Embed Size (px)
Citation preview

PREPARED BY3 Times Square18th Floor
New York, NY 10036www.thomsonreuters.com
1655 Fort Myer DriveSuite 850
Arlington, VA 22209www.nvca.org
INCLUDING STATISTICS FROM THEPricewaterhouseCoopers/National Venture Capital Association
MoneyTree™ Report based on data from Thomson Reuters
NATIONAL VENTURECAPITALASSOCIATION
PREPARED BY
NATIO
NA
L VENTU
RE CA
PITAL A
SSOC
IATION
YEARBO
OK 2010
NATIONAL VENTURECAPITALASSOCIATION
YEARBOOK 2010
March 2010
Dear Reader:
As the nation and world works through the many economic and fiscal challenges of ourtime, the US venture capital industry and the entrepreneurial sector are being looked tofor job creation, economic development, better healthcare, cleaner technology, and otheranswers to today’s opportunities.
The statistics gathered and tracked by Thomson Reuters for ThomsonONE.com (formerlyVentureXpert) and this Yearbook are essential to enabling analysis of venture capital by pol-icy think tanks and economists and for use by government officials and other decisionmakers. For example, recent analysis of Thomson Reuters data by IHS Global Insightshows that while venture capital investment represents 0.2% of US GDP, the revenue ofcompanies created by the industry represented 21% of GDP in 2008. For every venturecapital dollar invested in 1970-2001, there was $9.88 in US revenue during 2008 in thosecompanies and for every $24,564 of venture capital invested in 1970-2001, there was oneongoing job at the end of the year 2008.
On behalf of the National Venture Capital Association board of directors and staff, we arepleased to present you with the latest statistics that describe the activity of the venturecapital industry in the United States. These statistics reflect yet another all-time high levelof survey participation by venture capital practitioners. This support has allowed us toaccurately report industry activity. Your comments are always welcome [email protected].
NVCA believes that it is more important than ever to effectively tell the story of venturecapital, differentiate it from other forms of alternative assets, and explain what’s needed tocontinue creating great, leading-edge companies. We believe that a strong venture capitalindustry is essential to America’s future and improving our quality of life.
Very truly yours,
John Jaggers Mark G. Heesen John S. TaylorSevin Rosen Funds NVCA President NVCA VP ResearchNVCA Director & Chairmanof the NVCA Research Committee
2 Thomson Reuters
NVCA BOARD OF DIRECTORS 2009-2010
Executive Committee
Terry McGuire Kate MitchellChairman Chairman-electPolaris Venture Partners Scale Venture Partners
E. Rogers Novak Ira EhrenpreisTreasurer At-LargeNovak Biddle Venture Partners Technology Partners
Paul MaederAt-LargeHighland Capital Partners
Research Committee
John Jaggers Mike ElliottResearch Chairman Noro-Moseley PartnersSevin Rosen Funds
Diana Frazier Stephen HolmesFLAG Capital Management, LLC InterWest Partners
Board Members At-Large
Keith Crandell Barbara DaltonARCH Venture Partners Pfizer, Inc.
James Fleming Michael GreeleyColumbia Capital Flybridge Capital Partners
Josh Green Jim Hale, IIIMohr, Davidow Ventures FTV Capital
Deepak Kamra Robert KibbleCanaan Partners Mission Ventures
Jack Lasersohn Pascal LevensohnThe Vertical Group Levensohn Venture Partners
Trevor Loy James MarverFlywheel Ventures Vantage Point Partners
Jason Mendelson Sherrill NeffFoundry Group Quaker BioVentures
David Prend Jonathan RootRockPort Capital Partners U.S. Venture Partners
Ray RothrockVenrock Associates
For the National Venture Capital Association
Prepared by Thomson Reuters
Copyright © 2010 Thomson Reuters
The information presented in this report has been gathered with the utmost carefrom sources believed to be reliable, but is not guaranteed. Thomson Reutersdisclaims any liability including incidental or consequential damages arisingfrom errors or omissions in this report.
2010
National Venture Capital Association
Yearbook
Thomson Reuters 3
National Venture Capital Association1655 Fort Myer Drive, Suite 850Arlington, Virginia 22209-3114Telephone: 703-524-2549Telephone: 703-524-3940www.nvca.org
PresidentMark G. Heesen
Vice President of ResearchJohn S. Taylor
Senior Vice PresidentMolly M. Myers
Vice President of Federal Policy & Political AdvocacyJennifer Connell Dowling
Vice President of Strategic Affairs & Public OutreachEmily Mendell
Vice President of Membership & Member FirmLiaisonJanice Mawson
Director of Federal Policy & Political AdvocacyEmily A. Baker
Director of MarketingJeanne Lazarus Metzger
Director of Federal Life Science PolicyKelly Slone
Public Policy ManagerSumi Singh
Membership Coordinator & Database AdministratorTerry Samm
Accounting ManagerBeverley Badley
Manager of Administration and MeetingsAllyson Chappell
Administrative Assistant Gwendolyn Taylor
Research LabMavis Moulterd
Thomson Reuters3 Times Square, 18th FloorNew York, NY 10036Telephone: 646-223-4431Fax: 646-223-4470www.thomsonreuters.com
Vice President, Private Equity ProductsElizabeth Benson
Vice President, Deals and Private Equity OperationsShariq Kajiji
U.S. PublisherJim Beecher
Editor-in-Charge, Deals GroupDavid Toll
Global Private Equity Operations ManagerAlex Tan
Operations Manager Private Equity—North AmericaJames Thisdelle
Contributor & Press ManagementMatthew Toole
Product ManagerLori Ann Silva
Team ManagerPaul Pantalla
Research EditorEamon Beltran
Senior Art DirectorDavid Cooke
Sales Manager – Publications (Buyouts, VCJ)Greg Winterton (646-223-6787)
ThomsonONE.com Sales:Bill Moore (646-223-7285)
4 Thomson Reuters
National Venture Capital Association 2010 Yearbook
Table of Contents
What is Venture Capital? . . . . . . . . . . . . . . . . . . . . . . . . . . . . . . . . . . . . . . . . . . . . . . . . . . . . . . . . . . . . . . . . . . . . . . 7
Executive Summary . . . . . . . . . . . . . . . . . . . . . . . . . . . . . . . . . . . . . . . . . . . . . . . . . . . . . . . . . . . . . . . . . . . . . . . . . . . 9Introduction . . . . . . . . . . . . . . . . . . . . . . . . . . . . . . . . . . . . . . . . . . . . . . . . . . . . . . . . . . . . . . . . . . . . . . . . . . . . . . 9Industry Resources . . . . . . . . . . . . . . . . . . . . . . . . . . . . . . . . . . . . . . . . . . . . . . . . . . . . . . . . . . . . . . . . . . . . . . . . . 9Capital Commitments . . . . . . . . . . . . . . . . . . . . . . . . . . . . . . . . . . . . . . . . . . . . . . . . . . . . . . . . . . . . . .. . . . . . . . 10Investments. . . . . . . . . . . . . . . . . . . . . . . . . . . . . . . . . . . . . . . . . . . . . . . . . . . . . . . . . . . . . . . . . . . . . . . . . . . . . . 11Portfolio Company Post-Money Valuations. . . . . . . . . . . . . . . . . . . . . . . . . . . . . . . . . . . . . . . . . . . . . . . . . . . . . 12Exits: IPOs and Acquisitions . . . . . . . . . . . . . . . . . . . . . . . . . . . . . . . . . . . . . . . . . . . . . . . . . . . . . . . . .. . . . . . . . 12
Industry Resources . . . . . . . . . . . . . . . . . . . . . . . . . . . . . . . . . . . . . . . . . . . . . . . . . . . . . . . . . . . . . . . . . . . . . . . . . . 15Methodology . . . . . . . . . . . . . . . . . . . . . . . . . . . . . . . . . . . . . . . . . . . . . . . . . . . . . . . . . . . . . . . . . . . . . . .. . . . . 15
Capital Commitments . . . . . . . . . . . . . . . . . . . . . . . . . . . . . . . . . . . . . . . . . . . . . . . . . . . . . . . . . . . . . . . . . . . . . . . . 19Methodology . . . . . . . . . . . . . . . . . . . . . . . . . . . . . . . . . . . . . . . . . . . . . . . . . . . . . . . . . . . . . . . . . . . . . . . . . . . . 19
Investments.. . . . . . . . . . . . . . . . . . . . . . . . . . . . . . . . . . . . . . . . . . . . . . . . . . . . . . . . . . . . . . . . . . . . . . . . . . . . . . . . 23Methodology . . . . . . . . . . . . . . . . . . . . . . . . . . . . . . . . . . . . . . . . . . . . . . . . . . . . . . . . . . . . . . . . . . . . . . . . . . . . 23
Portfolio Company Valuations . . . . . . . . . . . . . . . . . . . . . . . . . . . . . . . . . . . . . . . . . . . . . . . . . . . . . . . . . . . . . . . . . 43
Exits: IPOs and Acquisitions . . . . . . . . . . . . . . . . . . . . . . . . . . . . . . . . . . . . . . . . . . . . . . . . . . . . . . . . . . . . . . . . . . 49Methodology . . . . . . . . . . . . . . . . . . . . . . . . . . . . . . . . . . . . . . . . . . . . . . . . . . . . . . . . . . . . . . . . . . . . . . . . . . . . 49
Appendix A: Glossary . . . . . . . . . . . . . . . . . . . . . . . . . . . . . . . . . . . . . . . . . . . . . . . . . . . . . . . . . . . . . . . . . . . . . . . . 57
Appendix B: MoneyTree Definitions . . . . . . . . . . . . . . . . . . . . . . . . . . . . . . . . . . . . . . . . . . . . . . . . . . . . . . . . . . . . 73
Appendix C: MoneyTree Geographical Regions . . . . . . . . . . . . . . . . . . . . . . . . . . . . . . . . . . . . . . . . . . . . . . . . . . . 75
Appendix D: Industry Codes (VEICs). . . . . . . . . . . . . . . . . . . . . . . . . . . . . . . . . . . . . . . . . . . . . . . . . . . . . . . . . . . . 77
Appendix E: Industry Sector VEIC Ranges . . . . . . . . . . . . . . . . . . . . . . . . . . . . . . . . . . . . . . . . . . . . . . . . . . . . . . . 87
Appendix F: Stage Definitions . . . . . . . . . . . . . . . . . . . . . . . . . . . . . . . . . . . . . . . . . . . . . . . . . . . . . . . . . . . . . . . . . . 89
Appendix G: Data Sources and Resources . . . . . . . . . . . . . . . . . . . . . . . . . . . . . . . . . . . . . . . . . . . . . . . . . . . . . . . . 91
Appendix H: Portfolio Company Valuation Guidelines. . . . . . . . . . . . . . . . . . . . . . . . . . . . . . . . . . . . . . . . . . . . . . 95
Appendix I: International Convergence . . . . . . . . . . . . . . . . . . . . . . . . . . . . . . . . . . . . . . . . . . . . . . . . . . . . . . . . . 107
Appendix J: Non-US Private Equity . . . . . . . . . . . . . . . . . . . . . . . . . . . . . . . . . . . . . . . . . . . . . . . . . . . . . . . . . . . . 111
Thomson Reuters 5

6 Thomson Reuters
This page is intentionally left blank.
Thomson Reuters 7
Venture capital has enabled the United States to sup-port its entrepreneurial talent and appetite by turningideas and basic science into products and servicesthat are the envy of the world. Venture capital fundsbuild companies from the simplest form – perhapsjust the entrepreneur and an idea expressed as a busi-ness plan – to freestanding, mature organizations.
Risk Capital for Business
Venture capital firms are professional, institutionalmanagers of risk capital that enables and supports themost innovative and promising companies. Thismoney funds new ideas that could not be financedwith traditional bank financing, that threaten estab-lished products and services in a corporation, and thattypically require five to eight years to be launched.
Venture capital is quite unique as an institutionalinvestor asset class. When an investment is made in acompany, it is an equity investment in a companywhose stock is essentially illiquid and worthless until acompany matures five to eight years down the road.Follow-on investment provides additional funding asthe company grows. These “rounds,” typically occur-ring every year or two, are also equity investment, withthe shares allocated among the investors and manage-ment team based on an agreed “valuation.” But, unlessa company is acquired or goes public, there is littleactual value. Venture capital is a long-term investment.
More Than Money
The U.S. venture industry provides the capital to cre-ate some of the most innovative and successful com-panies. But venture capital is more than money.Venture capital partners become actively engagedwith a company, typically taking a board seat. With astartup, daily interaction with the management team iscommon. This limits the number of startups in whichany one fund can invest. Few entrepreneurs approach-ing venture capital firms for money are aware thatthey essentially are asking for 1/6 of a person!
Yet that active engagement is critical to the success ofthe fledgling company. Many one- and two-person
companies have received funding but no one- or two-person company has ever gone public! Along theway, talent must be recruited and the company scaledup. Ask any venture capitalist who has had an ultra-successful investment and he or she will tell you thatthe company that broke through the gravity evolvedfrom the original business plan concept with the care-ful input of an experienced hand.
Deal Flows — Where The Buys Are
For every 100 business plans that come to a venturecapital firm for funding, usually only 10 or so get aserious look, and only one ends up being funded. Theventure capital firm looks at the management team,the concept, the marketplace, fit to the fund’s objec-tives, the value-added potential for the firm, and thecapital needed to build a successful business. A busyventure capital professional’s most precious asset istime. These days, a business concept needs to addressworld markets, have superb scalability, be made suc-cessful in a reasonable timeframe, and be truly inno-vative. A concept that promises a 10 or 20 percentimprovement on something that already exists is notlikely to get a close look.
What is Venture Capital?
Venture Capital Backed CompaniesKnown for Innovative Business Models
Employment at IPO and Now
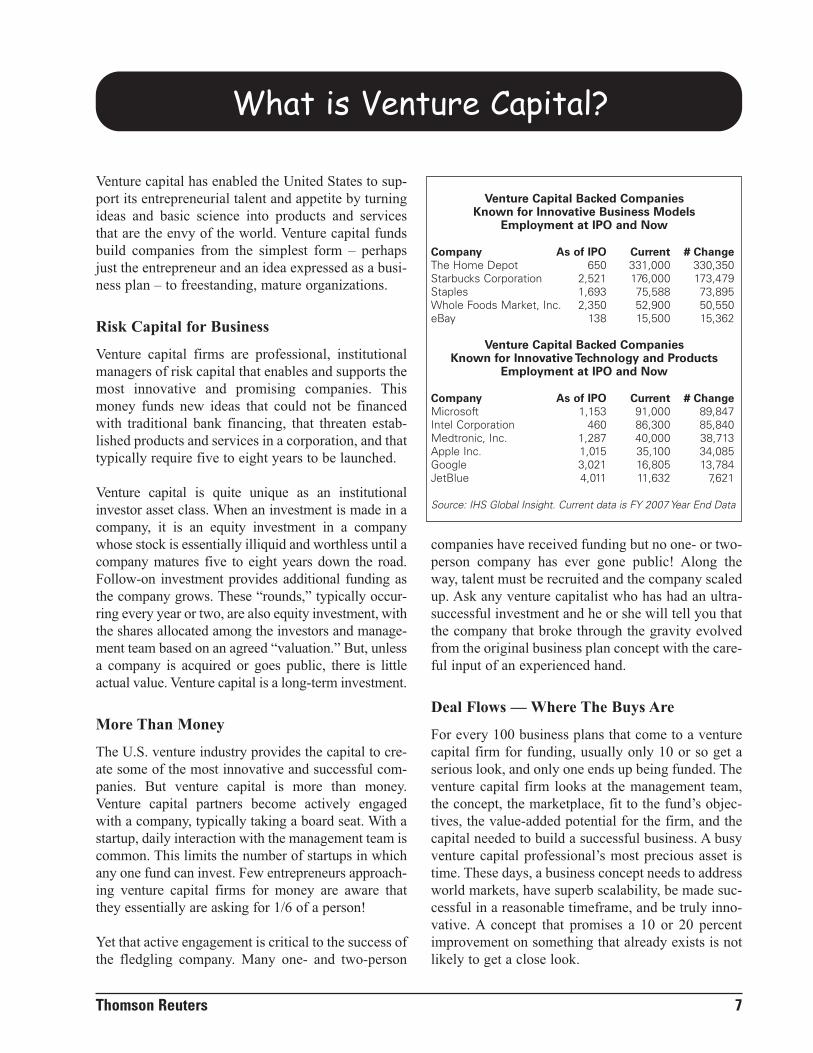
Company As of IPO Current # ChangeThe Home Depot 650 331,000 330,350 Starbucks Corporation 2,521 176,000 173,479 Staples 1,693 75,588 73,895 Whole Foods Market, Inc. 2,350 52,900 50,550 eBay 138 15,500 15,362
Venture Capital Backed CompaniesKnown for Innovative Technology and Products
Employment at IPO and Now
Company As of IPO Current # ChangeMicrosoft 1,153 91,000 89,847 Intel Corporation 460 86,300 85,840 Medtronic, Inc. 1,287 40,000 38,713 Apple Inc. 1,015 35,100 34,085 Google 3,021 16,805 13,784 JetBlue 4,011 11,632 7,621
Source: IHS Global Insight. Current data is FY 2007 Year End Data
Many technologies currently under development byventure capital firms are truly disruptive technologiesthat do not lend themselves to being embraced bylarger companies whose current products could becannibalized by this. Also, with the increased empha-sis on public company quarterly results, many largerorganizations tend to reduce spending on research anddevelopment and product development when thingsget tight. Many talented teams have come to the ven-ture capital process when their projects were turneddown by their companies.
Common Structure — Unique Results
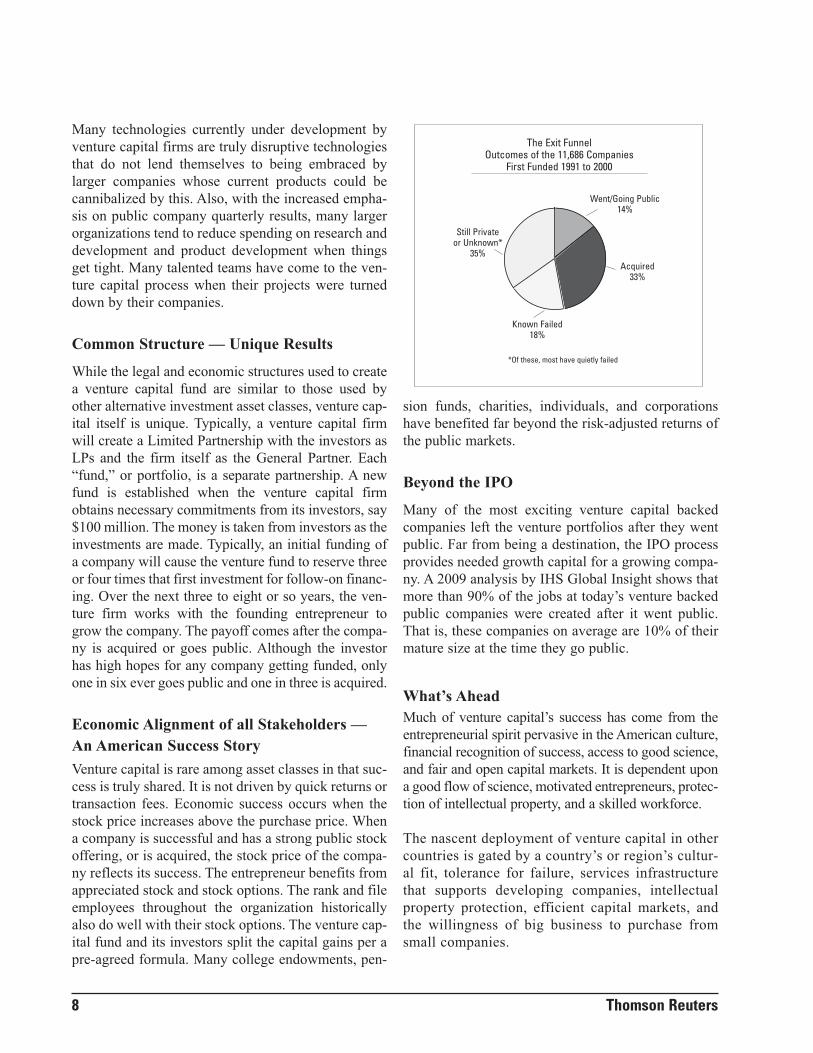
While the legal and economic structures used to createa venture capital fund are similar to those used byother alternative investment asset classes, venture cap-ital itself is unique. Typically, a venture capital firmwill create a Limited Partnership with the investors asLPs and the firm itself as the General Partner. Each“fund,” or portfolio, is a separate partnership. A newfund is established when the venture capital firmobtains necessary commitments from its investors, say$100 million. The money is taken from investors as theinvestments are made. Typically, an initial funding ofa company will cause the venture fund to reserve threeor four times that first investment for follow-on financ-ing. Over the next three to eight or so years, the ven-ture firm works with the founding entrepreneur togrow the company. The payoff comes after the compa-ny is acquired or goes public. Although the investorhas high hopes for any company getting funded, onlyone in six ever goes public and one in three is acquired.
Economic Alignment of all Stakeholders —An American Success StoryVenture capital is rare among asset classes in that suc-cess is truly shared. It is not driven by quick returns ortransaction fees. Economic success occurs when thestock price increases above the purchase price. Whena company is successful and has a strong public stockoffering, or is acquired, the stock price of the compa-ny reflects its success. The entrepreneur benefits fromappreciated stock and stock options. The rank and fileemployees throughout the organization historicallyalso do well with their stock options. The venture cap-ital fund and its investors split the capital gains per apre-agreed formula. Many college endowments, pen-
sion funds, charities, individuals, and corporationshave benefited far beyond the risk-adjusted returns ofthe public markets.
Beyond the IPO
Many of the most exciting venture capital backedcompanies left the venture portfolios after they wentpublic. Far from being a destination, the IPO processprovides needed growth capital for a growing compa-ny. A 2009 analysis by IHS Global Insight shows thatmore than 90% of the jobs at today’s venture backedpublic companies were created after it went public.That is, these companies on average are 10% of theirmature size at the time they go public.
What’s AheadMuch of venture capital’s success has come from theentrepreneurial spirit pervasive in the American culture,financial recognition of success, access to good science,and fair and open capital markets. It is dependent upona good flow of science, motivated entrepreneurs, protec-tion of intellectual property, and a skilled workforce.
The nascent deployment of venture capital in othercountries is gated by a country’s or region’s cultur-al fit, tolerance for failure, services infrastructurethat supports developing companies, intellectualproperty protection, efficient capital markets, andthe willingness of big business to purchase fromsmall companies.
The Exit FunnelOutcomes of the 11,686 Companies
First Funded 1991 to 2000
Went/Going Public 14%
Acquired 33%
Known Failed18%
Still Private or Unknown*
35%
*Of these, most have quietly failed
8 Thomson Reuters
Executive Summary
Introduction
The National Venture Capital Association 2010Yearbook provides a summary of all of venture capi-tal activity in the United States. This ranges frominvestments into portfolio companies to capital man-aged by general partners to fundraising from limitedpartners to valuations of companies receiving venturecapital investments to exits of the investments byeither IPOs or mergers and acquisitions. The statisticsfor this publication were assembled primarily from
the MoneyTree™ Report by PricewaterhouseCoopersand the National Venture Capital Association basedon data from Thomson Reuters and analyzed throughthe ThomsonONE.com (formerly VentureXpert) data-base of Thomson Reuters, which has been endorsedby the NVCA as the official industry activity data-base. Subscribers to that system can perform consid-erable further analysis on the underlying data.
Industry Resources
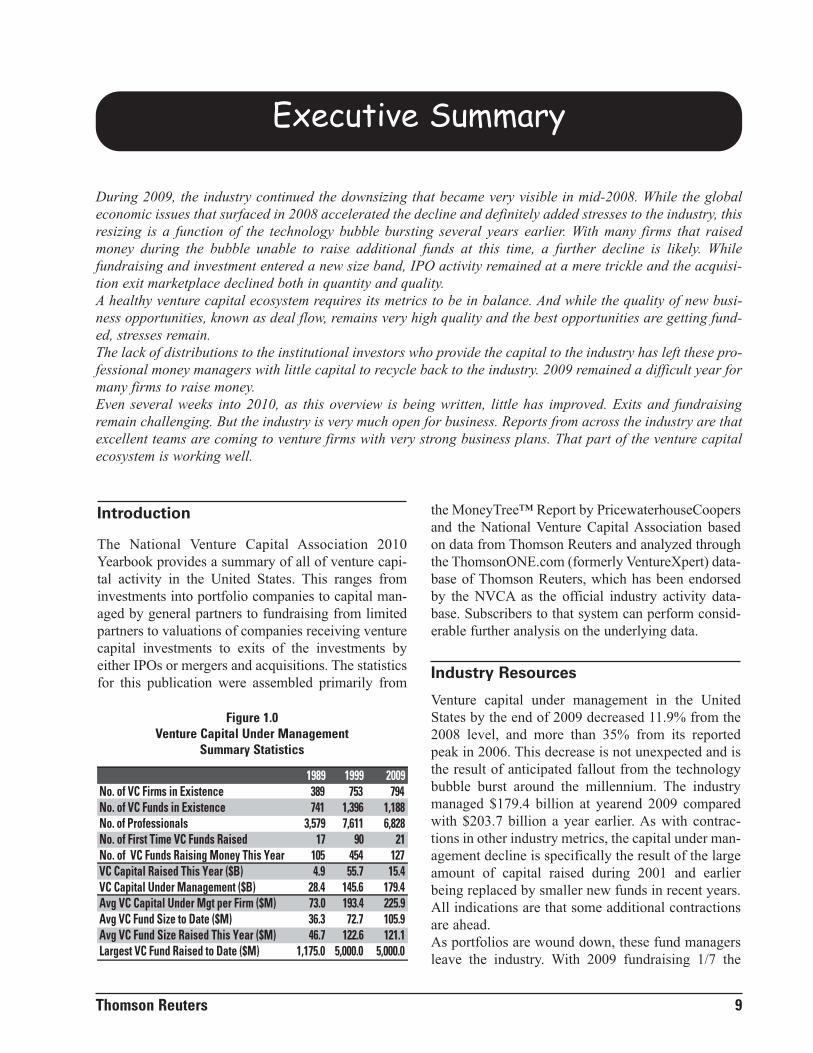
Venture capital under management in the UnitedStates by the end of 2009 decreased 11.9% from the2008 level, and more than 35% from its reportedpeak in 2006. This decrease is not unexpected and isthe result of anticipated fallout from the technologybubble burst around the millennium. The industrymanaged $179.4 billion at yearend 2009 comparedwith $203.7 billion a year earlier. As with contrac-tions in other industry metrics, the capital under man-agement decline is specifically the result of the largeamount of capital raised during 2001 and earlierbeing replaced by smaller new funds in recent years.All indications are that some additional contractionsare ahead.As portfolios are wound down, these fund managersleave the industry. With 2009 fundraising 1/7 the
During 2009, the industry continued the downsizing that became very visible in mid-2008. While the globaleconomic issues that surfaced in 2008 accelerated the decline and definitely added stresses to the industry, thisresizing is a function of the technology bubble bursting several years earlier. With many firms that raisedmoney during the bubble unable to raise additional funds at this time, a further decline is likely. Whilefundraising and investment entered a new size band, IPO activity remained at a mere trickle and the acquisi-tion exit marketplace declined both in quantity and quality.A healthy venture capital ecosystem requires its metrics to be in balance. And while the quality of new busi-ness opportunities, known as deal flow, remains very high quality and the best opportunities are getting fund-ed, stresses remain.The lack of distributions to the institutional investors who provide the capital to the industry has left these pro-fessional money managers with little capital to recycle back to the industry. 2009 remained a difficult year formany firms to raise money.Even several weeks into 2010, as this overview is being written, little has improved. Exits and fundraisingremain challenging. But the industry is very much open for business. Reports from across the industry are thatexcellent teams are coming to venture firms with very strong business plans. That part of the venture capitalecosystem is working well.
Thomson Reuters 9
1989 1999 2009No. of VC Firms in Existence 389 753 794No. of VC Funds in Existence 741 1,396 1,188No. of Professionals 3,579 7,611 6,828No. of First Time VC Funds Raised 17 90 21No. of VC Funds Raising Money This Year 105 454 127VC Capital Raised This Year ($B) 4.9 55.7 15.4VC Capital Under Management ($B) 28.4 145.6 179.4Avg VC Capital Under Mgt per Firm ($M) 73.0 193.4 225.9Avg VC Fund Size to Date ($M) 36.3 72.7 105.9Avg VC Fund Size Raised This Year ($M) 46.7 122.6 121.1Largest VC Fund Raised to Date ($M) 1,175.0 5,000.0 5,000.0
Figure 1.0Venture Capital Under Management
Summary Statistics
National Venture Capital Association
10 Thomson Reuters
0
50
100
150
200
250
300
Year
Figure 2.0Capital Under Management
U.S. Venture Funds ($ Billions)1980 to 2009
0
20
40
60
80
100
120
Year
Figure 3.0Capital Commitments to
U.S. Venture Funds ($ Billions)1980 to 2009
1980
1981
1982
1983
1984
1985
1986
1987
1988
1989
1990
1991
1992
1993
1994
1995
1996
1997
1998
1999
2000 20
0120
0220
0320
0420
0520
0620
0720
0820
09
1980
1981
1982
1983
1984
1985
1986
1987
1988
1989
1990
1991
1992
1993
1994
1995
1996
1997
1998
1999
2000 20
0120
0220
0320
0420
0520
0620
0720
0820
09
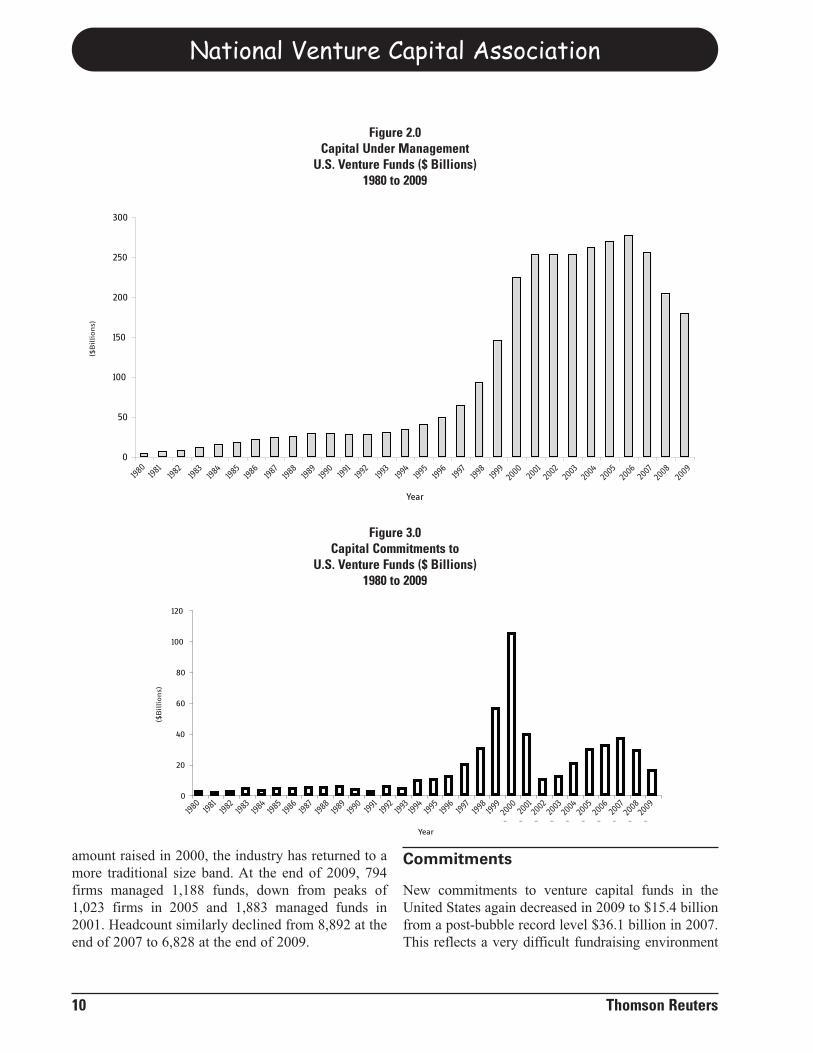
amount raised in 2000, the industry has returned to amore traditional size band. At the end of 2009, 794firms managed 1,188 funds, down from peaks of1,023 firms in 2005 and 1,883 managed funds in2001. Headcount similarly declined from 8,892 at theend of 2007 to 6,828 at the end of 2009.
Commitments
New commitments to venture capital funds in theUnited States again decreased in 2009 to $15.4 billionfrom a post-bubble record level $36.1 billion in 2007.This reflects a very difficult fundraising environment
($B
illion
s)
($B
illion
s)
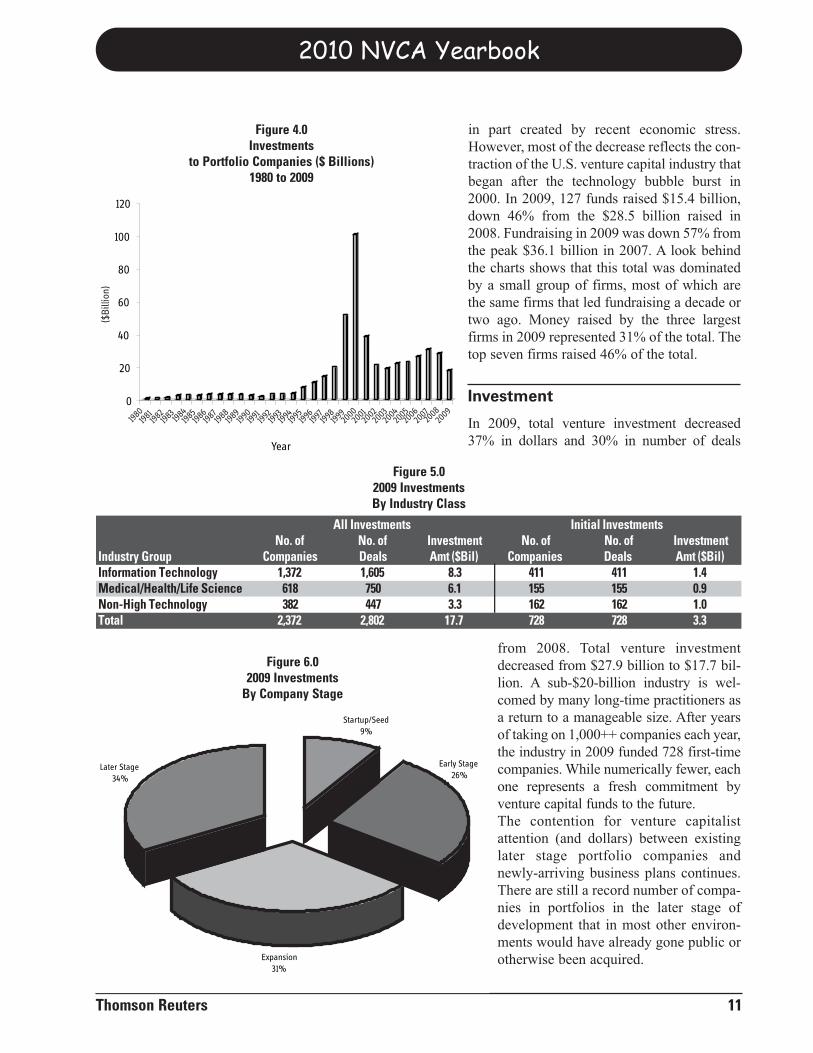
in part created by recent economic stress.However, most of the decrease reflects the con-traction of the U.S. venture capital industry thatbegan after the technology bubble burst in2000. In 2009, 127 funds raised $15.4 billion,down 46% from the $28.5 billion raised in2008. Fundraising in 2009 was down 57% fromthe peak $36.1 billion in 2007. A look behindthe charts shows that this total was dominatedby a small group of firms, most of which arethe same firms that led fundraising a decade ortwo ago. Money raised by the three largestfirms in 2009 represented 31% of the total. Thetop seven firms raised 46% of the total.
Investment
In 2009, total venture investment decreased37% in dollars and 30% in number of deals
from 2008. Total venture investmentdecreased from $27.9 billion to $17.7 bil-lion. A sub-$20-billion industry is wel-comed by many long-time practitioners asa return to a manageable size. After yearsof taking on 1,000++ companies each year,the industry in 2009 funded 728 first-timecompanies. While numerically fewer, eachone represents a fresh commitment byventure capital funds to the future.The contention for venture capitalistattention (and dollars) between existinglater stage portfolio companies andnewly-arriving business plans continues.There are still a record number of compa-nies in portfolios in the later stage ofdevelopment that in most other environ-ments would have already gone public orotherwise been acquired.
2010 NVCA Yearbook
Thomson Reuters 11
0
20
40
60
80
100
120
Year
Figure 4.0Investments
to Portfolio Companies ($ Billions)1980 to 2009
1980198
1198
2198
3198
4198
5198
6198
7198
8198
9199
0199
1199
2199
3199
4199
5199
6199
7199
8199
920
0020
0120
0220
0320
0420
0520
0620
0720
0820
09
($B
illio
n)
No. of No. of Investment No. of No. of InvestmentIndustry Group Companies Deals Amt ($Bil) Companies Deals Amt ($Bil)Information Technology 1,372 1,605 8.3 411 411 1.4Medical/Health/Life Science 618 750 6.1 155 155 0.9Non-High Technology 382 447 3.3 162 162 1.0Total 2,372 2,802 17.7 728 728 3.3
All Investments Initial Investments
Figure 5.02009 InvestmentsBy Industry Class
Startup/Seed9%
Expansion31%
Later Stage34%
Early Stage26%
Figure 6.02009 Investments
By Company Stage
Portfolio Company Post-MoneyValuations
Round valuations in 2009, where reported, didincrease overall at the average and at the median fromthe reference period 2005-2008. However, it varies bysector. Biotechnology valuations are lower butIndustrial/Energy, the MoneyTree sector containingmuch of the clean technology investment, significant-ly increased. Software, the sector receiving the sec-ond highest amount of money, also showed meaning-fully higher valuations.
Exits
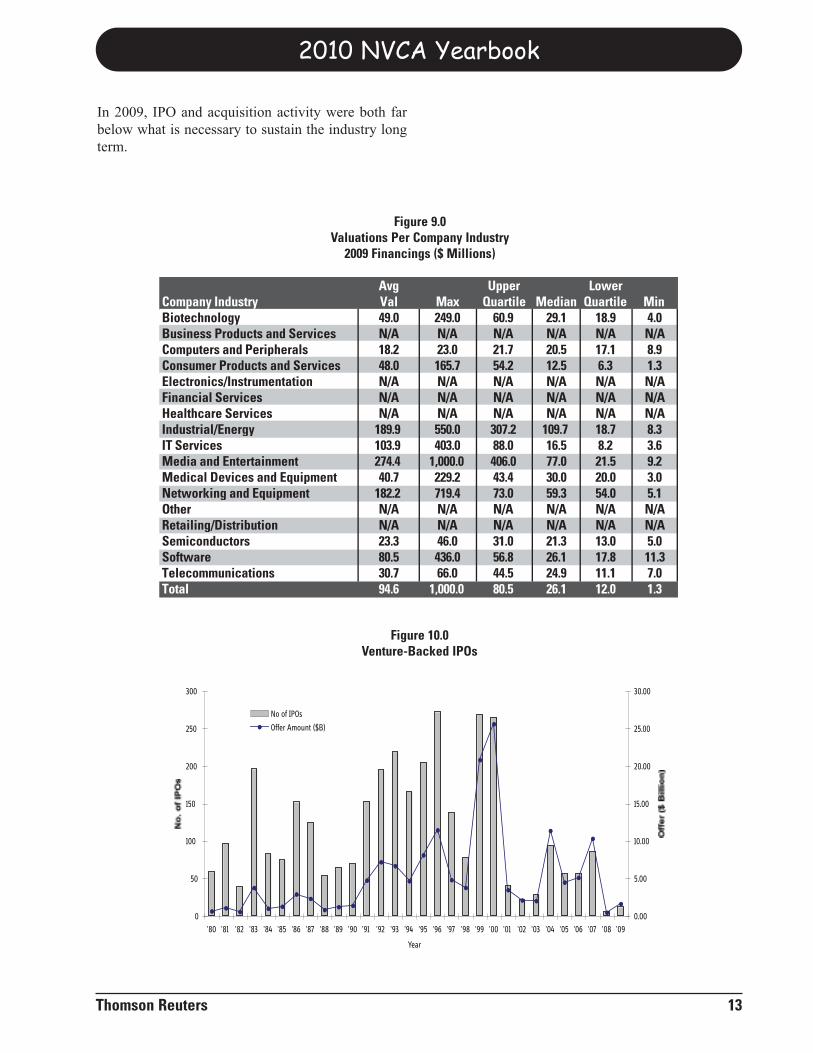
As bad as 2008 was for venture-backed companiesexiting through initial public offerings or acquisitions,the year 2009 was not much better. In 2009, therewere just 12 venture-backed IPOs raising $1.6 billionand 270 acquisitions with disclosed deals totaling$14.1 billion. The IPO levels remained near zeroagainst a backdrop of an ever increasing number ofportfolio companies maturing into the later stages andthus awaiting an exit. The 12 venture-backed compa-nies that went public in 2009 were double the sixIPOs in 2008. These two years are the second-worstand worst years, respectively, going back at least to1980. Similarly, the $1.6 billion raised through IPOsin 2009 is the second worst year (only to 2008) since1990. While the valuation of the 2009 IPOs reachedalmost $15 billion, the overall pace remained a meretrickle. At year end 2009, there were only 23 compa-nies in registration.
The number of venture-backed companies acquiredduring 2009 (270) declined from 2008 (349), whichitself declined from 2007 (379). While there were afew strong acquisitions raising the average purchaseprice to $152.9 million, the overall quality of dealsdeteriorated, with 38% of the known acquisitionsoccurring at a price less than the total venture invest-ment in that company.
National Venture Capital Association
12 Thomson Reuters
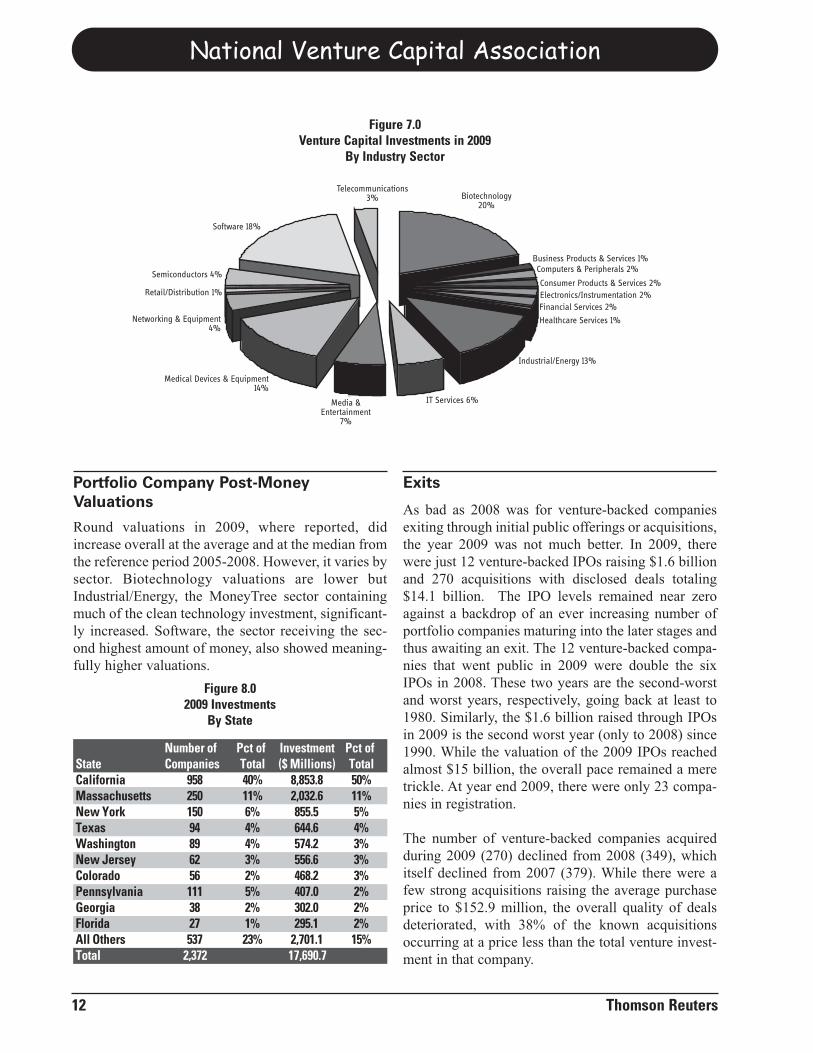
Figure 7.0Venture Capital Investments in 2009
By Industry Sector
Biotechnology20%
Business Products & Services 1%Computers & Peripherals 2%
Consumer Products & Services 2%Electronics/Instrumentation 2%Financial Services 2%
Healthcare Services 1%
Industrial/Energy 13%
IT Services 6%
Medical Devices & Equipment 14%
Networking & Equipment 4%
Retail/Distribution 1%
Semiconductors 4%
Software 18%
Media & Entertainment
7%
Telecommunications3%
Number of Pct of Investment Pct ofState Companies Total ($ Millions) TotalCalifornia 958 40% 8,853.8 50%Massachusetts 250 11% 2,032.6 11%New York 150 6% 855.5 5%Texas 94 4% 644.6 4%Washington 89 4% 574.2 3%New Jersey 62 3% 556.6 3%Colorado 56 2% 468.2 3%Pennsylvania 111 5% 407.0 2%Georgia 38 2% 302.0 2%Florida 27 1% 295.1 2%All Others 537 23% 2,701.1 15%Total 2,372 17,690.7
Figure 8.02009 Investments
By State
2010 NVCA Yearbook
Thomson Reuters 13
In 2009, IPO and acquisition activity were both farbelow what is necessary to sustain the industry longterm.
Avg Upper LowerVal Quartile Quartile
Biotechnology 49.0 249.0 60.9 29.1 18.9 4.0Business Products and Services N/A N/A N/A N/A N/A N/AComputers and Peripherals 18.2 23.0 21.7 20.5 17.1 8.9Consumer Products and Services 48.0 165.7 54.2 12.5 6.3 1.3Electronics/Instrumentation N/A N/A N/A N/A N/A N/AFinancial Services N/A N/A N/A N/A N/A N/AHealthcare Services N/A N/A N/A N/A N/A N/AIndustrial/Energy 189.9 550.0 307.2 109.7 18.7 8.3IT Services 103.9 403.0 88.0 16.5 8.2 3.6Media and Entertainment 274.4 1,000.0 406.0 77.0 21.5 9.2Medical Devices and Equipment 40.7 229.2 43.4 30.0 20.0 3.0Networking and Equipment 182.2 719.4 73.0 59.3 54.0 5.1Other N/A N/A N/A N/A N/A N/ARetailing/Distribution N/A N/A N/A N/A N/A N/ASemiconductors 23.3 46.0 31.0 21.3 13.0 5.0Software 80.5 436.0 56.8 26.1 17.8 11.3Telecommunications 30.7 66.0 44.5 24.9 11.1 7.0Total 94.6 1,000.0 80.5 26.1 12.0 1.3
MinCompany Industry Max Median
Figure 9.0Valuations Per Company Industry
2009 Financings ($ Millions)
0
50
100
150
200
250
300
'80 '81 '82 '83 '84 '85 '86 '87 '88 '89 '90 '91 '92 '93 '94 '95 '96 '97 '98 '99 '00 '01 '02 '03 '04 '05 '06 '07 '08 '09
Year
0.00
5.00
10.00
15.00
20.00
25.00
30.00
No of IPOs
Offer Amount ($B)
Figure 10.0Venture-Backed IPOs

National Venture Capital Association
14 Thomson Reuters
This page is intentionally left blank.
Industry Resources
METHODOLOGY
The number of firms in existence will vary on arolling eight-year basis as firms raise new funds or donot raise funds for more than eight years. Under thismethodology, we estimate that there are currently 794firms with limited partnerships “in existence”. Toclarify, this is actually stating that there are 794 firms
that have raised a venture capital partnership in thelast eight years. In reality, there may well be fewerfirms actually making new investments.
For this publication, we are primarily counting thenumber of firms with limited partnerships and areexcluding other types of investment vehicles. From
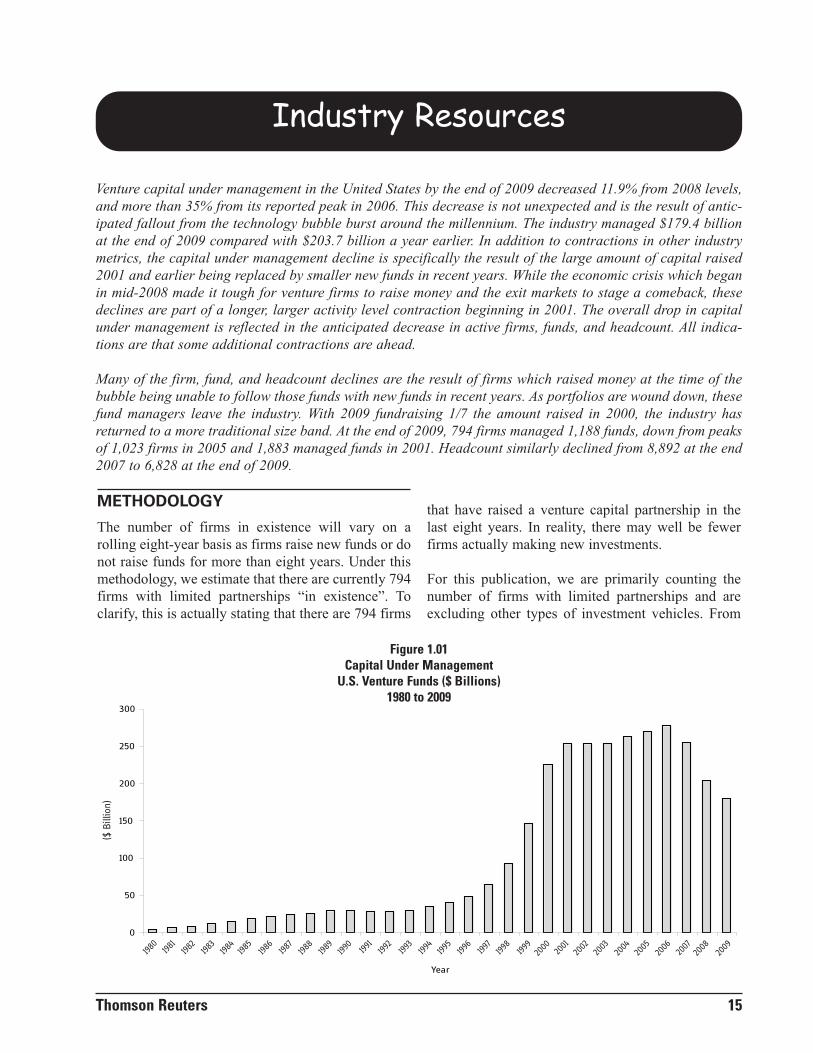
Venture capital under management in the United States by the end of 2009 decreased 11.9% from 2008 levels,and more than 35% from its reported peak in 2006. This decrease is not unexpected and is the result of antic-ipated fallout from the technology bubble burst around the millennium. The industry managed $179.4 billionat the end of 2009 compared with $203.7 billion a year earlier. In addition to contractions in other industrymetrics, the capital under management decline is specifically the result of the large amount of capital raised2001 and earlier being replaced by smaller new funds in recent years. While the economic crisis which beganin mid-2008 made it tough for venture firms to raise money and the exit markets to stage a comeback, thesedeclines are part of a longer, larger activity level contraction beginning in 2001. The overall drop in capitalunder management is reflected in the anticipated decrease in active firms, funds, and headcount. All indica-tions are that some additional contractions are ahead.
Many of the firm, fund, and headcount declines are the result of firms which raised money at the time of thebubble being unable to follow those funds with new funds in recent years. As portfolios are wound down, thesefund managers leave the industry. With 2009 fundraising 1/7 the amount raised in 2000, the industry hasreturned to a more traditional size band. At the end of 2009, 794 firms managed 1,188 funds, down from peaksof 1,023 firms in 2005 and 1,883 managed funds in 2001. Headcount similarly declined from 8,892 at the end2007 to 6,828 at the end of 2009.
Thomson Reuters 15
0
50
100
150
200
250
300
Year
Figure 1.01Capital Under Management
U.S. Venture Funds ($ Billions)1980 to 2009
($B
illio
n)
1980
1981
1982
1983
1984
1985
1986
1987
1988
1989
1990
1991
1992
1993
1994
1995
1996
1997
1998
1999
2000 20
0120
0220
0320
0420
0520
0620
0720
0820
09
that description, it may appear that the statistics fortotal industry resources may be underestimated.However, this must be balanced with the fact capitalunder management by captive and evergreen funds isdifficult to compare equitably to typical limited part-nerships with fixed lives. For this analysis only, thefirms counted for capital under management includefirms with fixed life partnerships and venture capitalfunds raised. If a firm raised both buyout and venturecapital funds, only the venture funds would be count-ed in the calculation of venture capital under manage-ment.
Venture capital under management can be a complexstatistic to estimate. Indeed, capital under manage-ment reported by firms can differ from firm to firm as
there’s not one singular definition. For example, somefirms include only cumulative committed capital, oth-ers may include committed capital plus capital gains,and still other firms define it as committed capitalafter subtracting liquidations. To complicate matters,it is difficult to compare these totals to European pri-vate equity firms which include capital gains as partof their capital under management measurements.
For purposes of the analysis in this publication, wehave tried to clarify the industry definition of capitalunder management as the cumulative total of commit-ted capital less liquidated funds or those funds thathave completed their life cycle. Typically, venturecapital firms have a stated 10-year fixed life span,except for life science funds which are often estab-
lished as 12-year funds. Figure 1.08 showsthe reality of fund life. Thomson Reuters cal-culates capital under management as thecumulative amount committed to funds on arolling eight-year basis. Current capital undermanagement is calculated by taking the capi-tal under management calculation from theprevious year, add in the current year’s funds’commitments, and subtracting the capitalraised eight years prior.
For this analysis, Thomson Reuters classi-fies venture capital firms using four distincttypes: private independent firms, financialinstitutions, corporations, and other entities.‘Private independent’ firms are made up ofindependent private and public firms includ-ing both institutionally and non-institution-ally funded firms and family groups.‘Financial institutions’ refers to firms thatare affiliates and/or subsidiaries of invest-ment banks and non-investment bank finan-
National Venture Capital Association
16 Thomson Reuters
119129
95
117
144
88
5745
0
20
40
60
80
100
120
140
160
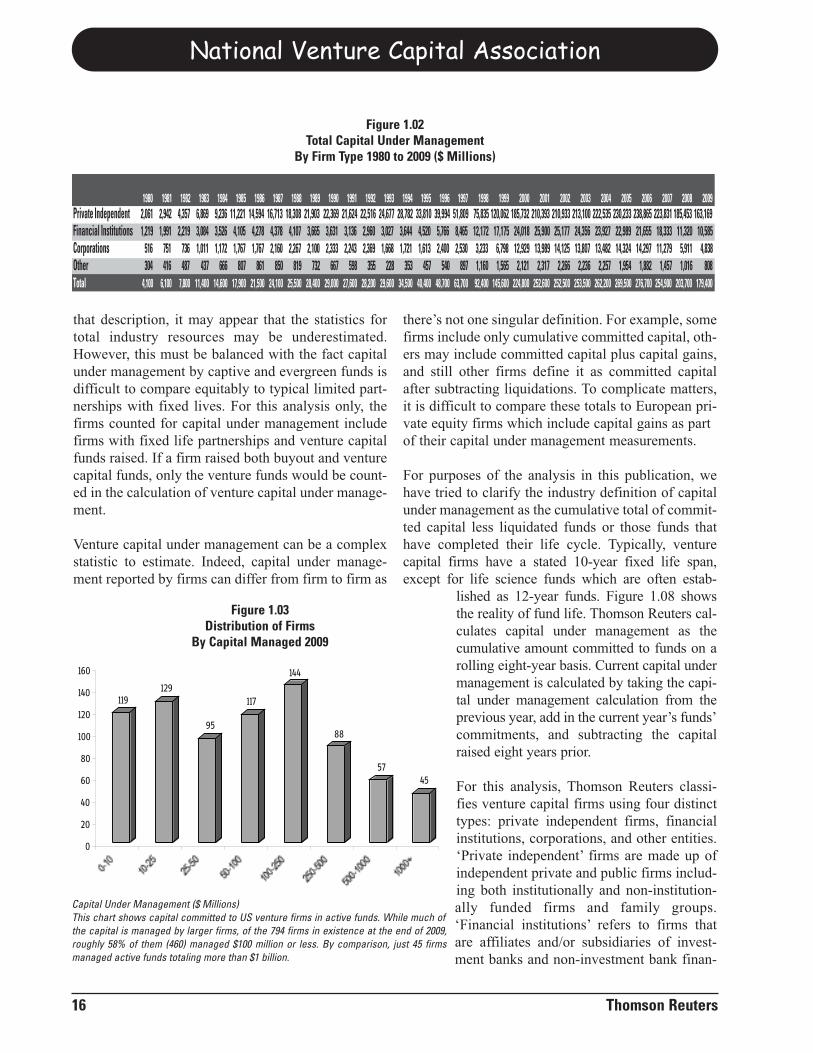
Capital Under Management ($ Millions)This chart shows capital committed to US venture firms in active funds. While much ofthe capital is managed by larger firms, of the 794 firms in existence at the end of 2009,roughly 58% of them (460) managed $100 million or less. By comparison, just 45 firmsmanaged active funds totaling more than $1 billion.
Figure 1.03Distribution of Firms
By Capital Managed 2009
1980 1981 1982 1983 1984 1985 1986 1987 1988 1989 1990 1991 1992 1993 1994 1995 1996 1997 1998 1999 2000 2001 2002 2003 2004 2005 2006 2007 2008 2009Private Independent 2,061 2,942 4,357 6,869 9,236 11,221 14,594 16,713 18,308 21,903 22,369 21,624 22,516 24,677 28,782 33,810 39,994 51,809 75,835 120,062 185,732 210,393 210,933 213,100 222,535 230,233 238,865 223,831 185,453 163,169Financial Institutions 1,219 1,991 2,219 3,084 3,526 4,105 4,278 4,378 4,107 3,665 3,631 3,136 2,960 3,027 3,644 4,520 5,766 8,465 12,172 17,175 24,018 25,900 25,177 24,356 23,927 22,989 21,655 18,333 11,320 10,585Corporations 516 751 736 1,011 1,172 1,767 1,767 2,160 2,267 2,100 2,333 2,243 2,369 1,668 1,721 1,613 2,400 2,530 3,233 6,798 12,929 13,989 14,125 13,807 13,482 14,324 14,297 11,279 5,911 4,838Other 304 416 487 437 666 807 861 850 819 732 667 598 355 228 353 457 540 897 1,160 1,565 2,121 2,317 2,266 2,236 2,257 1,954 1,882 1,457 1,016 808Total 4,100 6,100 7,800 11,400 14,600 17,900 21,500 24,100 25,500 28,400 29,000 27,600 28,200 29,600 34,500 40,400 48,700 63,700 92,400 145,600 224,800 252,600 252,500 253,500 262,200 269,500 276,700 254,900 203,700 179,400
Figure 1.02Total Capital Under Management
By Firm Type 1980 to 2009 ($ Millions)
cial entities including commercial banks and insur-ance companies. The ‘Corporations’ classificationincludes venture capital subsidiaries and affiliates ofindustrial corporations. The capital under manage-ment data referred to in this section consist primarilyof venture capital firms investing through limitedpartnerships with fixed commitment levels and fixed
lives and does not include infinite lived “evergreenfunds” or true captive corporate industrial investmentgroups without fixed commitment levels. The term‘evergreen funds’ refers to funds that have a continu-ous infusion of capital from a parent organization asopposed to the fixed life and commitment level of aclosed-end venture capital fund.
2010 NVCA Yearbook
Thomson Reuters 17
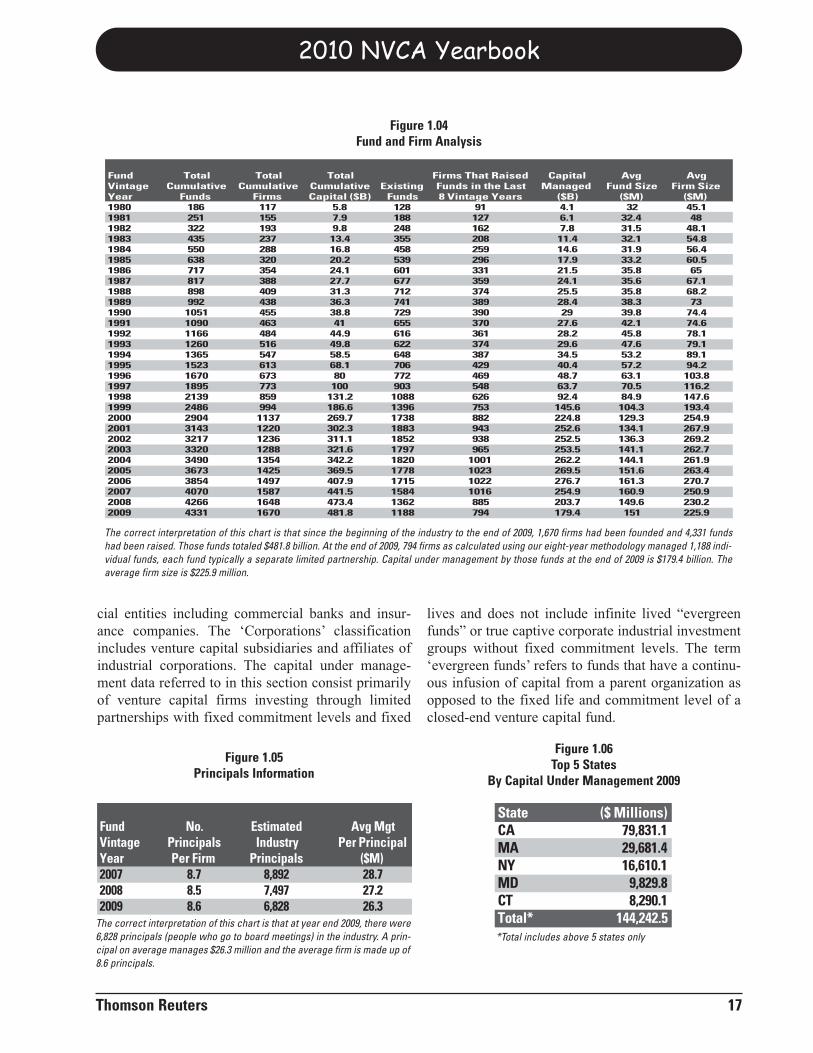
Fund No. Estimated Avg MgtVintage Principals Industry Per PrincipalYear Per Firm Principals ($M)2007 8.7 8,892 28.72008 8.5 7,497 27.22009 8.6 6,828 26.3
Figure 1.05Principals Information
Fund Total Total Total Firms That Raised Capital Avg AvgVintage Cumulative Cumulative Cumulative Existing Funds in the Last Managed Fund Size Firm SizeYear Funds Firms Capital ($B) Funds 8 Vintage Years ($B) ($M) ($M)1980 186 117 5.8 128 91 4.1 32 45.11981 251 155 7.9 188 127 6.1 32.4 481982 322 193 9.8 248 162 7.8 31.5 48.11983 435 237 13.4 355 208 11.4 32.1 54.81984 550 288 16.8 458 259 14.6 31.9 56.41985 638 320 20.2 539 296 17.9 33.2 60.51986 717 354 24.1 601 331 21.5 35.8 651987 817 388 27.7 677 359 24.1 35.6 67.11988 898 409 31.3 712 374 25.5 35.8 68.21989 992 438 36.3 741 389 28.4 38.3 731990 1051 455 38.8 729 390 29 39.8 74.41991 1090 463 41 655 370 27.6 42.1 74.61992 1166 484 44.9 616 361 28.2 45.8 78.11993 1260 516 49.8 622 374 29.6 47.6 79.11994 1365 547 58.5 648 387 34.5 53.2 89.11995 1523 613 68.1 706 429 40.4 57.2 94.21996 1670 673 80 772 469 48.7 63.1 103.81997 1895 773 100 903 548 63.7 70.5 116.21998 2139 859 131.2 1088 626 92.4 84.9 147.61999 2486 994 186.6 1396 753 145.6 104.3 193.42000 2904 1137 269.7 1738 882 224.8 129.3 254.92001 3143 1220 302.3 1883 943 252.6 134.1 267.92002 3217 1236 311.1 1852 938 252.5 136.3 269.22003 3320 1288 321.6 1797 965 253.5 141.1 262.72004 3490 1354 342.2 1820 1001 262.2 144.1 261.92005 3673 1425 369.5 1778 1023 269.5 151.6 263.42006 3854 1497 407.9 1715 1022 276.7 161.3 270.72007 4070 1587 441.5 1584 1016 254.9 160.9 250.92008 4266 1648 473.4 1362 885 203.7 149.6 230.22009 4331 1670 481.8 1188 794 179.4 151 225.9
Figure 1.04Fund and Firm Analysis
State ($ Millions)CA 79,831.1MA 29,681.4NY 16,610.1MD 9,829.8CT 8,290.1Total* 144,242.5
Figure 1.06Top 5 States
By Capital Under Management 2009
*Total includes above 5 states onlyThe correct interpretation of this chart is that at year end 2009, there were6,828 principals (people who go to board meetings) in the industry. A prin-cipal on average manages $26.3 million and the average firm is made up of8.6 principals.
The correct interpretation of this chart is that since the beginning of the industry to the end of 2009, 1,670 firms had been founded and 4,331 fundshad been raised. Those funds totaled $481.8 billion. At the end of 2009, 794 firms as calculated using our eight-year methodology managed 1,188 indi-vidual funds, each fund typically a separate limited partnership. Capital under management by those funds at the end of 2009 is $179.4 billion. Theaverage firm size is $225.9 million.
National Venture Capital Association
18 Thomson Reuters
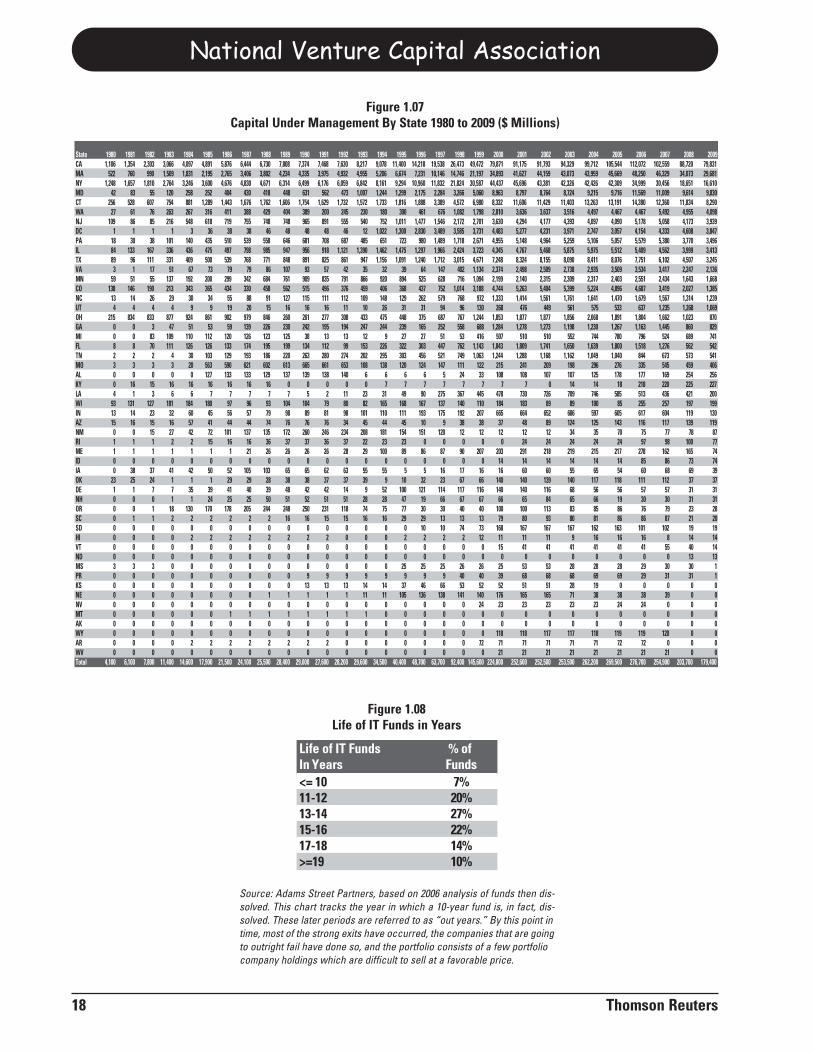
Life of IT Funds % ofIn Years Funds<= 10 7%11-12 20%13-14 27%15-16 22%17-18 14%>=19 10%
Figure 1.08Life of IT Funds in Years
Source: Adams Street Partners, based on 2006 analysis of funds then dis-solved. This chart tracks the year in which a 10-year fund is, in fact, dis-solved. These later periods are referred to as “out years.” By this point intime, most of the strong exits have occurred, the companies that are goingto outright fail have done so, and the portfolio consists of a few portfoliocompany holdings which are difficult to sell at a favorable price.
State 1980 1981 1982 1983 1984 1985 1986 1987 1988 1989 1990 1991 1992 1993 1994 1995 1996 1997 1998 1999 2000 2001 2002 2003 2004 2005 2006 2007 2008 2009CA 1,106 1,354 2,303 3,066 4,097 4,891 5,876 6,444 6,730 7,808 7,374 7,468 7,630 8,217 9,078 11,400 14,218 19,538 26,473 49,472 79,871 91,175 91,793 94,329 99,712 105,544 112,072 102,559 88,720 79,831MA 522 760 990 1,509 1,831 2,195 2,765 3,406 3,802 4,234 4,335 3,975 4,932 4,955 5,206 6,674 7,231 10,146 14,746 21,197 34,893 41,627 44,159 43,073 43,959 45,669 48,250 46,329 34,073 29,681NY 1,248 1,657 1,810 2,764 3,246 3,600 4,676 4,830 4,671 6,314 6,499 6,176 6,059 6,842 8,161 9,294 10,960 11,832 21,824 30,587 44,437 45,696 43,381 42,326 42,426 42,309 34,999 30,456 18,651 16,610MD 42 83 55 120 258 252 404 430 418 448 631 562 473 1,007 1,244 1,299 2,175 2,284 3,266 5,060 8,963 8,797 8,764 8,724 9,215 9,716 11,569 11,009 9,614 9,830CT 256 528 607 754 881 1,289 1,443 1,676 1,762 1,606 1,754 1,629 1,732 1,572 1,733 1,816 1,888 3,389 4,572 6,980 8,332 11,606 11,429 11,403 13,263 13,191 14,380 12,360 11,834 8,290WA 27 61 76 263 267 316 411 388 429 404 389 200 245 230 180 300 461 676 1,082 1,798 2,810 3,636 3,637 3,516 4,497 4,467 4,467 5,492 4,955 4,098NJ 109 86 85 216 548 618 719 755 748 748 965 891 555 540 752 1,011 1,477 1,546 2,172 2,701 3,630 4,294 4,177 4,393 4,097 4,090 5,178 5,058 4,173 3,939DC 1 1 1 1 3 36 38 38 46 48 48 48 46 12 1,022 1,300 2,830 3,489 3,585 3,731 4,483 5,277 4,231 3,971 2,747 3,057 4,154 4,333 4,608 3,847PA 18 30 38 101 140 435 510 539 558 646 681 708 687 485 651 723 980 1,489 1,718 2,671 4,955 5,148 4,964 5,259 5,106 5,057 5,579 5,380 3,770 3,496IL 84 133 167 336 436 475 497 798 985 947 956 918 1,121 1,390 1,462 1,475 1,297 1,966 2,424 3,723 4,345 4,767 5,468 5,875 5,975 5,512 5,409 4,562 3,999 3,413TX 89 96 111 331 409 500 539 768 771 848 891 825 861 947 1,156 1,091 1,240 1,712 3,015 4,671 7,248 8,324 8,155 8,090 8,411 8,076 7,751 6,102 4,507 3,245VA 3 1 17 51 67 73 79 79 86 107 93 57 42 35 32 39 64 147 402 1,134 2,374 2,498 2,509 2,738 2,935 3,509 3,534 3,417 2,247 2,136MN 59 51 55 137 192 200 299 342 684 761 909 835 791 866 920 894 525 628 716 1,094 2,199 2,140 2,315 2,309 2,317 2,403 2,551 2,434 1,643 1,668CO 138 146 190 213 343 365 434 330 458 562 515 496 376 459 406 368 437 752 1,014 3,188 4,744 5,263 5,404 5,399 5,224 4,896 4,687 3,419 2,027 1,385NC 13 14 26 29 30 34 55 88 91 127 115 111 112 109 148 129 262 579 768 972 1,333 1,414 1,561 1,761 1,641 1,470 1,679 1,567 1,314 1,239UT 4 4 4 4 9 9 19 20 15 16 16 16 11 10 26 31 31 94 96 130 268 476 449 561 575 533 637 1,235 1,268 1,069OH 215 834 833 877 924 861 902 979 846 260 261 277 308 433 475 448 375 687 767 1,244 1,853 1,877 1,877 1,856 2,068 1,891 1,804 1,662 1,023 870GA 0 0 3 47 51 53 59 139 226 230 242 195 194 247 244 239 165 252 558 688 1,284 1,278 1,273 1,198 1,230 1,267 1,163 1,445 860 829MI 0 0 83 109 110 112 120 126 123 125 38 13 13 12 9 27 27 51 53 416 507 510 510 552 744 780 796 524 689 741FL 8 8 70 111 126 126 133 174 195 199 134 112 99 153 226 322 303 447 762 1,143 1,843 1,809 1,741 1,650 1,639 1,800 1,518 1,276 562 542TN 2 2 2 4 30 103 129 193 186 220 263 280 274 202 295 303 456 521 749 1,063 1,244 1,288 1,168 1,162 1,049 1,040 844 673 573 541MO 3 3 3 3 20 563 590 621 602 613 665 661 653 108 138 120 124 147 111 122 215 241 209 198 296 276 335 545 459 406AL 0 0 0 0 0 127 133 133 129 137 139 138 140 6 6 6 6 5 24 33 108 108 107 107 125 178 177 169 254 256KY 0 16 15 16 16 16 16 16 16 0 0 0 0 0 7 7 7 7 7 7 7 7 0 14 14 18 218 220 225 227LA 4 1 3 6 6 7 7 7 7 7 5 2 11 23 31 49 90 275 367 445 478 730 726 709 746 585 513 436 421 200WI 93 131 127 181 184 180 97 96 93 104 104 79 80 82 165 168 167 137 140 110 184 183 89 89 100 85 255 257 197 199IN 13 14 23 32 60 45 56 57 79 98 89 81 98 101 110 111 193 175 192 207 665 664 652 686 597 605 617 604 119 130AZ 15 16 15 16 57 41 44 44 74 76 76 76 34 45 44 45 10 9 38 38 37 48 89 124 125 143 116 117 139 119NM 0 0 15 27 42 72 101 137 135 172 260 246 234 208 181 154 151 120 12 12 12 12 12 34 35 70 75 77 78 87RI 1 1 1 2 2 15 16 16 36 37 37 36 37 22 23 23 0 0 0 0 0 24 24 24 24 24 97 98 100 77ME 1 1 1 1 1 1 1 21 26 26 26 26 28 29 100 89 86 87 90 207 203 291 218 219 215 217 278 162 165 74ID 0 0 0 0 0 0 0 0 0 0 0 0 0 0 0 0 0 0 0 0 14 14 14 14 14 14 85 86 73 74IA 0 38 37 41 42 50 52 105 103 65 65 62 63 55 55 5 5 16 17 16 16 60 60 55 65 54 60 68 69 39OK 23 25 24 1 1 1 29 29 28 38 38 37 37 39 9 10 32 23 67 66 140 140 139 140 117 118 111 112 37 37DE 1 1 7 7 35 39 41 40 39 48 42 42 14 9 52 100 121 114 117 116 140 140 116 68 56 56 57 57 31 31NH 0 0 0 1 1 24 25 25 50 51 52 51 51 28 28 47 19 66 67 67 66 65 84 65 66 19 30 30 31 31OR 0 0 1 18 130 170 178 205 244 248 250 231 118 74 75 77 30 30 40 40 100 100 113 83 85 86 76 79 23 28SC 0 1 1 2 2 2 2 2 2 16 16 15 15 16 16 29 29 13 13 13 79 80 93 80 81 86 86 87 21 20SD 0 0 0 0 0 0 0 0 0 0 0 0 0 0 0 0 10 10 74 73 168 167 167 167 162 163 101 102 19 19HI 0 0 0 0 2 2 2 2 2 2 2 2 0 0 0 2 2 2 2 12 11 11 11 9 16 16 16 8 14 14VT 0 0 0 0 0 0 0 0 0 0 0 0 0 0 0 0 0 0 0 0 15 41 41 41 41 41 41 55 40 14ND 0 0 0 0 0 0 0 0 0 0 0 0 0 0 0 0 0 0 0 0 0 0 0 0 0 0 0 0 13 13MS 3 3 3 0 0 0 0 0 0 0 0 0 0 0 0 25 25 25 26 26 25 53 53 28 28 28 29 30 30 1PR 0 0 0 0 0 0 0 0 0 0 9 9 9 9 9 9 9 9 40 40 39 68 68 68 69 69 29 31 31 1KS 0 0 0 0 0 0 0 0 0 0 13 13 13 14 14 37 46 66 53 52 52 51 51 28 19 0 0 0 0 0NE 0 0 0 0 0 0 0 0 1 1 1 1 1 11 11 105 136 138 141 140 176 165 165 71 38 38 38 39 0 0NV 0 0 0 0 0 0 0 0 0 0 0 0 0 0 0 0 0 0 0 24 23 23 23 23 23 24 24 0 0 0MT 0 0 0 0 0 0 1 1 1 1 1 1 1 1 0 0 0 0 0 0 0 0 0 0 0 0 0 0 0 0AK 0 0 0 0 0 0 0 0 0 0 0 0 0 0 0 0 0 0 0 0 0 0 0 0 0 0 0 0 0 0WY 0 0 0 0 0 0 0 0 0 0 0 0 0 0 0 0 0 0 0 0 118 118 117 117 118 119 119 120 0 0AR 0 0 0 0 2 2 2 2 2 2 2 2 0 0 0 0 0 0 0 72 71 71 71 71 71 72 72 0 0 0WV 0 0 0 0 0 0 0 0 0 0 0 0 0 0 0 0 0 0 0 0 21 21 21 21 21 21 21 21 0 0Total 4,100 6,100 7,800 11,400 14,600 17,900 21,500 24,100 25,500 28,400 29,000 27,600 28,200 29,600 34,500 40,400 48,700 63,700 92,400 145,600 224,800 252,600 252,500 253,500 262,200 269,500 276,700 254,900 203,700 179,400
Figure 1.07Capital Under Management By State 1980 to 2009 ($ Millions)
Capital Commitments
Methodology
As defined by Thomson Reuters, capital commit-ments, also known as fundraising, are firm capitalcommitments to private equity limited partnershipsby outside investors. For purposes of these statistics,the terms “capital commitments,” “fundraising,” and“fund closes” are used interchangeably. There arethree sources of data for capital commitments: (1)SEC filings that are regularly monitored by ourresearch staff, (2) surveys of the industry routinelyconducted by Thomson Reuters, and (3) industrypress and press releases from venture firms. Capital commitments are stated on either a calendaryear basis when committed or a vintage year basisonce the fund starts investing depending on the analy-sis required. The data in this chapter is by calendar
year and incrementally measures how much capital afund raised during the calendar year. For example, aventure capital firm announces a $200 million fund inlate 2007, raises $75 million in 2008, and subsequent-ly raises the remaining $125 million in 2009. In thischapter, nothing would be reflected in 2007, $75 mil-lion would be counted in 2008, and $125 millionwould be counted in 2009. Assuming it started invest-ing and made its first capital call in 2009, the entirefund would then be considered to be a 2009 vintageyear fund. An important note: the fund commitmentspresented in this publication do not include those cor-porate captive venture capital funds that are fundedby a corporate parent as well as evergreen funds sincethey do not typically raise capital from outsideinvestors.
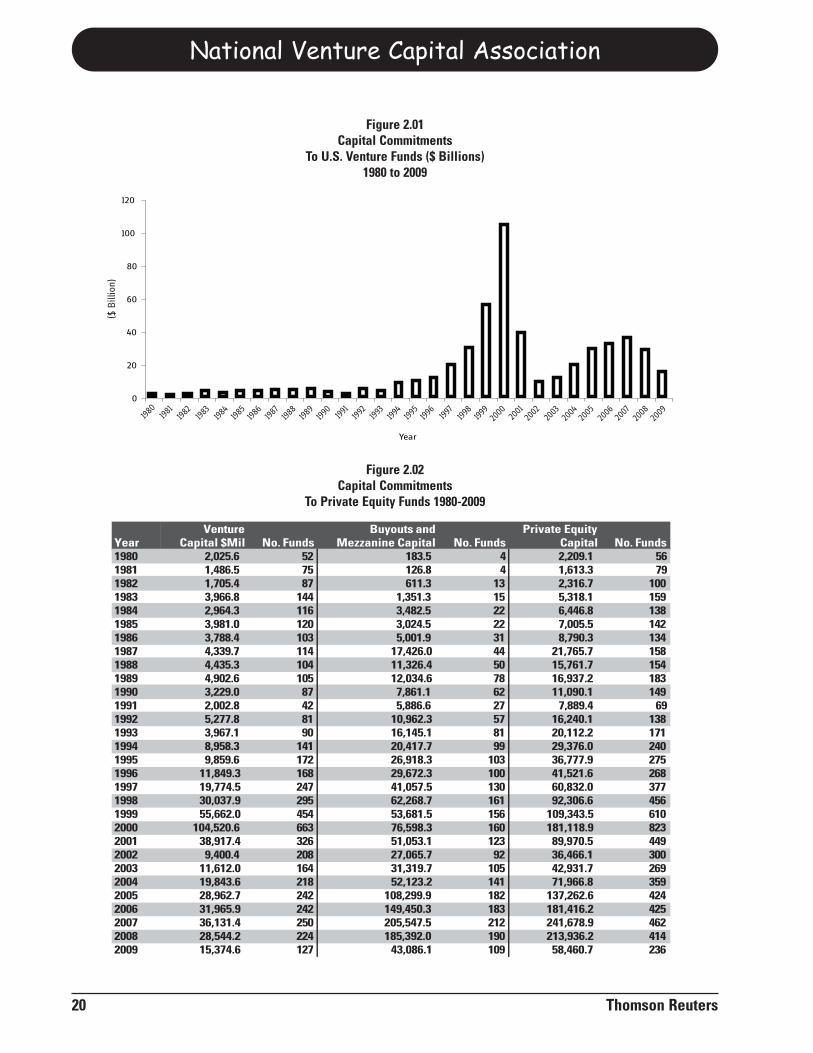
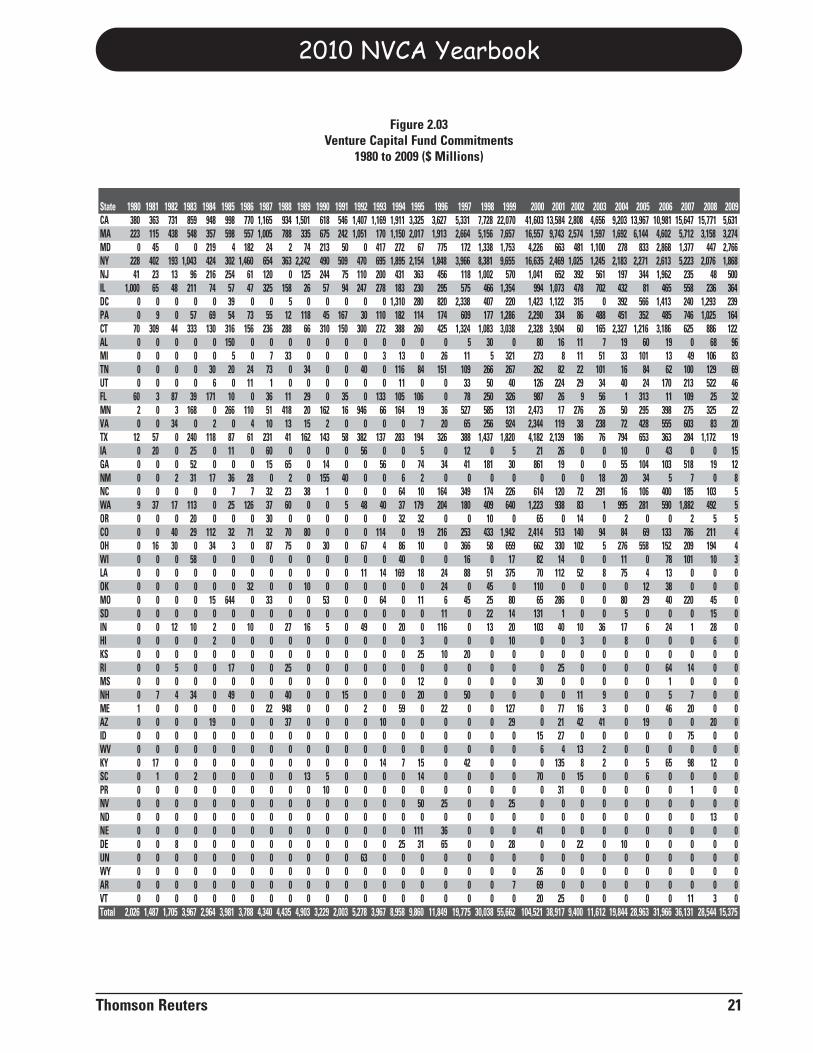
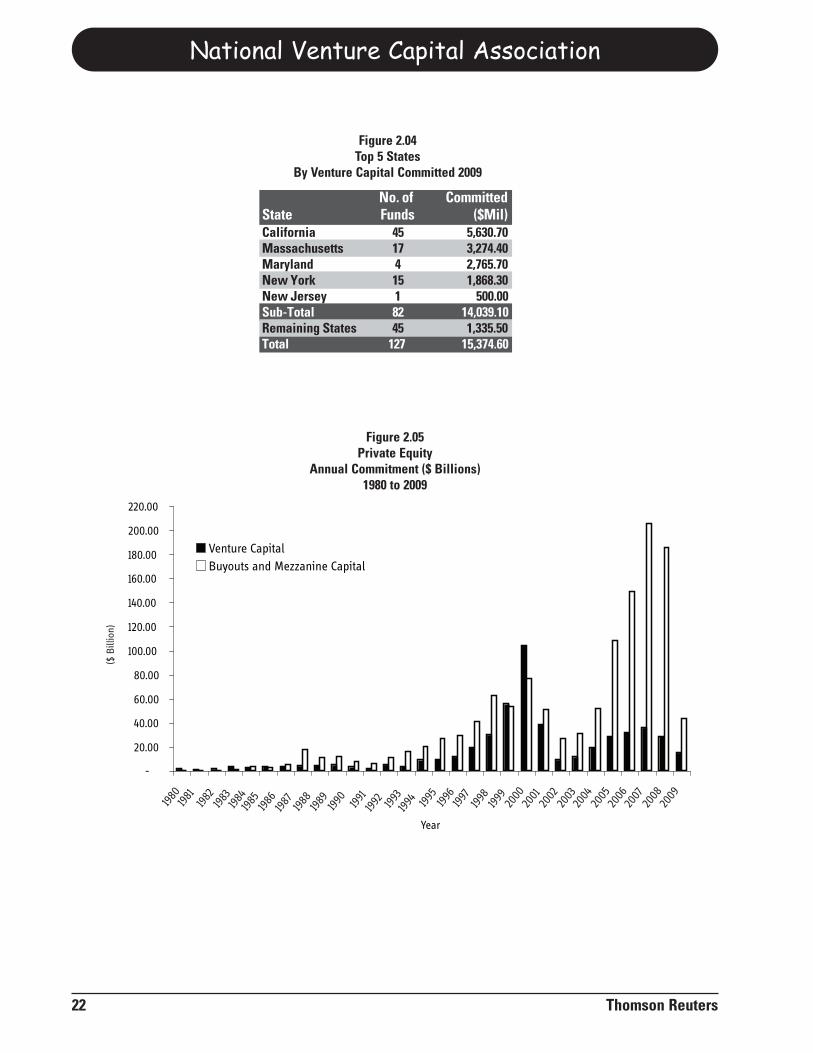
New commitments to venture capital funds in the United States again decreased in 2009 to $15.4 billion fromtheir post-bubble record level $36.1 billion in 2007. This reflects a very difficult fundraising environment inpart created by recent economic stress. However, most of the decrease reflects the contraction of the U.S. ven-ture capital industry that began after the technology bubble burst in 2000.In 2009, 127 funds raised $15.4 billion, down 46% from the $28.5 billion raised in 2008. Fundraising in 2009was down 57% from the peak $36.1 billion in 2007. A look behind the charts shows that this total was dominat-ed by a small group of firms, most of which are the same firms that led fundraising a decade or two ago. Moneyraised by the three largest firms in 2009 represented 31% of the total. The top seven firms raised 46% of the total.For most firms, the fundraising environment in 2009 was difficult, with only the most promising, and in manycases, established, firms able to raise capital. Over the past few years, it has been very difficult for any firmnot perceived as having top quartile potential to raise money. The 2009 environment took that to a new level.There are several reasons for fundraising difficulty: (1) the denominator effect where institutional investorsfound themselves over allocated to the asset class as their overall portfolio valuations fell, (2) few distributionsback to investors from exits in recent years thus impairing the traditional “recycling” of capital from maturefund exits to newly-emerging funds, and (3) with strong returns difficult in the current environment, top per-forming firms have a better chance of outperforming other asset classes on a risk-adjusted basis.Looking at annual commitment totals, venture firms had raised considerable funds in 2007 and the first partof 2008. As the economy worsened toward the end of 2008, many institutional investors (e.g., pension plans,endowments, money managers) saw the public portion of their portfolios fall and found themselves over-allo-cated to alternative asset classes, including venture capital. This slowdown dominated the last half of 2008 andaccelerated further in 2009. The top two fundraising states remained California and Massachusetts. Rounding out the top five states areMaryland, New York, and New Jersey. Overall, funds domiciled in the top five states accounted for 91% of thecapital raised compared with the top five 2008 states raising 82% of the total.Please note that the state of fund domicile matters less than has been true historically. Much of the money ismanaged by large, national funds that tend to be domiciled in any of several states with a broad geographicinvesting footprint. For example, the U.S. venture firm raising the most money in 2009 is domiciled in the mid-Atlantic but does most of its investing elsewhere.
Thomson Reuters 19
National Venture Capital Association
20 Thomson Reuters
YearVenture
Capital $Mil No. FundsBuyouts and
Mezzanine Capital No. FundsPrivate Equity
Capital No. Funds1980 2,025.6 52 183.5 4 2,209.1 561981 1,486.5 75 126.8 4 1,613.3 791982 1,705.4 87 611.3 13 2,316.7 1001983 3,966.8 144 1,351.3 15 5,318.1 1591984 2,964.3 116 3,482.5 22 6,446.8 1381985 3,981.0 120 3,024.5 22 7,005.5 1421986 3,788.4 103 5,001.9 31 8,790.3 1341987 4,339.7 114 17,426.0 44 21,765.7 1581988 4,435.3 104 11,326.4 50 15,761.7 1541989 4,902.6 105 12,034.6 78 16,937.2 1831990 3,229.0 87 7,861.1 62 11,090.1 1491991 2,002.8 42 5,886.6 27 7,889.4 691992 5,277.8 81 10,962.3 57 16,240.1 1381993 3,967.1 90 16,145.1 81 20,112.2 1711994 8,958.3 141 20,417.7 99 29,376.0 2401995 9,859.6 172 26,918.3 103 36,777.9 2751996 11,849.3 168 29,672.3 100 41,521.6 2681997 19,774.5 247 41,057.5 130 60,832.0 3771998 30,037.9 295 62,268.7 161 92,306.6 4561999 55,662.0 454 53,681.5 156 109,343.5 6102000 104,520.6 663 76,598.3 160 181,118.9 8232001 38,917.4 326 51,053.1 123 89,970.5 4492002 9,400.4 208 27,065.7 92 36,466.1 3002003 11,612.0 164 31,319.7 105 42,931.7 2692004 19,843.6 218 52,123.2 141 71,966.8 3592005 28,962.7 242 108,299.9 182 137,262.6 4242006 31,965.9 242 149,450.3 183 181,416.2 4252007 36,131.4 250 205,547.5 212 241,678.9 4622008 28,544.2 224 185,392.0 190 213,936.2 4142009 15,374.6 127 43,086.1 109 58,460.7 236
Figure 2.02Capital Commitments
To Private Equity Funds 1980-2009
0
20
40
60
80
100
120
Year
Figure 2.01Capital Commitments
To U.S. Venture Funds ($ Billions)1980 to 2009
($B
illio
n)
1980
1981
1982
1983
1984
1985
1986
1987
1988
1989
1990
1991
1992
1993
1994
1995
1996
1997
1998
1999
2000 20
0120
0220
0320
0420
0520
0620
0720
0820
09
2010 NVCA Yearbook
Thomson Reuters 21
State 1980 1981 1982 1983 1984 1985 1986 1987 1988 1989 1990 1991 1992 1993 1994 1995 1996 1997 1998 1999 2000 2001 2002 2003 2004 2005 2006 2007 2008 2009CA 380 363 731 859 948 998 770 1,165 934 1,501 618 546 1,407 1,169 1,911 3,325 3,627 5,331 7,728 22,070 41,603 13,584 2,808 4,656 9,203 13,967 10,981 15,647 15,771 5,631MA 223 115 438 548 357 598 557 1,005 788 335 675 242 1,051 170 1,150 2,017 1,913 2,664 5,156 7,657 16,557 9,743 2,574 1,597 1,692 6,144 4,602 5,712 3,158 3,274MD 0 45 0 0 219 4 182 24 2 74 213 50 0 417 272 67 775 172 1,338 1,753 4,226 663 481 1,100 278 833 2,868 1,377 447 2,766NY 228 402 193 1,043 424 302 1,460 654 363 2,242 490 509 470 695 1,895 2,154 1,848 3,966 8,381 9,655 16,635 2,469 1,025 1,245 2,183 2,271 2,613 5,223 2,076 1,868NJ 41 23 13 96 216 254 61 120 0 125 244 75 110 200 431 363 456 118 1,002 570 1,041 652 392 561 197 344 1,962 235 48 500IL 1,000 65 48 211 74 57 47 325 158 26 57 94 247 278 183 230 295 575 466 1,354 994 1,073 478 702 432 81 465 558 236 364DC 0 0 0 0 0 39 0 0 5 0 0 0 0 0 1,310 280 820 2,338 407 220 1,423 1,122 315 0 392 566 1,413 240 1,293 239PA 0 9 0 57 69 54 73 55 12 118 45 167 30 110 182 114 174 609 177 1,286 2,290 334 86 488 451 352 485 746 1,025 164CT 70 309 44 333 130 316 156 236 288 66 310 150 300 272 388 260 425 1,324 1,083 3,038 2,328 3,904 60 165 2,327 1,216 3,186 625 886 122AL 0 0 0 0 0 150 0 0 0 0 0 0 0 0 0 0 0 5 30 0 80 16 11 7 19 60 19 0 68 96MI 0 0 0 0 0 5 0 7 33 0 0 0 0 3 13 0 26 11 5 321 273 8 11 51 33 101 13 49 106 83TN 0 0 0 0 30 20 24 73 0 34 0 0 40 0 116 84 151 109 266 267 262 82 22 101 16 84 62 100 129 69UT 0 0 0 0 6 0 11 1 0 0 0 0 0 0 11 0 0 33 50 40 126 224 29 34 40 24 170 213 522 46FL 60 3 87 39 171 10 0 36 11 29 0 35 0 133 105 106 0 78 250 326 987 26 9 56 1 313 11 109 25 32MN 2 0 3 168 0 266 110 51 418 20 162 16 946 66 164 19 36 527 585 131 2,473 17 276 26 50 295 398 275 325 22VA 0 0 34 0 2 0 4 10 13 15 2 0 0 0 0 7 20 65 256 924 2,344 119 38 238 72 428 555 603 83 20TX 12 57 0 240 118 87 61 231 41 162 143 58 382 137 283 194 326 388 1,437 1,820 4,182 2,139 186 76 794 653 363 284 1,172 19IA 0 20 0 25 0 11 0 60 0 0 0 0 56 0 0 5 0 12 0 5 21 26 0 0 10 0 43 0 0 15GA 0 0 0 52 0 0 0 15 65 0 14 0 0 56 0 74 34 41 181 30 861 19 0 0 55 104 103 518 19 12NM 0 0 2 31 17 36 28 0 2 0 155 40 0 0 6 2 0 0 0 0 0 0 0 18 20 34 5 7 0 8NC 0 0 0 0 0 7 7 32 23 38 1 0 0 0 64 10 164 349 174 226 614 120 72 291 16 106 400 185 103 5WA 9 37 17 113 0 25 126 37 60 0 0 5 48 40 37 179 204 180 409 640 1,223 938 83 1 995 281 590 1,882 492 5OR 0 0 0 20 0 0 0 30 0 0 0 0 0 0 32 32 0 0 10 0 65 0 14 0 2 0 0 2 5 5CO 0 0 40 29 112 32 71 32 70 80 0 0 0 114 0 19 216 253 433 1,942 2,414 513 140 94 84 69 133 786 211 4OH 0 16 30 0 34 3 0 87 75 0 30 0 67 4 86 10 0 366 58 659 662 330 102 5 276 558 152 209 194 4WI 0 0 0 58 0 0 0 0 0 0 0 0 0 0 40 0 0 16 0 17 82 14 0 0 11 0 78 101 10 3LA 0 0 0 0 0 0 0 0 0 0 0 0 11 14 169 18 24 88 51 375 70 112 52 8 75 4 13 0 0 0OK 0 0 0 0 0 0 32 0 0 10 0 0 0 0 0 0 24 0 45 0 110 0 0 0 0 12 38 0 0 0MO 0 0 0 0 15 644 0 33 0 0 53 0 0 64 0 11 6 45 25 80 65 286 0 0 80 29 40 220 45 0SD 0 0 0 0 0 0 0 0 0 0 0 0 0 0 0 0 11 0 22 14 131 1 0 0 5 0 0 0 15 0IN 0 0 12 10 2 0 10 0 27 16 5 0 49 0 20 0 116 0 13 20 103 40 10 36 17 6 24 1 28 0HI 0 0 0 0 2 0 0 0 0 0 0 0 0 0 0 3 0 0 0 10 0 0 3 0 8 0 0 0 6 0KS 0 0 0 0 0 0 0 0 0 0 0 0 0 0 0 25 10 20 0 0 0 0 0 0 0 0 0 0 0 0RI 0 0 5 0 0 17 0 0 25 0 0 0 0 0 0 0 0 0 0 0 0 25 0 0 0 0 64 14 0 0MS 0 0 0 0 0 0 0 0 0 0 0 0 0 0 0 12 0 0 0 0 30 0 0 0 0 0 1 0 0 0NH 0 7 4 34 0 49 0 0 40 0 0 15 0 0 0 20 0 50 0 0 0 0 11 9 0 0 5 7 0 0ME 1 0 0 0 0 0 0 22 948 0 0 0 2 0 59 0 22 0 0 127 0 77 16 3 0 0 46 20 0 0AZ 0 0 0 0 19 0 0 0 37 0 0 0 0 10 0 0 0 0 0 29 0 21 42 41 0 19 0 0 20 0ID 0 0 0 0 0 0 0 0 0 0 0 0 0 0 0 0 0 0 0 0 15 27 0 0 0 0 0 75 0 0WV 0 0 0 0 0 0 0 0 0 0 0 0 0 0 0 0 0 0 0 0 6 4 13 2 0 0 0 0 0 0KY 0 17 0 0 0 0 0 0 0 0 0 0 0 14 7 15 0 42 0 0 0 135 8 2 0 5 65 98 12 0SC 0 1 0 2 0 0 0 0 0 13 5 0 0 0 0 14 0 0 0 0 70 0 15 0 0 6 0 0 0 0PR 0 0 0 0 0 0 0 0 0 0 10 0 0 0 0 0 0 0 0 0 0 31 0 0 0 0 0 1 0 0NV 0 0 0 0 0 0 0 0 0 0 0 0 0 0 0 50 25 0 0 25 0 0 0 0 0 0 0 0 0 0ND 0 0 0 0 0 0 0 0 0 0 0 0 0 0 0 0 0 0 0 0 0 0 0 0 0 0 0 0 13 0NE 0 0 0 0 0 0 0 0 0 0 0 0 0 0 0 111 36 0 0 0 41 0 0 0 0 0 0 0 0 0DE 0 0 8 0 0 0 0 0 0 0 0 0 0 0 25 31 65 0 0 28 0 0 22 0 10 0 0 0 0 0UN 0 0 0 0 0 0 0 0 0 0 0 0 63 0 0 0 0 0 0 0 0 0 0 0 0 0 0 0 0 0WY 0 0 0 0 0 0 0 0 0 0 0 0 0 0 0 0 0 0 0 0 26 0 0 0 0 0 0 0 0 0AR 0 0 0 0 0 0 0 0 0 0 0 0 0 0 0 0 0 0 0 7 69 0 0 0 0 0 0 0 0 0VT 0 0 0 0 0 0 0 0 0 0 0 0 0 0 0 0 0 0 0 0 20 25 0 0 0 0 0 11 3 0Total 2,026 1,487 1,705 3,967 2,964 3,981 3,788 4,340 4,435 4,903 3,229 2,003 5,278 3,967 8,958 9,860 11,849 19,775 30,038 55,662 104,521 38,917 9,400 11,612 19,844 28,963 31,966 36,131 28,544 15,375
Figure 2.03Venture Capital Fund Commitments
1980 to 2009 ($ Millions)
National Venture Capital Association
22 Thomson Reuters
-
20.00
40.00
60.00
80.00
100.00
120.00
140.00
160.00
180.00
200.00
220.00
Year
Venture Capital
Buyouts and Mezzanine Capital
Figure 2.05Private Equity
Annual Commitment ($ Billions)1980 to 2009
No. of CommittedState Funds ($Mil)California 45 5,630.70Massachusetts 17 3,274.40Maryland 4 2,765.70New York 15 1,868.30New Jersey 1 500.00Sub-Total 82 14,039.10Remaining States 45 1,335.50Total 127 15,374.60
Figure 2.04Top 5 States
By Venture Capital Committed 2009
($B
illio
n)
1980
1981
1982
1983
1984
1985
1986
1987 1988
1989 1990 1991
1992 1993
1994 1995
1996
1997
1998
1999
2000
2001
2002
2003
2004
2005
2006
2007
2008
2009
Investments
Methodology
As calculated by Thomson Reuters, venture capitalinvestment data are derived from several sources.Primarily, survey information is obtained from thequarterly survey which drives the MoneyTreeReport™ from PricewaterhouseCoopers and theNational Venture Capital Association based on datafrom Thomson Reuters. This is the official industry
database of venture capital investment. Secondly,Thomson Reuters obtains data from SEC filings thatare regularly monitored by our research staff. Finally,publicly available sources such as press releases andtrade publications are used.
For detailed information on which transactions quali-fy as MoneyTree deals and are therefore counted inthis chapter, please refer to Appendix B.
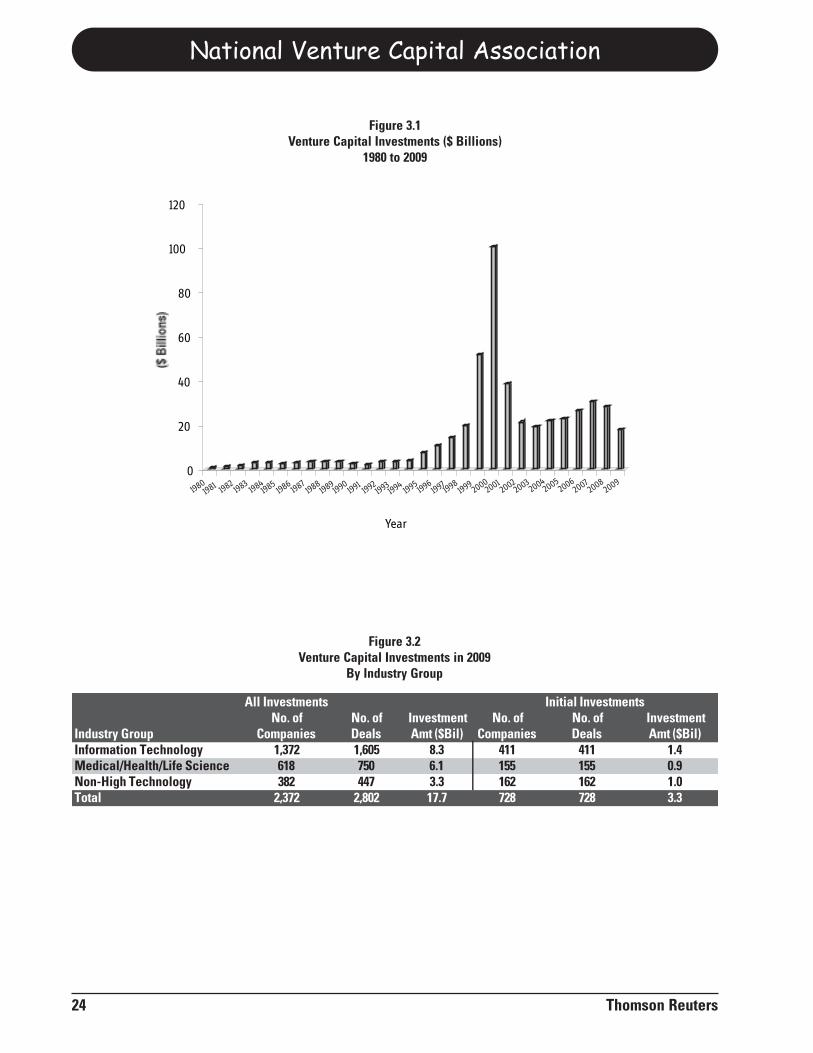
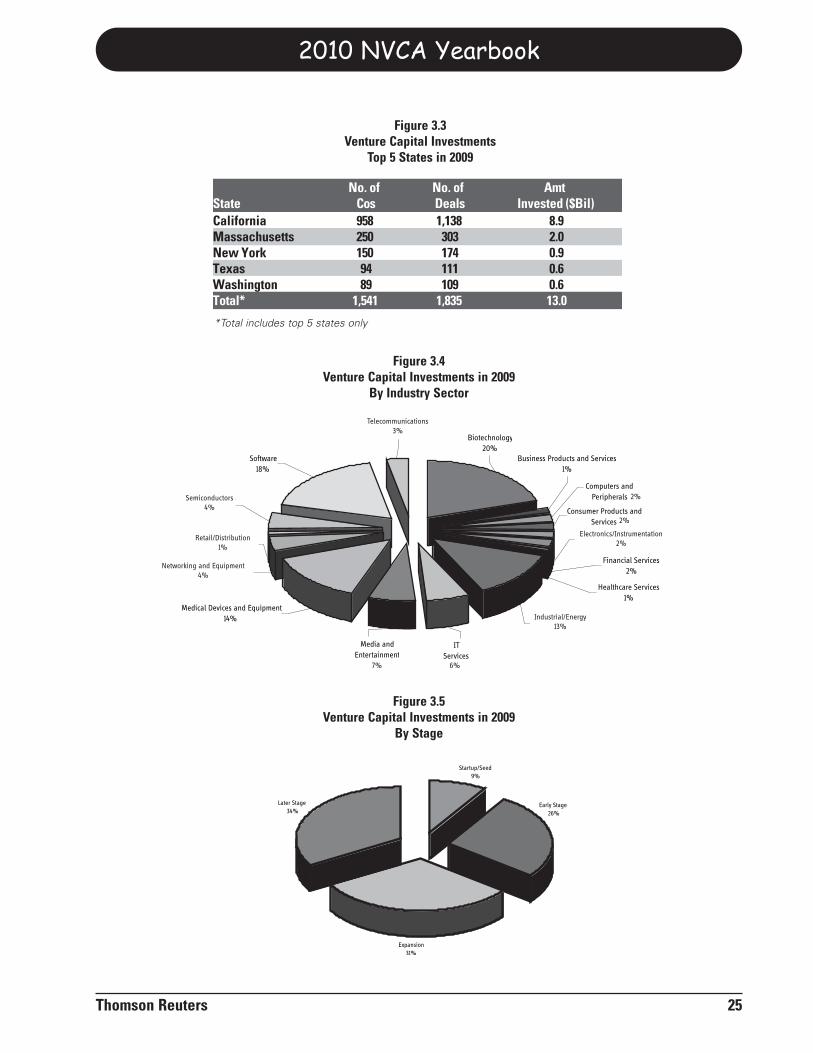
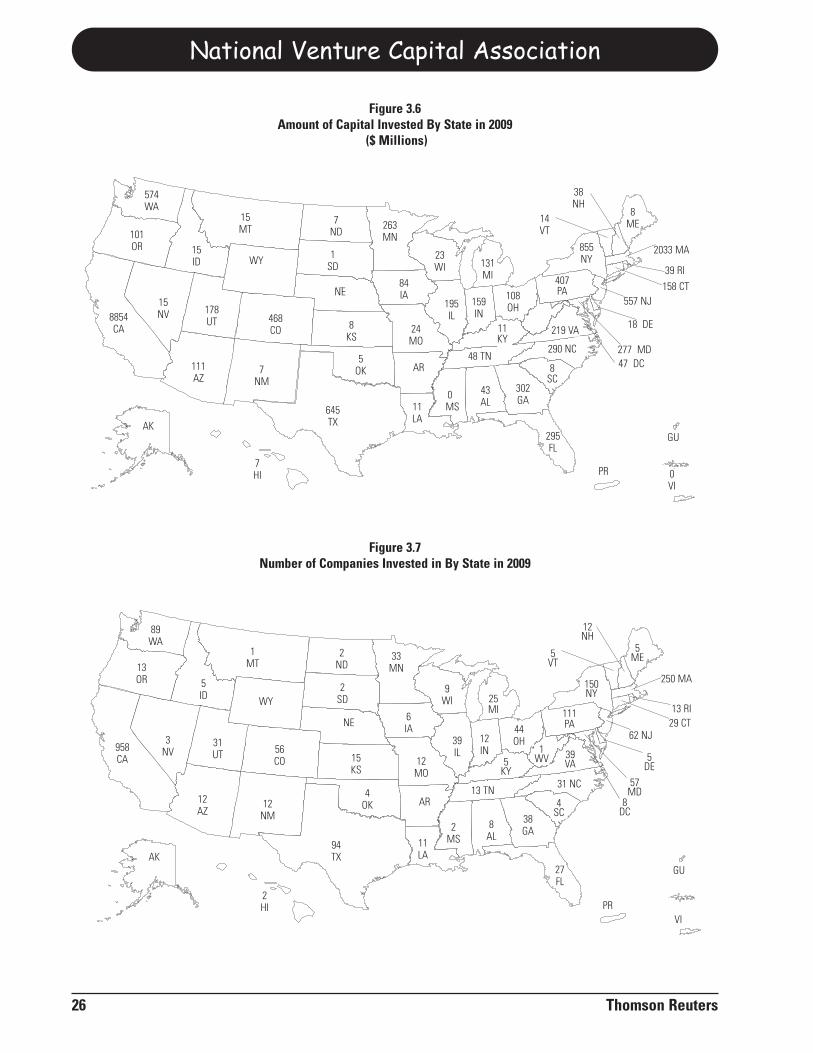
In 2009, total venture investment decreased 37% in dollars and 30% in number of deals from 2008. Total ven-ture investment decreased from $27.9 billion to $17.7 billion. While the timing of this most recent drop in indus-try size followed global economic concerns in mid-2008, the downward resizing of the industry is a result ofthe technology bubble bursting in 2000. Many of the venture firms which raised funds at the peak have sincedeployed their available capital and are unable to raise new funds. A sub-$20-billion industry is welcomed bymany long time practitioners as a return to a manageable size.After years of taking on 1,000++ companies each year, the industry in 2009 funded 728 first time companies.While numerically fewer, each one represents a fresh commitment by venture capital funds to the future. The contention for venture capitalist attention (and dollars) between existing later stage portfolio companiesand newly-arriving business plans continues. There are still a record number of companies in portfolios in thelater stage of development which in most other environments would have already gone public or otherwisebeen acquired. While the actual number of later stage deals declined in 2009, the proportion is still historical-ly high. Not all of these later stage companies received further funding in 2009. Many of those companieswhich did not get 2009 funding have had to cut back growth plans awaiting better times. With IPOs occurringat a mere trickle and M&A markets slow, there is no place for these companies to go.The life sciences share of the venture capital investment scene continued to grow. In 2009, 20% of total dollarswent to biotechnology companies, 14% went to medical devices and equipment and 1% went to healthcareservices. Clean technology is the industry’s most visible emerging sector with $2.2 billion invested in 2009 —just over 12% of the total dollars and more than four times the amount of four years earlier.California companies received just over 50% of the total investment dollars although individual centers of sec-tor strength and strong deal flow drove investment to 46 states and DC. Investment by corporate venture capital groups declined to 7% of total US investment in 2009. Approximately13% of all rounds involve at least one corporate venture group down from 19% a year earlier. Several factors were in play which put upward pressure on the amount of venture capital invested: (1) thereare a record number of later stage companies which need continued funding in light of poor exit opportunities;(2) the emerging sectors such as biotechnology, medical devices, and clean technology tend to be more capi-tal intensive than typical information technology companies;(3) venture firms report an increasing number ofhigh-quality opportunities and teams in the marketplace; and (4) increased government R&D funding willundoubtedly make certain sectors more investible in the future. On the other hand, those factors suppressinginvestment levels in the near term are (1) the need for capital efficiency at the portfolio companies – lengthen-ing the runway and reducing the burn rate; (2) possible difficulty in additional fundraising from institutionalinvestors over the next several quarters because of stretched allocations to this asset class; and (3) a lack ofexits means lack of distributions which means a lack of capital which can be recycled for future investment.
Thomson Reuters 23
National Venture Capital Association
24 Thomson Reuters
No. of No. of Investment No. of No. of InvestmentIndustry Group Companies Deals Amt ($Bil) Companies Deals Amt ($Bil)Information Technology 1,372 1,605 8.3 411 411 1.4Medical/Health/Life Science 618 750 6.1 155 155 0.9Non-High Technology 382 447 3.3 162 162 1.0Total 2,372 2,802 17.7 728 728 3.3
All Investments Initial Investments
0
20
40
60
80
100
120
Year
Figure 3.2Venture Capital Investments in 2009
By Industry Group
Figure 3.1Venture Capital Investments ($ Billions)
1980 to 2009
19801981 1982
19831984
19851986
19871988
19891990
19911992
199319941995
199619971998
19992000
20012002
20032004
20052006
20072008
2009
2010 NVCA Yearbook
Thomson Reuters 25
No. of No. of AmtState Cos Deals Invested ($Bil)California 958 1,138 8.9Massachusetts 250 303 2.0New York 150 174 0.9Texas 94 111 0.6Washington 89 109 0.6Total* 1,541 1,835 13.0
Figure 3.3Venture Capital Investments
Top 5 States in 2009
Telecommunications
Software18%
Semiconductors
Retailing/Distribution
Networking and Equipment4%
Medical Devices and Equipment14%
Media and Entertainment
ITServices
Industrial/Energy13%
Healthcare Services1%
Financial Services2%
Electronics/Instrumentation2%
Consumer Products and Services
Computers and Peripherals
Business Products and Services1%
Biotechnology20%
Figure 3.4Venture Capital Investments in 2009
By Industry Sector
Startup/Seed9%
Expansion31%
Later Stage34%
Early Stage26%
Figure 3.5Venture Capital Investments in 2009
By Stage
*Total includes top 5 states only
2%
Telecommunications3%
Semiconductors4%
Retail/Distribution 1%
Networking and Equipment 4%
Industrial/Energy13%
Electronics/Instrumentation2%
2%
7% 6%
AR
NE
WY
8
AL
56CO 5
DE
38
GA
2
HI
15
KS
MA
57MD
33MN
12
MO
2MS
1
MT2
ND
12
NH
12NM
44
OH
94
TX
31
UT
5
VT
9
WI
250
AK
AR
NE
WY
43
AL
111
AZ
468CO 18
DE
302
GA
7
HI
84
IA
15
ID
8
KS
277MD
263MN
24
MO
0MS
15
MT7
ND
7NM
15NV
101OR
645
TX
178
UT
574WA
23
WI
National Venture Capital Association
26 Thomson Reuters
Figure 3.6Amount of Capital Invested By State in 2009
($ Millions)
Figure 3.7Number of Companies Invested in By State in 2009
15MT
15ID WY
468CO
178UT
15NV8854
CA
111AZ
7NM
645TX
7ND
1SD
NE
8KS
5OK
263MN
23WI 131
MI
855NY
14VT
38NH
8ME
2033 MA
39 RI
158 CT557 NJ
18 DE
277 MD290 NC48 TN
0MS
43AL
302GA
295FL
PR 0VI
GU
84IA
195IL
159IN
108OH
219 VA11KY
24MO
AR
11LA
7HI
AK
AK
13OR
1MT
2ND
33MN
5ID
2SD
958CA
3NV
31UT 56
CO
NE
15KS
6IA
9WI 25
MI
12MO
39IL
12IN
44OH
5KY
13 TN
111PA
39VA
5ME
12NH
5VT
150NY
8DC
AR4
OK
94TX
2HI
11LA
2MS
8AL
38GA
27FL
PRVI
GU
12NM
12AZ
WY
407PA
47 DC8SC
4SC
57MD
5DE
62 NJ29 CT13 RI
250 MA
1WV
31 NC
574WA
101OR
89WA
2010 NVCA Yearbook
Thomson Reuters 27
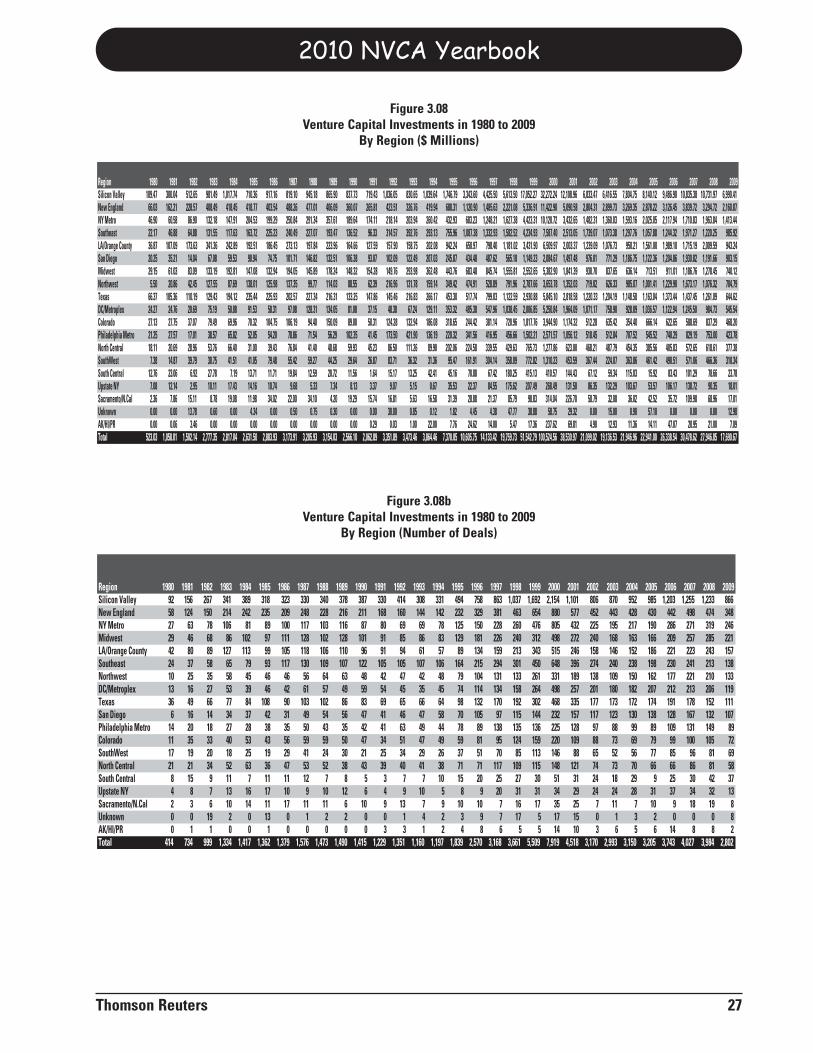
Region 1980 1981 1982 1983 1984 1985 1986 1987 1988 1989 1990 1991 1992 1993 1994 1995 1996 1997 1998 1999 2000 2001 2002 2003 2004 2005 2006 2007 2008 2009Silicon Valley 109.47 300.04 512.65 981.49 1,017.74 710.36 917.16 819.10 945.18 865.90 837.73 719.43 1,036.05 830.65 1,039.64 1,746.79 3,343.60 4,425.50 5,613.50 17,052.27 32,272.24 12,108.96 6,833.47 6,416.55 7,804.75 8,140.12 9,486.90 10,835.38 10,731.97 6,990.41New England 66.03 162.21 228.57 408.49 418.45 418.77 403.54 488.26 477.01 406.09 360.07 265.81 423.51 326.76 419.94 688.31 1,120.90 1,485.63 2,221.08 5,336.91 11,422.90 5,090.58 2,804.31 2,899.73 3,269.35 2,878.22 3,126.45 3,839.72 3,294.72 2,160.87NY Metro 46.90 60.58 86.90 132.18 147.91 204.53 199.29 250.84 291.34 357.61 189.64 174.11 218.14 203.94 260.42 432.93 683.23 1,248.21 1,627.38 4,423.31 10,120.72 3,432.65 1,482.31 1,360.03 1,593.16 2,025.05 2,117.94 1,710.83 1,963.84 1,413.44Southeast 22.17 46.88 64.88 131.55 117.63 163.72 225.23 240.49 227.07 193.47 136.52 96.33 314.57 392.76 293.13 755.96 1,087.38 1,332.93 1,582.52 4,234.93 7,587.40 2,513.05 1,739.07 1,073.38 1,297.76 1,057.88 1,244.32 1,971.27 1,220.25 985.92LA/Orange County 36.87 107.09 173.63 341.36 242.89 192.51 186.45 273.13 197.84 223.96 164.66 127.59 157.90 158.75 202.08 942.24 650.97 798.40 1,181.02 3,431.90 6,509.97 2,003.37 1,239.09 1,076.73 950.21 1,561.00 1,989.10 1,715.19 2,009.59 943.24San Diego 20.25 35.21 14.04 67.08 59.53 90.94 74.75 101.71 146.82 132.51 106.38 93.07 102.09 122.49 207.03 245.87 434.48 487.62 565.18 1,149.23 2,084.67 1,497.48 976.01 771.29 1,186.75 1,122.36 1,204.86 1,930.82 1,191.66 903.15Midwest 29.15 61.03 83.09 133.19 192.81 147.08 132.94 194.05 145.89 178.24 148.32 154.28 149.76 293.98 362.48 443.76 683.48 845.74 1,555.81 2,552.65 5,382.90 1,841.39 930.70 837.65 636.14 713.51 911.01 1,186.76 1,278.45 740.12Northwest 5.50 20.86 42.45 127.55 87.69 138.01 125.98 137.35 99.77 114.03 88.55 62.39 216.96 131.78 159.14 349.42 474.91 528.89 791.96 2,787.66 3,653.78 1,352.03 719.02 626.33 985.07 1,001.41 1,229.90 1,673.17 1,076.32 704.79Texas 66.37 105.36 110.19 129.43 194.12 235.44 225.93 202.57 227.34 216.31 133.25 147.86 145.46 216.83 266.17 453.30 517.74 799.03 1,122.59 2,930.88 5,845.10 2,818.58 1,220.33 1,204.19 1,148.58 1,163.04 1,373.44 1,437.45 1,261.09 644.62DC/Metroplex 24.27 24.76 20.69 75.19 50.88 91.53 58.31 97.08 128.31 134.05 81.08 37.15 48.38 67.24 129.11 353.32 485.38 547.96 1,038.45 2,006.85 5,250.84 1,964.09 1,071.17 758.90 928.09 1,036.57 1,122.94 1,245.50 984.73 545.54Colorado 27.13 27.75 37.07 79.49 69.96 70.32 104.75 106.19 94.40 150.09 89.00 50.31 124.28 132.94 186.08 318.65 244.42 381.14 720.96 1,817.76 3,944.90 1,174.32 512.28 635.42 354.40 666.14 622.65 588.69 837.29 468.20Philadelphia Metro 21.25 27.57 17.01 38.57 65.82 52.05 54.20 78.86 71.54 56.29 102.35 41.45 173.50 421.90 136.19 220.32 341.56 416.95 456.66 1,502.21 2,571.57 1,056.12 518.45 512.84 707.52 545.52 740.29 829.19 753.00 423.78North Central 18.11 20.69 28.96 53.76 66.40 31.00 39.43 76.84 41.40 48.68 59.93 45.23 86.50 111.26 89.90 202.06 224.58 339.55 429.63 765.73 1,277.86 623.00 468.21 487.79 454.35 385.56 405.83 572.65 618.61 377.38SouthWest 7.38 14.87 39.79 30.75 41.51 41.05 79.48 55.42 59.27 44.25 29.64 26.87 83.71 36.32 31.36 95.47 161.91 304.14 358.09 772.82 1,310.23 453.59 367.44 224.07 363.86 461.42 490.51 571.06 466.36 310.34South Central 12.76 23.06 6.92 27.78 7.19 13.71 11.71 19.84 12.59 20.72 11.56 1.64 15.17 13.25 42.41 45.16 70.88 67.42 180.25 415.13 410.57 144.43 67.12 59.34 115.03 15.92 83.43 101.29 78.66 23.78Upstate NY 7.08 12.14 2.95 10.11 17.43 14.16 10.74 9.68 5.33 7.34 8.13 3.37 9.07 5.15 0.67 35.53 22.37 84.55 175.62 207.49 268.49 131.50 86.35 132.29 103.67 53.57 106.17 138.72 90.35 18.01Sacramento/N.Cal 2.36 7.86 15.11 8.78 19.08 11.98 34.02 22.00 34.10 4.20 19.29 15.74 16.81 5.63 16.58 31.39 28.88 21.37 85.79 98.83 314.04 226.70 58.79 32.08 36.02 42.52 35.72 109.98 68.96 17.01Unknown 0.00 0.00 13.78 0.60 0.00 4.34 0.00 0.50 0.75 0.30 0.00 0.00 30.00 0.85 0.12 1.82 4.45 4.38 47.77 38.88 58.75 29.32 0.00 15.00 0.90 57.10 0.00 0.00 0.00 12.98AK/HI/PR 0.00 0.06 3.46 0.00 0.00 0.00 0.00 0.00 0.00 0.00 0.00 0.29 0.03 1.00 22.00 7.76 24.62 14.00 5.47 17.36 237.62 69.81 4.90 12.93 11.36 14.11 47.07 20.95 21.00 7.09Total 523.03 1,058.01 1,502.14 2,777.35 2,817.04 2,631.50 2,883.93 3,173.91 3,205.93 3,154.03 2,566.10 2,062.89 3,351.89 3,473.46 3,864.46 7,370.05 10,605.75 14,133.42 19,759.73 51,542.79 100,524.56 38,530.97 21,099.02 19,136.53 21,946.96 22,941.00 26,338.54 30,478.62 27,946.85 17,690.67
Figure 3.08Venture Capital Investments in 1980 to 2009
By Region ($ Millions)
Region 1980 1981 1982 1983 1984 1985 1986 1987 1988 1989 1990 1991 1992 1993 1994 1995 1996 1997 1998 1999 2000 2001 2002 2003 2004 2005 2006 2007 2008 2009Silicon Valley 92 156 267 341 389 318 323 330 340 378 387 330 414 308 331 494 758 863 1,037 1,692 2,154 1,101 806 870 952 985 1,203 1,255 1,233 866New England 58 124 150 214 242 235 209 248 228 216 211 168 160 144 142 232 329 381 463 654 880 577 452 443 428 430 442 498 474 348NY Metro 27 63 78 106 81 89 100 117 103 116 87 80 69 69 78 125 150 228 260 476 805 432 225 195 217 190 286 271 319 246Midwest 29 46 68 86 102 97 111 128 102 128 101 91 85 86 83 129 181 226 240 312 498 272 240 168 163 166 209 257 285 221LA/Orange County 42 80 89 127 113 99 105 118 106 110 96 91 94 61 57 89 134 159 213 343 515 246 158 146 152 186 221 223 243 157Southeast 24 37 58 65 79 93 117 130 109 107 122 105 105 107 106 164 215 294 301 450 648 396 274 240 238 198 230 241 213 138Northwest 10 25 35 58 45 46 46 56 64 63 48 42 47 42 48 79 104 131 133 261 331 189 138 109 150 162 177 221 210 133DC/Metroplex 13 16 27 53 39 46 42 61 57 49 59 54 45 35 45 74 114 134 158 264 498 257 201 180 182 207 212 213 206 119Texas 36 49 66 77 84 108 90 103 102 86 83 69 65 66 64 98 132 170 192 302 468 335 177 173 172 174 191 178 152 111San Diego 6 16 14 34 37 42 31 49 54 56 47 41 46 47 58 70 105 97 115 144 232 157 117 123 130 138 128 167 132 107Philadelphia Metro 14 20 18 27 28 38 35 50 43 35 42 41 63 49 44 78 89 138 135 136 225 128 97 88 99 89 109 131 149 89Colorado 11 35 33 40 53 43 56 59 59 50 47 34 51 47 49 59 81 95 124 159 220 109 88 73 69 79 99 100 105 72SouthWest 17 19 20 18 25 19 29 41 24 30 21 25 34 29 26 37 51 70 85 113 146 88 65 52 56 77 85 96 81 69North Central 21 21 34 52 63 36 47 53 52 38 43 39 40 41 38 71 71 117 109 115 148 121 74 73 70 66 66 86 81 58South Central 8 15 9 11 7 11 11 12 7 8 5 3 7 7 10 15 20 25 27 30 51 31 24 18 29 9 25 30 42 37Upstate NY 4 8 7 13 16 17 10 9 10 12 6 4 9 10 5 8 9 20 31 31 34 29 24 24 28 31 37 34 32 13Sacramento/N.Cal 2 3 6 10 14 11 17 11 11 6 10 9 13 7 9 10 10 7 16 17 35 25 7 11 7 10 9 18 19 8Unknown 0 0 19 2 0 13 0 1 2 2 0 0 1 4 2 3 9 7 17 5 17 15 0 1 3 2 0 0 0 8AK/HI/PR 0 1 1 0 0 1 0 0 0 0 0 3 3 1 2 4 8 6 5 5 14 10 3 6 5 6 14 8 8 2Total 414 734 999 1,334 1,417 1,362 1,379 1,576 1,473 1,490 1,415 1,229 1,351 1,160 1,197 1,839 2,570 3,168 3,661 5,509 7,919 4,518 3,170 2,993 3,150 3,205 3,743 4,027 3,984 2,802
Figure 3.08bVenture Capital Investments in 1980 to 2009
By Region (Number of Deals)

National Venture Capital Association
28 Thomson Reuters
SSttaaggee 11998800 11998811 11998822 11998833 11998844 11998855 11998866 11998877 11998888 11998899 11999900 11999911 11999922 11999933 11999944 11999955 11999966 11999977 11999988 11999999 22000000 22000011 22000022 22000033 22000044 22000055 22000066 22000077 22000088 22000099Startup/Seed 113 226 267 360 387 360 382 386 365 352 259 184 249 284 329 429 504 536 664 808 697 279 179 209 220 249 379 484 494 309Early Stage 149 214 315 415 388 310 325 391 350 328 368 271 282 179 251 508 753 886 1,011 1,719 2,850 1,292 888 812 886 848 972 1,070 1,069 889Expansion 125 243 310 458 512 526 494 589 595 644 586 528 601 505 424 696 1,019 1,412 1,576 2,453 3,697 2,401 1,610 1,374 1,243 1,111 1,376 1,276 1,224 804Later Stage 27 51 107 101 130 166 178 210 163 166 202 246 219 192 193 206 294 334 410 529 675 546 493 598 801 997 1,016 1,197 1,197 800TToottaall 441144 773344 999999 11,,333344 11,,441177 11,,336622 11,,337799 11,,557766 11,,447733 11,,449900 11,,441155 11,,222299 11,,335511 11,,116600 11,,119977 11,,883399 22,,557700 33,,116688 33,,666611 55,,550099 77,,991199 44,,551188 33,,117700 22,,999933 33,,115500 33,,220055 33,,774433 44,,002277 33,,998844 22,,880022
Figure 3.09bVenture Capital Investments
1980 to 2009 By Stage (Number of Deals)
Stage 1980-1Q 1980-2Q 1980-3Q 1980-4Q 1980 Total 1981-1Q 1981-2Q 1981-3Q 1981-4Q 1981 Total 1982-1Q 1982-2Q 1982-3Q 1982-4Q 1982 Total 1983-1Q 1983-2Q 1983-3Q 1983-4Q 1983 Total 1984-1Q 1984-2Q 1984-3Q 1984-4Q 1984 TotalStartup/Seed 46.83 11.95 48.58 45.88 153.24 94.51 45.95 105.18 76.91 322.56 112.84 50.82 71.14 99.01 333.81 109.09 144.16 136.78 153.86 543.89 170.08 186.54 162.27 117.54 636.44Early Stage 30.37 22.89 30.57 39.21 123.05 80.63 60.77 66.89 72.33 280.60 128.81 98.96 49.58 82.21 359.56 211.67 172.73 148.05 170.77 703.22 165.29 161.68 158.40 180.26 665.62Expansion 51.51 31.64 62.73 31.64 177.52 109.18 74.50 81.98 97.41 363.07 144.35 145.83 146.34 164.97 601.49 296.35 282.36 313.60 293.70 1,186.01 301.98 280.15 285.09 273.85 1,141.07Later Stage 4.82 36.03 2.08 26.31 69.23 21.64 20.14 23.68 26.33 91.78 67.47 53.76 37.17 48.88 207.29 60.09 95.41 95.28 93.45 344.23 102.17 77.99 81.64 112.10 373.91Total 133.53 102.50 143.96 143.04 523.03 305.95 201.36 277.72 272.98 1,058.01 453.47 349.36 304.23 395.08 1,502.14 677.20 694.66 693.70 711.78 2,777.35 739.52 706.36 687.40 683.76 2,817.04
1980 1981 1982 19841983
Figure 3.09c-1Quarterly Venture Capital Investments
1980 to 2009 By Stage ($ Millions)
Stage 1985-1Q 1985-2Q 1985-3Q 1985-4Q 1985 Total 1986-1Q 1986-2Q 1986-3Q 1986-4Q 1986 Total 1987-1Q 1987-2Q 1987-3Q 1987-4Q 1987 Total 1988-1Q 1988-2Q 1988-3Q 1988-4Q 1988 Total 1989-1Q 1989-2Q 1989-3Q 1989-4Q 1989 TotalStartup/Seed 147.70 141.02 91.11 129.51 509.35 180.47 268.06 102.60 181.64 732.77 142.93 200.08 144.21 129.36 616.58 154.88 144.27 229.40 112.02 640.58 140.87 166.85 102.77 133.00 543.49Early Stage 91.96 170.50 104.00 140.10 506.55 126.07 124.84 166.18 170.98 588.07 164.28 178.79 181.45 183.93 708.45 142.26 225.14 186.20 163.53 717.13 246.57 110.43 160.14 172.89 690.04Expansion 208.63 313.33 289.15 363.75 1,174.85 265.99 351.09 228.67 268.70 1,114.44 391.30 346.58 363.35 298.38 1,399.60 302.63 471.61 291.03 406.50 1,471.77 383.97 428.16 274.61 435.10 1,521.84Later Stage 133.20 82.27 151.18 74.11 440.75 107.76 79.71 134.50 126.68 448.65 91.85 151.99 104.52 100.93 449.28 110.32 67.85 139.82 58.46 376.45 87.79 92.50 78.68 139.71 398.67Total 581.48 707.12 635.44 707.47 2,631.50 680.29 823.70 631.95 747.99 2,883.93 790.36 877.44 793.52 712.59 3,173.91 710.09 908.88 846.45 740.52 3,205.93 859.20 797.94 616.20 880.69 3,154.03
1988 19891985 1986 1987
Figure 3.09c-2Quarterly Venture Capital Investments
1980 to 2009 By Stage ($ Millions)
Stage 1980 1981 1982 1983 1984 1985 1986 1987 1988 1989 1990 1991 1992 1993 1994 1995 1996 1997 1998 1999 2000 2001 2002 2003 2004 2005 2006 2007 2008 2009Startup/Seed 153.2 322.6 333.8 543.9 636.4 509.3 732.8 616.6 640.6 543.5 384.7 223.0 534.4 599.2 727.3 1,193.4 1,237.2 1,295.9 1,651.4 3,498.7 3,006.3 721.6 320.7 336.1 456.6 908.4 1,229.0 1,425.2 1,625.2 1,596.3Early Stage 123.0 280.6 359.6 703.2 665.6 506.6 588.1 708.4 717.1 690.0 667.6 521.2 548.3 601.3 812.9 1,670.3 2,530.8 3,362.3 5,276.2 11,074.5 23,975.9 8,191.2 3,764.7 3,523.6 3,864.5 3,932.2 4,251.7 5,740.0 5,326.6 4,671.8Expansion 177.5 363.1 601.5 1,186.0 1,141.1 1,174.9 1,114.4 1,399.6 1,471.8 1,521.8 1,174.6 994.2 1,713.7 1,761.0 1,431.5 3,436.3 5,246.3 7,264.3 9,840.4 28,611.0 57,455.5 21,837.1 11,904.0 9,592.6 9,145.8 8,557.1 11,270.1 11,270.4 10,370.2 5,510.5Later Stage 69.2 91.8 207.3 344.2 373.9 440.7 448.6 449.3 376.4 398.7 339.2 324.5 555.4 511.9 892.8 1,070.1 1,591.4 2,211.0 2,991.8 8,358.5 16,086.8 7,781.0 5,109.6 5,684.1 8,480.0 9,543.3 9,587.8 12,043.0 10,624.8 5,912.1Total 523.0 1,058.0 1,502.1 2,777.3 2,817.0 2,631.5 2,883.9 3,173.9 3,205.9 3,154.0 2,566.1 2,062.9 3,351.9 3,473.5 3,864.5 7,370.1 10,605.7 14,133.4 19,759.7 51,542.8 100,524.6 38,531.0 21,099.0 19,136.5 21,947.0 22,941.0 26,338.5 30,478.6 27,946.8 17,690.7
Figure 3.09Venture Capital Investments
1980 to 2009 By Stage ($ Millions)

2010 NVCA Yearbook
Thomson Reuters 29
Stage 1990-1Q 1990-2Q 1990-3Q 1990-4Q 1990 Total 1991-1Q 1991-2Q 1991-3Q 1991-4Q 1991 Total 1992-1Q 1992-2Q 1992-3Q 1992-4Q 1992 Total 1993-1Q 1993-2Q 1993-3Q 1993-4Q 1993 Total 1994-1Q 1994-2Q 1994-3Q 1994-4Q 1994 TotalStartup/Seed 80.02 117.89 103.73 83.03 384.67 44.83 79.48 46.02 52.71 223.05 62.92 208.27 62.38 200.83 534.40 144.76 128.55 164.26 161.65 599.22 183.79 204.42 148.26 190.79 727.27Early Stage 141.48 192.82 127.87 205.44 667.61 131.39 128.52 135.41 125.85 521.17 120.14 186.31 75.17 166.74 548.35 172.22 138.63 137.18 153.24 601.27 165.19 172.81 160.16 314.70 812.86Expansion 339.28 299.65 197.67 338.02 1,174.62 209.63 230.61 249.07 304.86 994.17 461.96 483.84 322.84 445.09 1,713.72 339.66 401.65 433.98 585.73 1,761.02 304.23 348.09 323.34 455.87 1,431.53Later Stage 81.02 92.00 79.82 86.37 339.20 81.46 96.17 54.72 92.15 324.50 193.39 88.97 96.22 176.85 555.43 176.11 93.37 92.86 149.60 511.95 158.32 169.50 225.74 339.25 892.81Total 641.79 702.36 509.08 712.86 2,566.10 467.32 534.78 485.22 575.57 2,062.89 838.40 967.38 556.61 989.50 3,351.89 832.75 762.20 828.28 1,050.23 3,473.46 811.53 894.82 857.51 1,300.61 3,864.46
1990 1991 1992 1993 1994
Figure 3.09c-3Quarterly Venture Capital Investments
1980 to 2009 By Stage ($ Millions)
Stage 1995-1Q 1995-2Q 1995-3Q 1995-4Q 1995 Total 1996-1Q 1996-2Q 1996-3Q 1996-4Q 1996 Total 1997-1Q 1997-2Q 1997-3Q 1997-4Q 1997 Total 1998-1Q 1998-2Q 1998-3Q 1998-4Q 1998 Total 1999-1Q 1999-2Q 1999-3Q 1999-4Q 1999 TotalStartup/Seed 265.30 397.96 215.33 314.82 1,193.40 306.96 420.39 203.18 306.71 1,237.23 378.40 303.85 313.42 300.22 1,295.88 361.39 391.47 436.17 462.35 1,651.38 504.93 795.77 936.44 1,261.61 3,498.75Early Stage 409.72 383.08 349.27 528.19 1,670.26 551.63 677.53 592.98 708.61 2,530.75 749.73 818.73 761.55 1,032.24 3,362.25 1,066.89 1,175.61 1,134.15 1,899.52 5,276.18 1,147.61 2,117.21 2,559.41 5,250.27 11,074.50Expansion 620.70 1,385.13 754.19 676.25 3,436.26 1,075.75 1,483.47 1,179.17 1,507.93 5,246.31 1,286.23 1,906.09 1,902.86 2,169.14 7,264.31 1,673.50 3,012.80 2,646.43 2,507.67 9,840.41 3,010.77 5,059.80 7,535.01 13,005.45 28,611.03Later Stage 307.02 251.92 255.99 255.21 1,070.13 277.95 427.72 390.21 495.57 1,591.45 472.96 482.71 585.49 669.82 2,210.98 744.70 679.90 704.99 862.17 2,991.76 1,364.35 2,336.89 1,862.99 2,794.28 8,358.52Total 1,602.73 2,418.09 1,574.77 1,774.46 7,370.05 2,212.28 3,009.11 2,365.54 3,018.82 10,605.75 2,887.31 3,511.39 3,563.32 4,171.40 14,133.42 3,846.49 5,259.77 4,921.75 5,731.72 19,759.73 6,027.66 10,309.67 12,893.85 22,311.61 51,542.79
1998 19991995 1996 1997
Figure 3.09c-4Quarterly Venture Capital Investments
1980 to 2009 By Stage ($ Millions)
Stage 2000-1Q 2000-2Q 2000-3Q 2000-4Q 2000 Total 2001-1Q 2001-2Q 2001-3Q 2001-4Q 2001 Total 2002-1Q 2002-2Q 2002-3Q 2002-4Q 2002 Total 2003-1Q 2003-2Q 2003-3Q 2003-4Q 2003 Total 2004-1Q 2004-2Q 2004-3Q 2004-4Q 2004 TotalStartup/Seed 775.26 916.95 847.86 466.23 3,006.29 248.02 233.27 113.69 126.63 721.62 67.96 91.20 80.54 80.96 320.66 70.23 91.46 90.87 83.56 336.12 91.06 119.78 110.30 135.46 456.60Early Stage 6,849.13 6,577.19 5,578.12 4,971.51 23,975.95 3,362.43 1,943.27 1,614.35 1,271.13 8,191.18 1,107.14 1,091.10 797.83 768.67 3,764.74 692.03 1,001.31 788.88 1,041.42 3,523.63 882.76 959.35 973.91 1,048.50 3,864.53Expansion 15,743.08 15,302.64 14,810.01 11,599.75 57,455.49 6,447.49 6,296.01 4,425.10 4,668.54 21,837.13 3,677.57 3,606.10 2,372.84 2,247.51 11,904.02 2,351.58 2,374.34 2,277.56 2,589.15 9,592.64 2,087.10 2,778.26 2,011.46 2,269.02 9,145.84Later Stage 3,978.58 4,025.77 4,133.86 3,948.63 16,086.84 2,218.44 2,235.90 1,721.69 1,605.00 7,781.03 1,692.31 1,078.01 1,104.99 1,234.30 5,109.61 1,017.73 1,307.13 1,583.80 1,775.48 5,684.14 2,164.40 2,233.59 1,715.73 2,366.27 8,479.99Total 27,346.05 26,822.55 25,369.84 20,986.12 100,524.56 12,276.37 10,708.45 7,874.84 7,671.30 38,530.97 6,544.97 5,866.41 4,356.20 4,331.44 21,099.02 4,131.57 4,774.25 4,741.10 5,489.61 19,136.53 5,225.32 6,090.98 4,811.40 5,819.25 21,946.96
20042000 2001 2002 2003
Figure 3.09c-5Quarterly Venture Capital Investments
1980 to 2009 By Stage ($ Millions)
Stage 2005-1Q 2005-2Q 2005-3Q 2005-4Q 2005 Total 2006-1Q 2006-2Q 2006-3Q 2006-4Q 2006 Total 2007-1Q 2007-2Q 2007-3Q 2007-4Q 2007 Total 2008-1Q 2008-2Q 2008-3Q 2008-4Q 2008 Total 2009-1Q 2009-2Q 2009-3Q 2009-4Q 2009 TotalStartup/Seed 116.09 491.50 151.89 148.94 908.41 231.37 371.53 333.51 292.57 1,228.98 250.62 347.54 349.32 477.73 1,425.21 420.91 463.22 434.46 306.64 1,625.23 202.15 516.59 475.24 402.30 1,596.29Early Stage 835.00 930.33 1,185.57 981.32 3,932.20 874.49 913.22 1,033.56 1,430.41 4,251.68 1,219.85 1,577.59 1,255.41 1,687.18 5,740.03 1,285.84 1,406.14 1,299.21 1,335.39 5,326.58 778.26 1,095.22 1,185.40 1,612.89 4,671.78Expansion 2,134.70 2,465.77 1,647.30 2,309.33 8,557.10 2,528.77 3,328.13 2,924.43 2,488.75 11,270.09 3,020.52 2,314.27 2,963.13 2,972.45 11,270.37 3,353.07 2,506.80 2,491.04 2,019.30 10,370.22 937.24 1,282.70 1,680.74 1,609.87 5,510.54Later Stage 1,960.59 2,376.21 2,874.68 2,331.79 9,543.28 2,678.19 2,487.70 2,358.68 2,063.22 9,587.79 2,896.09 3,083.10 3,175.71 2,888.10 12,043.00 2,631.56 2,987.81 2,812.08 2,193.38 10,624.83 1,472.88 1,208.40 1,760.10 1,470.68 5,912.06Total 5,046.38 6,263.81 5,859.43 5,771.37 22,941.00 6,312.82 7,100.58 6,650.18 6,274.95 26,338.54 7,387.08 7,322.50 7,743.58 8,025.46 30,478.62 7,691.38 7,363.96 7,036.80 5,854.70 27,946.85 3,390.52 4,102.91 5,101.49 5,095.74 17,690.67
2005 2006 20092007 2008
Figure 3.09c-6Quarterly Venture Capital Investments
1980 to 2009 By Stage ($ Millions)

National Venture Capital Association
30 Thomson Reuters
Stage 1985-1Q 1985-2Q 1985-3Q 1985-4Q 1985 Total 1986-1Q 1986-2Q 1986-3Q 1986-4Q 1986 Total 1987-1Q 1987-2Q 1987-3Q 1987-4Q 1987 Total 1988-1Q 1988-2Q 1988-3Q 1988-4Q 1988 Total 1989-1Q 1989-2Q 1989-3Q 1989-4Q 1989 TotalStartup/Seed 111 89 61 99 360 133 107 62 80 382 115 102 86 83 386 118 78 88 81 365 106 97 77 72 352Early Stage 88 82 61 79 310 109 69 70 77 325 124 83 97 87 391 96 91 87 76 350 99 63 82 84 328Expansion 142 120 114 150 526 168 133 93 100 494 173 131 152 133 589 152 177 127 139 595 213 156 118 157 644Later Stage 60 40 36 30 166 56 49 29 44 178 61 58 45 46 210 48 40 40 35 163 44 29 38 55 166Total 401 331 272 358 1362 466 358 254 301 1379 473 374 380 349 1576 414 386 342 331 1473 462 345 315 368 1490
19891985 1986 1987 1988
Figure 3.09d-2Quarterly Venture Capital Investments
1980 to 2009 By Stage (Number of Deals)
Stage 1990-1Q 1990-2Q 1990-3Q 1990-4Q 1990 Total 1991-1Q 1991-2Q 1991-3Q 1991-4Q 1991 Total 1992-1Q 1992-2Q 1992-3Q 1992-4Q 1992 Total 1993-1Q 1993-2Q 1993-3Q 1993-4Q 1993 Total 1994-1Q 1994-2Q 1994-3Q 1994-4Q 1994 TotalStartup/Seed 60 70 58 71 259 51 48 42 43 184 49 68 48 84 249 69 68 66 81 284 89 68 81 91 329Early Stage 87 95 74 112 368 79 70 58 64 271 74 87 51 70 282 41 48 39 51 179 64 61 49 77 251Expansion 148 146 140 152 586 129 128 123 148 528 154 160 101 186 601 144 119 117 125 505 104 108 98 114 424Later Stage 47 51 40 64 202 48 65 53 80 246 68 40 41 70 219 64 46 41 41 192 46 63 37 47 193Total 342 362 312 399 1415 307 311 276 335 1229 345 355 241 410 1351 318 281 263 298 1160 303 300 265 329 1197
1990 1991 1992 1993 1994
Figure 3.09d-3Quarterly Venture Capital Investments
1980 to 2009 By Stage (Number of Deals)
Stage 1995-1Q 1995-2Q 1995-3Q 1995-4Q1995 Total 1996-1Q 1996-2Q 1996-3Q 1996-4Q1996 Total 1997-1Q 1997-2Q 1997-3Q 1997-4Q1997 Total 1998-1Q 1998-2Q 1998-3Q 1998-4Q1998 Total 1999-1Q 1999-2Q 1999-3Q 1999-4Q1999 TotalStartup/Seed 124 95 95 115 429 132 139 98 135 504 161 117 119 139 536 148 160 162 194 664 165 212 245 186 808Early Stage 129 135 112 132 508 149 205 178 221 753 204 209 219 254 886 236 220 248 307 1,011 242 379 446 652 1,719Expansion 189 178 162 167 696 229 241 233 316 1,019 308 366 326 412 1,412 368 412 406 390 1,576 380 564 602 907 2,453Later Stage 55 46 53 52 206 65 70 75 84 294 88 74 80 92 334 97 109 96 108 410 124 155 128 122 529Total 497 454 422 466 1,839 575 655 584 756 2,570 761 766 744 897 3,168 849 901 912 999 3,661 911 1,310 1,421 1,867 5,509
1995 1996 1998 19991997
Figure 3.09d-4Quarterly Venture Capital Investments
1980 to 2009 By Stage (Number of Deals)
Stage 1980-1Q 1980-2Q 1980-3Q 1980-4Q 1980 Total 1981-1Q 1981-2Q 1981-3Q 1981-4Q 1981 Total 1982-1Q 1982-2Q 1982-3Q 1982-4Q 1982 Total 1983-1Q 1983-2Q 1983-3Q 1983-4Q 1983 Total 1984-1Q 1984-2Q 1984-3Q 1984-4Q 1984 TotalStartup/Seed 42 12 27 32 113 62 48 58 58 226 93 48 57 69 267 88 95 98 79 360 122 84 92 89 387Early Stage 57 21 28 43 149 98 45 34 37 214 154 55 43 63 315 156 78 93 88 415 139 94 72 83 388Expansion 49 25 26 25 125 94 49 55 45 243 126 57 58 69 310 157 92 107 102 458 173 115 115 109 512Later Stage 7 7 6 7 27 15 11 10 15 51 36 21 24 26 107 25 27 25 24 101 44 26 24 36 130Total 155 65 87 107 414 269 153 157 155 734 409 181 182 227 999 426 292 323 293 1334 478 319 303 317 1417
19841980 1981 1982 1983
Figure 3.09d-1Quarterly Venture Capital Investments
1980 to 2009 By Stage (Number of Deals)
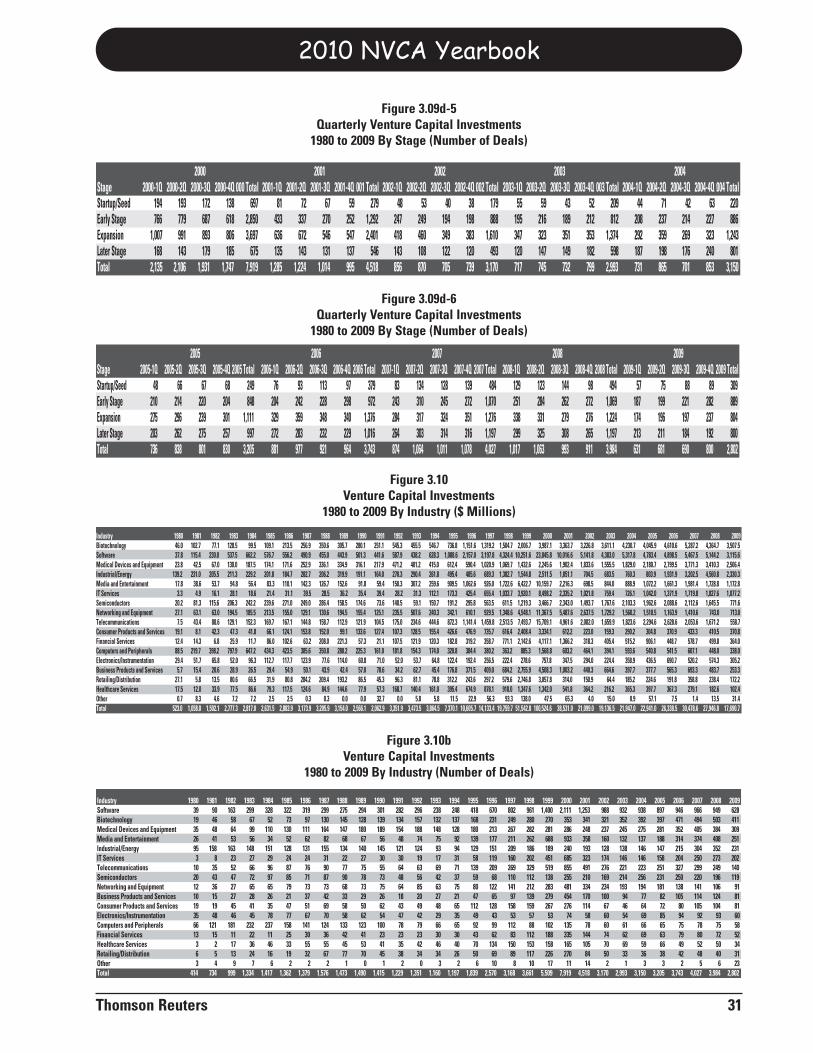
2010 NVCA Yearbook
Thomson Reuters 31
Industry 1980 1981 1982 1983 1984 1985 1986 1987 1988 1989 1990 1991 1992 1993 1994 1995 1996 1997 1998 1999 2000 2001 2002 2003 2004 2005 2006 2007 2008 2009Biotechnology 46.0 102.7 77.1 128.5 99.5 109.1 213.5 256.9 350.6 305.7 280.1 251.1 545.3 455.5 546.7 736.8 1,151.6 1,319.2 1,504.7 2,006.7 3,987.1 3,363.7 3,226.8 3,611.1 4,230.7 4,045.9 4,610.6 5,287.2 4,364.7 3,507.5Software 37.8 115.4 230.0 537.5 662.2 576.7 556.2 490.9 455.0 443.9 501.3 441.6 587.9 438.2 628.3 1,088.6 2,157.0 3,197.8 4,324.4 10,251.6 23,845.8 10,016.6 5,141.8 4,383.0 5,317.8 4,783.4 4,898.5 5,467.5 5,144.2 3,115.6Medical Devices and Equipment 23.8 42.5 67.0 130.0 187.5 174.1 171.6 252.9 336.1 334.9 316.1 217.9 471.2 401.2 415.0 612.4 590.4 1,020.9 1,069.7 1,432.6 2,245.6 1,902.4 1,833.6 1,555.5 1,829.0 2,180.7 2,799.5 3,771.3 3,410.3 2,506.4Industrial/Energy 139.2 231.0 205.5 211.3 229.2 201.8 184.7 282.7 206.2 319.9 191.1 164.0 270.3 290.4 261.8 495.4 485.6 689.3 1,382.7 1,544.8 2,511.5 1,051.1 704.5 683.5 760.3 803.9 1,931.9 3,202.5 4,560.8 2,330.3Media and Entertainment 17.8 38.6 53.7 94.8 56.4 83.3 110.1 142.3 126.7 152.6 91.8 59.4 150.3 307.2 259.6 909.5 1,062.6 926.0 1,722.6 6,422.7 10,159.7 2,216.3 698.5 844.0 888.9 1,072.2 1,661.3 1,981.4 1,728.8 1,172.8IT Services 3.3 4.9 16.1 28.1 18.6 21.4 31.1 39.5 28.5 36.2 35.4 39.4 28.2 31.3 112.1 173.3 425.4 655.4 1,033.7 3,920.1 8,498.2 2,335.2 1,021.8 759.4 726.1 1,042.0 1,371.9 1,719.8 1,827.6 1,077.2Semiconductors 20.2 81.3 115.6 206.3 242.2 239.6 271.0 249.0 286.4 158.5 174.6 73.6 140.5 59.1 150.7 191.2 295.8 563.5 611.5 1,219.3 3,466.7 2,343.0 1,493.7 1,767.6 2,103.3 1,962.6 2,088.6 2,112.6 1,645.5 771.6Networking and Equipment 27.1 63.1 63.0 194.5 185.5 213.5 155.0 129.1 130.6 194.5 155.4 125.1 235.5 507.6 240.3 342.1 610.1 929.5 1,348.6 4,548.1 11,367.5 5,487.6 2,637.5 1,729.2 1,560.2 1,510.5 1,163.9 1,410.6 743.0 713.0Telecommunications 7.5 43.4 88.6 129.1 152.3 169.7 167.1 144.8 158.7 112.9 121.9 104.5 175.0 234.6 444.6 872.3 1,141.4 1,459.8 2,513.5 7,493.7 15,709.1 4,961.6 2,082.0 1,659.9 1,823.6 2,294.6 2,628.6 2,053.6 1,671.2 558.7Consumer Products and Services 19.1 8.1 42.3 47.3 41.8 66.1 124.1 153.8 152.0 99.1 133.6 127.4 107.3 128.5 155.4 426.6 476.9 735.7 616.4 2,408.4 3,334.1 612.2 223.0 159.3 290.2 304.8 370.9 433.3 410.5 370.8Financial Services 12.4 14.3 6.8 25.9 11.7 86.0 102.6 63.2 208.0 221.3 57.3 21.1 107.5 121.9 120.3 182.8 319.2 358.7 771.1 2,142.6 4,117.1 1,366.2 318.3 405.4 515.2 906.1 448.7 578.7 499.8 364.0Computers and Peripherals 88.5 219.7 398.2 797.9 647.2 434.3 423.5 385.6 350.8 280.2 225.3 161.0 181.8 154.3 174.0 320.8 384.4 380.2 363.2 885.3 1,568.8 603.2 464.1 394.1 593.6 540.8 541.5 607.1 448.0 338.0Electronics/Instrumentation 29.4 51.7 65.8 52.0 96.3 112.7 117.7 123.9 77.6 114.0 60.8 71.0 52.0 53.7 64.8 122.4 192.4 256.5 222.4 278.6 757.8 347.5 294.0 224.4 358.9 436.5 690.7 520.2 574.3 305.2Business Products and Services 5.7 15.4 20.6 28.9 26.5 29.4 54.9 50.1 43.9 42.4 57.0 70.6 34.2 62.7 45.4 176.8 371.5 409.0 684.2 2,755.9 4,508.3 1,003.2 440.3 664.6 397.7 377.7 565.3 693.3 483.7 253.3Retailing/Distribution 27.1 5.8 13.5 80.6 66.5 31.9 80.8 284.2 209.4 193.2 86.5 45.3 96.3 81.1 78.8 312.2 243.6 297.2 579.6 2,746.8 3,057.8 314.0 150.9 64.4 185.2 224.6 191.8 358.8 238.4 172.2Healthcare Services 17.5 12.0 33.9 77.5 86.6 79.3 117.5 124.6 84.9 144.6 77.9 57.3 168.7 140.4 161.0 395.4 674.9 878.1 918.0 1,347.6 1,342.0 541.8 364.2 216.2 365.3 397.7 367.3 279.1 182.6 102.4Other 0.7 8.3 4.6 7.2 7.2 2.5 2.5 0.3 0.3 0.0 0.0 32.7 0.0 5.8 5.8 11.5 22.9 56.3 93.3 138.0 47.5 65.3 4.0 15.0 0.9 57.1 7.5 1.4 13.5 31.4Total 523.0 1,058.0 1,502.1 2,777.3 2,817.0 2,631.5 2,883.9 3,173.9 3,205.9 3,154.0 2,566.1 2,062.9 3,351.9 3,473.5 3,864.5 7,370.1 10,605.7 14,133.4 19,759.7 51,542.8 100,524.6 38,531.0 21,099.0 19,136.5 21,947.0 22,941.0 26,338.5 30,478.6 27,946.8 17,690.7
Figure 3.10Venture Capital Investments
1980 to 2009 By Industry ($ Millions)
Industry 1980 1981 1982 1983 1984 1985 1986 1987 1988 1989 1990 1991 1992 1993 1994 1995 1996 1997 1998 1999 2000 2001 2002 2003 2004 2005 2006 2007 2008 2009Software 39 90 163 299 328 322 319 299 275 294 301 282 296 238 248 418 670 802 961 1,400 2,111 1,253 988 932 938 897 946 966 949 628Biotechnology 19 46 58 67 52 73 97 130 145 128 139 134 157 132 137 168 231 249 280 270 353 341 321 352 392 397 471 494 503 411Medical Devices and Equipment 35 48 64 99 110 130 111 164 147 180 189 154 188 148 128 180 213 267 282 281 286 248 237 245 275 281 352 405 384 309Media and Entertainment 26 41 53 56 34 52 62 82 68 67 56 48 74 75 92 139 177 211 262 688 933 358 160 132 137 188 314 374 408 251Industrial/Energy 95 158 163 148 151 128 131 155 134 140 145 121 124 93 94 129 151 209 186 189 240 193 128 138 146 147 215 304 352 231IT Services 3 8 23 27 29 24 24 31 22 27 30 30 19 17 31 58 119 160 202 451 685 323 174 146 146 158 204 250 273 202Telecommunications 10 35 52 66 96 87 76 90 77 75 55 64 63 69 71 139 209 269 329 519 855 491 276 221 223 251 327 299 249 140Semiconductors 20 43 47 72 97 85 71 87 90 78 73 48 56 42 37 59 68 110 112 138 255 210 169 214 256 231 250 220 196 119Networking and Equipment 12 36 27 65 65 79 73 73 68 73 75 64 85 63 75 80 122 141 212 283 481 334 234 193 194 181 138 141 106 91Business Products and Services 10 15 27 28 26 21 37 42 33 29 26 18 20 27 21 47 65 97 139 279 454 170 100 94 77 82 105 114 124 81Consumer Products and Services 19 19 45 41 35 47 51 69 58 50 62 43 49 48 65 112 128 158 159 267 276 114 67 46 64 72 80 105 104 81Electronics/Instrumentation 35 48 46 45 78 77 67 70 58 62 54 47 42 29 35 49 43 53 57 53 74 58 60 54 69 85 94 92 93 60Computers and Peripherals 66 121 181 232 237 158 141 124 133 123 100 78 79 66 65 92 99 112 88 102 135 78 60 61 66 65 75 78 75 58Financial Services 13 15 11 22 11 25 30 36 42 41 23 23 23 30 30 43 62 83 112 188 335 144 74 62 69 63 79 80 72 52Healthcare Services 3 2 17 36 46 33 55 55 45 53 41 35 42 46 40 70 134 150 153 158 165 105 70 69 59 66 49 52 50 34Retailing/Distribution 6 5 13 24 16 19 32 67 77 70 45 38 34 34 26 50 69 89 117 226 270 84 50 33 36 38 42 48 40 31Other 3 4 9 7 6 2 2 2 1 0 1 2 0 3 2 6 10 8 10 17 11 14 2 1 3 3 2 5 6 23Total 414 734 999 1,334 1,417 1,362 1,379 1,576 1,473 1,490 1,415 1,229 1,351 1,160 1,197 1,839 2,570 3,168 3,661 5,509 7,919 4,518 3,170 2,993 3,150 3,205 3,743 4,027 3,984 2,802
Figure 3.10bVenture Capital Investments
1980 to 2009 By Industry (Number of Deals)
Stage 2000-1Q 2000-2Q 2000-3Q 2000-4Q2000 Total 2001-1Q 2001-2Q 2001-3Q 2001-4Q2001 Total 2002-1Q 2002-2Q 2002-3Q 2002-4Q2002 Total 2003-1Q 2003-2Q 2003-3Q 2003-4Q2003 Total 2004-1Q 2004-2Q 2004-3Q 2004-4Q2004 TotalStartup/Seed 194 193 172 138 697 81 72 67 59 279 48 53 40 38 179 55 59 43 52 209 44 71 42 63 220Early Stage 766 779 687 618 2,850 433 337 270 252 1,292 247 249 194 198 888 195 216 189 212 812 208 237 214 227 886Expansion 1,007 991 893 806 3,697 636 672 546 547 2,401 418 460 349 383 1,610 347 323 351 353 1,374 292 359 269 323 1,243Later Stage 168 143 179 185 675 135 143 131 137 546 143 108 122 120 493 120 147 149 182 598 187 198 176 240 801Total 2,135 2,106 1,931 1,747 7,919 1,285 1,224 1,014 995 4,518 856 870 705 739 3,170 717 745 732 799 2,993 731 865 701 853 3,150
2000 2001 2002 2003 2004
Figure 3.09d-5Quarterly Venture Capital Investments
1980 to 2009 By Stage (Number of Deals)
Stage 2005-1Q 2005-2Q 2005-3Q 2005-4Q 2005 Total 2006-1Q 2006-2Q 2006-3Q 2006-4Q 2006 Total 2007-1Q 2007-2Q 2007-3Q 2007-4Q 2007 Total 2008-1Q 2008-2Q 2008-3Q 2008-4Q 2008 Total 2009-1Q 2009-2Q 2009-3Q 2009-4Q 2009 TotalStartup/Seed 48 66 67 68 249 76 93 113 97 379 83 134 128 139 484 129 123 144 98 494 57 75 88 89 309Early Stage 210 214 220 204 848 204 242 228 298 972 243 310 245 272 1,070 251 284 262 272 1,069 187 199 221 282 889Expansion 275 296 239 301 1,111 329 359 348 340 1,376 284 317 324 351 1,276 338 331 279 276 1,224 174 196 197 237 804Later Stage 203 262 275 257 997 272 283 232 229 1,016 264 303 314 316 1,197 299 325 308 265 1,197 213 211 184 192 800Total 736 838 801 830 3,205 881 977 921 964 3,743 874 1,064 1,011 1,078 4,027 1,017 1,063 993 911 3,984 631 681 690 800 2,802
2005 2006 2007 2008 2009
Figure 3.09d-6Quarterly Venture Capital Investments
1980 to 2009 By Stage (Number of Deals)
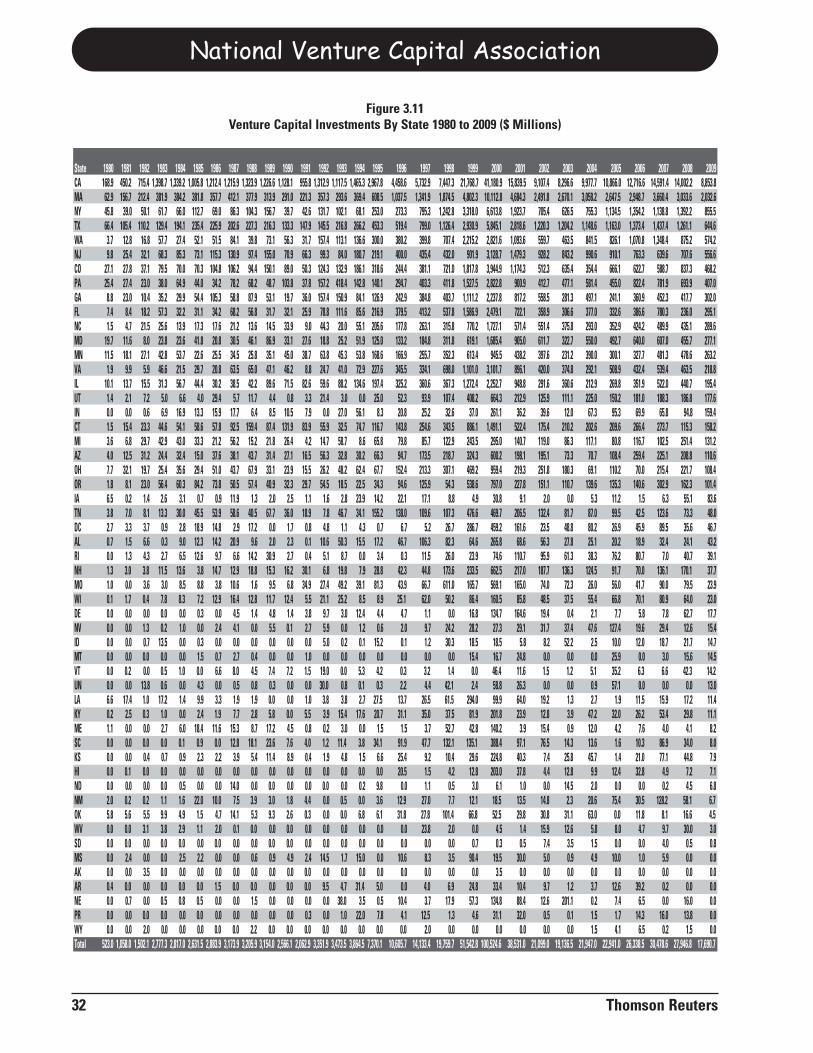
National Venture Capital Association
32 Thomson Reuters
Figure 3.11Venture Capital Investments By State 1980 to 2009 ($ Millions)
State 1980 1981 1982 1983 1984 1985 1986 1987 1988 1989 1990 1991 1992 1993 1994 1995 1996 1997 1998 1999 2000 2001 2002 2003 2004 2005 2006 2007 2008 2009CA 168.9 450.2 715.4 1,398.7 1,339.2 1,005.8 1,212.4 1,215.9 1,323.9 1,226.6 1,128.1 955.8 1,312.9 1,117.5 1,465.3 2,967.8 4,458.6 5,732.9 7,447.3 21,768.7 41,180.9 15,839.5 9,107.4 8,296.6 9,977.7 10,866.0 12,716.6 14,591.4 14,002.2 8,853.8MA 62.9 156.7 212.4 381.9 384.2 381.8 357.7 412.1 377.9 313.9 291.0 221.3 357.3 293.6 369.4 608.5 1,037.5 1,341.9 1,874.5 4,802.3 10,112.8 4,684.3 2,491.8 2,670.1 3,058.2 2,647.5 2,948.7 3,660.4 3,033.6 2,032.6NY 45.8 39.0 50.1 61.7 66.0 112.7 69.0 86.3 104.3 156.7 39.7 42.6 131.7 102.1 68.1 253.0 273.3 795.3 1,242.8 3,318.0 6,613.8 1,923.7 705.4 626.5 755.3 1,134.5 1,354.2 1,138.8 1,392.2 855.5TX 66.4 105.4 110.2 129.4 194.1 235.4 225.9 202.6 227.3 216.3 133.3 147.9 145.5 216.8 266.2 453.3 519.4 799.0 1,126.4 2,930.9 5,845.1 2,818.6 1,220.3 1,204.2 1,148.6 1,163.0 1,373.4 1,437.4 1,261.1 644.6WA 3.7 12.8 16.8 57.7 27.4 52.1 51.5 84.1 39.8 73.1 56.3 31.7 157.4 113.1 136.6 300.0 380.2 399.8 707.4 2,215.2 2,821.6 1,093.6 559.7 463.5 841.5 826.1 1,070.8 1,348.4 875.2 574.2NJ 9.8 25.4 32.1 68.3 85.3 73.1 115.3 130.9 97.4 155.0 70.9 66.3 99.3 84.0 180.7 219.1 400.0 435.4 432.0 901.9 3,128.7 1,479.3 928.2 843.2 990.6 910.1 763.3 639.6 707.6 556.6CO 27.1 27.8 37.1 79.5 70.0 70.3 104.8 106.2 94.4 150.1 89.0 50.3 124.3 132.9 186.1 318.6 244.4 381.1 721.0 1,817.8 3,944.9 1,174.3 512.3 635.4 354.4 666.1 622.7 588.7 837.3 468.2PA 25.4 27.4 23.0 38.0 64.9 44.0 34.2 78.2 68.2 48.7 103.8 37.8 157.2 418.4 142.8 140.1 294.7 403.3 411.8 1,527.5 2,822.8 900.9 412.7 477.1 581.4 455.0 822.4 781.9 693.9 407.0GA 8.8 23.0 10.4 35.2 29.9 54.4 105.3 58.8 87.9 53.1 19.7 36.0 157.4 150.9 84.1 126.9 242.9 384.8 403.7 1,111.2 2,237.8 817.2 558.5 281.3 497.1 241.1 360.9 452.3 417.7 302.0FL 7.4 8.4 18.2 57.3 32.2 31.1 34.2 68.2 56.8 31.7 32.1 25.9 78.8 111.6 85.6 216.9 379.5 413.2 537.8 1,586.9 2,479.1 722.1 358.9 306.6 377.0 332.6 386.6 780.3 236.0 295.1NC 1.5 4.7 21.5 25.6 13.9 17.3 17.6 21.2 13.6 14.5 33.9 9.0 44.3 20.0 55.1 205.6 177.8 263.1 315.8 770.2 1,727.1 571.4 551.4 375.8 293.0 352.9 424.2 489.9 435.1 289.6MD 19.7 11.6 8.0 23.8 23.6 41.8 20.8 30.5 46.1 86.9 33.1 27.6 18.8 25.2 51.9 125.0 133.2 184.8 311.8 619.1 1,685.4 905.0 611.7 322.7 550.0 492.7 640.0 607.0 455.7 277.1MN 11.5 18.1 27.1 42.8 53.7 22.6 25.5 34.5 25.8 35.1 45.0 38.7 63.8 45.3 53.8 168.6 166.9 255.7 352.3 613.4 945.5 438.2 397.6 231.2 390.0 300.1 327.7 481.3 478.6 263.2VA 1.9 9.9 5.9 46.6 21.5 29.7 20.8 63.5 65.0 47.1 46.2 8.8 24.7 41.0 72.9 227.6 345.5 334.1 698.0 1,101.0 3,101.7 896.1 420.0 374.8 292.1 508.9 432.4 539.4 463.5 218.8IL 10.1 13.7 15.5 31.3 56.7 44.4 30.2 38.5 42.2 89.6 71.5 82.6 59.6 88.2 134.6 197.4 325.2 360.6 367.3 1,272.4 2,252.7 948.8 291.6 360.6 212.9 269.8 351.9 522.0 440.7 195.4UT 1.4 2.1 7.2 5.0 6.6 4.0 29.4 5.7 11.7 4.4 0.8 3.3 21.4 3.0 0.0 25.0 52.3 93.9 107.4 408.2 664.3 212.9 125.9 111.1 225.0 150.2 181.0 188.3 186.8 177.6IN 0.0 0.0 0.6 6.9 16.9 13.3 15.9 17.7 6.4 8.5 10.5 7.9 0.0 27.0 56.1 8.3 20.8 25.2 32.6 37.0 261.1 36.2 39.6 12.0 67.3 95.3 69.9 65.8 94.8 159.4CT 1.5 15.4 23.3 44.6 54.1 58.6 57.8 92.5 159.4 87.4 131.9 83.9 55.9 32.5 74.7 116.7 143.8 254.6 343.5 886.1 1,491.1 522.4 175.4 210.2 202.6 209.6 266.4 273.7 115.3 158.2MI 3.6 6.8 29.7 42.9 43.0 33.3 21.2 56.2 15.2 21.8 26.4 4.2 14.7 58.7 8.6 65.8 79.8 85.7 122.9 243.5 295.0 140.7 119.0 86.3 117.1 80.8 116.7 102.5 251.4 131.2AZ 4.0 12.5 31.2 24.4 32.4 15.0 37.6 38.1 43.7 31.4 27.1 16.5 56.3 32.8 30.2 66.3 94.7 173.5 218.7 324.3 600.2 198.1 195.1 73.3 70.7 108.4 259.4 225.1 208.8 110.6OH 7.7 32.1 19.7 25.4 35.6 29.4 51.0 43.7 67.9 33.1 23.9 15.5 26.2 48.2 62.4 67.7 152.4 213.3 307.1 469.2 959.4 219.3 251.8 180.3 69.1 110.2 70.0 215.4 221.7 108.4OR 1.8 8.1 23.0 56.4 60.3 84.2 73.8 50.5 57.4 40.9 32.3 29.7 54.5 18.5 22.5 34.3 94.6 125.9 54.3 538.6 797.0 227.8 151.1 110.7 139.6 135.3 140.6 302.9 162.3 101.4IA 6.5 0.2 1.4 2.6 3.1 0.7 0.9 11.9 1.3 2.0 2.5 1.1 1.6 2.8 23.9 14.2 22.1 17.1 8.8 4.9 30.8 9.1 2.0 0.0 5.3 11.2 1.5 6.3 55.1 83.6TN 3.8 7.0 8.1 13.3 30.0 45.5 53.9 58.6 40.5 67.7 36.0 18.9 7.8 46.7 34.1 155.2 138.0 109.6 107.3 476.6 469.7 206.5 132.4 81.7 87.0 99.5 42.5 123.6 73.3 48.0DC 2.7 3.3 3.7 0.9 2.8 18.9 14.8 2.9 17.2 0.0 1.7 0.8 4.8 1.1 4.3 0.7 6.7 5.2 26.7 286.7 459.2 161.6 23.5 48.8 80.2 26.9 45.9 89.5 35.6 46.7AL 0.7 1.5 6.6 0.3 9.0 12.3 14.2 20.9 9.6 2.0 2.3 0.1 10.6 50.3 15.5 17.2 46.7 106.3 82.3 64.6 265.8 68.6 56.3 27.8 25.1 20.2 18.9 32.4 24.1 43.2RI 0.0 1.3 4.3 2.7 6.5 12.6 9.7 6.6 14.2 30.9 2.7 0.4 5.1 8.7 0.0 3.4 0.3 11.5 26.0 23.9 74.6 110.7 95.9 61.3 38.3 76.2 80.7 7.0 40.7 39.1NH 1.3 3.0 3.8 11.5 13.6 3.8 14.7 12.9 18.8 15.3 16.2 30.1 6.8 19.8 7.9 28.8 42.3 44.8 173.6 233.5 662.5 217.0 187.7 136.3 124.5 91.7 70.0 136.1 170.1 37.7MO 1.0 0.0 3.6 3.0 8.5 8.8 3.8 10.6 1.6 9.5 6.8 34.9 27.4 49.2 39.1 81.3 43.9 66.7 611.0 165.7 569.1 165.0 74.0 72.3 26.0 56.0 41.7 90.0 79.5 23.9WI 0.1 1.7 0.4 7.8 8.3 7.2 12.9 16.4 12.8 11.7 12.4 5.5 21.1 25.2 8.5 8.9 25.1 62.0 50.2 86.4 160.5 85.8 48.5 37.5 55.4 66.8 70.1 80.9 64.0 23.0DE 0.0 0.0 0.0 0.0 0.0 0.3 0.0 4.5 1.4 4.8 1.4 3.8 9.7 3.0 12.4 4.4 4.7 1.1 0.0 16.8 134.7 164.6 19.4 0.4 2.1 7.7 5.8 7.8 62.7 17.7NV 0.0 0.0 1.3 0.2 1.0 0.0 2.4 4.1 0.0 5.5 0.1 2.7 5.9 0.0 1.2 0.6 2.0 9.7 24.2 28.2 27.3 29.1 31.7 37.4 47.6 127.4 19.6 29.4 12.6 15.4ID 0.0 0.0 0.7 13.5 0.0 0.3 0.0 0.0 0.0 0.0 0.0 0.0 5.0 0.2 0.1 15.2 0.1 1.2 30.3 18.5 18.5 5.8 8.2 52.2 2.5 10.0 12.0 18.7 21.7 14.7MT 0.0 0.0 0.0 0.0 0.0 1.5 0.7 2.7 0.4 0.0 0.0 1.0 0.0 0.0 0.0 0.0 0.0 0.0 0.0 15.4 16.7 24.8 0.0 0.0 0.0 25.9 0.0 3.0 15.6 14.5VT 0.0 0.2 0.0 0.5 1.0 0.0 6.6 8.0 4.5 7.4 7.2 1.5 19.0 0.0 5.3 4.2 0.3 3.2 1.4 0.0 46.4 11.6 1.5 1.2 5.1 35.2 6.3 6.6 42.3 14.2UN 0.0 0.0 13.8 0.6 0.0 4.3 0.0 0.5 0.8 0.3 0.0 0.0 30.0 0.8 0.1 0.3 2.2 4.4 42.1 2.4 58.8 26.3 0.0 0.0 0.9 57.1 0.0 0.0 0.0 13.0LA 6.6 17.4 1.0 17.2 1.4 9.9 3.3 1.9 1.9 0.0 0.0 1.0 3.8 3.8 2.7 27.5 13.7 26.5 61.5 294.0 99.9 64.0 19.2 1.3 2.7 1.9 11.5 15.9 17.2 11.4KY 0.2 2.5 0.3 1.0 0.0 2.4 1.9 7.7 2.8 5.8 0.0 5.5 3.9 15.4 17.6 20.7 31.1 35.0 37.5 81.9 201.8 23.9 12.8 3.9 47.2 32.0 26.2 53.4 29.8 11.1ME 1.1 0.0 0.0 2.7 6.0 18.4 11.6 15.3 8.7 17.2 4.5 0.8 0.2 3.0 0.0 1.5 1.5 3.7 52.7 42.8 140.2 3.9 15.4 0.9 12.0 4.2 7.6 4.0 4.1 8.2SC 0.0 0.0 0.0 0.0 0.1 0.9 0.0 12.8 18.1 23.6 7.6 4.0 1.2 11.4 3.8 34.1 91.9 47.7 132.1 135.1 388.4 97.1 76.5 14.3 13.6 1.6 10.3 86.9 34.0 8.0KS 0.0 0.0 0.4 0.7 0.9 2.3 2.2 3.9 5.4 11.4 8.9 0.4 1.9 4.8 1.5 6.6 25.4 9.2 10.4 29.6 224.8 40.3 7.4 25.8 45.7 1.4 21.0 77.1 44.8 7.9HI 0.0 0.1 0.0 0.0 0.0 0.0 0.0 0.0 0.0 0.0 0.0 0.0 0.0 0.0 0.0 0.0 20.5 1.5 4.2 12.8 203.0 37.8 4.4 12.8 9.9 12.4 32.8 4.9 7.2 7.1ND 0.0 0.0 0.0 0.0 0.5 0.0 0.0 14.0 0.0 0.0 0.0 0.0 0.0 0.0 0.2 9.8 0.0 1.1 0.5 3.0 6.1 1.0 0.0 14.5 2.0 0.0 0.0 0.2 4.5 6.8NM 2.0 0.2 0.2 1.1 1.6 22.0 10.0 7.5 3.9 3.0 1.8 4.4 0.0 0.5 0.0 3.6 12.9 27.0 7.7 12.1 18.5 13.5 14.8 2.3 20.6 75.4 30.5 128.2 58.1 6.7OK 5.8 5.6 5.5 9.9 4.9 1.5 4.7 14.1 5.3 9.3 2.6 0.3 0.0 0.0 6.8 6.1 31.8 27.8 101.4 66.8 52.5 29.8 30.8 31.1 63.0 0.0 11.8 8.1 16.6 4.5WV 0.0 0.0 3.1 3.8 2.9 1.1 2.0 0.1 0.0 0.0 0.0 0.0 0.0 0.0 0.0 0.0 0.0 23.8 2.0 0.0 4.5 1.4 15.9 12.6 5.8 8.0 4.7 9.7 30.0 3.0SD 0.0 0.0 0.0 0.0 0.0 0.0 0.0 0.0 0.0 0.0 0.0 0.0 0.0 0.0 0.0 0.0 0.0 0.0 0.0 0.7 0.3 0.5 7.4 3.5 1.5 0.0 0.0 4.0 0.5 0.8MS 0.0 2.4 0.0 0.0 2.5 2.2 0.0 0.0 0.6 0.9 4.9 2.4 14.5 1.7 15.0 0.0 10.6 8.3 3.5 90.4 19.5 30.0 5.0 0.9 4.9 10.0 1.0 5.9 0.0 0.0AK 0.0 0.0 3.5 0.0 0.0 0.0 0.0 0.0 0.0 0.0 0.0 0.0 0.0 0.0 0.0 0.0 0.0 0.0 0.0 0.0 3.5 0.0 0.0 0.0 0.0 0.0 0.0 0.0 0.0 0.0AR 0.4 0.0 0.0 0.0 0.0 0.0 1.5 0.0 0.0 0.0 0.0 0.0 9.5 4.7 31.4 5.0 0.0 4.0 6.9 24.8 33.4 10.4 9.7 1.2 3.7 12.6 39.2 0.2 0.0 0.0NE 0.0 0.7 0.0 0.5 0.8 0.5 0.0 0.0 1.5 0.0 0.0 0.0 0.0 38.0 3.5 0.5 10.4 3.7 17.9 57.3 134.8 88.4 12.6 201.1 0.2 7.4 6.5 0.0 16.0 0.0PR 0.0 0.0 0.0 0.0 0.0 0.0 0.0 0.0 0.0 0.0 0.0 0.3 0.0 1.0 22.0 7.8 4.1 12.5 1.3 4.6 31.1 32.0 0.5 0.1 1.5 1.7 14.3 16.0 13.8 0.0WY 0.0 0.0 2.0 0.0 0.0 0.0 0.0 0.0 2.2 0.0 0.0 0.0 0.0 0.0 0.0 0.0 0.0 2.0 0.0 0.0 0.0 0.0 0.0 0.0 1.5 4.1 6.5 0.2 1.5 0.0Total 523.0 1,058.0 1,502.1 2,777.3 2,817.0 2,631.5 2,883.9 3,173.9 3,205.9 3,154.0 2,566.1 2,062.9 3,351.9 3,473.5 3,864.5 7,370.1 10,605.7 14,133.4 19,759.7 51,542.8 100,524.6 38,531.0 21,099.0 19,136.5 21,947.0 22,941.0 26,338.5 30,478.6 27,946.8 17,690.7
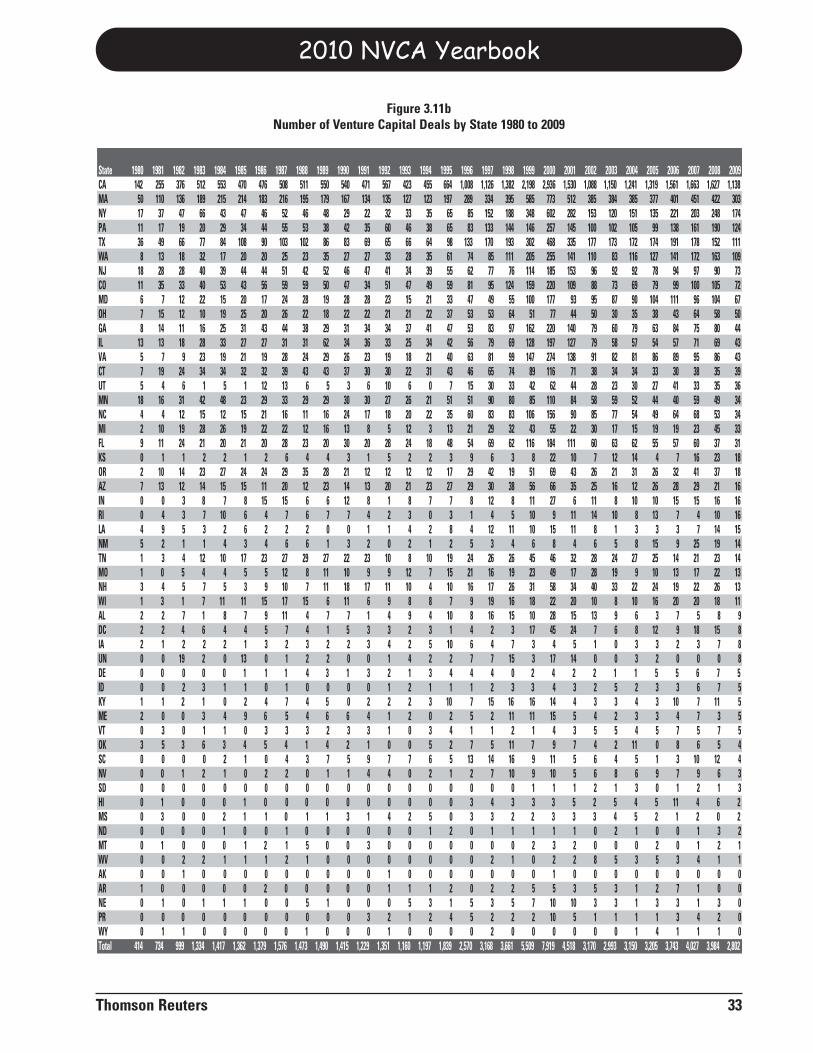
2010 NVCA Yearbook
Thomson Reuters 33
Figure 3.11bNumber of Venture Capital Deals by State 1980 to 2009
State 1980 1981 1982 1983 1984 1985 1986 1987 1988 1989 1990 1991 1992 1993 1994 1995 1996 1997 1998 1999 2000 2001 2002 2003 2004 2005 2006 2007 2008 2009CA 142 255 376 512 553 470 476 508 511 550 540 471 567 423 455 664 1,008 1,126 1,382 2,198 2,936 1,530 1,088 1,150 1,241 1,319 1,561 1,663 1,627 1,138MA 50 110 136 189 215 214 183 216 195 179 167 134 135 127 123 197 289 334 395 585 773 512 385 384 385 377 401 451 422 303NY 17 37 47 66 43 47 46 52 46 48 29 22 32 33 35 65 85 152 188 348 602 282 153 120 151 135 221 203 248 174PA 11 17 19 20 29 34 44 55 53 38 42 35 60 46 38 65 83 133 144 146 257 145 100 102 105 99 138 161 190 124TX 36 49 66 77 84 108 90 103 102 86 83 69 65 66 64 98 133 170 193 302 468 335 177 173 172 174 191 178 152 111WA 8 13 18 32 17 20 20 25 23 35 27 27 33 28 35 61 74 85 111 205 255 141 110 83 116 127 141 172 163 109NJ 18 28 28 40 39 44 44 51 42 52 46 47 41 34 39 55 62 77 76 114 185 153 96 92 92 78 94 97 90 73CO 11 35 33 40 53 43 56 59 59 50 47 34 51 47 49 59 81 95 124 159 220 109 88 73 69 79 99 100 105 72MD 6 7 12 22 15 20 17 24 28 19 28 28 23 15 21 33 47 49 55 100 177 93 95 87 90 104 111 96 104 67OH 7 15 12 10 19 25 20 26 22 18 22 22 21 21 22 37 53 53 64 51 77 44 50 30 35 38 43 64 58 50GA 8 14 11 16 25 31 43 44 38 29 31 34 34 37 41 47 53 83 97 162 220 140 79 60 79 63 84 75 80 44IL 13 13 18 28 33 27 27 31 31 62 34 36 33 25 34 42 56 79 69 128 197 127 79 58 57 54 57 71 69 43VA 5 7 9 23 19 21 19 28 24 29 26 23 19 18 21 40 63 81 99 147 274 138 91 82 81 86 89 95 86 43CT 7 19 24 34 34 32 32 39 43 43 37 30 30 22 31 43 46 65 74 89 116 71 38 34 34 33 30 38 35 39UT 5 4 6 1 5 1 12 13 6 5 3 6 10 6 0 7 15 30 33 42 62 44 28 23 30 27 41 33 35 36MN 18 16 31 42 48 23 29 33 29 29 30 30 27 26 21 51 51 90 80 85 110 84 58 59 52 44 40 59 49 34NC 4 4 12 15 12 15 21 16 11 16 24 17 18 20 22 35 60 83 83 106 156 90 85 77 54 49 64 68 53 34MI 2 10 19 28 26 19 22 22 12 16 13 8 5 12 3 13 21 29 32 43 55 22 30 17 15 19 19 23 45 33FL 9 11 24 21 20 21 20 28 23 20 30 20 28 24 18 48 54 69 62 116 184 111 60 63 62 55 57 60 37 31KS 0 1 1 2 2 1 2 6 4 4 3 1 5 2 2 3 9 6 3 8 22 10 7 12 14 4 7 16 23 18OR 2 10 14 23 27 24 24 29 35 28 21 12 12 12 12 17 29 42 19 51 69 43 26 21 31 26 32 41 37 18AZ 7 13 12 14 15 15 11 20 12 23 14 13 20 21 23 27 29 30 38 56 66 35 25 16 12 26 28 29 21 16IN 0 0 3 8 7 8 15 15 6 6 12 8 1 8 7 7 8 12 8 11 27 6 11 8 10 10 15 15 16 16RI 0 4 3 7 10 6 4 7 6 7 7 4 2 3 0 3 1 4 5 10 9 11 14 10 8 13 7 4 10 16LA 4 9 5 3 2 6 2 2 2 0 0 1 1 4 2 8 4 12 11 10 15 11 8 1 3 3 3 7 14 15NM 5 2 1 1 4 3 4 6 6 1 3 2 0 2 1 2 5 3 4 6 8 4 6 5 8 15 9 25 19 14TN 1 3 4 12 10 17 23 27 29 27 22 23 10 8 10 19 24 26 26 45 46 32 28 24 27 25 14 21 23 14MO 1 0 5 4 4 5 5 12 8 11 10 9 9 12 7 15 21 16 19 23 49 17 28 19 9 10 13 17 22 13NH 3 4 5 7 5 3 9 10 7 11 18 17 11 10 4 10 16 17 26 31 58 34 40 33 22 24 19 22 26 13WI 1 3 1 7 11 11 15 17 15 6 11 6 9 8 8 7 9 19 16 18 22 20 10 8 10 16 20 20 18 11AL 2 2 7 1 8 7 9 11 4 7 7 1 4 9 4 10 8 16 15 10 28 15 13 9 6 3 7 5 8 9DC 2 2 4 6 4 4 5 7 4 1 5 3 3 2 3 1 4 2 3 17 45 24 7 6 8 12 9 18 15 8IA 2 1 2 2 2 1 3 2 3 2 2 3 4 2 5 10 6 4 7 3 4 5 1 0 3 3 2 3 7 8UN 0 0 19 2 0 13 0 1 2 2 0 0 1 4 2 2 7 7 15 3 17 14 0 0 3 2 0 0 0 8DE 0 0 0 0 0 1 1 1 4 3 1 3 2 1 3 4 4 4 0 2 4 2 2 1 1 5 5 6 7 5ID 0 0 2 3 1 1 0 1 0 0 0 0 1 2 1 1 1 2 3 3 4 3 2 5 2 3 3 6 7 5KY 1 1 2 1 0 2 4 7 4 5 0 2 2 2 3 10 7 15 16 16 14 4 3 3 4 3 10 7 11 5ME 2 0 0 3 4 9 6 5 4 6 6 4 1 2 0 2 5 2 11 11 15 5 4 2 3 3 4 7 3 5VT 0 3 0 1 1 0 3 3 3 2 3 3 1 0 3 4 1 1 2 1 4 3 5 5 4 5 7 5 7 5OK 3 5 3 6 3 4 5 4 1 4 2 1 0 0 5 2 7 5 11 7 9 7 4 2 11 0 8 6 5 4SC 0 0 0 0 2 1 0 4 3 7 5 9 7 7 6 5 13 14 16 9 11 5 6 4 5 1 3 10 12 4NV 0 0 1 2 1 0 2 2 0 1 1 4 4 0 2 1 2 7 10 9 10 5 6 8 6 9 7 9 6 3SD 0 0 0 0 0 0 0 0 0 0 0 0 0 0 0 0 0 0 0 1 1 1 2 1 3 0 1 2 1 3HI 0 1 0 0 0 1 0 0 0 0 0 0 0 0 0 0 3 4 3 3 3 5 2 5 4 5 11 4 6 2MS 0 3 0 0 2 1 1 0 1 1 3 1 4 2 5 0 3 3 2 2 3 3 3 4 5 2 1 2 0 2ND 0 0 0 0 1 0 0 1 0 0 0 0 0 0 1 2 0 1 1 1 1 1 0 2 1 0 0 1 3 2MT 0 1 0 0 0 1 2 1 5 0 0 3 0 0 0 0 0 0 0 2 3 2 0 0 0 2 0 1 2 1WV 0 0 2 2 1 1 1 2 1 0 0 0 0 0 0 0 0 2 1 0 2 2 8 5 3 5 3 4 1 1AK 0 0 1 0 0 0 0 0 0 0 0 0 1 0 0 0 0 0 0 0 1 0 0 0 0 0 0 0 0 0AR 1 0 0 0 0 0 2 0 0 0 0 0 1 1 1 2 0 2 2 5 5 3 5 3 1 2 7 1 0 0NE 0 1 0 1 1 1 0 0 5 1 0 0 0 5 3 1 5 3 5 7 10 10 3 3 1 3 3 1 3 0PR 0 0 0 0 0 0 0 0 0 0 0 3 2 1 2 4 5 2 2 2 10 5 1 1 1 1 3 4 2 0WY 0 1 1 0 0 0 0 0 1 0 0 0 1 0 0 0 0 2 0 0 0 0 0 0 1 4 1 1 1 0Total 414 734 999 1,334 1,417 1,362 1,379 1,576 1,473 1,490 1,415 1,229 1,351 1,160 1,197 1,839 2,570 3,168 3,661 5,509 7,919 4,518 3,170 2,993 3,150 3,205 3,743 4,027 3,984 2,802
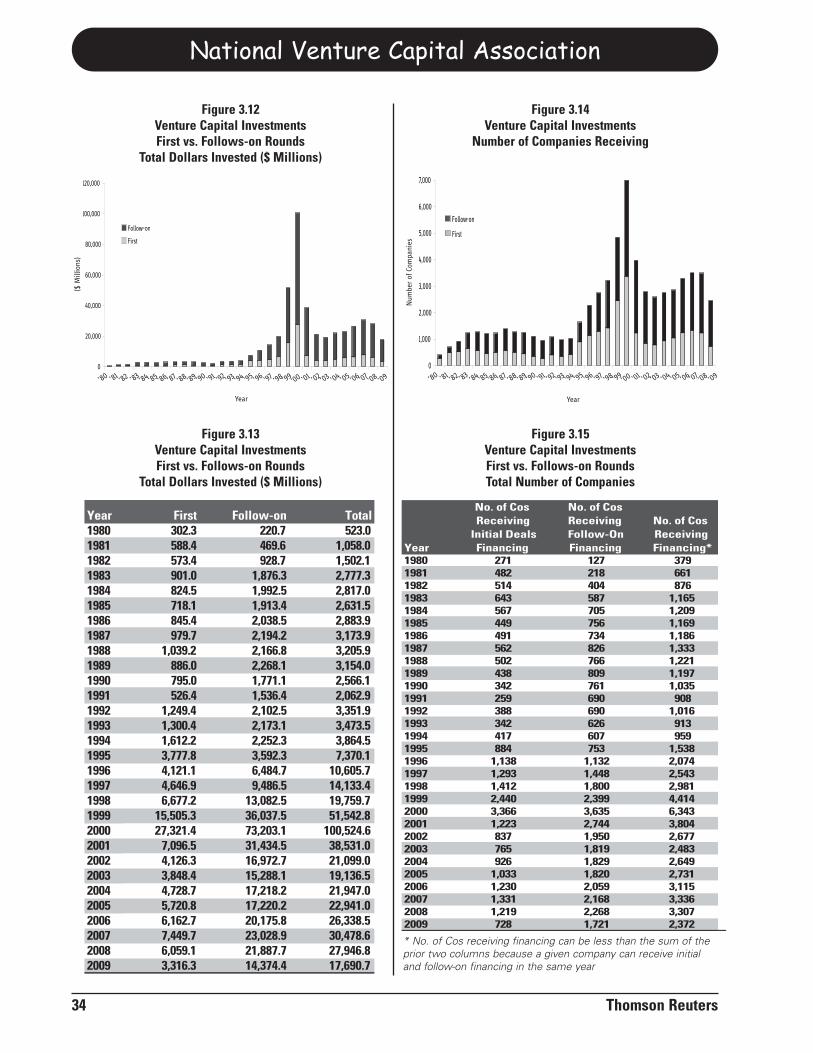
National Venture Capital Association
34 Thomson Reuters
0
20,000
40,000
60,000
80,000
100,000
120,000
Follow-on
First
Figure 3.12Venture Capital InvestmentsFirst vs. Follows-on Rounds
Total Dollars Invested ($ Millions)
Year First Follow-on Total1980 302.3 220.7 523.01981 588.4 469.6 1,058.01982 573.4 928.7 1,502.11983 901.0 1,876.3 2,777.31984 824.5 1,992.5 2,817.01985 718.1 1,913.4 2,631.51986 845.4 2,038.5 2,883.91987 979.7 2,194.2 3,173.91988 1,039.2 2,166.8 3,205.91989 886.0 2,268.1 3,154.01990 795.0 1,771.1 2,566.11991 526.4 1,536.4 2,062.91992 1,249.4 2,102.5 3,351.91993 1,300.4 2,173.1 3,473.51994 1,612.2 2,252.3 3,864.51995 3,777.8 3,592.3 7,370.11996 4,121.1 6,484.7 10,605.71997 4,646.9 9,486.5 14,133.41998 6,677.2 13,082.5 19,759.71999 15,505.3 36,037.5 51,542.82000 27,321.4 73,203.1 100,524.62001 7,096.5 31,434.5 38,531.02002 4,126.3 16,972.7 21,099.02003 3,848.4 15,288.1 19,136.52004 4,728.7 17,218.2 21,947.02005 5,720.8 17,220.2 22,941.02006 6,162.7 20,175.8 26,338.52007 7,449.7 23,028.9 30,478.62008 6,059.1 21,887.7 27,946.82009 3,316.3 14,374.4 17,690.7
Figure 3.13Venture Capital InvestmentsFirst vs. Follows-on Rounds
Total Dollars Invested ($ Millions)
No. of Cos No. of CosReceiving Receiving No. of Cos
Initial Deals Follow-On ReceivingYear Financing Financing Financing*1980 271 127 3791981 482 218 6611982 514 404 8761983 643 587 1,1651984 567 705 1,2091985 449 756 1,1691986 491 734 1,1861987 562 826 1,3331988 502 766 1,2211989 438 809 1,1971990 342 761 1,0351991 259 690 9081992 388 690 1,0161993 342 626 9131994 417 607 9591995 884 753 1,5381996 1,138 1,132 2,0741997 1,293 1,448 2,5431998 1,412 1,800 2,9811999 2,440 2,399 4,4142000 3,366 3,635 6,3432001 1,223 2,744 3,8042002 837 1,950 2,6772003 765 1,819 2,4832004 926 1,829 2,6492005 1,033 1,820 2,7312006 1,230 2,059 3,1152007 1,331 2,168 3,3362008 1,219 2,268 3,3072009 728 1,721 2,372
Figure 3.15Venture Capital InvestmentsFirst vs. Follows-on Rounds Total Number of Companies
0
1,000
2,000
3,000
4,000
5,000
6,000
7,000
Series2
Series1
Follow-on
First
Figure 3.14Venture Capital Investments
Number of Companies Receiving
* No. of Cos receiving financing can be less than the sum of theprior two columns because a given company can receive initialand follow-on financing in the same year
($ M
illio
ns)
Num
ber
of C
ompa
nies
Year Year
’80 ’81’82 ’83 ’84 ’85 ’86 ’87 ’88 ’89 ’90 ’91 ’92 ’93 ’94 ’95 ’96 ’97 ’98 ’99
’00 ’01 ’02 ’03 ’04 ’05 ’06 ’07 ’08 ’09 ’80 ’81’82 ’83 ’84 ’85 ’86 ’87 ’88 ’89 ’90 ’91 ’92 ’93 ’94 ’95 ’96 ’97 ’98 ’99
’00 ’01 ’02 ’03 ’04 ’05 ’06 ’07 ’08 ’09
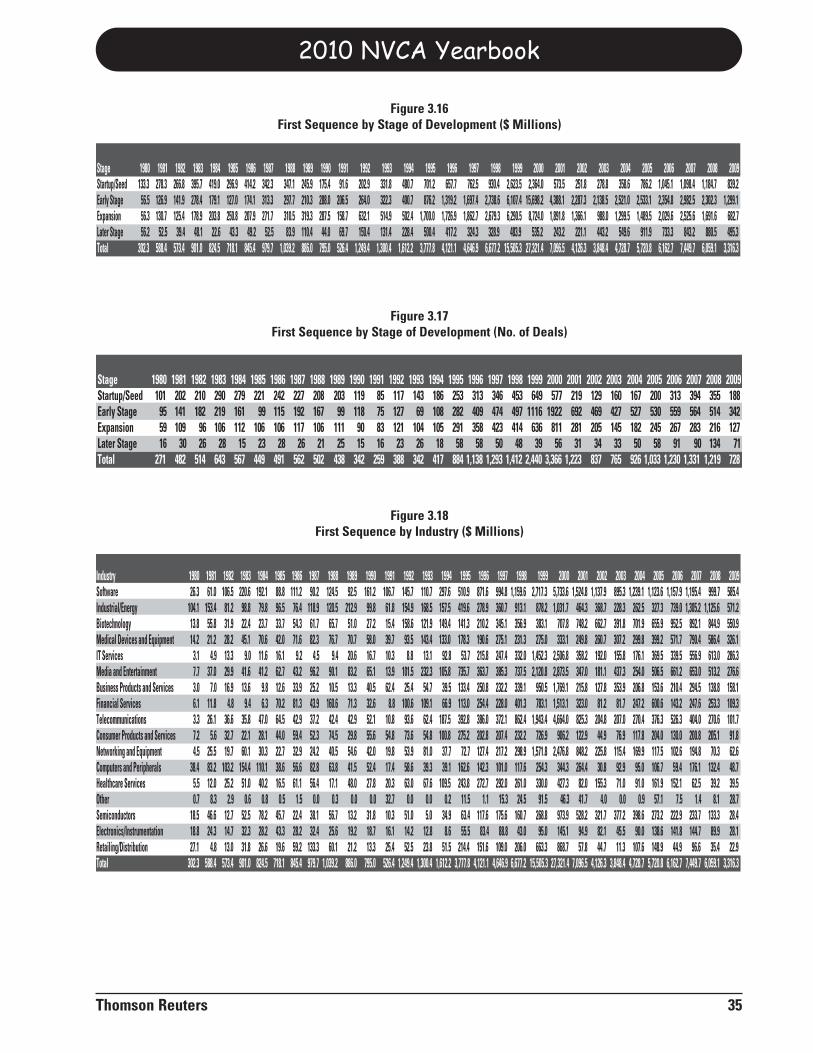
2010 NVCA Yearbook
Thomson Reuters 35
Industry 1980 1981 1982 1983 1984 1985 1986 1987 1988 1989 1990 1991 1992 1993 1994 1995 1996 1997 1998 1999 2000 2001 2002 2003 2004 2005 2006 2007 2008 2009Software 26.3 61.0 106.5 220.6 192.1 88.8 111.2 90.2 124.5 92.5 161.2 106.7 145.7 110.7 297.6 510.9 871.6 994.8 1,159.6 2,717.3 5,733.6 1,524.8 1,137.9 895.3 1,239.1 1,123.6 1,157.9 1,195.4 999.7 585.4Industrial/Energy 104.1 153.4 81.2 98.8 79.8 96.5 76.4 118.9 120.5 212.9 99.8 61.8 154.9 168.5 157.5 419.6 278.9 360.7 913.1 878.2 1,031.7 464.3 368.7 228.3 262.5 327.3 739.0 1,305.2 1,125.6 571.2Biotechnology 13.8 55.8 31.9 22.4 23.7 33.7 54.3 61.7 65.7 51.0 27.2 15.4 158.6 121.9 149.4 141.3 210.2 345.1 356.9 383.1 707.8 748.2 662.7 391.8 701.9 655.9 952.5 892.1 844.9 550.9Medical Devices and Equipment 14.2 21.2 28.2 45.1 70.6 42.0 71.6 82.3 76.7 70.7 58.0 39.7 93.5 143.4 133.0 178.3 190.6 275.1 231.3 275.0 333.1 249.8 260.7 307.2 299.8 399.2 571.7 790.4 586.4 326.1IT Services 3.1 4.9 13.3 9.0 11.6 16.1 9.2 4.5 9.4 20.6 16.7 10.3 8.8 13.1 92.8 53.7 215.8 247.4 332.0 1,452.3 2,506.8 358.2 192.0 155.8 176.1 369.5 339.5 556.9 613.0 286.3Media and Entertainment 7.7 37.0 29.9 41.6 41.2 62.7 43.2 96.2 90.1 83.2 65.1 13.9 101.5 232.3 105.8 735.7 363.7 385.3 737.5 2,120.8 2,873.5 347.0 181.1 437.3 254.0 506.5 661.2 653.0 513.2 276.6Business Products and Services 3.0 7.0 16.9 13.6 9.8 12.6 33.9 25.2 10.5 13.3 40.5 62.4 25.4 54.7 39.5 133.4 250.8 232.2 339.1 950.5 1,769.1 215.8 127.8 353.9 206.8 153.6 210.4 294.5 138.8 158.1Financial Services 6.1 11.8 4.8 9.4 6.3 70.2 81.3 43.9 160.6 71.3 32.6 8.8 100.6 109.1 66.9 113.0 254.4 228.0 401.3 783.1 1,513.1 323.0 81.2 81.7 247.2 600.6 143.2 247.6 253.3 109.3Telecommunications 3.3 26.1 36.6 35.8 47.0 64.5 42.9 37.2 42.4 42.9 52.1 10.8 93.6 62.4 187.5 392.8 386.0 372.1 862.4 1,943.4 4,664.0 825.3 204.8 207.0 270.4 376.3 526.3 404.0 270.6 101.7Consumer Products and Services 7.2 5.6 32.7 22.1 28.1 44.0 59.4 52.3 74.5 29.8 55.6 54.8 73.6 54.8 100.8 275.2 202.8 207.4 232.2 726.9 906.2 122.9 44.9 76.9 117.8 204.0 130.0 200.8 205.1 91.8Networking and Equipment 4.5 25.5 19.7 60.1 30.3 22.7 32.9 24.2 40.5 54.6 42.0 19.8 53.9 81.0 37.7 72.7 127.4 217.2 298.9 1,571.8 2,476.8 848.2 225.8 115.4 169.9 117.5 102.6 194.8 70.3 62.6Computers and Peripherals 38.4 83.2 103.2 154.4 110.1 38.6 56.6 82.8 63.8 41.5 52.4 17.4 58.6 39.3 39.1 162.6 142.3 101.0 117.6 254.3 344.3 264.4 30.8 92.9 95.0 106.7 59.4 176.1 132.4 48.7Healthcare Services 5.5 12.0 25.2 51.0 40.2 16.5 61.1 56.4 17.1 48.0 27.8 20.3 63.0 67.6 109.5 243.8 272.7 292.0 261.0 330.0 427.3 82.0 155.3 71.0 91.0 161.9 152.1 62.5 39.2 39.5Other 0.7 8.3 2.9 0.6 0.8 0.5 1.5 0.0 0.3 0.0 0.0 32.7 0.0 0.0 0.2 11.5 1.1 15.3 24.5 91.5 46.3 41.7 4.0 0.0 0.9 57.1 7.5 1.4 8.1 28.7Semiconductors 18.5 46.6 12.7 52.5 78.2 45.7 22.4 38.1 56.7 13.2 31.8 10.3 51.0 5.0 34.9 63.4 117.6 175.6 160.7 268.8 973.9 528.2 321.7 377.2 398.6 273.2 222.9 233.7 133.3 28.4Electronics/Instrumentation 18.8 24.3 14.7 32.3 28.2 43.3 28.2 32.4 25.6 19.2 18.7 16.1 14.2 12.8 8.6 55.5 83.4 88.8 43.0 95.0 145.1 94.9 82.1 45.5 90.0 138.6 141.8 144.7 89.9 28.1Retailing/Distribution 27.1 4.8 13.0 31.8 26.6 19.6 59.2 133.3 60.1 21.2 13.3 25.4 52.5 23.8 51.5 214.4 151.6 109.0 206.0 663.3 868.7 57.8 44.7 11.3 107.6 148.9 44.9 96.6 35.4 22.9Total 302.3 588.4 573.4 901.0 824.5 718.1 845.4 979.7 1,039.2 886.0 795.0 526.4 1,249.4 1,300.4 1,612.2 3,777.8 4,121.1 4,646.9 6,677.2 15,505.3 27,321.4 7,096.5 4,126.3 3,848.4 4,728.7 5,720.8 6,162.7 7,449.7 6,059.1 3,316.3
Figure 3.18First Sequence by Industry ($ Millions)
Stage 1980 1981 1982 1983 1984 1985 1986 1987 1988 1989 1990 1991 1992 1993 1994 1995 1996 1997 1998 1999 2000 2001 2002 2003 2004 2005 2006 2007 2008 2009Startup/Seed 133.3 278.3 266.8 395.7 419.0 296.9 414.2 342.3 347.1 245.9 175.4 91.6 202.9 331.8 480.7 701.2 657.7 762.5 930.4 2,623.5 2,364.0 573.5 251.8 278.8 358.6 786.2 1,045.1 1,098.4 1,184.7 839.2Early Stage 56.5 126.9 141.9 278.4 179.1 127.0 174.1 313.3 297.7 210.3 288.0 206.5 264.0 322.3 400.7 876.2 1,319.2 1,697.4 2,738.6 6,107.4 15,698.2 4,388.1 2,287.3 2,138.5 2,521.0 2,533.1 2,354.8 2,982.5 2,302.3 1,299.1Expansion 56.3 130.7 125.4 178.9 203.8 250.8 207.9 271.7 310.5 319.3 287.5 158.7 632.1 514.9 502.4 1,700.0 1,726.9 1,862.7 2,679.3 6,290.5 8,724.0 1,891.8 1,366.1 988.0 1,299.5 1,489.5 2,029.6 2,525.6 1,691.6 682.7Later Stage 56.2 52.5 39.4 48.1 22.6 43.3 49.2 52.5 83.9 110.4 44.0 69.7 150.4 131.4 228.4 500.4 417.2 324.3 328.9 483.9 535.2 243.2 221.1 443.2 549.6 911.9 733.3 843.2 880.5 495.3Total 302.3 588.4 573.4 901.0 824.5 718.1 845.4 979.7 1,039.2 886.0 795.0 526.4 1,249.4 1,300.4 1,612.2 3,777.8 4,121.1 4,646.9 6,677.2 15,505.3 27,321.4 7,096.5 4,126.3 3,848.4 4,728.7 5,720.8 6,162.7 7,449.7 6,059.1 3,316.3
Figure 3.16First Sequence by Stage of Development ($ Millions)
Stage 1980 1981 1982 1983 1984 1985 1986 1987 1988 1989 1990 1991 1992 1993 1994 1995 1996 1997 1998 1999 2000 2001 2002 2003 2004 2005 2006 2007 2008 2009Startup/Seed 101 202 210 290 279 221 242 227 208 203 119 85 117 143 186 253 313 346 453 649 577 219 129 160 167 200 313 394 355 188Early Stage 95 141 182 219 161 99 115 192 167 99 118 75 127 69 108 282 409 474 497 1116 1922 692 469 427 527 530 559 564 514 342Expansion 59 109 96 106 112 106 106 117 106 111 90 83 121 104 105 291 358 423 414 636 811 281 205 145 182 245 267 283 216 127Later Stage 16 30 26 28 15 23 28 26 21 25 15 16 23 26 18 58 58 50 48 39 56 31 34 33 50 58 91 90 134 71Total 271 482 514 643 567 449 491 562 502 438 342 259 388 342 417 884 1,138 1,293 1,412 2,440 3,366 1,223 837 765 926 1,033 1,230 1,331 1,219 728
Figure 3.17First Sequence by Stage of Development (No. of Deals)
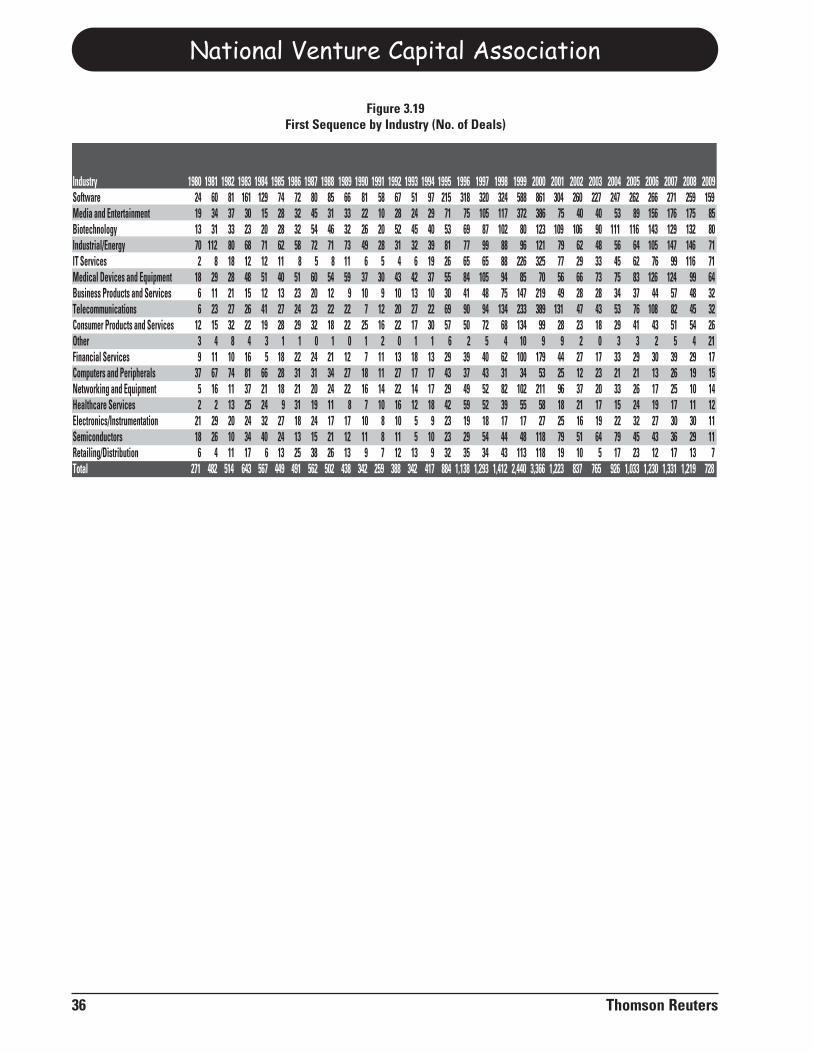
National Venture Capital Association
36 Thomson Reuters
Industry 1980 1981 1982 1983 1984 1985 1986 1987 1988 1989 1990 1991 1992 1993 1994 1995 1996 1997 1998 1999 2000 2001 2002 2003 2004 2005 2006 2007 2008 2009Software 24 60 81 161 129 74 72 80 85 66 81 58 67 51 97 215 318 320 324 588 861 304 260 227 247 262 266 271 259 159Media and Entertainment 19 34 37 30 15 28 32 45 31 33 22 10 28 24 29 71 75 105 117 372 386 75 40 40 53 89 156 176 175 85Biotechnology 13 31 33 23 20 28 32 54 46 32 26 20 52 45 40 53 69 87 102 80 123 109 106 90 111 116 143 129 132 80Industrial/Energy 70 112 80 68 71 62 58 72 71 73 49 28 31 32 39 81 77 99 88 96 121 79 62 48 56 64 105 147 146 71IT Services 2 8 18 12 12 11 8 5 8 11 6 5 4 6 19 26 65 65 88 226 325 77 29 33 45 62 76 99 116 71Medical Devices and Equipment 18 29 28 48 51 40 51 60 54 59 37 30 43 42 37 55 84 105 94 85 70 56 66 73 75 83 126 124 99 64Business Products and Services 6 11 21 15 12 13 23 20 12 9 10 9 10 13 10 30 41 48 75 147 219 49 28 28 34 37 44 57 48 32Telecommunications 6 23 27 26 41 27 24 23 22 22 7 12 20 27 22 69 90 94 134 233 389 131 47 43 53 76 108 82 45 32Consumer Products and Services 12 15 32 22 19 28 29 32 18 22 25 16 22 17 30 57 50 72 68 134 99 28 23 18 29 41 43 51 54 26Other 3 4 8 4 3 1 1 0 1 0 1 2 0 1 1 6 2 5 4 10 9 9 2 0 3 3 2 5 4 21Financial Services 9 11 10 16 5 18 22 24 21 12 7 11 13 18 13 29 39 40 62 100 179 44 27 17 33 29 30 39 29 17Computers and Peripherals 37 67 74 81 66 28 31 31 34 27 18 11 27 17 17 43 37 43 31 34 53 25 12 23 21 21 13 26 19 15Networking and Equipment 5 16 11 37 21 18 21 20 24 22 16 14 22 14 17 29 49 52 82 102 211 96 37 20 33 26 17 25 10 14Healthcare Services 2 2 13 25 24 9 31 19 11 8 7 10 16 12 18 42 59 52 39 55 58 18 21 17 15 24 19 17 11 12Electronics/Instrumentation 21 29 20 24 32 27 18 24 17 17 10 8 10 5 9 23 19 18 17 17 27 25 16 19 22 32 27 30 30 11Semiconductors 18 26 10 34 40 24 13 15 21 12 11 8 11 5 10 23 29 54 44 48 118 79 51 64 79 45 43 36 29 11Retailing/Distribution 6 4 11 17 6 13 25 38 26 13 9 7 12 13 9 32 35 34 43 113 118 19 10 5 17 23 12 17 13 7Total 271 482 514 643 567 449 491 562 502 438 342 259 388 342 417 884 1,138 1,293 1,412 2,440 3,366 1,223 837 765 926 1,033 1,230 1,331 1,219 728
Figure 3.19First Sequence by Industry (No. of Deals)
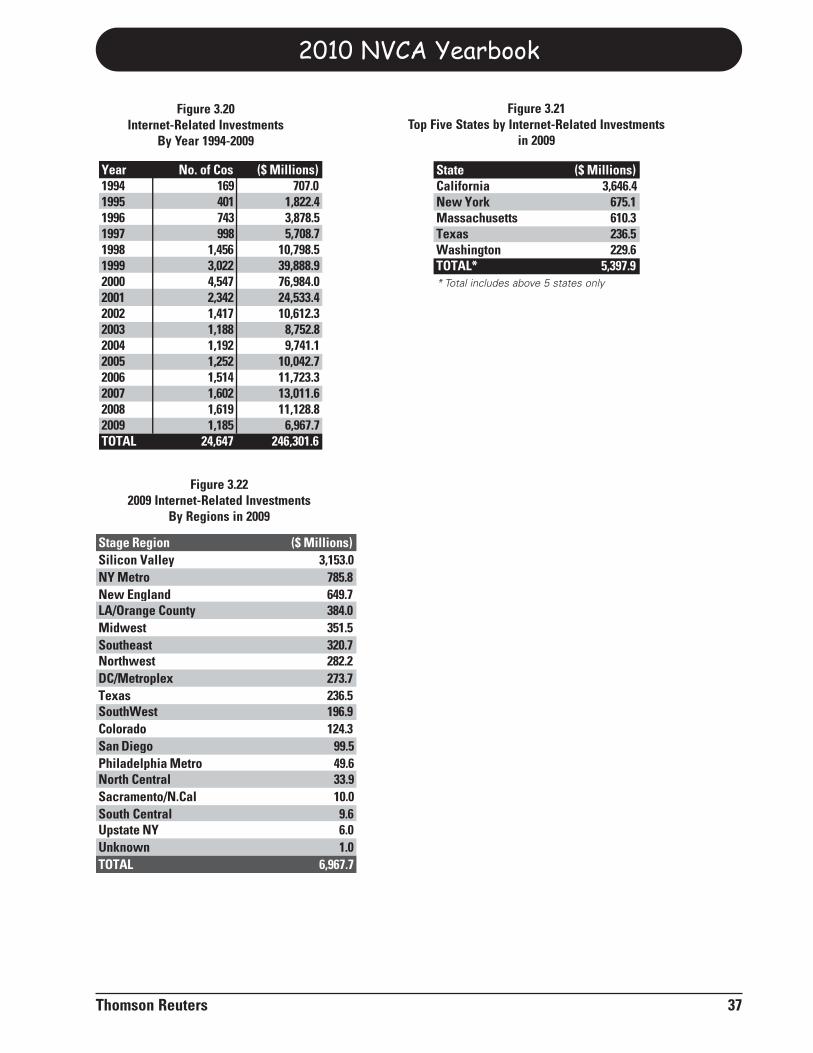
2010 NVCA Yearbook
Thomson Reuters 37
Stage Region ($ Millions)Silicon Valley 3,153.0NY Metro 785.8New England 649.7LA/Orange County 384.0Midwest 351.5Southeast 320.7Northwest 282.2DC/Metroplex 273.7Texas 236.5SouthWest 196.9Colorado 124.3San Diego 99.5Philadelphia Metro 49.6North Central 33.9Sacramento/N.Cal 10.0South Central 9.6Upstate NY 6.0Unknown 1.0TOTAL 6,967.7
Figure 3.222009 Internet-Related Investments
By Regions in 2009
Year No. of Cos ($ Millions)1994 169 707.01995 401 1,822.41996 743 3,878.51997 998 5,708.71998 1,456 10,798.51999 3,022 39,888.92000 4,547 76,984.02001 2,342 24,533.42002 1,417 10,612.32003 1,188 8,752.82004 1,192 9,741.12005 1,252 10,042.72006 1,514 11,723.32007 1,602 13,011.62008 1,619 11,128.82009 1,185 6,967.7TOTAL 24,647 246,301.6
Figure 3.20Internet-Related Investments
By Year 1994-2009
State ($ Millions)California 3,646.4New York 675.1Massachusetts 610.3Texas 236.5Washington 229.6TOTAL* 5,397.9
Figure 3.21Top Five States by Internet-Related Investments
in 2009
* Total includes above 5 states only
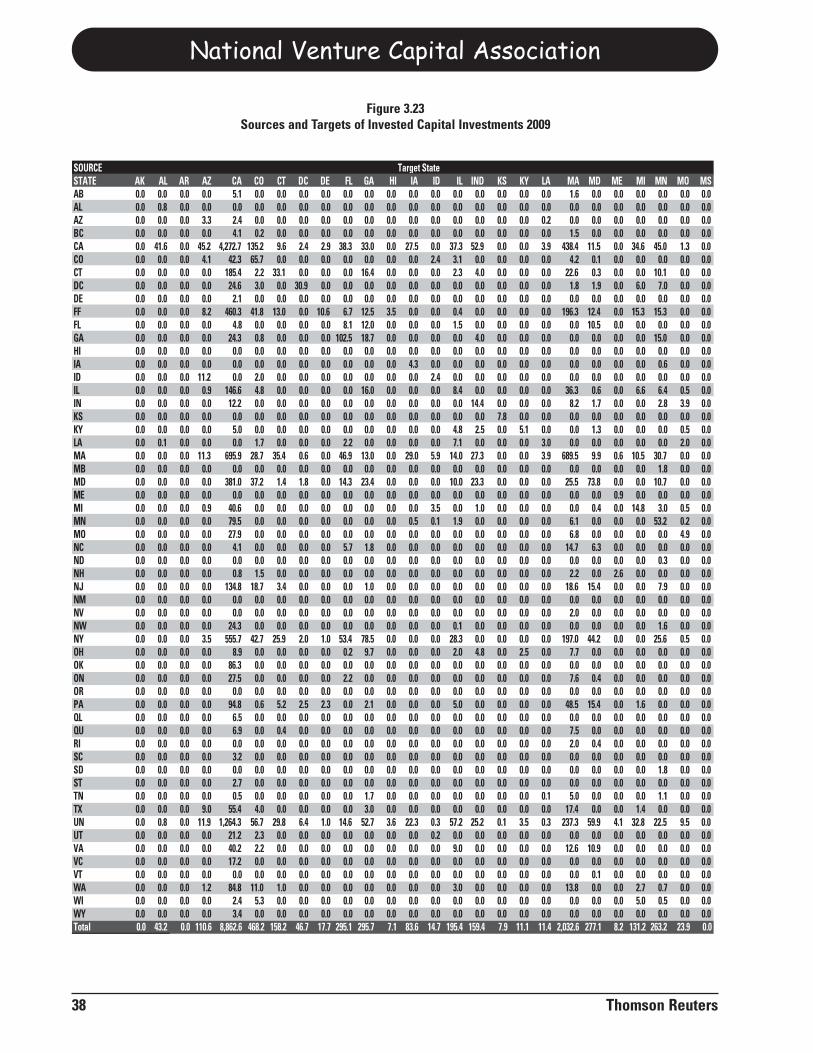
National Venture Capital Association
38 Thomson Reuters
SOURCESTATE AK AL AR AZ CA CO CT DC DE FL GA HI IA ID IL IND KS KY LA MA MD ME MI MN MO MSAB 0.0 0.0 0.0 0.0 5.1 0.0 0.0 0.0 0.0 0.0 0.0 0.0 0.0 0.0 0.0 0.0 0.0 0.0 0.0 1.6 0.0 0.0 0.0 0.0 0.0 0.0AL 0.0 0.8 0.0 0.0 0.0 0.0 0.0 0.0 0.0 0.0 0.0 0.0 0.0 0.0 0.0 0.0 0.0 0.0 0.0 0.0 0.0 0.0 0.0 0.0 0.0 0.0AZ 0.0 0.0 0.0 3.3 2.4 0.0 0.0 0.0 0.0 0.0 0.0 0.0 0.0 0.0 0.0 0.0 0.0 0.0 0.2 0.0 0.0 0.0 0.0 0.0 0.0 0.0BC 0.0 0.0 0.0 0.0 4.1 0.2 0.0 0.0 0.0 0.0 0.0 0.0 0.0 0.0 0.0 0.0 0.0 0.0 0.0 1.5 0.0 0.0 0.0 0.0 0.0 0.0CA 0.0 41.6 0.0 45.2 4,272.7 135.2 9.6 2.4 2.9 38.3 33.0 0.0 27.5 0.0 37.3 52.9 0.0 0.0 3.9 438.4 11.5 0.0 34.6 45.0 1.3 0.0CO 0.0 0.0 0.0 4.1 42.3 65.7 0.0 0.0 0.0 0.0 0.0 0.0 0.0 2.4 3.1 0.0 0.0 0.0 0.0 4.2 0.1 0.0 0.0 0.0 0.0 0.0CT 0.0 0.0 0.0 0.0 185.4 2.2 33.1 0.0 0.0 0.0 16.4 0.0 0.0 0.0 2.3 4.0 0.0 0.0 0.0 22.6 0.3 0.0 0.0 10.1 0.0 0.0DC 0.0 0.0 0.0 0.0 24.6 3.0 0.0 30.9 0.0 0.0 0.0 0.0 0.0 0.0 0.0 0.0 0.0 0.0 0.0 1.8 1.9 0.0 6.0 7.0 0.0 0.0DE 0.0 0.0 0.0 0.0 2.1 0.0 0.0 0.0 0.0 0.0 0.0 0.0 0.0 0.0 0.0 0.0 0.0 0.0 0.0 0.0 0.0 0.0 0.0 0.0 0.0 0.0FF 0.0 0.0 0.0 8.2 460.3 41.8 13.0 0.0 10.6 6.7 12.5 3.5 0.0 0.0 0.4 0.0 0.0 0.0 0.0 196.3 12.4 0.0 15.3 15.3 0.0 0.0FL 0.0 0.0 0.0 0.0 4.8 0.0 0.0 0.0 0.0 8.1 12.0 0.0 0.0 0.0 1.5 0.0 0.0 0.0 0.0 0.0 10.5 0.0 0.0 0.0 0.0 0.0GA 0.0 0.0 0.0 0.0 24.3 0.8 0.0 0.0 0.0 102.5 18.7 0.0 0.0 0.0 0.0 4.0 0.0 0.0 0.0 0.0 0.0 0.0 0.0 15.0 0.0 0.0HI 0.0 0.0 0.0 0.0 0.0 0.0 0.0 0.0 0.0 0.0 0.0 0.0 0.0 0.0 0.0 0.0 0.0 0.0 0.0 0.0 0.0 0.0 0.0 0.0 0.0 0.0IA 0.0 0.0 0.0 0.0 0.0 0.0 0.0 0.0 0.0 0.0 0.0 0.0 4.3 0.0 0.0 0.0 0.0 0.0 0.0 0.0 0.0 0.0 0.0 0.6 0.0 0.0ID 0.0 0.0 0.0 11.2 0.0 2.0 0.0 0.0 0.0 0.0 0.0 0.0 0.0 2.4 0.0 0.0 0.0 0.0 0.0 0.0 0.0 0.0 0.0 0.0 0.0 0.0IL 0.0 0.0 0.0 0.9 146.6 4.8 0.0 0.0 0.0 0.0 16.0 0.0 0.0 0.0 8.4 0.0 0.0 0.0 0.0 36.3 0.6 0.0 6.6 6.4 0.5 0.0IN 0.0 0.0 0.0 0.0 12.2 0.0 0.0 0.0 0.0 0.0 0.0 0.0 0.0 0.0 0.0 14.4 0.0 0.0 0.0 8.2 1.7 0.0 0.0 2.8 3.9 0.0KS 0.0 0.0 0.0 0.0 0.0 0.0 0.0 0.0 0.0 0.0 0.0 0.0 0.0 0.0 0.0 0.0 7.8 0.0 0.0 0.0 0.0 0.0 0.0 0.0 0.0 0.0KY 0.0 0.0 0.0 0.0 5.0 0.0 0.0 0.0 0.0 0.0 0.0 0.0 0.0 0.0 4.8 2.5 0.0 5.1 0.0 0.0 1.3 0.0 0.0 0.0 0.5 0.0LA 0.0 0.1 0.0 0.0 0.0 1.7 0.0 0.0 0.0 2.2 0.0 0.0 0.0 0.0 7.1 0.0 0.0 0.0 3.0 0.0 0.0 0.0 0.0 0.0 2.0 0.0MA 0.0 0.0 0.0 11.3 695.9 28.7 35.4 0.6 0.0 46.9 13.0 0.0 29.0 5.9 14.0 27.3 0.0 0.0 3.9 689.5 9.9 0.6 10.5 30.7 0.0 0.0MB 0.0 0.0 0.0 0.0 0.0 0.0 0.0 0.0 0.0 0.0 0.0 0.0 0.0 0.0 0.0 0.0 0.0 0.0 0.0 0.0 0.0 0.0 0.0 1.8 0.0 0.0MD 0.0 0.0 0.0 0.0 381.0 37.2 1.4 1.8 0.0 14.3 23.4 0.0 0.0 0.0 10.0 23.3 0.0 0.0 0.0 25.5 73.8 0.0 0.0 10.7 0.0 0.0ME 0.0 0.0 0.0 0.0 0.0 0.0 0.0 0.0 0.0 0.0 0.0 0.0 0.0 0.0 0.0 0.0 0.0 0.0 0.0 0.0 0.0 0.9 0.0 0.0 0.0 0.0MI 0.0 0.0 0.0 0.9 40.6 0.0 0.0 0.0 0.0 0.0 0.0 0.0 0.0 3.5 0.0 1.0 0.0 0.0 0.0 0.0 0.4 0.0 14.8 3.0 0.5 0.0MN 0.0 0.0 0.0 0.0 79.5 0.0 0.0 0.0 0.0 0.0 0.0 0.0 0.5 0.1 1.9 0.0 0.0 0.0 0.0 6.1 0.0 0.0 0.0 53.2 0.2 0.0MO 0.0 0.0 0.0 0.0 27.9 0.0 0.0 0.0 0.0 0.0 0.0 0.0 0.0 0.0 0.0 0.0 0.0 0.0 0.0 6.8 0.0 0.0 0.0 0.0 4.9 0.0NC 0.0 0.0 0.0 0.0 4.1 0.0 0.0 0.0 0.0 5.7 1.8 0.0 0.0 0.0 0.0 0.0 0.0 0.0 0.0 14.7 6.3 0.0 0.0 0.0 0.0 0.0ND 0.0 0.0 0.0 0.0 0.0 0.0 0.0 0.0 0.0 0.0 0.0 0.0 0.0 0.0 0.0 0.0 0.0 0.0 0.0 0.0 0.0 0.0 0.0 0.3 0.0 0.0NH 0.0 0.0 0.0 0.0 0.8 1.5 0.0 0.0 0.0 0.0 0.0 0.0 0.0 0.0 0.0 0.0 0.0 0.0 0.0 2.2 0.0 2.6 0.0 0.0 0.0 0.0NJ 0.0 0.0 0.0 0.0 134.8 18.7 3.4 0.0 0.0 0.0 1.0 0.0 0.0 0.0 0.0 0.0 0.0 0.0 0.0 18.6 15.4 0.0 0.0 7.9 0.0 0.0NM 0.0 0.0 0.0 0.0 0.0 0.0 0.0 0.0 0.0 0.0 0.0 0.0 0.0 0.0 0.0 0.0 0.0 0.0 0.0 0.0 0.0 0.0 0.0 0.0 0.0 0.0NV 0.0 0.0 0.0 0.0 0.0 0.0 0.0 0.0 0.0 0.0 0.0 0.0 0.0 0.0 0.0 0.0 0.0 0.0 0.0 2.0 0.0 0.0 0.0 0.0 0.0 0.0NW 0.0 0.0 0.0 0.0 24.3 0.0 0.0 0.0 0.0 0.0 0.0 0.0 0.0 0.0 0.1 0.0 0.0 0.0 0.0 0.0 0.0 0.0 0.0 1.6 0.0 0.0NY 0.0 0.0 0.0 3.5 555.7 42.7 25.9 2.0 1.0 53.4 78.5 0.0 0.0 0.0 28.3 0.0 0.0 0.0 0.0 197.0 44.2 0.0 0.0 25.6 0.5 0.0OH 0.0 0.0 0.0 0.0 8.9 0.0 0.0 0.0 0.0 0.2 9.7 0.0 0.0 0.0 2.0 4.8 0.0 2.5 0.0 7.7 0.0 0.0 0.0 0.0 0.0 0.0OK 0.0 0.0 0.0 0.0 86.3 0.0 0.0 0.0 0.0 0.0 0.0 0.0 0.0 0.0 0.0 0.0 0.0 0.0 0.0 0.0 0.0 0.0 0.0 0.0 0.0 0.0ON 0.0 0.0 0.0 0.0 27.5 0.0 0.0 0.0 0.0 2.2 0.0 0.0 0.0 0.0 0.0 0.0 0.0 0.0 0.0 7.6 0.4 0.0 0.0 0.0 0.0 0.0OR 0.0 0.0 0.0 0.0 0.0 0.0 0.0 0.0 0.0 0.0 0.0 0.0 0.0 0.0 0.0 0.0 0.0 0.0 0.0 0.0 0.0 0.0 0.0 0.0 0.0 0.0PA 0.0 0.0 0.0 0.0 94.8 0.6 5.2 2.5 2.3 0.0 2.1 0.0 0.0 0.0 5.0 0.0 0.0 0.0 0.0 48.5 15.4 0.0 1.6 0.0 0.0 0.0QL 0.0 0.0 0.0 0.0 6.5 0.0 0.0 0.0 0.0 0.0 0.0 0.0 0.0 0.0 0.0 0.0 0.0 0.0 0.0 0.0 0.0 0.0 0.0 0.0 0.0 0.0QU 0.0 0.0 0.0 0.0 6.9 0.0 0.4 0.0 0.0 0.0 0.0 0.0 0.0 0.0 0.0 0.0 0.0 0.0 0.0 7.5 0.0 0.0 0.0 0.0 0.0 0.0RI 0.0 0.0 0.0 0.0 0.0 0.0 0.0 0.0 0.0 0.0 0.0 0.0 0.0 0.0 0.0 0.0 0.0 0.0 0.0 2.0 0.4 0.0 0.0 0.0 0.0 0.0SC 0.0 0.0 0.0 0.0 3.2 0.0 0.0 0.0 0.0 0.0 0.0 0.0 0.0 0.0 0.0 0.0 0.0 0.0 0.0 0.0 0.0 0.0 0.0 0.0 0.0 0.0SD 0.0 0.0 0.0 0.0 0.0 0.0 0.0 0.0 0.0 0.0 0.0 0.0 0.0 0.0 0.0 0.0 0.0 0.0 0.0 0.0 0.0 0.0 0.0 1.8 0.0 0.0ST 0.0 0.0 0.0 0.0 2.7 0.0 0.0 0.0 0.0 0.0 0.0 0.0 0.0 0.0 0.0 0.0 0.0 0.0 0.0 0.0 0.0 0.0 0.0 0.0 0.0 0.0TN 0.0 0.0 0.0 0.0 0.5 0.0 0.0 0.0 0.0 0.0 1.7 0.0 0.0 0.0 0.0 0.0 0.0 0.0 0.1 5.0 0.0 0.0 0.0 1.1 0.0 0.0TX 0.0 0.0 0.0 9.0 55.4 4.0 0.0 0.0 0.0 0.0 3.0 0.0 0.0 0.0 0.0 0.0 0.0 0.0 0.0 17.4 0.0 0.0 1.4 0.0 0.0 0.0UN 0.0 0.8 0.0 11.9 1,264.3 56.7 29.8 6.4 1.0 14.6 52.7 3.6 22.3 0.3 57.2 25.2 0.1 3.5 0.3 237.3 59.9 4.1 32.8 22.5 9.5 0.0UT 0.0 0.0 0.0 0.0 21.2 2.3 0.0 0.0 0.0 0.0 0.0 0.0 0.0 0.2 0.0 0.0 0.0 0.0 0.0 0.0 0.0 0.0 0.0 0.0 0.0 0.0VA 0.0 0.0 0.0 0.0 40.2 2.2 0.0 0.0 0.0 0.0 0.0 0.0 0.0 0.0 9.0 0.0 0.0 0.0 0.0 12.6 10.9 0.0 0.0 0.0 0.0 0.0VC 0.0 0.0 0.0 0.0 17.2 0.0 0.0 0.0 0.0 0.0 0.0 0.0 0.0 0.0 0.0 0.0 0.0 0.0 0.0 0.0 0.0 0.0 0.0 0.0 0.0 0.0VT 0.0 0.0 0.0 0.0 0.0 0.0 0.0 0.0 0.0 0.0 0.0 0.0 0.0 0.0 0.0 0.0 0.0 0.0 0.0 0.0 0.1 0.0 0.0 0.0 0.0 0.0WA 0.0 0.0 0.0 1.2 84.8 11.0 1.0 0.0 0.0 0.0 0.0 0.0 0.0 0.0 3.0 0.0 0.0 0.0 0.0 13.8 0.0 0.0 2.7 0.7 0.0 0.0WI 0.0 0.0 0.0 0.0 2.4 5.3 0.0 0.0 0.0 0.0 0.0 0.0 0.0 0.0 0.0 0.0 0.0 0.0 0.0 0.0 0.0 0.0 5.0 0.5 0.0 0.0WY 0.0 0.0 0.0 0.0 3.4 0.0 0.0 0.0 0.0 0.0 0.0 0.0 0.0 0.0 0.0 0.0 0.0 0.0 0.0 0.0 0.0 0.0 0.0 0.0 0.0 0.0Total 0.0 43.2 0.0 110.6 8,862.6 468.2 158.2 46.7 17.7 295.1 295.7 7.1 83.6 14.7 195.4 159.4 7.9 11.1 11.4 2,032.6 277.1 8.2 131.2 263.2 23.9 0.0
Target State
Figure 3.23Sources and Targets of Invested Capital Investments 2009
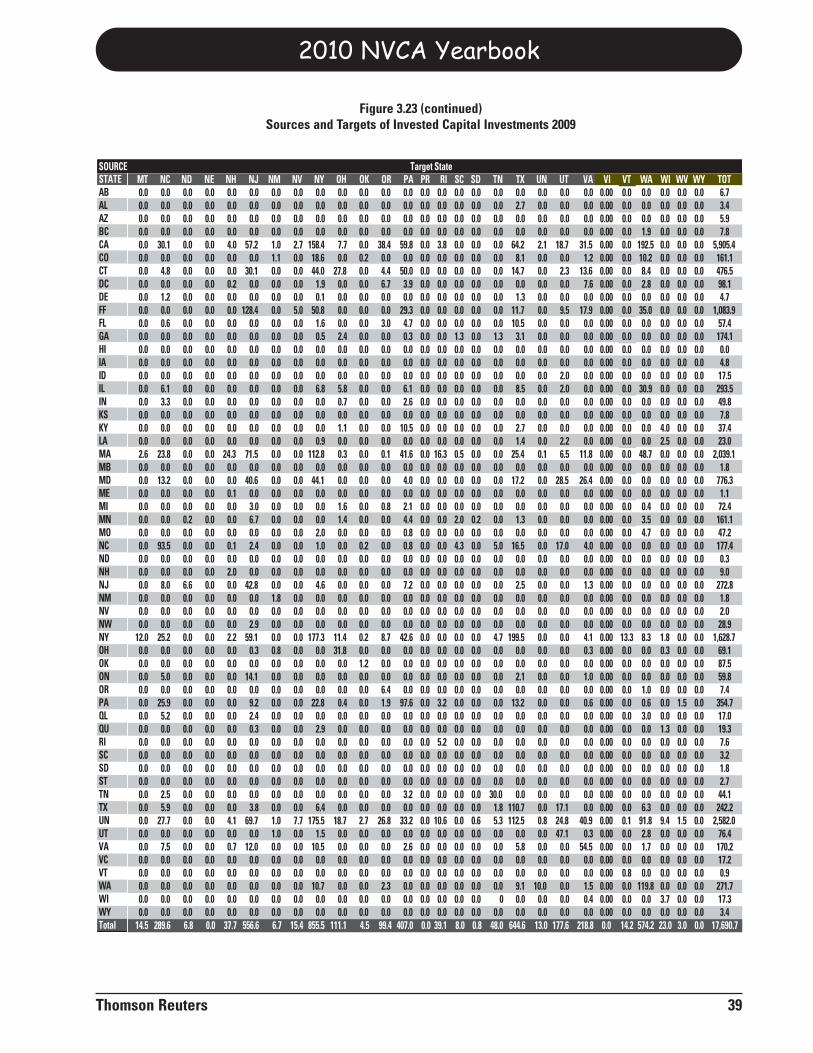
2010 NVCA Yearbook
Thomson Reuters 39
MT NC ND NE NH NJ NM NV NY OH OK OR PA PR RI SC SD TN TX UN UT VA VI VT WA WI WV WY TOT0.0 0.0 0.0 0.0 0.0 0.0 0.0 0.0 0.0 0.0 0.0 0.0 0.0 0.0 0.0 0.0 0.0 0.0 0.0 0.0 0.0 0.0 0.00 0.0 0.0 0.0 0.0 0.0 6.70.0 0.0 0.0 0.0 0.0 0.0 0.0 0.0 0.0 0.0 0.0 0.0 0.0 0.0 0.0 0.0 0.0 0.0 2.7 0.0 0.0 0.0 0.00 0.0 0.0 0.0 0.0 0.0 3.40.0 0.0 0.0 0.0 0.0 0.0 0.0 0.0 0.0 0.0 0.0 0.0 0.0 0.0 0.0 0.0 0.0 0.0 0.0 0.0 0.0 0.0 0.00 0.0 0.0 0.0 0.0 0.0 5.90.0 0.0 0.0 0.0 0.0 0.0 0.0 0.0 0.0 0.0 0.0 0.0 0.0 0.0 0.0 0.0 0.0 0.0 0.0 0.0 0.0 0.0 0.00 0.0 1.9 0.0 0.0 0.0 7.80.0 30.1 0.0 0.0 4.0 57.2 1.0 2.7 158.4 7.7 0.0 38.4 59.8 0.0 3.8 0.0 0.0 0.0 64.2 2.1 18.7 31.5 0.00 0.0 192.5 0.0 0.0 0.0 5,905.40.0 0.0 0.0 0.0 0.0 0.0 1.1 0.0 18.6 0.0 0.2 0.0 0.0 0.0 0.0 0.0 0.0 0.0 8.1 0.0 0.0 1.2 0.00 0.0 10.2 0.0 0.0 0.0 161.10.0 4.8 0.0 0.0 0.0 30.1 0.0 0.0 44.0 27.8 0.0 4.4 50.0 0.0 0.0 0.0 0.0 0.0 14.7 0.0 2.3 13.6 0.00 0.0 8.4 0.0 0.0 0.0 476.50.0 0.0 0.0 0.0 0.2 0.0 0.0 0.0 1.9 0.0 0.0 6.7 3.9 0.0 0.0 0.0 0.0 0.0 0.0 0.0 0.0 7.6 0.00 0.0 2.8 0.0 0.0 0.0 98.10.0 1.2 0.0 0.0 0.0 0.0 0.0 0.0 0.1 0.0 0.0 0.0 0.0 0.0 0.0 0.0 0.0 0.0 1.3 0.0 0.0 0.0 0.00 0.0 0.0 0.0 0.0 0.0 4.70.0 0.0 0.0 0.0 0.0 128.4 0.0 5.0 50.8 0.0 0.0 0.0 29.3 0.0 0.0 0.0 0.0 0.0 11.7 0.0 9.5 17.9 0.00 0.0 35.0 0.0 0.0 0.0 1,083.90.0 0.6 0.0 0.0 0.0 0.0 0.0 0.0 1.6 0.0 0.0 3.0 4.7 0.0 0.0 0.0 0.0 0.0 10.5 0.0 0.0 0.0 0.00 0.0 0.0 0.0 0.0 0.0 57.40.0 0.0 0.0 0.0 0.0 0.0 0.0 0.0 0.5 2.4 0.0 0.0 0.3 0.0 0.0 1.3 0.0 1.3 3.1 0.0 0.0 0.0 0.00 0.0 0.0 0.0 0.0 0.0 174.10.0 0.0 0.0 0.0 0.0 0.0 0.0 0.0 0.0 0.0 0.0 0.0 0.0 0.0 0.0 0.0 0.0 0.0 0.0 0.0 0.0 0.0 0.00 0.0 0.0 0.0 0.0 0.0 0.00.0 0.0 0.0 0.0 0.0 0.0 0.0 0.0 0.0 0.0 0.0 0.0 0.0 0.0 0.0 0.0 0.0 0.0 0.0 0.0 0.0 0.0 0.00 0.0 0.0 0.0 0.0 0.0 4.80.0 0.0 0.0 0.0 0.0 0.0 0.0 0.0 0.0 0.0 0.0 0.0 0.0 0.0 0.0 0.0 0.0 0.0 0.0 0.0 2.0 0.0 0.00 0.0 0.0 0.0 0.0 0.0 17.50.0 6.1 0.0 0.0 0.0 0.0 0.0 0.0 6.8 5.8 0.0 0.0 6.1 0.0 0.0 0.0 0.0 0.0 8.5 0.0 2.0 0.0 0.00 0.0 30.9 0.0 0.0 0.0 293.50.0 3.3 0.0 0.0 0.0 0.0 0.0 0.0 0.0 0.7 0.0 0.0 2.6 0.0 0.0 0.0 0.0 0.0 0.0 0.0 0.0 0.0 0.00 0.0 0.0 0.0 0.0 0.0 49.80.0 0.0 0.0 0.0 0.0 0.0 0.0 0.0 0.0 0.0 0.0 0.0 0.0 0.0 0.0 0.0 0.0 0.0 0.0 0.0 0.0 0.0 0.00 0.0 0.0 0.0 0.0 0.0 7.80.0 0.0 0.0 0.0 0.0 0.0 0.0 0.0 0.0 1.1 0.0 0.0 10.5 0.0 0.0 0.0 0.0 0.0 2.7 0.0 0.0 0.0 0.00 0.0 0.0 4.0 0.0 0.0 37.40.0 0.0 0.0 0.0 0.0 0.0 0.0 0.0 0.9 0.0 0.0 0.0 0.0 0.0 0.0 0.0 0.0 0.0 1.4 0.0 2.2 0.0 0.00 0.0 0.0 2.5 0.0 0.0 23.02.6 23.8 0.0 0.0 24.3 71.5 0.0 0.0 112.8 0.3 0.0 0.1 41.6 0.0 16.3 0.5 0.0 0.0 25.4 0.1 6.5 11.8 0.00 0.0 48.7 0.0 0.0 0.0 2,039.10.0 0.0 0.0 0.0 0.0 0.0 0.0 0.0 0.0 0.0 0.0 0.0 0.0 0.0 0.0 0.0 0.0 0.0 0.0 0.0 0.0 0.0 0.00 0.0 0.0 0.0 0.0 0.0 1.80.0 13.2 0.0 0.0 0.0 40.6 0.0 0.0 44.1 0.0 0.0 0.0 4.0 0.0 0.0 0.0 0.0 0.0 17.2 0.0 28.5 26.4 0.00 0.0 0.0 0.0 0.0 0.0 776.30.0 0.0 0.0 0.0 0.1 0.0 0.0 0.0 0.0 0.0 0.0 0.0 0.0 0.0 0.0 0.0 0.0 0.0 0.0 0.0 0.0 0.0 0.00 0.0 0.0 0.0 0.0 0.0 1.10.0 0.0 0.0 0.0 0.0 3.0 0.0 0.0 0.0 1.6 0.0 0.8 2.1 0.0 0.0 0.0 0.0 0.0 0.0 0.0 0.0 0.0 0.00 0.0 0.4 0.0 0.0 0.0 72.40.0 0.0 0.2 0.0 0.0 6.7 0.0 0.0 0.0 1.4 0.0 0.0 4.4 0.0 0.0 2.0 0.2 0.0 1.3 0.0 0.0 0.0 0.00 0.0 3.5 0.0 0.0 0.0 161.10.0 0.0 0.0 0.0 0.0 0.0 0.0 0.0 2.0 0.0 0.0 0.0 0.8 0.0 0.0 0.0 0.0 0.0 0.0 0.0 0.0 0.0 0.00 0.0 4.7 0.0 0.0 0.0 47.20.0 93.5 0.0 0.0 0.1 2.4 0.0 0.0 1.0 0.0 0.2 0.0 0.8 0.0 0.0 4.3 0.0 5.0 16.5 0.0 17.0 4.0 0.00 0.0 0.0 0.0 0.0 0.0 177.40.0 0.0 0.0 0.0 0.0 0.0 0.0 0.0 0.0 0.0 0.0 0.0 0.0 0.0 0.0 0.0 0.0 0.0 0.0 0.0 0.0 0.0 0.00 0.0 0.0 0.0 0.0 0.0 0.30.0 0.0 0.0 0.0 2.0 0.0 0.0 0.0 0.0 0.0 0.0 0.0 0.0 0.0 0.0 0.0 0.0 0.0 0.0 0.0 0.0 0.0 0.00 0.0 0.0 0.0 0.0 0.0 9.00.0 8.0 6.6 0.0 0.0 42.8 0.0 0.0 4.6 0.0 0.0 0.0 7.2 0.0 0.0 0.0 0.0 0.0 2.5 0.0 0.0 1.3 0.00 0.0 0.0 0.0 0.0 0.0 272.80.0 0.0 0.0 0.0 0.0 0.0 1.8 0.0 0.0 0.0 0.0 0.0 0.0 0.0 0.0 0.0 0.0 0.0 0.0 0.0 0.0 0.0 0.00 0.0 0.0 0.0 0.0 0.0 1.80.0 0.0 0.0 0.0 0.0 0.0 0.0 0.0 0.0 0.0 0.0 0.0 0.0 0.0 0.0 0.0 0.0 0.0 0.0 0.0 0.0 0.0 0.00 0.0 0.0 0.0 0.0 0.0 2.00.0 0.0 0.0 0.0 0.0 2.9 0.0 0.0 0.0 0.0 0.0 0.0 0.0 0.0 0.0 0.0 0.0 0.0 0.0 0.0 0.0 0.0 0.00 0.0 0.0 0.0 0.0 0.0 28.9
12.0 25.2 0.0 0.0 2.2 59.1 0.0 0.0 177.3 11.4 0.2 8.7 42.6 0.0 0.0 0.0 0.0 4.7 199.5 0.0 0.0 4.1 0.00 13.3 8.3 1.8 0.0 0.0 1,628.70.0 0.0 0.0 0.0 0.0 0.3 0.8 0.0 0.0 31.8 0.0 0.0 0.0 0.0 0.0 0.0 0.0 0.0 0.0 0.0 0.0 0.3 0.00 0.0 0.0 0.3 0.0 0.0 69.10.0 0.0 0.0 0.0 0.0 0.0 0.0 0.0 0.0 0.0 1.2 0.0 0.0 0.0 0.0 0.0 0.0 0.0 0.0 0.0 0.0 0.0 0.00 0.0 0.0 0.0 0.0 0.0 87.50.0 5.0 0.0 0.0 0.0 14.1 0.0 0.0 0.0 0.0 0.0 0.0 0.0 0.0 0.0 0.0 0.0 0.0 2.1 0.0 0.0 1.0 0.00 0.0 0.0 0.0 0.0 0.0 59.80.0 0.0 0.0 0.0 0.0 0.0 0.0 0.0 0.0 0.0 0.0 6.4 0.0 0.0 0.0 0.0 0.0 0.0 0.0 0.0 0.0 0.0 0.00 0.0 1.0 0.0 0.0 0.0 7.40.0 25.9 0.0 0.0 0.0 9.2 0.0 0.0 22.8 0.4 0.0 1.9 97.6 0.0 3.2 0.0 0.0 0.0 13.2 0.0 0.0 0.6 0.00 0.0 0.6 0.0 1.5 0.0 354.70.0 5.2 0.0 0.0 0.0 2.4 0.0 0.0 0.0 0.0 0.0 0.0 0.0 0.0 0.0 0.0 0.0 0.0 0.0 0.0 0.0 0.0 0.00 0.0 3.0 0.0 0.0 0.0 17.00.0 0.0 0.0 0.0 0.0 0.3 0.0 0.0 2.9 0.0 0.0 0.0 0.0 0.0 0.0 0.0 0.0 0.0 0.0 0.0 0.0 0.0 0.00 0.0 0.0 1.3 0.0 0.0 19.30.0 0.0 0.0 0.0 0.0 0.0 0.0 0.0 0.0 0.0 0.0 0.0 0.0 0.0 5.2 0.0 0.0 0.0 0.0 0.0 0.0 0.0 0.00 0.0 0.0 0.0 0.0 0.0 7.60.0 0.0 0.0 0.0 0.0 0.0 0.0 0.0 0.0 0.0 0.0 0.0 0.0 0.0 0.0 0.0 0.0 0.0 0.0 0.0 0.0 0.0 0.00 0.0 0.0 0.0 0.0 0.0 3.20.0 0.0 0.0 0.0 0.0 0.0 0.0 0.0 0.0 0.0 0.0 0.0 0.0 0.0 0.0 0.0 0.0 0.0 0.0 0.0 0.0 0.0 0.00 0.0 0.0 0.0 0.0 0.0 1.80.0 0.0 0.0 0.0 0.0 0.0 0.0 0.0 0.0 0.0 0.0 0.0 0.0 0.0 0.0 0.0 0.0 0.0 0.0 0.0 0.0 0.0 0.00 0.0 0.0 0.0 0.0 0.0 2.70.0 2.5 0.0 0.0 0.0 0.0 0.0 0.0 0.0 0.0 0.0 0.0 3.2 0.0 0.0 0.0 0.0 30.0 0.0 0.0 0.0 0.0 0.00 0.0 0.0 0.0 0.0 0.0 44.10.0 5.9 0.0 0.0 0.0 3.8 0.0 0.0 6.4 0.0 0.0 0.0 0.0 0.0 0.0 0.0 0.0 1.8 110.7 0.0 17.1 0.0 0.00 0.0 6.3 0.0 0.0 0.0 242.20.0 27.7 0.0 0.0 4.1 69.7 1.0 7.7 175.5 18.7 2.7 26.8 33.2 0.0 10.6 0.0 0.6 5.3 112.5 0.8 24.8 40.9 0.00 0.1 91.8 9.4 1.5 0.0 2,582.00.0 0.0 0.0 0.0 0.0 0.0 1.0 0.0 1.5 0.0 0.0 0.0 0.0 0.0 0.0 0.0 0.0 0.0 0.0 0.0 47.1 0.3 0.00 0.0 2.8 0.0 0.0 0.0 76.40.0 7.5 0.0 0.0 0.7 12.0 0.0 0.0 10.5 0.0 0.0 0.0 2.6 0.0 0.0 0.0 0.0 0.0 5.8 0.0 0.0 54.5 0.00 0.0 1.7 0.0 0.0 0.0 170.20.0 0.0 0.0 0.0 0.0 0.0 0.0 0.0 0.0 0.0 0.0 0.0 0.0 0.0 0.0 0.0 0.0 0.0 0.0 0.0 0.0 0.0 0.00 0.0 0.0 0.0 0.0 0.0 17.20.0 0.0 0.0 0.0 0.0 0.0 0.0 0.0 0.0 0.0 0.0 0.0 0.0 0.0 0.0 0.0 0.0 0.0 0.0 0.0 0.0 0.0 0.00 0.8 0.0 0.0 0.0 0.0 0.90.0 0.0 0.0 0.0 0.0 0.0 0.0 0.0 10.7 0.0 0.0 2.3 0.0 0.0 0.0 0.0 0.0 0.0 9.1 10.0 0.0 1.5 0.00 0.0 119.8 0.0 0.0 0.0 271.70.0 0.0 0.0 0.0 0.0 0.0 0.0 0.0 0.0 0.0 0.0 0.0 0.0 0.0 0.0 0.0 0.0 0 0.0 0.0 0.0 0.4 0.00 0.0 0.0 3.7 0.0 0.0 17.30.0 0.0 0.0 0.0 0.0 0.0 0.0 0.0 0.0 0.0 0.0 0.0 0.0 0.0 0.0 0.0 0.0 0.0 0.0 0.0 0.0 0.0 0.00 0.0 0.0 0.0 0.0 0.0 3.4
14.5 289.6 6.8 0.0 37.7 556.6 6.7 15.4 855.5 111.1 4.5 99.4 407.0 0.0 39.1 8.0 0.8 48.0 644.6 13.0 177.6 218.8 0.0 14.2 574.2 23.0 3.0 0.0 17,690.7
STATEABALAZBCCACOCTDCDEFFFLGAHIIAIDILINKSKYLAMAMBMDMEMIMNMONCNDNHNJNMNVNWNYOHOKONORPAQLQURISCSDSTTNTXUNUTVAVCVTWAWIWYTotal
Figure 3.23 (continued)Sources and Targets of Invested Capital Investments 2009
SOURCE Target State
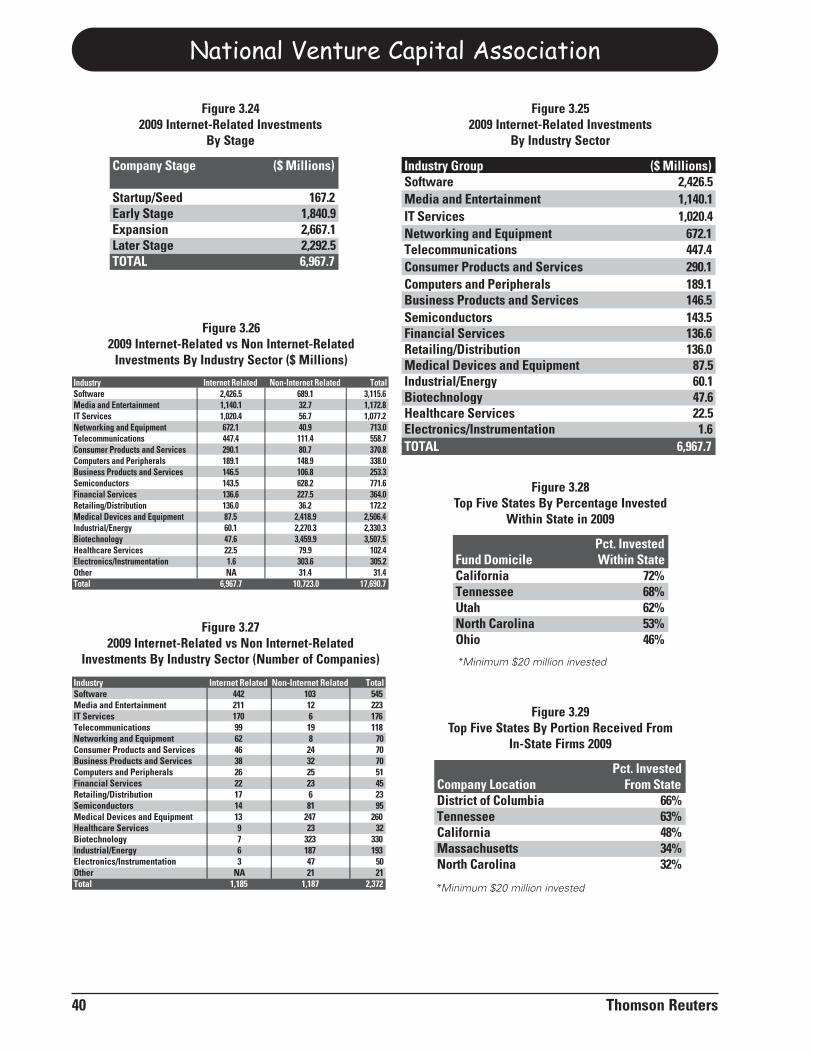
National Venture Capital Association
40 Thomson Reuters
Company Stage ($ Millions)
Startup/Seed 167.2Early Stage 1,840.9Expansion 2,667.1Later Stage 2,292.5TOTAL 6,967.7
Figure 3.242009 Internet-Related Investments
By Stage
Industry Group ($ Millions)Software 2,426.5Media and Entertainment 1,140.1IT Services 1,020.4Networking and Equipment 672.1Telecommunications 447.4Consumer Products and Services 290.1Computers and Peripherals 189.1Business Products and Services 146.5Semiconductors 143.5Financial Services 136.6Retailing/Distribution 136.0Medical Devices and Equipment 87.5Industrial/Energy 60.1Biotechnology 47.6Healthcare Services 22.5Electronics/Instrumentation 1.6TOTAL 6,967.7
Figure 3.252009 Internet-Related Investments
By Industry Sector
Pct. InvestedFund Domicile Within StateCalifornia 72%Tennessee 68%Utah 62%North Carolina 53%Ohio 46%
Figure 3.28Top Five States By Percentage Invested
Within State in 2009
Industry Internet Related Non-Internet Related TotalSoftware 442 103 545Media and Entertainment 211 12 223IT Services 170 6 176Telecommunications 99 19 118Networking and Equipment 62 8 70Consumer Products and Services 46 24 70Business Products and Services 38 32 70Computers and Peripherals 26 25 51Financial Services 22 23 45Retailing/Distribution 17 6 23Semiconductors 14 81 95Medical Devices and Equipment 13 247 260Healthcare Services 9 23 32Biotechnology 7 323 330Industrial/Energy 6 187 193Electronics/Instrumentation 3 47 50Other NA 21 21Total 1,185 1,187 2,372
Figure 3.272009 Internet-Related vs Non Internet-Related
Investments By Industry Sector (Number of Companies)
Industry Internet Related Non-Internet Related TotalSoftware 2,426.5 689.1 3,115.6Media and Entertainment 1,140.1 32.7 1,172.8IT Services 1,020.4 56.7 1,077.2Networking and Equipment 672.1 40.9 713.0Telecommunications 447.4 111.4 558.7Consumer Products and Services 290.1 80.7 370.8Computers and Peripherals 189.1 148.9 338.0Business Products and Services 146.5 106.8 253.3Semiconductors 143.5 628.2 771.6Financial Services 136.6 227.5 364.0Retailing/Distribution 136.0 36.2 172.2Medical Devices and Equipment 87.5 2,418.9 2,506.4Industrial/Energy 60.1 2,270.3 2,330.3Biotechnology 47.6 3,459.9 3,507.5Healthcare Services 22.5 79.9 102.4Electronics/Instrumentation 1.6 303.6 305.2Other NA 31.4 31.4Total 6,967.7 10,723.0 17,690.7
Figure 3.262009 Internet-Related vs Non Internet-Related
Investments By Industry Sector ($ Millions)
*Minimum $20 million invested
Pct. InvestedCompany Location From StateDistrict of Columbia 66%Tennessee 63%California 48%Massachusetts 34%North Carolina 32%
Figure 3.29Top Five States By Portion Received From
In-State Firms 2009
*Minimum $20 million invested
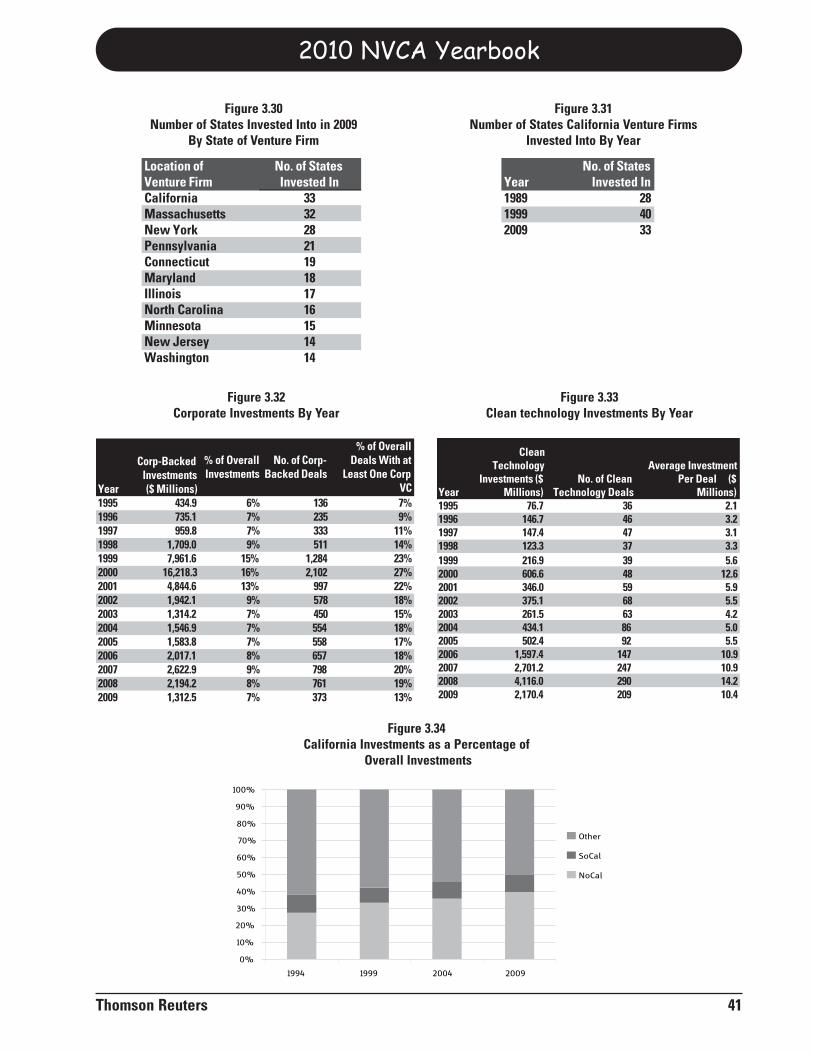
2010 NVCA Yearbook
Thomson Reuters 41
Location ofVenture FirmCalifornia 33Massachusetts 32New York 28Pennsylvania 21Connecticut 19Maryland 18Illinois 17North Carolina 16Minnesota 15New Jersey 14Washington 14
No. of StatesInvested In
Figure 3.30Number of States Invested Into in 2009
By State of Venture Firm
Year1995 434.9 6% 136 7%1996 735.1 7% 235 9%1997 959.8 7% 333 11%1998 1,709.0 9% 511 14%1999 7,961.6 15% 1,284 23%2000 16,218.3 16% 2,102 27%2001 4,844.6 13% 997 22%2002 1,942.1 9% 578 18%2003 1,314.2 7% 450 15%2004 1,546.9 7% 554 18%2005 1,583.8 7% 558 17%2006 2,017.1 8% 657 18%2007 2,622.9 9% 798 20%2008 2,194.2 8% 761 19%2009 1,312.5 7% 373 13%
Corp-BackedInvestments($ Millions)
No. of Corp-Backed Deals
% of OverallDeals With at
Least One CorpVC
% of OverallInvestments
Figure 3.32Corporate Investments By Year
Year1995 76.7 36 2.11996 146.7 46 3.21997 147.4 47 3.11998 123.3 37 3.31999 216.9 39 5.62000 606.6 48 12.62001 346.0 59 5.92002 375.1 68 5.52003 261.5 63 4.22004 434.1 86 5.02005 502.4 92 5.52006 1,597.4 147 10.92007 2,701.2 247 10.92008 4,116.0 290 14.22009 2,170.4 209 10.4
CleanTechnology
Investments ($Millions)
No. of CleanTechnology Deals
Average InvestmentPer Deal ($
Millions)
Figure 3.33Clean technology Investments By Year
0%
10%
20%
30%
40%
50%
60%
70%
80%
90%
100%
1994 1999 2004 2009
Other
SoCal
NoCal
Figure 3.34California Investments as a Percentage of
Overall Investments
No. of StatesYear Invested In1989 281999 402009 33
Figure 3.31Number of States California Venture Firms
Invested Into By Year

This page is intentionally left blank.
National Venture Capital Association
42 Thomson Reuters
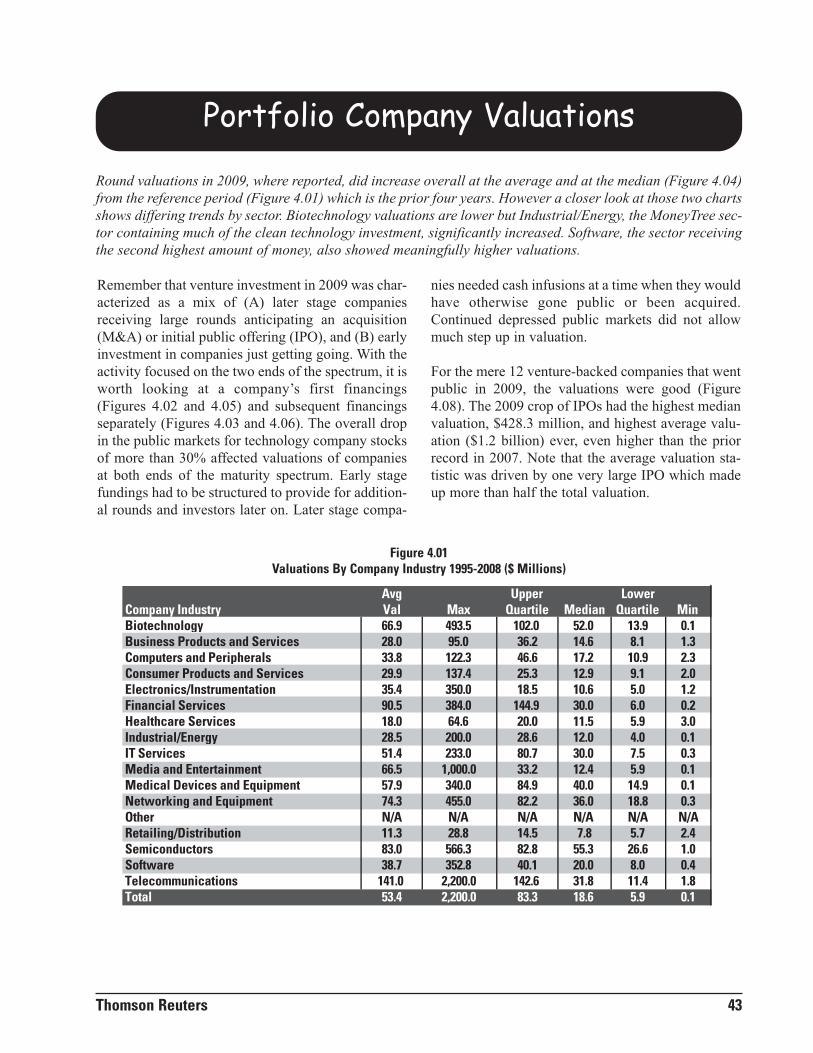
Portfolio Company Valuations
Remember that venture investment in 2009 was char-acterized as a mix of (A) later stage companiesreceiving large rounds anticipating an acquisition(M&A) or initial public offering (IPO), and (B) earlyinvestment in companies just getting going. With theactivity focused on the two ends of the spectrum, it isworth looking at a company’s first financings(Figures 4.02 and 4.05) and subsequent financingsseparately (Figures 4.03 and 4.06). The overall dropin the public markets for technology company stocksof more than 30% affected valuations of companiesat both ends of the maturity spectrum. Early stagefundings had to be structured to provide for addition-al rounds and investors later on. Later stage compa-
nies needed cash infusions at a time when they wouldhave otherwise gone public or been acquired.Continued depressed public markets did not allowmuch step up in valuation.
For the mere 12 venture-backed companies that wentpublic in 2009, the valuations were good (Figure4.08). The 2009 crop of IPOs had the highest medianvaluation, $428.3 million, and highest average valu-ation ($1.2 billion) ever, even higher than the priorrecord in 2007. Note that the average valuation sta-tistic was driven by one very large IPO which madeup more than half the total valuation.
Round valuations in 2009, where reported, did increase overall at the average and at the median (Figure 4.04)from the reference period (Figure 4.01) which is the prior four years. However a closer look at those two chartsshows differing trends by sector. Biotechnology valuations are lower but Industrial/Energy, the MoneyTree sec-tor containing much of the clean technology investment, significantly increased. Software, the sector receivingthe second highest amount of money, also showed meaningfully higher valuations.
Thomson Reuters 43
Avg Upper LowerVal Quartile Quartile
Biotechnology 66.9 493.5 102.0 52.0 13.9 0.1Business Products and Services 28.0 95.0 36.2 14.6 8.1 1.3Computers and Peripherals 33.8 122.3 46.6 17.2 10.9 2.3Consumer Products and Services 29.9 137.4 25.3 12.9 9.1 2.0Electronics/Instrumentation 35.4 350.0 18.5 10.6 5.0 1.2Financial Services 90.5 384.0 144.9 30.0 6.0 0.2Healthcare Services 18.0 64.6 20.0 11.5 5.9 3.0Industrial/Energy 28.5 200.0 28.6 12.0 4.0 0.1IT Services 51.4 233.0 80.7 30.0 7.5 0.3Media and Entertainment 66.5 1,000.0 33.2 12.4 5.9 0.1Medical Devices and Equipment 57.9 340.0 84.9 40.0 14.9 0.1Networking and Equipment 74.3 455.0 82.2 36.0 18.8 0.3Other N/A N/A N/A N/A N/A N/ARetailing/Distribution 11.3 28.8 14.5 7.8 5.7 2.4Semiconductors 83.0 566.3 82.8 55.3 26.6 1.0Software 38.7 352.8 40.1 20.0 8.0 0.4Telecommunications 141.0 2,200.0 142.6 31.8 11.4 1.8Total 53.4 2,200.0 83.3 18.6 5.9 0.1
MinCompany Industry Max Median
Figure 4.01Valuations By Company Industry 1995-2008 ($ Millions)
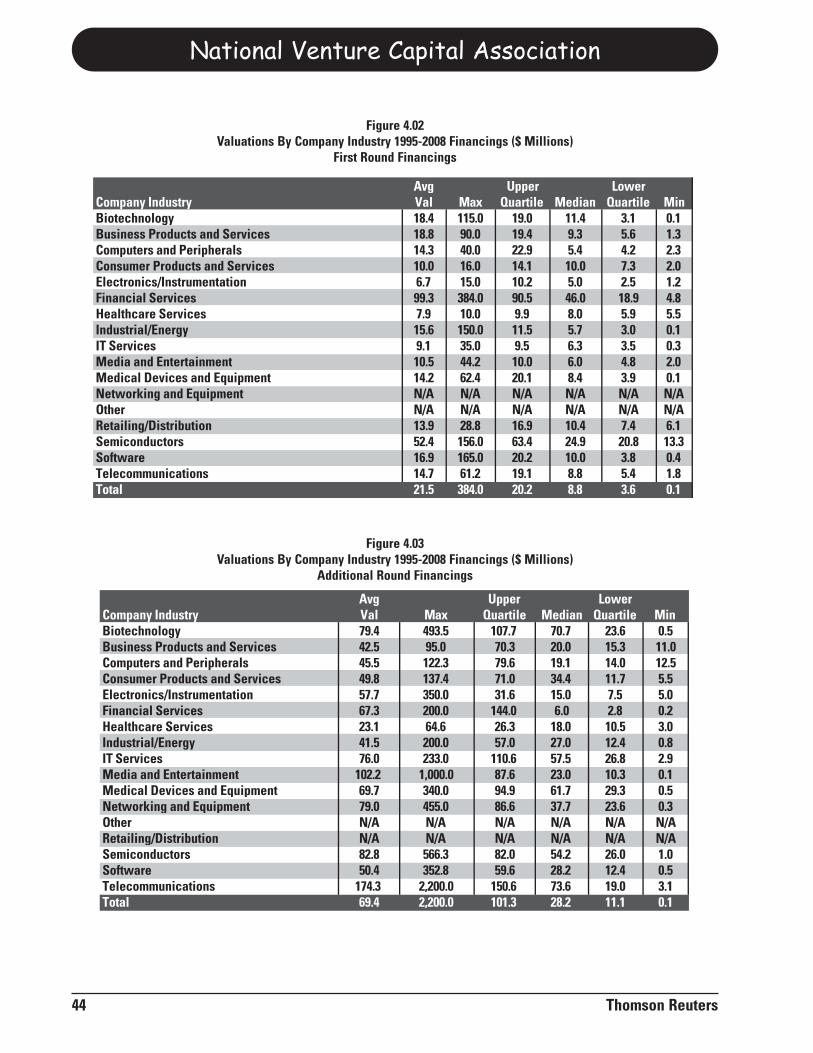
National Venture Capital Association
44 Thomson Reuters
Avg Upper LowerVal Quartile Quartile
Biotechnology 18.4 115.0 19.0 11.4 3.1 0.1Business Products and Services 18.8 90.0 19.4 9.3 5.6 1.3Computers and Peripherals 14.3 40.0 22.9 5.4 4.2 2.3Consumer Products and Services 10.0 16.0 14.1 10.0 7.3 2.0Electronics/Instrumentation 6.7 15.0 10.2 5.0 2.5 1.2Financial Services 99.3 384.0 90.5 46.0 18.9 4.8Healthcare Services 7.9 10.0 9.9 8.0 5.9 5.5Industrial/Energy 15.6 150.0 11.5 5.7 3.0 0.1IT Services 9.1 35.0 9.5 6.3 3.5 0.3Media and Entertainment 10.5 44.2 10.0 6.0 4.8 2.0Medical Devices and Equipment 14.2 62.4 20.1 8.4 3.9 0.1Networking and Equipment N/A N/A N/A N/A N/A N/AOther N/A N/A N/A N/A N/A N/ARetailing/Distribution 13.9 28.8 16.9 10.4 7.4 6.1Semiconductors 52.4 156.0 63.4 24.9 20.8 13.3Software 16.9 165.0 20.2 10.0 3.8 0.4Telecommunications 14.7 61.2 19.1 8.8 5.4 1.8Total 21.5 384.0 20.2 8.8 3.6 0.1
MinCompany Industry Max Median
Figure 4.02Valuations By Company Industry 1995-2008 Financings ($ Millions)
First Round Financings
Avg Upper LowerVal Quartile Quartile
Biotechnology 79.4 493.5 107.7 70.7 23.6 0.5Business Products and Services 42.5 95.0 70.3 20.0 15.3 11.0Computers and Peripherals 45.5 122.3 79.6 19.1 14.0 12.5Consumer Products and Services 49.8 137.4 71.0 34.4 11.7 5.5Electronics/Instrumentation 57.7 350.0 31.6 15.0 7.5 5.0Financial Services 67.3 200.0 144.0 6.0 2.8 0.2Healthcare Services 23.1 64.6 26.3 18.0 10.5 3.0Industrial/Energy 41.5 200.0 57.0 27.0 12.4 0.8IT Services 76.0 233.0 110.6 57.5 26.8 2.9Media and Entertainment 102.2 1,000.0 87.6 23.0 10.3 0.1Medical Devices and Equipment 69.7 340.0 94.9 61.7 29.3 0.5Networking and Equipment 79.0 455.0 86.6 37.7 23.6 0.3Other N/A N/A N/A N/A N/A N/ARetailing/Distribution N/A N/A N/A N/A N/A N/ASemiconductors 82.8 566.3 82.0 54.2 26.0 1.0Software 50.4 352.8 59.6 28.2 12.4 0.5Telecommunications 174.3 2,200.0 150.6 73.6 19.0 3.1Total 69.4 2,200.0 101.3 28.2 11.1 0.1
MinCompany Industry Max Median
Figure 4.03Valuations By Company Industry 1995-2008 Financings ($ Millions)
Additional Round Financings
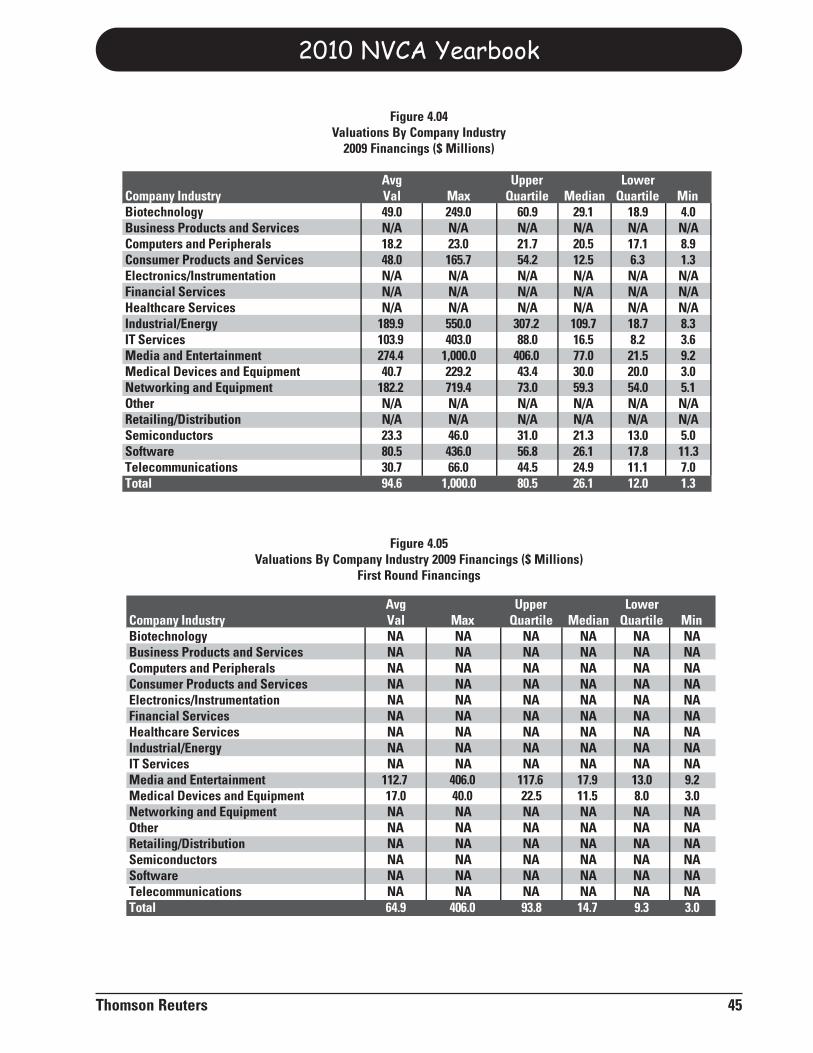
2010 NVCA Yearbook
Thomson Reuters 45
Avg Upper LowerVal Quartile Quartile
Biotechnology 49.0 249.0 60.9 29.1 18.9 4.0Business Products and Services N/A N/A N/A N/A N/A N/AComputers and Peripherals 18.2 23.0 21.7 20.5 17.1 8.9Consumer Products and Services 48.0 165.7 54.2 12.5 6.3 1.3Electronics/Instrumentation N/A N/A N/A N/A N/A N/AFinancial Services N/A N/A N/A N/A N/A N/AHealthcare Services N/A N/A N/A N/A N/A N/AIndustrial/Energy 189.9 550.0 307.2 109.7 18.7 8.3IT Services 103.9 403.0 88.0 16.5 8.2 3.6Media and Entertainment 274.4 1,000.0 406.0 77.0 21.5 9.2Medical Devices and Equipment 40.7 229.2 43.4 30.0 20.0 3.0Networking and Equipment 182.2 719.4 73.0 59.3 54.0 5.1Other N/A N/A N/A N/A N/A N/ARetailing/Distribution N/A N/A N/A N/A N/A N/ASemiconductors 23.3 46.0 31.0 21.3 13.0 5.0Software 80.5 436.0 56.8 26.1 17.8 11.3Telecommunications 30.7 66.0 44.5 24.9 11.1 7.0Total 94.6 1,000.0 80.5 26.1 12.0 1.3
MinCompany Industry Max Median
Figure 4.04Valuations By Company Industry
2009 Financings ($ Millions)
Avg Upper LowerVal Quartile Quartile
Biotechnology NA NA NA NA NA NABusiness Products and Services NA NA NA NA NA NAComputers and Peripherals NA NA NA NA NA NAConsumer Products and Services NA NA NA NA NA NAElectronics/Instrumentation NA NA NA NA NA NAFinancial Services NA NA NA NA NA NAHealthcare Services NA NA NA NA NA NAIndustrial/Energy NA NA NA NA NA NAIT Services NA NA NA NA NA NAMedia and Entertainment 112.7 406.0 117.6 17.9 13.0 9.2Medical Devices and Equipment 17.0 40.0 22.5 11.5 8.0 3.0Networking and Equipment NA NA NA NA NA NAOther NA NA NA NA NA NARetailing/Distribution NA NA NA NA NA NASemiconductors NA NA NA NA NA NASoftware NA NA NA NA NA NATelecommunications NA NA NA NA NA NATotal 64.9 406.0 93.8 14.7 9.3 3.0
MinCompany Industry Max Median
Figure 4.05Valuations By Company Industry 2009 Financings ($ Millions)
First Round Financings
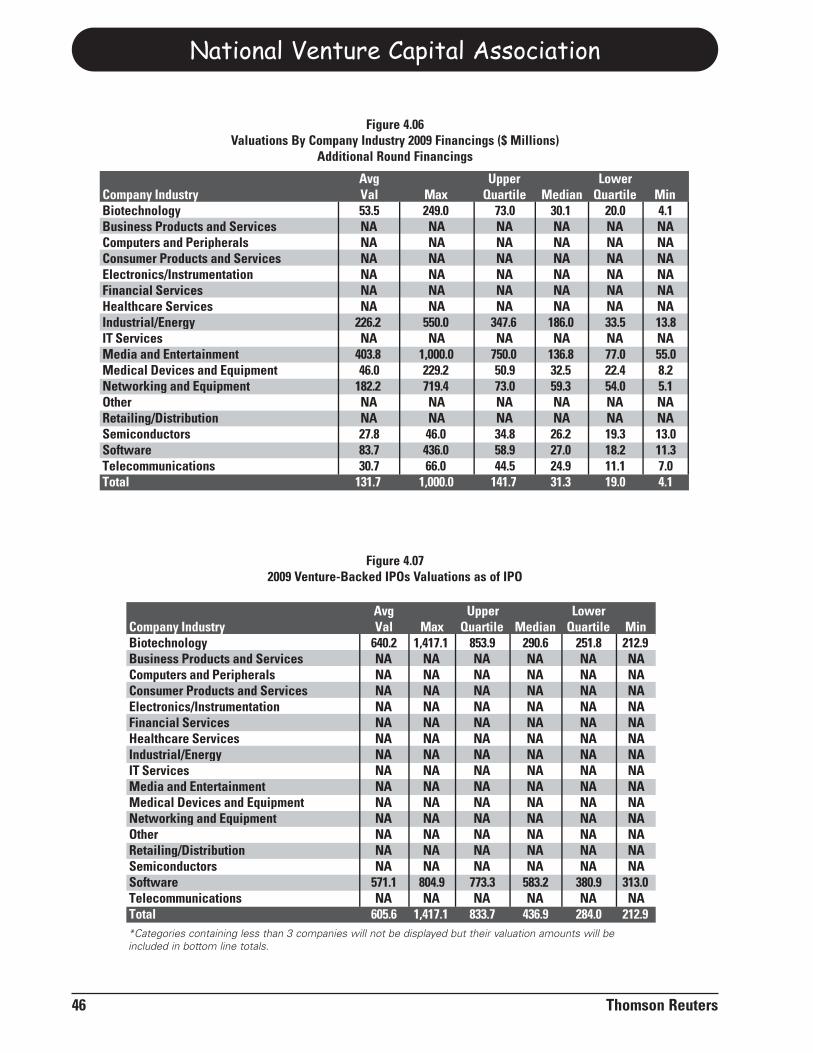
National Venture Capital Association
46 Thomson Reuters
Avg Upper LowerVal Quartile Quartile
Biotechnology 53.5 249.0 73.0 30.1 20.0 4.1Business Products and Services NA NA NA NA NA NAComputers and Peripherals NA NA NA NA NA NAConsumer Products and Services NA NA NA NA NA NAElectronics/Instrumentation NA NA NA NA NA NAFinancial Services NA NA NA NA NA NAHealthcare Services NA NA NA NA NA NAIndustrial/Energy 226.2 550.0 347.6 186.0 33.5 13.8IT Services NA NA NA NA NA NAMedia and Entertainment 403.8 1,000.0 750.0 136.8 77.0 55.0Medical Devices and Equipment 46.0 229.2 50.9 32.5 22.4 8.2Networking and Equipment 182.2 719.4 73.0 59.3 54.0 5.1Other NA NA NA NA NA NARetailing/Distribution NA NA NA NA NA NASemiconductors 27.8 46.0 34.8 26.2 19.3 13.0Software 83.7 436.0 58.9 27.0 18.2 11.3Telecommunications 30.7 66.0 44.5 24.9 11.1 7.0Total 131.7 1,000.0 141.7 31.3 19.0 4.1
MinCompany Industry Max Median
Figure 4.06Valuations By Company Industry 2009 Financings ($ Millions)
Additional Round Financings
Avg Upper LowerVal Quartile Quartile
Biotechnology 640.2 1,417.1 853.9 290.6 251.8 212.9Business Products and Services NA NA NA NA NA NAComputers and Peripherals NA NA NA NA NA NAConsumer Products and Services NA NA NA NA NA NAElectronics/Instrumentation NA NA NA NA NA NAFinancial Services NA NA NA NA NA NAHealthcare Services NA NA NA NA NA NAIndustrial/Energy NA NA NA NA NA NAIT Services NA NA NA NA NA NAMedia and Entertainment NA NA NA NA NA NAMedical Devices and Equipment NA NA NA NA NA NANetworking and Equipment NA NA NA NA NA NAOther NA NA NA NA NA NARetailing/Distribution NA NA NA NA NA NASemiconductors NA NA NA NA NA NASoftware 571.1 804.9 773.3 583.2 380.9 313.0Telecommunications NA NA NA NA NA NATotal 605.6 1,417.1 833.7 436.9 284.0 212.9
MinCompany Industry Max Median
Figure 4.072009 Venture-Backed IPOs Valuations as of IPO
*Categories containing less than 3 companies will not be displayed but their valuation amounts will be included in bottom line totals.
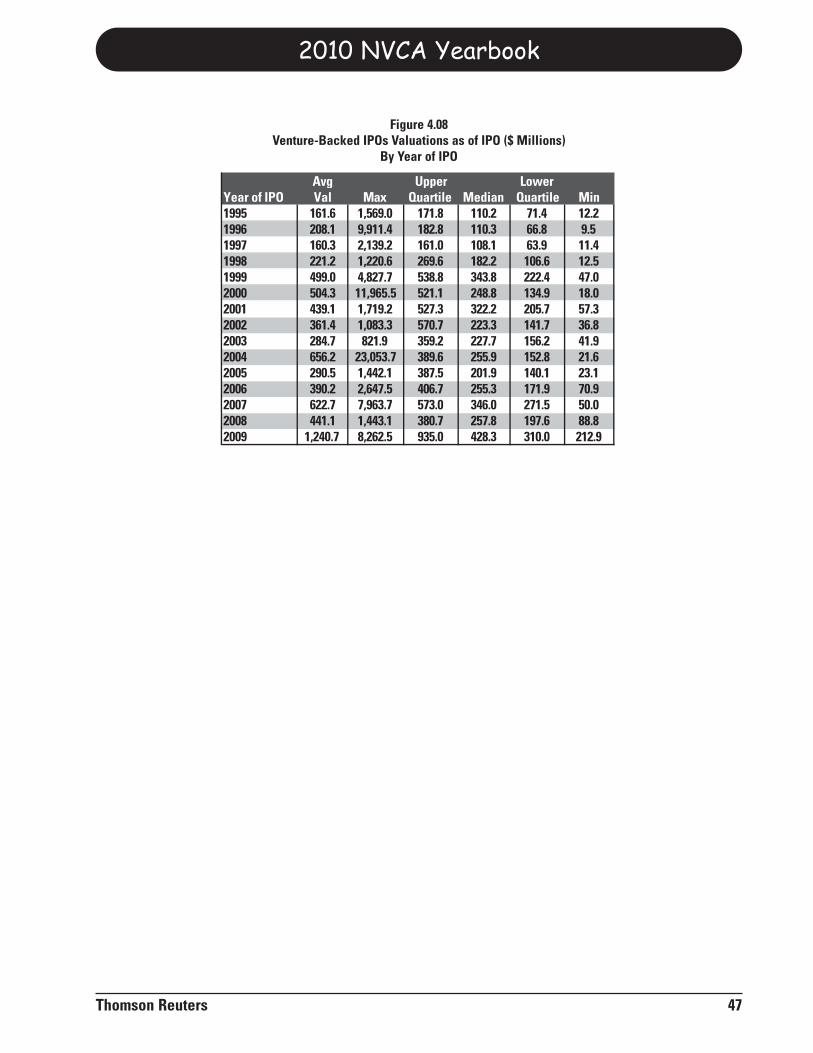
2010 NVCA Yearbook
Thomson Reuters 47
Avg Upper LowerVal Quartile Quartile
1995 161.6 1,569.0 171.8 110.2 71.4 12.21996 208.1 9,911.4 182.8 110.3 66.8 9.51997 160.3 2,139.2 161.0 108.1 63.9 11.41998 221.2 1,220.6 269.6 182.2 106.6 12.51999 499.0 4,827.7 538.8 343.8 222.4 47.02000 504.3 11,965.5 521.1 248.8 134.9 18.02001 439.1 1,719.2 527.3 322.2 205.7 57.32002 361.4 1,083.3 570.7 223.3 141.7 36.82003 284.7 821.9 359.2 227.7 156.2 41.92004 656.2 23,053.7 389.6 255.9 152.8 21.62005 290.5 1,442.1 387.5 201.9 140.1 23.12006 390.2 2,647.5 406.7 255.3 171.9 70.92007 622.7 7,963.7 573.0 346.0 271.5 50.02008 441.1 1,443.1 380.7 257.8 197.6 88.82009 1,240.7 8,262.5 935.0 428.3 310.0 212.9
MinYear of IPO Max Median
Figure 4.08Venture-Backed IPOs Valuations as of IPO ($ Millions)
By Year of IPO

This page is intentionally left blank.
National Venture Capital Association
48 Thomson Reuters
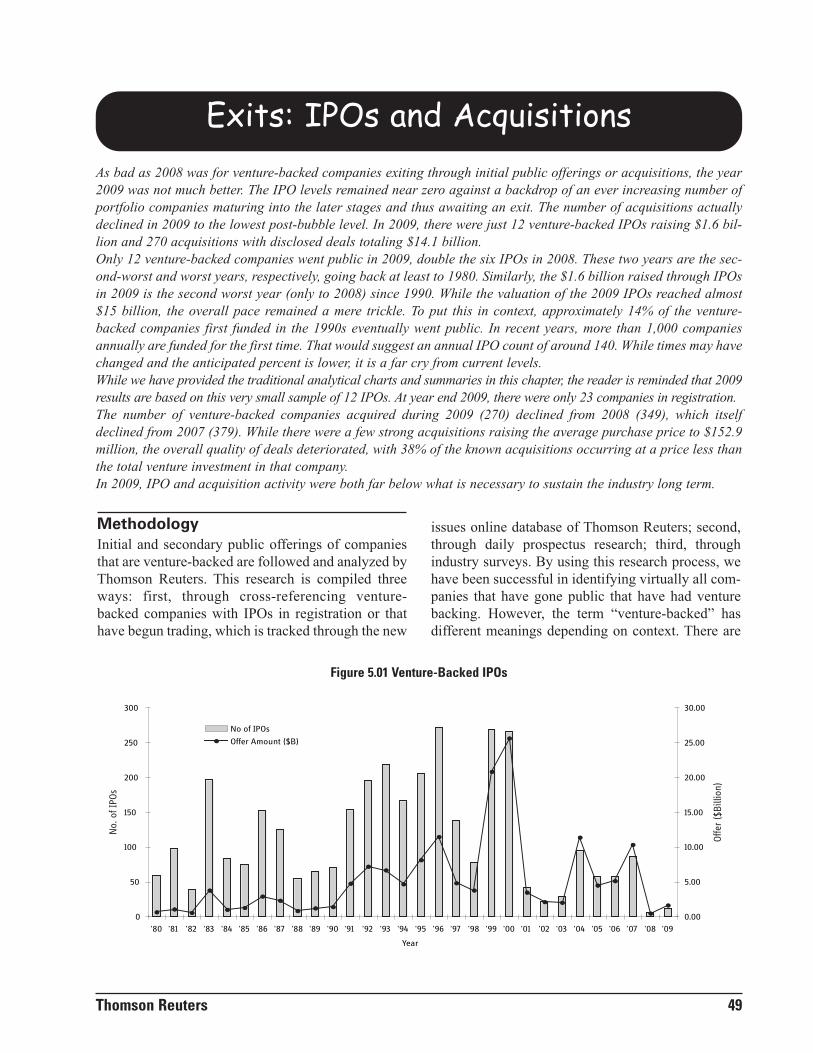
Exits: IPOs and Acquisitions
MethodologyInitial and secondary public offerings of companiesthat are venture-backed are followed and analyzed byThomson Reuters. This research is compiled threeways: first, through cross-referencing venture-backed companies with IPOs in registration or thathave begun trading, which is tracked through the new
issues online database of Thomson Reuters; second,through daily prospectus research; third, throughindustry surveys. By using this research process, wehave been successful in identifying virtually all com-panies that have gone public that have had venturebacking. However, the term “venture-backed” hasdifferent meanings depending on context. There are
As bad as 2008 was for venture-backed companies exiting through initial public offerings or acquisitions, the year2009 was not much better. The IPO levels remained near zero against a backdrop of an ever increasing number ofportfolio companies maturing into the later stages and thus awaiting an exit. The number of acquisitions actuallydeclined in 2009 to the lowest post-bubble level. In 2009, there were just 12 venture-backed IPOs raising $1.6 bil-lion and 270 acquisitions with disclosed deals totaling $14.1 billion. Only 12 venture-backed companies went public in 2009, double the six IPOs in 2008. These two years are the sec-ond-worst and worst years, respectively, going back at least to 1980. Similarly, the $1.6 billion raised through IPOsin 2009 is the second worst year (only to 2008) since 1990. While the valuation of the 2009 IPOs reached almost$15 billion, the overall pace remained a mere trickle. To put this in context, approximately 14% of the venture-backed companies first funded in the 1990s eventually went public. In recent years, more than 1,000 companiesannually are funded for the first time. That would suggest an annual IPO count of around 140. While times may havechanged and the anticipated percent is lower, it is a far cry from current levels. While we have provided the traditional analytical charts and summaries in this chapter, the reader is reminded that 2009results are based on this very small sample of 12 IPOs. At year end 2009, there were only 23 companies in registration.The number of venture-backed companies acquired during 2009 (270) declined from 2008 (349), which itselfdeclined from 2007 (379). While there were a few strong acquisitions raising the average purchase price to $152.9million, the overall quality of deals deteriorated, with 38% of the known acquisitions occurring at a price less thanthe total venture investment in that company.In 2009, IPO and acquisition activity were both far below what is necessary to sustain the industry long term.
Thomson Reuters 49
0
50
100
150
200
250
300
'80 '81 '82 '83 '84 '85 '86 '87 '88 '89 '90 '91 '92 '93 '94 '95 '96 '97 '98 '99 '00 '01 '02 '03 '04 '05 '06 '07 '08 '09
Year
0.00
5.00
10.00
15.00
20.00
25.00
30.00
No of IPOs
Offer Amount ($B)
Figure 5.01 Venture-Backed IPOs
No.
ofIP
Os
Offe
r($
Bill
ion)
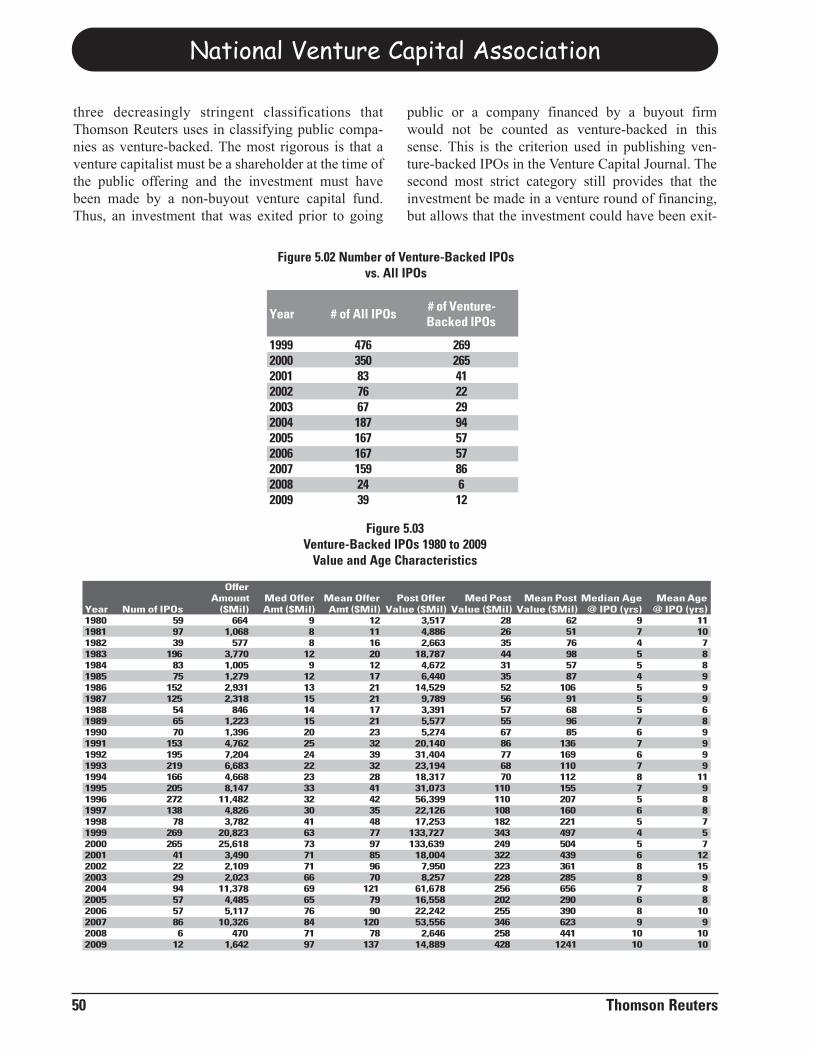
three decreasingly stringent classifications thatThomson Reuters uses in classifying public compa-nies as venture-backed. The most rigorous is that aventure capitalist must be a shareholder at the time ofthe public offering and the investment must havebeen made by a non-buyout venture capital fund.Thus, an investment that was exited prior to going
public or a company financed by a buyout firmwould not be counted as venture-backed in thissense. This is the criterion used in publishing ven-ture-backed IPOs in the Venture Capital Journal. Thesecond most strict category still provides that theinvestment be made in a venture round of financing,but allows that the investment could have been exit-
National Venture Capital Association
50 Thomson Reuters
Year1980 59 664 9 12 3,517 28 62 9 111981 97 1,068 8 11 4,886 26 51 7 101982 39 577 8 16 2,663 35 76 4 71983 196 3,770 12 20 18,787 44 98 5 81984 83 1,005 9 12 4,672 31 57 5 81985 75 1,279 12 17 6,440 35 87 4 91986 152 2,931 13 21 14,529 52 106 5 91987 125 2,318 15 21 9,789 56 91 5 91988 54 846 14 17 3,391 57 68 5 61989 65 1,223 15 21 5,577 55 96 7 81990 70 1,396 20 23 5,274 67 85 6 91991 153 4,762 25 32 20,140 86 136 7 91992 195 7,204 24 39 31,404 77 169 6 91993 219 6,683 22 32 23,194 68 110 7 91994 166 4,668 23 28 18,317 70 112 8 111995 205 8,147 33 41 31,073 110 155 7 91996 272 11,482 32 42 56,399 110 207 5 81997 138 4,826 30 35 22,126 108 160 6 81998 78 3,782 41 48 17,253 182 221 5 71999 269 20,823 63 77 133,727 343 497 4 52000 265 25,618 73 97 133,639 249 504 5 72001 41 3,490 71 85 18,004 322 439 6 122002 22 2,109 71 96 7,950 223 361 8 152003 29 2,023 66 70 8,257 228 285 8 92004 94 11,378 69 121 61,678 256 656 7 82005 57 4,485 65 79 16,558 202 290 6 82006 57 5,117 76 90 22,242 255 390 8 102007 86 10,326 84 120 53,556 346 623 9 92008 6 470 71 78 2,646 258 441 10 102009 12 1,642 97 137 14,889 428 1241 10 10
Mean Age@ IPO (yrs)Num of IPOs
OfferAmount
($Mil)Med OfferAmt ($Mil)
Mean OfferAmt ($Mil)
Post OfferValue ($Mil)
Med PostValue ($Mil)
Mean PostValue ($Mil)
Median Age@ IPO (yrs)
Figure 5.03 Venture-Backed IPOs 1980 to 2009
Value and Age Characteristics
1999 476 2692000 350 2652001 83 412002 76 222003 67 292004 187 942005 167 572006 167 572007 159 862008 24 62009 39 12
# of Venture-Backed IPOs# of All IPOsYear
Figure 5.02 Number of Venture-Backed IPOsvs. All IPOs
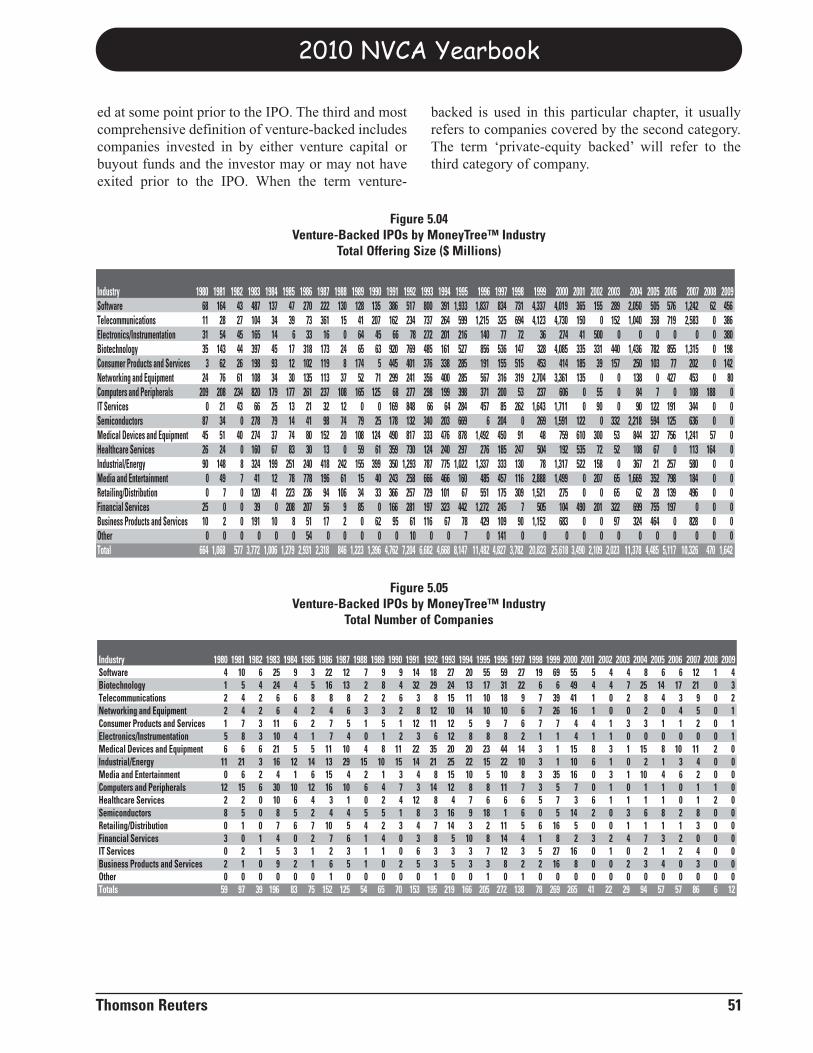
ed at some point prior to the IPO. The third and mostcomprehensive definition of venture-backed includescompanies invested in by either venture capital orbuyout funds and the investor may or may not haveexited prior to the IPO. When the term venture-
backed is used in this particular chapter, it usuallyrefers to companies covered by the second category.The term ‘private-equity backed’ will refer to thethird category of company.
2010 NVCA Yearbook
Thomson Reuters 51
Industry 1980 1981 1982 1983 1984 1985 1986 1987 1988 1989 1990 1991 1992 1993 1994 1995 1996 1997 1998 1999 2000 2001 2002 2003 2004 2005 2006 2007 2008 2009Software 68 164 43 487 137 47 270 222 130 128 135 386 517 800 391 1,933 1,837 834 731 4,337 4,019 365 155 289 2,050 505 576 1,242 62 456Telecommunications 11 28 27 104 34 39 73 361 15 41 207 162 234 737 264 599 1,215 325 694 4,123 4,730 150 0 152 1,040 358 719 2,583 0 386Electronics/Instrumentation 31 54 45 165 14 6 33 16 0 64 45 66 78 272 201 216 140 77 72 36 274 41 500 0 0 0 0 0 0 380Biotechnology 35 143 44 397 45 17 318 173 24 65 63 920 769 485 161 527 856 536 147 328 4,085 335 331 440 1,436 782 855 1,315 0 198Consumer Products and Services 3 62 26 198 93 12 102 119 8 174 5 445 401 376 338 285 191 155 515 453 414 185 39 157 250 103 77 202 0 142Networking and Equipment 24 76 61 108 34 30 135 113 37 52 71 299 241 356 400 285 567 316 319 2,704 3,361 135 0 0 138 0 427 453 0 80Computers and Peripherals 209 208 234 820 179 177 261 237 108 165 125 68 277 298 199 398 371 200 53 237 606 0 55 0 84 7 0 108 188 0IT Services 0 21 43 66 25 13 21 32 12 0 0 169 848 66 64 284 457 85 262 1,643 1,711 0 90 0 90 122 191 344 0 0Semiconductors 87 34 0 278 79 14 41 98 74 79 25 178 132 340 203 669 6 204 0 269 1,591 122 0 332 2,218 594 125 636 0 0Medical Devices and Equipment 45 51 40 274 37 74 80 152 20 108 124 490 817 333 476 878 1,492 450 91 48 759 610 300 53 844 327 756 1,241 57 0Healthcare Services 26 24 0 160 67 83 30 13 0 59 61 359 730 124 240 297 276 185 247 504 192 535 72 52 108 67 0 113 164 0Industrial/Energy 90 148 8 324 199 251 240 418 242 155 399 350 1,293 787 775 1,022 1,337 333 130 78 1,317 522 158 0 367 21 257 580 0 0Media and Entertainment 0 49 7 41 12 78 778 196 61 15 40 243 258 666 466 160 485 457 116 2,888 1,499 0 207 65 1,669 352 798 184 0 0Retailing/Distribution 0 7 0 120 41 223 236 94 106 34 33 366 257 729 101 67 551 175 309 1,521 275 0 0 65 62 28 139 496 0 0Financial Services 25 0 0 39 0 208 207 56 9 85 0 166 281 197 323 442 1,272 245 7 505 104 490 201 322 699 755 197 0 0 0Business Products and Services 10 2 0 191 10 8 51 17 2 0 62 95 61 116 67 78 429 109 90 1,152 683 0 0 97 324 464 0 828 0 0Other 0 0 0 0 0 0 54 0 0 0 0 0 10 0 0 7 0 141 0 0 0 0 0 0 0 0 0 0 0 0Total 664 1,068 577 3,772 1,006 1,279 2,931 2,318 846 1,223 1,396 4,762 7,204 6,682 4,668 8,147 11,482 4,827 3,782 20,823 25,618 3,490 2,109 2,023 11,378 4,485 5,117 10,326 470 1,642
Figure 5.04 Venture-Backed IPOs by MoneyTree™ Industry
Total Offering Size ($ Millions)
Industry 1980 1981 1982 1983 1984 1985 1986 1987 1988 1989 1990 1991 1992 1993 1994 1995 1996 1997 1998 1999 2000 2001 2002 2003 2004 2005 2006 2007 2008 2009Software 4 10 6 25 9 3 22 12 7 9 9 14 18 27 20 55 59 27 19 69 55 5 4 4 8 6 6 12 1 4Biotechnology 1 5 4 24 4 5 16 13 2 8 4 32 29 24 13 17 31 22 6 6 49 4 4 7 25 14 17 21 0 3Telecommunications 2 4 2 6 6 8 8 8 2 2 6 3 8 15 11 10 18 9 7 39 41 1 0 2 8 4 3 9 0 2Networking and Equipment 2 4 2 6 4 2 4 6 3 3 2 8 12 10 14 10 10 6 7 26 16 1 0 0 2 0 4 5 0 1Consumer Products and Services 1 7 3 11 6 2 7 5 1 5 1 12 11 12 5 9 7 6 7 7 4 4 1 3 3 1 1 2 0 1Electronics/Instrumentation 5 8 3 10 4 1 7 4 0 1 2 3 6 12 8 8 8 2 1 1 4 1 1 0 0 0 0 0 0 1Medical Devices and Equipment 6 6 6 21 5 5 11 10 4 8 11 22 35 20 20 23 44 14 3 1 15 8 3 1 15 8 10 11 2 0Industrial/Energy 11 21 3 16 12 14 13 29 15 10 15 14 21 25 22 15 22 10 3 1 10 6 1 0 2 1 3 4 0 0Media and Entertainment 0 6 2 4 1 6 15 4 2 1 3 4 8 15 10 5 10 8 3 35 16 0 3 1 10 4 6 2 0 0Computers and Peripherals 12 15 6 30 10 12 16 10 6 4 7 3 14 12 8 8 11 7 3 5 7 0 1 0 1 1 0 1 1 0Healthcare Services 2 2 0 10 6 4 3 1 0 2 4 12 8 4 7 6 6 6 5 7 3 6 1 1 1 1 0 1 2 0Semiconductors 8 5 0 8 5 2 4 4 5 5 1 8 3 16 9 18 1 6 0 5 14 2 0 3 6 8 2 8 0 0Retailing/Distribution 0 1 0 7 6 7 10 5 4 2 3 4 7 14 3 2 11 5 6 16 5 0 0 1 1 1 1 3 0 0Financial Services 3 0 1 4 0 2 7 6 1 4 0 3 8 5 10 8 14 4 1 8 2 3 2 4 7 3 2 0 0 0IT Services 0 2 1 5 3 1 2 3 1 1 0 6 3 3 3 7 12 3 5 27 16 0 1 0 2 1 2 4 0 0Business Products and Services 2 1 0 9 2 1 6 5 1 0 2 5 3 5 3 3 8 2 2 16 8 0 0 2 3 4 0 3 0 0Other 0 0 0 0 0 0 1 0 0 0 0 0 1 0 0 1 0 1 0 0 0 0 0 0 0 0 0 0 0 0Totals 59 97 39 196 83 75 152 125 54 65 70 153 195 219 166 205 272 138 78 269 265 41 22 29 94 57 57 86 6 12
Figure 5.05 Venture-Backed IPOs by MoneyTree™ Industry
Total Number of Companies
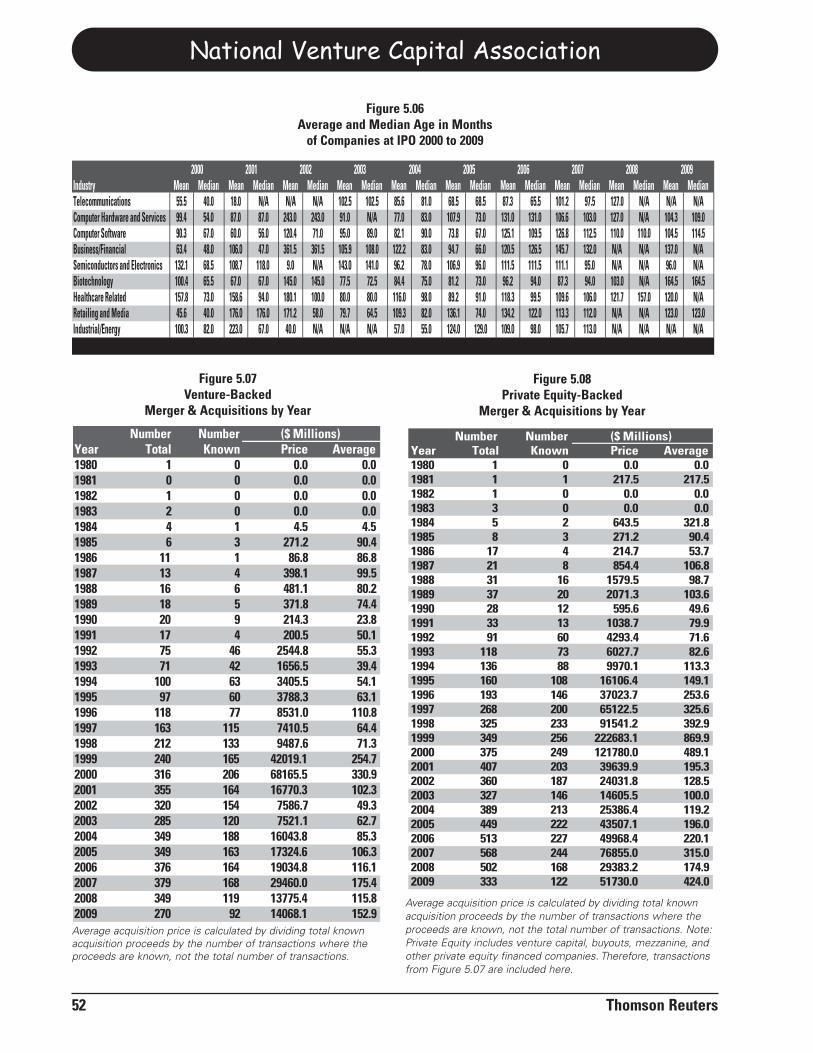
National Venture Capital Association
52 Thomson Reuters
Number Number ($ Millions)Year Total Known Price Average1980 1 0 0.0 0.01981 1 1 217.5 217.51982 1 0 0.0 0.01983 3 0 0.0 0.01984 5 2 643.5 321.81985 8 3 271.2 90.41986 17 4 214.7 53.71987 21 8 854.4 106.81988 31 16 1579.5 98.71989 37 20 2071.3 103.61990 28 12 595.6 49.61991 33 13 1038.7 79.91992 91 60 4293.4 71.61993 118 73 6027.7 82.61994 136 88 9970.1 113.31995 160 108 16106.4 149.11996 193 146 37023.7 253.61997 268 200 65122.5 325.61998 325 233 91541.2 392.91999 349 256 222683.1 869.92000 375 249 121780.0 489.12001 407 203 39639.9 195.32002 360 187 24031.8 128.52003 327 146 14605.5 100.02004 389 213 25386.4 119.22005 449 222 43507.1 196.02006 513 227 49968.4 220.12007 568 244 76855.0 315.02008 502 168 29383.2 174.92009 333 122 51730.0 424.0
Figure 5.08Private Equity-Backed
Merger & Acquisitions by Year
Number Number ($ Millions)Year Total Known Price Average1980 1 0 0.0 0.01981 0 0 0.0 0.01982 1 0 0.0 0.01983 2 0 0.0 0.01984 4 1 4.5 4.51985 6 3 271.2 90.41986 11 1 86.8 86.81987 13 4 398.1 99.51988 16 6 481.1 80.21989 18 5 371.8 74.41990 20 9 214.3 23.81991 17 4 200.5 50.11992 75 46 2544.8 55.31993 71 42 1656.5 39.41994 100 63 3405.5 54.11995 97 60 3788.3 63.11996 118 77 8531.0 110.81997 163 115 7410.5 64.41998 212 133 9487.6 71.31999 240 165 42019.1 254.72000 316 206 68165.5 330.92001 355 164 16770.3 102.32002 320 154 7586.7 49.32003 285 120 7521.1 62.72004 349 188 16043.8 85.32005 349 163 17324.6 106.32006 376 164 19034.8 116.12007 379 168 29460.0 175.42008 349 119 13775.4 115.82009 270 92 14068.1 152.9
Figure 5.07Venture-Backed
Merger & Acquisitions by Year
Average acquisition price is calculated by dividing total knownacquisition proceeds by the number of transactions where theproceeds are known, not the total number of transactions. Note:Private Equity includes venture capital, buyouts, mezzanine, andother private equity financed companies. Therefore, transactionsfrom Figure 5.07 are included here.
Average acquisition price is calculated by dividing total knownacquisition proceeds by the number of transactions where theproceeds are known, not the total number of transactions.
Industry Mean Median Mean Median Mean Median Mean Median Mean Median Mean Median Mean Median Mean Median Mean Median Mean MedianTelecommunications 55.5 40.0 18.0 N/A N/A N/A 102.5 102.5 85.6 81.0 68.5 68.5 87.3 65.5 101.2 97.5 127.0 N/A N/A N/AComputer Hardware and Services 99.4 54.0 87.0 87.0 243.0 243.0 91.0 N/A 77.0 83.0 107.9 73.0 131.0 131.0 106.6 103.0 127.0 N/A 104.3 109.0Computer Software 90.3 67.0 60.0 56.0 120.4 71.0 95.0 89.0 82.1 90.0 73.8 67.0 125.1 109.5 126.8 112.5 110.0 110.0 104.5 114.5Business/Financial 63.4 48.0 106.0 47.0 361.5 361.5 105.9 108.0 122.2 83.0 94.7 66.0 120.5 126.5 145.7 132.0 N/A N/A 137.0 N/ASemiconductors and Electronics 132.1 68.5 108.7 118.0 9.0 N/A 143.0 141.0 96.2 78.0 106.9 96.0 111.5 111.5 111.1 95.0 N/A N/A 96.0 N/ABiotechnology 100.4 65.5 67.0 67.0 145.0 145.0 77.5 72.5 84.4 75.0 81.2 73.0 96.2 94.0 87.3 94.0 103.0 N/A 164.5 164.5Healthcare Related 157.8 73.0 158.6 94.0 180.1 100.0 80.0 80.0 116.0 98.0 89.2 91.0 118.3 99.5 109.6 106.0 121.7 157.0 120.0 N/ARetailing and Media 45.6 40.0 176.0 176.0 171.2 58.0 79.7 64.5 109.3 82.0 136.1 74.0 134.2 122.0 113.3 112.0 N/A N/A 123.0 123.0Industrial/Energy 100.3 82.0 223.0 67.0 40.0 N/A N/A N/A 57.0 55.0 124.0 129.0 109.0 98.0 105.7 113.0 N/A N/A N/A N/A
200920082007200620052000 20042001 2002 2003
Figure 5.06 Average and Median Age in Months
of Companies at IPO 2000 to 2009
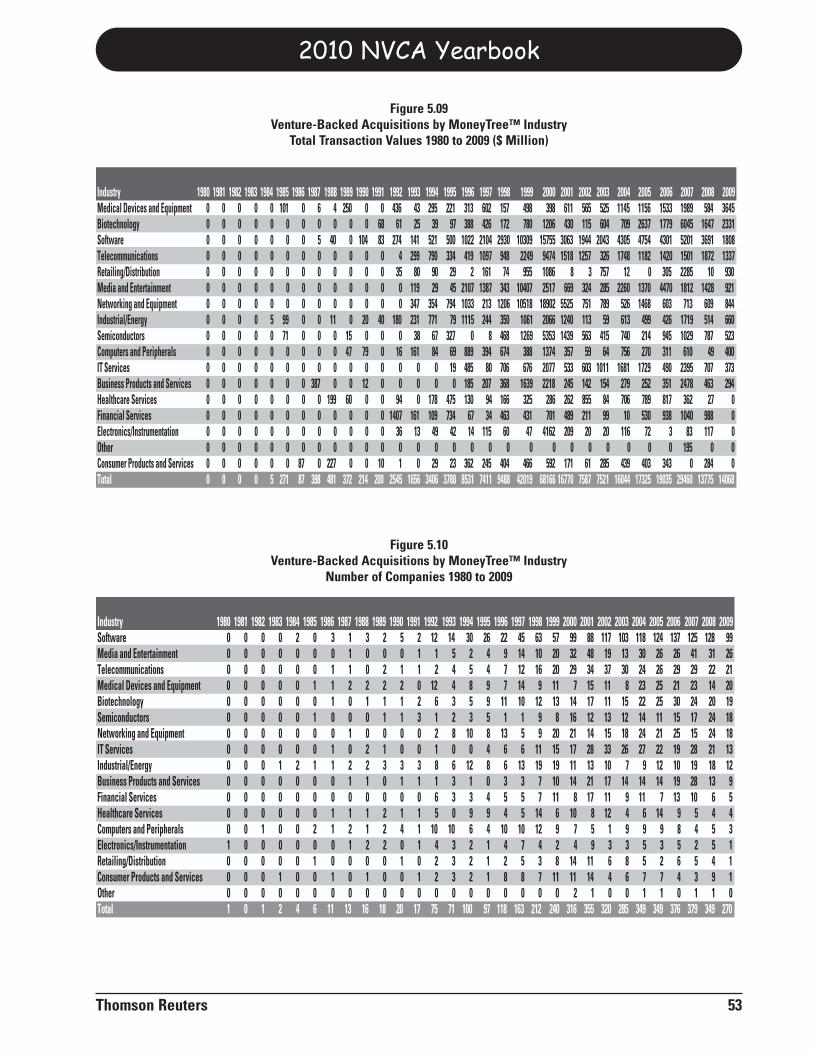
2010 NVCA Yearbook
Thomson Reuters 53
Industry 1980 1981 1982 1983 1984 1985 1986 1987 1988 1989 1990 1991 1992 1993 1994 1995 1996 1997 1998 1999 2000 2001 2002 2003 2004 2005 2006 2007 2008 2009Medical Devices and Equipment 0 0 0 0 0 101 0 6 4 250 0 0 436 43 295 221 313 602 157 498 398 611 565 525 1145 1156 1533 1989 584 3645Biotechnology 0 0 0 0 0 0 0 0 0 0 0 68 61 25 39 97 388 426 172 780 1206 430 115 604 709 2637 1779 6045 1647 2331Software 0 0 0 0 0 0 0 5 40 0 104 83 274 141 521 500 1022 2104 2930 10309 15755 3063 1944 2043 4305 4754 4301 5201 3691 1808Telecommunications 0 0 0 0 0 0 0 0 0 0 0 0 4 299 790 334 419 1097 948 2249 9474 1518 1257 326 1748 1182 1420 1501 1872 1337Retailing/Distribution 0 0 0 0 0 0 0 0 0 0 0 0 35 80 90 29 2 161 74 955 1086 8 3 757 12 0 305 2285 10 930Media and Entertainment 0 0 0 0 0 0 0 0 0 0 0 0 0 119 29 45 2107 1387 343 10407 2517 669 324 285 2260 1370 4470 1812 1428 921Networking and Equipment 0 0 0 0 0 0 0 0 0 0 0 0 0 347 354 794 1033 213 1206 10518 18902 5525 751 789 526 1468 603 713 609 844Industrial/Energy 0 0 0 0 5 99 0 0 11 0 20 40 180 231 771 79 1115 244 350 1061 2066 1240 113 59 613 499 426 1719 514 660Semiconductors 0 0 0 0 0 71 0 0 0 15 0 0 0 38 67 327 0 8 468 1269 5353 1439 563 415 740 214 945 1029 787 523Computers and Peripherals 0 0 0 0 0 0 0 0 0 47 79 0 16 161 84 69 889 394 674 388 1374 357 59 64 756 270 311 610 49 400IT Services 0 0 0 0 0 0 0 0 0 0 0 0 0 0 0 19 485 80 706 676 2077 533 603 1011 1681 1729 490 2395 707 373Business Products and Services 0 0 0 0 0 0 0 387 0 0 12 0 0 0 0 0 185 207 368 1639 2218 245 142 154 279 252 351 2478 463 294Healthcare Services 0 0 0 0 0 0 0 0 199 60 0 0 94 0 178 475 130 94 166 325 286 262 855 84 706 789 817 362 27 0Financial Services 0 0 0 0 0 0 0 0 0 0 0 0 1407 161 109 734 67 34 463 431 701 489 211 99 10 530 938 1040 988 0Electronics/Instrumentation 0 0 0 0 0 0 0 0 0 0 0 0 36 13 49 42 14 115 60 47 4162 209 20 20 116 72 3 83 117 0Other 0 0 0 0 0 0 0 0 0 0 0 0 0 0 0 0 0 0 0 0 0 0 0 0 0 0 0 195 0 0Consumer Products and Services 0 0 0 0 0 0 87 0 227 0 0 10 1 0 29 23 362 245 404 466 592 171 61 285 439 403 343 0 284 0Total 0 0 0 0 5 271 87 398 481 372 214 200 2545 1656 3406 3788 8531 7411 9488 42019 68166 16770 7587 7521 16044 17325 19035 29460 13775 14068
Figure 5.09 Venture-Backed Acquisitions by MoneyTree™ Industry
Total Transaction Values 1980 to 2009 ($ Million)
Industry 1980 1981 1982 1983 1984 1985 1986 1987 1988 1989 1990 1991 1992 1993 1994 1995 1996 1997 1998 1999 2000 2001 2002 2003 2004 2005 2006 2007 2008 2009Software 0 0 0 0 2 0 3 1 3 2 5 2 12 14 30 26 22 45 63 57 99 88 117 103 118 124 137 125 128 99Media and Entertainment 0 0 0 0 0 0 0 1 0 0 0 1 1 5 2 4 9 14 10 20 32 48 19 13 30 26 26 41 31 26Telecommunications 0 0 0 0 0 0 1 1 0 2 1 1 2 4 5 4 7 12 16 20 29 34 37 30 24 26 29 29 22 21Medical Devices and Equipment 0 0 0 0 0 1 1 2 2 2 2 0 12 4 8 9 7 14 9 11 7 15 11 8 23 25 21 23 14 20Biotechnology 0 0 0 0 0 0 1 0 1 1 1 2 6 3 5 9 11 10 12 13 14 17 11 15 22 25 30 24 20 19Semiconductors 0 0 0 0 0 1 0 0 0 1 1 3 1 2 3 5 1 1 9 8 16 12 13 12 14 11 15 17 24 18Networking and Equipment 0 0 0 0 0 0 0 1 0 0 0 0 2 8 10 8 13 5 9 20 21 14 15 18 24 21 25 15 24 18IT Services 0 0 0 0 0 0 1 0 2 1 0 0 1 0 0 4 6 6 11 15 17 28 33 26 27 22 19 28 21 13Industrial/Energy 0 0 0 1 2 1 1 2 2 3 3 3 8 6 12 8 6 13 19 19 11 13 10 7 9 12 10 19 18 12Business Products and Services 0 0 0 0 0 0 0 1 1 0 1 1 1 3 1 0 3 3 7 10 14 21 17 14 14 14 19 28 13 9Financial Services 0 0 0 0 0 0 0 0 0 0 0 0 6 3 3 4 5 5 7 11 8 17 11 9 11 7 13 10 6 5Healthcare Services 0 0 0 0 0 0 1 1 1 2 1 1 5 0 9 9 4 5 14 6 10 8 12 4 6 14 9 5 4 4Computers and Peripherals 0 0 1 0 0 2 1 2 1 2 4 1 10 10 6 4 10 10 12 9 7 5 1 9 9 9 8 4 5 3Electronics/Instrumentation 1 0 0 0 0 0 0 1 2 2 0 1 4 3 2 1 4 7 4 2 4 9 3 3 5 3 5 2 5 1Retailing/Distribution 0 0 0 0 0 1 0 0 0 0 1 0 2 3 2 1 2 5 3 8 14 11 6 8 5 2 6 5 4 1Consumer Products and Services 0 0 0 1 0 0 1 0 1 0 0 1 2 3 2 1 8 8 7 11 11 14 4 6 7 7 4 3 9 1Other 0 0 0 0 0 0 0 0 0 0 0 0 0 0 0 0 0 0 0 0 2 1 0 0 1 1 0 1 1 0Total 1 0 1 2 4 6 11 13 16 18 20 17 75 71 100 97 118 163 212 240 316 355 320 285 349 349 376 379 349 270
Figure 5.10 Venture-Backed Acquisitions by MoneyTree™ Industry
Number of Companies 1980 to 2009
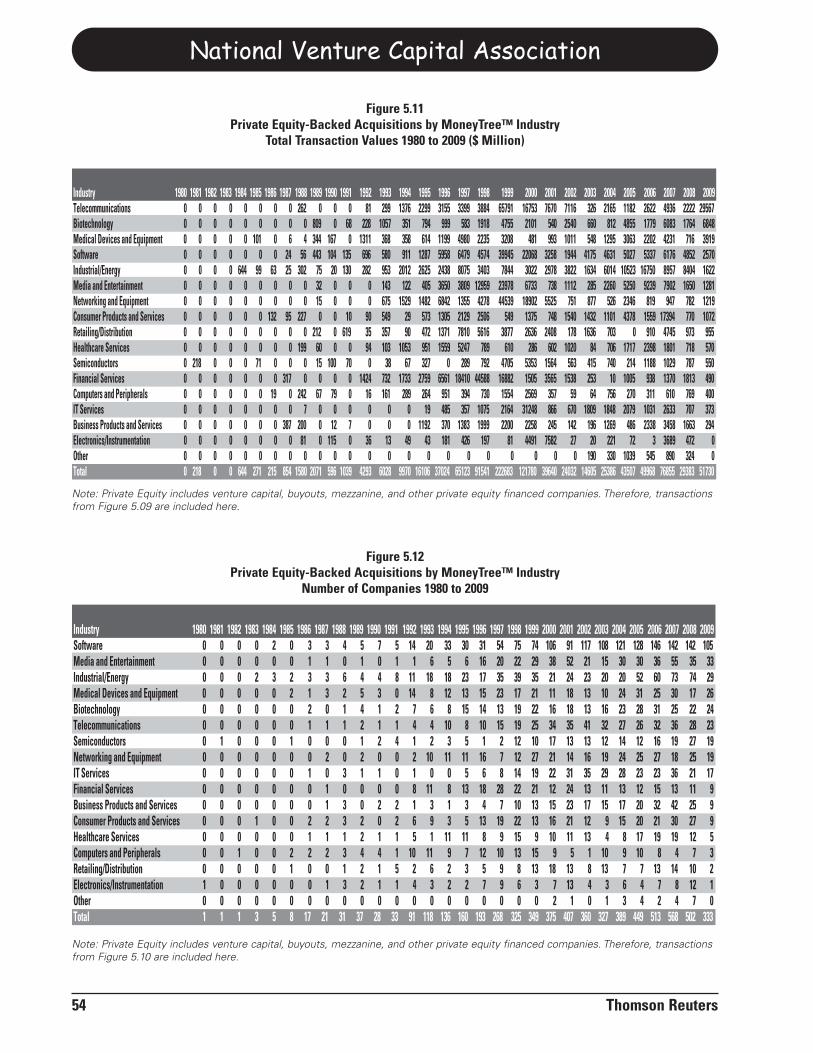
National Venture Capital Association
54 Thomson Reuters
Industry 1980 1981 1982 1983 1984 1985 1986 1987 1988 1989 1990 1991 1992 1993 1994 1995 1996 1997 1998 1999 2000 2001 2002 2003 2004 2005 2006 2007 2008 2009Software 0 0 0 0 2 0 3 3 4 5 7 5 14 20 33 30 31 54 75 74 106 91 117 108 121 128 146 142 142 105Media and Entertainment 0 0 0 0 0 0 1 1 0 1 0 1 1 6 5 6 16 20 22 29 38 52 21 15 30 30 36 55 35 33Industrial/Energy 0 0 0 2 3 2 3 3 6 4 4 8 11 18 18 23 17 35 39 35 21 24 23 20 20 52 60 73 74 29Medical Devices and Equipment 0 0 0 0 0 2 1 3 2 5 3 0 14 8 12 13 15 23 17 21 11 18 13 10 24 31 25 30 17 26Biotechnology 0 0 0 0 0 0 2 0 1 4 1 2 7 6 8 15 14 13 19 22 16 18 13 16 23 28 31 25 22 24Telecommunications 0 0 0 0 0 0 1 1 1 2 1 1 4 4 10 8 10 15 19 25 34 35 41 32 27 26 32 36 28 23Semiconductors 0 1 0 0 0 1 0 0 0 1 2 4 1 2 3 5 1 2 12 10 17 13 13 12 14 12 16 19 27 19Networking and Equipment 0 0 0 0 0 0 0 2 0 2 0 0 2 10 11 11 16 7 12 27 21 14 16 19 24 25 27 18 25 19IT Services 0 0 0 0 0 0 1 0 3 1 1 0 1 0 0 5 6 8 14 19 22 31 35 29 28 23 23 36 21 17Financial Services 0 0 0 0 0 0 0 1 0 0 0 0 8 11 8 13 18 28 22 21 12 24 13 11 13 12 15 13 11 9Business Products and Services 0 0 0 0 0 0 0 1 3 0 2 2 1 3 1 3 4 7 10 13 15 23 17 15 17 20 32 42 25 9Consumer Products and Services 0 0 0 1 0 0 2 2 3 2 0 2 6 9 3 5 13 19 22 13 16 21 12 9 15 20 21 30 27 9Healthcare Services 0 0 0 0 0 0 1 1 1 2 1 1 5 1 11 11 8 9 15 9 10 11 13 4 8 17 19 19 12 5Computers and Peripherals 0 0 1 0 0 2 2 2 3 4 4 1 10 11 9 7 12 10 13 15 9 5 1 10 9 10 8 4 7 3Retailing/Distribution 0 0 0 0 0 1 0 0 1 2 1 5 2 6 2 3 5 9 8 13 18 13 8 13 7 7 13 14 10 2Electronics/Instrumentation 1 0 0 0 0 0 0 1 3 2 1 1 4 3 2 2 7 9 6 3 7 13 4 3 6 4 7 8 12 1Other 0 0 0 0 0 0 0 0 0 0 0 0 0 0 0 0 0 0 0 0 2 1 0 1 3 4 2 4 7 0Total 1 1 1 3 5 8 17 21 31 37 28 33 91 118 136 160 193 268 325 349 375 407 360 327 389 449 513 568 502 333
Figure 5.12 Private Equity-Backed Acquisitions by MoneyTree™ Industry
Number of Companies 1980 to 2009
Note: Private Equity includes venture capital, buyouts, mezzanine, and other private equity financed companies. Therefore, transactionsfrom Figure 5.10 are included here.
Note: Private Equity includes venture capital, buyouts, mezzanine, and other private equity financed companies. Therefore, transactionsfrom Figure 5.09 are included here.
Industry 1980 1981 1982 1983 1984 1985 1986 1987 1988 1989 1990 1991 1992 1993 1994 1995 1996 1997 1998 1999 2000 2001 2002 2003 2004 2005 2006 2007 2008 2009Telecommunications 0 0 0 0 0 0 0 0 262 0 0 0 81 299 1376 2299 3155 3399 3884 65791 16753 7670 7116 326 2165 1182 2622 4936 2222 29567Biotechnology 0 0 0 0 0 0 0 0 0 809 0 68 228 1057 351 794 999 583 1918 4755 2101 540 2540 660 812 4855 1779 6083 1764 6848Medical Devices and Equipment 0 0 0 0 0 101 0 6 4 344 167 0 1311 368 358 614 1199 4980 2235 3208 481 993 1011 548 1295 3063 2202 4231 716 3919Software 0 0 0 0 0 0 0 24 56 443 104 135 696 580 911 1287 5958 6479 4574 39945 22068 3258 1944 4175 4631 5027 5337 6176 4852 2570Industrial/Energy 0 0 0 0 644 99 63 25 302 75 20 130 282 953 2012 2625 2438 8075 3403 7844 3022 2978 3822 1634 6014 10523 16750 8957 8404 1622Media and Entertainment 0 0 0 0 0 0 0 0 0 32 0 0 0 143 122 405 3650 3809 12959 23978 6733 738 1112 285 2260 5250 9239 7902 1650 1281Networking and Equipment 0 0 0 0 0 0 0 0 0 15 0 0 0 675 1529 1482 6842 1355 4278 44539 18902 5525 751 877 526 2346 819 947 782 1219Consumer Products and Services 0 0 0 0 0 0 132 95 227 0 0 10 90 549 29 573 1305 2129 2506 549 1375 748 1540 1432 1101 4378 1559 17394 770 1072Retailing/Distribution 0 0 0 0 0 0 0 0 0 212 0 619 35 357 90 472 1371 7810 5616 3877 2636 2408 178 1636 703 0 910 4745 973 955Healthcare Services 0 0 0 0 0 0 0 0 199 60 0 0 94 103 1053 951 1559 5247 789 610 286 602 1020 84 706 1717 2398 1801 718 570Semiconductors 0 218 0 0 0 71 0 0 0 15 100 70 0 38 67 327 0 289 792 4705 5353 1564 563 415 740 214 1188 1029 787 550Financial Services 0 0 0 0 0 0 0 317 0 0 0 0 1424 732 1733 2759 6561 18410 44588 16882 1505 3565 1538 253 10 1005 938 1370 1813 490Computers and Peripherals 0 0 0 0 0 0 19 0 242 67 79 0 16 161 289 264 951 394 730 1554 2569 357 59 64 756 270 311 610 769 400IT Services 0 0 0 0 0 0 0 0 7 0 0 0 0 0 0 19 485 357 1075 2164 31248 866 670 1809 1848 2079 1031 2633 707 373Business Products and Services 0 0 0 0 0 0 0 387 200 0 12 7 0 0 0 1192 370 1383 1999 2200 2258 245 142 196 1269 486 2338 3458 1663 294Electronics/Instrumentation 0 0 0 0 0 0 0 0 81 0 115 0 36 13 49 43 181 426 197 81 4491 7582 27 20 221 72 3 3689 472 0Other 0 0 0 0 0 0 0 0 0 0 0 0 0 0 0 0 0 0 0 0 0 0 0 190 330 1039 545 890 324 0Total 0 218 0 0 644 271 215 854 1580 2071 596 1039 4293 6028 9970 16106 37024 65123 91541 222683 121780 39640 24032 14605 25386 43507 49968 76855 29383 51730
Figure 5.11 Private Equity-Backed Acquisitions by MoneyTree™ Industry
Total Transaction Values 1980 to 2009 ($ Million)
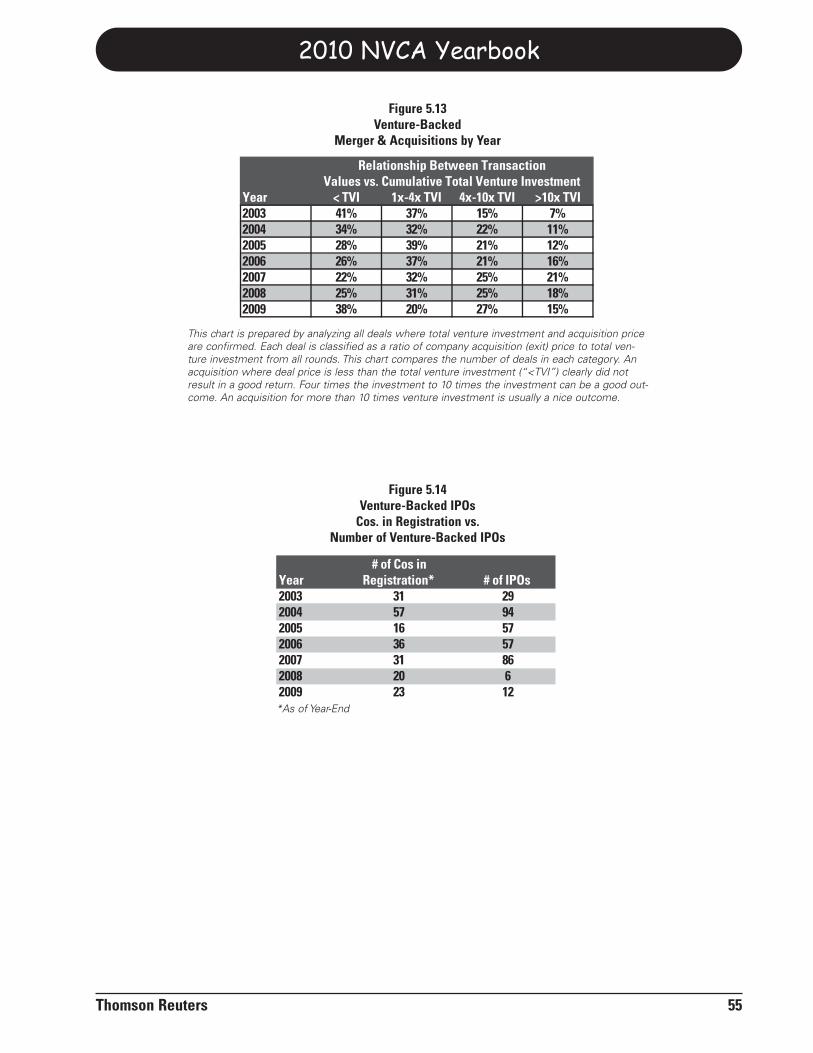
2010 NVCA Yearbook
Thomson Reuters 55
Year < TVI 1x-4x TVI 4x-10x TVI >10x TVI2003 41% 37% 15% 7%2004 34% 32% 22% 11%2005 28% 39% 21% 12%2006 26% 37% 21% 16%2007 22% 32% 25% 21%2008 25% 31% 25% 18%2009 38% 20% 27% 15%
Values vs. Cumulative Total Venture InvestmentRelationship Between Transaction
Figure 5.13Venture-Backed
Merger & Acquisitions by Year
This chart is prepared by analyzing all deals where total venture investment and acquisition priceare confirmed. Each deal is classified as a ratio of company acquisition (exit) price to total ven-ture investment from all rounds. This chart compares the number of deals in each category. Anacquisition where deal price is less than the total venture investment (“<TVI”) clearly did notresult in a good return. Four times the investment to 10 times the investment can be a good out-come. An acquisition for more than 10 times venture investment is usually a nice outcome.
Year2003 31 292004 57 942005 16 572006 36 572007 31 862008 20 62009 23 12
# of Cos inRegistration* # of IPOs
Figure 5.14Venture-Backed IPOs
Cos. in Registration vs.Number of Venture-Backed IPOs
*As of Year-End

National Venture Capital Association
56 Thomson Reuters
This page intentionally left blank.
Appendix A: Glossary
“A” round – a financing event whereby angelgroups and / or venture capitalists become involvedin a fast growth company that was previouslyfinanced by founders and their friends and families.
Accredited investor – a person or legal entity, suchas a company or trust fund, that meets certain networth and income qualifications and is considered tobe sufficiently sophisticated to make investmentdecisions in private offerings. Regulation D of theSecurities Act of 1933 exempts accredited investorsfrom protection of the Securities Act. The Securitiesand Exchange Commission has proposed revisions tothe accredited investor qualifying rules, which mayor may not result in changes for venture investors.The current criteria for a natural person are: $1 mil-lion net worth or annual income exceeding $200,000individually or $300,000 with a spouse. Directors,general partners and executive officers of the issuerare considered to be accredited investors.
Alternative asset class – a class of investments thatincludes venture capital, leverage buyouts, hedgefunds, real estate, and oil and gas, but excludes pub-licly traded securities. Pension plans, college endow-ments and other relatively large institutional investorstypically allocate a certain percentage of their invest-ments to alternative assets with an objective to diver-sify their portfolios.
Alpha – a term derived from statistics and financetheory that is used to describe the return produced bya fund manager in excess of the return of a bench-mark index. Manager returns and benchmark returnsare measured net of the risk-free rate. In addition,manager returns are adjusted for the risk of the man-ager’s portfolio relative to the risk of the benchmarkindex. Alpha is a proxy for manager skill.
Angel – a wealthy individual that invests in compa-nies in relatively early stages of development.Usually angels invest less than $1 million per startup.
Anti-dilution – a contract clause that protects aninvestor from a substantial reduction in percentageownership in a company due to the issuance by the
company of additional shares to other entities. Themechanism for making an adjustment that maintainsthe same percentage ownership is called a FullRatchet. The most commonly used adjustment pro-vides partial protection and is called WeightedAverage.
“B” round – a financing event whereby investorssuch as venture capitalists and organized angelgroups are sufficiently interested in a company toprovide additional funds after the “A” round offinancing. Subsequent rounds are called “C”, “D”and so on.
Basis point (“bp”) – one one-hundredth (1/100) of apercentage unit. For example, 50 basis points equalsone half of one percent. Banks quote variable loanrates in terms of an index plus a margin and the mar-gin is often described in basis points, such as LIBORplus 400 basis points (or, as the experts say, “beeps”).
Beta – a measure of volatility of a public stock rela-tive to an index or a composite of all stocks in a mar-ket or geographical region. A beta of more than oneindicates the stock has higher volatility than theindex (or composite) and a beta of one indicatesvolatility equivalent to the index (or composite). Forexample, the price of a stock with a beta of 1.5 willchange by 1.5% if the index value changes by 1%.Typically, the S&P500 index is used in calculatingthe beta of a stock.
Beta product – a product that is being tested bypotential customers prior to being formally launchedinto the marketplace.
Board of directors – a group of individuals, typical-ly composed of managers, investors and experts whohave a fiduciary responsibility for the well being andproper guidance of a corporation. The board is elect-ed by the shareholders.
Book – see Private placement memorandum.
Bootstrapping – the actions of a startup to minimizeexpenses and build cash flow, thereby reducing or
Thomson Reuters 57
eliminating the need for outside investors.
Bp – see Basis point.
Bridge financing – temporary funding that will even-tually be replaced by permanent capital from equityinvestors or debt lenders. In venture capital, a bridge isusually a short term note (6 to 12 months) that convertsto preferred stock. Typically, the bridge lender has theright to convert the note to preferred stock at a pricethat is a 20% to 25% discount from the price of the pre-ferred stock in the next financing round. SeeMezzanine and Wipeout bridge.
Broad-based weighted average anti-dilution - Aweighted average anti-dilution method adjusts down-ward the price per share of the preferred stock ofinvestor A due to the issuance of new preferredshares to new investor B at a price lower than theprice investor A originally received. Investor A’s pre-ferred stock is repriced to a weighted average ofinvestor A’s price and investor B’s price. A broad-based anti-dilution method uses all common stockoutstanding on a fully diluted basis (including allconvertible securities, warrants and options) in thedenominator of the formula for determining the newweighted average price. See Narrow-based weight-ed average anti-dilution .
Burn rate – the rate at which a startup with little orno revenue uses available cash to cover expenses.Usually expressed on a monthly or weekly basis.
Business Development Company (BDC) – a pub-licly traded company that invests in private compa-nies and is required by law to provide meaningfulsupport and assistance to its portfolio companies.
Business plan – a document that describes a newconcept for a business opportunity. A business plantypically includes the following sections: executivesummary, market need, solution, technology, compe-tition, marketing, management, operations, exit strat-egy, and financials (including cash flow projections).For most venture capital funds fewer than 10 ofevery 100 business plans received eventually receivefunding.
Buyout – a sector of the private equity industry.Also, the purchase of a controlling interest of a com-
pany by an outside investor (in a leveraged buyout)or a management team (in a management buyout).
Buy-sell agreement – a contract that sets forth theconditions under which a shareholder must first offerhis or her shares for sale to the other shareholdersbefore being allowed to sell to entities outside thecompany.
C Corporation – an ownership structure that allowsany number of individuals or companies to ownshares. A C corporation is a stand-alone legal entityso it offers some protection to its owners, managersand investors from liability resulting from its actions.
Capital Asset Pricing Model (CAPM) – a methodof estimating the cost of equity capital of a company.The cost of equity capital is equal to the return of arisk-free investment plus a premium that reflects therisk of the company’s equity.
Capital call – when a private equity fund manager(usually a “general partner” in a partnership) requeststhat an investor in the fund (a “limited partner”) pro-vide additional capital. Usually a limited partner willagree to a maximum investment amount and the gener-al partner will make a series of capital calls over timeto the limited partner as opportunities arise to financestartups and buyouts.
Capital gap - the difficulty faced by some entrepre-neurs in trying to raise between $2 million and $5million. Friends, family and angel investors are typi-cally good sources for financing rounds of less than$2 million, while many venture capital funds havebecome so large that investments in this size rangeare difficult.
Capitalization table – a table showing the owners ofa company’s shares and their ownership percentagesas well as the debt holders. It also lists the forms ofownership, such as common stock, preferred stock,warrants, options, senior debt, and subordinated debt.
Capital gains – a tax classification of investmentearnings resulting from the purchase and sale ofassets. Typically, a company’s investors and foundershave earnings classified as long term capital gains(held for a year or longer), which are taxed at a lowerrate than ordinary income.
National Venture Capital Association
58 Thomson Reuters
Capital stock – a description of stock that applieswhen there is only one class of shares. This class isknown as “common stock”.
Capped participating preferred stock – preferredstock whose participating feature is limited so that aninvestor cannot receive more than a specifiedamount. See Participating preferred stock.
Carried interest — the share in the capital gains ofa venture capital fund which is allocated to theGeneral Partner. Typically, a fund must return thecapital given to it by limited partners plus any pref-erential rate of return before the general partner canshare in the profits of the fund. The general partnerwill typically receive a 20% carried interest, althoughsome successful firms receive 25%-30%. Alsoknown as “carry” or “promote.”
Clawback – a clause in the agreement between thegeneral partner and the limited partners of a privateequity fund. The clawback gives limited partners theright to reclaim a portion of disbursements to a gen-eral partner for profitable investments based on sig-nificant losses from later investments in a portfolio.
Closing – the conclusion of a financing round where-by all necessary legal documents are signed and cap-ital has been transferred.
Club deal – the act of investing by two or more enti-ties in the same target company, usually involving aleveraged buyout transaction.
Co-investment –the direct investment by a limitedpartner alongside a general partner in a portfoliocompany.
Collateral – hard assets of the borrower, such as realestate or equipment, for which a lender has a legalinterest until a loan obligation is fully paid off.
Commitment – an obligation, typically the maxi-mum amount that a limited partner agrees to invest ina fund. See Capital call.
Common stock – a type of security representing own-ership rights in a company. Usually, company founders,management and employees own common stock whileinvestors own preferred stock. In the event of a liquida-
tion of the company, the claims of secured and unse-cured creditors, bondholders and preferred stockholderstake precedence over common stockholders. SeePreferred stock.
Comparable – a publicly traded company with sim-ilar characteristics to a private company that is beingvalued. For example, a telecommunications equip-ment manufacturer whose market value is 2 timesrevenues can be used to estimate the value of a simi-lar and relatively new company with a new productin the same industry. See Liquidity discount.
Control – the authority of an individual or entity thatowns more than 50% of equity in a company or ownsthe largest block of shares compared to other share-holders.
Consolidation – see Rollup.
Conversion – the right of an investor or lender toforce a company to replace the investor’s preferredshares or the lender’s debt with common shares at apreset conversion ratio. A conversion feature wasfirst used in railroad bonds in the 1800’s.
Convertible debt – a loan which allows the lender toexchange the debt for common shares in a companyat a preset conversion ratio. Also known as a “con-vertible note.”
Convertible preferred stock – a type of stock thatgives an owner the right to convert to common sharesof stock. Usually, preferred stock has certain rightsthat common stock doesn’t have, such as decision-making management control, a promised return oninvestment (dividend), or senior priority in receivingproceeds from a sale or liquidation of the company.Typically, convertible preferred stock automaticallyconverts to common stock if the company makes aninitial public offering (IPO). Convertible preferred isthe most common tool for private equity funds toinvest in companies.
Co-sale right – a contractual right of an investor tosell some of the investor’s stock along with thefounder’s or majority shareholder’s stock if either thefounder or majority shareholder elects to sell stock toa third-party. Also known as Tag-along right.
2010 NVCA Yearbook
Thomson Reuters 59
Cost of capital – see Weighted average cost of cap-ital.
Cost of revenue – the expenses generated by thecore operations of a company.
Covenant – a legal promise to do or not do a certainthing. For example, in a financing arrangement, com-pany management may agree to a negative covenant,whereby it promises not to incur additional debt. Thepenalties for violation of a covenant may vary fromrepairing the mistake to losing control of the compa-ny.
Coverage ratio – describes a company’s ability topay debt from cash flow or profits. Typical measuresare EBITDA/Interest, (EBITDA minus CapitalExpenditures)/Interest, and EBIT/Interest.
Cram down round – a financing event upon whichnew investors with substantial capital are able todemand and receive contractual terms that effective-ly cause the issuance of sufficient new shares by thestartup company to significantly reduce (“dilute”) theownership percentage of previous investors.
Cumulative dividends – the owner of preferredstock with cumulative dividends has the right toreceive accrued (previously unpaid) dividends in fullbefore dividends are paid to any other classes ofstock.
Current ratio – the ratio of current assets to currentliabilities.
Data room – a specific location where potential buy-ers / investors can review confidential informationabout a target company. This information may includedetailed financial statements, client contracts, intellec-tual property, property leases, and compensationagreements.
Deal flow – a measure of the number of potentialinvestments that a fund reviews in any given period.
Defined benefit plan – a company retirement plan inwhich the benefits are typically based on an employ-ee’s salary and number of years worked. Fixed bene-fits are paid after the employee retires. The employ-er bears the investment risk and is committed to pro-
viding the benefits to the employee. Defined benefitplan managers can invest in private equity funds.
Defined contribution plan – a company retirementplan in which the employee elects to contribute someportion of his or her salary into a retirement plan,such as a 401(k) or 403(b). The employer may alsocontribute to the employee’s plan. With this type ofplan, the employee bears the investment risk. Thebenefits depend solely on the amount of money madefrom investing the employee’s contributions.Defined contribution plan capital cannot be investedin private equity funds.
Demand rights – a type of registration right.Demand rights give an investor the right to force astartup to register its shares with the SEC and preparefor a public sale of stock (IPO).
Dilution – the reduction in the ownership percentageof current investors, founders and employees causedby the issuance of new shares to new investors.
Dilution protection – see Anti-dilution and Fullratchet.
Direct secondary transaction - A transaction inwhich the buyer purchases shares of an operatingcompany from an existing seller. While the transac-tion is a secondary sale of shares, the transactedinterest is a primary issue purchase directly into anoperating company. Sellers are often venture capital-ists selling their ownership stake in a portfolio com-pany. Buyers are often funds that specialize in suchinvestments.
Disbursement – an investment by a fund in a com-pany.
Discount rate – the interest rate used to determinethe present value of a series of future cash flows.
Discounted cash flow (DCF) – a valuation method-ology whereby the present value of all future cashflows expected from a company is calculated.
Distressed debt – the bonds of a company that iseither in or approaching bankruptcy. Some privateequity funds specialize in purchasing such debt atdeep discounts with the expectation of exerting
National Venture Capital Association
60 Thomson Reuters
influence in the restructuring of the company andthen selling the debt once the company has mean-ingfully recovered.
Distribution – the transfer of cash or securities to alimited partner resulting from the sale, liquidation orIPO of one or more portfolio companies in which ageneral partner chose to invest.
Dividends – payments made by a company to theowners of certain securities. Typically, dividends arepaid quarterly, by approval of the board of directors,to owners of preferred stock.
Down round – a round of financing whereby the val-uation of the company is lower than the value deter-mined by investors in an earlier round.
Drag-along rights – the contractual right of aninvestor in a company to force all other investors toagree to a specific action, such as the sale of the com-pany.
Drawdown schedule – an estimate of the gradualtransfer of committed investment funds from the lim-ited partners of a private equity fund to the generalpartners.
Due diligence – the investigatory process performedby investors to assess the viability of a potentialinvestment and the accuracy of the information pro-vided by the target company.
Dutch auction – a method of conducting an IPOwhereby newly issued shares of stock are committedto the highest bidder, then, if any shares remain, to thenext highest bidder, and so on until all the shares arecommitted. Note that the price per share paid by allbuyers is the price commitment of the buyer of the lastshare.
Early stage – the state of a company after the seed(formation) stage but before middle stage (generatingrevenues). Typically, a company in early stage willhave a core management team and a proven conceptor product, but no positive cash flow.
Earnings before interest and taxes (EBIT) – a meas-urement of the operating profit of a company. One pos-sible valuation methodology is based on a comparison
of private and public companies’ value as a multiple ofEBIT.
Earnings before interest, taxes, depreciation andamortization (EBITDA) – a measurement of thecash flow of a company. One possible valuationmethodology is based on a comparison of private andpublic companies’ value as a multiple of EBITDA.
Earn out – an arrangement in which sellers of a busi-ness receive additional future payments, usuallybased on financial performance metrics such as rev-enue or net income.
Elevator pitch – a concise presentation, lasting onlya few minutes (an elevator ride), by an entrepreneur toa potential investor about an investment opportunity.
Employee Stock Ownership Program (ESOP) – aplan established by a company to reserve shares foremployees.
Entrepreneur – an individual who starts his or herown business.
Entrepreneurship – the application of innovativeleadership to limited resources in order to createexceptional value.
Enterprise Value (EV) – the sum of the market val-ues of the common stock and long term debt of acompany, minus excess cash.
Equity – the ownership structure of a company rep-resented by common shares, preferred shares or unitinterests. Equity = Assets – Liabilities.
ESOP – see Employee Stock Ownership Program.
Evergreen fund – a fund that reinvests its profits inorder to ensure the availability of capital for futureinvestments.
Exit strategy – the plan for generating profits forowners and investors of a company. Typically, theoptions are to merge, be acquired or make an initialpublic offering (IPO). An alternative is to recapitalize(releverage the company and then pay dividends toshareholders).
2010 NVCA Yearbook
Thomson Reuters 61
Expansion stage – the stage of a company character-ized by a complete management team and a substan-tial increase in revenues.
Fair value – a financial reporting principle for valuingassets and liabilities, for example, portfolio companiesin venture capital fund portfolios. This has receivedmuch recent attention as the Financial AccountingStandards Board (FASB) has issued definitive guid-ance (FAS 157) on this long standing principle.
Fairness opinion – a letter issued by an investmentbank that charges a fee to assess the fairness of anegotiated price for a merger or acquisition.
FAS 157 – an an accounting standard developed bythe Financial Accounting Standards Board (FASB)regarding the application of a fair value principle.
First refusal – the right of a privately owned compa-ny to purchase any shares that employees would liketo sell.
Founders stock – nominally priced common stockissued to founders, officers, employees, directors,and consultants.
Free cash flow to equity (FCFE) – the cash flowavailable after operating expenses, interest paymentson debt, taxes, net principal repayments, preferredstock dividends, reinvestment needs and changes inworking capital. In a discounted cash flow model todetermine the value of the equity of a firm usingFCFE, the discount rate used is the cost of equity.
Free cash flow to the firm (FCFF) – the operatingcash flow available after operating expenses, taxes,reinvestment needs and changes in working capital,but before any interest payments on debt are made. Ina discounted cash flow model to determine the enter-prise value of a firm using FCFF, the discount rateused is the weighted average cost of capital (WACC).
Friends and family financing – capital provided bythe friends and family of founders of an early stagecompany. Founders should be careful not to create anownership structure that may hinder the participationof professional investors once the company begins toachieve success.
Full ratchet – an anti-dilution protection mechanismwhereby the price per share of the preferred stock ofinvestor A is adjusted downward due to the issuanceof new preferred shares to new investor B at a pricelower than the price investor A originally received.Investor A’s preferred stock is repriced to match theprice of investor B’s preferred stock. Usually as aresult of the implementation of a ratchet, companymanagement and employees who own a fixedamount of common shares suffer significant dilution.See Narrow-based weighted average anti-dilutionand Broad-based weighted average anti-dilution.
Fully diluted basis – a methodology for calculatingany per share ratios whereby the denominator is thetotal number of shares issued by the company on theassumption that all warrants and options are exer-cised and preferred stock.
Fund-of-funds – a fund created to invest in privateequity funds. Typically, individual investors and rela-tively small institutional investors participate in afund-of-funds to minimize their portfolio manage-ment efforts.
Gatekeepers – intermediaries which endowments,pension funds and other institutional investors use asadvisors regarding private equity investments.
General partner (GP) – a class of partner in a part-nership. The general partner retains liability for theactions of the partnership. Historically, venture capi-tal and buyout funds have been structured as limitedpartnerships, with the venture firm as the GP and lim-ited partners (LPs) being the institutional and highnet worth investors that provide most of the capital inthe partnership. The GP earns a management fee anda percentage of gains (see Carried interest).
GP – see General partner.
GP for hire - In a spin-out or a synthetic secondary,a GP for hire refers to the professional investor whomay be hired by a purchasing firm to manage the newfund created from the orphaned assets purchased. Inpast cases, the GP has often expanded its role tofundraise for and run new funds aside from the initialfund.
Going-private transaction – when a public compa-
National Venture Capital Association
62 Thomson Reuters
ny chooses to pay off all public investors, delist fromall stock exchanges, and become owned by manage-ment, employees, and select private investors.
Golden handcuffs – financial incentives that dis-courage founders and / or important employees fromleaving a company before a predetermined date orimportant milestone.
Grossing up – an adjustment of an option pool formanagement and employees of a company whichincreases the number of shares available over time.This usually occurs after a financing round wherebyone or more investors receive a relatively large per-centage of the company. Without a grossing up,managers and employees would suffer the financialand emotional consequences of dilution, therebypotentially affecting the overall performance of thecompany.
Growth stage – the state of a company when it hasreceived one or more rounds of financing and is gen-erating revenue from its product or service. Alsoknown as “middle stage.”
Hart-Scott-Rodino Act – a law requiring entitiesthat acquire certain amounts of stock or assets of acompany to inform the Federal Trade Commissionand the Department of Justice and to observe a wait-ing period before completing the transaction.
Hedge fund – an investment fund that has the abili-ty to use leverage, take short positions in securities,or use a variety of derivative instruments in order toachieve a return that is relatively less correlated tothe performance of typical indices (such as the S&P500) than traditional long-only funds. Hedge fundmanagers are typically compensated based on assetsunder management as well as fund performance.
High yield debt – debt issued via public offering orpublic placement (Rule 144A) that is rated belowinvestment grade by S&P or Moody’s. This means thatthe debt is rated below the top four rating categories (i.e.S&P BB+, Moody’s Ba2 or below). The lower rating isindicative of higher risk of default, and therefore thedebt carries a higher coupon or yield than investmentgrade debt. Also referred to as Junk bonds or Sub-investment grade debt.
Hockey stick – the general shape and form of a chartshowing revenue, customers, cash or some otherfinancial or operational measure that increases dra-matically at some point in the future. Entrepreneursoften develop business plans with hockey stick chartsto impress potential investors.
Holding period – amount of time an investmentremains in a portfolio.
Hot issue – stock in an initial public offering that isin high demand.
Hot money – capital from investors that have no tol-erance for lack of results by the investment managerand move quickly to withdraw at the first sign oftrouble.
Hurdle rate – a minimum rate of return requiredbefore an investor will make an investment.
Incorporation – the process by which a businessreceives a state charter, allowing it to become a cor-poration. Many corporations choose Delawarebecause its laws are business-friendly and up to date.
Incubator – a company or facility designed to hoststartup companies. Incubators help startups growwhile controlling costs by offering networks of con-tacts and shared backoffice resources.
Indenture – the terms and conditions between abond issuer and bond buyers.
Initial public offering (IPO) – the first offering ofstock by a company to the public. New public offer-ings must be registered with the Securities andExchange Commission. An IPO is one of the methodsthat a startup that has achieved significant success canuse to raise additional capital for further growth. SeeQualified IPO.
In-kind distribution – a distribution to limited part-ners of a private equity fund that is in the form ofpublicly trades shares rather than cash.
Inside round – a round of financing in which theinvestors are the same investors as the previousround. An inside round raises liability issues sincethe valuation of the company has no third party veri-
2010 NVCA Yearbook
Thomson Reuters 63
fication in the form of an outside investor. In addi-tion, the terms of the inside round may be consideredself-dealing if they are onerous to any set of share-holders or if the investors give themselves additionalpreferential rights.
Institutional investor – professional entities thatinvest capital on behalf of companies or individuals.Examples are: pension plans, insurance companiesand university endowments.
Intellectual property (IP) – knowledge, techniques,writings and images that are intangible but often pro-tected by law via patents, copyrights, and trademarks.
Interest coverage ratio – earnings before interestand taxes (EBIT) divided by interest expense. This isa key ratio used by lenders to assess the ability of acompany to produce sufficient cash to pay its debtobligation.
Internal rate of return (IRR) – the interest rate atwhich a certain amount of capital today would haveto be invested in order to grow to a specific value ata specific time in the future.
Investment thesis / Investment philosophy – thefundamental ideas which determine the types ofinvestments that an investment fund will choose inorder to achieve its financial goals.
IPO – see Initial public offering.
IRR – see Internal rate of return.
Issuer – the company that chooses to distribute aportion of its stock to the public.
J curve – a concept that during the first few years ofa private equity fund, cash flow or returns are nega-tive due to investments, losses, and expenses, but asinvestments produce results the cash flow or returnstrend upward. A graph of cash flow or returns versustime would then resemble the letter “J”.
Later stage – the state of a company that has provenits concept, achieved significant revenues comparedto its competition, and is approaching cash flowbreak even or positive net income. Typically, a laterstage company is about 6 to 12 months away from a
liquidity event such as an IPO or buyout. The rate ofreturn for venture capitalists that invest in later stage,less risky ventures is lower than in earlier stage ven-tures.
LBO – see Leveraged buyout.
Lead investor – the venture capital investor thatmakes the largest investment in a financing round andmanages the documentation and closing of that round.The lead investor sets the price per share of thefinancing round, thereby determining the valuation ofthe company.
Letter of intent – a document confirming the intentof an investor to participate in a round of financingfor a company. By signing this document, the subjectcompany agrees to begin the legal and due diligenceprocess prior to the closing of the transaction. Alsoknown as a “Term Sheet”.
Leverage – the use of debt to acquire assets, buildoperations and increase revenues. By using debt, acompany is attempting to achieve results faster thanif it only used its cash available from pre-leverageoperations. The risk is that the increase in assets andrevenues does not generate sufficient net income andcash flow to pay the interest costs of the debt.
Leveraged buyout (LBO) – the purchase of a com-pany or a business unit of a company by an outsideinvestor using mostly borrowed capital.
Leveraged recapitalization – the reorganization of acompany’s capital structure resulting in more debtadded to the balance sheet. Private equity funds canrecapitalize a portfolio company and then direct thecompany to issue a one-time dividend to equityinvestors. This is often done when the company isperforming well financially and the debt markets areexpanding.
Leverage ratios – measurements of a company’s debtas a multiple of cash flow. Typical leverage ratiosinclude Total Debt / EBITDA, Total Debt / (EBITDAminus Capital Expenditures), and Seniore Debt /EBITDA.
L.I.B.O.R. – see The London Interbank OfferedRate.
National Venture Capital Association
64 Thomson Reuters
License – a contract in which a patent owner grants toa company the right to make, use or sell an inventionunder certain circumstances and for compensation.
Limited liability company (LLC) – an ownershipstructure designed to limit the founders’ losses to theamount of their investment. An LLC itself does notpay taxes, rather its owners pay taxes on their propor-tion of the LLC profits at their individual tax rates.
Limited partnership – a legal entity composed of ageneral partner and various limited partners. Thegeneral partner manages the investments and is liablefor the actions of the partnership while the limitedpartners are generally protected from legal actionsand any losses beyond their original investment. Thegeneral partner collects a management fee and earnsa percentage of capital gains (see Carried interest),while the limited partners receive income, capitalgains and tax benefits.
Limited partner (LP) – an investor in a limited part-nership. The general partner is liable for the actionsof the partnership while the limited partners are gen-erally protected from legal actions and any lossesbeyond their original investment. The limited partnerreceives income, capital gains and tax benefits.
Liquidation – the sale of a company. This may occurin the context of an acquisition by a larger companyor in the context of selling off all assets prior to ces-sation of operations (Chapter 7 bankruptcy). In a liq-uidation, the claims of secured and unsecured credi-tors, bondholders and preferred stockholders takeprecedence over common stockholders.
Liquidation preference – the contractual right of aninvestor to priority in receiving the proceeds from theliquidation of a company. For example, a venturecapital investor with a “2x liquidation preference”has the right to receive two times its original invest-ment upon liquidation.
Liquidity discount – a decrease in the value of a pri-vate company compared to the value of a similar butpublicly traded company. Since an investor in a pri-vate company cannot readily sell his or her invest-ment, the shares in the private company must be val-ued less than a comparable public company.
Liquidity event – a transaction whereby owners of asignificant portion of the shares of a private compa-ny sell their shares in exchange for cash or shares inanother, usually larger company. For example, anIPO is a liquidity event.
Lock-up agreement – investors, management andemployees often agree not to sell their shares for aspecific time period after an IPO, usually 6 to 12months. By avoiding large sales of its stock, the com-pany has time to build interest among potential buy-ers of its shares.
London Interbank Offered Rate (L.I.B.O.R.) – theaverage rate charged by large banks in London forloans to each other. LIBOR is a relatively volatilerate and is typically quoted in maturities of onemonth, three months, six months and one year.
Management buyout (MBO) – a leveraged buyoutcontrolled by the members of the management teamof a company or a division. Often an MBO is con-ducted in partnership with a buyout fund.
Management fee – a fee charged to the limited part-ners in a fund by the general partner. Managementfees in a private equity fund usually range from0.75% to 3% of capital under management, depend-ing on the type and size of fund. For venture capitalfunds, 2% is typical.
Management rights – the rights often required by aventure capitalist as part of the agreement to invest ina company. The venture capitalist has the right toconsult with management on key operational issues,attend board meetings and review information aboutthe company’s financial situation.
Market capitalization – the value of a publicly trad-ed company as determined by multiplying the num-ber of shares outstanding by the current price pershare.
MBO – see Management buyout.
Mezzanine – a layer of financing that has intermedi-ate priority (seniority) in the capital structure of acompany. For example, mezzanine debt has lowerpriority than senior debt but usually has a higherinterest rate and often includes warrants. In venture
2010 NVCA Yearbook
Thomson Reuters 65
capital, a mezzanine round is generally the round offinancing that is designed to help a company haveenough resources to reach an IPO. See Bridgefinancing.
Multiples – a valuation methodology that comparespublic and private companies in terms of a ratio ofvalue to an operations figure such as revenue or netincome. For example, if several publicly tradedcomputer hardware companies are valued atapproximately 2 times revenues, then it is reason-able to assume that a startup computer hardwarecompany that is growing fast has the potential toachieve a valuation of 2 times its revenues. Beforethe startup issues its IPO, it will likely be valued atless than 2 times revenue because of the lack of liq-uidity of its shares. See Liquidity discount.
Narrow-based weighted average anti-dilution – atype of anti-dilution mechanism. A weighted averageanti-dilution method adjusts downward the price pershare of the preferred stock of investor A due to theissuance of new preferred shares to new investor B ata price lower than the price investor A originallyreceived. Investor A’s preferred stock is repriced to aweighed average of investor A’s price and investor B’sprice. A narrow-based anti-dilution uses only com-mon stock outstanding in the denominator of the for-mula for determining the new weighted average price.
NDA – see Non-disclosure agreement.
No-shop clause – a section of an agreement to pur-chase a company whereby the seller agrees not tomarket the company to other potential buyers for aspecific time period.
Non-cumulative dividends – dividends that arepayable to owners of preferred stock at a specificpoint in time only if there is sufficient cash flowavailable after all company expenses have been paid.If cash flow is insufficient, the owners of the pre-ferred stock will not receive the dividends owed forthat time period and will have to wait until the boardof directors declares another set of dividends.
Non-interference – an agreement often signed byemployees and management whereby they agree notto interfere with the company’s relationships withemployees, clients, suppliers and sub-contractors
within a certain time period after termination ofemployment.
Non-solicitation – an agreement often signed byemployees and management whereby they agree notto solicit other employees of the company regardingjob opportunities.
Non-disclosure agreement (NDA) – an agreementissued by entrepreneurs to protect the privacy of theirideas when disclosing those ideas to third parties.
Offering memorandum – a legal document thatprovides details of an investment to potentialinvestors. See Private placement memorandum.
OID – see Original issue discount.
Operating cash flow – the cash flow produced fromthe operation of a business, not from investing activ-ities (such as selling assets) or financing activities(such as issuing debt). Calculated as net operatingincome (NOI) plus depreciation.
Option pool – a group of options set aside for longterm, phased compensation to management andemployees.
Outstanding shares – the total amount of commonshares of a company, not including treasury stock,convertible preferred stock, warrants and options.
Pay to play – a clause in a financing agreementwhereby any investor that does not participate in afuture round agrees to suffer significant dilution com-pared to other investors. The most onerous version of“pay to play” is automatic conversion to commonshares, which in essence ends any preferential rightsof an investor, such as the right to influence key man-agement decisions.
Pari passu – a legal term referring to the equal treat-ment of two or more parties in an agreement. Forexample, a venture capitalist may agree to have reg-istration rights that are pari passu with the otherinvestors in a financing round.
Participating dividends – the right of holders of cer-tain preferred stock to receive dividends and participatein additional distributions of cash, stock or other assets.
National Venture Capital Association
66 Thomson Reuters
Participating preferred stock – a unit of ownershipcomposed of preferred stock and common stock. Thepreferred stock entitles the owner to receive a prede-termined sum of cash (usually the original invest-ment plus accrued dividends) if the company is soldor has an IPO. The common stock represents addi-tional continued ownership in the company.Participating preferred stock has been characterizedas “having your cake and eating it too”.
PEIGG – acronym for Private Equity IndustryGuidelines Group, an ad hoc group of individualsand firms involved in the private equity industry forthe purpose of establishing valuation and reportingguidelines.
Piggyback rights – rights of an investor to have hisor her shares included in a registration of a startup’sshares in preparation for an IPO.
PIK dividend – a dividend paid to the holder of astock, usually preferred stock, in the form of addi-tional stock rather than cash. PIK refers to paymentin kind.
PIPEs – see Private investment in public equity.
Placement agent – a company that specializes infinding institutional investors that are willing andable to invest in a private equity fund. Sometimes aprivate equity fund will hire a placement agent so thefund partners can focus on making and managinginvestments in companies rather than on raising cap-ital.
Portfolio company – a company that has received aninvestment from a private equity fund.
Post-money valuation – the valuation of a companyincluding the capital provided by the current round offinancing. For example, a venture capitalist may invest$5 million in a company valued at $2 million “pre-money” (before the investment was made). As a result,the startup will have a post-money valuation of $7 mil-lion.
PPM – see Private placement memorandum.
Preemptive rights – the rights of shareholders tomaintain their percentage ownership of a company
by buying shares sold by the company in futurefinancing rounds.
Preference – seniority, usually with respect to divi-dends and proceeds from a sale or dissolution of acompany.
Preferred return – a minimum return per annumthat must be generated for limited partners of a pri-vate equity fund before the general partner can beginreceiving a percentage of profits from investments.
Preferred stock – a type of stock that has certainrights that common stock does not have. These specialrights may include dividends, participation, liquiditypreference, anti-dilution protection and veto provi-sions, among others. Private equity investors usuallypurchase preferred stock when they make investmentsin companies.
Pre-money valuation – the valuation of a companyprior to the current round of financing. For example, aventure capitalist may invest $5 million in a companyvalued at $2 million pre-money. As a result, the start-up will have a “post-money” valuation of $7 million.
Primary shares – shares sold by a corporation (notby individual shareholders).
Private equity – equity investments in non-publiccompanies, usually defined as being made up of ven-ture capital funds and buyout funds. Real estate, oiland gas, and other such partnerships are sometimesincluded in the definition.
Private investment in public equity (PIPEs) –investments by a private equity fund in a publiclytraded company, usually at a discount and in the formof preferred stock.
Private placement – the sale of a security directly toa limited number of institutional and qualified indi-vidual investors. If structured correctly, a privateplacement avoids registration with the Securities andExchange Commission.
Private placement memorandum (PPM) – a docu-ment explaining the details of an investment to poten-tial investors. For example, a private equity fund willissue a PPM when it is raising capital from institution-
2010 NVCA Yearbook
Thomson Reuters 67
al investors. Also, a startup may issue a PPM when itneeds growth capital. Also known as “OfferingMemorandum”.
Private securities – securities that are not registeredwith the Securities and Exchange Commission anddo not trade on any exchanges. The price per share isnegotiated between the buyer and the seller (the“issuer”).
Prudent man rule – a fundamental principle for pro-fessional money management which serves as a basisfor the Prudent Investor Act. The principle is basedon a statement by Judge Samuel Putnum in 1830:“Those with the responsibility to invest money forothers should act with prudence, discretion, intelli-gence and regard for the safety of capital as well asincome.” In the 1970s a favorable interpretation ofthis rule enabled pension fund managers to invest inventure capital for the first time.
Qualified IPO – a public offering of securities val-ued at or above a total amount specified in a financ-ing agreement. This amount is usually specified to besufficiently large to guarantee that the IPO shareswill trade in a major exchange (NASDAQ or NewYork Stock Exchange). Usually upon a qualified IPOpreferred stock is forced to convert to common stock.
Quartile – one fourth of the data points in a data set.Often, private equity investors are measured by theresults of their investments during a particular periodof time. Institutional investors often prefer to investin private equity funds that demonstrate consistentresults over time, placing in the upper quartile of theinvestment results for all funds.
Ratchet – a mechanism to prevent dilution. An anti-dilution clause in a contract protects an investorfrom a reduction in percentage ownership in a com-pany due to the future issuance by the company ofadditional shares to other entities.
Realization ratio – the ratio of cumulative distribu-tions to paid-in capital. The realization ratio is usedas a measure of the distributions from investmentresults of a private equity partnership compared tothe capital under management.
Recapitalization – the reorganization of a compa-
ny’s capital structure.
Red herring – a preliminary prospectus filed withthe Securities and Exchange Commission and con-taining the details of an IPO offering. The namerefers to the disclosure warning printed in red letterson the cover of each preliminary prospectus advisingpotential investors of the risks involved.
Redemption rights – the right of an investor to forcethe startup company to buy back the shares issued asa result of the investment. In effect, the investor hasthe right to take back his/her investment and mayeven negotiate a right to receive an additional sum inexcess of the original investment.
Registration – the process whereby shares of a com-pany are registered with the Securities and ExchangeCommission under the Securities Act of 1933 inpreparation for a sale of the shares to the public.
Regulation D – an SEC regulation that governs privateplacements. Private placements are investment offer-ings for institutional and accredited individualinvestors but not for the general public. There is anexception that 35 non-accredited investors can partici-pate.
Restricted shares – shares that cannot be traded inthe public markets.
Return on investment (ROI) – the proceeds froman investment, during a specific time period, calcu-lated as a percentage of the original investment. Also,net profit after taxes divided by average total assets.
Rights offering – an offering of stock to currentshareholders that entitles them to purchase the newissue, usually at a discount.
Rights of co-sale with founders – a clause in ven-ture capital investment agreements that allows theVC fund to sell shares at the same time that thefounders of a startup chose to sell.
Right of first refusal – a contractual right to partic-ipate in a transaction. For example, a venture capital-ist may participate in a first round of investment in astartup and request a right of first refusal in any fol-lowing rounds of investment.
National Venture Capital Association
68 Thomson Reuters
Risk-free rate – a term used in finance theory todescribe the return from investing in a riskless secu-rity. In practice, this is often taken to be the return onUS Treasury Bills.
Road show – presentations made in several cities topotential investors and other interested parties. Forexample, a company will often make a road show togenerate interest among institutional investors prior toits IPO.
ROI – see Return on investment.
Rollup – the purchase of relatively smaller compa-nies in a sector by a rapidly growing company in thesame sector. The strategy is to create economies ofscale. For example, the movie theater industry under-went significant consolidation in the 1960’s and1970’s.
Round – a financing event usually involving severalprivate equity investors.
Royalties – payments made to patent or copyrightowners in exchange for the use of their intellectualproperty.
Rule 144 – a rule of the Securities and ExchangeCommission that specifies the conditions underwhich the holder of shares acquired in a privatetransaction may sell those shares in the public mar-kets.
S corporation – an ownership structure that limits itsnumber of owners to 100. An S corporation does notpay taxes, rather its owners pay taxes on their propor-tion of the corporation’s profits at their individual taxrates.
SBIC – see Small Business Investment Company.
Scalability – a characteristic of a new business con-cept that entails the growth of sales and revenueswith a much slower growth of organizational com-plexity and expenses. Venture capitalists look forscalability in the startups they select to finance.
Scale-down – a schedule for phased decreases inmanagement fees for general partners in a limitedpartnership as the fund reduces its investment activi-
ties toward the end of its term.
Scale-up – the process of a company growing quick-ly while maintaining operational and financial con-trols in place. Also, a schedule for phased increasesin management fees for general partners in a limitedpartnership as the fund increases its investment activ-ities over time.
Secondary market – a market for the sale of limitedpartnership interests in private equity funds.Sometimes limited partners chose to sell their interestin a partnership, typically to raise cash or because theycannot meet their obligation to invest more capitalaccording to the takedown schedule. Certain invest-ment companies specialize in buying these partnershipinterests at a discount.
Secondary shares – shares sold by a shareholder(not by the corporation).
Securities and Exchange Commission (SEC) – theregulatory body that enforces federal securities lawssuch as the Securities Act of 1933 and the SecuritiesExchange Act of 1934.
Seed capital – investment provided by angels, friendsand family to the founders of a startup in seed stage.
Seed stage – the state of a company when it has justbeen incorporated and its founders are developingtheir product or service.
Senior debt – a loan that has a higher priority in caseof a liquidation of the asset or company.
Seniority – higher priority.
Series A preferred stock – preferred stock issued bya fast growth company in exchange for capital frominvestors in the “A” round of financing. This pre-ferred stock is usually convertible to common sharesupon the IPO or sale of the company.
Sharpe Ratio – a method of calculating the risk-adjusted return of an investment. The Sharpe Ratio iscalculated by subtracting the risk-free rate from thereturn on a specific investment for a time period(usually one year) and then dividing the resulting fig-ure by the standard deviation of the historical (annu-
2010 NVCA Yearbook
Thomson Reuters 69
al) returns for that investment. The higher the SharpeRatio, the better.
Small Business Investment Company (SBIC) – acompany licensed by the Small BusinessAdministration to receive government capital in theform of debt or equity in order to use in private equi-ty investing.
Stock option – a right to purchase or sell a share ofstock at a specific price within a specific period oftime. Stock purchase options are commonly used aslong term incentive compensation for employees andmanagement of fast growth companies.
Strategic investor – a relatively large corporationthat agrees to invest in a young or a smaller compa-ny in order to have access to its proprietary technol-ogy, product or service.
Subordinated debt – a loan that has a lower priori-ty than a senior loan in case of a liquidation of theasset or company. Also known as “junior debt”.
Success rate – the proportion of venture fundedcompanies that are considered successful. A study ofcompanies funded by VCs during the 1990s indicat-ed that 14% of the companies went public and anoth-er 11%were acquired.
Sweat equity – ownership of shares in a companyresulting primarily from work rather than investmentof capital.
Syndicate – a group of investors that agree to partic-ipate in a round of funding for a company.Alternatively, a syndicate can refer to a group ofinvestment banks that agree to participate in the saleof stock to the public as part of an IPO.
Synthetic secondary - A popular method of complet-ing a direct secondary transaction in which the buyerbecomes a limited partner (LP) in a special purposevehicle (SPV) or similar entity which has been set upout of the underlying investments in order to create alimited partnership interest. The term arose becauseof the synthetic nature of the direct purchase throughthe LP secondary transaction.
Tag-along right – the right of a minority investor to
receive the same benefits as a majority investor.Usually applies to a sale of securities by investors.Also known as Co-sale right.
Takedown – a schedule of the transfer of capital inphases in order to complete a commitment of funds.Typically, a takedown is used by a general partner ofa private equity fund to plan the transfer of capitalfrom the limited partners.
Tender offer – an offer to public shareholders of acompany to purchase their shares.
Term loan – a bank loan for a specific period oftime, usually up to ten years in leveraged buyoutstructures.
Term sheet – a document confirming the intent of aninvestor to participate in a round of financing for acompany. By signing this document, the subjectcompany agrees to begin the legal and due diligenceprocess prior to the closing of the transaction. Alsoknown as “Letter of Intent”.
Tranche – a portion of a set of securities. Eachtranche may have different rights or risk characteris-tics. When venture capital firms finance a company,a round may be disbursed in two or three tranches,each of which is paid when the company attains oneor more milestones.
Turnaround – a process resulting in a substantialincrease in a company’s revenues, profits and reputa-tion.
Under water option – an option is said to be underwater if the current fair market value of a stock is lessthan the option exercise price.
Underwriter – an investment bank that chooses tobe responsible for the process of selling new securi-ties to the public. An underwriter usually chooses towork with a syndicate of investment banks in orderto maximize the distribution of the securities.
Venture capital – a segment of the private equityindustry which focuses on investing in new compa-nies with high growth potential and accompanyinghigh risk.
National Venture Capital Association
70 Thomson Reuters
Venture capital method – a pricing valuationmethod whereby an estimate of the future value ofa company is discounted by a certain interest rateand adjusted for future anticipated dilution in orderto determine the current value. Usually, discountrates for the venture capital method are consider-ably higher than public stock return rates, repre-senting the fact that venture capitalists mustachieve significant returns on investment in orderto compensate for the risks they take in fundingunproven companies.
Vesting – a schedule by which employees gain own-ership over time of a previously agreed upon amountof retirement funding or stock options.
Vintage – the year that a private equity fund stopsaccepting new investors and begins to make invest-ments on behalf of those investors. Venture funds aregenerally benchmarked to funds of the same vintageyear.
Voting rights – the rights of holders of preferred andcommon stock in a company to vote on certain actsaffecting the company. These matters may includepayment of dividends, issuance of a new class ofstock, merger or liquidation.
Warrant – a security which gives the holder theright to purchase shares in a company at a pre-deter-mined price. A warrant is a long term option, usuallyvalid for several years or indefinitely. Typically, war-rants are issued concurrently with preferred stocks orbonds in order to increase the appeal of the stocks orbonds to potential investors.
Washout round – a financing round whereby previ-ous investors, the founders and management suffersignificant dilution. Usually as a result of a washoutround, the new investor gains majority ownershipand control of the company.
Weighted average cost of capital (WACC) – theaverage of the cost of equity and the after-tax cost of
debt. This average is determined using weight factorsbased on the ratio of equity to debt plus equity andthe ratio of debt to debt plus equity.
Weighted average anti-dilution – an anti-dilutionprotection mechanism whereby the conversion rateof preferred stock is adjusted in order to reduce aninvestor’s loss due to an increase in the number ofshares in a company. Without anti-dilution protec-tion, an investor would suffer from a reduction ofhis or her percentage ownership. Usually as a resultof the implementation of a weighted average anti-dilution, company management and employees whoown a fixed amount of common shares suffer signif-icant dilution, but not as badly as in the case of afull ratchet.
Write-down – a decrease in the reported value of anasset or a company.
Write-off – a decrease in the reported value of anasset or a company to zero.
Write-up – an increase in the reported value of anasset or a company.
Zombie – a company that has received capital frominvestors but has only generated sufficient revenuesand cash flow to maintain its operations without sig-nificant growth. Sometimes referred to as “walkingdead.” Typically, a venture capitalist has to make adifficult decision as to whether to liquidate a zombieor continue to invest funds in the hopes that the zom-bie will become a winner.
These definitions were graciously provided by theCenter for Private Equity and Entrepreneurship at theTuck School of Business at Dartmouth. Please referto the Center’s website for additional definitions andinformation at http://mba.tuck.dartmouth.edu/pecen-ter/resources/glossary.html. Used by permission.Thomson Reuters and National Venture CapitalAssociation are grateful to the Center for its support.
2010 NVCA Yearbook
Thomson Reuters 71

National Venture Capital Association
72 Thomson Reuters
This page is intentionally left blank.
Appendix B: MoneyTree Report Criteria
Summary DescriptionThe MoneyTree™ Report measures cash-for-equityinvestments by the professional venture capital com-munity in private emerging companies in the U.S.
General Definition
The report includes the investment activity of profes-sional venture capital firms with or without a USoffice, SBICs, venture arms of corporations, institu-tions, investment banks and similar entities whoseprimary activity is financial investing. Where thereare other participants such as angels, corporations,and governments in a qualified and verified financ-ing round the entire amount of the round is included.
Qualifying transactions include cash investments bythese entities either directly or by participation invarious forms of private placement. All recipientcompanies are private, and may have been newly-created or spunout of existing companies.
The report excludes debt, buyouts, recapitalizations,secondary purchases, IPOs, investments in public com-panies such as PIPES (private investments in publicentities), investments for which the proceeds are pri-marily intended for acquisition such as roll-ups, changeof ownership, and other forms of private equity that donot involve cash such as services-in-kind and ventureleasing. Investee companies must be domiciled in oneof the 50 US states or DC even if substantial portionsof their activities are outside the United States.
Specific Methodology
The focus of the report is on cash received by thecompany. Therefore, tranches not term sheets are thedetermining factor. Drawdowns on commitments are
recognized at the time the company receives themoney rather than recorded as a lump sum amount atthe time the term sheet is executed. Convertible debtand bridge loans are recognized only when convert-ed to equity. Once a company has received a qualify-ing venture capital financing round, all subsequentequity financing rounds are included regardless ofwhether the round involved a venture capital firm aslong as all other investment criteria are met (e.g.cash-for-equity, not buyout or services in kind).
Angel, incubator and similar investments are consid-ered pre-venture financing if the company hasreceived no prior qualifying venture capital invest-ment and are not included in the MoneyTree results.Angel, incubator and similar investments that arepart of a qualifying venture capital round or follow aqualifying venture capital round are included to theextent that such investments can be fully verified asmeeting all other criteria (e.g. cash for equity, notbuyout or services in kind).
Direct investment by corporations (not through a ven-ture capital arm) is excluded unless (a) the investmentis clearly demonstrated to be primarily a financialinvestment rather than outsourced R&D or marketdevelopment, (b) it is co-investment in an otherwisequalifying round, or (c) it follows a qualifying ventureround in a company and meets all other criteria (e.g.cash-for-equity, not buyout or services in kind).
Data is primarily obtained from a quarterly survey ofventure capital practitioners. Information is aug-mented by other research techniques including otherpublic and private sources. All data is subject to ver-ification with the venture capital firms and/or theinvestee companies. Only professional independent venture capital firms,
Thomson Reuters 73
The MoneyTree™ Report by PricewaterhouseCoopers and the National VentureCapital Association based on data from Thomson Reuters
REPORT CRITERIA
institutional venture capital groups, and recognizedcorporate venture capital groups are included in ven-ture capital industry rankings.
Disclaimer
PricewaterhouseCoopers, the National VentureCapital Association, and Thomson Reuters havetaken responsible steps to ensure that the informationcontained in the MoneyTree Report has beenobtained from reliable sources. However, none of theparties can warrant the ultimate validity of the dataobtained in this manner. Results are updated periodi-cally. Therefore, all data is subject to change at anytime.
National Venture Capital Association
74 Thomson Reuters

Appendix C: MoneyTree Geographical Definitions
The Geographical Regions identified in the MoneyTree™ Report by PricewaterhouseCoopers and the NationalVenture Capital Association based on data provided by Thomson Reuters and used in the 2010 NVCA Yearbookare as follows:
Alaska/Hawaii/Puerto Rico: Alaska, Hawaii, and Puerto Rico
Colorado: The state of Colorado
DC/Metroplex: Washington, D.C., Virginia, West Virginia, and Maryland
LA/Orange County: Los Angeles, Ventura, Orange, and Riverside Counties (i.e., southern California, exceptSan Diego)
Midwest: Illinois, Missouri, Indiana, Kentucky, Ohio, Michigan, and western Pennsylvania
New England: Maine, New Hampshire, Vermont, Massachusetts, Rhode Island, and parts of Connecticut(excluding Fairfield county)
New York Metro: Metropolitan NY area, northern New Jersey, and Fairfield County, Connecticut
North Central: Minnesota, Iowa, Wisconsin, North Dakota, South Dakota, and Nebraska
Northwest: Washington, Oregon, Idaho, Montana, and Wyoming
Philadelphia Metro: Eastern Pennsylvania, southern New Jersey, and Delaware
Sacramento/Northern California: Northeastern California
San Diego: San Diego area
Silicon Valley: Northern California, bay area and coastline
South Central: Kansas, Oklahoma, Arkansas, and Louisiana
Southeast: Alabama, Florida, Georgia, Mississippi, Tennessee, South Carolina, and North Carolina
Southwest: Utah, Arizona, New Mexico, and Nevada
Texas: The state of Texas
Upstate New York: Northern New York state, except Metropolitan New York City area
Thomson Reuters 75

This page is intentionally left blank.
National Venture Capital Association
76 Thomson Reuters
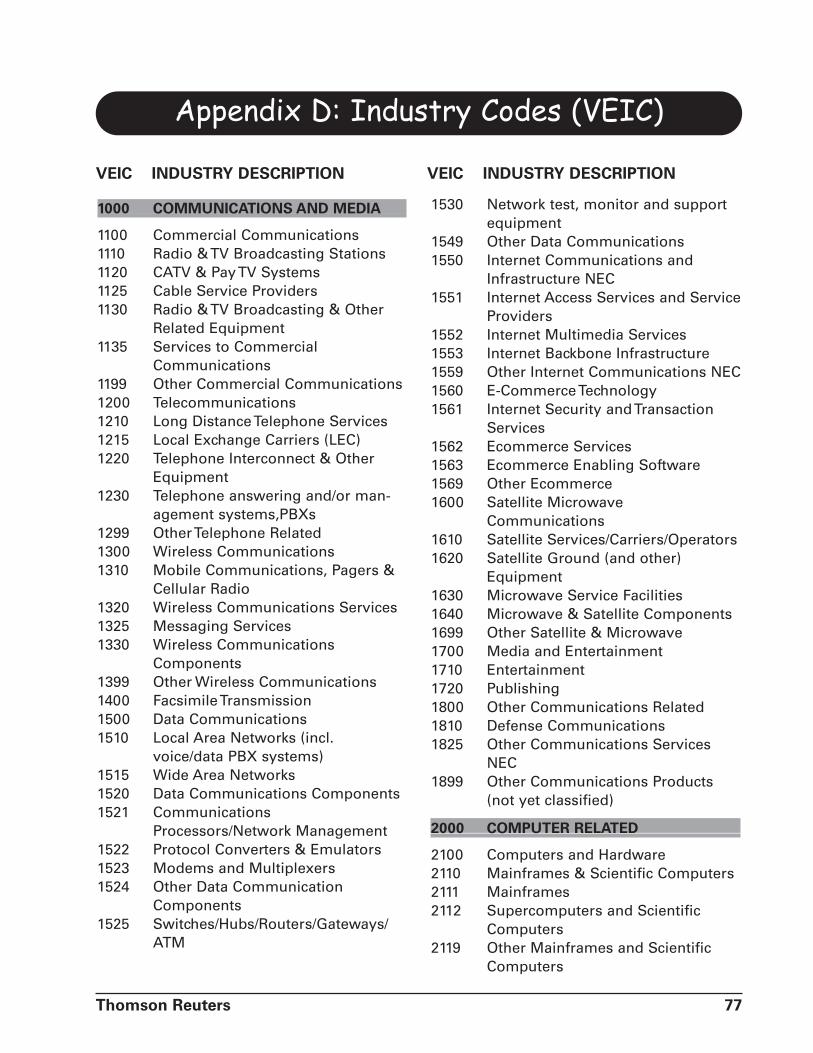
Appendix D: Industry Codes (VEIC)
1000 COMMUNICATIONS AND MEDIA
1100 Commercial Communications1110 Radio & TV Broadcasting Stations1120 CATV & Pay TV Systems1125 Cable Service Providers1130 Radio & TV Broadcasting & Other
Related Equipment1135 Services to Commercial
Communications1199 Other Commercial Communications1200 Telecommunications1210 Long Distance Telephone Services1215 Local Exchange Carriers (LEC)1220 Telephone Interconnect & Other
Equipment1230 Telephone answering and/or man-
agement systems,PBXs1299 Other Telephone Related1300 Wireless Communications1310 Mobile Communications, Pagers &
Cellular Radio1320 Wireless Communications Services1325 Messaging Services1330 Wireless Communications
Components1399 Other Wireless Communications1400 Facsimile Transmission1500 Data Communications1510 Local Area Networks (incl.
voice/data PBX systems)1515 Wide Area Networks1520 Data Communications Components1521 Communications
Processors/Network Management1522 Protocol Converters & Emulators1523 Modems and Multiplexers1524 Other Data Communication
Components1525 Switches/Hubs/Routers/Gateways/
ATM
1530 Network test, monitor and supportequipment
1549 Other Data Communications1550 Internet Communications and
Infrastructure NEC1551 Internet Access Services and Service
Providers1552 Internet Multimedia Services1553 Internet Backbone Infrastructure1559 Other Internet Communications NEC1560 E-Commerce Technology1561 Internet Security and Transaction
Services1562 Ecommerce Services1563 Ecommerce Enabling Software1569 Other Ecommerce1600 Satellite Microwave
Communications1610 Satellite Services/Carriers/Operators1620 Satellite Ground (and other)
Equipment1630 Microwave Service Facilities1640 Microwave & Satellite Components1699 Other Satellite & Microwave1700 Media and Entertainment1710 Entertainment1720 Publishing1800 Other Communications Related1810 Defense Communications1825 Other Communications Services
NEC1899 Other Communications Products
(not yet classified)
2000 COMPUTER RELATED
2100 Computers and Hardware2110 Mainframes & Scientific Computers2111 Mainframes2112 Supercomputers and Scientific
Computers2119 Other Mainframes and Scientific
Computers
Thomson Reuters 77
VEIC INDUSTRY DESCRIPTION VEIC INDUSTRY DESCRIPTION
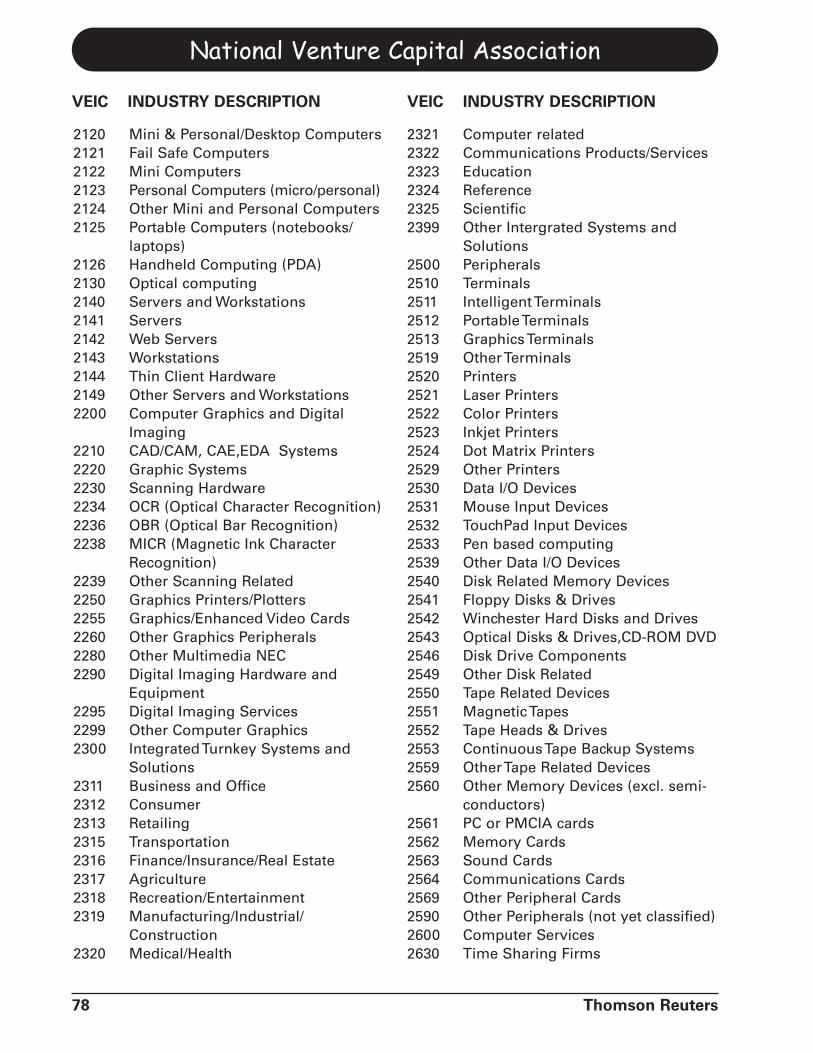
2120 Mini & Personal/Desktop Computers2121 Fail Safe Computers2122 Mini Computers2123 Personal Computers (micro/personal)2124 Other Mini and Personal Computers2125 Portable Computers (notebooks/
laptops)2126 Handheld Computing (PDA)2130 Optical computing2140 Servers and Workstations2141 Servers2142 Web Servers2143 Workstations2144 Thin Client Hardware2149 Other Servers and Workstations2200 Computer Graphics and Digital
Imaging2210 CAD/CAM, CAE,EDA Systems2220 Graphic Systems2230 Scanning Hardware2234 OCR (Optical Character Recognition)2236 OBR (Optical Bar Recognition)2238 MICR (Magnetic Ink Character
Recognition)2239 Other Scanning Related2250 Graphics Printers/Plotters2255 Graphics/Enhanced Video Cards2260 Other Graphics Peripherals2280 Other Multimedia NEC2290 Digital Imaging Hardware and
Equipment2295 Digital Imaging Services2299 Other Computer Graphics2300 Integrated Turnkey Systems and
Solutions2311 Business and Office2312 Consumer2313 Retailing2315 Transportation2316 Finance/Insurance/Real Estate2317 Agriculture2318 Recreation/Entertainment2319 Manufacturing/Industrial/
Construction2320 Medical/Health
2321 Computer related2322 Communications Products/Services2323 Education2324 Reference2325 Scientific2399 Other Intergrated Systems and
Solutions2500 Peripherals2510 Terminals2511 Intelligent Terminals2512 Portable Terminals2513 Graphics Terminals2519 Other Terminals2520 Printers2521 Laser Printers2522 Color Printers2523 Inkjet Printers2524 Dot Matrix Printers2529 Other Printers2530 Data I/O Devices2531 Mouse Input Devices2532 TouchPad Input Devices2533 Pen based computing2539 Other Data I/O Devices2540 Disk Related Memory Devices2541 Floppy Disks & Drives2542 Winchester Hard Disks and Drives2543 Optical Disks & Drives,CD-ROM DVD2546 Disk Drive Components2549 Other Disk Related2550 Tape Related Devices2551 Magnetic Tapes2552 Tape Heads & Drives2553 Continuous Tape Backup Systems2559 Other Tape Related Devices2560 Other Memory Devices (excl. semi-
conductors)2561 PC or PMCIA cards2562 Memory Cards2563 Sound Cards2564 Communications Cards2569 Other Peripheral Cards2590 Other Peripherals (not yet classified)2600 Computer Services2630 Time Sharing Firms
National Venture Capital Association
78 Thomson Reuters
VEIC INDUSTRY DESCRIPTION VEIC INDUSTRY DESCRIPTION
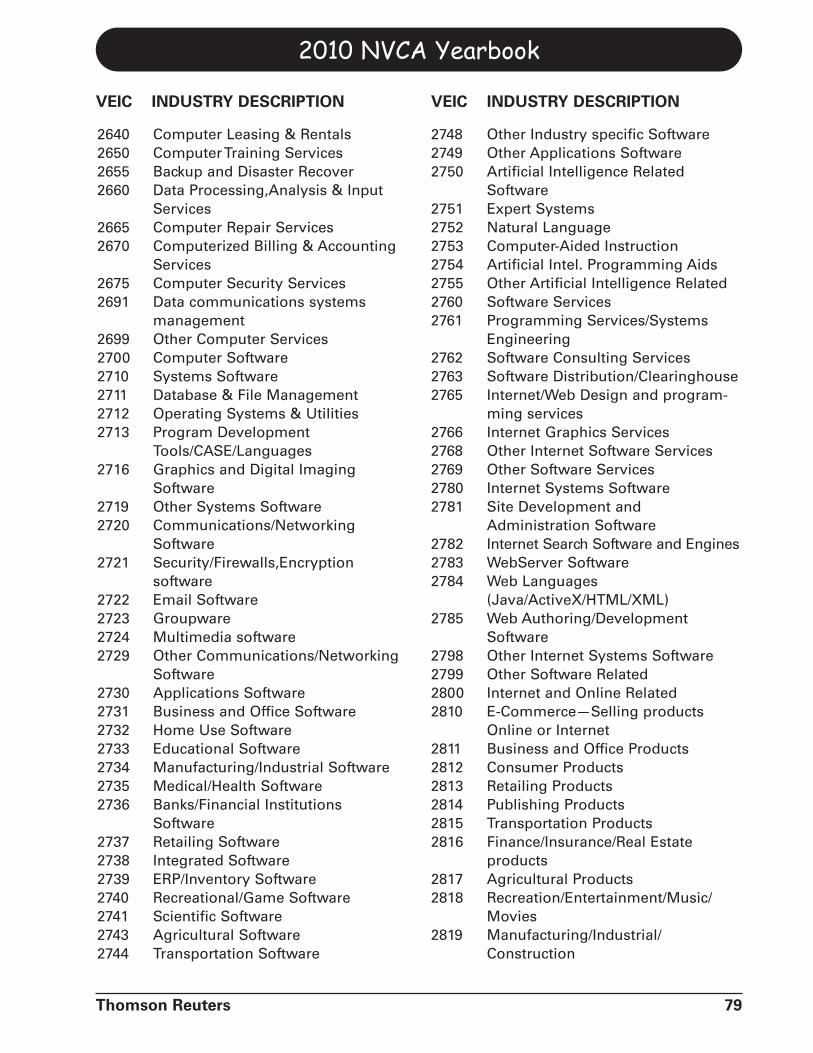
2640 Computer Leasing & Rentals2650 Computer Training Services2655 Backup and Disaster Recover2660 Data Processing,Analysis & Input
Services2665 Computer Repair Services2670 Computerized Billing & Accounting
Services2675 Computer Security Services2691 Data communications systems
management2699 Other Computer Services2700 Computer Software2710 Systems Software2711 Database & File Management2712 Operating Systems & Utilities2713 Program Development
Tools/CASE/Languages2716 Graphics and Digital Imaging
Software2719 Other Systems Software2720 Communications/Networking
Software2721 Security/Firewalls,Encryption
software2722 Email Software2723 Groupware2724 Multimedia software2729 Other Communications/Networking
Software2730 Applications Software2731 Business and Office Software2732 Home Use Software2733 Educational Software2734 Manufacturing/Industrial Software2735 Medical/Health Software2736 Banks/Financial Institutions
Software2737 Retailing Software2738 Integrated Software2739 ERP/Inventory Software2740 Recreational/Game Software2741 Scientific Software2743 Agricultural Software2744 Transportation Software
2748 Other Industry specific Software2749 Other Applications Software2750 Artificial Intelligence Related
Software2751 Expert Systems2752 Natural Language2753 Computer-Aided Instruction2754 Artificial Intel. Programming Aids2755 Other Artificial Intelligence Related2760 Software Services2761 Programming Services/Systems
Engineering2762 Software Consulting Services2763 Software Distribution/Clearinghouse2765 Internet/Web Design and program-
ming services2766 Internet Graphics Services2768 Other Internet Software Services2769 Other Software Services2780 Internet Systems Software2781 Site Development and
Administration Software2782 Internet Search Software and Engines2783 WebServer Software2784 Web Languages
(Java/ActiveX/HTML/XML)2785 Web Authoring/Development
Software2798 Other Internet Systems Software2799 Other Software Related2800 Internet and Online Related2810 E-Commerce—Selling products
Online or Internet2811 Business and Office Products2812 Consumer Products2813 Retailing Products2814 Publishing Products2815 Transportation Products2816 Finance/Insurance/Real Estate
products2817 Agricultural Products2818 Recreation/Entertainment/Music/
Movies2819 Manufacturing/Industrial/
Construction
2010 NVCA Yearbook
Thomson Reuters 79
VEIC INDUSTRY DESCRIPTION VEIC INDUSTRY DESCRIPTION
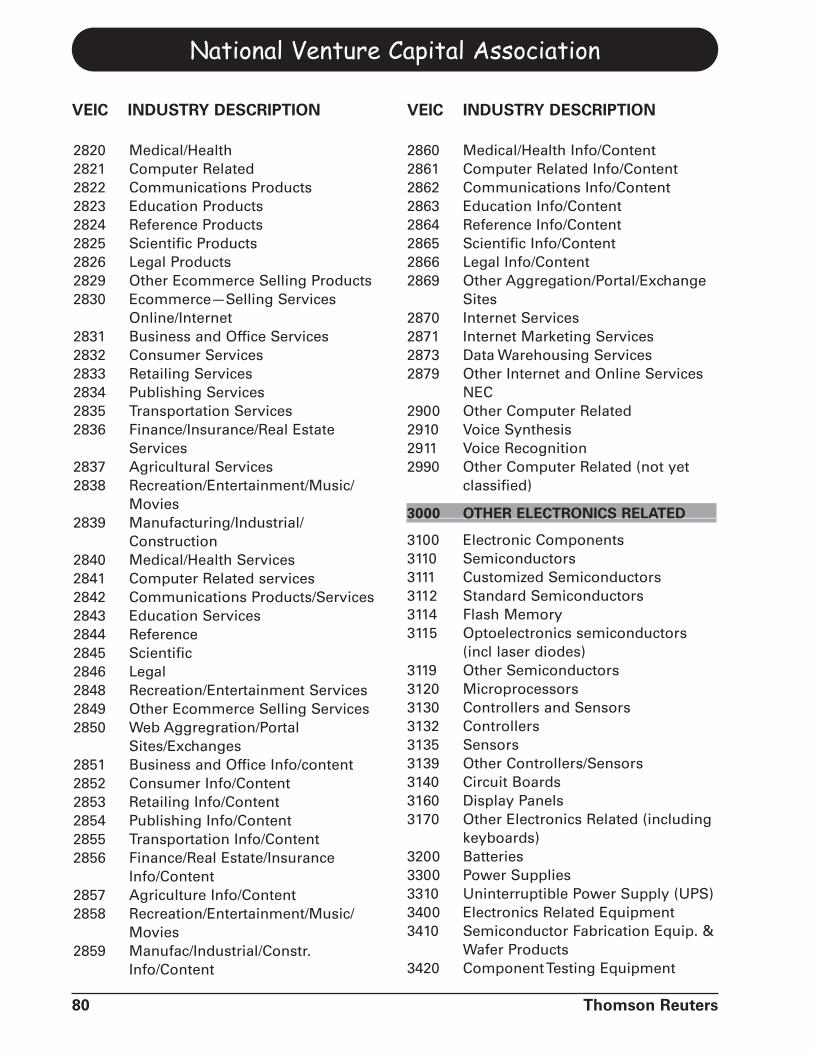
2820 Medical/Health2821 Computer Related2822 Communications Products2823 Education Products2824 Reference Products2825 Scientific Products2826 Legal Products2829 Other Ecommerce Selling Products2830 Ecommerce—Selling Services
Online/Internet2831 Business and Office Services2832 Consumer Services2833 Retailing Services2834 Publishing Services2835 Transportation Services2836 Finance/Insurance/Real Estate
Services2837 Agricultural Services2838 Recreation/Entertainment/Music/
Movies2839 Manufacturing/Industrial/
Construction2840 Medical/Health Services2841 Computer Related services2842 Communications Products/Services2843 Education Services2844 Reference2845 Scientific2846 Legal2848 Recreation/Entertainment Services2849 Other Ecommerce Selling Services2850 Web Aggregration/Portal
Sites/Exchanges2851 Business and Office Info/content2852 Consumer Info/Content2853 Retailing Info/Content2854 Publishing Info/Content2855 Transportation Info/Content2856 Finance/Real Estate/Insurance
Info/Content2857 Agriculture Info/Content2858 Recreation/Entertainment/Music/
Movies2859 Manufac/Industrial/Constr.
Info/Content
2860 Medical/Health Info/Content2861 Computer Related Info/Content2862 Communications Info/Content2863 Education Info/Content2864 Reference Info/Content2865 Scientific Info/Content2866 Legal Info/Content2869 Other Aggregation/Portal/Exchange
Sites2870 Internet Services2871 Internet Marketing Services2873 Data Warehousing Services2879 Other Internet and Online Services
NEC2900 Other Computer Related2910 Voice Synthesis2911 Voice Recognition2990 Other Computer Related (not yet
classified)
3000 OTHER ELECTRONICS RELATED
3100 Electronic Components3110 Semiconductors3111 Customized Semiconductors3112 Standard Semiconductors3114 Flash Memory3115 Optoelectronics semiconductors
(incl laser diodes)3119 Other Semiconductors3120 Microprocessors3130 Controllers and Sensors3132 Controllers3135 Sensors3139 Other Controllers/Sensors3140 Circuit Boards3160 Display Panels3170 Other Electronics Related (including
keyboards)3200 Batteries3300 Power Supplies3310 Uninterruptible Power Supply (UPS)3400 Electronics Related Equipment3410 Semiconductor Fabrication Equip. &
Wafer Products3420 Component Testing Equipment
National Venture Capital Association
80 Thomson Reuters
VEIC INDUSTRY DESCRIPTION VEIC INDUSTRY DESCRIPTION
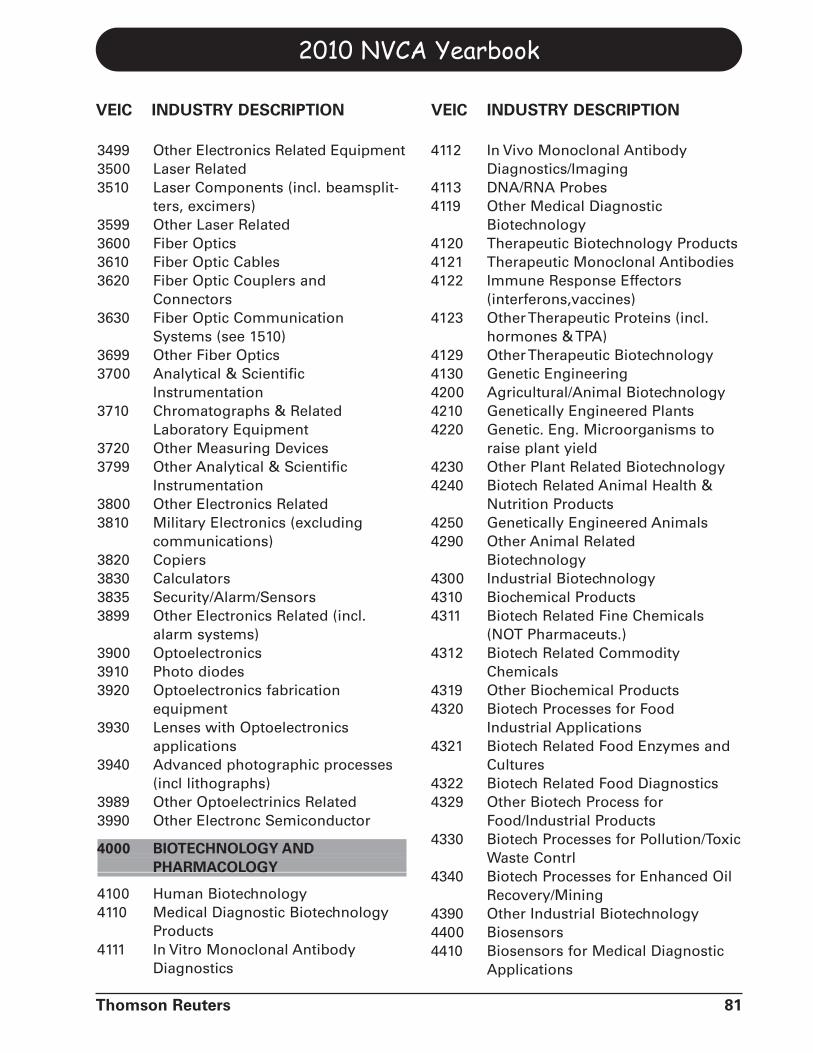
3499 Other Electronics Related Equipment3500 Laser Related3510 Laser Components (incl. beamsplit-
ters, excimers)3599 Other Laser Related3600 Fiber Optics3610 Fiber Optic Cables3620 Fiber Optic Couplers and
Connectors3630 Fiber Optic Communication
Systems (see 1510)3699 Other Fiber Optics3700 Analytical & Scientific
Instrumentation3710 Chromatographs & Related
Laboratory Equipment3720 Other Measuring Devices3799 Other Analytical & Scientific
Instrumentation3800 Other Electronics Related3810 Military Electronics (excluding
communications)3820 Copiers3830 Calculators3835 Security/Alarm/Sensors3899 Other Electronics Related (incl.
alarm systems)3900 Optoelectronics3910 Photo diodes3920 Optoelectronics fabrication
equipment3930 Lenses with Optoelectronics
applications3940 Advanced photographic processes
(incl lithographs)3989 Other Optoelectrinics Related3990 Other Electronc Semiconductor
4000 BIOTECHNOLOGY AND PHARMACOLOGY
4100 Human Biotechnology4110 Medical Diagnostic Biotechnology
Products4111 In Vitro Monoclonal Antibody
Diagnostics
4112 In Vivo Monoclonal AntibodyDiagnostics/Imaging
4113 DNA/RNA Probes4119 Other Medical Diagnostic
Biotechnology4120 Therapeutic Biotechnology Products4121 Therapeutic Monoclonal Antibodies4122 Immune Response Effectors
(interferons,vaccines)4123 Other Therapeutic Proteins (incl.
hormones & TPA)4129 Other Therapeutic Biotechnology4130 Genetic Engineering4200 Agricultural/Animal Biotechnology4210 Genetically Engineered Plants4220 Genetic. Eng. Microorganisms to
raise plant yield4230 Other Plant Related Biotechnology4240 Biotech Related Animal Health &
Nutrition Products4250 Genetically Engineered Animals4290 Other Animal Related
Biotechnology4300 Industrial Biotechnology4310 Biochemical Products4311 Biotech Related Fine Chemicals
(NOT Pharmaceuts.)4312 Biotech Related Commodity
Chemicals4319 Other Biochemical Products4320 Biotech Processes for Food
Industrial Applications4321 Biotech Related Food Enzymes and
Cultures4322 Biotech Related Food Diagnostics4329 Other Biotech Process for
Food/Industrial Products4330 Biotech Processes for Pollution/Toxic
Waste Contrl4340 Biotech Processes for Enhanced Oil
Recovery/Mining4390 Other Industrial Biotechnology4400 Biosensors4410 Biosensors for Medical Diagnostic
Applications
2010 NVCA Yearbook
Thomson Reuters 81
VEIC INDUSTRY DESCRIPTION VEIC INDUSTRY DESCRIPTION
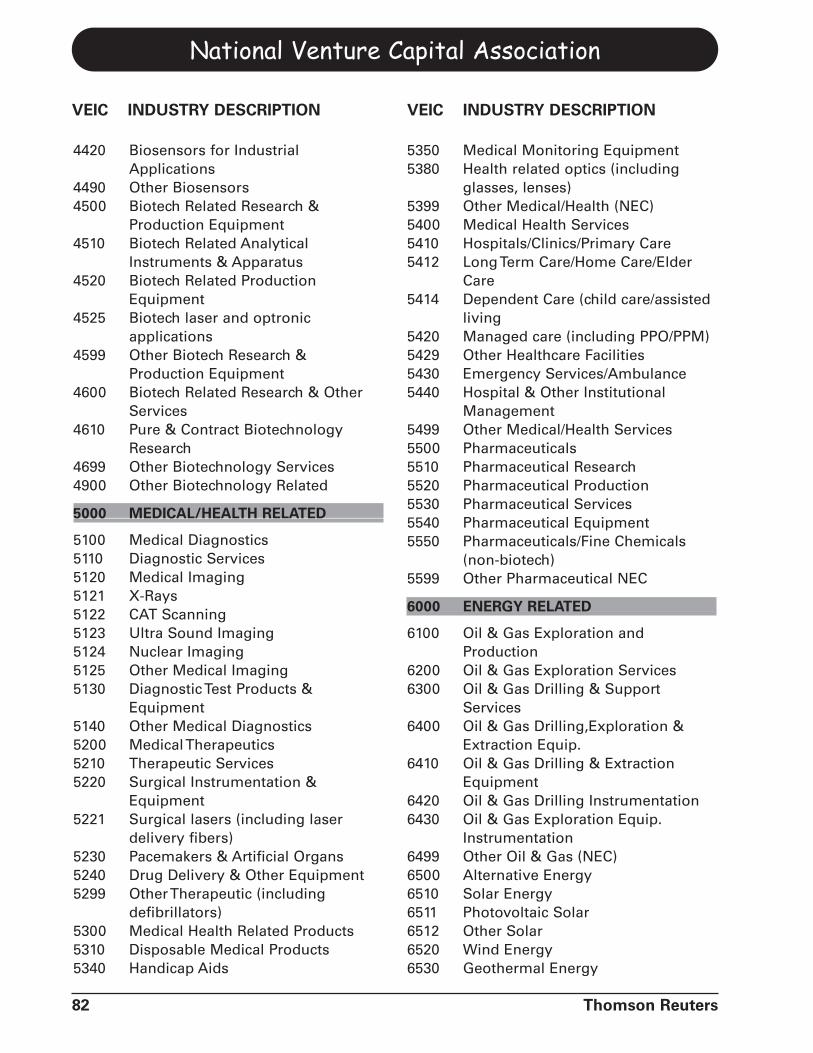
4420 Biosensors for IndustrialApplications
4490 Other Biosensors4500 Biotech Related Research &
Production Equipment4510 Biotech Related Analytical
Instruments & Apparatus4520 Biotech Related Production
Equipment4525 Biotech laser and optronic
applications4599 Other Biotech Research &
Production Equipment4600 Biotech Related Research & Other
Services4610 Pure & Contract Biotechnology
Research4699 Other Biotechnology Services4900 Other Biotechnology Related
5000 MEDICAL/HEALTH RELATED
5100 Medical Diagnostics5110 Diagnostic Services5120 Medical Imaging5121 X-Rays5122 CAT Scanning5123 Ultra Sound Imaging5124 Nuclear Imaging5125 Other Medical Imaging5130 Diagnostic Test Products &
Equipment5140 Other Medical Diagnostics5200 Medical Therapeutics5210 Therapeutic Services5220 Surgical Instrumentation &
Equipment5221 Surgical lasers (including laser
delivery fibers)5230 Pacemakers & Artificial Organs5240 Drug Delivery & Other Equipment5299 Other Therapeutic (including
defibrillators)5300 Medical Health Related Products5310 Disposable Medical Products5340 Handicap Aids
5350 Medical Monitoring Equipment5380 Health related optics (including
glasses, lenses)5399 Other Medical/Health (NEC)5400 Medical Health Services5410 Hospitals/Clinics/Primary Care5412 Long Term Care/Home Care/Elder
Care5414 Dependent Care (child care/assisted
living5420 Managed care (including PPO/PPM)5429 Other Healthcare Facilities5430 Emergency Services/Ambulance5440 Hospital & Other Institutional
Management5499 Other Medical/Health Services5500 Pharmaceuticals5510 Pharmaceutical Research5520 Pharmaceutical Production5530 Pharmaceutical Services5540 Pharmaceutical Equipment5550 Pharmaceuticals/Fine Chemicals
(non-biotech)5599 Other Pharmaceutical NEC
6000 ENERGY RELATED
6100 Oil & Gas Exploration andProduction
6200 Oil & Gas Exploration Services6300 Oil & Gas Drilling & Support
Services6400 Oil & Gas Drilling,Exploration &
Extraction Equip.6410 Oil & Gas Drilling & Extraction
Equipment6420 Oil & Gas Drilling Instrumentation6430 Oil & Gas Exploration Equip.
Instrumentation6499 Other Oil & Gas (NEC)6500 Alternative Energy6510 Solar Energy6511 Photovoltaic Solar6512 Other Solar6520 Wind Energy6530 Geothermal Energy
National Venture Capital Association
82 Thomson Reuters
VEIC INDUSTRY DESCRIPTION VEIC INDUSTRY DESCRIPTION
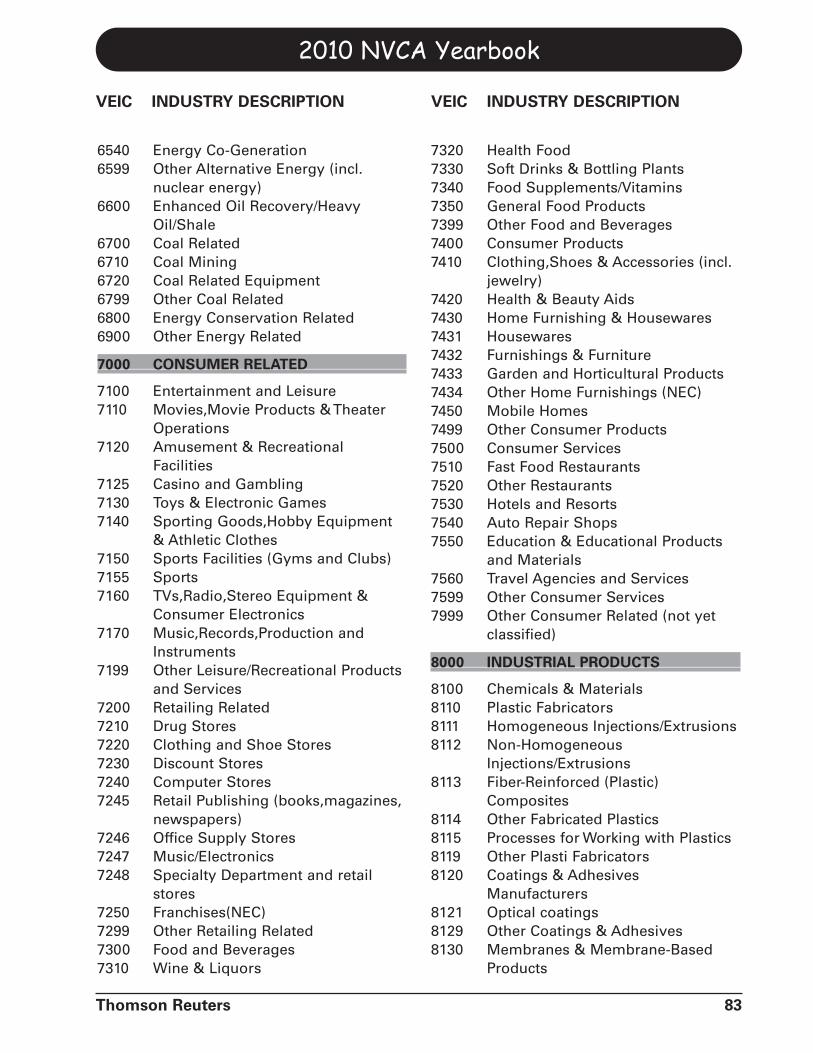
6540 Energy Co-Generation6599 Other Alternative Energy (incl.
nuclear energy)6600 Enhanced Oil Recovery/Heavy
Oil/Shale6700 Coal Related6710 Coal Mining6720 Coal Related Equipment6799 Other Coal Related6800 Energy Conservation Related6900 Other Energy Related
7000 CONSUMER RELATED
7100 Entertainment and Leisure7110 Movies,Movie Products & Theater
Operations7120 Amusement & Recreational
Facilities7125 Casino and Gambling7130 Toys & Electronic Games7140 Sporting Goods,Hobby Equipment
& Athletic Clothes7150 Sports Facilities (Gyms and Clubs)7155 Sports7160 TVs,Radio,Stereo Equipment &
Consumer Electronics7170 Music,Records,Production and
Instruments7199 Other Leisure/Recreational Products
and Services7200 Retailing Related7210 Drug Stores7220 Clothing and Shoe Stores7230 Discount Stores7240 Computer Stores7245 Retail Publishing (books,magazines,
newspapers)7246 Office Supply Stores7247 Music/Electronics7248 Specialty Department and retail
stores7250 Franchises(NEC)7299 Other Retailing Related7300 Food and Beverages7310 Wine & Liquors
7320 Health Food7330 Soft Drinks & Bottling Plants7340 Food Supplements/Vitamins7350 General Food Products7399 Other Food and Beverages7400 Consumer Products7410 Clothing,Shoes & Accessories (incl.
jewelry)7420 Health & Beauty Aids7430 Home Furnishing & Housewares7431 Housewares7432 Furnishings & Furniture7433 Garden and Horticultural Products7434 Other Home Furnishings (NEC)7450 Mobile Homes7499 Other Consumer Products7500 Consumer Services7510 Fast Food Restaurants7520 Other Restaurants7530 Hotels and Resorts7540 Auto Repair Shops7550 Education & Educational Products
and Materials7560 Travel Agencies and Services7599 Other Consumer Services7999 Other Consumer Related (not yet
classified)
8000 INDUSTRIAL PRODUCTS
8100 Chemicals & Materials8110 Plastic Fabricators8111 Homogeneous Injections/Extrusions8112 Non-Homogeneous
Injections/Extrusions8113 Fiber-Reinforced (Plastic)
Composites8114 Other Fabricated Plastics8115 Processes for Working with Plastics8119 Other Plasti Fabricators8120 Coatings & Adhesives
Manufacturers8121 Optical coatings8129 Other Coatings & Adhesives8130 Membranes & Membrane-Based
Products
2010 NVCA Yearbook
Thomson Reuters 83
VEIC INDUSTRY DESCRIPTION VEIC INDUSTRY DESCRIPTION
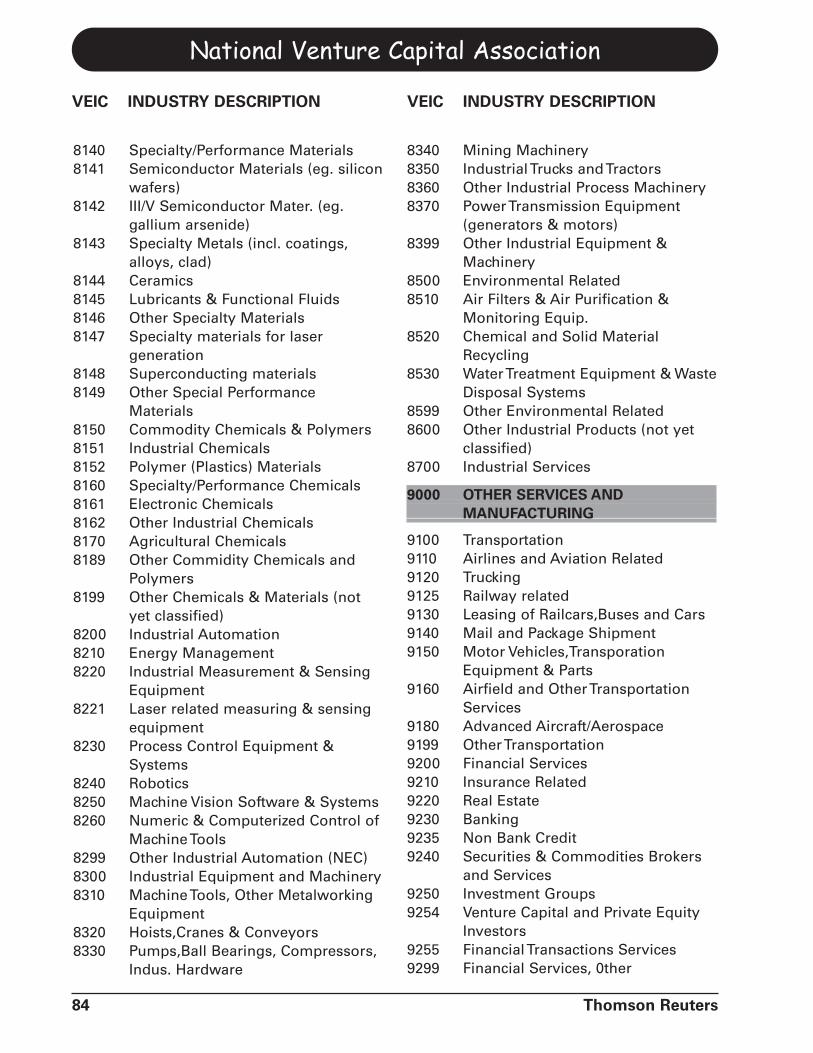
8140 Specialty/Performance Materials8141 Semiconductor Materials (eg. silicon
wafers)8142 III/V Semiconductor Mater. (eg.
gallium arsenide)8143 Specialty Metals (incl. coatings,
alloys, clad)8144 Ceramics8145 Lubricants & Functional Fluids8146 Other Specialty Materials8147 Specialty materials for laser
generation8148 Superconducting materials8149 Other Special Performance
Materials8150 Commodity Chemicals & Polymers8151 Industrial Chemicals8152 Polymer (Plastics) Materials8160 Specialty/Performance Chemicals8161 Electronic Chemicals8162 Other Industrial Chemicals8170 Agricultural Chemicals8189 Other Commidity Chemicals and
Polymers8199 Other Chemicals & Materials (not
yet classified)8200 Industrial Automation8210 Energy Management8220 Industrial Measurement & Sensing
Equipment8221 Laser related measuring & sensing
equipment8230 Process Control Equipment &
Systems8240 Robotics8250 Machine Vision Software & Systems8260 Numeric & Computerized Control of
Machine Tools8299 Other Industrial Automation (NEC)8300 Industrial Equipment and Machinery8310 Machine Tools, Other Metalworking
Equipment8320 Hoists,Cranes & Conveyors8330 Pumps,Ball Bearings, Compressors,
Indus. Hardware
8340 Mining Machinery8350 Industrial Trucks and Tractors8360 Other Industrial Process Machinery8370 Power Transmission Equipment
(generators & motors)8399 Other Industrial Equipment &
Machinery8500 Environmental Related8510 Air Filters & Air Purification &
Monitoring Equip.8520 Chemical and Solid Material
Recycling8530 Water Treatment Equipment & Waste
Disposal Systems8599 Other Environmental Related8600 Other Industrial Products (not yet
classified)8700 Industrial Services
9000 OTHER SERVICES AND MANUFACTURING
9100 Transportation9110 Airlines and Aviation Related9120 Trucking9125 Railway related9130 Leasing of Railcars,Buses and Cars9140 Mail and Package Shipment9150 Motor Vehicles,Transporation
Equipment & Parts9160 Airfield and Other Transportation
Services9180 Advanced Aircraft/Aerospace9199 Other Transportation9200 Financial Services9210 Insurance Related9220 Real Estate9230 Banking9235 Non Bank Credit9240 Securities & Commodities Brokers
and Services9250 Investment Groups9254 Venture Capital and Private Equity
Investors9255 Financial Transactions Services9299 Financial Services, 0ther
National Venture Capital Association
84 Thomson Reuters
VEIC INDUSTRY DESCRIPTION VEIC INDUSTRY DESCRIPTION
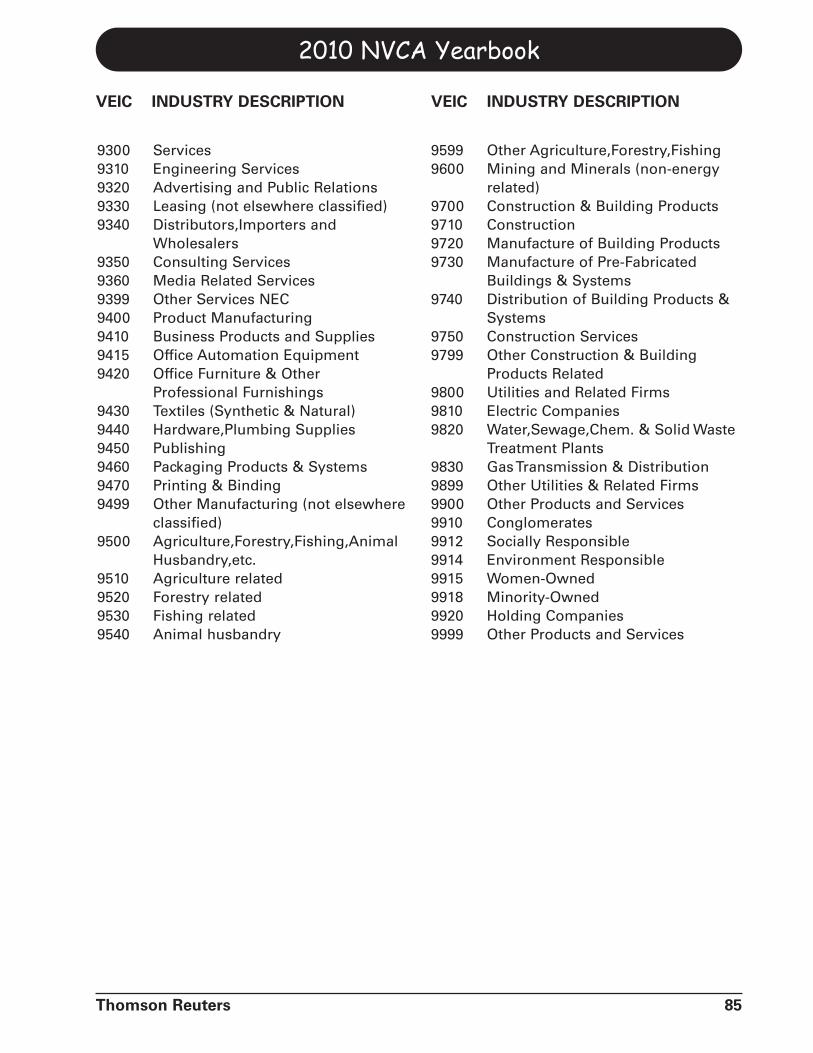
9300 Services9310 Engineering Services9320 Advertising and Public Relations9330 Leasing (not elsewhere classified)9340 Distributors,Importers and
Wholesalers9350 Consulting Services9360 Media Related Services9399 Other Services NEC9400 Product Manufacturing9410 Business Products and Supplies9415 Office Automation Equipment9420 Office Furniture & Other
Professional Furnishings9430 Textiles (Synthetic & Natural)9440 Hardware,Plumbing Supplies9450 Publishing9460 Packaging Products & Systems9470 Printing & Binding9499 Other Manufacturing (not elsewhere
classified)9500 Agriculture,Forestry,Fishing,Animal
Husbandry,etc.9510 Agriculture related9520 Forestry related9530 Fishing related9540 Animal husbandry
9599 Other Agriculture,Forestry,Fishing9600 Mining and Minerals (non-energy
related)9700 Construction & Building Products9710 Construction9720 Manufacture of Building Products9730 Manufacture of Pre-Fabricated
Buildings & Systems9740 Distribution of Building Products &
Systems9750 Construction Services9799 Other Construction & Building
Products Related9800 Utilities and Related Firms9810 Electric Companies9820 Water,Sewage,Chem. & Solid Waste
Treatment Plants9830 Gas Transmission & Distribution9899 Other Utilities & Related Firms9900 Other Products and Services9910 Conglomerates9912 Socially Responsible9914 Environment Responsible9915 Women-Owned9918 Minority-Owned9920 Holding Companies9999 Other Products and Services
2010 NVCA Yearbook
Thomson Reuters 85
VEIC INDUSTRY DESCRIPTION VEIC INDUSTRY DESCRIPTION

National Venture Capital Association
86 Thomson Reuters
The page is intentionally left blank.
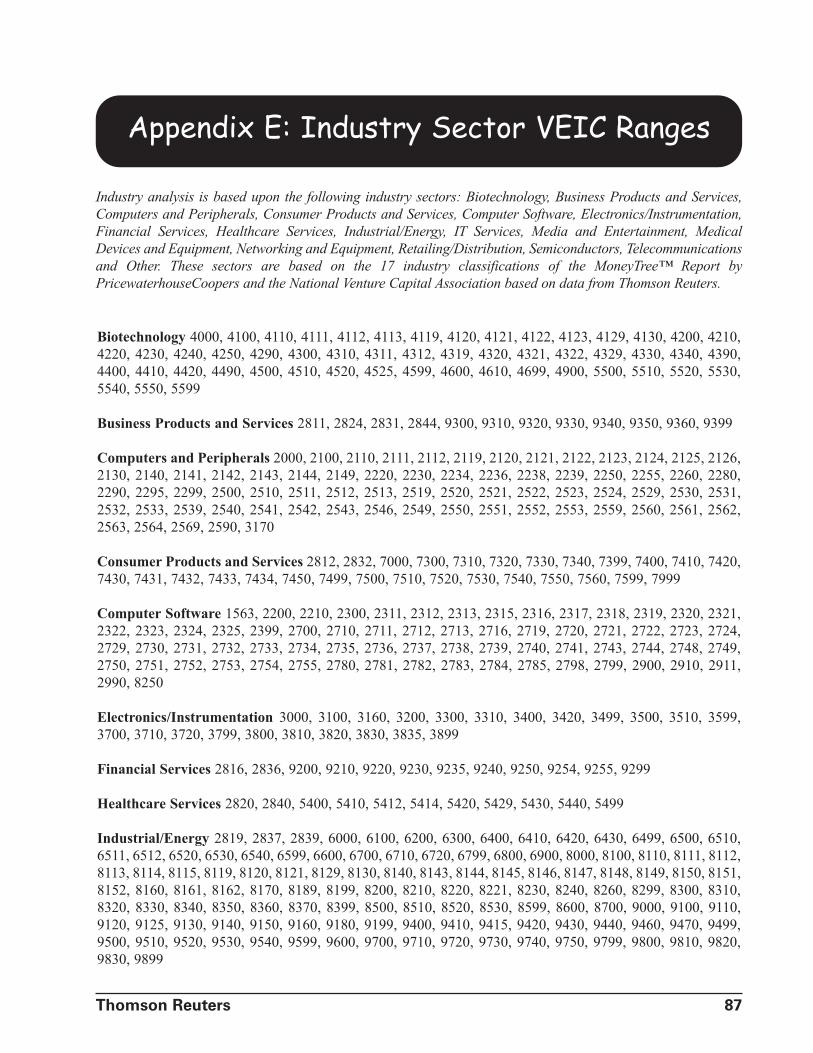
Appendix E: Industry Sector VEIC Ranges
Biotechnology 4000, 4100, 4110, 4111, 4112, 4113, 4119, 4120, 4121, 4122, 4123, 4129, 4130, 4200, 4210,4220, 4230, 4240, 4250, 4290, 4300, 4310, 4311, 4312, 4319, 4320, 4321, 4322, 4329, 4330, 4340, 4390,4400, 4410, 4420, 4490, 4500, 4510, 4520, 4525, 4599, 4600, 4610, 4699, 4900, 5500, 5510, 5520, 5530,5540, 5550, 5599
Business Products and Services 2811, 2824, 2831, 2844, 9300, 9310, 9320, 9330, 9340, 9350, 9360, 9399
Computers and Peripherals 2000, 2100, 2110, 2111, 2112, 2119, 2120, 2121, 2122, 2123, 2124, 2125, 2126,2130, 2140, 2141, 2142, 2143, 2144, 2149, 2220, 2230, 2234, 2236, 2238, 2239, 2250, 2255, 2260, 2280,2290, 2295, 2299, 2500, 2510, 2511, 2512, 2513, 2519, 2520, 2521, 2522, 2523, 2524, 2529, 2530, 2531,2532, 2533, 2539, 2540, 2541, 2542, 2543, 2546, 2549, 2550, 2551, 2552, 2553, 2559, 2560, 2561, 2562,2563, 2564, 2569, 2590, 3170
Consumer Products and Services 2812, 2832, 7000, 7300, 7310, 7320, 7330, 7340, 7399, 7400, 7410, 7420,7430, 7431, 7432, 7433, 7434, 7450, 7499, 7500, 7510, 7520, 7530, 7540, 7550, 7560, 7599, 7999
Computer Software 1563, 2200, 2210, 2300, 2311, 2312, 2313, 2315, 2316, 2317, 2318, 2319, 2320, 2321,2322, 2323, 2324, 2325, 2399, 2700, 2710, 2711, 2712, 2713, 2716, 2719, 2720, 2721, 2722, 2723, 2724,2729, 2730, 2731, 2732, 2733, 2734, 2735, 2736, 2737, 2738, 2739, 2740, 2741, 2743, 2744, 2748, 2749,2750, 2751, 2752, 2753, 2754, 2755, 2780, 2781, 2782, 2783, 2784, 2785, 2798, 2799, 2900, 2910, 2911,2990, 8250
Electronics/Instrumentation 3000, 3100, 3160, 3200, 3300, 3310, 3400, 3420, 3499, 3500, 3510, 3599,3700, 3710, 3720, 3799, 3800, 3810, 3820, 3830, 3835, 3899
Financial Services 2816, 2836, 9200, 9210, 9220, 9230, 9235, 9240, 9250, 9254, 9255, 9299
Healthcare Services 2820, 2840, 5400, 5410, 5412, 5414, 5420, 5429, 5430, 5440, 5499
Industrial/Energy 2819, 2837, 2839, 6000, 6100, 6200, 6300, 6400, 6410, 6420, 6430, 6499, 6500, 6510,6511, 6512, 6520, 6530, 6540, 6599, 6600, 6700, 6710, 6720, 6799, 6800, 6900, 8000, 8100, 8110, 8111, 8112,8113, 8114, 8115, 8119, 8120, 8121, 8129, 8130, 8140, 8143, 8144, 8145, 8146, 8147, 8148, 8149, 8150, 8151,8152, 8160, 8161, 8162, 8170, 8189, 8199, 8200, 8210, 8220, 8221, 8230, 8240, 8260, 8299, 8300, 8310,8320, 8330, 8340, 8350, 8360, 8370, 8399, 8500, 8510, 8520, 8530, 8599, 8600, 8700, 9000, 9100, 9110,9120, 9125, 9130, 9140, 9150, 9160, 9180, 9199, 9400, 9410, 9415, 9420, 9430, 9440, 9460, 9470, 9499,9500, 9510, 9520, 9530, 9540, 9599, 9600, 9700, 9710, 9720, 9730, 9740, 9750, 9799, 9800, 9810, 9820,9830, 9899
Thomson Reuters 87
Industry analysis is based upon the following industry sectors: Biotechnology, Business Products and Services,Computers and Peripherals, Consumer Products and Services, Computer Software, Electronics/Instrumentation,Financial Services, Healthcare Services, Industrial/Energy, IT Services, Media and Entertainment, MedicalDevices and Equipment, Networking and Equipment, Retailing/Distribution, Semiconductors, Telecommunicationsand Other. These sectors are based on the 17 industry classifications of the MoneyTree™ Report byPricewaterhouseCoopers and the National Venture Capital Association based on data from Thomson Reuters.
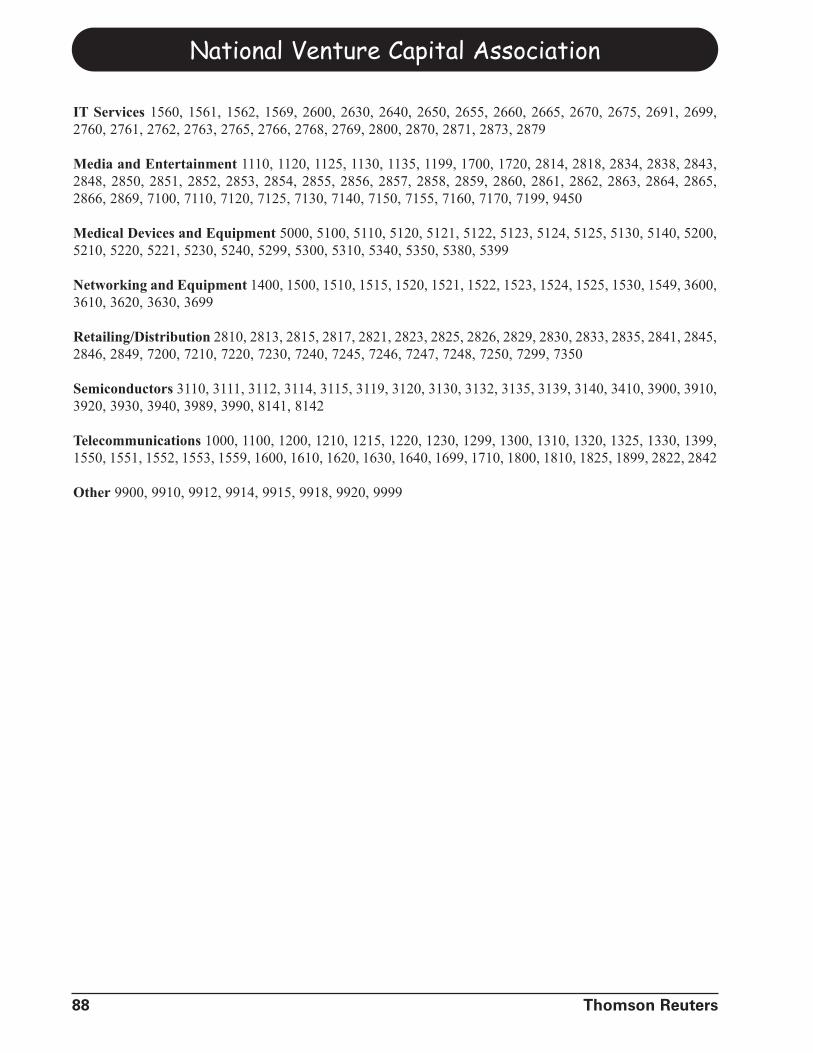
IT Services 1560, 1561, 1562, 1569, 2600, 2630, 2640, 2650, 2655, 2660, 2665, 2670, 2675, 2691, 2699,2760, 2761, 2762, 2763, 2765, 2766, 2768, 2769, 2800, 2870, 2871, 2873, 2879
Media and Entertainment 1110, 1120, 1125, 1130, 1135, 1199, 1700, 1720, 2814, 2818, 2834, 2838, 2843,2848, 2850, 2851, 2852, 2853, 2854, 2855, 2856, 2857, 2858, 2859, 2860, 2861, 2862, 2863, 2864, 2865,2866, 2869, 7100, 7110, 7120, 7125, 7130, 7140, 7150, 7155, 7160, 7170, 7199, 9450
Medical Devices and Equipment 5000, 5100, 5110, 5120, 5121, 5122, 5123, 5124, 5125, 5130, 5140, 5200,5210, 5220, 5221, 5230, 5240, 5299, 5300, 5310, 5340, 5350, 5380, 5399
Networking and Equipment 1400, 1500, 1510, 1515, 1520, 1521, 1522, 1523, 1524, 1525, 1530, 1549, 3600,3610, 3620, 3630, 3699
Retailing/Distribution 2810, 2813, 2815, 2817, 2821, 2823, 2825, 2826, 2829, 2830, 2833, 2835, 2841, 2845,2846, 2849, 7200, 7210, 7220, 7230, 7240, 7245, 7246, 7247, 7248, 7250, 7299, 7350
Semiconductors 3110, 3111, 3112, 3114, 3115, 3119, 3120, 3130, 3132, 3135, 3139, 3140, 3410, 3900, 3910,3920, 3930, 3940, 3989, 3990, 8141, 8142
Telecommunications 1000, 1100, 1200, 1210, 1215, 1220, 1230, 1299, 1300, 1310, 1320, 1325, 1330, 1399,1550, 1551, 1552, 1553, 1559, 1600, 1610, 1620, 1630, 1640, 1699, 1710, 1800, 1810, 1825, 1899, 2822, 2842
Other 9900, 9910, 9912, 9914, 9915, 9918, 9920, 9999
National Venture Capital Association
88 Thomson Reuters
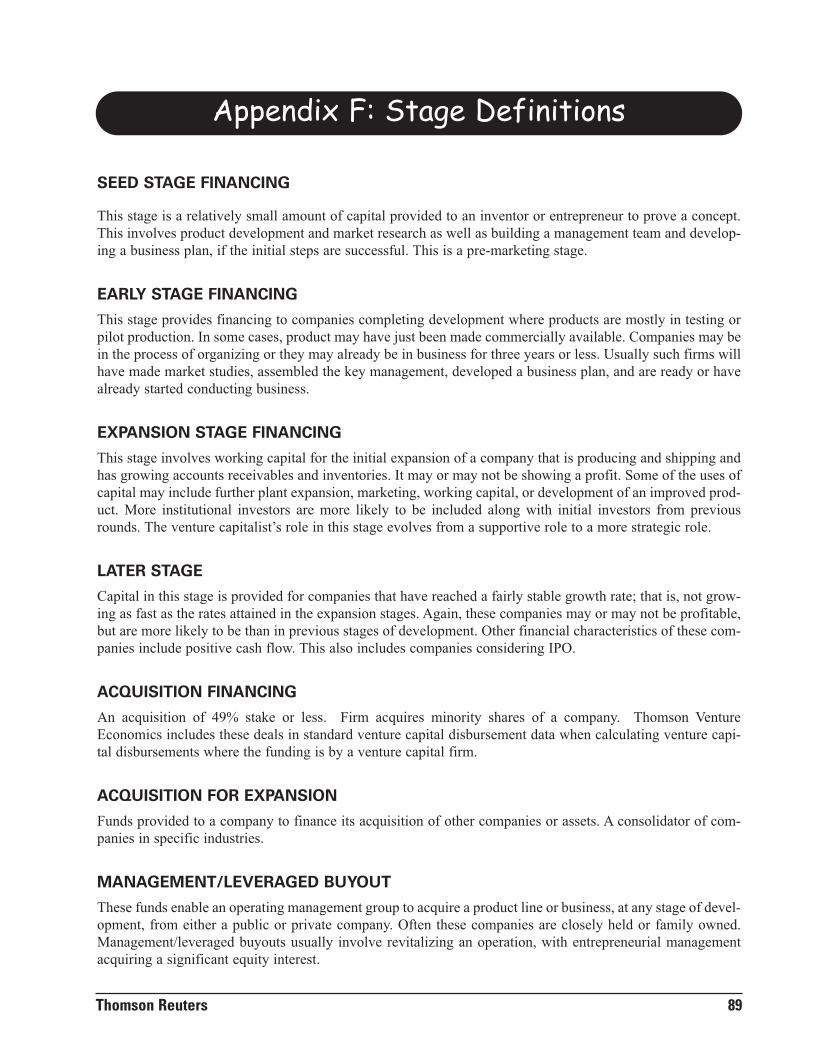
Appendix F: Stage Definitions
SEED STAGE FINANCING
This stage is a relatively small amount of capital provided to an inventor or entrepreneur to prove a concept.This involves product development and market research as well as building a management team and develop-ing a business plan, if the initial steps are successful. This is a pre-marketing stage.
EARLY STAGE FINANCING
This stage provides financing to companies completing development where products are mostly in testing orpilot production. In some cases, product may have just been made commercially available. Companies may bein the process of organizing or they may already be in business for three years or less. Usually such firms willhave made market studies, assembled the key management, developed a business plan, and are ready or havealready started conducting business.
EXPANSION STAGE FINANCING
This stage involves working capital for the initial expansion of a company that is producing and shipping andhas growing accounts receivables and inventories. It may or may not be showing a profit. Some of the uses ofcapital may include further plant expansion, marketing, working capital, or development of an improved prod-uct. More institutional investors are more likely to be included along with initial investors from previousrounds. The venture capitalist’s role in this stage evolves from a supportive role to a more strategic role.
LATER STAGE
Capital in this stage is provided for companies that have reached a fairly stable growth rate; that is, not grow-ing as fast as the rates attained in the expansion stages. Again, these companies may or may not be profitable,but are more likely to be than in previous stages of development. Other financial characteristics of these com-panies include positive cash flow. This also includes companies considering IPO.
ACQUISITION FINANCING
An acquisition of 49% stake or less. Firm acquires minority shares of a company. Thomson VentureEconomics includes these deals in standard venture capital disbursement data when calculating venture capi-tal disbursements where the funding is by a venture capital firm.
ACQUISITION FOR EXPANSION
Funds provided to a company to finance its acquisition of other companies or assets. A consolidator of com-panies in specific industries.
MANAGEMENT/LEVERAGED BUYOUT
These funds enable an operating management group to acquire a product line or business, at any stage of devel-opment, from either a public or private company. Often these companies are closely held or family owned.Management/leveraged buyouts usually involve revitalizing an operation, with entrepreneurial managementacquiring a significant equity interest.
Thomson Reuters 89

RECAP/ TURNAROUNDFinancing provided to a company at a time of operational or financial difficulty with the intention of improv-ing the company’s performance.
SECONDARY BUYOUT
A buyout deal on top of a buyout deal. Secondary buyouts are distinguished when the initial firm investor isdifferent from the current investing firm.
National Venture Capital Association
90 Thomson Reuters
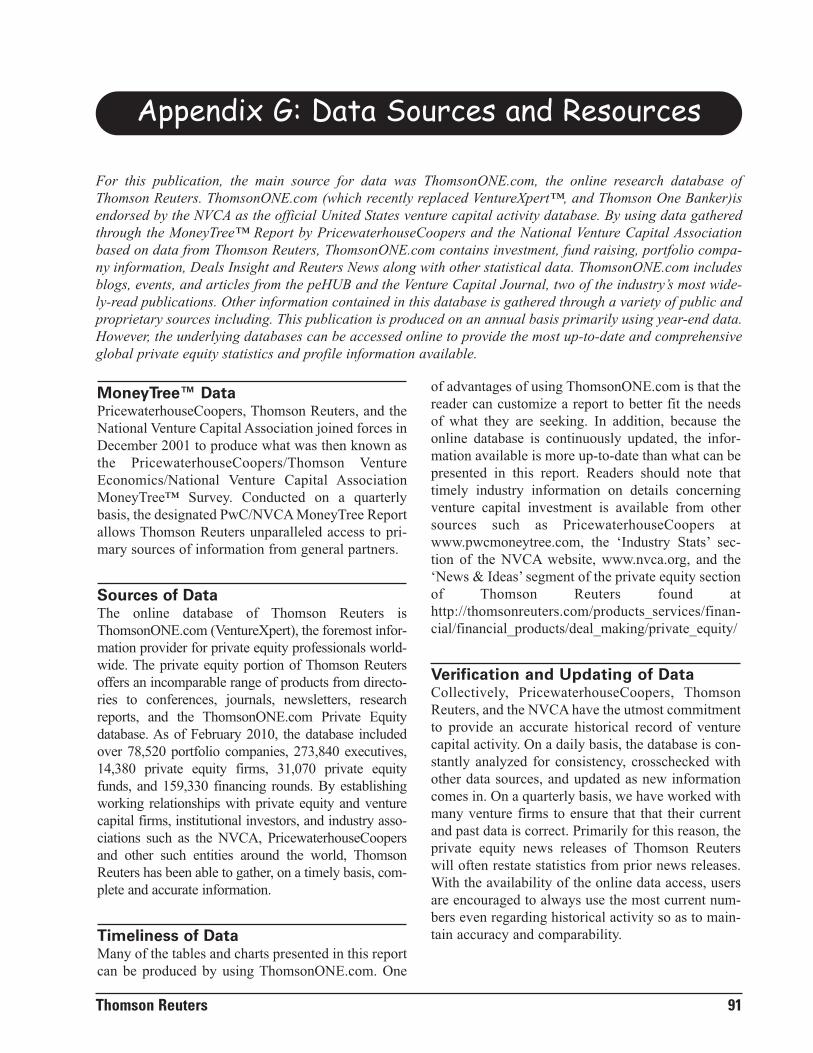
Appendix G: Data Sources and Resources
MoneyTree™ DataPricewaterhouseCoopers, Thomson Reuters, and theNational Venture Capital Association joined forces inDecember 2001 to produce what was then known asthe PricewaterhouseCoopers/Thomson VentureEconomics/National Venture Capital AssociationMoneyTree™ Survey. Conducted on a quarterlybasis, the designated PwC/NVCA MoneyTree Reportallows Thomson Reuters unparalleled access to pri-mary sources of information from general partners.
Sources of DataThe online database of Thomson Reuters isThomsonONE.com (VentureXpert), the foremost infor-mation provider for private equity professionals world-wide. The private equity portion of Thomson Reutersoffers an incomparable range of products from directo-ries to conferences, journals, newsletters, researchreports, and the ThomsonONE.com Private Equitydatabase. As of February 2010, the database includedover 78,520 portfolio companies, 273,840 executives,14,380 private equity firms, 31,070 private equityfunds, and 159,330 financing rounds. By establishingworking relationships with private equity and venturecapital firms, institutional investors, and industry asso-ciations such as the NVCA, PricewaterhouseCoopersand other such entities around the world, ThomsonReuters has been able to gather, on a timely basis, com-plete and accurate information.
Timeliness of DataMany of the tables and charts presented in this reportcan be produced by using ThomsonONE.com. One
of advantages of using ThomsonONE.com is that thereader can customize a report to better fit the needsof what they are seeking. In addition, because theonline database is continuously updated, the infor-mation available is more up-to-date than what can bepresented in this report. Readers should note thattimely industry information on details concerningventure capital investment is available from othersources such as PricewaterhouseCoopers atwww.pwcmoneytree.com, the ‘Industry Stats’ sec-tion of the NVCA website, www.nvca.org, and the‘News & Ideas’ segment of the private equity sectionof Thomson Reuters found athttp://thomsonreuters.com/products_services/finan-cial/financial_products/deal_making/private_equity/
Verification and Updating of Data Collectively, PricewaterhouseCoopers, ThomsonReuters, and the NVCA have the utmost commitmentto provide an accurate historical record of venturecapital activity. On a daily basis, the database is con-stantly analyzed for consistency, crosschecked withother data sources, and updated as new informationcomes in. On a quarterly basis, we have worked withmany venture firms to ensure that that their currentand past data is correct. Primarily for this reason, theprivate equity news releases of Thomson Reuterswill often restate statistics from prior news releases.With the availability of the online data access, usersare encouraged to always use the most current num-bers even regarding historical activity so as to main-tain accuracy and comparability.
Thomson Reuters 91
For this publication, the main source for data was ThomsonONE.com, the online research database ofThomson Reuters. ThomsonONE.com (which recently replaced VentureXpert™, and Thomson One Banker)isendorsed by the NVCA as the official United States venture capital activity database. By using data gatheredthrough the MoneyTree™ Report by PricewaterhouseCoopers and the National Venture Capital Associationbased on data from Thomson Reuters, ThomsonONE.com contains investment, fund raising, portfolio compa-ny information, Deals Insight and Reuters News along with other statistical data. ThomsonONE.com includesblogs, events, and articles from the peHUB and the Venture Capital Journal, two of the industry’s most wide-ly-read publications. Other information contained in this database is gathered through a variety of public andproprietary sources including. This publication is produced on an annual basis primarily using year-end data.However, the underlying databases can be accessed online to provide the most up-to-date and comprehensiveglobal private equity statistics and profile information available.
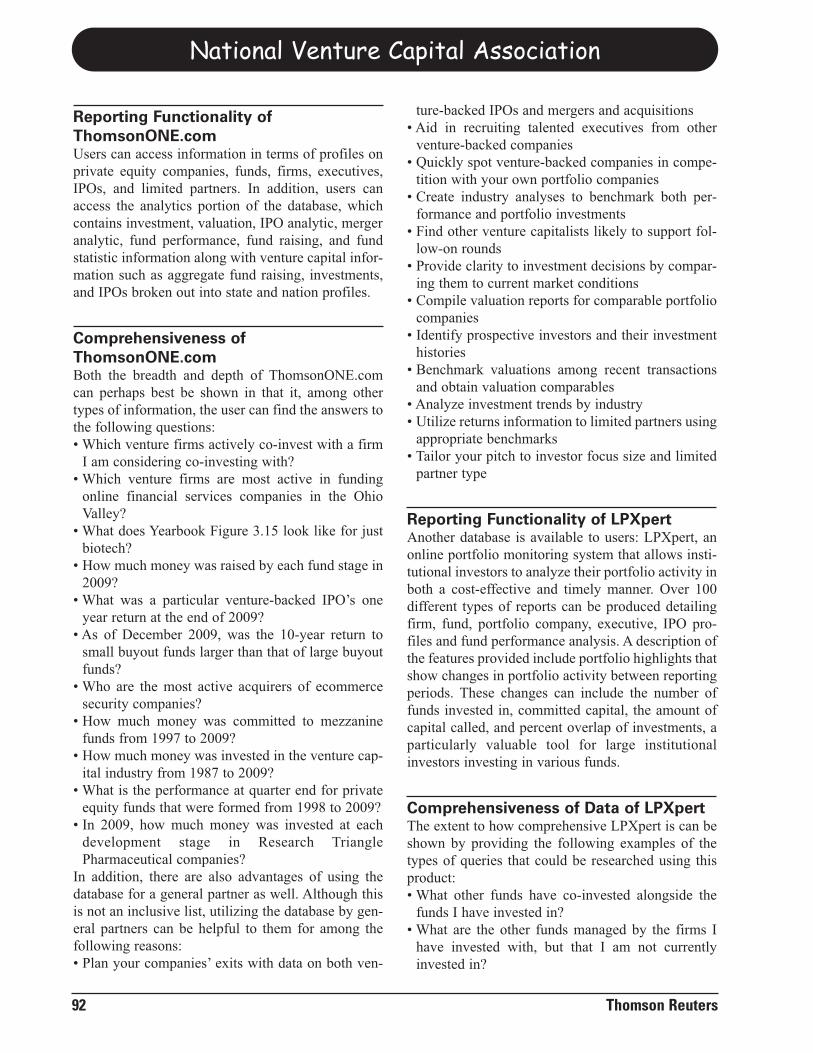
Reporting Functionality ofThomsonONE.comUsers can access information in terms of profiles onprivate equity companies, funds, firms, executives,IPOs, and limited partners. In addition, users canaccess the analytics portion of the database, whichcontains investment, valuation, IPO analytic, mergeranalytic, fund performance, fund raising, and fundstatistic information along with venture capital infor-mation such as aggregate fund raising, investments,and IPOs broken out into state and nation profiles.
Comprehensiveness ofThomsonONE.comBoth the breadth and depth of ThomsonONE.comcan perhaps best be shown in that it, among othertypes of information, the user can find the answers tothe following questions:• Which venture firms actively co-invest with a firm
I am considering co-investing with?• Which venture firms are most active in funding
online financial services companies in the OhioValley?
• What does Yearbook Figure 3.15 look like for justbiotech?
• How much money was raised by each fund stage in2009?
• What was a particular venture-backed IPO’s oneyear return at the end of 2009?
• As of December 2009, was the 10-year return tosmall buyout funds larger than that of large buyoutfunds?
• Who are the most active acquirers of ecommercesecurity companies?
• How much money was committed to mezzaninefunds from 1997 to 2009?
• How much money was invested in the venture cap-ital industry from 1987 to 2009?
• What is the performance at quarter end for privateequity funds that were formed from 1998 to 2009?
• In 2009, how much money was invested at eachdevelopment stage in Research TrianglePharmaceutical companies?
In addition, there are also advantages of using thedatabase for a general partner as well. Although thisis not an inclusive list, utilizing the database by gen-eral partners can be helpful to them for among thefollowing reasons:• Plan your companies’ exits with data on both ven-
ture-backed IPOs and mergers and acquisitions • Aid in recruiting talented executives from other
venture-backed companies• Quickly spot venture-backed companies in compe-
tition with your own portfolio companies• Create industry analyses to benchmark both per-
formance and portfolio investments• Find other venture capitalists likely to support fol-
low-on rounds• Provide clarity to investment decisions by compar-
ing them to current market conditions• Compile valuation reports for comparable portfolio
companies• Identify prospective investors and their investment
histories• Benchmark valuations among recent transactions
and obtain valuation comparables• Analyze investment trends by industry• Utilize returns information to limited partners using
appropriate benchmarks• Tailor your pitch to investor focus size and limited
partner type
Reporting Functionality of LPXpert Another database is available to users: LPXpert, anonline portfolio monitoring system that allows insti-tutional investors to analyze their portfolio activity inboth a cost-effective and timely manner. Over 100different types of reports can be produced detailingfirm, fund, portfolio company, executive, IPO pro-files and fund performance analysis. A description ofthe features provided include portfolio highlights thatshow changes in portfolio activity between reportingperiods. These changes can include the number offunds invested in, committed capital, the amount ofcapital called, and percent overlap of investments, aparticularly valuable tool for large institutionalinvestors investing in various funds.
Comprehensiveness of Data of LPXpertThe extent to how comprehensive LPXpert is can beshown by providing the following examples of thetypes of queries that could be researched using thisproduct:• What other funds have co-invested alongside the
funds I have invested in?• What are the other funds managed by the firms I
have invested with, but that I am not currentlyinvested in?
National Venture Capital Association
92 Thomson Reuters
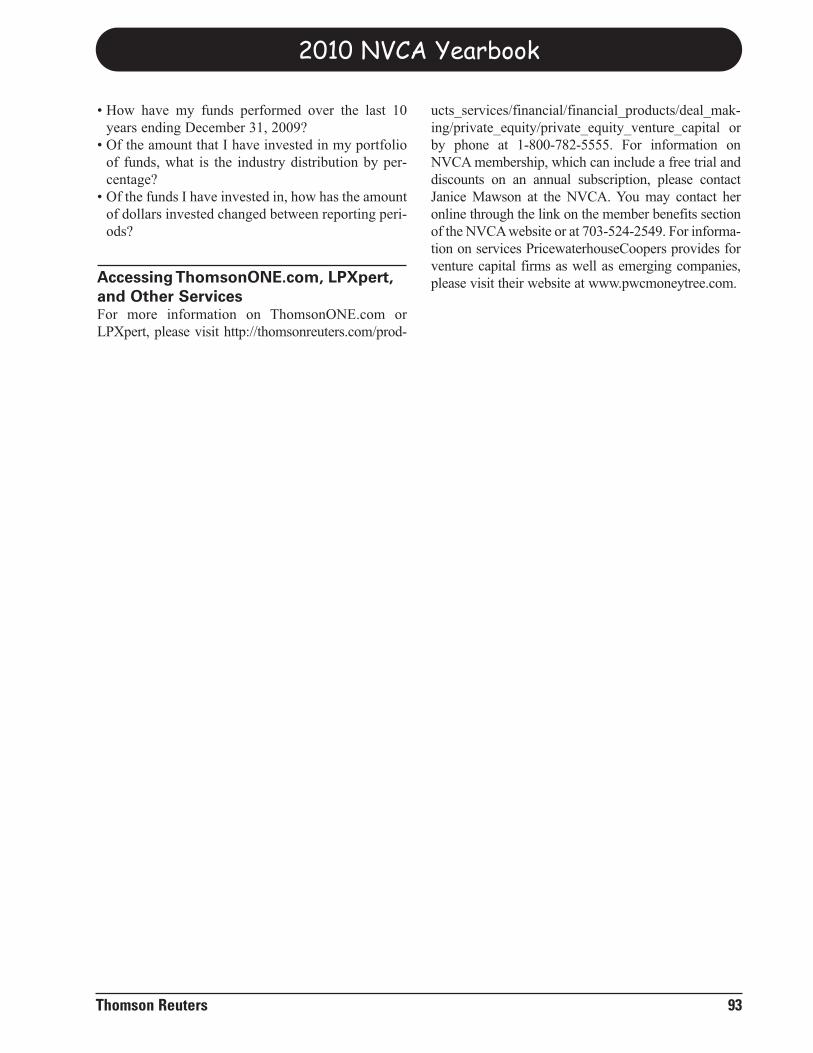
• How have my funds performed over the last 10years ending December 31, 2009?
• Of the amount that I have invested in my portfolioof funds, what is the industry distribution by per-centage?
• Of the funds I have invested in, how has the amountof dollars invested changed between reporting peri-ods?
Accessing ThomsonONE.com, LPXpert,and Other ServicesFor more information on ThomsonONE.com orLPXpert, please visit http://thomsonreuters.com/prod-
ucts_services/financial/financial_products/deal_mak-ing/private_equity/private_equity_venture_capital orby phone at 1-800-782-5555. For information onNVCA membership, which can include a free trial anddiscounts on an annual subscription, please contactJanice Mawson at the NVCA. You may contact heronline through the link on the member benefits sectionof the NVCA website or at 703-524-2549. For informa-tion on services PricewaterhouseCoopers provides forventure capital firms as well as emerging companies,please visit their website at www.pwcmoneytree.com.
2010 NVCA Yearbook
Thomson Reuters 93

National Venture Capital Association
94 Thomson Reuters
This page is intentionally left blank.
Appendix H: Portfolio Company Valuation Guidelines
Guidelines fall into two categories. The first is port-folio performance presentation formats, calculations,and disclosure. An example of the former is thePrivate Equity Provisions of the Global InvestmentPerformance Standards (GIPS). This was developedby the CFA Institute. While many of the specifica-tions and terminology line up with current practice inthe United States, the NVCA has not endorsed or oth-erwise commented on these standards. NeitherNVCA nor Thomson Reuters has determined howwidespread the adoption of those standards is or willlikely be. This document and accompanying guid-ance can be currently found at http://www.cfainsti-tute.org/centre/codes/gips/.
Much more attention is being paid to the other cat-egory: portfolio company valuation guidelines.The chronology and sections below refer to thiscategory. Suffice it to say for now that portfoliovaluation guidelines developed by the PrivateEquity Industry Guidelines Group (PEIGG,www.peigg.org/home.html > Valuations), mostrecently revised in March 2007, are the most com-monly referred to in the US. An unrelatedEuropean consortium has created “international”guidelines which they intend to conform to IASBrules. That version has received little attention inthe US.
Why Valuation Guidelines Matter
What ultimately matters to the investors and privateequity practitioners is the cash which has been dis-tributed to the investors during the life of the fundcompared with the original money put in. However,
the life of a typical venture fund is at least 10 years,longer in the life sciences arena. During that periodthe venture capital fund reports progress to the lim-ited partners. In many cases, this means quarterlyportfolio updates and a complete audited annualfinancial statement. For a typical venture fund, verylittle money is paid out in the first four or five years.Also, while every portfolio company receives fund-ing with high expectations, it can take several yearsto determine if a particular company is a likely win-ner. Therefore, understanding progress in the portfo-lio requires some estimate of the success of theinvestee companies by the venture capital or privateequity firm. While many investors and fund man-agers agree that financial measurements mean littlefor the first three or so years of a fund, after that thefund wants to communicate progress to theinvestors. This is where specific valuation rules andprocesses become important. The agreed valuationprocedures for individual portfolio companiesbecome the basis for progress assessment as the fundmatures and ultimately distributes cash to theinvestors.
So while portfolio company valuations are more ofan art than a science, especially for pre-revenue oreven pre-EBITDA companies, most limited partneragreements (LPAs) establishing a venture capitalfund require the venture firm to provide quarterlyand annual financial statements using GenerallyAccepted Accounting Principles (GAAP). GAAPrequires fair value measurement for portfolio posi-tions. Therefore, most GPs must issue financial state-ments using fair value.
Thomson Reuters 95
In the United States, a venture capital fund is usually organized as a limited partnership. The institutionalinvestors providing capital to a fund typically become limited partners (LPs). The venture firm becomes a gen-eral partner (GP) in the limited partnership. In most of the limited partnership agreements defining GP-LPrelationship, the GPs are required to provide financial reports quarterly (unaudited) and annually (audited)prepared according to United States Generally Accepted Accounting Principles (“GAAP”). GAAP generallyrequires the use of investment company accounting which mandates that a fair value to be assigned to the indi-vidual portfolio companies. This is consistent with the LPs need for fair values of their investments as well as3rd party or regulatory requirements, e.g., ERISA-regulation.
The Evolution of Valuation Guidelines:1989 to 2009
This section reviews the various efforts to createcomprehensive portfolio company valuation guide-lines for US private equity.
1989-1990 – A group of investors, private equityfund managers, and fund-of-fund managers formed agroup to develop a set of portfolio company valua-tion guidelines. Contrary to a very persistent rumor,the NVCA did not endorse, adopt, bless, publish, orotherwise opine on the guidelines.
Decade of the 1990s – Two noteworthy develop-ments occurred in the 1990s. Despite no endorsementby the NVCA these guidelines became accepted prac-tice by much of the US industry, especially in the ven-ture capital side of private equity. These guidelineswere referred to by many as being issued by theNVCA but in fact they were not. The second develop-ment is international venture associations creatinglocalized guidelines based heavily on these guide-lines. These were created in Europe and other interna-tional regions. In fact, by 2005, there had been multi-ple iterations of the European and British guidelines.
2003 – A self-appointed group of private equity prac-titioners, fund managers, fund-of-fund managers andothers formed the Private Equity Industry GuidelinesGroups (PEIGG). The overall constitution of thisgroup is not hugely different from the 1989-1990group. The PEIGG group announced that it was con-templating taking on four initiatives, of which port-folio company valuation guidelines was the first one.
December 2003 – After an extensive input phase andreview by various industry groups and serviceproviders, the first version of the PEIGG guidelineswere issued. Throughout the process PEIGG hadbeen actively soliciting feedback and input from anumber of industry groups including the NVCA.
March 2004 – NVCA board issued statement of sup-port, but not endorsement as some pundits hadhoped. NVCA position was widely consistent withinput provided by members of the NVCA CFO TaskForce, members at large, and the NVCA Board ofDirectors. The text of NVCA’s statement is printedbelow.
March/April 2004 – The Institutional LimitedPartners Association (ILPA) hails NVCA support aswelcome support – especially as it relates to the GPand LPs mutually agreeing to the valuation process.PEIGG also hails the NVCA support.
July 2004 – After consulting quietly with variousindustry groups, PEIGG issues guidance on contro-versial paragraph 30 which was the most discussedand debated provision in the guidelines.
September 2004 – Based on input from ILPA andothers, PEIGG agrees to minor wording changes intwo paragraphs. This becomes PEIGG guidelines ver-sion 2. These two wording changes were consistentwith, and in part inspired by, language the NVCAboard used in its March 2004 statement of support.
October 2004 – ILPA endorses the PEIGG guidelines.
December 2004 – As most fund accounting year’s end,GPs prepare for their first audits since the effective dateof AICPA’s SAS 101 rule. Essentially that rule says thatif a reporting entity claims to be reporting “fair value”– which is required by GAAP – then the auditors mustdocument and test that this is, in fact, true. It was notclear to what extent this increased scrutiny would affectvaluation expectation and practices.
March 2005 – NVCA board issues an updated state-ment, which now refers to the September 2004 ver-sion of the PEIGG guidelines. The NVCA also decid-ed to make the PEIGG document widely available toits members. The text of that statement is below.
April 2006 – Guidelines issued by a consortium ofthree Europe-based venture capital associations(AFIC, BVCA, EVCA) are released. The authors citecompliance with IASB rules. Informal feedback fromUS venture capital professionals reviewing this docu-ment was that the document was more formulaic thanPEIGG’s counterpart and only partially compliantwith US GAAP as defined at that time. Subsequently,30 non-US private equity and venture capital associa-tions endorsed this document. Go to http://www.priva-teequityvaluation.com. The most recent edition isOctober 2006. These guidelines have gotten little trac-tion in the US and expected to be updated in 2009.
September 2006 – Financial Accounting Standards
National Venture Capital Association
96 Thomson Reuters
Board (FASB) issues its long-awaited and long-antici-pated fair value measurement standard as FAS 157.Only a few of its 145 pages relate directly to typicalventure capital and private equity funds. Because FASBmaintains that this is a clarification and further defini-tion of fair value which was already required for portfo-lio accounting, some auditors began requiring selectivecompliance in advance of the 2008 effective date.
March 2007 – PEIGG issues a revised portfoliocompany valuation guidelines document to reflectthe Fair Value Measurement standard (FAS 157).
September 2007 – NVCA board reaffirms its priorposition on the PEIGG guidelines to refer to the mostrecent version.
March 2008 – the International Private EquityValuation & Venture Capital Valuation (IPEV) Boardreconstitutes and re-launches itself, expanded toinclude 5 practitioners from the United States. Theinitial focus of the group is on convergence of USPEIGG and IPEV valuation guidelines. Details atwww.privateequityvaluation.com.
August 2008 – SEC proposes a roadmap toward
global accounting standards and publishes for publiccomment the concept of adoption of InternationalFinancial Reporting Standards. Details are athttp://www.sec.gov/news/press/2008/2008-184.htm.
September 2008 – At this point, visible signs of avaluation whirlpool are hard to miss. This changedwhat appeared a couple of months earlier to be a gen-erally painless implementation of FAS 157 to a fluidenvironment with no precedent and little guidance.
December 2008 - The decreases in public marketvaluations accelerate. This makes valuation of evenon-track, pre-revenue companies tricky. The NVCAissues a one page information letter to its members toshed light on applying FAS 157 in a valuationmicroburst/whirlpool. (Text below)
July 2009 – Effective July 1, authoritative GAAPbecame contained in a single Codification and theprior nomenclature went away. Existing US GAAPwas recast in 90 topics which include all relatedFASB pronouncements, AICPA guidance and EITFsunder single “Topics.” Familiar standards will nolonger exist. For example, FAS157 is now Topic 820Fair Value Measurements and Disclosure.
2010 NVCA Yearbook
Thomson Reuters 97
OVERVIEW
Introduction
1. As the U.S. private equity industry (defined as ven-ture, buyout, mezzanine, and other investments in pri-vate companies) has grown and matured, its partici-pants have become increasingly interested in theappropriate reporting of fund values. The interest
stems from a number of sources, such as an investor’sdesire to measure interim performance, investor’s needfor fair value data to report investments in their ownfinancial statements, a manager’s need to report andmeasure valuations in accordance with fund agree-ments, and the need to determine the allocation of dis-tributions of fund realizations. This has led toincreased scrutiny of portfolio company values and theneed for greater consistency of valuation methodolo-gies employed by managers of private equity funds.However, by its very nature private equity is an assetclass in which judgment plays a significant role.Accordingly, investors in the same company may havedifferent, but supportable, views on valuation.
2. The objective of the Updated U.S. Private EquityValuation Guidelines (“Guidelines”) is to providemanagers a framework for valuing investments inportfolio companies at fair value and to providegreater consistency within the private equity industrywith regard to valuations. Historically there were few
The PEIGG GuidelinesWhile the NVCA has not specifically endorsed thePEIGG portfolio company valuation guidelines (seestatement in next section below), it believes that theguidelines document should be readily accessible to itsmembers for reference and use. Be sure to refer towww.peigg.org for the latest version and guidance onthe document. The NVCA thanks the members ofPEIGG for their efforts and for their permission toreprint the guidelines here. The guidelines as updatedin March 2007 to reflect FAS 157 are printed below.
authoritative guidelines compliant with U.S. general-ly accepted accounting principles (GAAP) thatrequired specific procedures for estimating fair valueof investments in portfolio companies held by privateequity investors. In September, 2006, the FinancialAccounting Standards Board released Statement ofFinancial Accounting Standards No. 157, Fair ValueMeasurements. The Updated U.S. Private EquityValuation Guidelines are intended to assist managersin their estimation of fair value and are intended to beconsistent with GAAP (FASB Statement No. 157)and the AICPA Audit and Accounting Guide - Auditsof Investment Companies. The AICPA Guide’s defi-nition of Investment Companies includes PrivateEquity Investors (paragraph 1.03) and requires invest-ments to be reported at fair value (paragraph 1.32).
3. These Guidelines were created jointly by managers(i.e., general partners) and investors (i.e., limited part-ners) incorporating feedback from a wide number ofindustry participants. The Guidelines are not intend-ed to be all encompassing, nor are they intended toeliminate all subjectivity. Rather, they are to be aguide to assist managers and investors in agreeing toa valuation framework while allowing a manager toexercise its best judgment in applying the Guidelines.
4. Included in these Guidelines are terms that are sub-jective in nature, such as materiality, and could havedifferent meanings in various factual situations.While it is outside the scope of these Guidelines toforce specific definitions upon its users, the manager,in consultation with the Valuation Policy Committee(as discussed below) may develop and documentappropriate definitions of these subjective terms.
5. The Guidelines are not intended in any way tomodify the provisions of the fund agreement relat-ing to the subject matter hereof. To the extent theGuidelines are adopted by a manager and aValuation Policy Committee and in one or morerespects the Guidelines are inconsistent with thefund agreement, the fund agreement would govern(absent a specific amendment thereto).
Fair Value Concept6. The Guidelines seek to have all investments inportfolio companies reported at fair value on a con-sistent, transparent and prudent basis. Fair value as
defined in accordance with GAAP is “the price thatwould be received to sell an asset or paid to transfera liability in an orderly transaction between marketparticipants at the measurement date” (FASBStatement No. 157, paragraph 5). The objective isto estimate the exchange price at which hypotheticalwilling marketplace participants would agree totransact in the principal market, or lacking a princi-pal market, the most advantageous market. No mat-ter which market is deemed most appropriate, fairvalue is the estimated “exit price” in that market.
7. Securities of private companies, by definition,will not have quoted market prices available.However, private companies at times engage inarm’s-length transactions for issuances of theirequity or debt securities. The value of these trans-actions could serve as an observable market pricesimilar to a quoted market price if the transaction isboth recent and between willing parties for the samesecurities as those for which the fair value determi-nation is being made (deemed a level 2 input byFASB Statement No. 157), and could therefore beused as an estimate of the theoretical exit price.
8. When quoted market prices or arm’s-length trans-action prices as described above are not available,the estimate of fair value should incorporate all rea-sonably available information about the businessand utilize assumptions that market participantswould normally use in their estimates of value. Theestimate of fair value should seek to best replicatethe amount at which the investment could be sold ina current transaction between willing parties.
9. In determining the fair value of individual invest-ments using these Guidelines, managers are expectedto use their judgment. In utilizing judgment, sub-stance takes precedence over form. For example,when a manager’s past experience indicates that liq-uidation preferences will likely be renegotiated ormay not be fully enforced at the time of liquidation,the manager is strongly encouraged to use the expect-ed results rather than the form of the agreement.
10. Valuations should be updated on each measure-ment date, generally on a quarterly basis. Of course,valuations used for annual and quarterly perform-ance reporting should be used in private placement
National Venture Capital Association
98 Thomson Reuters
memorandums and other marketing materials.
Valuation Policy Committee11. These Guidelines acknowledge the perceptionthat bias exists or has the potential to exist in a non-independent (versus independent) valuation per-formed by a fund’s manager. As a result, it is recom-mended that the manager of each private equity fundestablish a Valuation Policy Committee consisting ofa subset of the fund’s investor representatives. TheValuation Policy Committee could be all of, or a por-tion of, a fund’s advisory committee, if such a com-mittee exists. (Neither these Guidelines nor GAAPrequire managers to obtain independent valuations).
12. The fund manager, in consultation with theValuation Policy Committee, should establish thewritten valuation parameters to be consistently fol-lowed by the fund’s manager using theseGuidelines. The agreed upon valuation policy anddeviations from that policy should be communicat-ed to the Valuation Policy Committee and the limit-ed partners by the manager. Private equity fundmanagers are solely responsible for establishing anddocumenting valuation policy, practices, proceduresand methodologies as well as valuing their invest-ments in portfolio companies The Valuation PolicyCommittee should not set, formulate or approve thevaluations, except as required by the fund agree-ment. The Valuation Policy Committee should peri-odically discuss the level of the manager’s adher-ence to the fund’s valuation policy parameters.
II. PRIVATE COMPANY VALUATIONMETHODOLOGIES
General Guidelines
13. Managers are to fairly value the investments intheir portfolio companies on a consistent, transparentand prudent basis. Since value is often realizedthrough a liquidity event of the entire company, thevalue of the company as a whole at the reporting datewill often provide the best evidence of the value ofthe investment in that company. As a result, themethodologies discussed in this section involve esti-mating the value of the company as a whole as an ini-tial step for valuing the company’s privately issuedsecurities. The manager will then need to determine
how the total enterprise value is distributed amongthe various securities of the company.
14. Managers of funds should, without undue costand effort, contact other sophisticated investors todiscuss the valuations of common investments andthe factors considered in their valuations. However,managers are not required to use other investors’valuations since the estimate of fair value is theresponsibility of the managers.
15. To value an investment, managers should placethe most weight on valuation methodologies that areclearly objective and timely. On each valuation datemanagers need to take into account available infor-mation from market participants, the relevant mar-ketplace and the global economy along with specif-ic facts and circumstances in determining the fairvalue of their investments.
16. Historically, the Private Equity Industry usedcost or the value of the latest round of financing asan approximation of fair value; often without takinginto account other facts and circumstances. Such anapproach is incompatible with the concept of fairvalue described above. At each valuation date amanager must make a determination of fair valuefor each investment. As further outlined below,these Guidelines provide a consistent and transpar-ent methodology for determining fair value.However, a manager may conclude, after consider-ing the facts and circumstances as outlined below,that the best indication of fair value is provided bycost or the value of the latest round of financing.
17. FASB Statement No. 157 allows managers toutilize three valuation techniques, either alone or incombination. These Guidelines encourage man-agers to use the “market approach” in most situa-tions (see FASB Statement No. 157, paragraph 18a)utilizing Comparable Company Transactions orPerformance Multiple inputs, as the primary tech-nique to estimate the fair value of equity securitiesin private companies. For Private Equity, the mar-ket approach usually is the most appropriate. 18. In addition to the market approach technique dis-cussed above, there are other valuation methodologies,some of which are discussed in paragraphs 41 and 42.These other methodologies or techniques may be
2010 NVCA Yearbook
Thomson Reuters 99
appropriate in certain circumstances, and include dis-counting cash flows, valuing net assets, and industry-specific benchmarking (described in FASB StatementNo.157 as the income and cost approaches).
19. Other valuation matters, including valuing inter-est bearing securities, PIK dividends, warrants, liq-uidation preferences, convertible securities, escrows,and other rights, privileges and preferences of pre-ferred securities are discussed in paragraph 47.
20. Determination of valuation adjustments shouldtypically be based upon actual positive and negativeevents, not upon expected accomplishments andperformance.
21. Regardless of the valuation methodology used,once used, it should continue to be used until a newmethodology will provide a better approximation ofthe investment’s current fair value. It is expectedthat there would not be frequent changes in valua-tion methodology.
Cost / Latest Round of Financing22. While entry prices and exit prices are differentconceptually, for the Private Equity Industry theseGuidelines presume the manager at the time of theinitial investment has considered near term compa-ny performance in determining investment valua-tion. Therefore, cost (the transaction price) may befair value (the exit price) upon purchase. The trans-action price may not represent fair value upon pur-chase when:
a) The transaction is between related parties;b) The transaction occurs under duress;c) The transaction price includes transaction costs(transaction costs are expensed under GAAP);d) The market in which the initial transaction takesplace is different than the principal or most advan-tageous market in which the exit transaction wouldtake place.
23. Managers should reconsider a company’s fairvalue in connection with each material equityfinancing, regardless of the manager’s participation.The value of the last round of financing is a factorin determining fair value, but it is not necessarilythe only factor.
24. A subsequent equity financing that includessubstantially the same group of investors as theprior financing is an appropriate factor to considerin valuing prior investments unless it can be demon-strated that the financing no longer represents fairvalue. This approach may be different from historicpractice, where, typically the value of prior invest-ments was not increased in a subsequent higherpriced financing round unless a new investor ‘vali-dated’ the new pricing.
25. If a private financing will be completed with ahigh degree of certainty in the near future, and the pric-ing of the transaction has been substantially agreed, toestablish the value of a previous investment, a manag-er should consider their best estimate of the upcomingnew financing if it can be objectively determined thatthe prospective financing is at fair value.
26. Occasionally a round of financing includes asignificant investment from a strategic investor pay-ing a premium due to benefits accruing uniquely toitself. The manager must evaluate whether such apremium is representative of what the most likelybuyers of the company would also pay upon exit,and therefore, whether the price paid by the strate-gic investor is deemed to be the exit price (fairvalue) expected from market participants.
Deviations from Cost / Latest Round of Financing27. After some period of time, cost or the latestround of financing becomes less reliable as anapproximation of fair value. Therefore, the manag-er must assess whether fair value has changed eventhough there has not been a new round of financing.Examples of changes in circumstances which indi-cate a change in fair value may include, but are notlimited to, the following:
a) The current performance of the company is signif-icantly above or below the expectations at the time ofthe original investment. Potential indicators of thissituation will include evaluation of the company’ssuccess or failure in attaining certain milestones,achieving technology breakthroughs, developing pro-prietary technology, progressing through clinical trialsor significantly exceeding or failing to meet budgets.
b) Market, economic or company specific conditions
National Venture Capital Association
100 Thomson Reuters
have significantly improved or deteriorated since thetime of the original investment. Potential indicatorsof this situation will include evaluation of broadchanges in the economic climate, changes in thefinancing markets, changes in the legal or regulatoryenvironment in which the company operates, changesin the company’s cost structure, increased ordecreased risk factors faced by the company, or sig-nificant fluctuations in share prices of quoted compa-nies operating in the same or a related industry.
c) Substantial decreases in the value of quoted,more senior securities of the company (e.g., publicdebt), defaults on any obligations of the company, abankruptcy filing, significant ownership dilutioncaused by recapitalization of the company, or liq-uidity concerns that are expected to be more thanshort term in nature are circumstances which mayindicate a potential impairment in value.
28. Estimating the extent of a change in fair value, ifany, may not easily lend itself to an analyticalprocess. As a result, the manager will be required toexercise prudent judgment and carefully consider thebroad indicators of potential changes to fair value(such as market conditions, relevant stock marketindices, and other factors as discussed above).
29. The result of such consideration will provideindications whether the carrying value of the invest-ment should be increased or decreased to representfair value. The longer that fair value has been esti-mated using cost or the price paid at the most recentround of financing, the more consideration shouldbe given to reviewing changed circumstances andpotentially determining fair value utilizing otherinputs. Managers may consider historic cost or theprice paid at the most recent round of financing inmaking their fair value determination, but shouldnot use cost or the most recent financing price as thesole determinate of fair value.
30. These Guidelines recognize that building long-term value in a private equity backed business is notan easy task. Usually, many positive events need tohappen in order for portfolio companies to succeed.However, managers often become aware that certainof their investments are likely to fail given theirinsight into the company. Even private companies
that have significant manager involvement face adaunting task to create value for investors. Thus, it isnatural that decreases in value may be more easilyidentified and justified than increases in value.However, both decreases and increases in investmentfair value should be recognized when warranted.Because of the difficultly in building sustainable,long-term value in a private equity backed business,increases in value should only be made where themanager can support the increase using the method-ologies discussed in these guidelines or using othertechniques common to the marketplace, rememberingthat fair value is defined as the exit price on the meas-urement date in a hypothetical transaction. Diligence,prudence and caution should be applied when valuingprivate companies, and in particular when consideringthe valuation write-up of early-stage companies, inthe absence of market-based financing events. Allsuch changes and the factors upon which the changesare made should be reviewed with the ValuationPolicy Committee. However, managers must recog-nize that there should be no bias toward either increas-ing or decreasing carrying value to record fair value.
31. When valuation adjustments are necessary, themethodology used should be based on relevant com-parable data wherever possible (“relevant compara-ble data” as used in these Guidelines is intended tobe consistent with the input hierarchy discussed inparagraphs 22-31 of FASB Statement No. 157).Recommended methodologies are discussed below.
Comparable Company Transactions32. This methodology involves deriving the valueof a company through examination of third-partyinvestments in comparable equity securities of thecompany, examination of transactions in equitysecurities of comparable companies and direct com-parisons to similar companies. These comparisonsshould be appropriately adjusted for any controlpremiums, synergistic benefits or other excess ben-efits or detriments that accrue to the owner whendetermining a proper comparable valuation.
33. These Guidelines acknowledge that until acompany achieves marketplace acceptance for itsproduct or service, it is unlikely that truly compara-ble companies with determinable fair values will bereadily identifiable.
2010 NVCA Yearbook
Thomson Reuters 101
34. To the extent comparable transactions cannot beascertained and fair value cannot be reasonablyassessed and reliably measured using comparabletransactions, the following Performance Multiplemethodology should be used, if applicable.
Performance Multiple35. The performance multiple methodology appliesa relevant multiple to the performance of the com-pany being valued in order to derive the value of thecompany. This approach is most applicable to com-panies that have achieved positive and sustainableoperating performance.
36. The valuation determined using this methodolo-gy is calculated by applying the most appropriate andreasonable multiple derived from reference to marketbased conditions of quoted companies or recent pri-vate transactions. The multiple to be used, whichmay need to be adjusted for differences in terms ofgrowth prospects and risk attributes (depending onthe size of the comparison sample, among other fac-tors), should be one of the following:
a) Current average comparable public companymultiple for similar companies in the industry;
b) Current average multiples for recent private trans-actions of similar companies in the industry; and
c) The original acquisition multiple when no othersimilar public or private multiples can be ascertained.
The most appropriate and reasonable multiple asdetermined above will be applied to the relevantoperating performance metrics of the company toestimate fair value.
37. The manager should be confident that reason-able, relevant and sustainable performance metricsare utilized, which may necessitate the adjustmentfor one-time and non-recurring items.
38. There may be significant changes in the finan-cial, regulatory, economic or legal climate in whichthe company operates which harm or enhance theprospects of the company, but these changes may notyet have affected performance. The manager needsto consider these changes in evaluating a company’s
sustainable performance. Managers should sharewith the Valuation Policy Committee the factual dataand their assumptions that support the sustainableperformance used in the valuation determination.
39. The multiples used should be those that are usedregularly and routinely to value companies in theindustry in which the subject company is operating.If the multiples used are derived from public compa-ny comparables, a discount to a private company’sequity value may be appropriate. Discounts appliedto private securities may be higher than those appliedto restricted public securities, which are discussed inparagraph 46. Managers should share with theValuation Policy Committee the factual data that gen-erates the multiples used in the valuation process.
40. To the extent fair value cannot be reasonablyassessed and reliably measured using performancemultiples, the following methodologies may be con-sidered.
Other Valuation Methodologies41. A few other valuation methodologies, which maybe appropriate in certain circumstances, are as follows:
a) Because of the need to use significant estimatesand forward-looking information, discounted cashflow (DCF) methodologies should only be used inlimited situations using a discount rate commensu-rate with the risks involved. These situations wouldinvolve instances where the methodologies previ-ously discussed in these Guidelines prove incapableof addressing the specific circumstances.
b) Net asset valuation methodologies should beused for valuing investments in businesses whosevalue is derived primarily from the underlying valueof their tangible assets rather than their performance.
c) Industry-specific benchmarks, which are customar-ily and routinely used in specific industries such asprice per subscriber or other industry norms, shouldonly be used in estimating fair value where appropriate.42. In those circumstances where there are indica-tions that a change in carrying value is appropriatebased on paragraph 27, but the methodologiesdescribed in paragraphs 32-41 are not applicable,the manager should exercise prudent judgment in
National Venture Capital Association
102 Thomson Reuters
considering assumptions that marketplace partici-pants would utilize in their estimate of fair value.
III. VALUATION OF PUBLICLY TRADEDSECURITIES
Unrestricted
43. Actively traded public equity and public debtsecurities are required to be valued at the closingprice or bid price, except as discussed below. Activemarkets are defined as a market in which transactionsoccur with sufficient frequency (daily) and sufficientvolume to provide pricing information on an ongoingbasis, regardless of the size of the position held.
44. Discount (blockage) factors for unrestrictedsecurities that trade in an active market are prohib-ited by GAAP (FASB Statement No. 157).
Restricted45. A discount from values of actively traded securi-ties should be taken for holdings of securities whenthere is a formal restriction that limits sale of the secu-rities. Examples of restrictions that may warrant adiscount include rule 144 holding periods and under-writer’s lock-ups. Discounts for restricted equitysecurities from their market price typically range from0% to 30%. When determining a discount to activelytraded restricted securities, factors that should betaken into consideration include the company’s trad-ing characteristics (the extent to which the market forthe security is active), the investor’s ability to sell itsposition when the restriction expires, and the term ofthe restriction. The adjustment of the discount willvary depending on the duration of the restriction. Asthe remaining length of the restriction decreases, theamount of the discount should also decrease.Limitations on sale based on rule 144’s volume testsor based on a closed trading window for board mem-bers do not qualify as formal restrictions related to thesecurity itself. Therefore discounts are not allowed byGAAP in these situations.
Inactive46. A quoted price is not readily available for secu-rities which trade in inactive markets, where trans-actions do not occur with sufficient frequency andvolume to provide ongoing pricing data. Therefore,
the last transacted price may not provide the bestindication of fair value. In such situations, anadjustment to the last transacted price may beappropriate or other valuation techniques may beutilized based on all relevant factors.
IV. OTHER MATTERS
47. There are a wide variety of securities and capi-tal structures used in the private equity industry.Such securities should be valued consistent with theGuidelines set forth above. Some examples andvaluation guidance for securities and structureswhich have not been specifically addressed by theseGuidelines include:
a) The carrying value of private interest bearingsecurities should be based on the underlying compa-ny’s ability to service and repay debt.
b) PIK dividends should be accrued in accordancewith the terms of the underlying security. A valua-tion discount may be necessary depending on thehealth of the company and the realizability of theunderlying securities.
c) Valuations of securities denominated in currenciesother than the base currency of the fund should beadjusted for changes in the spot prices of the currency.
d) Warrants should be carried at their fair value.
e) The rights associated with preferred stock are gen-erally divided into two broad categories—economicrights and control rights. Once the enterprise value ofthe company is determined in accordance with theseGuidelines, fair value should be determined by allo-cating value to shares of preferred and common stockbased on their relative economic and control rights.
In addition, when making their fair value determi-nation managers should recognize that liquidationpreferences are often granted to investors as aninducement to invest in a company. When a manag-er’s past experience indicates that liquidation pref-erences will be renegotiated or will not be fullyenforced at the time of liquidation, the manager isstrongly encouraged to use the expected results in
2010 NVCA Yearbook
Thomson Reuters 103
determining the valuation of a security which has aliquidation preference.
f) Currently convertible securities should be val-ued at the excess of the value of the underlyingsecurity over the conversion price as if the securitywas converted when the conversion feature is “inthe money” (appropriately discounted if restricted).If the security is not currently convertible, the use ofan appropriate discount in valuing the underlyingsecurity should be considered. If the value of theunderlying security is less than the conversionprice, the carrying value of the convertible securityshould be based on the underlying company’s abili-ty to service and repay the security.
g) If deemed determinable beyond a reasonabledoubt (virtually certain) escrows from the sale of aportfolio company should be valued at an amountthat the manager, using its best estimate, ultimatelyexpects to receive from the buyer in light of theescrow’s various conditions.
h) Because of the inefficiencies of the secondarymarket, purchase and sale transactions of partner-ship interests in and of themselves may not beappropriate in determining the value of portfoliocompany valuations or positions in funds.
48. FASB’s Statement No. 157 Fair ValueMeasurements utilizes a hierarchy described as Level1, 2 and 3 inputs (Statement No. 157 paragraphs 21-31). The FASB valuation hierarchy has not beenrestated in these Guidelines. The concepts outlinedin these Guidelines are intended to be consistent withLevel 1, 2 and 3 inputs as defined. The input level isa required GAAP disclosure and provides users offinancial statements with additional clarity in how amanager made their determination of fair value.
V. CONCLUSION
49. As the private equity industry has matured inthe United States, there is a need for greater consis-tency of valuation standards/methodologies by bothmanagers of, and investors in, private equity funds.These Guidelines are designed to provide a frame-work for addressing the majority of the private equi-ty industry’s valuation questions on a consistent,
transparent and prudent basis. It is recommendedthat managers and investors collaborate to shareexperiences and best practices across relationships.This collaboration will narrow the range of specificdefinitions of subjective terms and will enhance theconsistent application of these Guidelines.
50. The key goals of these Guidelines are as fol-lows:
• Encourage managers to approach valuation froma consistent, transparent and prudent basis.
• Focus the private equity industry on the need todetermine fair value for each of their investments ina manner that is consistent with these Guidelines.
• Provide greater transparency into valuation resultsthrough the use of the Valuation Policy Committeeas described in the Guidelines.
51. The Guidelines are not intended to be allencompassing, nor are they intended to eliminate allsubjectivity. Rather, they are to be a guide to assistmanagers and investors in agreeing to a valuationframework while allowing a manager to exercise itsbest judgment in applying the Guidelines.
52. The Private Equity Industry Guidelines Groupacknowledges that the application of these guide-lines may result in a departure from past valuationpractices. It is recommended that managers andinvestors work jointly to develop a timetable toimplement these guidelines. It is expected that overtime the broad use of these Guidelines will becomeindustry practice
53. These Guidelines are consistent with USGenerally Accepted Accounting Principles. If man-agers adopt these Guidelines it is expected that theirdetermination of fair value will be GAAP compli-ant. However, it is also understood that a managermay be GAAP compliant without utilizing theseGuidelines.
National Venture Capital Association
104 Thomson Reuters
NVCA Position on Portfolio CompanyValuation Guidelines (March 2007Version)
The NVCA Board of Directors reaffirmed its supportfor the latest iteration (March 2007) of the PEIGGGuidelines on September 18, 2007. While the NVCAhas not specifically endorsed the PEIGG or other valu-ation guidelines, the NVCA board statement of supportis below:
The NVCA recommends that its members create, fol-low and communicate clearly the specific proceduresand methodologies used for valuing their portfolios.These methodologies should be agreed to by the firm’sinvestors (LPs), and conform, when required, toGenerally Accepted Accounting Principles and fairvalue measurement standards, recognizing that the ulti-mate responsibility for valuations remains with the gen-eral partner. When evaluating current valuation proce-dures or developing new approaches, the NVCA sug-gests its members include a review of the Private EquityIndustry Guidelines Group (PEIGG) December 2003“Private Equity Valuations Guidelines” document, asreissued in March 2007 (found at www.peigg.org). Wecommend the fine efforts of PEIGG, an independentgroup which sought and reflected input from the NVCAand other industry stakeholders. The NVCA encour-ages diligence, prudence, and caution when implement-ing the specific elements of any guideline, such as val-uation changes to early-stage companies in the absenceof market-based financing events.
NVCA Member Alert – Fair ValueConsiderations for Venture Capitalists -December 2008
The following alert was sent to the NVCA member-ship to highlight certain issues and considerations tobe explored in the application of FAS 157, the fairvalue measurement standard. The NVCA thanksDavid Larsen of Duff and Phelps and several mem-bers of the NVCA CFO Task Force for their role indrafting this document:
“We are operating in a severely distressed investmentenvironment that has deteriorated rapidly in the pastfew months. What does this mean for venture capital
investors as they attempt to value privately-heldinvestments at December 31, 2008? The short answeris: despite the current very challenging economicenvironment, Fund managers must continue to exer-cise their sound judgment in estimating the FairValue of each portfolio company after consideringthe relevant facts, including current market condi-tions. The valuation process does not change, butmuch more judgment is required when we are in aperiod of economic discontinuity.
Virtually all LP agreements require GPs to use USGAAP for financial reporting. US GAAP requiresFair Value reporting for virtually all VC firmsbecause they are “investment companies.” USGAAP continues to define Fair Value as: “the pricethat would be received to sell an asset…in an order-ly transaction between market participants at themeasurement date.”
Fund managers need to establish Fair Values eventhough they may not currently need to sell, or cannotsell, their private investments in this market. GPsmust use their judgment in estimating the currentFair Values of their investments, even though “exitmarkets” may have few buyers, IPO markets appearclosed, and there are few, if any, relevant comparabletransactions. Such judgment should take into accountall relevant information, including a financinground’s specific terms and conditions.
There are no easy outs, rules of thumb or safe harborsfor establishing Fair Value.
As always, best considerations for Fair Value deter-mination include the following: • The Fair Value of an investment portfolio is the sum
of the Fair Value determined for each portfoliocompany using a “bottoms up” approach. Applyinga “top-down” overall percentage adjustment to theaggregate portfolio’s value is not compliant withUS GAAP.
• Valuations should reflect specific factors in abuy/sell context. For example, a GP could ask:“Given my portfolio company’s current cash posi-tion, cash burn rate, performance compared to plan,probability of meeting forecasts, the projected envi-ronment for its product or technology, etc., as aboard member, what is the lowest price that I would
2010 NVCA Yearbook
Thomson Reuters 105
sell the company’s stock today in an orderly salewith a willing buyer?” [Footnote: A fund managershould not assume a “fire sale” of the stock, butshould assume “exposure to the market for a periodprior to the measurement date to allow for market-ing activities that are usual and customary…” -SFAS 157, Paragraph 7].
• The valuations set by the most recent financinground – perhaps even one in the third quarter of2008 – may be stale and inappropriate for determin-ing Fair Value, especially given current market con-ditions.
• The Fair Value at December 31 in many cases willlikely be different from the value at September 30,given the deterioration of the macro economic envi-ronment.
• Each valuation should reflect a company’s degreeof progress from the prior reporting date to the cur-rent one.
• To determine a portfolio company’s Fair Value,GPs should apply their judgment in a consistentmanner and evaluate the same data they use formonitoring a company’s performance and progress.There is no magic formula or weighting of factors.
In summary, determining Fair Value continues torequire the exercise of judgment based on objectiveevidence, such as calibrating the original investmentdecision with the current performance of the compa-ny and the current economic environment. The factthat the macro market is distressed probably adverse-ly impacts the value of most companies. This nega-tive impact may be compounded by disappointingcompany performance or mitigated by tangible andsustainable company progress.
If you need more details about Fair Value, you mightconsider the 18-page PEIGG Valuation Guidelines atwww.peigg.org, or you can download the 158-pageSFAS 157 at www.fasb.org.”
National Venture Capital Association
106 Thomson Reuters
Appendix I: International Convergence
A GP’s Primer on Global AccountingStandards Convergence
A recent flurry of media coverage has focused on thepossible upcoming convergence of U.S. and interna-tional accounting standards. Much of this coveragediscusses which accounting system casts which pub-lic companies in the most favorable light. Whileseemingly distant from the U.S. venture capitalindustry, it is important that all business constituen-cies weigh in on which system (current U.S. GAAPvs. International vs. neither) is the best system over-all for the U.S. business community going forward.We would expect this dialogue to center on trans-parency, reliability, relevance, comparability, andongoing costs in addition to any conversion costs,which might be significant.
More relevant to the U.S. venture capital industry arematters specifically affecting fund reporting, specifi-cally the financial statements provided by GPs to LPsunder international rules, should the internationalrules become the new U.S. rules.
As a first step towards understanding and engagingin constructive dialogue in both of these areas, theNVCA CFO Task Force has appointed a subgroup tobegin gathering facts, analysis, and expert opinion onwhat all of this means to our industry.
In 2009, with a new administration, new SEC leader-ship, and other priorities at the SEC, the directionand timetable for convergence became less clear. Akey concern for the U.S. venture capital industry isbeing able to continue investment company (IC)accounting. There are no provisions in the interna-tional rules for IC reporting, so if current GAAP pro-visions were not continued, venture fund statementsto their investors would become unusable. Reportsare that international venture capital and privateequity firms currently subject to international rulesare simply ignoring those provisions or additionallyproviding side schedules prepared in accordancewith U.S. GAAP. If investment company accountingis removed from GAAP, for example, if the existing
international rules become GAAP, GPs would likelyhave to keep an additional set of books. One setwould be used to create audit GAAP financial state-ments, although it not clear who the audience forthose statements would be. The other set would be toprovide meaningful portfolio information toinvestors and other stakeholders.
In February 2010, reports from a FASB-IASB meet-ing on convergence suggest a major initial victory forventure capital financial reporting. Sources reportthe Boards jointly agreed to permit an investmentcompany exception to consolidation rules — achange from the existing IAS 27. Furthermore,rather than a new more restrictive test for qualifica-tion that would have excluded some venture capitalfunds, the Boards are reported to have chosen to gen-erally follow criteria set out in current GAAP Topic946. This recognition of the importance ofInvestment Company Accounting is significant. Aswith any general agreement, the details need to beworked through.
Why Has The Convergence Issue Cometo the Surface at This Time?For years, the United States has been developinggeneralized accounting principles referred to asGenerally Accepted Accounting Principles(“GAAP”). The keeper/arbiter/decider of GAAP isthe Financial Accounting Standards Board(“FASB”). FASB develops and updates GAAP andthe SEC has adopted these accounting rules for pub-lic company reporting and other situations overwhich the SEC has jurisdiction.
In recent years, on a parallel track, a separate set ofrules emerged from the International AccountingStandards Board (“IASB”) which was Europe-cen-tric. These rules became known as the InternationalFinancial Reporting Standards (“IFRS,” pronounced“IFF-ers”).
Over recent years, the large number of multina-tional corporations complained that they had to
Thomson Reuters 107
endure keeping two sets of books and this prompt-ed the concept of convergence. In early September2008, the SEC and the FASB announced steps topave the way for U.S. public companies to convertfrom U.S. GAAP to IFRS. The SEC “roadmap”provides for a three-year run-up to an SEC “go-nogo” decision in 2011. 2011 is also the year thatmajor U.S. trading partners Canada, Japan, Korea,and India have indicated plans to adopt IFRS. Atabout the same time, the FASB and the IASB metto review and re-orient their convergence plan tobe consistent with the SEC’s proposed schedule.The updated FASB-IASB memorandum of under-standing is at http://www.fasb.org/intl/MOU_09-11-08.pdf. In 2009, much of Washington’s atten-tion was focused on rescuing troubled assets andeconomic stimulus. The convergence time tablemay be delayed. Please check the www.nvca.orgwebsite for updates.
Nothing in the SEC proposal or the FASB-IASBmemorandum says that the U.S. will conclusively“converge” by switching over to IFRS. This all con-templates a well-thought-out and informed decision intwo years. It is worth pointing out that the SECroadmap refers to public company reporting; howeverwe should logically expect alignment of private andpublic company rules. Even with two sets of rules,because venture-backed companies plan to be publiccompanies or a component of a public company, mostventure-backed private companies would want to usepublic company accounting from the start.
What is not clear at this time is what the current glob-al economic turmoil will do to the priority of thisproject or its timetable.
U.S. GAAP vs. IFRS – Never Generalize
Even viewed from 30,000 feet, it is difficult to gen-eralize on how the two systems compare. First, whilethe IASB produces plain vanilla IFRS standards,there is no one flavor of IFRS in use. Much like theoriginal UNIX kernel, each country/jurisdiction hasbeen able to create its own version of IFRS. Butunlike UNIX, sometimes the differences among thelocalized IFRS versions are large. So an apples-to-apples comparison of “IFRS-compliant” financialsfrom different jurisdictions can be difficult. Second,it is true that IRFS itself is a very thin document com-
pared to GAAP, which has grown to roughly a two-foot stack of written rules. However, to implementIFRS, you need the implementation guide that com-bines with the original document to create its owntwo-foot stack. Again, much of the surface compar-isons are not useful.
Until this point, U.S. venture capital firms have beenusing U.S. GAAP accounting standards exclusively.However, in early November, we received a reportfrom a member firm with international intermedi-aries for overseas investment where the local audi-tors raised the question of whether those financialstatements need to be IFRS-compliant.
GP-to-LP Reporting
One area already identified as a possible problem areais GP to LP reporting. Virtually all LP agreements (oraccompanying documents) require GPs to provideGAAP-compliant financial reports to LPs. Annualaudits of these reports are GAAP-based. UnderGAAP, the U.S. venture capital industry provides fair-value portfolio reports under the special rules of“investment company reporting.” Our early analysisof IFRS shows special investment company rules forportfolios of publicly-traded companies, but no suchprovisions for portfolios of private companies.
Most of the SEC and FASB efforts to date havefocused on public company reporting. We are veryearly on in verifying and creating awareness of thelack of private portfolio provisions. The initial read-ing is that, under IFRS, the financial statements fora number of the portfolio companies would have tobe consolidated into the operating financials of theventure capital fund itself. This would create amish-mash report, essentially unusable to the LPs indetermining the value of their own portfolio hold-ings. This would mean an end to fair value report-ing as we have known it. A potential further compli-cation could arise if DOL ERISA fair value rulesremain in place for the plan sponsors while account-ing rules abandon the current fair value reportingrequirements.
Since most fund agreements require GAAP finan-cials, if investment company accounting is eliminat-ed from GAAP, venture firms might have to maintaintwo sets of books.
National Venture Capital Association
108 Thomson Reuters
How International GPs Now Handle LPReporting
A logical question arising from the above paragraphis how venture capital firms operating in IFRS juris-dictions are currently reporting to LPs, includingthose subject to U.S. ERISA fair value reportingrules. The initial, and somewhat limited, review bythe NVCA CFO Task Force subgroup is that theysimply are not doing so. Many international GPs con-tinue to produce financial statements in accordancewith U.S. GAAP for both their U.S. and internation-al LPs. Those reporting under IFRS are incurring theadditional effort and expense of also providing a sep-arate U.S. GAAP-type fair value schedule.
Recent Events
A full chronology of events is posted under ValuationGuidelines on the NVCA website www.nvca.org.This document is updated from the chronology inAppendix H of the NVCA 2010 Yearbook preparedby Thomson Reuters. Even as the U.S. industryworks toward compliance with the FASB’sStatement 157 (now officially called “Topic 820”) onfair value measurement starting with 2008 financials,
dialogue has begun on convergence. In March 2008,the International Private Equity & Venture CapitalValuation (IPEV) board reconstituted and relauncheditself. IPEV was expanded to include five practition-ers from the United States who are familiar with theventure industry. The initial focus of the group is onconvergence of U.S. Private Equity IndustryGuidelines Group (“PEIGG”) and IPEV fair valueguidelines. Details, and the September 2009International Private Equity and Venture CapitalValuation Guidelines, are online at www.privatee-quityvaluation.com. Check that site for updates, thepress release issued with those guidelines, FAQs, etc.
Going Forward
With the international and domestic attention onother economic matters, it is not clear how quicklyany accounting standard convergence activitieswill move. At the time this update is written inFebruary 2010, FASB plans to address the consoli-dation standard by Q4 2010, resolve major conver-gence issues by mid-2011, and implement conver-sion to IFRS by 2014. For more information, pleasecontact NVCA Vice President of Research, JohnTaylor, [email protected].
2010 NVCA Yearbook
Thomson Reuters 109

National Venture Capital Association
110 Thomson Reuters
This page is intentionally left blank.
Appendix J: Non-US Private Equity
IntroductionThis appendix highlights various aspects of privateequity activity outside of the United States and pro-vides valuable information for comparison to theUnited States private equity environment. However,this appendix is not directly comparable to domesticdata found in this Yearbook due to differences in def-initions between the regions and variations in the cur-rencies of each region. Additionally, this appendixprovides a brief overview of non-US private equity;data herein is not as comprehensive as the UnitedStates data presented elsewhere in this publication.Despite this, the reader can use this appendix to ana-lyze trends in private equity outside of the UnitedStates. All data is provided by Thomson Reuters.
As mentioned previously, readers should note the dif-ferences in methodology and definitions of privateequity between United States and other regions beforeanalyzing the data. For example, private equity out-side of the United States provides equity capital forentities not publicly traded and consists of buyoutsand venture capital. The category of buyouts includesmanagement buyouts (management from inside thecompany investing with private equity investors),leveraged buyouts (the target taking on a high level ofdebt secured by assets), institutional buyouts (outsideinvestors buying a business from existing sharehold-ers), and management buy-ins (management fromoutside the company investing with private equityinvestors). On the other hand, venture capitaldescribes the process of financing companies at theseed, start-up, or expansion stages. The United Statesplaces more emphasis on the early stages of develop-ment than do other regions, based on historical analy-sis of investments by stage. Like in the United States,non-US venture capital is considered a subset of pri-vate equity. For ease of analysis and to avoid differ-ences in definitions between venture capital and buy-outs inside and outside of the United States, it is per-
haps most comparable to analyze aggregate privateequity in the two regions as opposed to any classifica-tions contained within.
**Special Note: The methodology used to generatethe data within this appendix differs slightly from themethodology used in previous years, causing data tovary slightly from previous Yearbook issues.However, trends reported in the past remain intact.Additionally, most data is now replicable onThomsonONE.com.
Commitments
Private equity commitment levels, outside of theUnited States, significantly decreased in 2009 fromthe record levels set in 2008. During 2009 commit-ments totaled $36.3 billion, a 76% decrease from theprevious year. 2009 represents the slowest year forprivate equity fundraising commitments outside ofthe United States since 2004. Buyouts funds account-ed for a vast majority of the funds, 53%, of commit-ted funds, an 80% decrease from 2008. Early stagefinancing accounted for 11% of commitments, anincrease from 4% in the previous year, while balancedstage financing accounted for 3.4%, a slight decreasefrom 2008 when balanced stage financing accountedfor 11% of commitments. It should be noted that thesetotals reflect not only the amount raised by independ-ent funds, but also include capital gains and theamount raised by both captive funds and funds offunds, as well.
Investments
Private equity investing outside of the United Statesreached $46.0 billion in 2009, a 21% decrease fromthe $57.9 billion invested in the previous year. Buyoutstage financing, which typically garners the largestpercentage of investment dollars due the large trans-
Thomson Reuters 111
As interest in globalization increases with each year, private equity investors have continued to broaden theirinvestment criteria to include overseas ventures so as to increase portfolio diversification and search for high-er returns. As such, Appendix J is produced for readers to analyze non-US private equity data. All data isreported in US dollars.
action size associated with these deals, led activity in2009, accounting for 48% of total investments. Bynumber of deals, venture capital investments account-ed for 65% of total deal activity outside of the UnitedStates. Leading all activity outside of the UnitedStates, investments in the United Kingdom totaled$8.8 billion during 2009, a 27% increase from 2008levels. In the emerging markets, private equity invest-ments in China reached $4.1 billion, a 2% decreasefrom 2008 and investments in India totaled $2.8 bil-lion a 35% decrease from a year ago.
National Venture Capital Association
112 Thomson Reuters

PREPARED BY3 Times Square18th Floor
New York, NY 10036www.thomsonreuters.com
1655 Fort Myer DriveSuite 850
Arlington, VA 22209www.nvca.org
INCLUDING STATISTICS FROM THEPricewaterhouseCoopers/National Venture Capital Association
MoneyTree™ Report based on data from Thomson Reuters
NATIONAL VENTURECAPITALASSOCIATION
PREPARED BY
NATIO
NA
L VENTU
RE CA
PITAL A
SSOC
IATION
YEARBO
OK 2010
NATIONAL VENTURECAPITALASSOCIATION
YEARBOOK 2010