Embed Size (px)
Citation preview
NATIONAL TB PROGRAM ANNUAL REPORT
2012
Presented by: Ndumiso Mlotsa
Ministry of Health NTCP
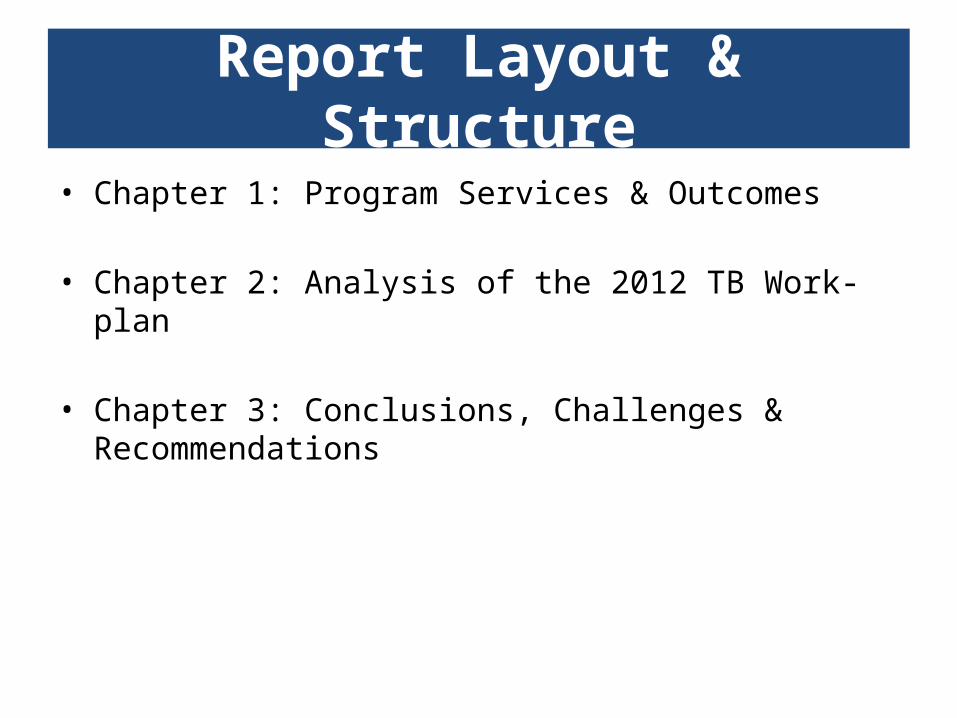
Report Layout & Structure
• Chapter 1: Program Services & Outcomes
• Chapter 2: Analysis of the 2012 TB Work-plan
• Chapter 3: Conclusions, Challenges & Recommendations
TB Situation…
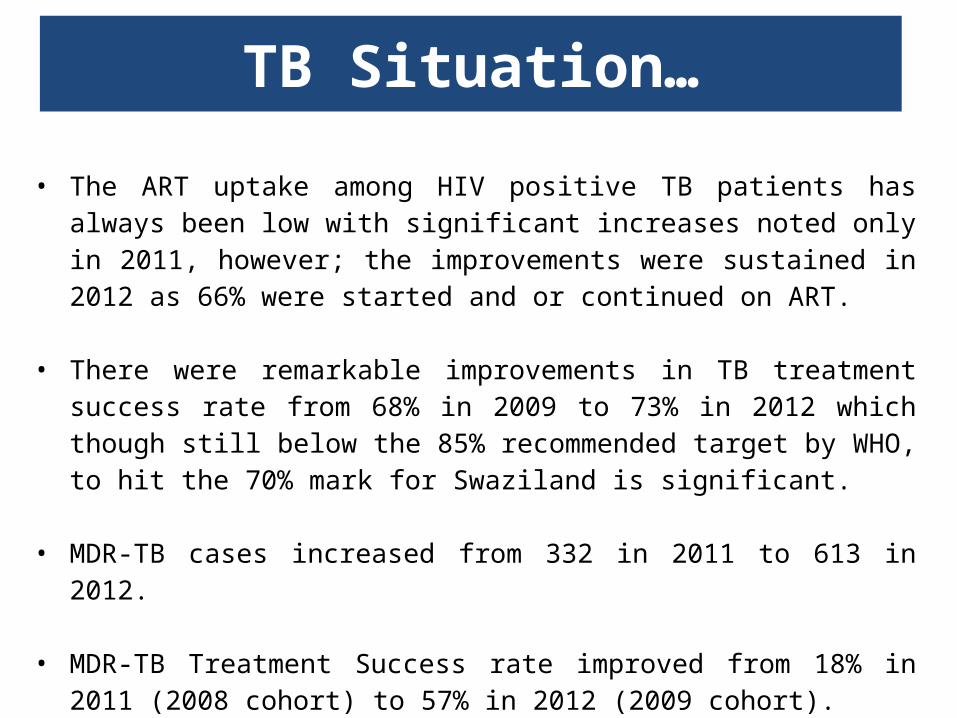
• The ART uptake among HIV positive TB patients has always been low with significant increases noted only in 2011, however; the improvements were sustained in 2012 as 66% were started and or continued on ART.
• There were remarkable improvements in TB treatment success rate from 68% in 2009 to 73% in 2012 which though still below the 85% recommended target by WHO, to hit the 70% mark for Swaziland is significant.
• MDR-TB cases increased from 332 in 2011 to 613 in 2012.
• MDR-TB Treatment Success rate improved from 18% in 2011 (2008 cohort) to 57% in 2012 (2009 cohort).

Program Description
Policy Formulation & Guidelines
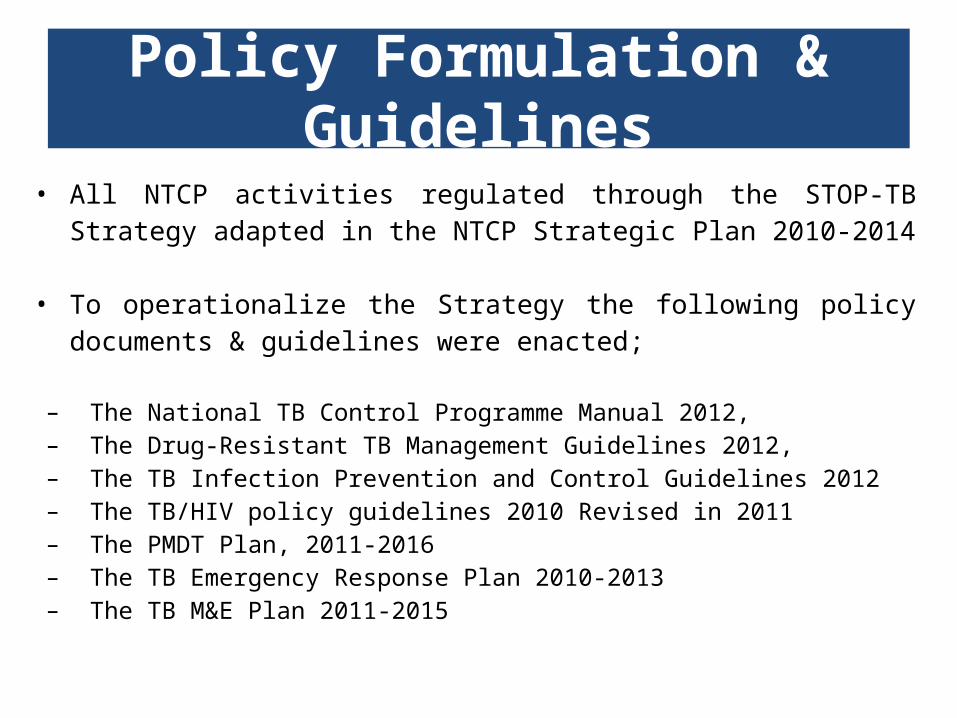
• All NTCP activities regulated through the STOP-TB Strategy adapted in the NTCP Strategic Plan 2010-2014
• To operationalize the Strategy the following policy documents & guidelines were enacted;
– The National TB Control Programme Manual 2012, – The Drug-Resistant TB Management Guidelines 2012, – The TB Infection Prevention and Control Guidelines 2012– The TB/HIV policy guidelines 2010 Revised in 2011– The PMDT Plan, 2011-2016– The TB Emergency Response Plan 2010-2013– The TB M&E Plan 2011-2015
Organization of TB Services
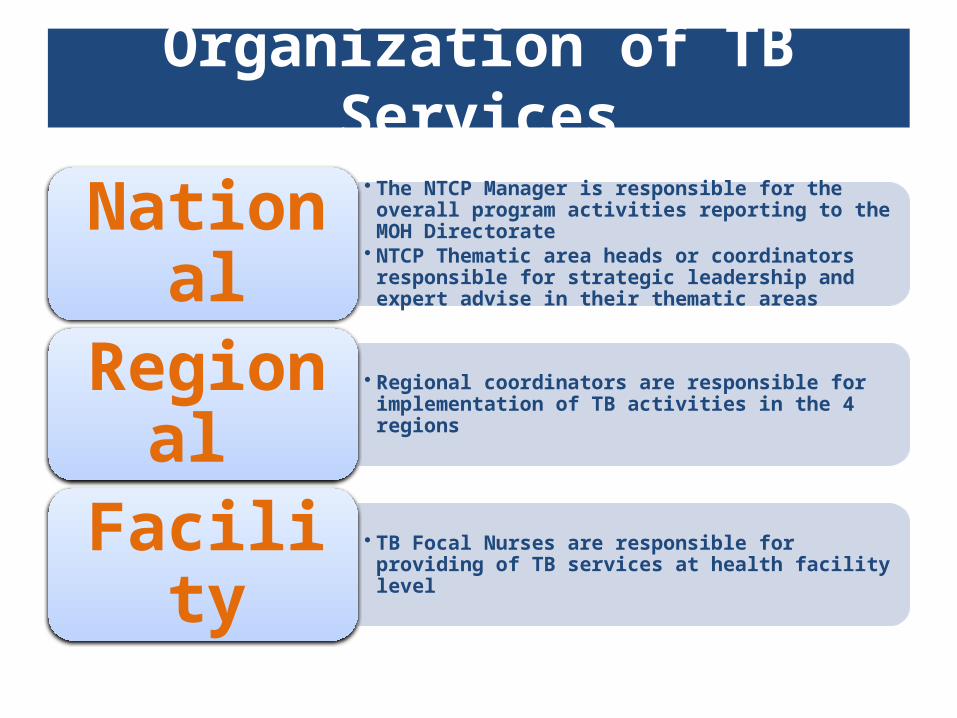
• The NTCP Manager is responsible for the overall program activities reporting to the MOH Directorate
• NTCP Thematic area heads or coordinators responsible for strategic leadership and expert advise in their thematic areas
National
• Regional coordinators are responsible for implementation of TB activities in the 4 regionsRegional
• TB Focal Nurses are responsible for providing of TB services at health facility levelFacility
Decentralization of TB Services & Infrastructure Improvements
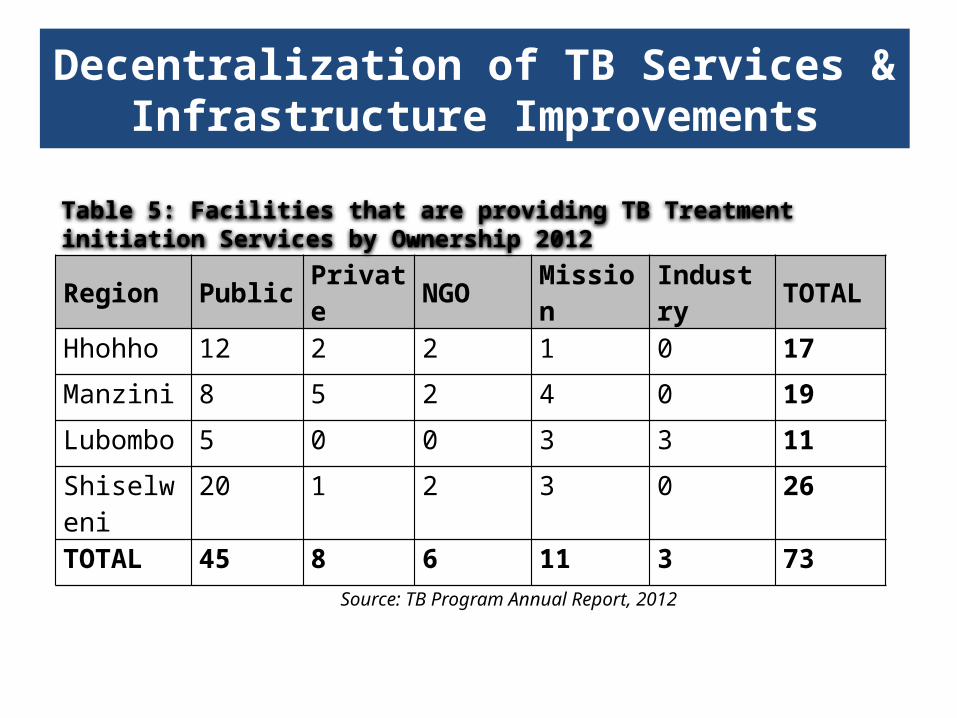
Region Public Private NGO Mission Industry TOTAL
Hhohho 12 2 2 1 0 17
Manzini 8 5 2 4 0 19
Lubombo 5 0 0 3 3 11
Shiselweni 20 1 2 3 0 26
TOTAL 45 8 6 11 3 73
Table 5: Facilities that are providing TB Treatment initiation Services by Ownership 2012
Source: TB Program Annual Report, 2012
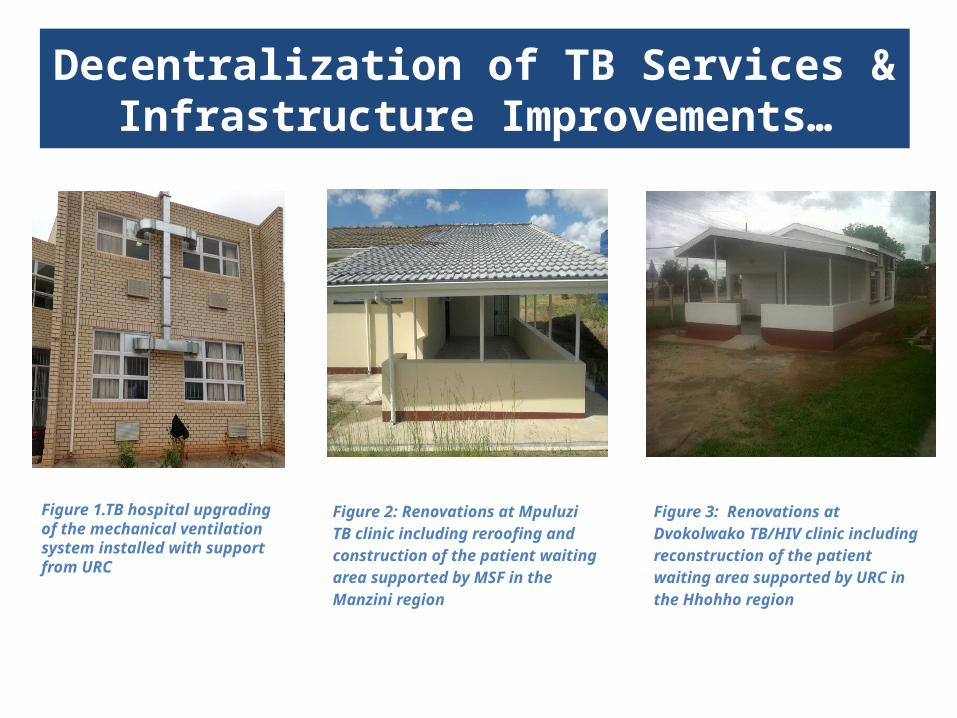
Decentralization of TB Services & Infrastructure Improvements…
Figure 1.TB hospital upgrading of the mechanical ventilation system installed with support from URC
Figure 2: Renovations at Mpuluzi TB clinic including reroofing and construction of the patient waiting area supported by MSF in the Manzini region
Figure 3: Renovations at Dvokolwako TB/HIV clinic including reconstruction of the patient waiting area supported by URC in the Hhohho region

Continue…..
• Mankayane Hospital TB ward with Support from (MSF).
• Hlathikhulu TB ward to admit DR-TB patients.• TB Centre Clinic to have a fully fledged
laboratory with the Support from URC.• Accreditation of Sphofaneni lab to provide
diagnostic services for surrounding Health Facilities in the Lubombo region.
Decentralization of TB Services & Infrastructure Improvements…
New TB Diagnostics & Lab Strengthening
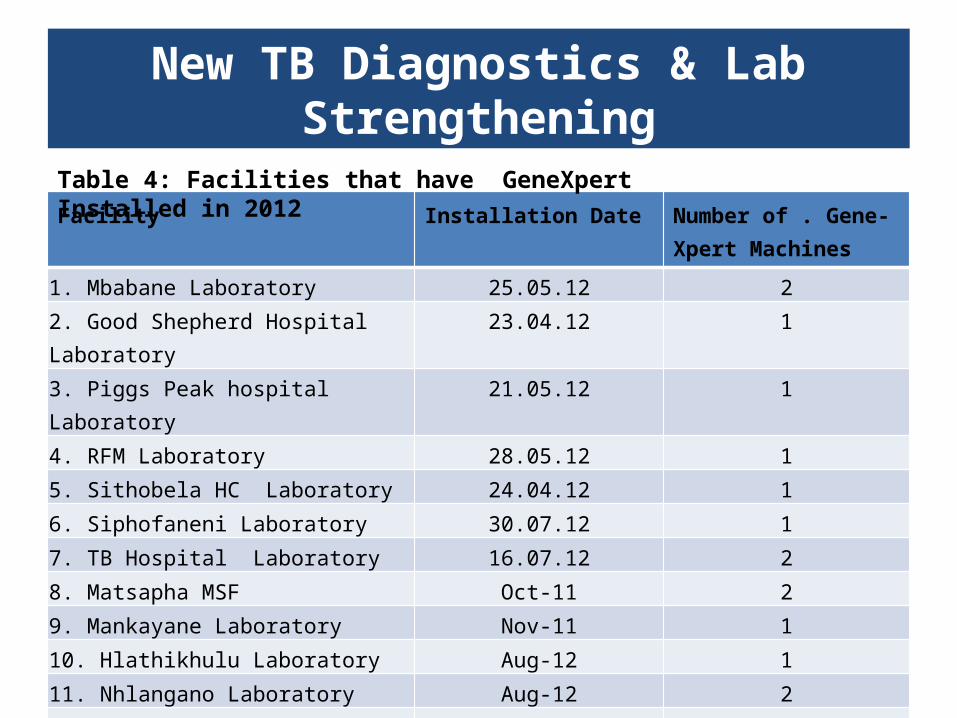
Facility Installation Date Number of . Gene-Xpert Machines
1. Mbabane Laboratory 25.05.12 22. Good Shepherd Hospital Laboratory
23.04.12 1
3. Piggs Peak hospital Laboratory 21.05.12 14. RFM Laboratory 28.05.12 15. Sithobela HC Laboratory 24.04.12 16. Siphofaneni Laboratory 30.07.12 17. TB Hospital Laboratory 16.07.12 28. Matsapha MSF Oct-11 29. Mankayane Laboratory Nov-11 110. Hlathikhulu Laboratory Aug-12 111. Nhlangano Laboratory Aug-12 212. Matsanjeni Laboratory Nov-12 113. TB Centre Nov-12 2Total By end of 2012 18
Table 4: Facilities that have GeneXpert Installed in 2012
New TB Diagnostics & Lab Strengthening
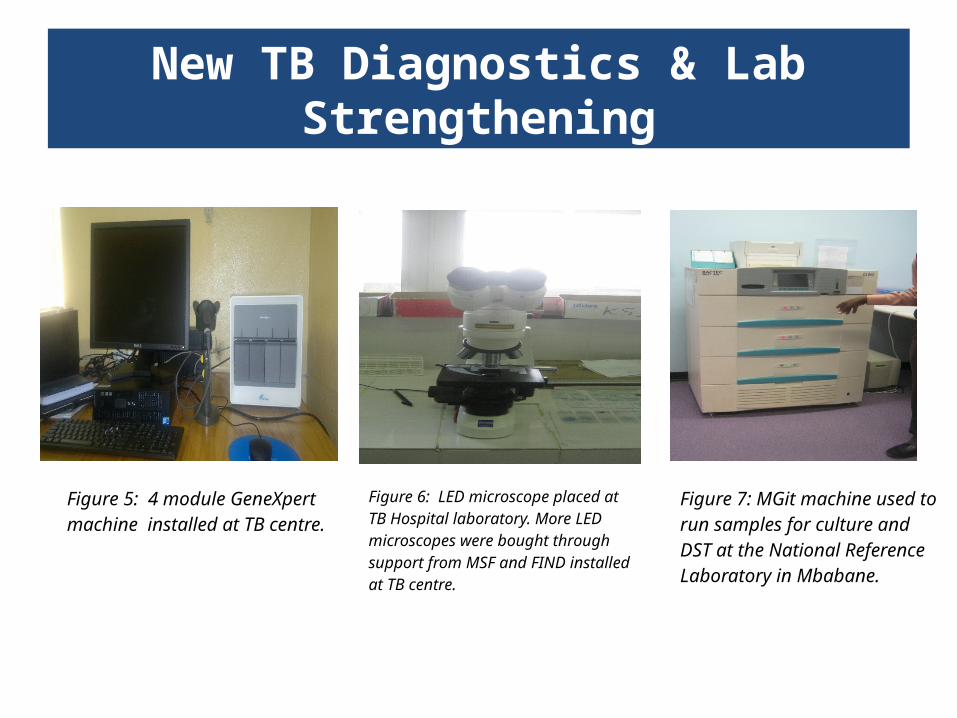
Figure 5: 4 module GeneXpert machine installed at TB centre.
Figure 6: LED microscope placed at TB Hospital laboratory. More LED microscopes were bought through support from MSF and FIND installed at TB centre.
Figure 7: MGit machine used to run samples for culture and DST at the National Reference Laboratory in Mbabane.
Drug Supply & Management
• Although none of the facilities reported stock-out of TB drugs in 2012 there were some erratic supplies
that were a result of expired drugs being distributed from the central medical stores (CMS) however these did
not amount to stock-outs as initiation of TB patients on treatment was not interrupted.
• There were approved changes with regards to the procurement, management and classification of treatment
regimens for TB medicines as follows;– Streptomycin phased out as 1st line regimen: only patients who were already on Streptomycin are
continuing and new initiations has ceased already for this drug.
– Also, the ordering and distribution of TB medicines have since been centralised and integrated to the normative Ministry of Health system i.e. it is now fully coordinated by the Central Medical Stores.
• This was complemented by the appointment of a dedicated pharmacist at the Central Medical Stores who is responsible for quantification, ordering and procurement of TB medicines and supplies.
– Direct procurement of TB drugs has been approved by the Ministry of Finance which ensures uninterrupted supply of TB medicines.
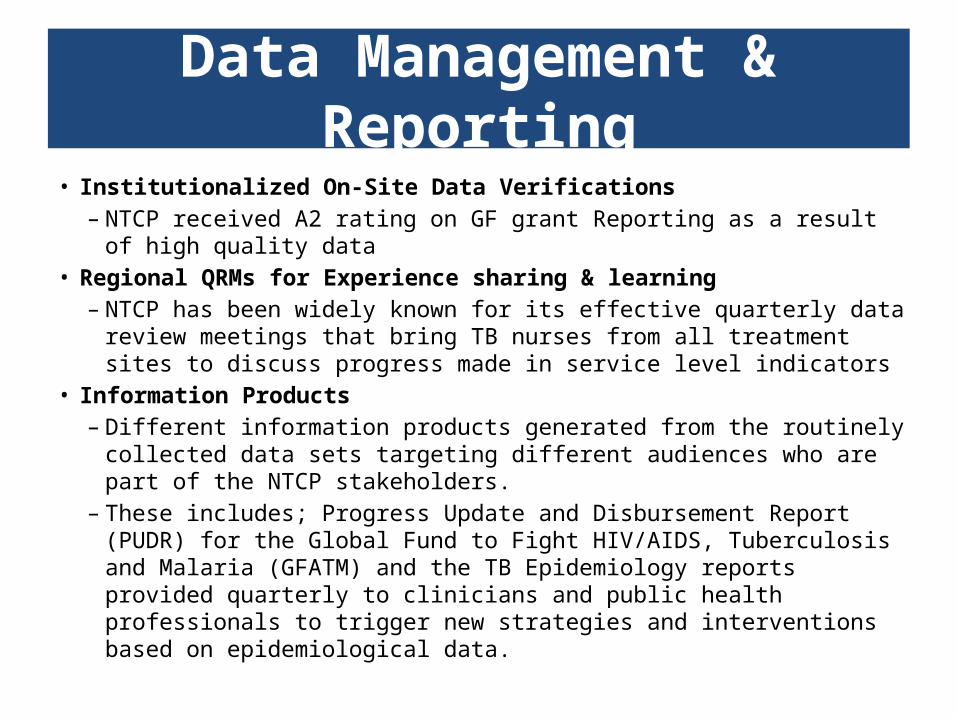
Data Management & Reporting• Institutionalized On-Site Data Verifications
– NTCP received A2 rating on GF grant Reporting as a result of high quality data
• Regional QRMs for Experience sharing & learning– NTCP has been widely known for its effective quarterly data review
meetings that bring TB nurses from all treatment sites to discuss progress made in service level indicators
• Information Products– Different information products generated from the routinely collected data
sets targeting different audiences who are part of the NTCP stakeholders. – These includes; Progress Update and Disbursement Report (PUDR) for the
Global Fund to Fight HIV/AIDS, Tuberculosis and Malaria (GFATM) and the TB Epidemiology reports provided quarterly to clinicians and public health professionals to trigger new strategies and interventions based on epidemiological data.
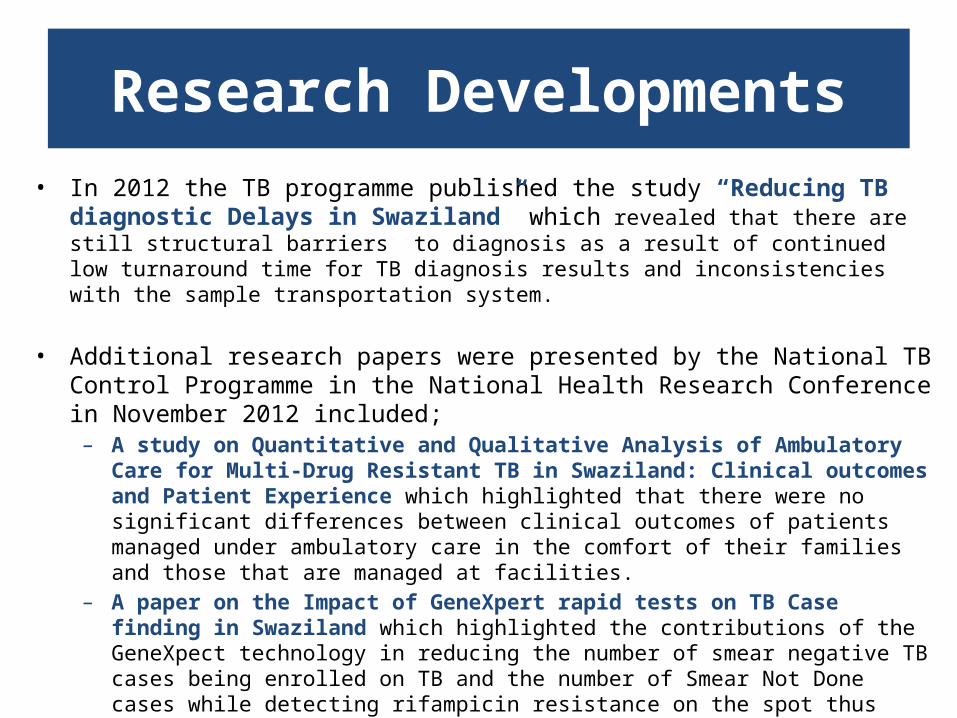
Research Developments• In 2012 the TB programme published the study “Reducing TB diagnostic Delays in Swaziland”
which revealed that there are still structural barriers to diagnosis as a result of continued low turnaround time for TB diagnosis results and inconsistencies with the sample transportation system.
• Additional research papers were presented by the National TB Control Programme in the National Health Research Conference in November 2012 included;
– A study on Quantitative and Qualitative Analysis of Ambulatory Care for Multi-Drug Resistant TB in Swaziland: Clinical outcomes and Patient Experience which highlighted that there were no significant differences between clinical outcomes of patients managed under ambulatory care in the comfort of their families and those that are managed at facilities.
– A paper on the Impact of GeneXpert rapid tests on TB Case finding in Swaziland which highlighted the contributions of the GeneXpect technology in reducing the number of smear negative TB cases being enrolled on TB and the number of Smear Not Done cases while detecting rifampicin resistance on the spot thus reducing the proportion of non-converters at 2/3 months after treatment enrolment.
– Two additional papers were presented by the regions on successful scaling up of TB/HIV services in health facilities in the country and the role of partnerships in implementing TB/HIV collaborative activities in Shiselweni region. Both the papers highlighted the achievements of the National TB Control Programme in increasing coverage of TB/HIV services and bring the services closer to the people.
TB Epidemiology & Patient Outcomes
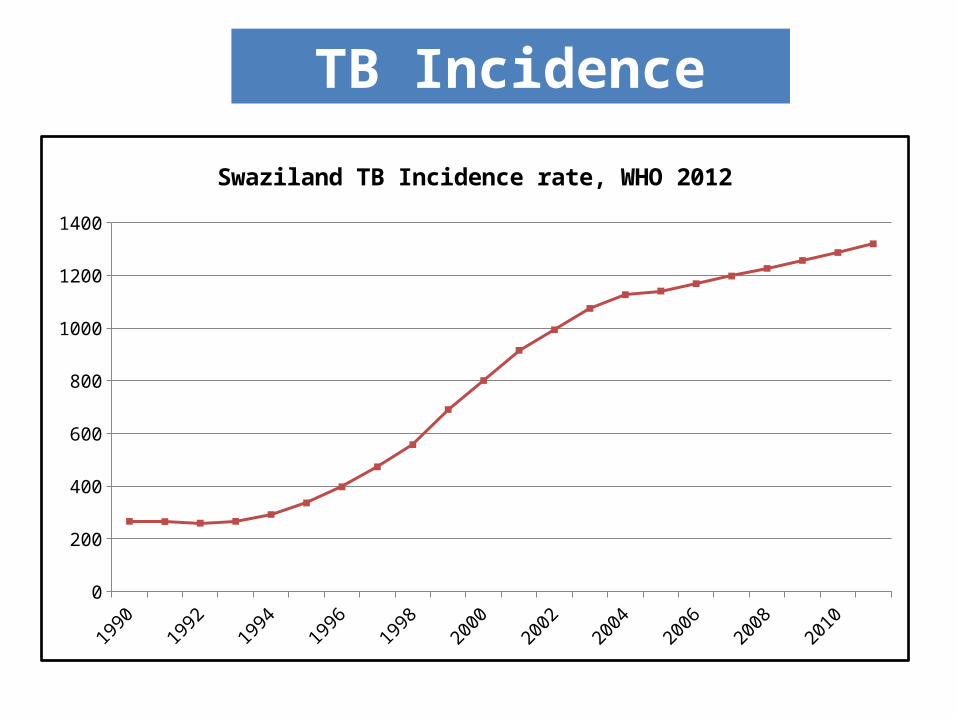
TB Incidence
19901991
19921993
19941995
19961997
19981999
20002001
20022003
20042005
20062007
20082009
20102011
0
200
400
600
800
1000
1200
1400
Swaziland TB Incidence rate, WHO 2012
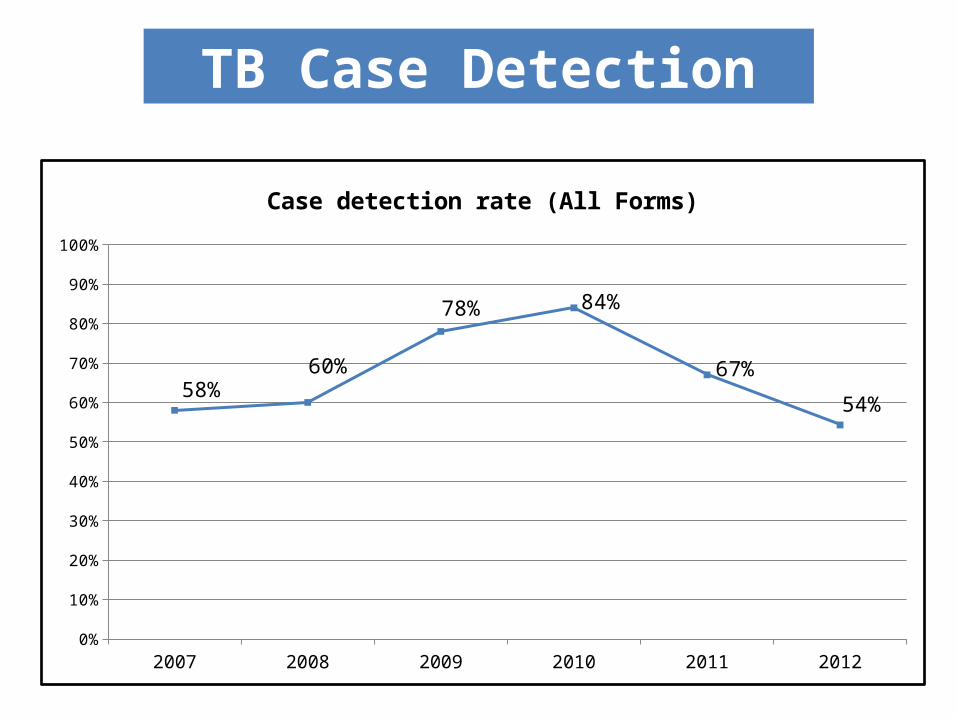
TB Case Detection
2007 2008 2009 2010 2011 20120%
10%
20%
30%
40%
50%
60%
70%
80%
90%
100%
58%60%
78% 84%
67%
54%
Case detection rate (All Forms)
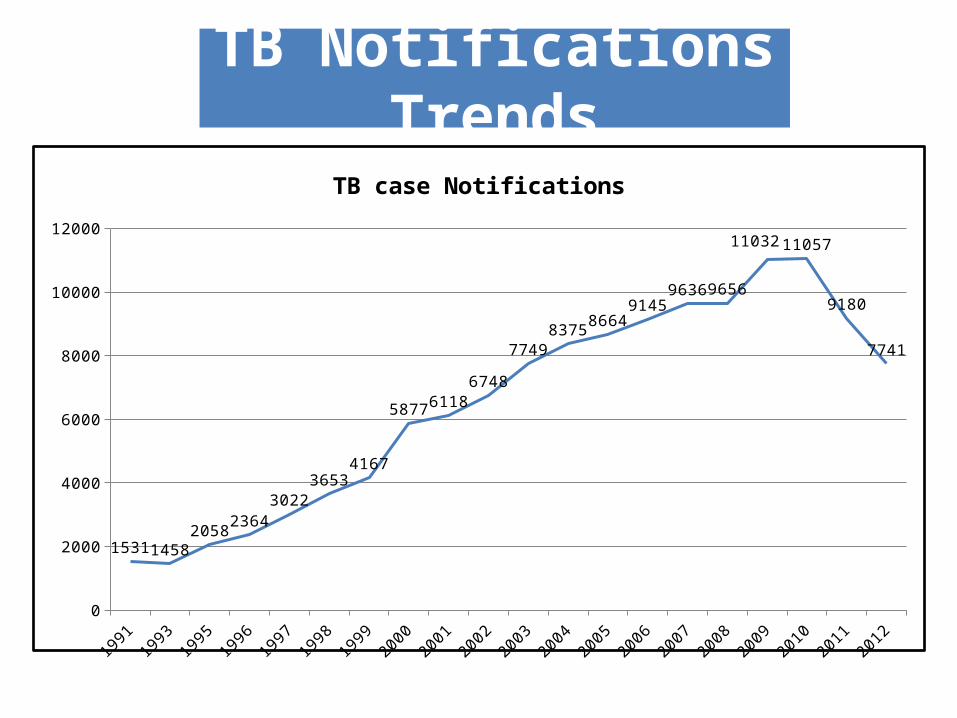
TB Notifications Trends
1991 1993 1995 1996 1997 1998 1999 2000 2001 2002 2003 2004 2005 2006 2007 2008 2009 2010 2011 20120
2000
4000
6000
8000
10000
12000
1531 14582058
23643022
36534167
5877 61186748
77498375
86649145
9636 9656
11032 11057
9180
7741
TB case Notifications
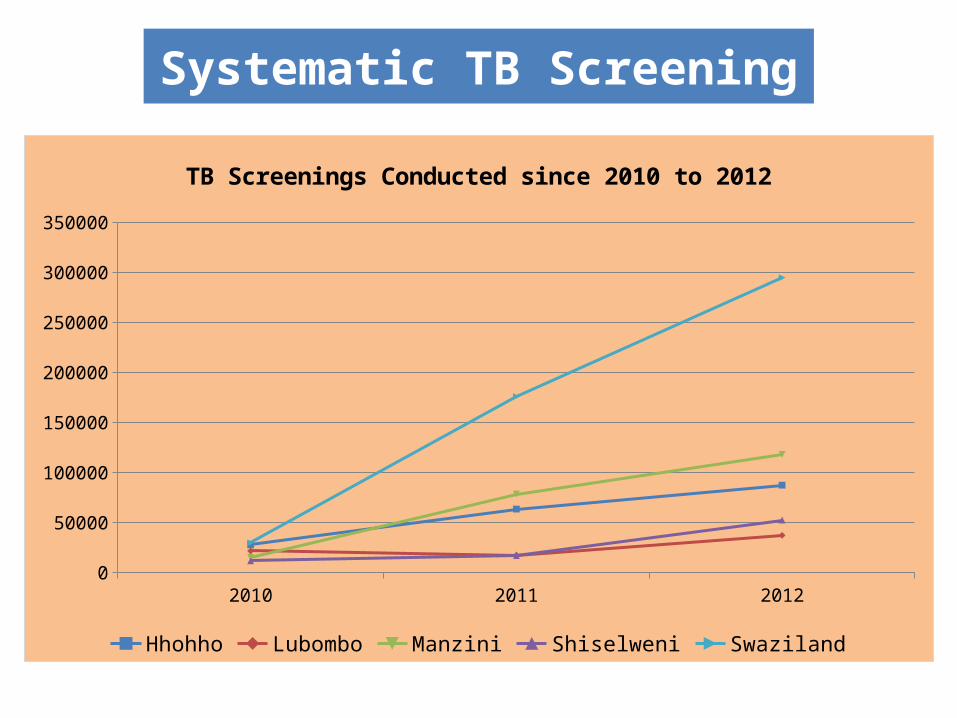
Systematic TB Screening
2010 2011 20120
50000
100000
150000
200000
250000
300000
350000
TB Screenings Conducted since 2010 to 2012
Hhohho Lubombo Manzini Shiselweni Swaziland
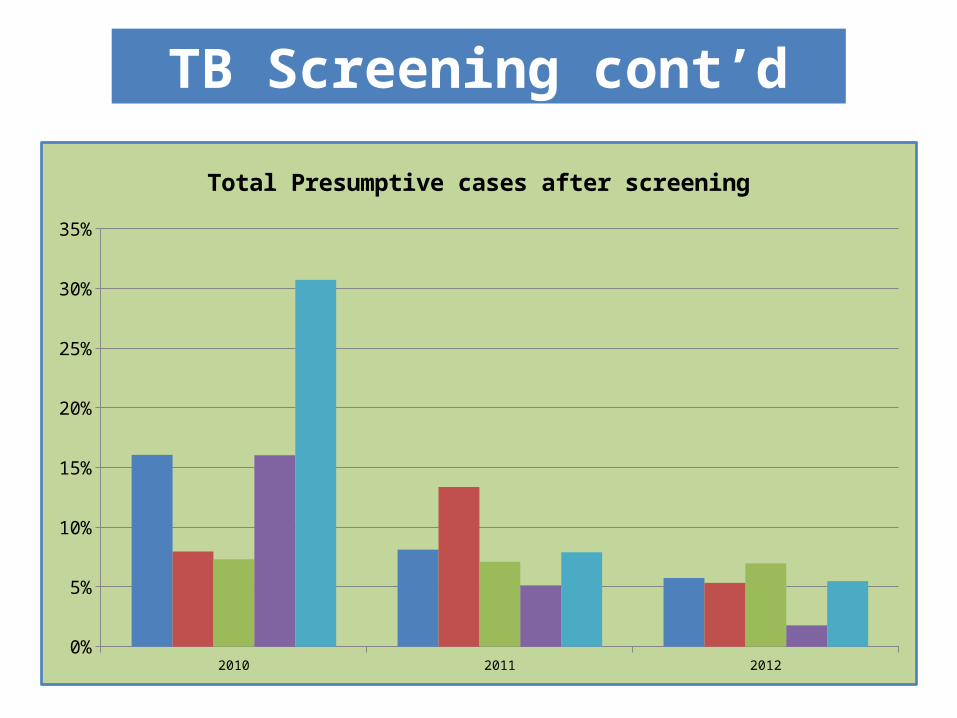
TB Screening cont’d
2010 2011 2012
Hhohho 0.160535481062255 0.0812347043498855 0.0574479310028443
Lubombo 0.079646017699115 0.133630418426992 0.0533398053016207
Manzini 0.0731208341582525 0.0709965548041342 0.069671089420975
Shiselweni 0.160258620689655 0.0512408498482414 0.0177786274134965
Swaziland 0.307147195788621 0.0789535062319739 0.0547841051420348
3%
8%
13%
18%
23%
28%
33%
Total Presumptive cases after screening
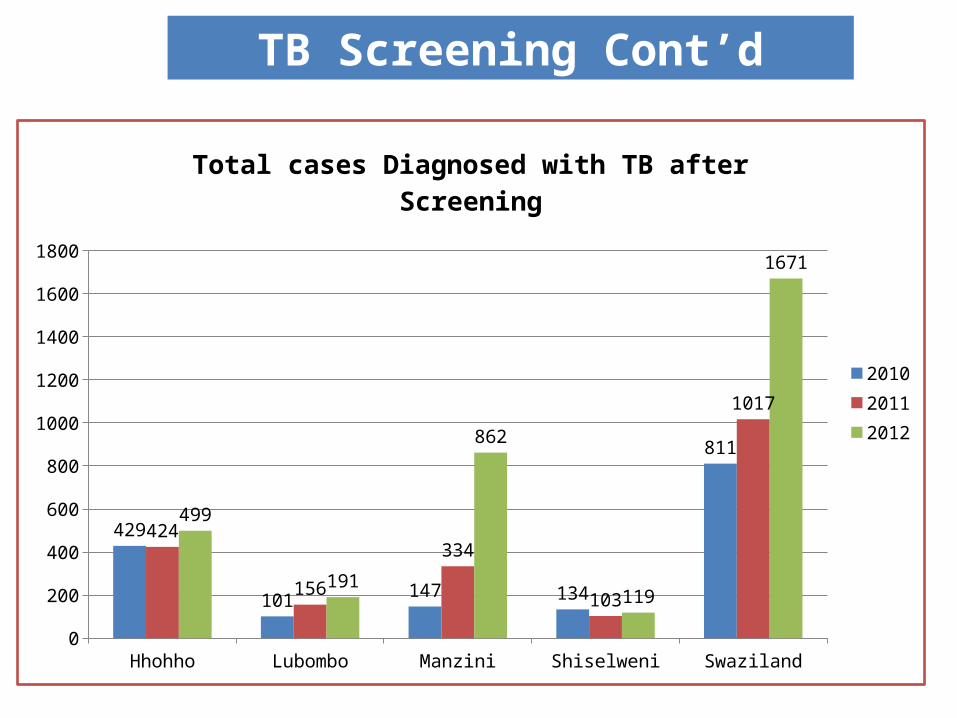
TB Screening Cont’d
Hhohho Lubombo Manzini Shiselweni Swaziland0
200
400
600
800
1000
1200
1400
1600
1800
429
101147 134
811
424
156
334
103
1017
499
191
862
119
1671
Total cases Diagnosed with TB after Screening
201020112012
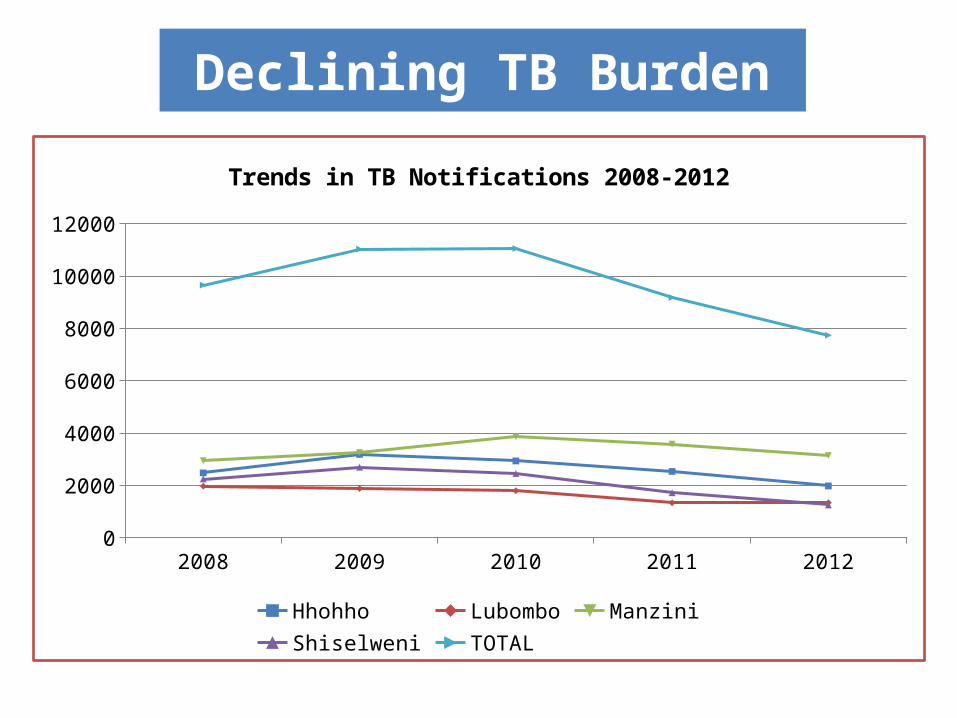
Declining TB Burden
2008 2009 2010 2011 20120
2000
4000
6000
8000
10000
12000
Trends in TB Notifications 2008-2012
Hhohho Lubombo Manzini Shiselweni TOTAL
CHILDHOOD TB NOTIFICATIONS
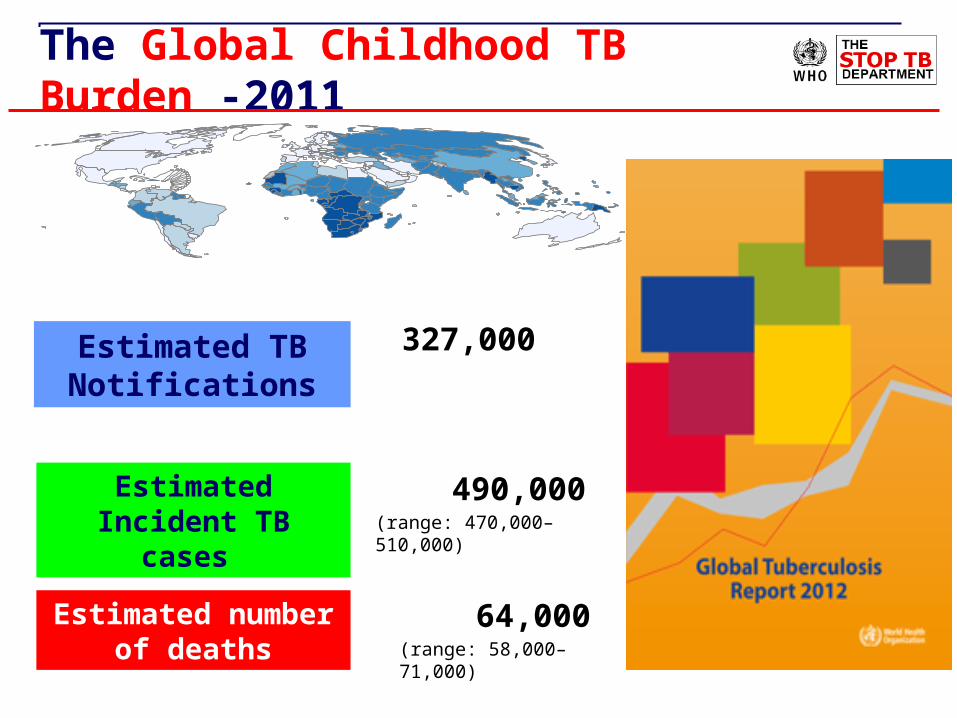
Estimated number of deaths
490,000(range: 470,000–510,000)
327,000 Estimated TB Notifications
The Global Childhood TB Burden -2011Estimated TB incidence rates, by country, 2010
TB cases per 100 000
0–24
25–49
50–99
100–299
>=300
No estimate
Estimated Incident TB cases
64,000(range: 58,000–71,000)
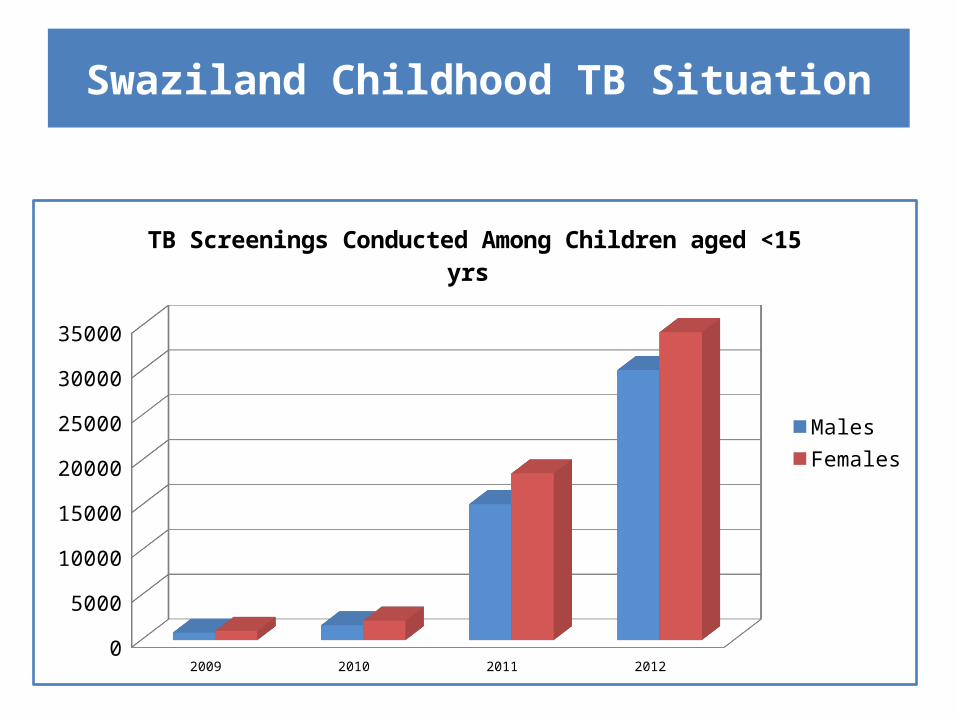
Swaziland Childhood TB Situation
2009 2010 2011 2012
Males 848 1656 15148 30099
Females 1032 2176 18582 34331
2500
7500
12500
17500
22500
27500
32500
TB Screenings Conducted Among Children aged <15 yrs
MalesFemales

TB Screening cont’d
2009 2010 2011 2012
Males 0.261792452830189 0.147946859903382 0.0433060470029047
0.0205986909864115
Females 0.842054263565892 0.126838235294118 0.0396082230115165
0.0253706562581923
5%15%25%35%45%55%65%75%85%95%
Presumptive TB Cases from Screenings among Children
TB Screening Cont’d
2009 2010 2011 20120
5
10
15
20
25
30
35
40
45
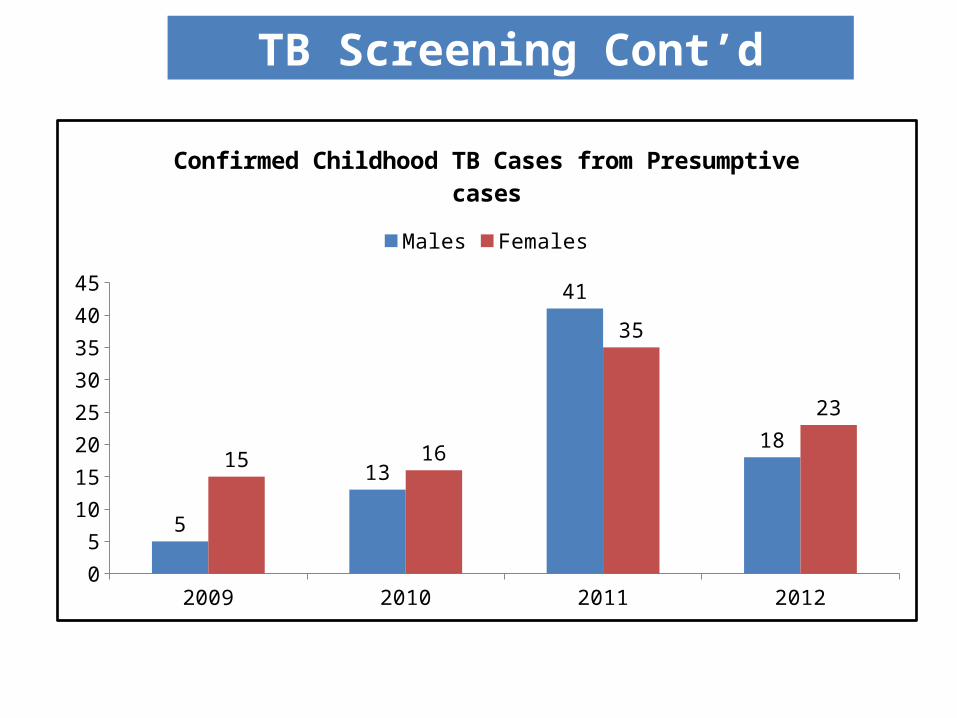
5
13
41
1815 16
35
23
Confirmed Childhood TB Cases from Presumptive cases
Males Females
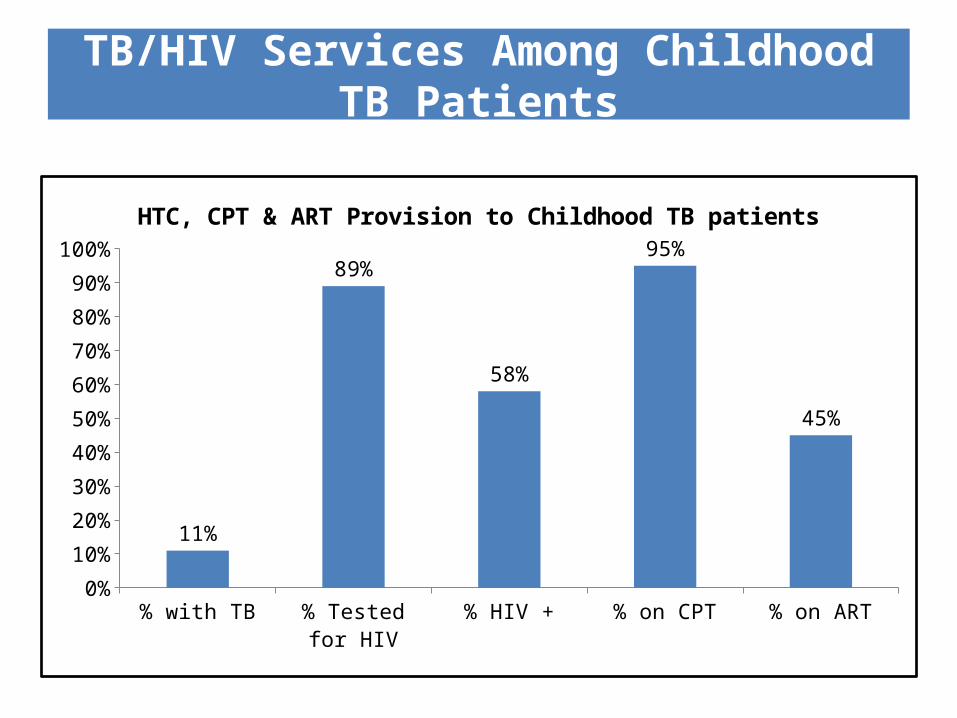
TB/HIV Services Among Childhood TB Patients
% with TB % Tested for HIV % HIV + % on CPT % on ART0%
10%
20%
30%
40%
50%
60%
70%
80%
90%
100%
11%
89%
58%
95%
45%
HTC, CPT & ART Provision to Childhood TB patients
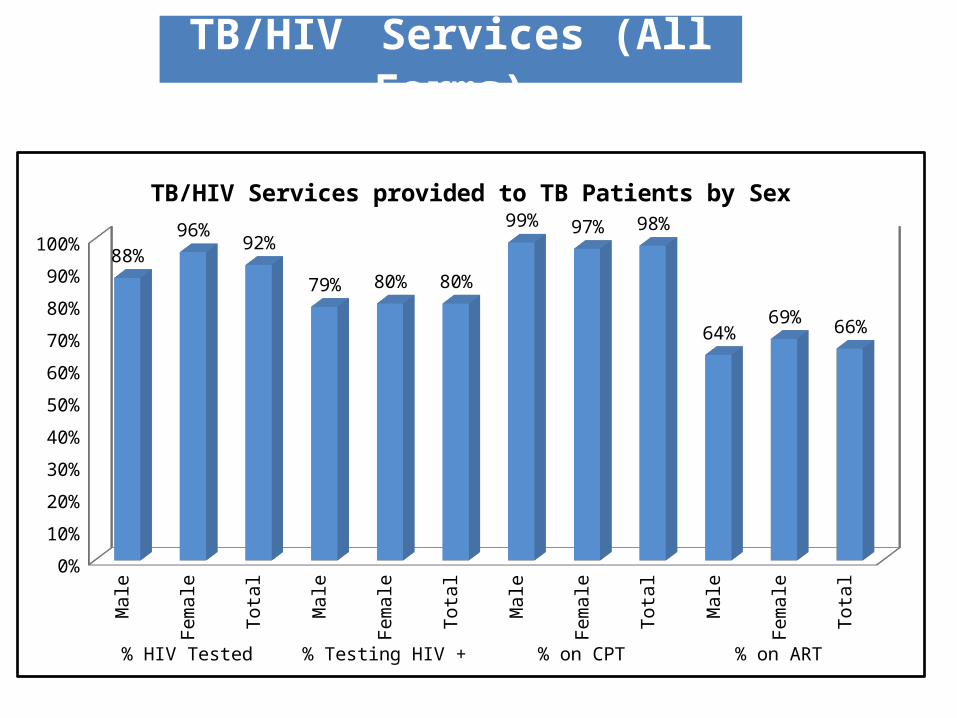
TB/HIV Services (All Forms)
Male Female Total Male Female Total Male Female Total Male Female Total% HIV Tested % Testing HIV + % on CPT % on ART
0%
10%
20%
30%
40%
50%
60%
70%
80%
90%
100%88%
96%92%
79% 80% 80%
99% 97% 98%
64%69%
66%
TB/HIV Services provided to TB Patients by Sex
CHALLENGES & RECOMMENDATIONS
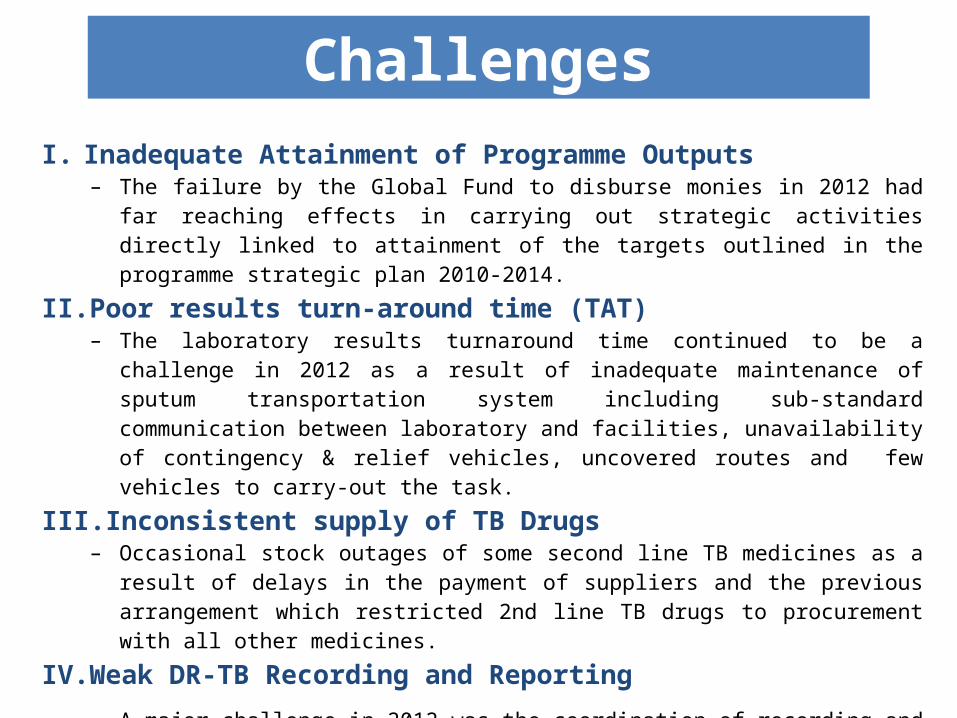
ChallengesI. Inadequate Attainment of Programme Outputs
– The failure by the Global Fund to disburse monies in 2012 had far reaching effects in carrying out strategic activities directly linked to attainment of the targets outlined in the programme strategic plan 2010-2014.
II. Poor results turn-around time (TAT)– The laboratory results turnaround time continued to be a challenge in 2012 as a result of inadequate
maintenance of sputum transportation system including sub-standard communication between laboratory and facilities, unavailability of contingency & relief vehicles, uncovered routes and few vehicles to carry-out the task.
III. Inconsistent supply of TB Drugs– Occasional stock outages of some second line TB medicines as a result of delays in the payment of
suppliers and the previous arrangement which restricted 2nd line TB drugs to procurement with all other medicines.
IV. Weak DR-TB Recording and Reporting
– A major challenge in 2012 was the coordination of recording and reporting needs for DR-TB response as the services were being decentralized to other facilities beyond the national TB Hospital in Moneni while the guidelines themselves were being reviewed for adoption.
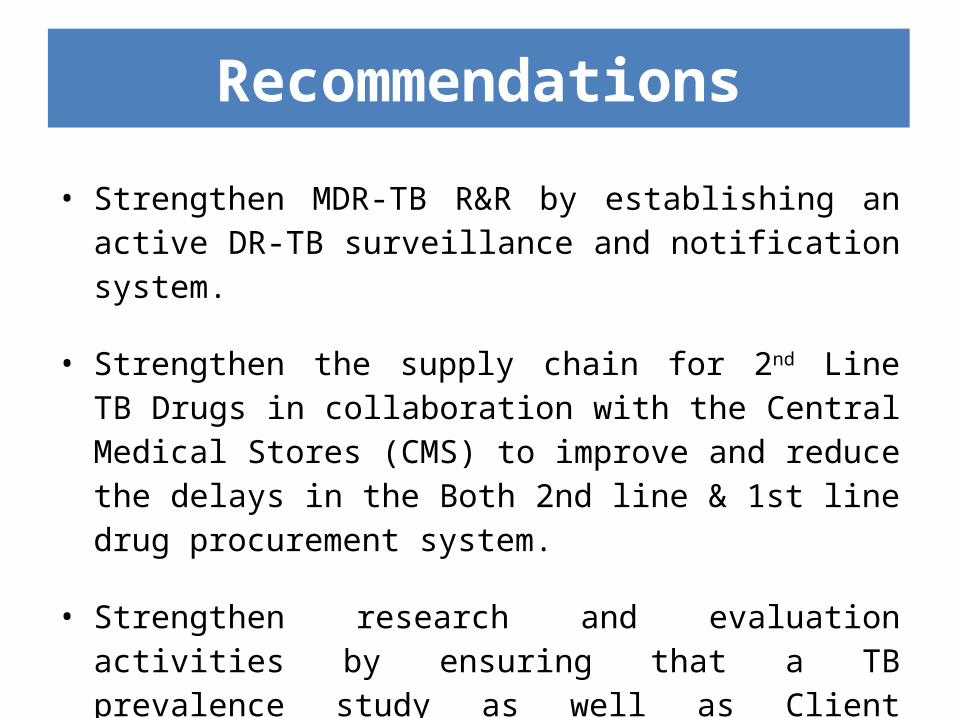
Recommendations
• Strengthen MDR-TB R&R by establishing an active DR-TB surveillance and notification system.
• Strengthen the supply chain for 2nd Line TB Drugs in collaboration with the Central Medical Stores (CMS) to improve and reduce the delays in the Both 2nd line & 1st line drug procurement system.
• Strengthen research and evaluation activities by ensuring that a TB prevalence study as well as Client satisfaction survey are conducted.
• Strengthen collaboration between the NRL and facility labs to improve results Turn Around Time (TAT).

THANK YOU…