Embed Size (px)
Citation preview
National Survey of Student Engagement (NSSE)
Taking the U of L’s Relationship with Students to the Next Level
October 2011
2
Outline
Q: What is engagement, how is it measured, and how does the U of L compare to other universities?
Covered in this presentation:
National Survey of Student Engagement (NSSE)

3
The Student Engagement Trinity
What students do -- time and energy devoted to educationally purposeful activities
What institutions do -- using effective educational practices to induce students to do the right things
Educationally effective institutions channel student energy toward the right activities
NSSE Overview
4
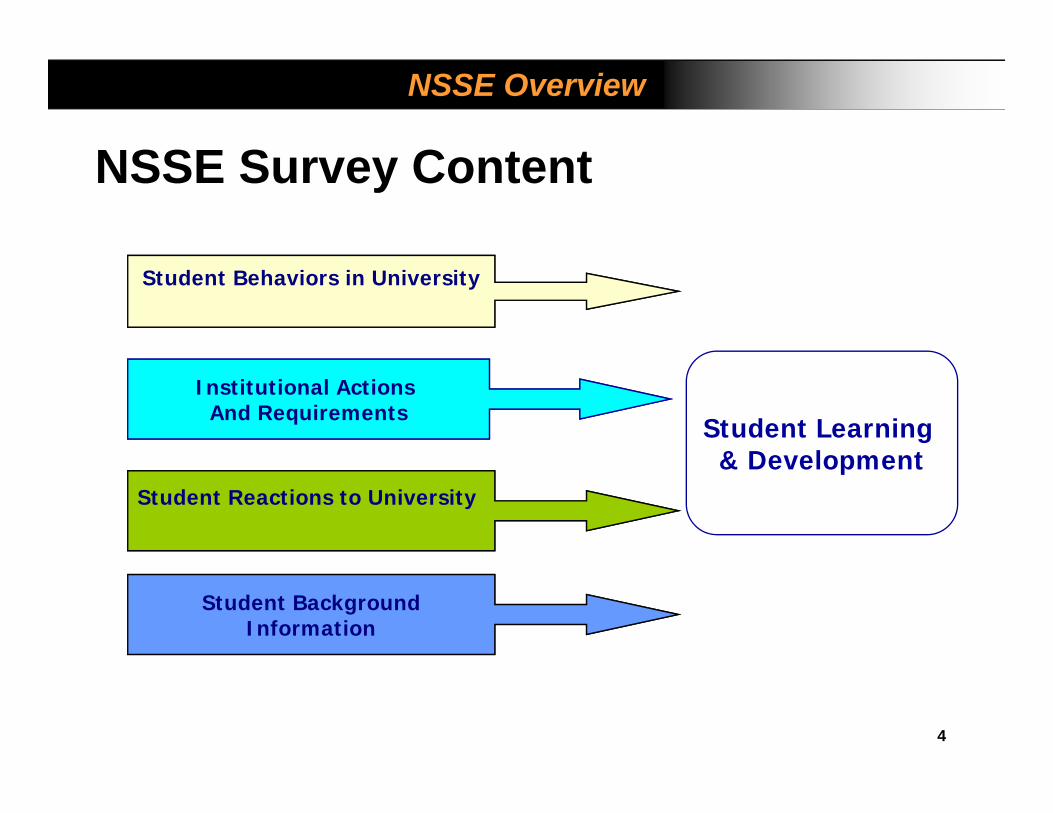
NSSE Survey Content
Student Behaviors in University
Institutional Actions And Requirements
Student Reactions to University
Student BackgroundInformation
Student Learning & Development
NSSE Overview
5
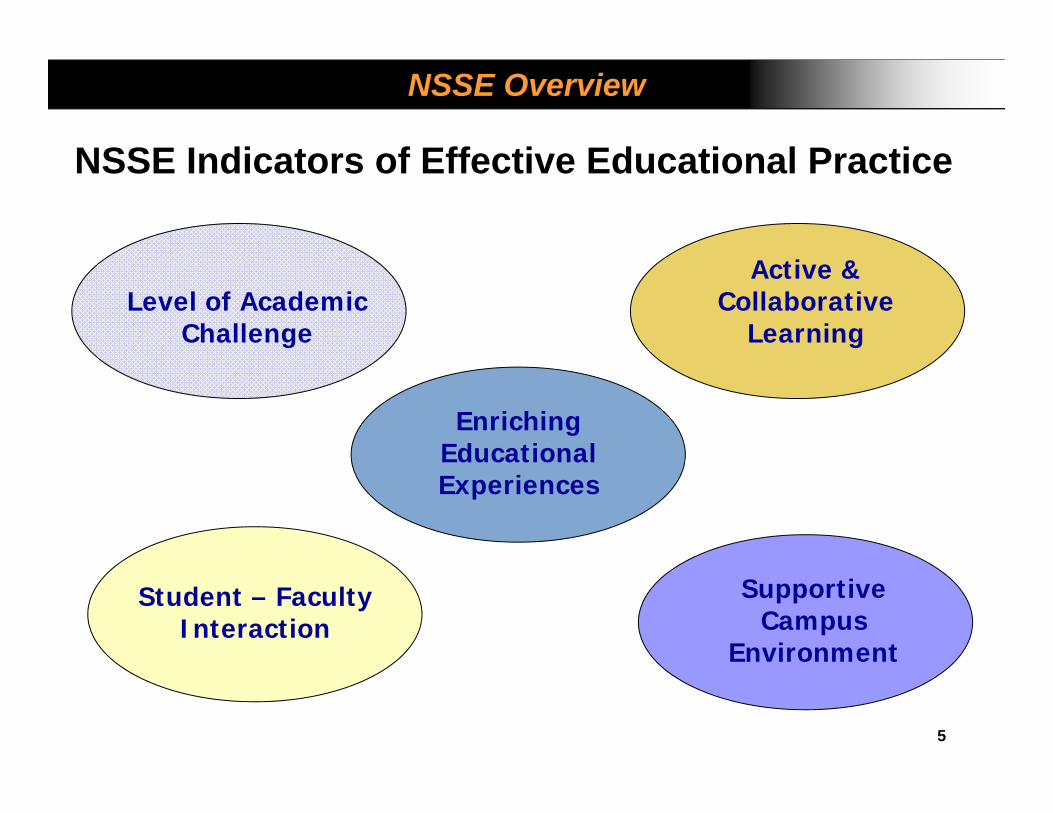
Level of Academic Challenge
Active & Collaborative
Learning
Enriching Educational Experiences
Student – Faculty Interaction
Supportive Campus
Environment
NSSE Indicators of Effective Educational Practice
NSSE Overview

6
Why a National Survey? Refocus conversations about
undergraduate quality to what matters most
Enhance institutional improvement efforts
Foster comparative and consortium activity
Inform accountability efforts Provide systematic national
data on “good educational practices”
NSSE Overview

7
Survey Administration Administered to random
samples of first-year & senior students
Paper & Web-based survey
Flexible to accommodate consortium questions
Multiple follow-ups to increase response rates
NSSE Overview
8
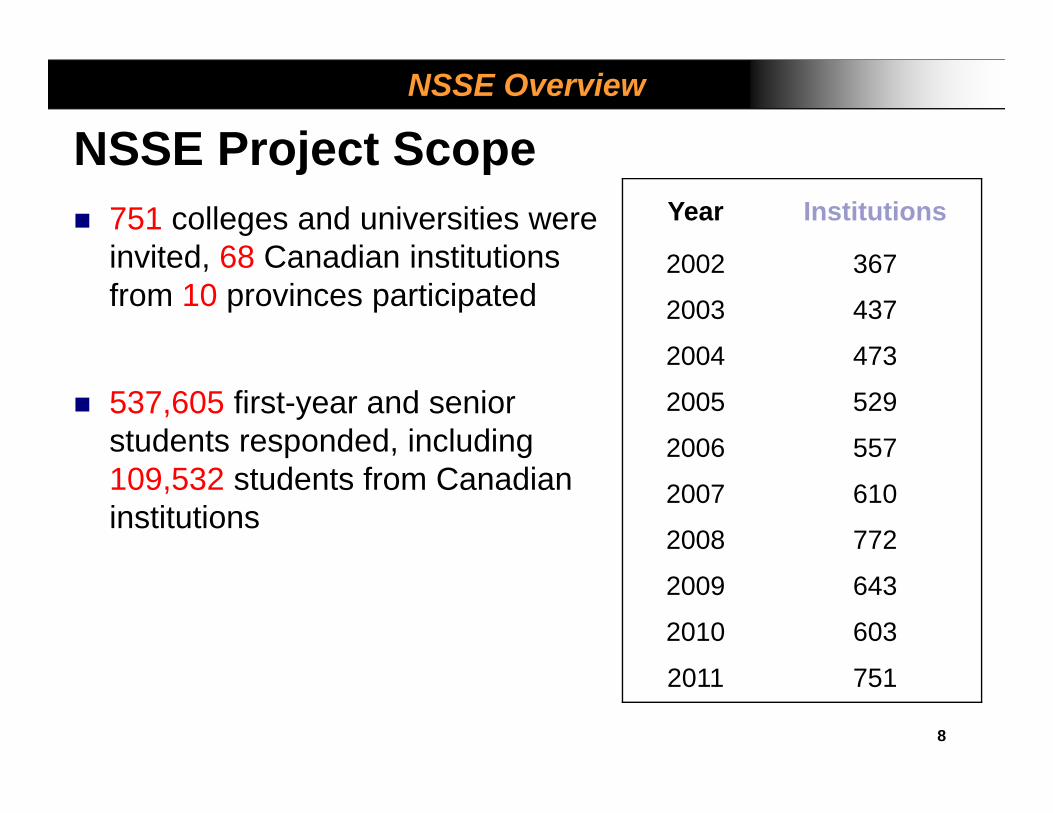
NSSE Project Scope 751 colleges and universities were
invited, 68 Canadian institutions from 10 provinces participated
537,605 first-year and senior students responded, including 109,532 students from Canadian institutions
Year Institutions
2002 367
2003 437
2004 473
2005 529
2006 557
2007 610
2008 772
2009 643
2010 603
2011 751
NSSE Overview

9
NSSE 2011 Survey Population and Respondents
Almost two million students were invited to participate in NSSE 2011, with 537,605responding
3,274 U of L students were invited to participate, with 1,060 responding
U of L’s response rate = 32%
NSSE Overview
10
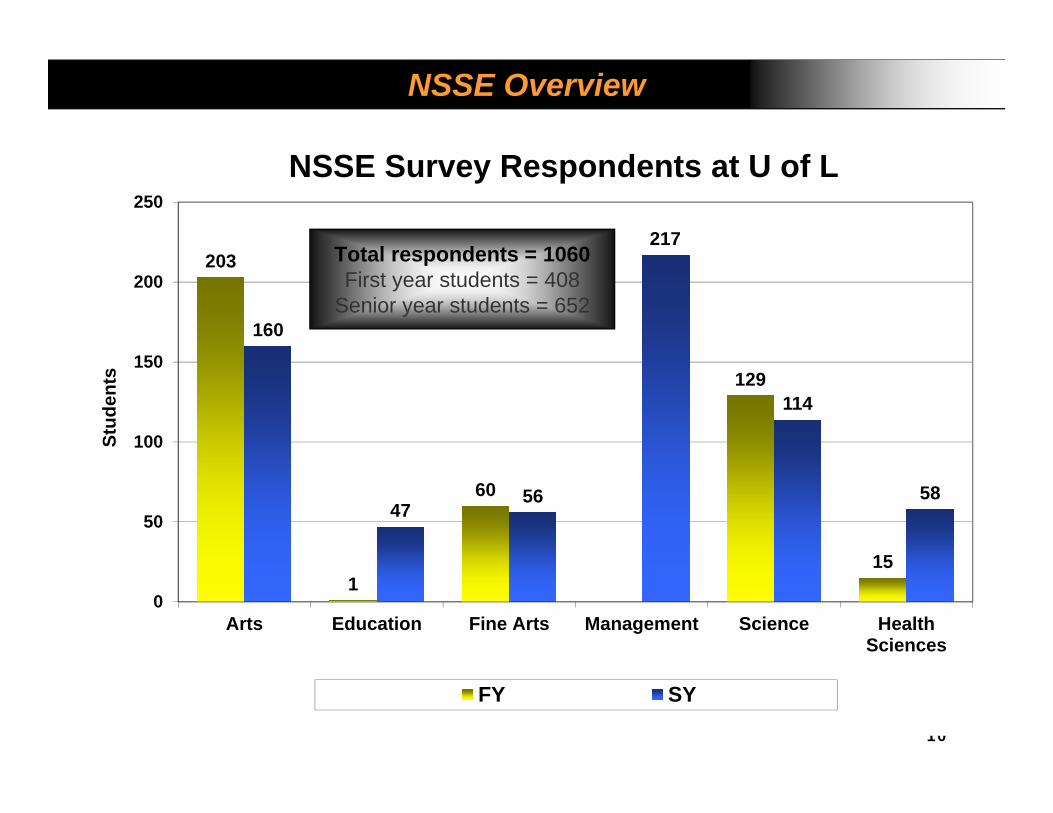
NSSE Overview
203
1
60
129
15
160
4756
217
114
58
0
50
100
150
200
250
Arts Education Fine Arts Management Science HealthSciences
Stud
ents
NSSE Survey Respondents at U of L
FY SY
Total respondents = 1060First year students = 408
Senior year students = 652
11
NSSE Overview
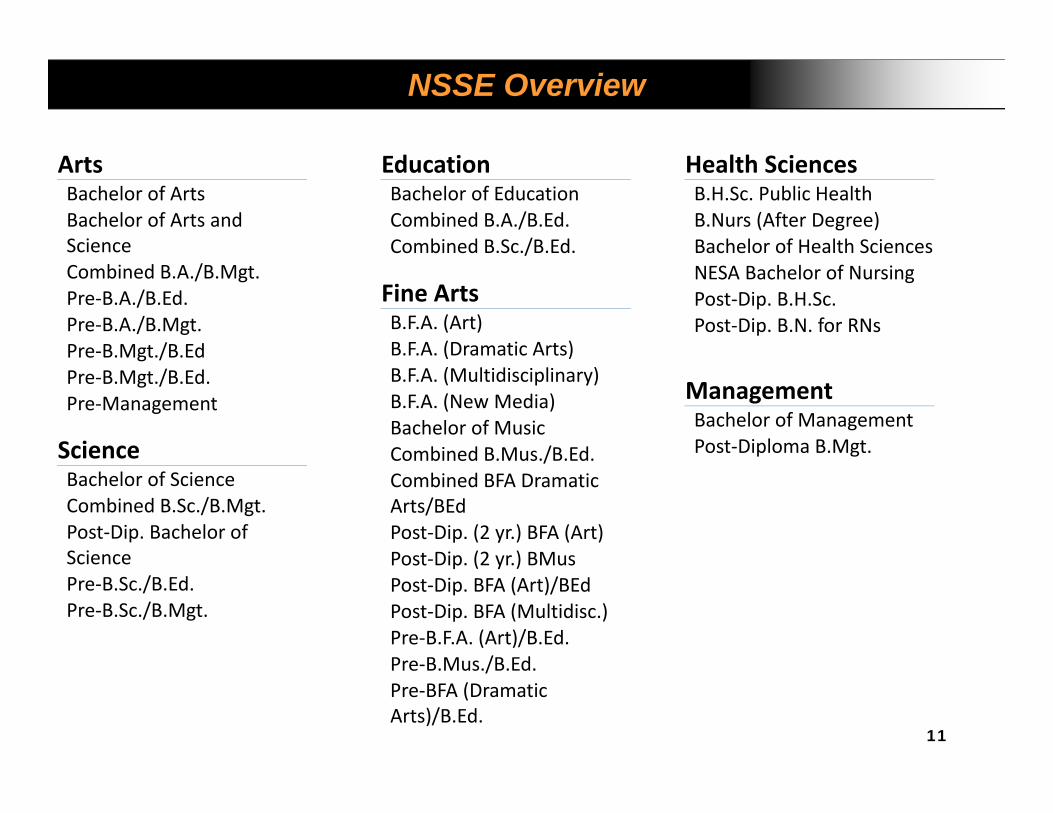
ArtsBachelor of ArtsBachelor of Arts and ScienceCombined B.A./B.Mgt.Pre‐B.A./B.Ed.Pre‐B.A./B.Mgt.Pre‐B.Mgt./B.EdPre‐B.Mgt./B.Ed.Pre‐Management
EducationBachelor of EducationCombined B.A./B.Ed.Combined B.Sc./B.Ed.
Fine ArtsB.F.A. (Art)B.F.A. (Dramatic Arts)B.F.A. (Multidisciplinary)B.F.A. (New Media)Bachelor of MusicCombined B.Mus./B.Ed.Combined BFA Dramatic Arts/BEdPost‐Dip. (2 yr.) BFA (Art)Post‐Dip. (2 yr.) BMusPost‐Dip. BFA (Art)/BEdPost‐Dip. BFA (Multidisc.)Pre‐B.F.A. (Art)/B.Ed.Pre‐B.Mus./B.Ed.Pre‐BFA (Dramatic Arts)/B.Ed.
ManagementBachelor of ManagementPost‐Diploma B.Mgt.
Health SciencesB.H.Sc. Public HealthB.Nurs (After Degree)Bachelor of Health SciencesNESA Bachelor of NursingPost‐Dip. B.H.Sc.Post‐Dip. B.N. for RNs
ScienceBachelor of ScienceCombined B.Sc./B.Mgt.Post‐Dip. Bachelor of SciencePre‐B.Sc./B.Ed.Pre‐B.Sc./B.Mgt.
Profile

14
U of L Student Attributes
Profile
% of student pop.
Female students 65
Students 19 years of age or younger 27
Students 23 years of age or younger 69
Students who started post-secondary elsewhere 33
FY students considering themselves full-time 96
SY students considering themselves full-time 90
15
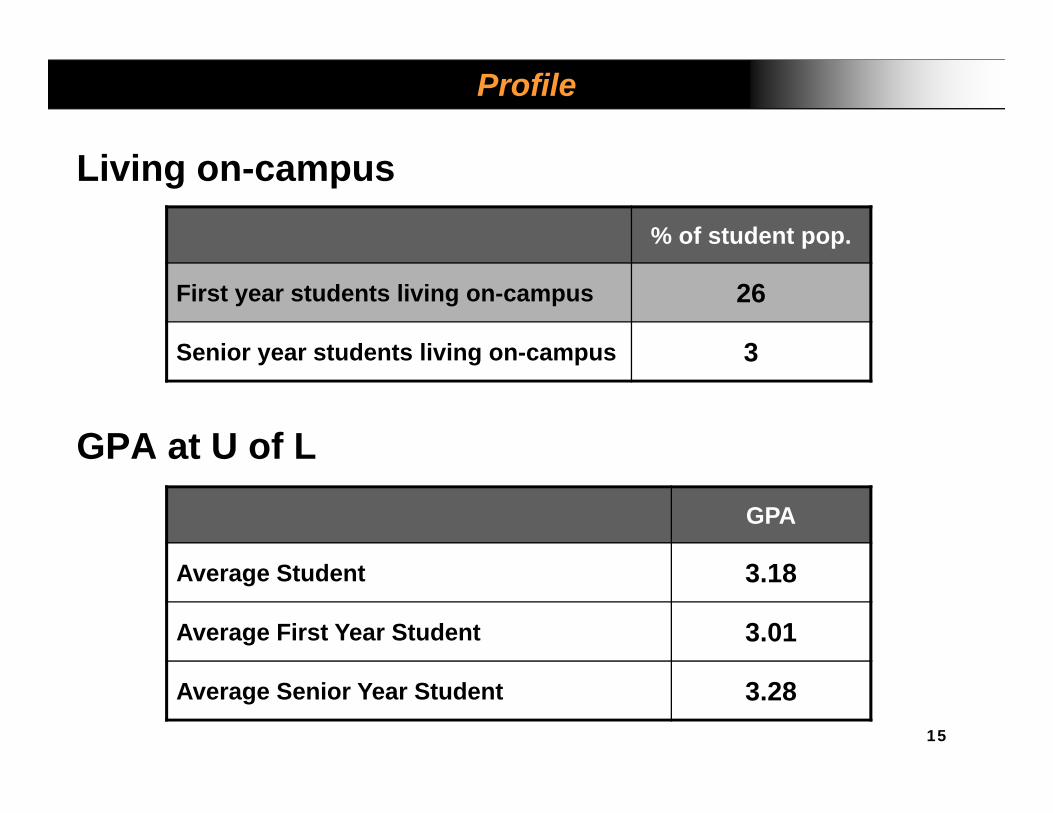
GPA at U of L
Profile
GPA
Average Student 3.18
Average First Year Student 3.01
Average Senior Year Student 3.28
Living on-campus% of student pop.
First year students living on-campus 26
Senior year students living on-campus 3

16
Profile
35%
29%
33%31%
0%
10%
20%
30%
40%
Father MotherFY SY
What percentage of students' parents have completed only some or only all of high school?
Perc
enta
ge

The BenchmarksLevel of Academic Challenge
Active and Collaborative LearningStudent-Faculty Interaction
Enriching Educational ExperiencesSupportive Campus Environment

Level of Academic Challenge

19
Level of Academic Challenge
Level of Academic Challenge entails: Preparing for class (studying, reading, writing, rehearsing, etc.) Number of assigned textbooks, books, or course packs Number of written papers Coursework emphasizing
Analysis Synthesis Judgment Application
Working harder than thought possible to meet instructor’s expectations Campus environment emphasizing school work

20
Level of Academic Challenge
47.8
55.449.8
54.251.2
55.5
10
20
30
40
50
60
FY SY
U of L Western Canadian Univ/Coll Canadian Univ
Level of Academic Challenge (LAC)W
eigh
ted
Ave
rage

21
Level of Academic Challenge
3.16 3.063.163.00
3.17 3.08
0
1
2
3
4
FY SY
U of L Western Canadian Univ/Coll Canadian Univ
Number of assigned textbooks, books, or book-length packs or course readings
>20 Books
5-10 Books
11-20 Books
1-4 Books
None
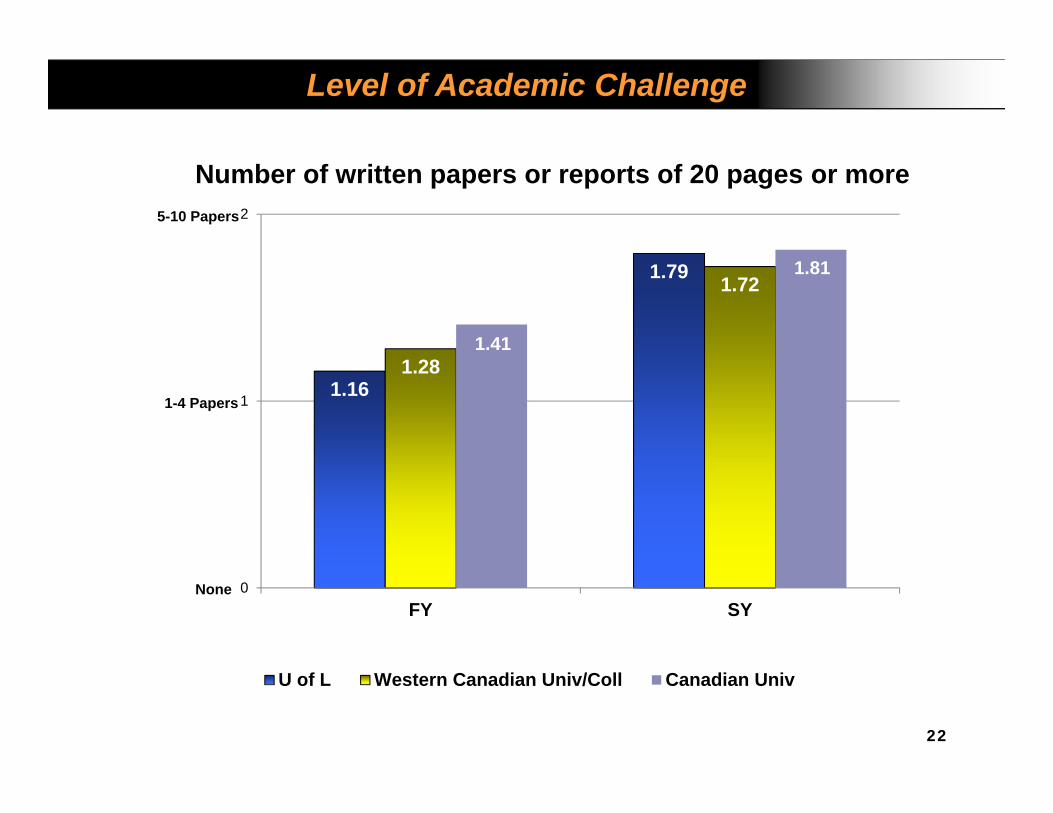
22
Level of Academic Challenge
1.16
1.79
1.28
1.72
1.41
1.81
0
1
2
FY SY
U of L Western Canadian Univ/Coll Canadian Univ
Number of written papers or reports of 20 pages or more5-10 Papers
1-4 Papers
None
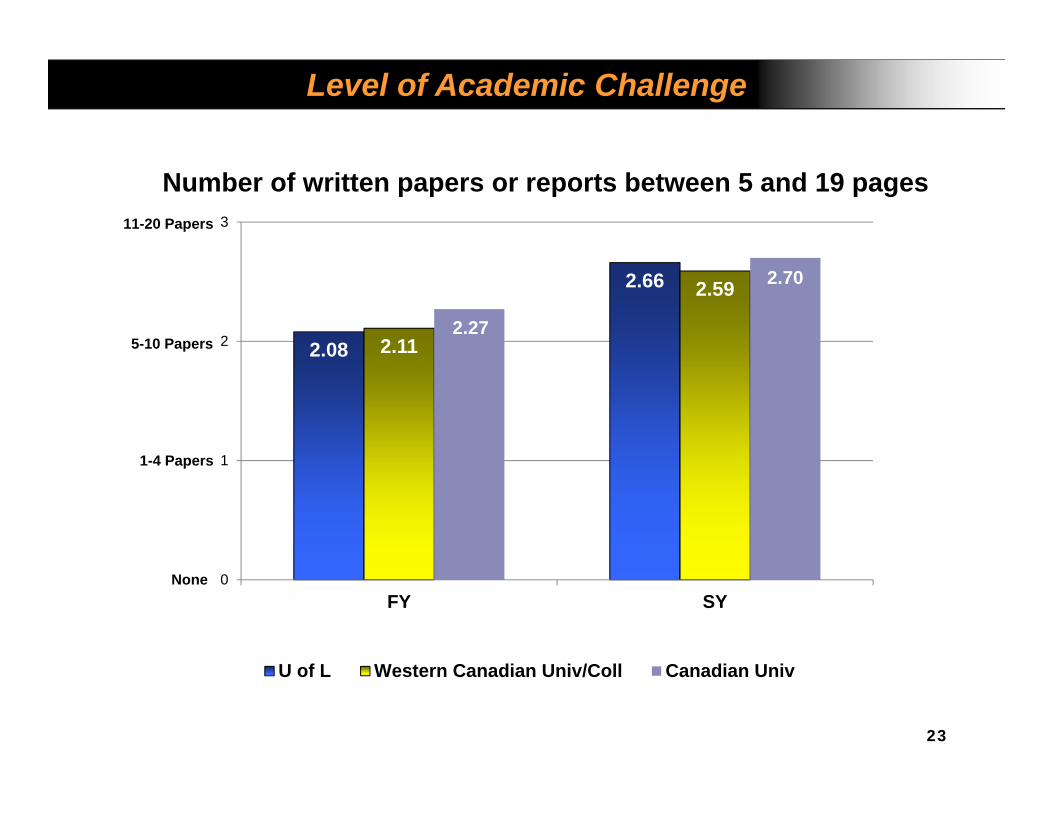
23
Level of Academic Challenge
2.08
2.66
2.11
2.59
2.27
2.70
0
1
2
3
FY SY
U of L Western Canadian Univ/Coll Canadian Univ
Number of written papers or reports between 5 and 19 pages
5-10 Papers
11-20 Papers
1-4 Papers
None

24
Level of Academic Challenge
2.342.552.47 2.552.51 2.59
0
1
2
3
FY SY
U of L Western Canadian Univ/Coll Canadian Univ
Number of written papers or reports of fewer than 5 pages
5-10 Papers
11-20 Papers
1-4 Papers
None

25
Level of Academic Challenge
4.144.334.34 4.484.42 4.48
1
2
3
4
5
FY SY
U of L Western Canadian Univ/Coll Canadian Univ
11-15
16-20
6-10
Preparing for class(studying, reading, writing, doing homework or lab work,
1-5
0
Hou
rsPe
r Wee
k

26
Level of Academic Challenge
3.04 3.013.11 3.103.14 3.14
1
2
3
4
FY SY
U of L Western Canadian Univ/Coll Canadian Univ
Very Much
Quite a Bit
Spending significant amounts of time studying and on academic work
Some
Very Little

Active and Collaborative Learning
28
Active and Collaborative Learning
Active and Collaborative Learning shows if students: Asked questions in class or contributed to class discussions Made a class presentation Worked with other students on projects during class Worked with classmates outside of class to prepare class assignments Tutored or taught other students Participated in a community-based project as part of a regular course Discussed ideas from your readings or classes with others outside of class
(students, family members, co-workers, etc.)

29
Active and Collaborative Learning
33.7
49.1
35.5
45.3
36.4
45.3
10
20
30
40
50
FY SY
U of L Western Canadian Univ/Coll Canadian Univ
Active and Collaborative Learning (ACL)W
eigh
ted
Ave
rage

30
Active and Collaborative Learning
2.44
2.99
2.32
2.73
2.32
2.73
1
2
3
4
FY SY
U of L Western Canadian Univ/Coll Canadian Univ
Asked questions in class or contributed to class discussionsVery Often
Often
Sometimes
Never
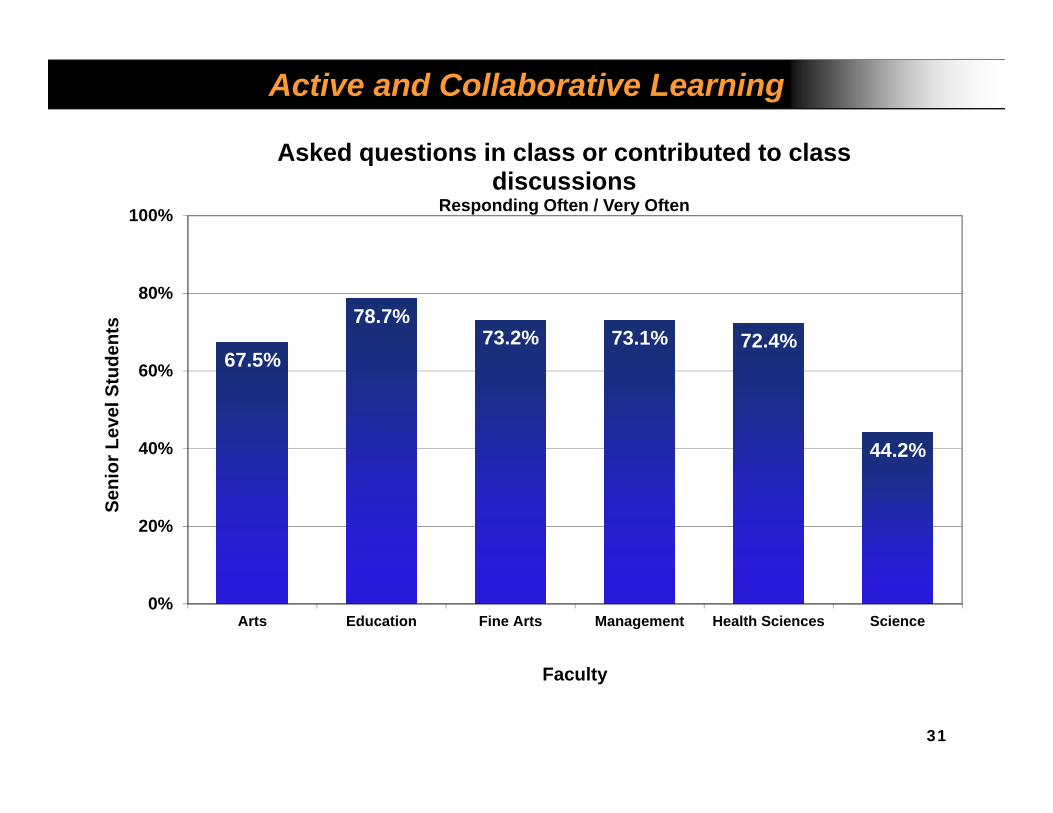
31
Active and Collaborative Learning
67.5%
78.7%73.2% 73.1% 72.4%
44.2%
0%
20%
40%
60%
80%
100%
Arts Education Fine Arts Management Health Sciences Science
Seni
or L
evel
Stu
dent
s
Faculty
Asked questions in class or contributed to class discussions
Responding Often / Very Often
32
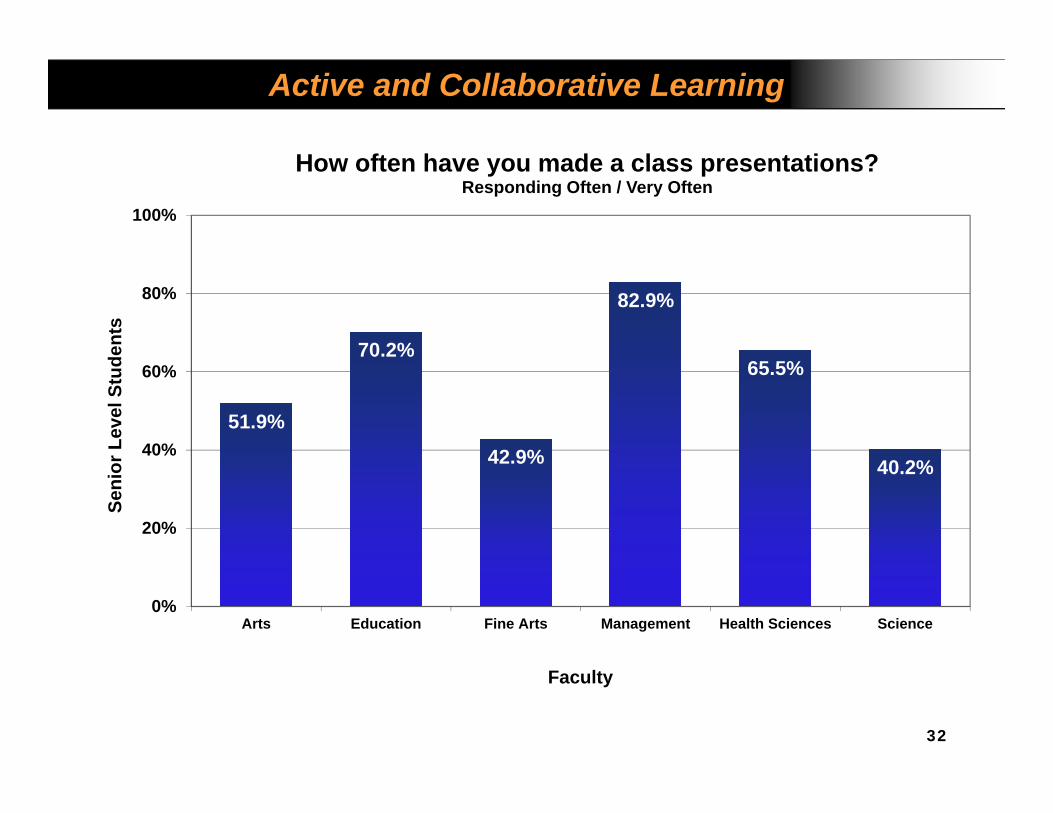
Active and Collaborative Learning
51.9%
70.2%
42.9%
82.9%
65.5%
40.2%
0%
20%
40%
60%
80%
100%
Arts Education Fine Arts Management Health Sciences Science
Seni
or L
evel
Stu
dent
s
Faculty
How often have you made a class presentations?Responding Often / Very Often

33
Active and Collaborative Learning
2.07
2.41
2.172.25
2.132.22
1
2
3
FY SY
U of L Western Canadian Univ/Coll Canadian Univ
Worked with other students on projects during classOften
Sometimes
Never

34
Active and Collaborative Learning
2.3
2.98
2.39
2.82
2.55
2.86
1
2
3
FY SY
U of L Western Canadian Univ/Coll Canadian Univ
Worked with classmates outside of class
Often
Sometimes
Never

Student-Faculty Interaction

36
Student-Faculty Interaction
Student-Faculty Interaction shows if students: Discussed grades or assignments with an instructor Talked about career plans with a faculty member or advisor Discussed ideas from your readings or classes with faculty members
outside of class Worked with faculty members on activities other than coursework
(committees, orientation, student-life activities, etc.) Received prompt written or oral feedback from faculty on your academic
performance Worked with a faculty member on a research project outside of course or
program requirements

37
Student-Faculty Interaction
27.8
37.3
23.7
32.6
22.8
32.2
10
20
30
40
FY SY
U of L Western Canadian Univ/Coll Canadian Univ
Student-Faculty Interaction (SFI)W
eigh
ted
Ave
rage
38
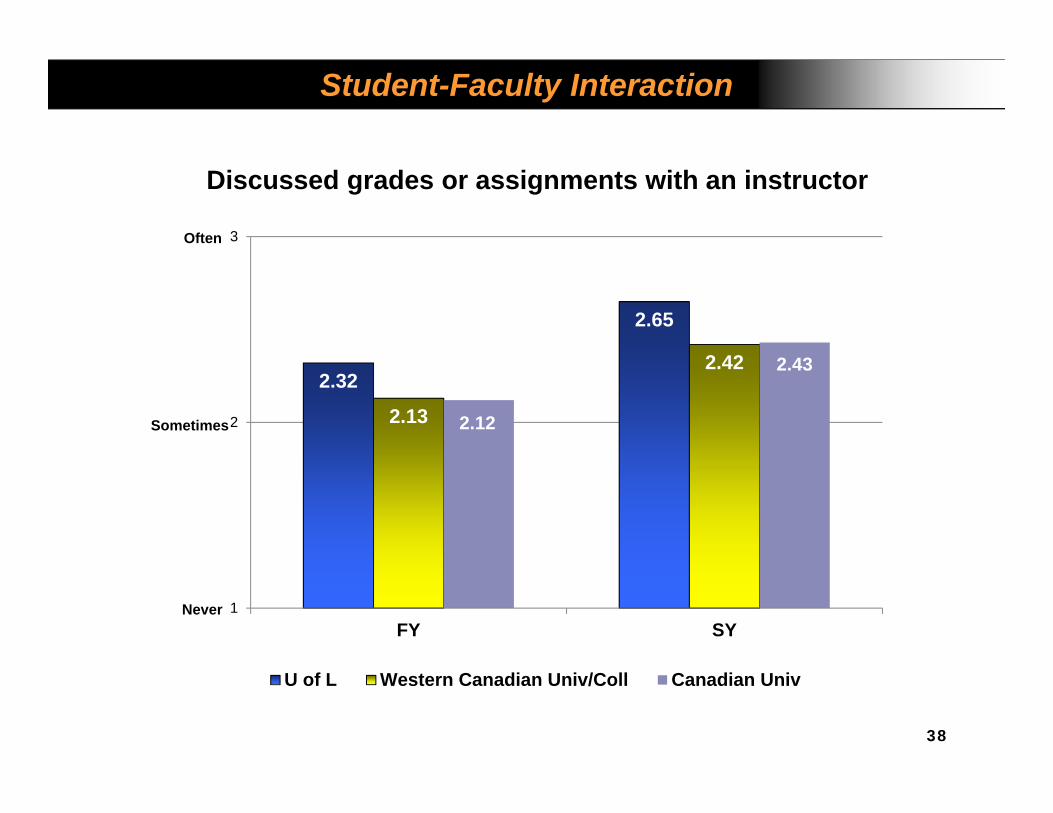
Student-Faculty Interaction
2.32
2.65
2.13
2.42
2.12
2.43
1
2
3
FY SY
U of L Western Canadian Univ/Coll Canadian Univ
Discussed grades or assignments with an instructor
Often
Sometimes
Never

39
Student-Faculty Interaction
52.3%58.7%
43.6%
52.6%58.6%
44.1%
0%
20%
40%
60%
80%
100%
Arts Education Fine Arts Management Health Sciences Science
Seni
or L
evel
Stu
dent
s
Discussed grades or assignments with an instructorResponding Often / Very Often
Faculty

40
Student-Faculty Interaction
2.002.16
1.68
1.96
1.63
1.95
1
2
3
FY SY
U of L Western Canadian Univ/Coll Canadian Univ
Talked about career plans with a faculty member or advisor
Often
Sometimes
Never
41
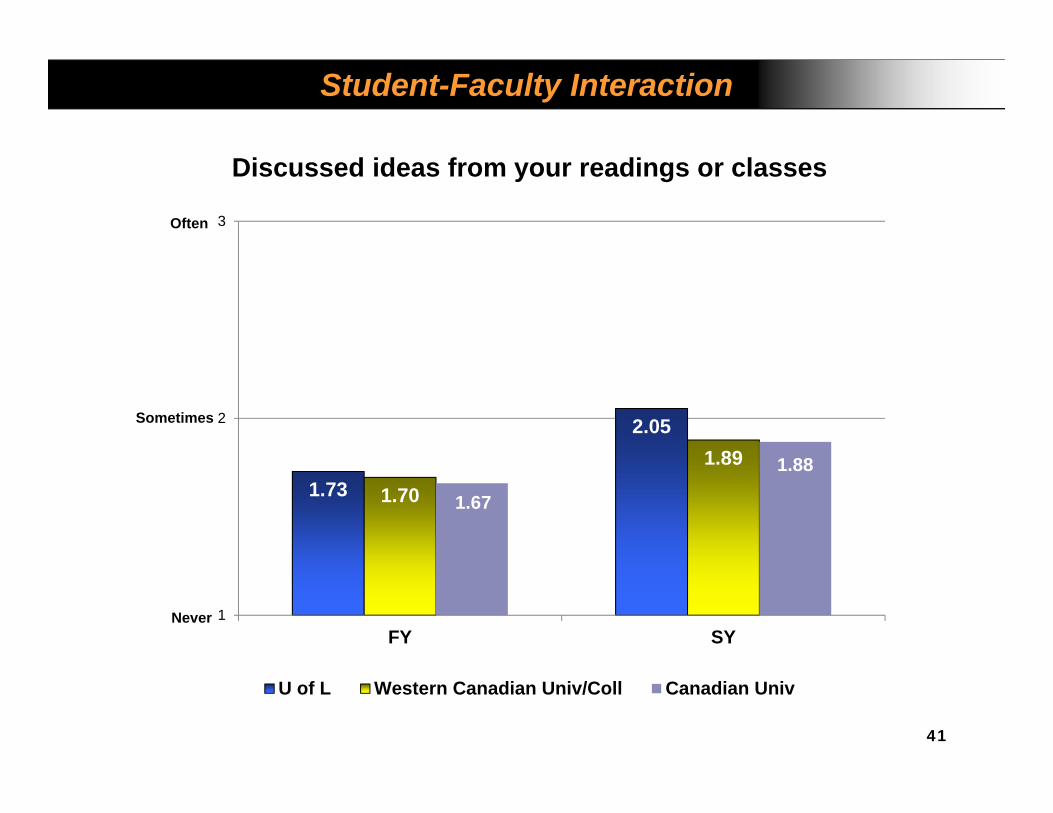
Student-Faculty Interaction
1.73
2.05
1.70
1.89
1.67
1.88
1
2
3
FY SY
U of L Western Canadian Univ/Coll Canadian Univ
Discussed ideas from your readings or classes
Often
Sometimes
Never
42
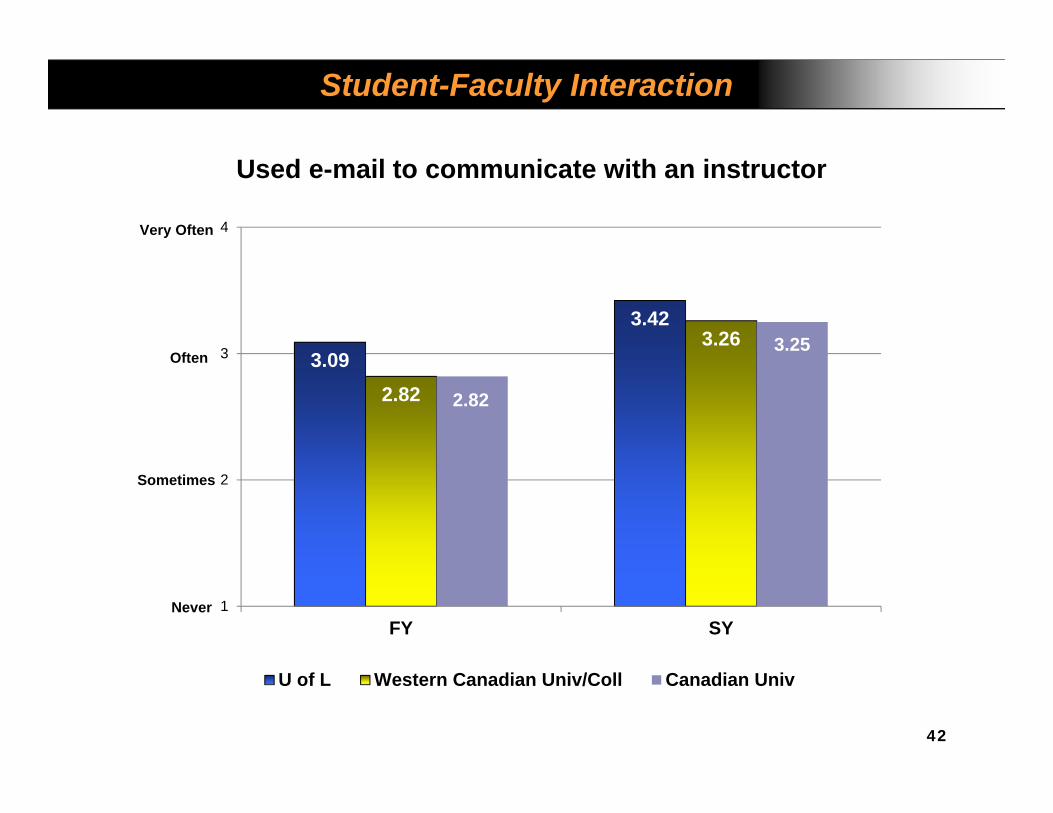
Student-Faculty Interaction
3.09
3.42
2.82
3.26
2.82
3.25
1
2
3
4
FY SY
U of L Western Canadian Univ/Coll Canadian Univ
Used e-mail to communicate with an instructor
Often
Sometimes
Never
Very Often
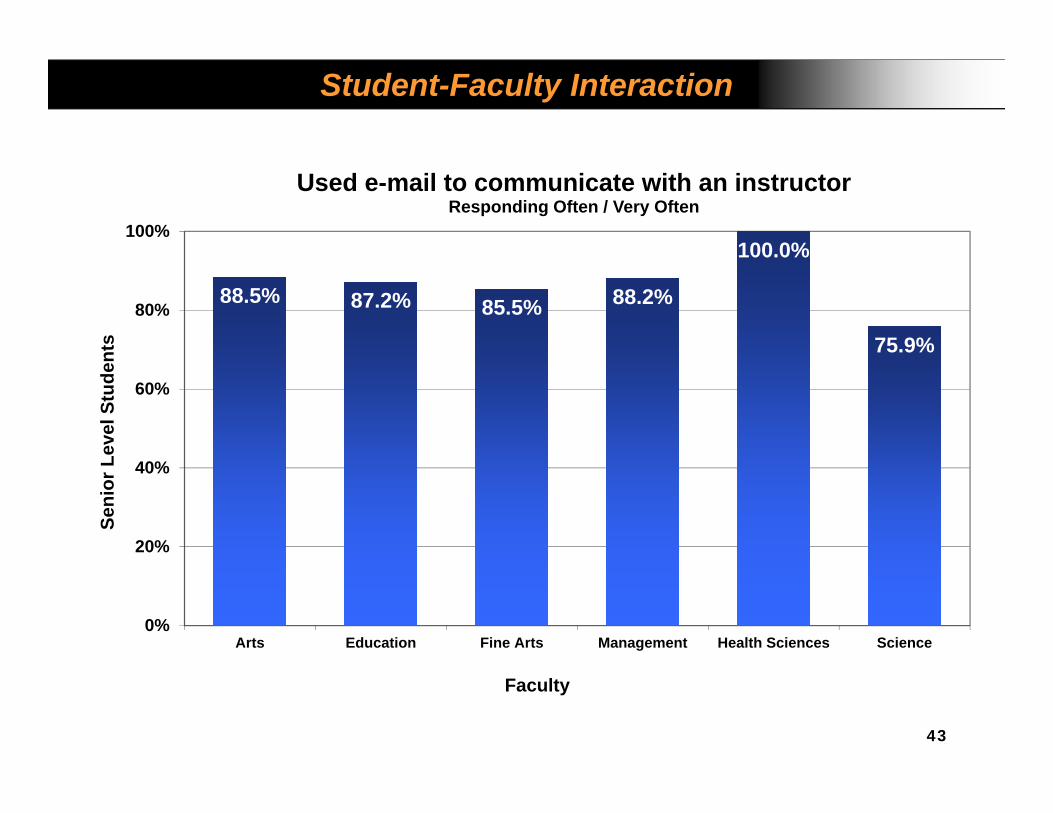
43
Student-Faculty Interaction
88.5% 87.2% 85.5% 88.2%
100.0%
75.9%
0%
20%
40%
60%
80%
100%
Arts Education Fine Arts Management Health Sciences Science
Seni
or L
evel
Stu
dent
s
Faculty
Used e-mail to communicate with an instructorResponding Often / Very Often

44
Student-Faculty Interaction
2.52
2.73
2.25
2.48
2.21
2.44
1
2
3
FY SY
U of L Western Canadian Univ/Coll Canadian Univ
Received prompt written or oral feedback
Often
Sometimes
Never

45
Student-Faculty Interaction
69.7%76.6%
58.2%54.8%
71.9%
57.1%
0%
20%
40%
60%
80%
100%
Arts Education Fine Arts Management Health Sciences Science
Seni
or L
evel
Stu
dent
s
Received prompt written or oral feedback fromfaculty on your academic performance
Responding Often / Very Often
Faculty

Enriching Educational Experiences

47
Enriching Educational Experiences
The Enriching Educational Experiences section shows if students: Participating in co-curricular activities (organizations, publications, student
government, sports, etc.) Practicum, internship, field experience, co-op experience, or clinical
assignment Community service or volunteer work Foreign language coursework & study abroad Independent study or self-designed major Culminating senior experience (capstone course, senior project or thesis,
comprehensive exam, etc.) Serious conversations with students of different religious beliefs, political
opinions, or personal values Serious conversations with students of a different race or ethnicity Using electronic technology to discuss or complete an assignment Campus environment encouraging contact among students from different
economic, social, and racial or ethnic backgrounds Participate in a learning community or some other formal program where
groups of students take two or more classes together

48
Enriching Educational Experiences
22.3
34.1
23.4
34.8
24.1
34.3
10
20
30
40
FY SY
U of L Western Canadian Univ/Coll Canadian Univ
Enriching Educational Experiences (EEE)W
eigh
ted
Ave
rage
49
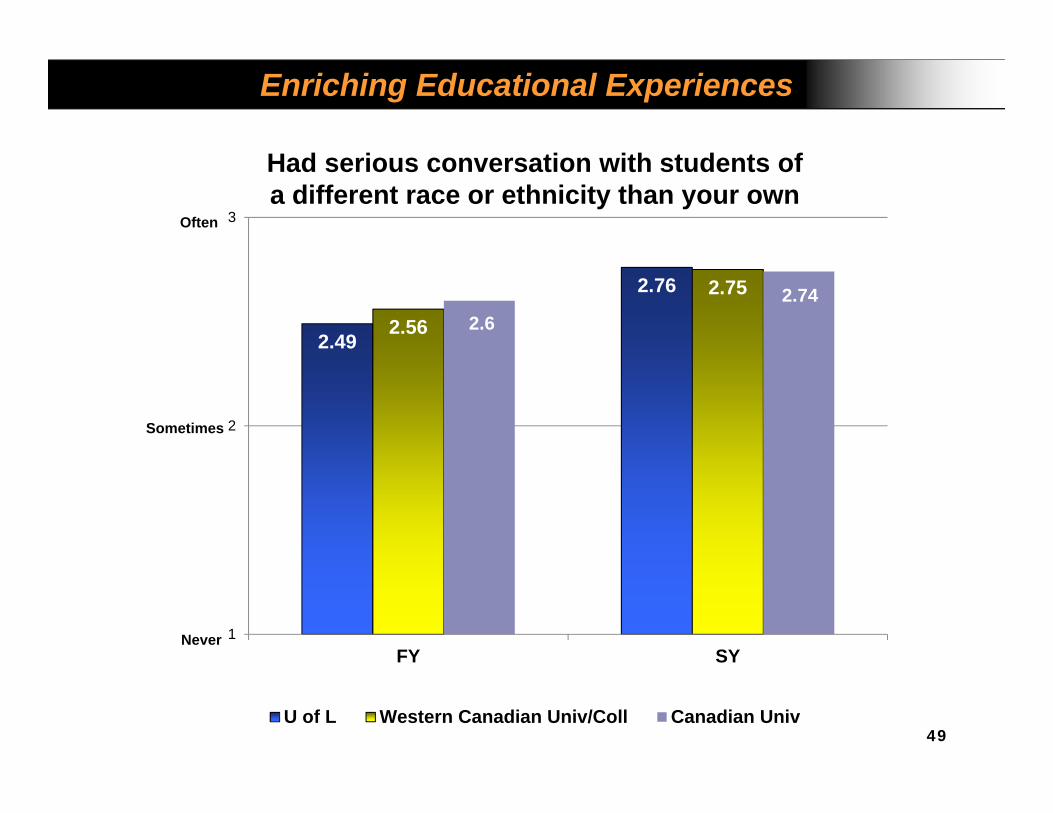
Enriching Educational Experiences
2.49
2.76
2.56
2.75
2.62.74
1
2
3
FY SY
U of L Western Canadian Univ/Coll Canadian Univ
Had serious conversation with students ofa different race or ethnicity than your own
Often
Sometimes
Never

50
Senior Level Students
Students who have done, or plan to do, an independent study or self-designed major
U of L: 31% (Western University/Colleges: 23%)
Students who have done, or plan to do, a practicum, internship, field experience, co-op experience, or clinical assignment
U of L: 59% (Western University/Colleges: 62%)
Students who have done, or plan to do, a culminating senior experience (capstone course, senior project or thesis, comprehensive exam, etc.)
U of L: 32% (Western University/Colleges: 37%)
Enriching Educational Experiences
51
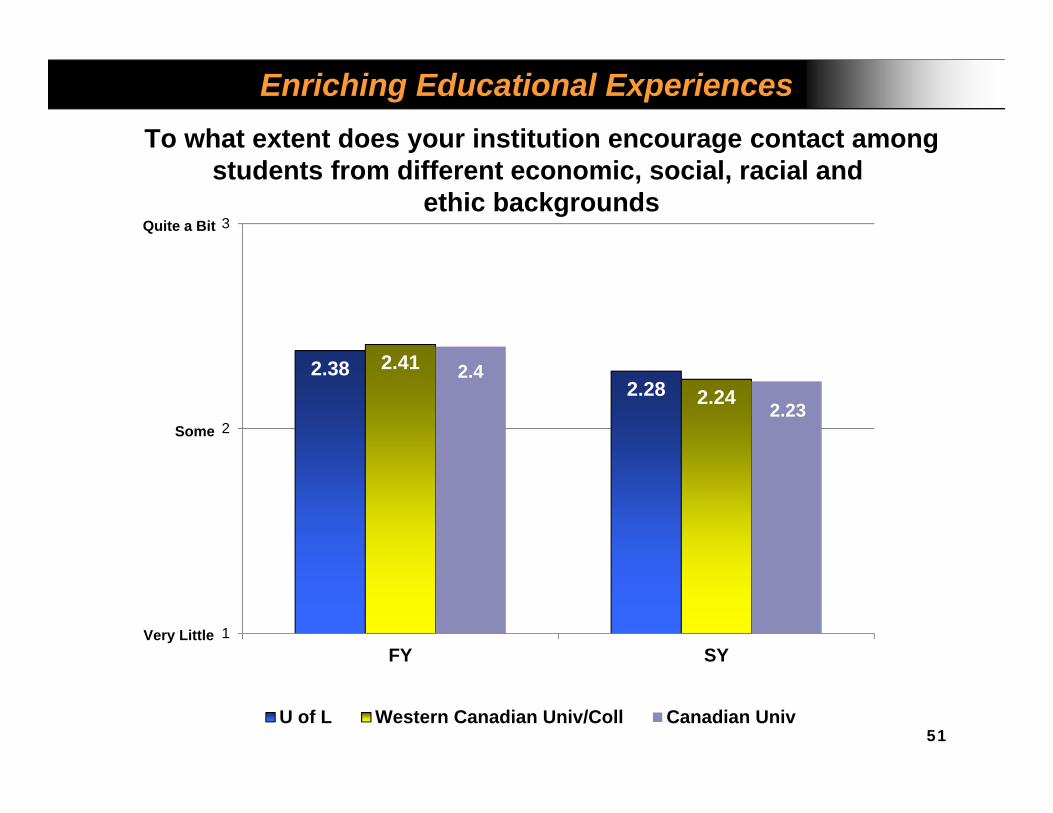
Enriching Educational Experiences
2.382.28
2.41
2.242.4
2.23
1
2
3
FY SY
U of L Western Canadian Univ/Coll Canadian Univ
Quite a Bit
To what extent does your institution encourage contact amongstudents from different economic, social, racial and
ethic backgrounds
Some
Very Little

Supportive Campus Environment

53
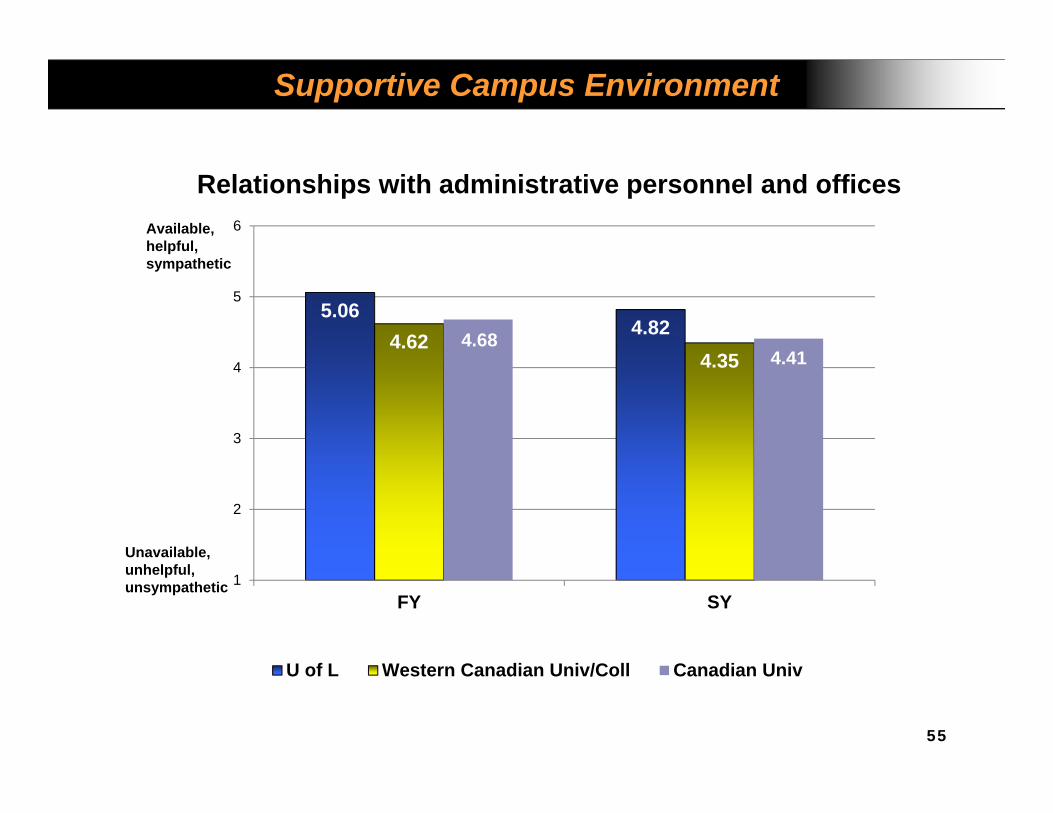
Supportive Campus Environment
The Supportive Campus Environment section includes: Campus environment provides the support you need to help you succeed
academically Campus environment helps you cope with your non-academic
responsibilities (work, family, etc.) Campus environment provides the support you need to thrive socially Quality of relationships with other students Quality of relationships with faculty members Quality of relationships with administrative personnel and offices
54
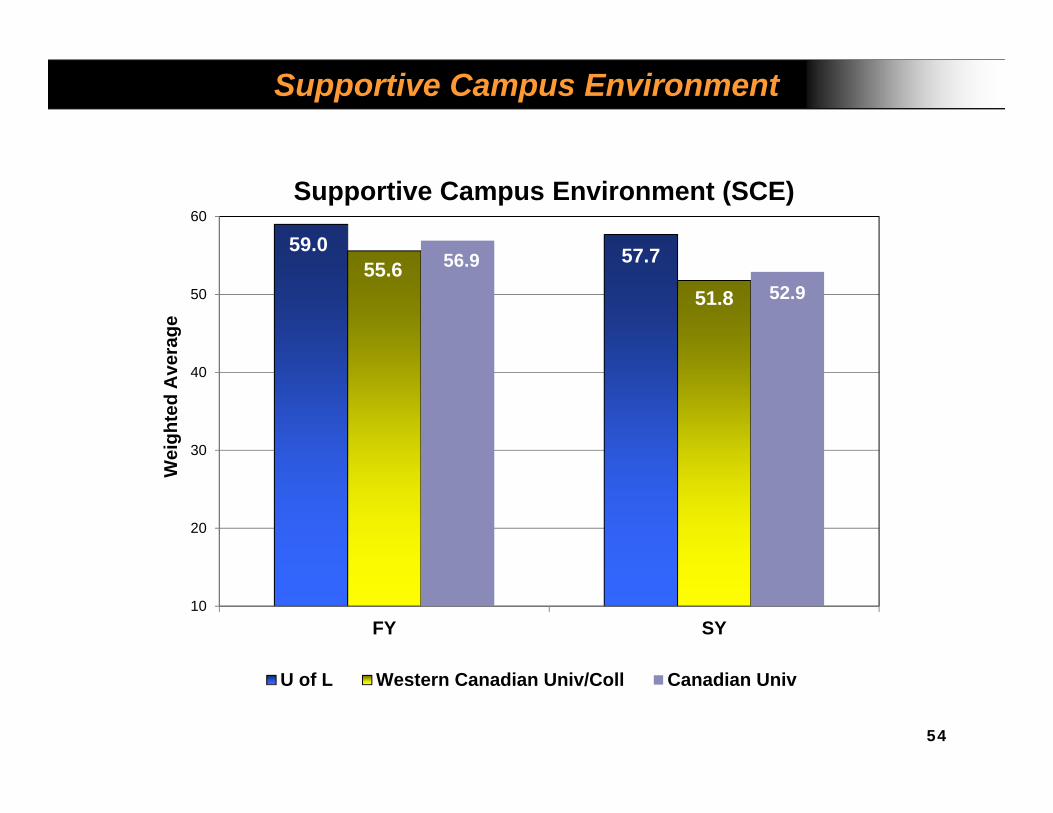
Supportive Campus Environment
59.0 57.755.6
51.8
56.952.9
10
20
30
40
50
60
FY SY
U of L Western Canadian Univ/Coll Canadian Univ
Supportive Campus Environment (SCE)W
eigh
ted
Ave
rage
55
Supportive Campus Environment
5.064.82
4.624.35
4.684.41
1
2
3
4
5
6
FY SY
U of L Western Canadian Univ/Coll Canadian Univ
Available,helpful,sympathetic
Relationships with administrative personnel and offices
Unavailable,unhelpful, unsympathetic
Mental Activities
57
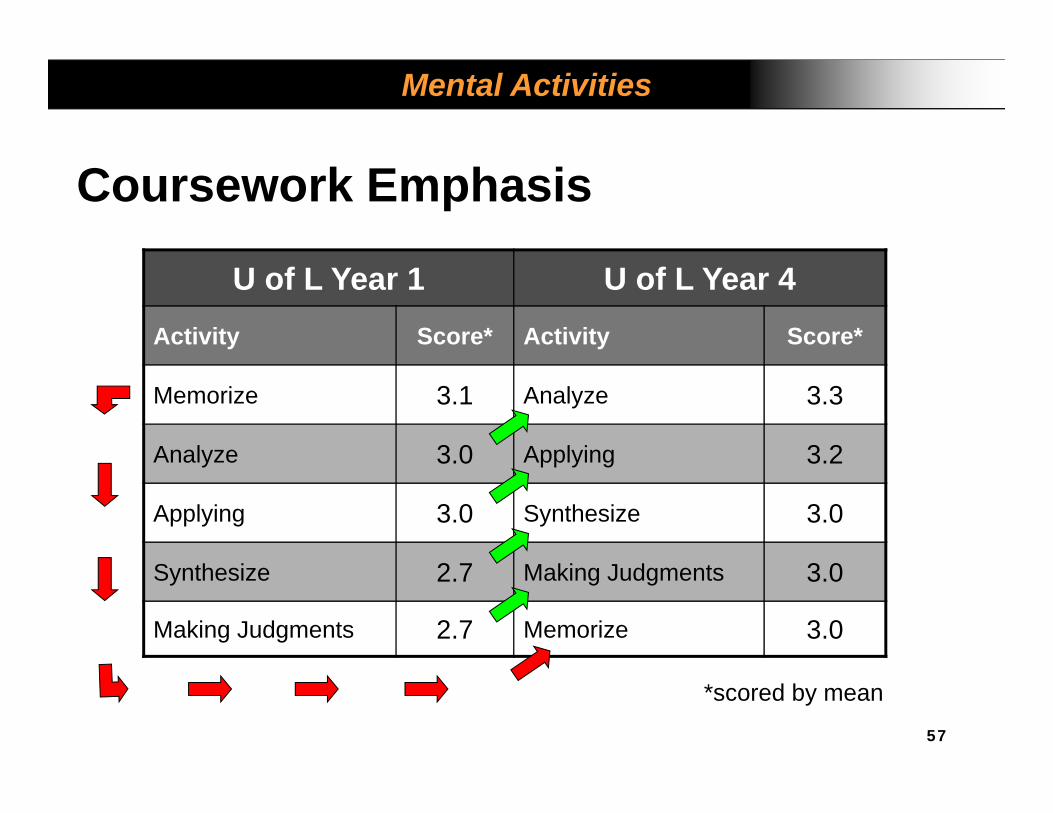
Coursework Emphasis
Mental Activities
U of L Year 1 U of L Year 4Activity Score* Activity Score*
Memorize 3.1 Analyze 3.3
Analyze 3.0 Applying 3.2
Applying 3.0 Synthesize 3.0
Synthesize 2.7 Making Judgments 3.0
Making Judgments 2.7 Memorize 3.0
*scored by mean
Satisfaction(Personal Development )

59
Satisfaction
69%63% 64%
0%
20%
40%
60%
80%
100%
U of L Western Canadian Univ/Coll Canadian Univ
Seni
or L
evel
Stu
dent
s
Overall, how would you evaluate the quality of academic advising you have received at your institution?
Responding Good / Excellent
First Year: 82% 74% 74%

60
Satisfaction
73.2% 75.6%70.0% 68.5% 65.5% 63.2%
0%
20%
40%
60%
80%
100%
Arts Education Fine Arts Management Health Sciences Science
Seni
or L
evel
Stu
dent
s
Overall, how would you evaluate the quality of academic advising you have received at your institution?
Responding Good / Excellent
Male : 71% Female 68%
61
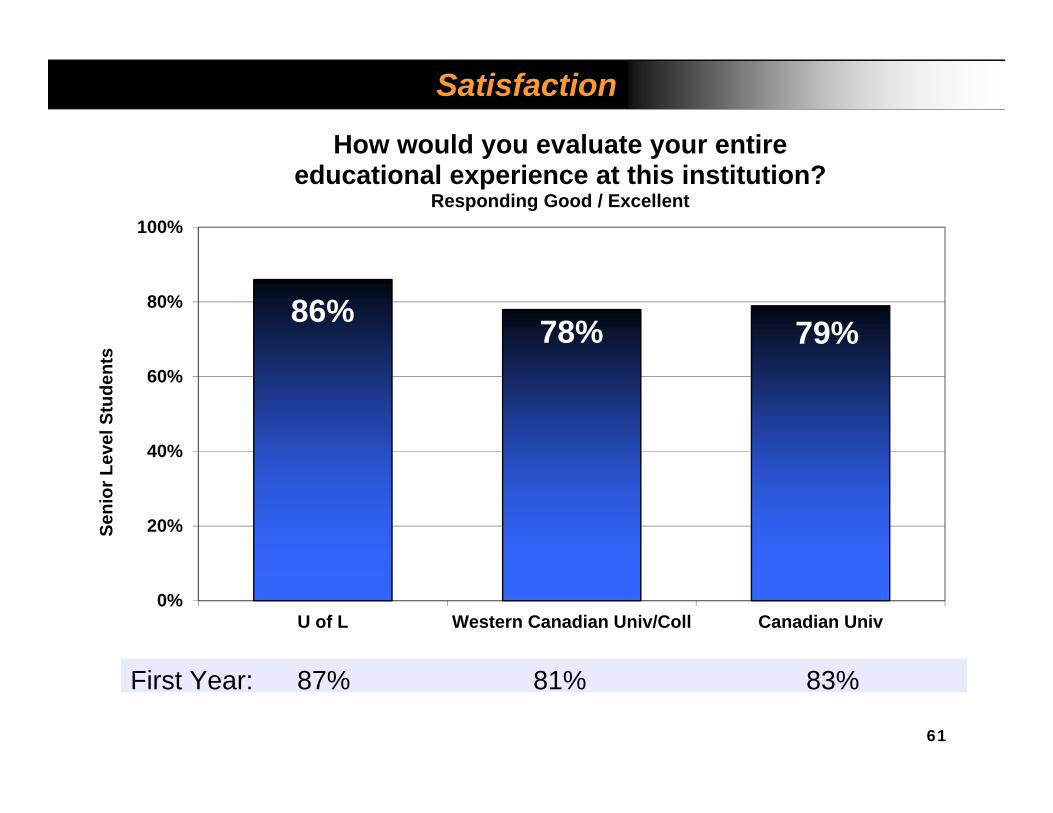
Satisfaction
86% 78% 79%
0%
20%
40%
60%
80%
100%
U of L Western Canadian Univ/Coll Canadian Univ
Seni
or L
evel
Stu
dent
s
How would you evaluate your entireeducational experience at this institution?
Responding Good / Excellent
First Year: 87% 81% 83%

62
Satisfaction
88.2%
97.8%
84.0% 85.5% 82.8% 82.1%
0%
20%
40%
60%
80%
100%
Arts Education Fine Arts Management Health Sciences Science
Seni
or L
evel
Stu
dent
s
How would you evaluate your entireeducational experience at this institution?
Responding Good / Excellent
Male : 83% Female 88%

63
Satisfaction
80% 79% 78%
0%
20%
40%
60%
80%
100%
U of L Western Canadian Univ/Coll Canadian Univ
Seni
or L
evel
Stu
dent
s
If you could start over again, would you go tothe same institution you are now attending?
Responding Probably yes / Definitely yes
First Year: 89% 87% 86%

64
Satisfaction
84.3%
97.8%
72.0%80.5%
75.9% 75.2%
0%
20%
40%
60%
80%
100%
Arts Education Fine Arts Management Health Sciences Science
Seni
or L
evel
Stu
dent
s
If you could start over again, would you go tothe same institution you are now attending?
Responding Probably yes / Definitely yes
Male : 79% Female 82%
65
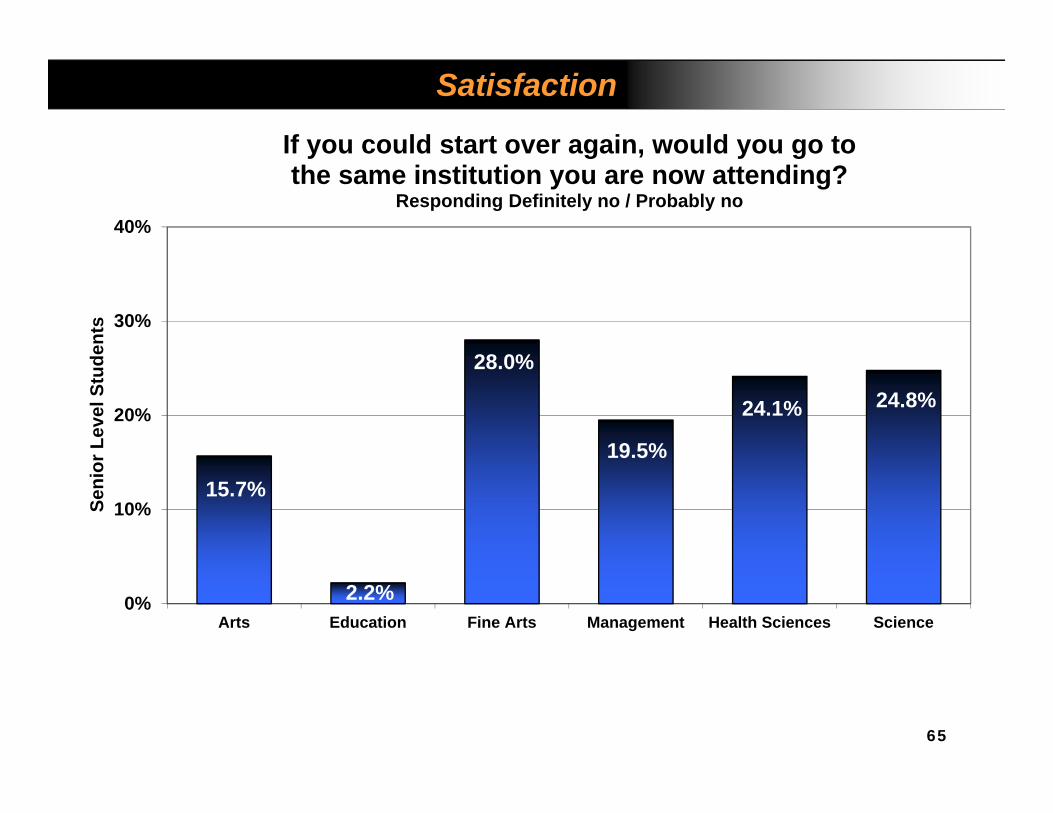
Satisfaction
15.7%
2.2%
28.0%
19.5%
24.1% 24.8%
0%
10%
20%
30%
40%
Arts Education Fine Arts Management Health Sciences Science
Seni
or L
evel
Stu
dent
s
If you could start over again, would you go tothe same institution you are now attending?
Responding Definitely no / Probably no
Extracurricular Activities

67
Extracurricular Activities
66%
48%
92%
0% 20% 40% 60% 80% 100%
What do first year students participate in?
Speakers, cultural activities, athletic events
Intramurals, student gov't, clubs
Theatre, music, play, art exhibits
68
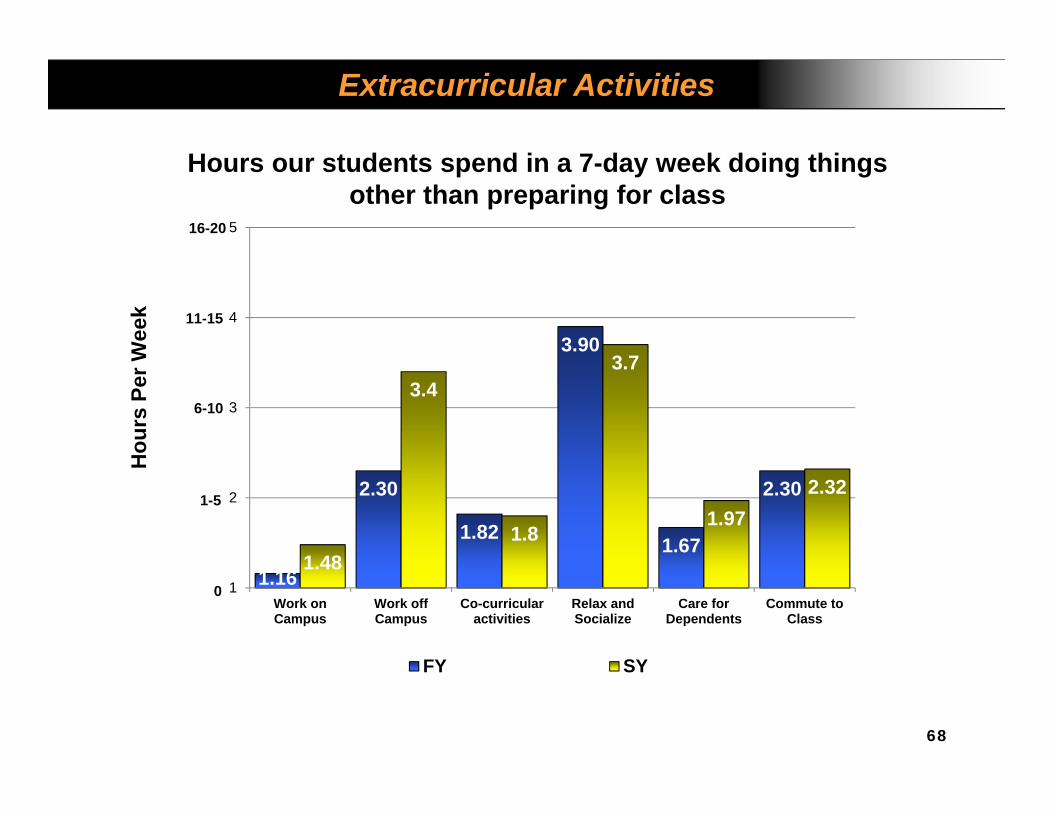
Extracurricular Activities
1.16
2.30
1.82
3.90
1.67
2.30
1.48
3.4
1.8
3.7
1.972.32
1
2
3
4
5
Work onCampus
Work offCampus
Co-curricularactivities
Relax andSocialize
Care forDependents
Commute toClass
FY SY
11-15
16-20
6-10
Hours our students spend in a 7-day week doing thingsother than preparing for class
1-5
0
Hou
rsPe
r Wee
k

69
Extracurricular Activities
54%59%
51% 54%48% 51%
0%
20%
40%
60%
80%
100%
FY SY
Exercised or participated in physical fitness activitiesResponding Often / Very Often
U of L Western Canadian Univ/Coll Canadian Univ
70
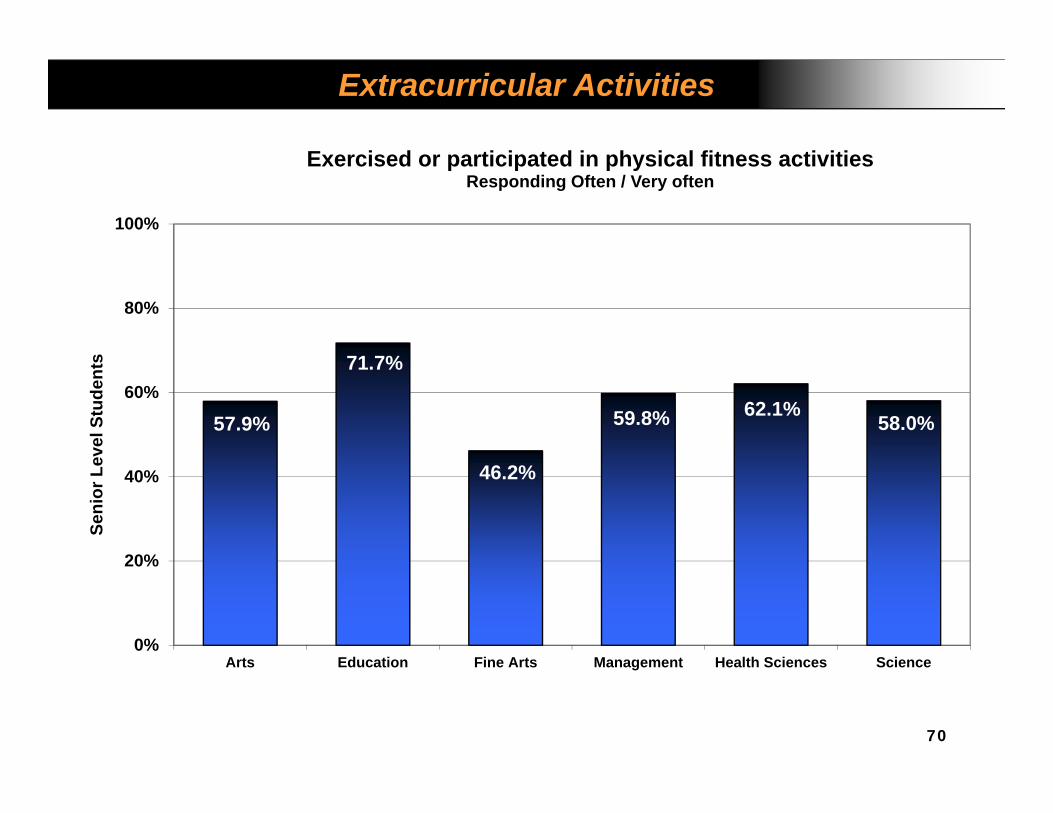
Extracurricular Activities
57.9%
71.7%
46.2%
59.8% 62.1%58.0%
0%
20%
40%
60%
80%
100%
Arts Education Fine Arts Management Health Sciences Science
Seni
or L
evel
Stu
dent
s
Exercised or participated in physical fitness activitiesResponding Often / Very often

Conclusion
72
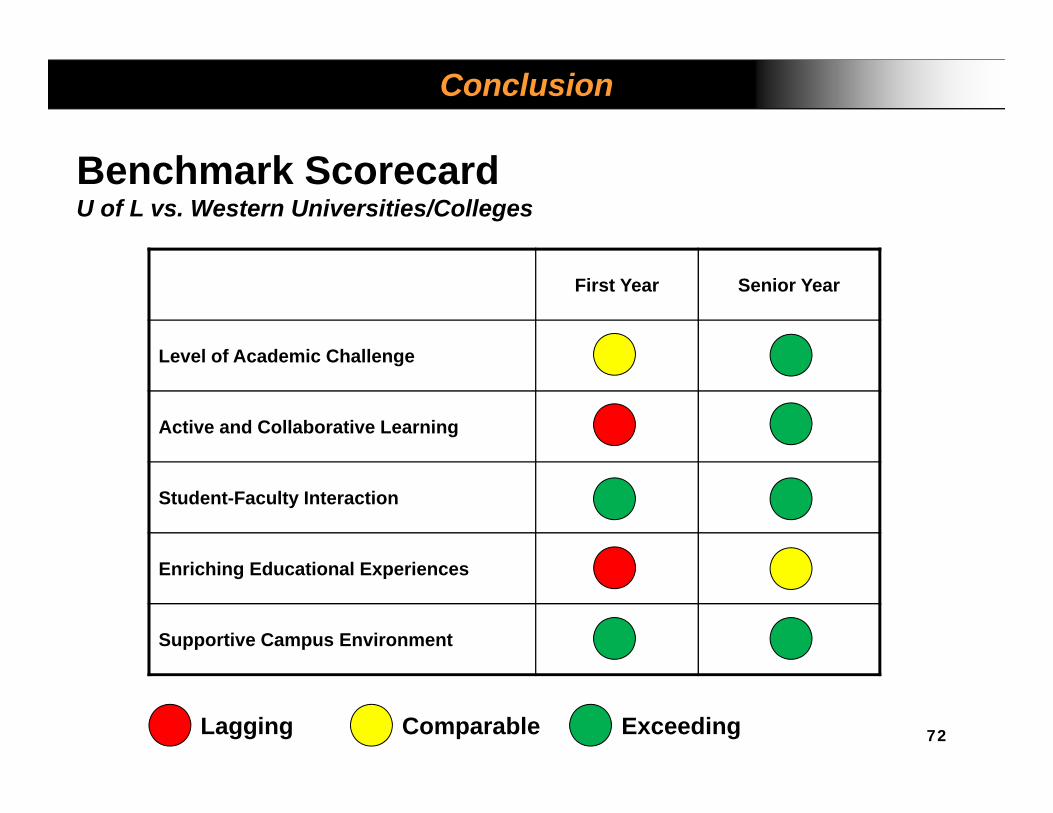
Conclusion
First Year Senior Year
Level of Academic Challenge
Active and Collaborative Learning
Student-Faculty Interaction
Enriching Educational Experiences
Supportive Campus Environment
Benchmark ScorecardU of L vs. Western Universities/Colleges
Comparable ExceedingLagging

73
Conclusion
First Year Senior Year
Level of Academic Challenge
Active and Collaborative Learning
Student-Faculty Interaction
Enriching Educational Experiences
Supportive Campus Environment
Benchmark Scorecard2011 results compared to 2007
Comparable ImprovingDecline