Embed Size (px)
Citation preview
March 2013
NATIONAL STATISTICS OFFICE
FINAL RESULTS OF THE 2010 ANNUAL SURVEY OF PHILIPPINE BUSINESS AND INDUSTRY
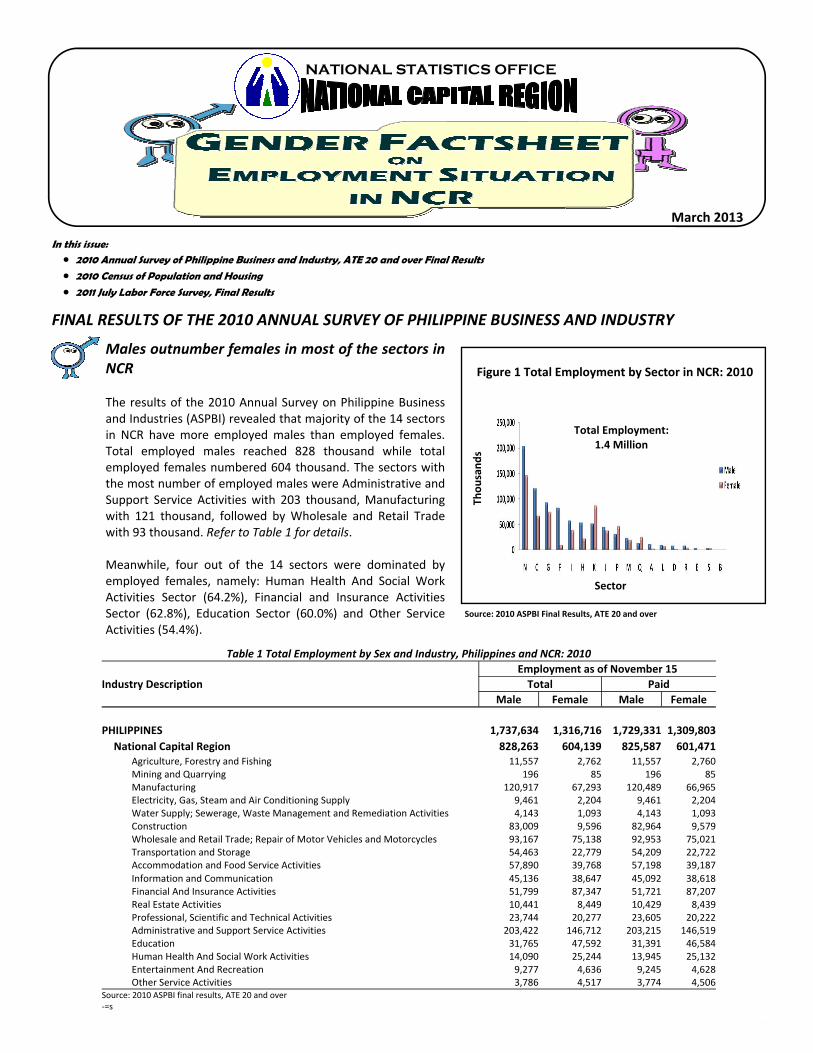
Males outnumber females in most of the sectors in NCR The results of the 2010 Annual Survey on Philippine Business and Industries (ASPBI) revealed that majority of the 14 sectors in NCR have more employed males than employed females. Total employed males reached 828 thousand while total employed females numbered 604 thousand. The sectors with the most number of employed males were Administrative and Support Service Activities with 203 thousand, Manufacturing with 121 thousand, followed by Wholesale and Retail Trade with 93 thousand. Refer to Table 1 for details. Meanwhile, four out of the 14 sectors were dominated by employed females, namely: Human Health And Social Work Activities Sector (64.2%), Financial and Insurance Activities Sector (62.8%), Education Sector (60.0%) and Other Service Activities (54.4%).
In this issue: • 2010 Annual Survey of Philippine Business and Industry, ATE 20 and over Final Results
• 2010 Census of Population and Housing
• 2011 July Labor Force Survey, Final Results
Table 1 Total Employment by Sex and Industry, Philippines and NCR: 2010
Industry Description Employment as of November 15 Total Paid
Male Female Male Female
PHILIPPINES 1,737,634 1,316,716 1,729,331 1,309,803 National Capital Region 828,263 604,139 825,587 601,471
Agriculture, Forestry and Fishing 11,557 2,762 11,557 2,760 Mining and Quarrying 196 85 196 85 Manufacturing 120,917 67,293 120,489 66,965 Electricity, Gas, Steam and Air Conditioning Supply 9,461 2,204 9,461 2,204 Water Supply; Sewerage, Waste Management and Remediation Activities 4,143 1,093 4,143 1,093 Construction 83,009 9,596 82,964 9,579 Wholesale and Retail Trade; Repair of Motor Vehicles and Motorcycles 93,167 75,138 92,953 75,021 Transportation and Storage 54,463 22,779 54,209 22,722 Accommodation and Food Service Activities 57,890 39,768 57,198 39,187 Information and Communication 45,136 38,647 45,092 38,618 Financial And Insurance Activities 51,799 87,347 51,721 87,207 Real Estate Activities 10,441 8,449 10,429 8,439 Professional, Scientific and Technical Activities 23,744 20,277 23,605 20,222 Administrative and Support Service Activities 203,422 146,712 203,215 146,519 Education 31,765 47,592 31,391 46,584 Human Health And Social Work Activities 14,090 25,244 13,945 25,132 Entertainment And Recreation 9,277 4,636 9,245 4,628 Other Service Activities 3,786 4,517 3,774 4,506
Source: 2010 ASPBI final results, ATE 20 and over ‐=s
Figure 1 Total Employment by Sector in NCR: 2010
Sector
Thou
sand
s
Total Employment: 1.4 Million
Source: 2010 ASPBI Final Results, ATE 20 and over
2
2010 CENSUS OF POPULATION AND HOUSING
Table 2 Household Population by Sex and Municipality, Philippines and NCR: 2010
Both Sexes Male Female
Philippines 92,097,978 46,459,318 45,638,660 National Capital Region 11,796,873 5,781,807 6,015,066 City of Manila 1,642,743 805,503 837,240 City of Mandaluyong 323,372 159,863 163,509 City of Marikina 424,150 206,821 217,329 City of Pasig 668,569 325,952 342,617 Quezon City 2,751,579 1,342,913 1,408,666 City of San Juan 120,898 54,518 66,380 Caloocan City 1,487,245 741,030 746,215 City of Malabon 352,890 176,073 176,817 City of Navotas 248,831 125,647 123,184 City of Valenzuela 574,840 288,292 286,548 City of Las Piñas 551,886 267,664 284,222 City of Makati 526,952 248,290 278,662 City of Muntinlupa 438,843 213,349 225,494 City of Parañaque 586,322 285,326 300,996 Pasay City 391,456 191,166 200,290 Pateros 64,020 31,511 32,509 Taguig City 642,277 317,889 324,388 Source: 2010 Census of Population and Housing ‐=s
The National Statistics Office conducted the 2010 Census of Population and Housing (CPH) in May to June 2010 pursuant to Batas Pambansa Blg. 72 and Commonwealth Act 591. The 2010 CPH is the 13th census of population and 6th census of housing undertaken since the first census in 1903. to take an inventory of the total population and housing units and to collect information about their characteristics. The census of population is the source of information on the size and distribution of the population as well as information about the demographic, social, economic and cultural characteristics. The census of housing, on the other hand, provides information on the supply of housing units, their structural characteristics and facilities which have bearing on the maintenance of privacy, health and the development of normal family living conditions.
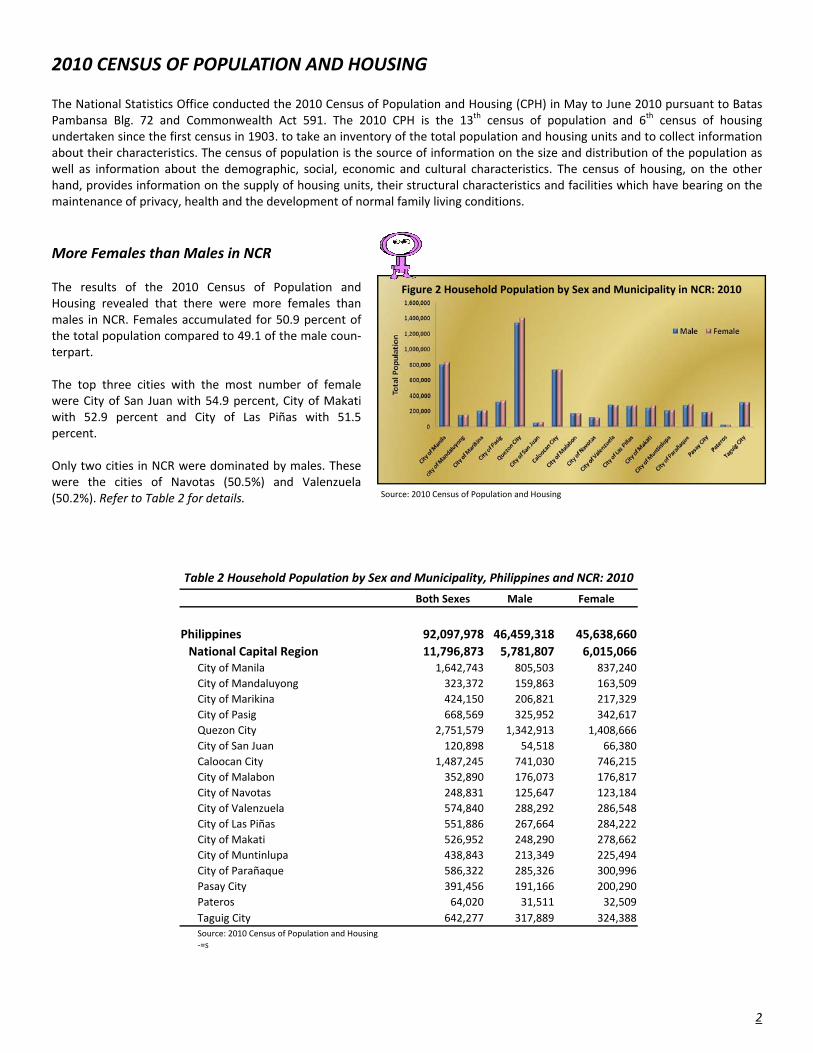
More Females than Males in NCR The results of the 2010 Census of Population and Housing revealed that there were more females than males in NCR. Females accumulated for 50.9 percent of the total population compared to 49.1 of the male coun‐terpart. The top three cities with the most number of female were City of San Juan with 54.9 percent, City of Makati with 52.9 percent and City of Las Piñas with 51.5 percent. Only two cities in NCR were dominated by males. These were the cities of Navotas (50.5%) and Valenzuela (50.2%). Refer to Table 2 for details.
Figure 2 Household Population by Sex and Municipality in NCR: 2010
Source: 2010 Census of Population and Housing
3
Table 3 Total Labor Force by Employment Status and Sex, Philippines and NCR: January 2009 to October 2011
PHILIPPINES NCR
TOTAL LABOR FORCE LFPR
EMPLOYED PERSONS TOTAL LABOR FORCE LFPR
EMPLOYED PERSONS Year/Quarter TOTAL
(Numbers) MALE (%)
FEMALE (%)
TOTAL (Numbers)
MALE (%)
FEMALE (%) (in thousands) (in thousands)
2009
January 37,116 63.3 34,262 61.3 38.7 4,719 60.9 4,059 56.4 43.6 April 37,824 64.0 34,997 61.3 38.7 4,671 60.8 4,043 56.8 43.2 July 38,437 64.6 35,514 60.5 39.5 4,861 62.4 4,271 54.9 45.1 October 38,197 64.0 35,478 61.2 38.8 4,851 61.9 4,279 56.4 43.6
2010
January 38,828 64.5 36,000 60.2 39.8 4,931 62.8 4,398 55.0 45.0 April 38,512 63.6 35,413 61.0 39.0 4,796 61.1 4,230 56.8 43.2
July 38,946 63.9 36,237 61.1 38.9 4,968 62.1 4,427 56.7 43.3 October 39,287 64.2 36,488 61.0 39.0 5,066 63.5 4,427 56.2 43.8
2011
January 39,210 63.7 36,293 61.1 38.9 5,017 63.0 4,412 57.3 42.7 April 39,691 64.2 36,820 60.8 39.2 4,952 62.5 4,377 55.9 44.1 July 39,928 64.4 37,106 60.6 39.4 5,049 63.0 4,497 56.5 43.5
Source: January 2009 to October 2011 Labor Force Survey
P‐Preliminary results
October 41,194 66.3 38,550 60.3 39.7 5,099 63.7 4,567 55.1 44.9
FINAL RESULTS OF THE LABOR FORCE SURVEY: 2009 to 2011
2009F 2010F
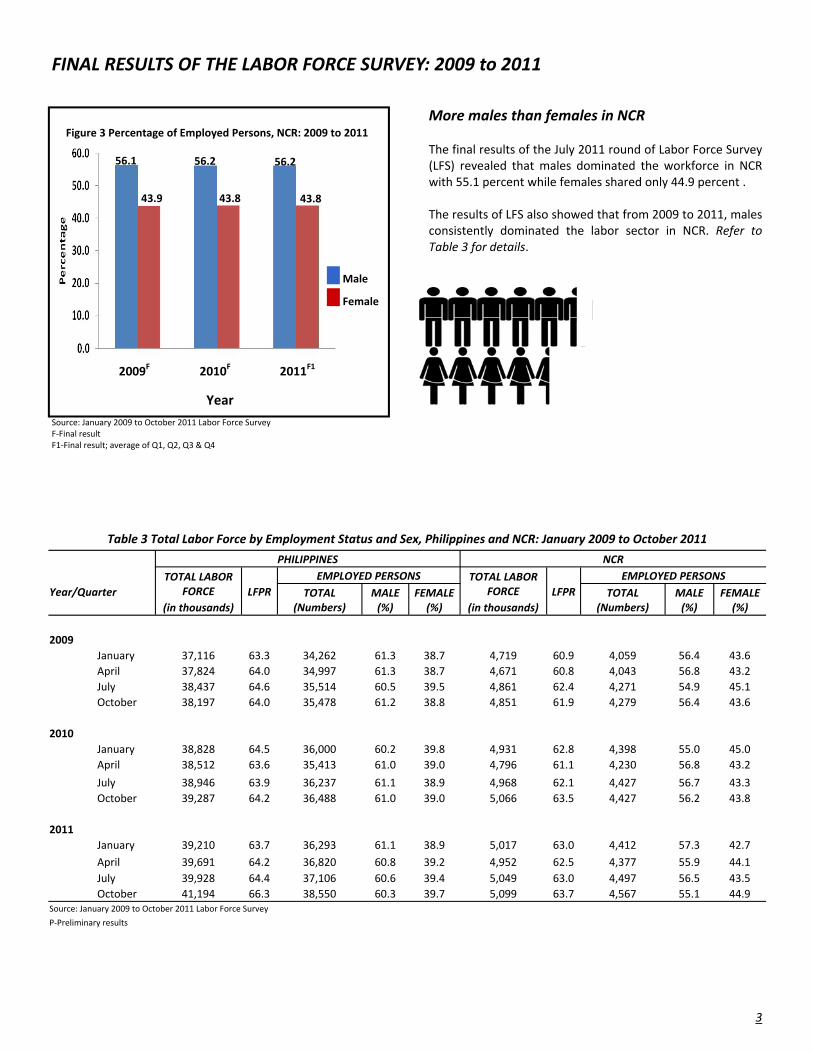
Figure 3 Percentage of Employed Persons, NCR: 2009 to 2011
2011F1
Female
Male
56.1
43.9
56.2
43.8
56.2
43.8
Year
More males than females in NCR The final results of the July 2011 round of Labor Force Survey (LFS) revealed that males dominated the workforce in NCR with 55.1 percent while females shared only 44.9 percent . The results of LFS also showed that from 2009 to 2011, males consistently dominated the labor sector in NCR. Refer to Table 3 for details.
Source: January 2009 to October 2011 Labor Force Survey F‐Final result F1‐Final result; average of Q1, Q2, Q3 & Q4
4
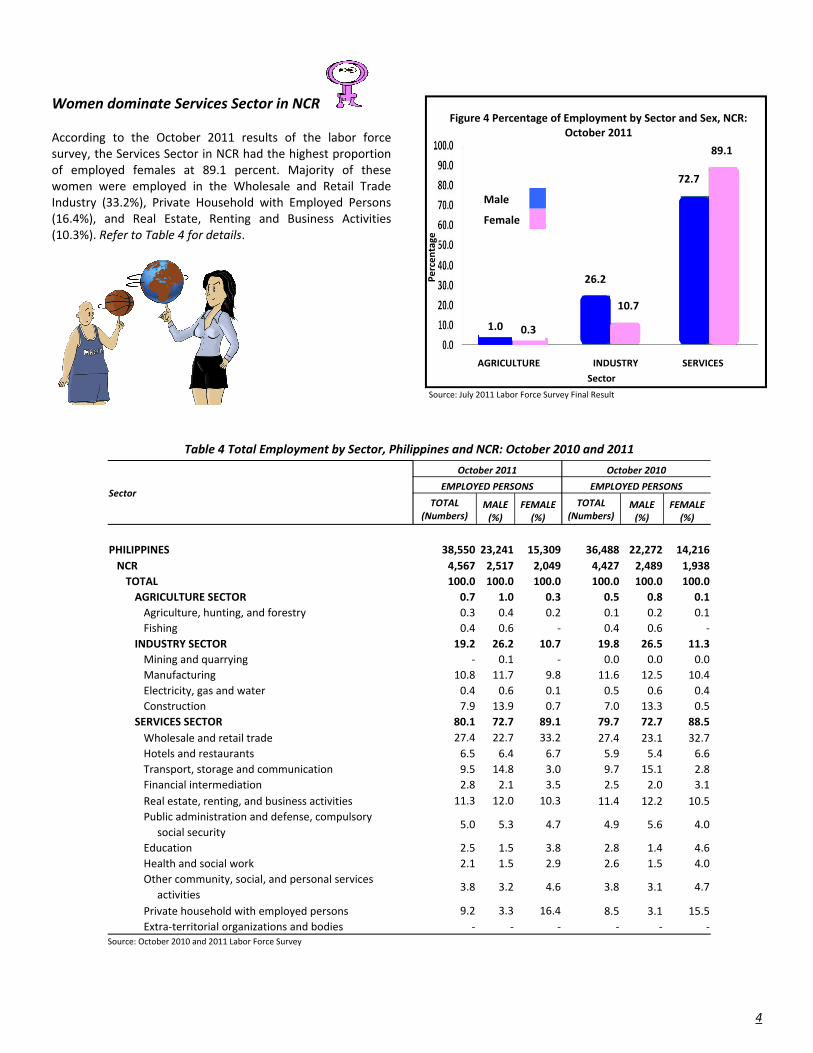
Women dominate Services Sector in NCR According to the October 2011 results of the labor force survey, the Services Sector in NCR had the highest proportion of employed females at 89.1 percent. Majority of these women were employed in the Wholesale and Retail Trade Industry (33.2%), Private Household with Employed Persons (16.4%), and Real Estate, Renting and Business Activities (10.3%). Refer to Table 4 for details.
Table 4 Total Employment by Sector, Philippines and NCR: October 2010 and 2011
Sector
October 2011 October 2010
EMPLOYED PERSONS EMPLOYED PERSONS
TOTAL (Numbers)
MALE (%)
FEMALE (%)
TOTAL (Numbers)
MALE (%)
FEMALE (%)
PHILIPPINES 38,550 23,241 15,309 36,488 22,272 14,216 NCR 4,567 2,517 2,049 4,427 2,489 1,938 TOTAL 100.0 100.0 100.0 100.0 100.0 100.0 AGRICULTURE SECTOR 0.7 1.0 0.3 0.5 0.8 0.1 Agriculture, hunting, and forestry 0.3 0.4 0.2 0.1 0.2 0.1 Fishing 0.4 0.6 ‐ 0.4 0.6 ‐
INDUSTRY SECTOR 19.2 26.2 10.7 19.8 26.5 11.3 Mining and quarrying ‐ 0.1 ‐ 0.0 0.0 0.0 Manufacturing 10.8 11.7 9.8 11.6 12.5 10.4 Electricity, gas and water 0.4 0.6 0.1 0.5 0.6 0.4 Construction 7.9 13.9 0.7 7.0 13.3 0.5
SERVICES SECTOR 80.1 72.7 89.1 79.7 72.7 88.5 Wholesale and retail trade 27.4 22.7 33.2 27.4 23.1 32.7 Hotels and restaurants 6.5 6.4 6.7 5.9 5.4 6.6 Transport, storage and communication 9.5 14.8 3.0 9.7 15.1 2.8 Financial intermediation 2.8 2.1 3.5 2.5 2.0 3.1 Real estate, renting, and business activities 11.3 12.0 10.3 11.4 12.2 10.5 Public administration and defense, compulsory
5.0 5.3 4.7 4.9 5.6 4.0 social security Education 2.5 1.5 3.8 2.8 1.4 4.6 Health and social work 2.1 1.5 2.9 2.6 1.5 4.0 Other community, social, and personal services
3.8 3.2 4.6 3.8 3.1 4.7 activities Private household with employed persons 9.2 3.3 16.4 8.5 3.1 15.5 Extra‐territorial organizations and bodies ‐ ‐ ‐ ‐ ‐ ‐
Source: October 2010 and 2011 Labor Force Survey
SERVICES INDUSTRY AGRICULTURE
Female
Male
89.1
72.7
26.2
10.7
1.0 0.3
Source: July 2011 Labor Force Survey Final Result
Figure 4 Percentage of Employment by Sector and Sex, NCR: October 2011
Percen
tage
Sector
5
National Statistics Office-National Capital Region Ms. Lourdes V. Homecillo
Regional Director Philippine Bible Society Building, R. Magsaysay Blvd.
Sta. Mesa, Manila Tel. No.: (02) 714-1721; (02) 713-1014; Telefax: (02) 716-4921
E-mail: [email protected] www.nso-ncr.ph
Region TOTAL MALE FEMALE
PHILIPPINES 38,550 23,241 26,295
NATIONAL CAPITAL REGION 4,567 2,517 2,049 Cordillera Administrative Region 755 445 310
I‐Ilocos Region 2,089 1,324 765 II‐Cagayan Valley 1,526 975 551 III‐Central Luzon 3,966 2,435 1,531 IVA‐CALABARZON 4,874 2,784 2,090 IVB‐MIMAROPA 1,304 778 526 V‐Bicol Region 2,186 1,365 821
VI‐Western Visayas 3,131 1,884 1,248
VII‐Central Visayas 3,031 1,841 1,386
VIII‐Eastern Visayas 1,865 1,146 719
IX‐Zamboanga Peninsula 1,526 962 564 X‐Northern Mindanao 2,036 1,203 833 XI‐Davao Region 2,020 1,270 750
XII‐SOCCSKSARGEN 1,807 1,154 652
Caraga 1,087 691 396 Autonomous Region in Muslim Mindanao 1,235 874 360
Source: July 2010 Labor Force Survey final results
Table 5 Total Employed Persons by Region: October 2011 (in thousands)
Total Employment: Males outnumber Females across regions The October 2011 results of Labor Force Survey revealed that across regions, males outnumbered females in terms of total employment in the country. Region IVA topped the rank with 2.78 million employed males, followed by NCR with 2.52 million. Rounding the top three with the most number of employed males was Central Luzon with 2.44 million. Caraga and Cordillera Administrative Region had the lowest number of employed males with 0.69 and 0.45 million respectively. In terms of the number of employed females, Region IVA ranked first with 2.09 million. This was followed closely by National Capital Region and Region III with 2.05 million and 1.53 million employed females, respectively. Refer to Table 5 for details. Highest proportion of employed males in ARMM In terms of proportion, ARMM’s work force was dominated by males, comprising 70.8 percent of the total. Cagayan Valley followed with 63.9 percent and Davao Region with 62.9 percent; while Central Visayas, NCR and Calabarzon Region’s employed females almost matched its male counterpart, comprising 45.7 percent, 44.9 percent and 42.8 percent, respectively. Refer to Table 5 for details.