Embed Size (px)
Citation preview

National Statement of Housing Supply and Demand 2014 and Outlook for 2015-17
July 2015

Published by: Housing Agency.
Publication date: July 2015
Contact Details Housing Agency,53 Mount Street Upper,Dublin 2.
01 656 [email protected]
For further information please visit www.housing.ie

Chairman’s Foreword 2
Executive Summary 4
1. Introduction 8
2. Overview of Housing Trends 2007 - 2014 9
3. Affordability 16
4. Policy Developments 19
5. Future Housing Requirements 22
6. Housing Supply 28
Appendix 1 Estimate of Pent-Up Demand 33
Contents
The Housing Agency is a statutory body set up to work with and support local authorities, approved housing bodies and the Department of the Environment, Community and Local Government in the delivery of housing and housing services. It also serves as the interim Regulator of Approved Housing Bodies. It brings together a wealth of practical, research and technical expertise to offer a broad base of services. The Agency’s vision is to enable everyone to live in good quality, affordable homes in sustainable communities. The Agency understands that housing plays a key role in people’s quality of life and life chances.
The Housing Agency wishes to acknowledge the assistance of Future Analytics in the preparation of this report.
1National Statement of Housing Supply and Demand 2014 and Outlook for 2015-17
T he Housing Agency was established in 2010 and works to deliver housing and housing services to citizens. The Agency collaborates with the Department of the Environment,
Community and Local Government, local authorities, approved housing bodies and the private sector. Our vision is that everyone should be able to live in good quality, affordable homes in sustainable communities. We are driven by an understanding of the central role that housing plays in people’s quality of life and life changes. One of the Agency’s priorities is to gather and present the necessary information to help inform housing policy and practice.
Achieving a sustainable balance between the supply and demand for housing is a key policy issue and an important component of our financial stability. Getting this balance wrong has far reaching social and economic implications. Economic competitiveness will be undermined through accommodation shortages leading to increased costs and resulting pressure on wage inflation. There are social implications too, for example, delayed household formation; unnecessary long commute times; overcrowding; and the health implications of poor housing quality. All these implications have negative impacts on households’ social participation.
In this context, the Housing Agency has prepared this first National Statement of Housing Supply and Demand. This Statement falls under Action 1 of Construction 2020, the Government’s strategy to renew the construction industry. Construction 2020 aims to avoid mistakes of
the past where housing supply and demand was left unchecked, with disastrous consequences.
This Statement charts a housing system that is showing some signs of recovery – with the number of houses coming on stream beginning to increase, and potential for further development in the Dublin region where demand is greatest. However, the demand for housing is projected to grow over the next few years, as the economy begins to show signs of recovery and demographic trends point to population increases and smaller household sizes.
There are many potential constraints to increasing supply, including the need for finance to fund construction and buyers; the availability of sites ready for development and construction workers to carry out the work; infrastructural requirements (in particular, water and transport); the time needed to bring developments through the process from planning to occupancy; the impact of expectations on supply and demand - developers’ and buyers’ anticipation of future price trends; changes in the type of units required, for example, for an ageing population and for smaller household sizes. What is clear is that increased supply will be gradual as the sector begins to recover. There are some stock reserves, in unfinished and partially finished developments, but these will be insufficient to meet future requirements. A substantial step-up in housing output is required over the next three years to meet this increasing demand.
Chairman’s Foreword
The Housing Agency was established in 2010 and works to deliver housing and housing services for citizens.
Housing Agency 2
It is also evident that increasing housing supply will involve working with many other non-housing bodies, including: Irish Water, the National Transport Authority, and the Department of Education and Skills. This collaboration is key to identifying and increasing supply in the areas where it is needed the most. It is also clear that housing is interconnected – what happens in one tenure will affect the other tenures. For example, recently we have seen some households who would have previously bought their homes are now renting for longer or as a long-term option. This increases pressure on the private rental sector. Equally, a shortage of supply of social housing has had the same effect. For families renting, security of tenure is a key issue which, if unresolved, will increase the demand for owner-occupied housing.
There are strong local and regional elements to the trends presented in this report. It is clear that the Dublin area is currently experiencing the most pressure in terms of an imbalance between supply and demand, as reflected in price and rental trends over 2014. The first half of 2015 has seen this pressure pushing out to the counties surrounding the Capital in particular, and also other urban areas such as Cork and Galway cities. In responding to increased accommodation requirements, the importance of ensuring that future supply is working to build sustainable communities needs to be considered. Sustainable communities have good quality, affordable accommodation that is in well designed and well connected neighbourhoods. These are communities with a mix of tenures suitable for households with different income levels. The Urban Regeneration and Housing Act 2015, which amends Part V of the Planning and Development Act, 2000, will work towards achieving these objectives.The Social Housing Strategy sets out a clear programme to address housing needs for those unable to afford housing from their own resources. This strategy will see
a combination of social housing construction and the use of the private rented sector. While the supply of social housing is a crucial challenge at this time, local authorities building mono-tenure large estates for low income households is not the answer. Supply needs to be well mixed and well assimilated into developments, and should be preferably mixed-use as well as mixed-tenure.Affordability is a key issue, and while both residential prices and rents reduced during the economic crisis, both have increased recently. Affordability means being able to access suitable accommodation and sustain rent or mortgage payments, having wriggle room should such costs go up or income reduce unexpectedly, and the ability to pay for other living costs such as household bills, commuting and childcare. Residential construction standards also need to result in affordable properties for renters and buyers. The Agency will undertake further work on affordability over the next year.
This is the first such Statement prepared by the Agency, and it is planned that it will be undertaken on an annual basis going forward. We would welcome feedback on its contents and also input regarding additional information or data which would be useful in its further development.
Conor Skehan, Chair, Housing Agency
June 2015
“Achieving a sustainable balance between the supply and demand for housing is a key policy issue and an important component of our financial stability”
3National Statement of Housing Supply and Demand 2014 and Outlook for 2015-17
I t is the first of its kind in this country, and presents the most up-to-date information available in relation to housing supply and demand. In future years, this Statement will be published on an
annual basis.
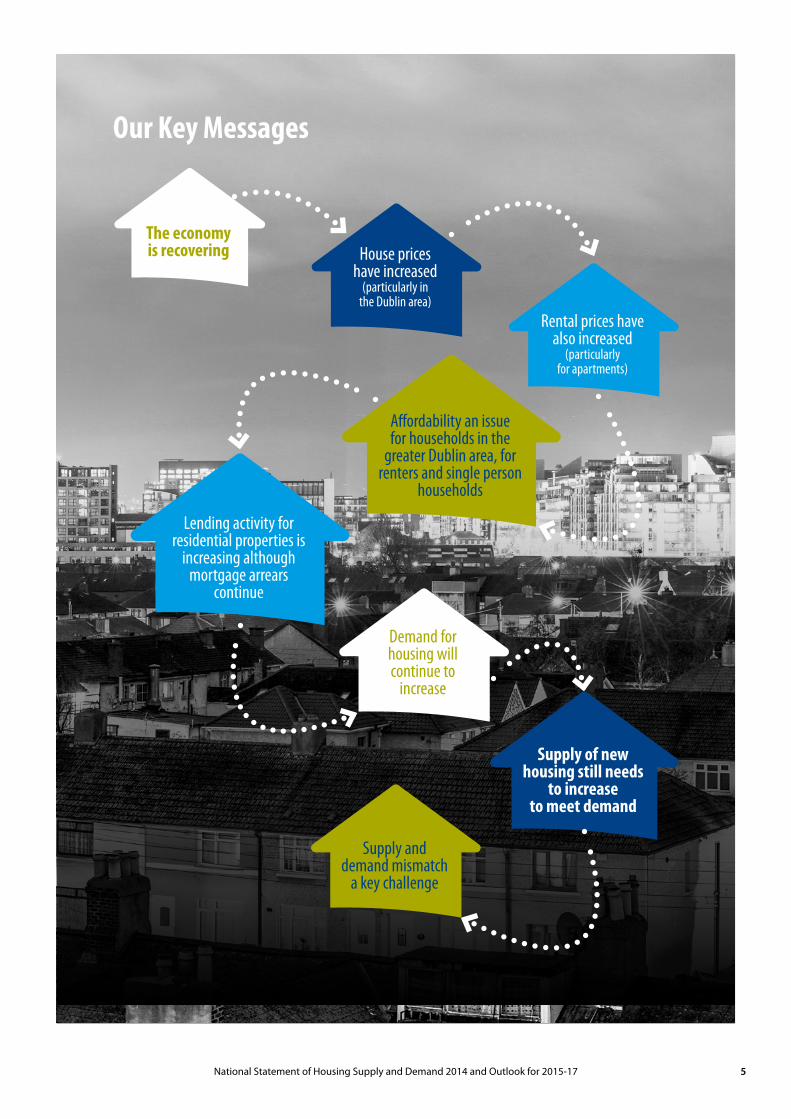
Key MessagesThe economy is recoveringThe economic situation is showing signs of recovery – the unemployment rate is at its lowest level in over five years, GDP grew by almost 5% in 2014 and is predicted to grow by 4% this year. Strong export performance and better than expected budgetary returns have been highlighted by economic commentators. Demographic trends also project continued population growth and a return to inward migration from 2017, all of which will require additional housing delivery.
House prices have increased, particularly in the Dublin areaThe median price paid for a residential property in the state in 2014 was €152,500, up from €140,000 in 2013. The average house price in the Dublin region increased by 18% up from a median price of €220,264 in 2013 to
€260,000 in 2014. For the rest of the country, residential price increases were comparatively modest – up on average 7.3% in 2014 to €118,000 from €110,000 in 2013. The first half of 2015 has seen asking prices for residential properties in some parts of Dublin levelling off, while increasing by 9% outside the Capital.
Rental prices have also increased, particularly for apartments Rents in the private rented sector have increased over the year, particularly for apartments in Dublin. The Private Residential Tenancies Board Rent Index found that at a national level, average monthly rents were 6.9% higher in Q1 2015 when compared with Q1 2014 (9.6% in Dublin and 5.3% outside of Dublin). Rents increased on average by 10.8% for apartments and 9% for houses in Dublin, while outside Dublin the increases were more modest at 5.2% for apartments and 5.7% for houses.
Affordability an issue for households in the greater Dublin area for renters and single person households Nationally, and on an average basis, housing is affordable for two-earner couples on average incomes. However, for those living in the Eastern region, particularly Dublin, and for single person households, affordability remains
Executive Summary
The Government’s strategy to renew the construction sector, Construction 2020 (May 2014) calls for a more strategic approach to the provision of housing, and a greater balance to match supply with demand. This National Statement of Housing Supply and Demand 2014 and Outlook for 2015-17 supports this commitment.
Housing Agency 4
Our Key Messages
Demand for housing will continue to
increase
Affordability an issue for households in the
greater Dublin area, for renters and single person
households
Rental prices have also increased
(particularly for apartments)
Supply of new housing still needs
to increase to meet demand
Supply and demand mismatch
a key challenge
Lending activity for residential properties is
increasing although mortgage arrears
continue
House priceshave increased
(particularly in the Dublin area)
The economy is recovering
5National Statement of Housing Supply and Demand 2014 and Outlook for 2015-17

Executive Summary /continued
an issue. There was some improvement in affordability in the 2006 – 2012 period, but declines in overall income levels coupled with strong house price increases has meant a deterioration in affordability levels in the period 2012 – 2014. Those renting spend the highest proportion of household expenditure on housing – on average making up a quarter of their household spend, the highest of all tenures.
Lending activity for residential properties is increasing although mortgage arrears continueOverall lending declined significantly during the 2006 – 2009 period, but has now stabilised. There are signals of increased activity in the residential market with the number of mortgage approval rates and mortgage drawdowns both going up. However, cash buyers still make up almost half of residential property sale transactions.
145,949 residential mortgages were in arrears at the end of 2014; 110,366 were mortgages on principal dwelling house and 35,583 were for buy-to-lets. There has been an ongoing decline in the number of mortgages in arrears, including those in arrears for 90 days or more. 140,000 mortgages were classified as restructured at the end of 2014.
2012 data found that one in five households renting reported missing a rent payment at some stage in the previous 12 months and the most recent data points to an increase in rent arrears among local authority tenants.
Demand for housing will continue to increaseThe population of the Irish State, at almost 4.6 million, is at its highest for 150 years. It increased by 30% in the last 20 years alone and is predicted to grow to 5.2 million by 2031. Projections undertaken for the Housing Agency
indicate that the national population will increase by over 170,000 between 2011 and 2018 and that the average household size will decrease from an average of 3.04 persons in 2002 to 2.67 in 2018. An increasing population and a declining household size will both increase demand for housing units.
The most recent Housing Needs Assessment (2013) identified almost 90,000 households as qualified for social housing support. The Social Housing Strategy 2020 commits to providing 35,000 additional social housing units (at a cost of €3.8 billion) and delivery of supports for 75,000 households in the private rented sector over the next six years.
Supply of new housing still needs to increase to meet demandThe latest data from the Department of the Environment, Community and Local Government states that 11,016 units dwellings were completed in 2014, an increase of 2,715 on the previous year (2013). Building commencements also indicate increased activity – an increase of 64%- from 4,708 in 2013 to 7,717 in 2014. The 2014 Residential Land Availability returns available from the Department of the Environment, Community and Local Government, identified a total of 17,434 hectares of residential zoned land available for housing nationally, allowing for phasing of residential development - 2,654 hectares are in the Dublin region. A Task Force was established under Construction 2020 to address housing supply issues in Dublin.
Subsequent work carried out by this Task Force has identified the capacity in the immediate to short-term for over 46,000 additional housing units in the Dublin Region, which comprises 18,000 planning permissions for homes which remain unbuilt, 2,666 applications for residential units (1,869 houses and 806 apartments)
“ An increasing population and a declining household size will both increase demand for housing”
Housing Agency 6
which are currently being processed by the four Dublin Local Authorities, in addition to sufficient zoned residential land for 25,507 residential units.
The number of residential property transactions recorded by the Property Services Regulatory Authority dropped significantly from 2010 to 2011 but has increased year-on-year since. In 2013, 29,791 transactions were recorded compared to a total of 38,187 by year-end 2014.
Supply and demand mismatch a key challengeA consistent challenge arising from the analysis gathered in this report is that there is a persistent mismatch between the supply and demand for housing, particularly in Dublin and surrounding counties, and major cities such as Cork, Galway and Limerick.
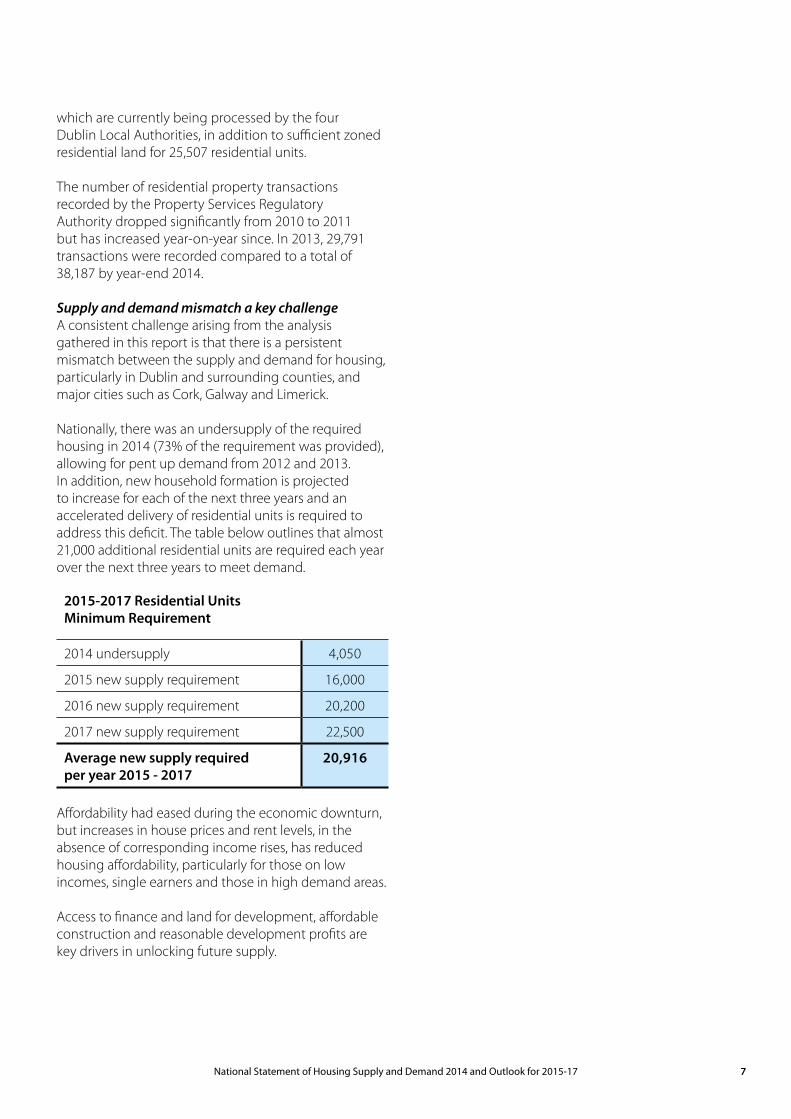
Nationally, there was an undersupply of the required housing in 2014 (73% of the requirement was provided), allowing for pent up demand from 2012 and 2013. In addition, new household formation is projected to increase for each of the next three years and an accelerated delivery of residential units is required to address this deficit. The table below outlines that almost 21,000 additional residential units are required each year over the next three years to meet demand.
2015-2017 Residential Units Minimum Requirement
2014 undersupply 4,050
2015 new supply requirement 16,000
2016 new supply requirement 20,200
2017 new supply requirement 22,500
Average new supply required per year 2015 - 2017
20,916
Affordability had eased during the economic downturn, but increases in house prices and rent levels, in the absence of corresponding income rises, has reduced housing affordability, particularly for those on low incomes, single earners and those in high demand areas.
Access to finance and land for development, affordable construction and reasonable development profits are key drivers in unlocking future supply.
7National Statement of Housing Supply and Demand 2014 and Outlook for 2015-17

Construction 2020One of its key actions is the establishment of a National Framework for Housing Supply and Annual Statement of Projected Housing Requirements, which is to be placed on a statutory footing. The following is the action as set out in Construction 2020.
National Framework for Housing Supply and Annual Statement of Projected Housing Requirements
1. We will put in place a National Framework for Housing Supply, ensuring a balanced approach in which the supply of housing is matched with projected demand, and in which emerging imbalances can be identified and rectified at an early stage. This will be placed on a statutory footing and will require the publication of an annual National Statement of Projected Housing Supply and Demand to be published each June.
Timeline: Q2 2014
Responsible Body: DECLG; Local Authorities; CSO; DES; The Housing Agency; other stakeholders
A core aspect of the National Framework is the analysis of supply and projected demand data, broken down on a national and local basis, with information on housing types and sizes a key feature.
The report will be published on an annual basis and the Minister for the Environment, Community and Local Government will update the Government on its contents.
Introduction
Construction 2020 was published in May 2014 and sets out the Government’s strategy to renew the construction sector. It calls for a strategic approach to the provision of housing, based on real needs and with measures in place to detect and address any mismatch between housing supply and demand.
Housing Agency 8

National economic recovery is gaining momentum, exports are continuing to grow, the recovery is broadening with domestic sources of growth, consumer spending and
investment; all of these factors are contributing positively to economic recovery for the first time since 2007.
The latest quarterly economic commentary from the ESRI (June 2015) highlighted continued positive growth with GNP forecast to grow at a rate of approximately 4% in 2015 and unemployment to fall to 9.7% by next year. Data from the ESRI Consumer Sentiment Index (December 2014) showed a significant positive increase in consumer sentiment from 2013, strengthening to December 2014, particularly in relation to consumer household finances.
The housing market in Ireland in the last year has been notable for a change in outlook and expectations on the prospect for housing growth. Following an extended period characterised by reducing prices, low levels of transactions and high vacancy; the trends over the last
year show signs of recovery in sales prices, rental levels and an increase in activity in the market. This reflects a number of interconnected elements that drive the supply and demand for housing.
Financial TrendsHouse Price TrendsIrish residential property prices have increased since early 2013. According to data from the CSO Residential Property Price Index, which examines the mix-adjusted average price paid for properties using data on mortgage drawdowns, in the 12 months to December 2014, residential property prices at a national level increased by 16.3%1. Residential properties in Dublin were 22.3% higher than a year ago, while those outside Dublin were on average 10.2% higher than in December 2013. In the first two months of 2015, residential prices fell slightly but in March rose by 0.9% nationwide.
Overview of Housing Trends 2007 - 2014
The changing environment on housing market activity reflects an improvement in the national economic position. The macro-economic and fiscal framework underpinning the economy is more favourable than in previous years.
1. Central Statistics Office Residential Property Price Index, January 2015
9National Statement of Housing Supply and Demand 2014 and Outlook for 2015-17
02 Overview of Housing Trends 2007 - 2014 /continued
Based on figures contained in the PSRA Residential Property Price Register, which measures actual property transaction prices, the median price paid for a residential property in the state in 2014 was €152,500, up from €140,000 in 2013. The latter figure reflects a 7.1% increase on the median price paid in the calendar year 2012. Within this, there are clear variations nationally, with the Dublin region exhibiting an 18% increase in prices, at a median price of €260,000 in 2014 (up from 220,264 in 2013). When Dublin is excluded from national figures, the national median price paid for a residential property in 2014 was €118,000, up from €110,000 in 2013 (+7.3%). Overall, there has been a 24.7% decrease in national median house prices over the last four years, which fell from €202,500 in 2010, to €152,500 in 2014. The most pronounced year-on-year decrease took place between 2010 and 2011, when the national median house price fell by approximately 16.1%.
Examining house prices on the basis of asking price reveals similar trends. The results of the Q1 2015 MyHome.ie Property Barometer, which analyses mix-adjusted average asking price data derived from the stock of properties advertised on the MyHome.ie property register, confirms that 2014 recorded the highest price growth since the 2007 peak. It shows national price increases of 2.6% in the year to Q4 2014, and the mix adjusted asking price up 11.4% in Dublin. The Q1 2015 results showed a slowdown in the rate of increase in residential property asking price – up 2.2% in the first quarter of 2015.
Data from the CSO Residential Property Price Index indicates that, overall, house price growth in Dublin during 2014 was exceptionally strong. Dublin house prices rose by 22.5% in the 12 months to December 2014, while Dublin apartment prices were 21% higher when compared with December 2013. However, the sub-indices for apartments are based on low volumes of observed transactions and consequently suffer from greater volatility. By the end of 2014, house prices in Dublin were 35.7% lower than at their highest level in April 2007. Apartments in Dublin were 44.9% lower than they were in early 2007. Overall, residential property prices in Dublin were 37.7% lower than at their highest level in February 2007.
The price of residential properties in the rest of Ireland (i.e. excluding Dublin) has grown by 16.3% in the 12 months to December 2014. The price of residential properties in the rest of Ireland is 41.4% lower than their highest level in September 2007. Overall, the national index is 37.3% lower than its highest level in 2007. However, many parts of the country have shown little or no increase in property values in recent quarters.
The Daft.ie Sales Report for end 2014, which examines average asking prices for residential sales based on the stock of properties advertised on the Daft.ie property register, reported a 13% rise in asking price nationally over 2014. The most recent Daft.ie Sales Report (for Q2 2015), however, reported that asking prices in some areas of Dublin have levelled off over the last nine months, while outside Dublin, prices have risen, on average, by 9%. The counties around Dublin: Meath (+22.8%), Kildare (+18.2%), Wicklow (+15.9%) and Louth (+15.4%) all recorded asking price inflation well above the average; as did Cork City (+18.9%) and Galway City (+17.2%).
The various available measures of changes in residential property prices are set out in the following table. The variation in the measured change in residential property prices is explained by the differences in the underlying data and the composition of the property mix.
Recent data published by Eurostat on the European House Price Index, indicates that there was a 15% annual increase in Irish residential property prices in the period 2013-2014, more than six times the EU average of 2.3%.2
2. Eurostat News Release Euro Indicators (14/2015)
Housing Agency 10

3. Report on Future of the Private Rented Sector DKM October 2014
PRSA Property
Price Register
Daft.ie Sales
Report
MyHome.ie Property
Barometer
CSO Residential Property
Price Index
Indicator/Metric Median Price Paid
Average Asking
Mix-Adjusted Average Asking
Price
Mix-Adjusted Property
Transaction Price Index
National 2014* €152,500 €193,000 €194,089 81.4
Dublin 2014* €260,000 n/a €268,816 83.8
Outside Dublin 2014* €118,000 n/a n/a 75.5
National 2013 €140,000 €171,000 €189,086 70.0
Dublin 2013 €220,264 n/a €241,392 68.5
Outside Dublin 2013 €110,000 n/a n/a 68.5
National increase % + +8.9% +12.9% +2.6% 16.3%
Dublin increase % + +18% n/a +11.4% +22.3%
Outside Dublin increase % + +7.3% n/a n/a +10.2%
*Latest available 2014 data from range of data sources+Data corresponds to December 2013/ December 2014
Rental TrendsRental levels since 2010 have been determined by the impact of declining incomes and household expenditure levels. Rents began to stabilise during 2010 and began to increase during 2013, particularly in the Dublin market. In contrast, house prices continued to decline until 2012 before starting to recover during 2013. In comparing rent data from both the PRTB Rent Index and house price data from the CSO Residential Property Price Index, it can be seen that the decline in house prices preceded the decline in rents and the house price decline was more severe and lasted longer than the decline in the rental market3.
The Private Residential Tenancies Board Rent Index, which analyses actual rental prices based on data
on tenancies registered with the PRTB, found that at national level, average monthly rents were 6.9% higher in Q1 2015 comparted with Q1 2014 (9.6% in Dublin and 5.3% outside of Dublin). Rents increased on average by 10.8% for apartments and 9% for houses in Dublin, while outside Dublin the increases were more modest at 5.2% for apartments and 5.7% for houses.
Nationally, in the period 2007-2012, rental levels have decreased significantly with a gradual increase commencing in 2014. In Dublin, the cost of rental began to grow at the start of 2013, with corresponding levels remaining static outside of the capital. By Q1 2015 rents nationally were 16.9% lower than their peak at the end of 2007, in Dublin they remain 7.5% below peak levels.
Table 2.1 Summary of Property Price Statistics (2014)
11National Statement of Housing Supply and Demand 2014 and Outlook for 2015-17

02 Overview of Housing Trends 2007 - 2014 /continued
In their most recent report, Daft.ie have drawn attention to the lack of stock on the rental market - on 1st May 2015, there were 4,340 properties to rent nationwide, the lowest figure in seven years (based on the Daft.ie database). All landlords are legally obliged to register tenancies with the PRTB, and the number of new registrations with the PRTB in Q1 2015 was 23,960. The overall number of tenancies registered with the PRTB as at the end of Q1 2015 was 308,096.
Mortgage Arrears and Negative EquityReductions in house prices have led to significant increases in financial stress and hardship on existing mortgage holders, reducing the ability of mortgage holders to move to more appropriate properties to serve their current and future needs.
Statistics collected by the Central Bank indicate that there was a total of 110,366 mortgages for principal
Figure 2.1 PRTB Rent Index National Rent Trends 2007 - 2015
Figure 2.2 PRTB Rent Index Dublin Rent Trends 2007 - 2015
Source: PRTB Rent Index Report Q1 2015
Source: PRTB Rent Index Report Q1 2015
Q1 Q2
2007
110
100
90
80
70
2008
National National Houses
Q3 2007=100
National Apartments
2009 2010 2011 2012 2013 2014 2015
Q1 Q2 Q3 Q4 Q1 Q2 Q3 Q4 Q1 Q2 Q3 Q4 Q1 Q2 Q3 Q4 Q1 Q2 Q3 Q4 Q1 Q2 Q3 Q4 Q1 Q2 Q3 Q4 Q1
Q1 Q2
2007
110
100
90
80
70
2008
Dublin Dublin Houses
Q3 2007=100
Dublin Apartments
2009 2010 2011 2012 2013 2014 2015
Q1 Q2 Q3 Q4 Q1 Q2 Q3 Q4 Q1 Q2 Q3 Q4 Q1 Q2 Q3 Q4 Q1 Q2 Q3 Q4 Q1 Q2 Q3 Q4 Q1 Q2 Q3 Q4 Q1
Housing Agency 12

dwelling houses in arrears at end 2014. This was a fall of 7,523 or 6.4% on the previous quarter. Some, 78,699 accounts were in arrears for more the 90 days. A total stock of 114,674 principal dwelling houses (PDH) mortgage accounts were categorised as restructured at end December 2014. Of a total of 140,995 residential mortgage accounts for buy-to-let (BTL) properties, some 35,583 were in arrears at the end 20144, including 29,224 that were in arrears for more than 90 days. A total stock of 25,334 BTL mortgage accounts were categorised as restructured at the end of December 2014.
By October 2013, there were also 6,275 local authority mortgages in arrears of more than 90 days. This represents 31% of the total number of these loans, up from 24% at the end of March 2010.5
The sharp decline in house prices since 2007 led to the emergence of widespread negative equity in Ireland, with the situation being much more severe than that experienced in other housing market downturns. The ESRIs Quarterly Economic Commentary estimates that the number of mortgages in negative equity will have halved over the last two years, to approximately 161,000.
Data from the Money Advice and Budgeting Service6 (MABS) highlights the relationship between those households in mortgage difficulties and specific household socio-demographic characteristics. MABS indicated an urban bias in those experiencing mortgage difficulty, with 33.7% drawn from Dublin, Cork or Galway. In terms of household composition, 67% of all clients had children. A large proportion of these mortgage indebted clients were also aged between 41 and 56 (60.8%) with 36.1% aged between 26 and 40.
Data derived from the CSO’s Survey on Income and Living Conditions (SILC 2012) showed that those in consistent poverty are three times more likely to be in mortgage/rent arrears. Where a household is in mortgage arrears, it is proportionately more likely to have a head of household whose highest level of education is primary or none; who is ill/disabled, unemployed, or on home duties; and/or who is a lone parent.
Research carried out by NESC in December 2014 showed that in terms of rent in arrears, the most recent data
shows that total local authority rent arrears increased from €32.9m on 1 January 2008, to €58.5m on 31 December 2011. It is important to note that comparable data does not exist for private tenancies. However, SILC data for 2012 did show that among households who rented, 19% had missed making rent payments on time at some stage in the previous 12 months.
The rate of dwelling repossession is continuing to increase, with 397 repossessions of Primary Dwelling Houses by December 2009, rising to 1,588 by the end of 2014. There were also 454 repossessions of buy-to-let properties by end 2012, and this had increased to 635 two years later7.
Recent research carried out by the CSO as part of their Household Finance and Consumption Survey 2013, which focused on the financial wellbeing of Irish households after the economic downturn, found that the burden of debt carried by Irish mortgage holders relative to the value of their homes is the highest in the euro area. The median or middle loan-to-value (LTV) ratio for owner-occupier mortgage holders in Ireland was 72.9%, nearly twice the euro zone average of 37%.
LendingThe pace of expansion in lending to Irish households from 2003-2007 was among the highest in the euro area, with the subsequent decline particularly large for consumer lending, with the extent of the contraction in household lending been more pronounced in Ireland than in the euro zone as a whole. Rates of lending to Irish residential households (incl. lending for house purchase) declined significantly in the period 2006-2009 (by 30%) and have remained significantly lower but relatively stable in the period 2010-20148.
Data from the Irish Banking Federation on mortgage approvals for residential house purchases indicates that there has been a sustained increase in overall approval rates in the period 2011-2014, increasing from 15,448 approvals in 2011, to 26,576 in the 12 months to December 2014. First-time buyers now comprise approximately half of those drawing down mortgages (IBF & PwC, 2014)9.
4. The Central Bank Residential Mortgage Arrears and Repossession Statistics, March 20155. The NESC Report on Homeownership and Rental in Ireland (December 2014)6. MABS Clients and Mortgage Arrears: A profile of MABS clients in mortgage difficulty and factors associated therewith 20137. The Central Bank Residential Mortgage Arrears and Repossession Statistics, March 2015.8. The Central Bank Financial Statistics – Summary Chart Pack 07/01/20159. NESC Homeownership and Rental: What Road is Ireland On? No. 140 December 2014
13National Statement of Housing Supply and Demand 2014 and Outlook for 2015-17
02 Overview of Housing Trends 2007 - 2014 /continued
The current residential property market has a strong prevalence of cash buyers. Cash buyers also accounted for 46% of the 27,042 property sale transactions in the 9 months to September 2014 (with 14,536 mortgages drawn down). Data from the Irish Banking Federation shows that 13,472 mortgages for house purchase were drawn down in 2013, i.e. that cash purchases accounted for 54% of the 29,354 property sale transactions in this year. This is not a new trend, as cash buyers were found to account for 39% and 44% of all transactions in 2011 and 2012 respectively.
Interest RatesWhile interest rates applying to commercial and mortgage lending have reduced as the national economic position has stabilised, these have not resulted in lending increasing commensurately.
Interest rates on household loans and deposits increased steadily in the period 2005-2008 (by up to 2%), falling significantly in early 2009. They remained relatively stable in the period from late 2009-2014, apart from a moderate percentage point decline in the rates for deposits.
Interest rates on loans to households have remained relatively stable in the period 2009-2014, averaging at between 3-4%, with interest rates on mortgage loans accounting for 83% of total outstanding loans to households10.
Residential MobilityData from the BPFI Mortgage Market Profile (most recent report is Q1 2015) on numbers of residential mortgage loans relating to ‘mover purchasers’ (a key indicator of residential mobility) shows that such mortgages accounted for an increasing proportion of total drawdowns in the period 2007-2014, up from 19.9% in Q4 2007 to 31.9% in Q1 2015.
Tenure/Housing SectorsThe housing market is largely comprised of three main sectors as follows, each with their own specific characteristics, but interdependent. These are:
nOwner-occupier
nPrivate Rented Sector
nSocial Housing
Owner-occupierIrish home ownership rates are traditionally amongst the highest in the world11. However, the gap between Ireland and other European countries in the level of home ownership is less prevalent than it was in the past12. This sector covered the majority of housing units in the country in 2011 at 70%. This has changed noticeably in the last intercensal period with ownership rates having fallen from 75% in 200613. In 2011, 34% of private household units were owned outright, with 35% owned with a mortgage.
Private Rented SectorDemands on the private rental sector have increased substantially, with almost 1 in 5 households now in the private rented sector compared with 1 in 10 in 2006.
The private rented sector provides housing for a wide range of households, many of whom would previously have had their accommodation needs met in the owner-occupier market or social housing sector, although it is also a growing option within the market. It is estimated that the private rented sector supports 32% of all households receiving state support.
The bulk of tenants in the private rented sector are aged 25-34 years, 61% are single while 30% are married14. The profile of tenants in the Irish rental sector is broadly in line with that of other European countries.
Research carried out by DKM as part of their report into the Future of the Private Rented Sector found that the sector is seen by the majority of current renters as a short-term housing tenure option, with 73% of respondents intent on leaving the sector over the period 2015-2016. Only 17% of respondents were intending to continue renting long-term, with the inability to afford
10. The Central Bank Financial Statistics – Summary Chart Pack 07/01/201511. DKM, Future of the Private Rented Sector Final Report 2014 (Eurofound (2007), EurLIFE Quality of Life Database, Eurostat 2014)12. NESC Homeownership and Rental: What Road is Ireland On? No. 140 December 201413. Central Statistics Office Census 2006 and 201114. Central Statistics Office Census 2011
Housing Agency 14

15. Social Housing Strategy, 2014 pg 516. Op cit, pg 7.
the purchase of a house put forward as the main reason for renting.
The lack of long-term tenure security and rent stability were identified as the principal issues that people have with the private rented sector as a housing tenure.
The majority of accommodation in the private rented sector is taken up by flats and apartments (35%), semi-detached houses make up 27%, while detached and terraced houses make up 17% and 18% respectively. The accommodation in the private rented sector is relatively modern, with 62% of the rented stock being approximately 20 years or younger.
Social HousingThe deterioration in the national economy and its effects on individual households have combined to cause unprecedented increases in the demands for social housing.
The most recent Assessment of Housing Need, undertaken in May 2013, identified 89,872 households that qualified for social housing support. This represents a reduction of 9% on the comparative total for 2011. However, it is significantly in excess of the 2008 requirement of 56,246 representing a 59% increase in demand for social housing in the period 2008-2011. Of the households assessed, 72% were dependent on social welfare as their only source of income, while 11% had income from employment only.
The announcement by the Government of the ‘Social Housing Strategy 2020 - Support, Supply and Reform’ in November 2014 is intended to address this issue and ensure that to the greatest extent possible, every household in Ireland will have access to secure, good quality housing suited to their needs, at an affordable price, and in a sustainable community. The past decade has seen a retrenchment in the social housing budget, with Exchequer funding falling from over €1.7bn in 2008 to €597m in 2014.15
In 2008, 5,692 units were completed or acquired by local authorities. In addition, 1,896 Approved Housing Body units were also completed. However, by 2013, the social housing model had changed considerably as leasing, Payment and Availability Agreements and the Rental Accommodation Scheme had become the main
vehicles of social housing supply. In 2013, 546 houses were completed or acquired by local authorities, 378 delivered by AHB, and 1,042 units delivered under the social housing leasing initiative.
Local authorities are the single largest providers of socially rented housing, controlling 137,00016 dwellings (112,000 owned and the remaining 25,000 rented or leased) in 2014, at an average rent of just over €50 per week.
Approved Housing Bodies (AHBs) manage approximately 30,000 homes nationally.
Homelessness It is difficult to know the exact number of people experiencing homelessness in Ireland due to its transient nature and hidden homelessness. Census 2011 recorded 3,808 persons as being homeless. The data indicates that there were significantly more males than females experiencing homelessness, with 40% of those recorded as homeless enumerated in accommodation as emergency, long-term and transitional. The spatial distribution of homeless persons highlighted a significant concentration in both Dublin (60% of total) and the South-East Region, with the age profile weighted predominantly toward the 20-59 age group. While the majority of homeless persons were recorded as being single, the Census also enumerated 296 family units, with 498 children.
The Department of the Environment, Community and Local Government recorded 2,858 homeless persons in emergency accommodation at end 2014. By end-April 2015 this figure had increased to 3,143. The number of families experiencing homelessness increased over 2014, and by the end of the year there were 407 families with 880 dependent children in this situation. The number of homeless families continued to increase to reach 504 families and 1,118 children at end-April 2015 – 411 of these families (including 970 children) were in the Dublin region.
15National Statement of Housing Supply and Demand 2014 and Outlook for 2015-17

The affordability of purchasing a home in Ireland is influenced by a number of factors including the ratio between average house prices and average household incomes, which indicates the
proportion of household income being spent on housing by a representative household. An additional measure on mortgage affordability is mortgage repayments as a percentage of net income. It is important that affordability for renting as well as home purchase is monitored.
The NESC Report on Homeownership and Rental in Ireland (December 2014) observed that a lack of affordability can result in people being homeless, at risk of being unable to sustain their rent or mortgage payments, unable to purchase a dwelling on the open market or devoting a disproportionate share of income to cover housing costs.
Affordability by Tenure TypeThe proportion of household expenditure spent on housing differs depending on the tenure type. Data from NESC Report on Homeownership and Rental in Ireland indicates that while the proportion of household expenditure spent on housing has increased for all tenure types in the period 1987-2010, this increase has been most pronounced in the private rental sector and to a lesser extent amongst mortgaged owner-occupiers. A Housing Sentiment Survey (based on a survey of 1,000 people) published by NABCO in December 2014 reported that those privately renting in Ireland spent, on average, 30% of their income on their accommodation, for those in Dublin this increased to 35% of income.
A recent analysis of the rental sector undertaken for the Private Residential Tenancies Board17 found that the cost burden for single earners in a one-bed apartment in Dublin was most likely to be problematic. Those outside Dublin and two-earner households were much less likely to experience such affordability issues.
AffordabilityHousing affordability is measured by examining the proportion of household income that is spent on meeting their housing need whether renting or purchasing a home. As a general guide, for households on a moderate income, housing would be considered affordable where housing cost is below 35% of the household income.
17. DKM Economic Consultants, Rent Stability in the Private Rented Sector, 2014
Housing Agency 16

2008 2009 2010 2011 2012 2013 2014 20150
5
10
15
20
25
30
24.9
20.5
15.6
16.4
15.618.9
20.520.6
Figure 3.1 Affordability Index for 2 earner household in (National) with 30 year mortgage, 2008 - 2015
Source: Data supplied by the Department of the Environment, Community and Local Government
2008 2009 2010 2011 2012 2013 2014 20150
5
10
15
20
25
30
35
30.3
20.517.2
20.8
18.8
24.827.7
29.5
Figure 3.2 Affordability Index for 2 earner household (Dublin) with 30 year mortgage, 2008 - 2015
Source: Data supplied by the Department of the Environment, Community and Local Government
Mortgage Affordability TrendsFigure 3.1 and 3.2 overleaf show the trend in affordability since 2008. Using data from the CSOs Earnings and Labour Cost Survey, it shows that, for those in employment, the proportion of average income used to service a mortgage reduced during the economic down-turn, both nationally and in Dublin. This was due to a combination of factors such as falls in interest rates and house prices. In more recent years, price and interest rate increases have seen a reduction in affordability for buyers.
Affordability by AreaAnalysis carried out last year by EBS / DKM Economic Consultants (April 2014) based on median transaction prices from the Property Price Register appears to indicate the emergence of a three-tier housing market across the country. Within this, Dublin, Wicklow, and Kildare were identified as the least affordable counties, while Roscommon, Cavan, Leitrim and Longford were seen as the most affordable. In a large tier of counties, including Kilkenny, Kerry and Clare, housing affordability was found to be between 10-14% of net income.
“ A Housing Sentiment Survey reported that those privately renting in Ireland spent, on average, 30% of their income on their accommodation, for those in the Dublin this increased to 35% of income. ”
17National Statement of Housing Supply and Demand 2014 and Outlook for 2015-17
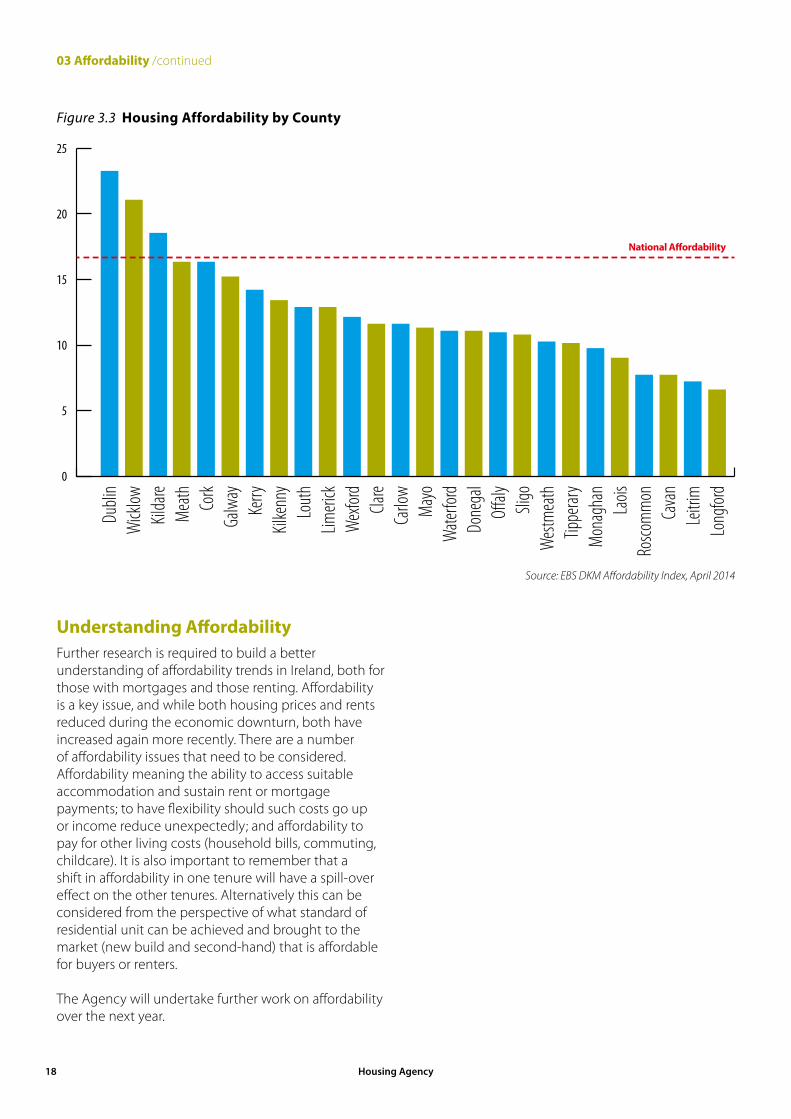
Understanding Affordability Further research is required to build a better understanding of affordability trends in Ireland, both for those with mortgages and those renting. Affordability is a key issue, and while both housing prices and rents reduced during the economic downturn, both have increased again more recently. There are a number of affordability issues that need to be considered. Affordability meaning the ability to access suitable accommodation and sustain rent or mortgage payments; to have flexibility should such costs go up or income reduce unexpectedly; and affordability to pay for other living costs (household bills, commuting, childcare). It is also important to remember that a shift in affordability in one tenure will have a spill-over effect on the other tenures. Alternatively this can be considered from the perspective of what standard of residential unit can be achieved and brought to the market (new build and second-hand) that is affordable for buyers or renters.
The Agency will undertake further work on affordability over the next year.
03 Affordability /continued
Figure 3.3 Housing Affordability by County
0
5
10
15
20
25
National A�ordability
Dublin
Wicklow
Kildare
Meath Cork
Galway
Kerry
Kilkenny
Louth
Limerick
Wexford
Clare
Carlow
Mayo
Waterford
Donegal
Offaly Sligo
Westmeath
Tipperary
Monaghan
Laois
Roscomm
onCavan
Leitrim
Longford
Source: EBS DKM Affordability Index, April 2014
Housing Agency 18

Construction 2020As part of Construction 2020, the Government set out its policy to address the critical issues in the housing market. It commits to the delivery of an overall strategic, evidence-based approach to housing supply, seeking to provide the tools to local and national authorities to detect emerging imbalances and to take the steps necessary to correct them at an early stage. The plan contains commitments in relation to:
nA national framework for housing supply and an annual statement of projected housing requirements
nA housing supply coordination task force for Dublin
nThe availability of quality data
nHousing mobility
nThe private rented sector
nFair and transparent tenancy deposit protection scheme
nPrivate rented and commercial property
nSocial housing
nPart V of the Planning and Development Act 2000
nHomelessness
nLegacy Issues
This Statement of Housing Supply and Demand forms part of that strategic response.
Policy Developments
Housing is a key policy area. In 2014 Construction 2020 was published, the Government’s strategy to renew the construction sector, changes to mortgage rules and taxation and the publication of the Social Housing Strategy. The Urban Regeneration and Housing Bill was enacted in 2015. These national housing policy developments are outlined in more detail in this section of the Statement.
19National Statement of Housing Supply and Demand 2014 and Outlook for 2015-17
04 Policy Developments /continued
Changes to Mortgage RulesMacro-prudential policy for residential mortgage lendingThe Central Bank recently announced the introduction of new regulations which will apply proportionate limits to mortgage lending by regulated financial service providers in the Irish market. The key objective of these regulations is to increase the resilience of the household sector to the property market and to reduce the risk of house price spirals from developing in the future. It is expected that the regulation will be introduced under legislation shortly. The measures introduce measures to cap the proportion of mortgage lending at both high loan-to-value (LTV) ratio and loan-to-income ratio (LTI) by regulated financial service providers, in order to improve the financial resilience of the banking and household sectors to the property market and try to reduce the risk of bank credit and housing price spirals from developing in the future.
The proposed measures, which apply to primary dwelling purchases, will require a deposit which amounts to 20% of the purchase price of the property, in addition to a cap on the value of the mortgage of 3.5 times of the applicants annual earnings. For first-time buyers, banks will be able to lend 90% up to a value of €220,000. Above that, the 80% limit will apply.
The Central Bank stated that the new rules were introduced for financial stability purposes and not to control house prices, although house price have moderated in some areas since these measures were brought on stream (see pages 11-12 above).
Taxation ChangesThe Government introduced a new relief from capital gains tax for properties purchased after 7th December 2011 as part of the 2012 Budget, an initiative designed to incentivise people to look at property as a viable investment opportunity. While the relief was originally only for property acquired before the end of 2013, it was extended until the 31st December 2014 under Section 604A of the Finance Act 2012. However, due to an upgraded growth forecast for the Irish economy, the capital gains tax relief will be discontinued in 2015. The removal of this capital gains tax relief is likely to impact upon levels of residential property investment going forward.
Under the 2015 Budget, the provisions introduced in 2009 and which applied an 80% rate of tax to gains from disposals of land (where those gains are attributable to a relevant planning decision by a planning authority) are being abolished in the case of disposals made on or after 1 January 2015. Such land disposals will instead be liable to a lower 33% standard rate of Capital Gains Tax.
Social Housing Strategy 2020Social Housing Strategy 2020: Support, Supply and Reform was launched by the Department of the Environment, Community and Local Government in November 2014. The Strategy commits to provide 35,000 new social housing units at a cost of €3.8bn. The Strategy restores the State to a central role in the provision of social housing through a resumption of direct building on a significant scale by local authorities and Approved Housing Bodies. It emphasises the State’s lead role in building partnerships with other public, voluntary and private providers of housing in the development of innovative funding mechanisms that do not increase the General Government Debt.
Among its provisions is an objective to establish the Dublin Social Housing Delivery Taskforce, to respond to the current supply difficulties and focus on the delivery of social housing in the Dublin area.
In addition, it sets out a road map to accommodate everyone on the social housing waiting list by 2020 (90,000 households).
The Strategy is founded on a three pillar approach and is to be delivered in two phases.
nPillar 1: Provision of New Social Housing Supply
nPillar 2: Providing Housing Supports through the Private Rental Sector
nPillar 3: Reform Creating More Flexible and Responsive Social Housing Supports in Ireland
nPhase 1: Target of 18,000 additional housing units and 32,000 HAP/RAS units by end of 2017
nPhase 2: Target of 17,000 additional housing units and 43,000 HAP/RAS units by end of 2020
The Strategy also contains an Action Plan with detailed objectives and timelines.
Housing Agency 20
Urban Regeneration and Housing Act 2015Vacant Land LevyThe Urban Regeneration and Housing Act 2015, when commenced, will introduce a vacant site levy whereby local authorities will have the power to apply levies to property owners who leave their sites vacant and underutilised. The levy will work by applying an annual levy at a rate of 3% of the market value to the site if the owner does not take steps to develop the site. This is intended to expedite the development of lands identified as being important in delivering on the objectives of the relevant development plan, including housing delivery and regeneration of land.
Revision to Part VThe Act amends the current legislation to improve the operation of Part V (of the Planning and Development Act, 2000) and refocus the measure on the delivery of completed housing units. The maximum requirement under Part V has been amended to 10% from 20%. The option of providing cash in lieu of land or completed housing units is removed and provision is made to allow an agreement to determine that units on an alternative site can be acquired by local authorities where the development that is subject to the planning application does not meet the local social housing need. A number of changes will also see a greater role for Approved Housing Bodies in delivery of Part V social housing.
“ The key objective of these [Central Bank] regulations is to increase the resilience of the household sector to the property market and to reduce the risk of house price spirals from developing in the future.”
21National Statement of Housing Supply and Demand 2014 and Outlook for 2015-17

Population TrendsThe population of the Irish State is currently at its highest in 150 years, at just over 4.5 million people. Over the last 20 years, the population of the country has increased by over one million people (or 30.1%).
The national population increased by 348,404 people between 2006 and 2011, representing an 8.2% increase over the intercensal period or an annual average increase of 1.6%. Between 2006 and 2011, the number of people in Ireland increased across all ages, except in the 15-29 age groups. This decrease was due to the decline in births in the late 1980s and early 1990s, combined with the effects of migration for those in the mid-twenties. The population is also getting older, with a recorded 14.4% increase in those aged 65 and over in 2011. The average age of the population continues to increase and currently stands at 36.1
Central Statistics Office Demographic ProjectionsAssumptionsThe Central Statistics Office carries out population projections for the country on a range of bases that assume varying rates of in-migration and total fertility rates. The most recent regional projections were published by CSO in December 2013, following projections of national population carried out in April 2013.
The central projection basis used to carry out the regional population projection is the M2F2 basis, which assumes that the Total Fertility Rate will decrease from its 2010 level of 2.1 to 1.8 by 2026 and remain constant thereafter, that in-migration will be negative from 2011 – 2016 and will then return to a positive from 201618, and that life expectancy will increase for both men and women.
Future Housing Requirements
Future housing requirements will be influenced by changes in the size of the population, household formation and household size. In this section of the Statement, demographic projections are outlined followed by estimates of future residential requirements.
18. Migration trends in particular will need to be kept under regular review, in line with changes in the economic position of the country.
Housing Agency 22
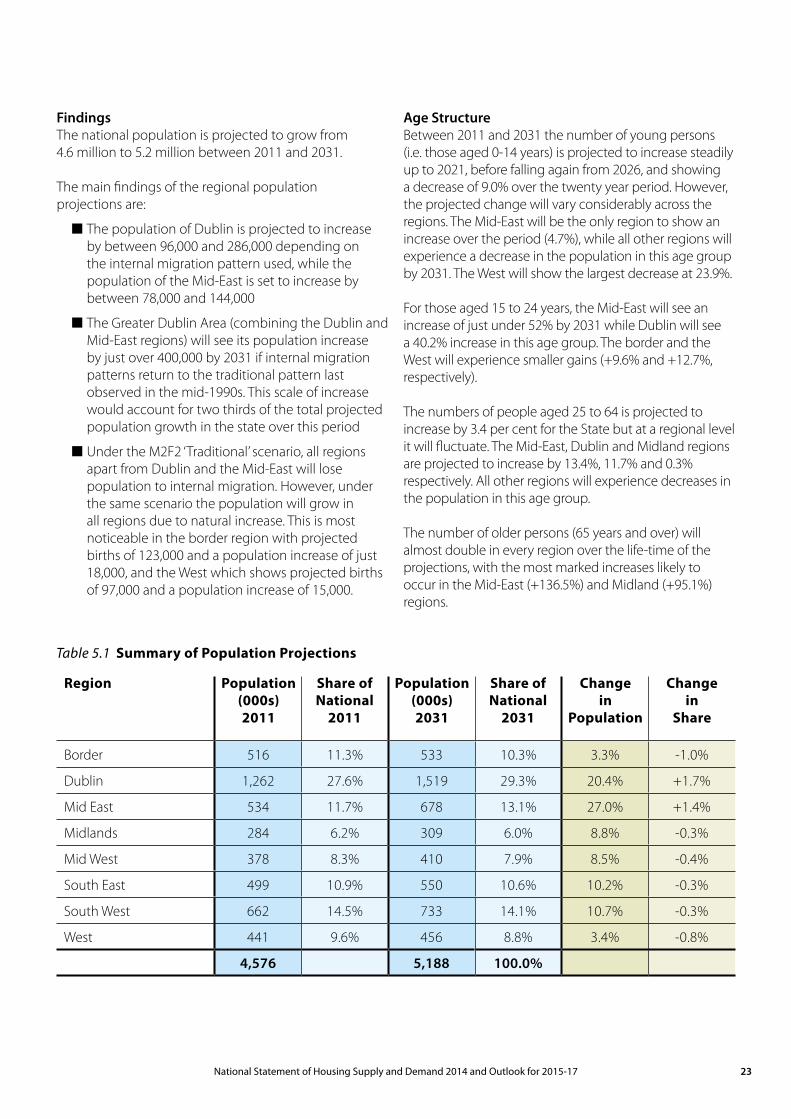
FindingsThe national population is projected to grow from 4.6 million to 5.2 million between 2011 and 2031. The main findings of the regional population projections are:
nThe population of Dublin is projected to increase by between 96,000 and 286,000 depending on the internal migration pattern used, while the population of the Mid-East is set to increase by between 78,000 and 144,000
nThe Greater Dublin Area (combining the Dublin and Mid-East regions) will see its population increase by just over 400,000 by 2031 if internal migration patterns return to the traditional pattern last observed in the mid-1990s. This scale of increase would account for two thirds of the total projected population growth in the state over this period
nUnder the M2F2 ‘Traditional’ scenario, all regions apart from Dublin and the Mid-East will lose population to internal migration. However, under the same scenario the population will grow in all regions due to natural increase. This is most noticeable in the border region with projected births of 123,000 and a population increase of just 18,000, and the West which shows projected births of 97,000 and a population increase of 15,000.
Age StructureBetween 2011 and 2031 the number of young persons (i.e. those aged 0-14 years) is projected to increase steadily up to 2021, before falling again from 2026, and showing a decrease of 9.0% over the twenty year period. However, the projected change will vary considerably across the regions. The Mid-East will be the only region to show an increase over the period (4.7%), while all other regions will experience a decrease in the population in this age group by 2031. The West will show the largest decrease at 23.9%.
For those aged 15 to 24 years, the Mid-East will see an increase of just under 52% by 2031 while Dublin will see a 40.2% increase in this age group. The border and the West will experience smaller gains (+9.6% and +12.7%, respectively).
The numbers of people aged 25 to 64 is projected to increase by 3.4 per cent for the State but at a regional level it will fluctuate. The Mid-East, Dublin and Midland regions are projected to increase by 13.4%, 11.7% and 0.3% respectively. All other regions will experience decreases in the population in this age group.
The number of older persons (65 years and over) will almost double in every region over the life-time of the projections, with the most marked increases likely to occur in the Mid-East (+136.5%) and Midland (+95.1%) regions.
Region Population (000s)2011
Share of National
2011
Population (000s)2031
Share of National
2031
Change in
Population
Change in
Share
Border 516 11.3% 533 10.3% 3.3% -1.0%
Dublin 1,262 27.6% 1,519 29.3% 20.4% +1.7%
Mid East 534 11.7% 678 13.1% 27.0% +1.4%
Midlands 284 6.2% 309 6.0% 8.8% -0.3%
Mid West 378 8.3% 410 7.9% 8.5% -0.4%
South East 499 10.9% 550 10.6% 10.2% -0.3%
South West 662 14.5% 733 14.1% 10.7% -0.3%
West 441 9.6% 456 8.8% 3.4% -0.8%
4,576 5,188 100.0%
Table 5.1 Summary of Population Projections
23National Statement of Housing Supply and Demand 2014 and Outlook for 2015-17

Household RequirementsResearch carried out for the Housing Agency in April 201419 examined population change between 2002 and 2011, and provided a projection of population growth in the short term to 2018, in addition to an assessment of related housing stock requirements over this period.
Using the assumptions underlying the M2F2 model used by CSO above, the report estimated that the national population will increase by 171,345 people between 2011 and 2018.
The average household size in the country has fallen significantly over the last 9 years, from an average of 3.04 in 2002 to 2.77 in 2011. Based on an assessment of regional trends, it has been calculated that it will fall further to 2.67 by 2018. This reflects changes in household composition such as the 19% increase in ‘one person’ households and the 18% increase in ‘lone parent with children’ households between 2006 and 2011. A declining household size will invariably increase demand for housing units and it is projected that an additional 23,000 households will be formed nationally by 2018.
Existing Housing Stock The total state housing stock was recorded as 1,994,845 housing units in the 2011 Census, with an overall unit vacancy rate of 14.5%. The percentage of unit vacancy increased significantly in the period 1996-2011, rising from 8.4% in 1996. The Irish National Survey of Housing Quality 2001-2002 (November 2003) examined the nature and condition of existing Irish housing stock at that time (with reference to the preceding 1991 survey). It found that the age-profile of the Irish housing stock was relatively favourable by international standards, with 27% of the stock having been built since 2001, with a significant proportion of the stock (40%) also being over 30 years old. The data also indicated significant improvement in the condition of dwellings nationally, which may reflect the higher percentage of new housing over that period with higher building quality and standards. However, the data is now largely historic and is not particularly relevant in examining current conditions of housing stock.
Required Residential Units
05 Future Housing Requirements /continued
2002 ‘06 ‘11 ‘12 ‘13 ‘14 ‘15 ‘16 ‘17 ‘182.6
2.7
2.8
2.9
3.0
3.13.04
Actual
Projected
2.89
2.77
2.752.74
2.722.71
2.72.68
2.67
Figure 5.1 Past and Projected National Average Household Size 2002 - 2018
Source: Housing Supply Requirements in Ireland’s Urban Settlements (2014)
19. Housing Supply Requirements in Ireland’s Urban Settlements
0
5,000
10,000
15,000
20,000
25,000
9,50
0 12,8
00 17,1
00 20,9
00
19,4
00Average Housing Supply Requirement 2014 - 2018
2014 2015 2016 2017 2018
Figure 5.2 Estimated Residential Units Supply Requirements in Urban Areas 2014 - 2018
n(Annual) Housing Supply Requirement
Source: Housing Supply Requirements in Ireland’s Urban Settlements (2014)
Housing Agency 24

20. Society of Chartered Surveyors Ireland, Housing Supply Capacity in Dublin’s Urban Settlements 2014 – 2018 (September, 2014)
The supply requirements graph set out below summarises the number of units required to meet identified demand, as derived from an assessment of national demand. Taking account of both levels of existing housing stock and historic trends in housing supply explored in the section above, it outlines that approximately 80,000 residential units will be required to meet expected population growth to 2018 in our main urban centres. The annual need for these units ranges from approximately 9,500 units in 2014 to almost 21,000 in 2018.
Projected demand is most pronounced in the Greater Dublin Area regions of Dublin and the Mid-East, which accounts for almost half of the units of identified demand.
The table below provides a breakdown of the component parts that make up the national figures, including identified demand in the cities of Dublin, Cork, Limerick and Galway.
Table 5.2 Breakdown of Housing Demand by Region 2014 - 2018
Region Projected Population
Increase 2011 - 2018
2011 Housing
Stock from CSO
No. of Additional
Housing Units
Required 2014 - 2018
Dublin 44,056 527,665 37,581
Mid-East 25,707 202,842 11,999
Midlands 9,476 118,896 3,992
South East
7,911 220,861 3,997
South West
11,103 301,242 7,559
Mid-West
9,662 168,562 5,496
West 8,731 208,544 4,580
Border 10,515 245,043 5,164
Total 127,161 1,993,655 80,368
Source: Future Analytics Consultants
The Dublin market has been further analysed in ‘Housing Supply Capacity in Dublin’s Urban Settlements 2014-2018’ 20. This study examined the demographic changes in the city to assess housing requirements, as well as examining supply side issues. The minimum housing requirements in 2018 in the four Dublin local authorities was projected as follows:
Table 5.3 Breakdown of Housing Demand by Dublin Local Authority 2014 - 2018
Local Authority Minimum Housing Units Required
2014-2018
Dublin City Council 13,751
Fingal County Council 9,617
Dun Laoghaire Rathdown 3,299
South Dublin 8,766
Total 35,433
Source: Society of Chartered Surveyors Ireland (2014)
Household CompositionProportional household composition (as opposed to average household size) is used as a more reliable indicator to determine how housing units will be occupied going forward, and therefore, as a means to inform future housing projections and supply requirements. Household composition can be understood as the % of population living in an ‘X’ person household.
Intercensal trends in household composition (between 2002-2006 and 2006-2011) show an increase in smaller households (no. of people in occupancy) with a corresponding decrease in larger households.
25National Statement of Housing Supply and Demand 2014 and Outlook for 2015-17

05 Future Housing Requirements /continued
Table 5.4 Changes in National Household Composition 2002 - 2011
National Household Composition
2002 2006 2011
1 Person Household
7.4% 8.1% 8.7%
2 Person Household
17.8% 20.4% 21.6%
3 Person Household
18.2% 19.4% 19.9%
4 Person Household
23.6% 23.6% 23.6%
5+ Person Household
32.8% 28.3% 26%
Source: The Housing Agency Housing Supply Requirements in Irelands Urban Settlements 2014-2018: Overview, April 2014
Pent-up DemandIn addition to household formation in future years, there is a level of demand for housing for those that may have wished to form a household in previous years but were not able to do so, due to the lack of supply of residential units. Pent-up demand will also be influenced by a wide range of other factors, such as employment, availability of lending, mobility etc.
There is a lack of data to accurately estimate the level of this pent-up demand. However, a broad estimate of the order of magnitude is provided using average household size, increases in population and housing completions in the period from 2011-2013. Population increases in the period 2011-2013 are estimated by comparing regional population data from the 2011 Census with data from the CSO’s Regional Population Projections for 2013 under the M2F2 scenario. The projected population increases in each region are then divided by their respective regional household size in order to estimate the number of housing units required in each region. Documented annual housing completions are then cross-referenced against this total in order to quantify the housing requirement generated by unmet demand by region.
This analysis indicates that 2,366 additional households may have formed if additional residential units had been provided in 2012 and 2013. The estimate is set out in the following table. Further details on the calculation are set out in Appendix 1. Table 5.5 Estimate of Unmet Demand by Region, 2012 - 2013
Region Unmet Demand 2012 and 2013
Dublin 832
Mid East 1,151
Midlands 123
South East 259
South West 0
Mid West 0
West 0
Border 0
Total 2,366
Source: Future Analytics Consultants (see Appendix 1)
The Dublin region is achieving a significant proportion of new job creation in the country, with anecdotal evidence suggesting that employment-related in-migration accounts for significant additional pent-up demand in the capital above the levels estimated above. This is supported by the identified significant increases in rental levels and house purchase prices.
Housing Agency 26
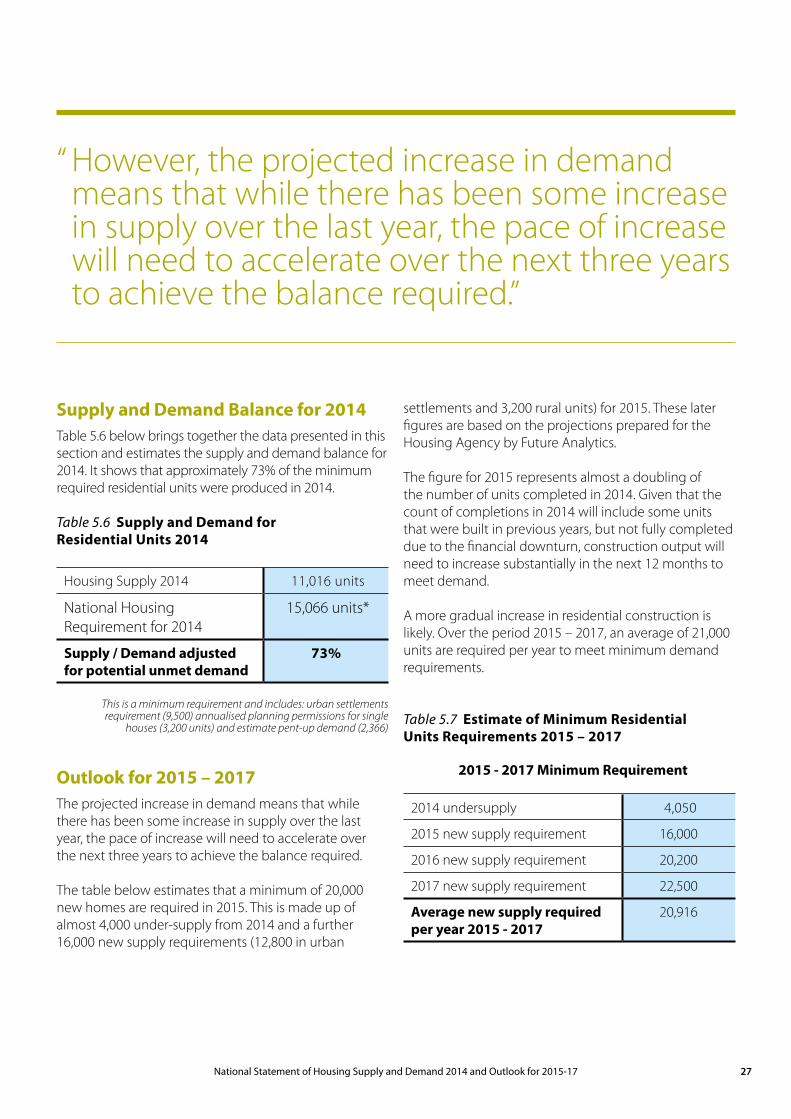
Supply and Demand Balance for 2014Table 5.6 below brings together the data presented in this section and estimates the supply and demand balance for 2014. It shows that approximately 73% of the minimum required residential units were produced in 2014.
Table 5.6 Supply and Demand for Residential Units 2014
Housing Supply 2014 11,016 units
National Housing Requirement for 2014
15,066 units*
Supply / Demand adjusted for potential unmet demand
73%
This is a minimum requirement and includes: urban settlements requirement (9,500) annualised planning permissions for single
houses (3,200 units) and estimate pent-up demand (2,366)
Outlook for 2015 – 2017The projected increase in demand means that while there has been some increase in supply over the last year, the pace of increase will need to accelerate over the next three years to achieve the balance required.
The table below estimates that a minimum of 20,000 new homes are required in 2015. This is made up of almost 4,000 under-supply from 2014 and a further 16,000 new supply requirements (12,800 in urban
settlements and 3,200 rural units) for 2015. These later figures are based on the projections prepared for the Housing Agency by Future Analytics.
The figure for 2015 represents almost a doubling of the number of units completed in 2014. Given that the count of completions in 2014 will include some units that were built in previous years, but not fully completed due to the financial downturn, construction output will need to increase substantially in the next 12 months to meet demand.
A more gradual increase in residential construction is likely. Over the period 2015 – 2017, an average of 21,000 units are required per year to meet minimum demand requirements.
Table 5.7 Estimate of Minimum Residential Units Requirements 2015 – 2017
2015 - 2017 Minimum Requirement
2014 undersupply 4,050
2015 new supply requirement 16,000
2016 new supply requirement 20,200
2017 new supply requirement 22,500
Average new supply required per year 2015 - 2017
20,916
“ However, the projected increase in demand means that while there has been some increase in supply over the last year, the pace of increase will need to accelerate over the next three years to achieve the balance required.”
27National Statement of Housing Supply and Demand 2014 and Outlook for 2015-17
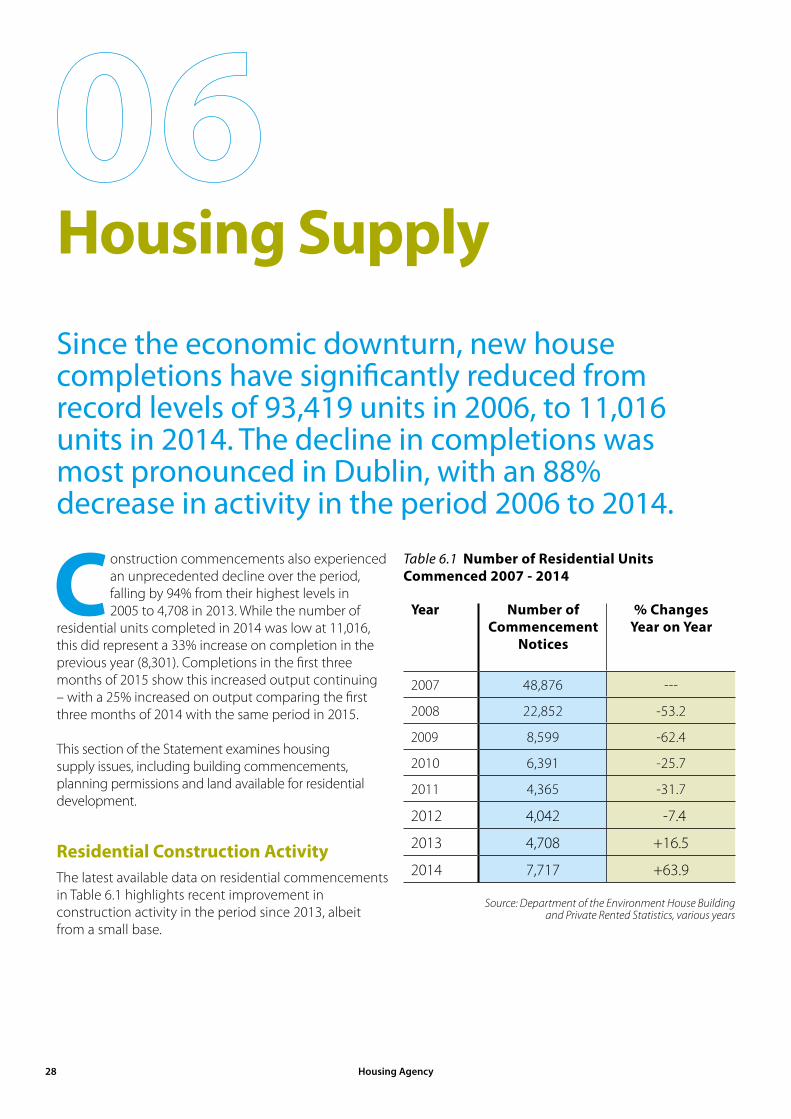
Construction commencements also experienced an unprecedented decline over the period, falling by 94% from their highest levels in 2005 to 4,708 in 2013. While the number of
residential units completed in 2014 was low at 11,016, this did represent a 33% increase on completion in the previous year (8,301). Completions in the first three months of 2015 show this increased output continuing – with a 25% increased on output comparing the first three months of 2014 with the same period in 2015.
This section of the Statement examines housing supply issues, including building commencements, planning permissions and land available for residential development.
Residential Construction ActivityThe latest available data on residential commencements in Table 6.1 highlights recent improvement in construction activity in the period since 2013, albeit from a small base.
Table 6.1 Number of Residential Units Commenced 2007 - 2014
Year Number of Commencement
Notices
% Changes Year on Year
2007 48,876 ---
2008 22,852 -53.2
2009 8,599 -62.4
2010 6,391 -25.7
2011 4,365 -31.7
2012 4,042 -7.4
2013 4,708 +16.5
2014 7,717 +63.9
Source: Department of the Environment House Building and Private Rented Statistics, various years
Housing Supply
Since the economic downturn, new house completions have significantly reduced from record levels of 93,419 units in 2006, to 11,016 units in 2014. The decline in completions was most pronounced in Dublin, with an 88% decrease in activity in the period 2006 to 2014.
Housing Agency 28

While commencement notice data is showing improvement, planning permission data is less encouraging. The data presented in Table 6.2 shows planning permissions granted over the last eight years for dwellings. In more recent years, the floor area for permissions granted is low compared to the period 2007 – 2010 period. Permissions normally are for a five year period, but even if some were extended, there would appear to be insufficient permissions to meet the projected requirement. However, see section below in relation to land availability.
Table 6.2 New Dwelling Planning Permissions 2007 - 2014
Year Planning Permissions
Granted
Total Floor Area (‘000 sq Metres)
2007 22,253 12,206
2008 17,491 9,837
2009 10,380 5,928
2010 6,347 2,861
2011 4,767 1,981
2012 3,643 1,199
2013 3,316 1,305
2014 3,606 1,366
Source: CSO, various years
Residential Land AvailabilityThe Residential Land Availability Survey 2014 was published in February 2015, and provides data in respect of residentially zoned land available for housing as of 31st March 2014. The survey examines the land in two stages:
nStage 1 – undeveloped residentially zoned lands, regardless of the sequence of the development of those lands or phasing under local authority development plan core strategies
nStage 2 - the lands identified in Stage 1 that are potentially available for development in relation to the order of priority or phasing indicated under the relevant Development Plan or Local Area Plan period
The identification of the lands does not account for the availability of services for the lands, such as water services, energy and communications, transport, schools, community facilities and amenities. Potential (in terms of the delivery of units) is based on information provided by the planning relevant authorities.
The total area of available zoned land following the Stage 2 assessment is 17,434 ha nationally, capable of supporting over 414,000 housing units.
The results by region are summarised in the following table.
“ Improved mortgage availability and consumer confidence are both likely to stimulate improved levels of activity in the housing market in the coming years.”
29National Statement of Housing Supply and Demand 2014 and Outlook for 2015-17

The report ‘Housing Supply Requirements in Ireland’s Urban Settlements 2014 – 2018’, prepared for the Housing Agency in 2014, examined the availability of sufficient and adequate zoned land to accommodate future requirements for new households in the urban areas of the country. As shown in Section 3.0, the analysis undertaken indicated a potential national supply shortfall of 48,395 units over the period 2012-2018 from the existing stock of housing units. The majority of this demand (75%) emanates from the Greater Dublin Area (Dublin and Mid-East Regions). When examined independently, city based growth is very apparent, with Cork and Limerick, alongside Dublin in particular, exhibiting high levels of future demand, when excess regional capacity is discounted.
The report ‘Housing Supply Capacity in Dublin’s Urban Settlements 2014-2018’ analysed the extent of zoned residential lands for development and the amount of extant planning permissions that can contribute to new supply of housing in the short term:
nThere are 2,233 hectares (ha) of land zoned and potentially available for residential development, which is 2.4% of the total land area in the Dublin Region
nThis can result in the provision of housing for approximately 269,000 additional persons
nThere is a total deficit of approximately 25% across the four Dublin authorities. Dublin City Council has the largest deficit due in part to the limited extent of available land and the mixed use nature of many of its zoning classes
nThere will also be potential to develop residential units within the scope of other development land zonings, such as in mixed use schemes or in town centres. This gives additional scope for address housing requirements
The number of extant planning permissions is not currently publicly available at this level of detail for other regions of the country.
A Housing Supply Coordination Task Force for Dublin was established under Action 2 of Construction 2020 with an immediate focus on addressing supply-side issues. It is working closely with industry and other parties, including those responsible for key infrastructure such as schools, to identify and address any obstacles to viable and appropriate development. To date the Task Force has completed two reports.
06 Housing Supply /continued
Stage 1 Stage 2
Area(ha)
Potential Dwellings
Area(ha)
Potential Dwellings
South West Region 2,430 45,611 1,995 35,746
Mid-West Region 3,277 66,328 2,168 36,435
South-East Region 4,534 77,930 3,520 58,559
Mid-East Region 3,614 97,089 3,506 94,349
Midlands Region 2,359 44,454 1,343 29,738
West Region 3,097 54,604 1,266 23,820
Dublin Region 2,812 123,451 2,654 116,705
Border Region 5,240 101,835 983 19,360
National Total 27,363 611,302 17,435 414,712
Table 6.3 Residential Land Availability Survey 2014
Source: Department of the Environment, Community and Local Government
Housing Agency 30

The first of these reports21, published in June 2014, identified capacity in the immediate to short-term for 46,217 additional housing units in the Dublin Region, which comprises 18,044 planning permissions for homes which remain unbuilt, 2,666 applications for residential units (1,860 houses and 806 apartments) which are currently being processed by the four Dublin Local Authorities, in addition to sufficient zoned residential land for 25,507 residential units.
The report also identified the assessment of the medium to longer term infrastructural issues as a priority in the Task Force’s work programme. The approach to be adopted in progressing that analysis and the identification of any non-planning blockages to the activation of approved but not yet commenced permissions, has been agreed. The wider infrastructural position will be considered in the context of both a future National Planning Framework (Actions 12 and 42 under Construction 2020) and Regional Spatial and Economic Strategies (Actions 17 and 42 under Construction 2020).
The Task Force’s Second Report on Critical Infrastructure Deficits in Residential Priority Areas in the Dublin Region has been submitted to the Department of the Environment, Community and Local Government for consideration and will be published in due course.
Rural Housing SupplyHousing supply in small urban centres and in rural areas has largely been met by the development of single residential units. Data on planning permissions granted for new single residential units derived from the CSO provides an estimate of the number of units delivered, and also acts as an indicator of housing requirements in rural areas.
Table 6.4 Planning Permissions Granted, 2010 - 2014
Year No. of Planning Permissions Granted for Single Residential Units
2010 5,582
2011 4,243
2012 3,250
2013 2,916
2014 3,096
Residential Sales Trends
Stock on the marketThe most recent Daft.ie House Price Report for Q2 2015 records the number of properties on the market (as advertised on Daft.ie). The national level of stock for sale has stabilised with approximately 30,000 properties, a similar level to last year. However, in Dublin, the stock has risen from 2,800 in mid-2014 to 4,600 units. Almost 59% of sales are sold within four months currently, similar to last year.
TransactionsData on the numbers of transactions for residential property has been recorded by the Property Services Regulatory Authority since 2010.
The number of transactions dropped significantly from 2010 to 2011, but has seen an increase in number in all regions each year since 2011. Table 6.5 below identifies the change in the number of transactions in each region.
In 2014, the number of transactions increased by 22% compared to the 12 months previously (Table 6.6). The region showing the greatest increase in transactions in 2014 to date is the Midlands. The trends suggest the Midlands, Mid-West and the Mid-East regions recovered more quickly from the lowest levels of 2011 in terms of property transactions, having dropped most in 2011. Transactions levels are beginning to moderate in these regions. Other regions, such as the West and South East have shown their recovery beginning later and continuing, albeit from lower levels of transactions, while Dublin exhibited the lowest rate of transaction growth in the period 2013-2014, despite maintaining the highest level of transaction activity.
21. http://www.environ.ie/en/Publications/DevelopmentandHousing/Planning/FileDownLoad,40631,en.pdf
31National Statement of Housing Supply and Demand 2014 and Outlook for 2015-17

06 Housing Supply /continued
Unfinished HousingThe Government’s Action Programme on Unfinished Housing Developments was published in 2010.
The third Annual Progress Report on Actions to Address Unfinished Housing Developments, published in December 2014, identified a further improvement during the year demonstrated by the reduced vacancy figures and increased levels of activity on sites.
Over the past four years, the number of unfinished developments has been reduced by two-thirds from under 3,000 to 992 developments.
A Special Resolution Fund of €10 million was designed to be targeted towards developments not likely to be resolved in the normal way through solely developer / owner / funder action because of the presence of specific financial barriers 2015. Budget 2015 allocated a further €3.35 million to the Special Resolution Fund for progress in 2015.
2010 2011 2012 2013 2014
Dublin 6,915 5,880 8,853 10,314 12,542
Mid-East 2,611 1,981 2,644 3,295 4,307
South East 1,758 1,658 2,249 2,587 3,363
South West 2,886 2,659 3,502 4,090 5,099
Mid-West 1,811 1,640 2,020 2,271 3,154
West 1,645 1,644 2,116 2,689 3,461
Midlands 1,125 1,042 1,366 1,535 2,211
Border 2,145 1,826 2,439 3,010 4,050
Total 20,896 18,330 25,189 29,791 38,187
2011 2012 2013 2014
Dublin -15% 51% 17% 22%
Mid-East -24% 33% 25% 31%
South East -6% 36% 15% 30%
South East -8% 32% 17% 25%
Mid-West -9% 23% 12% 39%
West 0% 29% 27% 29%
Midlands -7% 31% 12% 44%
Border -15% 34% 23% 35%
Total -12% 37% 18% 28%
Table 6.5 Numbers of Transactions, 2010 - 2014
Table 6.6 Change in Numbers of Transactions, 2010 - 2014
Source: Property Services Regulatory Authority, various years
Source: Property Services Regulatory Authority, various years
Housing Agency 32

Population Increase
2011 to 2013
Average Household
Size (Census 2011)
Units Required
Completions 2012
and 2013
Unmet Demand
Dublin 6,909 2.65 2,606 1,774 832
Midlands 3,581 2.80 1,277 1,154 123
Mid East 8,664 2.93 2,961 1,810 1,151
Mid West 768 2.71 284 1,218 0
South East 5,396 2.73 1,978 1,719 259
South West 4,574 2.71 1,688 2,904 0
West -602 2.71 0 1,736 0
Border -409 2.75 0 2,336 0
Total 28,881 10,794 14,651 2,366
Source: The Housing Agency
Appendix 1Estimate of Pent-Up Demand, 2014
33National Statement of Housing Supply and Demand 2014 and Outlook for 2015-17

www.housing.ie