Embed Size (px)
Citation preview
Copyright reserved Please turn over
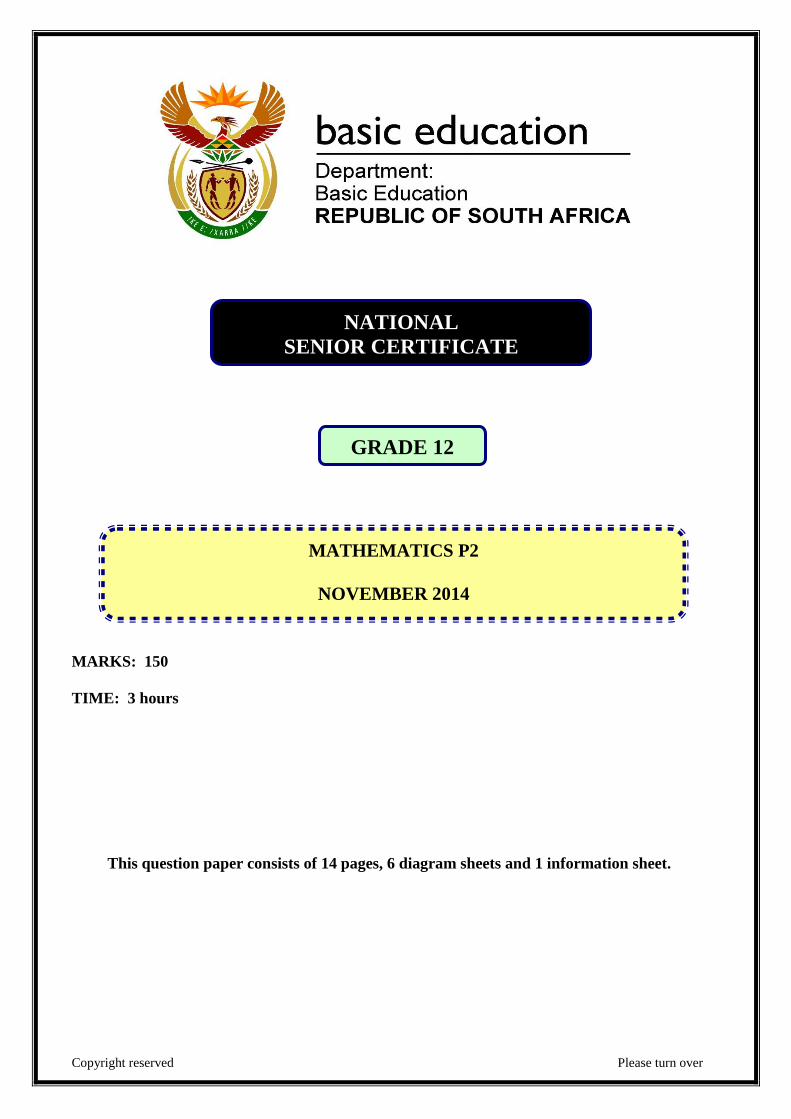
MARKS: 150
TIME: 3 hours
This question paper consists of 14 pages, 6 diagram sheets and 1 information sheet.
MATHEMATICS P2
NOVEMBER 2014
NATIONAL
SENIOR CERTIFICATE
GRADE 12
Mathematics/P2 2 DBE/November 2014
NSC
Copyright reserved Please turn over
INSTRUCTIONS AND INFORMATION
Read the following instructions carefully before answering the questions.
1.
2.
3.
4.
5.
This question paper consists of 10 questions.
Answer ALL the questions.
Clearly show ALL calculations, diagrams, graphs, et cetera which you have used
in determining the answers.
Answers only will NOT necessarily be awarded full marks.
You may use an approved scientific calculator (non-programmable and
non-graphical), unless stated otherwise.
6.
7.
If necessary, round off answers to TWO decimal places, unless stated otherwise.
SIX diagram sheets for QUESTIONS 2.2.1, 2.2.2, 7.4, 8.1, 8.2, 8.3, 9.1, 9.2 and 10
are attached at the end of this question paper. Write your centre number and
examination number on these sheets in the spaces provided and insert them inside
the back cover of your ANSWER BOOK.
8. Diagrams are NOT necessarily drawn to scale.
9.
10.
Number the answers correctly according to the numbering system used in this
question paper.
Write neatly and legibly.
Mathematics/P2 3 DBE/November 2014
NSC
Copyright reserved Please turn over
QUESTION 1
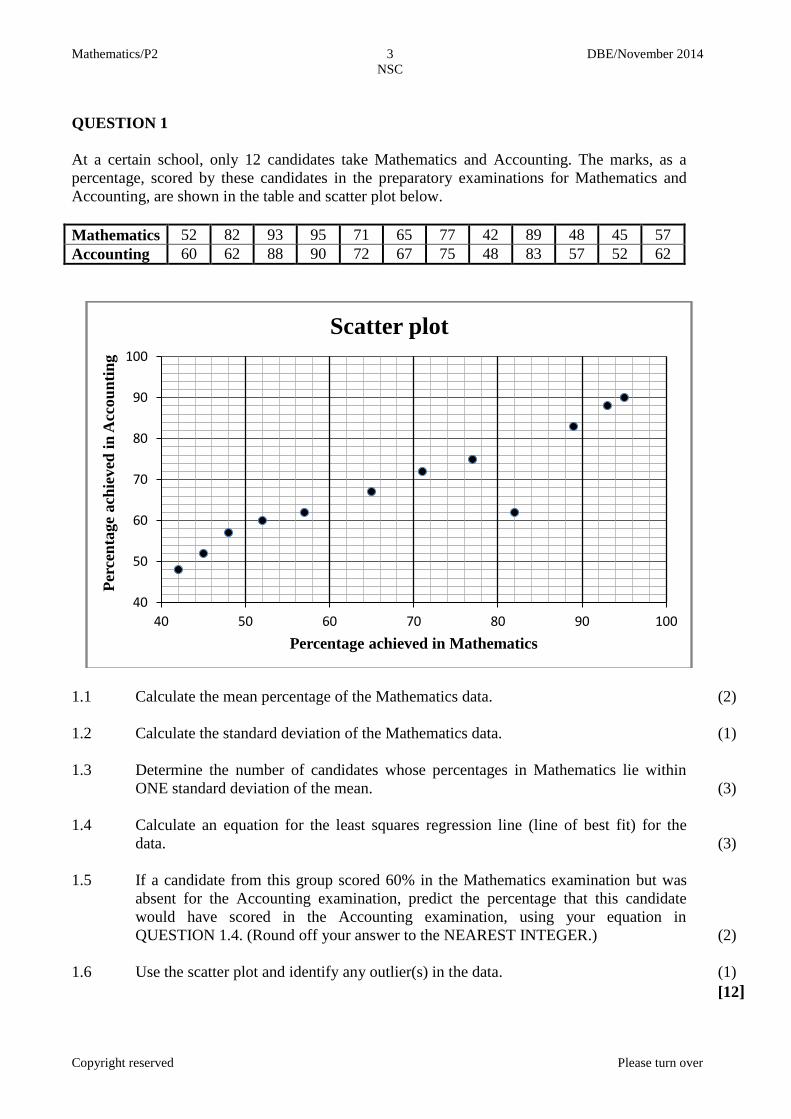
At a certain school, only 12 candidates take Mathematics and Accounting. The marks, as a
percentage, scored by these candidates in the preparatory examinations for Mathematics and
Accounting, are shown in the table and scatter plot below.
Mathematics 52 82 93 95 71 65 77 42 89 48 45 57
Accounting 60 62 88 90 72 67 75 48 83 57 52 62
1.1 Calculate the mean percentage of the Mathematics data. (2)
1.2 Calculate the standard deviation of the Mathematics data. (1)
1.3 Determine the number of candidates whose percentages in Mathematics lie within
ONE standard deviation of the mean.
(3)
1.4 Calculate an equation for the least squares regression line (line of best fit) for the
data.
(3)
1.5 If a candidate from this group scored 60% in the Mathematics examination but was
absent for the Accounting examination, predict the percentage that this candidate
would have scored in the Accounting examination, using your equation in
QUESTION 1.4. (Round off your answer to the NEAREST INTEGER.)
(2)
1.6 Use the scatter plot and identify any outlier(s) in the data. (1)
[12]
40
50
60
70
80
90
100
40 50 60 70 80 90 100
Per
cen
tage
ach
ieved
in
Acc
ou
nti
ng
Percentage achieved in Mathematics
Scatter plot
Mathematics/P2 4 DBE/November 2014
NSC
Copyright reserved Please turn over
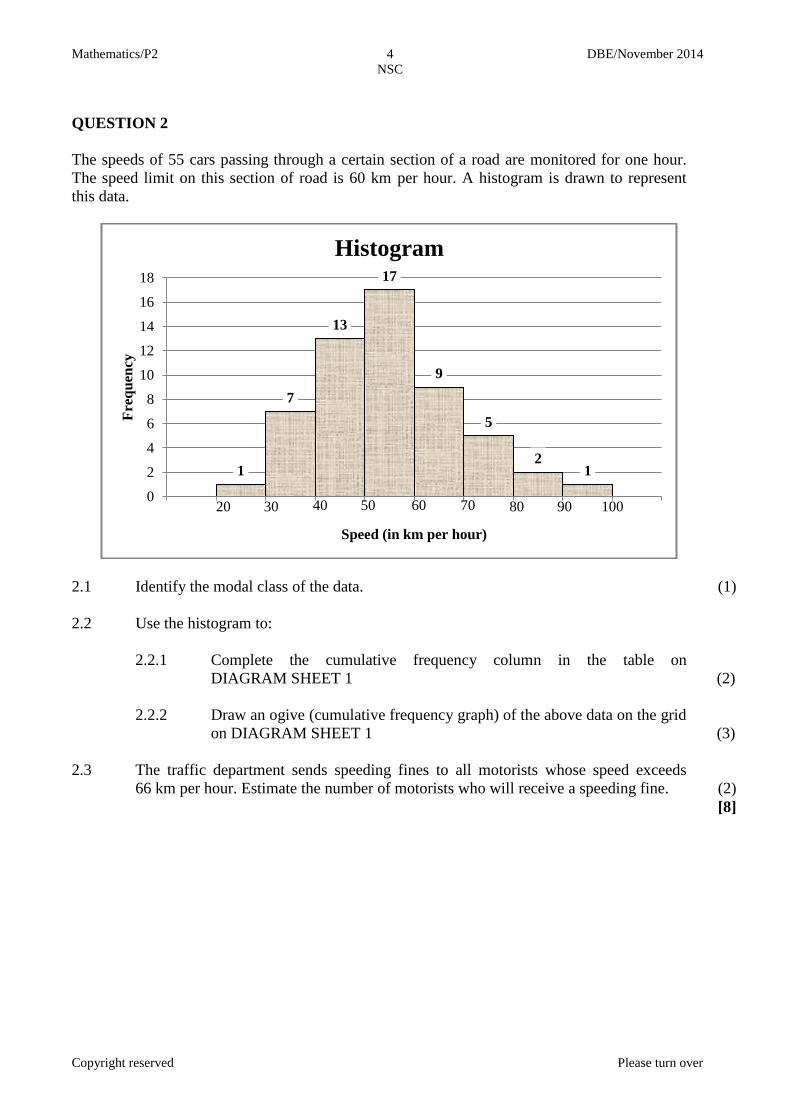
QUESTION 2
The speeds of 55 cars passing through a certain section of a road are monitored for one hour.
The speed limit on this section of road is 60 km per hour. A histogram is drawn to represent
this data.
2.1 Identify the modal class of the data. (1)
2.2 Use the histogram to:
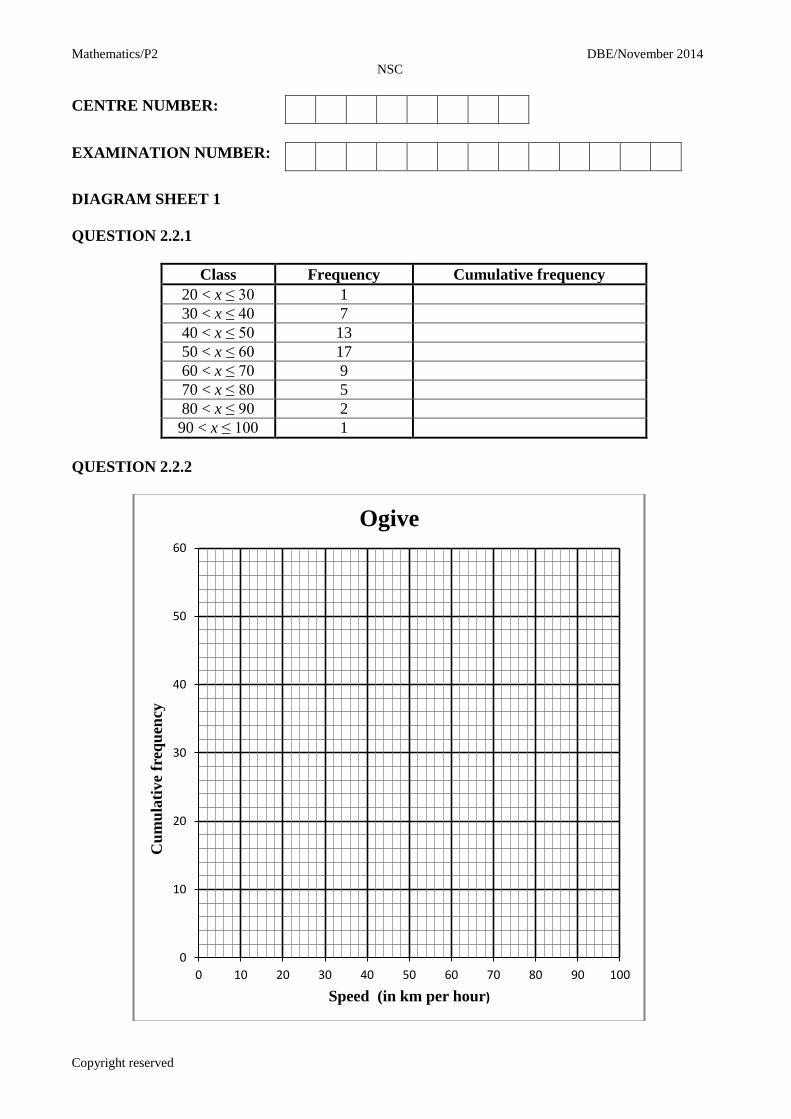
2.2.1 Complete the cumulative frequency column in the table on
DIAGRAM SHEET 1
(2)
2.2.2 Draw an ogive (cumulative frequency graph) of the above data on the grid
on DIAGRAM SHEET 1
(3)
2.3 The traffic department sends speeding fines to all motorists whose speed exceeds
66 km per hour. Estimate the number of motorists who will receive a speeding fine.
(2)
[8]
1
7
13
17
9
5
2 1
0
2
4
6
8
10
12
14
16
18
0-20 20-30 30-40 40-50 50-60 60-70 70-80 80-90 90-100 100-110
Fre
qu
ency
Speed (in km per hour)
Histogram
20 30 40 50 60 70 80 90 100
Mathematics/P2 5 DBE/November 2014
NSC
Copyright reserved Please turn over
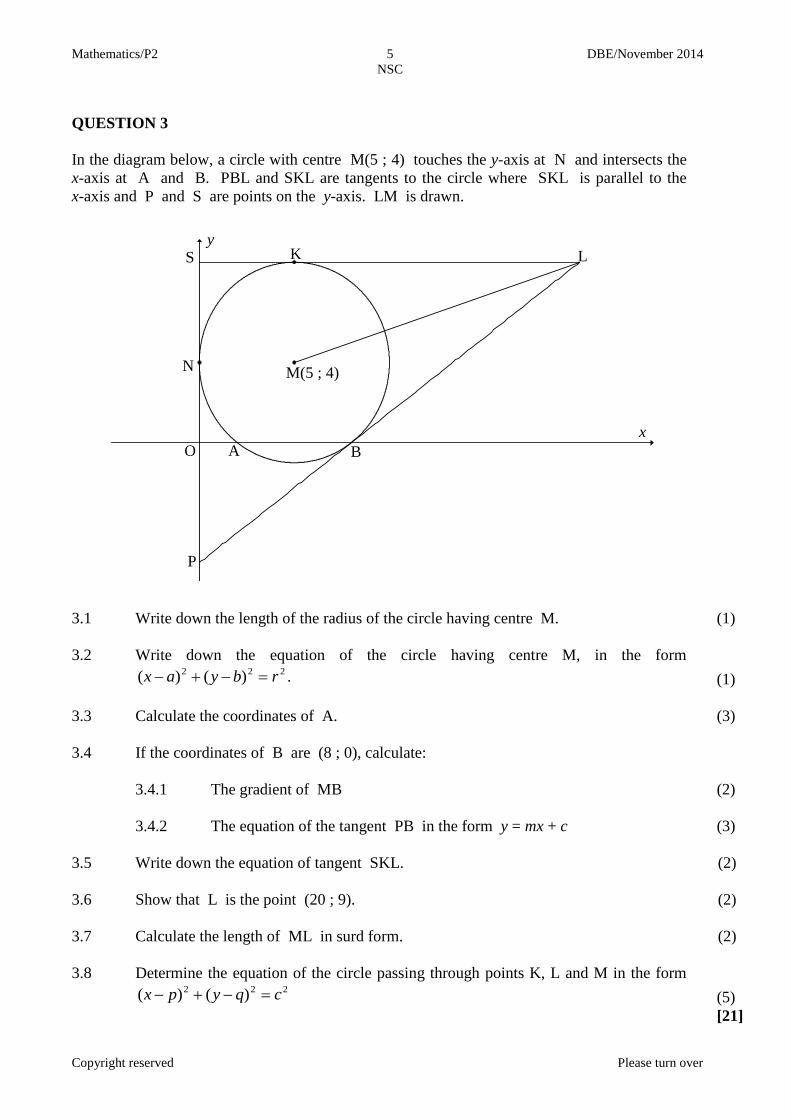
QUESTION 3
In the diagram below, a circle with centre M(5 ; 4) touches the y-axis at N and intersects the
x-axis at A and B. PBL and SKL are tangents to the circle where SKL is parallel to the
x-axis and P and S are points on the y-axis. LM is drawn.
3.1 Write down the length of the radius of the circle having centre M. (1)
3.2 Write down the equation of the circle having centre M, in the form 222 )()( rbyax .
(1)
3.3 Calculate the coordinates of A. (3)
3.4 If the coordinates of B are (8 ; 0), calculate:
3.4.1 The gradient of MB (2)
3.4.2 The equation of the tangent PB in the form y = mx + c (3)
3.5 Write down the equation of tangent SKL. (2)
3.6 Show that L is the point (20 ; 9). (2)
3.7 Calculate the length of ML in surd form. (2)
3.8 Determine the equation of the circle passing through points K, L and M in the form 222 )()( cqypx
(5)
[21]
y
x
N
S L
M(5 ; 4)
O A B
P
K y
Mathematics/P2 6 DBE/November 2014
NSC
Copyright reserved Please turn over
QUESTION 4
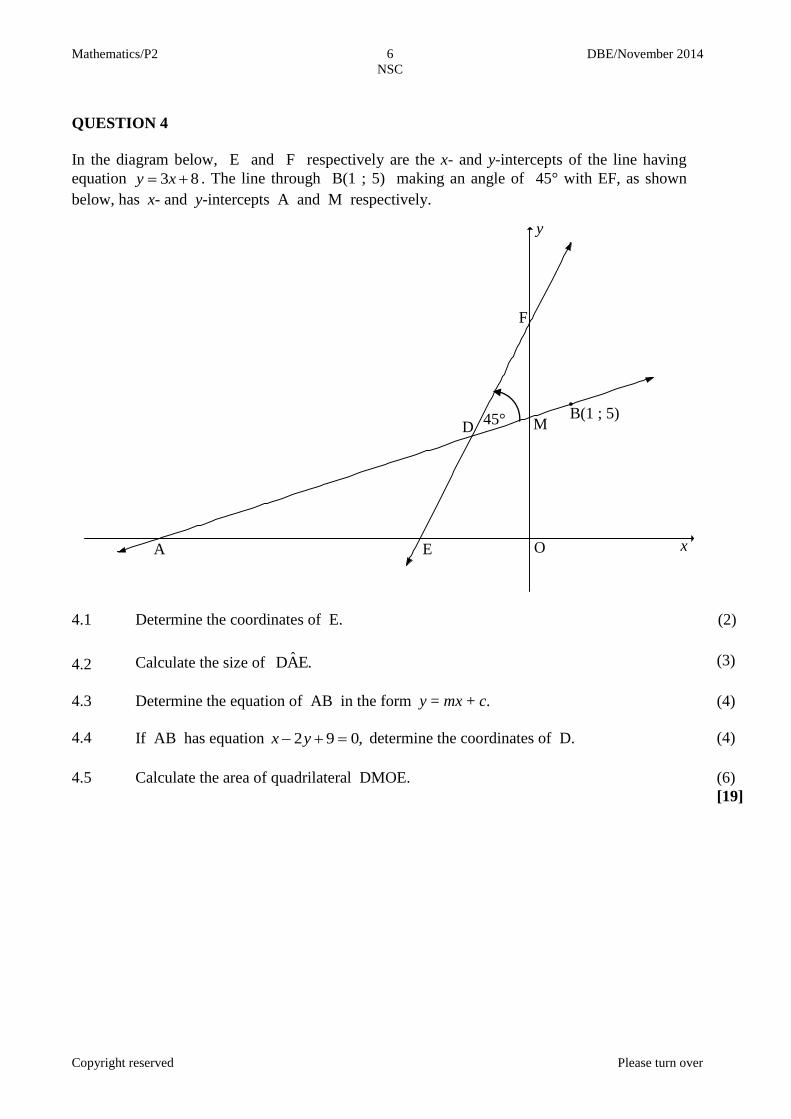
In the diagram below, E and F respectively are the x- and y-intercepts of the line having
equation 83 xy . The line through B(1 ; 5) making an angle of 45° with EF, as shown
below, has x- and y-intercepts A and M respectively.
4.1 Determine the coordinates of E. (2)
4.2 Calculate the size of E.AD (3)
4.3 Determine the equation of AB in the form y = mx + c. (4)
4.4 If AB has equation ,092 yx determine the coordinates of D. (4)
4.5 Calculate the area of quadrilateral DMOE. (6)
[19]
y
45° D
B(1 ; 5) M
E A
F
O x
Mathematics/P2 7 DBE/November 2014
NSC
Copyright reserved Please turn over
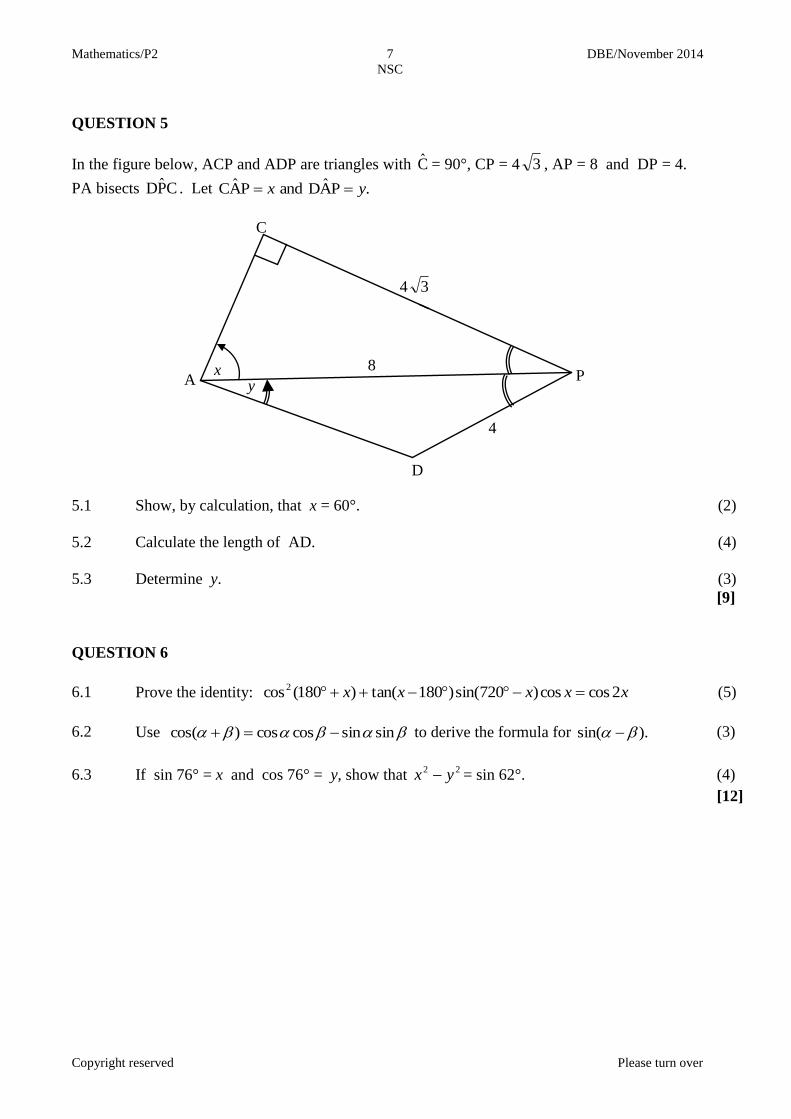
QUESTION 5
In the figure below, ACP and ADP are triangles with C = 90°, CP = 4 3 , AP = 8 and DP = 4.
PA bisects CPD . Let .PADandPAC yx
5.1 Show, by calculation, that x = 60°. (2)
5.2 Calculate the length of AD. (4)
5.3 Determine y. (3)
[9]
QUESTION 6
6.1 Prove the identity: xxxxx 2coscos)720sin()180tan()180(cos2 (5)
6.2 Use sinsincoscos)cos( to derive the formula for ).sin( (3)
6.3 If sin 76° = x and cos 76° = y, show that 22 yx = sin 62°.
(4)
[12]
C
D
A P x y
4
4 3
8
Mathematics/P2 8 DBE/November 2014
NSC
Copyright reserved Please turn over
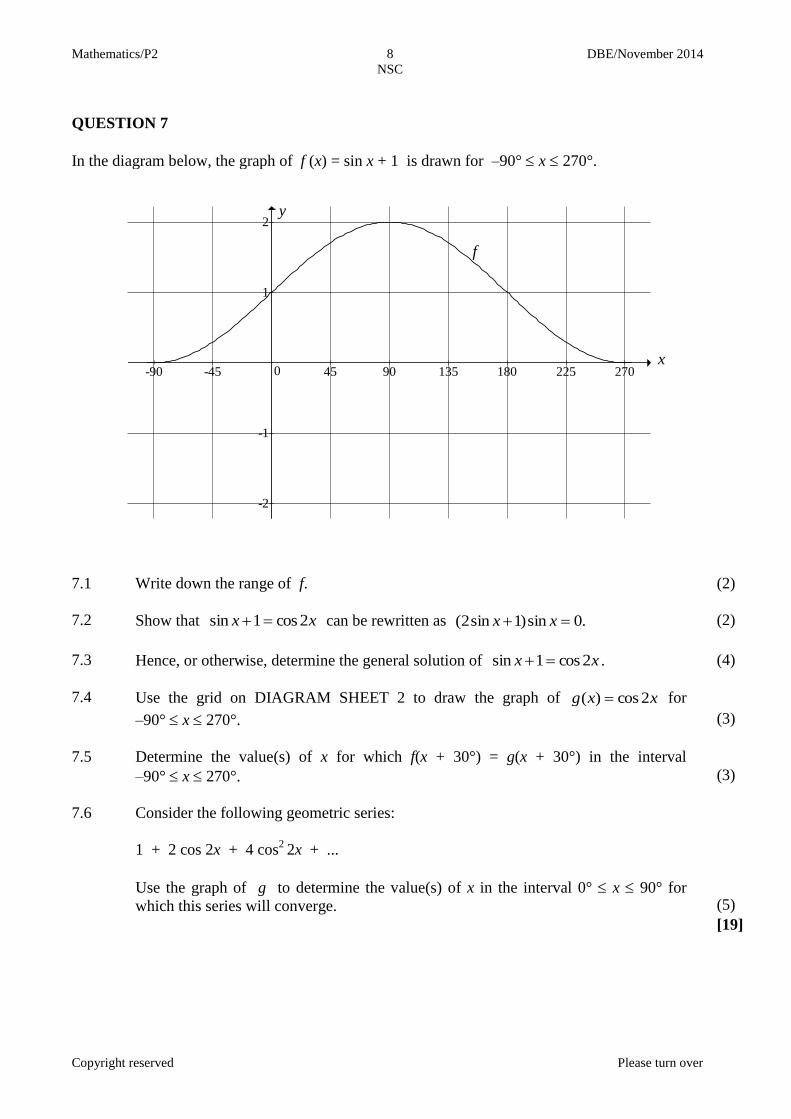
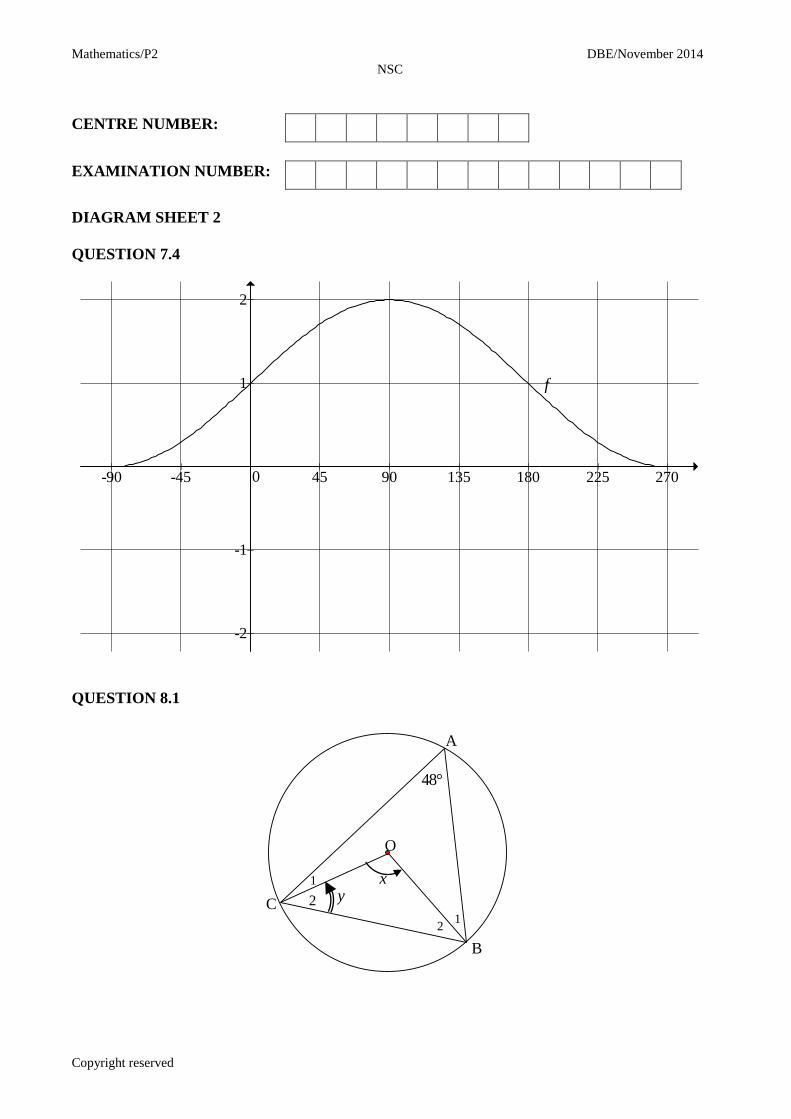
QUESTION 7
In the diagram below, the graph of f (x) = sin x + 1 is drawn for –90° x 270°.
-90 -45 45 90 135 180 225 270
-2
-1
1
2
7.1 Write down the range of f. (2)
7.2 Show that xx 2cos1sin can be rewritten as .0sin)1sin2( xx (2)
7.3 Hence, or otherwise, determine the general solution of xx 2cos1sin . (4)
7.4 Use the grid on DIAGRAM SHEET 2 to draw the graph of xxg 2cos)( for
–90° x 270°.
(3)
7.5 Determine the value(s) of x for which f(x + 30°) = g(x + 30°) in the interval
–90° x 270°.
(3)
7.6 Consider the following geometric series:
1 + 2 cos 2x + 4 cos2
2x + ...
Use the graph of g to determine the value(s) of x in the interval 0° x 90° for
which this series will converge.
(5)
[19]
y
x
f
0
Mathematics/P2 9 DBE/November 2014
NSC
Copyright reserved Please turn over
GIVE REASONS FOR YOUR STATEMENTS IN QUESTIONS 8, 9 AND 10.
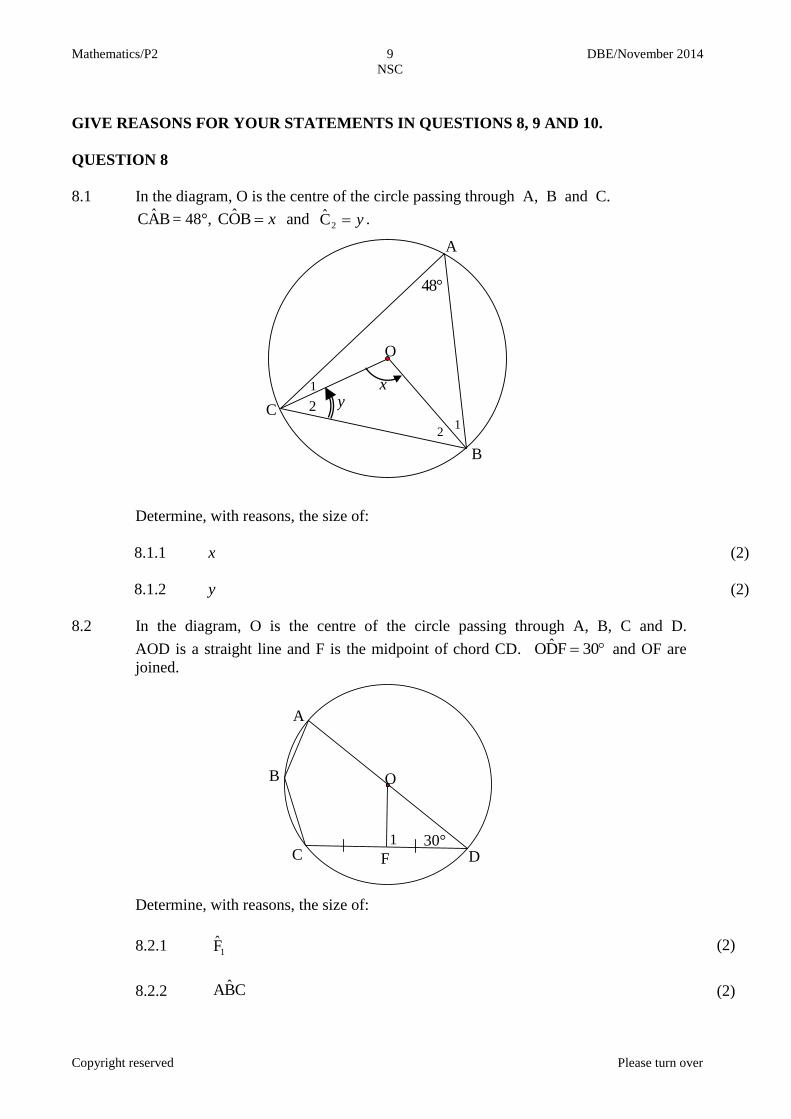
QUESTION 8
8.1 In the diagram, O is the centre of the circle passing through A, B and C.
BAC = 48°, xBOC and y2C .
Determine, with reasons, the size of:
8.1.1 x (2)
8.1.2 y (2)
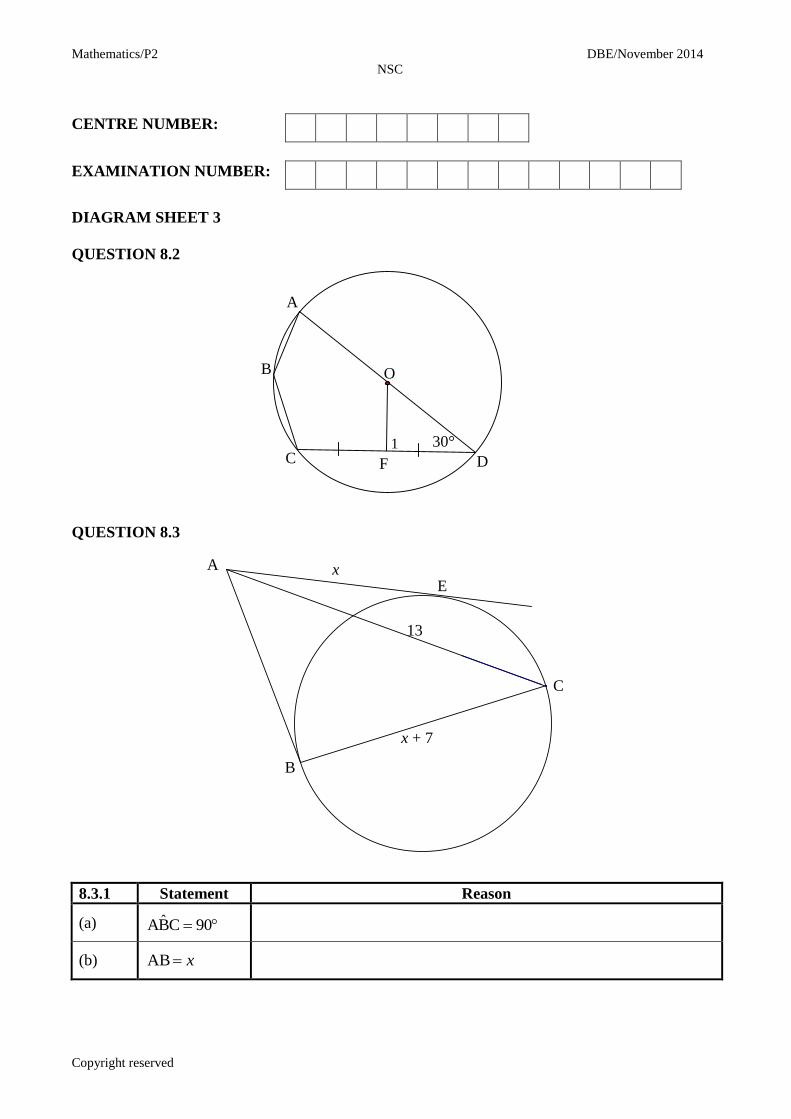
8.2 In the diagram, O is the centre of the circle passing through A, B, C and D.
AOD is a straight line and F is the midpoint of chord CD. 30FDO and OF are
joined.
Determine, with reasons, the size of:
8.2.1 1F (2)
8.2.2 CBA (2)
48°
x
2
1
1
y
A
O
B
C 2
30°
A
B
C D
O
F
1
Mathematics/P2 10 DBE/November 2014
NSC
Copyright reserved Please turn over
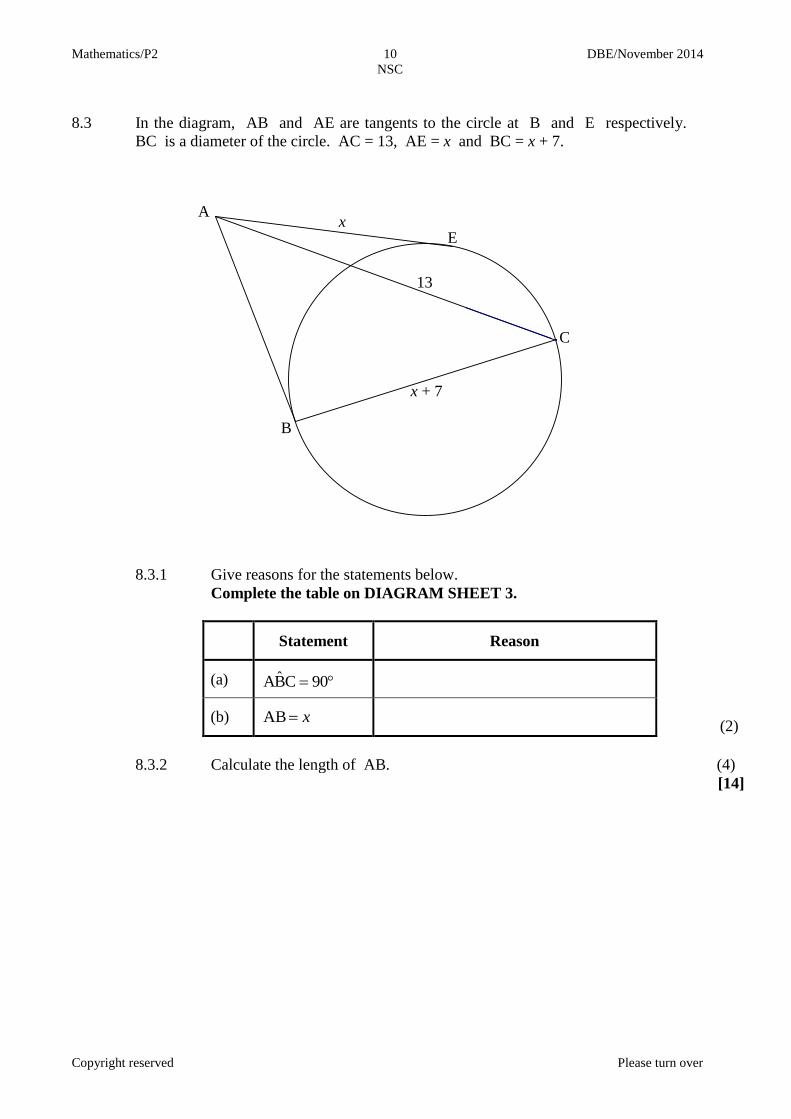
8.3 In the diagram, AB and AE are tangents to the circle at B and E respectively.
BC is a diameter of the circle. AC = 13, AE = x and BC = x + 7.
8.3.1 Give reasons for the statements below.
Complete the table on DIAGRAM SHEET 3.
Statement Reason
(a) 90CBA
(b) xAB
(2)
8.3.2 Calculate the length of AB. (4)
[14]
A
E
B
C
x
13
x + 7
Mathematics/P2 11 DBE/November 2014
NSC
Copyright reserved Please turn over
QUESTION 9
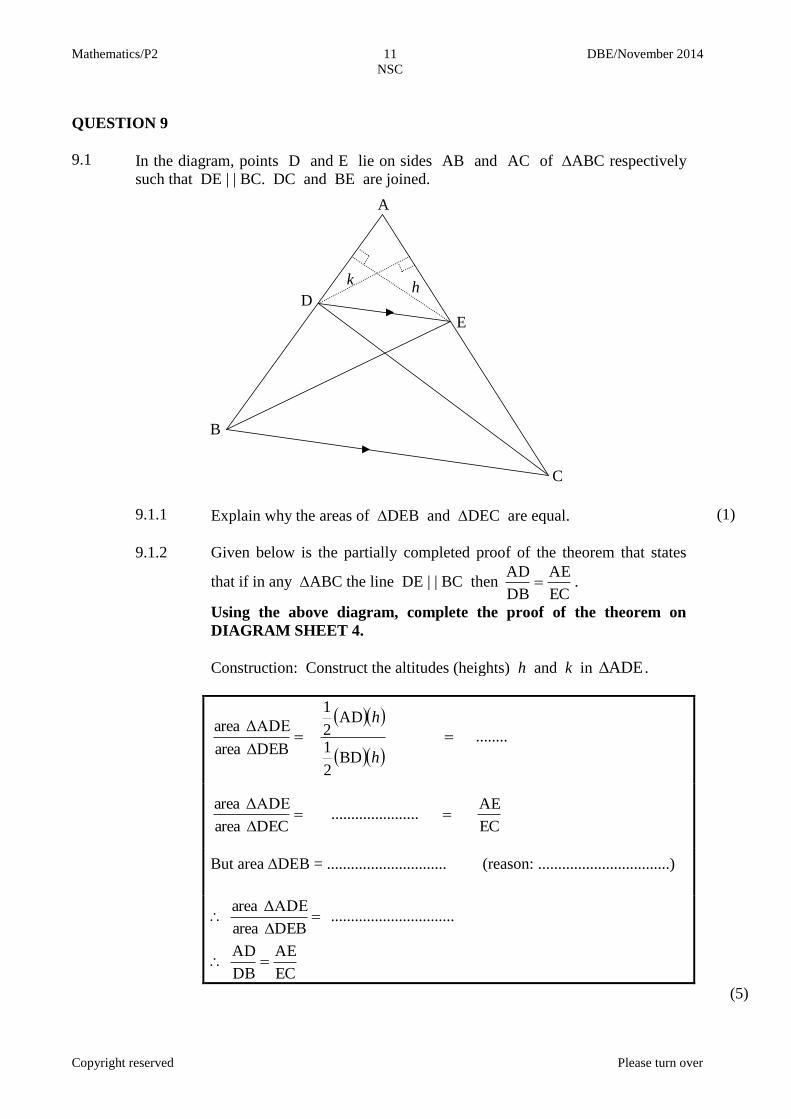
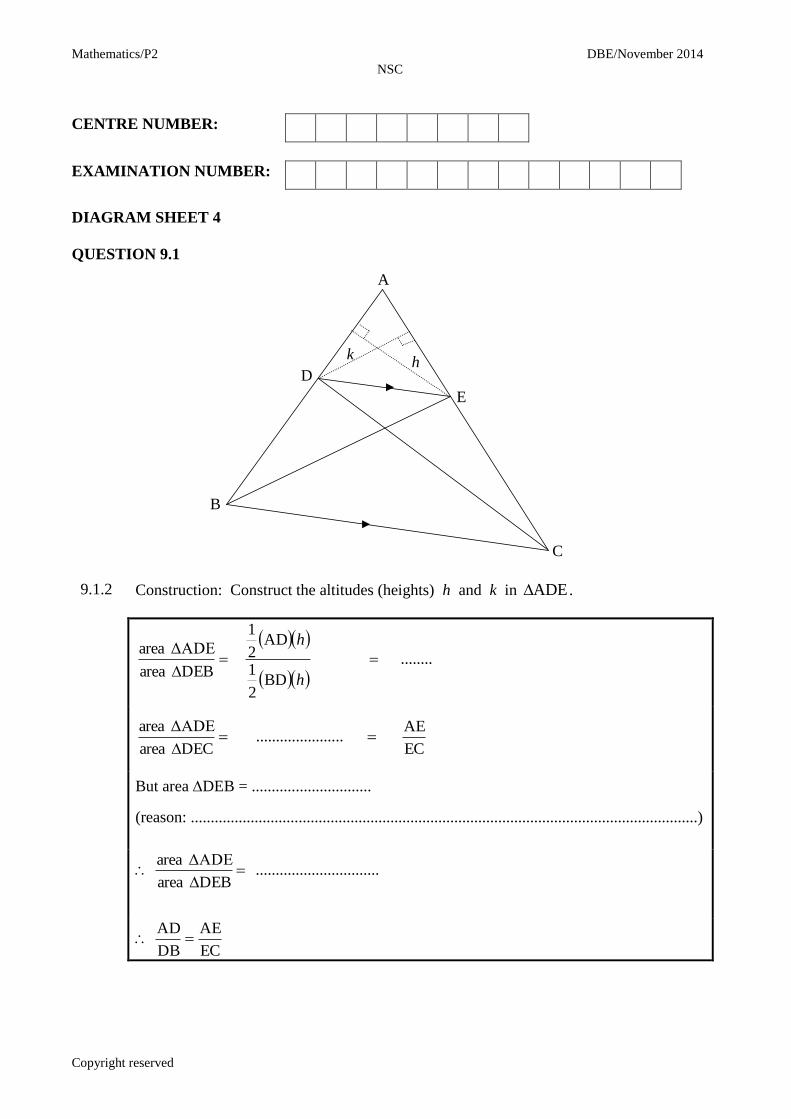
9.1 In the diagram, points D and E lie on sides AB and AC of ABC respectively
such that DE | | BC. DC and BE are joined.
9.1.1 Explain why the areas of DEB and DEC are equal. (1)
9.1.2 Given below is the partially completed proof of the theorem that states
that if in any ABC the line DE | | BC then EC
AE
DB
AD .
Using the above diagram, complete the proof of the theorem on
DIAGRAM SHEET 4.
Construction: Construct the altitudes (heights) h and k in ADE .
........
BD2
1
AD2
1
DEBarea
ΔADEarea
h
h
EC
AE......................
DECarea
ΔADEarea
But areaDEB = .............................. (reason: .................................)
DEBarea
ΔADEarea ...............................
EC
AE
DB
AD
(5)
A
B
C
D
E
h
1
k
1
Mathematics/P2 12 DBE/November 2014
NSC
Copyright reserved Please turn over
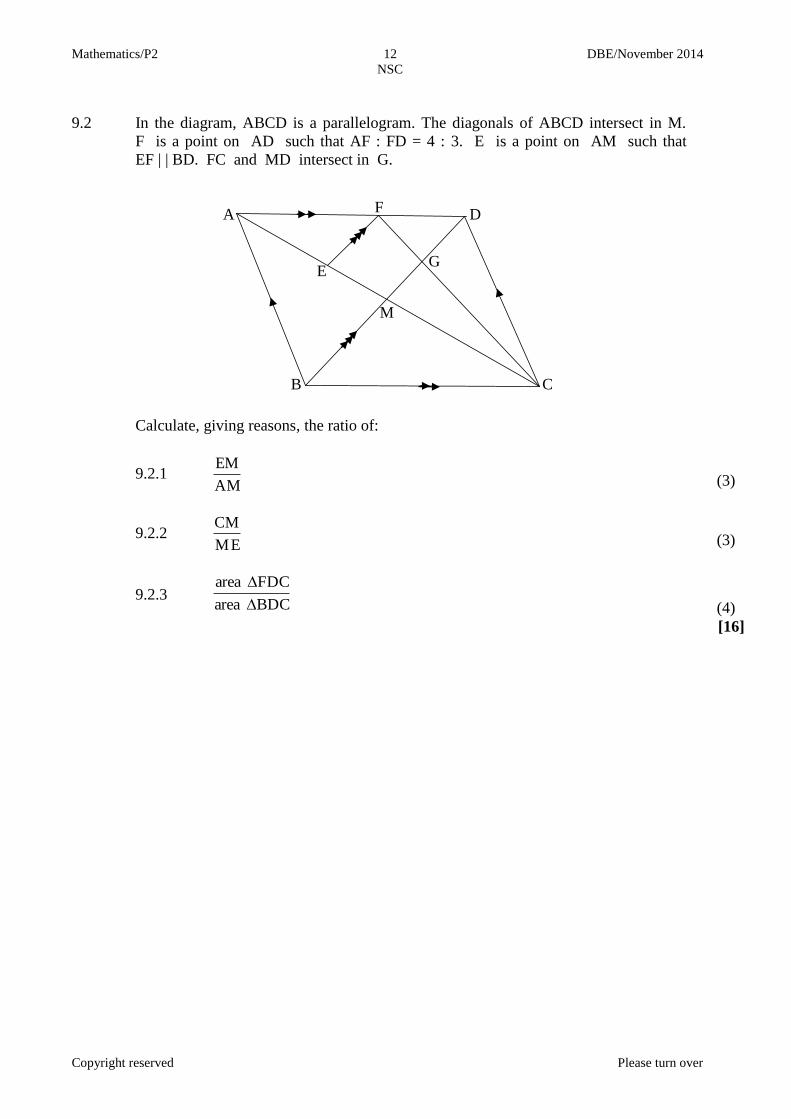
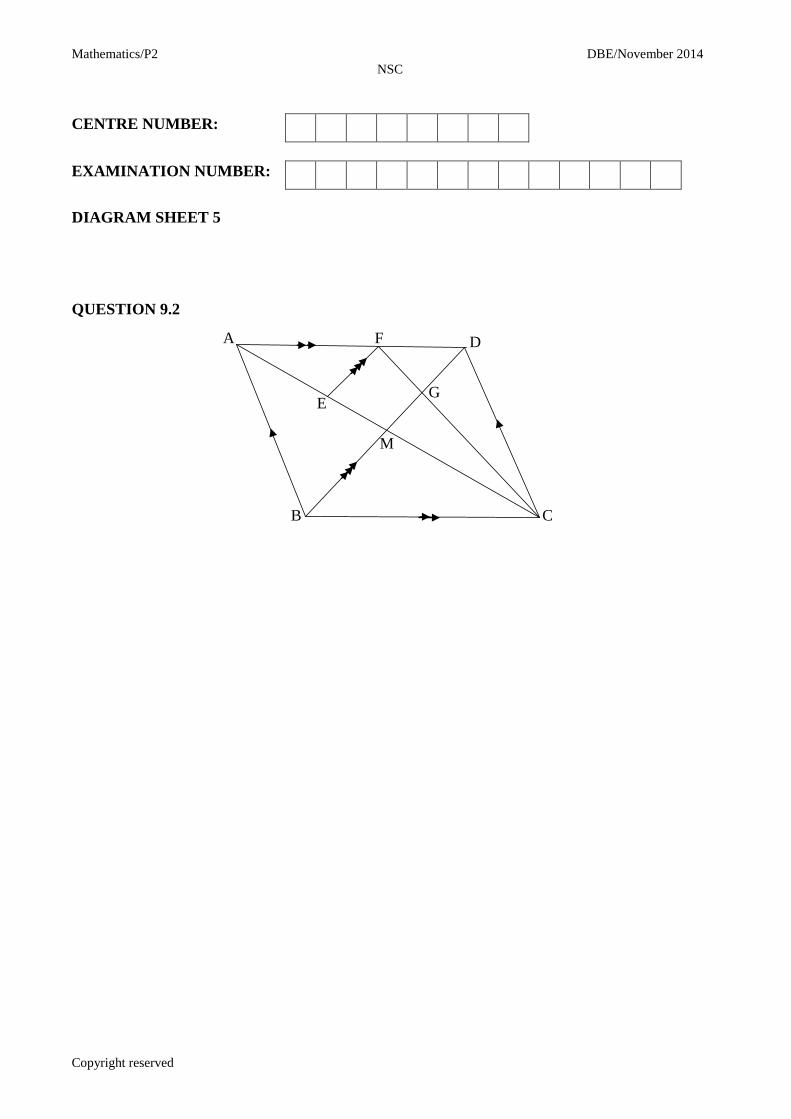
9.2 In the diagram, ABCD is a parallelogram. The diagonals of ABCD intersect in M.
F is a point on AD such that AF : FD = 4 : 3. E is a point on AM such that
EF | | BD. FC and MD intersect in G.
Calculate, giving reasons, the ratio of:
9.2.1
AM
EM
(3)
9.2.2
ME
CM
(3)
9.2.3
BDCarea
FDCarea
(4)
[16]
A
B C
D
M
E
F
G
Mathematics/P2 13 DBE/November 2014
NSC
Copyright reserved Please turn over
QUESTION 10
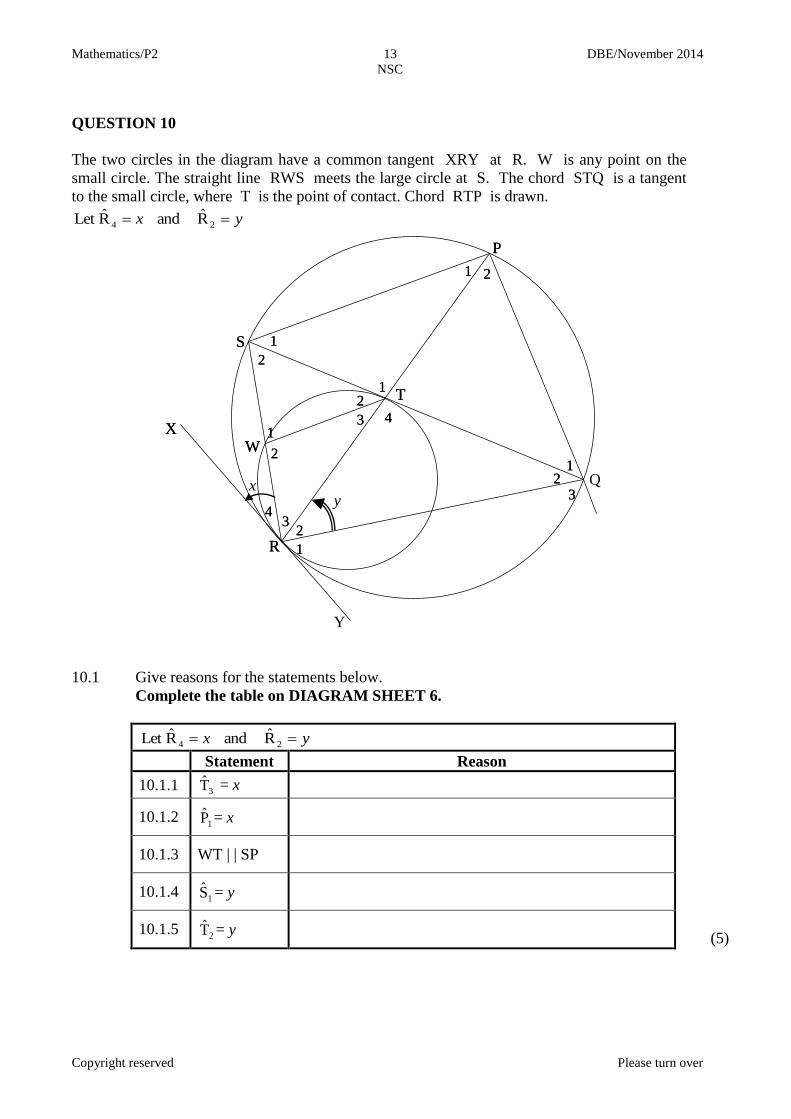
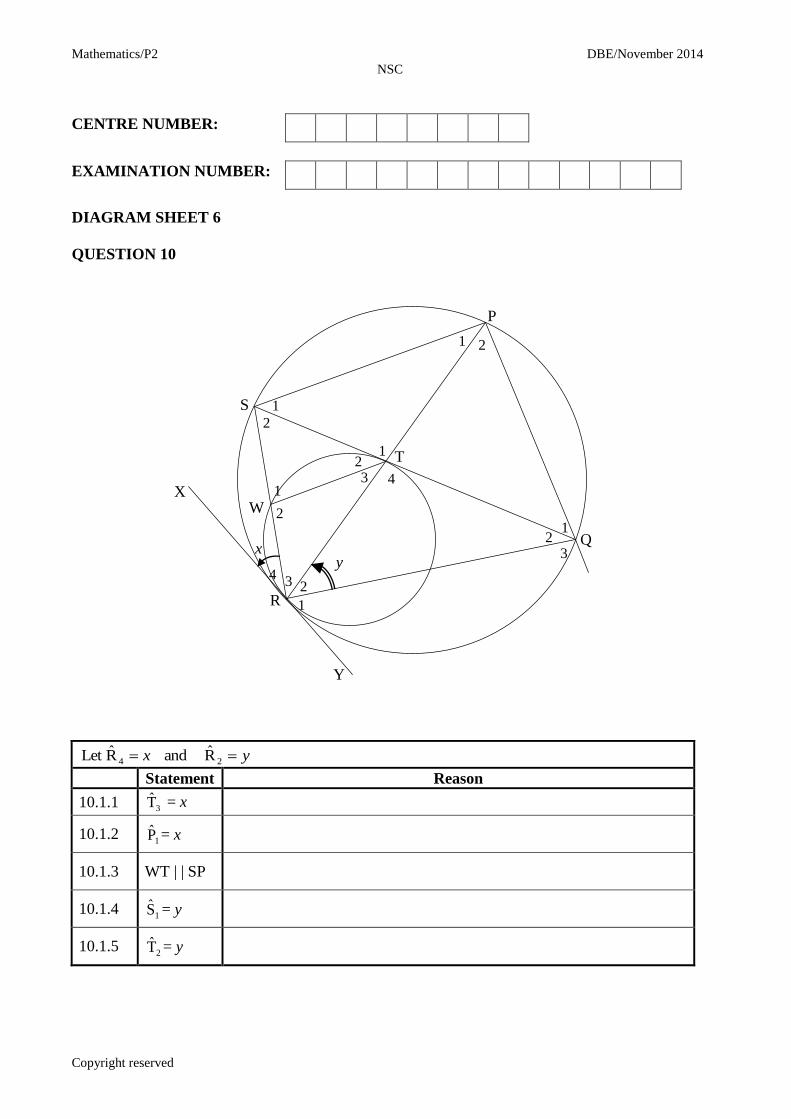
The two circles in the diagram have a common tangent XRY at R. W is any point on the
small circle. The straight line RWS meets the large circle at S. The chord STQ is a tangent
to the small circle, where T is the point of contact. Chord RTP is drawn.
yx 24 RandRLet
10.1 Give reasons for the statements below.
Complete the table on DIAGRAM SHEET 6.
yx 24 RandRLet
Statement Reason
10.1.1 3T = x
10.1.2 1P = x
10.1.3 WT | | SP
10.1.4 1S = y
10.1.5 2T = y
(5)
Y
X
R
W
S
P
Q
T
1
2 3
4
1
2 1
2 3
1 2
1
2
1 2
3 4 X
R
W
S
P
T
y
1
2 3
4
1
2 1
2 3
1 2
1
2
1 2
3 4
x
Mathematics/P2 14 DBE/November 2014
NSC
Copyright reserved
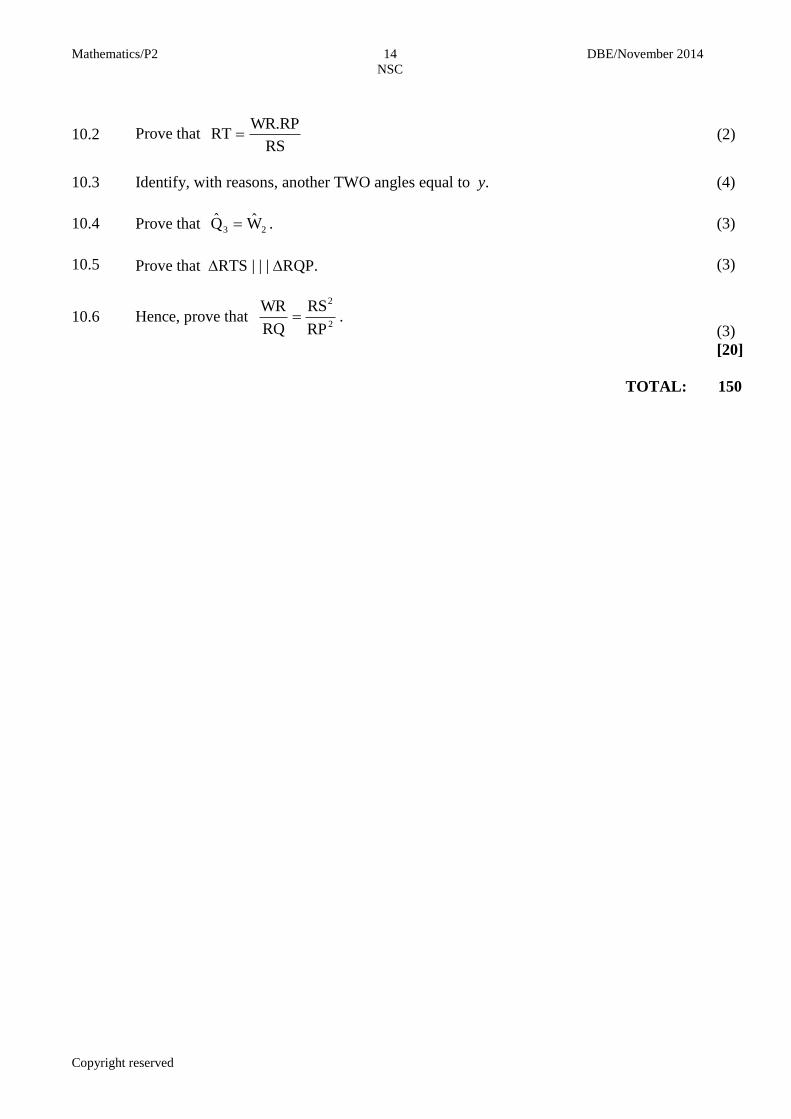
10.2 Prove that RS
WR.RPRT
(2)
10.3 Identify, with reasons, another TWO angles equal to y. (4)
10.4 Prove that 23 WQ . (3)
10.5 Prove that RTS | | | RQP. (3)
10.6 Hence, prove that 2
2
RP
RS
RQ
WR .
(3)
[20]
TOTAL: 150
Mathematics/P2 DBE/November 2014
NSC
Copyright reserved
CENTRE NUMBER:
EXAMINATION NUMBER:
DIAGRAM SHEET 1
QUESTION 2.2.1
Class Frequency Cumulative frequency
20 < x ≤ 30 1
30 < x ≤ 40 7
40 < x ≤ 50 13
50 < x ≤ 60 17
60 < x ≤ 70 9
70 < x ≤ 80 5
80 < x ≤ 90 2
90 < x ≤ 100 1
QUESTION 2.2.2
0
10
20
30
40
50
60
0 10 20 30 40 50 60 70 80 90 100
Cu
mu
lati
ve
freq
uen
cy
Speed (in km per hour)
Ogive
Mathematics/P2 DBE/November 2014
NSC
Copyright reserved
CENTRE NUMBER:
EXAMINATION NUMBER:
DIAGRAM SHEET 2
QUESTION 7.4
-90 -45 45 90 135 180 225 270
-2
-1
1
2
f
QUESTION 8.1
48°
x
2
1
1
y
0
A
O
B
C 2
Mathematics/P2 DBE/November 2014
NSC
Copyright reserved
CENTRE NUMBER:
EXAMINATION NUMBER:
DIAGRAM SHEET 3
QUESTION 8.2
QUESTION 8.3
8.3.1 Statement Reason
(a) 90CBA
(b) xAB
A
B
C D
O
F
30° 1
A
E
B
C
x
13
x + 7
Mathematics/P2 DBE/November 2014
NSC
Copyright reserved
CENTRE NUMBER:
EXAMINATION NUMBER:
DIAGRAM SHEET 4
QUESTION 9.1
9.1.2 Construction: Construct the altitudes (heights) h and k in ADE .
........
BD2
1
AD2
1
DEBarea
ΔADEarea
h
h
EC
AE......................
DECarea
ΔADEarea
But areaDEB = ..............................
(reason: ...............................................................................................................................)
DEBarea
ΔADEarea ...............................
EC
AE
DB
AD
A
B
C
D
E
h
1
k
1
Mathematics/P2 DBE/November 2014
NSC
Copyright reserved
CENTRE NUMBER:
EXAMINATION NUMBER:
DIAGRAM SHEET 5
QUESTION 9.2
A
B C
D
M
E
F
G
Mathematics/P2 DBE/November 2014
NSC
Copyright reserved
CENTRE NUMBER:
EXAMINATION NUMBER:
DIAGRAM SHEET 6
QUESTION 10
yx 24 RandRLet
Statement Reason
10.1.1 3T = x
10.1.2 1P = x
10.1.3 WT | | SP
10.1.4 1S = y
10.1.5 2T = y
Y
X
R
W
S
P
Q
T
y
1
2 3 4
1
2 1
2 3
1 2
1
2
1 2 3 4
x
Mathematics/P2 DBE/November 2014
NSC
Copyright reserved
INFORMATION SHEET
a
acbbx
2
42
)1( niPA )1( niPA niPA )1( niPA )1(
dnaTn )1( dnan
n )1(22
S
1 n
n arT 1
1
r
raS
n
n ; 1r
r
aS
1; 11 r
i
ixF
n11
i
ixP
n
11
h
xfhxfxf
h
)()(lim)('
0
2
12
2
12 )()( yyxxd M
2;
2
2121 yyxx
cmxy )( 11 xxmyy 12
12
xx
yym
tanm
222rbyax
In ABC: C
c
B
b
A
a
sinsinsin
Abccba cos.2222
CabABCarea sin.2
1
sin.coscos.sinsin sin.coscos.sinsin
sin.sincos.coscos sin.sincos.coscos
1cos2
sin21
sincos
2cos
2
2
22
cos.sin22sin
n
fxx
n
xxn
i
i2
1
2)(
Sn
AnAP
)()( P(A or B) = P(A) + P(B) – P(A and B)
bxay ˆ
2)(
)(
xx
yyxxb