Embed Size (px)
Citation preview
CLERNATIONAL REPORT
OF FINDINGS 2021

2 | CLER NATIONAL REPORT OF FINDINGS 2021
©2021 Accreditation Council for Graduate Medical Education
SUGGESTED CITATION:
Suggested citation: Koh NJ, Wagner R, Newton RC, Kuhn CM, Co JPT, Weiss KB; on behalf of the CLER Evaluation Committee and the CLER Program. CLER National Report of Findings 2021. Chicago, IL: Accreditation Council for Graduate Medical Education; 2021. doi: 10.35425/ACGME.0008
ISBN Digital: 978-1-945365-40-9
DEDICATION
The Accreditation Council for Graduate Medical Education thanks the designated institutional officials at its accredited Sponsoring Institutions, as well as the executive leaders of the participating hospitals, medical centers, and ambulatory care sites for graciously hosting this set of Clinical Learning Environment Review Site Visits. We appreciate the effort that went into arranging the visits and ensuring open access to residents, fellows, faculty members, and other staff. It was a privilege to spend time in your organizations, and we recognize your dedication to continually improving graduate medical education and patient care.

CLER NATIONAL REPORT OF FINDINGS 2021 | 3
FOREWORD ........................................................................................................................................................................................ 7
INTRODUCTION: CHARACTERIZING THE PRESENT AND INFORMING THE FUTURE ................ 9
OVERVIEW OF THE CLER PROGRAM ...............................................................................................................................13
METHODOLOGY .............................................................................................................................................................................. 17
OVERARCHING THEMES ......................................................................................................................................................... 27
CHALLENGES AND OPPORTUNITIES IN SELECTED CLER FOCUS AREAS .......................................... 35
DETAILED FINDINGS ....................................................................................................................................................................................... 43
TRENDS IN THE CLER FOCUS AREAS .......................................................................................................................................... 75
LESSONS LEARNED AND FUTURE DIRECTIONS ............................................................................................................. 95
APPENDICES ........................................................................................................................................................................................................... 98
TABLE OF CONTENTS

4 | CLER NATIONAL REPORT OF FINDINGS 2021
The Accreditation Council for Graduate Medical Education (ACGME) acknowledges the many individuals involved in the Clinical Learning Environment Review (CLER) Program and in developing this report, including the CLER Program staff who collectively arranged and conducted the site visits, collated and analyzed the data, and provided editorial input; the members of the CLER Evaluation Committee who reviewed the results and offered their insights as to the impact of the findings; and the reviewers who generously offered their time to read early drafts and provide feedback. The ACGME thanks them for their dedication and commitment to improving graduate medical education and patient care.
(Names in alphabetical order)
CLER EVALUATION COMMITTEE MEMBERS 2017 - 2020
Catherine M. Kuhn, MD, Current Co-Chair
John Patrick T. Co, MD, MPH, FAAP, Immediate Past Co-Chair
Kevin B. Weiss, MD, Co-Chair
Jenny J. Alexopulos, DO
Michael Apostolakos, MD
Vamsi Aribindi, MD
James P. Bagian, MD, PE
Lindsay Dale, MD
Rosemary Gibson, MSc
Linda A. Headrick, MD, MS, FACP
Robert Higgins, MD
Sherry C. Huang, MD
Marcia Hutchinson, MD
Lynne M. Kirk, MD, MACP
Anai N. Kothari, MD, MS
Tanya Lord, PhD, MPH
David Markenson, MD, MBA, FAAP, FACEP, FCCM, FACHE
David Mayer, MD
Lucie E. Mitchell, DO, MS
Douglas E. Paull, MD, MS, FACS, FCCP, CHSE, CPPS
Lakshmana Swamy, MD, MBA
Andrew M. Thomas, MD, MBA
Marjorie S. Wiggins, DNP, MBA, RN, FAAN, NEA-BC
Ronald Wyatt, MD, MHA, DMS (Hon)
CLER PROGRAM STAFF 2017 - 2020
Octavia Bailey
Mark R. Bixby, MD, FAAFP
Isabelle Bourgeois, MPA
Jennifer J. Buescher, MD, MSPH
Robert Casanova, MD, MHPE
Baretta R. Casey, MD, MPH, FAAFP
Marian D. Damewood, MD, FACOG
Kevin C. Dellsperger, MD, PhD
Robin Dibner, MD
David L. Dull, MD, MMM, FAAPL
Staci A. Fischer, MD, FACP, FIDSA
Patrick Guthrie
Paula Hensley, MPH
Acknowledgments

CLER NATIONAL REPORT OF FINDINGS 2021 | 5
Kristen Ward Hirsch
John A. Hopper, MD
Sharhabeel Jwayyed, MD, MS
Catherine Kallal, MD
Elizabeth Kimball, MA
Nancy J. Koh, PhD
Kathryn E. McGoldrick, MD, MAH, FCAI (Hon)
Clifton McReynolds, PhD
Terrie Mendelson, MD
Joshua Mirôn, MA
Robin C. Newton, MD, FACP
Morgan Passiment, MS
Douglas E. Paull, MD, MS, FACS, FCCP, CHSE, CPPS
Daniel Picard, MD
Kathy B. Porter, MD, MBA, FACOG
Dale Ray, MD, MMM
Laura Riordan, MS
Melissa Schori, MD, FACP, MBA
Tara Shedor
Stephen Smith, MD
Mike Strickland, MFA
Hongling Sun, PhD
Marie Trontell, MD
Paul Uhlig, MD, MPA
Robin Wagner, RN, MHSA
Elizabeth Wedemeyer, MD
Kevin B. Weiss, MD
Esther Woods
Martha S. Wright, MD, MEd
James R. Zaidan, MD, MBA
Jose Zayas, DO, FAAP
OTHER ACGME STAFF
Kara Etolen-Collins
Paul Foster Johnson, MFA
Laney McDougal, MS
Olivia Orndorff, MSLIS
Cassie Pritchard, MPP
REVIEWERS
Tejal Gandhi, MD, MPH
Thomas Hansen, MD, MBA, FAAFP
Thomas J. Nasca, MD, MACP
Karen Nichols, DO
Steven H. Rose, MD
Stephen Weber, MD
Claudia J. Wyatt-Johnson, MA

6 | CLER NATIONAL REPORT OF FINDINGS 2021
CLER in the Time of the COVID-19 Pandemic
The novel coronavirus (COVID-19) brought a shock to international health care systems throughout the world.
Among those affected were the US health care systems that serve as clinical learning environments (CLEs) for
Sponsoring Institutions accredited by the Accreditation Council for Graduate Medical Education (ACGME) and
their residency and fellowship programs. Of note, the Clinical Learning Environment Review (CLER) Program
site visits that form the basis of this report were conducted between June 2017 and February 2020—before the
pandemic.
In considering how to frame this report, the CLER Evaluation Committee noted the findings rest on their own
merit, independent of the complexities introduced by the pandemic. Therefore, the reader is asked to view this
report through two different lenses. First, consider the findings as a reflection of the learning environments
for residents and fellows pre-pandemic. Second, consider how these findings might have been affected by
the unique and often extremely challenging changes that occurred as the pandemic reached and sometimes
overwhelmed the CLEs and the communities they serve. When viewed through either lens, these findings
present new information that suggests both challenges and opportunities for graduate medical education
(GME), the health care systems that host GME, and the patients they serve.
CLER NATIONAL REPORT OF FINDINGS 2021 | FOREWARD | 7
The past year has provided the graduate medical education (GME) community with a clear message as to
the environment’s impact on the experiences of residents and fellows. The COVID-19 pandemic has rapidly
shaped and reshaped the way in which patient care is delivered. The ACGME’s CLER Program provides
a continual reminder of how our nation’s CLEs can influence physicians in training as they develop in their
chosen specialties and subspecialties. This CLER National Report of Findings provides a unique view of
the hospitals, medical centers, ambulatory care sites, and other clinical settings that serve as CLEs—drawing
upon the information gleaned from a cycle of site visits that concluded just as the pandemic entered the
United States. It provides an excellent cross-sectional evaluation of how our CLEs are shaping the learning
experience of resident and fellows in the six CLER Focus Areas of interest to the ACGME Board of Directors.
One of the highlights of this report is the new insight
it provides on well-being. For the ACGME Board of
Directors, clinician well-being has been one of our top
priorities over the past few years. This report is the first
comprehensive assessment of the ways in which health
care organizations serving as CLEs are addressing this
important issue.
The report also contains other key findings. Most notably,
when compared with information from the first National Report in 2016, it reveals steady improvement in the
ways CLEs are engaging residents and fellows in efforts
to address patient safety. It has been just over 20 years
since the release of the Institute of Medicine’s report,
“To Err Is Human.”1 While this National Report continues
to show an ongoing gap in achieving full involvement of
GME in their CLEs’ efforts to address patient safety, the
trends are very encouraging.
Finally, one of the exciting aspects of this report is that
it occurred during the period in which the ACGME and
the American Osteopathic Association (AOA) were
transitioning to a single GME accreditation system in the
United States. Therefore, this report is the first National Report to include a number of CLEs from Sponsoring
Institutions that in the past were part of the AOA
GME system and are new to ACGME accreditation. It is gratifying to note that in embracing both medical
traditions, the ACGME has been able to rapidly extend a uniform benefit of this formative learning to the
entire GME community.
Foreword Karen Nichols, DO, Chair, ACGME Board of Directors
One of the exciting aspects of this report is
that it occurred during the period in which
the ACGME and the American Osteopathic
Association (AOA) were transitioning to
a single GME accreditation system in the
United States. Therefore, this report is the
first National Report to include a number of
CLEs from Sponsoring Institutions that in
the past were part of the AOA GME system
and are new to ACGME accreditation. It is
gratifying to note that in embracing both
medical traditions, the ACGME has been able
to rapidly extend a uniform benefit of this
formative learning to the entire
GME community.

8 | FOREWARD | CLER NATIONAL REPORT OF FINDINGS 2021
The CLER Program continues to help the ACGME Board of Directors, the GME and CLE community, and
the public understand how to improve the important relationship between the environment and its impact on
learning. We look forward to seeing the positive actions this report will catalyze and to the new information
from the CLER COVID protocol currently underway.
REFERENCES1. Linda T. Kohn, Janet M. Corrigan, and Molla S. Donaldson, eds. 2000. To Err Is Human: Building A Safer
Health System. Washington, DC: The National Academies Press. https://doi.org/10.17226/9728.

CLER NATIONAL REPORT OF FINDINGS 2021 | I NTRODUCTION | 9
It has been five years since the release of the first CLER National Report of Findings. That first report
focused on the larger Sponsoring Institutions, encompassing data from 297 clinical sites. In contrast,
this National Report presents findings from 566 CLEs associated with both large and small ACGME
Sponsoring Institutions. It provides a number of insights as to how hospitals, medical centers, ambulatory
care sites, and other clinical settings serve as teaching environments for the approximately 145,000 resident
and fellow physicians participating in more than 12,000 ACGME-accredited programs. This report has
several unique features that will inform the ACGME, the GME community, and the public about these
important environments where learning occurs in the context of providing patient care. First, both larger
and smaller Sponsoring Institutions concurrently participated in CLER site visits in a single time period for
the first time. Second, the report presents trends across several of the CLER Focus Areas for a subset of
approximately 240 CLEs that have completed three CLER visits. Third, the report includes findings from
institutions that achieved ACGME accreditation through the transition to a single GME accreditation system
and had progressed past the Initial Accreditation period. Lastly, the report reflects findings of the newest
CLER Focus Area, Well-Being.
The findings demonstrate that CLEs exhibit some common features with regard to the Focus Areas,
irrespective of CLE bed size (i.e., acute bed count), geographic location, or the type of ownership of the
clinical site. The findings also suggest there are some notable differences seen in the CLER Focus Areas
based on CLE characteristics. For example, there were significant differences in the percentage of residents
and fellows who reported (1) participating in a quality improvement project linked to one or more of the
clinical site’s quality improvement goals, (2) following a standardized process for hand-offs between shifts
that included a standardized written template for communication, and (3) that based upon their experience
at the clinical site, faculty members often or always disclose whether or not they have potential conflicts of
interests during each of their clinical rotations. Over time, the CLER Program will seek to both understand
these differences and identify successful approaches, albeit potentially different approaches, to optimizing
the various CLEs across the range of ACGME-accredited Sponsoring Institutions.
As noted earlier, this report provides a first look at trends across three time periods for a subset of
Sponsoring Institutions whose principal CLE participated in three successive CLER visits. The size and
scope of this analysis is aided by a small set of questions that remained the same in all three cycles
of CLER visits. Some interesting observations emerged from this view. Specifically, there has been
demonstrable improvement in GME involvement in addressing patient safety. Patient safety has been a
major focus of the CLER visits and the attention to this important and critical area of health care is reflected
in the signs of improvement. With regard to structural changes, overall, CLEs appear to have dramatically
increased their attention to resident and fellow access to and use of patient safety event reporting systems.
For example, in Cycle 1, approximately one third of the CLEs indicated they tracked the number of patient
Introduction: Characterizing the Present and Informing the Future Thomas J. Nasca, MD, MACP, President and Chief Executive Officer, ACGME and Kevin B. Weiss, MD, Chief Sponsoring Institutions and Clinical Learning Environment Officer, ACGME
10 | I NTRODUCTION | CLER NATIONAL REPORT OF FINDINGS 2021
safety event reports submitted by residents and fellows; in Cycle 3, this had increased to 80.0%. Similarly,
there has been a nearly 20 percent relative increase in the percentage of residents and fellows who reported
into their CLE’s patient safety event reporting system.
This report also highlights areas in need of additional attention—specifically in engaging residents and fellows
in patient safety event analysis, which has not improved across the three cycles. The lessons learned from
the CLER Program’s Pursuing Excellence in Clinical Learning Environments (Pursuing Excellence) Pathway
Leaders Patient Safety Collaborative,1 and the Program Directors’ Patient Safety and Quality Educators
Network (a collaborative effort of the ACGME, Project ECHO, and the Organization of Program Director
Associations) provide an evidence base and new approaches to addressing this challenging and important
finding.
The findings related to health care disparities, while more modest, indicate for the first time that CLEs are
starting to recognize the importance of this issue. During the site visits, more CEOs and their executive
teams were starting to have open discussions on the need to examine risks for health care disparities within
the populations served in the CLE. It is important to remember these findings reflect conversations held with
the CLE executive leaders prior to the start of the COVID-19 pandemic. It will be informative to see how the
commitment to and success in elimination of disparities may improve in the next cycle of visits given the high
degree of visibility of health care disparities revealed by the pandemic.
For several of the CLER Focus Areas, the report presents trends that represent no change, and in some
cases trends in an undesirable direction. These findings will be the source of important reflection and possible
intervention as they are further studied.
The report also identifies some new challenges. In examining the approximately 50% of residents and fellows
interviewed who reported encountering a physician (attending physician or consultant) who made them feel
uncomfortable when requesting assistance, the report notes this was more prevalent among the residents
who were earlier in their post-graduate education and training. These findings indicate suboptimal educational
experiences, inadequate implementation of appropriate supervision and mentoring, and challenges to the
culture of safety and patient care.
Along similar lines, one third of residents and fellows interviewed reported that they would “power through” to
hand-off even if they were impaired by fatigue, revealing this is also more common among those in their early
years of post-graduate education and training.
One of the key areas highlighted in this report is the new CLER Focus Area of Well-Being. Well-being is one
of the four elements of the Quadruple Aim and is integral to the ACGME’s mission.2 In 2017, the ACGME
joined with the National Academy of Medicine (NAM) and other members of the health care and medical
education community in ongoing efforts to address clinician well-being and resilience—specifically the
challenges posed by the rapid changes both in health care organizations and in patient needs.3 This report
presents the first national data that characterizes many aspects of well-being within the nation’s CLEs. In
gathering the data, the CLER Field Representatives focused on four priority areas as delineated in the CLER Pathways to Excellence, Version 2.0:4 work/life balance; fatigue; burnout; and support of those at risk of or
demonstrating self-harm.

CLER NATIONAL REPORT OF FINDINGS 2021 | I NTRODUCTION | 11
While the report reveals a number of
interesting findings on well-being, two issues
are particularly noteworthy. The first is not
formally reflected in the findings, rather it
relates to observations of the CLER Field
Representatives. As part of the site visit
protocol, the CLER team asked to meet
with the individuals responsible for leading
the CLE’s efforts to address well-being. The
Field Representatives informally noted that
a variety of individuals with a range of roles
and responsibilities attended these meetings.
They noted the well-being representatives
could often speak to isolated well-being
activities for individuals or professions.
However, absent from these conversations
was a cohesive effort on the part of the CLE
to implement a common strategy to address
the well-being of the clinical care team. The
other issue relates to the finding noting
the types of interventions being planned or
implemented in the CLEs. The finding noted
examples of new efforts to identify individuals at risk, especially efforts to identify residents and fellows, and efforts
to build resilience in the clinical care team. There were few examples of CLEs that were able to describe a strategy
or substantive efforts to address the system-based factors that were creating challenges to well-being.
As with just about everyone else during 2020-2021, the COVID-19 pandemic has caused the ACGME CLER
team to reflect on opportunities to better understand the impact of this catastrophic societal challenge. In
response, the CLER Program has launched a specially designed site visit to understand the pandemic’s impact on
the CLEs.5
Looking forward, the CLER Program is seeking to use the knowledge from this and prior reports to inform a
metamorphosis and transformation of thinking in how to best assess, understand, and inspire the CLEs of
ACGME-accredited Sponsoring Institutions. This will include efforts to advance the CLER site visit program’s
configuration to build on the experiences of the CLER COVID protocol, possibly retaining some of the new
features, such as a sampling approach to selecting Sponsoring Institutions and CLEs visited, maintaining the new
model of additional advanced notification for scheduling, incorporating new surveys for executive leadership, and
possibly integrating some component of remote interviews. Any changes to the site visit protocol will still need to
retain in-person visits to facilitate walking rounds. The impromptu conversations that happen on the walking rounds
of the floors and service areas of the CLEs provide essential perspectives and insights from other members of the
clinical care team (e.g., nurses, pharmacists, social workers, respiratory technicians) and additional members of the
GME community who do not participate in the formal group meetings.
One of the key areas highlighted in this report is the
new CLER Focus Area of Well-Being... In 2017, the
ACGME joined with the National Academy of Medicine
(NAM) and other members of the health care and
medical education community in ongoing efforts to
address clinician well-being and resilience—specifically
the challenges posed by the rapid changes both
in health care organizations and in patient needs.3
This report presents the first national data that
characterizes many aspects of well-being within the
nation’s CLEs.
12 | I NTRODUCTION | CLER NATIONAL REPORT OF FINDINGS 2021
As modeled in the Pursuing Excellence initiative, the CLER Program will continue to seek opportunities to
use the information gained from this report and future visits to provide GME and CLE leadership with the
knowledge and tools to advance improvements in their CLEs. The aggregate information in this and past
CLER National Reports will also serve as an evidence base to inform the upcoming major revision of the
ACGME Institutional Requirements.
Of final note, the CLER Program will also undertake efforts to transform its body of work to increasingly focus
on an outcomes-oriented perspective of CLE performance. There are currently a number of efforts nationally
to assess the quality of care provided in the many types of CLEs that host GME. NAM recognizes attention
to health care outcomes to be a major priority if the US to achieve the goal of better health at lower cost.6
Through the CLER Program, the ACGME will explore the resources available to better align and integrate
GME performance with this national direction of measuring health care quality outcomes. While this effort is in
its early stages, over time, this will be an essential tool to aid the ACGME’s ability to provide the best possible
formative feedback to the GME community and CLEs to optimize learning and patient care in the framework of
the Quadruple Aim.
REFERENCES1. Passiment, Morgan, Robin Wagner, and Kevin B. Weiss, for the Pursuing Excellence in Clinical Learning Environments:
Pathway Leaders Patient Safety Collaborative. 2020. “ACGME Summary Report: The Pursuing Excellence Pathway Leaders
Patient Safety Collaborative.” Published September 30, 2020. doi:10.35425/ACGME.0006.
2. Bodenheimer, Thomas, and Christine Sinsky. 2014. “From Triple to Quadruple Aim: Care of the Patient Requires Care of the
Provider.” The Annals of Family Medicine 12 (6): 573–76. doi.org/10.1370/afm.1713.
3. https://nam.edu/initiatives/clinician-resilience-and-well-being/
4. CLER Evaluation Committee. 2019. “CLER Pathways to Excellence: Expectations for an Optimal Clinical Learning
Environment to Achieve Safe and High-Quality Patient Care, Version 2.0.” Chicago, IL: Accreditation Council for Graduate
Medical Education. doi:10.35425/ACGME.0003.
5. https://www.acgme.org/Newsroom/Blog/Details/ArticleID/10707/ACGME-e-Communication-November-9-2020/
6. Whicher, Danielle, Mahnoor Ahmed, Sameer Siddiqi, Inez Adams, Claudia Grossmann, and Kristin Carman. 2020. “Health Data
Sharing to Support Better Outcomes: Building a Foundation of Stakeholder Trust.” NAM Special Publication. Washington, DC:
National Academy of Medicine.

CLER NATIONAL REPORT OF FINDINGS 2021 | OVERVIEW | 13
INTRODUCTIONThe ACGME established the CLER Program in 20121 to provide GME leaders and executive leaders of
hospitals, medical centers, ambulatory care sites, and other clinical settings with formative feedback aimed
at improving patient care while optimizing learning in the six cross-cutting CLER Focus Areas:2, 3 patient
safety; health care quality (including health care disparities); care transitions; supervision; professionalism;
and the newest Focus Area of well-being.a
By conducting periodic site visits and providing formative feedback to clinical sites that serve as CLEs for
resident and fellow physicians, the CLER Program aims to stimulate conversations and motivate CLEs to
build upon their strengths and internally address opportunities for improvement. The CLER Program refers
to CLEs as living and breathing entities—the embodiment of all of the individuals within these settings that
influence and imprint upon these early learners. The CLER Program’s formative approach recognizes that,
although there are shared elements, each site that serves as
a CLE for resident and fellow physicians has a unique set of
internal and external factors that influence the development
and implementation of that CLE’s strategic goals aimed at
improving patient care.
The CLER Program is separate and distinct from nearly all
accreditation activities. Two essential elements connect the
CLER Program with the rest of the accreditation process:
(1) each Sponsoring Institution contacted for a CLER visit
is required to complete the visit; and (2) the chief executive
officer and the leader of GME (specifically the designated
institutional official) of the clinical site must attend the
opening and closing sessions of the visit.
Of note, in the first cycle of CLER visits, the CLER Program was in the process of building its infrastructure.
As such, it began with visits to CLEs of the larger Sponsoring Institutions—those with three or more core
residency programs. The second cycle started with repeat visits to the CLEs of the larger Sponsoring
Institutions, and about midway through, began visits to the smaller Sponsoring Institutions—those with two
or fewer core residency programs. This asynchrony in the second cycle resulted in two separate National Reports of Findings.4,5 The third cycle of visits was the first time both larger and smaller Sponsoring
Institutions were included from start to finish, allowing for this single report that reflects a larger cohort of
participants and a larger denominator of responses to the CLER Field Representatives’ queries.
Overview of the CLER Program
By conducting periodic site visits and
providing formative feedback to clinical
sites that serve as CLEs for resident and
fellow physicians, the CLER Program aims to
stimulate conversations and motivate CLEs
to build upon their strengths and internally
address opportunities for improvement.
Robin Wagner, RN, MHSA; Robin C. Newton, MD, FACP; Nancy J. Koh, PhD; and Kevin B. Weiss, MD on behalf of the CLER Program
a This new Focus Area, introduced in the CLER Pathways to Excellence Version 1.1, is an expansion of the Focus Area originally titled “duty
hours, fatigue management, and mitigation,” and has evolved to address four interrelated topics: work/life balance; fatigue; burnout; and
support of those at risk of or demonstrating self-harm.

14 | OVERVIEW | CLER NATIONAL REPORT OF FINDINGS 2021
PROTOCOL ADAPTATIONS FOR THE THIRD CYCLE OF VISITSThe CLER Field Representatives in this cycle used Protocol 3.0, which was similar but not identical to the
protocol used in the first and second cycles of visits.5,6,7 When appropriate, this protocol maintained the
adaptations from Protocol 2.0 needed to address smaller Sponsoring Institutions, including:
• For the small proportion of Sponsoring Institutions where the visit was exclusive to the ambulatory care
setting, the protocol questions and scenarios were modified to fit the setting while keeping the essence
of the questions to allow for comparability across settings.
• In Sponsoring Institutions with one residency or fellowship program, if the program director was also
the designated institutional official, the program director attended the executive leadership meetings
and assigned a designee (often an associate program director) for the program director interview
session
• In Sponsoring Institutions with one or two program directors, while the interview sessions for the
program directors were separate from the sessions with faculty members, the results were combined in
the verbal and written reports to maintain anonymity.
In Protocol 3.0, many of the questions remained consistent. However, in their commitment to a model of
continual quality improvement, CLER Program staff members also modified some questions and added new
questions to explore important topics in greater depth. For a more detailed description of the protocol, please
see the Methodology section of this report (pp. 17-26).
THE CLER EVALUATION COMMITTEEThe CLER Evaluation Committee provides oversight and guidance to all aspects of program development.
The committee is composed of members with expertise in patient safety and health care quality improvement,
as well as GME and executive leadership of hospitals and medical centers (e.g., chief medical officer, chief
nursing officer). The committee also includes postgraduate physician representation and public members.
For this report, the committee reviewed the data resulting from the site visits and worked with CLER Program
staff members to identify overarching themes and prioritize key findings—presented here in the form of
challenges and opportunities. The committee members bring an external voice in response to the findings.
Their views and commentary on the significance of the key findings and overarching themes are reflected in
the discussion sections of this report.
REPORTING THE FINDINGS AND ORGANIZATION OF THE REPORTSimilar to prior reports of findings, this report presents several different perspectives, including overarching
themes, highlights of the challenges and opportunities in the CLER Focus Areas of patient safety and well-
being, detailed findings, and a section on trends.
Protocol 3.0 was also the first to include a subprotocol—exploring the operative and procedural areas of a
subset of the larger Sponsoring Institutions. Findings from the subprotocol have been published separately
and are available on the ACGME website.

CLER NATIONAL REPORT OF FINDINGS 2021 | OVERVIEW | 15
REFERENCES1. Weiss, Kevin B., James P. Bagian, and Thomas J. Nasca. 2013. “The Clinical Learning Environment: The Foundation of Graduate
Medical Education.” JAMA 309 (16): 1687–88. doi.org/10.1001/jama.2013.1931.
2. CLER Evaluation Committee. 2017. “CLER Pathways to Excellence: Expectations for an Optimal Clinical Learning Environment to
Achieve Safe and High Quality Patient Care, Version 1.1.” Chicago, IL: Accreditation Council for Graduation Medical Education.
3. CLER Evaluation Committee. 2019. “CLER Pathways to Excellence: Expectations for an Optimal Clinical Learning Environment
to Achieve Safe and High-Quality Patient Care, Version 2.0.” Chicago, IL: Accreditation Council for Graduate Medical Education.
doi:10.35425/ACGME.0003.
4. Koh, Nancy J., Robin Wagner, Robin C. Newton, Baretta R. Casey, Hongling Sun, and Kevin B. Weiss, on behalf of the CLER
Program. 2018. “Detailed Findings from the CLER National Report of Findings 2018.” Journal of Graduate Medical Education 10
(4s): 49–68. doi.org/10.4300/1949-8349.8.2s1.35.
5. The CLER Evaluation Committee and the CLER Program. 2019. “CLER National Report of Findings 2019: Initial Visits to
Sponsoring Institutions With 2 or Fewer Core Residency Programs.” Chicago, IL: Accreditation Council for Graduate Medical
Education. doi:10.35425/ACGME.0001.
6. Koh, Nancy J., Robin Wagner, and Kevin B. Weiss, on behalf of the CLER Program. 2016. “The Methodology for the CLER
National Report of Findings 2016.” Journal of Graduate Medical Education 8 (2s1): 15–19. doi.org/10.4300/1949-
8349.8.2s1.15.
7. Koh, Nancy J., Robin Wagner, Hongling Sun, Kevin B. Weiss, on behalf of the CLER Program. 2018. “The Methodology for
the CLER National Report of Findings 2018.” Journal of Graduate Medical Education 10 (4s): 13–18. doi.org/10.4300/1949-
349.8.2s1.15.
CLER PROGRAM
Octavia Bailey; Mark R. Bixby, MD, FAAFP; Isabelle Bourgeois, MPA; Jennifer J. Buescher, MD, MSPH; Robert Casanova, MD,
MHPE; Baretta R. Casey, MD, MPH, FAAFP; Marian D. Damewood, MD, FACOG; Kevin C. Dellsperger, MD, PhD; Robin Dibner,
MD; David L. Dull, MD, MMM, FAAPL; Staci A. Fischer, MD, FACP, FIDSA; Patrick Guthrie; Paula Hensley, MPH; Kristen Ward
Hirsch; John A. Hopper, MD; Sharhabeel Jwayyed, MD, MS; Catherine Kallal, MD; Elizabeth Kimball, MA; Nancy J. Koh, PhD;
Kathryn E. McGoldrick, MD, MAH, FCAI (Hon); Clifton McReynolds, PhD; Terrie Mendelson, MD; Joshua Mirôn, MA; Robin C.
Newton, MD, FACP; Morgan Passiment, MS; Douglas E. Paull, MD, MS, FACS, FCCP, CHSE, CPPS; Daniel Picard, MD; Kathy
B. Porter, MD, MBA, FACOG; Dale Ray, MD, MMM; Laura Riordan, MS; Melissa Schori, MD, FACP, MBA; Tara Shedor; Stephen
Smith, M; Mike Strickland, MFA; Hongling Sun, PhD; Marie Trontell, MD; Paul Uhlig, MD, MPA; Robin Wagner, RN, MHSA; Elizabeth
Wedemeyer, MD; Kevin B. Weiss, MD; Esther Woods; Martha S. Wright, MD, Med; James R. Zaidan, MD, MBA; Jose Zayas, DO,
FAAP

16 | OVERVIEW | CLER NATIONAL REPORT OF FINDINGS 2021

CLER NATIONAL REPORT OF FINDINGS 2021 | METHODOLOGY | 17
INTRODUCTIONThis report details findings of the third set of CLER site visits to 566 ACGME-accredited Sponsoring
Institutions conducted by the CLER Program from June 20, 2017 to February 19, 2020.a The aggregated
findings in this report reflect a mixed methods approach (i.e., both quantitative and qualitative information
gathering and analysis), which was used by the CLER Program to form a comprehensive base of evidence on
how the nation’s CLEs engage residents and fellows in the CLER Focus Areas.1
In addition to the findings from the third set of CLER visits, this report includes a look at changes on a selected
set of measures in each of the CLER Focus Areas (i.e., three- and two-point analysis). This analysis highlights
both progress and challenges in CLEs over time. These findings can enhance and extend understandings
of the complex and dynamic nature of CLEs and help inform conversations on how to continually improve
physician education and training to ensure high-quality patient care within these learning environments.
SELECTION OF CLINICAL LEARNING ENVIRONMENTS
n 2017, there were 766 ACGME-accredited Sponsoring Institutions. Within these institutions were nearly
1,800 major participating sites, which are the hospitals, medical centers, ambulatory care sites, and other
clinical settings where residents and fellows learn and train. This report contains findings from 566 CLEs that
are affiliated with 566 Sponsoring Institutions that collectively oversaw 9,724 ACGME-accredited residency
and fellowship programs (93.7% of all ACGME-accredited programs) and 105,398 residents and fellows
(92.7% of all residents and fellows in ACGME-accredited programs).b Appendix A provides additional
information on the general characteristics of these Sponsoring Institutions (e.g., type of Sponsoring Institution,
number of programs) compared to all ACGME-accredited Sponsoring Institutions.
For Sponsoring Institutions with two or more clinical sites that served as participating sites, the CLER Program
visited one site due to resource limitations. This selection was based on two factors: (1) which CLE served
the largest possible number of programs for that Sponsoring Institution; and (2) whether that CLE had the
availability of both the DIO and the CEO for the opening and exit interviews.
For the majority of the Sponsoring Institutions, the CLER site visit occurred at the hospital or medical center
that served as the major participating clinical site for the Sponsoring Institution. At many of these sites, the
CLER Field Representatives spent time in both inpatient and affiliated ambulatory care practices. For a small
Methodology Nancy J. Koh, PhD; Robin Wagner, RN, MHSA; Robin C. Newton, MD, FACP; Hongling Sun, PhD; Clifton McReynolds, PhD; and Kevin B. Weiss, MD, on behalf of the CLER Program
a The findings from visits to the smallest sites of Sponsoring Institutions (i.e., preventive medicine programs and single fellowship programs)
are omitted from this report. Due to the COVID-19 pandemic, these sites did not receive a visit in the third set of CLER site visits. b Source: The ACGME annual data report. The ACGME annual data reports contains the most recent data on the programs, institutions, and
physicians in graduate medical education as reported by all medical residency Sponsoring Institutions and ACGME-accredited programs.

18 | METHODOLOGY | CLER NATIONAL REPORT OF FINDINGS 2021
proportion of the Sponsoring Institutions, the site visit was conducted exclusively in the ambulatory care
setting, including teaching health centers administered by the Health Resources and Services Administration.
Additionally, for a small number of Sponsoring Institutions, the site visit was exclusive to an ambulatory care
site if the major participating site in an inpatient setting had been visited for a CLER site visit for a different
Sponsoring Institution.
CLER SITE VISIT PROTOCOL
The CLER site visit protocol included a structured schedule of events for each visit (Figure 1). In general,
the CLER Program designed its site visit protocol to be the same for all CLER site visits regardless of the
number of core residency programs at a Sponsoring Institution. In recognizing that the visits to the smaller
Sponsoring Institutions involved spending time in both inpatient and affiliated ambulatory care practices or
solely in an ambulatory care setting, the CLER Program modified the protocol and site visit process as needed
to accommodate these conditions and other unique aspects of the smaller Sponsoring Institutions. Overall,
these modifications were minor (e.g., length of the site visit, site visit agenda) and are noted appropriately in
the sections that follow.
Figure 1. Schematic Flow of a Clinical Learning Environment Review (CLER) Site Visit

CLER NATIONAL REPORT OF FINDINGS 2021 | METHODOLOGY | 19
CLER Program staff members notified clinical sites of the CLER site visit at least 10 working days in advance.
This relatively short notice was intended to maximize the likelihood of gathering real-time information from
interviewees.
The number of CLER Field Representatives and visit length varied according to the number of programs and
residents and fellows at the site, with teams comprising two to four CLER Field Representatives and visits
lasting two to three days. A salaried employee of the ACGME led each CLER site visit team. Additional team
members included other CLER Field Representatives, ACGME staff members, or trained volunteers from the
GME community.
For site visits that involved time in both inpatient and affiliated ambulatory care practices, the site visit agenda
allowed time for the CLER Field Representatives to travel between the inpatient site and the main ambulatory
care clinical site.
For the majority of the visits, the CLER Field Representatives conducted group interviews in the same order:
(1) an interview with the DIO; (2) an initial group interview with the CEO, members of the executive team (e.g.,
chief medical officer, chief nursing officer), the DIO, and a resident/fellow representative; (3) a short interview
with patient safety and quality leaders; (4) a group interview with residents and fellows; (5) a group interview
with well-being leadership; (6) a group interview with faculty members; (6) a second interview with patient
safety and quality leaders; (7) a group interview with program directors; and (8) an exit meeting with the CEO,
members of the executive team, the DIO, and a resident/fellow representative. Following specific guidelines,
each clinical site provided the CLER Field Representatives with a list of all individuals attending the group
interviews before the site visit. The CLER team conducted all group interviews in a quiet location without
interruption and ensured that the interviews did not exceed 90 minutes.
The purpose of the initial meetings with executive and patient safety and quality leaders was to allow the
CLER team to become familiar with the basic language and culture of the CLE’s current activities in the six
CLER Focus Areas. This information helped inform subsequent interviews and observations during the CLER
visit.
The purpose of the meeting with well-being leadership was to gain an understanding of the CLE’s efforts
to ensure the well-being of its clinical care providers (e.g., physicians, nurses, and other health care
professionals) in order to provide safe patient care. The meeting included individuals formally or informally
designated by executive leadership to address the well-being of all members of the clinical care team at the
clinical site.
The resident and fellow group interviews comprised one to 32 peer-selected participants per session.
Specifically, residents and fellows at the Sponsoring Institution, excluding chief residents, voted for their peers
to attend the group interviews. The participants broadly represented ACGME-accredited programs at the
clinical site with proportionally more individuals from larger programs. The CLER team primarily interviewed
residents and fellows in the post-graduate year 2 (PGY-2) or higher to ensure that interviewees had sufficient
clinical experience to assess the learning environment. PGY-1 residents in a transitional year residency
program were permitted to attend.
For the group interviews with faculty members and program directors, the CLER Program instructed the DIO
to invite participants to attend the group interviews. In the faculty member group interviews, each session
comprised one to 32 clinical faculty members who broadly represented the residency and fellowship programs

20 | METHODOLOGY | CLER NATIONAL REPORT OF FINDINGS 2021
at the CLE. Program directors were not permitted to attend the faculty member meetings. Group interviews with
program directors comprised one to 32 leaders of ACGME-accredited core residency programs at each clinical
site; sessions included associate program directors when program directors were not available.
For CLEs with more than 30 programs, two separate sets of interviews were conducted with residents and
fellows, faculty members, and program directors, with no more than 32 participants attending an individual session.
Additionally, the CLER site visit team conducted a set of walking rounds, escorted by senior or chief residents
and fellows, to observe various patient floors, units, service areas, and ambulatory care sites. The CLER Program
asked the DIO to select residents and fellows, preferably from a range of different specialties, to guide each CLER
Field Representative. For the majority of the visits, residents and fellows who participated in the resident and
fellow group meetings or served as the resident/fellow representative in the executive leadership meeting were not
permitted to serves as escorts for the walking rounds. In CLEs with a small number of residents and fellows, the
resident and fellow escorts on the walking rounds were permitted to serve as escorts more than once and could
also attend the resident and fellow group meeting.
The walking rounds enabled the CLER site visit team to gather feedback from physicians, nurses, and other health
care professionals (e.g., pharmacists, radiology technicians, social workers) in the clinical setting. Each CLER Field
Representative conducted two to six sets of walking rounds per clinical site, with each walking round lasting 60 to
105 minutes. For larger CLEs, CLER Field Representatives conducted an additional fourth walking round lasting
60 minutes.
Throughout each visit, the CLER team conducted huddles to discuss the information they had gathered. Later
during the visit, they held a team meeting to synthesize their findings, reach consensus, and prepare both an
oral report and a draft of a written narrative report. At the exit meeting, the CLER team shared its oral report with
executive leadership, which covered initial feedback on the six CLER Focus Areas. The written report, delivered
approximately six to eight weeks after the site visit, reflected the same topics but with a more comprehensive and
detailed set of observations. The intention of both the oral and written report was to provide formative information
that would help executive leaders assess their practices in the six CLER Focus Areas, inform resident and fellow
education and training, and guide improvements in the CLE to ensure high-quality patient care.
DATA SOURCES
Survey Instruments To conduct the group interviews, the CLER Field Representatives used a structured questionnaire developed under the guidance of experts in GME and/or the six CLER Focus Areas. The questionnaires contained both closed- and open-ended questions. For the visits exclusive to the ambulatory care setting, the protocol questions and scenarios were modified to fit the setting while keeping the essence of the questions to allow for comparability across settings.
After the questionnaires were initially content validated by expert review, the CLER Program field tested the
instruments on seven CLER site visits. At the conclusion of each of these visits, the items were refined as part of
an iterative design process; with each iteration, the CLER Program reviewed and revised the items as necessary
based on feedback from interviewees and interviewers.

CLER NATIONAL REPORT OF FINDINGS 2021 | METHODOLOGY | 21
Walking Rounds
The CLER Program designed the walking rounds to facilitate random, impromptu interviews with residents, fellows,
nurses, and other health care professionals across a number of clinical areas (e.g., inpatient areas, emergency
departments, ambulatory care settings) where residents and fellows were educated and trained based on the
Sponsoring Institution’s ACGME-accredited specialty and subspecialty programs.
The aims of the walking rounds were to (1) triangulate, confirm, and cross-check findings from the group
interviews, and (2) glean new information on residents’ and fellows’ experiences across the six CLER Focus
Areas. The walking rounds provided important information that could either confirm or conflict with the information
gathered in the group interviews.
CLER Site Visit Reports
The CLER Field Representatives synthesized findings from each visit in a written report, working from a formal
template developed and refined in the early stages of the CLER Program. The template assisted the CLER site
visit team in ensuring that each of the six CLER Focus Areas was fully addressed in the oral and written reports for
each clinical site. The reports also included a brief description of the clinical site and any of its notable aspects. All
members of the CLER site visit team reviewed and edited each report for accuracy and to achieve consensus on
the findings.
In the smaller Sponsoring Institutions, the results from both the group interviews with faculty members and
program directors were combined in the oral and written reports to maintain anonymity.
Other Sources of Data
Several other sources of data were used to augment the site visit data, including the ACGME annual data reportsc
and the 2018 American Hospital Association (AHA) Annual Survey Database.d The ACGME reports provided
information on the Sponsoring Institutions, programs, and physicians in GME, including the number of ACGME-
accredited programs, number of residents and fellows matriculated, and university affiliation. The AHA data offered
CLE information, including type of ownership (e.g., non-government, not-for-profit versus investor-owned, for-profit)
and size, as measured by the number of staffed acute care beds.
DATA COLLECTION Group Interviews with an Audience Response System
CLER Field Representatives conducted group interviews with residents and fellows, faculty members, and
program directors using a computerized audience response system (ARS) (Keypoint Interactive version 2.6.6,
Innovision Inc, Commerce, MI) that allowed for anonymous answers to closed-ended questions. The ARS data
were exported into a Microsoft Excel spreadsheet and then into a software package for statistical analysis. CLER
Field Representatives documented responses to open-ended questions qualitatively. The three surveys—one each
for residents and fellows, faculty members, and program directors—consisted of 45, 17, and 32 closed-ended
questions, and 24, 16, and 27 open-ended questions, respectively. Of note, one question in the resident and
fellow survey did not apply to visits exclusively in the ambulatory care setting and thus was omitted from the survey
instrument used on these visits.
c The ACGME annual data reports contains the most recent data on the programs, institutions, and physicians in GME as reported
by all ACGME-accredited Sponsoring Institutions and ACGME-accredited programs. d The AHA Annual Survey Database includes data from the AHA Annual Survey of Hospitals, the AHA registration database, the US
Census Bureau population data, and information from hospital accrediting bodies and other organizations.

22 | METHODOLOGY | CLER NATIONAL REPORT OF FINDINGS 2021
Group Interviews with No Audience Response System
CLER Field Representatives documented all responses qualitatively for group interviews with the DIO
(19 questions); CEO, members of the executive team, the DIO, and the resident/fellow representative (18
questions); patient safety and quality leadership (38 questions); and with well-being leadership (16 questions).
DATA ANALYSIS Descriptive Statistics
Descriptive statistics were used to summarize and describe distribution and general characteristics of
Sponsoring Institutions, CLEs, and physician groups interviewed. For Sponsoring Institutions, characteristics
included Sponsoring Institution type (e.g., teaching hospital, medical school) and the number of ACGME-
accredited residency and fellowship programs per institution. CLE characteristics included type of ownership
(e.g., non-government, not-for-profit), number of licensed beds, and total staff count. Demographic information
included gender and medical specialty of physicians who participated in the group interviews.
Analysis of Audience Response System Data
Analyses were conducted at both the individual (e.g., resident and fellow) and the CLE level. For the individual-
level analyses, results are based on the total sample of individuals surveyed, presented as percentages. For
CLE-level analyses, results show differences between CLEs after individual responses were aggregated at
the CLE level and are presented as medians and interquartile ranges. These two levels of analysis provided
a national overview of the state of CLE engagement in the six CLER Focus Areas and revealed how CLEs
compared on these outcomes.
Chi-square analysis was used to compare resident and fellow responses and to identify any relationships in
responses by (1) gender, (2) residency year, and (3) specialty grouping. Chi-square analysis was also used to
explore if differences were associated with the following CLE characteristics: (1) regional location; (2) bed size;
and (3) type of ownership. Categories in the annual AHA survey informed grouping of CLE-specific variables
(e.g., bed size). P values of .05 or less were considered statistically significant. All statistical analyses were
conducted using SPSS Statistics version 22.0 (IBM Corp, Armonk, NY).
Analysis of CLER Site Visit Reports
Specific findings based on responses to non-ARS questions and interviews on walking rounds were
systematically coded in NVivo qualitative data analysis software version 11 (QSR International Pty Ltd,
Doncaster, Victoria, Australia) following the principles of content analysis. Three members of the CLER Program
staff, trained in qualitative data analysis, generated a master codebook through an iterative process by (1)
independently applying codes to the data, (2) peer-reviewing coding, (3) discussing coding discrepancies, and
(4) reaching agreement on the codes through consensus. The results were recorded as frequency counts for
further descriptive analysis. Overall percentages and percentages stratified by CLE region, bed size, and type of
ownership are reported.
Three-Point Analysis of Selected Measures in the CLER Focus Areas
A selected set of measures in each of the CLER Focus Areas was examined to explore change over time since
the first cycle of visits for matched observations (i.e., the same CLEs in all three cycles of visits). The final data
set for the three-point analysis comprised 242 CLEs; reasons for exclusion included changes in accreditation
status (e.g., Voluntary Withdrawal), changes in the number of core residency programs, and incomplete

CLER NATIONAL REPORT OF FINDINGS 2021 | METHODOLOGY | 23
or missing data (see Figure 2). The measures examined were the same in all three cycles of visits (i.e., the
questions remained constant between Cycles 1, 2, and 3).
The Kolmogorov-Smirnov test was used to test for normality in the data. Based on the results of the Kolmogorov-
Smirnov test and tests of symmetry, non-parametric tests were employed in the three-point analysis. The
Friedman test was conducted to determine if there were differences in the median percentage based on
responses to closed-ended questions (i.e., ARS data) that were aggregated at the CLE level. The Wilcoxon
signed rank test (and the sign test when the data were nonsymmetrical) was conducted as a post-hoc analysis
to determine which cycles were significantly different. The Cochran’s Q and Friedman tests were conducted to
compare changes in the qualitative findings based on coded extractions from the CLER Site Visit Reports. P
values of .05 or less were considered statistically significant. SPSS Statistics version 22.0 was used to conduct
statistical analyses.
Two-Point Analysis of Selected Measures in the CLER Focus Areas
For the two-point analysis, a selected set of measures in the CLER Focus Areas was examined to explore
change over time for matched observations between Cycle 2 and Cycle 3. The final data set for the two-point
analysis comprised 504 CLEs; reasons for exclusion included changes in accreditation status (e.g., Voluntary
Withdrawal), changes in the number of core residency programs, and incomplete or missing data (see Figure
3). As part of its commitment to a model of continuous quality improvement, the CLER Program added these
measures to the site visit protocol in Cycle 2 to explore important topics in greater depth. The measures
examined remained constant between Cycle 2 and Cycle 3.
The Kolmogorov-Smirnov test was used to test for normality in the data. Based on the results of the Kolmogorov-
Smirnov test and tests of symmetry, nonparametric tests were employed in the two-point analysis. The Wilcoxon
signed rank test (and the sign test when the data were nonsymmetrical) was conducted to compare changes in
median percentage based on responses to closed-ended questions (i.e., ARS data) that were aggregated at the
CLE level. The McNemar and marginal homogeneity tests were conducted to compare changes in the qualitative
findings based on coded extractions from the CLER Site Visit Reports. P values of .05 or less were considered
statistically significant. SPSS Statistics version 22.0 was used to conduct statistical analyses.
Figure 2. Matched Clinical Learning Environments (CLEs) Between Cycle 1, Cycle 2, and Cycle 3 of Clinical Learning Environment Review Site Visits
N = 242 Matched CLEs
between Cycle1, Cycle 2, and Cycle 3
N = 297 CLEs visited in Cycle 1
CLEs excluded from three-point analysis (n = 55)
• Voluntary withdrawals, n = 19 • Incomplete or missing data, n = 35 • Change in the number of core residency programs resulting
in reclassification as a smaller Sponsoring Institution with visit held exclusively in the ambulatory care setting, n = 1

24 | METHODOLOGY | CLER NATIONAL REPORT OF FINDINGS 2021
Development of Overarching Themes and Findings in the CLER Focus Areas
The overarching themes and findings by CLER Focus Areas were determined in three stages. First, the CLER
Program staff members asked each CLER Field Representative to identify the overarching themes (i.e., broad,
high-level observations) and key findings in the CLER Focus Areas based on their summative experiences and
observations through a key informant survey. The CLER Program staff members systematically analyzed the
content of all responses to discern common themes and note salient concepts. The approach to analysis was
inductive in that the themes emerged from the content of the responses.
Next, the CLER Field Representatives reviewed and commented on the results and offered additional findings
by consensus. Based on feedback from the CLER Field Representatives, the CLER Program staff members
revised the summary of results and presented them to the CLER Evaluation Committee. Lastly, the members of
the CLER Evaluation Committee reviewed the results and developed a set of commentaries on the importance
of the findings and their impact on patient care and physician education. The work of the committee was
achieved by consensus.
Figure 3. Matched Clinical Learning Environments (CLEs) Between Cycle 2 and Cycle 3 of Clinical Learning Environment Review Site Visits
N = 566 CLEs visited in Cycle 3
N = 504 Matched CLEs
between Cycle 2 and Cycle 3
N = 557 CLEs visited in Cycle 2
CLEs excluded from Cycle 3 visits and two-point analysis (n = 50)
• Voluntary withdrawals, n = 49 • Change in the number of core residency programs resulting in
reclassification as a smaller Sponsoring Institution with CLE in unique setting, n = 1
CLEs added to Cycle 3 visits (n = 59)
• New Sponsoring Institutions, n = 59
CLEs excluded from two-point analysis (n = 62)
• CLEs added to Cycle 3 visits, n = 59 • Incomplete or missing data, n = 3

CLER NATIONAL REPORT OF FINDINGS 2021 | METHODOLOGY | 25
Use of Terms to Summarize Quantitative and Qualitative Results
For the purposes of this report, a specific set of descriptive terms is used to summarize quantitative results
from both the ARS and the CLER Site Visit Reports: few (< 10%); some (10%-49%); most (50%-90%); and
nearly all (> 90%).
The summary of qualitative data (i.e., responses to open-ended questions during group interviews and
conversations on walking rounds) is based on the CLER Field Representatives’ assessment of the relative
magnitude of responses. The following set of terms is intended to approximate the quantitative terms above:
uncommon or limited; occasionally; many; and generally.
TRIANGULATION AND CROSS-VALIDATION
Triangulation of the findings enhanced overall accuracy in the conclusions. The findings were cross-validated
for consistency and corroboration using multiple sources of complementary evidence and analytic techniques.
For example, the ARS results were more meaningful when supplemented by critical qualitative information and
vice versa. Multiple sources of data provided greater insight and minimized inadequacies of individual data
sources when a finding was supported in multiple places. This mixed methods approach provided a richer,
more balanced, and comprehensive perspective by allowing for deeper dimensions of the data to emerge.
LIMITATIONSAs with any formative learning process, limitations to the CLER Program warrant consideration in using the
information in this report. Perhaps most important, these findings do not suggest cause and effect.
Second, although this aggregated set of findings is designed to be highly representative, it is based on a
series of sampled populations and thus may not be generalizable to all CLEs. As previously mentioned, the
CLER teams interviewed a sample of residents, fellows, faculty members, program directors, and other clinical
and administrative staff members for each visit, with the aim of broad representation across all programs (e.g.,
proportionally more individuals from larger programs). Although the goal was to achieve a broad degree of
representativeness, the sample may or may not reflect the entire population. Given that the CLER Program
provides formative assessment, this approach to sampling allowed for a broad and in-depth understanding
of socially complex systems such as CLEs. The CLEs that were not included in this sample may represent
different experiences and consequently could yield different conclusions as the CLER Program considers
them in the future.

26 | METHODOLOGY | CLER NATIONAL REPORT OF FINDINGS 2021
REFERENCES1. CLER Evaluation Committee. 2017. “CLER Pathways to Excellence: Expectations for an Optimal Clinical Learning Environment
to Achieve Safe and High Quality Patient Care, Version 1.1.” Chicago, IL: Accreditation Council for Graduation Medical
Education.
CLER PROGRAM
Octavia Bailey; Mark R. Bixby, MD, FAAFP; Isabelle Bourgeois, MPA; Jennifer J. Buescher, MD, MSPH; Robert Casanova, MD,
MHPE; Baretta R. Casey, MD, MPH, FAAFP; Marian D. Damewood, MD, FACOG; Kevin C. Dellsperger, MD, PhD; Robin Dibner,
MD; David L. Dull, MD, MMM, FAAPL; Staci A. Fischer, MD, FACP, FIDSA; Patrick Guthrie; Paula Hensley, MPH; Kristen Ward
Hirsch; John A. Hopper, MD; Sharhabeel Jwayyed, MD, MS; Catherine Kallal, MD; Elizabeth Kimball, MA; Nancy J. Koh, PhD;
Kathryn E. McGoldrick, MD, MAH, FCAI (Hon); Clifton McReynolds, PhD; Terrie Mendelson, MD; Joshua Mirôn, MA; Robin C.
Newton, MD, FACP; Morgan Passiment, MS; Douglas E. Paull, MD, MS, FACS, FCCP, CHSE, CPPS; Daniel Picard, MD; Kathy
B. Porter, MD, MBA, FACOG; Dale Ray, MD, MMM; Laura Riordan, MS; Melissa Schori, MD, FACP, MBA; Tara Shedor; Stephen
Smith, M; Mike Strickland, MFA; Hongling Sun, PhD; Marie Trontell, MD; Paul Uhlig, MD, MPA; Robin Wagner, RN, MHSA;
Elizabeth Wedemeyer, MD; Kevin B. Weiss, MD; Esther Woods; Martha S. Wright, MD, Med; James R. Zaidan, MD, MBA; Jose
Zayas, DO, FAAP
CLER NATIONAL REPORT OF FINDINGS 2021 | OVERARCHING THEMES | 27
Note: The data in this report were collected prior to March 2020. Many of the challenges identified in this section have been further accelerated by the COVID-19 pandemic which has dramatically amplified the need for rapid innovation and adaptation while placing stress on the health system’s ability to maintain quality patient care, patient safety, and workforce well-being.
INTRODUCTIONAs in prior CLER National Reports of Findings, this third report reveals a number of overarching themes
that cut across the six CLER Focus Areas.1 Of note, the CLER protocol for this third cycle of visits did
not directly assess for these themes. Rather, they are based on the CLER Field Representatives’ overall
observations for the most recent cycle of CLER visits. The development of these themes is described in
detail in the Methodology section (pp. 17-26).
The overarching themes appear in the following shaded boxes and are numbered for easy reference within
the report; these numbers do not suggest order or importance. Each theme is accompanied by a discussion
section, authored by the CLER Evaluation Committee, which highlights the theme’s relevance to the GME
community and the CLEs in which residents and fellows learn and train.
Overarching Themes Catherine M. Kuhn, MD; John Patrick T. Co, MD, MPH, FAAP; and Kevin B. Weiss, MD, on behalf of the CLER Evaluation Committee
Discussion
The US health care environment continually seeks to innovate while sustaining high quality and safe patient care.
Managing innovation while maintaining safety and quality requires engaging every member of the patient care team
and health system workforce. Over the past few years, US health care has experienced a number of accelerated
changes. There has been a dramatic increase in mergers and acquisitions of hospitals and related health care
entities, resulting in increasingly large and complex health care organizations. There has also been rapid entry
of private equity in ownership of physician group practices, particularly among certain specialty-based clinical
practices. One of the notable outcomes of these trends is a rapidly developing workforce of physicians who are
directly employed by health care organizations.2 In addition, during the past decade, US health care organizations
have nearly finalized the transition from primarily paper-based to electronic-based health records, with all the well-
OVERARCHING THEMES
Theme 1Clinical learning environments continue to face significant challenges in changing their health systems
at the speed and magnitude needed for sustained improvements in patient care. There are a few clinical
learning environments in which executive leadership effectively engages the GME community in the
design of solutions to address these challenges.

28 | OVERARCHING THEMES | CLER NATIONAL REPORT OF FINDINGS 2021
described benefits and challenges associated with this change.3 US health care is also rapidly increasing the use
of technology to promote both telemedicine and distance learning.
This report examines key aspects of the clinical learning environment during this rapid evolution of the US health
care system and exposes the challenges and opportunities related to how CLEs engage their residents and fellows
in individualized learning while simultaneously planning for and implementing system changes to respond to the
need for innovation.
Residents and fellows are on the front line of patient care and are therefore a valuable source of information about
the practicality of proposed solutions to improve care. It is therefore important that CLE leadership work with
GME leadership to engage residents and fellows in developing and testing proposed solutions to ensure optimal
implementation and sustainability of patient care improvement that is most proximate to the patient experience.
Residents and fellows are also source of new talent, new ideas, and innovation in the patient care workforce.
Ensuring residents and fellows have experience in systems-based identification and problem solving can only serve
to benefit health systems as they rapidly evolve.
This overarching finding of rapid change in our nation’s health care environments is offset by the unfortunate finding
that there are few CLEs where executive leadership is effectively engaging their GME community in designing
solutions to address the need for innovation and change. Traditionally, the GME community (primarily the DIO,
program directors, faculty members, residents, and fellows) have been viewed as a source for implementing
change. This same community has less frequently been viewed as a resource or partner in problem solving to
achieve CLE goals.
The finding noted a few of the CLEs visited appeared to be engaging residents and fellows in the early stages of
innovation. These CLEs possess a strategic advantage by expanding input from the front lines of patient care. This
approach to engagement is a benefit with few downsides. However, efforts to improve GME engagement also
comes with challenges.
Over the past several years, the CLER Program’s Pursuing Excellence initiative4 has been exploring the benefits
and challenges of bringing GME leaders, and specifically DIO leaders, into a closer relationship with the executive
leaders of their CLEs. The eight Sponsoring Institutions participating in the Innovators Collaborative of Pursuing Excellence have reported major benefits from more closely engaging with their health system leadership (e.g.,
expanded efforts in faculty development and increased interprofessional learning). To date, they have shared
their experiences with the GME community through several workshops and have a series of publications
forthcoming.5,6,7
Preparing the GME community to actively engage in all aspects of innovation requires the CLE’s leaders to invest
in developing leaders within GME. In addition to their clinical expertise, GME faculty members, residents, and
fellows need to understand and develop skills to be able to address important concepts such as: (1) principles of
meta-leadership; (2) principles of leading in a crisis; and (3) principles of resilient leadership. Additionally, GME
leaders need to ensure that each of their programs is addressing resident and fellow competence in knowledge,
skills, and attitudes related to systems-based practice.
Enhancing input from the GME community requires the CLE’s executive leaders to more formally engage with
GME leaders in strategic decision making and warrants consideration of including GME leaders as part of the
CLE’s executive leadership team. In these times of rapid change, the Pursuing Excellence initiative indicates the

CLER NATIONAL REPORT OF FINDINGS 2021 | OVERARCHING THEMES | 29
Discussion
The CLE’s lack of efforts to engage residents and fellows in efforts to improve health care quality and patient
safety was one of the earliest themes to emerge from the CLER Program. While, over time, CLER reports
have revealed some demonstrated improvement in this area, there appear to be challenges to bringing about
rapid change and improvement. Educating and training the next generation of physician leaders in how to fully
engage in patient safety and health care quality improvement needs to be viewed as foundational to physician
practice. Physicians educated and trained in patient safety and quality improvement have the ability to lead,
co-lead, and otherwise participate effectively in interprofessional efforts to eliminate health care disparities,
improve the quality and value of patient care, and decrease risk/harm to patients.
Over the past several years, the CLER Program has revealed some of the challenges CLEs face in engaging
residents and fellows in patient safety and quality improvement. For many CLEs, resident and fellow
engagement in patient safety and quality improvement is primarily GME-centered versus CLE-centered
learning—accomplished through single, event-based activities rather than longitudinal, competency-based
approaches to teaching these important concepts. In these situations, residents and fellows often complete
only one or two steps of a four-part quality improvement cycle during their educational programs and never get
to see the effort as a whole. In addition, there has also been an overall lack of investment in faculty development
to build the capacity to mentor/coach residents and fellows in patient safety and quality improvement. Each
of these challenges could likely be overcome if the CLE’s leadership re-envisions how it engages GME and
recognizes how doing so will help them achieve their goals of optimizing patient care.
One of the most important actions that could accelerate change is for the GME community to recognize and
regard patient safety and health care quality improvement as essential functions of the CLE, thereby creating
an imperative to ensure that residents and fellows rapidly acquire knowledge and skills in these areas. Often,
physicians view work in this area as administrative work that is separate from (or additional to) their clinical
responsibilities rather than a critical and integral component of clinical care.
Patient safety and health care quality improvement is centered on patient care, patient care teams, and
systems-based thinking and solutions. When resident and fellow experiences in addressing patient safety and
health care quality are confined to GME-based activities that do not integrate with the CLE’s efforts in this
area, they will, by design, fail to achieve optimal learning or optimal improvements in patient care. Therefore, in
addition to having CLE leaders reach out to more actively engage their residents and fellows in patient safety
and quality improvement, outreach needs to come from GME as well. It is essential that GME leaders engage
the CLE’s patient safety and quality leadership and staff members in co-creating the resident and fellow patient
safety and quality improvement learning experiences, with joint accountability for the outcomes. Improving
nation’s CLEs would benefit from improving engagement with their GME communities as they seek to navigate
through numerous systems-level challenges.
Theme 2In general, clinical learning environments do not appear to engage all their residents and fellows in their
organization’s efforts to design, evaluate, and improve patient safety and health care quality, including
health care disparities.

30 | OVERARCHING THEMES | CLER NATIONAL REPORT OF FINDINGS 2021
patient safety and health care quality requires interprofessional engagement that is team oriented if the efforts
are to result in sustainable systems-based solutions.
As noted on the previous page, one of the fundamental challenges to CLE and GME leadership is the
predominant view that resident and fellow learning about patient safety and health care quality improvement is
best accomplished through event-based experiences (e.g., residents engage in a patient safety event analysis,
submit an patient safety event report, or participate in a piece of a quality improvement activity). Competency-
based learning in patient safety and health care quality improvement needs to reflect progressive longitudinal
learning on a developmental trajectory that spans the entirety of the resident’s and fellow’s educational
program. Successful educational programming in patient safety and health care quality improvement needs
to be a series of events and learning experiences that are co-designed and implemented with input from key
stakeholders of both the CLE and GME leadership.
The overarching theme noted above poses a key challenge for CLEs to ensure that resident and fellow
participation in patient safety and quality improvement activities reflect complete learning cycles—similar to that
of a plan/do/study/act quality improvement cycle. All too often, residents and fellows submit a patient safety
event report without subsequently engaging with the CLE in the event analysis (do) or design of follow-up
actions (study) to affect improvement. Incomplete learning cycles, like incomplete quality improvement cycles,
have little likelihood of creating sustainable learning or improvement in patient care.
CLE investment in faculty development in patient safety and health care quality is essential. However, not every
faculty member needs to be an expert in patient safety and health care quality improvement. The Pursuing Excellence initiative and the ACGME’s pilot work in creating a Program Directors Patient Safety and Quality
Improvement Educators Network have demonstrated that both the CLE and GME benefit from fostering
different groups of faculty members with different degrees of proficiency and engagement. The first group
are the experts—a few faculty members who have significant knowledge and experience in patient safety and
health care quality improvement. These experts do not necessarily need to come exclusively from within the
specialty or the physician community. When viewed through a multidisciplinary interprofessional lens, there
may be significant expertise already residing within the CLE. The second group (also relatively small) are those
with sufficient skills to serve as mentors or coaches for residents and fellows. For this group, the CLE and
GME may also benefit from drawing on expertise from across the professions. Once the first two groups are
established, the majority of faculty members need only to be conversant in the general concepts of patient
safety and health care quality improvement, provide a supportive and safe culture of inquiry, and actively assist
residents and fellows in developing strong relationships with their faculty mentors and coaches. With this
three-group approach in mind, the task of faculty development becomes less onerous and more achievable.
As noted in prior CLER reports, there are compelling reasons to focus on enhancing resident and fellow
engagement in improving patient safety and health care quality. Residents and fellows are uniquely positioned
to identify near misses and opportunities for improvement, and to appropriately test and trial any plans for
system redesign to address challenges prior to widespread implementation. In keeping with the thoughts
above regarding faculty development, every resident and fellow does not need to be an expert in patient safety
and health care quality improvement. However, each resident and fellow does need to be competent in the
skills of how to design, evaluate, and improve patient safety and health care quality if at minimum they are to
continually improve their own personal practice and patient outcomes.

CLER NATIONAL REPORT OF FINDINGS 2021 | OVERARCHING THEMES | 31
If CLE and GME leadership do not work together to actively engage residents and fellows while they are
in their educational programs, these learners may go on to independent practice believing that physician
involvement in improving patient safety and health care quality is not important or necessary. This CLE/
GME partnership is essential to avoid perpetuating the structural silos that disconnect the physician
workforce from the CLE’s imperative to provide safe, high-quality patient care.
Discussion
The primary role of every health care organization is to provide safe, high-quality patient care. It has been
proposed that there should be four aims to quality improvement in health care: better health outcomes;
better care; lower cost; and joy in work.8 This CLER report includes the newest Focus Area of well-being
and provides the first national assessment of how CLEs are addressing the challenge of creating clinical
care environments that support the well-being of their clinical staff members, including learners (specifically
residents and fellows).
The findings from this first CLER assessment of the Focus Area of well-being support other national findings
noting a high degree of burnout associated with those who provide clinical care.9 It is well known that much of
the burnout observed in US health care organizations is rooted in challenges associated with systems-based
structures and processes. Some of the well described systems-based challenges include inadequate staffing
of various members of clinical care team; the increasing complexity and acuity of patient case mix across
different settings; inefficient or ineffective patient care workflow designs; inefficient or ineffective deployment
of resources (e.g., electronic health records); asymmetry in work intensity across different members of the
clinical care team; and increasing volume and complexity of non-clinical administrative demands on clinical
care providers, including residents, fellows, and faculty members.
Although many of the problems being identified as negatively affecting well-being are systems based, the
findings from this report suggest most of the current solutions are focused on assessing individuals, providing
individual or group support, and helping individuals to develop resilience. This report noted that only a small
number of CLEs appear to have developed approaches that address their entire workforce, solving for some
of the systems-based root causes that impede well-being. Most of the CLE well-being efforts that were
identified in this cycle of CLER visits focused on physicians, more specifically residents and fellows. This may
be due to the GME community’s interest in supporting well-being. At the same time, it is important to view
well-being as essential for the entire clinical care team.
Creating programs to assist residents and fellows in addressing burnout and other issues affecting well-being
is important work, and the focus on managing harm to residents, fellows, and other members of the health
care team is an important priority, yet it is only a partial solution. CLEs will ultimately benefit from broadening
their scope to identify and address systems-based factors that are adversely affecting the well-being of all
Theme 3In addressing well-being, many clinical learning environments are focused on individual responsibility and
resilience. Few clinical learning environments appeared to address systems-based factors that adversely
impact the well-being of the clinical care team and the safety and quality of patient care.

32 | OVERARCHING THEMES | CLER NATIONAL REPORT OF FINDINGS 2021
REFERENCES1. CLER Evaluation Committee. 2017. “CLER Pathways to Excellence: Expectations for an Optimal Clinical Learning Environment to Achieve Safe and High Quality Patient Care, Version 1.1.” Chicago, IL: Accreditation Council for Graduation Medical Education.
2. Kane, Carol K. 2019. “Updated Data on Physician Practice Arrangements: For the First Time, Fewer Physicians Are Owners Than Employees.” American Medical Association Policy Research Perspectives, May, 1–16.
3. Palabindala, Venkataraman, Amaleswari Pamarthy, and Nageshwar Reddy Jonnalagadda. 2016. “Adoption of Electronic Health Records and Barriers.” Journal of Community Hospital Internal Medicine Perspectives 6 (5): 32643. doi.org/10.3402/jchimp. v6.32643.
4. Wagner, Robin, Kevin B. Weiss, Morgan L. Passiment, and Thomas J. Nasca. 2016. “Pursuing Excellence in Clinical Learning Environments.” Journal of Graduate Medical Education 8 (1): 124–27. doi.org/10.4300/JGME-D-15-00737.1.
5. Passiment, Morgan, Pavan Zaveri, Elias I. Traboulsi, Kalli Varaklis, Anita Blanchard, Robert B. Baron, Laurinda Calongne, et al. 2020. “CLER Pursuing Excellence: Designing a Collaborative for Innovation.” Journal of Graduate Medical Education 12 (4): 512–17. https://doi.org/10.4300/JGME-D-20-00712.
6. Traboulsi, Elias I., Anita K. Blanchard, Morgan Passiment, Dewesh Agrawal, Robert B. Baron, Laurinda Calongne, Diane Hartmann, et al. 2021. “Driving GME Integration With Health System Strategic Priorities.” Journal of Graduate Medical Education 13 (1): 153–60. https://doi.org/10.4300/JGME-D-20-01540.1.
7. Arora, Vineet M., Glenn Rosenbluth, Amanda O’Rourke, Rita M. Pappas, Aaron C. Hamilton, Richard J. Vath, and Anita K. Blanchard. 2021. “Integrating Clinical Learning Environment Staff and Learners Into the Pursuit of Quality, Safety, Equity, and Value.” Journal of Graduate Medical Education 13 (2): 294–300. https://doi.org/10.4300/JGME-D-21-00197.1.
8. Bodenheimer, Thomas, and Christine Sinsky. 2014. “From Triple to Quadruple Aim: Care of the Patient Requires Care of the Provider.” The Annals of Family Medicine 12 (6): 573–76. doi.org/10.1370/afm.1713.
9. National Academies of Sciences, Engineering, and Medicine. 2019. Taking Action Against Clinician Burnout: A Systems Approach to Professional Well-Being. Washington, D.C.: National Academies Press. doi.org/10.17226/25521.
members of the care team. Doing so has the potential to increase staff safety, morale, and job satisfaction
that will likely translate directly into improvements in quality of care, patient safety, and staff and faculty
recruitment and retention. This in turn will likely improve the CLE’s reputation in the community as both a
source of good patient care as well as a caring and responsible community asset.
As this is the first set of CLER visits under this new Focus Area of well-being, it is important to recognize
the earnest efforts to date to assist individuals in managing the impact of health systems’ challenges on their
well-being. It is also important to recognize the need to dramatically enhance efforts to improve well-being
through systems-based solutions. Later in this report, the section on challenges and opportunities addresses
important key findings in the area of well-being in greater detail, including highlighting some of the GME-
based efforts to date in this area. Given the high degree of national interest in clinician well-being, there is
hope that when the CLER Program conducts its next cycle of visits, there will be evidence of rapid progress
in aligning the efforts to assist individuals with expanded efforts to identify and implement systems-based
solutions to improving well-being.

CLER NATIONAL REPORT OF FINDINGS 2021 | OVERARCHING THEMES | 33
CLER EVALUATION COMMITTEE Catherine M. Kuhn, MD, Current Co-Chair, Durham, NC; John Patrick T. Co, MD, MPH, FAAP, Immediate Past Co-Chair,
Boston, MA; Kevin B. Weiss, MD, Co-Chair, Chicago, IL; Jenny J. Alexopulos, DO, Tulsa, OK; Michael Apostolakos, MD,
Rochester, NY; Vamsi Aribindi, MD, Houston, TX; James P. Bagian, MD, PE, Ann Arbor, MI; Lindsay Dale, MD, Richmond, VA;
Rosemary Gibson, MSc, Arlington, VA; Linda A. Headrick, MD, MS, FACP, Columbia, MO; Robert Higgins, MD, Augusta, GA;
Sherry C. Huang, MD, New Brunswick, NJ; Marcia Hutchinson, MD, Savannah, GA; Lynne M. Kirk, MD, MACP, Chicago, IL;
Anai N. Kothari, MD, MS, Maywood, IL; Tanya Lord, PhD, MPH, Concord, NH; David Markenson, MD, MBA, FAAP, FACEP,
FCCM, FACHE, Washington, DC; David Mayer, MD, Columbia, MD; Lucie E. Mitchell, DO, MS, Birmingham, AL; Douglas E.
Paull, MD, MS, FACS, FCCP, CHSE, CPPS, Chicago, IL; Lakshmana Swamy, MD, MBA, Boston, MA; Andrew M. Thomas,
MD, MBA, Columbus, OH; Marjorie S. Wiggins, DNP, MBA, RN, FAAN, NEA-BC, Portland, ME; Ronald Wyatt, MD, MHA,
DMS (Hon), Atlanta, GA

34 | OVERARCHING THEMES | CLER NATIONAL REPORT OF FINDINGS 2021
CLER NATIONAL REPORT OF FINDINGS 2021 | CHALLENGES AND OPPORTUNITIES | 35
INTRODUCTION
In this third CLER National Report of Findings, the CLER Program continues to provide the nation with a
periodic snapshot of the CLEs that host resident and fellow physicians, continuing to elucidate the important
interface between learning and patient care. As in prior National Reports, the findings reveal both strengths
and opportunities for improvement. In particular, they highlight those areas where GME plays a key role in
ensuring the CLE achieves its goals for delivering safe, high-quality patient care. For example, this third cycle
of visits revealed several strengths:
• Most CLEs reported tracking the number of patient safety event reports submitted by residents and
fellows.
• Approximately 80% of residents and fellows reported participating in a quality improvement project of
their own design or one designed by their program or department.
• Across CLEs, most residents and fellows reported following a standardized process for handling
transitions of care during hand-offs between shifts.
• Across CLEs, most residents and fellows reported an overall culture of adequate supervision.
These examples are encouraging and can serve as models or catalysts for action to address the challenges
and opportunities for improving the CLE that are associated with the findings in this report.
This section presents the views of the CLER Evaluation Committee on the significance of the findings in
two of the six CLER Focus Areas: patient safety and well-being. The committee members chose to highlight
patient safety both for the seriousness of the issues and the opportunity to share examples of how new
approaches and dedicated efforts to improve resident and fellow engagement in patient safety can make a
difference. The committee selected well-being for several reasons. First, it is a new Focus Area for the CLER
Program—having expanded over the years from a focus on fatigue management, mitigation, and duty hours
to a more comprehensive assessment of the CLE that addresses four interrelated topics: work/life balance;
fatigue; burnout; and support of those at risk of or demonstrating self-harm. Importantly, it is an opportunity to
speak to an issue garnering national attention in the US health care system and its implications for GME and
the future physician workforce.
The shaded boxes that follow present selected findings based on both quantitative and qualitative results
drawn from the CLER site visits. (Refer to the Methodology section on pp. 17-26 for more information on the
specific terminology used in describing the findings.) As with the section reporting on the overarching themes
(pp. 27-33), the CLER Program staff members presented the CLER Evaluation Committee with a summary
of results in these two CLER Focus Areas—patient safety and well-being—to review in the development of this
section. The findings that follow are numbered for easy reference within the report. These numbers do not
suggest order or importance.
Challenges and Opportunities in Selected CLER Focus Areas Kevin B. Weiss, MD; Catherine M. Kuhn, MD; and John Patrick T. Co, MD, MPH, FAAP, on behalf of the CLER Evaluation Committee

36 | CHALLENGES AND OPPORTUNITIES | CLER NATIONAL REPORT OF FINDINGS 2021
Discussion
This report re-emphasizes what was seen in the prior CLER reports in the area of patient safety—that there
is a large performance gap in how residents and fellows engage in the patient safety initiatives within their
CLE. It is reassuring that overall there now appears to be a general awareness of the importance of, and the
value in, engaging residents and fellows in CLE activities to improve patient safety. From the perspective of
the CLE, resident/fellow engagement results in more patient safety event reports from providers who are in
close contact with their patients. Engaging residents and fellows also increases the number of members of the
clinical team that can participate in analyzing patient safety events and thereby improve care. Through increased
engagement, residents and fellows are learning the value of working with CLEs to improve the effectiveness
and efficiency of patient care through system-based solutions.
For this section on challenges and opportunities, the CLER Evaluation Committee focuses on two important
findings, drawing upon the CLER site visit experience as well as the recent work of the National Collaborative
for Improving the Clinical Learning Environment (NCICLE) and the Pursuing Excellence Pathway Leaders
Patient Safety Collaborative.1,2 One finding is the need for GME and CLE leadership to prioritize engaging all
residents and fellows in patient safety event analysis starting in their first year in the CLE. Of note, this needs to
be meaningful engagement so as to inspire residents and fellows on the value of engaging in efforts to improve
patient safety. While their first experience needs to happen in the first year, there needs to be a longitudinal
approach to developing these skills. The other finding is the need for the GME community and other members
of the clinical care team to broaden the range of what they view as reportable patient safety events. The CLER
Evaluation Committee believes these two issues are key levers to advancing the patient safety culture within
CLEs, enhancing GME, and improving patient care.
In 2017, NCICLE, a collaborative of organizations interested in improving the clinical learning environment,
released a guidance document for engaging new clinicians in patient safety. The document outlines four basic
components of engagement, including recognizing and reporting events, analyzing events, participating in
improvement efforts, and understanding culture (see Figure 1).1 The CLER Program used this framework as
the foundation for the Pursuing Excellence Pathway Leaders Patient Safety Collaborative to test the value
of engaging residents and fellows early in their education and training. This Collaborative of nine ACGME-
accredited Sponsoring Institutions focused on patient safety event analysis, rather than event reporting, as the
PATIENT SAFETY
Patient Safety Finding 1In general, residents, fellows, and nurses lacked clarity and awareness of the range of reportable patient safety events. When queried, residents, fellows, and nurses also appeared to vary in their understanding of how the clinical learning environments used the reporting of adverse events and near misses/close calls to improve systems of care.
Patient Safety Finding 2Across clinical learning environments, a limited number of residents, fellows, and faculty members participated in interprofessional, interdisciplinary, systems-based improvement efforts, such as patient safety event reviews and analyses.

CLER NATIONAL REPORT OF FINDINGS 2021 | CHALLENGES AND OPPORTUNITIES | 37
key lever for engaging residents and fellows. The results of this Collaborative were notable and suggested
that if residents and fellows become involved early in their clinical education and training in meaningful patient
safety event analysis, they will, in general, be more engaged in patient safety and more likely to report patient
safety events. The results seem to be intuitive; residents and fellows are more likely to want to engage in a
CLE’s patient safety program if they perceive they are valued as problem solvers and not just reporters of
events.
Some of the ways to increase resident and fellow engagement in patient safety are to ensure all participants
recognize the important roles they play in addressing patient safety—that the CLE’s patient safety program
values resident and fellow participation and that the GME leadership values the expertise of the CLE’s patient
safety program staff members. Other lessons learned from the Pursuing Excellence Pathway Leaders Patient
Safety Collaborative note it is important that resident and fellow engagement is based on real and recent
events that are relevant to residents and fellows—ideally events that are related to their field in health care, that
the analysis involves interprofessional collaboration with other members of the health care team, and that small
group (rather than large group) analysis provides greater opportunities for meaningful input. Residents and
fellows are also more likely to engage if their faculty members are interested in and prioritize patient safety—
adjusting clinical workflow to allow residents and fellows be able to participate in patient safety initiatives—
recognizing this may require accommodating the workflow of other (interprofessional) members of the health
care team.
The first finding notes that, across many of the CLEs, the members of the clinical care team were uncertain
as to the full range of reportable events. As the findings of this report demonstrate, few residents and fellows
indicated they have reported a near miss event. Across all members of the clinical care team, there appears
to be a general lack of awareness of the broad range of types of events that benefit from documentation,
especially those events that are either near misses or unsafe conditions (e.g., preventable harm). Much of
the learning across CLEs appears to be based disproportionately on harm, often serious harm, events. It is
important for residents and fellows to recognize, report, and know how to analyze the full spectrum of patient
safety events from unsafe conditions to serious harm. If residents’ and fellows’ experience in patient safety is
limited to reporting and analyzing harm events, they will not develop the skills to be able to participate in or
lead proactive analyses that develop solutions to prevent harm from occurring in the first place or understand
how to prioritize limited resources in addressing patient safety.
These findings reflect that CLEs often find it challenging to demonstrate to the clinical care team (including
GME learners), that there were sustainable improvements that resulted from analyses of patient safety event
reports. The findings also suggest that there are many ways by which both GME and CLE leadership are
making efforts to engage residents and fellows in patient safety, including simulation activities, lecture series,
and morbidity and mortality conferences that have been reconfigured to emulate a true patient safety event
analysis, such as a root cause analysis. While these activities support education about patient safety, they are
not substitutes for the primary goal of engaging residents and fellows in real, interprofessional patient safety
event analyses.

38 | CHALLENGES AND OPPORTUNITIES | CLER NATIONAL REPORT OF FINDINGS 2021
Discussion
Anchoring well-being efforts in a comprehensive strategy
The findings from this cycle of CLER visits suggest that well-being is a priority for many of the nation’s CLEs.
The results also indicate a paucity of CLEs have developed and implemented formal strategies to address these
issues. While many CLEs indicated they offer a variety of independent activities and resources to address well-
being, they appear to do so absent formal comprehensive strategies.
A comprehensive strategy is important for two reasons: (1) the majority of clinical care is delivered by
interprofessional teams of providers where stressors on one or more members of the team in turn affect others;
and (2) clinical care teams function within larger CLE systems of care. So while individuals may take advantage
of offerings to build their resilience, there are other major stressors impacting these individuals that can only be
addressed at the system level. Additionally, a comprehensive organizational strategy better positions the CLE to
ensure equity in well-being among the various health professions and across the entire workforce.
WELL-BEING
Well-Being Finding 1A limited number of clinical learning environments appeared to have a formal strategy to promote, improve, and sustain the well-being of the clinical care team to ensure safe patient care.
Well-Being Finding 2Across many clinical learning environments, efforts to address well-being appeared to focus on individual resilience and wellness with an emphasis on physical and mental health (e.g., nutrition, exercise, gym membership, meditation) rather than systems-based solutions to improve the well-being of the clinical care team.
Well-Being Finding 3Across many clinical learning environments, when well-being efforts existed, they appeared to be siloed and initiated by individual programs, professional groups, service lines, or units with separate activities for residents and fellows.
Well-Being Finding 4Across clinical learning environments, members of the clinical care team reported that burnout among faculty members and nurses was more prevalent than other members of the clinical care team. Burnout was reported among residents and fellows, it was less prevalent compared to faculty members and nurses.
Well-Being Finding 5A limited number of clinical learning environments appeared to have a systematic approach to preventing, recognizing, and effectively mitigating burnout among physicians. When clinical learning environments were engaged in efforts to address burnout, many were at varying stages of implementing solutions. It was uncommon for clinical learning environments to have assessed the effectiveness of these efforts.

CLER NATIONAL REPORT OF FINDINGS 2021 | CHALLENGES AND OPPORTUNITIES | 39
CLEs need to address both the whole workforce and the subgroups. Absent a comprehensive strategy, efforts
to shore up one subgroup will break down due to the stressors on the other members of the workforce relied
upon to collectively provide safe care.
Optimizing the well-being of the entire clinical care team is essential for providing safe, high-quality patient
care and requires ongoing commitment at the highest levels of the CLE. Governance and executive leaders
of CLEs can best demonstrate that commitment by developing formal strategies that create a long-term vision
of what well-being means to the organization and the patients it serves. To succeed, these strategies need to
be supported by plans that include specific, measurable, attainable, relevant, and timely (“SMART”) goals and
ongoing evaluation and assessment of progress towards them.
Comprehensive, organization-wide strategic well-being efforts may also benefit from common measurement
and data sharing across the institution and serve as a useful source for identifying successful practices within
a CLE. In these circumstances, the CLE’s leadership would use well-being data in a manner similar to the way
it uses other metrics for quality improvement within the organization.
Building a strategy that centers on system-based solutions for optimizing well-being
Finding 2 notes that many CLEs approach well-being by offering physicians and other clinical staff members
access to a variety of activities and resources aimed at building individual resilience. Common examples are
availability of exercise facilities, meditation and yoga instruction, and access to wellness programs. Providing
resilience resources appears to be an important initial step and one that is relatively easy to establish.
However, there are limitations to focusing primarily on wellness activities.
CLEs that address well-being primarily through wellness activities may be missing the more urgent systems-
level issues, such as inefficient workflow design, inadequate staffing, and sub-optimally designed electronic
health record systems. These issues place significant stress on all members of the clinical care team. As
such, well-being programs aimed primarily at building individual resilience may be viewed by the workforce
as superficial and a means to avoid the larger and more impactful concerns related to system breakdowns.
Failure to address the system-level issues impedes team building and erodes team members’ abilities to reflect
and learn—all of which negatively impact patient care.
The findings also note that many CLE efforts in well-being have been developed and implemented for special
areas within the CLE (such as oncology or burn units) or for one sector of the clinical care team (such
as residents and fellows), with little offered to the remaining units or team members. There are important
justifications for developing special efforts to support subpopulations of the workforce. The heavy burden
of illness in some units (e.g., oncology units) is a chronic stressor to the care teams on that unit. In addition,
unique groups such as residents and fellows may benefit from special attention because they lack the years of
experience that serve as a foundation for other members of the care team and so may be more vulnerable to
stressors. However, in focusing on special units or unique groups it is important to connect these efforts to a
comprehensive strategy that ensures equity is a key attribute of the CLE’s strategic approach to well-being.

40 | CHALLENGES AND OPPORTUNITIES | CLER NATIONAL REPORT OF FINDINGS 2021
The findings also identified a notable amount of burnouta reported across the CLEs. Burnout was also
reported to be prevalent across the various members of the clinical care teams. Given the large number of
studies in this area, this finding is expected.3,4 Nevertheless, it is noteworthy that residents and fellows appear
to currently be enveloped in teams where there is a high degree of burnout.
While studies of the effect of the environment on resident/fellow fatigue and burnout are still forthcoming,
it makes intuitive sense that the presence of burnout in GME faculty members and other members of the
clinical team adversely affects resident and fellow education and training, well-being, and ability to deliver safe
patient care. For these reasons, CLEs that principally address burnout as a resident/fellow issue will likely not
succeed absent interventions for faculty members and other members of the health care team.
There are multiple complex underlying issues driving the current level of burnout in the health care workforce.4
Some of these include the rapid evolution of health systems and changes in technology, the changing
expectations of patients seeking care, productivity pressures, and inefficiencies in health care payment and
workflow.
CLEs may find it challenging to develop systems-based approaches to addressing burnout and optimizing
workforce well-being, as it may require a detailed understanding of optimal workflow, placing maximums on
patient care volumes and intensity, and identifying and implementing successful practices for sharing patient
care among the members of the clinical care team. For these situations, the quality improvement framework
offers a tested model for approaching these systems-based issues as it addresses structure, process, and
outcomes as essential components of any comprehensive improvement strategy.
While the findings indicate the numbers are limited, it is encouraging to see there are CLEs addressing the
challenge of developing systems-based approaches to mitigating burnout among physicians. Avoidance of
burnout in both physicians and other members of the clinical care team is known to be associated with both
increased well-being of the care team member, and importantly with improved patient care.3 Therefore, the
finding that there are a small number of CLEs approaching this issue as a system concern is important and
encouraging as it is essential to address physician burnout from its root cause. All members of the clinical care
team benefit from a culture that avoids viewing burnout as a failure of individuals and remains ever vigilant in
avoiding care team burnout by continually identifying and solving systems-based issues that lead to care team
satisfaction and well-being. A clinical team that trusts that leadership is focused on prevention can themselves
best focus on optimizing patient care.
Given the high degree of CLE leadership interest in well-being noted in the CLER site visits, the next cycle of
visits is likely to report a higher prevalence of CLEs employing systems-based solutions to burnout, potentially
revealing important lessons learned in this area.
a The CLER Program used the following definition of burnout in conducting the site visits: Distinct from fatigue, burnout is
characterized by, but not limited to, losing enthusiasm for work, treating people as if they were objects, and having a sense that
work is no longer meaningful.
CLER NATIONAL REPORT OF FINDINGS 2021 | CHALLENGES AND OPPORTUNITIES | 41
REFERENCES1. Disch, Joanne, Charles M. Kilo, Morgan Passiment, Robin Wagner, and Kevin B. Weiss; National Collaborative for Improving the Clinical Learning Environment. 2017. “The Role of Clinical Learning Environments in Preparing New Clinicians to Engage in Patient Safety.” http://nicicle.org. Published September 27, 2017.
2. Passiment, Morgan, Robin Wagner, and Kevin B. Weiss, for the Pursuing Excellence in Clinical Learning Environments: Pathway Leaders Patient Safety Collaborative. 2020. “ACGME Summary Report: The Pursuing Excellence Pathway Leaders Patient Safety Collaborative.” Published September 30, 2020. doi:10.35425/ACGME.0006
3. Dyrbye, Lotte N., Tait D. Shanafelt, Christine A. Sinsky, Pamela F. Cipriano, Jay Bhatt, Alexander Ommaya, Colin P. West, and David Meyers. 2017. “Burnout Among Health Care Professionals: A Call to Explore and Address This Underrecognized Threat to Safe, High-Quality Care.” NAM Perspectives 7 (7). doi.org/10.31478/201707b.
4. National Academies of Sciences, Engineering, and Medicine. 2019. Taking Action Against Clinician Burnout: A Systems Approach to Professional Well-Being. Washington, D.C.: National Academies Press. doi.org/10.17226/25521.
CLER EVALUATION COMMITTEE Catherine M. Kuhn, MD, Current Co-Chair, Durham, NC; John Patrick T. Co, MD, MPH, FAAP, Immediate Past Co-Chair, Boston,
MA; Kevin B. Weiss, MD, Co-Chair, Chicago, IL; Jenny J. Alexopulos, DO, Tulsa, OK; Michael Apostolakos, MD, Rochester, NY;
Vamsi Aribindi, MD, Houston, TX; James P. Bagian, MD, PE, Ann Arbor, MI; Lindsay Dale, MD, Richmond, VA; Rosemary Gibson,
MSc, Arlington, VA; Linda A. Headrick, MD, MS, FACP, Columbia, MO; Robert Higgins, MD, Augusta, GA; Sherry C. Huang, MD,
New Brunswick, NJ; Marcia Hutchinson, MD, Savannah, GA; Lynne M. Kirk, MD, MACP, Chicago, IL; Anai N. Kothari, MD, MS,
Maywood, IL; Tanya Lord, PhD, MPH, Concord, NH; David Markenson, MD, MBA, FAAP, FACEP, FCCM, FACHE, Washington,
DC; David Mayer, MD, Columbia, MD; Lucie E. Mitchell, DO, MS, Birmingham, AL; Douglas E. Paull, MD, MS, FACS, FCCP,
CHSE, CPPS, Chicago, IL; Lakshmana Swamy, MD, MBA, Boston, MA; Andrew M. Thomas, MD, MBA, Columbus, OH; Marjorie
S. Wiggins, DNP, MBA, RN, FAAN, NEA-BC, Portland, ME; Ronald Wyatt, MD, MHA, DMS (Hon), Atlanta, GA

42 | CHALLENGES AND OPPORTUNITIES | CLER NATIONAL REPORT OF FINDINGS 2021
CLER NATIONAL REPORT OF FINDINGS 2021 | DETAILED FIND INGS | 43
INTRODUCTIONThis section includes detailed findings from the third cycle of visits of the CLER Program. The findings in the
six CLER Focus Areas1 are based on site visits to the major participating clinical sites (i.e., hospitals, medical
centers, ambulatory care sites, and other clinical settings) for 566 ACGME-accredited Sponsoring Institutions.
These sites serve as CLEs for the Sponsoring Institutions.2,3
Collectively, the 566 Sponsoring Institutions oversee 9,724 ACGME-accredited residency and fellowship
programs, with a range of one to 159 programs per Sponsoring Institution (median = 4). These Sponsoring
Institutions account for 92.7% of all residents and fellows in ACGME-accredited programs—with a range of
one to 1,661 residents/fellows per Sponsoring Institution (median = 74).
Approximately 29% of the CLEs were located in the southern region of the United States, 26.0% in the
northeast, 25.3% in the midwest, and 18.9% in the west. The sites ranged in size from 38 to 2,875 acute care
beds (median = 402). The majority (71.0%) were non-government, not-for-profit organizations; 17.2% were
government, non-federal; 7.9% were investor-owned, for-profit; and 3.9% were government, federal.
In total, the CLER teams interviewed more than 3,000 members of executive leadership (including CEOs);
11,166 residents and fellows; 9,988 core faculty members; and 6,489 program directors of ACGME-
accredited programs in the group interviews. Additionally, the CLER teams interviewed the CLEs’ leadership
in patient safety and health care quality, individuals formally or informally designated by executive leadership to
address the well-being of all members of the clinical care team at the clinical site, and thousands of residents,
fellows, faculty members, nurses, pharmacists, social workers, and other health care professionals while on
walking rounds in the clinical areas.
These findings are based on a mixed methods approach to data gathering and analysis to improve the
accuracy of the findings by combining quantitative, descriptive, and qualitative evidence in a complementary
manner (see Methodology, pp. 17-26). As such, some of the findings are represented quantitatively while
others are described qualitatively.
The combination of methodologies and varied representation of findings should be considered when
interpreting the results, making comparisons, or drawing conclusions. Both supporting and conflicting
evidence may be presented to explain or qualify findings. For example, results from the group interviews may
appear more positive than information gathered on walking rounds. Alternatively, practices reported during
group interviews may have been verified on walking rounds.
INTERPRETING QUANTITATIVE RESULTS FROM THE GROUP INTERVIEWSDuring the group interviews with residents and fellows, faculty members, and program directors, an electronic
audience response system (ARS; Keypoint Interactive version 2.6.6, Innovision Inc, Commerce Township,
Detailed Findings Nancy J. Koh, PhD; Robin Wagner, RN, MHSA; Robin C. Newton, MD, FACP; Hongling Sun, PhD; and Kevin B. Weiss, MD, on behalf of the CLER Program

44 | DETAILED FIND INGS | CLER NATIONAL REPORT OF FINDINGS 2021
MI) was used to collect anonymous responses to closed-ended questions. The results from the ARS were
analyzed at both the individual (e.g., residents and fellows) and the CLE levels.
At the individual level of analysis, results are presented as percentages of the total number of individuals
surveyed. For example:
“In the group interviews, 31.2% of the residents and fellows reported that they had received cultural competency training that was specific to the patients receiving care at their clinical site.”
At the CLE level of analysis, individual responses were aggregated at the CLE level and results are presented
as median and interquartile range (IQR) percentages. For example:
“Across CLEs, a median (IQR) of 30.0% (18.7%–50.0%) of the residents and fellows indicated that they had received cultural competency training that was specific to the patients receiving care at their clinical site.”
Statistically significant differences (i.e., P ≤ .05) in responses due to resident and fellow characteristics (e.g.,
residency/fellowship year) and CLE characteristics (e.g., bed size) are also reported. Of note, statistical
significance does not always imply practical significance. For example, differences in responses by residency/
fellowship year may be statistically significant but the differences may not be meaningful or large enough to
have practical relevance or implications.
ADDITIONAL CONSIDERATIONSAs described in the Methodology section (pp. 17-26), this report contains a specific set of descriptive terms
that summarize quantitative results from both the ARS and specific findings that were quantified from the
CLER Site Visit Reports. These terms and their corresponding quantitative ranges are as follows:
few (< 10%); some (10%-49%); most (50%-90%); and nearly all (> 90%).
Besides the quantitative data, this report contains qualitative data from a number of open-ended questions
that CLER Field Representatives asked during group interviews and walking rounds. This information, by
design, was not intended to be enumerated. For these questions, the site visit teams made an assessment
of the relative magnitude of observations at each individual site. To prevent confusion, these results are
presented in the report using a set of descriptive terms different from the previously described terms used for
quantitative data. The qualitative descriptive terms, which are intended to approximate the quantitative terms
above, are as follows:
uncommon or limited; occasionally; many; and generally.
Finally, this section follows approximately the same structure as the individual CLER Site Visit Reports
received by participating institutions. This structure is intended to facilitate easy comparison between data
from an individual site and that of this report, which aggregates results from all 566 Sponsoring Institutions.
Those who seek additional detail may consult the appendices (pp. 98-140).

CLER NATIONAL REPORT OF FINDINGS 2021 | DETAILED FIND INGS | 45
PATIENT SAFETY
The CLER Program explored several aspects of resident and fellow engagement in patient safety with
emphasis on five major topics: culture of safety; use of the patient safety event reporting system; knowledge of
patient safety principles and methods; inclusion in patient safety event investigations; and disclosure of patient
safety events.
Culture of Safety
Overall, 97.0% of the residents and fellows in the group interviews indicated that their CLE provides a safe
and non-punitive environment for reporting errors.
Across CLEs, physicians and other staff members also indicated use of the patient safety event reporting
system to report on individual behaviors. This included reporting on behaviors in a retaliatory fashion or in a
manner that could be perceived as punitive.
Given this and based on the collective findings from the site visits, it is unclear whether residents, fellows, and
other staff members perceived a safe and non-punitive culture for reporting patient safety events.
Use of the Patient Safety Event Reporting System
CLE Systems for Reporting
In general, CLEs had one or more mechanisms for reporting patient safety events, including an online or
paper-based patient safety event reporting system and a mechanism to verbally report events to the patient
safety staff members (e.g., a hotline). Patient safety events could also be reported through the chain of
command—reporting to an immediate supervisor (e.g., a more senior resident, faculty member, or nurse
supervisor).
Across CLEs, residents and fellows appeared to be aware of their CLE’s process for reporting patient safety
events such as adverse events, near misses/close calls, and unsafe conditions. During walking rounds, the
CLER site visit team also asked nurses about their CLE’s patient safety event reporting system. Across nearly
all CLEs (98.6%), nurses appeared to be familiar with their CLE’s system for reporting patient safety events.
Overall, 69.6% of CLEs were able to track the number of patient safety event reports submitted by residents
and fellows (see Appendix C1). Approximately 61% of CLEs were able to track the number of patient safety
event reports submitted by medical staff physicians. The remaining CLEs indicated that their system did not
track such information.
While CLEs occasionally provided the Graduate Medical Education Committee (GMEC) and their governing
body with information on the number or percentage of patient safety event reports submitted by residents and
fellows, it was less common for them to routinely provide the same groups with the number or percentage of
patient safety event reports submitted by medical staff physicians.
Understanding of Reportable Events
Generally, across CLEs, the residents and fellows interviewed on walking rounds appeared to lack
understanding and awareness of the range of reportable patient safety events, including what defines a near
miss/close call. In many CLEs, nurses’ understanding and awareness of reportable patient safety events also
varied.

46 | DETAILED FIND INGS | CLER NATIONAL REPORT OF FINDINGS 2021
Across CLEs, residents, fellows, and nurses appeared to focus on reporting sentinel events, medication
errors, patient falls, and other events with harm; they did not appear to recognize near misses/close calls,
unsafe conditions, events without harm, unexpected deteriorations, or known procedural complications that
occurred as reportable patient safety events. Residents and fellows appeared to have little awareness of the
importance of reporting these events and how such reporting can provide valuable information for identifying
system failures, addressing vulnerabilities in the system, reducing risks, and consistently improving patient
safety.
Reporting
Many CLEs did not appear to have specific goals for resident and fellow recognition and reporting of adverse
events, near misses, and unsafe conditions.
Approximately 74% of the residents and fellows in the group interviews indicated they had experienced an
adverse event, near miss/close call, or unsafe condition while at their CLE (median [IQR], 75.0% [60.0%-
83.5%] across CLEs). This experience varied by gender, year of training, and specialty grouping (see
Appendix B1 for additional information on variability).
Of the residents and fellows who reported they had experienced an adverse event, near miss/close call, or
unsafe condition, 54.0% indicated they had personally reported the patient safety event using the CLE’s
patient safety event reporting system (median [IQR], 56.4% [37.9%-75.0%] across CLEs). Responses varied
by gender, year of training, and specialty grouping (Figure 1; see also Appendix B2 for additional information
on variability). For those who did not personally enter the patient safety event into the system, 11.5% indicated
they relied on a nurse or medical assistant to submit the patient safety event report, 22.6% indicated they
relied on a physician supervisor, and 12.0% indicated that they cared for the patient and chose not to submit
a report.
Figure 1. Percentage of Residents and Fellows Who Reported Experiencing an Adverse Event, Near Miss/Close Call, or Unsafe Condition and Submitted a Report through the Clinical Site’s Reporting System, by Specialty Group
0%
10%
20%
30%
40%
50%
60%
Hospital-BasedSurgicalMedical
Resid
ents
and
Fello
ws, %
Specialty Group
58.3%
50.9%
44.2%
70%

CLER NATIONAL REPORT OF FINDINGS 2021 | DETAILED FIND INGS | 47
When the CLER teams asked faculty members and program directors what process residents and fellows
most frequently followed when reporting a patient safety event, 64.4% of the faculty members and 57.8%
of the program directors in the group interviews indicated they believed residents and fellows most often
reported the event themselves using the CLE’s patient safety event reporting system.
The CLER teams also explored faculty members’ and program directors’ use of the CLE’s patient safety
event reporting system. Approximately 37% of the faculty members reported they had personally reported an
adverse event, near miss/close call, or unsafe condition in the past year (median [IQR], 37.5% [25.0%-50.0%]
across CLEs). Among the program directors, 39.1% reported they had personally reported an adverse event,
near miss/close call, or unsafe condition in the past year (median [IQR], 44.4% [22.2%-75.0%] across CLEs);
5.7% had no clinical responsibilities at the site. In both groups, responses varied by CLE bed size and type of
ownership.
In a separate query, 22.4% of the residents and fellows in the group interviews indicated they had reported a
near miss/close call event while at the CLE, with responses varying by gender, specialty grouping, and year of
training (Figure 2). Across CLEs, the median (IQR) finding was 21.4% (10.0%-33.3%); responses varied by
region, CLE bed size, and type of ownership. Appendix B3 provides detailed information on variability.
Figure 2. Percentage of Residents and Fellows Who Reported a Near Miss/Close Call Event, by Level of Training. Abbreviation: PGY, postgraduate year.
0%
10%
20%
30%
40%
PGY-4+PGY-3PGY-2
Resid
ents
and
Fello
ws, %
Level of Training
24.8%26.9%
17.9%
While indicating familiarity with the patient safety event reporting system and its use, residents and fellows
interviewed on walking rounds in many CLEs mentioned that they often report patient safety events locally or
through their chain of command. When they delegated or relied on others to report, it was unclear if these reports
were formally captured in the CLE’s centralized patient safety event reporting system. Residents and fellows
mentioned the cumbersome process of submitting a report, lack of feedback, the time needed to enter a report,
and fears of repercussion as reasons for not reporting.
Based on the collective information from the site visits, resident and fellow reporting of patient safety events into
the CLE’s patient safety event reporting system was varied or infrequent in 93.3% of the CLEs (see Appendix C2).

48 | DETAILED FIND INGS | CLER NATIONAL REPORT OF FINDINGS 2021
Feedback on Patient Safety Event Reports
In the group interviews, the CLER teams asked residents and fellows whether they received feedback on
patient safety event reports. Of those who had experienced an adverse event, near miss/close call, or unsafe
condition and who had personally submitted a patient safety event report or relied on a nurse, medical
assistant, or supervisor to submit the report, 46.0% reported that they received feedback on the outcome of
the report. Responses varied by gender, specialty grouping, and year of training. Across CLEs, the median
(IQR) finding was 50.0% (31.7%-66.7%), with responses varying by region, CLE bed size, and type of
ownership (Figure 3). Appendix B4 provides complete information on variability.
Figure 3. Percentage of Residents and Fellows Who Reported Receiving Feedback on the Outcome of a Patient Safety Event Report Submitted, by Type of Clinical Learning Environment (CLE) Ownership
Resid
ents
and
Fello
ws, %
Type of CLE Ownership
0%
10%
20%
30%
40%
50%
60%
Government,Non-Federal
Government,Federal
Investor-Owned,For-Profit
Non-Government,Not-For-Profit
47.6%
36.2%
50.2%
41.6%
Residents and fellows sometimes mentioned receiving an email acknowledging receipt of the patient safety
event report. They also noted receiving requests for additional information as part of a formal patient safety event
investigation when they were involved in the event. It was uncommon for residents to mention receiving information
on the outcome of the investigation, including recommended actions to address vulnerabilities in the system and
improve patient safety. Across CLEs, residents, fellows, nurses, and other clinical staff members expressed a
strong desire to receive feedback in response to submitting a patient safety event report.
CLEs varied in their processes for reviewing and prioritizing reported patient safety events or patient safety event
reports. Residents and fellows also varied in their knowledge of these processes and often used the term “black
box,” indicating that these processes were unclear. Many residents and fellows appeared to be unaware of how
their CLE use the reporting of adverse events, near misses/close calls, or unsafe conditions to improve care
broadly and at the individual departmental level. Residents and fellows were rarely involved in their CLE’s process
for reviewing and prioritizing reported patient safety events or patient safety event reports that required further
investigation.
Time-Outs
As part of patient safety practices, the CLER teams explored resident and fellow participation in the time-out
process (e.g., ambulatory and bedside procedures). Across many CLEs, residents, fellows, nurses, and other
health care professionals interviewed on walking rounds indicated that residents and fellows do not consistently
conduct standardized time-outs before performing ambulatory and bedside procedures.

CLER NATIONAL REPORT OF FINDINGS 2021 | DETAILED FIND INGS | 49
Knowledge of Patient Safety Principles and Methods
Across most CLEs (88.5%), residents and fellows appeared to have limited knowledge of fundamental patient
safety principles and methods (e.g., fishbone diagrams, root cause analysis, Swiss cheese model of system
failure; see Appendix C3).
The majority of the program directors in the group interviews indicated they were either proficient or expert
(66.6% and 21.2%, respectively) in applying patient safety principles.
Inclusion in Patient Safety Event Investigations
In many CLEs, the patient safety and quality leaders indicated that they track resident and fellow participation
in patient safety event investigations (e.g., root cause analysis). Several CLEs provided the GMEC and the
governing body with information regarding the number of residents and fellows who had participated in formal
patient safety event investigations. Overall, many CLEs did not appear to have measures of success with
regard to including residents and fellows in patient safety event investigations.
The CLER teams also asked the program directors if they measured resident and fellow participation in patient
safety event investigations. Across CLEs, a median (IQR) of 50.0% (23.3%-80.0%) of the program directors
in the group interviews reported tracking resident and fellow involvement, with responses varying by region,
CLE bed size, and type of ownership.
In the group interviews, 40.4% of the residents and fellows who were post-graduate year 3 (PGY-3) and
higher indicated that they had participated in an interprofessional investigation of a patient safety event that
included components such as analysis of system issues, development and implementation of an action plan,
and monitoring for continuous improvement. Reponses varied by specialty grouping (Figure 4). Across CLEs,
the median (IQR) finding was 40.0% (26.6%-61.6%), with responses varying by region and type of ownership.
Appendix B5 provides detailed information on variability.
Figure 4. Percentage of Residents and Fellows (Post-Graduate Year 3 and Above) Who Reported Participating in an Interprofessional Investigation of a Patient Safety Event, by Specialty Group.
0%
10%
20%
30%
40%
50%
Hospital-BasedSurgicalMedical
Resid
ents
and
Fello
ws, %
Specialty Group
41.3% 41.2%36.7%

50 | DETAILED FIND INGS | CLER NATIONAL REPORT OF FINDINGS 2021
Overall, the format and process of investigating patient safety events varied both across and within CLEs.
Across many CLEs, departmental morbidity and mortality conferences, case conferences, and grand rounds—
limited to physician participation—were commonly described as the primary means by which residents and
fellows experience patient safety event investigations. It was uncommon for residents and fellows to describe
involvement in interprofessional comprehensive systems-based approaches to patient safety event investigations
aimed at preventing future adverse events, improving patient care, and sustaining improvements in patient safety.
In general, residents and fellows described experiences that lacked the attributes of a formal patient safety event
investigation with minimal or no interprofessional or interdisciplinary engagement. Residents and fellows varied
widely in their perceptions of what constituted a formal investigation of a patient safety event.
Disclosure of Patient Safety Events
Approximately 72% of the residents and fellows in the group interviews indicated they had received training
on disclosing medical errors to patients and/or families (3.4% reported that such training was not applicable).
Responses varied by gender, year of training, and specialty grouping. Across CLEs, the median (IQR) finding
was 77.8% (64.6%-89.4%), with responses varying by region and CLE bed size. Of those who received training,
9.2% indicated that the training was primarily simulation based; 34.6%, lecture based; 26.2%, online; 28.4%,
informal; and 1.5%, other.
When asked if they knew of CLE resources to assist them in coping with a major patient safety event that
resulted in a patient death or harm, 85.5% of the residents and fellows in the group interviews indicated
that they knew of such resources. Across CLEs, the median (IQR) finding was 90.9% (80.0%-100%), with
responses varying by region, CLE bed size, and type of ownership (see Appendix B6). Of those familiar with the
resources, most indicated they would be somewhat (39.8%) or very (42.8%) comfortable using these resources.

CLER NATIONAL REPORT OF FINDINGS 2021 | DETAILED FIND INGS | 51
HEALTH CARE QUALITY (INCLUDING HEALTH CARE DISPARITIES)The CLER Program explored resident and fellow engagement in improving health care quality within the
context of six major areas: involvement in developing and implementing the CLE’s strategies for health care
quality; awareness of the CLE’s health care quality priorities; knowledge of health care quality terminology and
methods; engagement in quality improvement (QI) projects; access to quality metrics data; and engagement in
CLE efforts to eliminate health care disparities.
Involvement in Developing Health Care Quality Strategies
As part of understanding the CLE’s approach to improving health care quality, the CLER teams reviewed each
organization’s strategic plan for quality and interviewed both executive and patient safety and quality leaders.
Across CLEs, resident and fellow involvement in strategic planning for QI was uncommon. Residents and
fellows often served as implementers of CLE-wide QI activities (e.g., hand hygiene, reducing hospital-acquired
infections, reducing 30-day readmissions).
In many CLEs, resident and fellow participation in institutional QI committees was uncommon. If residents and
fellows were assigned to these committees, roles and expectations for participation were often undefined or
unclear. The clinical sites also appeared to have insufficient structure to allow residents and fellows to attend
committee meetings regularly and to participate in meaningful ways. Additionally, residents and fellows in many
CLEs were not included in the governing body’s patient safety and quality committees.
Priorities for Improving Health Care Quality
While priorities for improving health care quality varied across CLEs, some common themes included alignment
with broad national priorities, such as Centers for Medicare & Medicaid Services value-based purchasing,
Core Measures, or other publicly reported performance measures. Many CLEs were highly focused on meeting
specific criteria, such as reducing 30-day readmissions or improving performance on metrics related to chronic
heart failure, pneumonia, and surgical care improvement project measures.
In the group interviews, 75.3% of the residents and fellows (PGY-2 and above) reported knowing their CLE’s
priorities for improving health care quality (see Appendix B7 for additional information on variability). When
asked the same question, 82.2% of the faculty members and 84.7% of the program directors reported
knowing the priorities. The physician groups often focused on departmental activities and did not describe
priorities that aligned with those identified by the CLE’s executive leadership or the patient safety and quality
leaders. When the physicians identified priorities aligned with those of executive leadership, they were
most commonly around nationally recognized measures, especially those related to programs with financial
incentives such as measures from the Centers for Medicare & Medicaid Services.
Knowledge of Health Care Quality Improvement
In general, the approach to educating residents and fellows about health care QI varied both within and across
CLEs. Although some type of education was common as part of new resident and fellow orientation, a limited
number of CLEs aimed to provide ongoing training for all residents and fellows. Training in health care QI
appeared to occur primarily within departments or individual graduate medical education (GME) programs, and
the format, methods, and content appeared to vary widely.

52 | DETAILED FIND INGS | CLER NATIONAL REPORT OF FINDINGS 2021
In 62.1% of the CLEs, the residents and fellows appeared to have limited knowledge or understanding of basic QI
terminology and methods, such as Lean, Plan-Do-Study-Act, and Six Sigma (Figure 5, see also Appendix C4). A
limited number of residents and fellows could articulate the QI approach employed by their CLE in designing and
implementing QI activities to improve patient care.
Few Had a Working Knowledge
of Quality Improvement
Concepts
62.1%
Most Had a Working Knowledge of Quality Improvement Concepts11.4%
Some Had a Working Knowledge of Quality Improvement Concepts26.5%
Figure 5. Percentage of Clinical Learning Environments by Proportion of Resident and Fellow Knowledge of Basic Quality Improvement Concepts
Engagement in Quality Improvement Projects
Approximately 79% of the residents and fellows (PGY-2 and above) in the group interviews reported they had
participated in a QI project of their own design, or one designed by their program, department, or ambulatory
care setting. Of this group, 47.5% reported their QI project was directly linked to one or more of the CLE’s
goals; 25.3% were uncertain. Of those who reported their QI projects were linked to the CLE’s goals, 74.2%
reported that their projects involved interprofessional teams. Appendices B8, B9, and B10 provide complete
information on variability.

CLER NATIONAL REPORT OF FINDINGS 2021 | DETAILED FIND INGS | 53
In the group interviews and on walking rounds, the CLER teams asked residents and fellows to describe their
QI projects. Overall, it was uncommon for residents and fellows to describe projects that aligned with their
CLE’s priorities. In most CLEs (81.4%), few described projects that included the all components of a complete
QI cycle (i.e., Plan-Do-Study-Act) (Figure 6; see also Appendix C5). Often, resident and fellow participation
was limited to planning and implementing a QI activity. For many residents and fellows, their QI projects did not
involve formally assessing effectiveness and designing follow-up actions to adjust, support, and sustain ongoing
QI efforts.
Across CLEs, it was also uncommon for residents and fellows to describe involvement in interprofessional
team-based QI projects that reflected collaborative engagement in each stage of QI work—including planning,
implementing, and monitoring outcomes. During the interviews on walking rounds, a limited number of nurses
and other health care professionals indicated they were involved in interprofessional QI projects that included
residents and fellows.
In 9.4% of the CLEs, the patient safety and quality leaders indicated that they centrally monitor all resident- and
fellow-led QI projects.
Access to Data
In the group interviews, 77.4% of the program directors reported that their residents and fellows have ready
access to organized systems for collecting and analyzing data for the purposes of QI. Electronic health records,
specialty-specific clinical registries, and local, regional, or national quality dashboards were often reported as
common sources of QI data. Residents and fellows often mentioned the challenges (e.g., long waiting lists) in
acquiring specific reports from these data sources.
Many program directors noted that residents and fellows had limited support for data analysis. When support
existed, it was often a departmental resource. The type and extent of analytic support services available to
residents and fellows varied both within and across CLEs.
Most Projects2.7%
Few Projects
81.4%
Some Projects
15.9%
Figure 6. Percentage of Clinical Learning Environments by Proportion of Resident and Fellow Quality Improvement Projects with Components of a Complete Quality Improvement Cycle

54 | DETAILED FIND INGS | CLER NATIONAL REPORT OF FINDINGS 2021
Overall, 31.8% of the residents and fellows in the group interviews reported receiving aggregated or
benchmarked QI data on their own patients. Responses varied by year of training and specialty grouping (Figure 7). Across CLEs, the median (IQR) finding was 33.6% (20.0%-45.6%), with responses varying by region, CLE
bed size, and type of ownership. Appendix B11 provides complete information on variability.
While many patient safety and quality leaders indicated that residents and fellows receive department or clinical
service line quality performance data, it was less common for them to receive quality performance data specific
to their patients.
Engagement in CLE Efforts to Eliminate Health Care Disparities
Strategies Focused on Eliminating Health Care Disparities
Across many CLEs, executive leaders were aware of issues of health disparities affecting their surrounding
communities. Many described using information gleaned from their community health needs assessments to
improve access to care and providing free or low-cost care and clinics for the underserved, often staffed by
residents and fellows from a few core specialties (e.g., family medicine, internal medicine, pediatrics, obstetrics
and gynecology). A limited number of residents and fellows from other specialty and subspecialty programs
reported engaging in these activities.
A limited number of executive leaders spoke to health care disparities occurring within their hospital or medical
center. Overall, 2.0% of executive leaders described a specific set of strategies or a systematic approach to
identifying, addressing, and continuously assessing variability in the care provided to or the clinical outcomes
of their patient populations at risk for health care disparities. Approximately 14% of executive leaders
described what appeared to be the early stages of developing a systematic approach to identifying variability
in the care provided to or the clinical outcomes of their patient populations at risk for health care disparities.
Across CLEs, a limited number of executive leaders described measures that appeared to focus on health
care disparities as part of the CLE’s process for tracking quality and safety performance measures. It was
also uncommon for CLEs to provide their governing body with information on quality metrics by subgroups of
vulnerable patient populations.
Figure 7. Percentage of Residents and Fellows Who Reported Receiving Aggregated or Benchmarked Quality Performance Data About the Care of Their Own Patients, by Specialty Group
0%
10%
20%
30%
40%
50%
Hospital-BasedSurgicalMedical
Resid
ents
and
Fello
ws, %
Specialty Group
36.6%
23.0%
28.4%
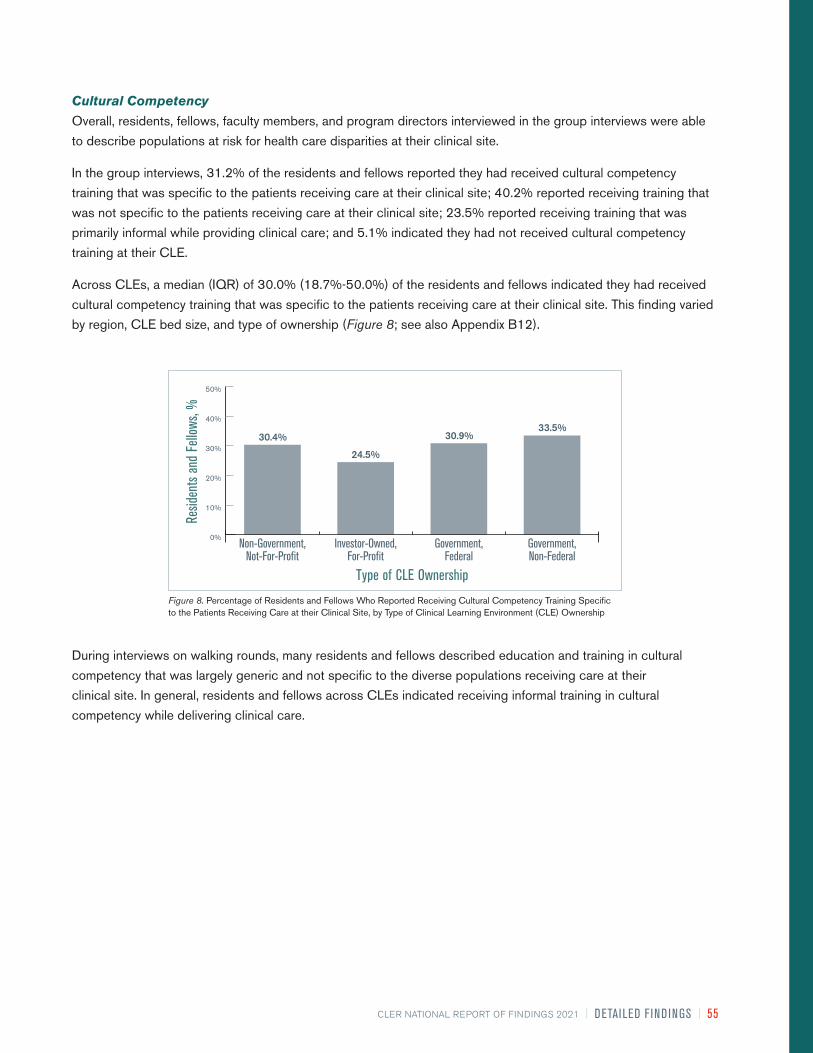
CLER NATIONAL REPORT OF FINDINGS 2021 | DETAILED FIND INGS | 55
Cultural Competency
Overall, residents, fellows, faculty members, and program directors interviewed in the group interviews were able
to describe populations at risk for health care disparities at their clinical site.
In the group interviews, 31.2% of the residents and fellows reported they had received cultural competency
training that was specific to the patients receiving care at their clinical site; 40.2% reported receiving training that
was not specific to the patients receiving care at their clinical site; 23.5% reported receiving training that was
primarily informal while providing clinical care; and 5.1% indicated they had not received cultural competency
training at their CLE.
Across CLEs, a median (IQR) of 30.0% (18.7%-50.0%) of the residents and fellows indicated they had received
cultural competency training that was specific to the patients receiving care at their clinical site. This finding varied
by region, CLE bed size, and type of ownership (Figure 8; see also Appendix B12).
Figure 8. Percentage of Residents and Fellows Who Reported Receiving Cultural Competency Training Specific to the Patients Receiving Care at their Clinical Site, by Type of Clinical Learning Environment (CLE) Ownership
Resid
ents
and
Fello
ws, %
Type of CLE Ownership
0%
10%
20%
30%
40%
50%
Government,Non-Federal
Government,Federal
Investor-Owned,For-Profit
Non-Government,Not-For-Profit
30.4%
24.5%
30.9%33.5%
During interviews on walking rounds, many residents and fellows described education and training in cultural
competency that was largely generic and not specific to the diverse populations receiving care at their
clinical site. In general, residents and fellows across CLEs indicated receiving informal training in cultural
competency while delivering clinical care.

56 | DETAILED FIND INGS | CLER NATIONAL REPORT OF FINDINGS 2021
Figure 9. Percentage of Residents and Fellows Who Reported Participating in a Quality Improvement Project Focused on Eliminating Health Care Disparities, by Specialty Group
0%
10%
20%
Hospital-BasedSurgicalMedical
Resid
ents
and
Fello
ws, %
Specialty Group
10.0%
7.9%
4.9%
Participation in Quality Improvement to Address Health Care Disparities
Approximately 9% of the residents and fellows in the group interviews reported that they had participated
in a QI project focused on eliminating health care disparities at their clinical site (median [IQR], 5.5% [0%-
15.4%] across CLEs); responses varied by gender, year of training, and specialty grouping (Figure 9, see
also Appendix B13). In group discussions and on walking rounds, residents and fellows indicated that they
rarely received CLE data related to health care disparities.

CLER NATIONAL REPORT OF FINDINGS 2021 | DETAILED FIND INGS | 57
CARE TRANSITIONSThe CLER Field Representatives explored several aspects of resident and fellow engagement in improving care
transitions, including perceived vulnerabilities in care transitions, education on care transitions, change-of-duty
transitions, inpatient transition processes, and supervision and assessment of care transitions.
Perceived Vulnerabilities in Care Transitions
Across CLEs, residents, fellows, nurses, and other clinical staff members identified many transitions they
believed posed vulnerabilities in patient safety. Examples included transfers from the emergency department
to inpatient floors or units, transfers from the intensive care units to the floors, transfers from and to outside
facilities, transfers from inpatient care back to the community, and multiple intra-hospital transitions, such
as service-to-service and floor-to-floor, as well as between levels of care. Residents, fellows, and nurses
often expressed concerns that communication during these transitions was most likely to be incomplete or
inaccurate, leading to vulnerabilities for patient safety events.
Education on Care Transitions
Overall, 59.4% of the residents and fellows reported they had participated in formal interprofessional
educational activities on transitioning patient care (9.9% reported that transitioning patients’ care does not
apply to their specialty). Responses varied by gender, level of training, and specialty group. Across CLEs, this
finding ranged from 0% to 100%, with a median (IQR) of 66.7% (50.0%-83.3%); responses varied by region,
CLE bed size, and type of ownership (Figure 10). Appendix B14 provides detailed information on variability.
Figure 10. Percentage of Residents and Fellows Who Reported Participating in Formal Interprofessional Educational Activities in How to Transition Patients’ Care, by Type of Clinical Learning Environment (CLE) Ownership
Resid
ents
and
Fello
ws, %
Type of CLE Ownership
0%
20%
40%
60%
80%
100%
Government,Non-Federal
Government,Federal
Investor-Owned,For-Profit
Non-Government,Not-For-Profit
66.6% 64.7%
77.4%
62.8%

58 | DETAILED FIND INGS | CLER NATIONAL REPORT OF FINDINGS 2021
Change-of-Duty Transitionsa
In the group interviews, 78.3% of the residents and fellows reported that they followed a standardized process
for change-of-duty hand-offs (10.5% reported that change-of-duty hand-offs do not apply to their specialty).
Across CLEs, this finding ranged from 12.5% to 100%, with a median (IQR) of 88.7% (75.0%-100%). Of the
residents and fellows who reported following a standardized process between shifts, 78.4% reported using a
standardized written template of patient information to facilitate the hand-off process. Across CLEs, the median
(IQR) finding was 83.8% (70.8%-100%), with responses varying by region, type of ownership, and CLE bed
size (Figure 11). Appendices B15 and B16 provide complete information on variability.
Figure 11. Percentage of Residents and Fellows Who Reported Following a Standardized Process for Hand-Offs Between Shifts that Included a Standardized Written Template for Communication, by Clinical Learning Environment (CLE) Bed Size
0%
20%
40%
60%
80%
100%
500 or More400-499300-399200-299< 200
Resid
ents
and
Fello
ws, %
CLE Bed Size
85.2% 83.8% 79.8% 79.1% 75.6%
When asked how often attending physicians supervise their shift-to-shift hand-off process, 22.0% of the
residents and fellows in the group interviews reported that this supervision occurs daily, whereas 43.7%
reported it rarely occurs. Other responses included once per week (11.3%) and once per month (7.8%).
Approximately 15% reported that shift-to-shift hand-offs do not apply to their specialty.
In group interviews, 73.8% of faculty members reported that they assess resident and fellow readiness to
move from direct to indirect supervision in conducting change-of-duty hand-offs (14.0% reported that they do
not conduct change-of-duty hand-offs in their program).
Approximately 61% of the program directors in the group interviews indicated that their program assesses
resident and fellow readiness to move from direct to indirect supervision in conducting change-of-duty hand-
offs (21.4% reported that their program does not conduct change-of-duty hand-offs). For those who indicated
their program assesses resident and fellow readiness, 60.3% indicated that assessment occurs by direct
observation only, 32.0% used both direct observation and a standardized assessment tool, and 7.7% reported
other.
a Results from visits that were held exclusively in the ambulatory care setting (9%) have been omitted due to modifications to the question and/or scenario to better fit the setting. These modifications limited comparability across inpatient and ambulatory care settings.

CLER NATIONAL REPORT OF FINDINGS 2021 | DETAILED FIND INGS | 59
From the information obtained on walking rounds, it appeared that the processes for transitioning care at
change-of-duty vary across programs in most CLEs (72.4%) (Figure 12; see also Appendix C6).
Some Standardization
72.4%
No Standardization10.4%
All Standardized17.2%
Figure 12. Percentage of Clinical Learning Environments with Hand-Off Processes that Were Standardized Across Programs, Based on Direct Observation
On average, the CLER teams observed resident and fellow change-of-duty hand-offs for one to five programs
per visit. Overall, the hand-offs varied both within and across CLEs. Many were conducted in quiet, non-
patient areas with minimal interruption. The hand-offs varied in the use of electronic or written templates and
other common tools for formal communication. Generally, faculty members were not consistently engaged in
supervising these hand-offs, and interprofessional involvement was uncommon. Contingency planning (“if-
then” scenarios) and read-back techniques to confirm the plan of care were also inconsistent.

60 | DETAILED FIND INGS | CLER NATIONAL REPORT OF FINDINGS 2021
Inpatient to Outpatient Transitionsa
When queried, 48.2% of the residents and fellows in the group interviews indicated that they use a
standardized process for transitioning patients from inpatient to outpatient care (25.5% indicated that
transitioning patients from inpatient to outpatient care did not apply to their specialty). Across CLEs, the
median (IQR) was 57.1% (40.0%-80.0%), with responses varying by region and bed size (Figure 13; see
Appendix B17).
Nature of interprofessional rounds varied across and within CLEs. These types of rounds were most
commonly reported to occur in the intensive care units, when planning for transitioning patients to outpatient
care, or for purposes of discharge planning to home and other facilities (e.g., rehabilitation centers, skilled
nursing facilities).
Monitoring Care Transitions
The patient safety and quality leaders in many CLEs indicated that they analyze patient safety event reports for
issues related to resident and fellow transitions of care; they seldom mentioned proactive monitoring of these
care transitions.
Figure 13. Percentage of Residents and Fellows Who Reported Following Standardized Processes for Handling Transitions of Care from Inpatient to Outpatient Care, by Clinical Learning Environment (CLE) Bed Size
0%
20%
40%
60%
80%
100%
500 or More400-499300-399200-299<200
Resid
ents
and
Fello
ws, %
CLE Bed Size
71.9% 71.9% 68.3%63.7% 61.5%
a Results from visits that were held exclusively in the ambulatory care setting (9%) have been omitted due to modifications to the question and/or scenario to better fit the setting. These modifications limited comparability across inpatient and ambulatory care settings.
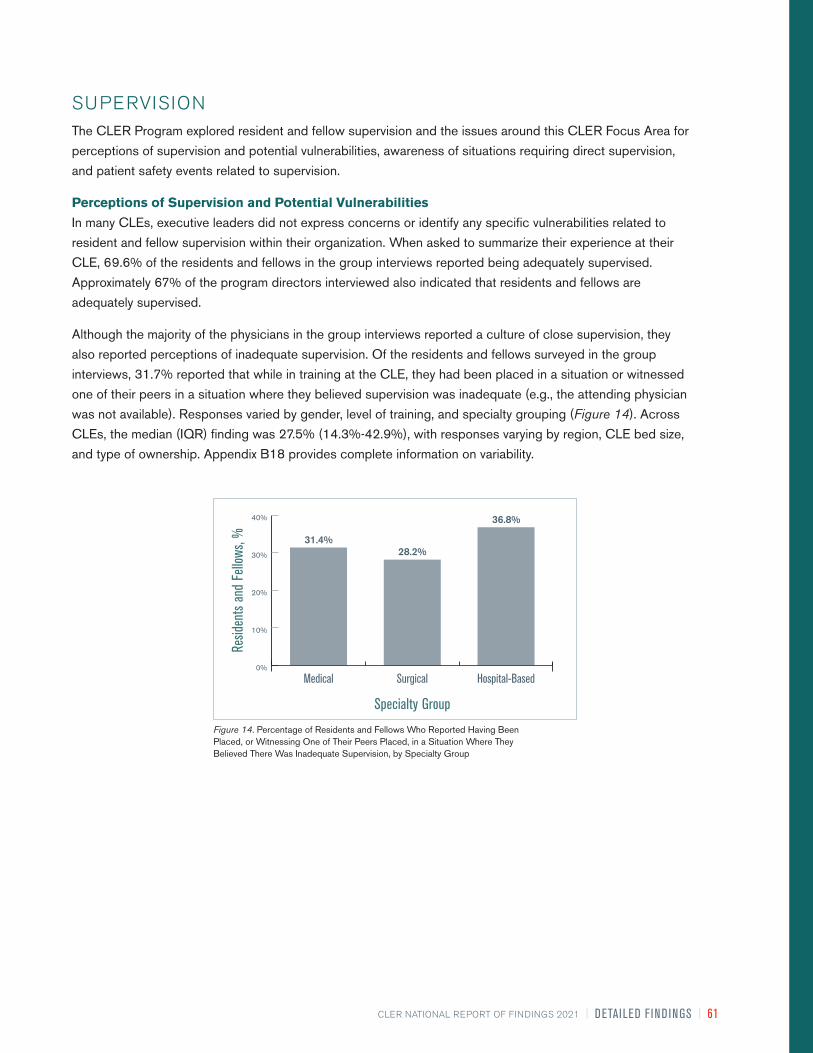
CLER NATIONAL REPORT OF FINDINGS 2021 | DETAILED FIND INGS | 61
Figure 14. Percentage of Residents and Fellows Who Reported Having Been Placed, or Witnessing One of Their Peers Placed, in a Situation Where They Believed There Was Inadequate Supervision, by Specialty Group
0%
10%
20%
30%
40%
Hospital-BasedSurgicalMedical
Resid
ents
and
Fello
ws, %
Specialty Group
31.4%28.2%
36.8%
SUPERVISIONThe CLER Program explored resident and fellow supervision and the issues around this CLER Focus Area for
perceptions of supervision and potential vulnerabilities, awareness of situations requiring direct supervision,
and patient safety events related to supervision.
Perceptions of Supervision and Potential Vulnerabilities
In many CLEs, executive leaders did not express concerns or identify any specific vulnerabilities related to
resident and fellow supervision within their organization. When asked to summarize their experience at their
CLE, 69.6% of the residents and fellows in the group interviews reported being adequately supervised.
Approximately 67% of the program directors interviewed also indicated that residents and fellows are
adequately supervised.
Although the majority of the physicians in the group interviews reported a culture of close supervision, they
also reported perceptions of inadequate supervision. Of the residents and fellows surveyed in the group
interviews, 31.7% reported that while in training at the CLE, they had been placed in a situation or witnessed
one of their peers in a situation where they believed supervision was inadequate (e.g., the attending physician
was not available). Responses varied by gender, level of training, and specialty grouping (Figure 14). Across
CLEs, the median (IQR) finding was 27.5% (14.3%-42.9%), with responses varying by region, CLE bed size,
and type of ownership. Appendix B18 provides complete information on variability.

62 | DETAILED FIND INGS | CLER NATIONAL REPORT OF FINDINGS 2021
Figure 15. Percentage of Residents and Fellows Who Reported Encountering a Physician (Attending Physician or Consultant) Who Made Them Feel Occasionally or Frequently Uncomfortable When Requesting Assistance, by Gender
Resid
ents
and
Fello
ws, %
Gender
45.1%
52.7%
0%
10%
20%
30%
40%
50%
60%
FemaleMale
In discussing issues related to supervision that may be creating patient safety vulnerabilities, the physician
groups frequently mentioned the challenges of providing supervision in the evenings, on weekends, and during
times of high acuity and patient volume. They also noted that competing clinical responsibilities further limited
the availability of faculty members to supervise residents and fellows.
Across CLEs, many residents and fellows expressed hesitancy to request help from attending physicians,
non-core faculty members, and consultants or to report concerns regarding supervision. They noted reluctance
or discomfort to ask for assistance due to a lack of understanding of when to escalate concerns in a timely
manner, uncertainty about who is on call, unwillingness to appear unprepared, fear of retaliation or other
negative consequences, and/or potential resistance when asking for help.
Residents and fellows also mentioned gaps in supervision when their peers provide consultative services,
noting these gaps as a potential source of patient safety vulnerabilities.
In addition to concerns of under-supervision, many program directors expressed concerns related to over-
supervision, particularly in the procedural specialties, and the impact on resident and fellow readiness for
independent practice. In discussing the factors that contribute to over-supervision, program directors often
mentioned medical liability concerns and billing requirements.
In the group interviews, the CLER teams also asked residents and fellows about their experiences in contacting
attending physicians and consultants for assistance. Overall, 48.7% indicated they had encountered an
attending physician or consultant who made them feel occasionally or frequently uncomfortable when
requesting help at their clinical site (median [IQR], 50.0% [33.3%-68.8%] across CLEs). This finding varied by
level of training, specialty group, and gender (Figure 15; see also Appendix B19). Approximately 50% of the
program directors perceived their residents and fellows had encountered an attending physician or consultant
who made them feel occasionally or frequently uncomfortable in requesting help.

CLER NATIONAL REPORT OF FINDINGS 2021 | DETAILED FIND INGS | 63
Awareness of Situations Requiring Direct Supervision
Overall, 91.6% of the residents and fellows in the group interviews reported that they knew what they were
allowed to do without direct supervision. Responses varied by level of training and specialty grouping (see
Appendix B20).
In a separate query, 30.1% of the residents and fellows in the group interviews indicated they had an objective
way to know what procedures their peers from other services were allowed to do without direct supervision
when providing consultative services on their patients (17.7% reported that residents and fellows from other
services do not consult on their patients). This finding varied by gender and specialty grouping (see Appendix
B21).
Nearly 76% of the faculty members in the group interviews indicated they had an objective way of knowing
which procedures a particular resident or fellow was allowed to perform without direct supervision (10.9%
reported that their residents and fellows do not perform procedures). In many CLEs, faculty members reported
this information is documented in an online system and maintained by the GME office or individual programs.
In general, faculty members and programs directors indicated that nurses and other clinical staff members
had mechanisms (e.g., paper or online methods) to verify the level of supervision needed when residents and
fellows perform clinical procedures outside of the operative areas. During the walking rounds, it appeared that
the nurses had limited access to this information, varied in their awareness of how to access this information,
or did not routinely use this information in the course of clinical care. Often, this information appeared to be
incomplete, inaccurate, or did not exist. In most CLEs (93.9%), nurses reported that, in the absence of an
attending physician, they relied principally on familiarity, trust, or year of training when residents and fellows
performed procedures (Figure 16; see also Appendix C7).
Trust Primarily
93.9%
Some Type of System Is Used4.7%
No Process Exists1.4%
Figure 16. Percentage of Clinical Learning Environments by Mechanism Used for Identification of Resident and Fellow Competence to Perform Clinical Procedures in the Absence of an Attending Physician, as Reported by Nurses

64 | DETAILED FIND INGS | CLER NATIONAL REPORT OF FINDINGS 2021
Patient Safety Events Related to Supervision
In 30.1% of the CLEs, the patient safety and quality leaders recalled patient safety event reports in the past
year related to resident and fellow supervision (see Appendix C8). In the group interviews, 18.0% of program
directors reported that, in the past year, they had to manage an issue of resident or fellow supervision that
involved a patient safety event at their clinical site. Executive leadership were often unaware of patient safety
events attributed to supervision.
In general, executive and patient safety and quality leaders indicated they addressed patient safety events
related to supervision as a factor in retrospective review of reported patient safety events. The issue of
supervision was often viewed as the responsibility of the GME community. It was uncommon for CLEs to
proactively monitor for potential patient safety events related to supervision.

CLER NATIONAL REPORT OF FINDINGS 2021 | DETAILED FIND INGS | 65
WELL-BEING
This CLER Focus Area recognizes the importance of sustainable systems that comprehensively address the
well-being of residents, fellows, faculty members, and other health care professionals to provide safe patient
care. While the concept of well-being is large in scope, the CLER Program explored a selected set of four
interrelated topics: work/life balance; fatigue; burnout; and support of those at risk of or demonstrating self-
harm.
As part of exploring this Focus Area, the CLER teams interviewed individuals formally or informally designated
by executive leadership to address the well-being of all members of the clinical care team (e.g., physicians,
nurses, and other health care professionals) at the clinical site. The group interview with well-being leadership
often included a Human Resources director or representative (12.2%), a psychologist or psychiatrist (11.5%), a
wellness program representative (10.7%), and a faculty member (10.6%). Approximately 5% of the participants
were designated by their clinical site as a well-being director, officer, or representative. Other participants
included a chaplain, an employee assistance program representative, an ombudsman, a resident or fellow, a
nurse, and a social worker.
Strategies to Promote the Well-Being of the Clinical Care Team
Overall, a limited number of CLEs appeared to have a formal strategy to promote, improve, and sustain the well-
being of the clinical care team to ensure safe and high-quality patient care. Many CLEs had wellness initiatives
and other activities, programs, or resources focused on emotional and physical health (e.g., mindfulness and
resilience training, counseling services, provision of access to nearby gym facilities). These efforts were isolated
and initiated by individual programs, service lines, units, or professional groups—they did not appear to be part
of a larger comprehensive organizational strategy focused on systems-based solutions to optimize the well-
being of the entire clinical care team.
In many CLEs, the well-being leadership indicated that their CLE maintained several activities and programs to
promote the physical and emotional well-being of residents and fellows. Occasionally, the well-being leadership
described formal processes to assess the effectiveness of these efforts.
Maintaining Personal Well-Being and Fulfilling Professional Obligations
In the section that follows, “workload” refers to volume and complexity of patient care in addition to hours
worked, including time for documentation, research, and educational activities.
When asked to what extent the leadership of the CLE collaborated with GME leadership to set expectations
for residents’ and fellows’ workload to optimize patient care while supporting their well-being, 42.5% of the
program directors surveyed reported that this collaboration occurred to a moderate or great extent (median
[IQR], 50.0% [29.4%-100%] across CLEs).
Approximately 70% of the faculty members and 55.1% of the program directors in the group interviews agreed
or strongly agreed that the CLE created an environment that promotes balance between faculty members’
workload and their well-being. In a separate query, 32.6% of the faculty members and 47.5% of the program
directors agreed or strongly agreed that the volume and intensity of faculty members’ workload adversely
impacted their ability to teach residents and fellows.
Many CLEs did not appear to monitor whether residents, fellows, and faculty members exceed their expected
workload. Many also did not appear to monitor whether faculty members’ clinical workload adversely impacted
their teaching responsibilities.

66 | DETAILED FIND INGS | CLER NATIONAL REPORT OF FINDINGS 2021
Across CLEs, the patient safety and quality leaders generally did not describe mechanisms to proactively
assess risks to patient safety due to resident and fellow workload intensity; patient safety events were often
addressed as they arose and through retrospective review of the events.
Fatigue Management
At each of the site visits, the residents and fellows in the group interviews were asked to consider a
hypothetical scenario in which they were maximally fatigued yet had two hours left before the end of their shift
or workday. In this circumstance, 47.6% of the residents and fellows reported that they would power through
to hand-off or the end of the day. Responses varied by year of training, specialty grouping, and gender (Figure
17). Across CLEs, the median (IQR) finding was 43.0% (25.0%-57.2%); responses varied by CLE bed size
and type of ownership. Appendix B22 provides detailed information on variability.
In this same circumstance, 28.0% of the residents and fellows indicated they would notify a supervisor and
expect to be taken off duty immediately; 11.5% indicated that they would ask another resident or fellow to take
over their responsibilities.
Figure 17. Percentage of Residents and Fellows Who Reported They Would Power through When Maximally Fatigued, by Gender
Resid
ents
and
Fello
ws, %
Gender
44.5%
51.1%
0%
10%
20%
30%
40%
50%
60%
FemaleMale
When presented with the same scenario, 22.7% of the faculty members and 16.8% of the program directors in
the group interviews expressed the belief that the resident or fellow would power through to hand-off or the end
of the day. Approximately 53% of the faculty members and 56.8% of the program directors believed that the
resident or fellow would notify their supervisor and expect to be taken off duty immediately.

CLER NATIONAL REPORT OF FINDINGS 2021 | DETAILED FIND INGS | 67
Of the residents and fellows surveyed in the group interviews, 79.5% agreed or strongly agreed that the
clinical site had successful systems in place to ensure patient safety from the risks of resident and fellow
fatigue. Responses varied by gender. Across CLEs, the median (IQR) finding was 85.7% (73.3%-100%),
with responses varying by CLE bed size, type of ownership, and region (Figure 18). Appendix B23 provides
complete information on variability.
In general, CLE efforts to mitigate fatigue among residents and fellows focused primarily on back-up call
systems, provision of sleep rooms, transportation home when they were too tired to drive, and education on
fatigue management and mitigation.
Recognition and Mitigation of Burnout
In many CLEs, the well-being leadership described active efforts to build awareness on burnout. In the
group interviews, 62.8% of the residents and fellows and 75.0% of the faculty members reported they were
moderately or very prepared to recognize and respond to burnout among the members of the clinical care
team.
When asked how frequently they see signs of burnout among faculty members at their clinical site, over half
of the residents and fellows surveyed responded sometimes or often (38.1% and 13.8%, respectively). When
asked the same question, 44.0% of the faculty members in the group interviews reported that they sometimes
see signs of burnout among their faculty colleagues; 15.0% reported they see these signs often.
In many CLEs, residents, fellows, nurses, and other health care professionals described seeing signs of
burnout in their colleagues, faculty members, and other members of the clinical care team that included
emotional exhaustion, depersonalization, and/or a sense of low personal accomplishment. Across CLEs,
members of the clinical care team reported that burnout among faculty members and nurses was more
prevalent than among other members of the clinical care team.
Figure 18. Percentage of Residents and Fellows Who Agreed or Strongly Agreed That Their Clinical Site Had Successful Systems to Ensure Patient Safety from the Risks of Resident and Fellow Fatigue, by Clinical Learning Environment (CLE) Region
Resid
ents
and
Fello
ws, %
CLE Region
0%
20%
40%
60%
80%
100%
WestSouthMidwestNortheast
74.8%83.4% 81.5%
76.9%

68 | DETAILED FIND INGS | CLER NATIONAL REPORT OF FINDINGS 2021
Did Not Appear to Have Systems
in Place
59.0%
Appeared to Have Systems
in Place36.2%
Working to Establish Systems4.8%
Figure 19. Percentage of Clinical Learning Environments That Appeared to Have Systems in Place to Identify the Level of Burnout among Faculty Members
When asked about factors at their CLE that increase their risk for burnout, faculty members in the group
interviews mentioned the following as contributing factors: high patient volume; patient acuity; clinical
productivity pressures; extensive documentation requirements; inadequate clinical and administrative support;
and the challenge of balancing teaching, research, administrative responsibilities, and patient care.
Less than half of the CLEs visited appeared to have systems in place to identify the level of burnout among
faculty members (Figure 19; see also Appendix C9). A limited number of CLEs appeared to have a systematic
approach to preventing, recognizing, and effectively mitigating burnout among physicians. When engaged in
efforts to address burnout, many CLEs were at varying stages of implementing solutions and assessing the
effectiveness of these efforts was uncommon. Proactive efforts to eliminate harm to patients due to physician
burnout was also uncommon across CLEs.

CLER NATIONAL REPORT OF FINDINGS 2021 | DETAILED FIND INGS | 69
Support of Those at Risk of or Demonstrating Self-Harm
In the group interviews, 58.1% of the residents and fellows reported they were moderately or very prepared
to recognize members of the clinical care team at risk of or demonstrating self-harm (median [IQR], 62.5%
[45.6%-79.7%] across CLEs). Responses varied by level of training, specialty group, and gender (Figure 20;
see also Appendix B24).
When asked the same question, 70.0% of the faculty members, and 73.9% of the program directors
reported they were moderately or very prepared to recognize members of the clinical care team at risk of or
demonstrating self-harm.
Figure 20. Percentage of Residents and Fellows Who Reported Being Moderately or Very Prepared to Recognize Members of Their Clinical Care Team at Risk of or Demonstrating Self-Harm, by Gender
Resid
ents
and
Fello
ws, %
Gender
60.0%55.9%
0%
20%
40%
60%
80%
FemaleMale
In a separate query, 87.2% of the residents and fellows and 80.1% of the faculty members reported that they knew
of resources offered by their CLE to support their well-being if they needed personal or professional support after
one of their colleagues harmed themself.
In many CLEs, processes did not appear to exist to identify residents, fellows, and faculty members at risk of or
demonstrating self-harm. If such processes existed, many CLEs did not appear to assess the effectiveness of its
efforts to facilitate care for those at risk of or demonstrating self-harm.

70 | DETAILED FIND INGS | CLER NATIONAL REPORT OF FINDINGS 2021
PROFESSIONALISMThe concept of professionalism encompasses a number of attributes. The CLER visits focused mainly on those
involving honesty, integrity, disclosure of potential conflicts of interest, and respectful treatment of others.
Honesty in Reporting
Overall, 86.8% of the residents and fellows in the group interviews reported that they believe their CLE
provides a supportive, non-punitive environment for bringing forward concerns about honesty in reporting.
Responses varied by gender and specialty group. Across CLEs, the median (IQR) finding was 92.9% (82.8%-
100%) with responses varying by region and type of ownership. Appendix B25 provides complete information
on variability.
Culture of Reporting Work Hours
In the group interviews, the CLER teams presented the residents and fellows with a scenario in which a
colleague stays 30 minutes beyond work hour limits to address a small, non-urgent clinical task. When asked
about the likelihood that the colleague would report the time, 50.9% responded that it was very unlikely that the
colleague would do so. When presented with the same scenario, 16.1% of the program directors indicated that
it was very unlikely that the resident or fellow would report the time.
In a separate query, 36.5% of the program directors in the group interviews indicated that when moonlighting
was permitted, residents and fellows may be underreporting their moonlighting hours (median [IQR], 25.0%
[0%-50.0%] across CLEs).
Documentation Practices
In the group interviews, 32.9% of the residents and fellows reported that while at their CLE, they had
documented a history or physical finding in a patient medical record that they did not personally elicit (e.g.,
copying and pasting from another note without attribution). Reponses varied by gender and specialty group
(see Appendix B26). Approximately 5% reported that documenting a history or physical finding in a patient
medical record did not apply to their specialty.
When the CLER teams asked the faculty members about their documentation practices, 13.5% in the group
interviews indicated they had documented a history or physical finding in a patient medical record that they did
not personally elicit (6.4% reported that documenting a history or physical finding in a patient medical record
did not apply to their specialty).

CLER NATIONAL REPORT OF FINDINGS 2021 | DETAILED FIND INGS | 71
Figure 21. Percentage of Residents and Fellows Who Reported Having Felt Pressured to Compromise Their Honesty or Integrity to Satisfy an Authority Figure During Their Training at the Clinical Site, by Type pf Clinical Learning Environment (CLE) Ownership
Resid
ents
and
Fello
ws, %
Type of CLE Ownership
0%
10%
20%
30%
Government,Non-Federal
Government,Federal
Investor-Owned,For-Profit
Non-Government,Not-For-Profit
14.6%
20.8%
12.0%
16.5%
Integrity
Of the residents and fellows surveyed in the group interviews, 15.2% reported that while at the CLE, they had
on occasion felt pressured to compromise their honesty or integrity to satisfy an authority figure. Across CLEs,
the median (IQR) finding was 11.1% (0%-20.0%), with responses varying by region, CLE bed size, and type
of ownership (Figure 21; see also Appendix B27).
To further explore issues of integrity, the CLER teams presented the residents and fellows in the group
interviews with a scenario in which one of their colleagues has written a manuscript and the department chair
or program director, although not involved in the project, asked to be included as an author. Approximately
50% of the residents and fellows responded that they would advise the colleague to discuss the matter with a
faculty member or the DIO. The next most common response (26.0%) was to advise their colleague to include
the department chair’s or program director’s name on the manuscript.

72 | DETAILED FIND INGS | CLER NATIONAL REPORT OF FINDINGS 2021
Disclosure of Potential Conflicts of Interest
When asked how often faculty members disclose whether or not they have potential conflicts of interests
(e.g., research funding or commercial interests) during each resident and fellow clinical rotation, 30.1% of
the residents and fellows in the group interviews reported that faculty members often or always disclose this
information. Responses varied by level of training and specialty group. Across CLEs, this finding ranged from
0% to 100%, with a median (IQR) of 28.6% (15.5%-44.6%); responses varied by region, type of ownership,
and CLE bed size (Figure 22). Appendix B28 provides detailed information on variability.
Figure 22. Percentage of Residents and Fellows Who Reported That, Based on Their Experience at the Clinical Site, Faculty Members Often or Always Disclose Whether or Not They Have Potential Conflicts of Interests (e.g., Research Funding or Commercial Interests) During Each of Their Clinical Rotations, by Clinical Learning Environment (CLE) Bed Size
0%
20%
40%
60%
80%
100%
500 or More400-499300-399200-299<200
Resid
ents
and
Fello
ws, %
CLE Bed Size
85.2% 83.8% 79.8% 79.1% 75.6%

CLER NATIONAL REPORT OF FINDINGS 2021 | DETAILED FIND INGS | 73
Respectful Treatment of Others
Across CLEs, executive leaders expressed intolerance for unprofessional and disrespectful behavior.
Approximately 75% of the program directors surveyed expressed the belief that their CLE was usually or always
effective in managing reports of unprofessional behavior.
Although many residents, fellows, nurses, and other health care professionals described their work environments
as respectful and collegial, in nearly all of the CLEs (93.3%), individuals across multiple areas described the
behavior of attending physicians and nurses as disrespectful or disruptive. In 78.4% of the CLEs, the behaviors
were described as chronic, persistent, or pervasive in nature (Figure 23; see also Appendix C10).
Reports of Chronic Disrespectful or
Disruptive Behavior
78.4%
No Reports of Chronic Disrespectful or
Disruptive Behavior21.6%
Figure 23. Percentage of Clinical Learning Environments with Reports of Chronic
Disrespectful or Disruptive Behavior Across More Than One Clinical Unit
Across CLEs, many residents and fellows also described professionalism issues in obtaining consultation
services, including lack of responsiveness and disrespectful communications in response to their requests for
consultation.
In the group interviews, the CLER teams presented the residents and fellows with a scenario describing an
attending physician’s mistreatment of a resident colleague that continued to persist despite being reported
to the chief resident, program director, department chair, and head of GME. When presented with choices
of what they might advise the colleague to do, 58.9% indicated that they would recommend contacting the
organization’s Human Resources department or anonymous hotline. Other responses included: contacting
the Equal Employment Opportunity Commission (6.7%); registering a concern with the ACGME (19.2%); and
taking no further action (3.0%). Another 12.2% suggested they would advise some other course of action, and
when asked to elaborate, many indicated they would recommend speaking with an ombudsman or returning to
one or more members of the GME community to seek assistance.
When presented with the same scenario, faculty members and program directors in the group interviews also
varied in their belief as to what the resident would do to address the perceived mistreatment.
In general, residents and fellows across CLEs did not appear to be aware of the mechanisms and resources
available to resolve perceived mistreatment beyond those offered by GME. According to program directors,
the effectiveness of the organization’s response to address these concerns varied across CLEs. Residents,
fellows, and other clinical staff members often mentioned that they would not report mistreatment out of
concern for adverse consequences of reporting.

74 | DETAILED FIND INGS | CLER NATIONAL REPORT OF FINDINGS 2021
REFERENCES1. CLER Evaluation Committee. 2017. “CLER Pathways to Excellence: Expectations for an Optimal Clinical Learning Environment
to Achieve Safe and High Quality Patient Care, Version 1.1.” Chicago, IL: Accreditation Council for Graduation Medical Education.
2. Weiss, Kevin B., Robin Wagner, and Thomas J. Nasca. 2012. “Development, Testing, and Implementation of the ACGME Clinical Learning Environment Review (CLER) Program.” Journal of Graduate Medical Education 4 (3): 396–98. doi.org/10.4300/JGME-04-03-31.
3. Weiss, Kevin B., James P. Bagian, and Thomas J. Nasca. 2013. “The Clinical Learning Environment: The Foundation of Graduate Medical Education.” JAMA 309 (16): 1687–88. doi.org/10.1001/jama.2013.1931.
CLER PROGRAM Octavia Bailey; Mark R. Bixby, MD, FAAFP; Isabelle Bourgeois, MPA; Jennifer J. Buescher, MD, MSPH; Robert Casanova, MD,
MHPE; Baretta R. Casey, MD, MPH, FAAFP; Marian D. Damewood, MD, FACOG; Kevin C. Dellsperger, MD, PhD; Robin Dibner,
MD; David L. Dull, MD, MMM, FAAPL; Staci A. Fischer, MD, FACP, FIDSA; Patrick Guthrie; Paula Hensley, MPH; Kristen Ward
Hirsch; John A. Hopper, MD; Sharhabeel Jwayyed, MD, MS; Catherine Kallal, MD; Elizabeth Kimball, MA; Nancy J. Koh, PhD;
Kathryn E. McGoldrick, MD, MAH, FCAI (Hon); Clifton McReynolds, PhD; Terrie Mendelson, MD; Joshua Mirôn, MA; Robin C.
Newton, MD, FACP; Morgan Passiment, MS; Douglas E. Paull, MD, MS, FACS, FCCP, CHSE, CPPS; Daniel Picard, MD; Kathy
B. Porter, MD, MBA, FACOG; Dale Ray, MD, MMM; Laura Riordan, MS; Melissa Schori, MD, FACP, MBA; Tara Shedor; Stephen
Smith, M; Mike Strickland, MFA; Hongling Sun, PhD; Marie Trontell, MD; Paul Uhlig, MD, MPA; Robin Wagner, RN, MHSA;
Elizabeth Wedemeyer, MD; Kevin B. Weiss, MD; Esther Woods; Martha S. Wright, MD, Med; James R. Zaidan, MD, MBA; Jose
Zayas, DO, FAAP

CLER NATIONAL REPORT OF FINDINGS 2021 | TRENDS IN THE CLER FOCUS AREAS | 75
INTRODUCTIONThe CLER Program assessed and monitored a selected set of observations in each of the six CLER Focus
Areas over the last three cycles of visits. This section offers a look at changes over time in each of these
areas.1 The measures examined are not comprehensive and do not summarize the full scope of resident
and fellow engagement in the CLER Focus Areas. Instead, these trends offer a snapshot that paints a
multidimensional picture of the CLE. These findings are intended to further stimulate new discussions on
continuously improving the CLE. This section also offers a two-point analysis of selected observations since
the last set of visits; the CLER Program added these measures to the site visit protocol in the second cycle of
visits to explore important topics in greater depth.
The results are based on matched cases (i.e., CLEs) and a combination of quantitative (e.g., resident and
fellow responses to closed-ended questions in group interviews) and qualitative (e.g., observations and
interviews on walking rounds) information. Details on data sources and the methods for analysis are described
elsewhere in this report (see Methodology section, pp. 17-26).
This section reports changes on selected measures and is not designed to imply plausible explanations of
effects or to establish causal relationships. Additionally, statistical significance does not necessarily imply
practical significance as the differences may not be large enough to have practical implications. Many factors
may influence change, such as awareness and understanding of the CLER Focus Areas, opportunities for
engagement (e.g., participation in patient safety event investigations), and attention to improvements in
selected CLER Focus Areas (e.g., patient safety and health care quality). These factors may vary across CLEs
and change over time; thus, such factors should be considered in interpreting these findings.
Trends in the CLER Focus AreasNancy J. Koh, PhD; Robin Wagner, RN, MHSA; Robin C. Newton, MD, FACP; Hongling Sun, PhD; and Kevin B. Weiss, MD, on behalf of the CLER Program

76 | TRENDS IN THE CLER FOCUS AREAS | CLER NATIONAL REPORT OF FINDINGS 2021
PATIENT SAFETYThree-Point Analysis
The overall changes on selected measures in patient safety between Cycle 1 and Cycle 3 are presented in Figure 1.
3.8
4.6
Desired Directional Change
Supportive, non-punitive environment for reporting errors
Experienced an adverse event, near miss/close call, or unsafe condition
Submitted a report through the clinical site’s reporting system
Received feedback on the outcome of a report submitted
Reported a near miss/close call event
Participated in an interprofessional patient safety even investigation
-4 -2 0 2 4 6 8 10
Median Change, %
3.3
7.3
8.3
3.5
-2.3
-1.2
Figure 1. Median Percentage Differences on Selected Measures in Patient Safety Between Cycle 1 and Cycle 3 of Clinical Learning Environment Review Visits Based on Resident and Fellow Responses to Closed-Ended Questions in Group Interviews
Since Cycle 1, a high median percentage of residents and fellows continued to report that the clinical site
provided a supportive and non-punitive environment for reporting errors. In Cycles 1, 2, and 3, the median
(interquartile range [IQR]) findings were 96.7% (93.6%-100%), 100% (96.4%-100%), and 100% (95.0%-
100%), respectively.
Across CLEs, the median percentage of residents and fellows who reported experiencing an adverse event,
near miss/close call, or unsafe condition increased over time since Cycle 1 (Figure 2). The median (IQR)
findings in Cycles 1, 2, and 3 were 68.1% (57.9%-76.3%), 72.4% (62.7%-80.0%), and 75.4% (66.7%-
83.3%), respectively (P < .001).
CHANGE IN MEDIAN BETWEEN CLER VISITS:CYCLES 1 – 3d,e (N = 240)***
3
Median=68.1
Cycle
Resid
ents
and
Fel
lows
, %
0
20
40
60
80
100
1 2
Median=72.4
Median=75.4
Figure 2. Boxplotsa of the Median Percentage of Residents and Fellows Who Reported Experiencing an Adverse Event, Near Miss/Close Call, or Unsafe Condition: Cycles 1-3
a The horizontal line in the middle of the box indicates the median and the top and bottom of the box indicate the 75th and 25th percentiles, respectively, also known as the interquartile range (IQR). The whiskers above and below the box mark the maximum and minimum values, respectively. The points beyond the whiskers are outliers.

CLER NATIONAL REPORT OF FINDINGS 2021 | TRENDS IN THE CLER FOCUS AREAS | 77
CHANGE IN MEDIAN BETWEEN CLER VISITS:CYCLES 1 – 3d,e (n = 240)**
3
Median=46.4
Cycle
Resid
ents
and
Fel
lows
, %
0
20
40
60
80
100
1 2
Median=50.0
Median=54.8 Figure 3. Boxplotsa of the
Median Percentage of Residents and Fellows Who Reported Experiencing an Adverse Event, Near Miss/Close Call, or Unsafe Condition and Submitted a Report through the Clinical Site’s Reporting System: Cycles 1-3
CHANGE IN MEDIAN BETWEEN CLER VISITS:CYCLES 1 – 3e,f (n = 240)***
3
Median=46.7
Cycle
Resid
ents
and
Fel
lows
, %
0
20
40
60
80
100
1 2
Median=48.5 Median=
44.4 Figure 4. Boxplotsa of the Median Percentage of Residents and Fellows Who Reported Receiving Feedback on the Outcome of a Report Submitted through the Clinical Site’s Reporting System: Cycles 1-3
While there was a slight increase in the median percentage of residents and fellows who reported receiving
feedback on the outcome of a patient safety event report submitted into the CLE’s central reporting system
between Cycle 1 and Cycle 2, the median percentage decreased in Cycle 3 (Figure 4). In Cycles 1, 2, and 3,
the median (IQR) findings were 46.7% (33.8%-60.0%), 48.5% (33.3%-59.9%), and 44.4% (33.3%-59.4%),
respectively. These differences were not statistically significant.
The percentage of residents and fellows who reported these events into their CLE’s patient safety event
reporting system also increased significantly over the last three cycles (Figure 3). The median (IQR) findings
were 46.5% (33.3%-60.7%) in Cycle 1, 50.0% (37.1%-66.7%) in Cycle 2, and 54.8% (43.8%-68.1%) in
Cycle 3 (P < .001).
a The horizontal line in the middle of the box indicates the median and the top and bottom of the box indicate the 75th and 25th percentiles, respectively, also known as the interquartile range (IQR). The whiskers above and below the box mark the maximum and minimum values, respectively. The points beyond the whiskers are outliers.
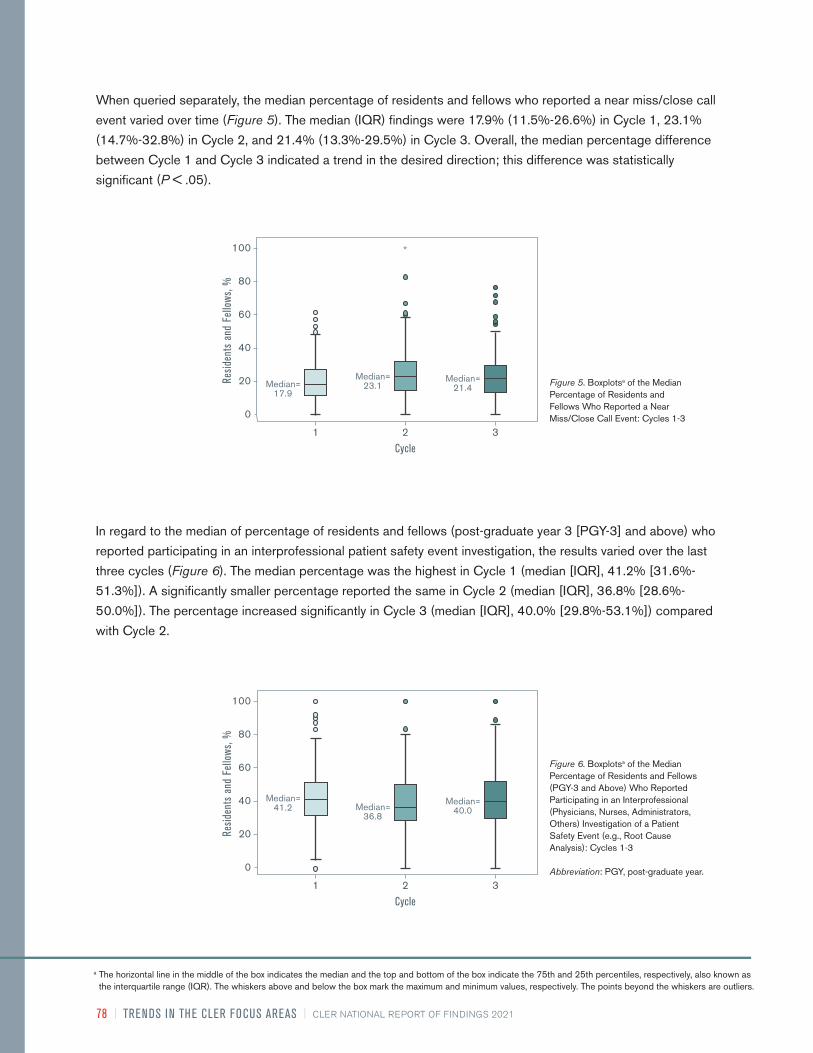
78 | TRENDS IN THE CLER FOCUS AREAS | CLER NATIONAL REPORT OF FINDINGS 2021
When queried separately, the median percentage of residents and fellows who reported a near miss/close call
event varied over time (Figure 5). The median (IQR) findings were 17.9% (11.5%-26.6%) in Cycle 1, 23.1%
(14.7%-32.8%) in Cycle 2, and 21.4% (13.3%-29.5%) in Cycle 3. Overall, the median percentage difference
between Cycle 1 and Cycle 3 indicated a trend in the desired direction; this difference was statistically
significant (P < .05).
In regard to the median of percentage of residents and fellows (post-graduate year 3 [PGY-3] and above) who
reported participating in an interprofessional patient safety event investigation, the results varied over the last
three cycles (Figure 6). The median percentage was the highest in Cycle 1 (median [IQR], 41.2% [31.6%-
51.3%]). A significantly smaller percentage reported the same in Cycle 2 (median [IQR], 36.8% [28.6%-
50.0%]). The percentage increased significantly in Cycle 3 (median [IQR], 40.0% [29.8%-53.1%]) compared
with Cycle 2.
CHANGE IN MEDIAN BETWEEN CLER VISITS:CYCLES 1 – 3d,e (n = 235)*
3
Median=41.2
Cycle
Resid
ents
and
Fel
lows
, %
0
20
40
60
80
100
1 2
Median=36.8
Median=40.0
Figure 6. Boxplotsa of the Median Percentage of Residents and Fellows (PGY-3 and Above) Who Reported Participating in an Interprofessional (Physicians, Nurses, Administrators, Others) Investigation of a Patient Safety Event (e.g., Root Cause Analysis): Cycles 1-3
Abbreviation: PGY, post-graduate year.
CHANGE IN MEDIAN BETWEEN CLER VISITS:CYCLES 1 – 3d,e (n = 241)***
3
Median=17.9
Cycle
Resid
ents
and
Fel
lows
, %
0
20
40
60
80
100
1 2
Median=23.1
Median=21.4 Figure 5. Boxplotsa of the Median
Percentage of Residents and Fellows Who Reported a Near Miss/Close Call Event: Cycles 1-3
a The horizontal line in the middle of the box indicates the median and the top and bottom of the box indicate the 75th and 25th percentiles, respectively, also known as the interquartile range (IQR). The whiskers above and below the box mark the maximum and minimum values, respectively. The points beyond the whiskers are outliers.

CLER NATIONAL REPORT OF FINDINGS 2021 | TRENDS IN THE CLER FOCUS AREAS | 79
Table 1 presents results related to qualitative information collected on walking rounds and interviews with
patient safety and quality leaders. Compared with Cycle 1, there was a higher proportion of residents and
fellows with a working knowledge of basic patient safety terminology across CLEs in Cycle 2 and Cycle 3 (P
< .001).
The percentage of CLEs that tracked the number of patient safety event reports submitted by residents and
fellows increased over the last three cycles. The percentage of CLEs that tracked the number of patient safety
event reports submitted by residents and fellows was 34.5% in Cycle 1, 75.5% in Cycle 2, and 80.0% in
Cycle 3. This change over time was statistically significant (P < .001).
Table 1. Percentage of Clinical Learning Environments by Proportion of Resident and Fellow Knowledge of Patient Safety Terminology and Principles and Tracking of Resident and Fellow Reporting of Patient Safety Events
Items Scale Cycle 1 n (%)
Cycle 2 n (%)
Cycle 3 n (%)
Proportion of residents and fellows with knowledge of basic patient safety terminology and principles***
Most 33 (16.8) 14 (7.1) 20 (10.2)
Some 90 (45.9) 161 (82.1) 153 (78.1)
Few 73 (37.2) 21 (10.7) 23 (11.7)
Tracks the number of patient safety event reports submitted by residents and fellows***
Tracks reporting 69 (34.5) 151(75.5) 160 (80.0)
Does not track reporting 131 (65.5) 49 (24.5) 40 (20.0)
***Statistically significant at P < .001.
Two-Point Analysis
Across CLEs, the median percentage of residents and fellows who reported receiving training on disclosing
medical errors to patients and/or families was higher in Cycle 3 than in Cycle 2 (Figure 7). In Cycles 2 and 3,
the median (IQR) findings were 75.0% (62.3%-87.5%) and 80.0% (67.9%-90.9%), respectively (P < .001).
In addition, the median percentage of residents and fellows who reported knowing resources provided by the
clinical site to support them when they were involved in a major patient safety event resulting a patient death
was slightly higher in Cycle 3 than in Cycle 2. The median (IQR) findings were 89.7% (77.4%-100%) in Cycle
2 and 90.9% (80.0%-100%) in Cycle 3 (P < .05). These results indicated a change in the desired direction.
3
Cycle
Resid
ents
and
Fel
lows
, %
0
20
40
60
80
100
2
Median=75.0
Median=80.0
Figure 7. Boxplotsa of the Median Percentage of Residents and Fellows Who Reported Receiving Training on Disclosing Medical Errors to Patients and/or Families: Cycles 2-3
a The horizontal line in the middle of the box indicates the median and the top and bottom of the box indicate the 75th and 25th percentiles, respectively, also known as the interquartile range (IQR). The whiskers above and below the box mark the maximum and minimum values, respectively. The points beyond the whiskers are outliers.

80 | TRENDS IN THE CLER FOCUS AREAS | CLER NATIONAL REPORT OF FINDINGS 2021
Compared with Cycle 1, there was a higher proportion of residents and fellows with a working knowledge of
basic quality improvement (QI) concepts across CLEs in Cycle 2 and Cycle 3 (Table 2). These differences
were not statistically significant.
Table 2. Percentage of Clinical Learning Environments by Proportion of Resident and Fellow Knowledge of Basic Quality Improvement Concepts
Item Scale Cycle 1 n (%)
Cycle 2 n (%)
Cycle 3 n (%)
Proportion of residents and fellows with knowledge of basic quality improvement concepts
Most 38 (17.2) 25 (11.3) 24 (10.9)
Some 47 (21.3) 77 (34.8) 79 (35.7)
Few 136 (61.5) 119 (53.8) 118 (53.4)
HEALTH CARE QUALITY (INCLUDING HEALTH CARE DISPARITIES)Three-Point Analysis
Figure 8 presents the overall changes on selected measures in health care quality and health care disparities
between Cycle 1 and Cycle 3.
Desired Directional Change
Knew the clinical site’s priorities in the area of QI
Participated in a QI project of own design or one designed by program
or department
Participated in a QI project linked to one or more of the clinical site’s QI goals
Engaged in an interprofessional QI project directly linked to one or more of the
clinical site’s QI goals
Median Change, %
2.1
-9.8
-1.8
-2.3
-10 -5 0 5 10
Figure 8. Median Percentage Differences on Selected Measures in Health Care Quality Between Cycle 1 and Cycle 3 of Clinical Learning Environment Review Visits Based on Resident and Fellow Responses to Closed-Ended Questions in Group Interviews
Abbreviation: QI, quality improvement
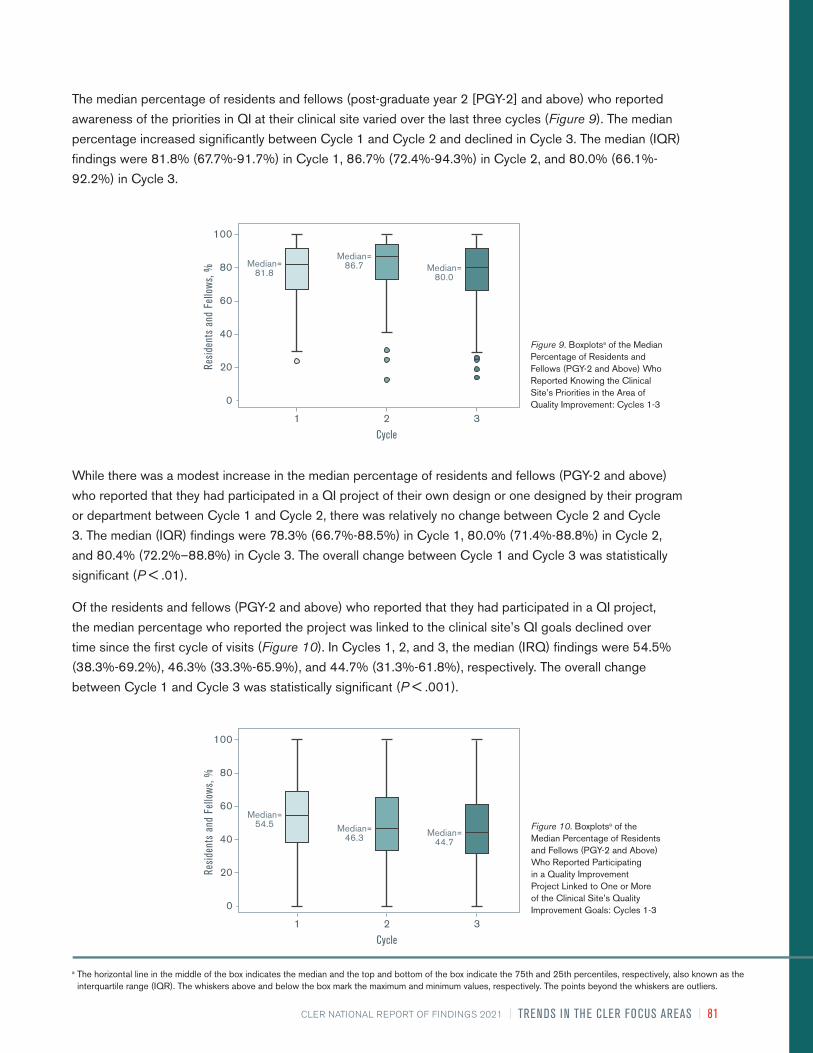
CLER NATIONAL REPORT OF FINDINGS 2021 | TRENDS IN THE CLER FOCUS AREAS | 81
While there was a modest increase in the median percentage of residents and fellows (PGY-2 and above)
who reported that they had participated in a QI project of their own design or one designed by their program
or department between Cycle 1 and Cycle 2, there was relatively no change between Cycle 2 and Cycle
3. The median (IQR) findings were 78.3% (66.7%-88.5%) in Cycle 1, 80.0% (71.4%-88.8%) in Cycle 2,
and 80.4% (72.2%–88.8%) in Cycle 3. The overall change between Cycle 1 and Cycle 3 was statistically
significant (P < .01).
Of the residents and fellows (PGY-2 and above) who reported that they had participated in a QI project,
the median percentage who reported the project was linked to the clinical site’s QI goals declined over
time since the first cycle of visits (Figure 10). In Cycles 1, 2, and 3, the median (IRQ) findings were 54.5%
(38.3%-69.2%), 46.3% (33.3%-65.9%), and 44.7% (31.3%-61.8%), respectively. The overall change
between Cycle 1 and Cycle 3 was statistically significant (P < .001).
CHANGE IN MEDIAN BETWEEN CLER VISITS:CYCLES 1 – 3d,e (n = 237)**
3
Median=81.8
Cycle
Resid
ents
and
Fel
lows
, %
0
20
40
60
80
100
1 2
Median=86.7 Median=
80.0
Figure 9. Boxplotsa of the Median Percentage of Residents and Fellows (PGY-2 and Above) Who Reported Knowing the Clinical Site’s Priorities in the Area of Quality Improvement: Cycles 1-3
CHANGE IN MEDIAN BETWEEN CLER VISITS:CYCLES 1 – 3e,f (n = 240)***
3
Median=46.7
Cycle
Resid
ents
and
Fel
lows
, %
0
20
40
60
80
100
1 2
Median=48.5 Median=
44.4
CHANGE IN MEDIAN BETWEEN CLER VISITS:CYCLES 1 – 3d,e (n = 236)**
3
Median=54.5
Cycle
Resid
ents
and
Fel
lows
, %
0
20
40
60
80
100
1 2
Median=46.3 Median=
44.7
Figure 10. Boxplotsa of the Median Percentage of Residents and Fellows (PGY-2 and Above) Who Reported Participating in a Quality Improvement Project Linked to One or More of the Clinical Site’s Quality Improvement Goals: Cycles 1-3
The median percentage of residents and fellows (post-graduate year 2 [PGY-2] and above) who reported
awareness of the priorities in QI at their clinical site varied over the last three cycles (Figure 9). The median
percentage increased significantly between Cycle 1 and Cycle 2 and declined in Cycle 3. The median (IQR)
findings were 81.8% (67.7%-91.7%) in Cycle 1, 86.7% (72.4%-94.3%) in Cycle 2, and 80.0% (66.1%-
92.2%) in Cycle 3.
a The horizontal line in the middle of the box indicates the median and the top and bottom of the box indicate the 75th and 25th percentiles, respectively, also known as the interquartile range (IQR). The whiskers above and below the box mark the maximum and minimum values, respectively. The points beyond the whiskers are outliers.

82 | TRENDS IN THE CLER FOCUS AREAS | CLER NATIONAL REPORT OF FINDINGS 2021
Of the residents and fellows (PGY-2 and above) who reported that they had participated in a QI project linked
to the clinical site’s QI goals, the median percentage who reported the project involved an interprofessional
team increased between Cycle 1 and Cycle 2 and declined in Cycle 3 (Figure 11). The median (IQR) findings
in Cycle 1, Cycle 2, and Cycle 3 were 75.0% (61.1%-88.0%), 77.8% (66.7%-87.5%), and 72.7% (58.8%-
87.5%), respectively. The overall change between Cycle 1 and Cycle 3 was not statistically significant.
After three cycles of visits, there was little change in the percentage of CLEs that appeared to have a
systematic approach to addressing health care disparities among the at-risk patients receiving care at these
clinical sites—less than 5.0% of CLEs in each cycle. Since the first two cycles of visits, a small percentage of
CLEs in Cycle 3 (17.9%) appeared to be in the early stages of developing a systematic approach to identifying
variability in the care provided to or the clinical outcomes of their known vulnerable patient populations.
Two-Point Analysis
While the greater proportion of resident and fellow QI projects did not appear to have the components of a
complete QI cycle in both sets of visits as described during group interviews and on walking rounds, there
was a smaller proportion of resident and fellow QI projects with all of the components in Cycle 3 than in Cycle
2 (Table 3).
CHANGE IN MEDIAN BETWEEN CLER VISITS:CYCLES 1 – 3d,e (n = 231)
3
Median=75.0
Cycle
Resid
ents
and
Fel
lows
, %
0
20
40
60
80
100
1 2
Median=77.8 Median=
72.7
Figure 11. Boxplotsa of the Median Percentage of Residents and Fellows (PGY-2 and Above) Who Reported Being Engaged in Interprofessional Quality Improvement Teams (e.g., Nurses, Administrators, Pharmacists, etc.) While Participating in a Quality Improvement Project Directly Linked to One or More of the Clinical Site’s Quality Improvement Goals: Cycles 1-3
Table 3. Percentage of Clinical Learning Environments by Proportion of Resident and Fellow Quality Improvement Projects with Components of a Complete Quality Improvement Cycle
Item Scale Cycle 2 n (%)
Cycle 3 n (%)
Proportion of resident and fellow quality improvement projects with components of a complete quality improvement cycle
Most 26 (5.2) 14 (2.8)
Some 78 (15.6) 82 (16.4)
Few 397 (79.2) 405 (80.8)
a The horizontal line in the middle of the box indicates the median and the top and bottom of the box indicate the 75th and 25th percentiles, respectively, also known as the interquartile range (IQR). The whiskers above and below the box mark the maximum and minimum values, respectively. The points beyond the whiskers are outliers.

CLER NATIONAL REPORT OF FINDINGS 2021 | TRENDS IN THE CLER FOCUS AREAS | 83
Compared with Cycle 2, a significantly smaller median percentage of residents and fellows in Cycle 3
reported receiving aggregated or benchmarked quality performance data about the care of their own patients
(Figure 12). The median (IQR) findings were 37.5% (24.8%-60.0%) in Cycle 2 and 32.8% (20.0%-55.3%) in
Cycle 3 (P < .01).
In the area of health care disparities, a significantly smaller median percentage of residents and fellows
reported participating in a quality improvement project focused on eliminating health care disparities in Cycle
3 (median [IQR], 5.8% [0.0%-14.3%]) than in Cycle 2 (median [IQR], 9.6% [0.0%-18.2%]) (P < .001).
CHANGE IN MEDIAN BETWEEN CLER VISITS:CYCLES 2 – 3c,d (n = 501)***
3
Cycle
Resid
ents
and
Fel
lows
, %
0
20
40
60
80
100
2
Median=37.5 Median=
32.8
Figure 12. Boxplotsa of the Median Percentage of Residents and Fellows Who Reported Receiving Aggregated or Benchmarked Quality Performance Data About the Care of Their Own Patients: Cycles 2-3
a The horizontal line in the middle of the box indicates the median and the top and bottom of the box indicate the 75th and 25th percentiles, respectively, also known as the interquartile range (IQR). The whiskers above and below the box mark the maximum and minimum values, respectively. The points beyond the whiskers are outliers.

84 | TRENDS IN THE CLER FOCUS AREAS | CLER NATIONAL REPORT OF FINDINGS 2021
CARE TRANSITIONSThree-Point Analysis
Figure 13 presents the overall changes on selected measures related to care transitions between Cycle
1 and Cycle 3.
The median percentage of residents and fellows who reported following a standardized process for handling
transitions of care during change-of-duty hand-offs was highest in Cycle 1, with a median (IQR) of 91.7%
(83.9%-100%) (Figure 14). In Cycle 2 and Cycle 3, the median (IQR) findings were 86.0% (77.8%-94.3%)
and 90.7% (82.4%-96.3%), respectively. Similarly, of those who reported following a standardized process, a
higher percentage in the first cycle of visits indicated that the process included a standardized written template
for communication for handling transitions of care during change-of-duty hand-offs, with a median (IQR) finding
of 79.6% (70.4%-89.5%) (Figure 15). The median percentage decreased slightly in Cycle 2 (median [IQR],
77.5% [68.8%-88.1%]) and remained relatively the same in Cycle 3 (median [IQR], 77.8% [69.1%-89.6%]).
Desired Directional Change
Followed a standardized process for handling transitions of care during
hand-offs between shifts
Followed a standardized process that included a standardized written template
during change-of-duty hand-offs
Followed a standardized processes for handling transitions from inpatient to
outpatient
Median Change, %
-1.8
-0.9
-17.8
-20 -10 0 10 20
Figure 13. Median Percentage Differences on Selected Measures in Care Transitions Between Cycle 1 and Cycle 3 of Clinical Learning Environment Review Visits Based on Resident and Fellow Responses to Closed-Ended Questions in Group Interviews
CHANGE IN MEDIAN BETWEEN CLER VISITS:CYCLES 1 – 3e,f (n = 240)***
3
Median=46.7
Cycle
Resid
ents
and
Fel
lows
, %
0
20
40
60
80
100
1 2
Median=48.5 Median=
44.4
CHANGE IN MEDIAN BETWEEN CLER VISITS:CYCLES 1 – 3d,e (n = 241)***
3
Median=91.7
Cycle
Resid
ents
and
Fel
lows
, %
0
20
40
60
80
100
1 2
Median=86.0
Median=90.7
Figure 14. Boxplotsa of the Median Percentage of Residents and Fellows Who Reported Following a Standardized Process for Handling Transitions of Care During Hand-Offs Between Shifts: Cycles 1-3
a The horizontal line in the middle of the box indicates the median and the top and bottom of the box indicate the 75th and 25th percentiles, respectively, also known as the interquartile range (IQR). The whiskers above and below the box mark the maximum and minimum values, respectively. The points beyond the whiskers are outliers.

CLER NATIONAL REPORT OF FINDINGS 2021 | TRENDS IN THE CLER FOCUS AREAS | 85
Based on observations during walking rounds, in many CLEs there appeared to be some level of standardization
in the change-of-duty hand-off processes across programs since Cycle 1. Whereas it appeared there was no
standardization in the hand-off processes in 68.4% of the CLEs in Cycle 1, the same observation was made in
14.7% of the CLEs in Cycle 3 (Table 4). These differences were statistically significant.
3
Median=79.6
Cycle
Resid
ents
and
Fel
lows
, %
0
20
40
60
80
100
1 2
Median=77.5
Median=77.8
Figure 15. Boxplotsa of the Median Percentage of Residents and Fellows Who Reported Following a Standardized Process for Hand-Offs Between Shifts that Included a Standardized Written Template for Communication: Cycles 1-3
Table 4. Percentage of Clinical Learning Environments with Hand-Off Processes That Were Standardized Across Programs
Item Scale Cycle 1 n (%)
Cycle 2 n (%)
Cycle 3 n (%)
Hand-off processes that were standardized across programs, based on direct observations***
All standardized 27 (11.7) 2 (0.9) 24 (10.4)
Some standardization 46 (19.9) 221 (95.7) 173 (74.9)
No standardization 158 (68.4) 8 (3.5) 34 (14.7)
***Statistically significant at P < .001.
In regard to transitions from inpatient to outpatient care, there was a marked decline in the median percentage
of residents and fellows who reported following standardized processes for handling transitions of care from
inpatient to outpatient care since Cycle 1 (Figure 16). The median (IQR) findings were 82.1% (71.9%-91.0%)
in Cycle 1, 65.0% (51.0%-78.6%) in Cycle 2, and 64.3% (52.5%-80.0%) in Cycle 3. The median percentage
difference between Cycle 1 and Cycle 3 was statistically significant (P < .001).CHANGE IN MEDIAN BETWEEN CLER VISITS:CYCLES 1 – 3d,e (n = 242)***
3
Median=82.1
Cycle
Resid
ents
and
Fel
lows
, %
0
20
40
60
80
100
1 2
Median=65.0
Median=64.3
Figure 16. Boxplotsa of the Median Percentage of Residents and Fellows Who Reported Following Standardized Processes for Handling Transitions of Care from Inpatient to Outpatient Care: Cycles 1-3
a The horizontal line in the middle of the box indicates the median and the top and bottom of the box indicate the 75th and 25th percentiles, respectively, also known as the interquartile range (IQR). The whiskers above and below the box mark the maximum and minimum values, respectively. The points beyond the whiskers are outliers.
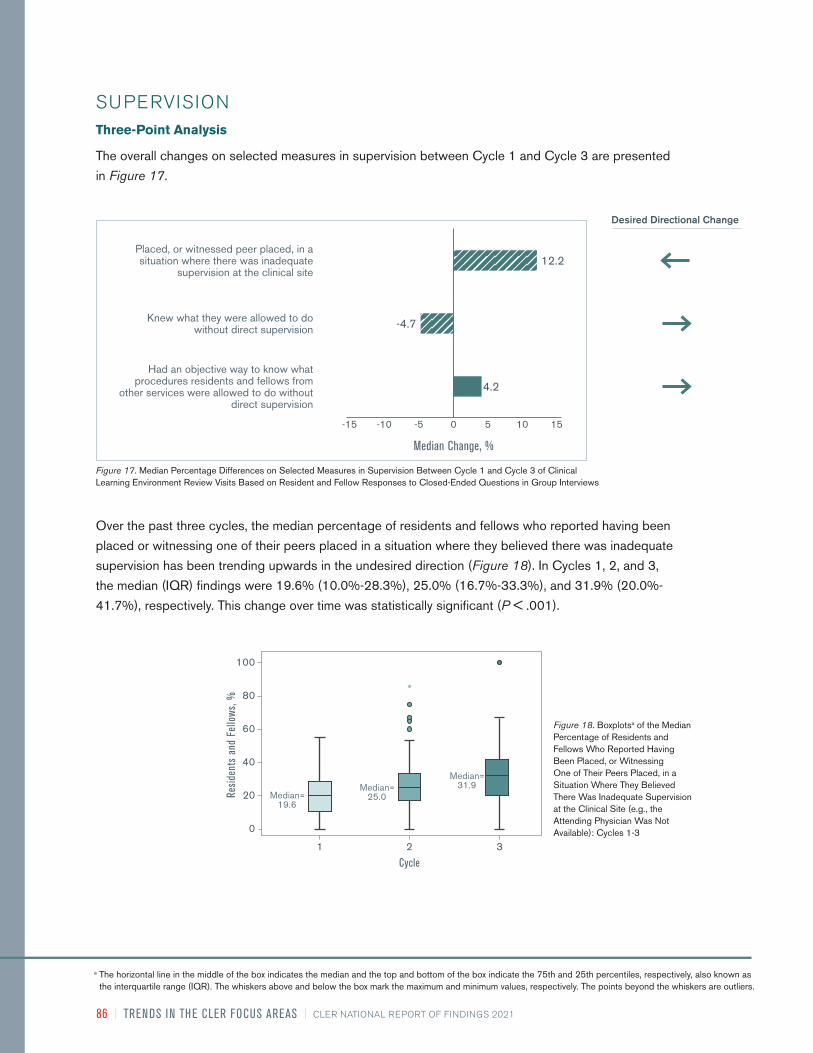
86 | TRENDS IN THE CLER FOCUS AREAS | CLER NATIONAL REPORT OF FINDINGS 2021
Over the past three cycles, the median percentage of residents and fellows who reported having been
placed or witnessing one of their peers placed in a situation where they believed there was inadequate
supervision has been trending upwards in the undesired direction (Figure 18). In Cycles 1, 2, and 3,
the median (IQR) findings were 19.6% (10.0%-28.3%), 25.0% (16.7%-33.3%), and 31.9% (20.0%-
41.7%), respectively. This change over time was statistically significant (P < .001).
SUPERVISIONThree-Point Analysis
The overall changes on selected measures in supervision between Cycle 1 and Cycle 3 are presented
in Figure 17.
Desired Directional Change
Placed, or witnessed peer placed, in a situation where there was inadequate
supervision at the clinical site
Knew what they were allowed to do without direct supervision
Had an objective way to know what procedures residents and fellows from
other services were allowed to do without direct supervision
Median Change, %
-4.7
-10-15 -5 0 5 10 15
4.2
12.2
Figure 17. Median Percentage Differences on Selected Measures in Supervision Between Cycle 1 and Cycle 3 of Clinical Learning Environment Review Visits Based on Resident and Fellow Responses to Closed-Ended Questions in Group Interviews
3
Median=19.6
Cycle
Resid
ents
and
Fel
lows
, %
0
20
40
60
80
100
1 2
Median=25.0
Median=31.9
Figure 18. Boxplotsa of the Median Percentage of Residents and Fellows Who Reported Having Been Placed, or Witnessing One of Their Peers Placed, in a Situation Where They Believed There Was Inadequate Supervision at the Clinical Site (e.g., the Attending Physician Was Not Available): Cycles 1-3
a The horizontal line in the middle of the box indicates the median and the top and bottom of the box indicate the 75th and 25th percentiles, respectively, also known as the interquartile range (IQR). The whiskers above and below the box mark the maximum and minimum values, respectively. The points beyond the whiskers are outliers.

CLER NATIONAL REPORT OF FINDINGS 2021 | TRENDS IN THE CLER FOCUS AREAS | 87
Since Cycle 1, a high median percentage of residents and fellows continued to report knowing what
they were allowed to do without direct supervision. In Cycles 1, 2, and 3, the median (IQR) findings
were 99.2% (94.9%-100%), 96.3% (91.5%-100%), and 94.5% (88.9%-100%), respectively.
The median percentage of residents and fellows who reported having an objective way to know what
procedures residents and fellows from other services were allowed to do without direct supervision
when they consulted on patients varied over time (Figure 19). While there was a significant increase
in the median percentage from Cycle 1 to Cycle 2, the median percentage decreased in Cycle 3. The
median (IQR) findings were 29.1% (16.6%-54.3%) in Cycle 1, 40.0% (22.8%-61.1%) in Cycle 2, and
33.3% (22.2%-57.3%) in Cycle 3.CHANGE IN MEDIAN BETWEEN CLER VISITS:
CYCLES 1 – 3c,d (n = 242)**
3
Median=29.1
Cycle
Resid
ents
and
Fel
lows
, %
0
20
40
60
80
100
1 2
Median=40.0 Median=
33.3
Figure 19. Boxplotsa of the Median Percentage of Residents and Fellows Who Reported Having an Objective Way to Know What Procedures Residents and Fellows from Other Services Were Allowed to Do Without Direct Supervision When They Consulted on Patients: Cycles 1-3
In the majority of CLEs (90.3% in Cycle 1, 93.7% in Cycle 2, and 92.8% in Cycle 3), nurses indicated
on walking rounds that in the absence of an attending physician, they relied primarily on trust when
residents and fellows performed clinical procedures (Table 5).
Table 5. Percentage of Clinical Learning Environments by Mechanism Used for Identification of Resident and Fellow Competence to Perform Clinical Procedures, as Reported by Nurses
Item Scale Cycle 1 n (%)
Cycle 2 n (%)
Cycle 3 n (%)
Mechanism used for identification of resident and fellow competency to perform clinical procedures, as reported by nurses
Some type of system is used 21 (8.9) 13 (5.5) 17 (7.2)
Trust primarily 214 (90.3) 222 (93.7) 220 (92.8)
No process exists 2 (0.8) 2 (0.8) —
a The horizontal line in the middle of the box indicates the median and the top and bottom of the box indicate the 75th and 25th percentiles, respectively, also known as the interquartile range (IQR). The whiskers above and below the box mark the maximum and minimum values, respectively. The points beyond the whiskers are outliers.

88 | TRENDS IN THE CLER FOCUS AREAS | CLER NATIONAL REPORT OF FINDINGS 2021
Two-Point Analysis
Compared with those in Cycle 2, a slightly higher median percentage of residents and fellows in Cycle
3 reported their experience of having encountered physicians (attending physicians or consultants)
who made them feel uncomfortable when requesting help (Figure 20). The median (IQR) findings were
48.3% (33.3%-63.2%) in Cycle 2 and 50.0% (34.7%-66.7%) in Cycle 3 (P < .05).CHANGE IN MEDIAN BETWEEN CLER VISITS:
CYCLES 2 – 3c,d (n = 504)***
3
Cycle
Resid
ents
and
Fel
lows
, %
0
20
40
60
80
100
2
Median=48.3
Median=50.0
Figure 20. Boxplotsa of the Median Percentage of Residents and Fellows Who Reported Encountering a Physician (Attending Physician or Consultant) Who Made Them Feel Uncomfortable When Requesting Assistance: Cycles 2-3
Table 6. Percentage of Clinical Learning Environments Where Patient Safety and Quality Leaders Recalled Patient Safety Event Reports Involving Issues of Resident or Fellow Supervision
Item Scale Cycle 1 n (%)
Cycle 2 n (%)
Cycle 3 n (%)
Patient safety and quality leaders recalled patient safety event reports involving issues of resident or fellow supervision
Recalled events 67 (41.6) 70 (43.5) 82 (50.9)
Did not recall events 94 (58.4) 91 (56.5) 79 (49.1)
The percentage of CLEs where patient safety and quality leaders recalled patient safety event reports
involving issues of resident or fellow supervision increased over time since the first cycle of visits (Table
6). In 41.6% of the CLEs in Cycle 1, 43.5% in Cycle 2, and 50.9% in Cycle 3, the patient safety and
quality leaders recalled such reports.
a The horizontal line in the middle of the box indicates the median and the top and bottom of the box indicate the 75th and 25th percentiles, respectively, also known as the interquartile range (IQR). The whiskers above and below the box mark the maximum and minimum values, respectively. The points beyond the whiskers are outliers.

CLER NATIONAL REPORT OF FINDINGS 2021 | TRENDS IN THE CLER FOCUS AREAS | 89
Overall, the median percentage of residents and fellows who reported that they would power through to
hand-off if placed in a situation in which they were impaired by fatigue trended upward over time (Figure
22). The median (IQR) findings in Cycles 1, 2, and 3 were 29.5% (16.9%-42.3%), 46.0% (30.8%-
–58.3%), and 48.2% (33.3%-58.9%), respectively. The median percentage difference between Cycle 1
and Cycle 3 was statistically significant (P < .001).
WELL-BEINGThree-Point Analysis
The overall changes on selected measures in well-being between Cycle 1 and Cycle 3 are presented in
Figure 21.
Desired Directional Change
Would power through to hand-off if placed in a situation impaired by fatigue
Median Change, %
18.8
-5-10-15 0 5 10 2015
Figure 21. Percentage of Residents and Fellows Who Reported They Would Power through When Maximally Fatigued: Median Percentage Differences between Cycle 1 and Cycle 3 of Clinical Learning Environment Review Visits
CHANGE IN MEDIAN BETWEEN CLER VISITS:CYCLES 1 – 3c,d (n = 242)***
3
Median=29.5
Cycle
Resid
ents
and
Fel
lows
, %
0
20
40
60
80
100
1 2
Median=46.0
Median=48.2
Figure 22. Boxplotsa of the Median Percentage of Residents and Fellows Who Reported They Would Power through When Maximally Fatigued: Cycles 1-3
a The horizontal line in the middle of the box indicates the median and the top and bottom of the box indicate the 75th and 25th percentiles, respectively, also known as the interquartile range (IQR). The whiskers above and below the box mark the maximum and minimum values, respectively. The points beyond the whiskers are outliers.

90 | TRENDS IN THE CLER FOCUS AREAS | CLER NATIONAL REPORT OF FINDINGS 2021
PROFESSIONALISMThree-Point Analysis
Figure 23 presents the overall changes on selected measures in professionalism between Cycle 1 and Cycle 3.
Across CLEs, the median percentage of residents and fellows who reported that their clinical site
provided a supportive, non-punitive environment for coming forward with concerns regarding honesty
in reporting remained relatively high over the last three cycles of visits. The median percentage was
highest in Cycle 1 (median [IQR], 95.0% [90.0%-100%]). In Cycle 2 and Cycle 3, the median (IQR)
findings were 90.0% (84.2%-96.0%) and 90.0% (82.4%-95.0%), respectively.
The median percentage of residents and fellows who reported that they had documented a history or
physical finding in a patient medical record that they did not personally elicit was the highest in Cycle
1, with a median (IQR) of 35.5% (20.5%-49.2%) (Figure 24). A smaller percentage reported the same
in Cycle 2, with a median (IQR) of 33.3% (17.1%-43.2%). The percentage increased slightly in Cycle 3
compared with Cycle 2, with a median (IQR) of 34.0% (22.2%-44.4%).
Desired Directional Change
Supportive, non-punitive environment for coming forward with concerns
regarding honesty in reporting
Documented a history or physical finding in a patient medical record not personal-
ly elicited at the clinical site
Felt pressured to compromise honesty or integrity to satisfy an authority figure during
training at the clinical site0
Median Change, %
-1.6
-5
-10 -5 0 5 10
Figure 23. Median Percentage Differences on Selected Measures in Professionalism Between Cycle 1 and Cycle 3 of Clinical Learning Environment Review Visits Based on Resident and Fellow Responses to Closed-Ended Questions in Group Interviews
CHANGE IN MEDIAN BETWEEN CLER VISITS:CYCLES 1 – 3c,d (n = 242)**
3
Median=35.5
Cycle
Resid
ents
and
Fel
lows
, %
0
20
40
60
80
1 2
Median=33.3
Median=34.0
Figure 24. Boxplotsa of the Median Percentage of Residents and Fellows Who Reported They Had Documented a History or Physical Finding in a Patient Medical Record That They Did Not Personally Elicit at the Clinical Site (e.g., Copying and Pasting from Another Note): Cycles 1-3
a The horizontal line in the middle of the box indicates the median and the top and bottom of the box indicate the 75th and 25th percentiles, respectively, also known as the interquartile range (IQR). The whiskers above and below the box mark the maximum and minimum values, respectively. The points beyond the whiskers are outliers.

CLER NATIONAL REPORT OF FINDINGS 2021 | TRENDS IN THE CLER FOCUS AREAS | 91
CHANGE IN MEDIAN BETWEEN CLER VISITS:CYCLES 1 – 3c,d (n = 242)
3
Median=14.3
Cycle
Resid
ents
and
Fel
lows
, %
0
60
50
40
30
20
10
1 2
Median=12.5
Median=14.3
Figure 25. Boxplotsa of the Median Percentage of Residents and Fellows Who Reported Having Felt Pressured to Compromise Their Honesty or Integrity to Satisfy an Authority Figure During Their Training at the Clinical Site: Cycles 1-3
Two-Point Analysis
Based on interviews on walking rounds, there was a significantly larger percentage of CLEs with reports
of chronic disrespectful or disruptive behavior across more than one clinical unit in Cycle 3 (78.3%)
than in Cycle 2 (60.1%) (Table 7). This difference was statistically significant (P < .001).
The median percentage of residents and fellows who reported that they felt pressure to compromise their
honesty or integrity to satisfy an authority figure during their training at their CLE was the lowest in Cycle
2, with a median (IQR) of 12.5% (6.7%-20.0%) (Figure 25). The results were the same in Cycles 1 and 3,
with a median (IQR) of 14.3% (8.3%-20.0%). These differences were not statistically significant.
Table 7. Percentage of Clinical Learning Environments with Reports of Chronic Disrespectful or Disruptive Behavior Across More Than One Clinical Unit
Item Scale Cycle 2 n (%)
Cycle 3 n (%)
Percentage of clinical learning environments with reports of chronic disrespectful or disruptive behavior across more than one clinical unit
No reports of chronic disrespectful or disruptive behavior
171 (39.9) 93 (21.7)
Reports of chronic disrespectful or disruptive behavior
258 (60.1) 336 (78.3)
a The horizontal line in the middle of the box indicates the median and the top and bottom of the box indicate the 75th and 25th percentiles, respectively, also known as the interquartile range (IQR). The whiskers above and below the box mark the maximum and minimum values, respectively. The points beyond the whiskers are outliers.

92 | TRENDS IN THE CLER FOCUS AREAS | CLER NATIONAL REPORT OF FINDINGS 2021
SUMMARYCollectively, the results indicate both progress and challenges across the CLER Focus Areas.
Overall, the trends in resident and fellow engagement in patient safety are encouraging. Since Cycle 1,
residents and fellows continued to report a supportive and non-punitive environment for reporting patient
safety errors. Resident and fellow recognition of reportable patient safety events and use of the clinical site’s
patient safety event reporting system to report these events also improved over time. Additionally, there
continued to be an upward trend in the percentage of CLEs that tracked the number of patient safety event
reports submitted by residents and fellows since the first cycle of CLER visits.
Conversely, the results over the last three cycles of visits indicate that challenges continue to exist in providing
residents and fellows with feedback on the outcomes of patient safety event reports submitted and engaging
them in interprofessional patient safety event investigations.
While there was progress from Cycle 1 to Cycle 2 on most of the measures in health care quality, there was
either change in the undesired direction or little change for the same measures between Cycle 2 and Cycle
3. Specifically, the median percentage of residents and fellows who reported that they knew their clinical
sites’ QI priorities declined significantly from Cycle 2 to Cycle 3. There was minimal change in the median
percentage of residents and fellows who reported participating in QI projects of their own design or one
designed by their program or department. There was a downward trend in the median percentage of residents
and fellows who reported participating in a QI project aligned with the clinical site’s QI goals and receiving
aggregated or benchmarked quality performance data about the care of their own patients.
Regarding health care disparities, the number of CLEs engaged in systematic efforts to identify and eliminate
disparities in health care and the clinical outcomes of their known vulnerable patient populations remained
relatively the same since Cycle 1. Additionally, the median percentage of residents and fellows who reported
participating in a QI project focused on eliminating health care disparities declined between Cycle 2 and
Cycle 3.
A moderately high median percentage of residents and fellows continued to report following a standardized
process for handling transitions of care during change-of-duty hand-offs. In many CLEs, there also appeared
to be some level of standardization in the change-of-duty hand-off processes across programs since the first
cycle of visits. At the same time, there was relatively no movement in the median percentage of residents and
fellows who reported using a standardized written template as part of a standardized process for change-of-
duty hand-offs. There was a downward trend in the median percentage of residents and fellows who reported
following a standardized process for handling care transitions from inpatient to outpatient care.
Overall, the majority of the measures in supervision moved in a direction opposite of desired change. Of note,
the percentage of CLEs where patient safety and quality leaders recalled patient safety event reports involving
issues of resident or fellow supervision continued to increase over time. There was also a significant upward
trend in the median percentage of residents and fellows who reported being placed or witnessing a situation
in which they perceived there was inadequate supervision. Additionally, a higher median percentage of
residents and fellows reported encountering a physician who made them feel uncomfortable when requesting
help in Cycle 3 than in Cycle 2.

CLER NATIONAL REPORT OF FINDINGS 2021 | TRENDS IN THE CLER FOCUS AREAS | 93
There was an upward trend—against the desired direction of change—in the median percentage of residents
and fellows who reported that they would power through to hand-off if impaired by fatigue, with the most
significant increase from Cycle 1 to Cycle 2.
In the area of professionalism, a high median percentage of residents and fellows continued to report that
their clinical site provided a supportive, non-punitive environment for coming forward with concerns regarding
honesty in reporting. Over time, there was little change in the median percentage of residents and fellows
who reported they had documented a history or physical finding in a patient medical record that they did not
personally elicit. Similarly, there was minimal change in the median percentage of residents and fellows who
reported they felt pressured to compromise their honesty or integrity to satisfy an authority figure. Challenges
remain in addressing unprofessional behavior—between Cycles 2 and 3, there was a significantly larger
percentage of CLEs with reports of chronic disrespectful or disruptive behavior across more than one
clinical unit.
CONCLUSIONThe trends and between-cycle findings across the CLER Focus Areas indicate that ongoing formative
feedback may be having some effect in advancing CLEs. They also point to opportunities for improvement.
In general, the results demonstrate modest progress in some areas, little or no movement in others,
and undesired change in other areas. Given the dynamic and intricate nature of CLEs, there can be a
considerable time lag between the discovery of challenges, implementation of systems changes to address
these challenges, and demonstrable results. The selected trends offer a perspective on how CLEs can
continue their journey to assess and explore innovative ways to improve the learning environment and to
ensure safe and high-quality patient care.
REFERENCES1. CLER Evaluation Committee. 2017. “CLER Pathways to Excellence: Expectations for an Optimal Clinical Learning
Environment to Achieve Safe and High Quality Patient Care, Version 1.1.” Chicago, IL: Accreditation Council for Graduation Medical Education.
CLER PROGRAMOctavia Bailey; Mark R. Bixby, MD, FAAFP; Isabelle Bourgeois, MPA; Jennifer J. Buescher, MD, MSPH; Robert Casanova,
MD, MHPE; Baretta R. Casey, MD, MPH, FAAFP; Marian D. Damewood, MD, FACOG; Kevin C. Dellsperger, MD, PhD; Robin
Dibner, MD; David L. Dull, MD, MMM, FAAPL; Staci A. Fischer, MD, FACP, FIDSA; Patrick Guthrie; Paula Hensley, MPH;
Kristen Ward Hirsch; John A. Hopper, MD; Sharhabeel Jwayyed, MD, MS; Catherine Kallal, MD; Elizabeth Kimball, MA; Nancy J.
Koh, PhD; Kathryn E. McGoldrick, MD, MAH, FCAI (Hon); Clifton McReynolds, PhD; Terrie Mendelson, MD; Joshua Mirôn, MA;
Robin C. Newton, MD, FACP; Morgan Passiment, MS; Douglas E. Paull, MD, MS, FACS, FCCP, CHSE, CPPS; Daniel Picard,
MD; Kathy B. Porter, MD, MBA, FACOG; Dale Ray, MD, MMM; Laura Riordan, MS; Melissa Schori, MD, FACP, MBA; Tara
Shedor; Stephen Smith, M; Mike Strickland, MFA; Hongling Sun, PhD; Marie Trontell, MD; Paul Uhlig, MD, MPA; Robin Wagner,
RN, MHSA; Elizabeth Wedemeyer, MD; Kevin B. Weiss, MD; Esther Woods; Martha S. Wright, MD, Med; James R. Zaidan, MD,
MBA; Jose Zayas, DO, FAAP

94 | TRENDS IN THE CLER FOCUS AREAS | CLER NATIONAL REPORT OF FINDINGS 2021

CLER NATIONAL REPORT OF FINDINGS 2021 | LESSONS LEARNED | 95
The CLER Program was conceived to gather new knowledge about the CLEs of resident and fellow
physicians, and to introduce a process of formative assessment and feedback to generate conversations
between GME leaders and the executive leadership of CLEs—conversations that promote positive change in
important areas of focus such as patient safety and health care quality.
This CLER National Report of Findings suggests the CLER Program’s process of providing formative
feedback is leading to improvements in some areas while in other areas there are performance gaps that
continue to persist without change or are moving in the undesired direction. As a result, discussions of
each of the CLER Focus Areas in this report are rich with examples from which to draw lessons learned. To
illustrate, the findings in the CLER Focus Area of patient safety offer numerous opportunities to learn from both
successes and challenges. For example, the data on
trends in resident and fellow reporting of patient safety
events has shown steady improvement from cycle to
cycle. This is likely a reflection of the dedicated efforts
within CLEs to help residents and fellows recognize
what to report and how to utilize the CLEs’ patient
safety event reporting systems.
This National Report also highlights trends in patient
safety that reflect persistent challenges. Examples
include challenges in providing residents and fellows
with feedback on the outcome of patient safety event
reports and involving them in patient safety event
investigations. Lack of feedback and engagement
may lead residents and fellows to think their efforts to
report events result in no actions being taken, thereby
worsening their impression of the CLE’s culture of
safety. One of the reasons behind the modest rather
than substantial improvements in resident and fellow
engagement in patient safety may reflect the gap between the traditional pace of GME that spans the entire
length of educational programs (ranging from one to seven years) and the CLE’s more immediate needs
for ensuring optimal patient care. GME and their CLEs often address patient safety and the other CLER
Focus Areas through separate non-aligned structures, processes, and timelines. The CLER Program seeks
to improve this lack of alignment by encouraging GME and CLE leadership to establish a formal structure
to work together to mutually identify incentives and opportunities to improve both learning and patient care
and establish goals, timelines, and accountability for achieving success. Ensuring residents and fellows
are included in the CLE’s efforts to measure the culture of safety is a starting place to understand the
opportunities for improvement.
Lessons Learned and Future DirectionsRobin Wagner, RN, MHSA and Kevin B. Weiss, MD
This CLER National Report of Findings
suggests the CLER Program’s process of
providing formative feedback is leading to
improvements in some areas while in other
areas there are performance gaps that
continue to persist without change or are
moving in the undesired direction. As a result,
discussions of each of the CLER Focus Areas
in this report are rich with examples from
which to draw lessons learned.
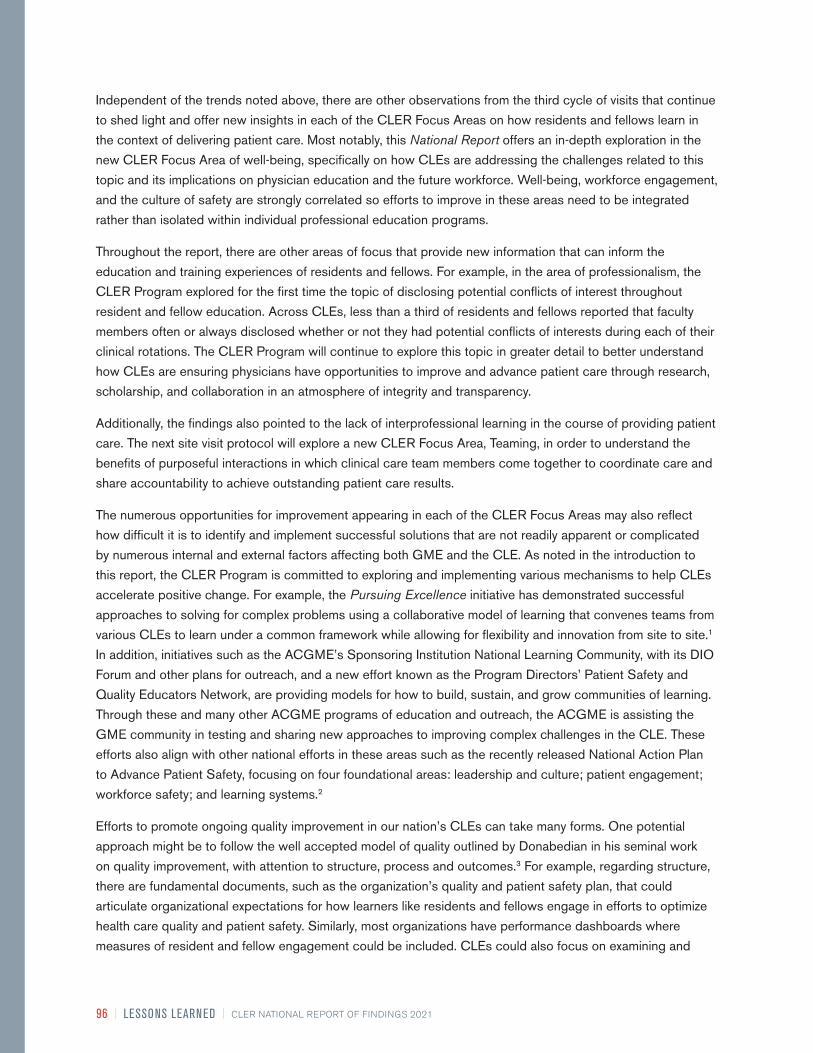
96 | LESSONS LEARNED | CLER NATIONAL REPORT OF FINDINGS 2021
Independent of the trends noted above, there are other observations from the third cycle of visits that continue
to shed light and offer new insights in each of the CLER Focus Areas on how residents and fellows learn in
the context of delivering patient care. Most notably, this National Report offers an in-depth exploration in the
new CLER Focus Area of well-being, specifically on how CLEs are addressing the challenges related to this
topic and its implications on physician education and the future workforce. Well-being, workforce engagement,
and the culture of safety are strongly correlated so efforts to improve in these areas need to be integrated
rather than isolated within individual professional education programs.
Throughout the report, there are other areas of focus that provide new information that can inform the
education and training experiences of residents and fellows. For example, in the area of professionalism, the
CLER Program explored for the first time the topic of disclosing potential conflicts of interest throughout
resident and fellow education. Across CLEs, less than a third of residents and fellows reported that faculty
members often or always disclosed whether or not they had potential conflicts of interests during each of their
clinical rotations. The CLER Program will continue to explore this topic in greater detail to better understand
how CLEs are ensuring physicians have opportunities to improve and advance patient care through research,
scholarship, and collaboration in an atmosphere of integrity and transparency.
Additionally, the findings also pointed to the lack of interprofessional learning in the course of providing patient
care. The next site visit protocol will explore a new CLER Focus Area, Teaming, in order to understand the
benefits of purposeful interactions in which clinical care team members come together to coordinate care and
share accountability to achieve outstanding patient care results.
The numerous opportunities for improvement appearing in each of the CLER Focus Areas may also reflect
how difficult it is to identify and implement successful solutions that are not readily apparent or complicated
by numerous internal and external factors affecting both GME and the CLE. As noted in the introduction to
this report, the CLER Program is committed to exploring and implementing various mechanisms to help CLEs
accelerate positive change. For example, the Pursuing Excellence initiative has demonstrated successful
approaches to solving for complex problems using a collaborative model of learning that convenes teams from
various CLEs to learn under a common framework while allowing for flexibility and innovation from site to site.1
In addition, initiatives such as the ACGME’s Sponsoring Institution National Learning Community, with its DIO
Forum and other plans for outreach, and a new effort known as the Program Directors’ Patient Safety and
Quality Educators Network, are providing models for how to build, sustain, and grow communities of learning.
Through these and many other ACGME programs of education and outreach, the ACGME is assisting the
GME community in testing and sharing new approaches to improving complex challenges in the CLE. These
efforts also align with other national efforts in these areas such as the recently released National Action Plan
to Advance Patient Safety, focusing on four foundational areas: leadership and culture; patient engagement;
workforce safety; and learning systems.2
Efforts to promote ongoing quality improvement in our nation’s CLEs can take many forms. One potential
approach might be to follow the well accepted model of quality outlined by Donabedian in his seminal work
on quality improvement, with attention to structure, process and outcomes.3 For example, regarding structure,
there are fundamental documents, such as the organization’s quality and patient safety plan, that could
articulate organizational expectations for how learners like residents and fellows engage in efforts to optimize
health care quality and patient safety. Similarly, most organizations have performance dashboards where
measures of resident and fellow engagement could be included. CLEs could also focus on examining and

CLER NATIONAL REPORT OF FINDINGS 2021 | LESSONS LEARNED | 97
improving their current approach to including GME in efforts to design optimal clinical care teams and patient
experiences.
When considering its processes, CLEs may benefit from examining how their patient safety and quality
departments could expand their processes for educating the workforce (including GME) and involve them in
strategic efforts. CLEs can seek to ensure each new member of the clinical care team, including residents
and fellows, receives a successful progressive learning experience that involves them in the organization’s
efforts to patient safety and quality improvement. For outcomes, CLEs could benefit from deepening their
understanding of the essential role GME plays in achieving optimal clinical outcomes by understanding
residents’ and fellows’ contributions to patient outcomes as reflected in the organization’s key performance
indicators.
In addition to its outward facing efforts, the CLER Program is also an essential component of the ACGME’s
internal cycles of continuous quality improvement. For the CLER Program, each cycle involves a multi-year
process to evolve and implement the CLER site visit protocol, analyze and report aggregate findings, and
explore ways to motivate and support improvement in GME and patient care. For example, the CLER National Report of Findings published in 2016 informed the CLER Pathways to Excellence guidance document
(Version 1.1).4 In turn, the Pathways to Excellence document and 2016 National Report catalyzed the launch
of the Pursuing Excellence initiative’s outreach efforts and also informed the ACGME’s ongoing process to
improve accreditation standards—specifically informing the background and requirements in Section VI of the
ACGME Common Program Requirements published in 2017.
In 2022, the ACGME’s Institutional Requirements are scheduled to undergo a major revision as part of a
routine 10-year major revision cycle. Anticipating this revision, the CLER Evaluation Committee is in the
process of studying the results in this current CLER National Report of Findings and those in past reports
to identify and articulate a set of opportunities for improvement for the Institutional Review Committee’s
consideration. This will complete a second major quality improvement cycle within the ACGME that weighs
the evidence from the CLER Program in forming the basis of institutional standards.
The ACGME is continually forward facing, and as part of its strategic plan, future directions will increasingly
include a focus on assessment of clinical outcomes. As part of this larger effort, the CLER Program is in the
early stages of exploring how clinical outcomes might best inform its ongoing evolution and transformation and
how those efforts in turn can best contribute to the ACGME’s next major quality improvement cycle. In doing
so, the CLER Program looks forward to the future and to furthering the goal of optimizing both learning and
patient care.
REFERENCES1. Wagner, Robin, Kevin B. Weiss, Morgan L. Passiment, and Thomas J. Nasca. 2016. “Pursuing Excellence in Clinical Learning
Environments.” Journal of Graduate Medical Education 8 (1): 124–27. doi.org/10.4300/JGME-D-15-00737.1.
2. http://forms.ihi.org/national-action-plan?hsCtaTracking=5aff5040-7b47-4fde-b44e-620597380a7d%7C919b960f-4785-4fc3-bfe6-83d96eaec247
3. Donabedian, Avedis. Explorations in Quality Assessment and Monitoring Vol. 1. The Definition of Quality and Approaches to Its Assessment. Ann Arbor, MI: Health Administration Press, 1980.
4. CLER Evaluation Committee. 2017. “CLER Pathways to Excellence: Expectations for an Optimal Clinical Learning Environment to Achieve Safe and High Quality Patient Care, Version 1.1.” Chicago, IL: Accreditation Council for Graduation Medical Education.

98 | APPEND IX A | CLER NATIONAL REPORT OF FINDINGS 2021
A1.1. Sponsoring Institution Distribution by Region and Typea
APPENDIX A1.GENERAL CHARACTERISTICS OF SPONSORING INSTITUTIONS
a Percentages do not total 100 because of rounding. b Limited to three Sponsoring Institutions (SIs) in Puerto Rico.
Abbreviations: ACGME, Accreditation Council for Graduate Medical Education; CLER, Clinical Learning Environment Review.
Characteristic SIs with CLER Visits, %a (n = 566)
All SIs, % (N = 766)
Region
Northeast 26.0 24.7
Midwest 25.3 23.1
South 29.3 30.2
West 18.9 20.5
Territoryb 0.5 1.6
Type of Sponsoring Institution
General/teaching hospital 57.8 48.4
Medical school or health science center 19.1 15.9
Educational consortium 4.4 6.7
Children’s hospital 2.7 2.5
Other 16.1 26.5
Programs and Sites SIs with CLER Visits, % (n = 566)
All SIs, % (N = 766)
Programs
< 3 36.9 47.8
3–4 14.3 12.5
5–20 24.2 20.9
> 20 24.6 18.8
Number of Core Programs
< 2 32.0 42.2
2–3 24.2 22.3
4–10 20.5 17.4
> 10 23.3 18.1
Number of Participating Sites
< 6 27.9 30.8
6–11 22.1 22.6
12–29 25.8 24.7
> 29 24.2 21.9
A1.2. Sponsoring Institution Distribution by Number of ACGME-Accredited Residency and Fellowship Programs and Participating Sites

CLER NATIONAL REPORT OF FINDINGS 2021 | APPEND IX A | 99
A1.3. Number and Distribution of Core Faculty Members at Sponsoring Institutions by Specialty Groupinga
a Percentages do not total 100 because of rounding.
Abbreviations: CLER, Clinical Learning Environment Review; PGY, postgraduate year; SI, Sponsoring Institution.
Specialty Subgroup SIs with CLER Visits, % (n = 98,976)
All SIs, % (N = 107,504)
Medical 43.7 45.4
Surgical 32.3 31.3
Hospital-based 24.1 23.3
Resident and Fellow Characteristic SIs with CLER Visits, % (n = 129,788)
All SIs, % (N = 139,265)
Gender
Male 53.5 53.6
Female 45.2 45.1
Unknown 1.3 1.3
Level of Training
PGY-1 25.6 25.9
PGY-2 23.1 23.3
PGY-3 22.1 22.3
PGY-4+ 29.2 28.6
Specialty Group
Medical 60.3 60.9
Surgical 20.3 19.8
Hospital-based 19.4 19.2
A1.4. Number and Distribution of Residents and Fellows at Sponsoring Institutions by Gender, Level of Training, and Specialty Groupinga

100 | APPEND IX A | CLER NATIONAL REPORT OF FINDINGS 2021
APPENDIX A2.G E N E RAL CHARACTE R ISTICS OF CLI N ICAL LEAR N I NG E NVI RON M E NTS
a Based on the 2018 American Hospital Association Annual Survey. b Percentages do not total 100 because of rounding. c Missing data (< 6%) largely due to clinical sites that do not report data to the American Hospital Association. Percentages based on valid percent.d Member of Council of Teaching Hospital of the Association of American Medical Colleges. e Includes psychiatric, rehabilitation, acute long-term care hospital, children’s general medical and surgical, and other types of services. f Missing data < 14%. g Missing data < 11%. h Missing data < 30%. i Missing data < 6%.j Physicians, residents, interns, and other trainees omitted from staff count. k Full-time and part-time personnel only; excludes full-time and part-time equivalent personnel.
Abbreviations: CLER, Clinical Learning Environment Review; IQR, interquartile range; SI, Sponsoring Institution.
A2.2. Clinical Learning Environment Distribution by Beds and Staffinga
Characteristic SIs with CLER Visits, % (n = 534)c
Teaching Hospitals,d % (n = 300)
All Hospitals, % (N = 6,218)
Type of Ownership
Non-government, not-for-profit 71.0 68.7 50.1
Investor-owned, for-profit 7.9 2.0 26.7
Government, federal 3.9 12.3 3.4
Government, non-federal 17.2 17.0 19.7
Service for Majority of Patients
General medical and surgical 94.4 89.7 74.2
Othere 5.6 10.3 25.8
Characteristic SIs with CLER Visits, Median (IQR)
Teaching Hospitals, Median (IQR)
All Hospitals, Median (IQR)
Total Licensed Beds 498 (341–713)f 620 (435–863)g 107 (40–260)h
Total Staffed Beds 402 (245–607)i 535 (358–734) 81 (30–196)
Staff j,k
Registered nurses 952 (568–1690) 1509 (920–2403) 112 (49–371)
Clinical staff 581 (330–1057) 876 (510–1384) 100 (48–255)
All other personnel 1459 (848–2769) 2357 (1384–3648) 213 (92–572)
A2.1. Clinical Learning Environment Distribution by Type of Ownership and Servicesa,b

CLER NATIONAL REPORT OF FINDINGS 2021 | APPEND IX A | 101
a Based on the 2017-2020 Accreditation Council for Graduate Medical Education data. b Percentages do not total 100 because of rounding. c Missing data limited to one Sponsoring Institution.
Abbreviation: SI, Sponsoring Institution.
Programsa,b SIs with CLER Visits, % (N = 565)c
Number of Programs at Site
< 4 29.4
4–10 22.7
11–34 23.2
> 34 24.8
Number of Core Programs at Site
< 3 27.3
3–7 26.0
8–18 22.1
> 18 24.6
APPENDIX A3.CLI N ICAL LEAR N I NG E NVI RON M E NTS VIS ITE D: N U M B E R OF PROG RAMS AT S ITE

102 | APPEND IX A | CLER NATIONAL REPORT OF FINDINGS 2021
APPENDIX A4.CLE R VIS ITS: CHARACTE R ISTICS OF G ROU PS I NTE RVI EWE D
a Based on audience response system data. b Missing data (< 2%) have been omitted; percentages based on valid percent. c Percentages do not total 100 because of rounding.
A4.2. Selected Characteristics of Faculty Members and Program Directors in the Group Interviewsa,c
A4.1. Selected Characteristics of Residents and Fellows in the Group Interviewsa
Characteristic Faculty Members, % (N = 9,988)
Program Directors, % (N = 6,489)
Years at Hospital, Medical Center, or Ambulatory Care Siteb
≤ 2 19.5 6.2
3–5 25.7 15.7
6–10 21.0 27.8
> 10 33.8 50.3
Programb
Core residency program 58.0 46.4
Fellowship 12.6 48.3
Both 29.4 5.3
Specialty Groupb
Medical 56.7 54.9
Surgical 22.3 22.8
Hospital-based 21.0 22.2
Characteristic Residents and Fellows, % (N = 11,166)
Genderb
Male 53.8
Female 45.8
Other 0.4
Level of Trainingb
PGY-1 1.6
PGY-2 27.1
PGY-3 30.4
PGY-4+ 40.9
Specialty Groupb
Medical 57.6
Surgical 23.3
Hospital-based 19.1

CLER NATIONAL REPORT OF FINDINGS 2021 | APPEND IX B | 103
APPENDIX B.SE LECTE D R ESU LTS FROM R ESI DE NT AN D FE LLOW G ROU P I NTE RVI EWS
B1. Percentage of Residents and Fellows Who Reported Experiencing an Adverse Event, Near Miss/Close Call, or Unsafe Condition
DISTRIBUTION ACROSS CLEsc (n = 565)
0 20 40 60 80 100
Median = 75.0
IQR = 60.8-83.5
Residents and Fellows, %
CLEs
, No.
0
20
40
60
80
CHANGE IN MEDIAN BETWEEN CLER VISITS:CYCLES 1 – 3d,e (N = 240)***
3
Median=68.1
Cycle
Resid
ents
and
Fel
lows
, %
0
20
40
60
80
100
1 2
Median=72.4
Median=75.4
a Missing data (< 4%) have been omitted; percentages based on valid percent.
b Results from clinical learning environments (CLEs) in Puerto Rico (< 1%) omitted to ensure anonymity.
c Distribution includes 95% or more of the total number of CLEs (N = 566). d Results based on matched observations; see Methodology (pp. 17–26).
e The horizontal line in the middle of the box indicates the median and the top and bottom of the box indicate the 75th and 25th percentiles, respectively, also known as the interquartile range (IQR). The whiskers above and below the box mark the maximum and minimum values, respectively. The points beyond the whiskers are outliers.
* Statistically significant at P < .05.
** Statistically significant at P < .01.
*** Statistically significant at P < .001.
Abbreviation: PGY, postgraduate year.
74.1PERCENT OF TOTAL SURVEYEDa (N = 11,148)
PERCENTAGE BY RESIDENT AND FELLOW AND CLE CHARACTERISTICSa
Residents and Fellows Characteristics
Residents and Fellows, % (n = 11,148)
Gender***
Male 72.7
Female 75.8
Level of Training***
PGY-1 52.2
PGY-2 72.4
PGY-3 78.4
PGY-4+ 72.9
Specialty Group***
Medical 74.2
Surgical 78.7
Hospital-based 68.4
CLE Characteristics
Regionb** Northeast 75.5
Midwest 75.4
South 73.4
West 74.5
Bed Size***
< 200 70.2
200–299 72.8
300–399 71.0
400–499 75.0
500 or more 76.0
Type of Ownership**
Non-government, not-for-profit 75.1
Investor-owned, for-profit 68.7
Government, federal 78.8
Government, non-federal 73.6

104 | APPEND IX B | CLER NATIONAL REPORT OF FINDINGS 2021
B2. Percentage of Residents and Fellows Who Reported Experiencing an Adverse Event, Near Miss/Close Call, or Unsafe Condition and Submitted a Report through the Clinical Site’s Reporting System
54.0PERCENT OF TOTAL SURVEYEDa (n = 8,093)
PERCENTAGE BY RESIDENT AND FELLOW AND CLE CHARACTERISTICSa
Residents and Fellows Characteristics
Residents and Fellows, % (n = 8,093)
Gender***
Male 52.0
Female 56.3
Level of Training***
PGY-1 33.7
PGY-2 53.8
PGY-3 57.2
PGY-4+ 52.0
Specialty Group***
Medical 58.3
Surgical 50.9
Hospital-based 44.2
CLE Characteristics
Regionb*** Northeast 53.2
Midwest 57.2
South 55.6
West 48.1
Bed Size***
< 200 61.0
200–299 60.6
300–399 55.3
400–499 49.1
500 or more 53.2
Type of Ownership***
Non-government, not-for-profit 54.9
Investor-owned, for-profit 42.5
Government, federal 69.5
Government, non-federal 52.4
DISTRIBUTION ACROSS CLEsc (n = 558)
0 20 40 60 80 100
Median = 56.4
IQR = 37.9-75.0
Residents and Fellows, %
CLEs
, No.
0
20
40
60
80
CHANGE IN MEDIAN BETWEEN CLER VISITS:CYCLES 1 – 3d,e (n = 240)**
3
Median=46.4
Cycle
Resid
ents
and
Fel
lows
, %
0
20
40
60
80
100
1 2
Median=50.0
Median=54.8
a Missing data (< 5%) have been omitted; percentages based on valid percent.
b Results from clinical learning environments (CLEs) in Puerto Rico (< 1%) omitted to ensure anonymity.
c Distribution includes 95% or more of the total number of CLEs (N = 566). d Results based on matched observations; see Methodology (pp. 17-26).
e The horizontal line in the middle of the box indicates the median and the top and bottom of the box indicate the 75th and 25th percentiles, respectively, also known as the interquartile range (IQR). The whiskers above and below the box mark the maximum and minimum values, respectively. The points beyond the whiskers are outliers.
* Statistically significant at P < .05.
** Statistically significant at P < .01.
*** Statistically significant at P < .001.
Abbreviation: PGY, postgraduate year.

CLER NATIONAL REPORT OF FINDINGS 2021 | APPEND IX B | 105
22.4PERCENT OF TOTAL SURVEYEDa (n = 11,138)
PERCENTAGE BY RESIDENT AND FELLOW AND CLE CHARACTERISTICSa
Residents and Fellows Characteristics
Residents and Fellows, % (n = 11,138)
Gender***
Male 19.6
Female 25.7
Level of Training***
PGY-1 9.3
PGY-2 24.8
PGY-3 26.9
PGY-4+ 17.9
Specialty Group***
Medical 25.6
Surgical 19.9
Hospital-based 16.0
CLE Characteristics
Regionb*** Northeast 24.0
Midwest 25.3
South 22.3
West 17.9
Bed Size*
< 200 24.3
200–299 25.2
300–399 20.2
400–499 21.8
500 or more 22.8
Type of Ownership***
Non-government, not-for-profit 23.5
Investor-owned, for-profit 23.1
Government, federal 28.1
Government, non-federal 19.9
B3. Percentage of Residents and Fellows Who Reported a Near Miss/Close Call Event
DISTRIBUTION ACROSS CLEsc (n = 565)
0 20 40 60 80 100
Median = 21.4
IQR = 10.0-33.3
Residents and Fellows, %
CLEs
, No.
0
20
40
60
80
100
CHANGE IN MEDIAN BETWEEN CLER VISITS:CYCLES 1 – 3d,e (n = 241)***
3
Median=17.9
Cycle
Resid
ents
and
Fel
lows
, %
0
20
40
60
80
100
1 2
Median=23.1
Median=21.4
a Missing data (< 4%) have been omitted; percentages based on valid percent.
b Results from clinical learning environments (CLEs) in Puerto Rico (< 1%) omitted to ensure anonymity.
c Distribution includes 95% or more of the total number of CLEs (N = 566). d Results based on matched observations; see Methodology (pp. 17-26).
e The horizontal line in the middle of the box indicates the median and the top and bottom of the box indicate the 75th and 25th percentiles, respectively, also known as the interquartile range (IQR). The whiskers above and below the box mark the maximum and minimum values, respectively. The points beyond the whiskers are outliers.
* Statistically significant at P < .05.
** Statistically significant at P < .01.
*** Statistically significant at P < .001.
Abbreviation: PGY, postgraduate year.

106 | APPEND IX B | CLER NATIONAL REPORT OF FINDINGS 2021
B4. Percentage of Residents and Fellows Who Reported Receiving Feedback on the Outcome of a Report Submitteda through the Clinical Site’s Reporting System
46.0PERCENT OF TOTAL SURVEYEDb (n = 6,673)
PERCENTAGE BY RESIDENT AND FELLOW AND CLE CHARACTERISTICSb
Residents and Fellows Characteristics
Residents and Fellows, % (n = 6,673)
Gender***
Male 49.5
Female 42.3
Level of Training***
PGY-1 38.1
PGY-2 42.0
PGY-3 46.3
PGY-4+ 48.5
Specialty Group***
Medical 44.2
Surgical 50.3
Hospital-based 46.2
CLE Characteristics
Regionc*** Northeast 49.1
Midwest 46.0
South 45.6
West 40.1
Bed Size*
< 200 50.9
200–299 49.7
300–399 45.2
400–499 44.8
500 or more 44.7
Type of Ownership***
Non-government, not-for-profit 47.6
Investor-owned, for-profit 36.2
Government, federal 50.2
Government, non-federal 41.6
DISTRIBUTION ACROSS CLEsd (n = 555)
0 20 40 60 80 100
Median = 50.0
IQR = 31.7-66.7
Residents and Fellows, %
CLEs
, No.
0
20
40
60
80
CHANGE IN MEDIAN BETWEEN CLER VISITS:CYCLES 1 – 3e,f (n = 240)***
3
Median=46.7
Cycle
Resid
ents
and
Fel
lows
, %
0
20
40
60
80
100
1 2
Median=48.5 Median=
44.4
a Report submitted by resident or fellow or through a nurse, medical assistant, or supervisor.
b Missing data (< 9%) have been omitted; percentages based on valid percent.
c Results from clinical learning environments (CLEs) in Puerto Rico (< 1%) omitted to ensure anonymity.
d Distribution includes 95% or more of the total number of CLEs (N = 566). e Results based on matched observations; see Methodology (pp. 17-26).
f The horizontal line in the middle of the box indicates the median and the top and bottom of the box indicate the 75th and 25th percentiles, respectively, also known as the interquartile range (IQR). The whiskers above and below the box mark the maximum and minimum values, respectively. The points beyond the whiskers are outliers.
* Statistically significant at P < .05.
** Statistically significant at P < .01.
*** Statistically significant at P < .001.
Abbreviation: PGY, postgraduate year.

CLER NATIONAL REPORT OF FINDINGS 2021 | APPEND IX B | 107
40.4PERCENT OF TOTAL SURVEYEDa (n = 7,774)
PERCENTAGE BY RESIDENT AND FELLOW AND CLE CHARACTERISTICSa
Residents and Fellows Characteristics
Residents and Fellows, % (n = 7,774)
Gender
Male 40.2
Female 40.6
Level of Training
PGY-3 40.9
PGY-4+ 39.9
Specialty Group**
Medical 41.3
Surgical 41.2
Hospital-based 36.7
CLE Characteristics
Regionb** Northeast 41.8
Midwest 41.4
South 40.7
West 36.8
Bed Size
< 200 41.9
200–299 42.8
300–399 37.7
400–499 39.6
500 or more 40.6
Type of Ownership*
Non-government, not-for-profit 41.5
Investor-owned, for-profit 36.0
Government, federal 38.6
Government, non-federal 38.5
B5. Percentage of Residents and Fellows (PGY-3 and Above) Who Reported Participating in an Interprofessional (Physicians, Nurses, Administrators, Others) Investigation of a Patient Safety Event (e.g., Root Cause Analysis)
DISTRIBUTION ACROSS CLEsc (n = 554)
0 20 40 60 80 100
Median = 40.0
IQR = 26.6-61.6
Residents and Fellows, %
CLEs
, No.
0
20
40
60
80
CHANGE IN MEDIAN BETWEEN CLER VISITS:CYCLES 1 – 3d,e (n = 235)*
3
Median=41.2
Cycle
Resid
ents
and
Fel
lows
, %
0
20
40
60
80
100
1 2
Median=36.8
Median=40.0
a Missing data (< 5%) have been omitted; percentages based on valid percent.
b Results from clinical learning environments (CLEs) in Puerto Rico (< 1%) omitted to ensure anonymity.
c Distribution includes 95% or more of the total number of CLEs (N = 566). d Results based on matched observations; see Methodology (pp. 17-26).
e The horizontal line in the middle of the box indicates the median and the top and bottom of the box indicate the 75th and 25th percentiles, respectively, also known as the interquartile range (IQR). The whiskers above and below the box mark the maximum and minimum values, respectively. The points beyond the whiskers are outliers.
* Statistically significant at P < .05.
** Statistically significant at P < .01.
*** Statistically significant at P < .001.
Abbreviation: PGY, postgraduate year.

108 | APPEND IX B | CLER NATIONAL REPORT OF FINDINGS 2021
B6. Percentage of Residents and Fellows Who Reported Knowing the Clinical Site’s Resources to Support Them if Involved in a Major Patient Safety Event
85.5PERCENT OF TOTAL SURVEYEDa (n = 11,124)
PERCENTAGE BY RESIDENT AND FELLOW AND CLE CHARACTERISTICSa
Residents and Fellows Characteristics
Residents and Fellows, % (n = 11,124)
Gender
Male 85.8
Female 85.4
Level of Training
PGY-1 85.7
PGY-2 86.0
PGY-3 86.0
PGY-4+ 85.0
Specialty Group
Medical 85.3
Surgical 86.0
Hospital-based 85.8
CLE Characteristics
Regionb*** Northeast 82.7
Midwest 86.0
South 86.0
West 89.3
Bed Size***
< 200 87.2
200–299 84.6
300–399 82.6
400–499 81.2
500 or more 87.0
Type of Ownership***
Non-government, not-for-profit 86.7
Investor-owned, for-profit 75.2
Government, federal 91.1
Government, non-federal 83.4
DISTRIBUTION ACROSS CLEsc (n = 565)
0 20 40 60 80 100
Median = 90.9
IQR = 80.0-100
Residents and Fellows, %
CLEs
, No.
0
50
100
150
200
250
CHANGE IN MEDIAN BETWEEN CLER VISITS:CYCLES 2 – 3d,e (n = 501)***
3
Cycle
Resid
ents
and
Fel
lows
, %
0
20
40
60
80
100
2
Median=89.7
Median=90.9
a Missing data (< 4%) have been omitted; percentages based on valid percent.
b Results from clinical learning environments (CLEs) in Puerto Rico (< 1%) omitted to ensure anonymity.
c Distribution includes 95% or more of the total number of CLEs (N = 566). d Results based on matched observations; see Methodology (pp. 17-26).
e The horizontal line in the middle of the box indicates the median and the top and bottom of the box indicate the 75th and 25th percentiles, respectively, also known as the interquartile range (IQR). The whiskers above and below the box mark the maximum and minimum values, respectively. The points beyond the whiskers are outliers.
* Statistically significant at P < .05.
** Statistically significant at P < .01.
*** Statistically significant at P < .001.
Abbreviation: PGY, postgraduate year.

CLER NATIONAL REPORT OF FINDINGS 2021 | APPEND IX B | 109
75.3PERCENT OF TOTAL SURVEYEDa (n = 10,914)
PERCENTAGE BY RESIDENT AND FELLOW AND CLE CHARACTERISTICSa
B7. Percentage of Residents and Fellows (PGY-2 and Above) Who Reported Knowing the Clinical Site’s Priorities in the Area of Quality Improvement
DISTRIBUTION ACROSS CLEsc (n = 564)
0 20 40 60 80 100
Median = 83.0
IQR = 66.7-100
Residents and Fellows, %
CLEs
, No.
0
50
100
150
200
CHANGE IN MEDIAN BETWEEN CLER VISITS:CYCLES 1 – 3d,e (n = 237)**
3
Median=81.8
Cycle
Resid
ents
and
Fel
lows
, %
0
20
40
60
80
100
1 2
Median=86.7 Median=
80.0
a Missing data (< 4%) have been omitted; percentages based on valid percent.
b Results from clinical learning environments (CLEs) in Puerto Rico (< 1%) omitted to ensure anonymity.
c Distribution includes 95% or more of the total number of CLEs (N = 566). d Results based on matched observations; see Methodology (pp. 17-26).
e The horizontal line in the middle of the box indicates the median and the top and bottom of the box indicate the 75th and 25th percentiles, respectively, also known as the interquartile range (IQR). The whiskers above and below the box mark the maximum and minimum values, respectively. The points beyond the whiskers are outliers.
* Statistically significant at P < .05.
** Statistically significant at P < .01.
*** Statistically significant at P < .001.
Abbreviation: PGY, postgraduate year.
Residents and Fellows Characteristics
Residents and Fellows, % (n = 10,914)
Gender*
Male 74.5
Female 76.4
Level of Training***
PGY-2 76.8
PGY-3 77.0
PGY-4+ 73.0
Specialty Group*
Medical 75.6
Surgical 76.5
Hospital-based 73.0
CLE Characteristics
Regionb*** Northeast 75.2
Midwest 76.1
South 77.0
West 69.6
Bed Size***
< 200 79.9
200–299 83.0
300–399 77.7
400–499 69.8
500 or more 73.6
Type of Ownership***
Non-government, not-for-profit 76.4
Investor-owned, for-profit 73.3
Government, federal 74.1
Government, non-federal 71.8

110 | APPEND IX B | CLER NATIONAL REPORT OF FINDINGS 2021
B8. Percentage of Residents and Fellows (PGY-2 and Above) Who Reported Participating in a Quality Improvement Project of Their Own Design or One Designed by Their Program or Department
78.9PERCENT OF TOTAL SURVEYEDa (n = 10,914)
PERCENTAGE BY RESIDENT AND FELLOW AND CLE CHARACTERISTICSa
Residents and Fellows Characteristics
Residents and Fellows, % (n = 10,914)
Gender***
Male 77.8
Female 80.2
Level of Training***
PGY-2 75.5
PGY-3 82.4
PGY-4+ 78.5
Specialty Group***
Medical 81.4
Surgical 75.5
Hospital-based 75.2
CLE Characteristics
Regionb*** Northeast 75.4
Midwest 78.6
South 80.6
West 81.2
Bed Size***
< 200 82.0
200–299 83.2
300–399 77.6
400–499 76.8
500 or more 78.2
Type of Ownership
Non-government, not-for-profit 78.6
Investor-owned, for-profit 80.2
Government, federal 82.2
Government, non-federal 78.2
DISTRIBUTION ACROSS CLEsc (n = 564)
0 20 40 60 80 100
Median = 82.9
IQR = 71.4-100
Residents and Fellows, %
CLEs
, No.
0
50
100
150
200
CHANGE IN MEDIAN BETWEEN CLER VISITS:CYCLES 1 – 3d,e (n = 237)*
3
Median=78.3
Cycle
Resid
ents
and
Fel
lows
, %
40
60
80
100
20
1 2
Median=80.0
Median=80.4
a Missing data (< 4%) have been omitted; percentages based on valid percent.
b Results from clinical learning environments (CLEs) in Puerto Rico (< 1%) omitted to ensure anonymity.
c Distribution includes 95% or more of the total number of CLEs (N = 566). d Results based on matched observations; see Methodology (pp. 17-26).
e The horizontal line in the middle of the box indicates the median and the top and bottom of the box indicate the 75th and 25th percentiles, respectively, also known as the interquartile range (IQR). The whiskers above and below the box mark the maximum and minimum values, respectively. The points beyond the whiskers are outliers.
* Statistically significant at P < .05.
** Statistically significant at P < .01.
*** Statistically significant at P < .001.
Abbreviation: PGY, postgraduate year.

CLER NATIONAL REPORT OF FINDINGS 2021 | APPEND IX B | 111
47.5PERCENT OF TOTAL SURVEYEDa (n = 8,440)
PERCENTAGE BY RESIDENT AND FELLOW AND CLE CHARACTERISTICSa
B9. Percentage of Residents and Fellows (PGY-2 and Above) Who Reported Participating in a Quality Improvement Project Linked to One or More of the Clinical Site’s Quality Improvement Goals
DISTRIBUTION ACROSS CLEsc (n = 563)
0 20 40 60 80 100
Median = 50.0
IQR = 31.6-71.4
Residents and Fellows, %
CLEs
, No.
0
10
30
20
40
50
60
CHANGE IN MEDIAN BETWEEN CLER VISITS:CYCLES 1 – 3d,e (n = 236)**
3
Median=54.5
Cycle
Resid
ents
and
Fel
lows
, %
0
20
40
60
80
100
1 2
Median=46.3 Median=
44.7
a Missing data (< 5%) have been omitted; percentages based on valid percent.
b Results from clinical learning environments (CLEs) in Puerto Rico (< 1%) omitted to ensure anonymity.
c Distribution includes 95% or more of the total number of CLEs (N = 566). d Results based on matched observations; see Methodology (pp. 17-26).
e The horizontal line in the middle of the box indicates the median and the top and bottom of the box indicate the 75th and 25th percentiles, respectively, also known as the interquartile range (IQR). The whiskers above and below the box mark the maximum and minimum values, respectively. The points beyond the whiskers are outliers.
* Statistically significant at P < .05.
** Statistically significant at P < .01.
*** Statistically significant at P < .001.
Abbreviation: PGY, postgraduate year.
Residents and Fellows Characteristics
Residents and Fellows, % (n = 8,440)
Gender
Male 48.6
Female 46.3
Level of Training
PGY-2 48.9
PGY-3 48.2
PGY-4+ 45.9
Specialty Group***
Medical 47.1
Surgical 51.0
Hospital-based 44.0
CLE Characteristics
Regionb*** Northeast 49.8
Midwest 46.5
South 46.9
West 43.3
Bed Size***
< 200 52.4
200–299 53.3
300–399 48.4
400–499 46.0
500 or more 45.1
Type of Ownership***
Non-government, not-for-profit 47.7
Investor-owned, for-profit 40.9
Government, federal 50.4
Government, non-federal 46.1

112 | APPEND IX B | CLER NATIONAL REPORT OF FINDINGS 2021
B10. Percentage of Residents and Fellows (PGY-2 and Above) Who Reported Being Engaged in Interprofessional Quality Improvement Teams (e.g., Nurses, Administrators, Pharmacists, etc.) While Participating in a Quality Improvement Project Directly Linked to One or More of the Clinical Site’s Quality Improvement Goals
74.2PERCENT OF TOTAL SURVEYEDa (n = 3,881)
PERCENTAGE BY RESIDENT AND FELLOW AND CLE CHARACTERISTICSa
Residents and Fellows Characteristics
Residents and Fellows, % (n = 3,881)
Gender
Male 74.4
Female 74.0
Level of Training
PGY-2 74.5
PGY-3 74.9
PGY-4+ 73.5
Specialty Group
Medical 75.3
Surgical 73.4
Hospital-based 71.5
CLE Characteristics
Regionb
Northeast 73.0
Midwest 73.1
South 75.0
West 74.1
Bed Size
< 200 78.2
200–299 74.4
300–399 72.6
400–499 74.4
500 or more 73.3
Type of Ownership
Non-government, not-for-profit 73.9
Investor-owned, for-profit 73.1
Government, federal 80.3
Government, non-federal 73.1
DISTRIBUTION ACROSS CLEsc (n = 518)
0 20 40 60 80 100
Median = 79.5
IQR = 60.0-100
Residents and Fellows, %
CLEs
, No.
0
50
100
150
200
CHANGE IN MEDIAN BETWEEN CLER VISITS:CYCLES 1 – 3d,e (n = 231)
3
Median=75.0
Cycle
Resid
ents
and
Fel
lows
, %
0
20
40
60
80
100
1 2
Median=77.8 Median=
72.7
a Missing data (< 7%) have been omitted; percentages based on valid percent.
b Results from clinical learning environments (CLEs) in Puerto Rico (< 1%) omitted to ensure anonymity.
c Distribution includes 90% or more of the total number of CLEs (N = 566). d Results based on matched observations; see Methodology (pp. 17-26).
e The horizontal line in the middle of the box indicates the median and the top and bottom of the box indicate the 75th and 25th percentiles, respectively, also known as the interquartile range (IQR). The whiskers above and below the box mark the maximum and minimum values, respectively. The points beyond the whiskers are outliers.
* Statistically significant at P < .05.
** Statistically significant at P < .01.
*** Statistically significant at P < .001.
Abbreviation: PGY, postgraduate year.

CLER NATIONAL REPORT OF FINDINGS 2021 | APPEND IX B | 113
31.8PERCENT OF TOTAL SURVEYEDa (n = 11,105)
PERCENTAGE BY RESIDENT AND FELLOW AND CLE CHARACTERISTICSa
B11. Percentage of Residents and Fellows Who Reported Receiving Aggregated or Benchmarked Quality Performance Data About the Care of Their Own Patients
DISTRIBUTION ACROSS CLEs (n = 566)
0 20 40 60 80 100
Median = 33.6
IQR = 20.0-45.6
Residents and Fellows, %
CLEs
, No.
0
20
40
60
80
CHANGE IN MEDIAN BETWEEN CLER VISITS:CYCLES 2 – 3c,d (n = 501)***
3
Cycle
Resid
ents
and
Fel
lows
, %
0
20
40
60
80
100
2
Median=37.5 Median=
32.8
a Missing data (< 4%) have been omitted; percentages based on valid percent.
b Results from clinical learning environments (CLEs) in Puerto Rico (< 1%) omitted to ensure anonymity.
c Results based on matched observations; see Methodology (pp. 17-26).
d The horizontal line in the middle of the box indicates the median and the top and bottom of the box indicate the 75th and 25th percentiles, respectively, also known as the interquartile range (IQR). The whiskers above and below the box mark the maximum and minimum values, respectively. The points beyond the whiskers are outliers.
* Statistically significant at P < .05.
** Statistically significant at P < .01.
*** Statistically significant at P < .001.
Abbreviation: PGY, postgraduate year.
Residents and Fellows Characteristics
Residents and Fellows, % (n = 11,105)
Gender
Male 32.1
Female 31.6
Level of Training***
PGY-1 28.2
PGY-2 37.2
PGY-3 35.9
PGY-4+ 25.4
Specialty Group***
Medical 36.6
Surgical 23.0
Hospital-based 28.4
CLE Characteristics
Regionb*** Northeast 30.5
Midwest 33.4
South 30.2
West 33.4
Bed Size**
< 200 34.3
200–299 36.1
300–399 32.8
400–499 28.9
500 or more 30.5
Type of Ownership***
Non-government, not-for-profit 32.4
Investor-owned, for-profit 27.4
Government, federal 32.5
Government, non-federal 29.4

114 | APPEND IX B | CLER NATIONAL REPORT OF FINDINGS 2021
B12. Percentage of Residents and Fellows Who Reported Receiving Cultural Competency Training Specific to Populations at Risk for Health Care Disparities at Their Clinical Site
31.2PERCENT OF TOTAL SURVEYEDa (n = 11,106)
PERCENTAGE BY RESIDENT AND FELLOW AND CLE CHARACTERISTICSa
DISTRIBUTION ACROSS CLEs (n = 566)
0 20 40 60 80 100
Median = 30.0
IQR = 18.7-50.0
Residents and Fellows, %
CLEs
, No.
0
10
30
20
40
50
60
CHANGE IN MEDIAN BETWEEN CLER VISITS:CYCLES 2 – 3c,d (n = 502)***
3
Cycle
Resid
ents
and
Fel
lows
, %
0
20
40
60
80
100
2
Median=37.5 Median=
29.2
a Missing data (< 4%) have been omitted; percentages based on valid percent.
b Results from clinical learning environments (CLEs) in Puerto Rico (< 1%) omitted to ensure anonymity.
c Results based on matched observations; see Methodology (pp. 17-26).
d The horizontal line in the middle of the box indicates the median and the top and bottom of the box indicate the 75th and 25th percentiles, respectively, also known as the interquartile range (IQR). The whiskers above and below the box mark the maximum and minimum values, respectively. The points beyond the whiskers are outliers.
* Statistically significant at P < .05.
** Statistically significant at P < .01.
*** Statistically significant at P < .001.
Abbreviation: PGY, postgraduate year.
Residents and Fellows Characteristics
Residents and Fellows, % (n = 11,106)
Gender**
Male 30.7
Female 31.7
Level of Training***
PGY-1 25.3
PGY-2 34.1
PGY-3 33.5
PGY-4+ 27.9
Specialty Group***
Medical 33.4
Surgical 29.9
Hospital-based 26.1
CLE Characteristics
Regionb** Northeast 31.8
Midwest 30.5
South 30.1
West 31.6
Bed Size***
< 200 31.3
200–299 35.3
300–399 32.4
400–499 32.1
500 or more 29.4
Type of Ownership***
Non-government, not-for-profit 30.4
Investor-owned, for-profit 24.5
Government, federal 30.9
Government, non-federal 33.5
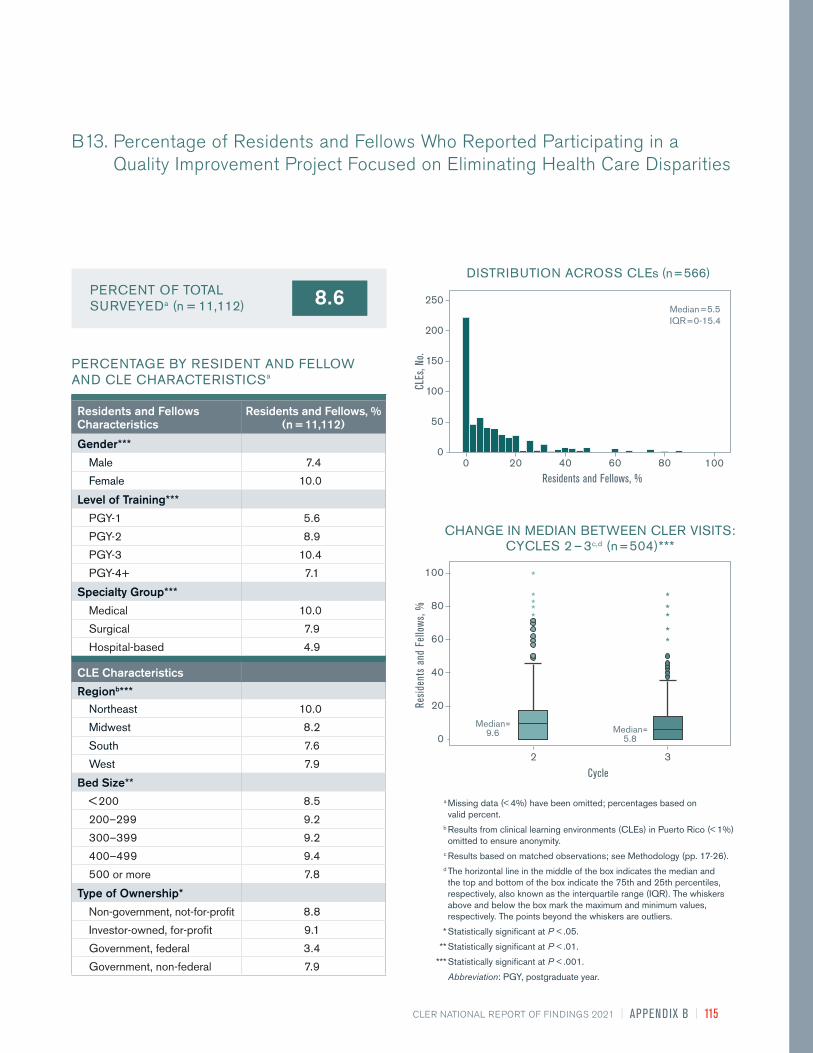
CLER NATIONAL REPORT OF FINDINGS 2021 | APPEND IX B | 115
8.6PERCENT OF TOTAL SURVEYEDa (n = 11,112)
PERCENTAGE BY RESIDENT AND FELLOW AND CLE CHARACTERISTICSa
B13. Percentage of Residents and Fellows Who Reported Participating in a Quality Improvement Project Focused on Eliminating Health Care Disparities
DISTRIBUTION ACROSS CLEs (n = 566)
Median = 5.5
IQR = 0-15.4
Residents and Fellows, %
CLEs
, No.
0
50
100
150
200
250
20 60 80 1000 40
CHANGE IN MEDIAN BETWEEN CLER VISITS:CYCLES 2 – 3c,d (n = 504)***
3
Cycle
Resid
ents
and
Fel
lows
, %
0
20
40
60
80
100
2
Median=9.6 Median=
5.8
a Missing data (< 4%) have been omitted; percentages based on valid percent.
b Results from clinical learning environments (CLEs) in Puerto Rico (< 1%) omitted to ensure anonymity.
c Results based on matched observations; see Methodology (pp. 17-26).
d The horizontal line in the middle of the box indicates the median and the top and bottom of the box indicate the 75th and 25th percentiles, respectively, also known as the interquartile range (IQR). The whiskers above and below the box mark the maximum and minimum values, respectively. The points beyond the whiskers are outliers.
* Statistically significant at P < .05.
** Statistically significant at P < .01.
*** Statistically significant at P < .001.
Abbreviation: PGY, postgraduate year.
Residents and Fellows Characteristics
Residents and Fellows, % (n = 11,112)
Gender***
Male 7.4
Female 10.0
Level of Training***
PGY-1 5.6
PGY-2 8.9
PGY-3 10.4
PGY-4+ 7.1
Specialty Group***
Medical 10.0
Surgical 7.9
Hospital-based 4.9
CLE Characteristics
Regionb*** Northeast 10.0
Midwest 8.2
South 7.6
West 7.9
Bed Size**
< 200 8.5
200–299 9.2
300–399 9.2
400–499 9.4
500 or more 7.8
Type of Ownership*
Non-government, not-for-profit 8.8
Investor-owned, for-profit 9.1
Government, federal 3.4
Government, non-federal 7.9

116 | APPEND IX B | CLER NATIONAL REPORT OF FINDINGS 2021
B14. Percentage of Residents and Fellows Who Reported Participating in Formal Interprofessional Educational Activities in How to Transition Patients’ Care
59.4PERCENT OF TOTAL SURVEYEDa (n = 11,105)
PERCENTAGE BY RESIDENT AND FELLOW AND CLE CHARACTERISTICSa
DISTRIBUTION ACROSS CLEs (n = 566)
0 20 40 60 80 100
Median = 66.7
IQR = 50.0-83.3
Residents and Fellows, %
CLEs
, No.
0
20
40
60
80
100
a Missing data (< 4%) have been omitted; percentages based on valid percent.
b Results from clinical learning environments (CLEs) in Puerto Rico (< 1%) omitted to ensure anonymity.
* Statistically significant at P < .05.
** Statistically significant at P < .01.
*** Statistically significant at P < .001.
Abbreviation: IQR, interquartile range; PGY, postgraduate year.
Residents and Fellows Characteristics
Residents and Fellows, % (n = 11,105)
Gender***
Male 59.6
Female 59.1
Level of Training***
PGY-1 54.1
PGY-2 64.8
PGY-3 63.4
PGY-4+ 53.0
Specialty Group***
Medical 62.4
Surgical 60.8
Hospital-based 48.5
CLE Characteristics
Regionb** Northeast 58.3
Midwest 60.3
South 61.2
West 55.8
Bed Size***
< 200 64.4
200–299 68.9
300–399 58.2
400–499 56.8
500 or more 57.6
Type of Ownership***
Non-government, not-for-profit 59.9
Investor-owned, for-profit 59.3
Government, federal 72.8
Government, non-federal 55.8
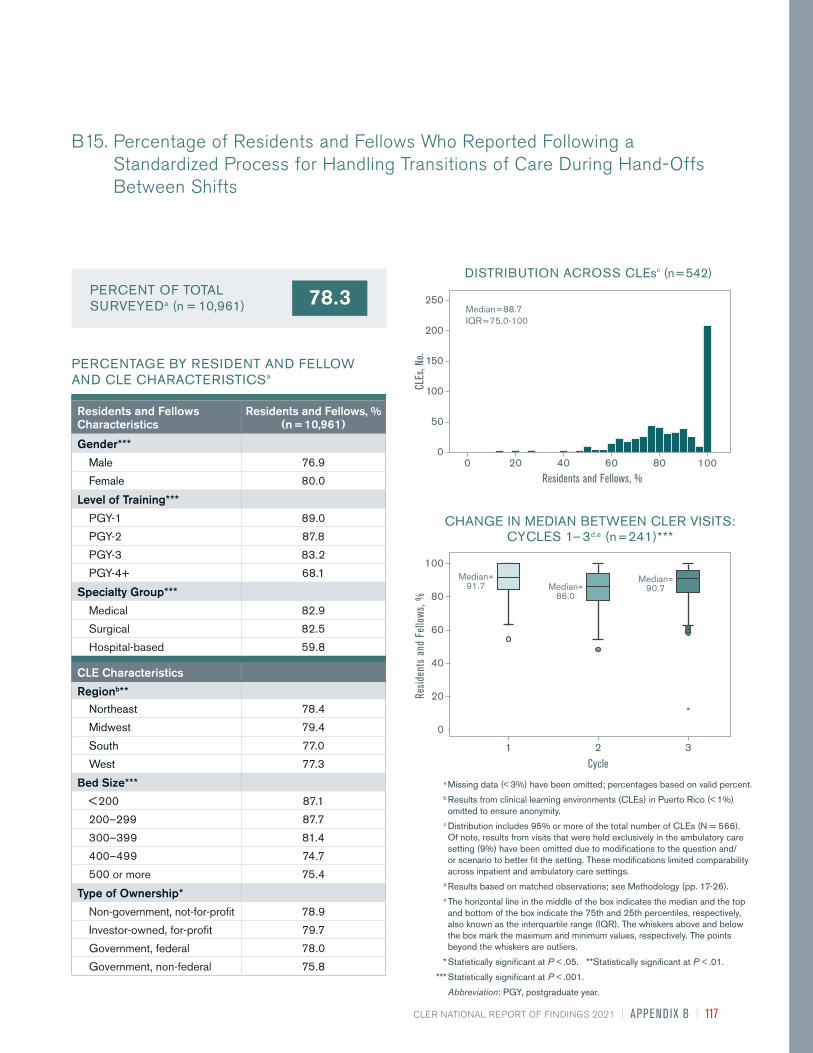
CLER NATIONAL REPORT OF FINDINGS 2021 | APPEND IX B | 117
78.3PERCENT OF TOTAL SURVEYEDa (n = 10,961)
PERCENTAGE BY RESIDENT AND FELLOW AND CLE CHARACTERISTICSa
B15. Percentage of Residents and Fellows Who Reported Following a Standardized Process for Handling Transitions of Care During Hand-Offs Between Shifts
DISTRIBUTION ACROSS CLEsc (n = 542)
Median = 88.7
IQR = 75.0-100
Residents and Fellows, %
CLEs
, No.
0
50
100
150
200
250
20 60 80 1000 40
CHANGE IN MEDIAN BETWEEN CLER VISITS:CYCLES 1 – 3d,e (n = 241)***
3
Median=91.7
Cycle
Resid
ents
and
Fel
lows
, %
0
20
40
60
80
100
1 2
Median=86.0
Median=90.7
Residents and Fellows Characteristics
Residents and Fellows, % (n = 10,961)
Gender***
Male 76.9
Female 80.0
Level of Training***
PGY-1 89.0
PGY-2 87.8
PGY-3 83.2
PGY-4+ 68.1
Specialty Group***
Medical 82.9
Surgical 82.5
Hospital-based 59.8
CLE Characteristics
Regionb** Northeast 78.4
Midwest 79.4
South 77.0
West 77.3
Bed Size***
< 200 87.1
200–299 87.7
300–399 81.4
400–499 74.7
500 or more 75.4
Type of Ownership*
Non-government, not-for-profit 78.9
Investor-owned, for-profit 79.7
Government, federal 78.0
Government, non-federal 75.8
a Missing data (< 3%) have been omitted; percentages based on valid percent. b Results from clinical learning environments (CLEs) in Puerto Rico (< 1%)
omitted to ensure anonymity. c Distribution includes 95% or more of the total number of CLEs (N = 566).
Of note, results from visits that were held exclusively in the ambulatory care setting (9%) have been omitted due to modifications to the question and/or scenario to better fit the setting. These modifications limited comparability across inpatient and ambulatory care settings.
d Results based on matched observations; see Methodology (pp. 17-26).
e The horizontal line in the middle of the box indicates the median and the top and bottom of the box indicate the 75th and 25th percentiles, respectively, also known as the interquartile range (IQR). The whiskers above and below the box mark the maximum and minimum values, respectively. The points beyond the whiskers are outliers.
* Statistically significant at P < .05. **Statistically significant at P < .01.
*** Statistically significant at P < .001.
Abbreviation: PGY, postgraduate year.

118 | APPEND IX B | CLER NATIONAL REPORT OF FINDINGS 2021
B16. Percentage of Residents and Fellows Who Reported Following a Standardized Process for Hand-Offs Between Shifts that Included a Standardized Written Template for Communication
78.4PERCENT OF TOTAL SURVEYEDa (n = 8,431)
PERCENTAGE BY RESIDENT AND FELLOW AND CLE CHARACTERISTICSa
DISTRIBUTION ACROSS CLEsc (n = 542)
0 20 40 60 80 100
Median = 83.8
IQR = 70.8-100
Residents and Fellows, %
CLEs
, No.
0
50
100
150
200
CHANGE IN MEDIAN BETWEEN CLER VISITS:CYCLES 1 – 3d,e (n = 241)*
3
Median=79.6
Cycle
Resid
ents
and
Fel
lows
, %
0
20
40
60
80
100
1 2
Median=77.5
Median=77.8
Residents and Fellows Characteristics
Residents and Fellows, % (n = 8,431)
Gender***
Male 75.4
Female 81.7
Level of Training***
PGY-1 83.1
PGY-2 83.1
PGY-3 84.1
PGY-4+ 69.0
Specialty Group***
Medical 85.0
Surgical 73.6
Hospital-based 59.0
CLE Characteristics
Regionb*** Northeast 80.3
Midwest 76.7
South 78.7
West 75.7
Bed Size***
< 200 85.2
200–299 83.8
300–399 79.8
400–499 79.1
500 or more 75.6
Type of Ownership*
Non-government, not-for-profit 78.0
Investor-owned, for-profit 82.8
Government, federal 83.4
Government, non-federal 77.6
a Missing data (< 4%) have been omitted; percentages based on valid percent. b Results from clinical learning environments (CLEs) in Puerto Rico (< 1%)
omitted to ensure anonymity. c Distribution includes 95% or more of the total number of CLEs (N = 566).
Of note, results from visits that were held exclusively in the ambulatory care setting (9%) have been omitted due to modifications to the question and/or scenario to better fit the setting. These modifications limited comparability across inpatient and ambulatory care settings.
d Results based on matched observations; see Methodology (pp. 17-26).
e The horizontal line in the middle of the box indicates the median and the top and bottom of the box indicate the 75th and 25th percentiles, respectively, also known as the interquartile range (IQR). The whiskers above and below the box mark the maximum and minimum values, respectively. The points beyond the whiskers are outliers.
* Statistically significant at P < .05. ** Statistically significant at P < .01.
*** Statistically significant at P < .001.
Abbreviation: PGY, postgraduate year.

CLER NATIONAL REPORT OF FINDINGS 2021 | APPEND IX B | 119
48.2PERCENT OF TOTAL SURVEYEDa (n = 10,942)
PERCENTAGE BY RESIDENT AND FELLOW AND CLE CHARACTERISTICSa
B17. Percentage of Residents and Fellows Who Reported Following Standardized Processes for Handling Transitions of Care from Inpatient to Outpatient Care
DISTRIBUTION ACROSS CLEsc (n = 542)
0 20 40 60 80 100
Median = 57.1
IQR = 40.0-80.0
Residents and Fellows, %
CLEs
, No.
0
20
40
60
80
100
CHANGE IN MEDIAN BETWEEN CLER VISITS:CYCLES 1 – 3d,e (n = 242)***
3
Median=82.1
Cycle
Resid
ents
and
Fel
lows
, %
0
20
40
60
80
100
1 2
Median=65.0
Median=64.3
Residents and Fellows Characteristics
Residents and Fellows, % (n = 10,942)
Gender***
Male 46.3
Female 50.4
Level of Training***
PGY-1 60.1
PGY-2 57.2
PGY-3 52.6
PGY-4+ 38.6
Specialty Group***
Medical 58.8
Surgical 50.2
Hospital-based 14.5
CLE Characteristics
Regionb*** Northeast 51.0
Midwest 49.7
South 45.0
West 45.9
Bed Size***
< 200 64.3
200–299 59.7
300–399 52.4
400–499 46.1
500 or more 43.6
Type of Ownership***
Non-government, not-for-profit 49.0
Investor-owned, for-profit 52.3
Government, federal 48.9
Government, non-federal 45.0
a Missing data (< 3%) have been omitted; percentages based on valid percent. b Results from clinical learning environments (CLEs) in Puerto Rico (< 1%)
omitted to ensure anonymity. c Distribution includes 95% or more of the total number of CLEs (N = 566).
Of note, results from visits that were held exclusively in the ambulatory care setting (9%) have been omitted due to modifications to the question and/or scenario to better fit the setting. These modifications limited comparability across inpatient and ambulatory care settings.
d Results based on matched observations; see Methodology (pp. 17-26).
e The horizontal line in the middle of the box indicates the median and the top and bottom of the box indicate the 75th and 25th percentiles, respectively, also known as the interquartile range (IQR). The whiskers above and below the box mark the maximum and minimum values, respectively. The points beyond the whiskers are outliers.
* Statistically significant at P < .05. ** Statistically significant at P < .01.
*** Statistically significant at P < .001.
Abbreviation: PGY, postgraduate year.

120 | APPEND IX B | CLER NATIONAL REPORT OF FINDINGS 2021
B18. Percentage of Residents and Fellows Who Reported Having Been Placed, or Witnessing One of Their Peers Placed, in a Situation Where They Believed There Was Inadequate Supervision at the Clinical Site (e.g., the Attending Physician Was Not Available)
31.7PERCENT OF TOTAL SURVEYEDa (n = 11,148)
PERCENTAGE BY RESIDENT AND FELLOW AND CLE CHARACTERISTICSa
DISTRIBUTION ACROSS CLEs (n = 566)
0 20 40 60 80 100
Median = 27.5
IQR = 14.3-42.9
Residents and Fellows, %
CLEs
, No.
0
20
40
60
80
100
CHANGE IN MEDIAN BETWEEN CLER VISITS:CYCLES 1 – 3c,d (n = 242)***
3
Median=19.6
Cycle
Resid
ents
and
Fel
lows
, %
0
20
40
60
80
100
1 2
Median=25.0
Median=31.9
Residents and Fellows Characteristics
Residents and Fellows, % (n = 11,148)
Gender***
Male 29.5
Female 34.2
Level of Training***
PGY-1 27.5
PGY-2 33.2
PGY-3 35.3
PGY-4+ 28.2
Specialty Group***
Medical 31.4
Surgical 28.2
Hospital-based 36.8
CLE Characteristics
Regionb*** Northeast 31.8
Midwest 31.5
South 29.8
West 36.8
Bed Size***
< 200 30.7
200–299 29.5
300–399 31.3
400–499 37.6
500 or more 31.3
Type of Ownership***
Non-government, not-for-profit 30.5
Investor-owned, for-profit 38.0
Government, federal 30.6
Government, non-federal 34.6
a Missing data (< 4%) have been omitted; percentages based on valid percent.
b Results from clinical learning environments (CLEs) in Puerto Rico (< 1%) omitted to ensure anonymity.
c Results based on matched observations; see Methodology (pp. 17-26).
d The horizontal line in the middle of the box indicates the median and the top and bottom of the box indicate the 75th and 25th percentiles, respectively, also known as the interquartile range (IQR). The whiskers above and below the box mark the maximum and minimum values, respectively. The points beyond the whiskers are outliers.
* Statistically significant at P < .05.
** Statistically significant at P < .01.
*** Statistically significant at P < .001.
Abbreviation: PGY, postgraduate year.

CLER NATIONAL REPORT OF FINDINGS 2021 | APPEND IX B | 121
48.7PERCENT OF TOTAL SURVEYEDa (n = 11,109)
PERCENTAGE BY RESIDENT AND FELLOW AND CLE CHARACTERISTICSa
B19. Percentage of Residents and Fellows Who Reported Encountering a Physician (Attending Physician or Consultant) Who Made Them Feel Uncomfortable When Requesting Assistance
DISTRIBUTION ACROSS CLEs (n = 566)
0 20 40 60 80 100
Median = 50.0
IQR = 33.3-68.8
Residents and Fellows, %
CLEs
, No.
0
10
30
20
40
50
60
CHANGE IN MEDIAN BETWEEN CLER VISITS:CYCLES 2 – 3c,d (n = 504)***
3
Cycle
Resid
ents
and
Fel
lows
, %
0
20
40
60
80
100
2
Median=48.3
Median=50.0
Residents and Fellows Characteristics
Residents and Fellows, % (n = 11,109)
Gender***
Male 45.1
Female 52.7
Level of Training***
PGY-1 57.4
PGY-2 55.9
PGY-3 55.0
PGY-4+ 38.8
Specialty Group**
Medical 49.6
Surgical 47.8
Hospital-based 47.1
CLE Characteristics
Regionb*** Northeast 45.7
Midwest 51.1
South 47.9
West 54.7
Bed Size
< 200 50.6
200–299 48.0
300–399 48.6
400–499 51.9
500 or more 48.5
Type of Ownership***
Non-government, not-for-profit 50.2
Investor-owned, for-profit 52.3
Government, federal 48.6
Government, non-federal 45.1
a Missing data (< 4%) have been omitted; percentages based on valid percent.
b Results from clinical learning environments (CLEs) in Puerto Rico (< 1%) omitted to ensure anonymity.
c Results based on matched observations; see Methodology (pp. 17-26).
d The horizontal line in the middle of the box indicates the median and the top and bottom of the box indicate the 75th and 25th percentiles, respectively, also known as the interquartile range (IQR). The whiskers above and below the box mark the maximum and minimum values, respectively. The points beyond the whiskers are outliers.
* Statistically significant at P < .05.
** Statistically significant at P < .01.
*** Statistically significant at P < .001.
Abbreviation: PGY, postgraduate year.
122 | APPEND IX B | CLER NATIONAL REPORT OF FINDINGS 2021
B20. Percentage of Residents and Fellows Who Reported Knowing What They Were Allowed to Do Without Direct Supervision
91.6PERCENT OF TOTAL SURVEYEDa (n = 11,102)
PERCENTAGE BY RESIDENT AND FELLOW AND CLE CHARACTERISTICSa
DISTRIBUTION ACROSS CLEsc (n = 565)
0 20 40 60 80 100
Median = 100
IQR = 88.6-100
Residents and Fellows, %
CLEs
, No.
0
50
100
150
CHANGE IN MEDIAN BETWEEN CLER VISITS:CYCLES 1 – 3d,e (n = 238)***
3
Median=99.2
Cycle
Resid
ents
and
Fel
lows
, %
40
60
80
100
1 2
Median=96.3 Median=
94.5
Residents and Fellows Characteristics
Residents and Fellows, % (n = 11,102)
Gender
Male 91.4
Female 91.9
Level of Training***
PGY-1 87.4
PGY-2 91.0
PGY-3 90.6
PGY-4+ 92.7
Specialty Group*
Medical 91.6
Surgical 92.5
Hospital-based 90.4
CLE Characteristics
Regionb* Northeast 90.8
Midwest 92.0
South 92.1
West 90.3
Bed Size*
< 200 91.8
200–299 93.9
300–399 90.9
400–499 89.9
500 or more 91.4
Type of Ownership**
Non-government, not-for-profit 91.7
Investor-owned, for-profit 88.2
Government, federal 94.0
Government, non-federal 91.0
a Missing data (< 4%) have been omitted; percentages based on valid percent.
b Results from clinical learning environments (CLEs) in Puerto Rico (< 1%) omitted to ensure anonymity.
c Distribution includes 95% or more of the total number of CLEs (N = 566). d Results based on matched observations; see Methodology (pp. 17-26).
e The horizontal line in the middle of the box indicates the median and the top and bottom of the box indicate the 75th and 25th percentiles, respectively, also known as the interquartile range (IQR). The whiskers above and below the box mark the maximum and minimum values, respectively. The points beyond the whiskers are outliers.
* Statistically significant at P < .05.
** Statistically significant at P < .01.
*** Statistically significant at P < .001.
Abbreviation: PGY, postgraduate year.

CLER NATIONAL REPORT OF FINDINGS 2021 | APPEND IX B | 123
30.1PERCENT OF TOTAL SURVEYEDa (n = 11,097)
PERCENTAGE BY RESIDENT AND FELLOW AND CLE CHARACTERISTICSa
B21. Percentage of Residents and Fellows Who Reported Having an Objective Way to Know What Procedures Residents and Fellows from Other Services Were Allowed to Do Without Direct Supervision When They Consulted on Patients
DISTRIBUTION ACROSS CLEs (n = 566)
0 20 40 60 80 100
Median = 25.0
IQR = 12.0-50.0
Residents and Fellows, %
CLEs
, No.
0
20
60
40
80
100
120
CHANGE IN MEDIAN BETWEEN CLER VISITS:CYCLES 1 – 3c,d (n = 242)**
3
Median=29.1
Cycle
Resid
ents
and
Fel
lows
, %
0
20
40
60
80
100
1 2
Median=40.0 Median=
33.3
Residents and Fellows Characteristics
Residents and Fellows, % (n = 11,097)
Gender***
Male 31.6
Female 28.3
Level of Training**
PGY-1 39.3
PGY-2 30.4
PGY-3 29.4
PGY-4+ 30.0
Specialty Group***
Medical 30.6
Surgical 34.9
Hospital-based 22.8
CLE Characteristics
Regionb*** Northeast 30.6
Midwest 31.4
South 31.4
West 25.3
Bed Size***
< 200 31.2
200–299 43.1
300–399 36.5
400–499 24.6
500 or more 27.8
Type of Ownership***
Non-government, not-for-profit 31.1
Investor-owned, for-profit 33.6
Government, federal 42.3
Government, non-federal 26.2
a Missing data (< 4%) have been omitted; percentages based on valid percent.
b Results from clinical learning environments (CLEs) in Puerto Rico (< 1%) omitted to ensure anonymity.
c Results based on matched observations; see Methodology (pp. 17-26).
d The horizontal line in the middle of the box indicates the median and the top and bottom of the box indicate the 75th and 25th percentiles, respectively, also known as the interquartile range (IQR). The whiskers above and below the box mark the maximum and minimum values, respectively. The points beyond the whiskers are outliers.
* Statistically significant at P < .05.
** Statistically significant at P < .01.
*** Statistically significant at P < .001.
Abbreviation: PGY, postgraduate year.

124 | APPEND IX B | CLER NATIONAL REPORT OF FINDINGS 2021
B22. Percentage of Residents and Fellows Who Reported They Would Power through to Hand-Off or the End of Their Workday if Placed in a Situation in Which They Were Impaired by Fatigue, Maxed Out on Caffeine, and a 15-Minute Nap Had No Effect
47.6PERCENT OF TOTAL SURVEYEDa (n = 11,111)
PERCENTAGE BY RESIDENT AND FELLOW AND CLE CHARACTERISTICSa
DISTRIBUTION ACROSS CLEs (n = 566)
0 20 40 60 80 100
Median = 43.0
IQR = 25.0-57.2
Residents and Fellows, %
CLEs
, No.
0
10
30
20
40
50
60
CHANGE IN MEDIAN BETWEEN CLER VISITS:CYCLES 1 – 3c,d (n = 242)***
3
Median=29.5
Cycle
Resid
ents
and
Fel
lows
, %
0
20
40
60
80
100
1 2
Median=46.0
Median=48.2
Residents and Fellows Characteristics
Residents and Fellows, % (n = 11,111)
Gender***
Male 44.5
Female 51.1
Level of Training***
PGY-1 46.7
PGY-2 50.8
PGY-3 49.6
PGY-4+ 44.0
Specialty Group***
Medical 45.4
Surgical 51.5
Hospital-based 49.4
CLE Characteristics
Regionb
Northeast 47.0
Midwest 46.8
South 48.2
West 49.7
Bed Size***
< 200 40.8
200–299 41.4
300–399 43.3
400–499 51.2
500 or more 49.8
Type of Ownership*
Non-government, not-for-profit 47.1
Investor-owned, for-profit 46.6
Government, federal 42.3
Government, non-federal 50.1
a Missing data (< 4%) have been omitted; percentages based on valid percent.
b Results from clinical learning environments (CLEs) in Puerto Rico (< 1%) omitted to ensure anonymity.
c Results based on matched observations; see Methodology (pp. 17-26).
d The horizontal line in the middle of the box indicates the median and the top and bottom of the box indicate the 75th and 25th percentiles, respectively, also known as the interquartile range (IQR). The whiskers above and below the box mark the maximum and minimum values, respectively. The points beyond the whiskers are outliers.
* Statistically significant at P < .05.
** Statistically significant at P < .01.
*** Statistically significant at P < .001.
Abbreviation: PGY, postgraduate year.

CLER NATIONAL REPORT OF FINDINGS 2021 | APPEND IX B | 125
79.5PERCENT OF TOTAL SURVEYEDa (n = 11,106)
PERCENTAGE BY RESIDENT AND FELLOW AND CLE CHARACTERISTICSa
B23. Percentage of Residents and Fellows Who Agreed or Strongly Agreed That Their Clinical Site Had Successful Systems to Ensure Patient Safety from the Risks of Resident and Fellow Fatigue
DISTRIBUTION ACROSS CLEs (n = 566)
0 20 40 60 80 100
Median = 85.7
IQR = 73.3-100
Residents and Fellows, %
CLEs
, No.
0
50
100
150
200
Residents and Fellows Characteristics
Residents and Fellows, % (n = 11,106)
Gender***
Male 81.5
Female 77.2
Level of Training
PGY-1 85.2
PGY-2 79.3
PGY-3 78.7
PGY-4+ 79.9
Specialty Group
Medical 79.9
Surgical 78.9
Hospital-based 78.9
CLE Characteristics
Regionb*** Northeast 74.8
Midwest 83.4
South 81.5
West 76.9
Bed Size***
< 200 77.6
200–299 82.4
300–399 82.2
400–499 75.3
500 or more 79.2
Type of Ownership***
Non-government, not-for-profit 80.1
Investor-owned, for-profit 76.4
Government, federal 84.1
Government, non-federal 77.0
a Missing data (< 4%) have been omitted; percentages based on valid percent.
b Results from clinical learning environments (CLEs) in Puerto Rico (< 1%) omitted to ensure anonymity.
* Statistically significant at P < .05.
** Statistically significant at P < .01.
*** Statistically significant at P < .001.
Abbreviation: IQR, interquartile range; PGY, postgraduate year.

126 | APPEND IX B | CLER NATIONAL REPORT OF FINDINGS 2021
B24. Percentage of Residents and Fellows Who Reported Being Moderately or Very Prepared to Recognize Members of Their Clinical Care Team at Risk of or Demonstrating Self-Harm
58.1PERCENT OF TOTAL SURVEYEDa (n = 11,085)
PERCENTAGE BY RESIDENT AND FELLOW AND CLE CHARACTERISTICSa
DISTRIBUTION ACROSS CLEs (n = 566)
0 20 40 60 80 100
Median = 62.5
IQR = 45.6-79.7
Residents and Fellows, %
CLEs
, No.
0
20
40
60
80
Residents and Fellows Characteristics
Residents and Fellows, % (n = 11,085)
Gender***
Male 60.0
Female 55.9
Level of Training***
PGY-1 57.1
PGY-2 61.3
PGY-3 58.1
PGY-4+ 56.1
Specialty Group*
Medical 58.1
Surgical 60.0
Hospital-based 55.9
CLE Characteristics
Regionb*** Northeast 55.9
Midwest 58.4
South 61.9
West 52.7
Bed Size***
< 200 58.9
200–299 62.8
300–399 60.9
400–499 54.6
500 or more 57.0
Type of Ownership***
Non-government, not-for-profit 57.8
Investor-owned, for-profit 53.8
Government, federal 71.6
Government, non-federal 57.3
a Missing data (< 4%) have been omitted; percentages based on valid percent.
b Results from clinical learning environments (CLEs) in Puerto Rico (< 1%) omitted to ensure anonymity.
* Statistically significant at P < .05.
** Statistically significant at P < .01.
*** Statistically significant at P < .001.
Abbreviation: IQR, interquartile range; PGY, postgraduate year.

CLER NATIONAL REPORT OF FINDINGS 2021 | APPEND IX B | 127
86.8PERCENT OF TOTAL SURVEYEDa (n = 11,112)
PERCENTAGE BY RESIDENT AND FELLOW AND CLE CHARACTERISTICSa
B25. Percentage of Residents and Fellows Who Reported That Their Clinical Site Provided a Supportive, Non-Punitive Environment for Coming Forward with Concerns Regarding Honesty in Reporting (e.g., Patient Data, Work Hours)
DISTRIBUTION ACROSS CLEs (n = 566)
0 20 40 60 80 100
Median = 92.9
IQR = 82.8-100
Residents and Fellows, %
CLEs
, No.
0
50
100
150
200
250
CHANGE IN MEDIAN BETWEEN CLER VISITS:CYCLES 1 – 3c,d (n = 242)***
3
Median=95.0
Cycle
Resid
ents
and
Fel
lows
, %
20
40
60
80
100
1 2
Median=90.0
Median=90.0
Residents and Fellows Characteristics
Residents and Fellows, % (n = 11,112)
Gender***
Male 87.7
Female 85.7
Level of Training
PGY-1 91.3
PGY-2 85.9
PGY-3 86.4
PGY-4+ 87.4
Specialty Group***
Medical 87.7
Surgical 84.2
Hospital-based 87.1
CLE Characteristics
Regionb*** Northeast 85.5
Midwest 88.9
South 86.8
West 85.4
Bed Size
< 200 85.7
200–299 87.9
300–399 87.8
400–499 84.5
500 or more 86.8
Type of Ownership***
Non-government, not-for-profit 87.6
Investor-owned, for-profit 79.9
Government, federal 88.6
Government, non-federal 85.2
a Missing data (< 4%) have been omitted; percentages based on valid percent.
b Results from clinical learning environments (CLEs) in Puerto Rico (< 1%) omitted to ensure anonymity.
c Results based on matched observations; see Methodology (pp. 17-26).
d The horizontal line in the middle of the box indicates the median and the top and bottom of the box indicate the 75th and 25th percentiles, respectively, also known as the interquartile range (IQR). The whiskers above and below the box mark the maximum and minimum values, respectively. The points beyond the whiskers are outliers.
* Statistically significant at P < .05.
** Statistically significant at P < .01.
*** Statistically significant at P < .001.
Abbreviation: PGY, postgraduate year.
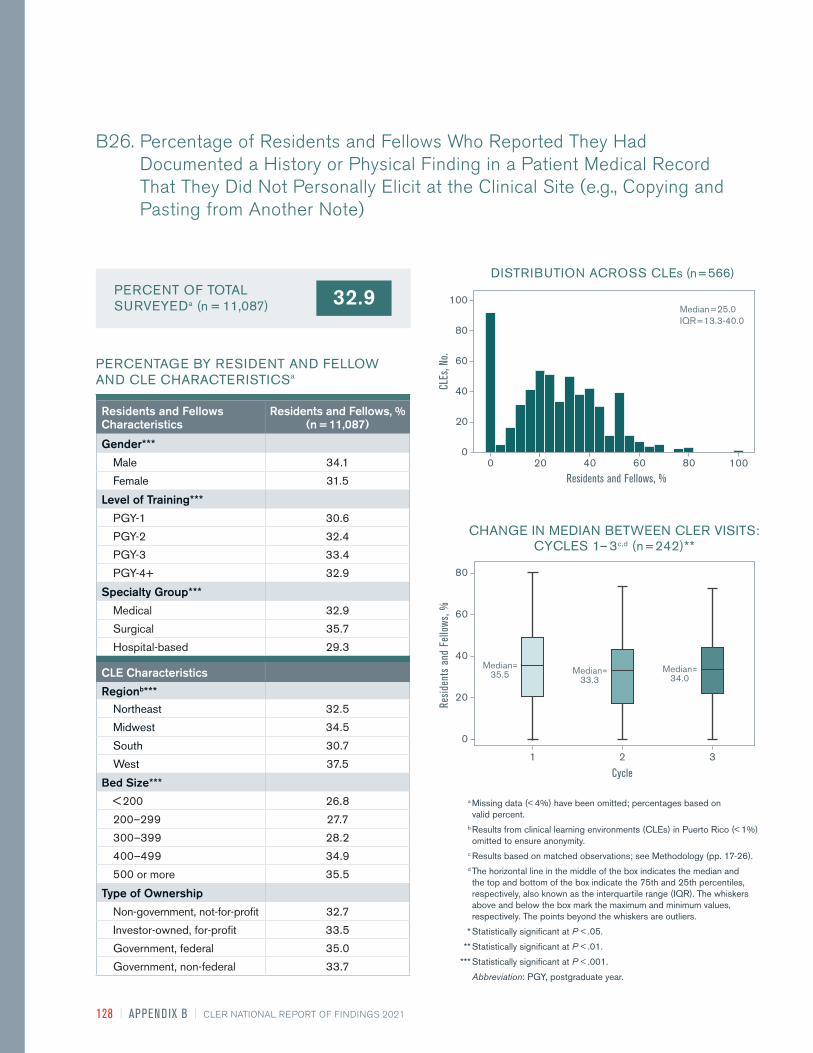
128 | APPEND IX B | CLER NATIONAL REPORT OF FINDINGS 2021
B26. Percentage of Residents and Fellows Who Reported They Had Documented a History or Physical Finding in a Patient Medical Record That They Did Not Personally Elicit at the Clinical Site (e.g., Copying and Pasting from Another Note)
32.9PERCENT OF TOTAL SURVEYEDa (n = 11,087)
PERCENTAGE BY RESIDENT AND FELLOW AND CLE CHARACTERISTICSa
DISTRIBUTION ACROSS CLEs (n = 566)
0 20 40 60 80 100
Median = 25.0
IQR = 13.3-40.0
Residents and Fellows, %
CLEs
, No.
0
20
40
60
80
100
CHANGE IN MEDIAN BETWEEN CLER VISITS:CYCLES 1 – 3c,d (n = 242)**
3
Median=35.5
Cycle
Resid
ents
and
Fel
lows
, %
0
20
40
60
80
1 2
Median=33.3
Median=34.0
Residents and Fellows Characteristics
Residents and Fellows, % (n = 11,087)
Gender***
Male 34.1
Female 31.5
Level of Training***
PGY-1 30.6
PGY-2 32.4
PGY-3 33.4
PGY-4+ 32.9
Specialty Group***
Medical 32.9
Surgical 35.7
Hospital-based 29.3
CLE Characteristics
Regionb*** Northeast 32.5
Midwest 34.5
South 30.7
West 37.5
Bed Size***
< 200 26.8
200–299 27.7
300–399 28.2
400–499 34.9
500 or more 35.5
Type of Ownership
Non-government, not-for-profit 32.7
Investor-owned, for-profit 33.5
Government, federal 35.0
Government, non-federal 33.7
a Missing data (< 4%) have been omitted; percentages based on valid percent.
b Results from clinical learning environments (CLEs) in Puerto Rico (< 1%) omitted to ensure anonymity.
c Results based on matched observations; see Methodology (pp. 17-26).
d The horizontal line in the middle of the box indicates the median and the top and bottom of the box indicate the 75th and 25th percentiles, respectively, also known as the interquartile range (IQR). The whiskers above and below the box mark the maximum and minimum values, respectively. The points beyond the whiskers are outliers.
* Statistically significant at P < .05.
** Statistically significant at P < .01.
*** Statistically significant at P < .001.
Abbreviation: PGY, postgraduate year.

CLER NATIONAL REPORT OF FINDINGS 2021 | APPEND IX B | 129
15.2PERCENT OF TOTAL SURVEYEDa (n = 11,119)
PERCENTAGE BY RESIDENT AND FELLOW AND CLE CHARACTERISTICSa
B27. Percentage of Residents and Fellows Who Reported Having Felt Pressured to Compromise Their Honesty or Integrity to Satisfy an Authority Figure During Their Training at the Clinical Site
DISTRIBUTION ACROSS CLEs (n = 566)
Median = 11.1
IQR = 0-20.0
Residents and Fellows, %
CLEs
, No.
0
50
100
150
200
20 60 80 1000 40
CHANGE IN MEDIAN BETWEEN CLER VISITS:CYCLES 1 – 3c,d (n = 242)
3
Median=14.3
Cycle
Resid
ents
and
Fel
lows
, %
0
60
50
40
30
20
10
1 2
Median=12.5
Median=14.3
Residents and Fellows Characteristics
Residents and Fellows, % (n = 11,119)
Gender***
Male 14.2
Female 16.0
Level of Training**
PGY-1 7.7
PGY-2 14.2
PGY-3 15.6
PGY-4+ 15.7
Specialty Group
Medical 14.8
Surgical 16.1
Hospital-based 14.9
CLE Characteristics
Regionb* Northeast 16.8
Midwest 14.0
South 14.7
West 16.1
Bed Size**
< 200 15.4
200–299 14.2
300–399 13.9
400–499 18.7
500 or more 15.1
Type of Ownership***
Non-government, not-for-profit 14.6
Investor-owned, for-profit 20.8
Government, federal 12.0
Government, non-federal 16.5
a Missing data (< 4%) have been omitted; percentages based on valid percent.
b Results from clinical learning environments (CLEs) in Puerto Rico (< 1%) omitted to ensure anonymity.
c Results based on matched observations; see Methodology (pp. 17-26).
d The horizontal line in the middle of the box indicates the median and the top and bottom of the box indicate the 75th and 25th percentiles, respectively, also known as the interquartile range (IQR). The whiskers above and below the box mark the maximum and minimum values, respectively. The points beyond the whiskers are outliers.
* Statistically significant at P < .05.
** Statistically significant at P < .01.
*** Statistically significant at P < .001.
Abbreviation: PGY, postgraduate year.
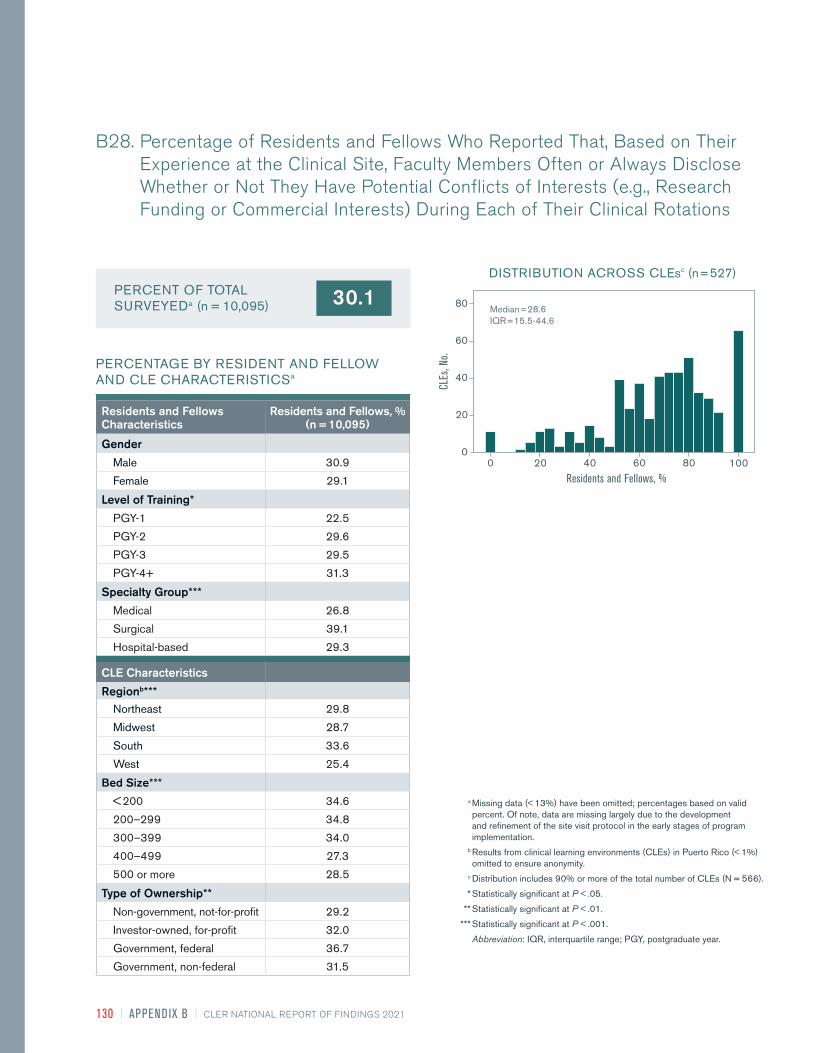
130 | APPEND IX B | CLER NATIONAL REPORT OF FINDINGS 2021
B28. Percentage of Residents and Fellows Who Reported That, Based on Their Experience at the Clinical Site, Faculty Members Often or Always Disclose Whether or Not They Have Potential Conflicts of Interests (e.g., Research Funding or Commercial Interests) During Each of Their Clinical Rotations
30.1PERCENT OF TOTAL SURVEYEDa (n = 10,095)
PERCENTAGE BY RESIDENT AND FELLOW AND CLE CHARACTERISTICSa
DISTRIBUTION ACROSS CLEsc (n = 527)
0 20 40 60 80 100
Median = 28.6
IQR = 15.5-44.6
Residents and Fellows, %
CLEs
, No.
0
20
40
60
80
Residents and Fellows Characteristics
Residents and Fellows, % (n = 10,095)
Gender
Male 30.9
Female 29.1
Level of Training*
PGY-1 22.5
PGY-2 29.6
PGY-3 29.5
PGY-4+ 31.3
Specialty Group***
Medical 26.8
Surgical 39.1
Hospital-based 29.3
CLE Characteristics
Regionb*** Northeast 29.8
Midwest 28.7
South 33.6
West 25.4
Bed Size***
< 200 34.6
200–299 34.8
300–399 34.0
400–499 27.3
500 or more 28.5
Type of Ownership**
Non-government, not-for-profit 29.2
Investor-owned, for-profit 32.0
Government, federal 36.7
Government, non-federal 31.5
a Missing data (< 13%) have been omitted; percentages based on valid percent. Of note, data are missing largely due to the development and refinement of the site visit protocol in the early stages of program implementation.
b Results from clinical learning environments (CLEs) in Puerto Rico (< 1%) omitted to ensure anonymity.
c Distribution includes 90% or more of the total number of CLEs (N = 566).
* Statistically significant at P < .05.
** Statistically significant at P < .01.
*** Statistically significant at P < .001.
Abbreviation: IQR, interquartile range; PGY, postgraduate year.

CLER NATIONAL REPORT OF FINDINGS 2021 | APPEND IX C | 131
0.0
20.0
40.0
60.0
80.0
100.0
TRACKS REPORTINGDOES NOT TRACK REPORTING
%
Cycle 1 Cycle 2 Cycle 3
PERCENTAGE OF CLEs THAT TRACKED REPORTING, BY CLE CHARACTERISTICS
CHANGES BETWEEN CLER VISITS: CYCLES 1 – 3c (n = 200)***
Characteristics CLEs, %
Regionb
Northeast 65.9
Midwest 75.6
South 62.1
West 75.0
Bed Size
< 200 59.1
200–299 71.4
300–399 55.9
400–499 73.6
500 or more 76.5
Type of Ownership
Non-government, not-for-profit 68.3
Investor-owned, for-profit 54.8
Government, federal 76.2
Government, non-federal 76.1
a Missing data (< 1%) have been omitted; percentages based on valid percent. Of note, data are missing largely due to the development and refinement of a formal written CLER Site Visit Report template in the early stages of program implementation.
b Results from clinical learning environments (CLEs) in Puerto Rico (1%) have been omitted to ensure anonymity. c Results based on matched observations; see Methodology (pp. 17-26).
* Statistically significant at P < .05. ** Statistically significant at P < .01. *** Statistically significant at P < .001.
Abbreviation: CLER, Clinical Learning Environment Review.
C1. Percentage of Clinical Learning Environments That Tracked the Number of Patient Safety Event Reports Submitted by Residents and Fellowsa
APPENDIX C.SE LECTE D QUALITATIVE R ESU LTS FROM CLI N ICAL LEAR N I NG E NVI RON M E NT R EVI EW S ITE VIS IT R E PORTS
Tracks Reporting
69.6%
Does Not Track Reporting
30.4%
65.5
24.5 20.0
34.5
75.5 80.0

132 | APPEND IX C | CLER NATIONAL REPORT OF FINDINGS 2021
0.0
20.0
40.0
60.0
FREQUENT REPORTINGVARIED REPORTINGINFREQUENT REPORTING
%
Cycle 2 Cycle 3
PERCENTAGE OF CLEs WHERE RESIDENTS AND FELLOWS FREQUENTLY SUBMITTED REPORTS, BY CLE CHARACTERISTICS
CHANGES BETWEEN CLER VISITS: CYCLES 2 – 3c (n = 468)*
Characteristics CLEs, %
Regionb
Northeast 5.3
Midwest 10.2
South 8.2
West 4.3
Bed Size
< 200 9.9
200–299 7.4
300–399 6.7
400–499 4.4
500 or more 7.1
Type of Ownership
Non-government, not-for-profit 6.9
Investor-owned, for-profit 2.4
Government, federal 18.8
Government, non-federal 8.2
a Missing data (< 7%) have been omitted; percentages based on valid percent. Of note, data are missing largely due to the development and refinement of a formal written CLER Site Visit Report template in the early stages of program implementation.
b Results from clinical learning environments (CLEs) in Puerto Rico (1%) have been omitted to ensure anonymity. c Results based on matched observations; see Methodology (pp. 17-26).
* Statistically significant at P < .05. ** Statistically significant at P < .01. *** Statistically significant at P < .001.
Abbreviation: CLER, Clinical Learning Environment Review.
C2. Percentage of Clinical Learning Environments Where Residents and Fellows Frequently Submitted Patient Safety Event Reportsa
Frequent Reporting
6.8%
Varied Reporting
53.0%
Infrequent Reporting
40.2%
42.137.6 36.8
54.9
21.2
7.5
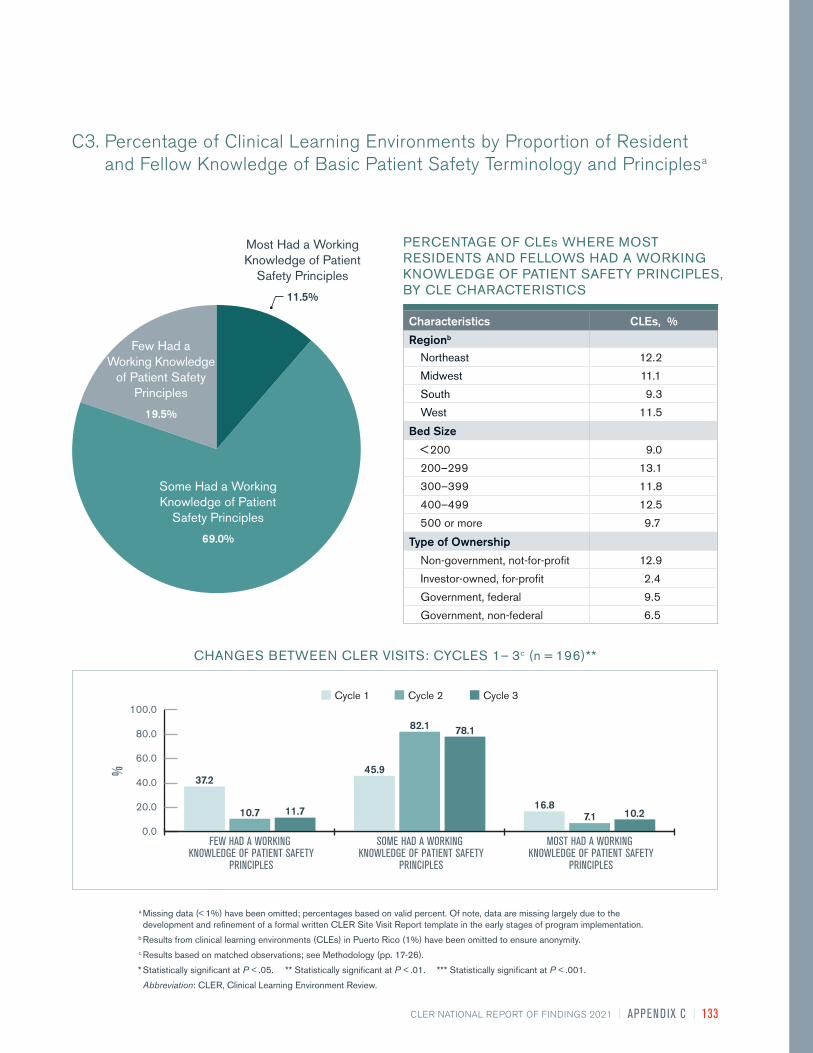
CLER NATIONAL REPORT OF FINDINGS 2021 | APPEND IX C | 133
0.0
20.0
40.0
60.0
80.0
100.0
MOST HAD A WORKING KNOWLEDGE OF PATIENT SAFETY
PRINCIPLES
SOME HAD A WORKING KNOWLEDGE OF PATIENT SAFETY
PRINCIPLES
FEW HAD A WORKING KNOWLEDGE OF PATIENT SAFETY
PRINCIPLES
%
Cycle 1 Cycle 2 Cycle 3
PERCENTAGE OF CLEs WHERE MOST RESIDENTS AND FELLOWS HAD A WORKING KNOWLEDGE OF PATIENT SAFETY PRINCIPLES, BY CLE CHARACTERISTICS
CHANGES BETWEEN CLER VISITS: CYCLES 1 – 3c (n = 196)**
Characteristics CLEs, %
Regionb
Northeast 12.2
Midwest 11.1
South 9.3
West 11.5
Bed Size
< 200 9.0
200–299 13.1
300–399 11.8
400–499 12.5
500 or more 9.7
Type of Ownership
Non-government, not-for-profit 12.9
Investor-owned, for-profit 2.4
Government, federal 9.5
Government, non-federal 6.5
a Missing data (< 1%) have been omitted; percentages based on valid percent. Of note, data are missing largely due to the development and refinement of a formal written CLER Site Visit Report template in the early stages of program implementation.
b Results from clinical learning environments (CLEs) in Puerto Rico (1%) have been omitted to ensure anonymity. c Results based on matched observations; see Methodology (pp. 17-26).
* Statistically significant at P < .05. ** Statistically significant at P < .01. *** Statistically significant at P < .001.
Abbreviation: CLER, Clinical Learning Environment Review.
C3. Percentage of Clinical Learning Environments by Proportion of Resident and Fellow Knowledge of Basic Patient Safety Terminology and Principlesa
Some Had a Working Knowledge of Patient
Safety Principles
69.0%
Few Had a Working Knowledge
of Patient Safety Principles
19.5%
Most Had a Working Knowledge of Patient
Safety Principles
11.5%
37.2
10.7 11.7
45.9
82.1 78.1
16.87.1 10.2

134 | APPEND IX C | CLER NATIONAL REPORT OF FINDINGS 2021
0.0
20.0
40.0
60.0
80.0
MOST HAD A WORKING KNOWLEDGE OF QUALITY IMPROVEMENT
CONCEPTS
SOME HAD A WORKING KNOWLEDGE OF QUALITY IMPROVEMENT
CONCEPTS
FEW HAD A WORKING KNOWLEDGE OF QUALITY IMPROVEMENT
CONCEPTS
%
Cycle 1 Cycle 2 Cycle 3
PERCENTAGE OF CLEs WHERE MOST RESIDENTS AND FELLOWS HAD A WORKING KNOWLEDGE OF QUALITY IMPROVEMENT CONCEPTS, BY CLE CHARACTERISTICS
CHANGES BETWEEN CLER VISITS: CYCLES 1 – 3c (n = 221)
Characteristics CLEs, %
Regionb
Northeast 10.8
Midwest 9.0
South 8.1
West 17.9
Bed Size
< 200 12.4
200–299 8.4
300–399 12.9
400–499 12.5
500 or more 9.7
Type of Ownership
Non-government, not-for-profit 11.7
Investor-owned, for-profit 7.1
Government, federal 9.5
Government, non-federal 9.8
a Missing data (< 1%) have been omitted; percentages based on valid percent. Of note, data are missing largely due to the development and refinement of a formal written CLER Site Visit Reportt template in the early stages of program implementation.
b Results from clinical learning environments (CLEs) in Puerto Rico (1%) have been omitted to ensure anonymity. c Results based on matched observations; see Methodology (pp. 17-26).
* Statistically significant at P < .05. ** Statistically significant at P < .01. *** Statistically significant at P < .001.
Abbreviation: CLER, Clinical Learning Environment Review.
C4. Percentage of Clinical Learning Environments by Proportion of Resident and Fellow Knowledge of Basic Quality Improvement Conceptsa
Most Had a Working Knowledge of Quality
Improvement Concepts 11.4%
Some Had Working Knowledge
of Quality Improvement
Concepts26.5%
Few Had a Working Knowledge of
Quality Improvement Concepts
62.1%
61.553.8 53.4
21.3
34.8 35.7
17.211.3 10.9
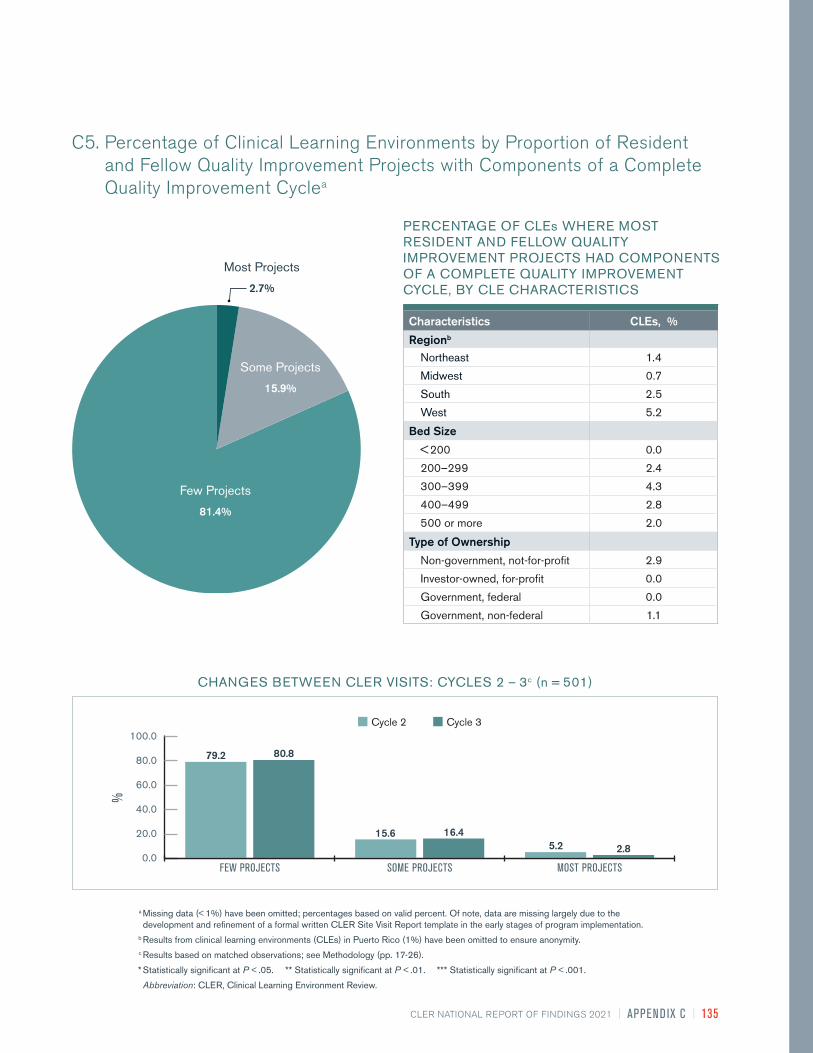
CLER NATIONAL REPORT OF FINDINGS 2021 | APPEND IX C | 135
0.0
20.0
40.0
60.0
80.0
100.0
MOST PROJECTSSOME PROJECTSFEW PROJECTS
%
Cycle 2 Cycle 3
CHANGES BETWEEN CLER VISITS: CYCLES 2 – 3c (n = 501)
PERCENTAGE OF CLEs WHERE MOST RESIDENT AND FELLOW QUALITY IMPROVEMENT PROJECTS HAD COMPONENTS OF A COMPLETE QUALITY IMPROVEMENT CYCLE, BY CLE CHARACTERISTICS
Characteristics CLEs, %
Regionb
Northeast 1.4
Midwest 0.7
South 2.5
West 5.2
Bed Size
< 200 0.0
200–299 2.4
300–399 4.3
400–499 2.8
500 or more 2.0
Type of Ownership
Non-government, not-for-profit 2.9
Investor-owned, for-profit 0.0
Government, federal 0.0
Government, non-federal 1.1
a Missing data (< 1%) have been omitted; percentages based on valid percent. Of note, data are missing largely due to the development and refinement of a formal written CLER Site Visit Report template in the early stages of program implementation.
b Results from clinical learning environments (CLEs) in Puerto Rico (1%) have been omitted to ensure anonymity. c Results based on matched observations; see Methodology (pp. 17-26).
* Statistically significant at P < .05. ** Statistically significant at P < .01. *** Statistically significant at P < .001.
Abbreviation: CLER, Clinical Learning Environment Review.
C5. Percentage of Clinical Learning Environments by Proportion of Resident and Fellow Quality Improvement Projects with Components of a Complete Quality Improvement Cyclea
Few Projects
81.4%
Some Projects
15.9%
Most Projects
2.7%
79.2 80.8
15.6 16.45.2 2.8

136 | APPEND IX C | CLER NATIONAL REPORT OF FINDINGS 2021
0.0
20.0
40.0
60.0
80.0
100.0
ALL STANDARDIZEDSOME STANDARDIZATIONNO STANDARDIZATION
%
Cycle 1 Cycle 2 Cycle 3
PERCENTAGE OF CLEs WITH HAND-OFF PROCESSES THAT WERE ALL STANDARDIZED, BY CLE CHARACTERISTICS
CHANGES BETWEEN CLER VISITS: CYCLES 1 – 3c (n = 231)***
Characteristics CLEs, %
Regionb
Northeast 11.1
Midwest 11.6
South 21.7
West 28.3
Bed Size
< 200 28.2
200–299 21.8
300–399 23.3
400–499 14.9
500 or more 9.8
Type of Ownership
Non-government, not-for-profit 17.8
Investor-owned, for-profit 17.5
Government, federal 35.0
Government, non-federal 12.2
a Missing data (< 10%) have been omitted; percentages based on valid percent. Of note, data are missing largely due to the development and refinement of a formal written CLER Site Visit Report template in the early stages of program implementation.
b Results from clinical learning environments (CLEs) in Puerto Rico (1%) have been omitted to ensure anonymity. c Results based on matched observations; see Methodology (pp. 17-26).
* Statistically significant at P < .05. ** Statistically significant at P < .01. *** Statistically significant at P < .001.
Abbreviation: CLER, Clinical Learning Environment Review.
C6. Percentage of Clinical Learning Environments with Hand-Off Processes that Were Standardized Across Programs, Based on Direct Observationsa
No Standardization 10.4%
All Standardized
17.2%
Some Standardization
72.4%
68.4
3.514.7 19.9
95.7
74.9
11.70.9
10.4

CLER NATIONAL REPORT OF FINDINGS 2021 | APPEND IX C | 137
0.0
20.0
40.0
60.0
80.0
100.0
SOME TYPE OF SYSTEM IS USEDTRUST PRIMARILYNO PROCESS EXISTS
%
Cycle 1 Cycle 2 Cycle 3
CHANGES BETWEEN CLER VISITS: CYCLES 1 – 3c (n = 237)
PERCENTAGE OF CLEs WHERE TRUST IS PRIMARILY USED TO IDENTIFY COMPETENCY, BY CLE CHARACTERISTICS
Characteristics CLEs, %
Regionb
Northeast 91.7
Midwest 98.5
South 93.1
West 92.7
Bed Size
< 200 94.1
200–299 93.9
300–399 97.8
400–499 94.4
500 or more 92.3
Type of Ownership
Non-government, not-for-profit 94.7
Investor-owned, for-profit 92.7
Government, federal 100
Government, non-federal 90.9
a Missing data (< 3%) have been omitted; percentages based on valid percent. Of note, data are missing largely due to the development and refinement of a formal written CLER Site Visit Report template in the early stages of program implementation.
b Results from clinical learning environments (CLEs) in Puerto Rico (1%) have been omitted to ensure anonymity. c Results based on matched observations; see Methodology (pp.17-26).
* Statistically significant at P < .05. ** Statistically significant at P < .01. *** Statistically significant at P < .001.
Abbreviation: CLER, Clinical Learning Environment Review.
C7. Percentage of Clinical Learning Environments by Mechanism Used for Identification of Resident and Fellow Competence to Perform Clinical Procedures in the Absence of an Attending Physician, as Reported by Nursesa
Trust Primarily
93.9%
No Process Exists
1.4%
Some Type of System Is Used
4.7%
90.3
8.90.8
93.7
5.50.8
92.8
7.20.0

138 | APPEND IX C | CLER NATIONAL REPORT OF FINDINGS 2021
0.0
20.0
40.0
60.0
80.0
RECALLED EVENTSDID NOT RECALL EVENTS
%
Cycle 1 Cycle 2 Cycle 3
PERCENTAGE OF CLEs WHERE PATIENT SAFETY AND QUALITY LEADERS RECALLED EVENTS, BY CLE CHARACTERISTICS
CHANGES BETWEEN CLER VISITS: CYCLES 1 – 3c (n = 161)***
Characteristics CLEs, %
Regionb
Northeast 27.3
Midwest 25.9
South 34.8
West 37.9
Bed Size
< 200 26.1
200–299 15.5
300–399 29.0
400–499 29.2
500 or more 41.3
Type of Ownership
Non-government, not-for-profit 29.6
Investor-owned, for-profit 28.6
Government, federal 35.0
Government, non-federal 37.0
a Missing data (< 1%) have been omitted; percentages based on valid percent. Of note, data are missing largely due to the development and refinement of a formal written CLER Site Visit Report template in the early stages of program implementation.
b Results from clinical learning environments (CLEs) in Puerto Rico (1%) have been omitted to ensure anonymity. c Results based on matched observations; see Methodology (pp. 17-26).
* Statistically significant at P < .05. ** Statistically significant at P < .01. *** Statistically significant at P < .001.
Abbreviation: CLER, Clinical Learning Environment Review.
C8. Percentage of Clinical Learning Environments Where Patient Safety and Quality Leaders Recalled Patient Safety Event Reports Involving Issues of Resident or Fellow Supervisiona
Recalled Events30.1%
Did Not Recall Events
69.9%
58.4 56.549.1
41.6 43.550.9

CLER NATIONAL REPORT OF FINDINGS 2021 | APPEND IX C | 139
PERCENTAGE OF CLEs THAT APPEARED TO HAVE SYSTEMS IN PLACE TO IDENTIFY THE LEVEL OF BURNOUT AMONG FACULTY MEMBERS, BY CLE CHARACTERISTICS
Characteristics CLEs, %
Regionb
Northeast 34.1
Midwest 39.3
South 38.1
West 37.2
Bed Size
< 200 28.4
200–299 31.0
300–399 34.4
400–499 34.7
500 or more 45.6
Type of Ownership
Non-government, not-for-profit 40.5
Investor-owned, for-profit 16.7
Government, federal 47.6
Government, non-federal 29.3
a Missing data (< 1%) have been omitted; percentages based on valid percent. Of note, data are missing largely due to the development and refinement of a formal written CLER Site Visit Report template in the early stages of program implementation.
b Results from clinical learning environments (CLEs) in Puerto Rico (1%) have been omitted to ensure anonymity.
* Statistically significant at P < .05. ** Statistically significant at P < .01. *** Statistically significant at P < .001.
Abbreviation: CLER, Clinical Learning Environment Review.
C9. Percentage of Clinical Learning Environments That Appeared to Have Systems in Place to Identify the Level of Burnout among Faculty Membersa
Did Not Appear to Have Systems
in Place
59.0%
Appeared to Have Systems
in Place
36.2%
Working to Establish Systems
4.8%

140 | APPEND IX C | CLER NATIONAL REPORT OF FINDINGS 2021
0.0
20.0
40.0
60.0
80.0
100.0
REPORTS OF CHRONIC DISRESPECTFUL ORDISRUPTIVE BEHAVIOR
NO REPORTS OF CHRONIC DISRESPECTFUL ORDISRUPTIVE BEHAVIOR
%
Cycle 2 Cycle 3
PERCENTAGE OF CLEs WITH REPORTS OF CHRONIC DISRESPECTFUL OR DISRUPTIVE BEHAVIOR, BY CLE CHARACTERISTICS
CHANGES BETWEEN CLER VISITS: CYCLES 2 – 3c (n = 429)***
Characteristics CLEs, %
Regionb
Northeast 86.8
Midwest 82.6
South 76.4
West 79.5
Bed Size
< 200 68.5
200–299 77.0
300–399 85.0
400–499 85.5
500 or more 83.9
Type of Ownership
Non-government, not-for-profit 81.4
Investor-owned, for-profit 78.4
Government, federal 64.7
Government, non-federal 82.9
a Missing data (< 13%) have been omitted; percentages based on valid percent. Of note, data are missing largely due to the development and refinement of a formal written CLER Site Visit Report template in the early stages of program implementation.
b Results from clinical learning environments (CLEs) in Puerto Rico (1%) have been omitted to ensure anonymity. c Results based on matched observations; see Methodology (pp. 17-26).
* Statistically significant at P < .05. ** Statistically significant at P < .01. *** Statistically significant at P < .001.
Abbreviation: CLER, Clinical Learning Environment Review.
C10. Percentage of Clinical Learning Environments with Reports of Chronic Disrespectful or Disruptive Behavior Across More Than One Clinical Unita
Reports of Chronic Disrespectful or
Disruptive Behavior78.4%
No Reports of Chronic
Disrespectful or Disruptive Behavior
21.6%
39.9
21.7
60.1
78.3

CLER NATIONAL REPORT OF FINDINGS 2021 | APPEND IX C | 141

Access the full CLER National Report of Findings 2021 at https://doi.org/10.35425/ACGME.0008
ISBN Digital: 978-1-945365-40-9