Embed Size (px)
Citation preview
National Report about the Status of Ozone Monitoring of Nepal
1. Background:
Upon the discovery that CF Cs and other human-made substa nces are leading to a depletion of the ozone layer, the inter national community agreed upon the Vienna Convention for the Protection of the Ozone Layer in 1985. Fo llowing this, the Montreal Protocol on Substances that Deplete t he Ozone Lay er was adopted in 1987 with the objective of reducing and finally phasing out the production and co nsumption of ozone-depleting substances. Nepal ratified to the Vienna Convention, Mont real Protocol and London Amendment to the Montreal Protocol on 6 Apr il 1990 and came into force on 4 October 1994.
In response to the Convention, Protocol and London Am endment 1990, the Government of Nepal (GoN) formed Natio nal Program Preparation Team ( NPPT) on 3 October 1996. The NPPT prepar ed Nepal Country Program fo r the Phasing out of the Ozone Depleting Substances an d the program was agreed on 19 February 1999. The GoN assigned the Nepal Bureau of St andard and Metrology (NBSM) as an Implementing Agency working with the dire ction of National Ozone Committee (NOC) which was formed under the joint-secretariat level of the then Ministry of Population and Environment in o 28 February 2000.
2. Institutional Mechanism:
Implementation of the Convention, Protocol and London Amendment in Nepal started with the following undertakings:
The then Ministry of Population and Environment (MoPE) (now it is the Ministry of Environment, MoE) was designated as a focal ministry;
The then MoPE (now MoE) and the then Ministry of Industries, Commerce and Supplies (now the Ministry of Industry) started working in close coordination;
The then MoPE established the coordination with the Convention Secretariat and necessary organizations;
The Nepal Bureau of Standard and Metrology (NBSM) was designated as an implementing agency;
For the effective implementation of the Vienna Convention, Montreal Protocol and London Amendment, necessary committees were constituted as and when necessary. In this regard the Steering Committee was formed and Secretaries of MoE and Ministry of Industry (MoI) have served as the co-chairs. Similarly the Implementation Committee has formed in the chair of the Director General of the NBSM Implementation Committee under the MoI. Other subject committees were established when necessary with the involvement of
332
Government organizations, private organizations and experts in the related field was also established by the government decision on 28 April 2000.
A National Ozone Unit (NOU) was established in NBSM with the responsibility of implementing and monitoring the ODS.
The Government formulated polic ies and enacted Acts and regulation s such as Environment Protection Act, 1996, Envi ronment Protection Rules, 1997 and Ozone Depleting Substances Cons umption Rules (ODSCR), 2001 etc. Environment Impact Assessment (EIA) of development works was institutionalized and standards related to the industrial effluents air quality were implemented by MoE. Similarly, NBSM has also implemented activities as the major Implem enting Agency of the C onvention, Protocol and London Amendment. 3. Activities for Monitoring ODS As the focal point of Convention, Prot ocol and London amendme nt, the then MoPE issued a public notic e in the National Ga zette on 25 September 2000 releasing the Government decision, on annual consumpti on, import quantity and phase- out rates of ODS. Similarly, as the Rule 4 of the OD SCR, the government designated the licens ing authority to the Department of Commerce to work under the Export, Import Control Act 1957 on the recommendation of MoE. Procedures and conditions of lic ense including specification and quantitative standards and annu al phase-out rates of ODS were als o made public by publis hing a notice on 6 Ma rch 2001. NOU was t he implementing and monitoring unit in all these matters under the NBSM. The National Bureau of Standar ds and Metrology (NBSM) started activities related to controlling and monitoring the ODS for not being imported to Nepal from the very beginning when Nepal ratified the Convention and the Protocol. In this regard the GoN established a Committee for th e implementation of the M ontreal Protocol, with its secretariat in the NBSM within the Ministry of Industry. The committee initiated its work by conducting a country wide survey in 1996. The survey established bas ic profile of Ozone Depleting Substances (ODS) consuming sectors in Nepal A 1996 survey on ODS consumption in Nepa l found 29 tones of Chlorofluorocarbon 12 (CFC12) and 23 tones of Hydro chlorofl uorocarbon 22 (HCFC- 22). Approximately 1 tones of CFC was us ed in new equipment and the balance 28 tones for servicing (15.8 tones for domestic and 12.2 tones in co mmercial and industrial r efrigeration). Refrigeration and Air conditioning sector was the predominant consumer of ODS mainly in the assembly, repair and ma intenance of equipment. The surv ey also indicated the general direction for ODS phase-out efforts.
(a) Refrigeration Management Plan (RMP):
Country Program for the phasing out of the ODS in Nepal was approved in 1998. Due to the predominance of the Refri geration and Air conditioning s ector in terms of OD S
333
consumption, the need for formulating a Refrigerant Managem ent Plan ( RMP) was identified, taking into account the following factors such as availability of alternate refrigerants, residual economic life of CFC containing equipment, training, and technical assistance for transitioning to non-CFC alternatives.
Nepal RMP was approved in J uly 1999. Under t he RMP, the followin g key activities such as promulgation of r egulations covering registration of importers establishing maximum permissible annual limits on import quantities; prohibition on import of CF C based equipment; national CF C recovery and recycling program whic h covered establishment of two recovery and recycling c enters, provision of recovery units to servicing establishments/end us ers and addi tional refrigerant equipment to servic e technicians; training of customs officers related to RMP and training program in good practices in refrigeration servicing through train the trainers program.
(b) CFC Monitoring
The Government made a Gazette Notifica tion in September 2000 lay ing down the strategy for ODS phase-out by 2010. Thereafte r, in exercise of powers conferred by Article 24 of the Environment Protection Act 1996, the Government approved and made public the Ozone Depleting S ubstances Consumption Rules in February 2001 for enforcement with immediate effect.
CFC Phase-out Plan:
Year(AD) 2000 2001 2002 2003 2004 2005 2006 2007 2008 2009 2010
CFC-11 & CFC-12 Joint (Metric Ton)
29.058 26 23 20 17 14 11 8 5 2 0
Monitoring through licensing also followed as the plan and now CF C import in the country has been controlled fully. Actually Nepal baseline for CFC was 29 ODP tones. It reported import of 94 ODP tones of CFC12 during the period of 1st July 2000 to 30 June 2001. As a consequence for the July 2000 to June 2001 Nepal was in non-complianc e with its obligation under Article 2A of the Montreal Protocol as per decision made at 14th Meeting of the Parties held at Italy.
Further the illegally traded quantities s hould not be counted against a Party consumption provided the Pa rty does not place the sa id quantities on its own market and if Nepal dec ides to release any of the seized quantity of CF C into its domestic market, it would be considered to be in non-compliance as per the decision made at 15th meeting of the Party held at Nairobi.
Nepal informed the seizing of the illegal ODS during MOP 16 at Prague in 2004 and the meeting agreed the removal of previous non- compliance issue by Nepal including a commitment by Nepal to report annually on t he quantity of CF Cs released on to its market.
Accordingly, in the 20 th meeting of the Parties, Nepal requested guidance from Parties on continued use of confiscated CFCs pos t 2010. Nepal proposes to consider options
334
for destruction of CF C (around 10 tons ) which was approv ed by the Executive Committee and we are working on this in cl ose cooperation with the Department of Customs.
4. Present Status
Nepal has addressed non-compliance issues in a very remarkable manner during the last four years to adhere stri ctly to the plan of action and controlled distribution of the stockpiled CFCs into the domes tic market. N epal has also taken si gnificant steps to control and phase-out its CF C consumption, including impr oved cross-border coordination with countries also engaged in CFC production, creation of awareness among importers of refrigeration and air c onditioning equipment and control of such imports.
The continuity of operation of the Ozone Officer appointed in 1998 and establishment of the NOU in Nepal has worked well whic h makes Officer one of the longest serving National Ozone Officers of all Article 5 countries,
Nepal Refrigeration and Electro Mechanical Association (NREMA) has been established in 2006; it cooperates very closely with t he NOU. The CFCs are provided to the workshops/technicians through this assoc iation following the procedure established for this purpose. The association is also respon sible for tracking the use of CFCs provided through this arrangement and reporting on the same to NOU.
NREMA started organizing training courses of different levels (basic and advanced) with the cooperation of Lalit pur Valley College in Lalitpur fo r technician student s or other interested persons. The training costs were partly covered by the participants and partly by the funding from UNEP, GTZ and India.
Nepal was awarded with "The Montreal Pr otocol Implementers Awards" by UNEP (United Nations Environmental Program) for the year 2007. The National Ozone Unit of Nepal was honored by this award in reorganization of its extraordinary contribution to the effective implementation of the Montreal Protocol and the global effort to protect the ozone layer.
At 19th Meeting of the Parties, the Parties agreed to accelerate the phase-out of production and c onsumption of HCFCs by wa y of an adjustment in acc ordance with paragraph 9 of Article 2 of the Montreal Protocol by choos ing the baseline the average of 2009 and 2010 levels of respectively and to freeze at that baseline level consumption in 2013 and then 10% reduction by 2015, 35% reduction by 2020 and 67.5% reduction by 2025 and 97.5% reduction by 2030.
Nepal HCFC Phase-out Management Plan (HPMP) was prepar ed and submitted to the 61st Executive Committee to implement above decision made during the 19th Meeting of the Parties.
However, the Committee deferred consideration of the HPMP for Nepal to 62 nd Meeting of Executive Committee in light of any additional informa tion regarding the commitment
335
of Nepal of ratifying the Copenhage n Amendment and to phase-out HCFC in accordance with the Executive committee.
It may be pointed out that without ratification of Copenhagen Amendment, Nepal would not be entitled to any Multilateral Fund (MLF) assistance to phase-out HCFCs since they would have no commitment to address these substances or any resultant compliance issue.
Nepal understands and appreciate s the decisions of the 62 nd Executive Committee which mentions that stage I of H PMP could be implemented if Nepal complies with the following by the time of 23rd MOP (14-18 November 2011):
I. Officially deposit its instrument of ratification of Copenhagen Amendment to the Montreal Protocol with the United Nations Treaty depository Office in New York;
II. Submit on official request to 23 rd MOP to be considered under Article 4, Paragraphs 8 and 9 of the Mo ntreal Protocol, which inter alia allows a State not Party to an amendm ent nevertheless to be found by the M OP to be in full compliance with the control Provision of the Montreal Protocol, thereby obviating the trade sanctions that might otherwise apply.
The Executive Committee decided that if one of the condition in i) and ii) above had been met, the Government of Nepal would submit a request to the Executive Committee for the first tranche of the HPMP and pres ent the corresponding Agreement between the Executive Committee.
Taking into consideration th e above, the MoI has process ed for the ratification of all Amendments including Copenh agen Amendment with the inpu ts of the Ministry of Environment and Ministry of Law and Justice and the proposal has been put forward for Cabinet approval. After due consideration of the Cabinet, the proposal will be submitted to the Parliament for formal ratification.
5. Observations
Beside the given outcomes of these efforts some issues in the government are unclear. The ODSCR chiefly focuses on t he licensing system to the importer to control over the illegal import of the ODS. However, rule has not mentioned anything about the exporter because of the reason that Nepal does not produce any ODS within the country.
In addition to this, ODSCR ha s given authority to the foca l ministry to prescribe necessary procedures and c onditions for the import of the substance; prescribe necessary specification, annual import and consumption quant ity as well as the phase-out rate of the substance for trade, busine ss needed in refrigeration, air conditioning, agriculture and health in cluding fire extinguishing services and in industrial uses; take actions for gradual phasing- out of the annual import and c onsumption quantity of the substance up to the zero limits within a scheduled period in accordance with the
336
provision of the Protocol; and monitor and ev aluate the status of the consumption as well as sales and distribution of the substance regularly.
At the beginning, the then MoPE started the implementation process on ODS which was smooth and effective also due to the is suance of the ODS Consumption Rules. However, its effective implementation was not achieved to the desired ext ent, as the then MoPE was dis solved in 2005 and it took ti me to integrate the functions of the Environment Division of the then MoPE by renaming the Ministry of S cience and Technology into the Ministry of Envir onment, Science and Technology (MoEST). Once the implementation was re-initiated the Government of Nepal separated MoEST again in 2009 int o the Ministry of Science and T echnology and the Ministry of E nvironment (MoE). After this, MoE has initiated working on ODS in the spirit of the Convention and the Protocol and has started the ratification process of the Copenhagen Amendment.
For the effective implementation of the licensing system, the NOU has been designated to make this lic ensing system operational. As mentioned earlie r, NREMA has also attempted several activities regarding the awareness raising on ODS including training to the students and c apacity building. Inte rnational Organizations like UNEP has also conducted three days training to the costume officers regarding the ODS in 2001 aiming to build capacity of the custom officers of Nepal on ODS. However, those efforts are not enough to raise awareness on ODS as well as to build capacity for the ODS monitoring and regulating activities.
Despite of the spec ific ODS s tudy, Nepal has also prepared the Initial Nationa l Communication in 2004 in which greenhouse gas inventory was one of the major components. CFCs inventory was not included under the GHGs at that time because of lack of available data. Now, Nepal is engaged in the preparat ion of the Second National Communication (SNC). The CFCs are also the target for inventory in SNC.
Bed Prakash LEKHAK Under Secretary and Chief
Climate Change Council Secretariat Section National Project Manager
Second National Communication Project Ministry of Environment
Government of Nepal 10 April 2011, Sunday
337

The Netherlands Systematic observations: Surface networks and capacity building
• Brewer measurements in the Netherlands The Brewer measurements at the station “De Bilt” by KNMI have been continued. Brewer #100 has been replaced by Brewer #189. “De Bilt” has the longest record of ozone measured with an MKIII instrument in the WOUDC database. The #100 has been refurbished, and transferred to Antarctica.
• Brewer measurements in Suriname Measurements at the station “Paramaribo” with Brewer #159 have been continued. After careful cleaning, the dataset has now been submitted to WOUDC and NDACC. (The variability in de ozone data in this tropical station is low, and interference by clouds is a significant problem at this site.)
• Ozone sondes in the Netherlands The ozone sounding program at station “De Bilt” by KNMI has been continued, with at least one launch per week, and more when special events occurred.
• Ozone sondes in Surinam The ozone sounding program in Paramaribo has been continued with one launch per week. Paramaribo station is part of the SHADOZ network. Problems with the balloons and batteries at this site are still under investigation. The observations at Paramaribo are performed by staff of the Meteorological Service of Surinam and the bilateral cooperation with KNMI includes capacity building at the Anton de Kom University.
• Lidar measurements in New-Zealand RIVM has continued the operation of the stratospheric ozone lidar at the NDACC station in Lauder, New-Zealand where first measurements started in 1994. The ozone and temperature profile observations are currently performed about four times per month. The data are available at the NDACC and ESA calibration/validation databases and have been used in various validation studies and also for trend analyses. • UV-monitoring in the Netherlands RIVM has continued spectral UV-monitoring on the Bilthoven location. A 17 year data-record has been achieved in 2010. Over 20000 spectral UV-readings are performed yearly and QC-checked UV-index data are reported live on the webpage www.rivm.nl/zonkracht (in Dutch). Yearly sums of the UV-doses are calculated and long term trends and variations are analysed. RIVM data are also used in the WMO/UNEP ozone assessment and RIVM lead-authored a publication on long term changes in the UV-climate at eight European UV-stations.
338

Satellite networks The Netherlands has been involved in satellite ozone measurements from several instruments: GOME, SCIAMACHY, OMI and GOME-2. These are UV-visible satellite spectrometers, from which ozone and several other trace gases, like NO2, SO2, HCHO, are determined. All four instruments are operational, although the global coverage of GOME is lost since 2003. SCIAMACHY is contributed by Germany, the Netherlands, and Belgium to ESA’s Envisat satellite. SRON is the Dutch co-PI of SCIAMACHY. OMI is a contribution from the Netherlands and Finland to NASA’s EOS-Aura satellite. KNMI has the PI-role for OMI. TROPOMI is the successor instrument of OMI and SCIAMACHY. TROPOMI is approved by the Netherlands and ESA, and will fly on the ESA Sentinel-5 Precursor mission, to be launched end of 2014. KNMI has the PI-role of TROPOMI. Ozone data processing and users At KNMI near-real time data processing of satellite ozone columns and ozone profiles is taking place; see Table 1. Also data assimilated products are made. Most of the products are being delivered to users via the web portal www.temis.nl. The OMI ozone products are being delivered via the GSFC Data and Information Services Center (DISC). GOME-2 data processing at KNMI is performed in the framework of the Ozone and Atmospheric Chemistry Monitoring Satellite Application Facility (O3MSAF) of EUMETSAT. Data delivery of near-real-time ozone profile products is done via EUMETCast broadcasting. Fig. 2 gives an example of GOME-2 profiles derived for the Antarctic in 2008. There are many users of the satellite ozone data; for example, SCIAMACHY and OMI ozone column data is being delivered in near-real-time to ECMWF for assimilation in the model. The EU MACC project is also a user of KNMI satellite ozone data. Table 1: Near-real-time and offline satellite ozone products made by KNMI. Instrument Product Period Data delivery GOME Ozone column 1995 – now
(global until 2003)
http://www.temis.nl
SCIAMACHY Ozone column 2002 – now http://www.temis.nl
OMI Ozone column, Ozone profile, Assimilated ozone column
2004 – now http://www.temis.nl http://disc.sci.gsfc.nasa.gov/Aura
GOME-2 Ozone profile, Assimilated ozone column
2007 – now http://www.temis.nl http://o3msaf.fmi.fi EUMETCast
339
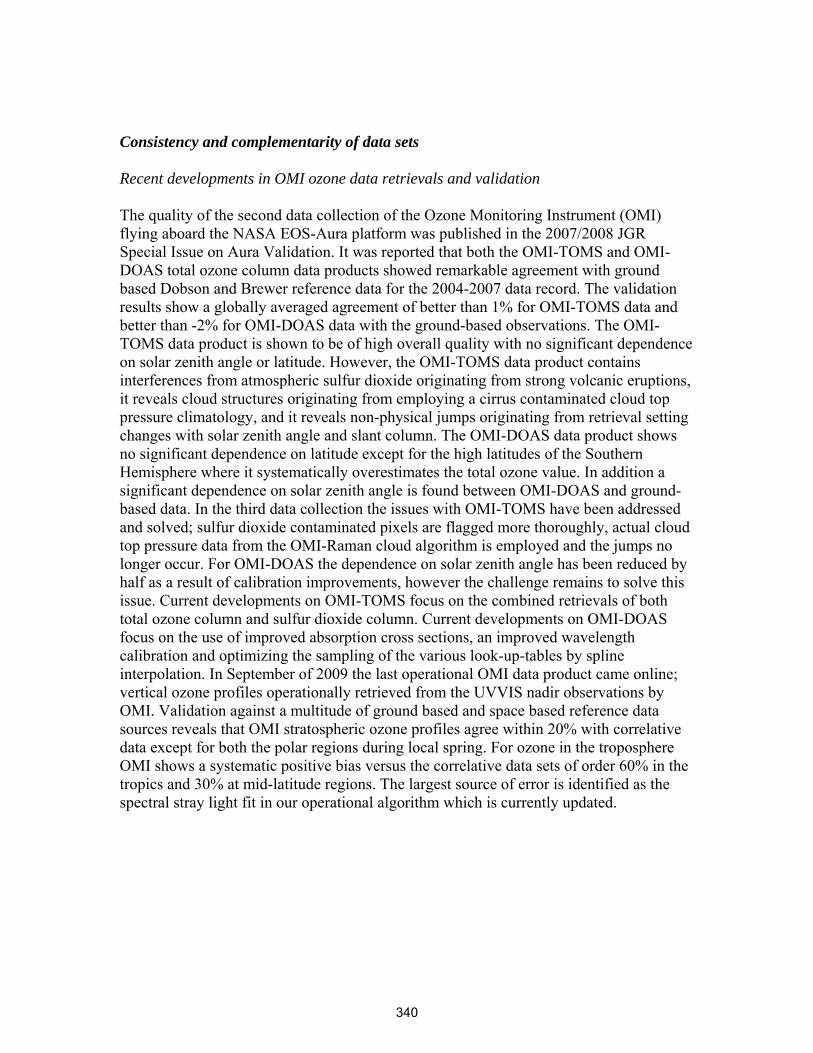
Consistency and complementarity of data sets Recent developments in OMI ozone data retrievals and validation The quality of the second data collection of the Ozone Monitoring Instrument (OMI) flying aboard the NASA EOS-Aura platform was published in the 2007/2008 JGR Special Issue on Aura Validation. It was reported that both the OMI-TOMS and OMI-DOAS total ozone column data products showed remarkable agreement with ground based Dobson and Brewer reference data for the 2004-2007 data record. The validation results show a globally averaged agreement of better than 1% for OMI-TOMS data and better than -2% for OMI-DOAS data with the ground-based observations. The OMI-TOMS data product is shown to be of high overall quality with no significant dependence on solar zenith angle or latitude. However, the OMI-TOMS data product contains interferences from atmospheric sulfur dioxide originating from strong volcanic eruptions, it reveals cloud structures originating from employing a cirrus contaminated cloud top pressure climatology, and it reveals non-physical jumps originating from retrieval setting changes with solar zenith angle and slant column. The OMI-DOAS data product shows no significant dependence on latitude except for the high latitudes of the Southern Hemisphere where it systematically overestimates the total ozone value. In addition a significant dependence on solar zenith angle is found between OMI-DOAS and ground-based data. In the third data collection the issues with OMI-TOMS have been addressed and solved; sulfur dioxide contaminated pixels are flagged more thoroughly, actual cloud top pressure data from the OMI-Raman cloud algorithm is employed and the jumps no longer occur. For OMI-DOAS the dependence on solar zenith angle has been reduced by half as a result of calibration improvements, however the challenge remains to solve this issue. Current developments on OMI-TOMS focus on the combined retrievals of both total ozone column and sulfur dioxide column. Current developments on OMI-DOAS focus on the use of improved absorption cross sections, an improved wavelength calibration and optimizing the sampling of the various look-up-tables by spline interpolation. In September of 2009 the last operational OMI data product came online; vertical ozone profiles operationally retrieved from the UVVIS nadir observations by OMI. Validation against a multitude of ground based and space based reference data sources reveals that OMI stratospheric ozone profiles agree within 20% with correlative data except for both the polar regions during local spring. For ozone in the troposphere OMI shows a systematic positive bias versus the correlative data sets of order 60% in the tropics and 30% at mid-latitude regions. The largest source of error is identified as the spectral stray light fit in our operational algorithm which is currently updated.
340
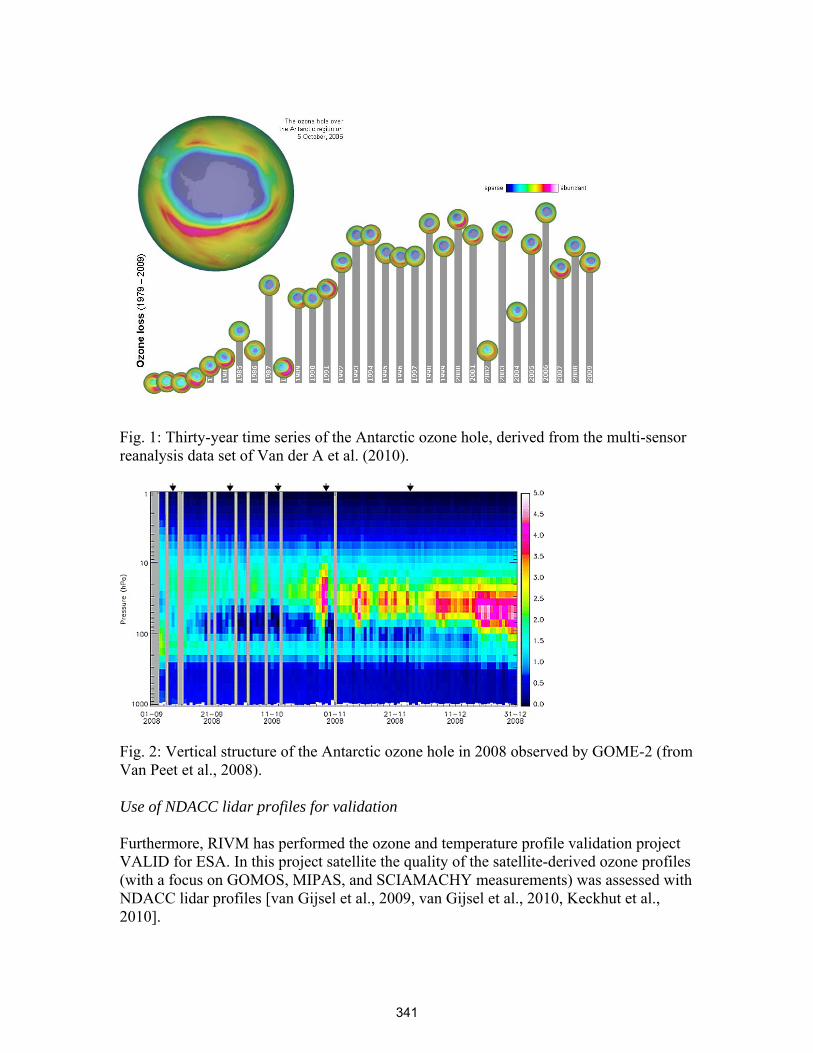
Fig. 1: Thirty-year time series of the Antarctic ozone hole, derived from the multi-sensor reanalysis data set of Van der A et al. (2010).
Fig. 2: Vertical structure of the Antarctic ozone hole in 2008 observed by GOME-2 (from Van Peet et al., 2008). Use of NDACC lidar profiles for validation Furthermore, RIVM has performed the ozone and temperature profile validation project VALID for ESA. In this project satellite the quality of the satellite-derived ozone profiles (with a focus on GOMOS, MIPAS, and SCIAMACHY measurements) was assessed with NDACC lidar profiles [van Gijsel et al., 2009, van Gijsel et al., 2010, Keckhut et al., 2010].
341
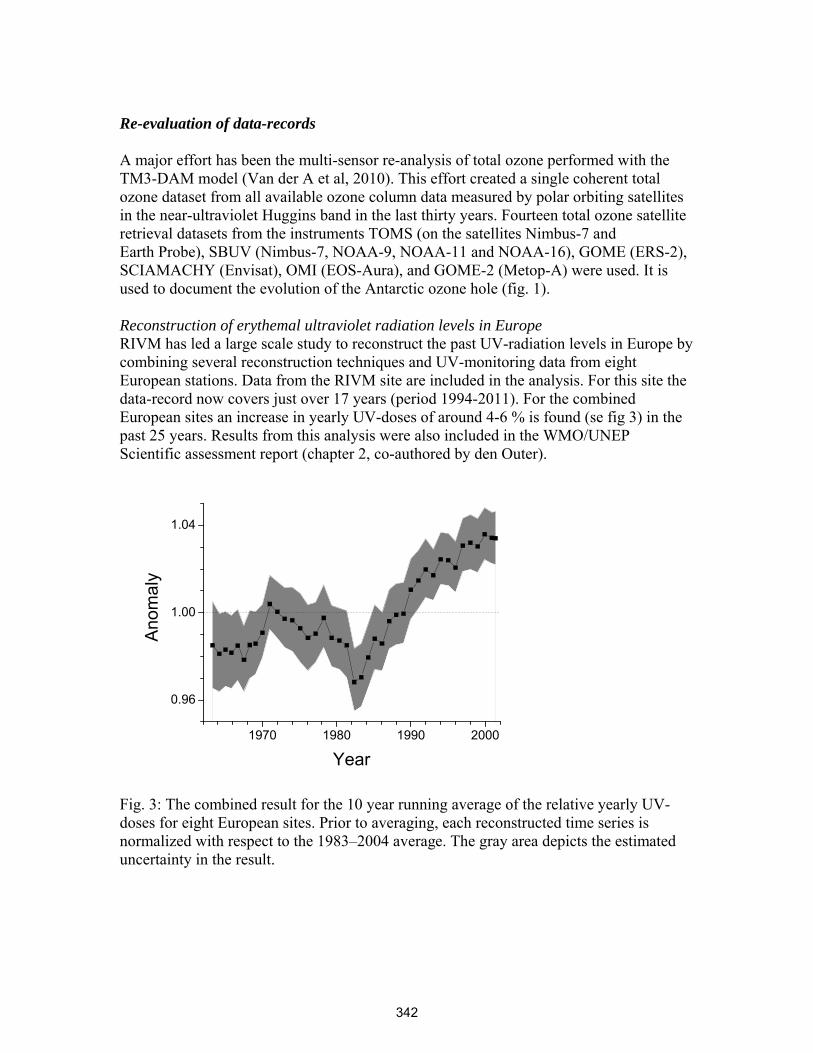
Re-evaluation of data-records A major effort has been the multi-sensor re-analysis of total ozone performed with the TM3-DAM model (Van der A et al, 2010). This effort created a single coherent total ozone dataset from all available ozone column data measured by polar orbiting satellites in the near-ultraviolet Huggins band in the last thirty years. Fourteen total ozone satellite retrieval datasets from the instruments TOMS (on the satellites Nimbus-7 and Earth Probe), SBUV (Nimbus-7, NOAA-9, NOAA-11 and NOAA-16), GOME (ERS-2), SCIAMACHY (Envisat), OMI (EOS-Aura), and GOME-2 (Metop-A) were used. It is used to document the evolution of the Antarctic ozone hole (fig. 1). Reconstruction of erythemal ultraviolet radiation levels in Europe RIVM has led a large scale study to reconstruct the past UV-radiation levels in Europe by combining several reconstruction techniques and UV-monitoring data from eight European stations. Data from the RIVM site are included in the analysis. For this site the data-record now covers just over 17 years (period 1994-2011). For the combined European sites an increase in yearly UV-doses of around 4-6 % is found (se fig 3) in the past 25 years. Results from this analysis were also included in the WMO/UNEP Scientific assessment report (chapter 2, co-authored by den Outer).
Fig. 3: The combined result for the 10 year running average of the relative yearly UV-doses for eight European sites. Prior to averaging, each reconstructed time series is normalized with respect to the 1983–2004 average. The gray area depicts the estimated uncertainty in the result.
342

Other contributions Netherlands scientists have contributed to several chapters of the 2010 UNEP/WMO Scientific assessment report, e.g. to the coordination of chapter 8 (Daniel and Velders, 2010). A new assessment study has led to an important update of the projected future contribution to climate warming by HFCs (Velders et al., 2009). References A, R.J. van der, M.A.F. Allaart and H.J. Eskes (2010): Multi sensor reanalysis of total ozone, Atm. Chem. Phys., 10, 11277-11294, doi:10.5194/acp-10-11277-2010. Daniel, J.S., G.J.M. Velders (Coordinating lead authors of Chapter 8), A Focus on Options and Information for Policymakers, in UNEP/WMO Scientific assessment of ozone depletion: 2010, World Meteorological Organization, Global Ozone Monitoring Project - Report No. 52, WMO, Geneva. Den Outer, P.N., H. Slaper, H., A. Lindfors, J. Kaurola, A. Bais, A Kazantzidis, U. Feister, J. Junk, M. Janouch, W. Josefsson .(2010), Reconstructing of erythemal ultraviolet radiation levels in Europe for the past four decades, J. Geophys. Res., 115, D10102, doi:10.1029/2009JD012827 Mijling, B., O.N.E. Tuinder, R.F. van Oss and R.J. van der A (2010): Improving ozone profile retrieval from spaceborne UV backscatter spectrometers using convergence behaviour diagnostics, Atmospheric Measurement Techniques, 3, 1555-1568, doi:10.5194/amt-3-1555-2010. Laat, A.T.J. de, R.J. van der A and M. van Weele (2009): Evaluation of tropospheric ozone columns derived from assimilated GOME ozone profile observations, Atm. Chem. Phys., 9, 8105-8120 Peet, J.C.A. van, R.J. van der A, A.T.J. de Laat, O.N.E. Tuinder, G. Koenig-Langlo and J. Wittig (2009): Height resolved ozone hole structure as observed by the Global Ozone Monitoring Experiment–2, Geophys. Res. Lett., 36, doi:10.1029/2009GL038603. Kroon, M., J.P. Veefkind, M. Sneep, R.D. McPeters, P.K. Bhartia and P.F. Levelt (2008): Comparing OMI-TOMS and OMI-DOAS total ozone column data, J. Geophys. Res., 113, doi:10.1029/2007JD008798. Kroon, M., I. Petropavlovskikh, R. Shetter, S. Hall, K. Ullman, J.P. Veefkind, R.D. McPeters and P.F. Levelt (2008): OMI total Ozone Column Validation with Aura-AVE CAFS Observations, J. Geophys. Res., 113, doi:10.1029/2007JD008795.
343

Struijs, J., A. Van Dijk, H. Slaper, H.J. Van Wijnen, G.J.M. Velders, G. Chaplin, M.A.J. Huijbregts (2010), Spatial- and time-explicit human damage modelling of ozone depleting substances in Life Cycle Impact, Environ. Sci. Technol. 44, 204–209. Van Gijsel et al. (2009): Global validation of ENVISAT ozone profiles using lidar measurements, International Journal of Remote Sensing 30(15), 3987-3994. Van Gijsel et al. (2010): GOMOS ozone profile validation using ground-based and balloon sonde measurements, Atmospheric Chemistry and Physics 10, 10473-10488. Velders, G.J.M., D.W. Fahey, J.S. Daniel, M. McFarland, S.O. Andersen (2009): The large contribution of projected HFC emissions to future climate forcing, Proc. Natl. Acad Sci., 106, 10949-10954, doi: 10.1073/pnas.0902817106.
344
Ozone research and monitoring in Norway
Ozone monitoring and related research activities in Norway involve several institutions and there is no distinct separation between research, development, monitoring and quality control. In this report we present the ozone related activities that have been carried out in Norway the last years.
1. OBSERVATIONAL ACTIVITIES
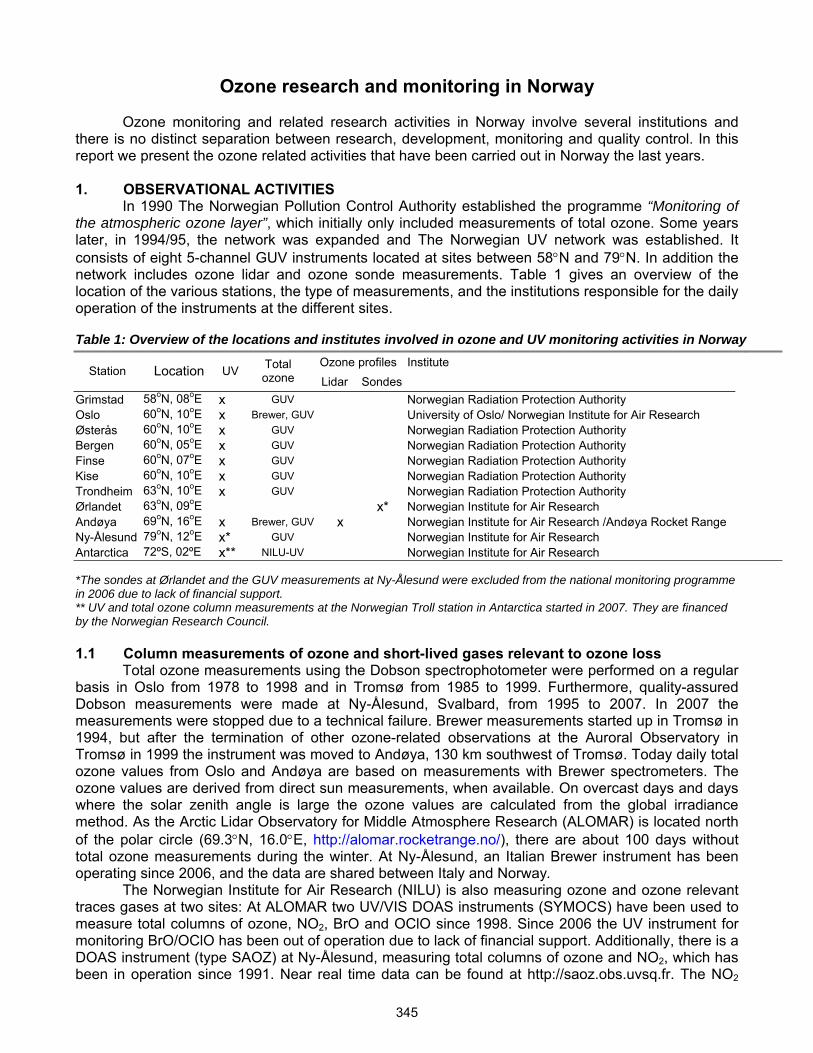
In 1990 The Norwegian Pollution Control Authority established the programme “Monitoring of the atmospheric ozone layer”, which initially only included measurements of total ozone. Some years later, in 1994/95, the network was expanded and The Norwegian UV network was established. It consists of eight 5-channel GUV instruments located at sites between 58°N and 79°N. In addition the network includes ozone lidar and ozone sonde measurements. Table 1 gives an overview of the location of the various stations, the type of measurements, and the institutions responsible for the daily operation of the instruments at the different sites. Table 1: Overview of the locations and institutes involved in ozone and UV monitoring activities in Norway
Ozone profiles Institute Station Location UV Total
ozone Lidar Sondes Grimstad 58oN, 08oE x GUV Norwegian Radiation Protection Authority Oslo 60oN, 10oE x Brewer, GUV University of Oslo/ Norwegian Institute for Air Research Østerås 60oN, 10oE x GUV Norwegian Radiation Protection Authority Bergen 60oN, 05oE x GUV Norwegian Radiation Protection Authority Finse 60oN, 07oE x GUV Norwegian Radiation Protection Authority Kise 60oN, 10oE x GUV Norwegian Radiation Protection Authority Trondheim 63oN, 10oE x GUV Norwegian Radiation Protection Authority Ørlandet 63oN, 09oE x* Norwegian Institute for Air Research Andøya 69oN, 16oE x Brewer, GUV x Norwegian Institute for Air Research /Andøya Rocket Range Ny-Ålesund 79oN, 12oE x* GUV Norwegian Institute for Air Research Antarctica 72ºS, 02ºE x** NILU-UV Norwegian Institute for Air Research *The sondes at Ørlandet and the GUV measurements at Ny-Ålesund were excluded from the national monitoring programme in 2006 due to lack of financial support. ** UV and total ozone column measurements at the Norwegian Troll station in Antarctica started in 2007. They are financed by the Norwegian Research Council. 1.1 Column measurements of ozone and short-lived gases relevant to ozone loss
Total ozone measurements using the Dobson spectrophotometer were performed on a regular basis in Oslo from 1978 to 1998 and in Tromsø from 1985 to 1999. Furthermore, quality-assured Dobson measurements were made at Ny-Ålesund, Svalbard, from 1995 to 2007. In 2007 the measurements were stopped due to a technical failure. Brewer measurements started up in Tromsø in 1994, but after the termination of other ozone-related observations at the Auroral Observatory in Tromsø in 1999 the instrument was moved to Andøya, 130 km southwest of Tromsø. Today daily total ozone values from Oslo and Andøya are based on measurements with Brewer spectrometers. The ozone values are derived from direct sun measurements, when available. On overcast days and days where the solar zenith angle is large the ozone values are calculated from the global irradiance method. As the Arctic Lidar Observatory for Middle Atmosphere Research (ALOMAR) is located north of the polar circle (69.3°N, 16.0°E, http://alomar.rocketrange.no/), there are about 100 days without total ozone measurements during the winter. At Ny-Ålesund, an Italian Brewer instrument has been operating since 2006, and the data are shared between Italy and Norway.
The Norwegian Institute for Air Research (NILU) is also measuring ozone and ozone relevant traces gases at two sites: At ALOMAR two UV/VIS DOAS instruments (SYMOCS) have been used to measure total columns of ozone, NO2, BrO and OClO since 1998. Since 2006 the UV instrument for monitoring BrO/OClO has been out of operation due to lack of financial support. Additionally, there is a DOAS instrument (type SAOZ) at Ny-Ålesund, measuring total columns of ozone and NO2, which has been in operation since 1991. Near real time data can be found at http://saoz.obs.uvsq.fr. The NO2
345

and ozone measurements at ALOMAR and Ny-Ålesund are a part of the Network for the detection of Atmospheric Composition Change (NDACC). 1.2 Profile measurements of ozone and other parameters relevant to ozone loss
Together with the Andøya Rocket Range, NILU has operated an ozone lidar at ALOMAR (Andøya) since January 1995. Since 1997 the instrument has been approved as a complementary site of the NDACC, and data are submitted to the NDACC database. The ozone lidar has also been used to measure polar stratospheric clouds and stratospheric temperature profiles. The lidar is run on a routine basis during clear sky conditions, providing ozone profiles in the height range 8 to 50 km. The latest measured raw data profiles and the latest analysed ozone data are available at http://alomar.rocketrange.no/alomar-lidar.html.
NILU was also operating an ozone sonde station at Ørlandet (63.4oN, 9.2oE) in the period 1994-2006. Nominally between 1 and 4 sondes were launched per month, depending on the time of the year. These measurements have traditionally been used for national monitoring purposes. In addition, NILU has participated in a number of experimental (match) campaigns where several stations have launched sondes in a coordinated pattern to sample the same air masses at different locations. The campaigns have been used to estimate ozone loss as a function of time and sun-lit hours. Finally, the ozone vertical profile soundings have extensively been used for validation of satellite instruments, especially on the ERS-2 and Envisat platforms. Unfortunately the ozone sonde measurements terminated in 2006 due to lack of financial support. 1.3 UV measurements
1.3.1 Narrowband filter instruments The instruments in the Norwegian UV network (GUV, from Biospherical Ltd) are designed to
measure UV irradiances in 4 channels. Using a technique developed by Dahlback (1996)1, we are able to derive total ozone abundance, cloud cover information, complete UV spectra from 290 to 400 nm, and biologically weighted UV doses for any action spectrum in the UV.
In January 2007 NILU started measurements with a similar instrument (the NILU-UV radiometer) at the Norwegian research station Troll in Antarctica. The instrument is calibrated every month against relative calibration laps in order to keep track of instrument drift. Near real time (NRT) data are available at http://observatories.nilu.no/Datasets/Radiation/tabid/433/Default.aspx and http://observatories.nilu.no/Datasets/Ozonestratosphere/Totalozone/tabid/765/Default.aspx.
1.3.2 Spectroradiometers Spectral UV irradiances (global scans) are measured at least twice every hour with the Brewer
instruments at the Department of Physics, University of Oslo, and at ALOMAR. 1.4 Calibration activities
1.4.2 The Brewer instruments The Brewer instrument at the University of Oslo has been in operation since summer 1990,
whereas the Brewer measurements in Northern Norway started in 1994. The International Ozone Services, Canada, calibrates the Brewer instruments in Oslo and Andøya on a yearly basis, and the instruments are regularly calibrated against standard lamps in order to check their stability. The calibrations show that the Brewer instruments have been stable during the years of observations. Also, the total ozone measurements from the Oslo Brewer instrument agreed well with the Dobson measurements performed in the 1990s.
1.4.3 The GUV instruments As a part of the Norwegian FARIN project, described in section 5, a major international UV
instrument intercomparison was arranged. Altogether 51 UV radiometers from various nations participated, among them 39 multiband filter radiometers (MBFR’s). The instruments were also characterized on site. In addition to measurements of spectral responses, measurements against QTH
1 Dahlback, A. (1996) Appl. Opt., Vol. 35., No.33, 6514-6521.
346
lamps and cosine responses were performed for a selection of instruments. The data are available on the ftp server zardoz.nilu.no at NILU, under directories /nadir/projects/other/farin/rawdata and /nadir/projects/other/farin/processed. The main results have been published by Johnsen et al. (2008)2.
2. RESULTS FROM OBSERVATIONS AND ANALYSIS 2.1 Ozone observations in Oslo
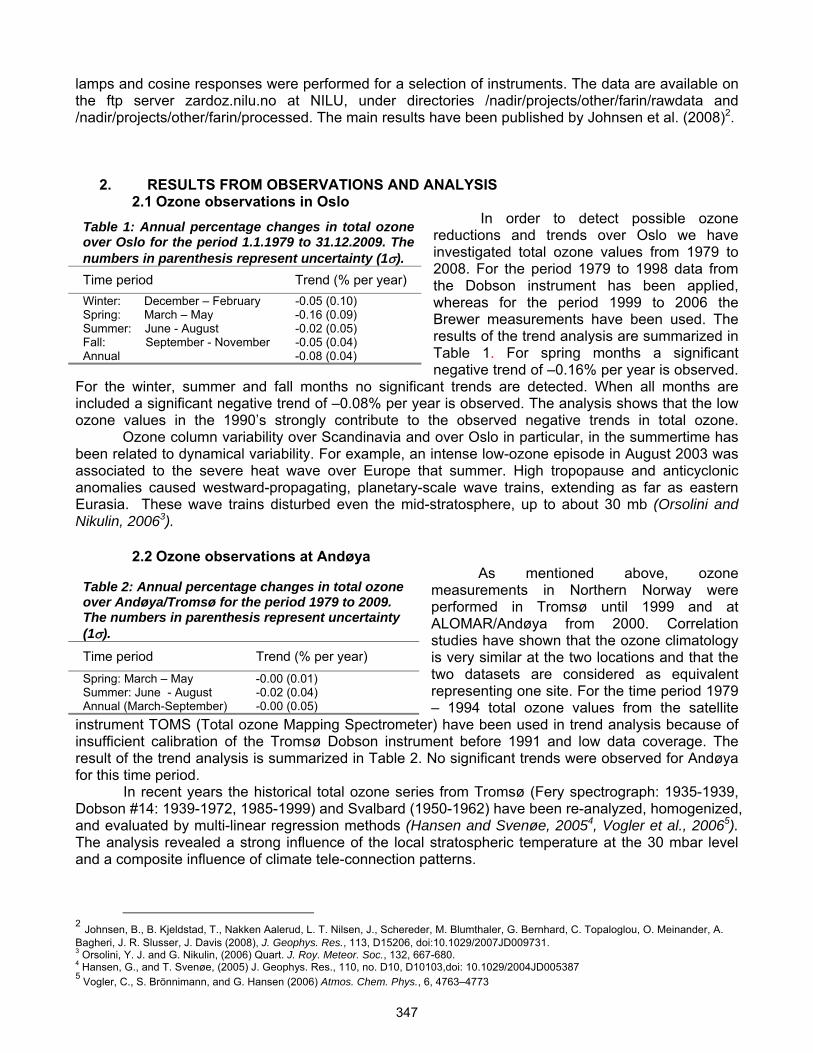
In order to detect possible ozone reductions and trends over Oslo we have investigated total ozone values from 1979 to 2008. For the period 1979 to 1998 data from the Dobson instrument has been applied, whereas for the period 1999 to 2006 the Brewer measurements have been used. The results of the trend analysis are summarized in Table 1. For spring months a significant negative trend of –0.16% per year is observed.
For the winter, summer and fall months no significant trends are detected. When all months are included a significant negative trend of –0.08% per year is observed. The analysis shows that the low ozone values in the 1990’s strongly contribute to the observed negative trends in total ozone. Ozone column variability over Scandinavia and over Oslo in particular, in the summertime has been related to dynamical variability. For example, an intense low-ozone episode in August 2003 was associated to the severe heat wave over Europe that summer. High tropopause and anticyclonic anomalies caused westward-propagating, planetary-scale wave trains, extending as far as eastern Eurasia. These wave trains disturbed even the mid-stratosphere, up to about 30 mb (Orsolini and Nikulin, 20063).
2.2 Ozone observations at Andøya As mentioned above, ozone measurements in Northern Norway were performed in Tromsø until 1999 and at ALOMAR/Andøya from 2000. Correlation studies have shown that the ozone climatology is very similar at the two locations and that the two datasets are considered as equivalent representing one site. For the time period 1979 – 1994 total ozone values from the satellite
instrument TOMS (Total ozone Mapping Spectrometer) have been used in trend analysis because of insufficient calibration of the Tromsø Dobson instrument before 1991 and low data coverage. The result of the trend analysis is summarized in Table 2. No significant trends were observed for Andøya for this time period.
In recent years the historical total ozone series from Tromsø (Fery spectrograph: 1935-1939, Dobson #14: 1939-1972, 1985-1999) and Svalbard (1950-1962) have been re-analyzed, homogenized, and evaluated by multi-linear regression methods (Hansen and Svenøe, 20054, Vogler et al., 20065). The analysis revealed a strong influence of the local stratospheric temperature at the 30 mbar level and a composite influence of climate tele-connection patterns.
2 Johnsen, B., B. Kjeldstad, T., Nakken Aalerud, L. T. Nilsen, J., Schereder, M. Blumthaler, G. Bernhard, C. Topaloglou, O. Meinander, A. Bagheri, J. R. Slusser, J. Davis (2008), J. Geophys. Res., 113, D15206, doi:10.1029/2007JD009731. 3 Orsolini, Y. J. and G. Nikulin, (2006) Quart. J. Roy. Meteor. Soc., 132, 667-680. 4 Hansen, G., and T. Svenøe, (2005) J. Geophys. Res., 110, no. D10, D10103,doi: 10.1029/2004JD005387 5 Vogler, C., S. Brönnimann, and G. Hansen (2006) Atmos. Chem. Phys., 6, 4763–4773
Table 1: Annual percentage changes in total ozone over Oslo for the period 1.1.1979 to 31.12.2009. The numbers in parenthesis represent uncertainty (1σ). Time period Trend (% per year) Winter: December – February -0.05 (0.10) Spring: March – May -0.16 (0.09) Summer: June - August -0.02 (0.05) Fall: September - November -0.05 (0.04) Annual -0.08 (0.04)
Table 2: Annual percentage changes in total ozone over Andøya/Tromsø for the period 1979 to 2009. The numbers in parenthesis represent uncertainty (1σ). Time period Trend (% per year) Spring: March – May -0.00 (0.01) Summer: June - August -0.02 (0.04) Annual (March-September) -0.00 (0.05)
347
2.3 UV observations
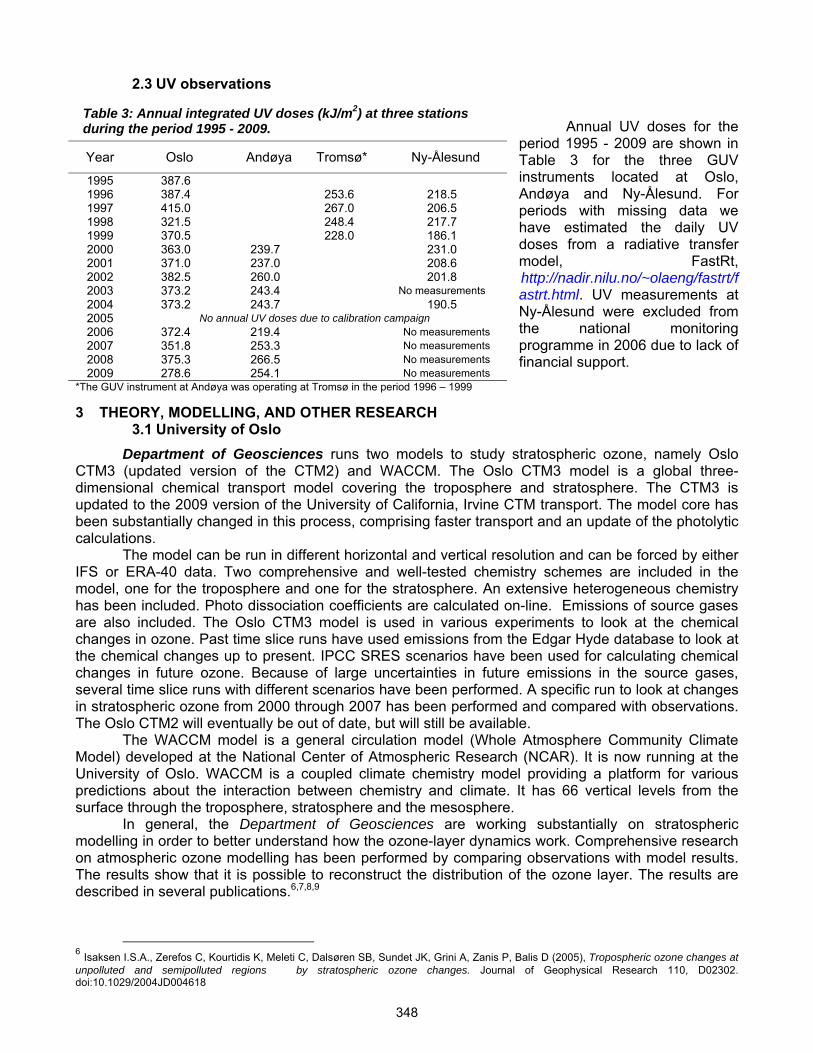
Annual UV doses for the period 1995 - 2009 are shown in Table 3 for the three GUV instruments located at Oslo, Andøya and Ny-Ålesund. For periods with missing data we have estimated the daily UV doses from a radiative transfer model, FastRt, http://nadir.nilu.no/~olaeng/fastrt/fastrt.html. UV measurements at Ny-Ålesund were excluded from the national monitoring programme in 2006 due to lack of financial support.
3 THEORY, MODELLING, AND OTHER RESEARCH 3.1 University of Oslo
Department of Geosciences runs two models to study stratospheric ozone, namely Oslo CTM3 (updated version of the CTM2) and WACCM. The Oslo CTM3 model is a global three-dimensional chemical transport model covering the troposphere and stratosphere. The CTM3 is updated to the 2009 version of the University of California, Irvine CTM transport. The model core has been substantially changed in this process, comprising faster transport and an update of the photolytic calculations.
The model can be run in different horizontal and vertical resolution and can be forced by either IFS or ERA-40 data. Two comprehensive and well-tested chemistry schemes are included in the model, one for the troposphere and one for the stratosphere. An extensive heterogeneous chemistry has been included. Photo dissociation coefficients are calculated on-line. Emissions of source gases are also included. The Oslo CTM3 model is used in various experiments to look at the chemical changes in ozone. Past time slice runs have used emissions from the Edgar Hyde database to look at the chemical changes up to present. IPCC SRES scenarios have been used for calculating chemical changes in future ozone. Because of large uncertainties in future emissions in the source gases, several time slice runs with different scenarios have been performed. A specific run to look at changes in stratospheric ozone from 2000 through 2007 has been performed and compared with observations. The Oslo CTM2 will eventually be out of date, but will still be available.
The WACCM model is a general circulation model (Whole Atmosphere Community Climate Model) developed at the National Center of Atmospheric Research (NCAR). It is now running at the University of Oslo. WACCM is a coupled climate chemistry model providing a platform for various predictions about the interaction between chemistry and climate. It has 66 vertical levels from the surface through the troposphere, stratosphere and the mesosphere.
In general, the Department of Geosciences are working substantially on stratospheric modelling in order to better understand how the ozone-layer dynamics work. Comprehensive research on atmospheric ozone modelling has been performed by comparing observations with model results. The results show that it is possible to reconstruct the distribution of the ozone layer. The results are described in several publications.6,7,8,9
6 Isaksen I.S.A., Zerefos C, Kourtidis K, Meleti C, Dalsøren SB, Sundet JK, Grini A, Zanis P, Balis D (2005), Tropospheric ozone changes at unpolluted and semipolluted regions by stratospheric ozone changes. Journal of Geophysical Research 110, D02302. doi:10.1029/2004JD004618
Table 3: Annual integrated UV doses (kJ/m2) at three stations during the period 1995 - 2009.
Year Oslo Andøya Tromsø* Ny-Ålesund
1995 387.6 1996 387.4 253.6 218.5 1997 415.0 267.0 206.5 1998 321.5 248.4 217.7 1999 370.5 228.0 186.1 2000 363.0 239.7 231.0 2001 371.0 237.0 208.6 2002 382.5 260.0 201.8 2003 373.2 243.4 No measurements 2004 373.2 243.7 190.5 2005 No annual UV doses due to calibration campaign 2006 372.4 219.4 No measurements 2007 351.8 253.3 No measurements 2008 375.3 266.5 No measurements 2009 278.6 254.1 No measurements
*The GUV instrument at Andøya was operating at Tromsø in the period 1996 – 1999
348
Department of Physics UV doses are calculated from a radiative transfer model and ozone
measurements from available satellite instruments (TOMS and OMI). The cloud parameterisation in the model is derived from reflectivity data from the same satellite instruments. The calculated UV doses are used in UV effect studies, i.e various cancers and Vitamin D production in humans.
3.2 Norwegian Institute for Air Research (NILU)
At NILU there has been a main research focus to understand the dynamical influence on the variability in column ozone, especially at the northern hemisphere at mid and high latitudes. Satellite validation of ozone profiles and total ozone is also a central activity. Some activities and results are listed below: The stratospheric lidar data from ALOMAR have been extensively used for the validation of GOME
and ENVISAT’s atmospheric instruments (GOMOS, MIPAS and SCIAMACHY). This is described in a series of publications. 10, 11, 12, 13, 14
Leading modes of climate variability have been shown to induce a strong signature on the trend and year-to-year variability in ozone. These modes include planetary-scale components of the atmospheric circulation (the North Atlantic Oscillation, the Aleutian-Icelandic Seesaw) (Orsolini, 200415) but also more regional patterns, e.g. those associated with blocking phenomena (Orsolini and Doblas-Reyes, 200316).
The dynamically induced low-ozone episodes (LOE) is studied. Orsolini et al. (200317) explained occurrences of summertime LOEs over the northern high latitudes, and Scandinavia in particular, and looked at their impact on the UV erythemal dose at the ground. An intense LOE occurred over Scandinavia during the European Heat Wave of the summer 2003 (Orsolini and Nikulin, 20067).
Orsolini et al., (200518) have studied the changes in atmospheric composition (HNO3, NOX), and ozone depletion occurring in the aftermath of the exceptional autumn 2003 solar storms. A highly anomalous layer enriched in nitric acid was observed in the upper stratosphere following the storms, and then slowly descended throughout the winter. Simultaneous observations of NO2, including the nighttime polar stratosphere, revealed strongly enrichment of NOX layers following the storms. The formation mechanism for the nitric acid layer does not seem to involve polar stratospheric clouds or aerosols, but rather, is likely to involve heterogeneous chemistry on water ion clusters, a relatively new and unknown topic.
7 Søvde, O.A. Orsolini, Y.J. , Jackson, D.R. , Stordal, F. , Isaksen, I.S.A. , Rognerud, B. (2011) Estimation of Arctic O3 loss during winter 2006/2007 using data assimilation and comparison with a chemical transport model, Quarterly Journal of the Royal Meteorological Society, 137, 654, 118-128 8 Eleftheratos, K., C..S. Zerefos, E. Gerasopoulos, I.S.A. Isaksen, B. Rognerud, S. Dalsøren, C. Varotsos and S. Gazerian, (20110 A note on the comparison between total ozone from Oslo CTM2 model and SBUV satellite data, International Journal of Remote Sensing (In press) 9 Isaksen, I.S.A. and S.B. Dalsøren, Improving estimates of the major atmospheric cleaning agent OH, (2011) Science, 331, DOI: 10.1126, 10 Steck, T. von Clarmann, H. Fischer, B. Funke, N. Glatthor, U. Grabowski, M. Höpfner, S. Kellmann, M. Kiefer, A. Linden, M. Milz, G. P. Stiller, D. Y. Wang, M. Allaart, Th. Blumenstock, P. von der Gathen, G. Hansen, F. Hase, G. Hochschild, G. Kopp, E. Kyrö, H. Oelhaf, U. Raffalski, A. Redondas Marrero, E. Remsberg, J. Russell III, K. Stebel, W. Steinbrecht, G. Wetzel, M. Yela, G. Zhang, (2007), Atmos. Chem. Phys., 7, 3639–3662. 11 Iapaolo M., S. Godin-Beekmann, F. Del Frate, S. Casadio, M. Petitdidier, I.S. McDermid, T. Leblanc, D. Swart, Y. Meijer, G. Hansen, and K. Stebel, (2007) J. of Quantitative Spectroscopy and Radiative Transfer, 107, 105-119. 12 Brinksma, E.J., A. Bracher, D. E. Lolkema, A. J. Segers, I. S. Boyd, K. Bramstedt, H. Claude, S. Godin-Beekmann, G. Hansen, G. Kopp, T. Leblanc, I. S. McDermid, Y. J. Meijer, H. Nakane, A. Parrish, C. von Savigny, K. Stebel, D. P. J. Swart, G. Taha, and A. J. M. Piters, (2006) Atmos. Chem. Phys. 6, 197-209. 13 Keckhut, P., McDermid, S., Swart, D., McGee, T., Godin-Beekmann, S., Adriani, A., Barnes, J., Baray, J.-L., Bencherif, H., Claude, H., di Sarra, A.G., Fiocco, G., Hansen, G., Hauchecorne, A., Leblanc, T., Lee, C.H., Pal, S., Megie, G., Nakane, H., Neuber, R., Steinbrecht, W. and Thayer, J. , (2004) Review of ozone and temperature lidar validations performed in the framework of the NDSC, J. Environ. Mon., 6, 721-733. 14 Meijer, Y. J., Swart, D. P. J., Allaart, M., Andersen, S. B., Bodeker, G., Boyd, I., Braathen, G., Calisesi, Y., Claude, H., Dorokhov, V., von der Gathen, P., Gil, M., Godin-Beekmann, S., Goutail, F., Hansen, G., Karpetchko, A., Keckhut, P., Kelder, H. M., Koelemeijer, R., Kois, B., Koopman, R. M., Kopp, G., Lambert, J.-C., Leblanc, T., McDermid, I. S., Pal, S., Schets, H., Stubi, R., Suortti, T., Visconti, G. and Yela, M., (2004) J. Geophys. Res., 109, D23305, doi:10.1029/2004JD004834, 2004 15 Orsolini, Y. J., (2004) J. Meteor. Soc. of Japan, 82, vol. 3, 941-948. 16 Orsolini, Y. J. and F.J. Doblas-Reyes. (2003) Q. J. of the Royal Meteorol. Soc., 129, 3251-3263, 2003. 17 Orsolini, Y.J., H. Eskes, G. Hansen, U-P. Hoppe, A. Kylling, E. Kyro, J. Notholt, R. Van der A. P. Von der Gathen, (2003) Q. J. R. Meteorol.
Soc., 129, 3265-3276. 18 Orsolini, Y. J., G.L. Manney, M. Santee and C.E. Randall, (2005) Geophys, Res. Lett., Vol. 32, No. 12, L12S01, 10.1029/2004GL021588.
349

Jackson and Orsolini, (200719) have developed a new technique for the estimate of ozone loss in the stratospheric polar vortex based on the assimilation of EOS MLS and SBUV observations in the Met Office data assimilation system. The method has been used to assess Arctic ozone loss during the winters 2004/05 and 2006/07 (abstract presented at the EGU General assembly, 2008) and is aimed at better accounting for mixing and inhomogeneous descent within the vortex. The results show that data assimilation methods are very promising to potentially lead to more accurate ozone-loss estimates
The ozone data from Tromsø have been used to establish a multi-decadal UV climatology at a nearby site (Skrova, Lofoten) with meteorological information (Engelsen et al., 200420). For the same area UV maps have been derived for the period 1984-2002, based on various satellite observation data (Meerkötter et al., 200321). In the frame of the EU project UVAC it was found that there is a positive correlation between maximum daily doses around 1 May and cod recruitment, in contradiction to the work hypothesis assuming a negative influence of UV on cod eggs and larvae.
The Svalbard ozone data have been used, together with long-term observations of cloud cover at Hopen Island (Svalbard), to calculate high-Arctic UV climatology. A preliminary analysis shows that spring UV doses in fact have decreased due to an increase of cloud coverage which is larger than the simultaneous decrease in ozone (Hansen et al., 200722).
Department of Community Medicine, University of Tromsø, has in collaboration with NILU conducted two field studies23,24 and developed a method25 for estimation of UV induced vitamin D status in humans. The studies applied UV simulations based on meteorological modelling data, UV measurements, questionnaire forms from cohort investigations, and blood sample analyses. The field studies and the developed method formed the basis for a larger cohort study on approx 41.000 women on the relation between oral and UV induced vitamin D status and breast cancer risk. No relation was found. NILU is also in charge of health risk assessment for Europe from UV exposure within the EU project INTARESE.
The EU CANDIDOZ project (Chemical and Dynamical Influences on Decadal Ozone Change) investigated the chemical and dynamical influences on decadal ozone trends focusing on the Northern Hemisphere. In this project the long-term ozone series at Tromsø26 and Svalbard27 was re-evaluated and used to quantify factors contributing to past ozone variability and trends.
3.3 CICERO Centre for International Climate and Research – Oslo At CICERO changes in the total solar radiation at the surface (Kvalevåg and Myhre, 200728) and UV (Kvalevåg et al., 200829) over industrial areas have been calculated. In the calculations changes in gases (ozone, CO2, H2O, CH4, NO2, SO2), direct as well as indirect aerosol effect of sulphate black and organic carbon, surface albedo changes, and contrails are taken into account. For changes in the total solar radiation at the surface, aerosols is a dominating factor for the dimming over land areas, but increase in tropospheric ozone, H2O, CH4, NO2 also give a small contribution. At high latitudes reduced total ozone is causing an increase in the total solar radiation at the surface (Kvalevåg and
19 Jackson D.R., Y. J. Orsolini, submitted to Quart. J. Roy. Meteor. Soc., October 2007. 20 Engelsen, O., G. Hansen, and T. Svenøe. (2004), Geophys. Res. Lett., 31, L12103, doi:10.1029/2003GL019241 21 Meerkötter, R., J. Verdebout, L. Bugliaro, K. Edvardsen, G. Hansen (2003), Geophys. Res. Lett., 30, 18, 1956, doi:
10.1029/2003GL017850 22 Hansen, G., O. Engelsen, C. Vogler, and S. Brönnimann (2007), Proc. The Polar Environment and Climate – The challenges, EUR 22965 EN, 67-69. 23 Brustad et al. (2007): Seasonality of UV-radiation and vitamin D status at 69 degrees north. Photochem. Photobiol. Sci., 6, 903-8 24 Edvardsen, K. (2007): The solar UV radiation level needed for cutaneous production of vitamin D3 in the face. A study conducted among subjects living at a high latitude (68° N). Photochem. Photobiol. Sci., 6, 57-62 25 Edvardsen et al. (2009): Duration of vitamin D synthesis from weather model data for use in prospective epidemiological studies. Int. J. Biometeorol., 53, 451-459. 26Hansen, G., Svenøe, T.(2005): Multilinear regression analysis of the 65-year Tromsø total ozone series, J. Geophys. Res., 110, D10103, doi:10.1029/2004JD005387 27 Vogler, C., Br¨onnimann, S., and Hansen, G.(2006): Re-evaluation of the 1950–1962 total ozone record from Longyearbyen, Svalbard, Atmos. Phys. Chem., 6, 4763–4773 28 Kvalevåg, M. M. and Myhre, G.: (2007) J. Climate, 20(19), 4874-4883. 29 Kvalevåg, M. M., Myhre, G., and Lund Myhre, C. E. (2009), Atmos. Chem. Phys., 9, 7737‐7751
350

Myhre, 200718). The changes in UV follow to a large degree the changes in the total solar radiation since pre-industrial times, i.e. with increasing values at high latitudes and a reduction over most land regions. Ozone plays a major role in this pattern, but other gases such NO2 and SO2 and aerosols significantly contribute to the reduced UV over most land areas (Kvalevåg et al., 200825.)
4. DISSEMINATION OF RESULTS 4.1 Data reporting: Ozone
The complete set of revised Dobson total ozone values from Oslo is available at The World Ozone Data Centre (WOUDC) http://www.msc-smc.ec.gc.ca/woudc/. There are established daily routines submitting ozone data from the University of Oslo and from Andøya to WOUDC. The averaged ozone profiles (2 hours) from Andøya are reported to NDACC twice a year. Preliminary lidar profiles are reported weekly to GEOMON and quality-controlled data products are submitted yearly. NILU has collected ozone measurements from Arctic balloon flights through the Nadir database since 1988. Files are transferred and stored in the NASA-AMES 2160 format, and an automatic script has been set up to convert incoming data into the CREX format that is used at ECMWF. This script also performs a series of data quality checks and can do simple corrections on erroneous input files. 4.2 Data reporting: UV NILU has submitted spectral UV measurements from Norway to the European UV database (EUVDB). In the framework of the EU project EDUCE NILU has developed quality assurance software for spectral UV measurements. The QA software is applied automatically to all UV data submitted to EUVDB. Currently there are Brewer and Bentham UV spectral data from Andøya for the period 1998-2001 in the database. 4.3 Information to the public
4.3.1 Ozone Daily total ozone values for Oslo are available at http://www.fys.uio.no/plasma/ozone/. The
latest measured raw data profiles and the latest analysed ozone data from the ALOMAR Observatory at Andøya are available at http://alomar.rocketrange.no/alomar-lidar.html.
4.3.2 UV and ozone from GUV measurements
NILU has developed a web portal for dissemination of UV-observations and UV forecasts for Norway and common global tourist destinations, http://uv.nilu.no. The content of the UV web pages are:
• UV forecast for three days for user-selected locations in Norway. The UV forecast is given for clear-sky, partly cloudy and cloudy conditions
• Global UV forecast for common tourist destinations • Measured UV doses and total ozone values measured at the Norwegian stations • Facts on UV radiation and the ozone layer • Information about sun protection for different locations and situations
The public may receive UV forecasts at user-selected locations by SMS or e-mail. The web application has been developed by NILU in co-operation with the Norwegian Radiation Protection Authority, Storm Weather Center, and the Norwegian Pollution Control Authority. In 2006 the Norwegian Meteorological Institute developed an additional UV forecast service where the weather forecast is an integrated part of the forecasted UV index.
UV indices and cloud effects measured by a GUV-instrument at the Department of Physics, University of Oslo, are presented and updated every 30 min at: http://www.fys.uio.no/plasma/ozone/.
351

The observations performed by the Norwegian Radiation Protection Authority are available at http://www.nrpa.no/uvnett/ together with annual doses and information on sun protection.
4.4 Relevant scientific papers
The ozone and UV measurements performed in Norway give rise to research in collaboration with national and international partners. The reference list below gives an impression of the international collaboration and ongoing research in the Norwegian ozone and UV scientific community since 2004.
Bjerke, J.W.; Elvebakk, A.; Dominguez, E.; Dahlback, A. (2005), Seasonal trends in usnic acid concentrations of Arctic,
alpine and Patagonian populations of the lichen Flavocetraria nivalis. Phytochemistry; 66:337-344 Braathen, G.O., Godin-Beekmann, S., Keckhut, P., McGee, T.J., Gross, M.R., Vialle, C. and Hauchecorne, A. (2004)
Intercomparison of stratospheric ozone and temperature measurements at the Observatoire de Haute Provence during the OTOIC NDSC validation campaign from 11 July 1997. Atmos. Chem. Phys. Discuss., 5, 5303-5344.
Brinksma, E.J., A. Bracher, D. E. Lolkema, A. J. Segers, I. S. Boyd, K. Bramstedt, H. Claude, S. Godin-Beekmann, G. Hansen, G. Kopp, T. Leblanc, I. S. McDermid, Y. J. Meijer, H. Nakane, A. Parrish, C. von Savigny, K. Stebel, D. P. J. Swart, G. Taha, and A. J. M. Piters, (2006) Geophysical Validation of SCIAMACHY Limb Ozone Profiles, Atmos. Chem. Phys. 6, 197-209.
Brunner, D., Staehelin, J., Rogers, H.L., Köhler, M.O., Pyle, J.A., Hauglustaine, D.A., Jourdain, L., Berntsen, T.K., Gauss, M., Isaksen, I.S.A., Meijer, E., van Velthoven, P., Pitari, G., Mancini, E., Grewe, V. and Sausen, R. (2005) An evaluation of the performance of chemistry transport models - Part 2: Detailed comparison with two selected campaigns. Atmos. Chem. Phys., 1, 107-129.
Brustad, M., Alsaker, E., Engelsen, O., Aksnes, L. and Lund, E. (2004) Vitamin D status in middle-aged women at 65-71 degrees north in relation to dietary intake and exposure to ultraviolet radiation. Public Health Nutr., 2, 327-335, doi:101029/2002JD003325.
Brustad M., K. Edvardsen, T. Wilsgaard, O. Engelsen, L. Aksnes, E. Lund (2007) Seasonality of UV-radiation and vitamin D status at 69 degrees north, Photochemical and Photobiological Sciences, 6, 903-908, doi:10.1039/b702947k.
Brönnimann, S., Luterbacher, J., Staehelin, J., Svendby, T.M., Hansen, G. and Svenøe, T. (2004) Extreme climate of the global troposphere and stratosphere in the 1940-42 related to El Nino. Nature, 7011, 971-974.
Christensen, T., Knudsen, B.M., Streibel, M., Andersen, S.B., Benesova, A., Braathen, G., Claude, H., Davies, J., De Backer, H., Dier, H., Dorokhov, V., Gerding, M., Gil, M., Henchoz, B., Kelder, H., Kivi, R., Kyrö, E., Litynska, Z., Moore, D., Peters, G., Skrivankova, P., Stübi, R., Turunen, T., Vaughan, G., Viatte, P., Vik, A.F., von der Gathen, P. and Zaitcev, I. (2005) Vortex-averaged Arctic ozone depletion in the winter 2002/2003. Atmos. Chem. Phys., 1, 131-138.
Dahlback, A., Eide, H., Høiskar, B.A.K., Olsen, R.O., Schmidlin, F.J., Tsay, S-C. and Stamnes, K. (2005) Comparison of data for ozone amount and ultraviolet doses obtained from simultaneous measurements with various standard ultraviolet instruments. Opt. Eng., 4, 041010.
Dahlback, A., N. Gelsor, J. J. Stamnes, and Y. Gjessing (2007), UV measurements in the 3000-5000 m altitude region in Tibet, J. Geophys. Res., 112, D09308, doi:10.1029/2006JD007700
Edvardsen, K., M. Brustad, O. Engelsen and L. Aksnes (2007) The Solar UV Radiation Level Needed for Cutaneous Production of Vitamin D3 in the Face. A Study Conducted Among Subjects Living at a High Latitude (68°N), Photochemical and Photobiological Sciences, 6, 57-62, doi:10.1039/b613263d.
Edvardsen, K., M. Brustad, O. Engelsen (2009). Duration of vitamin D synthesis from weather model data for use in prospective epidemiological studies. Int J Biometerol. 53(5): 451-9.
Engelsen, O., Brustad, M., Aksnes, L. and Lund, E. (2005) Daily Duration of Vitamin D Synthesis in Human Skin with Relation to Latitude, Total Ozone, Altitude, Ground Cover, Aerosols and Cloud Thickness. Accepted for publication in "Photochemistry and Photobiology", 2005. Published online 4 June 2005. doi: 10.1562/2004-11-19-RN-375
Engelsen, O., Hansen, G. and Svenøe, T. (2004) Long-term (1936–2003) ultraviolet and photosynthetically active radiation doses at a north Norwegian location in spring on the basis of total ozone and cloud cover. Geophys. Res. Lett., 31, L12103, doi:10.1029/2003GL019241.
Engelsen, O. and Kylling, A. (2005), Fast simulation tool for ultraviolet radiation at the earth’s surface. Opt. Eng., 4, 041012. Goutail, F., Pommereau, J.-P., Lefèvre, F., Van Roozendael, M., Andersen, S.B., Kåstad Høiskar, B.-A., Dorokhov, V., Kyrö,
E., Chipperfield, M.P. and Feng, W. (2005) Early unusual ozone loss during the Arctic winter 2002/2003 compared to other winters. Atmos. Chem. Phys., 5, 665–677.
Hansen, G., O. Engelsen, C. Vogler, and S. Brönnimann (2007), Proc. The Polar Environment and Climate – The challenges, EUR 22965 EN, 67-69.
Hansen, G. and T. Svenøe, (2005) Multi-linear regression analysis of the 65-year Tromsø total ozone series. J. Geophys. Res., 110 (D10), D10103, doi:10.1029/2004JD005387.
Harris, N.R.P., E. Kyrö, J. Staehelin, D. Brunner, S-B. Andersen, S. Godin-Beekmann, S. Dhomse, P. Hadjinicolaou, G. Hansen, I. Isaksen, A. Jrrar, A. Karpetchko, R. Kivi, B. Knudsen, P. Krizan, J. Lastovicka, J. Maeder, Y. Orsolini (2008), J.A. Pyle, M. Rex, K. Vanicek, M. Weber, I. Wohltmann, P. Zanis, and C. Zerefos, Ozone trends at northern mid- and high latitudes – a European perspective, Ann. Geophys., in press.
352
Hoor, P., J. Borken-Kleefeld, D. Caro, O. Dessens, O. Endresen, M. Gauss, V. Grewe, D. Hauglustaine, I.S.A. Isaksen, P. Jøckel, J. Lelieveld, E. Meijer, D. Olivie, M. Prather, C. Schnadt Poberaj, J. Staehelin, Q. Tang, J. van Aardenne, P. van Velthoven, and R. Sausen, The impact of traffic emissions on atmospheric ozone and OH: Results from QUANTIFY, ACP, 2009
Iapaolo M., S. Godin-Beekmann, F. Del Frate, S. Casadio, M. Petitdidier, I.S. McDermid, T. Leblanc, D. Swart, Y. Meijer, G. Hansen, and K. Stebel, GOME ozone profiles retrieved by neural network techniques: A global validation with lidar measurements, J. of Quantitative Spectroscopy and Radiative Transfer, 107, 105-119, 2007.
Jackson D.R., Y. J. Orsolini, Estimation of Arctic ozone loss in winter 2004/05 based on assimilation of EOS MLS observations, (2007) submitted to Quart. J. Roy. Meteor. Soc., October 2007
Keckhut, P., McDermid, S., Swart, D., McGee, T., Godin-Beekmann, S., Adriani, A., Barnes, J., Baray, J.-L., Bencherif, H., Claude, H., di Sarra, A.G., Fiocco, G., Hansen, G., Hauchecorne, A., Leblanc, T., Lee, C.H., Pal, S., Megie, G., Nakane, H., Neuber, R., Steinbrecht, W. and Thayer, J. (2004) Review of ozone and temperature lidar validations performed within the framework of the Network for the Detection of Stratospheric Change. J. Environ. Monit., 9, 721-733.
Kylling, A., Webb, A.R., Kift, R., Gobbi, G.P., Ammannato, L., Barnaba, F., Bais, A., Kazadzis, S., Wendisch, M., Jäkel, E., Schmidt, S., Kniffka, A., Thiel, S., Junkermann, W., Blumthaler, M., Silbernagl, R., Schallhart, B., Schmitt, R., Kjeldstad, B., Thorseth, T.M., Scheirer, R. and Mayer, B. (2005) Spectral actinic flux in the lower troposphere: measurement and 1-D simulations for cloudless, broken cloud and overcast situations. Atmos. Chem. Phys., 2, 1421-1467.
Kvalevåg, M. M. and Myhre, G.: Human impact on direct and diffuse solar radiation during the industrial era, (2007) J. Climate, 20(19), 4874-4883.
Kvalevåg, M. M., Myhre, G. and Myhre, C. E. L. (2008): Anthropogenic changes in the UV radiation at the surface during the industrial era, To be submitted, 2008.
Lagunova, Z. Porojnicu, A.C., Dahlback, A., Berg, J.P., Beer, T.M., and Moan, J. (2007) Prostate cancer survival is dependent on season of diagnosis. Prostate 67, 1362-1370. doi: 10.1002/pros.20577
Lakkala, K.; Redondas, A.; Meinander, O.; Torres, C.; Koskela, T.; Cuevas, E.; Taalas, P.; Dahlback, A.; Deferrari, G.; Edvardsen, K.; Ochoa, H.. (2005) Quality assurance of the solar UV network in the Antarctic. J. Geophys. Res. ;110 ,D15101, doi:10.1029/2004JD005584.
Meijer, Y. J., Swart, D. P. J., Allaart, M., Andersen, S. B., Bodeker, G., Boyd, I., Braathen, G., Calisesi, Y., Claude, H., Dorokhov, V., von der Gathen, P., Gil, M., Godin-Beekmann, S., Goutail, F., Hansen, G., Karpetchko, A., Keckhut, P., Kelder, H. M., Koelemeijer, R., Kois, B., Koopman, R. M., Kopp, G., Lambert, J.-C., Leblanc, T., McDermid, I. S., Pal, S., Schets, H., Stubi, R., Suortti, T., Visconti, G. and Yela, M., (2004) Pole-to-pole validation of Envisat GOMOS ozone profiles using data from ground-based and balloon sonde measurements, J. Geophys. Res., 109, D23305, doi:10.1029/2004JD004834, 2004
Moan, J.E., Porojnicu, A.C., Robsahm, T.E., Dahlback, A., Juzeniene, A., Tretli, S. and Grant, W. (2005) Solar radiation, vitamin D and survival rate of colon cancer in Norway. J. Photochem. Photobiol. B, Biol. 3, 189-193.
Moan, J., Porojnicu, A.C., and Dahlback, A. (2007) Epidemiology of cutaneous malignant melanoma. In: Skin cancer prevention. Ed. U.Ringborg, Y.Brandberg, E.W.Breitbart and R.Greinert. ISBN 0849398894. Informa Healthcare, NY, USA, pp. 179-201
Moan, J., Porojnicu, A.C., Dahlback, A., and Setlow, R.B. (2008) Addressing the health benefits and risks, involving vitamin D or skin cancer, of increased sun exposure, PNAS., vol. 105, 668-673. Orsolini, Y. J. (2004) Seesaw Ozone Fluctuations between the North Pacific and Atlantic in Late Winter, J. Meteor. Soc.
Japan, 3, 941-948. Orsolini, Y. J. and F.J. Doblas-Reyes. (2003) Ozone signatures of climate patterns over the Euro-Atlantic sector in the spring,
Q. J. of the Royal Meteorol. Soc., 129, 3251-3263, 2003. Orsolini, Y.J., Manney, G.L., Santee, M.L. and Randall, C.E. (2005) An upper stratospheric layer of enhanced HNO3 following
exceptional solar storms. Geophys. Res. Lett., 32, L12S01, doi:10.1029/2004GL021588. Orsolini, Y. J. and G. Nikulin, A low-ozone episode during the European heat wave of August 2003, (2006) Quart. J. Roy.
Meteor. Soc.,, 132, 667-680. Orsolini, Y.J., J. Urban and D. Murtagh, A climatology of nitric acid satellite observations from the Odin/SMR instrument
(2001-2007), PART II : High-altitude polar enhancements, Atmospheric Chemistry and Physics, 2008 (submitted). Porojnicu, Alina Carmen; Lagunova, Zoya; Robsahm, Trude Eid; Berg, Jens Petter; Dahlback, Arne; Moan, Johan Emilian.
Changes in risk of death from breast cancer with season and latitude : Sun exposure and breast cancer survival in Norway.. Breast Cancer Research and Treatment 2007;102(3):323-328
Porojnicu, Alina Carmen; Robsahm, Trude Eid; Dahlback, Arne; Berg, Jens Petter; Christiani, David; Bruland, Øyvind S; Moan, Johan Emilian. Seasonal and geographical variations in lung cancer prognosis in Norway does Vitamin D from the sun play a role? . Lung Cancer 2007;55(3):263-270
Randall, C.E., Harvey V.L., Manney G.L., Orsolini Y. J., Codrescu M., Sioris C., Brohede S., Haley C., Gordley L.L., Zawodny J.M., and J.M. Russell (2005) III, Stratospheric effects of energetic particle precipitation in 2003-2004, Geophys. Res. Lett., 32, No. 5, L05802, doi:10.1029/2004GL022003.
Robsahm, T.E., Tretli, S., Dahlback, A. and Moan, J.E. (2004) Vitamin D-3 from sunlight may improve the prognosis of breast-, colon- and prostate cancer (Norway). Cancer Causes Control, 2, 149-158
Rodríguez, E., Frioud, M., Gausa, M., Stebel, K., Mogo, S., Prats, N., Torres, B., Toledano, C., Bastidas, A., Berjón, A., Cachorro, V., de Frutos, A.M. (2008), Optical properties of tropospheric aerosols derived from lidar and sun photometer measurements at ALOMAR (69N) in 2005 and 2006. Óptica Pura y aplicada, 42, 183-190.
Steck, T. von Clarmann, H. Fischer, B. Funke, N. Glatthor, U. Grabowski, M. Höpfner, S. Kellmann, M. Kiefer, A. Linden, M. Milz, G. P. Stiller, D. Y. Wang, M. Allaart, Th. Blumenstock, P. von der Gathen, G. Hansen, F. Hase, G. Hochschild,
353
G. Kopp, E. Kyrö, H. Oelhaf, U. Raffalski, A. Redondas Marrero, E. Remsberg, J. Russell III, K. Stebel, W. Steinbrecht, G. Wetzel, M. Yela, G. Zhang, Bias determination and precision validation of ozone profiles from MIPAS-Envisat retrieved with the IMK-IAA processor, Atmos. Chem. Phys., 7, 3639–3662, 2007
Sobolewski, P., J. W. Krzy´scin, J. Jarosławski, and K. Stebel (2008), Measurements of UV radiation on rotating vertical plane at the ALOMAR Observatory (69N, 16E), Norway, June 2007, Atmos. Chem. Phys. Discuss., 8, 21–45.
Svendby, T.M. and Dahlback, A. (2004) Statistical analysis of total ozone measurements in Oslo, Norway, 1978-1998. J. of Geophys. Res.; 109, D16107, doi:10.1029/2004JD004679.
Vandaele, A. C., Fayt, C., Hendrick, F., Hermans, C., Humbled, F., Van Roozendael, M., Gil, M., Navarro, M., Puentedura, O., Yela, M., Braathen, G., Stebel, K., Tørnkvist, K., Johnston, P., Kreher, K., Goutail, F., Mieville, A., Pommereau, J.-P., Khaikine, S., Richter, A., Oetjen, H., Wittrock, F., Bugarski, S., Frieß, U., Pfeilsticker, K., Sinreich, R., Wagner, T., Corlett, G. and Leigh, R. (2005) An intercomparison campaign of ground-based UV-visible measurements of NO2, BrO, and AClO slant columns: Methods of analysis and results for NO2. J. Geophys. Res., 110, D08305, doi:10.1029/2004JD005423.
van der Mei I.A.F., Ponsonby A.-L., Engelsen O., Pasco J.A., McGrath J.J., Eyles D.W., Blizzard L., Dwyer T., Lucas R., Jones G. (2007) The high prevalence of vitamin D insufficiency across Australian populations is only partly explained by season and latitude. Environmental Health Perspectives, Aug:115(8), 1132-39.
Vogler, C., S. Brönnimann, and G. Hansen (2006) Re-evaluation of the 1950-1962 total ozone record from Longyearbyen, Svalbard, Atmos. Chem. Phys., 6, 4763–4773.
Webb, A.R. and O. Engelsen (2006) Calculated Ultraviolet Exposure Levels for a Healthy Vitamin D Status. Photochemistry and Photobiology. 82(6), 1697–1703.
5. PROJECTS AND COLLABORATION
Norwegian institutions and scientists are participating in numerous international and national projects. The following section gives an overview of the most important projects related to ozone and UV research in Norway.
International projects GEOMON Global Earth Observation and Monitoring of the atmosphere (2007-2011) is a European project contributing to GEOSS. Its mission is to build an integrated pan-European atmospheric observing system of greenhouse gases, reactive gases, aerosols, and stratospheric ozone. Ground-based and air-borne data are sustained and analysed, complementary with satellite observations, in order to quantify and understand the ongoing changes of the atmospheric composition. The key objectives of the ozone activities are to continue the monitoring of O3, NO2, BrO, Cly/Fy, T, H2O, aerosol/PSC from ground (NDACC) and space. Further the development of homogenisation and consistency of time series are central and the identification of links between stratospheric ozone and climate changes. Both NILU and the University of Oslo (Dep. of Geosciences) participate in this project. Web-site: http://geomon.ipsl.jussieu.fr/
NDACC: The Network for the Detection of Atmospheric Composition Change (1991-> present) is a set of high-quality remote-sounding research stations for observing and understanding the physical and chemical state of the stratosphere. Ozone and key ozone-related chemical compounds and parameters are targeted for measurement. The NDAAC is a major component of the international middle atmosphere research effort and has been endorsed by national and international scientific agencies, including the International Ozone Commission, the United Nations Environment Programme, and the World Meteorological Organization. Web-site: http://www.ndsc.ncep.noaa.gov/
INTARESE: Integrated assessment of health risks of environmental stressors in Europe (2005-2009) brings together a team of internationally lead scientists in the areas of epidemiology, environmental science and biosciences to collaborate on developing and applying new, integrated approaches to the assessment of environmental health risks and consequences, in support of European policy on environmental health. NILU is responsible for implementation of the human health risk assessment of ultraviolet radiation. Web-site: http://www.intarese.org
SHIVA: Stratospheric ozone: Halogen Impacts in a Varying Atmosphere (2009-2012) aims to reduce uncertainties in present and future stratospheric halogen loading and ozone depletion, resulting from climate feedbacks between emissions and transport of ozone depleting substances
354

(ODS). Of particular relevance will be studies of short and very short-lived substances (VSLS) with climate-sensitive natural emissions. We will perform field studies of ODS production, emission and transport in understudied, but critical, regions of the tropics using ship, aircraft and ground-based instrumentation. We will parameterise potential climate sensitivities of emissions based on inter-dependencies derived from our own field studies, and surveys of ongoing work in this area. Web-site: http://shiva.iup.uni-heidelberg.de
National projects
ARCTIC_LIS Arctic variability and climate change linked to stratosphere (2007-2011) is a NILU-UiO collaboration funded by the Norwegian Research Council. It aims to investigate the impact of climate change on stratospheric ozone chemistry and transport, especially upon the ozone recovery, using a comprehensive, stratospheric chemistry model. It will also carry out exploratory studies on processes, still poorly represented or missing altogether in current chemistry-climate models, and which will be under scrutiny during the International Polar Year: I) the role of solar cycle and solar-terrestrial coupling from energetic particle precipitation (EPP), on the stratospheric ozone and nitrogen chemistry and budget, II) the role of very-short-lived bromine compounds on polar ozone depletion. MERFATE Occurrence and fate of springtime atmospheric deposition of mercury in the Arctic (2007-2010), funded by the Norwegian Research Council. Deposition of mercury (Hg) from the atmosphere to the sensitive polar ecosystems is of particular interest in the Arctic. This is because studies have indicated the possibility of large depositional fluxes of Hg occurring during the polar spring (so-called Hg Atmospheric Depletion Events or AMDEs). UV radiation is one of the main driving factors in these processes and NILU and NTNU pursue further knowledge about this role of UVR. SATLUFT Use of Satellite observations in the national and regional assessment of air quality, the atmospheric ozone layer, ultraviolet radiation, and greenhouse gases (2007-2010). The main objectives of the project are to use Earth Observation data to improve the national and regional monitoring and assessment of the stratospheric ozone layer and surface UV exposure, the air quality in Europe and greenhouse gases. NILU coordinates this project which is funded by the Norwegian Space Centre and the European Space Agency. Web-site: http://www.nilu.no/projects/SatLuft/index.cfm Atmo-TROLL: Atmospheric research and monitoring at Troll – a long-term observational program (2007-2010). This program intends to establish new knowledge on annual and short-term variability as well as long-term changes of climate and pollution parameters. The list of parameters comprises physical, optical and chemical properties of aerosols, ozone and UV, organic and inorganic pollution including Hg, CO and NMHC and surface ozone. The project is coordinated by NILU and funded by The Research Council of Norway. Web-http://observatories.nilu.no/Observatories/Troll/tabid/417/Default.aspx UViversal: Industrial Verification of a Self-calibrating, Accurate and Non-expert ultraviolet (UV) Irradiance Meter (2009-2011). The UViversal verification project will develop a new UV irradiance meter, technology which will allow for better UV and ozone measurements, along with making possible for non-experts to precisely measure and monitor UV irradiance. We will enable UViversal to calibrate itself and alter the internal detectors to a non-silicon based technology which will allow for better ozone measurements at lower solar angles and increase the applicability of the instrument throughout the year in areas further north and south. 6. FUTURE PLANS A short presentation of future plans are summarised below:
NILU has deployed a NILU-UV instrument that is installed at the Norwegian Antarctic Troll Station (71º S). Analysis, further development, and applications of the instrument are planned for the
355

upcoming years. NILU will continue the focus on the ozone and UV monitoring activity, in order to establish a high quality data series which is important both for validation and UV/ozone research
Re-evaluation of Tromsø (since 1994) and Oslo (since 1990) Brewer ozone data series according to better instrument specifications and ozone absorption spectrum, will be conducted during 2011 and reported to the WOUDC in Canada.
NILU will continue the cooperation with CNRS, France, regarding the long-term series of measurements of O3, NO2 and other trace gases, with the newly upgraded SAOZ instrument in Ny-Ålesund.
NILU will continue in participating in the NDACC and UV/vis workgroup. Ny-Ålesund will continue to be included in the UV monitoring programme as long as the financial
situation allows it. NILU already are involved in community medicine activities related to ozone/UV and health and will
continue to establish cooperation with the community medicine institutions 7. NEEDS AND RECOMMENDATIONS
For the past 6 years ozone and UV monitoring in Norway has been suffering from lack of funding. Since 2005 the ozone sondes at Ørlandet and UV observations in Ny-Ålesund have been excluded from the national monitoring programme, but Ny-Ålesund will be included in the programme from 2010, if future funding allows it. The UV-monitoring programme in Norway is a split cooperation between the Norwegian Radiation Protection Authority (NRPA) and NILU, but is funded from different sources. This situation is untenable, as the funding to NRPA is on a long-term basis, and the funding to NILU relies more on short term decisions. Also the LIDAR measurements for ozone profile observations at Andøya are in danger of being excluded due to lack of funding.
In general there is a need for predictable multi-annual funding schedules in order to free operations from additional funding sources. In order to manage surveillance programmes and run instruments properly and continuously, stable long-term economic support is warranted. The trend over the last decade has been that long-term monitoring programmes have been supported through other channels, like satellite validation or other short-term research projects. This is a concern regarding the stability and quality of long-term data sets needed for trend analyses, in particular.
Monitoring of UV radiation and atmospheric ozone is not only a matter of environmental issues. Recommendation of closer international collaboration on UV health risk assessment, UV effects, quality assurance of measurements, databases and forecasting is thus obvious.
356

POLAND In Poland, ozone and UV monitoring and related research activities are conducted by the Institute of Meteorology and Water Management (IMWM), and Institute of Geophysics of the Polish Academy of Sciences (IGFPAS). The ozone and UV-B monitoring and research, carried on in both Institutes, are supported by: Chief Inspectorate for Environmental Protection; National Fund for Environmental Protection and Water Management; Ministry of the Environment. OBSERVATIONAL ACTIVITIES Column measurements of ozone and other gases/variables relevant to ozone loss Institute of Geophysics of the Polish Academy of Sciences IGFPAS has been involved in the long-term monitoring of the ozone layer for almost 50 years. Measurements of the total ozone content and ozone vertical profile by the Umkehr method at Belsk (51°50'N, 20°47'E) by means of the Dobson spectrophotometer No.84 started in 1963, long before the depletion of the ozone layer became great challenge for research community and the policy makers. In 1991 a Brewer spectrophotometer No.64 (single monochromator) with a UV-B monitor was installed .The Brewer spectrophotometer No. 207 (double monochromator) has been put into operation in 2010. The column ozone and ozone content in the Umkehr layers are measured simultaneously by 3 instruments that helps to determine precision of the ozone observations by each spectrophotometer. The surface ozone measurements with Monitor Labs, ML8810 meter started in 1991 (replaced by ML9811 in 2004) and since 1992 NOx measurements have been performed with Monitor Labs ML8841 meter (replaced by API200AV in 2004). The extended duration of the measurements and the high quality of the ozone data were essential for trend detection. Because the high quality of the ozone data is crucial subject in the analysis of the ozone variability the quality control and quality assurance of the ozone measurements is the major concern of the ozone research group. The Belsk ozone data were revaluated in 1983 and 1987 on a reading-by-reading basis, taking into account the calibration history of the instrument. The performance of the Belsk’s ozone instruments has been compared several times with the ground-based reference instruments (during international intercomparisons campaigns) and the satellite spectrophotometers (TOMS, OMI). Institute of Meteorology and Water Management Surface ozone measurements with Monitor Labs. ML9810 are performed at 3 stations: Leba (54.75N, 17.53E) on the Baltic Coast, Jarczew (51.81N, 21.98E) located in the central Poland, Sniezka (50.73N, 15.73E) in Sudety Mountains. Profile measurements of ozone Institute of Geophysics of the Polish Academy of Sciences The ozone content in selected layers in the stratosphere over Belsk (51°50' N, 20°47'E) have been calculated using the Umkehr measurements by the Dobson spectrophotometer (since 1963) and the Brewer spectrophotometers (the Brewer No.64 since 1992 and the Brewer No.207 since 2010). The ozone profiles are derived by UMK92 algorithm applied to the Dobson data. UMK04 algorithm is used both for to the Dobson and Brewer Umkehr data. The Belsk ozone profiles have been used in the validation of ozone profiles derived by Microwave Limb Sounder on board of the Aura satellite. Institute of Meteorology and Water Management The ozone soundings have been performed at Legionowo (52.40N, 20.97E) upper-air station since 1979. Up to May 1993 the OSE ozone sensor with the METEORIT/MARZ radio
357
sounding system was used. Later on the ECC ozone sensor and DigiCora/RS80/92 radio sounding system of Vaisala is in use. The ozone soundings are launched regularly on each Wednesday. Additional ozone soundings were performed for the purpose of the MATCH campaign (statistical evaluation of ozone chemical destruction in Polar Vortex). The Legionowo ozone profiles were also used in the validation procedures of ozone profiles derived from satellite projects: MIPAS, SCIAMACHY and OMI. Legionowo is a complimentary station of the global NDACC/NDSC ozone sounding network. Ozone sounding data from Legionowo are submitted to the NDACC database. Since 1993, on the base of the NOAA/TOVS/ATOVS satellite data, total ozone maps over Poland and surroundings have operationally been performed at the Satellite Remote Sensing Center of IMWM in Krakow. UV measurements Broadband measurements Institute of Meteorology and Water Management Broadband UV Biometers model SL 501 vers. 3 have been used for UV measurements at three IMWM stations in Poland: Leba (54.75N, 17.53E), on the Baltic Coast, Legionowo (52.40N, 20.97E), in central Poland, Zakopane 857m, in Tatra Mountains (49.30N, 19.97E). Since 2006, broadband OPTIX UVEM-6C have been used for nowcasting purposes at six IMWM stations in Poland: Leba (54.75N, 17.53E), Mikolajki (53.78N, 21.58E), in the north-eastern Poland, Legionowo (52.40N, 20.97E), Katowice (50.23N, 19.03E) in the southern Poland, Zakopane 857m, in Tatra Mountains (49.30N, 19.97E), Mount Kasprowy Wierch 1988m (49.23N, 19.98E), in Tatra Mountains. Institute of Geophysics of the Polish Academy of Sciences Systematic measurements of ground level ultraviolet solar radiation (UV-B) with the Robertson- Berger meter were carried out at Belsk station in the period May 1975 – December 1993. In 1992 UV Biometer SL501A (replaced by the same type of the instrument in 1996) , and in 2005 Kipp and Zonen UVS-AE-T broadband radiometer were installed. The instruments have been operated continuously up to now. The UV monitoring has been conducted at the Polish Polar Station at Hornsund, Svalbard (77°00'N, 15°33’) in the period 1996-1997 by UV Biometer SL501A and since spring 2006 up to now by Kipp and Zonen UVS-AE-T. Narrowband filter instruments Two NILU-UV spectral filter instruments, installed at IMWM station Legionowo, measure the UV-B, UV-A, total ozone and cloud transmission. Spectroradiometers Spectral distribution of UV radiation has also been monitored with the Brewer spectrophotometers at Belsk since 1992 (Brewer No.64) and in addition since 2010 (Brewer No.207). The spectra with 0.5 nm resolution for the range 290-325 nm and 286-363 nm have been calculated by the Brewer (No.64) and Brewer (No.207), respectively. Several spectra per hour are usually obtained for the solar zenith angles less than 850. Calibration activities Institute of Meteorology and Water Management The recent calibration of the reference UV Biometer model SL 501 took place in 2008 at PMOD/WRC – EUVC in Davos. The next calibration of the instrument is planned in 2011. The NILU-UV spectral filter instruments are regularly calibrated at NRPA, Norway. Institute of Geophysics of the Polish Academy of Sciences
358
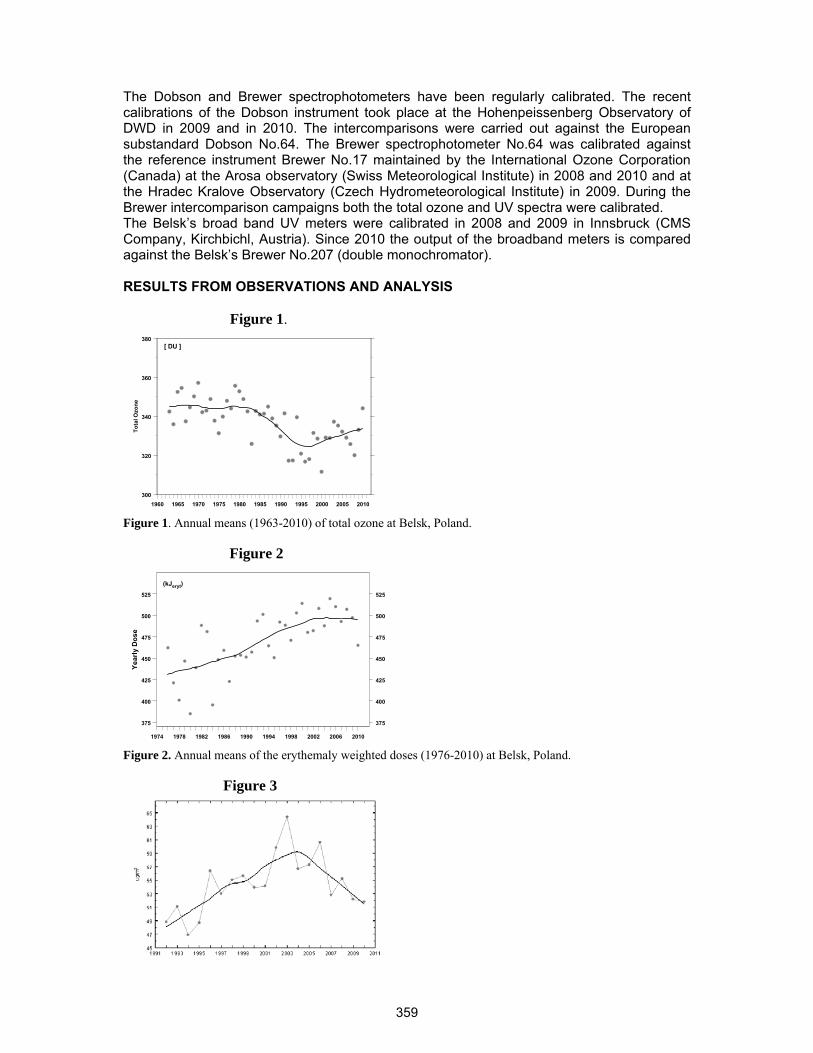
The Dobson and Brewer spectrophotometers have been regularly calibrated. The recent calibrations of the Dobson instrument took place at the Hohenpeissenberg Observatory of DWD in 2009 and in 2010. The intercomparisons were carried out against the European substandard Dobson No.64. The Brewer spectrophotometer No.64 was calibrated against the reference instrument Brewer No.17 maintained by the International Ozone Corporation (Canada) at the Arosa observatory (Swiss Meteorological Institute) in 2008 and 2010 and at the Hradec Kralove Observatory (Czech Hydrometeorological Institute) in 2009. During the Brewer intercomparison campaigns both the total ozone and UV spectra were calibrated. The Belsk’s broad band UV meters were calibrated in 2008 and 2009 in Innsbruck (CMS Company, Kirchbichl, Austria). Since 2010 the output of the broadband meters is compared against the Belsk’s Brewer No.207 (double monochromator). RESULTS FROM OBSERVATIONS AND ANALYSIS Figure 1.
1960 1965 1970 1975 1980 1985 1990 1995 2000 2005 2010300
320
340
360
380
Tota
l Ozo
ne
[ DU ]
Figure 1. Annual means (1963-2010) of total ozone at Belsk, Poland. Figure 2
1974 1978 1982 1986 1990 1994 1998 2002 2006 2010
375
400
425
450
475
500
525
375
400
425
450
475
500
525
Year
ly D
ose
(kJeryt)
Figure 2. Annual means of the erythemaly weighted doses (1976-2010) at Belsk, Poland. Figure 3
359
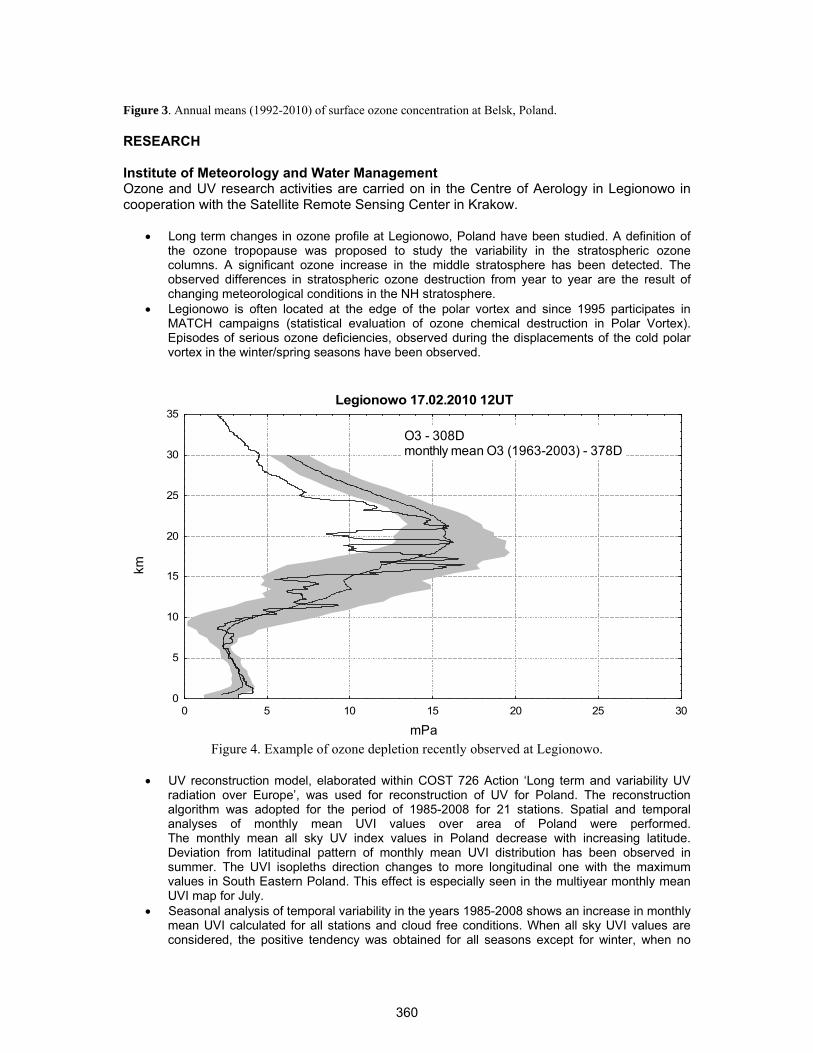
Figure 3. Annual means (1992-2010) of surface ozone concentration at Belsk, Poland. RESEARCH Institute of Meteorology and Water Management Ozone and UV research activities are carried on in the Centre of Aerology in Legionowo in cooperation with the Satellite Remote Sensing Center in Krakow.
• Long term changes in ozone profile at Legionowo, Poland have been studied. A definition of the ozone tropopause was proposed to study the variability in the stratospheric ozone columns. A significant ozone increase in the middle stratosphere has been detected. The observed differences in stratospheric ozone destruction from year to year are the result of changing meteorological conditions in the NH stratosphere.
• Legionowo is often located at the edge of the polar vortex and since 1995 participates in MATCH campaigns (statistical evaluation of ozone chemical destruction in Polar Vortex). Episodes of serious ozone deficiencies, observed during the displacements of the cold polar vortex in the winter/spring seasons have been observed.
Legionowo 17.02.2010 12UT
mPa
km
0 5 10 15 20 25 300
5
10
15
20
25
30
35
O3 - 308Dmonthly mean O3 (1963-2003) - 378D
Figure 4. Example of ozone depletion recently observed at Legionowo.
• UV reconstruction model, elaborated within COST 726 Action ‘Long term and variability UV
radiation over Europe’, was used for reconstruction of UV for Poland. The reconstruction algorithm was adopted for the period of 1985-2008 for 21 stations. Spatial and temporal analyses of monthly mean UVI values over area of Poland were performed. The monthly mean all sky UV index values in Poland decrease with increasing latitude. Deviation from latitudinal pattern of monthly mean UVI distribution has been observed in summer. The UVI isopleths direction changes to more longitudinal one with the maximum values in South Eastern Poland. This effect is especially seen in the multiyear monthly mean UVI map for July.
• Seasonal analysis of temporal variability in the years 1985-2008 shows an increase in monthly mean UVI calculated for all stations and cloud free conditions. When all sky UVI values are considered, the positive tendency was obtained for all seasons except for winter, when no
360

change can be seen. The increase in monthly mean UVI values is especially pronounced in spring and summer.
• Temporal variability of monthly mean UVI depends on the geographical localization as it can be seen in the analysis performed for maritime and mountainous stations. Nevertheless, for both stations the increase in monthly mean UVI has been obtained for spring and summer, what is especially significant for UV radiation biological effects.
• Biologically effective UV radiation (UVBE) for 3 stations of IMWM: Leba, Warsaw and Zakopane was analyzed. Analyses were performed on the basis of reconstructed data series: 17-years (1985-2001) for Leba and 24-years (1985-2008) for Warsaw and Zakopane. In Poland, there are hazards connected with excesses or deficiencies of UV radiation. Biologically effective UV radiation during the summer months may be harmful for human health without any protection. In winter time the UV radiation is not sufficient for natural synthesis of vitamin D3 by humans.
Institute of Geophysics of the Polish Academy of Sciences The ozone time series (from the observations taken at Belsk and from the global ozone data bases) are examined by statistical models developed in IGFPAS to determine factors responsible for the ozone changes. The ozone variability and quantification of the impact of human activities on the ozone layer is essential because of the coupling of the ozone layer and the global climate system. The changes in the ozone layer are examined in connection with changes in the dynamic factors characterizing the atmospheric circulation in the stratosphere. Various studies have been carried out in the Institute focusing on the role played by the dynamical factors of the ozone variability. Natural dynamical processes in the Earth’s atmosphere could perturb the recovery of the ozone layer. To get more comprehensive view of ozone long-term changes over Europe the trends have been calculated using the reconstructed daily total ozone data since January, 1, 1950 for the area 30-80oN and 25oW-35oE. Variability of solar UV radiation over Belsk since 1976 up to now, i.e. based on the world longest series of the erythemal observations, has been analyzed after homogenization of the whole series of the broadband UV measurements. Recent studies on the atmospheric aerosols properties (from sunphotometric measurements at Belsk and Hornsund) are triggered by our previous findings (Krzyścin and Puchalski, 1998, J.Geophys.Res.,vol.103, No. D13, PP. 16,175-16,181, doi:10.1029/98JD00899, Jarosławski and Krzyścin, 2005, J.Geophys.Res.,110, D16201, 9 PP., doi:10.1029/2005JD005951) suggesting that the variability of the aerosol optical characteristics in summer induces changes in the surface UV radiations comparable to those due to total ozone variability. The research achievements since the previous Report (2008) could be summarized as follow:
• introducing the wavelet multi-resolution decomposition in calculation of the trend pattern in UV time series. (Borkowski, 2008)
• developing the methodology to reconstruct the total ozone time series for the periods without the ozone observations based on the meteorological data from the global 3-D reanalyses (NCAR/NOAA) database. (Krzyścin, 2008)
• building of the European total ozone data base comprising the grided (1 deg x 1 deg) daily total ozone data over the region (30-80oN, 25oW-35oE) since January 1, 1950. The statistically significant negative trends are found almost over the whole Europe only in the period 1985–1994. Negative trends up to −3% per decade appeared over small areas in earlier periods when the anthropogenic forcing on the ozone layer was weak . The statistically significant positive trends are found only during warm seasons 1995–2004 over Svalbard archipelago. The reduction of ozone level in 2004 relative to that before the satellite era is not dramatic, i.e., up to ~5% and ~3.5% in the cold and warm subperiod, respectively. Present ozone level is still depleted over many popular resorts in southern Europe and northern Africa. For high latitude regions the statistically significant trend overturning could be inferred in last decade (1995–2004) (Krzyścin and Borkowski, 2008).
361
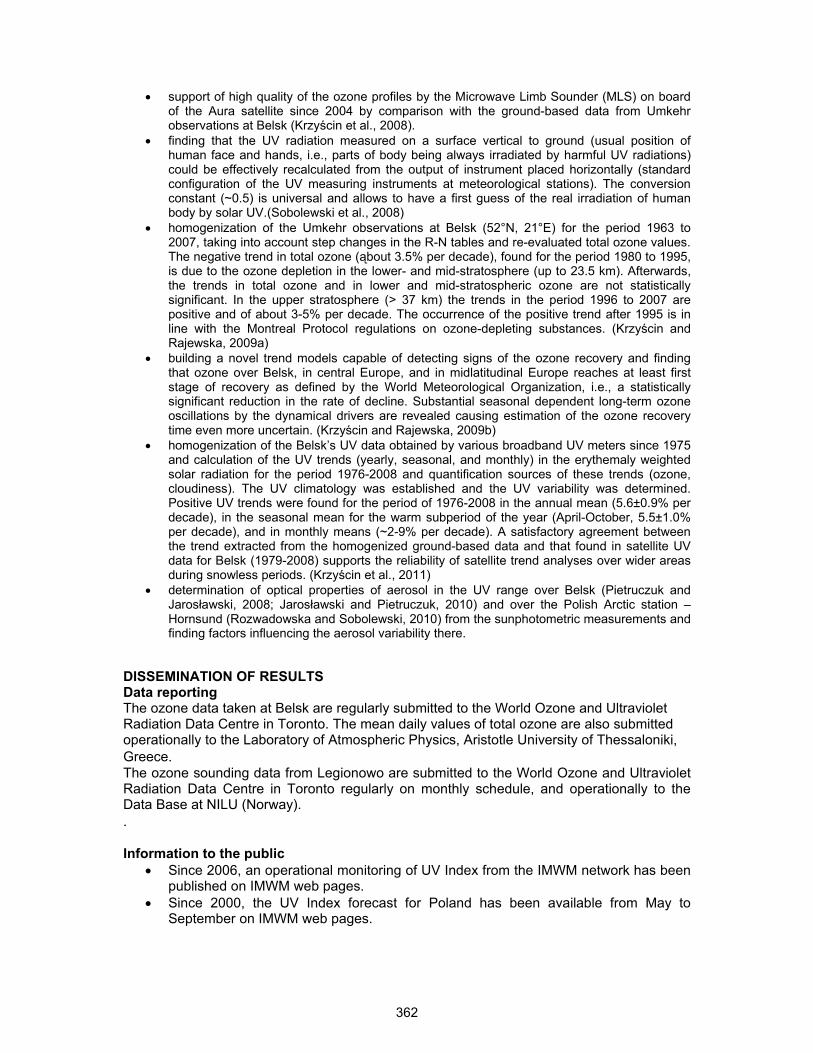
• support of high quality of the ozone profiles by the Microwave Limb Sounder (MLS) on board of the Aura satellite since 2004 by comparison with the ground-based data from Umkehr observations at Belsk (Krzyścin et al., 2008).
• finding that the UV radiation measured on a surface vertical to ground (usual position of human face and hands, i.e., parts of body being always irradiated by harmful UV radiations) could be effectively recalculated from the output of instrument placed horizontally (standard configuration of the UV measuring instruments at meteorological stations). The conversion constant (~0.5) is universal and allows to have a first guess of the real irradiation of human body by solar UV.(Sobolewski et al., 2008)
• homogenization of the Umkehr observations at Belsk (52°N, 21°E) for the period 1963 to 2007, taking into account step changes in the R-N tables and re-evaluated total ozone values. The negative trend in total ozone (ąbout 3.5% per decade), found for the period 1980 to 1995, is due to the ozone depletion in the lower- and mid-stratosphere (up to 23.5 km). Afterwards, the trends in total ozone and in lower and mid-stratospheric ozone are not statistically significant. In the upper stratosphere (> 37 km) the trends in the period 1996 to 2007 are positive and of about 3-5% per decade. The occurrence of the positive trend after 1995 is in line with the Montreal Protocol regulations on ozone-depleting substances. (Krzyścin and Rajewska, 2009a)
• building a novel trend models capable of detecting signs of the ozone recovery and finding that ozone over Belsk, in central Europe, and in midlatitudinal Europe reaches at least first stage of recovery as defined by the World Meteorological Organization, i.e., a statistically significant reduction in the rate of decline. Substantial seasonal dependent long-term ozone oscillations by the dynamical drivers are revealed causing estimation of the ozone recovery time even more uncertain. (Krzyścin and Rajewska, 2009b)
• homogenization of the Belsk’s UV data obtained by various broadband UV meters since 1975 and calculation of the UV trends (yearly, seasonal, and monthly) in the erythemaly weighted solar radiation for the period 1976-2008 and quantification sources of these trends (ozone, cloudiness). The UV climatology was established and the UV variability was determined. Positive UV trends were found for the period of 1976-2008 in the annual mean (5.6±0.9% per decade), in the seasonal mean for the warm subperiod of the year (April-October, 5.5±1.0% per decade), and in monthly means (~2-9% per decade). A satisfactory agreement between the trend extracted from the homogenized ground-based data and that found in satellite UV data for Belsk (1979-2008) supports the reliability of satellite trend analyses over wider areas during snowless periods. (Krzyścin et al., 2011)
• determination of optical properties of aerosol in the UV range over Belsk (Pietruczuk and Jarosławski, 2008; Jarosławski and Pietruczuk, 2010) and over the Polish Arctic station – Hornsund (Rozwadowska and Sobolewski, 2010) from the sunphotometric measurements and finding factors influencing the aerosol variability there.
DISSEMINATION OF RESULTS Data reporting The ozone data taken at Belsk are regularly submitted to the World Ozone and Ultraviolet Radiation Data Centre in Toronto. The mean daily values of total ozone are also submitted operationally to the Laboratory of Atmospheric Physics, Aristotle University of Thessaloniki, Greece. The ozone sounding data from Legionowo are submitted to the World Ozone and Ultraviolet Radiation Data Centre in Toronto regularly on monthly schedule, and operationally to the Data Base at NILU (Norway). . Information to the public
• Since 2006, an operational monitoring of UV Index from the IMWM network has been published on IMWM web pages.
• Since 2000, the UV Index forecast for Poland has been available from May to September on IMWM web pages.
362
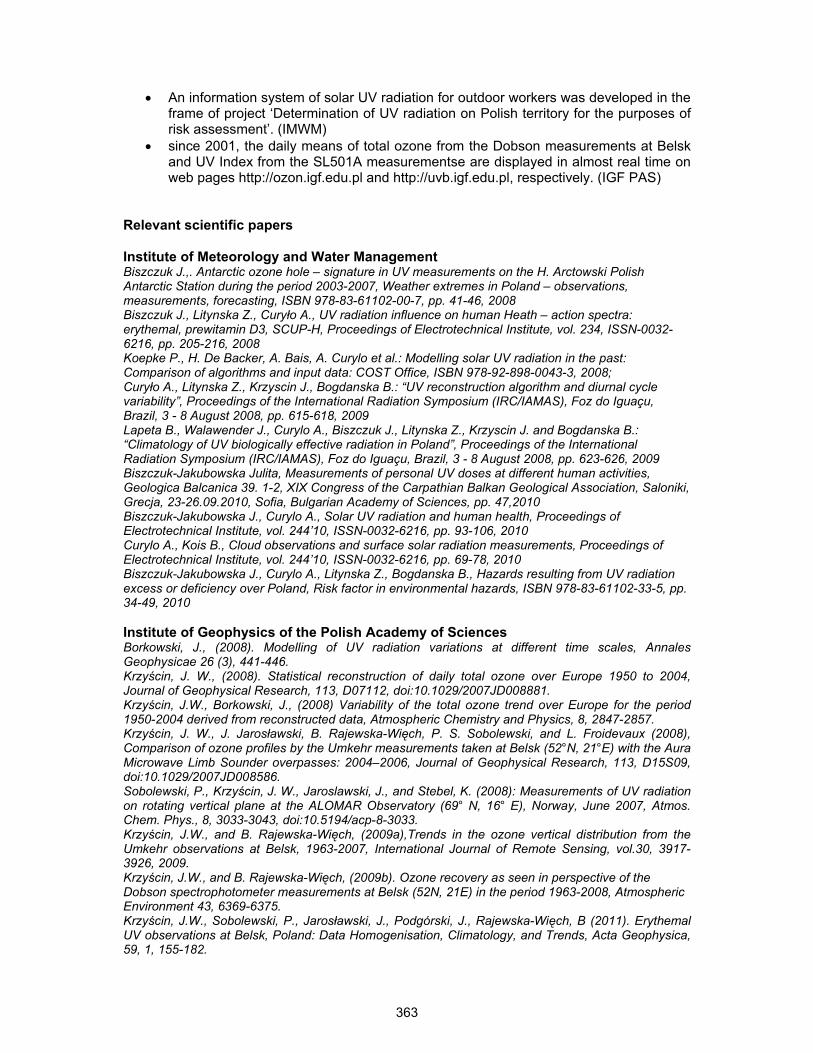
• An information system of solar UV radiation for outdoor workers was developed in the frame of project ‘Determination of UV radiation on Polish territory for the purposes of risk assessment’. (IMWM)
• since 2001, the daily means of total ozone from the Dobson measurements at Belsk and UV Index from the SL501A measurementse are displayed in almost real time on web pages http://ozon.igf.edu.pl and http://uvb.igf.edu.pl, respectively. (IGF PAS)
Relevant scientific papers Institute of Meteorology and Water Management Biszczuk J.,. Antarctic ozone hole – signature in UV measurements on the H. Arctowski Polish Antarctic Station during the period 2003-2007, Weather extremes in Poland – observations, measurements, forecasting, ISBN 978-83-61102-00-7, pp. 41-46, 2008 Biszczuk J., Litynska Z., Curyło A., UV radiation influence on human Heath – action spectra: erythemal, prewitamin D3, SCUP-H, Proceedings of Electrotechnical Institute, vol. 234, ISSN-0032-6216, pp. 205-216, 2008 Koepke P., H. De Backer, A. Bais, A. Curylo et al.: Modelling solar UV radiation in the past: Comparison of algorithms and input data: COST Office, ISBN 978-92-898-0043-3, 2008; Curyło A., Litynska Z., Krzyscin J., Bogdanska B.: “UV reconstruction algorithm and diurnal cycle variability”, Proceedings of the International Radiation Symposium (IRC/IAMAS), Foz do Iguaçu, Brazil, 3 - 8 August 2008, pp. 615-618, 2009 Lapeta B., Walawender J., Curylo A., Biszczuk J., Litynska Z., Krzyscin J. and Bogdanska B.: “Climatology of UV biologically effective radiation in Poland”, Proceedings of the International Radiation Symposium (IRC/IAMAS), Foz do Iguaçu, Brazil, 3 - 8 August 2008, pp. 623-626, 2009 Biszczuk-Jakubowska Julita, Measurements of personal UV doses at different human activities, Geologica Balcanica 39. 1-2, XIX Congress of the Carpathian Balkan Geological Association, Saloniki, Grecja, 23-26.09.2010, Sofia, Bulgarian Academy of Sciences, pp. 47,2010 Biszczuk-Jakubowska J., Curylo A., Solar UV radiation and human health, Proceedings of Electrotechnical Institute, vol. 244’10, ISSN-0032-6216, pp. 93-106, 2010 Curylo A., Kois B., Cloud observations and surface solar radiation measurements, Proceedings of Electrotechnical Institute, vol. 244’10, ISSN-0032-6216, pp. 69-78, 2010 Biszczuk-Jakubowska J., Curylo A., Litynska Z., Bogdanska B., Hazards resulting from UV radiation excess or deficiency over Poland, Risk factor in environmental hazards, ISBN 978-83-61102-33-5, pp. 34-49, 2010 Institute of Geophysics of the Polish Academy of Sciences Borkowski, J., (2008). Modelling of UV radiation variations at different time scales, Annales Geophysicae 26 (3), 441-446. Krzyścin, J. W., (2008). Statistical reconstruction of daily total ozone over Europe 1950 to 2004, Journal of Geophysical Research, 113, D07112, doi:10.1029/2007JD008881. Krzyścin, J.W., Borkowski, J., (2008) Variability of the total ozone trend over Europe for the period 1950-2004 derived from reconstructed data, Atmospheric Chemistry and Physics, 8, 2847-2857. Krzyścin, J. W., J. Jarosławski, B. Rajewska-Więch, P. S. Sobolewski, and L. Froidevaux (2008), Comparison of ozone profiles by the Umkehr measurements taken at Belsk (52°N, 21°E) with the Aura Microwave Limb Sounder overpasses: 2004–2006, Journal of Geophysical Research, 113, D15S09, doi:10.1029/2007JD008586. Sobolewski, P., Krzyścin, J. W., Jaroslawski, J., and Stebel, K. (2008): Measurements of UV radiation on rotating vertical plane at the ALOMAR Observatory (69° N, 16° E), Norway, June 2007, Atmos. Chem. Phys., 8, 3033-3043, doi:10.5194/acp-8-3033. Krzyścin, J.W., and B. Rajewska-Więch, (2009a),Trends in the ozone vertical distribution from the Umkehr observations at Belsk, 1963-2007, International Journal of Remote Sensing, vol.30, 3917-3926, 2009. Krzyścin, J.W., and B. Rajewska-Więch, (2009b). Ozone recovery as seen in perspective of the Dobson spectrophotometer measurements at Belsk (52N, 21E) in the period 1963-2008, Atmospheric Environment 43, 6369-6375. Krzyścin, J.W., Sobolewski, P., Jarosławski, J., Podgórski, J., Rajewska-Więch, B (2011). Erythemal UV observations at Belsk, Poland: Data Homogenisation, Climatology, and Trends, Acta Geophysica, 59, 1, 155-182.
363
Pietruczuk, A., and Jarosławski, J (2008). An alternative method for aerosol optical thickness retrieval in the UV range, A. Pietruczuk i J. Jarosławski, Journal of Atmospheric and Solar-Terrestrial Physics, 70, 973-979. Jarosławski, J., and Pietruczuk A., (2010), On the origin of seasonal variation of aerosol optical thickness in the UV range over Belsk, Poland, Acta Geophysica, 58,6, 1134-1146 Rozwadowska, A., Sobolewski, P. (2010) , Variability in aerosol optical properties at Hornsund, Spitsbergen, Oceanologia, 2010, No. 52 (4), s. 599-620. Rieder, H,E., Holawe, F., Simic, S., Blumthaler, M., Krzyścin, JW, Wagner, J.E., Schmalwieser, A,W., and Weihs, P. (2008) Reconstruction of erythemal UV-doses for two stations in Austria: a comparison between alpine and urban regions: Atmospheric Chemistry and Physics, 8, 6309-6323, Rajewska-Więch B., Krzyścin J., (2010), Changes in total column ozone at Belsk in perspective of ozone changes over Europe 1963-2008 (in Polish), Przegląd Geofizyczny, Z. 1-2, s. 49-59 PROJECTS AND COLLABORATION • Institute of Meteorology and Water Management have participated in projects: - 2004-2009: COST 726 Action ‘Long term and variability UV radiation over Europe’ - 2008-2010: ‘Determination of UV radiation on Polish territory for the purposes of risk
assessment’, coordinated by Central Institute for Labour Protection - National Research Institute, funded by National Center for Research and Development.
• Institute of Geophysics of the Polish Academy of Sciences - 2004-2009 COST 726 Action ‘Long term and variability UV radiation over Europe’ - 2006-2008 Ministry of Science and Higher Education grant No. N307 005 31/0495 –
“Variability of the biologically active solar UV radiation in the mid- and high–latitudes in different time scales”
- 2007-2008 ALOMAR eARI (contract number RITA-CT -2003-506208) under the European Community’s 6th Framework Programme – “Reconstruction of the biologically active UV-radiation reaching the Earth surface using results of standard meteorological measurements and output of the broadband meters”
FUTURE PLANS Continuation of the current monitoring and research and: • An e-atlas containing spatial and temporal distribution of UV radiation over Poland will be
prepared using the reconstructed data. (IMWM ) • gaining a more robust picture of the ozone global changes examining output of all
available trend models used in recent few years (IGF PAS) • quantification of the impact the Montreal Protocol on the levels of ozone by a novel
trend model that searches for a residual trend component that remains in the ozone series after subtracting the ozone signal related to long-term changes in the concentration of the ozone depleting substances in the stratosphere (IGF PAS)
• construction a retrieval algorithm applicable to the Umkehr profiles for the Dobson and Brewer spectrophotometers that allows statistical analyses of the aggregated time series comprising the Dobson and Brewer ozone profiles (IGF PAS)
NEEDS AND RECOMMENDATIONS IMWM and IGF PAS recommend closer international collaboration on UV radiation to find a proper balance between the risk (carcinogen effects) and the benefit (synthesis of vitamin D in skin) of the solar exposure. Ozone dial lidar would make possible the extension of the IGF PAS monitoring of the troposphere and lower stratosphere ozone with a special emphasis on the ozone changes in the tropopause region.
364

REPUBLIC OF KAZAKHSTAN THE ABSTRACT The report 73 with., 38 fig., 7 tab., 74 sources of the literature ОZONE DEPLETION SUBSTANCES, THE OZONE LAYER, TROPOSPHERIC OZONE, GROUND OZONE, THE MONTREAL REPORT, THE VIENNESE CONVENTION, THE KIOTSKY REPORT, THE INDIRECT GREEN HOUSE EFFECT, THE DIRECT GREEN HOUSE EFFECT, CARBON DIOXIDE, ODSs and CFC substitutes, BROMIC METHYL, SUBSTANCES OF THE APPENDIX C. Object of research are - a quantitative estimation of direct and indirect emissions (green house and ozone depletion influences) ozone depletion substances (ОDS) within the limits of obligations Republic of Kazakhstan (RK) under the Montreal report at a transition stage to alternative substances. The work purpose – Studying of time dynamics of the general maintenance of ozone over Kazakhstan to estimate taking place tendencies. Whenever possible to specify their origin • To Reveal aerosynoptic conditions at which extreme concentration of the general ozone take place. • To state an influence estimation ozone depletion, consumed in Kazakhstan, on an ozone layer and on a climate. To estimate share HFC in total amount consumed , ODSs and CFC substitutes in Republic. • The Analysis of measures undertaken by the developed countries on reduction of emissions ozone depletion substances in various branches of economic activities. • The Estimation of the undertaken efforts of directing bodies РК on reduction of emissions in atmosphere ODSs, and an estimation of consequences. In the course of work researches of influence ODSs, on an ozone layer, communications ODSs with climate change, dynamics of emissions ODSs were conducted, a quantitative estimation of a hotbed effect and ozone depletion influences during 1998-2008, the forecast of consumption for the period till 2015 is given. As a result of the executed researches level of direct and indirect emissions ODSs, in СО2 – an equivalent and its dynamics to 2008г is estimated., the forecast of consumption ODSs till 2015 in connection with transition to alternative sources is given. It is shown that despite consumption growth hydrofluorocarbons in Republic Kazakhstan direct and indirect influence on atmosphere tends to decrease. Dynamics of the general maintenance of ozone, tropospheric and ground ozone are studied. aerosynoptic conditions of formation of their extreme concentration. Results of research promote the decision of following problems: - To quantitative and qualitative acknowledgement of success of performance of the obligations accepted by Republic Kazakhstan according to the Montreal report; - To preparation of national reports of Republic Kazakhstan under the Montreal report and the Viennese convention; - Our knowledge in the field of geoecology of formation and dynamics of ozone is expanded.
365
THE MAINTENANCE THE LIST OF REDUCTIONS, SYMBOLS, UNITS AND TERMS SYMBOLS AND UNITS OF PHYSICAL SIZES INTRODUCTION 1. OZONE IN ATMOSPHERE 1.1 Physicists of formation of ozone 1.2. An annual course of the general maintenance of ozone. 1.3. Tropospheric ozone 1.4 Ground ozone 1.4.1 Annual course of ground ozone 1.4.2. A daily course of ground ozone 1.4.3. A daily course of ground ozone in Almaty 1.5. Long-term fluctuations of ozone. 1.6. Aerosynoptic conditions at which extreme concentration of ground ozone are formed 1.7 Dynamics and internal structure of monthly sizes of the general maintenance of ozone over Kazakhstan 1.7.1. Types of fields of distribution general maintenents of ozone (GMО ) over Kazakhstan 1.7.2. Synoptic conditions of formation of extreme sizes GMО 1.8. Tendencies of change GMО over Kazakhstan 1.9. Half Spheric models for transboundary carrying over of the polluting substances, some results for Kazakhstan on ground ozone. 2. THE ESTIMATION OF CONSUMPTION ODSs, IN KAZAKHSTAN ON ECONOMY SECTORS IN 2009 AND THE SCENARIO FOR THE NEXT YEARS 2.1 Dynamics of quantity consumed ozone depletion substances in Kazakhstan 2.1.1 Consumption level ODSs, in 2009 2.1.2 Consumption ODSs on categories. 2.1.3. Influence on climate ODSs, 2.2. Consumption of substances of group HFC on sectors 2.3.1 Uncertainty 3. THE ANALYSIS OF MEASURES UNDERTAKEN BY THE DEVELOPED COUNTRIES ON REDUCTION OF EMISSIONS OZONE DEPLETION SUBSTANCES IN VARIOUS BRANCHES OF ECONOMIC ACTIVITIES 3.1. The general condition of a question. 3.2. The measures undertaken by the developed countries for reduction of emissions and reduction of consumption ODSs, 3.3. An estimation of the undertaken efforts of directing bodies RК on reduction of emissions in atmosphere ODSs, 3.3.1. The national legislation, the administrative and legal measures, concerning ozone layer protection. 3.3.2. Data presentation in Secretary on ozone. 3.4. Necessary actions for maintenance of the program of the Government. THE LIST OF THE USED SOURCES Appendices
366
THE LIST OF REDUCTIONS, SYMBOLS, UNITS AND TERMS Reductions BrМ Bromic methyl Gross national product The Total internal product ICLLC Influence on a climate during life cycle HCFC hydrochlorofluorocarbon HFC Hydrofluorocarbon HS The Harmonized system GТRЭEE Group under the technical review and an economic estimation HCFCГХФУ Hydrochlorftorcarbon GEF Global ecological fund HFC hydroftorcarbon Кт Kilotons EFFICIENCY Efficiency MB Metilbromid Мт Metric tons МОPE The Ministry of preservation of the environment МCF Metilchloroform MR The Montreal report UN The United Nations UP Usual practice ODSs Ozone depletion of substances ODP Ozone depletion power PS polluting substances GMО The General maintenance of ozone GH Green house gases PGW Potential of global warming PD UN The Program of development of the United Nations RК Republic Kazakhstan RI Radiating influence SC The Stationary air conditioning COEUТЕE The Commission of experts under the technical review and an economic estimation ТCМ Tetrahclormetan HC Hydrocarbon CFC Chlorftorcarbon FCC Four-chloride carbon UNPPE The United Nations Program on preservation of the environment
367
SYMBOLS AND UNITS OF PHYSICAL SIZES Т.ODP Tons ODP Ozone depletion power 0С Celsius degree Thousand tons One thousand tons B. Tenge Billion tenge Chemical formulas About Atom of oxygen О2 An oxygen molecule CO carbon oxide СО2 Carbon dioxide CH4 Methane N2O Nitrous oxide
368
INTRODUCTION About 40 years ago it was revealed that hydrochlorftorcarbons, used in the industry, especially intensively – in refrigerating branch, destroy an ozone layer of the Earth. The intensive scientific researches which have begun in those years in the field of atmospheric chemistry have allowed to reveal at once some types of the chemical reactions leading to destruction of an ozone layer. As it is known, the basic quantity of ozone is at heights of 22 km or a little above [9, 31, 34]. Hydrochlorftorcarbons, having, as a rule, long term of a life, rise in an upper atmosphere and enter reaction with ozone, destroying it. Thus hydrochlorftorcarbons. do not collapse almost that has led to their fast enough accumulation in atmosphere and to acceleration of process of destruction of ozone [15, 16, 22, 23]. Ozone absorbs a considerable part of ultra-violet radiation of the Sun, protecting, thus, all live on the Earth, and simultaneously heating up corresponding layers of a stratosphere, i.e. an atmosphere part. Destruction of atmospheric ozone by hydrochlorftorcarbons, hence, conducts to cooling influence on atmosphere. However hydrochlorftorcarbons have own strips of absorption in an infra-red range of a spectrum and are, therefore hotbed gases. The majority of hydrochlorftorcarbons have on atmosphere double influence: destroying an ozone layer, cool it, but absorbing leaving long-wave radiation of the Earth and atmosphere, heat up it. The second effect – heating of atmosphere is much stronger, than cooling [20, 29]. Ozone layer destruction is extremely serious problem for mankind. Therefore a number of the international agreements on curtailment of production and uses especially aggressive hydrochlorftorcarbons and to replacement search by other substances (this question has been considered at the first stage of performance of a theme) has been accepted. In connection with the above-stated in the given work dynamics of the general, tropospheric and ground ozone is comprehensively considered, aerosynoptic conditions of formation of extrema of their concentration are studied. Time dynamics of concentration GMО is studied and bases for working out of corresponding methods of forecasting are put. For this purpose mathematical models ЕМЕР of the centres the West and the East have been studied also and the binding of results to the Kazakhstan data is carried out. The Viennese convention on protection of an ozone layer of 1985 was the first international document putting a problem of preservation of an ozone layer of the Earth. This document, inherently, had declarative character. The states which have signed him did not incur any obligations; contours of a universal problem which followed as soon as possible have been only outlined solve. However has passed hardly more than two years, and in 1987 the international community has accepted much more rigid document which has received the name the Montreal report on substances, destroying an ozone layer. According to its positions, the basic originators of destruction of an ozone layer by atoms of chlorine or bromine which have separated from molecules of the chemical compounds synthesised by the person [15, 16, 19, 22, 23] appeared. The basic fault was taken away by hydrochlorftorcarbons, used as sprays in aerosols, and to coolants, including well-known R12 by which the overwhelming majority of refrigerators and conditioners in those days has been filled. Despite protests of not numerous groups of the authoritative scientists specifying in insufficient scientific validity of positions of the forthcoming contract, the Montreal report has been accepted, and the group of the chemists which have prepared scientific base under this interdiction, has been awarded the Nobel Prize [29, 32, 33]. Till now some researchers express the big doubts concerning expediency of acceptance of an interdiction hydrochlorftorcarbons. The most rigid critics declare the report the grandiose swindle initiated by group of chemical concerns, on purpose to monopolise the market and to supersede national manufacturers, more moderate - speak about argumentativeness of some positions and call for updating of the report taking into account time.
369
Kazakhstan ratified the Viennese convention on protection of an ozone layer and the base Montreal report on the substances destroying an ozone layer [15]. The general obligations of the parties of these international nature protection agreements consist in the following. The parties of the Viennese convention undertake to protect health of the person and environment from the influences connected with an exhaustion of an ozone layer. The Montreal report to the convention contains schedules of stage-by-stage decrease in manufacture and consumption, the most important in the ecological and commercial relation ozone depletion substances (ОDSs), measures of regulation of their manufacture, export and import [15, 16, 18, 30]. The Report parties found commissions of experts by scientific, ecological and technical and economic estimations. In process of receipt of the new information from these groups about influences on an ozone layer, the world network of supervision based on the data behind the ozone maintenance in atmosphere and its chemical compound, researches of properties ОРВ and occurrence of alternative substances and technologies, the Parties included in it new substances and strengthened requirements of the Report by acceptance of additions and amendments (London, 1990, Copenhagen, 1992, Montreal, 1997, Beijing, 1999). In spite of the fact that after introduction of amendments and toughening of schedules of deducing from the reference of adjustable substances the Montreal report has taken very difficult form, it is recognised by most successful of nature protection international agreements. Thanks to the measures of regulation installed by its parties by 2000 world production ozone depletion substances, already it was reduced more than on 85 % in comparison with level of 1986 almost all countries of the world ratified the Montreal report that speaks about importance of participation in this agreement. Now 27 countries-parties of the Montreal report including Kazakhstan, are carried to the countries with transitive economy. Process of transition of economy to the market relations, carried out by these countries, causes serious difficulties in performance of their obligations under the Montreal report and ratification of amendments to it. Difficulties consist, basically, in absence in these countries of financing for realisation of projects on reduction of consumption ODSs, a lack of the prepared shots and the information in the field of technical alternatives ODSs институциональных and language barriers. The control over performance of the Montreal report is in conducting UNPE (United Nations Programs on environment). UNPE supports work of Ozone Secretary which (Kenya) is in Nairobi, is executive agency of the financial mechanism of the Montreal report - Multilateral Fund and Global Ecological Fund [15, 16, 19]. For today the total sum of the financial help on realisation of actions for reduction ODSs, rendered to the countries with transitive economy Global Ecological Fund, comes nearer to 200 million US dollars. Kazakhstan as the country which has joined the Montreal report and other agreements both on protection of an ozone layer and to the Kioto report on measures directed on reduction of emissions of hotbed gases, keeps account consumption hydrochlorftorcarbons in the country and tries to predict such consumption, and also to estimate size of a hotbed effect at the expense of emissions hydrochlorftorcarbons [16, 35-38]. Particularly at the third stage following problems have been put: 1) Studying of time dynamics of the general maintenance of ozone over Kazakhstan, an estimation of its tendencies and an origin; 2) To Reveal aerosynoptic conditions at which extreme concentration of the general and ground ozone take place; 3) To state an influence estimation хладонов, consumed in Kazakhstan on an ozone layer and on a climate. To estimate длю ГФУ in total amount consumed хладонов in Republic 4) To make the analysis of measures undertaken by the developed countries on reduction of emissions ozone depletion substances in various branches of economic activities.
370

The decision of the problems set forth above, according to the Technical specification on theme performance (Appendix A) also is the maintenance of the given Report. Tasks in view are completely executed, and results are presented in the given report. 1. OZONE IN ATMOSPHERE 1.2. An annual course of the general maintenance of ozone. The annual course of the general maintenance of ozone at stations of Kazakhstan where it is measured, is very simple and presented on fig. 1. Mans average sizes GMО for the same stations are resulted in table 1.
280
300
320
340
360
380
400
420
январь февраль март апрель май июнь июль август сентябрь октябрь ноябрь декабрьТ, мес
ОСО
(матм
-см
)
Алма-Ата,ОГМСАтырауАральское МореКарагандаСемипалатинск
Fig. 1 Annual course of the general maintenance of ozone at stations of Kazakhstan from 1973 for 2006 It is possible to see that annual course GMО is very simple and similar at all stations of Kazakhstan. It has one maximum in March and a minimum in September. However, in separate years the maximum can move for February, and a minimum for October. In an annual course it is well looked through following dependence: the to the south the station, the is less GMО in a maximum and as a whole within almost all year except for the minimum period. On this time site of size GMО are very close also dependence on width it is broken. The station Semipalatinsk though is located a little to the south of Karaganda, but it is considerably shifted to the east where the local maximum of ozone [30] takes place. In a maximum average sizes GMО change from 395 ODSs for Semipalatinsk to 373 ODSs for Almaty. In a minimum the range of change is less: from 309 ODSs for Atyrau in October to 294 ODSs for Almaty in September. Thus, the amplitude of annual course GMО makes 75-80, i.e. 30-35 % from an average for a year.
371

Table 1 Long-term average monthly values GMО (ODSs)
Months МS I II III IV V VI VII VIII IX X XI XII
Alma-Ata 351 372 373 353 343 328 308 297 294 299 310 329Атyrau 364 388 388 372 366 349 325 316 311 309 313 330Aral sea 357 381 384 364 361 344 322 315 306 305 304 326Karaganda 364 390 387 372 370 351 335 321 309 305 309 333Semipalatinsk 368 389 395 378 372 356 338 330 315 306 312 331AVERAGE 361 384 385 368 362 346 325 316 307 305 310 330 Against enough simple as it is told above, annual course GMО, characteristic Kazakhstan for all stations, most poorly this minimum is looked through on a curve of course GMО for Almaty. Thus, an annual course and features of spatial distribution GMО over territory of Kazakhstan as a whole correspond to the theory and results of researches of ozone [37, 39, 40, etc.]. 1.3. Tropospheric ozone As tropospheric ozone appears as a result of "infiltration" of stratospheric ozone through тропопаузу it is natural to expect that its annual course will be definitely caused by a course of stratospheric ozone. And stratospheric ozone, or the general maintenance of ozone (GMО), has the expressed simple annual course with one maximum and one minimum. The maximum takes place in the end of winter or in the beginning of spring. In a zone 45-50n.b. It is necessary on the beginning of April. The maximum at all widths of a moderate strip is distinct. Minimum GMО on the contrary flat also "is smeared". It can come in September-October (about 50 % of stations of Northern hemisphere) either in November-December or in August, i.e. the period from August till November of size GMО are insignificant and can change from a month by a month. Amplitudes of annual course of GMО in the north exceed of 200 Dobson units, and in moderate widths – 100 ODSs. In table 2 the annual course of size of tropospheric ozone over Kazakhstan in terms of Dobson u. on the basis of satellite measurements during 2005 [25] is presented. For simplification of the analysis in the table the data about tropospheric ozone in adjacent territories for the same year is cited. Table 2. Average sizes of tropospheric ozone at stations of Kazakhstan (D.units).
Months Станции I II III IV V VI VII VIII IX X XI XII The
Sum
Compare stations
year Alma-Ata 15 20 20 30 25 35 50 40 33 20 20 20 328 27,3 Атyrau 27 30 28 24 30 28 35 30 23 20 20 30 326 27,1 Aral sea 26 35 30 22 25 30 40 36 25 22 25 20 336 28,0 Karaganda 17 26 25 24 22 32 40 36 23 20 20 20 305 25,4 Semip-sk 15 28 23 20 30 35 43 30 22 20 17 17 300 25,0 Kazakhstan 20 28 25 24 26 32 42 34 25 20 22 20 1595 26,6 It is possible that in general an annual course of tropospheric ozone to see much more difficult, than annual course GMО. The basic maximum of tropospheric ozone in territory of Kazakhstan
372
is necessary for July. This maximum is well expressed in Republic territory though at some stations of adjoining territory it takes place in August or June (Chardzhou, Dushanbe, etc.). The maximum in a time course there is more stretched in time. However, in an annual course of tropospheric ozone unlike GMО is available two minima and two maxima. The second, or the secondary maximum is observed in February, and at some stations of adjoining territories, in March. Accordingly, the secondary minimum takes place in April-May. Both the secondary maximum, and a secondary minimum are expressed accurately and short in time. It is obvious that the secondary maximum in February-March and the basic minimum in September-November coincides with extrema during stratospheric ozone. As to the basic maximum of tropospheric ozone in July it is caused active thermal конвекцией in this season and destruction of tropopauze over the south of Kazakhstan in summertime [30] that facilitates receipt in troposphere of atmospheric ozone. The basic minimum of tropospheric ozone is observed simultaneously with minimum GMО in atmosphere and, probably, is its consequence. As to a secondary maximum of tropospheric ozone in February (sometimes in March) it coincides on time in due course approaches of maximum GMО. And this factor explains its existence. The approach explanation, however, a secondary minimum of tropospheric ozone in April-May demands additional researches. Probably it is result of strengthening an meridional exchange in which result on territory of Kazakhstan air of tropical widths arrives, poor ozone, and the mechanisms providing receipt of ozone from a stratosphere, are still insufficiently effective at this time. They amplify only by July. Thus, in an annual course of tropospheric ozone two maxima and two minima take place. The basic maximum takes place in July, and it is caused intensive turbulent and by convection an exchange on a vertical, and also easing тропопаузы, as detaining layer, by this time. The secondary maximum in February-March coincides on time with minimum GMО and, probably, by it is caused. And maximum of GMО comes in connection with activization of the general circulation of atmosphere and carrying out in system of hollows of the cold air rich with ozone from high widths. The basic minimum of tropospheric ozone is caused by a minimum of stratospheric ozone which comes during the period from September till November. The secondary minimum in April-May is caused by change of carrying out of the cold air weights rich with ozone, from high widths, on carrying out of warm air weights from the south, poor ozone. The annual course of tropospheric ozone appreciably defines a course of concentration of ground ozone. 1.4 Ground ozone (GO ) 1.4.1 Annual course of ground ozone The basic drain of atmospheric ozone, as it is known, are a ground layer and an earth surface where it filters. Therefore the quantity of ground ozone is defined on the one hand by its infiltration from an upper atmosphere (from a stratosphere), and with another – speed of its destruction in a ground layer and at the earth. The best conditions for ozone receipt in a ground layer are such when are developed convection, turbulence, and also the ordered movings of air on a vertical. Such conditions are created during the spring-and-summer period. In the winter for the majority of regions of Kazakhstan, except absence of conditions for intensive convection and turbulence presence of ground inversions or izostratas, interfering ozone receipt in a ground layer is characteristic. It causes in an annual course of ground ozone a maximum during the summer period and a minimum – during the winter period, May and December-January accordingly. Thus the amplitude of its annual course is great: From 0,01 mkg/m3 in the winter to 0,16 mkg/m3 in the summer, i.e. summer average concentration exceed winter at 10-15 time. On fig. 2 the annual course of ground ozone is presented to Almaty for the three-year period.
373
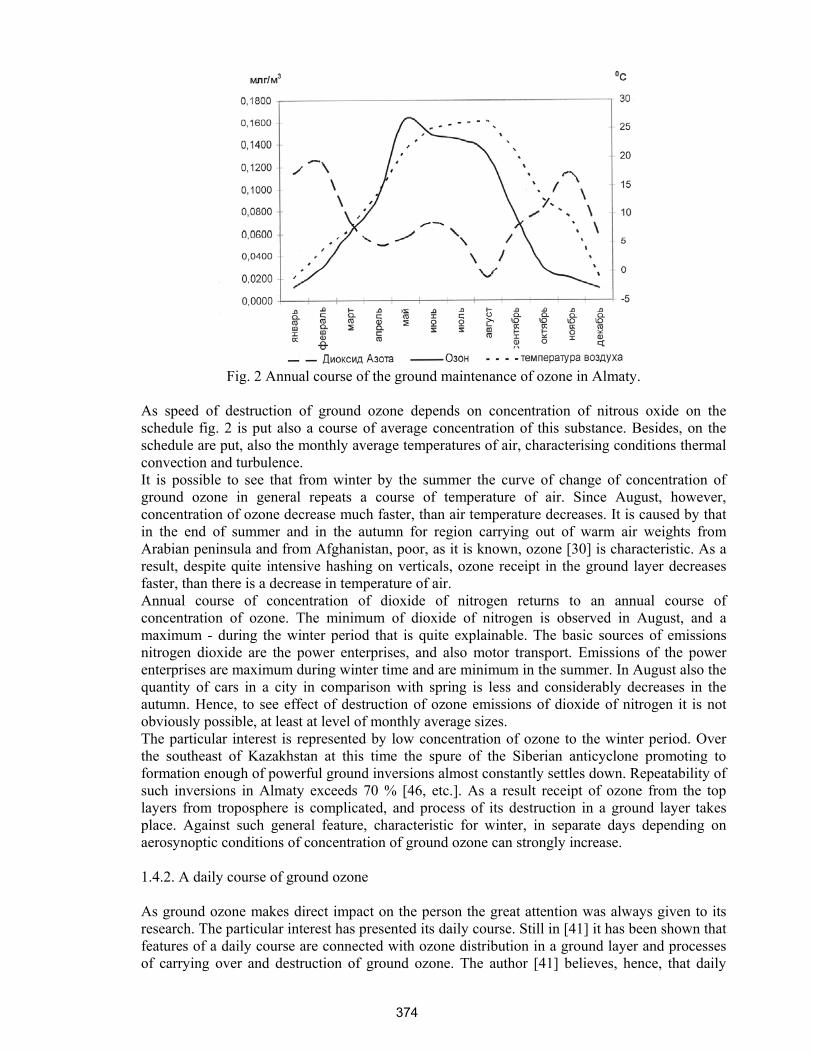
Fig. 2 Annual course of the ground maintenance of ozone in Almaty.
As speed of destruction of ground ozone depends on concentration of nitrous oxide on the schedule fig. 2 is put also a course of average concentration of this substance. Besides, on the schedule are put, also the monthly average temperatures of air, characterising conditions thermal convection and turbulence. It is possible to see that from winter by the summer the curve of change of concentration of ground ozone in general repeats a course of temperature of air. Since August, however, concentration of ozone decrease much faster, than air temperature decreases. It is caused by that in the end of summer and in the autumn for region carrying out of warm air weights from Arabian peninsula and from Afghanistan, poor, as it is known, ozone [30] is characteristic. As a result, despite quite intensive hashing on verticals, ozone receipt in the ground layer decreases faster, than there is a decrease in temperature of air. Annual course of concentration of dioxide of nitrogen returns to an annual course of concentration of ozone. The minimum of dioxide of nitrogen is observed in August, and a maximum - during the winter period that is quite explainable. The basic sources of emissions nitrogen dioxide are the power enterprises, and also motor transport. Emissions of the power enterprises are maximum during winter time and are minimum in the summer. In August also the quantity of cars in a city in comparison with spring is less and considerably decreases in the autumn. Hence, to see effect of destruction of ozone emissions of dioxide of nitrogen it is not obviously possible, at least at level of monthly average sizes. The particular interest is represented by low concentration of ozone to the winter period. Over the southeast of Kazakhstan at this time the spure of the Siberian anticyclone promoting to formation enough of powerful ground inversions almost constantly settles down. Repeatability of such inversions in Almaty exceeds 70 % [46, etc.]. As a result receipt of ozone from the top layers from troposphere is complicated, and process of its destruction in a ground layer takes place. Against such general feature, characteristic for winter, in separate days depending on aerosynoptic conditions of concentration of ground ozone can strongly increase. 1.4.2. A daily course of ground ozone As ground ozone makes direct impact on the person the great attention was always given to its research. The particular interest has presented its daily course. Still in [41] it has been shown that features of a daily course are connected with ozone distribution in a ground layer and processes of carrying over and destruction of ground ozone. The author [41] believes, hence, that daily
374
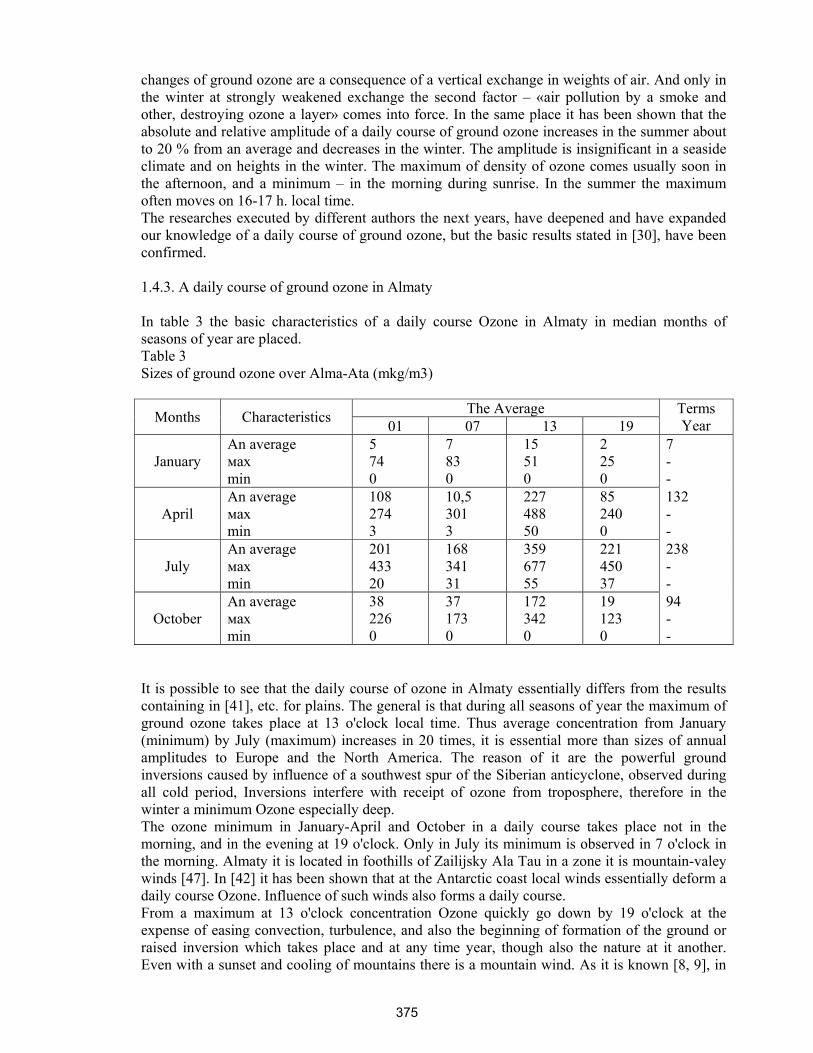
changes of ground ozone are a consequence of a vertical exchange in weights of air. And only in the winter at strongly weakened exchange the second factor – «air pollution by a smoke and other, destroying ozone a layer» comes into force. In the same place it has been shown that the absolute and relative amplitude of a daily course of ground ozone increases in the summer about to 20 % from an average and decreases in the winter. The amplitude is insignificant in a seaside climate and on heights in the winter. The maximum of density of ozone comes usually soon in the afternoon, and a minimum – in the morning during sunrise. In the summer the maximum often moves on 16-17 h. local time. The researches executed by different authors the next years, have deepened and have expanded our knowledge of a daily course of ground ozone, but the basic results stated in [30], have been confirmed. 1.4.3. A daily course of ground ozone in Almaty In table 3 the basic characteristics of a daily course Ozone in Almaty in median months of seasons of year are placed. Table 3 Sizes of ground ozone over Alma-Ata (mkg/m3)
The Average Months Characteristics 01 07 13 19 Terms Year
January An average мax min
5 74 0
7 83 0
15 51 0
2 25 0
7 - -
April An average мax min
108 274 3
10,5 301 3
227 488 50
85 240 0
132 - -
July An average мax min
201 433 20
168 341 31
359 677 55
221 450 37
238 - -
October An average мax min
38 226 0
37 173 0
172 342 0
19 123 0
94 - -
It is possible to see that the daily course of ozone in Almaty essentially differs from the results containing in [41], etc. for plains. The general is that during all seasons of year the maximum of ground ozone takes place at 13 o'clock local time. Thus average concentration from January (minimum) by July (maximum) increases in 20 times, it is essential more than sizes of annual amplitudes to Europe and the North America. The reason of it are the powerful ground inversions caused by influence of a southwest spur of the Siberian anticyclone, observed during all cold period, Inversions interfere with receipt of ozone from troposphere, therefore in the winter a minimum Ozone especially deep. The ozone minimum in January-April and October in a daily course takes place not in the morning, and in the evening at 19 o'clock. Only in July its minimum is observed in 7 o'clock in the morning. Almaty it is located in foothills of Zailijsky Ala Tau in a zone it is mountain-valey winds [47]. In [42] it has been shown that at the Antarctic coast local winds essentially deform a daily course Ozone. Influence of such winds also forms a daily course. From a maximum at 13 o'clock concentration Ozone quickly go down by 19 o'clock at the expense of easing convection, turbulence, and also the beginning of formation of the ground or raised inversion which takes place and at any time year, though also the nature at it another. Even with a sunset and cooling of mountains there is a mountain wind. As it is known [8, 9], in
375

an interface during the cold period at height about 500-1000 m the ozone maximum in its vertical distribution takes place. Here the mountain wind, promotes lowering of air weights along mountain valleys and slopes and enriches ozone the bottom layers. It absence of a minimum of ozone in 07 o'clock in cold months and its presence – in warm also speaks. Thus in June-August this minimum is especially deep. Small falls of concentration of Ozone in 07 o'clock are observed in April and October. In the end of April and the beginning of October of a condition is closer to summer, than to the winter. Therefore we can observe this weak secondary minimum. The similar explanation of a daily course at coast of Antarctica where are observed local стоковые winds, contains in [30, 42], etc. How does concentration of ground ozone within days strongly vary? According to [8, 9] daily fluctuations of Ozone are in limits + 20 % from an average. It is possible to see that in Almaty in January the daily course of average sizes of ozone makes 100 % from an average towards a maximum and 300 % towards a minimum, in June – 50 and 30 %, in April – 80 and 40 %, in October – 90 and 450 % accordingly. Hence, speed of change of ground concentration the least in July, in the winter, and during transitive seasons it above. In table 3 extreme values or extrema of Ozone, observed within months of certain seasons are resulted also. In January and also in April and October the bottom values of Ozone are defined by sensitivity of the device. In January in terms 01, 07, 13 and 19 o'clock 18, 13, 4 and 18 cases when the device showed zero concentration of Ozone have been registered. In April and July of such cases was not, and in October they have made 9, 7, 0 and 11 accordingly on terms. April and October, hence, despite approximate similarity radiation conditions, have very differing average sizes Ozone (132 and 94 mkg/m3 accordingly) and maxima Ozone in October much more low, than in April. The most appreciable distinction, however, is repeatability of zero sizes. In October such 27 cases from 94, and in April – any took place. October is transitive month from summer by the winter [30, etc.] When summer processes are already weakened, and winter have not gained in strength. It causes a weak exchange on a vertical (in comparison with April) and fast decrease in ground ozone. Apparently from the same table 31, extrema in all terms in July only in 2 times exceed average sizes. In April and in October during a day maximum they too only in 2 times exceed average value. In other terms, however, this excess can be in 5 and more times above, than averages for this term. For January, in view of a great number of zero values, conclusions are less reliable, extrema in a day maximum more than three times exceed an average, and in other terms they differ at 10-15 time. Marked features in sizes of averages and extrema allow to assume the following: there are any limiting sizes of concentration of ozone in atmosphere, whence it arrives in a ground layer. In the summer when the mechanism of a vertical exchange is most active, ground concentration of ozone is great, and they considerably come nearer to greatest possible taking into account possibilities of the mechanism of transfer. Therefore average and maximum sizes of ozone differ minimum in an annual course. During other seasons in the ground layer arrives on the average only a part of ozone from the possible.
Only at active synoptic processes of a condition of a vertical exchange temporarily improve ( or not improve ) there is a maximum (or a minimum), essentially distinguished from average.
Synoptic conditions at which extreme conditions of concentration of ozone take place, demand independent consideration, that by us is made below.
Some words about influence of the polluting substances (PS ), contained in a ground layer, on concentration of ground ozone. As it is fairly marked in [30, etc.], such influence can be noticed in the winter, when natural ground concentration of ozone are small. However there are a lot of difficulties in the winter. In [30] it is underlined, that it is frequently easier to allocate horizontal carry of ground ozone, than influence of polluting substances.
In our case, however, in view of results of the analysis of the aerosynoptic conditions stated below, the certain conclusions to make it is possible. First of all, presence in a daily course of a minimum of ozone in 19 o'clock, i.e. in a rush hour, unequivocally specifies influence PS on destruction of ground ozone. Thus the important role in this process plays except for оксидов
376

nitrogen and окись carbon. It is known, that at emissions of modern thermal stations окись carbon is present only as traces. The basic contribution to ground concentration WITH brings motor transport. Calms and the weak winds prevailing here, promote that concentration ЗВ can collect up to significant concentration.
The secondary night maximum of concentration of ozone in 01 o'clock too has an explanation. At night when movement of transport strongly weakens, emissions carbon dioxide and nitrous oxides appreciablly decrease, process of destruction of ozone too stops. In city the air mass (unimportantly, from what side}) is displaced more richer by ozone. It also promotes formation of a night maximum. To the morning we have a natural reduction in concentration of ground ozone due to easing its receipt from above.
The local conditions promoting on the one hand accumulation PS up to high concentration, and with another - a plenty of automobiles and their emissions in city with the expressed daily course of activity is enough facilitate our analysis.
As a whole, however, the problem of ground ozone is still far from a desirable level of understanding and additional more detailed measurements and the analysis are required.
1.5. Long-term fluctuations of ozone.
Studying long-term fluctuations of ozone is of interest. If these fluctuations are somehow
connected to changes of a climate and the general circulation of an atmosphere it will allow to consider such fluctuations of ozone as one of chains of the general circulation of an atmosphere. It was specified connection of acyclic fluctuations GMО with the general circulation still in [30]. There it has been shown, that a maximum of ozone by the similar image, appeared above the Western Europe and the Far East, has coincided with deep negative anomaly of temperature. Authors [43] came to a conclusion, that such anomalies are connected « not so much to separate intrusions of Arctic air, how many with the general gradual reorganization of circulation in Northern hemisphere ». Similar conclusions are made in [32] on supervision above Northern America where increase GMО on 7 % has been connected to a steady deepening in the winter of trough in the top troposphere above the east the USA which has caused carrying out of Arctic air, rich ozone, on the south.
Convincing enough results confirming the general reorganization of circulation are resulted in [30]. Authors have constructed twenty mons sliding average GMО for the period with 1961 on 1976 for stations Aroza and Татеno in spite of the fact that points divide 130 degrees of a longitude, curve had the certain similarity. High maximum GMО in Арозе took place in November, 1969, and in Татеnо - in February - March 1970y. Attraction of the data of station Arhus located on 10 degrees to the north of Aroza, has allowed to allocate a local component. Curves GMО for these stations were almost parallel, but in Arhus the maximum was higher and was observed later, than in Aroza. After 1969 of size GMО at both stations began to go down gradually. Occurrence satellite given, and also some other means now have allowed to study the given problem more deeply and more widly. So, in [44, 48] on the basis of the data of the National meteorological center of the USA are designed by two year long-term components of anomaly of the tropospheric and stratospheric moments of pulses for 1978-1992 г.г. It is shown, that distinctions of interannual variability of circulation of troposphere and a stratosphere can be explained by imposing two year and long-term fluctuations. On the basis of satellite measurements GMО it has been shown, that its interannual fluctuations above Antarctica in October can be explained a two year cycle of fluctuations of a zone wind of the bottom troposphere of equatorial latitudes (Singapore). In result have taken place long-term changes inter latitudes connections of circulation of a stratosphere. Hence, the initial reason of occurrence of an ozone gap above Antarctica is long-term easing of wave activity in average and high latitudes of a southern hemisphere. In the latest years a lot of works in which connection of fluctuations of the general circulation of an atmosphere with fluctuations GMО [30] is shown
377
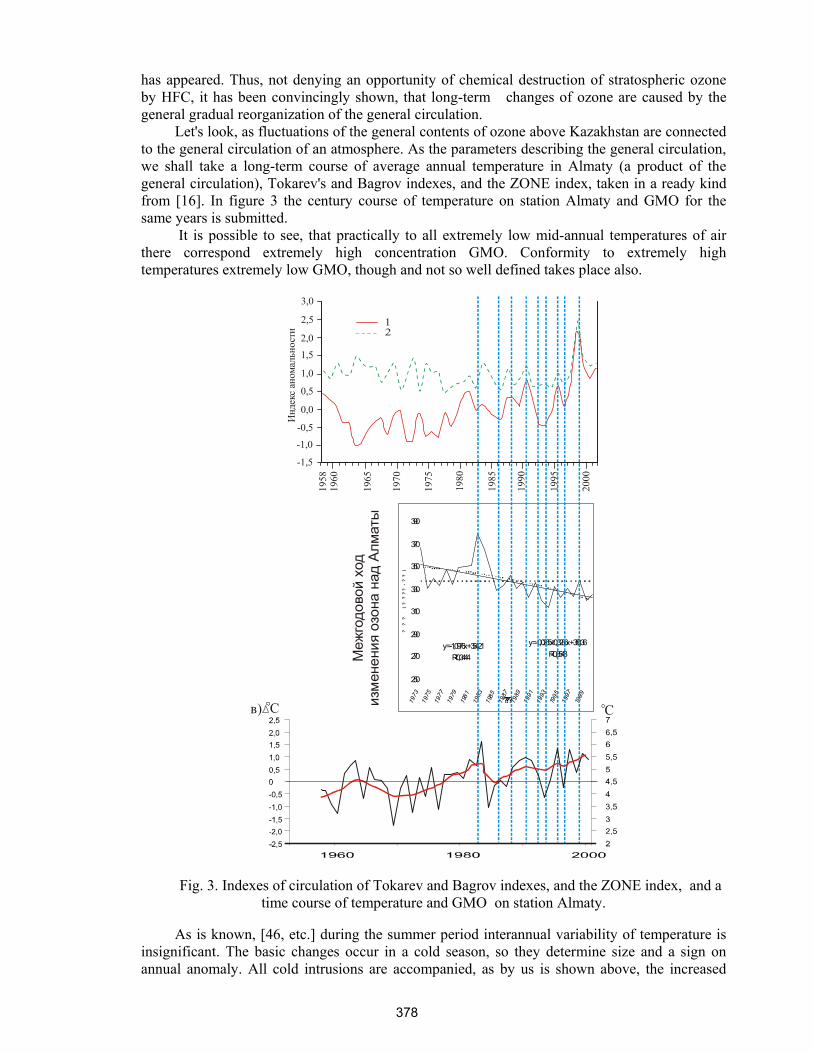
has appeared. Thus, not denying an opportunity of chemical destruction of stratospheric ozone by HFC, it has been convincingly shown, that long-term changes of ozone are caused by the general gradual reorganization of the general circulation.
Let's look, as fluctuations of the general contents of ozone above Kazakhstan are connected to the general circulation of an atmosphere. As the parameters describing the general circulation, we shall take a long-term course of average annual temperature in Almaty (a product of the general circulation), Tokarev's and Bagrov indexes, and the ZONE index, taken in a ready kind from [16]. In figure 3 the century course of temperature on station Almaty and GMО for the same years is submitted.
It is possible to see, that practically to all extremely low mid-annual temperatures of air there correspond extremely high concentration GMО. Conformity to extremely high temperatures extremely low GMО, though and not so well defined takes place also.
1958
1960
1965
1970
1975
1980
1985
1990
1995
2000
Индекс аномальности
3,0
2,5
2,01,5
1,0
0,5
0,0
-0,5
-1,0
-1,5
???????????????????????????????
y=-1,0976x+354,21R20,3444
y=-0,0265x20,3286x+350,36R20,3548
250
270
290
310
330
350
370
390
1973
1975
1977
1979
1981
1983
1985
1987
1989
1991
1993
1995
1997
1999???
??
?(
??
??
-?
?)
Меж
годовой ход
изменения
озона
над
Алм
аты
С Св)
Fig. 3. Indexes of circulation of Tokarev and Bagrov indexes, and the ZONE index, and a time course of temperature and GMО on station Almaty.
As is known, [46, etc.] during the summer period interannual variability of temperature is
insignificant. The basic changes occur in a cold season, so they determine size and a sign on annual anomaly. All cold intrusions are accompanied, as by us is shown above, the increased
378
concentration of ozone, is especial in a zone of fronts. It is caused by carrying out of air, rich ozone, from the Arctic latitudes. Arrival of tropical air to systems of subtropical crests is accompanied low GMО since this air is poor ozone. Hence, often and intensive intrusions of Arctic air form negative anomaly of temperature and positive - GMО. And often carrying out of air from subtropical latitudes - positive anomaly of temperature and negative - GMО.
On fig. 3 the joint course of Tokarev and Bagrov indexes and GMО on station Almaty for the same line of years is submitted. Earlier in [16] it has been shown, that a temporary line of average annual temperature for Kazakhstan well correlates with the above-named indexes. The temperature of air in Almaty is formed under influence of lines and other factors, except for analyzed. Nevertheless, we can see, that the basic extrema during the named indexes and in course GMО for Almaty coincide.
All marked above, specifies that the most significant fluctuations GMО are caused by fluctuations of parameters of the general circulation of an atmosphere. Hence, the forecast of changes GMО in Kazakhstan, including in long-term aspect should be based on the forecast of dynamicsof the general circulation of an atmosphere in Northern hemisphere.
1.6. Aerosynoptic conditions at which extreme concentration of ground ozone are
formed
Represents practical interest research of conditions of formation, both the general contents
of ozone, and ground one. Whereas conditions of formation of ground ozone in Almaty practically are not investigated, the greatest attention is given to this question. Then conditions of formation of the general contents of ozone above Kazakhstan are considered. Last years it has been shown, that transboundery carry of ground ozone can have significant sizes. The special attention is given to this question too. We shall consider also the general tendencies of change GMО above Kazakhstan last ten years.
So, within day small strengthening of the crest focused to a southwest from the Siberian anticyclone on January, 17 took place. The maximum of its development took place, probably, about 21 o'clock. After that its easing and activization of cyclonic activity, including along foothills began. Within this day warm air in the bottom layer of troposphere acted in area Almaty from a southwest, impoverished by ozone. On separate sites of front, however, its essential displacement to a southwest under influence of a crest of an anticyclone (term 03 o'clock still took place.). In this situation the temperature of air in Almaty was lowered up to minimal (about- 9 С). Further carrying out of warm air has proceeded, and the temperature of air gradually grew. By the end of day on January, 19, in view of clearing in a afterboundary zone in the second part of day occured downturn of temperature and some growth of pressure that has led to appreciable downturn of temperature of air and strengthening of ground inversion.
Let's consider now a course of temperature and concentration of ground ozone at station Almaty, involving to the analysis also the data on concentration NOх. On fig. 4 the temporary course of these parameters within three day on January, 17-19 is submitted. The maximum of concentration of ground ozone took place in all cases at presence of atmospheric front at foothills and displacement of a site of front to the north from foothills, i.e. at presence of a southern component of a wind in the bottom layers of an atmosphere (see maps). It occurs or in system of a wave on its warm site (on January, 17 and 18 if the front lays at foothills) or at active displacement of all site of front to the north on plain on southern Balhashregion (on January, 19). At such synoptic situation there is also a receipt of tropospheric ozone to the ground from its maximum located at some height in a tropospheric layer [8, etc.] . It proves to be true also climatic generalizations of ground ozone. Its maximum in a cold part of year takes place in the morning when the mountain component mountain - valley the circulation reaches a maximum, delivering to the ground enriched with ozone air.
379

Fig. 4. A daily course ground concentration nitrogen oxides and temperature for the period on January, 17 and on January, 19, 2005.
Only in the summer, more precisely, in a warm part of year when thermal convection is
very strong, time of receipt of a maximum of ground ozone is displaced on 13-15 o'clock of local time. On fig. 13 the temporary course of concentration of dioxide of nitrogen is resulted also. It is possible to see, that it has the expressed daily course with a maximum in a second half of day, about 13 o'clock and, a minimum in the morning, about 7 o'clock mornings. As is known, the layer, rich ozone, at heights of 500-1000 m during the summer period is absent [8]. Therefore in time 07 o'clock, despite of presence of a mountain wind of increase in concentration of ground ozone it is not observed. The maximum of dioxide of nitrogen and carbon dioxides about 19 o'clock is caused by emissions of motor transport which activity at this time is maximal. After that its concentration gradually goes down, including and due to a mountain component of a wind, the maximum which takes place to the morning. The role of this component and others PS, apparently by the example of dioxide of nitrogen, for Almaty is of great importance. (a Fig. 5).
Fig.5. A daily course of ground concentration of nitrogen and temperatures from July, 20 till
July, 22, 2005. As if to concentration nitrogen dioxides and carbon dioxides in points of a maximum they
depend also on intensity of ground inversions. When they are more strongly expressed, the concentration NOх is higher. It is necessary to remember, however, that fluctuations NOх due to
380
intensity of movement of transport occur on a background of concentration NOх caused by emissions of the power enterprises. These emissions have no daily course, and the ground concentration, caused by these emissions, change within day depending on conditions of dispersion.
Thus, influence of concentration NOх despite of their significant sizes during winter time, for ground concentration of ozone us are not found out. Probably, such influence is while within the limits of errors of measurements.
In the summer in a daily course of concentration of ground ozone the expressed basic maximum at 13-15 o'clock, and a minimum in 07 o'clock mornings takes place. As it is marked by us above, the maximum is caused active thermal конвекцией, providing receipt of ozone from troposphere.
The maximum of ground ozone in its time course takes place then when the general maintenance of ozone (GMО) and tropospheric ozone increases also, i.e. in a zone of atmospheric fronts in a southeast part of tropospheric hollows. It corresponds to a site of cold front at the ground, at once behind front. Such situation is considered by us in 1.7.2.
1.7 Dynamics and internal structure of monthly sizes of the general maintenance of
ozone above Kazakhstan.
Dynamics of atmospheric ozone above Kazakhstan after the fiftieth years of the last
century practically was not studied. However is proved heightened interest to a problem on the part of the world community and of some the International Conventions which Kazakhstan has joined, have made such researches necessary [6, 8]. Dynamics of the general maintenance of ozone (GMО ) above Kazakhstan was studied by us for the period with 1998 on 2006 Distribution GMО above Kazakhstan is a result of large-scale general circulation of an atmosphere above a significant part of Northern hemisphere. Therefore the information about GMО on space from Atlantic up to Silent oceans was used. sach data are on a regular basis published in reviews in magazine « Meteorology and the Hydrology », and also contains in works [3, 4, 5], etc.
1.7.2. Synoptic conditions of formation of extreme sizes GMО Further we had been selected cases of extreme sizes GMО above Kazakhstan. Thus for a
case took a situation when even on one of stations of Kazakhstan GMО deviates in any side norm up to 2,5 or more values of an average quadratic deviation{rejection} (�) [11, 12]. For an example we shall consider aerosynoptic conditions when extreme values GMО took place.
Thus, extremely high concentration of ozone were observed in system of especially deep trough, on its southeast periphery as a result of intrusion of a cold Arctic air, rich by ozone.
Deficiency GMО which has made 2,7 �, and the next day and more, took place in system of the crest generated as a result of intensive of longitude carrying out of tropical air through the western areas of Kazakhstan. In the top troposphere on 300 hPа the independent area of a high pressure specifying simultaneously and on intensity of carrying out of heat and was generated that displacement of system will be slow. Actually and was. With breaks, as a result of a pulsation of parameters of aerosynoptic system, deficiency GMО took place within several day both above Karaganda, and above Semipalatinsk. Above Аlmaty, however, deficiency GMО was not observed, as receipt of cold air on east periphery of system here took place.
381
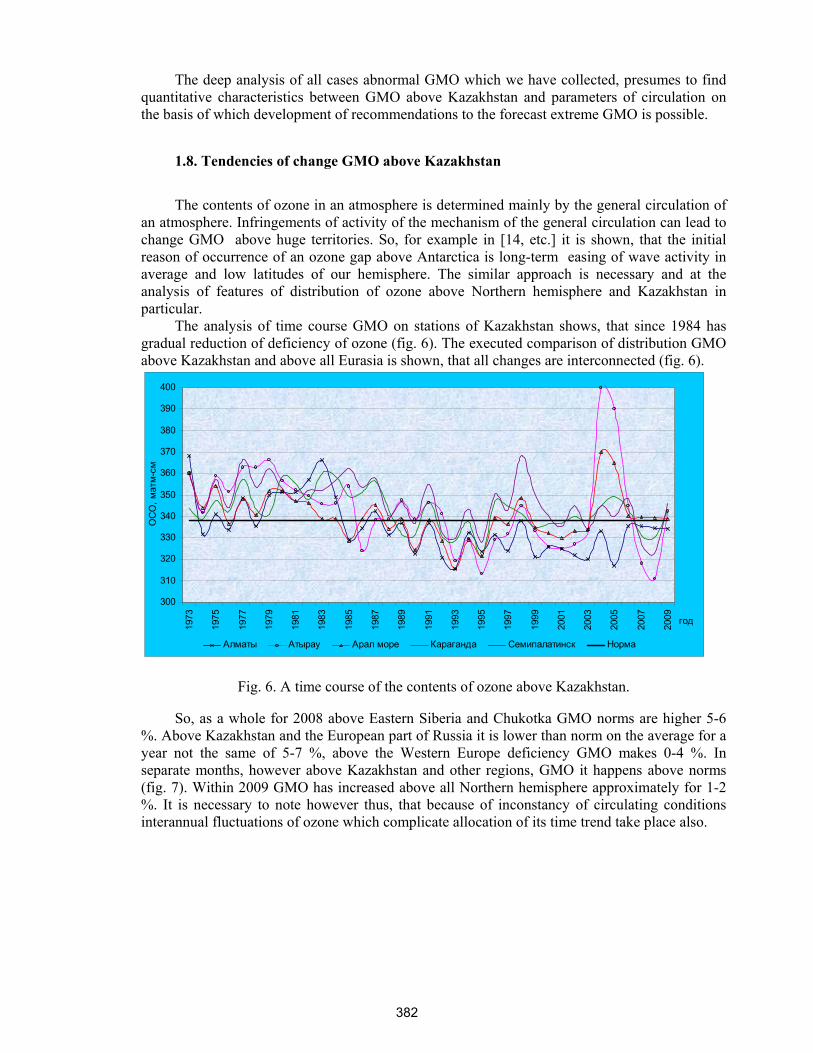
The deep analysis of all cases abnormal GMО which we have collected, presumes to find quantitative characteristics between GMО above Kazakhstan and parameters of circulation on the basis of which development of recommendations to the forecast extreme GMО is possible.
1.8. Tendencies of change GMО above Kazakhstan
The contents of ozone in an atmosphere is determined mainly by the general circulation of
an atmosphere. Infringements of activity of the mechanism of the general circulation can lead to change GMО above huge territories. So, for example in [14, etc.] it is shown, that the initial reason of occurrence of an ozone gap above Antarctica is long-term easing of wave activity in average and low latitudes of our hemisphere. The similar approach is necessary and at the analysis of features of distribution of ozone above Northern hemisphere and Kazakhstan in particular.
The analysis of time course GMО on stations of Kazakhstan shows, that since 1984 has gradual reduction of deficiency of ozone (fig. 6). The executed comparison of distribution GMО above Kazakhstan and above all Eurasia is shown, that all changes are interconnected (fig. 6).
300
310
320
330
340
350
360
370
380
390
400
1973
1975
1977
1979
1981
1983
1985
1987
1989
1991
1993
1995
1997
1999
2001
2003
2005
2007
2009 год
ОСО
, матм
-см
Алматы Атырау Арал море Караганда Семипалатинск Норма
Fig. 6. A time course of the contents of ozone above Kazakhstan.
So, as a whole for 2008 above Eastern Siberia and Chukotka GMО norms are higher 5-6
%. Above Kazakhstan and the European part of Russia it is lower than norm on the average for a year not the same of 5-7 %, above the Western Europe deficiency GMО makes 0-4 %. In separate months, however above Kazakhstan and other regions, GMО it happens above norms (fig. 7). Within 2009 GMО has increased above all Northern hemisphere approximately for 1-2 %. It is necessary to note however thus, that because of inconstancy of circulating conditions interannual fluctuations of ozone which complicate allocation of its time trend take place also.
382
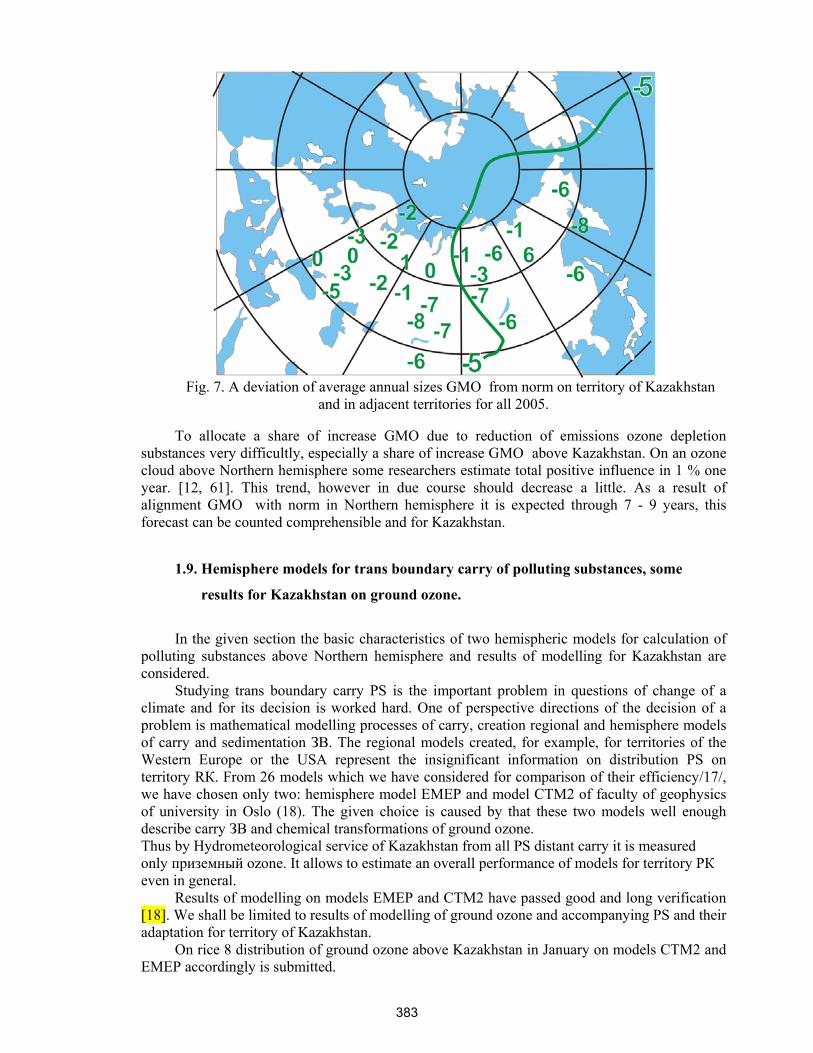
Fig. 7. A deviation of average annual sizes GMО from norm on territory of Kazakhstan
and in adjacent territories for all 2005. To allocate a share of increase GMО due to reduction of emissions ozone depletion
substances very difficultly, especially a share of increase GMО above Kazakhstan. On an ozone cloud above Northern hemisphere some researchers estimate total positive influence in 1 % one year. [12, 61]. This trend, however in due course should decrease a little. As a result of alignment GMО with norm in Northern hemisphere it is expected through 7 - 9 years, this forecast can be counted comprehensible and for Kazakhstan.
1.9. Hemisphere models for trans boundary carry of polluting substances, some
results for Kazakhstan on ground ozone.
In the given section the basic characteristics of two hemispheric models for calculation of
polluting substances above Northern hemisphere and results of modelling for Kazakhstan are considered.
Studying trans boundary carry PS is the important problem in questions of change of a climate and for its decision is worked hard. One of perspective directions of the decision of a problem is mathematical modelling processes of carry, creation regional and hemisphere models of carry and sedimentation ЗВ. The regional models created, for example, for territories of the Western Europe or the USA represent the insignificant information on distribution PS on territory RК. From 26 models which we have considered for comparison of their efficiency/17/, we have chosen only two: hemisphere model ЕМЕP and model СТМ2 of faculty of geophysics of university in Oslo (18). The given choice is caused by that these two models well enough describe carry ЗВ and chemical transformations of ground ozone. Thus by Hydrometeorological service of Kazakhstan from all PS distant carry it is measured only приземный ozone. It allows to estimate an overall performance of models for territory РК even in general.
Results of modelling on models ЕМЕР and СТМ2 have passed good and long verification [18]. We shall be limited to results of modelling of ground ozone and accompanying PS and their adaptation for territory of Kazakhstan.
On rice 8 distribution of ground ozone above Kazakhstan in January on models СТМ2 and ЕМЕР accordingly is submitted.
383

Fig. 8 Distribution of concentration of ground ozone (ррв) above Kazakhstan in January on
models СТМ2 and ЕМЕР {8}, Model ЕМЕР gives size of ground ozone 20+25 ррв above the central areas of Kazakhstan
about a minimum 20 ррв and less above northwest and Kazakhstan to the north Aral see. To the southeast it concentration of ozone grow, exceeding 30 ррв in the east and in a southeast of territory, i.e. in areas of Semipalatinsk - Almaty.
Model СТМ2 (fig. 8) an axis of a trough with the minimal sizes of ozone has longitude ways above Northern Kazakhstan and only to the south 50 ° n.l. It turns to a southeast. Accordingly, the lowest concentration of ozone take place above Northern Kazakhstan, 20 ррв and less, and the highest, 30 ррв, as above the east and a southeast of territory.
Comparing results of modelling with the data of supervision over ground ozone in Almaty, we mark, that the concentration received on model СТМ2 are closer to observable. Presence of the hills interfering free carry of air weights from the south, rich ozone is possible, provides conditions when the air weights acting from northern component and poor ozone prevail of the south and a southeast of Republic. At the same time the course of ground ozone lines above territory of the Republic, received on both models, is very close. Results of modelling for July are submitted on fig. 9
384
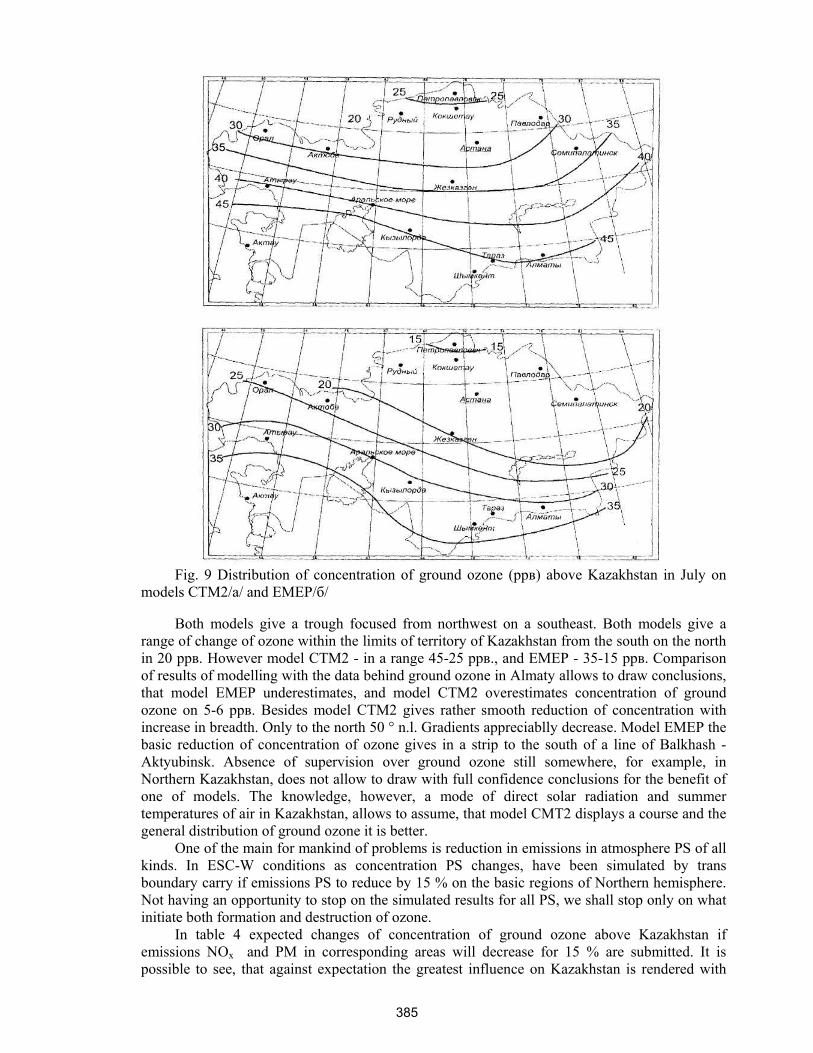
Fig. 9 Distribution of concentration of ground ozone (ррв) above Kazakhstan in July on
models СТМ2/а/ and ЕМЕР/б/ Both models give a trough focused from northwest on a southeast. Both models give a
range of change of ozone within the limits of territory of Kazakhstan from the south on the north in 20 ррв. However model СТМ2 - in a range 45-25 ррв., and ЕМЕР - 35-15 ррв. Comparison of results of modelling with the data behind ground ozone in Almaty allows to draw conclusions, that model ЕМЕР underestimates, and model СТМ2 overestimates concentration of ground ozone on 5-6 ррв. Besides model СТМ2 gives rather smooth reduction of concentration with increase in breadth. Only to the north 50 ° n.l. Gradients appreciablly decrease. Model ЕМЕР the basic reduction of concentration of ozone gives in a strip to the south of a line of Balkhash - Aktyubinsk. Absence of supervision over ground ozone still somewhere, for example, in Northern Kazakhstan, does not allow to draw with full confidence conclusions for the benefit of one of models. The knowledge, however, a mode of direct solar radiation and summer temperatures of air in Kazakhstan, allows to assume, that model СМТ2 displays a course and the general distribution of ground ozone it is better.
One of the main for mankind of problems is reduction in emissions in atmosphere PS of all kinds. In ESC-W conditions as concentration PS changes, have been simulated by trans boundary carry if emissions PS to reduce by 15 % on the basic regions of Northern hemisphere. Not having an opportunity to stop on the simulated results for all PS, we shall stop only on what initiate both formation and destruction of ozone.
In table 4 expected changes of concentration of ground ozone above Kazakhstan if emissions NOх and РМ in corresponding areas will decrease for 15 % are submitted. It is possible to see, that against expectation the greatest influence on Kazakhstan is rendered with
385
emissions PS by the industry of the countries of the Near East. Reduction in emissions PS there on 15 % results in reduction in average annual concentration of ground ozone on 0,15 ррв. Thus both models give approximately identical size.
Middle East, i.e. Iran, Iraq, Turkey and the Mediterranean, give in Kazakhstan an average annual background of ground ozone approximately in 0,1 ррв. Such significant size in comparison with industrially advanced regions is caused by that the most part of year carrying out of air massis occurs from Middle East.
Table 4 Average annual sizes of reduction in concentration of ozone (ррв) in territory of
Kazakhstan for the account trans boundary carry at reduction in emissions on 15 % in regions - donors accompanying ЗВ.
Regions ЗВ Sizes of reduction The Far East - About 0,15 ррв on all territory NOX + РМ Kazakhstan Middle East - Less than 0,1 ррв to the south оз. Balkhash and
about 0,0-to the north Northern America - About 0,10 ррв on all territory on The extreme south - has less Europe A southwest of Kazakhstan down to оз. Balkhash about0,10 ррв. On other Territories about0,05 ррв. The sum 0,45 ррв
Average annual concentration of ozone in territory of Kazakhstan 0,25-0,30 ррв air massis
occurs from Middle East. Regions of Europe and Northern America provide on 0,1 ррв ozone. In the sum for the account of trans boundary carry we have concentration of the ozone equal 0,45 ррв in Kazakhstan. How the background if receipt atmospheric ЗВ to Kazakhstan would stop at all will change? Then concentration of ground ozone would decrease on 3,5 ррв, that makes about 10-15 % for the south of Republic and 15-20 % - for itsnorthern areas.
The executed analysis shows on international character and the pollution of an atmosphere and struggle against it.
2. THE ESTIMATION OF CONSUMPTION ОРВ IN KAZAKHSTAN ON SECTORS OF ECONOMY IN 2009 AND THE SCRIPT THE NEAREST YEARS
2.1 Dynamics of quantity consumed ozone depletion in Kazakhstan
Usually any national strategy bases on the current data. It is necessary and an important point which allows to establish « width of a corridor » in which there can be changes. As a rule, the a line is longer, the estimation of forecasting will be more exact. In our disposal there are data for last fifteen years. However, unfortunately, to speak about uniformity of lines, it is not necessary stability of external factors. During monitoring behind consumption level ОРВ in Kazakhstan there were essential changes, both in quantity consumed HCFC, and in their quality indicators. The structure of consumed substances has changed, there is a reorganization of the market of the equipment where the mentioned substances are used. Certainly, such cardinal measures should affect a consumption level. Besides it is impossible to forget, that from the moment of occurrence of the Viennese convention has passed not less than 30 years and for this time innovative decisions in the equipment have been realized many. In view of that average term of operation of household refrigerators makes 25-30 years, commercial 12-15 years, and complex systems of cooling of stadiums, skating rolls, warehouse or technological premises can
386
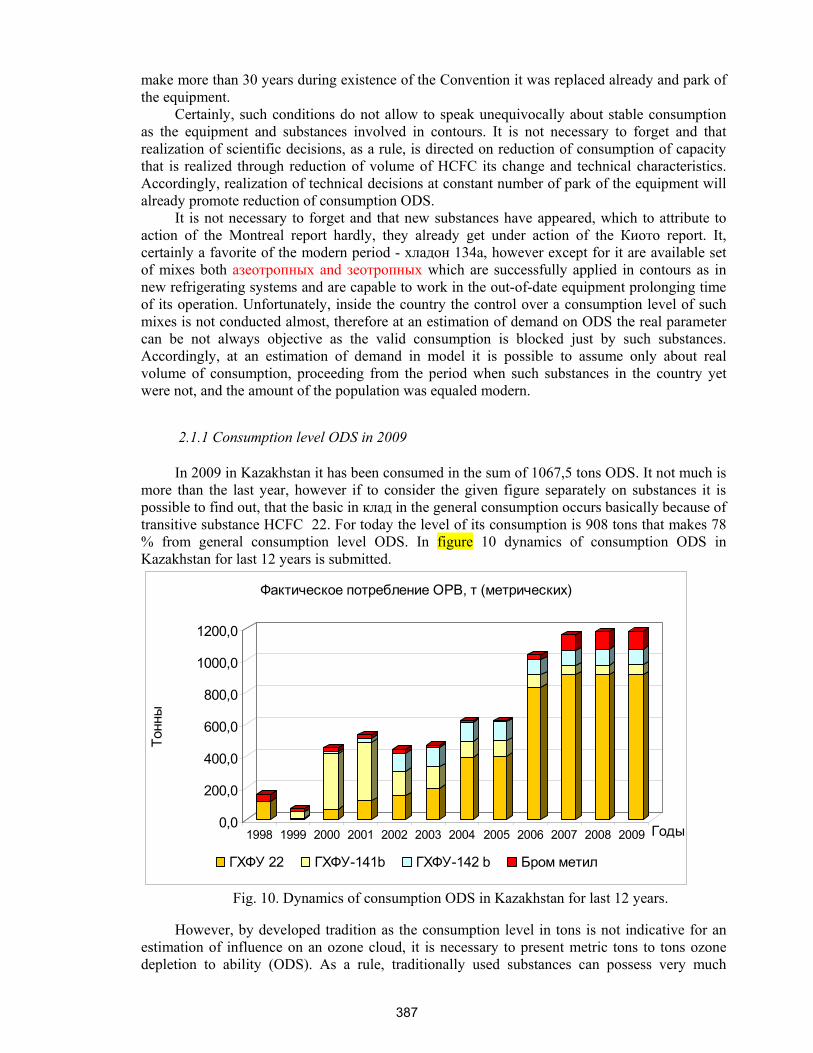
make more than 30 years during existence of the Convention it was replaced already and park of the equipment.
Certainly, such conditions do not allow to speak unequivocally about stable consumption as the equipment and substances involved in contours. It is not necessary to forget and that realization of scientific decisions, as a rule, is directed on reduction of consumption of capacity that is realized through reduction of volume of HCFC its change and technical characteristics. Accordingly, realization of technical decisions at constant number of park of the equipment will already promote reduction of consumption ОDS.
It is not necessary to forget and that new substances have appeared, which to attribute to action of the Montreal report hardly, they already get under action of the Киотo report. It, certainly a favorite of the modern period - хладон 134а, however except for it are available set of mixes both азеотропных and зеотропных which are successfully applied in contours as in new refrigerating systems and are capable to work in the out-of-date equipment prolonging time of its operation. Unfortunately, inside the country the control over a consumption level of such mixes is not conducted almost, therefore at an estimation of demand on ОDS the real parameter can be not always objective as the valid consumption is blocked just by such substances. Accordingly, at an estimation of demand in model it is possible to assume only about real volume of consumption, proceeding from the period when such substances in the country yet were not, and the amount of the population was equaled modern.
2.1.1 Consumption level ОDS in 2009 In 2009 in Kazakhstan it has been consumed in the sum of 1067,5 tons ОDS. It not much is
more than the last year, however if to consider the given figure separately on substances it is possible to find out, that the basic in клад in the general consumption occurs basically because of transitive substance HCFC 22. For today the level of its consumption is 908 tons that makes 78 % from general consumption level ОDS. In figure 10 dynamics of consumption ОDS in Kazakhstan for last 12 years is submitted.
0,0
200,0
400,0
600,0
800,0
1000,0
1200,0
Тонны
1998 1999 2000 2001 2002 2003 2004 2005 2006 2007 2008 2009 Годы
Фактическое потребление ОРВ, т (метрических)
ГХФУ 22 ГХФУ-141b ГХФУ-142 b Бром метил
Fig. 10. Dynamics of consumption ОDS in Kazakhstan for last 12 years.
However, by developed tradition as the consumption level in tons is not indicative for an estimation of influence on an ozone cloud, it is necessary to present metric tons to tons ozone depletion to ability (ОDS). As a rule, traditionally used substances can possess very much
387

different effort on influence on an ozone cloud, for this reason usual metric tons are not indicative, as different substances at identical volumes possess different destroying abilities. HCFC represent chemical substances in which one or more atoms of carbon are connected from one or more atoms of halogens (fluorine, chlorine, bromine or iodine). Ozone depletion ability HCFC , containing bromine, as a rule, much above, than at what contain chlorine. Synthetic chemical substances which provide the most part of chlorine and bromine for destruction of ozone, are bromic methyl, Metilchloroform, Tetrahclormetan and family of the chemical substances known as HCFC and an.
To each adjustable substance the factor describing its influence on a stratospheric ozone cloud on a mass unit of gas in comparison with the same weight CFC-11 is appropriated . These factors ОDS for each adjustable substance are specified in appendices to the Montreal report []. According to the Management on granting the data within the framework of the Montreal Report factor ОDS for bromic methyl 0,6, and for HCFC 22 - 0,055. In this case the real picture will look a little differently, fige 11.
It is possible to see, that the consumption level in tons ОDS essentially changes a picture. So the basic substance which renders negative influence on an ozone cloud is bromic methyl though its real consumption is lower almost in 7 times in tons metric.
The second on a level of influence is HCFC- 22, this transitive substance which can be used within the framework of the Montreal report. Except for that this substance is the potential applicant for an interdiction in use and most likely it will be applied only together with other substances - in mixes.
0
20
40
60
80
100
120
140
ОРС
, т
1998 1999 2000 2001 2002 2003 2004 2005 2006 2007 2008 2009 Года
Фактическое потребление ОРВ, в ОРС, т
ГХФУ 22 ГХФУ-141bГХФУ-142 b Бром метил
Fig. 11. Dynamics of consumption ОDS in tons ОDP Kazakhstan for last 12 years.
It is possible to see, that consumption of agents has appreciablly increased last four years. At the present stage the amount used ОDS almost three times exceeds a level 2003-2004 гг, and five times a level of 1999.
Besides from the submitted data it is visible, that such appreciable difference was formed basically due to increase in consumption of bromic methyl, with its high enough factor ОDS. The amount of used bromic methyl is comparable to the sum of all other substances of all categorys (fig. 12).
388
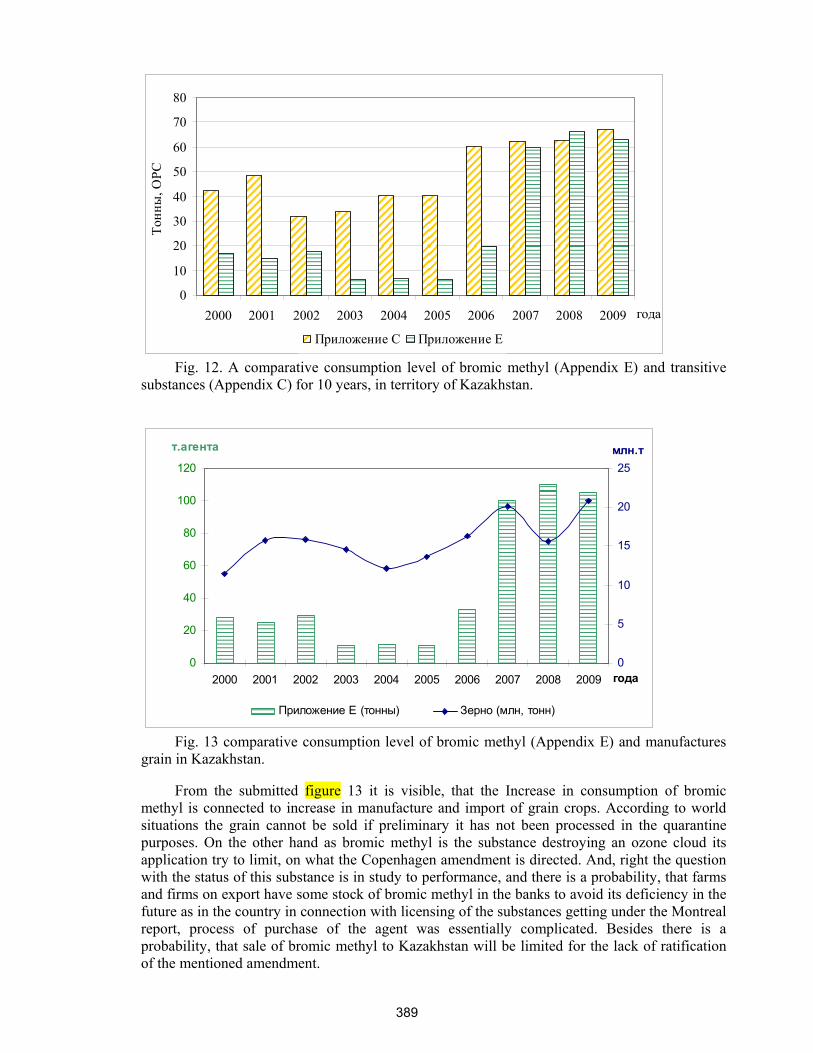
0
10
20
30
40
50
60
70
80
2000 2001 2002 2003 2004 2005 2006 2007 2008 2009 года
Тонны
, ОРС
Приложение С Приложение Е
Fig. 12. A comparative consumption level of bromic methyl (Appendix Е) and transitive substances (Appendix С) for 10 years, in territory of Kazakhstan.
0
20
40
60
80
100
120
2000 2001 2002 2003 2004 2005 2006 2007 2008 2009 года
т.агента
0
5
10
15
20
25млн.т
Приложение Е (тонны) Зерно (млн, тонн)
Fig. 13 comparative consumption level of bromic methyl (Appendix Е) and manufactures grain in Kazakhstan.
From the submitted figure 13 it is visible, that the Increase in consumption of bromic
methyl is connected to increase in manufacture and import of grain crops. According to world situations the grain cannot be sold if preliminary it has not been processed in the quarantine purposes. On the other hand as bromic methyl is the substance destroying an ozone cloud its application try to limit, on what the Copenhagen amendment is directed. And, right the question with the status of this substance is in study to performance, and there is a probability, that farms and firms on export have some stock of bromic methyl in the banks to avoid its deficiency in the future as in the country in connection with licensing of the substances getting under the Montreal report, process of purchase of the agent was essentially complicated. Besides there is a probability, that sale of bromic methyl to Kazakhstan will be limited for the lack of ratification of the mentioned amendment.
389

At the same time from figures 1 and 2 it is possible to see, that consumption of such substances as HCFC 141b and HCFC 142b is at a stable level and varies year by year insignificantly. And appreciable dynamics of growth of demand not these agents it is not observed, that speaks about a constant niche in the market where the mentioned agents are used.
Figure 13 evidently shows, as the situation for last ten years in market ODS varied. Besides figure shows, that has changed from the moment of refusal from ОDS Appendix A and In in 2004. It is possible to see, that a role of transitive substances, since 2000 began to grow. However, even after full refusal of application of the mentioned substances of sharp demand for substances of the appendix C does not occur. It can be connected to set of the reasons, first of all with problems of technical character. Today, unfortunately, there is no such substance which could replace completely in all sectors, freons 11 and 12.
First, not knowing technical characteristics of the new substances, many firms were not defined finally with a choice [6-8, 10-13, 24, 25].
0
200
400
600
800
1000
1200
1998
1999
2000
2001
2002
2003
2004
2005
2006
2007
2008
2009 года
тонны
ОРС
ОРВ приложения А, группы 1 ОРВ приложения А, группы 2ОРВ приложения В ОРВ Приложений С и Е
Figure 14 - Volume of consumption ozone depletion substances in Kazakhstan for 1998-
2009. Second, during economic reforms in the ninetieth years, many businessmen bought new
technical equipment which has been already initially charged by transitive substances, and besides corresponded{met} to the international requirements of manufacturing of that moment. It turns out, that demand has not increased yet because of rather new equipment which is maintained in commercial sector.
The third reason of such position, can be presence in the market and sphere of services of illegal freon which does not get under the control of official statistics, but, nevertheless is present. It still proves to be true also that fact, that after 2004 when Kazakhstan has completely refused to operait of the CFC substances, demand for transitive substances in all sectors, has increased insignificantly.
The fourth reason of such situation can be, the incorrect statistical data for the period of 1998 with which values we carry out comparisons. There is a probability, that these data for any reason have been strongly overestimated, or the methodological mistake in calculations is accomplished. The probability of it is improbable, however completely to exclude it does not follow.
As the fifth reason it is possible to assume, that after introduction of some programs in territory of republic, explanatory work which was conducted among suppliers of the equipment and technicians, the role of the fulfilled freon has increased. It is possible, that the enterprises
390
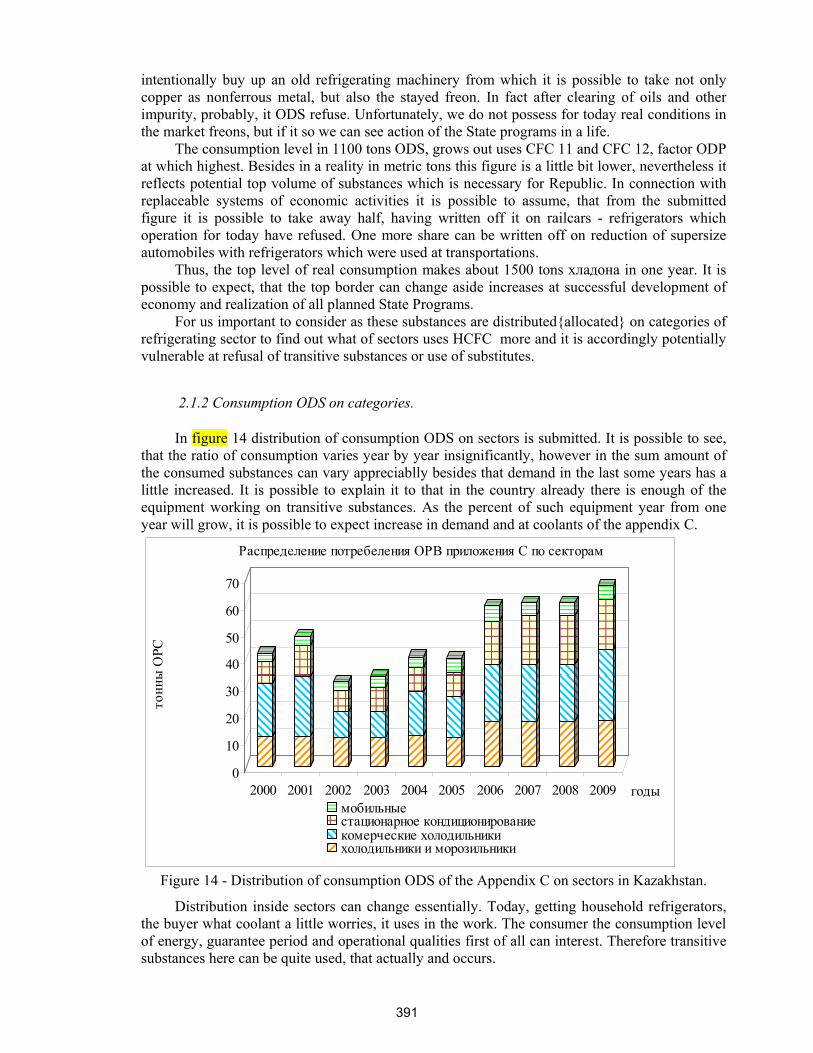
intentionally buy up an old refrigerating machinery from which it is possible to take not only copper as nonferrous metal, but also the stayed freon. In fact after clearing of oils and other impurity, probably, it ODS refuse. Unfortunately, we do not possess for today real conditions in the market freons, but if it so we can see action of the State programs in a life.
The consumption level in 1100 tons ОDS, grows out uses CFC 11 and CFC 12, factor ОDP at which highest. Besides in a reality in metric tons this figure is a little bit lower, nevertheless it reflects potential top volume of substances which is necessary for Republic. In connection with replaceable systems of economic activities it is possible to assume, that from the submitted figure it is possible to take away half, having written off it on railcars - refrigerators which operation for today have refused. One more share can be written off on reduction of supersize automobiles with refrigerators which were used at transportations.
Thus, the top level of real consumption makes about 1500 tons хладона in one year. It is possible to expect, that the top border can change aside increases at successful development of economy and realization of all planned State Programs.
For us important to consider as these substances are distributed{allocated} on categories of refrigerating sector to find out what of sectors uses HCFC more and it is accordingly potentially vulnerable at refusal of transitive substances or use of substitutes.
2.1.2 Consumption ОDS on categories. In figure 14 distribution of consumption ОDS on sectors is submitted. It is possible to see,
that the ratio of consumption varies year by year insignificantly, however in the sum amount of the consumed substances can vary appreciablly besides that demand in the last some years has a little increased. It is possible to explain it to that in the country already there is enough of the equipment working on transitive substances. As the percent of such equipment year from one year will grow, it is possible to expect increase in demand and at coolants of the appendix C.
0
10
20
30
40
50
60
70
тонны
ОРС
2000 2001 2002 2003 2004 2005 2006 2007 2008 2009 годы
Распределение потребеления ОРВ приложения С по секторам
мобильные стационарное кондиционированиекомерческие холодильникихолодильники и морозильники
Figure 14 - Distribution of consumption ОDS of the Appendix C on sectors in Kazakhstan.
Distribution inside sectors can change essentially. Today, getting household refrigerators, the buyer what coolant a little worries, it uses in the work. The consumer the consumption level of energy, guarantee period and operational qualities first of all can interest. Therefore transitive substances here can be quite used, that actually and occurs.
391

In other sectors where the equipment is in itself estimated highly, there is a high probability, that buyers already now began to pay attention what coolant is used. In fact not far off prospect of full refusal of use of transitive substances. To appear in a situation when the equipment is, and to fill it there will be nothing, nobody would like. Certainly, there is a variant of a choice of other substances which will meet not absolutely to all operational requirements that will cause losses of efficiency, and, hence, financial losses [6-8, 11-13, 38].
2.1.3. Influence on climate ОDS
Calculations are executed on the basis of the data contained in the report on the first stage of researches. Thus as it is accepted in world{global} practice, that banks annually lose 5 %, HCFC contained in them. Transitions coefficients are taken in accordens with recommendations of IG on CC UNEP. [20] and [34]. Estimations of emissions СО2-ecv. are executed on groups галоидоуглеводородов, and then shown together (Figure 15).
0,00
200,00
400,00
600,00
800,00
1000,00
1200,00
1400,00
1600,00
1800,00
1998
1999
2000
2001
2002
2003
2004
2005
2006
2007
2008
2009годы
Килотонны
ГХФУ 22 ГХФУ-141b ГХФУ-142 b Бром метил
Fig. 15 - Total emissions СО2-экв., for the period 2000-2009 гг
Consumption HCFC such as 141b is carried out in small amounts. Sizes of
consumption make approximately 5 % in comparison with HCFC such as -22. Emissions СО2-ecv., however, make only 3-4 % in comparison with HCFC -22, that is caused by a parity between factors ПГП 5:2 for these groups. A maximum of consumption HCFC -141b then its consumption began to fall sharply.
HCFC such as -142b are used in the same quantity{amount}, as -141b. Emissions СО2-ecv., however, exceed similar from -141b in eight times. It is caused by that ODP for -142b three times is more, than for -141b.
It is possible to expect, that by 2015 emissions СО2-tcv.. on substances -141b and 142b will be small as consumption of these substances tends to reduction.
As against calculations on other substances in this case was accepted, that all got bromic methyl was used within one year. Consumption of bromic methyl has appreciablly increased last years, approximately in 4 times in comparison with 2000. At the same time emissions СО2-ecv. (greenhouse effect) from group E are insignificant, since. ODP for this substance makes only 5.
Total emissions СО2-ecv.. from all groups HCFC for the period with 1998 on 2008 are resulted in the table 5. These emissions from a minimum in 2000 (10-20 Кт) have increased by
392
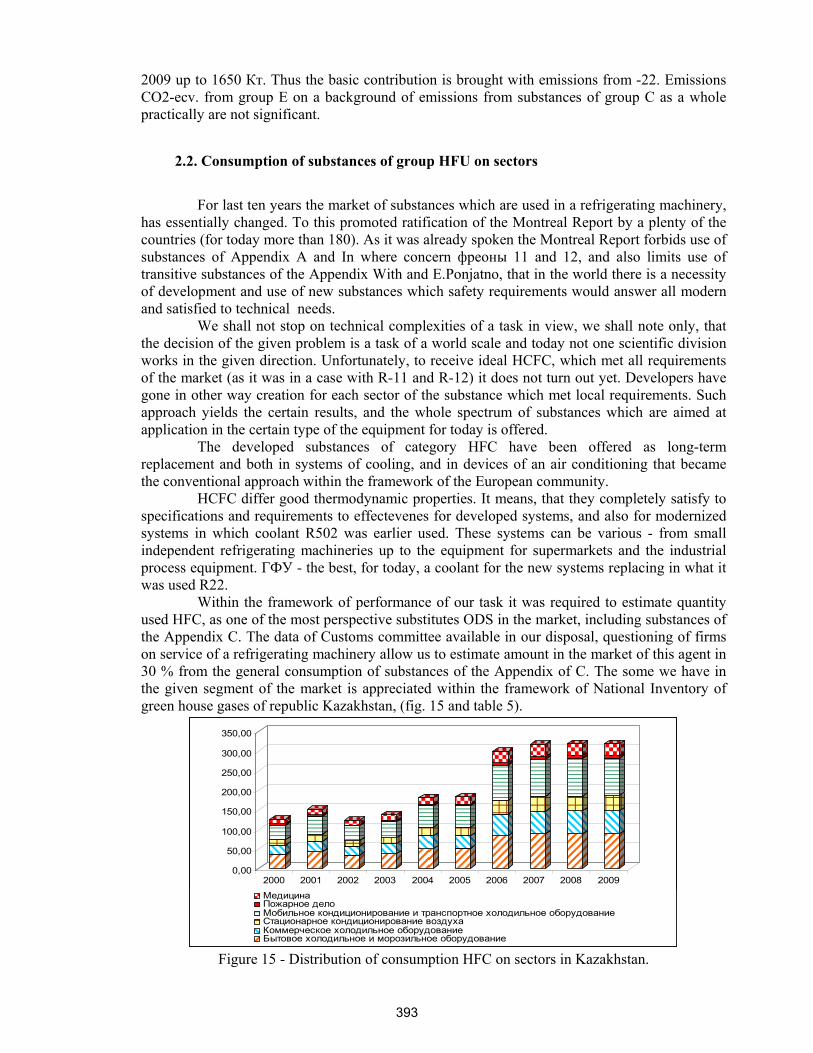
2009 up to 1650 Кт. Thus the basic contribution is brought with emissions from -22. Emissions СО2-ecv. from group E on a background of emissions from substances of group C as a whole practically are not significant.
2.2. Consumption of substances of group HFU on sectors
For last ten years the market of substances which are used in a refrigerating machinery,
has essentially changed. To this promoted ratification of the Montreal Report by a plenty of the countries (for today more than 180). As it was already spoken the Montreal Report forbids use of substances of Appendix A and In where concern фреоны 11 and 12, and also limits use of transitive substances of the Appendix With and E.Ponjatno, that in the world there is a necessity of development and use of new substances which safety requirements would answer all modern and satisfied to technical needs.
We shall not stop on technical complexities of a task in view, we shall note only, that the decision of the given problem is a task of a world scale and today not one scientific division works in the given direction. Unfortunately, to receive ideal HCFC, which met all requirements of the market (as it was in a case with R-11 and R-12) it does not turn out yet. Developers have gone in other way creation for each sector of the substance which met local requirements. Such approach yields the certain results, and the whole spectrum of substances which are aimed at application in the certain type of the equipment for today is offered.
The developed substances of category HFC have been offered as long-term replacement and both in systems of cooling, and in devices of an air conditioning that became the conventional approach within the framework of the European community.
HCFC differ good thermodynamic properties. It means, that they completely satisfy to specifications and requirements to effectevenes for developed systems, and also for modernized systems in which coolant R502 was earlier used. These systems can be various - from small independent refrigerating machineries up to the equipment for supermarkets and the industrial process equipment. ГФУ - the best, for today, a coolant for the new systems replacing in what it was used R22.
Within the framework of performance of our task it was required to estimate quantity used HFC, as one of the most perspective substitutes ОDS in the market, including substances of the Appendix C. The data of Customs committee available in our disposal, questioning of firms on service of a refrigerating machinery allow us to estimate amount in the market of this agent in 30 % from the general consumption of substances of the Appendix of C. The some we have in the given segment of the market is appreciated within the framework of National Inventory of green house gases of republic Kazakhstan, (fig. 15 and table 5).
0,00
50,00
100,00
150,00
200,00
250,00
300,00
350,00
2000 2001 2002 2003 2004 2005 2006 2007 2008 2009
МедицинаПожарное делоМобильное кондиционирование и транспортное холодильное оборудованиеСтационарное кондиционирование воздухаКоммерческое холодильное оборудованиеБытовое холодильное и морозильное оборудование
Figure 15 - Distribution of consumption HFC on sectors in Kazakhstan.
393
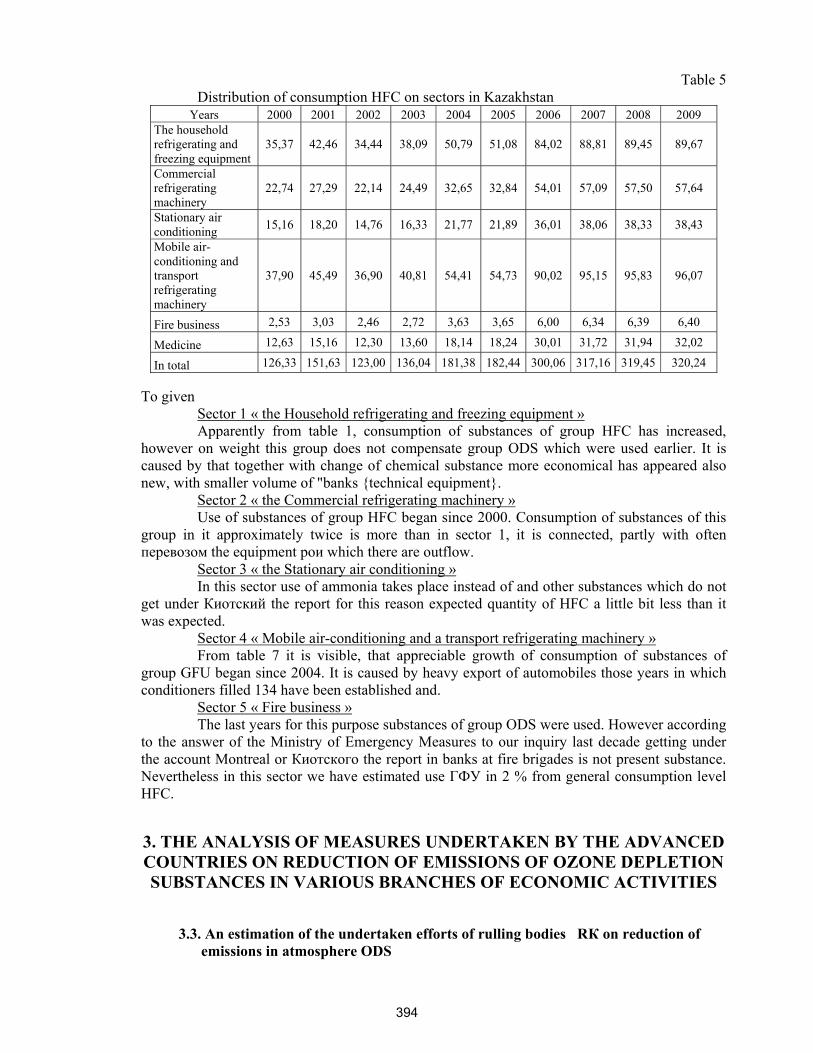
Table 5 Distribution of consumption HFC on sectors in Kazakhstan
Years 2000 2001 2002 2003 2004 2005 2006 2007 2008 2009 The household refrigerating and freezing equipment
35,37 42,46 34,44 38,09 50,79 51,08 84,02 88,81 89,45 89,67
Commercial refrigerating machinery
22,74 27,29 22,14 24,49 32,65 32,84 54,01 57,09 57,50 57,64
Stationary air conditioning 15,16 18,20 14,76 16,33 21,77 21,89 36,01 38,06 38,33 38,43
Mobile air-conditioning and transport refrigerating machinery
37,90 45,49 36,90 40,81 54,41 54,73 90,02 95,15 95,83 96,07
Fire business 2,53 3,03 2,46 2,72 3,63 3,65 6,00 6,34 6,39 6,40
Medicine 12,63 15,16 12,30 13,60 18,14 18,24 30,01 31,72 31,94 32,02
In total 126,33 151,63 123,00 136,04 181,38 182,44 300,06 317,16 319,45 320,24 To given
Sector 1 « the Household refrigerating and freezing equipment » Apparently from table 1, consumption of substances of group HFC has increased,
however on weight this group does not compensate group ODS which were used earlier. It is caused by that together with change of chemical substance more economical has appeared also new, with smaller volume of "banks {technical equipment}.
Sector 2 « the Commercial refrigerating machinery » Use of substances of group HFC began since 2000. Consumption of substances of this
group in it approximately twice is more than in sector 1, it is connected, partly with often перевозом the equipment рои which there are outflow.
Sector 3 « the Stationary air conditioning » In this sector use of ammonia takes place instead of and other substances which do not
get under Киотский the report for this reason expected quantity of HFC a little bit less than it was expected.
Sector 4 « Mobile air-conditioning and a transport refrigerating machinery » From table 7 it is visible, that appreciable growth of consumption of substances of
group GFU began since 2004. It is caused by heavy export of automobiles those years in which conditioners filled 134 have been established and.
Sector 5 « Fire business » The last years for this purpose substances of group ODS were used. However according
to the answer of the Ministry of Emergency Measures to our inquiry last decade getting under the account Montreal or Киотского the report in banks at fire brigades is not present substance. Nevertheless in this sector we have estimated use ГФУ in 2 % from general consumption level HFC.
3. THE ANALYSIS OF MEASURES UNDERTAKEN BY THE ADVANCED COUNTRIES ON REDUCTION OF EMISSIONS OF OZONE DEPLETION SUBSTANCES IN VARIOUS BRANCHES OF ECONOMIC ACTIVITIES
3.3. An estimation of the undertaken efforts of rulling bodies RК on reduction of emissions in atmosphere ОDS
394
For today the Republic Kazakhstan is the party of the Montreal report, accordingly there is a necessity for performance of obligations taken on. The given section is devoted to an estimation of measures applied in Kazakhstan on reduction of consumption ОРВ and transitive substances. Besides from the moment of signing the contract has passed enough time to tell on how many the measures are effective, used I in Kazakhstan for promotion in the market ozone safe substances and corresponding technologies, and whether am present necessity to application of other measures and strengthening available.
For performance of a task in view it is necessary to list the basic measures which have been undertaken in Kazakhstan for the decision of this question. It is necessary to note, that the basic positions of the Government of Kazakhstan contain in a question of protection of an ozone cloud and announcement of Strategy of reduction of consumption ОРВ in a number of acts, the international reports, the Ecological Code, the Concept of the project of the State program « the Effective utilization of energy and renewed resources of Republic Kazakhstan with a view of steady development till 2024 » and other documents, speech about which will go in following subitem [45].
3.3.1. The national legislation, the administrative and legal measures concerning protection of an ozone strata.
The government of Kazakhstan in November, 1999 issues the Decision № 1716 which
component are the Regulations about import / export ODS substances and production containing ОDS with appendices of Lists ОDS and production containing ОDS subject to state regulation [45].
According to article 2 point b the Viennese convention Kazakhstan takes necessary legislative or administrative measures under the control, restriction, reduction or prevention of activity of the person if this activity renders or can render adverse influence, changing or creating an opportunity of adverse change of a condition of an ozone cloud [45].
Introduction of system of sanctions of import / export ОРВ allows to adjust import ОРВ, the obligations of the country following from the Report and for prevention of illegal trade ОРВ both assistance to data gathering and representation of reports in Secretary on ozone [45].
In this connection the decision of Government RK³19 from January, 8, 2004 about introduction of system of licensing on import, export ОDS and on detail connected with manufacture, repair and installation of equipment where it is used ОDS which have been reconsidered and updated by the new Decision of the Government №508 from June, 18, 2007 [] is accepted.
To the sanction are subject: ᄃ Import and export OD substances and production their containing;
ᄃ Manufacture of works with use OD substances and production containing them, and also repair, installation, service of the equipment working on OD substances.
To exclude a problem of " a technological waste dumping », in Kazakhstan restriction on import of the equipment, containing ОDS is entered, by acceptance of the Decision №617 from June, 22, 2005. The given decision enters an interdiction on import ОDS of the List And and the List In and on the equipment containing the given substances [45].
Consumption ОDS is adjusted by the Ecological code of Republic of Kazakhstan (chapter 45): article 314 gives the general{common} requirements under the order of delivery of sanctions to import, export DS substances and production containing them, manufacture of works with use DS substances, repair, installation, service of the equipment containing DS substances, clause{article} 315-318 regulates requirements to consumption DS substances, including carrying out of annual inventory ОDS [45].
395
3.3.2. Data presentation in Secretary on ozone.
Data presentation in Secretary on ozone has great value for maintenance of the control over performance of obligations of the Parties. Within the framework of the Montreal report data presentation is the legal obligation of each Party of the Montreal report Article 7) [].
The data have crucial importance by way of performance by the Parties of the accepted obligations, and at a national level allow to carry out the control strategy of stage-by-stage reduction ОРВ. The responsible persons accepting the decisions at a national level, without the authentic data cannot formulate corresponding measures on regulation of these substances, to develop realistic strategy of stage-by-stage reduction of application and to provide the necessary financial and technical help. Gathering and data presentation is one of the key problems arising during performance of the Montreal report. Therefore inventory and the analysis of the data is considered not only as the requirement, but also as the useful instrument in this important business [45].
Each Party{Side} annually submits data on all adjustable substances, including the data on consumption (application) on sectors, import, export and to manufacture ОРВ [45].
Alongside with annual reports on the data on adjustable substances, secretary of Fund the information on actions on maintenance of administrative and organizational support under Montreal report [45] is represented.
Besides within the framework of actions on preservation of an ozone cloud in our country the certificated rates on training and improvement of professional skill at the personnel of the firms connected to sale or service of a refrigerating machinery are organized. Such rates are the important making internal policy (strategy) as many questions connected to the legal moments, technical subtleties and other questions allow to inform up to the persons involved directly in sector where the infringements are possible{probable}. The important component of a rate is the explanation in necessity of transition on new DS substances, acquaintance with characteristics хладонов and their properties.
For the period since 2006 courses of improvement of qualification on training technical operation and safety of works with DS substances were passed by 176 persons, representatives of the largest companies, and also individual businessmen from all regions of Kazakhstan: "ИСПАТ-КАРМЕТ", joint-stock company « Steel Temirtau », firm « EES Support Services », « Marked YORK - KAZAKHSTAN », « Данон the Golden eagle », joint-stock company « Aluminium of Kazakhstan, joint-stock company " Вагонсервис ", ТД "Нафта", Open Company " Imagination " " Каганат ", « Тантай groups », « FSKY-SERVICE GROUP, "Салтек", « КвадроСервисЭлектроникс, "SungateСервис", « the East the Climate », « Air Еnergy Com », "Proline", "Climate - 7", "БытТехСервис", « ЕFFE group », « Технодом service », « Datex engineering », "Хладо-service", "Climate - control", "КазВентСервис", "Интерхолод", ИП "Ананчев", "Торопов", "Ниетпаев", etc.
Also within the framework of the designated actions at participation of the international organizations in Kazakhstan the complex of the equipment on extraction and clearing of old freon (forbidden 11 and 12), for its repeated use or recycling of a failed refrigerating machinery has been put. Within the framework of the Montreal contract such practice is supposed. It allows to support at a stage of a choice of the future refrigerating systems the available equipment in working order, to reduce internal deficiency of agents thus to lower risks of use of illicit production. It is considered, that at absence of the great demand, many manufacturers in the countries, not joined to the Montreal report, will refuse manufacture forbidden хладонов for the lack of demand for it, and will be compelled to reorient the manufactures on allowed HCFC. In this case reorientation of manufactures will demand from such countries of financial investments which they can receive from the World or International financial organizations, that actually conducts to the introduction of such countries into the Montreal contract.
396
3.4. Necessary actions for maintenance of the program of the Government.
From the previous chapter{head} it is possible to draw a conclusion, that as a whole in the country it is made much, for successful realization of the internal program on reduction of use ODS and to refusal of use of transitive substances.
The basic result which has been achieved is a full refusal of use 11 and 12 фреонов in 2005. Now for Republic very important question, necessities of connection to other amendments to
the basic contract is. In this question it is necessary to realize precise understanding of all consequences of such step for a national economy. There are many weighty arguments to detain, connection to the Copenhagen, Peking and Montreal amendments. But also is it is a lot of, reasons for the benefit of such step. First of all it is an opportunity to expect for financial support of solid financial institutions, and to increase the status of the country in opinion of world community. It is necessary to understand, that behind connection or refusal of connection well weighed policy based, on comprehension of the responsibility for concrete action is necessary. Besides it demands much, time for internal study of a question with the big stage of preparation of all legal and technical questions connected to the decision.
The precise control over Customs committee, the internal control over work of corresponding firms through licensing and certification allows to supervise this sector successfully. However, there is open a question of the reporting. Today the basic reporting is carried out on the basis of the information of Customs Committee and it is logical, as inside Republic there are no corresponding manufactures. However with transition to Transitive substances of group With, and use ozone safe agents, some of which, can quite be made on oil refineries, the level of such reporting will be insufficient.
Now speech already goes not only about the Montreal contract, it is known, that such substances have a more potential of global warming here again the clear data in frameworks Киотского of the report are required.
Pains of that, there is a probability, that with refusal of use of transitive substances mixes which contain small amount R22 will be used, and the account of them is required already. At a modern level of the reporting will check volumes of uses of mixes hardly and necessity will come, to take into account the charge such HCFC at a level of separate firms. Today, for this step it is made much. Questions of domestic trade by emissions in frameworks of the Киотoо report are considered, the level of the reporting of each enterprise or firm raises. Also there are not few preconditions, that these actions finally will affect not only reduction of all emissions GHG in Republic, but also will lead to improvement of the internal reporting, so to the control over workmanship of legislative guidelines.
THE LIST OF THE USED SOURCES 1. Белан И.Д. Проблема тропосферного озона и некоторые результаты его измерений. //
Оптика атмосферы и океана. – 1996. – Том 9. – № 9. – С. 1184 - 1213. 2. Вароцос К.А., Кондратьев К.Я. Загрязнение тропосферы и ультрафиолетовая
солнечная радиация. // Оптика атмосферы и океана. – 1994. – № 2. – С.1020-1030. 3. Егорова Т.А., Розанов Е.В., Зубов В.А., Кароль И.Л. Модель для исследования трендов
озона (мезон). // Известия РАН. Физика атмосферы и океана. – 2003. – Том 39. – № 3. – С. 310-326.
4. Еланский Н.Ф. Российские исследования атмосферного озона в 1999…2002 гг. // Известия РАН. Физика атмосферы и океана. – 2004. – Том 40. – № 4. – С. 567-576.
5. Кароль И.Л., Киселев А.А. Фотохимические модели атмосферы и их использование в исследованиях озоносферы и климата (обзор) // Известия РАН. Физика атмосферы и океана. – 2006. – Том 42. – № I. – С. 3-34.
397

6. Кондратьев К.Я. Глобальная динамика озона. // Итоги науки и техники. Сер. Геомагнетизм и высокие слои атмосферы. Том 19. – М.: ВИНИТИ, 1989. – 212 с.
7. Кондратьев К.Я., Вароцос К.А. Исследование тропосферного озона в Европе // Метеорология и гидрология. – 2000. – № 10. – С. 12-23.
8. Перов С.Я., Хргиан Л.X. Современные проблемы атмосферного озона. – Л.: Гидрометеоиздат, 1980. – 287 с.
9. Хргиан А.Х. Физика атмосферного озона. – Л.: Гидрометеоиздат, 1973. – 292 с. 10. Sinnhuber В.М. et al. Large loss of total ozone during the Arctic winter of 1999/2000. –
Geophys. Res. Lett., 2006, Vol. 27. – No. 21. – P. 3473 - 3476. 11. The Northern Hemisphere Stratosphere in the Winter and Spring of 1999/2000. – The Report
of European Ozone Research Coordinating Union. – 2000. – P. 4 - 6. 12. World Meteorological Organization (WMO). Scientific Assessment of Ozone Depletion:
2002, Global Ozone Research and Monitoring Project – Report № 47. – 2003, P. 3.1—3.58. 13. Демин В.И., Белоглазов М.И., Еланский Н.Ф. Некоторые результаты
мониторинга приземного озона на Кольском полуострове (1999-2003 гг.). - Метеорология и гидрология. 2005, №10, с. 10-20
14. Жадин Е.А. Долгопериодные вариации озона и циркуляции атмосферы. - Метеорология и гидрология. 1999, № 2, с.68-80
15. Звягинцев A.M., Иванова Н.С.Крученицкий Г.М., Кузнецова Н.Н., Лезина Е.А. Содержание озона над территорией Российской федерации в 2006 г. - Метеорология и гидрология, 2007, № 2, с.116-121.
16. 3вягинцев A.M., Иванова Н.С., Крученицкий Г.М., Кузнецова Н.Н., Лезина Е.А., Романюк Я.О. Содержание озона над территорией Российской федерации в 2006 г. -Метеорология и гидрология, 2009, № 3, с.102-109
17. Hemispheric transport of air pollution 2007// Air pollution studies № 16, United Notions, New York and Geneva, 2007, 146 p.
18. First results from the hemispheric EMEP model and comparison with the global Oslo CTM2 model/EMEP, MSC-W, Technical report, №2, 2006, 46 p.
19. Prather M.J. Numerical advection by conservation of second ordermoments/ J.Geophys. Res. 91,6, pp. 671-681.
20. Tiedtke M.A comprehensive mass Них Scheme for cumulus parametrization on large scale models. M. Wea. Rev. 117, 1, 1989, pp. 779-800.
21. Holtslag A.A.M., DrBruijn. E.J.F., Plan H.I. A high resolution air mass transformation model for short-range weather forecasting./Mon. Wea.Rev., 118, 1990, pp. 1561-1575.
22. Wesely M.L. Parametrisation of surface resistence to gaseos dry deposition in regional-Scale numerical models/ Atm. Env. № 23,1989, pp. 1293-1304.
23. 23. Oliver J.G.J., Bedrowski J.J.M. Global emissions sources and sinks// The Climate System, A.A. Balkema Publishers. Lisse, The Netherlands, 2001, pp. 33-78.
24. Price С and an. NOx lightnings// Global distribution based on lightning/Jorn. Geophys. Res. 1997, №102, 5, pp. 943-952.
25. Berntsen Т.К., Jsakson J.S.A. A global 3D chemical transport model for the tropocphere: Models deseription and CO and O3 results./ Jorn. Geophys. Res., №102, 1997, pp. 239-280.
26. Bernsten Т.К., Jsaksen J.S.A. Effects of lightning and convection on changes in upper tropospheric ozone due to aircraft./ Fellus, 51B, 1989, pp. 766-788.
27. Stordal F., Gsaksen I.S.A., Horntvert K. Adiabatic circulation two- dimentional model with photochemistry simulations of ozone and long lived tracers with surface sources/ Jorn. Geophys. Res. №90, 1985, pp.757-776.
398
28. Wild O., Zhu X. and Prather M.G. Fast-J: accurate simulation of in-and below cloud photolysis in tropospheric chemical models/ Jorn. Of Atoms. Chem. №37, 2000, pp. 245-282.
29. Forster C, Stohl A., Wind P. and Benedictow A. Intercontinental air pollution transport.// Transboundary acidification, eulrophication and ground level ozone in Europe/ MSC-W status Report №1, Oslo, Norway, 2005, 49 p.
30. Айвазян С.А., Мхитарян В.С. Прикладная статистика и основы эконометрики. – М.: ЮНИТИ, 1998.
31. Баранник В.В., Маринюк Б.Т., Овчаренко B.C., Афонский В.П. Новый хладоноситель, особенности и перспективы применения. - Холодильный бизнес, 2001, №1.
32. В.Паренти, А.Бирч и др. Дау Юроп СА, Швейцария, «Последние достижения использования изопентана в качестве вспенивающего агента при получении жестких ППУ для приборостроения». Утек '96, статья 60.
33. В.Рейчман, А.Г.Байер, Германия, «Жесткие ППУ могут удовлетворить спрос в промышленности», Утек '96, статья 52.
34. Вопросы Министерства охраны окружающей среды Республики Казахстан: Постановление Правительства РК от 28.10.2004. №1113.
35. Генель Л.С., Галкин М.Л. Влияние хладоносителей на безопасность пищевой продукции. - Холодильный бизнес, 2003, №9.
36. Генель Л.С., Галкин М.Л. Состояние и тенденции развития европейского рынка хладоносителей. - Холодильный бизнес, 2006, №12.
37. Глобальное потепление: позиция Международного института холода //Холодильная техника. 2005. № 4.
38. Израэль Ю.А. Экология и контроль состояния природной среды. - М.: Гидрометеоиздат, 1984. - 560 с.
39. 91/589/ЕЭС (директива ЕЭС об опасных продуктах) 40. Калнинь И.М., Катерухин В.В., Савицкий И.К., Смыслов В.И., Шаталов В.В. Переход
на озонобезопасные хладагенты в условиях России// Холодильная техника. 1997. №1. 41. Калнинь И.М., Смыслов В.И., Фадеков К.Н. Оценка перспектив применения
экологически безопасных хладагентов в бытовой холодильной технике// Холодильная техника. 2001. № 12.
42. Каталог ОАО “Холодмаш”. – Ярославль. 43. Крюкова В.П. Озоновый слой и Монреальский протокол.//Гидрометеорология, 2003. –
№ 2. - С.7. 44. Монреальский протокол по веществам, разрушающим озоновый слой - ЮНЕП,
Секретариат по озону, 2000. - 55 с. 45. Национальный доклад по Венской конвенции об охране озонового слоя и
Монреальскому протоколу по веществам разрушающим озоновый слой за 2008 г. МООС РК. Астана, 2009. - 27 с.
46. О среднесрочном плане социально-экономического развития Республики Казахстан: Постановление Правительства РК от 31.08. 2004 № 917.
47. Об утверждении перечня экологически опасных видов хозяйственной деятельности и Правил их обязательного государственного лицензирования: Постановление РК от 08.01.2004 № 19 // Казахстанская правда от 11.02.2004 г. № 28 САПП Республики Казахстан, 2004. № 1, статья 10.
48. Об утверждении Правил организации и ведения Единой государственной системы мониторинга окружающей среды и природных ресурсов: Постановление Правительства РК от 27.06. 2001 № 885.
49. Охрана озонового слоя и глобальной климатической системы./Вопросы, связанные с гидрофторуглеродами и перфторуглеродами/. Доклад МГЭИК и ТЕАП. ВМО, 2005. – 88 с.
50. Пугачев С.В. Изменения необходимы// Стандарты и качество. 2005. № 7.
399
51. Руководство по международным договорам в области охраны озонового слоя – Секретариат по озону, ЮНЕП, 2000. – 432 с.
52. Руководство по представлению данных в рамках Монреальского протокола – Многосторонний Фонд для осуществления Монреальского протокола, ЮНЕП, 1999. – 114 с.
53. Цуранов О.А., Крысин А.Г. Холодильная техника и технология / Под ред. проф. В.А.Гуляева. - СПб., Лидер, 2004, 448 с.
54. Ш.Матсумото, Митсуи Тоат-суКемикалс Инк. «Тенденции развития жестких полиуретановых пен для холодильников в Азии». Утек Азия '95, статья 23
55. ГОСТ РИСО-14004-98 Системы управления окружающей средой. Общие руководящие указания по принципам, системам и средствам обеспечения функционирования. - М: ИПК Издательство стандартов, 1998. – 37 с.
56. ГОСТ РИСО-14001-98 Системы управления окружающей средой. Требования и руководства по применению. - М: ИПК Издательство стандартов, 1998. – 24 с.
57. ГОСТ 12.1.007-76. ССБТ. Вредные вещества. Классификация и общие требования безопасности.
58. Ревелль П., Ревелль Ч. Среда нашего обитания. Кн.2. Загрязнение воды и воздуха. - М.: Мир, 1995.
59. Метеорология и передача технологии. Секретариат ВМО, Женева 1993. - 39 с. 60. Меры по охране озонового слоя – Секретариат по озону, ЮНЕП, 1996. – 19 с. 61. Изменяющийся озоновый слой / Румен Божков – ВМО и ЮНЕП, 1995. – 32 с. 62. Изменение климата, 2001 г. Обобщенный доклад рабочих групп I,II,III в подготовку
третьего доклада об оценке МГЭИК. Под редакцией Роберта Т.Уотсона. Женева, 220 с. 63. Изменение климата, 2007 г. Смягчение последствий изменения климата. Четвертый
доклад МГЭИК, 2007. - 123 с. 64. Отчет о научно-исследовательской работе. - КазНИИМОСК, 1997. – 155 с. 65. Отчет о научно-исследовательской работе. - КазНИИМОСК, 2006. – 177 с. 66. Отчет о научно-исследовательской работе. - КазНИИМОСК, 2007. – 48 с. 67. Отчет о научно-исследовательской работе. - КазНИИМОСК, 2008. – 59 с. 68. Об охране окружающей среды: Закон РК от 15.06.1997 № 160. 69. ГОСТ 28084-89. Жидкости охлаждающие низкозамерзающие. Общие технические
условия. 70. F. Hillerns. Thermophysical Properties and Corrosion Behavior of Secondary Coolants.
Ashrae Winter Meeting, Seminar 19. - Atlanta, GA, 2001, Jan., p. 27- 31. 71. Zafer Ure. Benefits that flow from secondary systems. - Refrigeration and Air
Conditioning, 2000, July, p.32- 36. 72. http://www.izolan.ru/articles.php?id=5 73. http://www.rk-n.ru/press/index.php?id=12 74. http://test.holodteh.ru/ht/?menu=detal&id=1321
400
The Russian Federation National Report on Studies of the Earth Ozone Layer 1. Observations
Routine observations of atmospheric ozone comprise observations of total ozone (TO), its vertical distribution, and surface ozone concentrations.
Routine observations of nitrogen dioxide comprise observations of its content in the vertical atmospheric column. 1.1. Observations of to tal ozone and other gases / constituents responsible for ozone loss.
In the Russian Federation, responsibility for regular total ozone measurements and interaction with the corresponding WMO bodies lies with the Federal Service for Hydrometeorology and Environmental Monitoring (Roshydromet). Daily TO measurements are being performed on the network of 28 ozone measuring stations (with TO observations resumed on Heiss Island in 2008), located in the Russian Federation, Ukraine and Kazakhstan and equipped with М-124 filter ozonometers. Technical and methodological support of the network is provided by A.I. Voeykov Main Geophysical Observatory (MGO). Observational data are transmitted on-line to the Central Aerological Observatory (CAO) and MGO. CAO performs primary data quality control, archives the data and transmits it on-line to the World Ozone and UV Data Centre (WOUDC) under the Environment Service of Canada. Apart from that, CAO provides operational mapping of TO distribution over the territories of Russia and adjacent countries, revealing anomalies and analyzing the reasons for their occurrence. At MGO, the data undergo more thorough quality control, which enables defining the quality of performance of separate instruments, consecutive data correction, and transmission of final data to WOUDC.
MGO has completed upgrading of M-124 ozonometers that had been in operation on the network for over 25 years, which permitted further TO observations at Roshydromet stations. In the course of modernization, the techniques and programs of processing clear and cloudy sky zenith measurements have been improved, which made zenith TO measurements as accurate as direct solar light ones. The ability to measure in any cloudy conditions (except on precipitation days) in the range of a 5° to 70° sun elevation considerably enlarged the amount of information from the stations and enhanced observations at high-latitude stations.
In 2008-2010, four of the stations tested experimental models of UV ozone spectrometer (UVOS) developed for upgrading the equipment of Roshydromet ozone network. This instrument enables measuring TO, registering total UV and zenith radiation in a 290-400 nm range with resolution less than 1 nm and exposure less than 2 s. The network stations are expected to be reequipped with spectral instruments before 2015.
Besides, TO measurements are made at reference sites by institutions of Roshydromet and the Russian Academy of Sciences (RAS) using M-124 ozonometers, Dobson and Brewer spectrophotometers, and SAOZ instrument. Brewer spectrophotometer measurements of TO are performed in Kislovodsk (Obukhov Institute of Atmospheric Physics, RAS), Tomsk (Zuev Institute of Atmospheric Optics, RAS), Obninsk (SI RPA ‘Typhoon’), and Yakutsk (CAO). Total ozone and NO2 are measured with
401
SAOZ instrument at two high-latitude stations, Salekhard (67°N, 67°E) and Zhigansk (66°N, 123°E) (CAO).
Regular measurements of NO2 content in the vertical atmospheric column have been conducted at Zvenigorod research station of A.M. Obukhov Institute of Atmospheric Physics (IAP), RAS, since 1990. The measurements are made with a spectrophotometer based on a domestic monochromator MDR-23, by an original technique. NO2 vertical profile is reconstructed from twilight morning and evening measurements, and then, NO2 content in the vertical atmospheric column and, separately, in the boundary layer is determined. The station is included in the International Network for the Detection of Atmospheric Composition Change (NDACC), its NO2 measurement data being readily available at the NDACC server, at the address: http://www.ndacc.org/. 1.2. Measurements of the v ertical distribution of ozon e and other gases / constituents responsible for ozone loss.
Measurements of ozone profiles using ozone sondes in winter and spring seasons are carried out at Salekhard station within the framework of the European International program MATCH (CAO). Ozone profiles in the height range of 20-50 km, using microwave radiometer (142.2 GHz) are measured in Moscow (P.N. Lebedev Physical Institute, RAS). In Tomsk (the Institute of Atmospheric Optics, Siberian Branch of RAS), regular lidar measurements of ozone, NO2 and aerosol profiles at heights up to 70 km are conducted. Besides, monthly measurements of vertical ozone distribution in the troposphere (0-7 km), using chemiluminescent and UV-photometry (TEI-49) ozone gas analyzers installed on board AN-30 aircraft have been conducted there since 1997. These measurements have made it possible, in particular, to assess the influence of different cloud types on ozone concentration. Also initiated there have been experimental studies of the diurnal variation of vertical ozone distribution in the lower troposphere (up to 2-3 km) from board an aircraft. 1.3. Ground-based ozone concentration measurements
Ozone concentration measurements of many years, conducted at remote high-mountain stations in Russia, aim at detecting its long-term changes in the free troposphere. Routine measurements of ozone concentration have been carried out at Kislovodsk High-Mountain Science Station, 44o N, 43o Е, 2070 m a.s.l. (the RAS Institute of Atmospheric Physics), since1989, Terskol station, 43o N, 43o Е, 3100 m a.s.l. (the Ukraine Main Astronomical Observatory and CAO), since 2002, Mondy station, 51o N, 101o Е, 1304 m a.s.l. (the RAS Limnology Institute), using UV gas-analyzers. The UV gas-analyzers are regularly calibrated at D.I. Mendeleyev All-Russia Research Institute of Metrology or compared with the National Standard of Japan. Measurements of surface ozone concentration and concentrations of other minor atmospheric constituents are also fulfilled at a number of flat-country science stations (Moscow, the RAS Institute of Atmospheric Physics; Dolgoprudny, CAO; Obninsk, SI RPA ‘Typhoon’; Tomsk, the Institute of Atmospheric Optics, Siberian Branch of RAS, etc.). In order to study the space and time variability of surface ozone and other minor gaseous atmospheric species, the experiment TROICA (Transcontinental Observations into the Chemistry of the Atmosphere) is being continued, wherein concentrations of the gases are measured annually along the railways, generally, along ‘Moscow-Khabarovsk’ railway. Specialists from Germany, USA, Finland, and Austria are involved in the experiment.
402
1.4. UV-irradiation measurements 1.4.1. Wide-band measurements
Pilot measurements of UVB-radiation have been carried out at 14 ozone measuring station of Roshydromet since 2006. The UV radiation (UVR) measurements follow the technique developed by MGO and use M-124 ozonometers with correction attachments (Larche sphere). Observational results will be available after calibration of the ozonometers with attachments against an UVR reference sample.
1.4.2. Narrow-band filter measurements
Long-term regular measurements of UV-irradiation in an UV-B spectral range, using an UVB-1YES pyranometer, have been conducted at Lomonosov Moscow State University (MSU) since 1999 and in a 300-380 nm range since 1968. 1.4.3. Spectral measurements
UV-B radiation monitoring using Brewer instruments have been carried out in Kislovodsk since 1989, in Obninsk since 1991, and in Tomsk since 2006.
Besides, at 4 stations of Roshydromet, pilot measurements of the spectral composition of total (global) UV radiation within a 290-400 nm range have been conducted since 2008.
1.5. Calibration procedure 1.5.1 Calibration of ozonometers M-124
MGO fulfils calibration of ozonometers М-124. TO reference is provided by Dobson spectrophotometer No.108, which, in turn, once in 4 years undergoes intercalibration procedure at the WMO European Calibration Center. For the period 1988-2009, Dobson No.108 TO departure from WMO reference values was not more than 1%.
1.5.2 Regular quality control of TO measurements
TO measurement scale stability is maintained through regular calibration of ozonometers М-124 at MGO and monthly ozonometer intercomparisons at the stations. Each station has got 3 instruments – operational, back-up, and reserve. After repair (upgrading) and calibration at MGO, reserve ozonometer is set up at the station and becomes operational. The cycle covers 2 years.
MGO provides continuous control of measurement quality and performance rate of ozonometers
to reveal measurement scale changes and, if required, correct measurement results. Ozonometers showing considerable changes in measurement scale are replaced ahead of the schedule time and undergo calibration. 1.5.3 UV calibration
In 2010, an operational, Category 1 reference sample of irradiation spectral density in a 250-800 nm range, based on a quartz-halogen bulb, certified by the Russian Federation State Agency for Standardization, Gosstandard, was introduced to practice. Absolute scale calibration of UV radiation measurements will be performed at MGO beginning from 2011.
403
1.5.4 Brewer spectrophotometer calibration All the Brewer spectrophotometers in Russia, operated in Obninsk, Kislovodsk,
Yakutsk, and Tomsk, were last calibrated in 2008. 2. Measurement data analysis results
A number of studies conducted are devoted to analyzing long-term ozone layer changes and revealing quantitative relations between TO variability and various geo- and heliophysical factors. It is shown that in mid and high latitudes of the northern hemisphere and, in particular, over the territory of the Russian Federation, following TO However, with the observed rate of recovery, TO level characteristic of the 1970’s would only be reached in several decades (Zvyagintsev and Ananiev, 2010; Titova and Karol’, 2010). Analysis of the global TO time series for 1964–2006, constructed from the data of the world ground-based ozone measuring network, shows that its drastic decrease in the period between the mid 1070’s and mid 1990’s cannot be only assigned to anthropogenic influence (Bekoriukov et al., 2009). Using the methods of natural orthogonal functions (Kramarova, 2008), regression analysis (Zvyagintsev and Ananiev, 2010), spectral and discrimination analysis (Titova et al., 2009; Titova and Karol’, 2010), quantitative effects of the polar stratospheric temperatures, the arctic oscillation, quasi-biennial oscillation, and El-Nino – southern oscillation on TO changes in different regions of the world have been estimated.
Analysis of stratospheric ozone concentration measurements from satellite-borne instrument SAGE II, obtained during 1984-2005, has yielded estimates of the linear ozone trend for three 10-km layers (15–45 km) over the south of the European territory of Russia. It is shown that the rate of ozone concentration decrease is maximal in the upper stratosphere (a 35–45 km layer), amounting to about 3 % per decade (Ionov, 2009).
Lidar sounding data on ozone, aerosol, and temperature in the stratosphere over Tomsk have promoted clarifying the influence of the world centers of action on the vertical distribution of these parameters through constructing regression models (Kruchenitsky and Marichev, 2008).
From the results of long-term measurements of total NO2, quantitative estimates of the diurnal and annual variations in NO2 content, of the role of Pinatubo eruption in NO2
decrease, NO2 changes during an 11-year cycle of solar activity, and linear trends of NO2
content, depending on latitude, were obtained (Gruzdev, 2009). Analysis of the long-term TO data from the World Ozonometer Network and computations using 2D model SOCRATES demonstrated that changes in short-wavelength solar radiation during an 11-year solar activity cycle affects the intensity of the meridional transport of stratospheric ozone during autumn and winter seasons (Gruzdev, 2008).
The influence of an 11-year cycle of solar activity on quasi-biennial variations of ozone and temperature observed in the Canadian Arctic sector is discussed in (Sitnov, 2009). The variability of phase correlation between long-term TO variations at Arosa station and the number of sun-spots during the period 1932-2009 was investigated (Visheratin et al., 2008; Visheratin, 2011). The correlation between inter-diurnal TO variations from TOMS data and the most intense solar flares during the period 1979-2005, with spatial resolution of about 100 km, was explored (Visheratin and Shilkin, 2009). A study to explore the perturbation action of 20 tropical North Atlantic cyclones upon TO
404
field, based on TOMS data, for all cyclone evolution phases from depression to hurricane was fulfilled (Nerushev, 2008).
The parameters of short- and long-term variability of aerosol over Siberian lidar station were determined (Zuev et al., 2008a). Quantitative effects of aerosol, including that of volcanic origin, on the ozone layer parameters were revealed (Zuev et al., 2008d, 2010). Lidar soundings of ozone detected quite a rare process of the stratosphere-troposphere transport across the tropopause (Zuev et al., 2008b).
Based on the results of a synoptic analysis of mean monthly and mean diurnal TO fields, differences were found in the directions of the zonal transport of air masses containing different ozone amounts, depending on temperatures in the polar winter stratosphere, and phase of quasi-biennial oscillations (Syrovatkina et al., 2008).
Processes of air-mass exchange through the tropopause in extra-tropical latitudes were studied by analyzing balloon sounding data on ozone and water vapor, obtained during the field campaign LAUTLOS, as well as by using a trajectory model to clarify the origin of air masses and estimate fluxes through the tropopause (Luk’yanov et al., 2009).
Measurement time series of biologically active, erythema-weighted UV irradiation in Moscow for the period 1999-2006 were analyzed and its time variation was retrieved for the period 1968-2006 (Chubarova, 2008). The reconstructed model was used to show a marked growth of the rate of erythema-weighted UV irradiation in 1980-2006 due to changes in TO, effective cloud transparency, and aerosol loading. However, no statistically reliable changes in erythema-weighted UV irradiation were observed during a longer period, from 1968 to 2006, which is primarily due to considerable reduction of effective cloud transparency during that period.
A review comprising the most recent information about the chemical composition of the stratosphere and mesosphere has been compiled. The information had been obtained in different seasons and in both hemispheres, using instruments such as MIPAS (IR limb sounder), SCIAMACHY (UV-visible and near- IR nadir and limb viewer) and GOMOS (Global Ozone Mapping Spectrometer) aboard ENVISAT launched in 2002, as well as high-resolution instruments to measure important gaseous species in the stratosphere and upper troposphere on board the recently launched satellite Aura, i.e., HIRDLS – High Resolution Dynamics Limb Sounder, TES – Tropospheric Emission Spectrometer, OMI – Ozone Monitoring Instrument, and upgraded MLS - Microwave Limb Sounder (Repnev and Krivolutsky, 2010).
The results of ground-based spectrometer measurements of atmospheric column NO2 content from IAP Zvenigirod Research station were used to validate NO2 data from OMI (Ozone Monitoring Instrument) on board the US satellite EOS-Aura (Gruzdev and Elokhov, 2009; Gruzdev and Elokhov, 2010). 3. Theoretical, modeling, and other studies
Using a three-dimensional chemical-climatic model HAMMONIA, the influence of 27-day rotational variations of solar radiation on the chemical composition and temperature of the stratosphere, mesosphere, and lower troposphere were studied (Gruzdev et al., 2009). The model results were compared with observational data on tropical ozone and temperature response to a 27-year solar cycle.
The reasons for the enhancement in the XXI century of Brewer-Dobson meridional circulation, which in turn leads to TO increase in extra-tropical latitudes and its reduction
405
and lower stratosphere cooling in the tropics, were revealed through the use of a tree-dimensional chemical-climatic model SOCOL (Schraner et al., 2008), developed at MGO in cooperation with the Physical and Meteorological Observatory (Davos, Switzerland) and the Higher Polytechnic School (Zurich, Switzerland). It was inferred that the enhancement Brewer-Dobson model circulation in SOCOL resulted from increased wave activity of planetary and gravitational waves in the troposphere (Zubov et al., 2011). Using a 2D model of atmospheric photochemistry, radiation, and dynamics (SOCRATES), it was shown that ozone inflow to mid latitudes is enhanced when solar activity is high compared with its minimal activity period (Груздев, 2008). According to modeling data, this mechanism accounts for up to 30% of the winter increase of ozone content in the layer of ozone maximum (at about около 22 km) in mid latitudes of the southern hemisphere at the peak of an 11-year solar activity cycle, while in mid latitudes of the northern hemisphere, its major input to the 11-year variations of ozone content in this layer is made in the second half of winter. A thermodynamic-microphysical model of the formation and evolution of polar stratospheric clouds was constructed and integrated into the chemical-climatic model of the lower and middle atmosphere. Model experiments were staged to study the evolution of gaseous and aerosol composition of the stratosphere in Antarctica and the Arctic. The results of studying differences in the changes occurring in the amount of gaseous minor species and aerosol in polar regions show that the formation of a full-scale ozone hole in Antarctica and only casual “mini-holes” in the Arctic is mainly due to de-nitrification observed in Antarctica and its absence in the Arctic (Smyshlyaev et al., 2010).
Using an analytical and a 1D numerical photochemical models, stratospheric ozone sensitivity to the linear trends of the amount of NO2 and HCl vapor, leading to changes in ozone destruction rate in nitrogen and chlorine photochemical cycles, was estimated. (Gruzdev, 2009). It was shown that to correctly estimate ozone loss due to halocarbons, whose release to the atmosphere is governed by the Montreal Protocol provisions, long-term trends in NO2 content have to be allowed for.
A lidar to measure ozone concentration distribution in the upper troposphere–lower stratosphere was developed (Zuev et al., 2008c; Burlakov et al., 2010).
A technique to determine TO with high space (3 × 3 km2) and time (15 min.) resolution through measurements of the Earth’s outgoing thermal radiation from geo-stationary METEOSAT platforms was suggested (Polyakov and Timofeev, 2008). The technique employs measurements of SEVIRI instrument (8 IR channels) and supplementary information about a three-dimensional atmospheric temperature field and surface temperature from polar satellites (AIRS instrument). Yuri M. Timofeev and his colleagues suggested several improved algorithms to determine TO and vertical distribution of ozone, using satellite-borne UV and IR instrumentation (Virolainen and Timofeev, 2008, 2010; Polyakov et al., 2008, 2010; Polyakov and Timofeev, 2010).
For the first time ever, the mechanism of halogen activation in the lower stratosphere was completed with a new reaction cycle including a family of peroxide compounds, H2O2, H3O2
+, and HSO5-. It was shown that reactions of these substances
with chloride and bromide anions present in sulphate aerosol particles (Junge layer) can, depending on the conditions, either increase or weaken the influence of halogen activation on the ozone layer in mid latitudes (Larin and Yermakov, 2010). The ozone depleting and greenhouse potentials of C3F7I and C2F4I2, which could be used to extinguish fires, were estimated (Larin et al., 2010a). By using a method of resonance fluorescence, the
406
constants of the rates of reactions of oxygen atoms with molecular chlorine and iodo-methane were measured (Larin et al., 2010b); also, the formation of atomic iodine through a heterogenic reaction of atomic chlorine with iodo-methane was studied (Larin et al., 2010). Model data on the impact of galactic cosmic rays (GSRs) on minor atmospheric species, including OH, HO2, O3, O(1D), O(3P), NO, NO2, NO3, N2O5, HNO2, HNO3, HNO4, ClO, ClONO2, HCl, HOCl, Br, BrO, and HOBr, were obtained. It is shown that relative changes in some of the constituents at a 15-20 km level in mid latitudes due to GSRs can reach or exceed 20%. Also shown is that TO decrease in mid latitudes during the 11-year cycle of solar activity, which determines changes in GSRs flux intensity, can account for one third of the atmospheric ozone loss in the late XX century due to anthropogenic release of chlorofluorocarbons (Larin, 2010).
4. Dissemination of results 4.1. Archiving, storage, and transfer of observational results to national and international data archives
The results of TO observations on the M-124 ozonometer network are transmitted to the Hydrometeorological Center of Russia, CAO, and MGO on a daily basis. CAO performs primary data quality control, archives the data and transmits it on-line to the World Ozone and UV Data Centre (WOUDC). MGO receives initial measurement data from the stations, checks its quality, and prepares it for transmission to WOUDC. The ozonometers M-124 having been in operation for over 25 years, despite the upgrading of the instruments, quite a lot of troubles with the measurement scale occur. Therefore, measurement results require thorough verification, and, occasionally, special ozonometer calibration is needed, which precludes timely transfer of verified data to WOUDC.
TO and UV radiation data obtained at Kislovodsk and Obninsk stations using Brewer spectrophotometer are also transmitted to WOUDC.
SAOZ measurement data from the Russian stations are transmitted on-line to the World Data Center in France (http://gosic.org/gcos/SAOZ-data-access.htm).
IAP Zvenigorod research station measurement data on NO2 content in a stratospheric column and in the atmospheric boundary layer are regularly transmitted to NDACC (http://www.ndacc.org/).
4.2. Forecasting and public information
Analyses of the current ozone layer state are presented by CAO in the quarterly reviews of the journal “Meteorologia i Gidrologia” (with its English version disseminated by Springer Publishing House). Annually, the reviews include data on long-term changes of the ozone layer over Russia, which are compared with those observed in other regions of the globe. Information about the ozone layer state over Russia is also published in the annual reports on the climate of the Russian Federation and reviews of the state and pollution of the environment in the Russian Federation, presented by Roshydromet.
The technology of TO and UV index forecasting for the Russian territory has been recently developed by CAO in cooperation with the Hydrometeorological Center of Russia. TO forecasting uses current TO observations and predicted weather parameters. To determine the current state and forecast UV-B irradiation fields, observational data and
407
forecasts of TO, cloudiness, and underlying surface albedo are employed. At the present stage, this technology is just a pilot one.
The following 3 monographs have been published: Zuev, V.V. and V.D. Burlakov. Siberian lidar station: 20 years of stratospheric
optical monitoring. - Tomsk: IAO SB RAS, 2008. 226 с. Belan B.D. Ozone in troposphere. - Tomsk: IAO SB RAS, 2010. 525 p. Krivolutsky A.A., Repnev A.I. Cosmic influences on the ozonosphere of the Earth. -
Moscow: GEOS, 2009. 384 p.
4.3. Scientific publications Below, some basic 2008-2010 scientific publications are listed: Bekoryukov V.I., Glazkov V.N., and Kokin G. A.. Long-Term Variations in Global Ozone,
Izvestiya, Atmospheric and Oceanic Physics, 45 (5), 566-574, 2009. Burlakov V.D., Dolgii S.I., Makeev A.P., Nevzorov A.V., Kharchenko O.V., Romanovsky
O.A., Differential absorption lidar for Ozone sounding in the upper troposphere – lower stratosphere. Pribory i Tekhnika Experimenta, 5, 121-124, 2010 (in Russian).
Chubarova N.Ye. UV variability in Moscow according to long-term UV measurements and reconstruction model, Atmos. Chem. Phys., 8, 3025–3031, 2008.
Elansky N.F. Russian Studies of the Atmospheric Ozone in 2003-2006, Izvestiya, Atmospheric and Oceanic Physics, 45 (2), 207-220, 2009 .
Gruzdev, A.N. Latitudinal dependence of the variations of stratospheric NO2 content. Izvestiya, Atmospheric and Oceanic Physics, 44 (3), с. 345-359, 2008 .
Gruzdev, A.N. Stratospheric ozone sensitivity to long-term changes in the amount of nitrogen dioxide and hydrochloric acid. Reports, RAS, 427 (3), 384-387, 2009 (in Russian). .
Gruzdev A.N. and A.S. Elokhov. Validation of OMI measurements of NO2 content in a vertical atmospheric column on board EOS-Aura, using ground-based measurements at Zvenigorod research station. Izvestiya, Atmospheric and Oceanic Physics, 45 (4), 477-488, 2009.
Gruzdev A.N., Latitudinal structure of variations and trends in stratospheric NO2. International Journal of Remote Sensing, 30 (15), 4227-4246 2009.
Gruzdev A.N., Schmidt H., and Brasseur G.P. The effect of the solar rotational irradiance variation on the middle and upper atmosphere calculated by a three-dimensional chemistry-climate model, Atmos. Chem. Phys., 9, 595–614, 2009.
Gruzdev A.N., Elokhov A.S. Validation of Ozone Monitoring Instrument NO2 measurements using ground based NO2 measurements at Zvenigorod, Russia. International Journal of Remote Sensing, 31 (2), 497-511, 2010.
Ionov D.V. Vertical structure of long-tern stratospheric ozone trend from the satellite-borne measurements over southern Russia. Issledovanie Zemli iz Kosmosa, 4, 3-11, 2009 (in Russian).
Kramarova N.A., Effect of Certain Geo- and Heliophysical Factors on the Variability of Ozone and UV Irradiance Fields in the Tropics, Izvestiya, Atmospheric and Oceanic Physics, 44 (1), 107-116, 2008 .
Kruchenitskii G.M., Marichev V.N., Influence of global geophysical processes on variability of ozone, temperature, and aerosol vertical distribution over West Siberia, Atmospheric and Oceanic Optics Journal (Tomsk), 21 (4), 257-261, 2008 .
Larin I.K., Yermakov A.N., Whether the hydrogen peroxide can participate in halogenactivationin the low stratosphere? Int. J. Remote Sensing, 31 (2), 531-542, 2010.
408
Larin I.K., S.N. Kopylov, E.V. Nikonova. Estimation of ozone depleting and greenhouse potentials and atmospheric lifetimes of C3F7I and C2F4I2. Ekologicheskaya Himia, 18 (2), 65-69, 2009a (in Russian).
Larin I.K., A.I. Spassky, Е.М. Trofimova, L.Е. Turkin. Measurements of constants of the rate of atomic oxygen reactions with chlorine and iodo-methane using a method of resonance fluorescence of iodine and chlorine atoms. Kinetika i Kataliz, 50 (4), 496-502, 2009b (in Russian).
Larin I.K., A.I. Spassky, Е.М. Trofimova, L.Е. Turkin. Atomic iodine formation in a heterogeneous reaction between chlorine and iodo-methane. Kinetika i Kataliz, 51 (3), 1–6, 2010 (in Russian).
Larin I.K. On the influence of galactic cosmic rays on atmospheric composition, greenhouse effect, and the Earth’s ozone layer. Ekologicheskaya Himia, 19 (3), 133-140, 2010 (in Russian).
Luk’yanov A. N., Karpechko A. Yu., Yushkov V.A., Korshunov L.I., Khaikin S.M., Gan’shin A.V., Kyro E., Kivi R., Maturilli M., and Voemel H., Estimation of Water-Vapor and Ozone Transport in the Upper TroposphereLower Stratosphere and Fluxes through the Tropopause during the Field Campaign at the Sodankyla Station (Finland) , Izvestiya, Atmospheric and Oceanic Physics, 45 (3), 294-301, 2009.
Nerushev A.F. Perturbations of the ozone layer induced by intense atmospheric vortices, International Journal of Remote Sensing, 29 (9), 2705-2732, 2008.
Polyakov A.V. and Timofeev Yu.M. Determining Total Ozone from Geostationary Earth Satellites, Izvestiya, Atmospheric and Oceanic Physics, 44 (6), 745-752, 2008.
Polyakov A.V., Rendall K., Kharvei L., Khoke K. A new upgraded algorithm of interpreting SAGE III eclipse measurements. Issledovanie Zemli iz kosmosa, 1, 31-36, 2008 (in Russian).
Polyakov A.V., Timofeev Yu.M. An upgraded technique to determine total ozone content with SEVIRI instrumentation aboard geostationary satellites METEOSAT. Issledovanie Zemli iz Kosmosa, 5, 42-45, 2010 (in Russian).
Polyakov A.V., Yu.M.Timofeev, A.B. Uspenskii. Potentials of determining the amount of ozone and minor gaseous species from the data of satellite-borne, high-resoluton IR- sounders (IKFS-2). Issledovanie Zemli iz Kosmosa, 3, 3-11, 2010 (in Russian).
Repnev A.I. and Krivolutsky A.A. Variations in the chemical composition of the amosphere from satellite measurements and their relation to fluxes of energetic particles of cosmic origin (review), Izvestiya, Atmospheric and Oceanic Physics 46 (5), 535-562 .
Schraner M., Rozanov E., Zubov V., Egorova T. et al., Technical Note: Chemistry-climate model SOCOL: version 2.0 with improved transport and chemistry/microphysics schemes, Atmos. Chem. Phys., 8, 5957-5974, 2008.
Sitnov S.A., On the Influence of the 11-Year Cycle of Solar Activity on Quasi-Biennial Variations in Ozone and Temperature in the Canadian Sector of the Arctic, Izvestiya, Atmospheric and Oceanic Physics, 45 (3), 324-331, 2009.
Smyshlyaev S.P., Galin V.Ya., Shaariibuu G., and Motsakov M.A., Modeling the Variability of Gas and Aerosol Components in the Stratosphere of Polar Regions, Izvestiya, Atmospheric and Oceanic Physics, 46 (3), 265-280, 2010 .
Syrovatkina O.A., I.L. Karol, A.M. Shalamyanskii and L.P. Klyagina. Interannual variations in total ozone fields at high latitudes of the Northern Hemisphere, November to March 1998–2005, Russian Meteorology and Hydrology, 33 (2), 91-97, 2008.
Titova E.A. and Karol’ I.L., Analysis of the Influence that Climatic Variability Has on the Formation of the Total-Ozone-Content Field at Extratropical Latitudes of the Northern Hemisphere, Izvestiya, Atmospheric and Oceanic Physics, 46 (5), 635-642, 2010 .
409

Titova E.A., I.L. Karol, A.M. Shalamyanskii, L.P. Klyagina and A.A. Solomatnikova. Statistical analysis and comparison of external factor effects on the total ozone field over the Russian territory in 1973–2007, Russian Meteorology and Hydrology, 34 (7), 442-453, 2009. Virolainen Ya.A., Timofeev Yu.M. Kompleksnyi metod opredeleniya vertikal'nykh profilei soderzhaniya ozona dlya validatsii sputnikovykh izmerenii, Issledovanie Zemli iz kosmosa, 4, 61-66, 2010 (in Russian).
Virolainen Ya.A., Timofeev Yu.M. Opredelenie elementov vertikal'noi struktury soderzhaniya ozona iz nazemnykh izmerenii solnechnogo izlucheniya s vysokim spektral'nym razresheniem, Issledovanie Zemli iz kosmosa, 3, 3-10, 2008 (in Russian).
Visheratin K.N., Vasilev V.I., Sizov N.I., Current Aspects of Remote Sensing of Earth from Space, 1 (5), 429-434, 2008.
Visheratin K.N., Shilkin A.V. Effect of Sun flares activity of the total ozone content, Current Aspects of Remote Sensing of Earth from Space, 2 (6), 95-103, 2009.
Visheratin K.N. Phase relations between quasidecadal total ozone oscillations and solar cyclisity./ Geomagnetizm i Aeronomia, 51 (4), 2011 (in press) .
Zubov V.A., Е.V. Rozanov, I.V. Rosanova, T.A. Egorova, A.A. Kiselev, I.L. Karol and V. Shmutz. Modeling changes of global ozone and atmospheric dynamics in the XXI century, using chemical-climatic model SOCOL. Izvestiya, Atmospheric and Oceanic Physics, 47 (3), 2011. Zuev V.V., Bazhenov O.E., Burlakov V.D., Nevzorov A.V. Long-term trends, seasonal and anomalous short-term variations of background stratospheric aerosol, Atmospheric and Oceanic Optics Journal (Tomsk), 21 (1), 33-38, 2008a .
Zuev V.V., Burlakov V.D., Dolgii S.I., Nevzorov A.V., El'nikov A.V. Breakthrough of stratospheric air masses into the upper troposphere retrieved from ozone lidar measurements, Atmospheric and Oceanic Optics Journal (Tomsk), 21 (7), 514-519, 2008b.
Zuev V.V., Burlakov V.D., Dolgii S.I., Nevzorov A.V. Differential absorption lidar for ozone sensing in the upper troposphere - lower stratosphere, Atmospheric and Oceanic Optics Journal (Tomsk), 21 (10), 765-768, 2008 c.
Zuev V.V., Bazhenov O.E., Burlakov V.D., Grishaev M.V., Dolgii S.I., Nevzorov A.V. On the effect of volcanic aerosol on variations of stratospheric ozone and NO2 according to measurements at the Siberian Lidar Station, Atmospheric and Oceanic Optics Journal (Tomsk), 21 (11), 825-831, 2008d.
Zuev V.V., Bondarenko S.L., Zueva N.E. Analysis of volcanogenic perturbations in sub-Arctic ozonosphere based on the data of satellite-borne monitoring Issledovanie Zemli iz Kosmosa, No. 6, 22-29, 2010 (in Russian).
Zvyagintsev A.M., Ananiev L.B., Total ozone variability over the Russian territory during the period 1973-2008, Atmospheric and Oceanic Optics Journal (Tomsk), 23 (3), 190-195, 2010. 5. Participation in research projects
Scientists from Russia are involved in the following international projects: НЕРРА - High Energetic Particle Precipitations in the Atmosphere; ISST (International Space Science Institute) - Study of cosmic ray influence upon
atmospheric processes; MATCH - Determination of Stratospheric Polar Ozone Losses); POLARCAT - Polar Study using Aircraft, Remote Sensing, Surface Measurements
and Models, of Climate, Chemistry, Aerosols, and Transport;
410
RECONCILE - Reconciliation of Essential Parameters for an Enhanced Predictability of Arctic Stratospheric Ozone Loss and its Climate Interactions;
SCOUT-O3 - Stratospheric Climate Links with Emphasis on the UTLS; YAK-AEROSIB - Airborne Extensive Regular Observations over Siberia – (Russia-
France experiment). 6. Future activities
It is planned to resume TO observations at the station on Dickson Island (73,5°N, 80,5°E) and thereby completely restore the Russian Federation ozonometer network of 29 stations that were in operation prior to 1991.
In 2011, the tests of the UV ozone spectrometer are to be completed. Within the period of 2012-2015, these instruments are to be installed at all the ozonometer stations of Roshydromet, which will permit automating TO measurements and provide regular measurements of the spectral composition of the global UV radiation in a 290-400 nm range.
As concerns measurements using Brewer spectrophotometer, it is planned to adopt night-time measurements by the moon and measurements of the vertical profile of ozone concentration by an inversion method, as well as to improve the accuracy of measuring total SO2 and aerosol optical thickness through upgrading data processing procedure
It is expected, using three-dimensional models, to estimate the input of solar activity to the global changes in atmospheric chemical composition, the temperature and circulation of the middle atmosphere and troposphere (CAO, MGO).
A model version of the numerical forecast of spatial (3-D) ozone distribution for a month’s and a season’s periods in advance (CAO, HMC).
411