Embed Size (px)
Citation preview
National Department of Health Directorate: Nutrition
National Renal Nutrition Practice Guidelines
for Adults
June 2018

National Renal Nutrition Practice Guidelines for Adults
National Department of HealthDirectorate: Nutrition
June 2018
i
TABLE OF CONTENT
ACKNOWLEDGEMENTS ivACRONYMS vSCOPE AND PURPOSE viBACKGROUND AND MOTIVATIONS viiSECTION A: ACUTE KIDNEY INJURY 1
1. DEFINITIONS 11.1 Classification of acute kidney injury (AKI) 11.1.1 Risk, injury, failure, loss, end stage renal disease (RIFLE) and acute
kidney injury network (AKIN) Classifications 22. NUTRITIONAL ASSESSMENT 22.1 Anthropometry 22.2 Biochemistry 22.3 Clinical 22.4 Diet history 22.5 Urinary analysis 22.6 Blood gases 23. NUTRITIONAL RECOMMENDATIONS 33.1 Summary 34. NUTRITIONAL INTERVENTION 45. MONITORING 65.1 Nutritional assessment monitoring and follow-up 65.2 Complications related to AKI 65.3 Medication commonly used in acute kidney injury and potential side effects 75.4 Patient education 8SECTION B: CHRONIC KIDNEY DISEASE (INCLUDING RENAL TRANSPLANT) 91. DEFINITIONS 92. NUTRITIONAL ASSESSMENT 102.1 Anthropometry 102.1.1 Screening for overnutrition 10 2.1.2 Screening for undernutrition 102.2 Biochemistry 102.3 Clinical 112.4 Diet history 112.5 Urinary analysis 11 3. NUTRITIONAL RECOMMENDATIONS FOR CHRONIC KIDNEY DISEASE (CKD) 123.1 Nutritional Management of HIV/AIDS in CKD 12
4. NUTRITIONAL INTERVENTION 145. MONITORING 165.1 Nutritional assessment monitoring and follow-up 165.2 Complications related to dialysis treatment [hemodialysis (HD) and peritoneal (PD)] 175.3 Medication commonly used in chronic kidney disease and possible side effects 175.4 Patient education (chronic kidney disease) 185.4.1 Energy requirements 185.4.2 Protein requirements 19
ii
5.4.3 Sodium restriction 195.4.4 Fluid restriction 195.4.5 Potassium restriction 195.4.6 Phosphate restriction 205.4.7 Fibre and the gut microbiome 205.5 Transplant patient education 215.5.1 Early post transplant phase 215.5.2 Intermediate to late post transplant phase 215.5.3 Advice on discharge 21
6. REFERENCES 257. ANNEXURES 28Annexure 1: Enteral Product Formulations 28Annexure 2: Subjective Global Assessment (SGA.) 28Annexure 3: South African Renal Exchange Lists Updated 2012 29
LIST OF TABLESTable 1: RIFLE classification 1Table 2: AKIN staging system 1Table 3: Nutritional recommendations for acute kidney injury 3Table 4: Monitoring checklist for the patient with AKI 6Table 5: Complications related to hemodialysis and possible causes thereof in the patient with AKI 6Table 6: Medication commonly used in AKI and potential side effects 7Table 7: Patient education (AKI) - general guideline 8Table 8: Classification of overweight and obesity by body mass index (BMI), waist circumference and associated disease risk 10Table 9: Nutritional laboratory parameter outcome goals 11Table 10: Nutritional recommendations for chronic kidney disease 12Table 11: Nutritional recommendations for adults with diabetic nephropathy 14Table 12: Monitoring checklist for the hospitalised patient with chronic kidney disease (CKD) - conservative RRT (HD and CAPD) 16Table 13: Monitoring checklist for the out-patient with chronic kidney disease (CKD) - conservative renal replacement therapy (RRT) (HD and continuous arterial peritoneal dialysis (CAPD) 16Table14: Examples of the effects of HD and PD on nutrition 17 Table 15: Medication commonly used in renal disease and possible side effects 17Table 16: Patient education (CKD) - general guide 23Table 17: Patient education (transplant) - general guide 23
LIST OF FIGURESFigure 1: AKI flow chart 1Figure 2: Prognosis/classification of CKD 9Figure 3: CKD flow chart 15Figure 4: Patient education flow diagram 22
iii
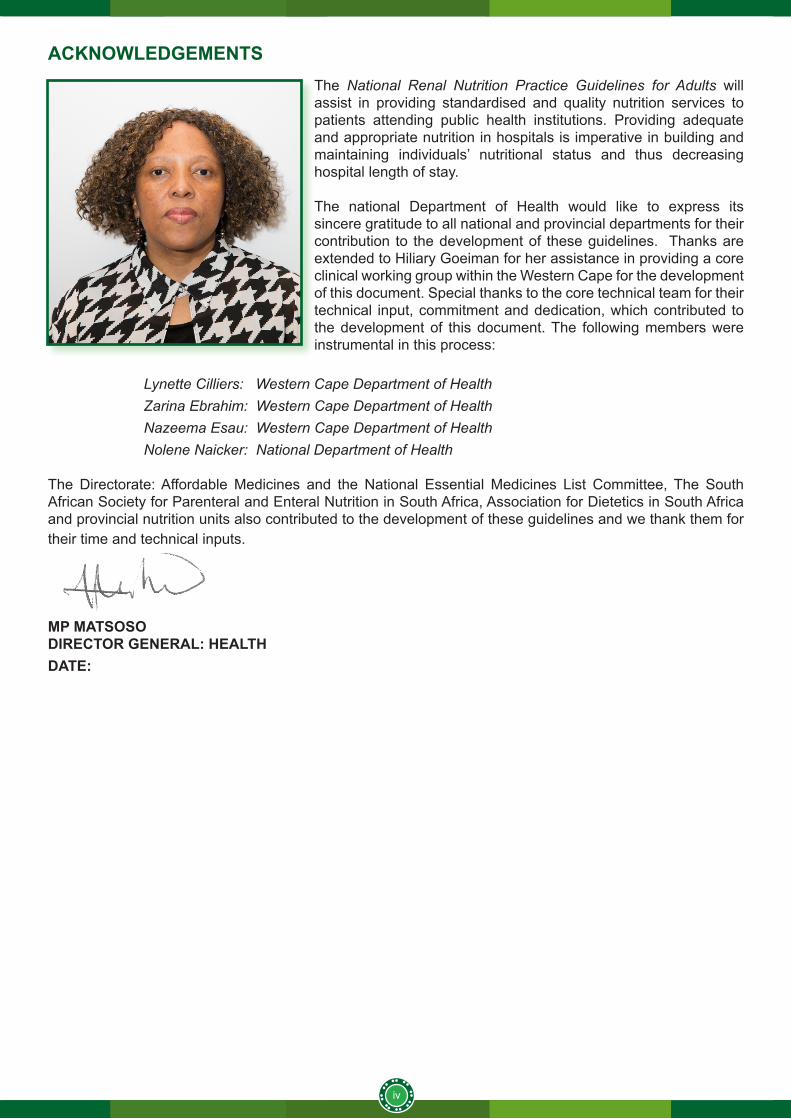
ACKNOWLEDGEMENTSThe National Renal Nutrition Practice Guidelines for Adults will assist in providing standardised and quality nutrition services to patients attending public health institutions. Providing adequate and appropriate nutrition in hospitals is imperative in building and maintaining individuals’ nutritional status and thus decreasing hospital length of stay.
The national Department of Health would like to express its sincere gratitude to all national and provincial departments for their contribution to the development of these guidelines. Thanks are extended to Hiliary Goeiman for her assistance in providing a core clinical working group within the Western Cape for the development of this document. Special thanks to the core technical team for their technical input, commitment and dedication, which contributed to the development of this document. The following members were instrumental in this process:
Lynette Cilliers: Western Cape Department of HealthZarina Ebrahim: Western Cape Department of HealthNazeema Esau: Western Cape Department of HealthNolene Naicker: National Department of Health
The Directorate: Affordable Medicines and the National Essential Medicines List Committee, The South African Society for Parenteral and Enteral Nutrition in South Africa, Association for Dietetics in South Africa and provincial nutrition units also contributed to the development of these guidelines and we thank them for their time and technical inputs.
MP MATSOSODIRECTOR GENERAL: HEALTH DATE:
iv
ACRONYMS
ACE Angiotensin converting enzymeAIDS Acquired Immunodeficiency SyndromeAKI Acute kidney injury AKIN Acute kidney injury network ARF Acute renal failureBEE Basal energy expenditureBMI Body mass indexBP Blood pressureBUN Blood urea nitrogenCAPD Continuous ambulatory peritoneal dialysisCKD Chronic kidney diseaseCRP C-reactive proteinCRRT Continuous renal replacement therapy DRI Dietary reference intakeDPI Dietary protein intakeEPO Erythropoietin ESRD End-stage renal disease GFR Glomerular filtration rateHB Harris Benedict Equation for determining basal energy expenditureHD HemodialysisICU Intensive care unitIHD Intermittent hemodialysisIBW Ideal body weight KDOQI Kidney disease outcome quality initiativeLDL Low density lipoproteinsNKF KDOQI National Kidney Foundation Kidney Disease Outcome Quality InitiativePCR Protein catabolic ratePD Peritoneal dialysispmp Per million populationPTH Parathyroid hormoneRIFLE Risk, injury, failure, loss, end stage renal diseaseRRT Renal replacement therapySGA Subjective global assessmentTE Total energyTG TriglyceridesTPN Total parenteral nutritionUUN Urinary urea nitrogen (g/day)VLDL Very low density lipoproteins
v
SCOPE AND PURPOSEThese guidelines aim to provide nutritional recommendations based on current evidence for best practice in the management of acute and chronic renal disease. The guidelines are targeted at nutrition professionals that play a role in the prevention and treatment of renal disease in adult patients attending public health facilities for care.
vi
BACKGROUND AND MOTIVATIONAcute kidney injury (AKI) is increasingly prevalent in both developed and developing countries and associated with severe morbidity and mortality. Worldwide, one in five adults experience AKI during a hospital episode of care, which should raise concern and awareness amongst healthcare workers1, 2.
Efforts should focus on minimising the causes of AKI, providing guidance on preventive strategies and early recognition and management. It is said that prevention is the key to avoid the heavy burden of mortality and morbidity associated with AKI3, 4.
Chronic kidney disease (CKD) affects mainly adults aged between 20 and 50 years in Sub-Saharan Africa and is primarily due to hypertension and glomerular diseases. Hypertension (especially in black patients) and diabetes (especially in whites and Asians) are the main causes of chronic kidney disease in South Africa.
Human immunodeficiency virus (HIV) infection is an epidemic, however there is very little data available on HIV-related glomerular disease. This is due to patients presenting late for treatment and usually already in need of dialysis. The availability of renal replacement therapy (RRT) is limited due to high costs and shortage of skilled employees. Dialysis rates are 4.5 per million population (pmp) for hemodialysis and 23 pmp for continuous ambulatory peritoneal dialysis (CAPD) in South Africa. The transplant rate averages 4.7 pmp in South Africa5. Thus, screening of high risk populations for CKD is a strategy that should be implemented, directed at patients with hypertension, diabetes mellitus, proteinuria, HIV infection and a family history of CKD6.
In addition, medical nutrition therapy plays a vital role in both the prevention and management of both non-communicable and renal disease. Thus, a team approach is suggested with a registered dietitian taking the key role in providing appropriate nutrition care.
vii
1
SECTION A: ACUTE KIDNEY INJURY
1. DEFINITIONS
Acute kidney injury (AKI)Recently acute kidney disease has been referred to as acute kidney injury.7AKI is an abrupt and sustained reduction in kidney function due to isolated kidney dysfunction or it may be a complication of severe illness8and it is defined as:
• an increase in serum creatinine by ≥26.5 µmmol/l (≥0.3mg/dl) within 48 hours or• an increase in serum creatinine to ≥1.5 times baseline, which is known or presumed to have occurred within the
prior seven days, or • urine volume < 0.5ml/kg/h for six hours
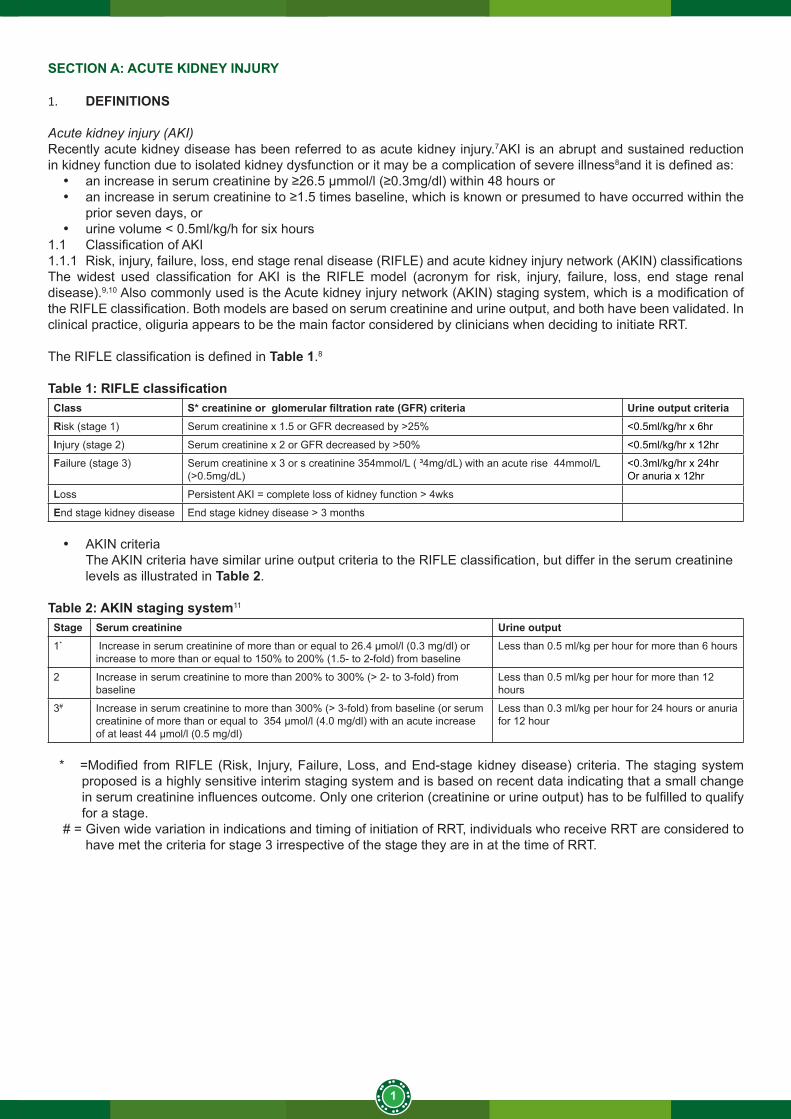
1.1 Classification of AKI1.1.1 Risk, injury, failure, loss, end stage renal disease (RIFLE) and acute kidney injury network (AKIN) classificationsThe widest used classification for AKI is the RIFLE model (acronym for risk, injury, failure, loss, end stage renal disease).9,10 Also commonly used is the Acute kidney injury network (AKIN) staging system, which is a modification of the RIFLE classification. Both models are based on serum creatinine and urine output, and both have been validated. In clinical practice, oliguria appears to be the main factor considered by clinicians when deciding to initiate RRT.
The RIFLE classification is defined in Table 1.8
Table 1: RIFLE classificationClass S* creatinine or glomerular filtration rate (GFR) criteria Urine output criteriaRisk (stage 1) Serum creatinine x 1.5 or GFR decreased by >25% <0.5ml/kg/hr x 6hr
Injury (stage 2) Serum creatinine x 2 or GFR decreased by >50% <0.5ml/kg/hr x 12hr
Failure (stage 3) Serum creatinine x 3 or s creatinine 354mmol/L ( ³4mg/dL) with an acute rise 44mmol/L (>0.5mg/dL)
<0.3ml/kg/hr x 24hrOr anuria x 12hr
Loss Persistent AKI = complete loss of kidney function > 4wks
End stage kidney disease End stage kidney disease > 3 months
• AKIN criteriaThe AKIN criteria have similar urine output criteria to the RIFLE classification, but differ in the serum creatinine levels as illustrated in Table 2.
Table 2: AKIN staging system11
Stage Serum creatinine Urine output1* Increase in serum creatinine of more than or equal to 26.4 μmol/l (0.3 mg/dl) or
increase to more than or equal to 150% to 200% (1.5- to 2-fold) from baselineLess than 0.5 ml/kg per hour for more than 6 hours
2 Increase in serum creatinine to more than 200% to 300% (> 2- to 3-fold) from baseline
Less than 0.5 ml/kg per hour for more than 12 hours
3# Increase in serum creatinine to more than 300% (> 3-fold) from baseline (or serum creatinine of more than or equal to 354 μmol/l (4.0 mg/dl) with an acute increase of at least 44 μmol/l (0.5 mg/dl)
Less than 0.3 ml/kg per hour for 24 hours or anuria for 12 hour
* =Modified from RIFLE (Risk, Injury, Failure, Loss, and End-stage kidney disease) criteria. The staging system proposed is a highly sensitive interim staging system and is based on recent data indicating that a small change in serum creatinine influences outcome. Only one criterion (creatinine or urine output) has to be fulfilled to qualify for a stage.
# = Given wide variation in indications and timing of initiation of RRT, individuals who receive RRT are considered to have met the criteria for stage 3 irrespective of the stage they are in at the time of RRT.
2
2. NUTRITIONAL ASSESSMENT
Nutritional assessment of the AKI patient is comparable to the routine nutrition assessment of normal individuals. 2.1 Anthropometry
Use actual body weight if normal body mass index (BMI).Use ideal body weight if overweight and critically ill.
2.2 Biochemistry (if available and/or indicated as part of routine monitoring)• full blood count• Na, K, Cl, urea, creatinine• calcium, magnesium, phosphate• serum triglycerides• serum glucose• c-reactive protein• albumin
2.3 Clinical• signs and symptoms of fluid overload• abdominal distension and discomfort• stools (frequency and consistency)• temperature• blood pressure (BP)
2.4 Diet historyDietary intake assessment can be completed as indicated using traditional choices of 24-hour recall, food diary, food frequency questionnaires.12
• food/medication allergies or intolerances• dietary intake prior to hospital admission• period nil per mouth within hospital/when was last meal taken• special dietary needs/interventions• medicine-nutrient interactions• herbal/supplement use
2.5 Urinary analysis (dipsticks and microscopy)• glucose• protein• urea and creatinine
2.6 Blood gasses• PH• PO2/PCO2• TCO2/HCO3
Nutritional support of AKI patients particularly demands an integrated and overall view on energy, protein, fluid, electrolyte metabolism, and a careful and accurate assessment of nitrogen and electrolyte balances. 13 Nutritional support in AKI should be started very early after injury. 13Nutritional support varies considerably between individual patients, depending on the degree of renal failure, co-morbid illness and medical management. Therefore, there is no standard dietary regimen that can be used for all patients. 14
3
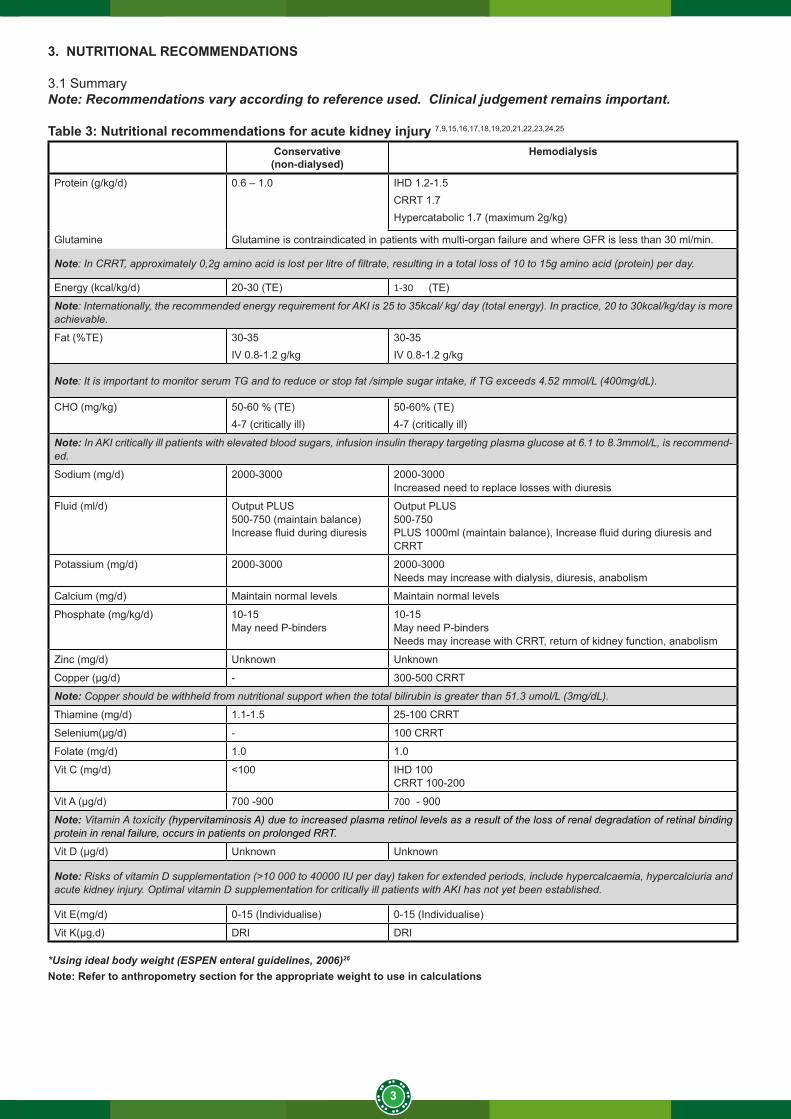
3. NUTRITIONAL RECOMMENDATIONS
3.1 SummaryNote: Recommendations vary according to reference used. Clinical judgement remains important.
Table 3: Nutritional recommendations for acute kidney injury 7,9,15,16,17,18,19,20,21,22,23,24,25
Conservative(non-dialysed)
Hemodialysis
Protein (g/kg/d) 0.6 – 1.0 IHD 1.2-1.5CRRT 1.7Hypercatabolic 1.7 (maximum 2g/kg)
Glutamine Glutamine is contraindicated in patients with multi-organ failure and where GFR is less than 30 ml/min.
Note: In CRRT, approximately 0,2g amino acid is lost per litre of filtrate, resulting in a total loss of 10 to 15g amino acid (protein) per day.
Energy (kcal/kg/d) 20-30 (TE) 1-30 (TE)
Note: Internationally, the recommended energy requirement for AKI is 25 to 35kcal/ kg/ day (total energy). In practice, 20 to 30kcal/kg/day is more achievable.
Fat (%TE) 30-35IV 0.8-1.2 g/kg
30-35IV 0.8-1.2 g/kg
Note: It is important to monitor serum TG and to reduce or stop fat /simple sugar intake, if TG exceeds 4.52 mmol/L (400mg/dL).
CHO (mg/kg) 50-60 % (TE)4-7 (critically ill)
50-60% (TE)4-7 (critically ill)
Note: In AKI critically ill patients with elevated blood sugars, infusion insulin therapy targeting plasma glucose at 6.1 to 8.3mmol/L, is recommend-ed.
Sodium (mg/d) 2000-3000 2000-3000Increased need to replace losses with diuresis
Fluid (ml/d) Output PLUS500-750 (maintain balance)Increase fluid during diuresis
Output PLUS500-750PLUS 1000ml (maintain balance), Increase fluid during diuresis and CRRT
Potassium (mg/d) 2000-3000 2000-3000 Needs may increase with dialysis, diuresis, anabolism
Calcium (mg/d) Maintain normal levels Maintain normal levels
Phosphate (mg/kg/d) 10-15May need P-binders
10-15May need P-bindersNeeds may increase with CRRT, return of kidney function, anabolism
Zinc (mg/d) Unknown Unknown
Copper (μg/d) - 300-500 CRRT
Note: Copper should be withheld from nutritional support when the total bilirubin is greater than 51.3 umol/L (3mg/dL).
Thiamine (mg/d) 1.1-1.5 25-100 CRRT
Selenium(μg/d) - 100 CRRT
Folate (mg/d) 1.0 1.0
Vit C (mg/d) <100 IHD 100CRRT 100-200
Vit A (μg/d) 700 -900 700 - 900
Note: Vitamin A toxicity (hypervitaminosis A) due to increased plasma retinol levels as a result of the loss of renal degradation of retinal binding protein in renal failure, occurs in patients on prolonged RRT.
Vit D (μg/d) Unknown Unknown
Note: Risks of vitamin D supplementation (>10 000 to 40000 IU per day) taken for extended periods, include hypercalcaemia, hypercalciuria and acute kidney injury. Optimal vitamin D supplementation for critically ill patients with AKI has not yet been established.
Vit E(mg/d) 0-15 (Individualise) 0-15 (Individualise)
Vit K(μg.d) DRI DRI
*Using ideal body weight (ESPEN enteral guidelines, 2006)26
Note: Refer to anthropometry section for the appropriate weight to use in calculations
4
4. NUTRITIONAL INTERVENTION
Prescribe an appropriate renal diet based on modality of treatment, patient’s tolerance and fluid restrictions. Patients with poor oral intake should be supplemented accordingly or be considered for enteral feeding. Critically ill patients with AKI would often require enteral feeding. Enteral feeding of AKI critically ill patients may be challenging due to impaired gastrointestinal motility and decreased absorption of nutrients secondary to bowel oedema. AKI is a major risk factor for gastrointestinal haemorrhage. Enteral feeding may potentially exert a protective effect in reducing the risk of stress ulcers or bleeding.15
When sufficient enteral feeding cannot be achieved, the combination of enteral and parenteral feeding may be required to achieve successful nutritional support. The two routes of feeding should be considered complementary, and not mutually exclusive.18 Enteral nutrition is the preferential route in the first 24 to 48 hours upon intensive care unit (ICU) admission, and if adequate enteral nutrition cannot be achieved between three and five days, parenteral nutrition should be introduced.15
At the onset of AKI, when few patients can tolerate oral feedings because of vomiting and diarrhoea, intravenous (IV) preparations can be used to reduce protein catabolism. Some patients can be managed with enteral feedings, depending on the degree of severity of symptoms, but in most AKI patients, IV feedings e.g. total parenteral nutrition (TPN) must be used. The preferred treatment is illustrated in Figure 1.
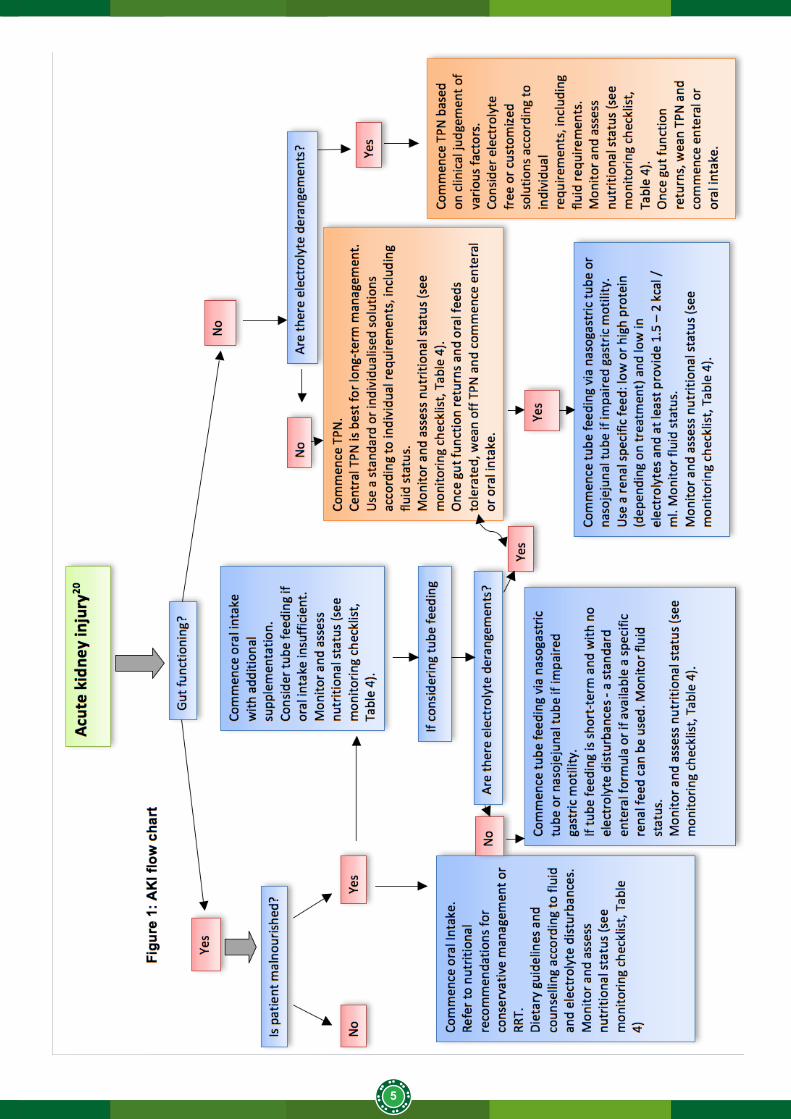
5
6
5. MONITORING
5.1 Nutritional assessment monitoring and follow-up
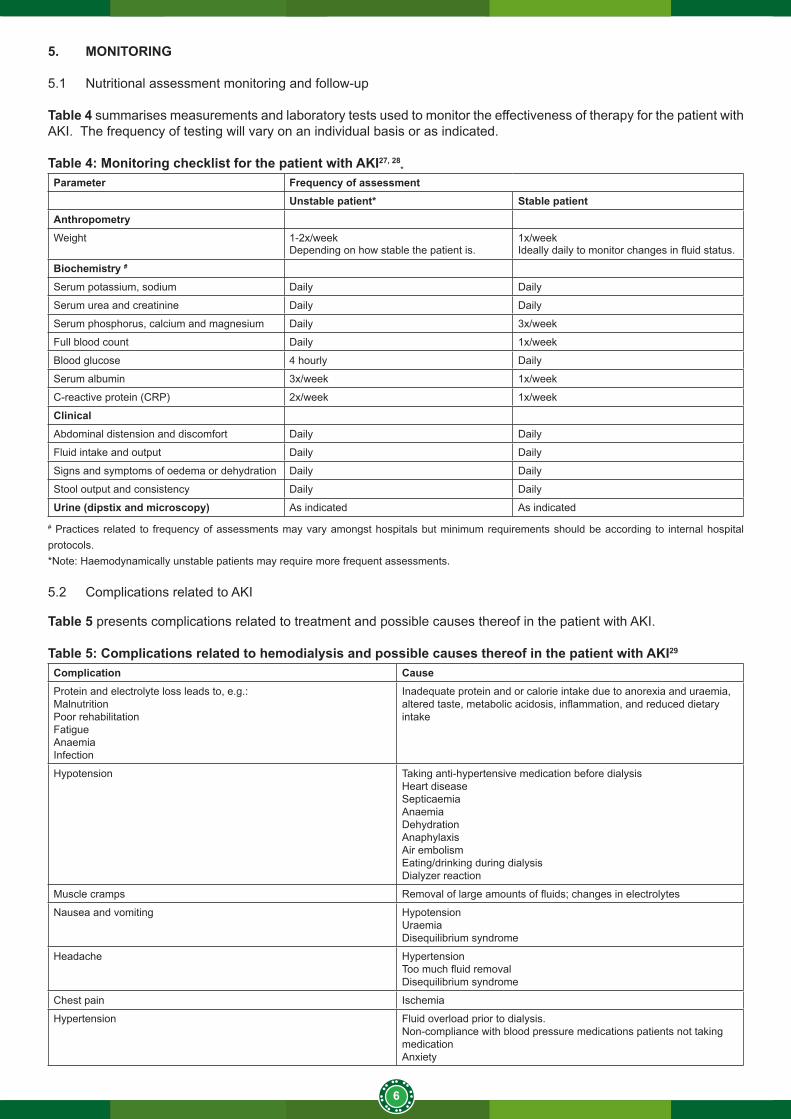
Table 4 summarises measurements and laboratory tests used to monitor the effectiveness of therapy for the patient with AKI. The frequency of testing will vary on an individual basis or as indicated.
Table 4: Monitoring checklist for the patient with AKI27, 28*
Parameter Frequency of assessmentUnstable patient* Stable patient
AnthropometryWeight 1-2x/week
Depending on how stable the patient is.1x/weekIdeally daily to monitor changes in fluid status.
Biochemistry #
Serum potassium, sodium Daily Daily
Serum urea and creatinine Daily Daily
Serum phosphorus, calcium and magnesium Daily 3x/week
Full blood count Daily 1x/week
Blood glucose 4 hourly Daily
Serum albumin 3x/week 1x/week
C-reactive protein (CRP) 2x/week 1x/week
ClinicalAbdominal distension and discomfort Daily Daily
Fluid intake and output Daily Daily
Signs and symptoms of oedema or dehydration Daily Daily
Stool output and consistency Daily Daily
Urine (dipstix and microscopy) As indicated As indicated
# Practices related to frequency of assessments may vary amongst hospitals but minimum requirements should be according to internal hospital protocols.*Note: Haemodynamically unstable patients may require more frequent assessments.
5.2 Complications related to AKI
Table 5 presents complications related to treatment and possible causes thereof in the patient with AKI.
Table 5: Complications related to hemodialysis and possible causes thereof in the patient with AKI29
Complication CauseProtein and electrolyte loss leads to, e.g.:Malnutrition Poor rehabilitationFatigueAnaemiaInfection
Inadequate protein and or calorie intake due to anorexia and uraemia, altered taste, metabolic acidosis, inflammation, and reduced dietary intake
Hypotension Taking anti-hypertensive medication before dialysisHeart diseaseSepticaemiaAnaemiaDehydrationAnaphylaxisAir embolismEating/drinking during dialysisDialyzer reaction
Muscle cramps Removal of large amounts of fluids; changes in electrolytes
Nausea and vomiting HypotensionUraemiaDisequilibrium syndrome
Headache HypertensionToo much fluid removalDisequilibrium syndrome
Chest pain Ischemia
Hypertension Fluid overload prior to dialysis.Non-compliance with blood pressure medications patients not taking medicationAnxiety
7
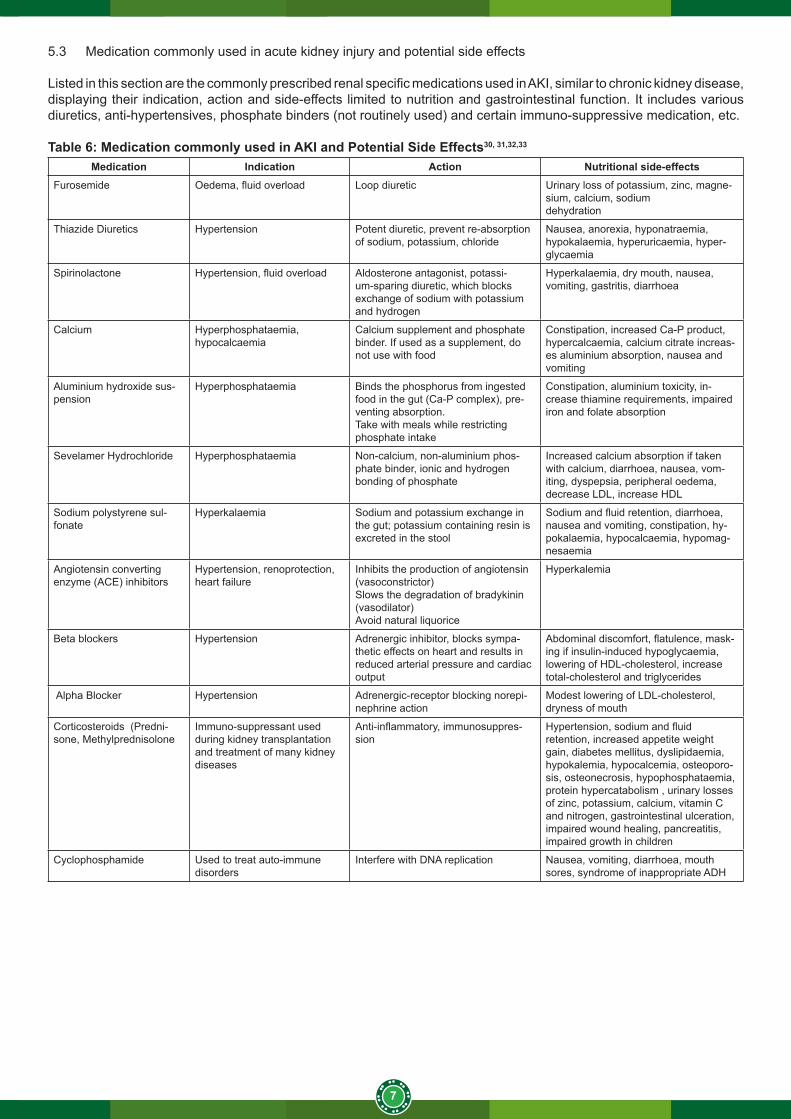
5.3 Medication commonly used in acute kidney injury and potential side effects
Listed in this section are the commonly prescribed renal specific medications used in AKI, similar to chronic kidney disease, displaying their indication, action and side-effects limited to nutrition and gastrointestinal function. It includes various diuretics, anti-hypertensives, phosphate binders (not routinely used) and certain immuno-suppressive medication, etc.
Table 6: Medication commonly used in AKI and Potential Side Effects30, 31,32,33
Medication Indication Action Nutritional side-effectsFurosemide Oedema, fluid overload Loop diuretic Urinary loss of potassium, zinc, magne-
sium, calcium, sodiumdehydration
Thiazide Diuretics Hypertension Potent diuretic, prevent re-absorption of sodium, potassium, chloride
Nausea, anorexia, hyponatraemia, hypokalaemia, hyperuricaemia, hyper-glycaemia
Spirinolactone Hypertension, fluid overload Aldosterone antagonist, potassi-um-sparing diuretic, which blocks exchange of sodium with potassium and hydrogen
Hyperkalaemia, dry mouth, nausea, vomiting, gastritis, diarrhoea
Calcium Hyperphosphataemia, hypocalcaemia
Calcium supplement and phosphate binder. If used as a supplement, do not use with food
Constipation, increased Ca-P product, hypercalcaemia, calcium citrate increas-es aluminium absorption, nausea and vomiting
Aluminium hydroxide sus-pension
Hyperphosphataemia Binds the phosphorus from ingested food in the gut (Ca-P complex), pre-venting absorption.Take with meals while restricting phosphate intake
Constipation, aluminium toxicity, in-crease thiamine requirements, impaired iron and folate absorption
Sevelamer Hydrochloride Hyperphosphataemia Non-calcium, non-aluminium phos-phate binder, ionic and hydrogen bonding of phosphate
Increased calcium absorption if taken with calcium, diarrhoea, nausea, vom-iting, dyspepsia, peripheral oedema, decrease LDL, increase HDL
Sodium polystyrene sul-fonate
Hyperkalaemia Sodium and potassium exchange in the gut; potassium containing resin is excreted in the stool
Sodium and fluid retention, diarrhoea, nausea and vomiting, constipation, hy-pokalaemia, hypocalcaemia, hypomag-nesaemia
Angiotensin converting enzyme (ACE) inhibitors
Hypertension, renoprotection, heart failure
Inhibits the production of angiotensin (vasoconstrictor)Slows the degradation of bradykinin (vasodilator)Avoid natural liquorice
Hyperkalemia
Beta blockers Hypertension Adrenergic inhibitor, blocks sympa-thetic effects on heart and results in reduced arterial pressure and cardiac output
Abdominal discomfort, flatulence, mask-ing if insulin-induced hypoglycaemia, lowering of HDL-cholesterol, increase total-cholesterol and triglycerides
Alpha Blocker Hypertension Adrenergic-receptor blocking norepi-nephrine action
Modest lowering of LDL-cholesterol, dryness of mouth
Corticosteroids (Predni-sone, Methylprednisolone
Immuno-suppressant used during kidney transplantation and treatment of many kidney diseases
Anti-inflammatory, immunosuppres-sion
Hypertension, sodium and fluid retention, increased appetite weight gain, diabetes mellitus, dyslipidaemia, hypokalemia, hypocalcemia, osteoporo-sis, osteonecrosis, hypophosphataemia, protein hypercatabolism , urinary losses of zinc, potassium, calcium, vitamin C and nitrogen, gastrointestinal ulceration, impaired wound healing, pancreatitis, impaired growth in children
Cyclophosphamide Used to treat auto-immune disorders
Interfere with DNA replication Nausea, vomiting, diarrhoea, mouth sores, syndrome of inappropriate ADH
8
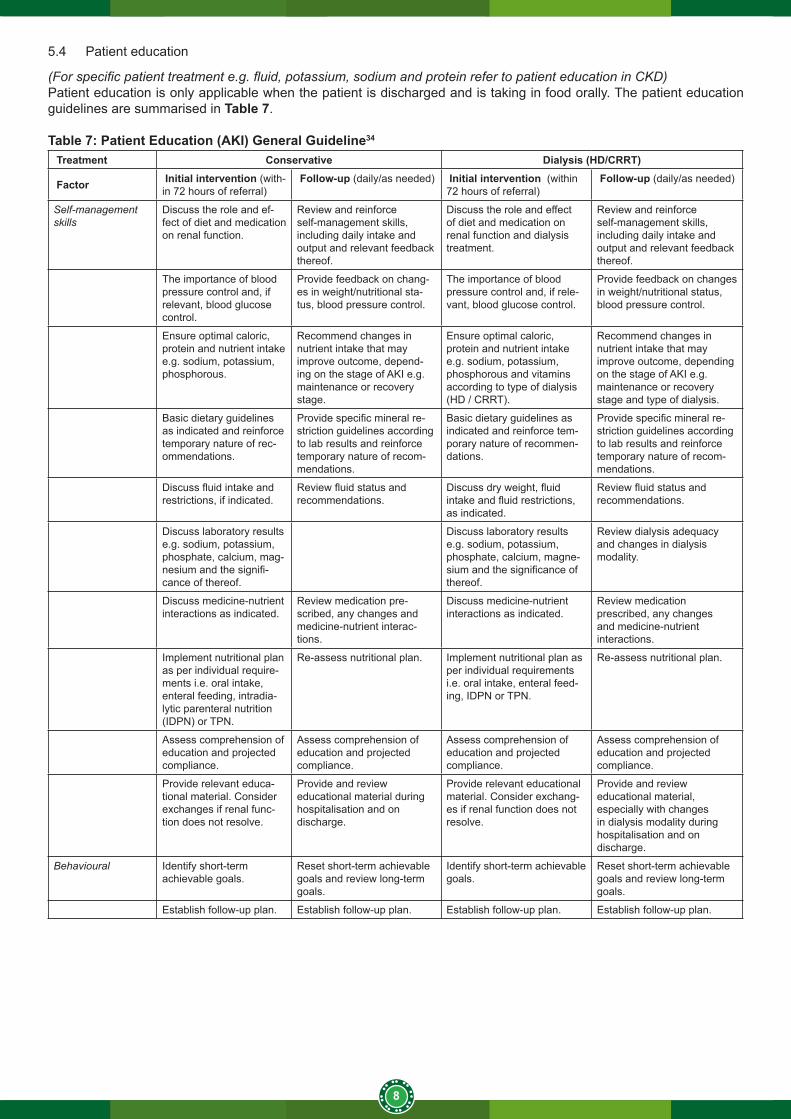
5.4 Patient education
(For specific patient treatment e.g. fluid, potassium, sodium and protein refer to patient education in CKD)Patient education is only applicable when the patient is discharged and is taking in food orally. The patient education guidelines are summarised in Table 7.
Table 7: Patient Education (AKI) General Guideline34
Treatment Conservative Dialysis (HD/CRRT)
Factor Initial intervention (with-in 72 hours of referral)
Follow-up (daily/as needed) Initial intervention (within 72 hours of referral)
Follow-up (daily/as needed)
Self-management skills
Discuss the role and ef-fect of diet and medication on renal function.
Review and reinforce self-management skills, including daily intake and output and relevant feedback thereof.
Discuss the role and effect of diet and medication on renal function and dialysis treatment.
Review and reinforce self-management skills, including daily intake and output and relevant feedback thereof.
The importance of blood pressure control and, if relevant, blood glucose control.
Provide feedback on chang-es in weight/nutritional sta-tus, blood pressure control.
The importance of blood pressure control and, if rele-vant, blood glucose control.
Provide feedback on changes in weight/nutritional status, blood pressure control.
Ensure optimal caloric, protein and nutrient intake e.g. sodium, potassium, phosphorous.
Recommend changes in nutrient intake that may improve outcome, depend-ing on the stage of AKI e.g. maintenance or recovery stage.
Ensure optimal caloric, protein and nutrient intake e.g. sodium, potassium, phosphorous and vitamins according to type of dialysis (HD / CRRT).
Recommend changes in nutrient intake that may improve outcome, depending on the stage of AKI e.g. maintenance or recovery stage and type of dialysis.
Basic dietary guidelines as indicated and reinforce temporary nature of rec-ommendations.
Provide specific mineral re-striction guidelines according to lab results and reinforce temporary nature of recom-mendations.
Basic dietary guidelines as indicated and reinforce tem-porary nature of recommen-dations.
Provide specific mineral re-striction guidelines according to lab results and reinforce temporary nature of recom-mendations.
Discuss fluid intake and restrictions, if indicated.
Review fluid status and recommendations.
Discuss dry weight, fluid intake and fluid restrictions, as indicated.
Review fluid status and recommendations.
Discuss laboratory results e.g. sodium, potassium, phosphate, calcium, mag-nesium and the signifi-cance of thereof.
Discuss laboratory results e.g. sodium, potassium, phosphate, calcium, magne-sium and the significance of thereof.
Review dialysis adequacy and changes in dialysis modality.
Discuss medicine-nutrient interactions as indicated.
Review medication pre-scribed, any changes and medicine-nutrient interac-tions.
Discuss medicine-nutrient interactions as indicated.
Review medication prescribed, any changes and medicine-nutrient interactions.
Implement nutritional plan as per individual require-ments i.e. oral intake, enteral feeding, intradia-lytic parenteral nutrition (IDPN) or TPN.
Re-assess nutritional plan. Implement nutritional plan as per individual requirements i.e. oral intake, enteral feed-ing, IDPN or TPN.
Re-assess nutritional plan.
Assess comprehension of education and projected compliance.
Assess comprehension of education and projected compliance.
Assess comprehension of education and projected compliance.
Assess comprehension of education and projected compliance.
Provide relevant educa-tional material. Consider exchanges if renal func-tion does not resolve.
Provide and review educational material during hospitalisation and on discharge.
Provide relevant educational material. Consider exchang-es if renal function does not resolve.
Provide and review educational material, especially with changes in dialysis modality during hospitalisation and on discharge.
Behavioural Identify short-term achievable goals.
Reset short-term achievable goals and review long-term goals.
Identify short-term achievable goals.
Reset short-term achievable goals and review long-term goals.
Establish follow-up plan. Establish follow-up plan. Establish follow-up plan. Establish follow-up plan.
9
SECTION B: CHRONIC KIDNEY DISEASE (INCLUDING RENAL TRANSPLANT)
1. DEFINITIONSAcute glomerulonephritis: A group of diseases characterised by inflammation of the capillary loops of the glomerulus.
Azotemia: The accumulation in the blood of abnormal quantities of urea, uric acid, creatinine, and other nitrogenous wastes.
Chronic kidney disease: Abnormalities of kidney structure or function, present for more than three months with implications for health and CKD is classified based on cause, GFR category, and albuminuria category.35
End-stage renal disease (ESRD): A disease characterised by the kidney’s inability to excrete waste products, maintain fluid and electrolyte balance and produce hormones.
Erythropoietin (EPO): A hormone secreted chiefly by the kidney in the adult and by the liver in the foetus, which acts on stem cells of the bone marrow to stimulate red blood cell production.
Glomerular filtration rate (GFR): The quality of glomerular filtrate formed per unit in all nephrons of both kidneys.
Nephritic syndrome: The syndrome of haematuria, hypertension and mild loss of renal function that results from acute inflammation of the capillary loops of the glomerulus.
Nephrotic syndrome: A condition resulting from loss of the glomerular barrier to protein; characterised by massive oedema, proteinuria, hypoalbuminemia, hypercholesterolemia, hypercoagulability, and abnormal bone metabolism.
Oliguria: The condition of having urinary volumes of less than 500ml/day.
Pyelonephritis: Bacterial infection of the kidneys.
Renal osteodystrophy: Metabolic bone disease as a complication of ESRD.
Uraemia: A clinical syndrome of malaise, weakness, nausea, vomiting, muscle cramps, itching, metallic mouth taste and often neurological impairment, which is brought about by azotemia. 30
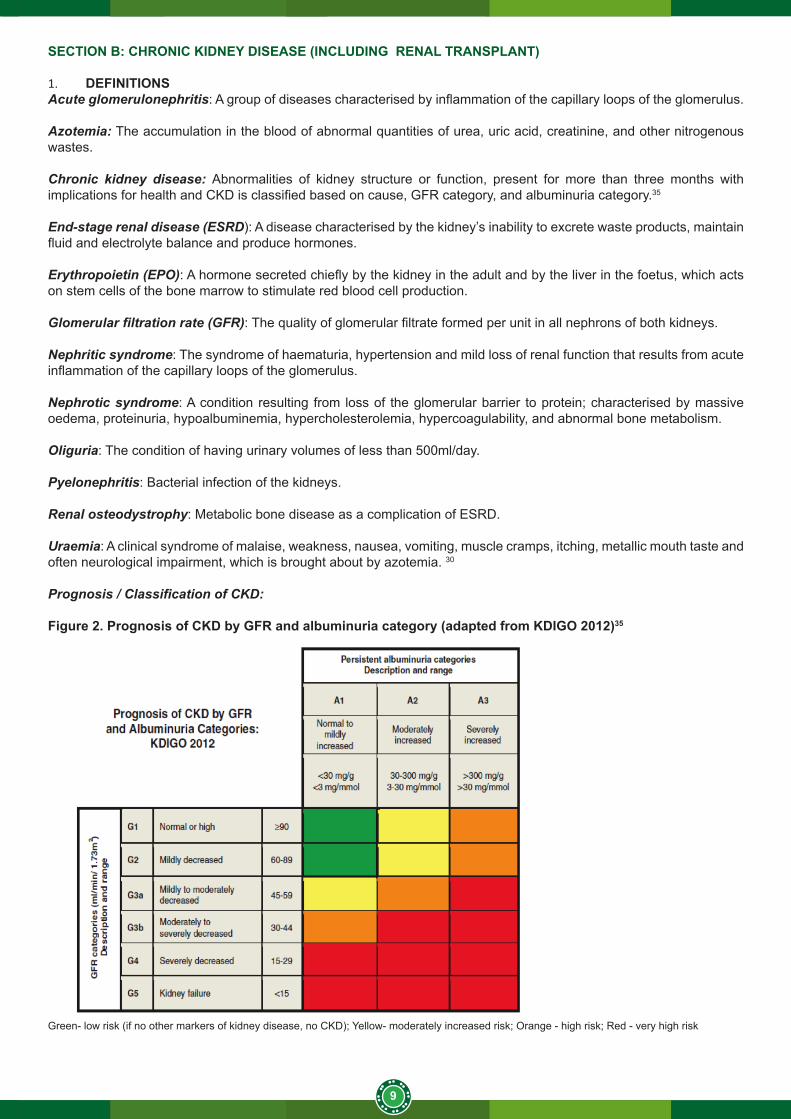
Prognosis / Classification of CKD:
Figure 2. Prognosis of CKD by GFR and albuminuria category (adapted from KDIGO 2012)35
Green- low risk (if no other markers of kidney disease, no CKD); Yellow- moderately increased risk; Orange - high risk; Red - very high risk
10
2. NUTRITIONAL ASSESSMENTThe nutritional assessment of the CKD patient is comparable to a routine nutrition assessment of normal individuals, but with some modifications.
The ABCD (anthropometry, biochemistry, clinical and dietary) approach should be used when doing a nutritional assessment as discussed below.
In patients receiving renal replacement therapy, the focus should be placed on body composition rather than on weight loss in isolation to reduce metabolic demands on the kidney and as a result delay progression of ESRD. Thus BMI should not be used in isolation, but rather with other anthropometric indicators like waist circumference.
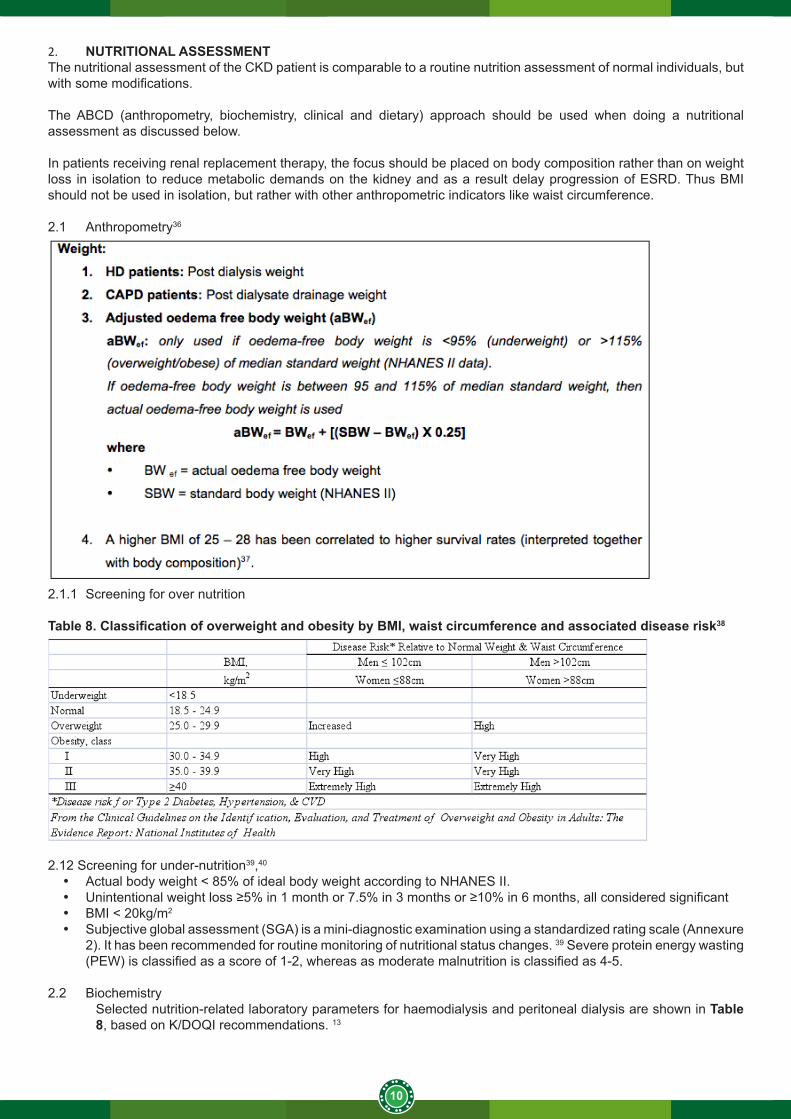
2.1 Anthropometry36
2.1.1 Screening for over nutrition
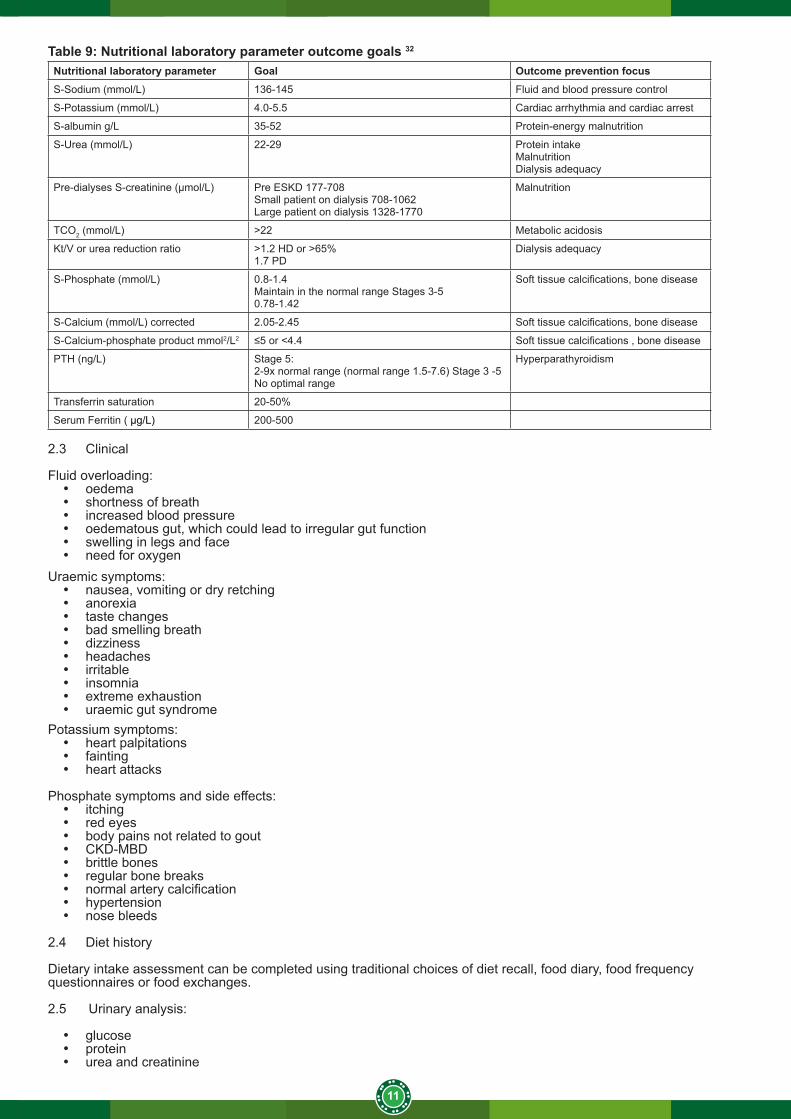
Table 8. Classification of overweight and obesity by BMI, waist circumference and associated disease risk38
2.12 Screening for under-nutrition39,40
• Actual body weight < 85% of ideal body weight according to NHANES II.• Unintentional weight loss ≥5% in 1 month or 7.5% in 3 months or ≥10% in 6 months, all considered significant• BMI < 20kg/m2
• Subjective global assessment (SGA) is a mini-diagnostic examination using a standardized rating scale (Annexure 2). It has been recommended for routine monitoring of nutritional status changes. 39 Severe protein energy wasting (PEW) is classified as a score of 1-2, whereas as moderate malnutrition is classified as 4-5.
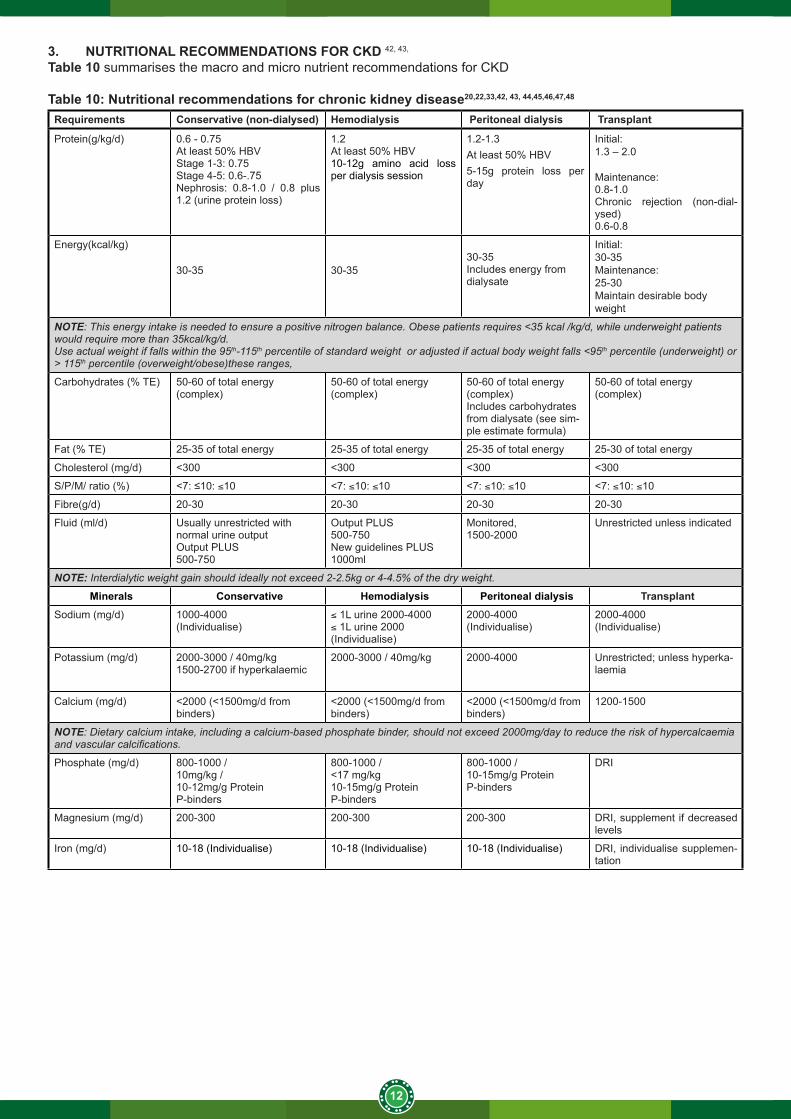
2.2 BiochemistrySelected nutrition-related laboratory parameters for haemodialysis and peritoneal dialysis are shown in Table 8, based on K/DOQI recommendations. 13
11
Table 9: Nutritional laboratory parameter outcome goals 32
Nutritional laboratory parameter Goal Outcome prevention focusS-Sodium (mmol/L) 136-145 Fluid and blood pressure control
S-Potassium (mmol/L) 4.0-5.5 Cardiac arrhythmia and cardiac arrest
S-albumin g/L 35-52 Protein-energy malnutrition
S-Urea (mmol/L) 22-29 Protein intakeMalnutritionDialysis adequacy
Pre-dialyses S-creatinine (µmol/L) Pre ESKD 177-708Small patient on dialysis 708-1062Large patient on dialysis 1328-1770
Malnutrition
TCO2 (mmol/L) >22 Metabolic acidosis
Kt/V or urea reduction ratio >1.2 HD or >65%1.7 PD
Dialysis adequacy
S-Phosphate (mmol/L) 0.8-1.4 Maintain in the normal range Stages 3-50.78-1.42
Soft tissue calcifications, bone disease
S-Calcium (mmol/L) corrected 2.05-2.45 Soft tissue calcifications, bone disease
S-Calcium-phosphate product mmol2/L2 ≤5 or <4.4 Soft tissue calcifications , bone disease
PTH (ng/L) Stage 5: 2-9x normal range (normal range 1.5-7.6) Stage 3 -5No optimal range
Hyperparathyroidism
Transferrin saturation 20-50%
Serum Ferritin ( μg/L) 200-500
2.3 Clinical
Fluid overloading:• oedema• shortness of breath• increased blood pressure• oedematous gut, which could lead to irregular gut function• swelling in legs and face• need for oxygen
Uraemic symptoms:• nausea, vomiting or dry retching• anorexia• taste changes• bad smelling breath• dizziness• headaches• irritable • insomnia• extreme exhaustion• uraemic gut syndrome
Potassium symptoms:• heart palpitations• fainting• heart attacks
Phosphate symptoms and side effects:• itching• red eyes• body pains not related to gout• CKD-MBD• brittle bones• regular bone breaks• normal artery calcification• hypertension• nose bleeds
2.4 Diet history
Dietary intake assessment can be completed using traditional choices of diet recall, food diary, food frequency questionnaires or food exchanges.
2.5 Urinary analysis:
• glucose• protein• urea and creatinine
12
3. NUTRITIONAL RECOMMENDATIONS FOR CKD 42, 43,
Table 10 summarises the macro and micro nutrient recommendations for CKD
Table 10: Nutritional recommendations for chronic kidney disease20,22,33,42, 43, 44,45,46,47,48
Requirements Conservative (non-dialysed) Hemodialysis Peritoneal dialysis Transplant
Protein(g/kg/d) 0.6 - 0.75At least 50% HBVStage 1-3: 0.75 Stage 4-5: 0.6-.75 Nephrosis: 0.8-1.0 / 0.8 plus 1.2 (urine protein loss)
1.2At least 50% HBV 10-12g amino acid loss per dialysis session
1.2-1.3At least 50% HBV5-15g protein loss per day
Initial: 1.3 – 2.0
Maintenance:0.8-1.0Chronic rejection (non-dial-ysed)0.6-0.8
Energy(kcal/kg)
30-35 30-35 30-35 Includes energy from dialysate
Initial: 30-35 Maintenance:25-30 Maintain desirable body weight
NOTE: This energy intake is needed to ensure a positive nitrogen balance. Obese patients requires <35 kcal /kg/d, while underweight patients would require more than 35kcal/kg/d.Use actual weight if falls within the 95th-115th percentile of standard weight or adjusted if actual body weight falls <95th percentile (underweight) or > 115th percentile (overweight/obese)these ranges,
Carbohydrates (% TE) 50-60 of total energy(complex)
50-60 of total energy(complex)
50-60 of total energy(complex)Includes carbohydrates from dialysate (see sim-ple estimate formula)
50-60 of total energy(complex)
Fat (% TE) 25-35 of total energy 25-35 of total energy 25-35 of total energy 25-30 of total energy
Cholesterol (mg/d) <300 <300 <300 <300
S/P/M/ ratio (%) <7: ≤10: ≤10 <7: ≤10: ≤10 <7: ≤10: ≤10 <7: ≤10: ≤10
Fibre(g/d) 20-30 20-30 20-30 20-30
Fluid (ml/d) Usually unrestricted with normal urine outputOutput PLUS500-750
Output PLUS500-750New guidelines PLUS 1000ml
Monitored,1500-2000
Unrestricted unless indicated
NOTE: Interdialytic weight gain should ideally not exceed 2-2.5kg or 4-4.5% of the dry weight.
Minerals Conservative Hemodialysis Peritoneal dialysis TransplantSodium (mg/d) 1000-4000
(Individualise)≤ 1L urine 2000-4000≤ 1L urine 2000(Individualise)
2000-4000(Individualise)
2000-4000(Individualise)
Potassium (mg/d) 2000-3000 / 40mg/kg1500-2700 if hyperkalaemic
2000-3000 / 40mg/kg 2000-4000 Unrestricted; unless hyperka-laemia
Calcium (mg/d) <2000 (<1500mg/d from binders)
<2000 (<1500mg/d from binders)
<2000 (<1500mg/d from binders)
1200-1500
NOTE: Dietary calcium intake, including a calcium-based phosphate binder, should not exceed 2000mg/day to reduce the risk of hypercalcaemia and vascular calcifications.
Phosphate (mg/d) 800-1000 /10mg/kg /10-12mg/g Protein P-binders
800-1000 /<17 mg/kg10-15mg/g ProteinP-binders
800-1000 /10-15mg/g ProteinP-binders
DRI
Magnesium (mg/d) 200-300 200-300 200-300 DRI, supplement if decreased levels
Iron (mg/d) 10-18 (Individualise) 10-18 (Individualise) 10-18 (Individualise) DRI, individualise supplemen-tation
13
Requirements Conservative (non-dialysed) Hemodialysis Peritoneal dialysis Transplant
Zinc (mg/d) Individualise Individualise Individualise DRI
NOTE: Routine supplementation of Zinc, Selenium and Copper not recommended.
Thiamine (mg/d) 1.1-1.5 1.1-1.5 1.1-1.5 DRI
Riboflavin (mg/d) 1.8 1.1-1.3 1.1-1.3 DRI
Panthothenic acid (mg/d)
5 5 5 DRI
Niacin (mg/d) 14-20 14-20 14-20 DRI
Pyridoxine (mg/d) 5 10 10 DRI
NOTE: Decreased levels of pyridoxine are associated with hyperhomocysteinaemia.
Vit B12 (μg/d) 2-3 2-3 2-3 DRI
Folate mg/d 1.0 1.0 1.0 DRI
NOTE: Vitamin B12 and Folate supplementation are required for normal erythropoiesis and an optimal response to the medications used to stimulate erythropoiesis.
Vit C mg/d 60-100 60-100 60-100 DRI
NOTE: High doses of supplemented vitamin C of >200mg/day is not advised due to increased risk of oxalate deposition that may contribute to vascular disease.
Vit A (μg/d) No supplementation No supplementation No supplementation DRI
NOTE: Vitamin A is known to accumulate during renal failure and therefore routine supplementation is not recommended during CKD.
Vit D (μg/d) Individualise Individualise Individualise DRI
NOTE: Consider Vitamin D supplementation for the treatment of osteomalacia and hyperparathyroidism. Supplementation may be indicated. Vitamin D: Individualise means we need to consider the patients calcium, phosphate and parathyroid hormone (PTH) levels, if need start at 0.25ug of 25(OH)vitamin D and titrate upwards.
Vit E mg/d 0-15 (Individualise) 0-15 (Individualise) 0-15 (Individualise) DRI
NOTE: Vitamin E is known to accumulate during renal failure and therefore routine supplementation is not recommended during CKD. There is controversy regarding the optimal vitamin E dose to be supplemented.
Vit K μg.d Individualise Individualise Individualise DRI
NOTE: The RDA for vitamin K is recommended except in cases with altered coagulant activity and long-term treatment with antibiotics.
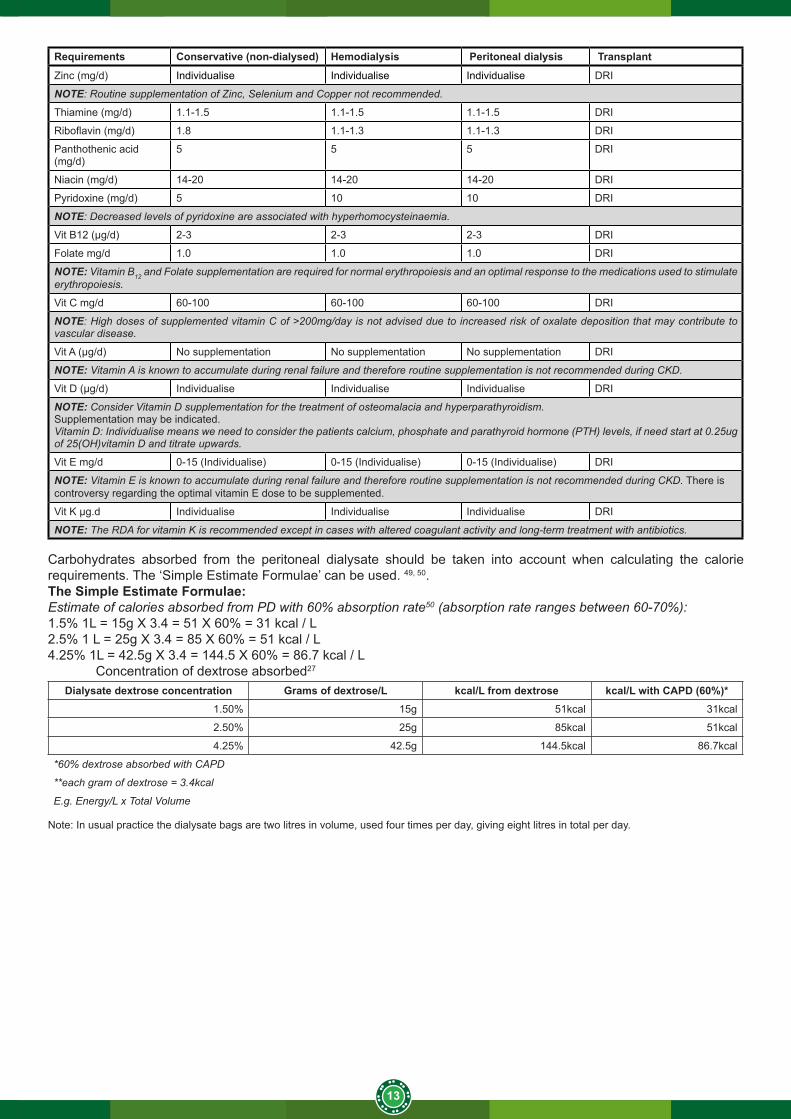
Carbohydrates absorbed from the peritoneal dialysate should be taken into account when calculating the calorie requirements. The ‘Simple Estimate Formulae’ can be used. 49, 50. The Simple Estimate Formulae: Estimate of calories absorbed from PD with 60% absorption rate50 (absorption rate ranges between 60-70%):1.5% 1L = 15g X 3.4 = 51 X 60% = 31 kcal / L2.5% 1 L = 25g X 3.4 = 85 X 60% = 51 kcal / L4.25% 1L = 42.5g X 3.4 = 144.5 X 60% = 86.7 kcal / L
Concentration of dextrose absorbed27
Dialysate dextrose concentration Grams of dextrose/L kcal/L from dextrose kcal/L with CAPD (60%)*1.50% 15g 51kcal 31kcal
2.50% 25g 85kcal 51kcal
4.25% 42.5g 144.5kcal 86.7kcal
*60% dextrose absorbed with CAPD
**each gram of dextrose = 3.4kcal
E.g. Energy/L x Total Volume
Note: In usual practice the dialysate bags are two litres in volume, used four times per day, giving eight litres in total per day.
14
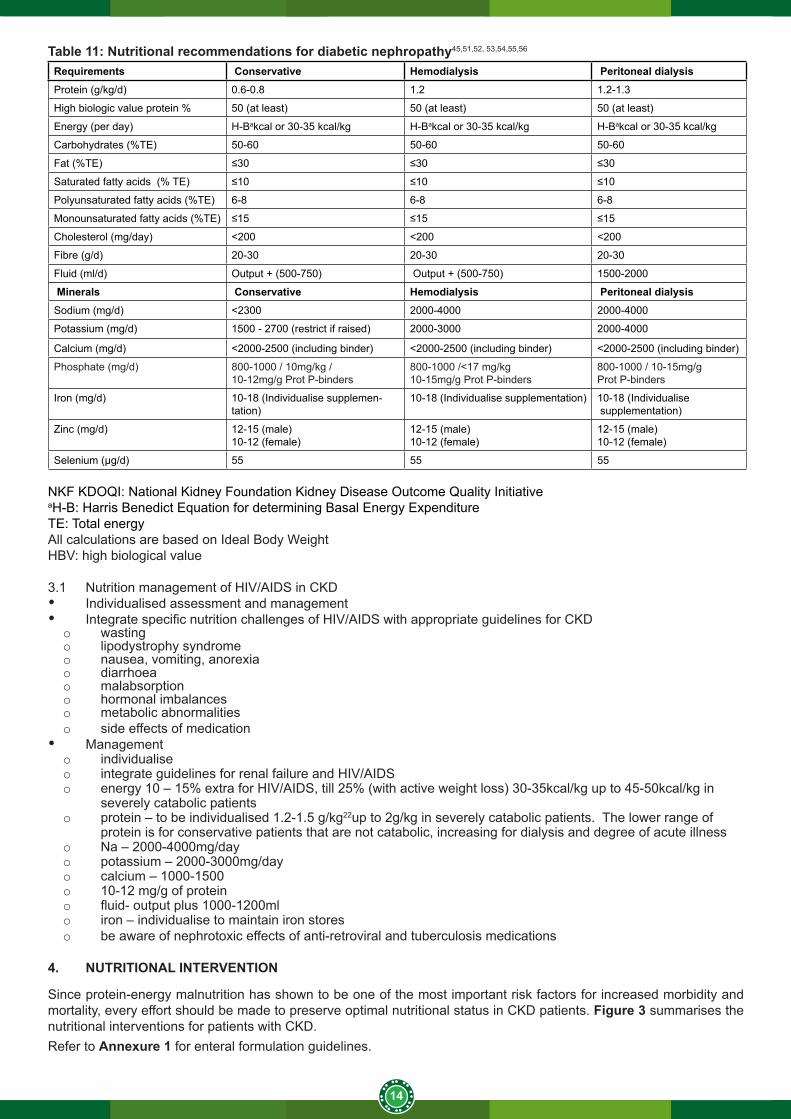
Table 11: Nutritional recommendations for diabetic nephropathy45,51,52, 53,54,55,56
Requirements Conservative Hemodialysis Peritoneal dialysisProtein (g/kg/d) 0.6-0.8 1.2 1.2-1.3
High biologic value protein % 50 (at least) 50 (at least) 50 (at least)
Energy (per day) H-Bakcal or 30-35 kcal/kg H-Bakcal or 30-35 kcal/kg H-Bakcal or 30-35 kcal/kg
Carbohydrates (%TE) 50-60 50-60 50-60
Fat (%TE) ≤30 ≤30 ≤30
Saturated fatty acids (% TE) ≤10 ≤10 ≤10
Polyunsaturated fatty acids (%TE) 6-8 6-8 6-8
Monounsaturated fatty acids (%TE) ≤15 ≤15 ≤15
Cholesterol (mg/day) <200 <200 <200
Fibre (g/d) 20-30 20-30 20-30
Fluid (ml/d) Output + (500-750) Output + (500-750) 1500-2000
Minerals Conservative Hemodialysis Peritoneal dialysisSodium (mg/d) <2300 2000-4000 2000-4000
Potassium (mg/d) 1500 - 2700 (restrict if raised) 2000-3000 2000-4000
Calcium (mg/d) <2000-2500 (including binder) <2000-2500 (including binder) <2000-2500 (including binder)
Phosphate (mg/d) 800-1000 / 10mg/kg /10-12mg/g Prot P-binders
800-1000 /<17 mg/kg10-15mg/g Prot P-binders
800-1000 / 10-15mg/gProt P-binders
Iron (mg/d) 10-18 (Individualise supplemen-tation)
10-18 (Individualise supplementation) 10-18 (Individualise supplementation)
Zinc (mg/d) 12-15 (male)10-12 (female)
12-15 (male)10-12 (female)
12-15 (male)10-12 (female)
Selenium (μg/d) 55 55 55
NKF KDOQI: National Kidney Foundation Kidney Disease Outcome Quality Initiative aH-B: Harris Benedict Equation for determining Basal Energy ExpenditureTE: Total energy All calculations are based on Ideal Body Weight HBV: high biological value
3.1 Nutrition management of HIV/AIDS in CKD• Individualised assessment and management• Integrate specific nutrition challenges of HIV/AIDS with appropriate guidelines for CKDo wastingo lipodystrophy syndromeo nausea, vomiting, anorexiao diarrhoea o malabsorption o hormonal imbalanceso metabolic abnormalitieso side effects of medication
• Management o individualise o integrate guidelines for renal failure and HIV/AIDSo energy 10 – 15% extra for HIV/AIDS, till 25% (with active weight loss) 30-35kcal/kg up to 45-50kcal/kg in
severely catabolic patientso protein – to be individualised 1.2-1.5 g/kg22up to 2g/kg in severely catabolic patients. The lower range of
protein is for conservative patients that are not catabolic, increasing for dialysis and degree of acute illness o Na – 2000-4000mg/dayo potassium – 2000-3000mg/dayo calcium – 1000-1500o 10-12 mg/g of protein o fluid- output plus 1000-1200mlo iron – individualise to maintain iron storeso be aware of nephrotoxic effects of anti-retroviral and tuberculosis medications
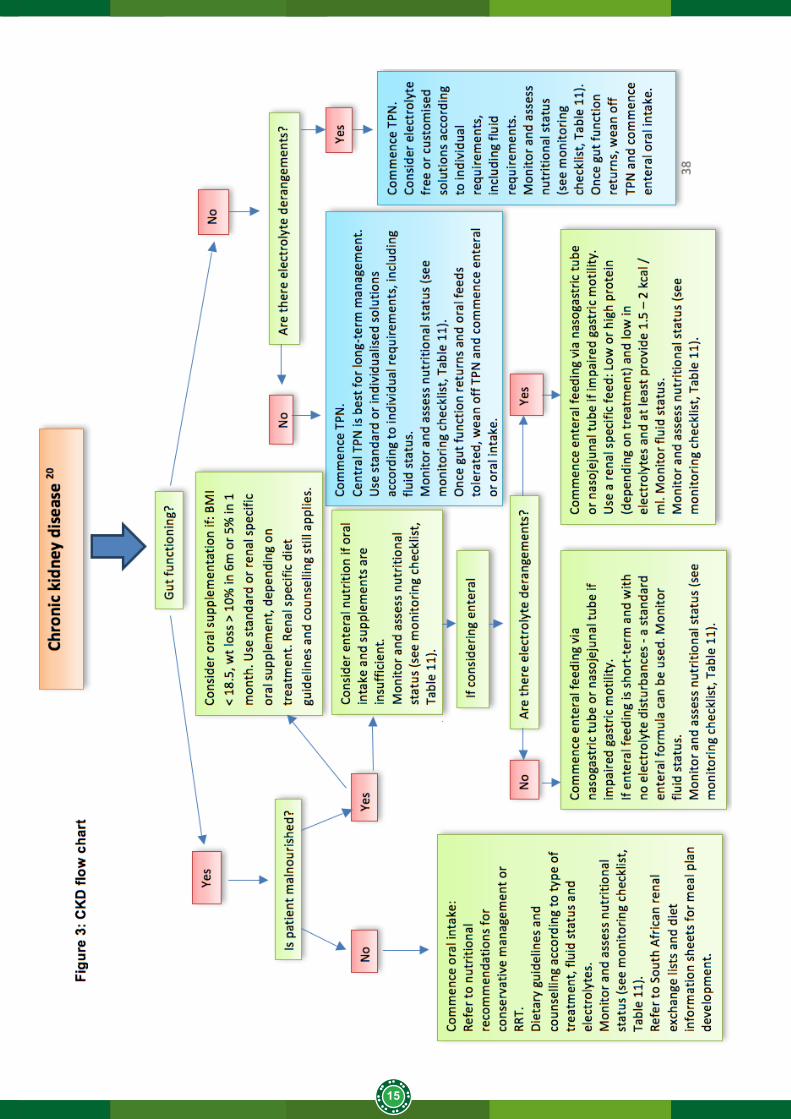
4. NUTRITIONAL INTERVENTION
Since protein-energy malnutrition has shown to be one of the most important risk factors for increased morbidity and mortality, every effort should be made to preserve optimal nutritional status in CKD patients. Figure 3 summarises the nutritional interventions for patients with CKD.Refer to Annexure 1 for enteral formulation guidelines.
15
16
5. MONITORING
# Practices vary amongst hospitals but minimum requirements should be according to internal hospital protocols.
5.1 Nutritional assessment, monitoring and follow-up
Table 12: Monitoring checklist for the hospitalised patient with chronic kidney disease (CKD) – conservative, RRT (HD and CAPD) 27, 52
Parameter Frequency of assessment
Conservative RRT
Anthropometry
Weight Daily To monitor changes in fluid status.
DailyTo monitor fluid, including pre- and post-dialysis weight.
*Biochemistry
Serum potassium, sodium Daily Daily
Serum urea and creatinine Daily Daily
Serum phosphorus, calcium and magnesium Weekly Weekly
Full blood count Weekly Weekly
Blood glucose Daily (if indicated) Daily (if indicated)
Serum albumin Weekly Weekly
Transferrin/RBS//Ferritin As needed As needed
CRP As needed As needed
Clinical
Signs and symptoms of oedema or dehydration Daily Daily
Stool output and consistency Daily DailyPractices may vary amongst hospitals (guided by resources and costing) but minimum requirements should be according to internal hospital protocols.
Table 13: Monitoring checklist for the out-patient with chronic kidney disease (CKD) – conservative, RRT (HD and CAPD) 27, 41, 57
Parameter Frequency of assessment
Conservative (pre-dialysis) RRT
Anthropometry
Weight 1- 3 monthly Monthly (PD) / 3x per week (pre- and post-HD)
BMI 1 -3 monthly 4 – monthly
SGA (subjective global assessment) 1 – 3 monthly 6 – monthly
Biochemistry #
Serum sodium 1 - 3 monthly 3 times a year
Potassium 6 times a year
Serum urea 1 - 3 monthly
Serum urea pre/post dialysis Monthly
Creatinine 1 - 3 monthly 3 times a year
Serum phosphorus 1 - 3 monthly 6 times a year
Serum calcium 1 - 3 monthly 6 times a year
Parathyroid hormone 3 times a year
Vitamin D Once a year
Bicarbonate (CO2 or HCO3) 6 times a year
White cell count and platelets 1 - 3 monthly Quarterly
Haemoglobin Monthly Monthly
Iron Quarterly
Ferritin Quarterly
Transferrin saturation Quarterly
Serum albumin 1 - 3 monthly Quarterly
Glucose (random) 2 times a year
HbA1C (diabetic patients only) 2 times a year
Lipogram fasting Once a year
Total cholesterol only Once a year
17
Clinical
Signs and symptoms of oedema or dehydration 1 - 3 monthly Monthly
Stool output and consistency 1 - 3 monthly Monthly
Urine
Glucose 1 - 3 monthly As needed
Protein 1 - 3 monthly As needed
Practices may vary amongst hospitals (guided by resources and costing) but minimum requirements should be according to internal hospital protocols.
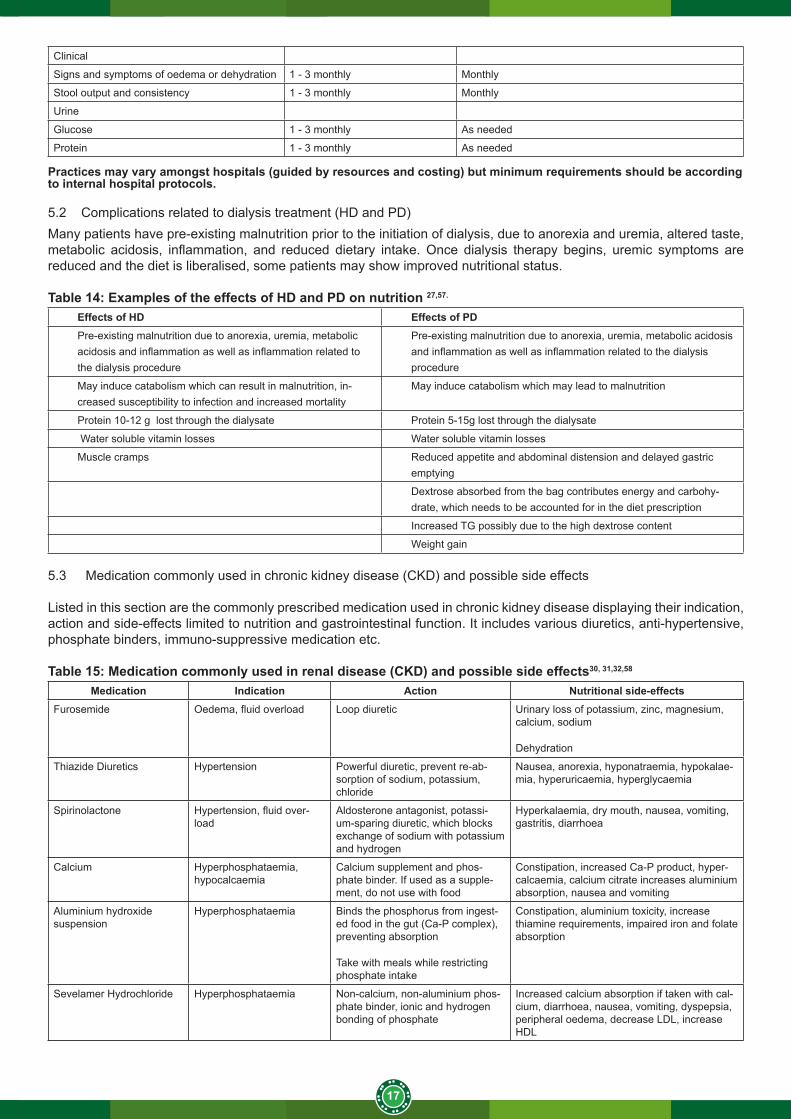
5.2 Complications related to dialysis treatment (HD and PD)Many patients have pre-existing malnutrition prior to the initiation of dialysis, due to anorexia and uremia, altered taste, metabolic acidosis, inflammation, and reduced dietary intake. Once dialysis therapy begins, uremic symptoms are reduced and the diet is liberalised, some patients may show improved nutritional status.
Table 14: Examples of the effects of HD and PD on nutrition 27,57.
Effects of HD Effects of PDPre-existing malnutrition due to anorexia, uremia, metabolic acidosis and inflammation as well as inflammation related to the dialysis procedure
Pre-existing malnutrition due to anorexia, uremia, metabolic acidosis and inflammation as well as inflammation related to the dialysis procedure
May induce catabolism which can result in malnutrition, in-creased susceptibility to infection and increased mortality
May induce catabolism which may lead to malnutrition
Protein 10-12 g lost through the dialysate Protein 5-15g lost through the dialysate
Water soluble vitamin losses Water soluble vitamin losses
Muscle cramps Reduced appetite and abdominal distension and delayed gastric emptying
Dextrose absorbed from the bag contributes energy and carbohy-drate, which needs to be accounted for in the diet prescription
Increased TG possibly due to the high dextrose content
Weight gain 5.3 Medication commonly used in chronic kidney disease (CKD) and possible side effects
Listed in this section are the commonly prescribed medication used in chronic kidney disease displaying their indication, action and side-effects limited to nutrition and gastrointestinal function. It includes various diuretics, anti-hypertensive, phosphate binders, immuno-suppressive medication etc.
Table 15: Medication commonly used in renal disease (CKD) and possible side effects30, 31,32,58
Medication Indication Action Nutritional side-effectsFurosemide Oedema, fluid overload Loop diuretic Urinary loss of potassium, zinc, magnesium,
calcium, sodium
Dehydration
Thiazide Diuretics Hypertension Powerful diuretic, prevent re-ab-sorption of sodium, potassium, chloride
Nausea, anorexia, hyponatraemia, hypokalae-mia, hyperuricaemia, hyperglycaemia
Spirinolactone Hypertension, fluid over-load
Aldosterone antagonist, potassi-um-sparing diuretic, which blocks exchange of sodium with potassium and hydrogen
Hyperkalaemia, dry mouth, nausea, vomiting, gastritis, diarrhoea
Calcium Hyperphosphataemia, hypocalcaemia
Calcium supplement and phos-phate binder. If used as a supple-ment, do not use with food
Constipation, increased Ca-P product, hyper-calcaemia, calcium citrate increases aluminium absorption, nausea and vomiting
Aluminium hydroxide suspension
Hyperphosphataemia Binds the phosphorus from ingest-ed food in the gut (Ca-P complex), preventing absorption
Take with meals while restricting phosphate intake
Constipation, aluminium toxicity, increase thiamine requirements, impaired iron and folate absorption
Sevelamer Hydrochloride Hyperphosphataemia Non-calcium, non-aluminium phos-phate binder, ionic and hydrogen bonding of phosphate
Increased calcium absorption if taken with cal-cium, diarrhoea, nausea, vomiting, dyspepsia, peripheral oedema, decrease LDL, increase HDL
18
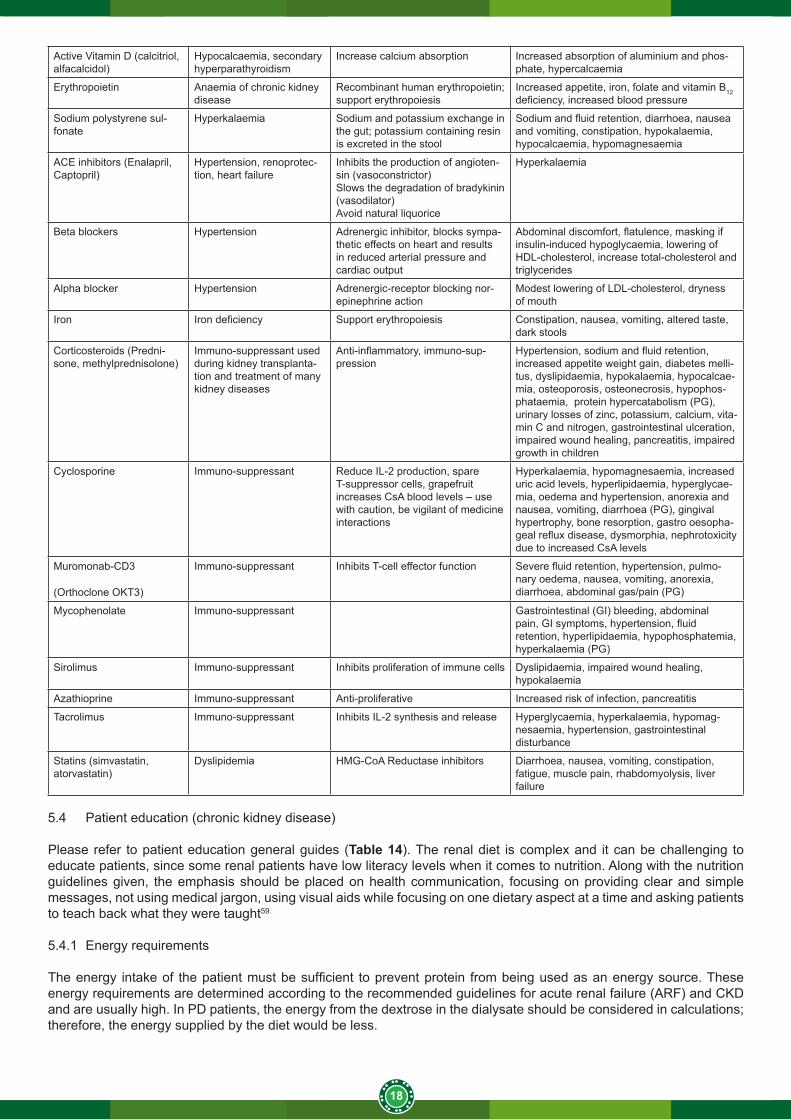
Active Vitamin D (calcitriol, alfacalcidol)
Hypocalcaemia, secondary hyperparathyroidism
Increase calcium absorption Increased absorption of aluminium and phos-phate, hypercalcaemia
Erythropoietin Anaemia of chronic kidney disease
Recombinant human erythropoietin; support erythropoiesis
Increased appetite, iron, folate and vitamin B12 deficiency, increased blood pressure
Sodium polystyrene sul-fonate
Hyperkalaemia Sodium and potassium exchange in the gut; potassium containing resin is excreted in the stool
Sodium and fluid retention, diarrhoea, nausea and vomiting, constipation, hypokalaemia, hypocalcaemia, hypomagnesaemia
ACE inhibitors (Enalapril, Captopril)
Hypertension, renoprotec-tion, heart failure
Inhibits the production of angioten-sin (vasoconstrictor)Slows the degradation of bradykinin (vasodilator)Avoid natural liquorice
Hyperkalaemia
Beta blockers Hypertension Adrenergic inhibitor, blocks sympa-thetic effects on heart and results in reduced arterial pressure and cardiac output
Abdominal discomfort, flatulence, masking if insulin-induced hypoglycaemia, lowering of HDL-cholesterol, increase total-cholesterol and triglycerides
Alpha blocker Hypertension Adrenergic-receptor blocking nor-epinephrine action
Modest lowering of LDL-cholesterol, dryness of mouth
Iron Iron deficiency Support erythropoiesis Constipation, nausea, vomiting, altered taste, dark stools
Corticosteroids (Predni-sone, methylprednisolone)
Immuno-suppressant used during kidney transplanta-tion and treatment of many kidney diseases
Anti-inflammatory, immuno-sup-pression
Hypertension, sodium and fluid retention, increased appetite weight gain, diabetes melli-tus, dyslipidaemia, hypokalaemia, hypocalcae-mia, osteoporosis, osteonecrosis, hypophos-phataemia, protein hypercatabolism (PG), urinary losses of zinc, potassium, calcium, vita-min C and nitrogen, gastrointestinal ulceration, impaired wound healing, pancreatitis, impaired growth in children
Cyclosporine Immuno-suppressant Reduce IL-2 production, spare T-suppressor cells, grapefruit increases CsA blood levels – use with caution, be vigilant of medicine interactions
Hyperkalaemia, hypomagnesaemia, increased uric acid levels, hyperlipidaemia, hyperglycae-mia, oedema and hypertension, anorexia and nausea, vomiting, diarrhoea (PG), gingival hypertrophy, bone resorption, gastro oesopha-geal reflux disease, dysmorphia, nephrotoxicity due to increased CsA levels
Muromonab-CD3
(Orthoclone OKT3)
Immuno-suppressant Inhibits T-cell effector function Severe fluid retention, hypertension, pulmo-nary oedema, nausea, vomiting, anorexia, diarrhoea, abdominal gas/pain (PG)
Mycophenolate Immuno-suppressant Gastrointestinal (GI) bleeding, abdominal pain, GI symptoms, hypertension, fluid retention, hyperlipidaemia, hypophosphatemia, hyperkalaemia (PG)
Sirolimus Immuno-suppressant Inhibits proliferation of immune cells Dyslipidaemia, impaired wound healing, hypokalaemia
Azathioprine Immuno-suppressant Anti-proliferative Increased risk of infection, pancreatitis
Tacrolimus Immuno-suppressant Inhibits IL-2 synthesis and release Hyperglycaemia, hyperkalaemia, hypomag-nesaemia, hypertension, gastrointestinal disturbance
Statins (simvastatin, atorvastatin)
Dyslipidemia HMG-CoA Reductase inhibitors Diarrhoea, nausea, vomiting, constipation, fatigue, muscle pain, rhabdomyolysis, liver failure
5.4 Patient education (chronic kidney disease)
Please refer to patient education general guides (Table 14). The renal diet is complex and it can be challenging to educate patients, since some renal patients have low literacy levels when it comes to nutrition. Along with the nutrition guidelines given, the emphasis should be placed on health communication, focusing on providing clear and simple messages, not using medical jargon, using visual aids while focusing on one dietary aspect at a time and asking patients to teach back what they were taught59.
5.4.1 Energy requirements
The energy intake of the patient must be sufficient to prevent protein from being used as an energy source. These energy requirements are determined according to the recommended guidelines for acute renal failure (ARF) and CKD and are usually high. In PD patients, the energy from the dextrose in the dialysate should be considered in calculations; therefore, the energy supplied by the diet would be less.
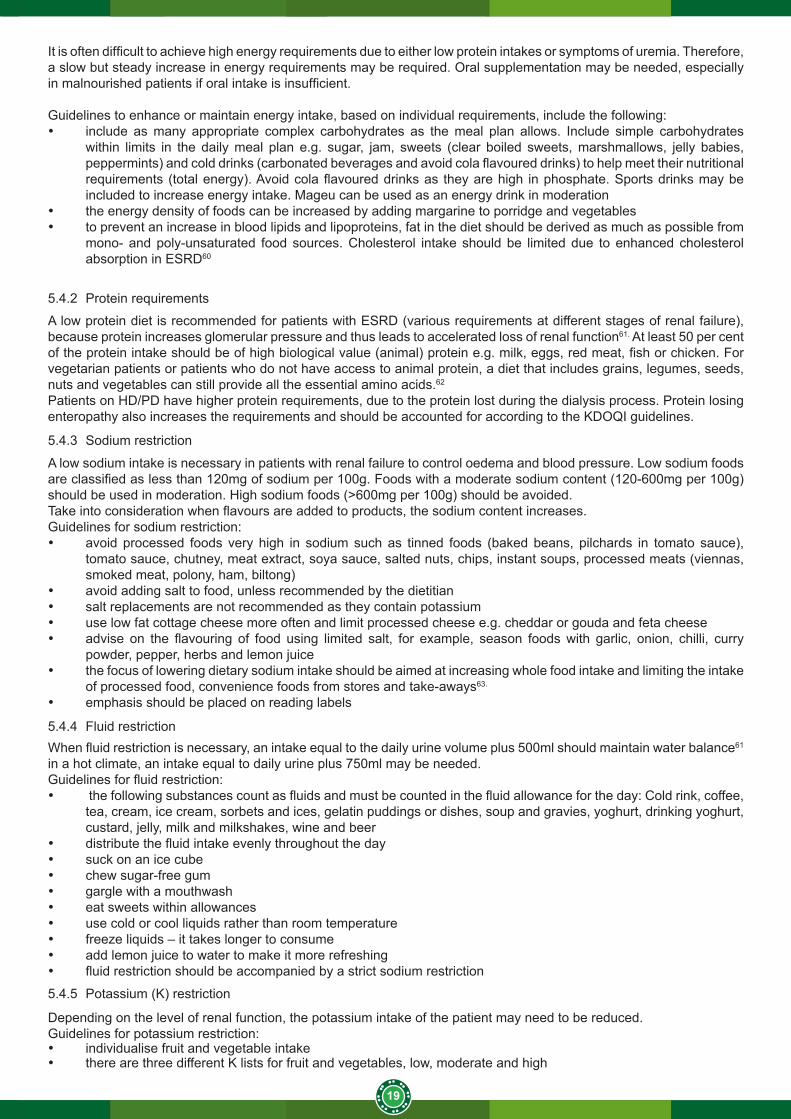
19
It is often difficult to achieve high energy requirements due to either low protein intakes or symptoms of uremia. Therefore, a slow but steady increase in energy requirements may be required. Oral supplementation may be needed, especially in malnourished patients if oral intake is insufficient.
Guidelines to enhance or maintain energy intake, based on individual requirements, include the following:• include as many appropriate complex carbohydrates as the meal plan allows. Include simple carbohydrates
within limits in the daily meal plan e.g. sugar, jam, sweets (clear boiled sweets, marshmallows, jelly babies, peppermints) and cold drinks (carbonated beverages and avoid cola flavoured drinks) to help meet their nutritional requirements (total energy). Avoid cola flavoured drinks as they are high in phosphate. Sports drinks may be included to increase energy intake. Mageu can be used as an energy drink in moderation
• the energy density of foods can be increased by adding margarine to porridge and vegetables • to prevent an increase in blood lipids and lipoproteins, fat in the diet should be derived as much as possible from
mono- and poly-unsaturated food sources. Cholesterol intake should be limited due to enhanced cholesterol absorption in ESRD60
5.4.2 Protein requirements
A low protein diet is recommended for patients with ESRD (various requirements at different stages of renal failure), because protein increases glomerular pressure and thus leads to accelerated loss of renal function61. At least 50 per cent of the protein intake should be of high biological value (animal) protein e.g. milk, eggs, red meat, fish or chicken. For vegetarian patients or patients who do not have access to animal protein, a diet that includes grains, legumes, seeds, nuts and vegetables can still provide all the essential amino acids.62
Patients on HD/PD have higher protein requirements, due to the protein lost during the dialysis process. Protein losing enteropathy also increases the requirements and should be accounted for according to the KDOQI guidelines.
5.4.3 Sodium restriction
A low sodium intake is necessary in patients with renal failure to control oedema and blood pressure. Low sodium foods are classified as less than 120mg of sodium per 100g. Foods with a moderate sodium content (120-600mg per 100g) should be used in moderation. High sodium foods (>600mg per 100g) should be avoided. Take into consideration when flavours are added to products, the sodium content increases.Guidelines for sodium restriction:• avoid processed foods very high in sodium such as tinned foods (baked beans, pilchards in tomato sauce),
tomato sauce, chutney, meat extract, soya sauce, salted nuts, chips, instant soups, processed meats (viennas, smoked meat, polony, ham, biltong)
• avoid adding salt to food, unless recommended by the dietitian• salt replacements are not recommended as they contain potassium• use low fat cottage cheese more often and limit processed cheese e.g. cheddar or gouda and feta cheese • advise on the flavouring of food using limited salt, for example, season foods with garlic, onion, chilli, curry
powder, pepper, herbs and lemon juice • the focus of lowering dietary sodium intake should be aimed at increasing whole food intake and limiting the intake
of processed food, convenience foods from stores and take-aways63.
• emphasis should be placed on reading labels
5.4.4 Fluid restrictionWhen fluid restriction is necessary, an intake equal to the daily urine volume plus 500ml should maintain water balance61 in a hot climate, an intake equal to daily urine plus 750ml may be needed.Guidelines for fluid restriction:• the following substances count as fluids and must be counted in the fluid allowance for the day: Cold rink, coffee,
tea, cream, ice cream, sorbets and ices, gelatin puddings or dishes, soup and gravies, yoghurt, drinking yoghurt, custard, jelly, milk and milkshakes, wine and beer
• distribute the fluid intake evenly throughout the day• suck on an ice cube• chew sugar-free gum• gargle with a mouthwash• eat sweets within allowances• use cold or cool liquids rather than room temperature• freeze liquids – it takes longer to consume• add lemon juice to water to make it more refreshing• fluid restriction should be accompanied by a strict sodium restriction
5.4.5 Potassium (K) restriction
Depending on the level of renal function, the potassium intake of the patient may need to be reduced.Guidelines for potassium restriction:• individualise fruit and vegetable intake• there are three different K lists for fruit and vegetables, low, moderate and high
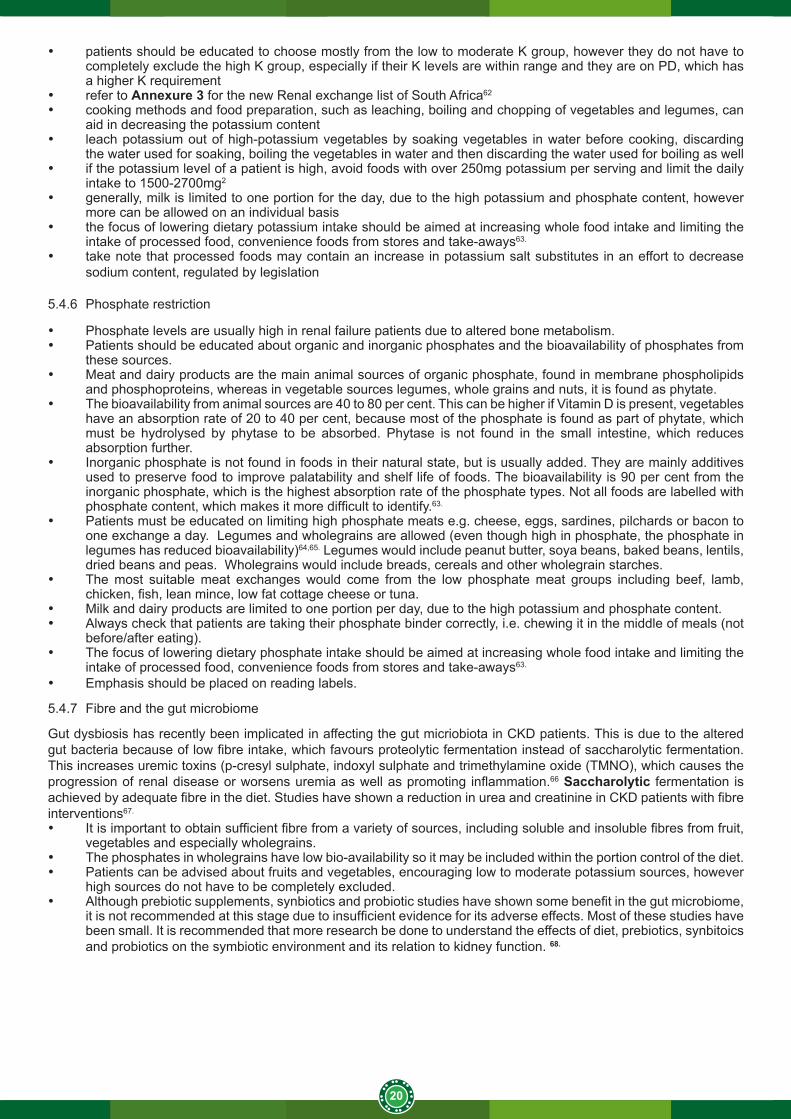
20
• patients should be educated to choose mostly from the low to moderate K group, however they do not have to completely exclude the high K group, especially if their K levels are within range and they are on PD, which has a higher K requirement
• refer to Annexure 3 for the new Renal exchange list of South Africa62
• cooking methods and food preparation, such as leaching, boiling and chopping of vegetables and legumes, can aid in decreasing the potassium content
• leach potassium out of high-potassium vegetables by soaking vegetables in water before cooking, discarding the water used for soaking, boiling the vegetables in water and then discarding the water used for boiling as well
• if the potassium level of a patient is high, avoid foods with over 250mg potassium per serving and limit the daily intake to 1500-2700mg2
• generally, milk is limited to one portion for the day, due to the high potassium and phosphate content, however more can be allowed on an individual basis
• the focus of lowering dietary potassium intake should be aimed at increasing whole food intake and limiting the intake of processed food, convenience foods from stores and take-aways63.
• take note that processed foods may contain an increase in potassium salt substitutes in an effort to decrease sodium content, regulated by legislation
5.4.6 Phosphate restriction
• Phosphate levels are usually high in renal failure patients due to altered bone metabolism.• Patients should be educated about organic and inorganic phosphates and the bioavailability of phosphates from
these sources.• Meat and dairy products are the main animal sources of organic phosphate, found in membrane phospholipids
and phosphoproteins, whereas in vegetable sources legumes, whole grains and nuts, it is found as phytate.• The bioavailability from animal sources are 40 to 80 per cent. This can be higher if Vitamin D is present, vegetables
have an absorption rate of 20 to 40 per cent, because most of the phosphate is found as part of phytate, which must be hydrolysed by phytase to be absorbed. Phytase is not found in the small intestine, which reduces absorption further.
• Inorganic phosphate is not found in foods in their natural state, but is usually added. They are mainly additives used to preserve food to improve palatability and shelf life of foods. The bioavailability is 90 per cent from the inorganic phosphate, which is the highest absorption rate of the phosphate types. Not all foods are labelled with phosphate content, which makes it more difficult to identify.63.
• Patients must be educated on limiting high phosphate meats e.g. cheese, eggs, sardines, pilchards or bacon to one exchange a day. Legumes and wholegrains are allowed (even though high in phosphate, the phosphate in legumes has reduced bioavailability)64,65. Legumes would include peanut butter, soya beans, baked beans, lentils, dried beans and peas. Wholegrains would include breads, cereals and other wholegrain starches.
• The most suitable meat exchanges would come from the low phosphate meat groups including beef, lamb, chicken, fish, lean mince, low fat cottage cheese or tuna.
• Milk and dairy products are limited to one portion per day, due to the high potassium and phosphate content. • Always check that patients are taking their phosphate binder correctly, i.e. chewing it in the middle of meals (not
before/after eating). • The focus of lowering dietary phosphate intake should be aimed at increasing whole food intake and limiting the
intake of processed food, convenience foods from stores and take-aways63.
• Emphasis should be placed on reading labels.
5.4.7 Fibre and the gut microbiome
Gut dysbiosis has recently been implicated in affecting the gut micriobiota in CKD patients. This is due to the altered gut bacteria because of low fibre intake, which favours proteolytic fermentation instead of saccharolytic fermentation. This increases uremic toxins (p-cresyl sulphate, indoxyl sulphate and trimethylamine oxide (TMNO), which causes the progression of renal disease or worsens uremia as well as promoting inflammation.66 Saccharolytic fermentation is achieved by adequate fibre in the diet. Studies have shown a reduction in urea and creatinine in CKD patients with fibre interventions67.
• It is important to obtain sufficient fibre from a variety of sources, including soluble and insoluble fibres from fruit, vegetables and especially wholegrains.
• The phosphates in wholegrains have low bio-availability so it may be included within the portion control of the diet. • Patients can be advised about fruits and vegetables, encouraging low to moderate potassium sources, however
high sources do not have to be completely excluded.• Although prebiotic supplements, synbiotics and probiotic studies have shown some benefit in the gut microbiome,
it is not recommended at this stage due to insufficient evidence for its adverse effects. Most of these studies have been small. It is recommended that more research be done to understand the effects of diet, prebiotics, synbitoics and probiotics on the symbiotic environment and its relation to kidney function. 68.
21
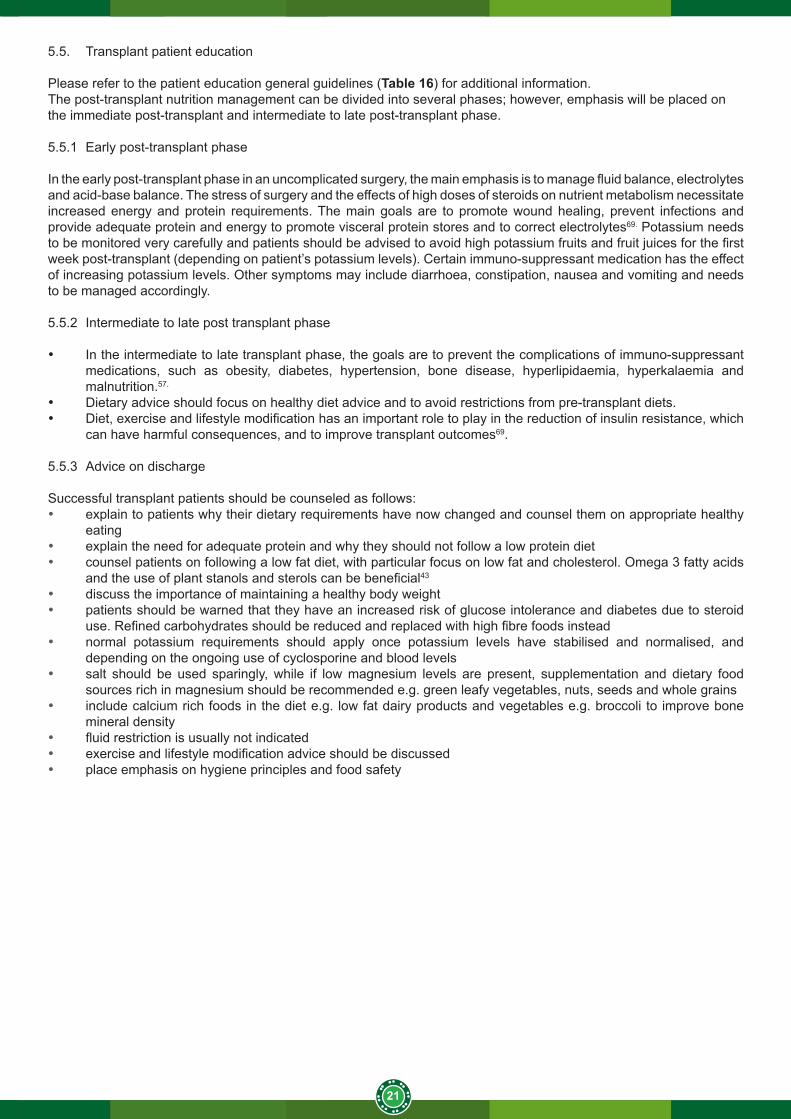
5.5. Transplant patient education
Please refer to the patient education general guidelines (Table 16) for additional information.The post-transplant nutrition management can be divided into several phases; however, emphasis will be placed on the immediate post-transplant and intermediate to late post-transplant phase.
5.5.1 Early post-transplant phase
In the early post-transplant phase in an uncomplicated surgery, the main emphasis is to manage fluid balance, electrolytes and acid-base balance. The stress of surgery and the effects of high doses of steroids on nutrient metabolism necessitate increased energy and protein requirements. The main goals are to promote wound healing, prevent infections and provide adequate protein and energy to promote visceral protein stores and to correct electrolytes69. Potassium needs to be monitored very carefully and patients should be advised to avoid high potassium fruits and fruit juices for the first week post-transplant (depending on patient’s potassium levels). Certain immuno-suppressant medication has the effect of increasing potassium levels. Other symptoms may include diarrhoea, constipation, nausea and vomiting and needs to be managed accordingly.
5.5.2 Intermediate to late post transplant phase
• In the intermediate to late transplant phase, the goals are to prevent the complications of immuno-suppressant medications, such as obesity, diabetes, hypertension, bone disease, hyperlipidaemia, hyperkalaemia and malnutrition.57.
• Dietary advice should focus on healthy diet advice and to avoid restrictions from pre-transplant diets. • Diet, exercise and lifestyle modification has an important role to play in the reduction of insulin resistance, which
can have harmful consequences, and to improve transplant outcomes69.
5.5.3 Advice on discharge
Successful transplant patients should be counseled as follows:• explain to patients why their dietary requirements have now changed and counsel them on appropriate healthy
eating• explain the need for adequate protein and why they should not follow a low protein diet• counsel patients on following a low fat diet, with particular focus on low fat and cholesterol. Omega 3 fatty acids
and the use of plant stanols and sterols can be beneficial43
• discuss the importance of maintaining a healthy body weight• patients should be warned that they have an increased risk of glucose intolerance and diabetes due to steroid
use. Refined carbohydrates should be reduced and replaced with high fibre foods instead • normal potassium requirements should apply once potassium levels have stabilised and normalised, and
depending on the ongoing use of cyclosporine and blood levels • salt should be used sparingly, while if low magnesium levels are present, supplementation and dietary food
sources rich in magnesium should be recommended e.g. green leafy vegetables, nuts, seeds and whole grains• include calcium rich foods in the diet e.g. low fat dairy products and vegetables e.g. broccoli to improve bone
mineral density• fluid restriction is usually not indicated• exercise and lifestyle modification advice should be discussed • place emphasis on hygiene principles and food safety
22
Figure 4: Patient education flow diagram27, 61, 69
23
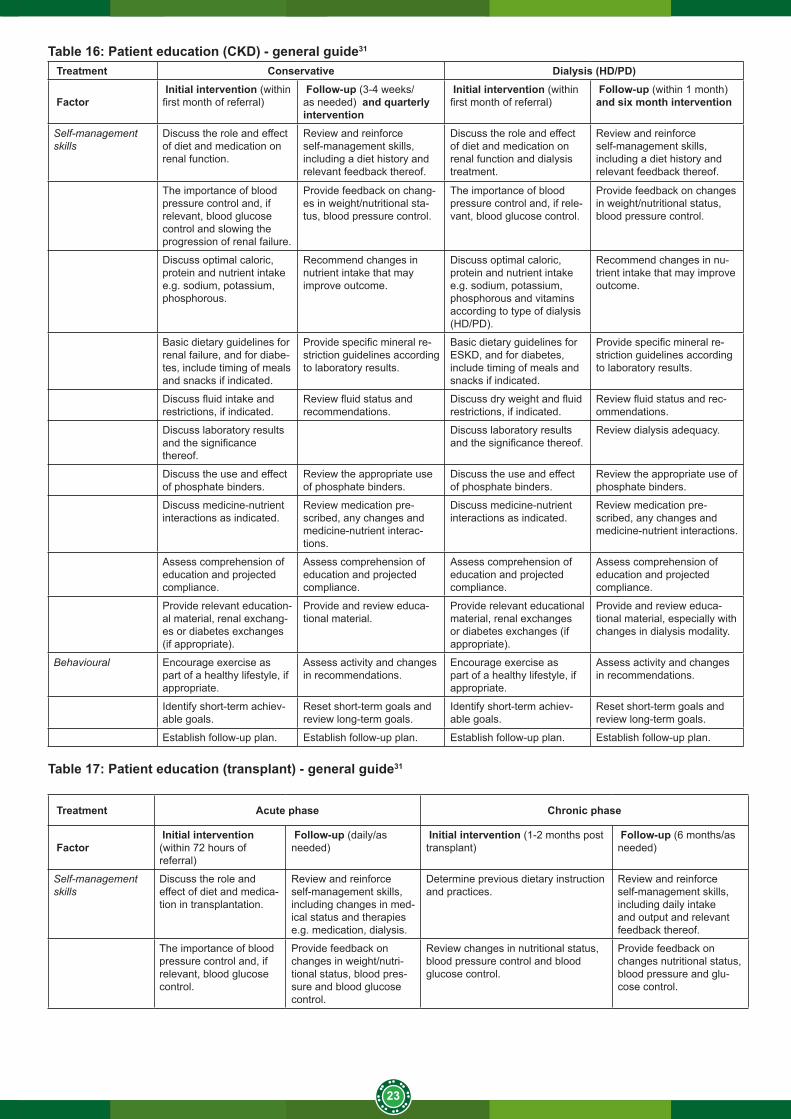
Table 16: Patient education (CKD) - general guide31
Treatment Conservative Dialysis (HD/PD)
Factor Initial intervention (within first month of referral)
Follow-up (3-4 weeks/as needed) and quarterly intervention
Initial intervention (within first month of referral)
Follow-up (within 1 month) and six month intervention
Self-management skills
Discuss the role and effect of diet and medication on renal function.
Review and reinforce self-management skills, including a diet history and relevant feedback thereof.
Discuss the role and effect of diet and medication on renal function and dialysis treatment.
Review and reinforce self-management skills, including a diet history and relevant feedback thereof.
The importance of blood pressure control and, if relevant, blood glucose control and slowing the progression of renal failure.
Provide feedback on chang-es in weight/nutritional sta-tus, blood pressure control.
The importance of blood pressure control and, if rele-vant, blood glucose control.
Provide feedback on changes in weight/nutritional status, blood pressure control.
Discuss optimal caloric, protein and nutrient intake e.g. sodium, potassium, phosphorous.
Recommend changes in nutrient intake that may improve outcome.
Discuss optimal caloric, protein and nutrient intake e.g. sodium, potassium, phosphorous and vitamins according to type of dialysis (HD/PD).
Recommend changes in nu-trient intake that may improve outcome.
Basic dietary guidelines for renal failure, and for diabe-tes, include timing of meals and snacks if indicated.
Provide specific mineral re-striction guidelines according to laboratory results.
Basic dietary guidelines for ESKD, and for diabetes, include timing of meals and snacks if indicated.
Provide specific mineral re-striction guidelines according to laboratory results.
Discuss fluid intake and restrictions, if indicated.
Review fluid status and recommendations.
Discuss dry weight and fluid restrictions, if indicated.
Review fluid status and rec-ommendations.
Discuss laboratory results and the significance thereof.
Discuss laboratory results and the significance thereof.
Review dialysis adequacy.
Discuss the use and effect of phosphate binders.
Review the appropriate use of phosphate binders.
Discuss the use and effect of phosphate binders.
Review the appropriate use of phosphate binders.
Discuss medicine-nutrient interactions as indicated.
Review medication pre-scribed, any changes and medicine-nutrient interac-tions.
Discuss medicine-nutrient interactions as indicated.
Review medication pre-scribed, any changes and medicine-nutrient interactions.
Assess comprehension of education and projected compliance.
Assess comprehension of education and projected compliance.
Assess comprehension of education and projected compliance.
Assess comprehension of education and projected compliance.
Provide relevant education-al material, renal exchang-es or diabetes exchanges (if appropriate).
Provide and review educa-tional material.
Provide relevant educational material, renal exchanges or diabetes exchanges (if appropriate).
Provide and review educa-tional material, especially with changes in dialysis modality.
Behavioural Encourage exercise as part of a healthy lifestyle, if appropriate.
Assess activity and changes in recommendations.
Encourage exercise as part of a healthy lifestyle, if appropriate.
Assess activity and changes in recommendations.
Identify short-term achiev-able goals.
Reset short-term goals and review long-term goals.
Identify short-term achiev-able goals.
Reset short-term goals and review long-term goals.
Establish follow-up plan. Establish follow-up plan. Establish follow-up plan. Establish follow-up plan.
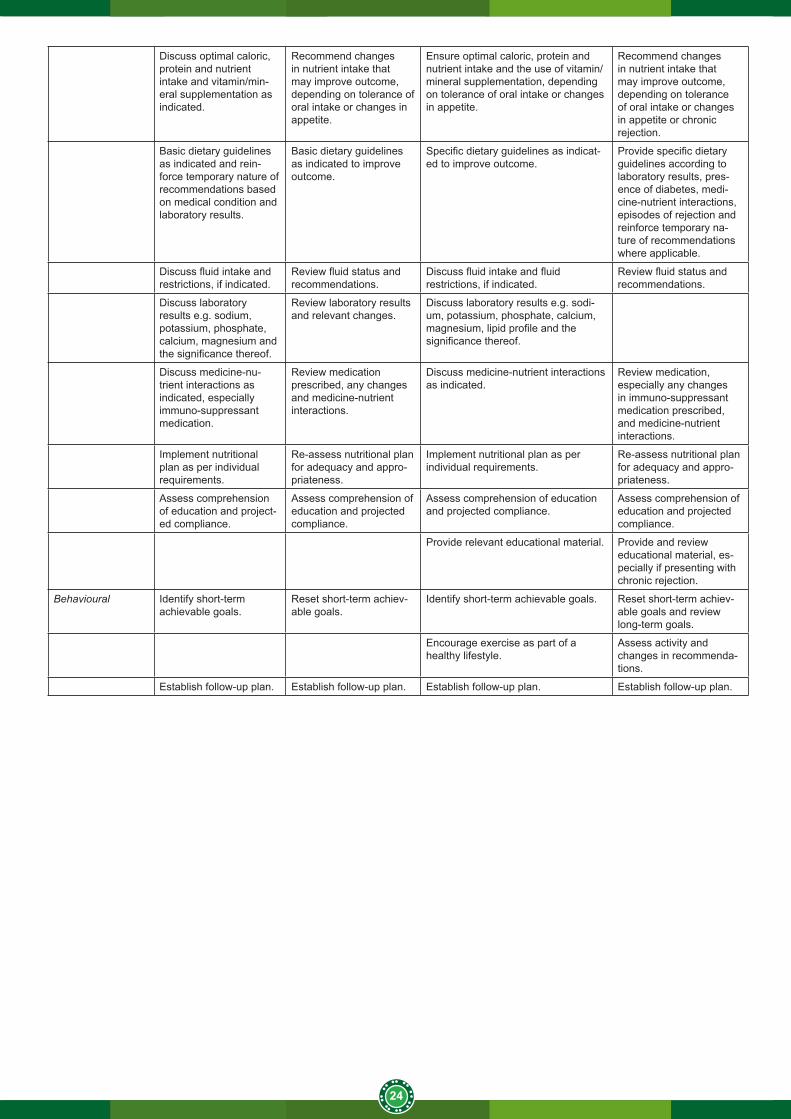
Table 17: Patient education (transplant) - general guide31
Treatment Acute phase Chronic phase
Factor Initial intervention (within 72 hours of referral)
Follow-up (daily/as needed)
Initial intervention (1-2 months post transplant)
Follow-up (6 months/as needed)
Self-management skills
Discuss the role and effect of diet and medica-tion in transplantation.
Review and reinforce self-management skills, including changes in med-ical status and therapies e.g. medication, dialysis.
Determine previous dietary instruction and practices.
Review and reinforce self-management skills, including daily intake and output and relevant feedback thereof.
The importance of blood pressure control and, if relevant, blood glucose control.
Provide feedback on changes in weight/nutri-tional status, blood pres-sure and blood glucose control.
Review changes in nutritional status, blood pressure control and blood glucose control.
Provide feedback on changes nutritional status, blood pressure and glu-cose control.
24
Discuss optimal caloric, protein and nutrient intake and vitamin/min-eral supplementation as indicated.
Recommend changes in nutrient intake that may improve outcome, depending on tolerance of oral intake or changes in appetite.
Ensure optimal caloric, protein and nutrient intake and the use of vitamin/mineral supplementation, depending on tolerance of oral intake or changes in appetite.
Recommend changes in nutrient intake that may improve outcome, depending on tolerance of oral intake or changes in appetite or chronic rejection.
Basic dietary guidelines as indicated and rein-force temporary nature of recommendations based on medical condition and laboratory results.
Basic dietary guidelines as indicated to improve outcome.
Specific dietary guidelines as indicat-ed to improve outcome.
Provide specific dietary guidelines according to laboratory results, pres-ence of diabetes, medi-cine-nutrient interactions, episodes of rejection and reinforce temporary na-ture of recommendations where applicable.
Discuss fluid intake and restrictions, if indicated.
Review fluid status and recommendations.
Discuss fluid intake and fluid restrictions, if indicated.
Review fluid status and recommendations.
Discuss laboratory results e.g. sodium, potassium, phosphate, calcium, magnesium and the significance thereof.
Review laboratory results and relevant changes.
Discuss laboratory results e.g. sodi-um, potassium, phosphate, calcium, magnesium, lipid profile and the significance thereof.
Discuss medicine-nu-trient interactions as indicated, especially immuno-suppressant medication.
Review medication prescribed, any changes and medicine-nutrient interactions.
Discuss medicine-nutrient interactions as indicated.
Review medication, especially any changes in immuno-suppressant medication prescribed, and medicine-nutrient interactions.
Implement nutritional plan as per individual requirements.
Re-assess nutritional plan for adequacy and appro-priateness.
Implement nutritional plan as per individual requirements.
Re-assess nutritional plan for adequacy and appro-priateness.
Assess comprehension of education and project-ed compliance.
Assess comprehension of education and projected compliance.
Assess comprehension of education and projected compliance.
Assess comprehension of education and projected compliance.
Provide relevant educational material. Provide and review educational material, es-pecially if presenting with chronic rejection.
Behavioural Identify short-term achievable goals.
Reset short-term achiev-able goals.
Identify short-term achievable goals. Reset short-term achiev-able goals and review long-term goals.
Encourage exercise as part of a healthy lifestyle.
Assess activity and changes in recommenda-tions.
Establish follow-up plan. Establish follow-up plan. Establish follow-up plan. Establish follow-up plan.
25
6. REFERENCES
1. Clin J Am Soc Nephrol. 2013 Sep;8(9):1482-93. doi: 10.2215/CJN.00710113. Epub 2013 Jun 6. World incidence of AKI: a meta-analysis.
2. Susantitaphong P, Cruz DN, Cerda J, Abulfaraj M, Alqahtani F, Koulouridis I, Jaber BL; Acute Kidney Injury Advisory Group of the American Society of Nephrology: World incidence of AKI: a meta-analysis. Clin J Am Soc Nephrol 8: 1482–1493, 2013.
3. Transplantation. 2013 Mar 15;95(5):653-7. doi: 10.1097/TP.0b013e31828848bc Acute kidney injury: global health alert.
4. Li PK1, Burdmann EA, Mehta RL; World Kidney Day Steering Committee 20135. (SA Renal Registry, 2012) Ref SA renal registry doc, pg 15)6. Naicker S. Burden of end-stage renal disease in sub-Saharan Africa, Clinical Nephrology, Vol. 74 – Suppl. 1/2010
(S13-S16),7. Dennen P, Douglas IS, Anderson R. Acute kidney injury in the intensive care unit: An update and primer for the
intensivist. Crit Care Med. 2010; 38 (1): 1-15.8. Valencia E, Marin A, Hardy G. Nutritional Therapy for acute kidney injury. Curr Opin Clin Metab Care. 2009;
12:241-244.9. Kidney Disease - Improving Global Outcomes (KDIGO). KDIGO Clinical Practice Guideline for Acute Kidney
Injury. Kidney International Supplements. 2012; 2 (1): doi:10.1038/kisup.2012.210. Honore PM, Jacobs R, Joannes-Boyau O, De RegtJ, Boer W, De Waele E, Collin V, Spapen HD. Septic AKI in
ICU patients. Diagnosis, pathophysiology, and treatment type, dosing, and timing: a comprehensive review of recent and future developments. Ann Intensive Care. 2011; 1:32.
11. Mehta RL, Kellum JA, Shah SV, Molitoris BA, Ronco C, Warnock DG, Levin A & the Acute Kidney Injury Network. Acute Kidney Injury Network: report of an initiative to improve outcomes in acute kidney injury. Crit Care.2007; 11: R31. [Doi:10.1186/cc5713].
12. Beto, JA, Bansal VK. Medical nutrition therapy in chronic kidney failure: Integrating clinical practice guidelines. Journal of the American Dietetics Association.2004; 104: 404 – 409.
13. Toigo G, Aparico M, Attman P-O, Cano N, Cianciaruso B, Engel B, Fouque D, Heidland A, Teplan V, Wanner C. Clinical nutrition. Expert working group report on nutrition in adult patients with renal insufficiency. Clinical Nutrition.
14. Herselman M. Nutrition in renal failure. Spec Med 1999; May; 313-320.15. McCarthy MS, Phipps SC. Special Nutrition Challenges: Current Approaches to Acute Kidney Injury. Nutr Clin
Pract. 2013. [Doi:10.1177/0884533613515726].16. Gervasio JM, Cotton AB. Nutrition Support Therapy in Acute Kidney Injury: Distinguishing Dogma from Good
Practice. Curr Gastroenterology Reports. 2009; 11: 325-331. 17. Fiaccadori E, Regolisti G, Cabassi A. Specific nutritional problems in acute kidney injury, treated with non-dialysis
and dialytic modalities. NDT Plus. 2010; 3: 1-7.18. Fiaccadori E, Regolisti G, Maggiore U. Specialized Nutritional Support Interventions in Critically Ill patients on
Renal Replacement Therapy. Curr Opin Clin Nutr Metab Care. 2013; 16:217-224.19. Fiaccadori E, Parenti E, Maggoire U. Nutritional support in acute kidney injury. J Nephrol. 2008; 21: 645-666.20. Cano NJM, Aparicio M, Brunori G, Carrero JJ, Cianciaruso B, Fiaccadori E, Lindholm B, Teplan V, Fouque D,
Guarnieri G. ESPEN Guidelines on Parenteral Nutrition: Acute kidney injury. Clin Nutr. 2009; 28: 401-414. 21. Amrein K, Venkatesh B. Vitamin D and the critically ill patient. Curr Opin Clin Nutr Metab Care. 2012; 15: 188-19322. Byham-Gray L, Wiesen K. A Clinical Guide to Nutrition Care in Kidney Disease. Renal Dietitians Dietetic Practice
Group of the American Dietetic Association and the Council on Renal Nutrition of the National Kidney Foundation. 2004, Chicago
23. Brochard L, Abroug F, Brenner M, Broccard AF, Danner RL, Ferrer M, Laghi F, Magder S, Papzian L, Pelosi P, Polderman KH. An official ATS/ ERS/ ESICM/ SCCM/ SRLF Statement: Prevention & Management of Acute kidney injury in the ICU Patient. Am J Respir Crit Care Med. 2010; 181:1128-1155.
24. Gordon, S. (2003). The Data in Support of Glutamine Supplementation. Nutrition in Clinical Practice. 18 (5). pp. 386-390.
25. McCarthy MS & Phipps SC. Special Nutrition Challenges: Current Approach to Acute Kidney Injury. NutrClinPract 2014; 29 (1): 56 - 62
26. Lochs H, Valentini T, Schutz SP, Allison P, Howard C et al. ESPEN Guidelines on Adult Enteral Nutrition. Clinical Nutrition 2006; 25:177-360.
27. Adapted from Mahan, L.K, Escott-Stump, S. & Raymond, J.L. (2012). Krause’s Food and the Nutrition Care Process. 13th Ed. Elsevier
28. Adapted from McClave, S.A. (2009). Guidelines for the provision and assessment of nutrition support therapy in the adult critically ill patients. JPEN J Parenter Enteral Nutri, 33:277
29. American Journal of kidney Diseases, Vol 45, No 6 (June), 2005: pp1122-1131. Complications of hemodialysis: Manual of clinical dialysis pp 59-77 2009 Springer US
30. Rossiter D, editor. SAMF 9th ed. Produced by Division of Clinical Pharmacology, Faculty of Health Sciences. University of Cape Town; 2010.
31. Wiggens KL. Renal Care: Resources and Practical Applications. Renal Dietitians Dietetic Practice Group, ADA.
26
2004, Chicago.32. NKF. Pocket Guide to Nutrition Assessment of the Renal Patient. 3rd ed. 2002, New York, National Kidney
Foundation. 33. McCann L. Pocket Guide to Nutritional Assessment of the Patient with Chronic Kidney Disease. 3rded. New York,
NY: National Kidney Foundation; 2002.34. Wiggens KL. Guidelines for Nutrition Care of Renal Patients 3rd Edition. Renal Dietitians Dietetic Practice Group,
ADA. 2002, USA35. DIGO 2012. Clinical Practice Guidelines for the Evaluation and Management of Chronic Kidney Disease. Jan
2013. Kidney International Supplements, Vol 3, Issue 1.36. National Kidney Foundation. KDOQI clinical practice guidelines for chronic kidney disease. Guideline 12. 200037. Judith A.B, Vinod K.B. Medical Nutrition Therapy in Chronic Kidney Failure: Integrating Clinical Practice Guidelines.
Journal of the American Dietetic Association. 2004; 104:404-409.38. Clinical Guidelines on the Identification, Evaluation, and Treatment of Overweight and Obesity in Adults (1998):
The Evidence Report: National Institutes of Health.98-4083. NIH publication.39. Cheng J, Peng H, Yuan Z, Zhung K, Xiao L, Huang J, Wang J, Huang H. Combination with Anthropometric
Measurements and MQSGA to Assess Nutritional Status in Chinese Hemodialysis Population. Int.J.Med.Sci.2013, Vol.10.
40. Wright M and Jones C.2013. Nutrition in CKD41. Paget G. and Naicker S. Guideline for the optimal care of patients on chronic dialysis in South Africa. May 2015.
South African Renal Society. 42. National Kidney Foundation. KDOQI clinical practice guidelines for chronic kidney disease: Evaluation,
classification and stratification. Am J Kidney Dis. 2002;39: S128-S129.-S140.43. KDIGO 2012 Clinical Practice Guideline for the Evaluation and Management of Chronic Kidney Disease. 2013.3.
(1)44. National Kidney Foundation. KDOQI clinical practice guidelines for chronic kidney disease. Am J Kidney Dis.
2000;35(6 suppl 2): S1-S140.45. Fouque D et al. EBPG Guidelines on Nutrition. Nephrol Dial Transplant 2007; 22 (suppl 2): 45-87.46. Wiggens KL. Renal Care: Resources and Practical Applications. Renal Dietitians Dietetic Practice Group, ADA.
2004, Chicago.47. McCann L. Nutrition management of the adult peritoneal dialysis patient. A clinical guide to nutrition care in kidney
disease. Renal dietitians dietetic practice group of the American Dietetic Association and the Council on renal nutrition of the NKF. USA; 2004. P57-69.
48. National Kidney Disease Education Program. Chronic Kidney Disease and diet: Assessment, Management and Treatment.2015
49. K/DOQI Clinical Work Group. Clinical practice guidelines for chronic kidney disease. Am J Kidney Dis. 2006; 39(Suppl 1): S1-S266.
50. Franz MJ. Medical nutrition therapy for diabetes mellitus and hypoglycaemia of non- diabetic origin. In Mahan LK, Escott-Stump S editors. Krause’s Food and Nutrition Therapy. 12th ed. USA. Saunders Elsevier, 2008; P764-805.
51. National Kidney Foundation. KDOQI Clinical Practice Guidelines and Clinical Practice Recommendations for Diabetes and Chronic Kidney Disease. Am J Kidney Dis. 2007; 49: s1-s182.
52. Franz MJ et al. The evidence of medical nutrition therapy for type 1 and type 2 diabetes in adults. J Am Diet Assoc. 2010; 110(12):1852-1859.
53. Gilmour ER, Hartley GH, Goodship THJ. Trace elements and vitamins in renal disease. In Mitch WE & Klahr S, editors. Handbook of Nutrition and the Kidney. 3rd ed. USA: Lippincott-Raven Publishers; 1998. P107-122.
54. Dietary Reference Intakes. Compiled by the Nutrition Information Centre of the University of Stellenbosch (NICUS). South Africa; 2003.
55. Ibrahim HN, Nath KA, Hostetter TH. Nutritional requirements of diabetics with nephropathy. In Mitch WE & Klahr S, editors. Handbook of Nutrition and the Kidney. 3rd ed. USA: Lippincott-Raven Publishers; 1998. P166-200.
56. Heng, A.E. and Cano, N.J.M. (2010). Nutritional problems in adult patients with stage 5 chronic kidney disease on dialysis
57. Wilkens, K.G. 2012. Medical nutrition therapy for renal disease, In Krause’s Food, Nutrition, & Diet Therapy, 961-995. 13th ed. Saunders. United states of America
58. Snyman J, editor. MIMS Desk Reference. MDR. 2010; Vol. 45.59. Dageforde, L.A. and Cavanaugh, K.L. 2013. Health Literacy: Emerging Evidence and Applications in Kidney
Disease Care. Advances in Chronic Kidney Disease. 20. (4).311-319. Doi: 10.1053/j.ackd.2013.04.00560. Patel, C.2014. The Vegetarian Diet and Chronic Kidney Disease. Available on:http://www.davita.com/education/
article.cfm?educationMainFolder=diet-and-nutrition&category=lifestyle&articleTitle=the-vegetarian-diet-and-chronic-kidney-disease&articleID=5346
61. Silbernagel, G. et al (2014). Toward Individualized Cholesterol- Lowering Treatment in End-Stage Renal Disease. Journal of Renal Nutrition. 24:65-71
62. Herselman, M. & Esau, N. 2005. South African renal exchange lists. 63. Biruete A, Jeong JH, Barnes JL, Wilund KR (2017). Modified Nutritional Recommendations to Improve Dietary
Patterns and Outcomes in Hemodialysis Patients. Journal of Renal Nutrition. 27.1:62-7064. Noori N, et al. (2010). Organic and Inorganic Dietary Phosphorous and its Management in Chronic Kidney
27
Disease. Kidney Diseases.4(2), 89-100.65. Moe, Sm et al. (2011). Vegetarian Compared with Meat Dietary Protein and Phosphorous Homeostasis in Chronic
kidney disease. Clin J Am Soc of Nephrol. 6, 257-26466. Nallu A, Sharma S, Ramezani A, Muralidharani J, Raj D. (2016). Gut micriobiome in chronic kidney disease:
challenges and opportunities. Translational Research. 1-14.67. Chiavaroli l, Mirrahimi A, Sievenpiper JL, Darling PB (2014). Dietary fibre effects in chronic kidney disease:
A systematic review and meta-analysis of controlled feeding trials. European Journal of Clinical Nutrition. doi:10.1038/ejcn.2014.237
68. Felizardo, R.J, Castoldi, A.C., Oliveira, V.A and Camara, N.O.S. 2016. The microbiota and chronic kidney diseases: a double edged sword. Clinical and Translational Immunology. 5.e86.doi:10.1038/cti.2016.36
69. Chitra, U. and Premalatha, S.K. 2013. Nutritional management of renal transplant patients. Indian Journal of Transplantation, 7(3), 88–93.
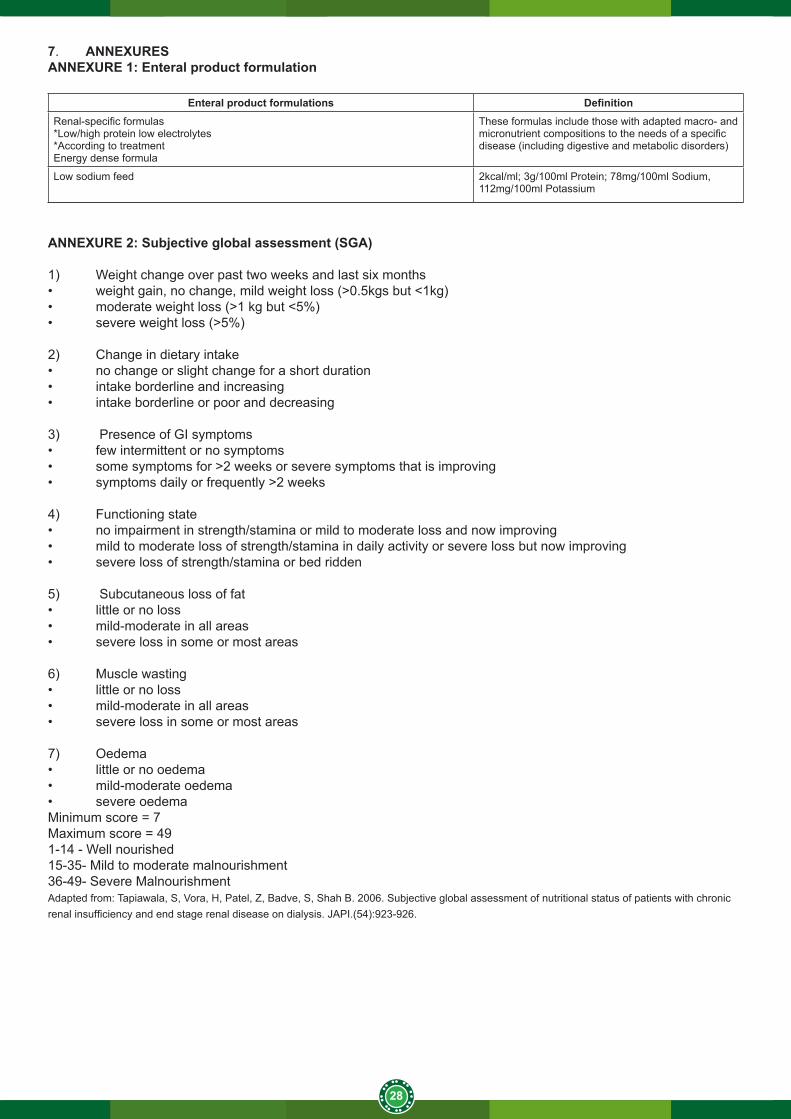
28
7. ANNEXURESANNEXURE 1: Enteral product formulation
Enteral product formulations DefinitionRenal-specific formulas*Low/high protein low electrolytes*According to treatmentEnergy dense formula
These formulas include those with adapted macro- and micronutrient compositions to the needs of a specific disease (including digestive and metabolic disorders)
Low sodium feed 2kcal/ml; 3g/100ml Protein; 78mg/100ml Sodium, 112mg/100ml Potassium
ANNEXURE 2: Subjective global assessment (SGA)
1) Weight change over past two weeks and last six months• weight gain, no change, mild weight loss (>0.5kgs but <1kg)• moderate weight loss (>1 kg but <5%)• severe weight loss (>5%)
2) Change in dietary intake• no change or slight change for a short duration• intake borderline and increasing• intake borderline or poor and decreasing
3) Presence of GI symptoms• few intermittent or no symptoms• some symptoms for >2 weeks or severe symptoms that is improving• symptoms daily or frequently >2 weeks
4) Functioning state• no impairment in strength/stamina or mild to moderate loss and now improving• mild to moderate loss of strength/stamina in daily activity or severe loss but now improving• severe loss of strength/stamina or bed ridden
5) Subcutaneous loss of fat• little or no loss• mild-moderate in all areas• severe loss in some or most areas
6) Muscle wasting• little or no loss• mild-moderate in all areas• severe loss in some or most areas
7) Oedema• little or no oedema• mild-moderate oedema• severe oedemaMinimum score = 7Maximum score = 491-14 - Well nourished15-35- Mild to moderate malnourishment36-49- Severe MalnourishmentAdapted from: Tapiawala, S, Vora, H, Patel, Z, Badve, S, Shah B. 2006. Subjective global assessment of nutritional status of patients with chronic renal insufficiency and end stage renal disease on dialysis. JAPI.(54):923-926.
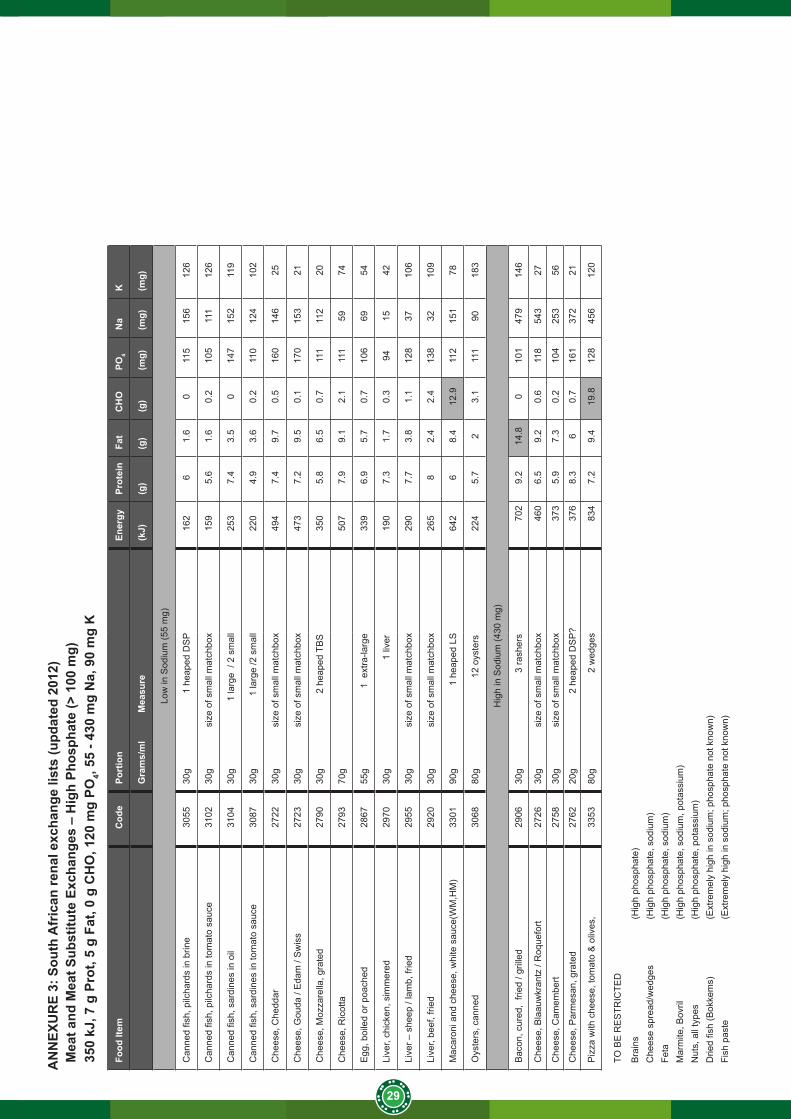
29
AN
NEX
UR
E 3:
Sou
th A
fric
an re
nal e
xcha
nge
lists
(upd
ated
201
2)M
eat a
nd M
eat S
ubst
itute
Exc
hang
es –
Hig
h Ph
osph
ate
(> 1
00 m
g)35
0 kJ
, 7 g
Pro
t, 5
g Fa
t, 0
g C
HO
, 120
mg
PO4,
55 -
430
mg
Na,
90
mg
K
Food
Item
Cod
ePo
rtio
n
Ener
gyPr
otei
nFa
tC
HO
PO4
Na
K
Gra
ms/
ml
M
easu
re(k
J)(g
)(g
)(g
)(m
g)(m
g)(m
g)
Low
in S
odiu
m (5
5 m
g)
Can
ned
fish,
pilc
hard
s in
brin
e30
5530
g
1 h
eape
d D
SP
162
61.
60
115
156
126
Can
ned
fish,
pilc
hard
s in
tom
ato
sauc
e31
0230
g
size
of s
mal
l mat
chbo
x15
95.
61.
60.
210
511
112
6
Can
ned
fish,
sar
dine
s in
oil
3104
30g
1 la
rge
/ 2
smal
l25
37.
43.
50
147
152
119
Can
ned
fish,
sar
dine
s in
tom
ato
sauc
e30
8730
g
1 la
rge
/2 s
mal
l22
04.
93.
60.
211
012
410
2
Che
ese,
Che
ddar
27
2230
g
size
of s
mal
l mat
chbo
x49
47.
49.
70.
516
014
625
Che
ese,
Gou
da /
Eda
m /
Sw
iss
2723
30g
si
ze o
f sm
all m
atch
box
473
7.2
9.5
0.1
170
153
21
Che
ese,
Moz
zare
lla, g
rate
d27
9030
g
2 h
eape
d TB
S
350
5.8
6.5
0.7
111
112
20
Che
ese,
Ric
otta
27
9370
g50
77.
99.
12.
111
159
74
Egg
, boi
led
or p
oach
ed28
6755
g
1
ext
ra-la
rge
339
6.9
5.7
0.7
106
6954
Live
r, ch
icke
n, s
imm
ered
2970
30g
1
live
r19
07.
31.
70.
394
1542
Live
r – s
heep
/ la
mb,
frie
d29
5530
g
size
of s
mal
l mat
chbo
x29
07.
73.
81.
112
837
106
Live
r, be
ef, f
ried
2920
30g
si
ze o
f sm
all m
atch
box
265
82.
42.
413
832
109
Mac
aron
i and
che
ese,
whi
te s
auce
(WM
,HM
)33
0190
g
1
hea
ped
LS64
26
8.4
12.9
112
151
78
Oys
ters
, can
ned
3068
80g
1
2 oy
ster
s22
45.
72
3.1
111
9018
3
Hig
h in
Sod
ium
(430
mg)
Bac
on, c
ured
, fri
ed /
grill
ed29
0630
g
3
rash
ers
702
9.2
14.8
010
147
914
6
Che
ese,
Bla
auw
kran
tz /
Roq
uefo
rt27
2630
g
size
of s
mal
l mat
chbo
x46
06.
59.
20.
611
854
327
Che
ese,
Cam
embe
rt 27
5830
g
size
of s
mal
l mat
chbo
x37
35.
97.
30.
210
425
356
Che
ese,
Par
mes
an, g
rate
d27
6220
g
2 h
eape
d D
SP
?37
68.
36
0.7
161
372
21
Piz
za w
ith c
hees
e, to
mat
o &
oliv
es,
3353
80g
2 w
edge
s83
47.
29.
419
.812
845
612
0
TO B
E R
ES
TRIC
TED
Bra
ins
(Hig
h ph
osph
ate)
Che
ese
spre
ad/w
edge
s(H
igh
phos
phat
e, s
odiu
m)
Feta
(Hig
h ph
osph
ate,
sod
ium
)M
arm
ite, B
ovril
(Hig
h ph
osph
ate,
sod
ium
, pot
assi
um)
Nut
s, a
ll ty
pes
(Hig
h ph
osph
ate,
pot
assi
um)
Drie
d fis
h (B
okke
ms)
(Ext
rem
ely
high
in s
odiu
m; p
hosp
hate
not
kno
wn)
Fish
pas
te(E
xtre
mel
y hi
gh in
sod
ium
; pho
spha
te n
ot k
now
n)
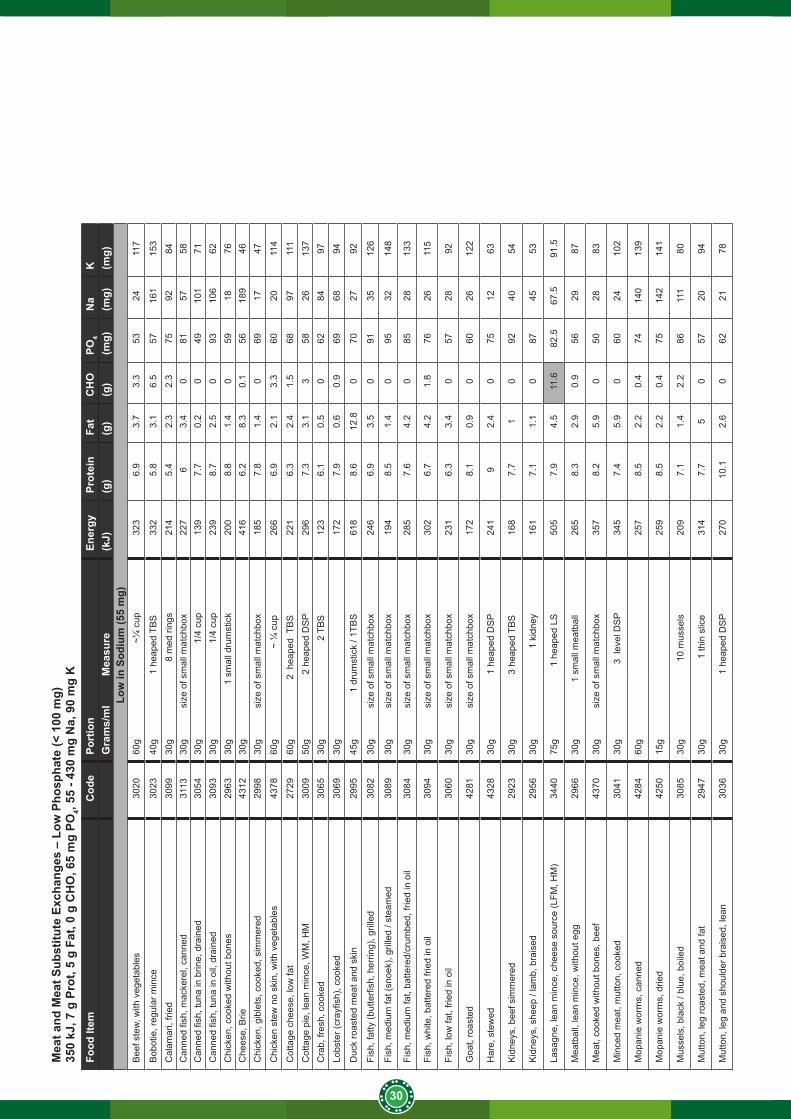
30
Mea
t and
Mea
t Sub
stitu
te E
xcha
nges
– L
ow P
hosp
hate
(< 1
00 m
g)35
0 kJ
, 7 g
Pro
t, 5
g Fa
t, 0
g C
HO
, 65
mg
PO4,
55 -
430
mg
Na,
90
mg
KFo
od It
emC
ode
Port
ion
En
ergy
Prot
ein
Fat
CH
OPO
4N
aK
Gra
ms/
ml
Mea
sure
(kJ)
(g)
(g)
(g)
(mg)
(mg)
(mg)
Low
in S
odiu
m (5
5 m
g)B
eef s
tew
, with
veg
etab
les
3020
60g
~¼ c
up32
36.
93.
73.
353
2411
7
Bob
otie
, reg
ular
min
ce30
2340
g
1
heap
ed T
BS
332
5.8
3.1
6.5
5716
115
3
Cal
amar
i, fri
ed30
9930
g
8 m
ed ri
ngs
214
5.4
2.3
2.3
7592
84C
anne
d fis
h, m
acke
rel,
cann
ed31
1330
g
siz
e of
sm
all m
atch
box
227
63.
40
8157
58C
anne
d fis
h, tu
na in
brin
e, d
rain
ed30
5430
g
1/
4 cu
p13
97.
70.
20
4910
171
Can
ned
fish,
tuna
in o
il, d
rain
ed30
9330
g
1/
4 cu
p23
98.
72.
50
9310
662
Chi
cken
, coo
ked
with
out b
ones
2963
30g
1 s
mal
l dru
mst
ick
200
8.8
1.4
059
1876
Che
ese,
Brie
43
1230
g41
66.
28.
30.
156
189
46C
hick
en, g
ible
ts, c
ooke
d, s
imm
ered
2998
30g
s
ize
of s
mal
l mat
chbo
x18
57.
81.
40
6917
47
Chi
cken
ste
w n
o sk
in, w
ith v
eget
able
s43
7860
g
~ ¼
cup
266
6.9
2.1
3.3
6020
114
Cot
tage
che
ese,
low
fat
2729
60g
2
hea
ped
TB
S22
16.
32.
41.
568
9711
1
Cot
tage
pie
, lea
n m
ince
, WM
, HM
3009
50g
2 he
aped
DS
P29
67.
33.
13
5826
137
Cra
b, fr
esh,
coo
ked
3065
30g
2 T
BS
123
6.1
0.5
062
8497
Lobs
ter (
cray
fish)
, coo
ked
3069
30g
172
7.9
0.6
0.9
6968
94
Duc
k ro
aste
d m
eat a
nd s
kin
2995
45g
1
dru
mst
ick
/ 1TB
S61
88.
612
.80
7027
92
Fish
, fat
ty (b
utte
rfish
, her
ring)
, gril
led
3082
30g
s
ize
of s
mal
l mat
chbo
x24
66.
93.
50
9135
126
Fish
, med
ium
fat (
snoe
k), g
rille
d / s
team
ed30
8930
g
siz
e of
sm
all m
atch
box
194
8.5
1.4
095
3214
8
Fish
, med
ium
fat,
batte
red/
crum
bed,
frie
d in
oil
3084
30g
s
ize
of s
mal
l mat
chbo
x28
57.
64.
20
8528
133
Fish
, whi
te, b
atte
red
fried
in o
il30
9430
g
siz
e of
sm
all m
atch
box
302
6.7
4.2
1.8
7626
115
Fish
, low
fat,
fried
in o
il30
6030
g
siz
e of
sm
all m
atch
box
231
6.3
3.4
057
2892
Goa
t, ro
aste
d42
8130
g
siz
e of
sm
all m
atch
box
172
8.1
0.9
060
2612
2
Har
e, s
tew
ed43
2830
g
1
heap
ed D
SP
241
92.
40
7512
63
Kid
neys
, bee
f sim
mer
ed29
2330
g
3
heap
ed T
BS
16
87.
71
092
4054
Kid
neys
, she
ep /
lam
b, b
rais
ed29
5630
g
1 k
idne
y16
17.
11.
10
8745
53
Lasa
gne,
lean
min
ce, c
hees
e so
urce
(LFM
, HM
)34
4075
g
1 he
aped
LS
505
7.9
4.5
11.6
82.5
67.5
91.5
Mea
tbal
l, le
an m
ince
, with
out e
gg29
6630
g
1 sm
all m
eatb
all
265
8.3
2.9
0.9
5629
87
Mea
t, co
oked
with
out b
ones
, bee
f43
7030
g
siz
e of
sm
all m
atch
box
357
8.2
5.9
050
2883
Min
ced
mea
t, m
utto
n, c
ooke
d30
4130
g
3 l
evel
DS
P34
57.
45.
90
6024
102
Mop
anie
wor
ms,
can
ned
4284
60g
257
8.5
2.2
0.4
7414
013
9
Mop
anie
wor
ms,
drie
d42
5015
g25
98.
52.
20.
475
142
141
Mus
sels
, bla
ck /
blue
, boi
led
3085
30g
1
0 m
usse
ls20
97.
11.
42.
286
111
80
Mut
ton,
leg
roas
ted,
mea
t and
fat
2947
30g
1 th
in s
lice
314
7.7
50
5720
94
Mut
ton,
leg
and
shou
lder
bra
ised
, lea
n30
3630
g
1
heap
ed D
SP
270
10.1
2.6
062
2178
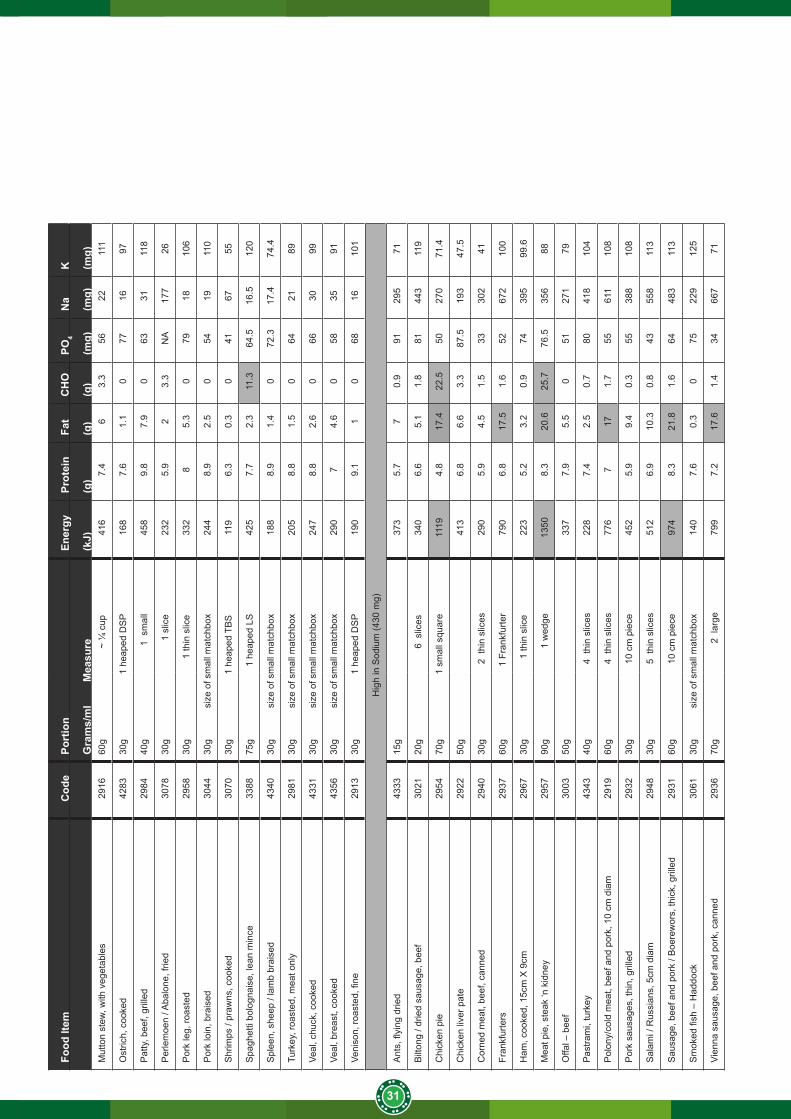
31
Food
Item
Cod
ePo
rtio
n
Ener
gyPr
otei
nFa
tC
HO
PO4
Na
K
Gra
ms/
ml
Mea
sure
(kJ)
(g)
(g)
(g)
(mg)
(mg)
(mg)
Mut
ton
stew
, with
veg
etab
les
2916
60g
~
¼ c
up41
67.
46
3.3
5622
111
Ost
rich,
coo
ked
4283
30g
1 he
aped
DS
P16
87.
61.
10
7716
97
Pat
ty, b
eef,
grill
ed29
8440
g
1 s
mal
l45
89.
87.
90
6331
118
Per
lem
oen
/ Aba
lone
, frie
d30
7830
g
1
slic
e23
25.
92
3.3
NA
177
26
Por
k le
g, ro
aste
d29
5830
g
1
thin
slic
e33
28
5.3
079
1810
6
Por
k lo
in, b
rais
ed30
4430
g
siz
e of
sm
all m
atch
box
244
8.9
2.5
054
1911
0
Shr
imps
/ pr
awns
, coo
ked
3070
30g
1 he
aped
TB
S11
96.
30.
30
4167
55
Spa
ghet
ti bo
logn
aise
, lea
n m
ince
3388
75g
1
heap
ed L
S42
57.
72.
311
.364
.516
.512
0
Spl
een,
she
ep /
lam
b br
aise
d43
4030
g
siz
e of
sm
all m
atch
box
188
8.9
1.4
072
.317
.474
.4
Turk
ey, r
oast
ed, m
eat o
nly
2981
30g
s
ize
of s
mal
l mat
chbo
x20
58.
81.
50
6421
89
Veal
, chu
ck, c
ooke
d43
3130
g
siz
e of
sm
all m
atch
box
247
8.8
2.6
066
3099
Veal
, bre
ast,
cook
ed43
5630
g
siz
e of
sm
all m
atch
box
290
74.
60
5835
91
Veni
son,
roas
ted,
fine
2913
30g
1 he
aped
DS
P19
09.
11
068
1610
1
Hig
h in
Sod
ium
(430
mg)
Ant
s, fl
ying
drie
d43
3315
g
37
35.
77
0.9
9129
571
Bilt
ong
/ drie
d sa
usag
e, b
eef
3021
20g
6
slic
es34
06.
65.
11.
881
443
119
Chi
cken
pie
2954
70g
1 sm
all s
quar
e11
194.
817
.422
.550
270
71.4
Chi
cken
live
r pat
e29
2250
g41
36.
86.
63.
387
.519
347
.5
Cor
ned
mea
t, be
ef, c
anne
d29
4030
g
2 t
hin
slic
es29
05.
94.
51.
533
302
41
Fran
kfur
ters
2937
60g
1
Fran
kfur
ter
790
6.8
17.5
1.6
5267
210
0
Ham
, coo
ked,
15c
m X
9cm
2967
30g
1 th
in s
lice
223
5.2
3.2
0.9
7439
599
.6
Mea
t pie
, ste
ak ‘n
kid
ney
2957
90g
1
wed
ge
1350
8.3
20.6
25.7
76.5
356
88
Offa
l – b
eef
3003
50g
337
7.9
5.5
051
271
79
Pas
tram
i, tu
rkey
4343
40g
4
thi
n sl
ices
228
7.4
2.5
0.7
8041
810
4
Pol
ony/
cold
mea
t, be
ef a
nd p
ork,
10
cm d
iam
2919
60g
4
thi
n sl
ices
776
717
1.7
5561
110
8
Por
k sa
usag
es, t
hin,
gril
led
2932
30g
1
0 cm
pie
ce45
25.
99.
40.
355
388
108
Sal
ami /
Rus
sian
s, 5
cm d
iam
2948
30g
5
thi
n sl
ices
512
6.9
10.3
0.8
4355
811
3
Sau
sage
, bee
f and
por
k / B
oere
wor
s, th
ick,
gril
led
2931
60g
1
0 cm
pie
ce97
48.
321
.81.
664
483
113
Sm
oked
fish
– H
addo
ck30
6130
g
siz
e of
sm
all m
atch
box
140
7.6
0.3
075
229
125
Vien
na s
ausa
ge, b
eef a
nd p
ork,
can
ned
2936
70g
2 la
rge
799
7.2
17.6
1.4
3466
771
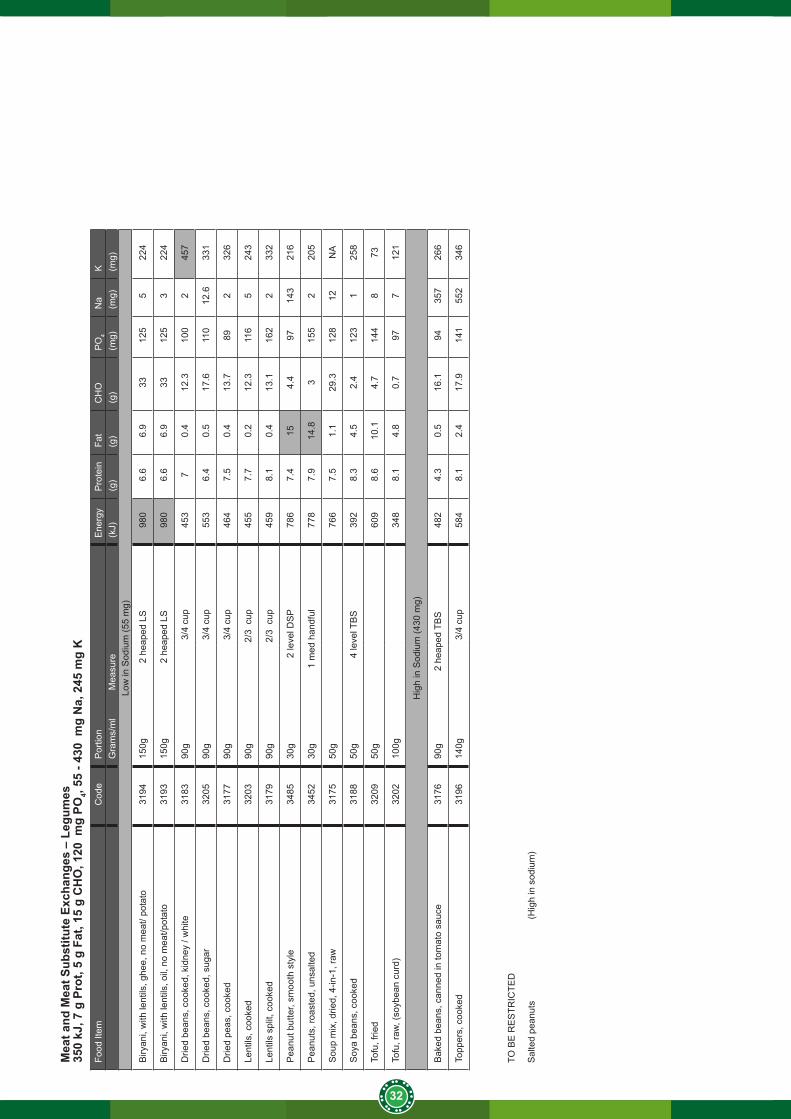
32
Mea
t and
Mea
t Sub
stitu
te E
xcha
nges
– L
egum
es35
0 kJ
, 7 g
Pro
t, 5
g Fa
t, 15
g C
HO
, 120
mg
PO4,
55 -
430
mg
Na,
245
mg
KFo
od It
emC
ode
Por
tion
E
nerg
yP
rote
inFa
tC
HO
PO
4N
aK
Gra
ms/
ml
M
easu
re(k
J)(g
)(g
)(g
)(m
g)(m
g)(m
g)Lo
w in
Sod
ium
(55
mg)
Biry
ani,
with
lent
ils, g
hee,
no
mea
t/ po
tato
3194
150g
2
hea
ped
LS98
06.
66.
933
125
522
4
Biry
ani,
with
lent
ils, o
il, n
o m
eat/p
otat
o31
9315
0g
2 h
eape
d LS
980
6.6
6.9
3312
53
224
Drie
d be
ans,
coo
ked,
kid
ney
/ whi
te31
8390
g
3/4
cup
453
70.
412
.310
02
457
Drie
d be
ans,
coo
ked,
sug
ar32
0590
g
3/4
cup
553
6.4
0.5
17.6
110
12.6
331
Drie
d pe
as, c
ooke
d31
7790
g
3/4
cup
464
7.5
0.4
13.7
892
326
Lent
ils, c
ooke
d32
0390
g
2
/3 c
up45
57.
70.
212
.311
65
243
Lent
ils s
plit,
coo
ked
3179
90g
2/3
cup
459
8.1
0.4
13.1
162
233
2
Pea
nut b
utte
r, sm
ooth
sty
le34
8530
g
2
leve
l DS
P78
67.
415
4.4
9714
321
6
Pea
nuts
, roa
sted
, uns
alte
d34
5230
g
1 m
ed h
andf
ul77
87.
914
.83
155
220
5
Sou
p m
ix, d
ried,
4-in
-1, r
aw31
7550
g76
67.
51.
129
.312
812
NA
Soy
a be
ans,
coo
ked
3188
50g
4 le
vel T
BS
392
8.3
4.5
2.4
123
125
8
Tofu
, frie
d32
0950
g
609
8.6
10.1
4.7
144
873
Tofu
, raw
, (so
ybea
n cu
rd)
3202
100g
348
8.1
4.8
0.7
977
121
Hig
h in
Sod
ium
(430
mg)
Bak
ed b
eans
, can
ned
in to
mat
o sa
uce
3176
90g
2
heap
ed T
BS
482
4.3
0.5
16.1
9435
726
6
Topp
ers,
coo
ked
3196
140g
3/4
cup
584
8.1
2.4
17.9
141
552
346
TO B
E R
ES
TRIC
TED
Sal
ted
pean
uts
(Hig
h in
sod
ium
)
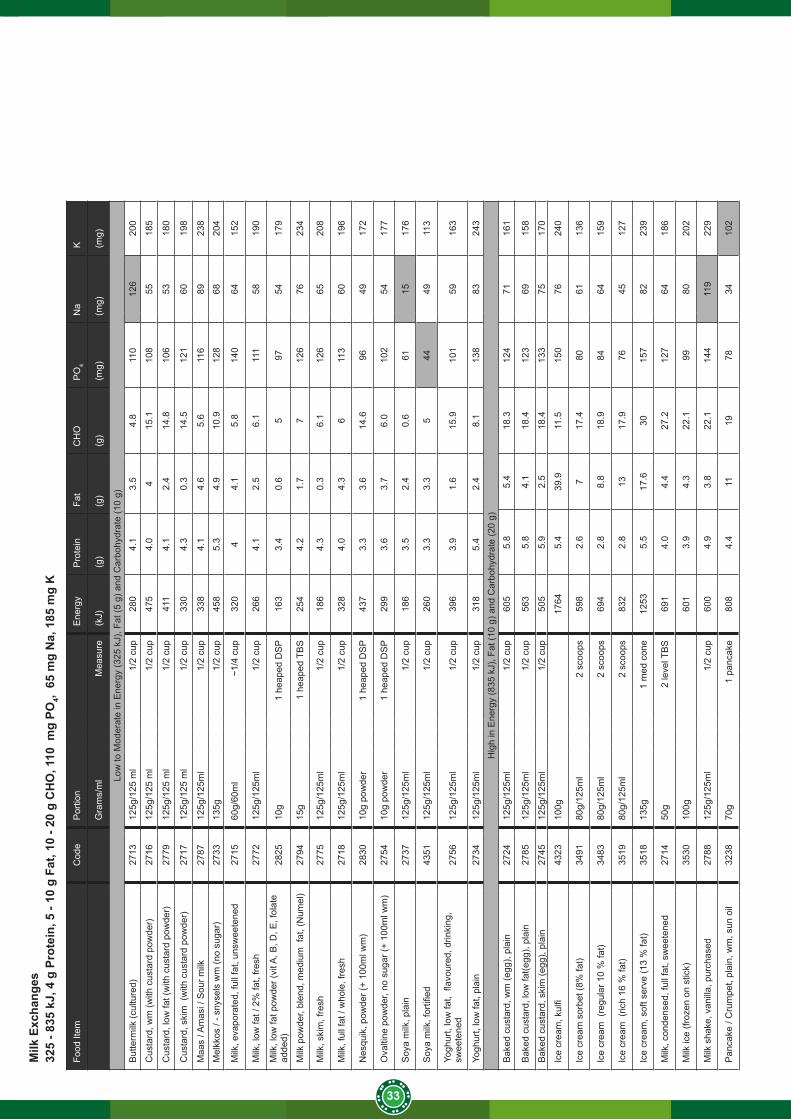
33
Milk
Exc
hang
es32
5 - 8
35 k
J, 4
g P
rote
in, 5
- 10
g F
at, 1
0 - 2
0 g
CH
O, 1
10 m
g PO
4, 6
5 m
g N
a, 1
85 m
g K
Food
Item
Cod
eP
ortio
n
Ene
rgy
Pro
tein
Fat
CH
OP
O4
Na
K
Gra
ms/
ml
Mea
sure
(kJ)
(g)
(g)
(g)
(mg)
(mg)
(mg)
Low
to M
oder
ate
in E
nerg
y (3
25 k
J), F
at (5
g) a
nd C
arbo
hydr
ate
(10
g)
But
term
ilk (c
ultu
red)
2713
125g
/125
ml
1/2
cup
280
4.1
3.5
4.8
110
126
200
Cus
tard
, wm
(with
cus
tard
pow
der)
2716
125g
/125
ml
1/2
cup
475
4.0
415
.110
855
185
Cus
tard
, low
fat (
with
cus
tard
pow
der)
2779
125g
/125
ml
1/2
cup
411
4.1
2.4
14.8
106
5318
0
Cus
tard
, ski
m (
with
cus
tard
pow
der)
2717
125g
/125
ml
1/2
cup
330
4.3
0.3
14.5
121
6019
8
Maa
s / A
mas
i / S
our m
ilk27
8712
5g/1
25m
l1/
2 cu
p33
84.
14.
65.
611
689
238
Mel
kkos
/ - s
nyse
ls w
m (n
o su
gar)
2733
135g
1/2
cup
458
5.3
4.9
10.9
128
6820
4
Milk
, eva
pora
ted,
full
fat,
unsw
eete
ned
2715
60g/
60m
l~1
/4 c
up32
04
4.1
5.8
140
6415
2
Milk
, low
fat /
2%
fat,
fresh
2772
125g
/125
ml
1/2
cup
266
4.1
2.5
6.1
111
5819
0
Milk
, low
fat p
owde
r (vi
t A, B
, D, E
, fol
ate
adde
d)28
2510
g1
heap
ed D
SP
163
3.4
0.6
597
5417
9
Milk
pow
der,
blen
d, m
ediu
m f
at, (
Num
el)
2794
15g
1 he
aped
TB
S25
44.
21.
77
126
7623
4
Milk
, ski
m, f
resh
2775
125g
/125
ml
1/2
cup
186
4.3
0.3
6.1
126
6520
8
Milk
, ful
l fat
/ w
hole
, fre
sh27
1812
5g/1
25m
l1/
2 cu
p32
84.
04.
36
113
6019
6
Nes
quik
, pow
der (
+ 10
0ml w
m)
2830
10g
pow
der
1 he
aped
DS
P43
73.
33.
614
.696
4917
2
Ova
ltine
pow
der,
no s
ugar
(+ 1
00m
l wm
) 27
5410
g po
wde
r1
heap
ed D
SP
299
3.6
3.7
6.0
102
5417
7
Soy
a m
ilk, p
lain
2737
125g
/125
ml
1/2
cup
186
3.5
2.4
0.6
6115
176
Soy
a m
ilk, f
ortifi
ed43
5112
5g/1
25m
l1/
2 cu
p26
03.
33.
35
4449
113
Yogh
urt,
low
fat,
flav
oure
d, d
rinki
ng,
swee
tene
d27
5612
5g/1
25m
l1/
2 cu
p39
63.
91.
615
.910
159
163
Yogh
urt,
low
fat,
plai
n27
3412
5g/1
25m
l1/
2 cu
p31
85.
42.
48.
113
883
243
Hig
h in
Ene
rgy
(835
kJ)
, Fat
(10
g) a
nd C
arbo
hydr
ate
(20
g)B
aked
cus
tard
, wm
(egg
), pl
ain
2724
125g
/125
ml
1/2
cup
605
5.8
5.4
18.3
124
7116
1
Bak
ed c
usta
rd, l
ow fa
t(egg
), pl
ain
27
8512
5g/1
25m
l1/
2 cu
p56
35.
84.
118
.412
369
158
Bak
ed c
usta
rd, s
kim
(egg
), pl
ain
2745
125g
/125
ml
1/2
cup
505
5.9
2.5
18.4
133
7517
0
Ice
crea
m, k
ulfi
4323
100g
1764
5.4
39.9
11.5
150
7624
0
Ice
crea
m s
orbe
t (8%
fat)
3491
80g/
125m
l2
scoo
ps59
82.
67
17.4
8061
136
Ice
crea
m (
regu
lar 1
0 %
fat)
3483
80g/
125m
l2
scoo
ps69
42.
88.
818
.984
6415
9
Ice
crea
m (
rich
16 %
fat)
3519
80g/
125m
l2
scoo
ps83
22.
813
17.9
7645
127
Ice
crea
m, s
oft s
erve
(13
% fa
t)35
1813
5g1
med
con
e12
535.
517
.630
157
8223
9
Milk
, con
dens
ed, f
ull f
at, s
wee
tene
d27
1450
g2
leve
l TB
S69
14.
04.
427
.212
764
186
Milk
ice
(froz
en o
n st
ick)
3530
100g
601
3.9
4.3
22.1
9980
202
Milk
sha
ke, v
anill
a, p
urch
ased
2788
125g
/125
ml
1/2
cup
600
4.9
3.8
22.1
144
119
229
Pan
cake
/ C
rum
pet,
plai
n, w
m, s
un o
il32
3870
g1
panc
ake
808
4.4
1119
7834
102
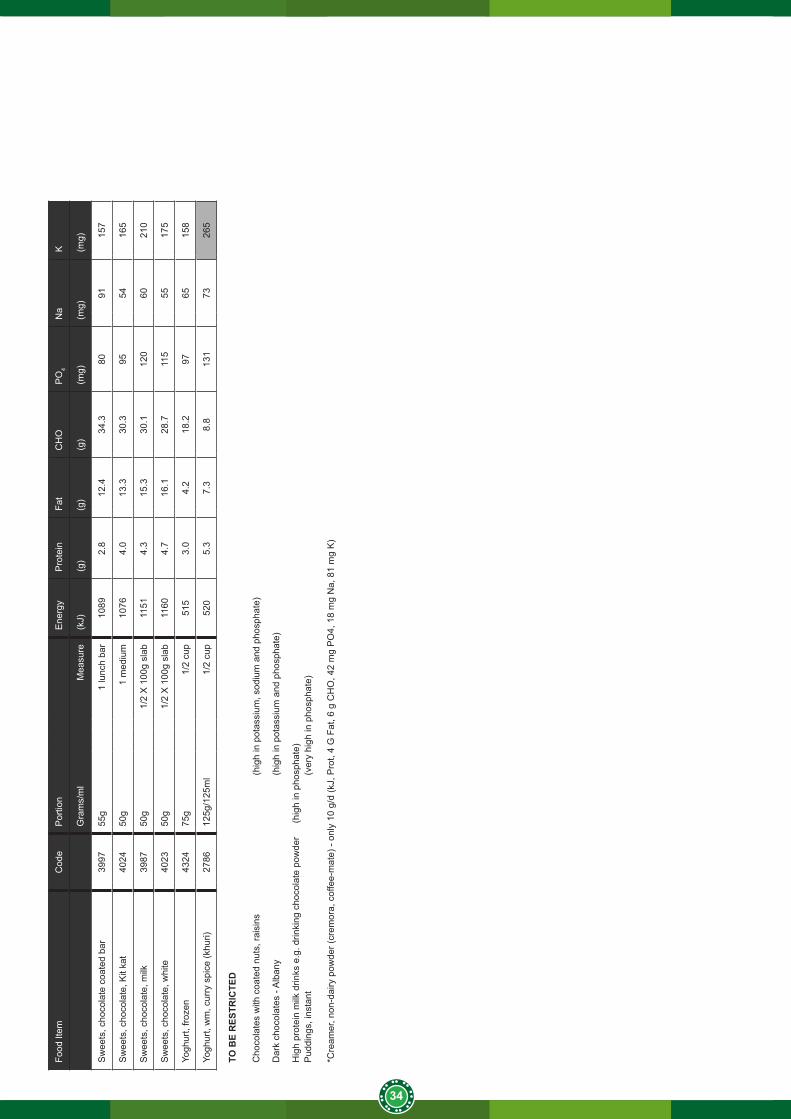
34
Food
Item
Cod
eP
ortio
n
Ene
rgy
Pro
tein
Fat
CH
OP
O4
Na
K
Gra
ms/
ml
Mea
sure
(kJ)
(g)
(g)
(g)
(mg)
(mg)
(mg)
Sw
eets
, cho
cola
te c
oate
d ba
r39
9755
g1
lunc
h ba
r10
892.
812
.434
.380
9115
7
Sw
eets
, cho
cola
te, K
it ka
t40
2450
g1
med
ium
1076
4.0
13.3
30.3
9554
165
Sw
eets
, cho
cola
te, m
ilk39
8750
g1/
2 X
100
g sl
ab11
514.
315
.330
.112
060
210
Sw
eets
, cho
cola
te, w
hite
4023
50g
1/2
X 1
00g
slab
1160
4.7
16.1
28.7
115
5517
5
Yogh
urt,
froze
n
4324
75g
1/2
cup
515
3.0
4.2
18.2
9765
158
Yogh
urt,
wm
, cur
ry s
pice
(khu
ri)27
8612
5g/1
25m
l1/
2 cu
p52
05.
37.
38.
813
173
265
TO B
E R
ESTR
ICTE
D
Cho
cola
tes
with
coa
ted
nuts
, rai
sins
(h
igh
in p
otas
sium
, sod
ium
and
pho
spha
te)
Dar
k ch
ocol
ates
- A
lban
y
(h
igh
in p
otas
sium
and
pho
spha
te)
Hig
h pr
otei
n m
ilk d
rinks
e.g
. drin
king
cho
cola
te p
owde
r (h
igh
in p
hosp
hate
)P
uddi
ngs,
inst
ant
(ver
y hi
gh in
pho
spha
te)
*Cre
amer
, non
-dai
ry p
owde
r (cr
emor
a, c
offe
e-m
ate)
- on
ly 1
0 g/
d (k
J, P
rot,
4 G
Fat
, 6 g
CH
O, 4
2 m
g P
O4,
18
mg
Na,
81
mg
K)
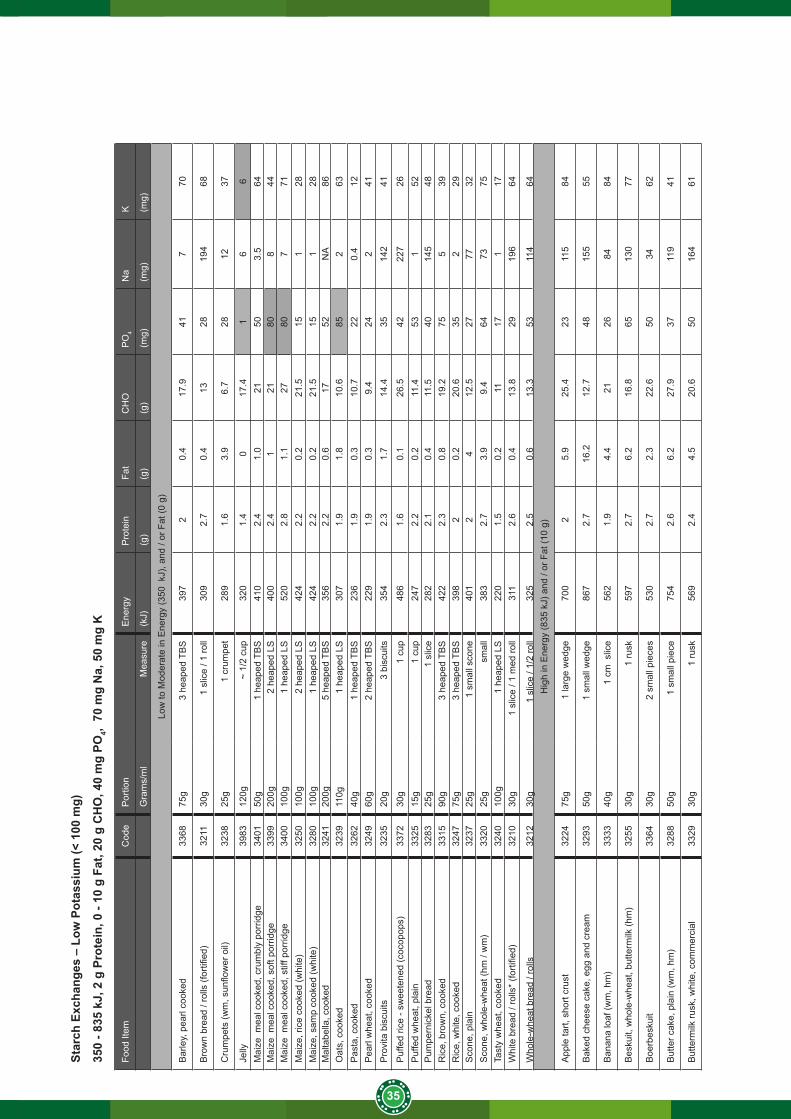
35
Star
ch E
xcha
nges
– L
ow P
otas
sium
(< 1
00 m
g)
350
- 835
kJ,
2 g
Pro
tein
, 0 -
10 g
Fat
, 20
g C
HO
, 40
mg
PO4,
70
mg
Na,
50
mg
K
Food
Item
Cod
eP
ortio
n
Ene
rgy
Pro
tein
Fat
CH
OP
O4
Na
K
Gra
ms/
ml
Mea
sure
(kJ)
(g)
(g)
(g)
(mg)
(mg)
(mg)
Low
to M
oder
ate
in E
nerg
y (3
50 k
J), a
nd /
or F
at (0
g)
Bar
ley,
pea
rl co
oked
3368
75g
3 he
aped
TB
S39
72
0.4
17.9
417
70
Bro
wn
brea
d / r
olls
(for
tified
)32
1130
g1
slic
e / 1
roll
309
2.7
0.4
1328
194
68
Cru
mpe
ts (w
m, s
unflo
wer
oil)
3238
25g
1 cr
umpe
t28
91.
63.
96.
728
1237
Jelly
3983
120g
~ 1/
2 cu
p32
01.
40
17.4
16
6M
aize
mea
l coo
ked,
cru
mbl
y po
rrid
ge34
0150
g1
heap
ed T
BS
410
2.4
1.0
2150
3.5
64M
aize
mea
l coo
ked,
sof
t por
ridge
3399
200g
2 he
aped
LS
400
2.4
121
808
44M
aize
mea
l coo
ked,
stif
f por
ridge
3400
100g
1 he
aped
LS
520
2.8
1.1
2780
771
Mai
ze, r
ice
cook
ed (w
hite
)32
5010
0g2
heap
ed L
S42
42.
20.
221
.515
128
Mai
ze, s
amp
cook
ed (w
hite
)32
8010
0g1
heap
ed L
S42
42.
20.
221
.515
128
Mal
tabe
lla, c
ooke
d32
4120
0g5
heap
ed T
BS
356
2.2
0.6
1752
NA
86O
ats,
coo
ked
3239
110g
1 he
aped
LS
307
1.9
1.8
10.6
852
63P
asta
, coo
ked
3262
40g
1 he
aped
TB
S23
61.
90.
310
.722
0.4
12P
earl
whe
at, c
ooke
d32
4960
g2
heap
ed T
BS
229
1.9
0.3
9.4
242
41P
rovi
ta b
iscu
its32
3520
g3
bisc
uits
354
2.3
1.7
14.4
3514
241
Puf
fed
rice
- sw
eete
ned
(coc
opop
s)33
7230
g1
cup
486
1.6
0.1
26.5
4222
726
Puf
fed
whe
at, p
lain
3325
15g
1 cu
p24
72.
20.
211
.453
152
Pum
pern
icke
l bre
ad
3283
25g
1 sl
ice
282
2.1
0.4
11.5
4014
548
Ric
e, b
row
n, c
ooke
d33
1590
g3
heap
ed T
BS
422
2.3
0.8
19.2
755
39R
ice,
whi
te, c
ooke
d32
4775
g3
heap
ed T
BS
398
20.
220
.635
229
Sco
ne, p
lain
3237
25g
1 sm
all s
cone
401
24
12.5
2777
32S
cone
, who
le-w
heat
(hm
/ w
m)
3320
25g
smal
l38
32.
73.
99.
464
7375
Tast
y w
heat
, coo
ked
3240
100g
1 he
aped
LS
220
1.5
0.2
1117
117
Whi
te b
read
/ ro
lls*
(forti
fied)
3210
30g
1 sl
ice
/ 1 m
ed ro
ll31
12.
60.
413
.829
196
64
Who
le-w
heat
bre
ad /
rolls
32
1230
g1
slic
e / 1
/2 ro
ll32
52.
50.
613
.353
114
64H
igh
in E
nerg
y (8
35 k
J) a
nd /
or F
at (1
0 g)
App
le ta
rt, s
hort
crus
t 32
2475
g1
larg
e w
edge
700
25.
925
.423
115
84
Bak
ed c
hees
e ca
ke, e
gg a
nd c
ream
3293
50g
1 sm
all w
edge
867
2.7
16.2
12.7
4815
555
Ban
ana
loaf
(wm
, hm
)33
3340
g1
cm s
lice
562
1.9
4.4
2126
8484
Bes
kuit,
who
le-w
heat
, but
term
ilk (h
m)
3255
30g
1 ru
sk59
72.
76.
216
.865
130
77
Boe
rbes
kuit
3364
30g
2 sm
all p
iece
s53
02.
72.
322
.650
3462
But
ter c
ake,
pla
in (w
m, h
m)
3288
50g
1 sm
all p
iece
754
2.6
6.2
27.9
3711
941
But
term
ilk ru
sk, w
hite
, com
mer
cial
3329
30g
1 ru
sk56
92.
44.
520
.650
164
61
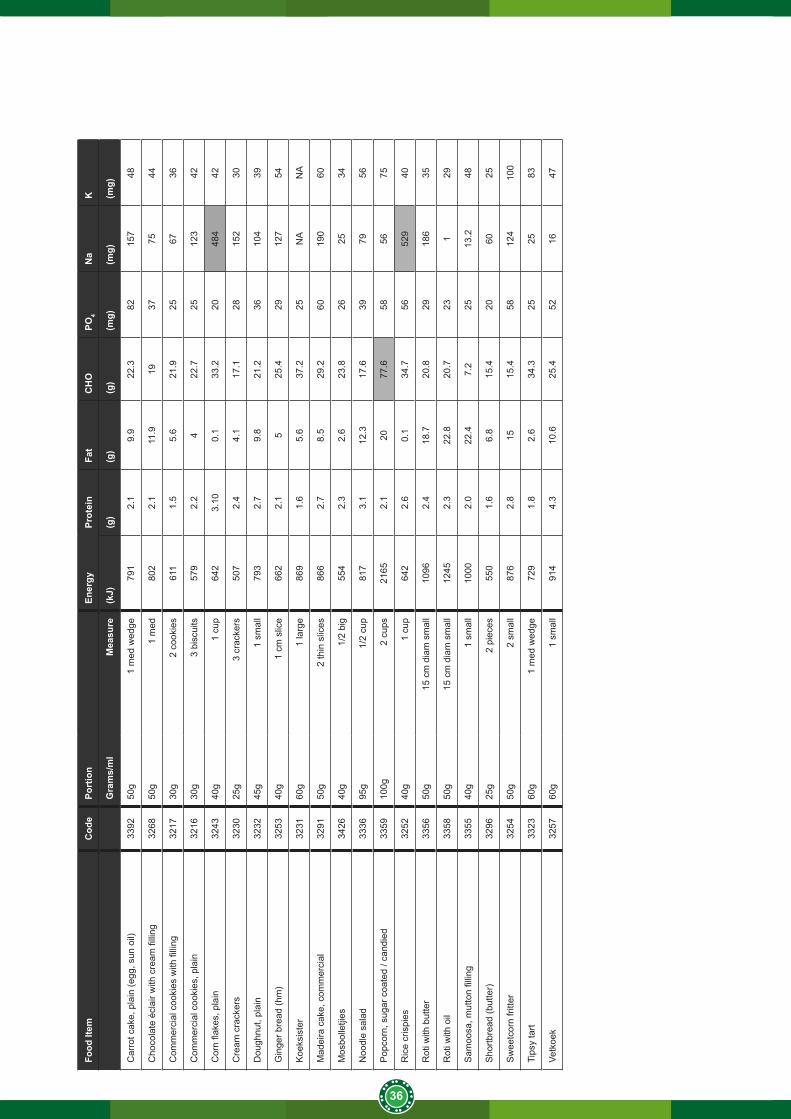
36
Food
Item
Cod
ePo
rtio
n
Ener
gyPr
otei
nFa
tC
HO
PO4
Na
K
Gra
ms/
ml
Mea
sure
(kJ)
(g)
(g)
(g)
(mg)
(mg)
(mg)
Car
rot c
ake,
pla
in (e
gg, s
un o
il)33
9250
g1
med
wed
ge79
12.
19.
922
.382
157
48
Cho
cola
te é
clai
r with
cre
am fi
lling
3268
50g
1 m
ed80
22.
111
.919
3775
44
Com
mer
cial
coo
kies
with
filli
ng32
1730
g2
cook
ies
611
1.5
5.6
21.9
2567
36
Com
mer
cial
coo
kies
, pla
in32
1630
g3
bisc
uits
579
2.2
422
.725
123
42
Cor
n fla
kes,
pla
in32
4340
g1
cup
642
3.10
0.1
33.2
2048
442
Cre
am c
rack
ers
3230
25g
3 cr
acke
rs50
72.
44.
117
.128
152
30
Dou
ghnu
t, pl
ain
3232
45g
1 sm
all
793
2.7
9.8
21.2
3610
439
Gin
ger b
read
(hm
)32
5340
g1
cm s
lice
662
2.1
525
.429
127
54
Koe
ksis
ter
3231
60g
1 la
rge
869
1.6
5.6
37.2
25N
AN
A
Mad
eira
cak
e, c
omm
erci
al32
9150
g2
thin
slic
es86
62.
78.
529
.260
190
60
Mos
bolle
tjies
3426
40g
1/2
big
554
2.3
2.6
23.8
2625
34
Noo
dle
sala
d33
3695
g1/
2 cu
p81
73.
112
.317
.639
7956
Pop
corn
, sug
ar c
oate
d / c
andi
ed33
5910
0g2
cups
2165
2.1
2077
.658
5675
Ric
e cr
ispi
es32
5240
g1
cup
642
2.6
0.1
34.7
5652
940
Rot
i with
but
ter
3356
50g
15 c
m d
iam
sm
all
1096
2.4
18.7
20.8
2918
635
Rot
i with
oil
3358
50g
15 c
m d
iam
sm
all
1245
2.3
22.8
20.7
231
29
Sam
oosa
, mut
ton
fillin
g33
5540
g1
smal
l10
002.
022
.47.
225
13.2
48
Sho
rtbre
ad (b
utte
r)32
9625
g2
piec
es55
01.
66.
815
.420
6025
Sw
eetc
orn
fritte
r32
5450
g2
smal
l87
62.
815
15.4
5812
410
0
Tips
y ta
rt33
2360
g1
med
wed
ge72
91.
82.
634
.325
2583
Vetk
oek
3257
60g
1 sm
all
914
4.3
10.6
25.4
5216
47
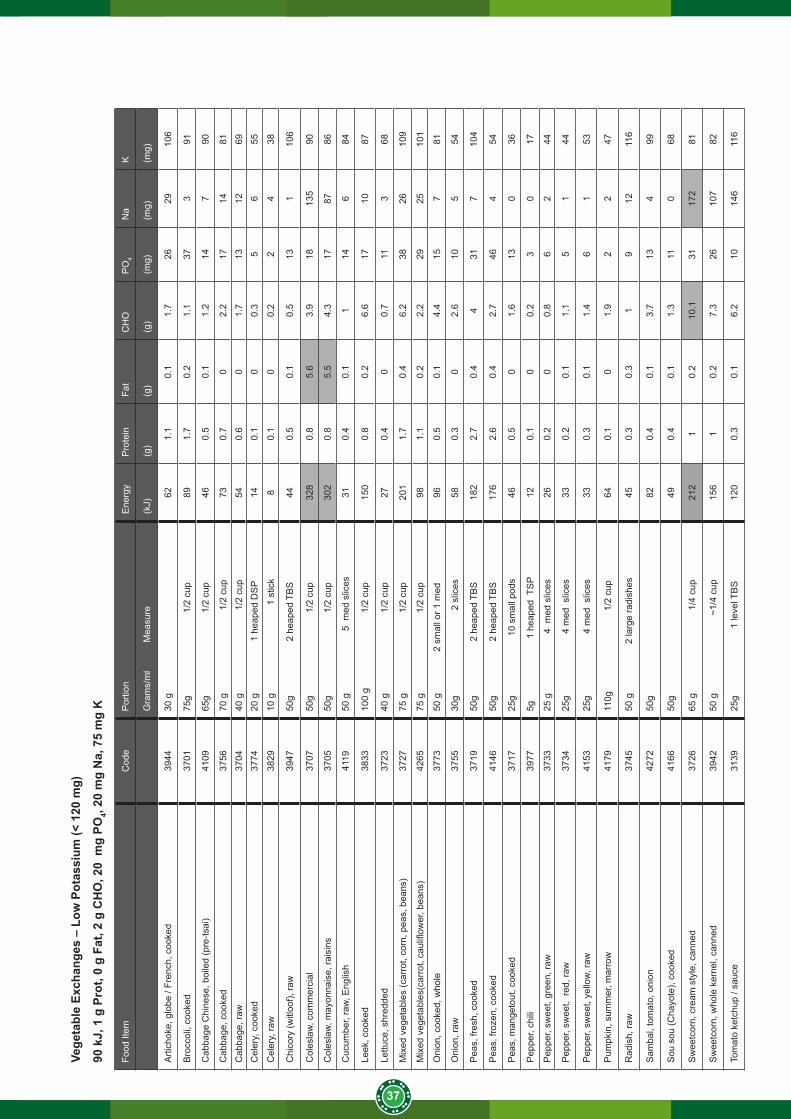
37
Vege
tabl
e Ex
chan
ges
– Lo
w P
otas
sium
(< 1
20 m
g)
90 k
J, 1
g P
rot,
0 g
Fat,
2 g
CH
O, 2
0 m
g PO
4, 20
mg
Na,
75
mg
K
Food
Item
Cod
eP
ortio
n E
nerg
yP
rote
inFa
tC
HO
PO
4N
aK
Gra
ms/
ml
M
easu
re(k
J)(g
)(g
)(g
)(m
g)(m
g)(m
g)
Arti
chok
e, g
lobe
/ Fr
ench
, coo
ked
3944
30 g
62
1.1
0.1
1.7
2629
106
Bro
ccol
i, co
oked
3701
75g
1/2
cup
89
1.7
0.2
1.1
373
91
Cab
bage
Chi
nese
, boi
led
(pre
-tsai
)41
0965
g
1
/2 c
up46
0.5
0.1
1.2
147
90
Cab
bage
, coo
ked
3756
70 g
1/2
cup
730.
70
2.2
1714
81
Cab
bage
, raw
3704
40 g
1/2
cup
540.
60
1.7
1312
69C
eler
y, c
ooke
d37
7420
g
1
hea
ped
DS
P14
0.1
00.
35
655
Cel
ery,
raw
3829
10 g
1
stic
k8
0.1
00.
22
438
Chi
cory
(witl
oof),
raw
3947
50g
2 h
eape
d TB
S44
0.5
0.1
0.5
131
106
Col
esla
w, c
omm
erci
al37
0750
g
1
/2 c
up32
80.
85.
63.
918
135
90
Col
esla
w, m
ayon
nais
e, ra
isin
s37
0550
g
1
/2 c
up30
20.
85.
54.
317
8786
Cuc
umbe
r, ra
w, E
nglis
h41
1950
g
5
med
slic
es31
0.4
0.1
114
684
Leek
, coo
ked
3833
100
g
1/2
cup
150
0.8
0.2
6.6
1710
87
Lettu
ce, s
hred
ded
3723
40 g
1/2
cup
270.
40
0.7
113
68
Mix
ed v
eget
able
s (c
arro
t, co
rn, p
eas,
bea
ns)
3727
75 g
1/2
cup
201
1.7
0.4
6.2
3826
109
Mix
ed v
eget
able
s(ca
rrot
, cau
liflow
er, b
eans
)42
6575
g
1
/2 c
up98
1.1
0.2
2.2
2925
101
Oni
on, c
ooke
d, w
hole
3773
50 g
2
sm
all o
r 1 m
ed96
0.5
0.1
4.4
157
81
Oni
on, r
aw37
5530
g
2
slic
es58
0.3
02.
610
554
Pea
s, fr
esh,
coo
ked
3719
50g
2 h
eape
d TB
S18
22.
70.
44
317
104
Pea
s, fr
ozen
, coo
ked
4146
50g
2 h
eape
d TB
S17
62.
60.
42.
746
454
Pea
s, m
ange
tout
, coo
ked
3717
25g
1
0 sm
all p
ods
460.
50
1.6
130
36
Pep
per,
chili
3977
5g
1
heap
ed T
SP
120.
10
0.2
30
17
Pep
per,
swee
t, gr
een,
raw
3733
25 g
4
med
slic
es26
0.2
00.
86
244
Pep
per,
swee
t, re
d, ra
w37
3425
g
4 m
ed s
lices
330.
20.
11.
15
144
Pep
per,
swee
t, ye
llow
, raw
4153
25g
4
med
slic
es33
0.3
0.1
1.4
61
53
Pum
pkin
, sum
mer
, mar
row
4179
110g
1/2
cup
640.
10
1.9
22
47
Rad
ish,
raw
3745
50 g
2 la
rge
radi
shes
450.
30.
31
912
116
Sam
bal,
tom
ato,
oni
on42
7250
g82
0.4
0.1
3.7
134
99
Sou
sou
(Cha
yote
), co
oked
4166
50g
490.
40.
11.
311
068
Sw
eetc
orn,
cre
am s
tyle
, can
ned
3726
65 g
1/4
cup
212
10.
210
.131
172
81
Sw
eetc
orn,
who
le k
erne
l, ca
nned
3942
50 g
~1/4
cup
156
10.
27.
326
107
82
Tom
ato
ketc
hup
/ sau
ce31
3925
g
1
leve
l TB
S12
00.
30.
16.
210
146
116
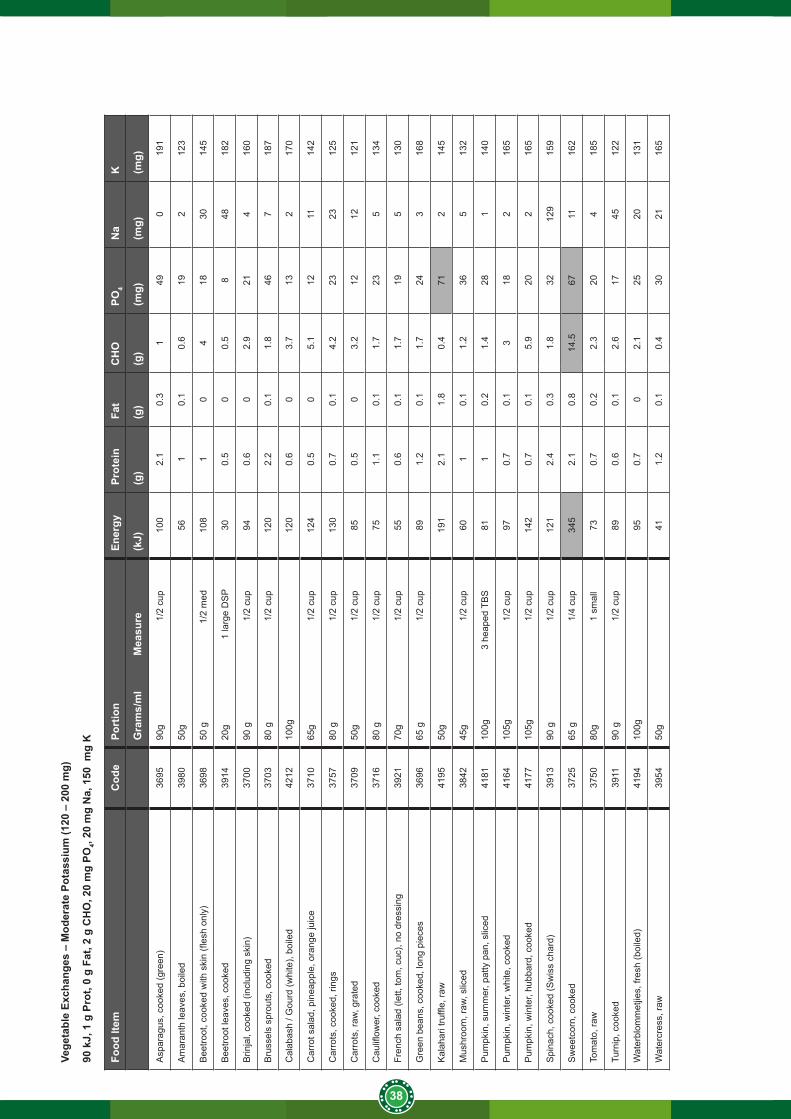
38
Vege
tabl
e Ex
chan
ges
– M
oder
ate
Pota
ssiu
m (1
20 –
200
mg)
90 k
J, 1
g P
rot,
0 g
Fat,
2 g
CH
O, 2
0 m
g PO
4, 20
mg
Na,
150
mg
K
Food
Item
Cod
ePo
rtio
n En
ergy
Prot
ein
Fat
CH
OPO
4N
aK
Gra
ms/
ml
M
easu
re(k
J)(g
)(g
)(g
)(m
g)(m
g)(m
g)
Asp
arag
us, c
ooke
d (g
reen
)36
9590
g
1/2
cup
100
2.1
0.3
149
019
1
Am
aran
th le
aves
, boi
led
3980
50g
561
0.1
0.6
192
123
Bee
troot
, coo
ked
with
ski
n (fl
esh
only
)36
9850
g
1
/2 m
ed10
81
04
1830
145
Bee
troot
leav
es, c
ooke
d39
1420
g
1
larg
e D
SP
300.
50
0.5
848
182
Brin
jal,
cook
ed (i
nclu
ding
ski
n)37
0090
g
1/2
cup
940.
60
2.9
214
160
Bru
ssel
s sp
rout
s, c
ooke
d37
0380
g
1/2
cup
120
2.2
0.1
1.8
467
187
Cal
abas
h / G
ourd
(whi
te),
boile
d42
1210
0g12
00.
60
3.7
132
170
Car
rot s
alad
, pin
eapp
le, o
rang
e ju
ice
3710
65g
1/
2 cu
p12
40.
50
5.1
1211
142
Car
rots
, coo
ked,
ring
s37
5780
g
1/2
cup
130
0.7
0.1
4.2
2323
125
Car
rots
, raw
, gra
ted
3709
50g
1/
2 cu
p85
0.5
03.
212
1212
1
Cau
liflow
er, c
ooke
d37
1680
g
1/2
cup
751.
10.
11.
723
513
4
Fren
ch s
alad
(let
t, to
m, c
uc),
no d
ress
ing
3921
70g
1/
2 cu
p55
0.6
0.1
1.7
195
130
Gre
en b
eans
, coo
ked,
long
pie
ces
3696
65 g
1/
2 cu
p89
1.2
0.1
1.7
243
168
Kal
ahar
i tru
ffle,
raw
4195
50g
191
2.1
1.8
0.4
712
145
Mus
hroo
m, r
aw, s
liced
3842
45g
1/
2 cu
p60
10.
11.
236
513
2
Pum
pkin
, sum
mer
, pat
ty p
an, s
liced
4181
100g
3
heap
ed T
BS
811
0.2
1.4
281
140
Pum
pkin
, win
ter,
whi
te, c
ooke
d41
6410
5g
1
/2 c
up97
0.7
0.1
318
216
5
Pum
pkin
, win
ter,
hubb
ard,
coo
ked
4177
105g
1/2
cup
142
0.7
0.1
5.9
202
165
Spi
nach
, coo
ked
(Sw
iss
char
d)39
1390
g
1/2
cup
121
2.4
0.3
1.8
3212
915
9
Sw
eetc
orn,
coo
ked
3725
65 g
1/
4 cu
p34
52.
10.
814
.567
1116
2
Tom
ato,
raw
3750
80g
1
smal
l 73
0.7
0.2
2.3
204
185
Turn
ip, c
ooke
d39
1190
g
1/2
cup
890.
60.
12.
617
4512
2
Wat
erbl
omm
etjie
s, fr
esh
(boi
led)
4194
100g
95
0.7
02.
125
2013
1
Wat
ercr
ess,
raw
3954
50g
411.
20.
10.
430
2116
5
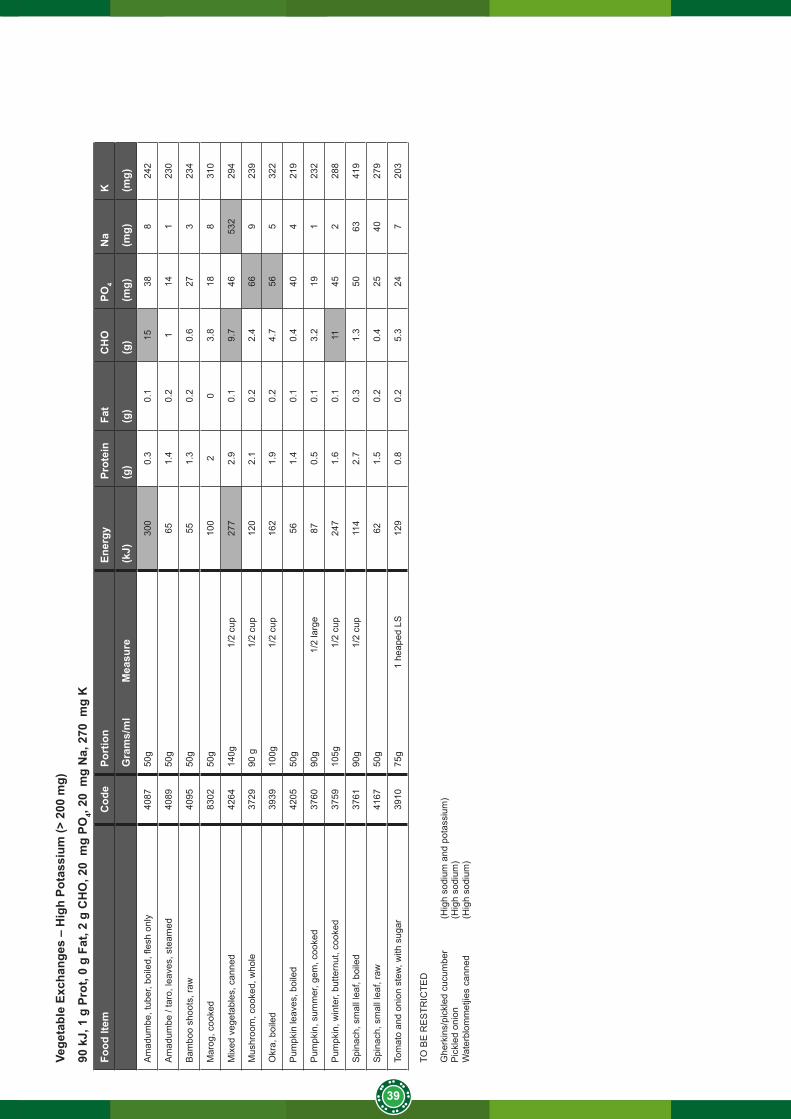
39
Vege
tabl
e Ex
chan
ges
– M
oder
ate
Pota
ssiu
m (1
20 –
200
mg)
90 k
J, 1
g P
rot,
0 g
Fat,
2 g
CH
O, 2
0 m
g PO
4, 20
mg
Na,
150
mg
K
Food
Item
Cod
ePo
rtio
n En
ergy
Prot
ein
Fat
CH
OPO
4N
aK
Gra
ms/
ml
M
easu
re(k
J)(g
)(g
)(g
)(m
g)(m
g)(m
g)
Asp
arag
us, c
ooke
d (g
reen
)36
9590
g
1/2
cup
100
2.1
0.3
149
019
1
Am
aran
th le
aves
, boi
led
3980
50g
561
0.1
0.6
192
123
Bee
troot
, coo
ked
with
ski
n (fl
esh
only
)36
9850
g
1
/2 m
ed10
81
04
1830
145
Bee
troot
leav
es, c
ooke
d39
1420
g
1
larg
e D
SP
300.
50
0.5
848
182
Brin
jal,
cook
ed (i
nclu
ding
ski
n)37
0090
g
1/2
cup
940.
60
2.9
214
160
Bru
ssel
s sp
rout
s, c
ooke
d37
0380
g
1/2
cup
120
2.2
0.1
1.8
467
187
Cal
abas
h / G
ourd
(whi
te),
boile
d42
1210
0g12
00.
60
3.7
132
170
Car
rot s
alad
, pin
eapp
le, o
rang
e ju
ice
3710
65g
1/
2 cu
p12
40.
50
5.1
1211
142
Car
rots
, coo
ked,
ring
s37
5780
g
1/2
cup
130
0.7
0.1
4.2
2323
125
Car
rots
, raw
, gra
ted
3709
50g
1/
2 cu
p85
0.5
03.
212
1212
1
Cau
liflow
er, c
ooke
d37
1680
g
1/2
cup
751.
10.
11.
723
513
4
Fren
ch s
alad
(let
t, to
m, c
uc),
no d
ress
ing
3921
70g
1/
2 cu
p55
0.6
0.1
1.7
195
130
Gre
en b
eans
, coo
ked,
long
pie
ces
3696
65 g
1/
2 cu
p89
1.2
0.1
1.7
243
168
Kal
ahar
i tru
ffle,
raw
4195
50g
191
2.1
1.8
0.4
712
145
Mus
hroo
m, r
aw, s
liced
3842
45g
1/
2 cu
p60
10.
11.
236
513
2
Pum
pkin
, sum
mer
, pat
ty p
an, s
liced
4181
100g
3
heap
ed T
BS
811
0.2
1.4
281
140
Pum
pkin
, win
ter,
whi
te, c
ooke
d41
6410
5g
1
/2 c
up97
0.7
0.1
318
216
5
Pum
pkin
, win
ter,
hubb
ard,
coo
ked
4177
105g
1/2
cup
142
0.7
0.1
5.9
202
165
Spi
nach
, coo
ked
(Sw
iss
char
d)39
1390
g
1/2
cup
121
2.4
0.3
1.8
3212
915
9
Sw
eetc
orn,
coo
ked
3725
65 g
1/
4 cu
p34
52.
10.
814
.567
1116
2
Tom
ato,
raw
3750
80g
1
smal
l 73
0.7
0.2
2.3
204
185
Turn
ip, c
ooke
d39
1190
g
1/2
cup
890.
60.
12.
617
4512
2
Wat
erbl
omm
etjie
s, fr
esh
(boi
led)
4194
100g
95
0.7
02.
125
2013
1
Wat
ercr
ess,
raw
3954
50g
411.
20.
10.
430
2116
5
Vege
tabl
e Ex
chan
ges
– H
igh
Pota
ssiu
m (>
200
mg)
90 k
J, 1
g P
rot,
0 g
Fat,
2 g
CH
O, 2
0 m
g PO
4, 20
mg
Na,
270
mg
K
Food
Item
Cod
ePo
rtio
n En
ergy
Prot
ein
Fat
CH
OPO
4N
aK
Gra
ms/
ml
M
easu
re(k
J)(g
)(g
)(g
)(m
g)(m
g)(m
g)
Am
adum
be, t
uber
, boi
led,
fles
h on
ly40
8750
g30
00.
30.
115
388
242
Am
adum
be /
taro
, lea
ves,
ste
amed
4089
50g
651.
40.
21
141
230
Bam
boo
shoo
ts, r
aw40
9550
g 55
1.3
0.2
0.6
273
234
Mar
og, c
ooke
d83
0250
g10
02
03.
818
831
0
Mix
ed v
eget
able
s, c
anne
d42
6414
0g
1
/2 c
up27
72.
90.
19.
746
532
294
Mus
hroo
m, c
ooke
d, w
hole
3729
90 g
1/
2 cu
p12
02.
10.
22.
466
923
9
Okr
a, b
oile
d39
3910
0g
1
/2 c
up16
21.
90.
24.
756
532
2
Pum
pkin
leav
es, b
oile
d42
0550
g56
1.4
0.1
0.4
404
219
Pum
pkin
, sum
mer
, gem
, coo
ked
3760
90g
1/2
larg
e87
0.5
0.1
3.2
191
232
Pum
pkin
, win
ter,
butte
rnut
, coo
ked
3759
105g
1/2
cup
247
1.6
0.1
1145
228
8
Spi
nach
, sm
all l
eaf,
boile
d37
6190
g
1/2
cup
114
2.7
0.3
1.3
5063
419
Spi
nach
, sm
all l
eaf,
raw
4167
50g
621.
50.
20.
425
4027
9
Tom
ato
and
onio
n st
ew, w
ith s
ugar
3910
75g
1 h
eape
d LS
129
0.8
0.2
5.3
247
203
TO B
E R
ES
TRIC
TED
Ghe
rkin
s/pi
ckle
d cu
cum
ber
(Hig
h so
dium
and
pot
assi
um)
Pic
kled
oni
on
(H
igh
sodi
um)
Wat
erbl
omm
etjie
s ca
nned
(H
igh
sodi
um)
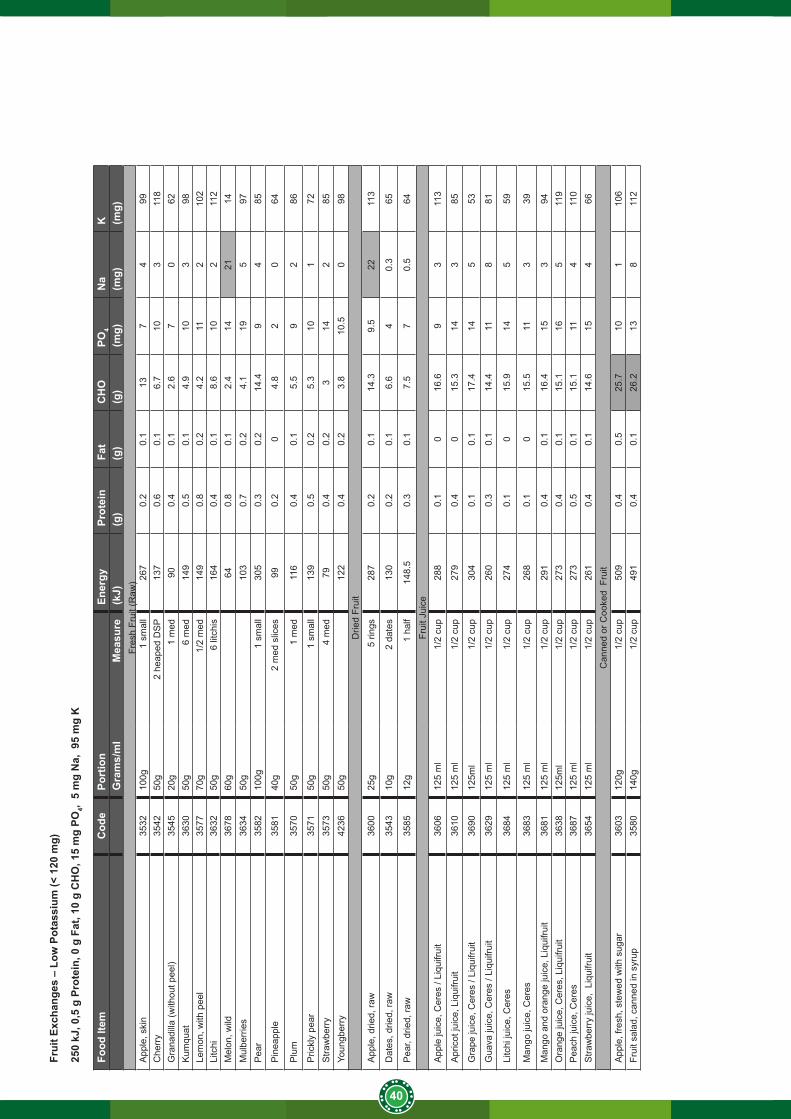
40
Frui
t Exc
hang
es –
Low
Pot
assi
um (<
120
mg)
250
kJ, 0
,5 g
Pro
tein
, 0 g
Fat
, 10
g C
HO
, 15
mg
PO4,
5 m
g N
a, 9
5 m
g K
Food
Item
Cod
ePo
rtio
n
Ener
gyPr
otei
nFa
tC
HO
PO4
Na
K
G
ram
s/m
lM
easu
re(k
J)(g
)(g
)(g
)(m
g)(m
g)(m
g)Fr
esh
Frui
t (R
aw)
App
le, s
kin
3532
100g
1 sm
all
267
0.2
0.1
137
499
Che
rry
3542
50g
2 he
aped
DS
P13
70.
60.
16.
710
311
8G
rana
dilla
(with
out p
eel)
3545
20g
1 m
ed90
0.4
0.1
2.6
70
62K
umqu
at36
3050
g6
med
149
0.5
0.1
4.9
103
98Le
mon
, with
pee
l35
7770
g1/
2 m
ed14
90.
80.
24.
211
210
2Li
tchi
36
3250
g 6
litc
his
164
0.4
0.1
8.6
102
112
Mel
on, w
ild36
7860
g
64
0.8
0.1
2.4
1421
14M
ulbe
rrie
s36
3450
g
103
0.7
0.2
4.1
195
97P
ear
3582
100g
1 sm
all
305
0.3
0.2
14.4
94
85
Pin
eapp
le35
8140
g2
med
slic
es99
0.2
04.
82
064
Plu
m35
7050
g 1
med
116
0.4
0.1
5.5
92
86
Pric
kly
pear
3571
50g
1 sm
all
139
0.5
0.2
5.3
101
72S
traw
berr
y35
7350
g4
med
790.
40.
23
142
85Yo
ungb
erry
4236
50g
122
0.4
0.2
3.8
10.5
098
Drie
d Fr
uit
App
le, d
ried,
raw
3600
25g
5 rin
gs28
70.
20.
114
.39.
522
113
Dat
es, d
ried,
raw
3543
10g
2 da
tes
130
0.2
0.1
6.6
40.
365
Pea
r, dr
ied,
raw
35
8512
g1
half
148.
50.
30.
17.
57
0.5
64
Frui
t Jui
ceA
pple
juic
e, C
eres
/ Li
quifr
uit
3606
125
ml
1/2
cup
288
0.1
016
.69
311
3
Apr
icot
juic
e, L
iqui
fruit
3610
125
ml
1/2
cup
279
0.4
015
.314
385
Gra
pe ju
ice,
Cer
es /
Liqu
ifrui
t 36
9012
5ml
1/2
cup
304
0.1
0.1
17.4
145
53
Gua
va ju
ice,
Cer
es /
Liqu
ifrui
t 36
2912
5 m
l1/
2 cu
p26
00.
30.
114
.411
881
Litc
hi ju
ice,
Cer
es36
8412
5 m
l1/
2 cu
p27
40.
10
15.9
145
59
Man
go ju
ice,
Cer
es36
8312
5 m
l1/
2 cu
p26
80.
10
15.5
113
39
Man
go a
nd o
rang
e ju
ice,
Liq
uifru
it36
8112
5 m
l1/
2 cu
p29
10.
40.
116
.415
394
Ora
nge
juic
e, C
eres
, Liq
uifru
it36
3812
5ml
1/2
cup
273
0.4
0.1
15.1
165
119
Pea
ch ju
ice,
Cer
es36
8712
5 m
l1/
2 cu
p27
30.
50.
115
.111
411
0S
traw
berr
y ju
ice,
Liq
uifru
it 36
5412
5 m
l1/
2 cu
p26
10.
40.
114
.615
466
Can
ned
or C
ooke
d F
ruit
App
le, f
resh
, ste
wed
with
sug
ar36
0312
0g1/
2 cu
p50
90.
40.
525
.710
110
6Fr
uit s
alad
, can
ned
in s
yrup
3580
140g
1/2
cup
491
0.4
0.1
26.2
138
112
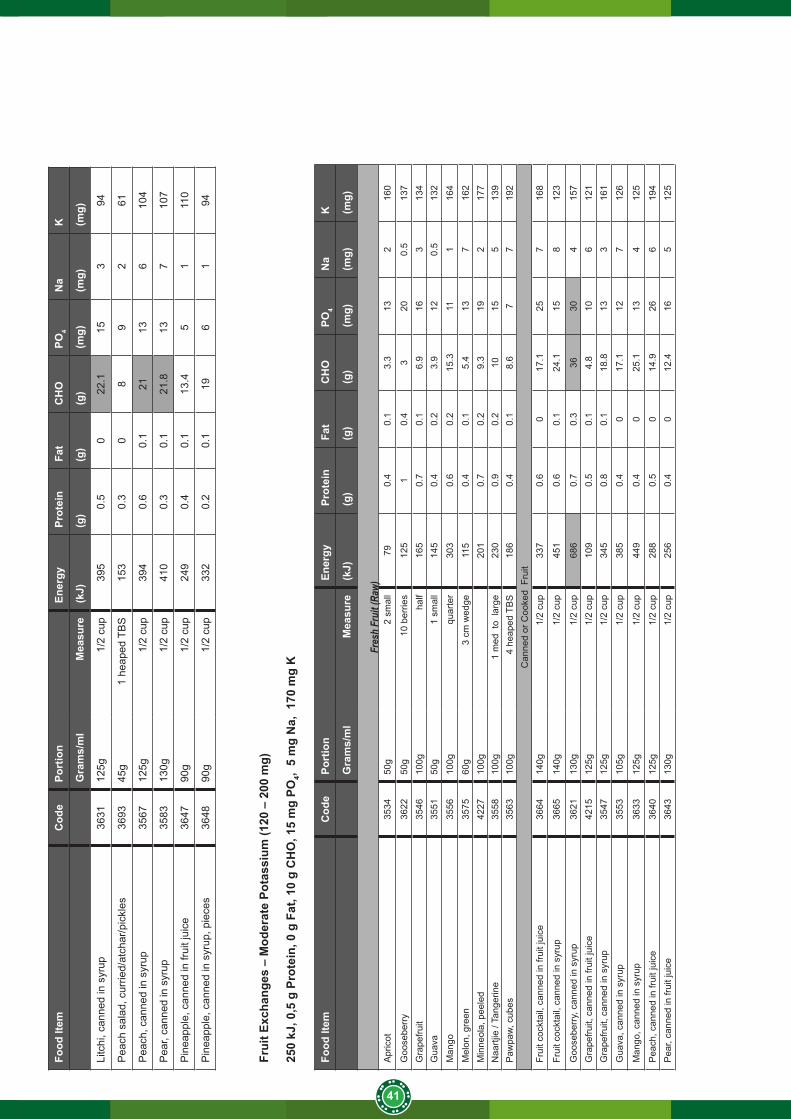
41
Food
Item
Cod
ePo
rtio
n
Ener
gyPr
otei
nFa
tC
HO
PO4
Na
K
Gra
ms/
ml
Mea
sure
(kJ)
(g)
(g)
(g)
(mg)
(mg)
(mg)
Litc
hi, c
anne
d in
syr
up36
3112
5g1/
2 cu
p39
50.
50
22.1
153
94
Pea
ch s
alad
, cur
ried/
atch
ar/p
ickl
es36
9345
g1
heap
ed T
BS
153
0.3
08
92
61
Pea
ch, c
anne
d in
syr
up35
6712
5g1/
2 cu
p39
40.
60.
121
136
104
Pea
r, ca
nned
in s
yrup
3583
130g
1/2
cup
410
0.3
0.1
21.8
137
107
Pin
eapp
le, c
anne
d in
frui
t jui
ce36
4790
g1/
2 cu
p24
90.
40.
113
.45
111
0
Pin
eapp
le, c
anne
d in
syr
up, p
iece
s36
4890
g1/
2 cu
p33
20.
20.
119
61
94
Frui
t Exc
hang
es –
Mod
erat
e Po
tass
ium
(120
– 2
00 m
g)
250
kJ, 0
,5 g
Pro
tein
, 0 g
Fat
, 10
g C
HO
, 15
mg
PO4,
5 m
g N
a, 1
70 m
g K
Food
Item
Cod
ePo
rtio
n
Ener
gyPr
otei
nFa
tC
HO
PO4
Na
K
Gra
ms/
ml
Mea
sure
(kJ)
(g)
(g)
(g)
(mg)
(mg)
(mg)
Fres
h Fr
uit (
Raw)
Apr
icot
3534
50g
2 sm
all
790.
40.
13.
313
216
0
Goo
sebe
rry
3622
50g
10 b
errie
s12
51
0.4
320
0.5
137
Gra
pefru
it 35
4610
0gha
lf16
50.
70.
16.
916
313
4G
uava
35
5150
g1
smal
l14
50.
40.
23.
912
0.5
132
Man
go
3556
100g
qu
arte
r30
30.
60.
215
.311
116
4
Mel
on, g
reen
3575
60g
3 cm
wed
ge11
50.
40.
15.
413
716
2M
inne
ola,
pee
led
4227
100g
201
0.7
0.2
9.3
192
177
Naa
rtjie
/ Ta
nger
ine
3558
100g
1 m
ed t
o la
rge
230
0.9
0.2
1015
513
9P
awpa
w, c
ubes
3563
100g
4 he
aped
TB
S18
60.
40.
18.
67
719
2C
anne
d or
Coo
ked
Fru
itFr
uit c
ockt
ail,
cann
ed in
frui
t jui
ce36
6414
0g1/
2 cu
p33
70.
60
17.1
257
168
Frui
t coc
ktai
l, ca
nned
in s
yrup
3665
140g
1/2
cup
451
0.6
0.1
24.1
158
123
Goo
sebe
rry,
can
ned
in s
yrup
3621
130g
1/2
cup
686
0.7
0.3
3630
415
7G
rape
fruit,
can
ned
in fr
uit j
uice
4215
125g
1/2
cup
109
0.5
0.1
4.8
106
121
Gra
pefru
it, c
anne
d in
syr
up35
4712
5g1/
2 cu
p34
50.
80.
118
.813
316
1
Gua
va, c
anne
d in
syr
up35
5310
5g1/
2 cu
p38
50.
40
17.1
127
126
Man
go, c
anne
d in
syr
up36
3312
5g1/
2 cu
p44
90.
40
25.1
134
125
Pea
ch, c
anne
d in
frui
t jui
ce36
4012
5g1/
2 cu
p28
80.
50
14.9
266
194
Pea
r, ca
nned
in fr
uit j
uice
3643
130g
1/2
cup
256
0.4
012
.416
512
5
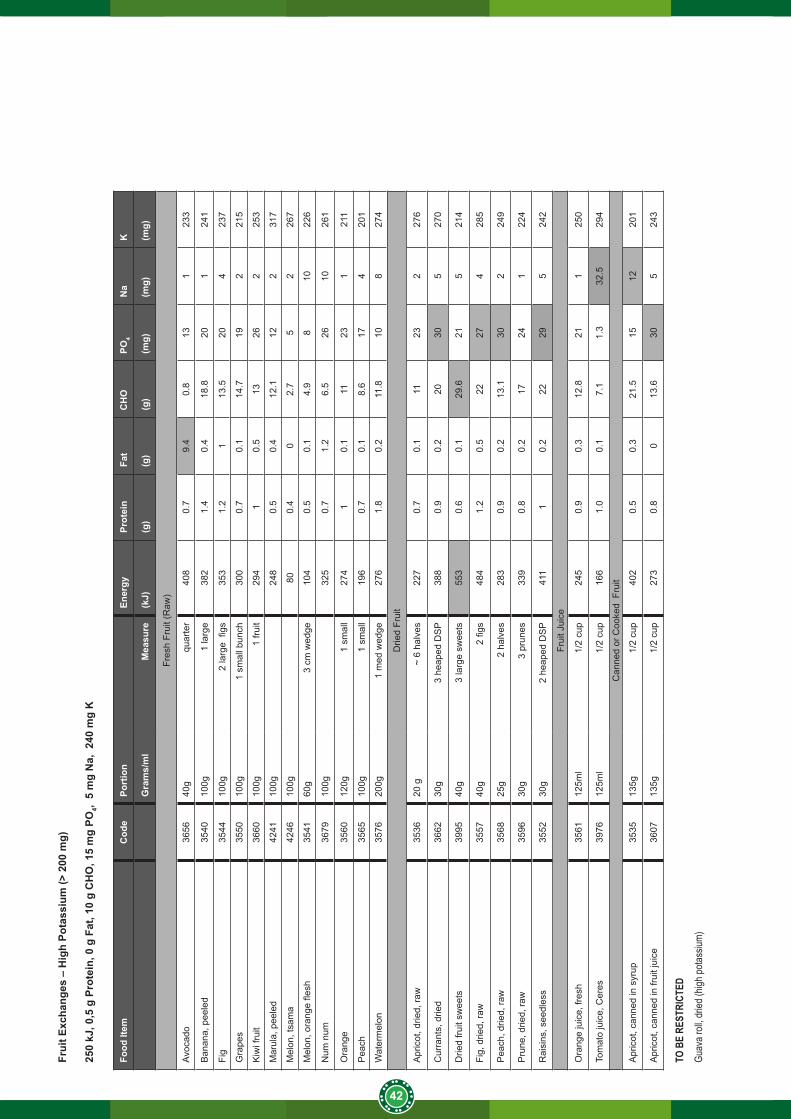
42
Frui
t Exc
hang
es –
Hig
h Po
tass
ium
(> 2
00 m
g)
250
kJ, 0
,5 g
Pro
tein
, 0 g
Fat
, 10
g C
HO
, 15
mg
PO4,
5 m
g N
a, 2
40 m
g K
Food
Item
Cod
ePo
rtio
n
Ener
gyPr
otei
nFa
tC
HO
PO4
Na
K
Gra
ms/
ml
Mea
sure
(kJ)
(g)
(g)
(g)
(mg)
(mg)
(mg)
Fres
h Fr
uit (
Raw
)
Avoc
ado
3656
40g
quar
ter
408
0.7
9.4
0.8
131
233
Ban
ana,
pee
led
3540
100g
1 la
rge
382
1.4
0.4
18.8
201
241
Fig
3544
100g
2 la
rge
figs
353
1.2
113
.520
423
7
Gra
pes
3550
100g
1 sm
all b
unch
300
0.7
0.1
14.7
192
215
Kiw
i fru
it 36
6010
0g1
fruit
294
10.
513
262
253
Mar
ula,
pee
led
4241
100g
24
80.
50.
412
.112
231
7
Mel
on, t
sam
a42
4610
0g
800.
40
2.7
52
267
Mel
on, o
rang
e fle
sh
3541
60g
3 cm
wed
ge10
40.
50.
14.
98
1022
6
Num
num
3679
100g
325
0.7
1.2
6.5
2610
261
Ora
nge
3560
120g
1 sm
all
274
10.
111
231
211
Pea
ch35
6510
0g1
smal
l19
60.
70.
18.
617
420
1
Wat
erm
elon
3576
200g
1
med
wed
ge27
61.
80.
211
.810
827
4
Drie
d Fr
uit
Apr
icot
, drie
d, ra
w35
3620
g~
6 ha
lves
227
0.7
0.1
1123
227
6
Cur
rant
s, d
ried
3662
30g
3 he
aped
DS
P38
80.
90.
220
305
270
Drie
d fru
it sw
eets
3995
40g
3 la
rge
swee
ts55
30.
60.
129
.621
521
4
Fig,
drie
d, ra
w35
5740
g2
figs
484
1.2
0.5
2227
428
5
Pea
ch, d
ried,
raw
3568
25g
2 ha
lves
283
0.9
0.2
13.1
302
249
Pru
ne, d
ried,
raw
3596
30g
3 pr
unes
339
0.8
0.2
1724
122
4
Rai
sins
, see
dles
s35
5230
g2
heap
ed D
SP
411
10.
222
295
242
Frui
t Jui
ce
Ora
nge
juic
e, fr
esh
3561
125m
l1/
2 cu
p24
50.
90.
312
.821
125
0
Tom
ato
juic
e, C
eres
3976
125m
l1/
2 cu
p16
61.
00.
17.
11.
332
.529
4
Can
ned
or C
ooke
d F
ruit
Apr
icot
, can
ned
in s
yrup
3535
135g
1/2
cup
402
0.5
0.3
21.5
1512
201
Apr
icot
, can
ned
in fr
uit j
uice
3607
135g
1/2
cup
273
0.8
013
.630
524
3
TO B
E RE
STRI
CTED
Guav
a roll
, drie
d (hig
h pota
ssium
)
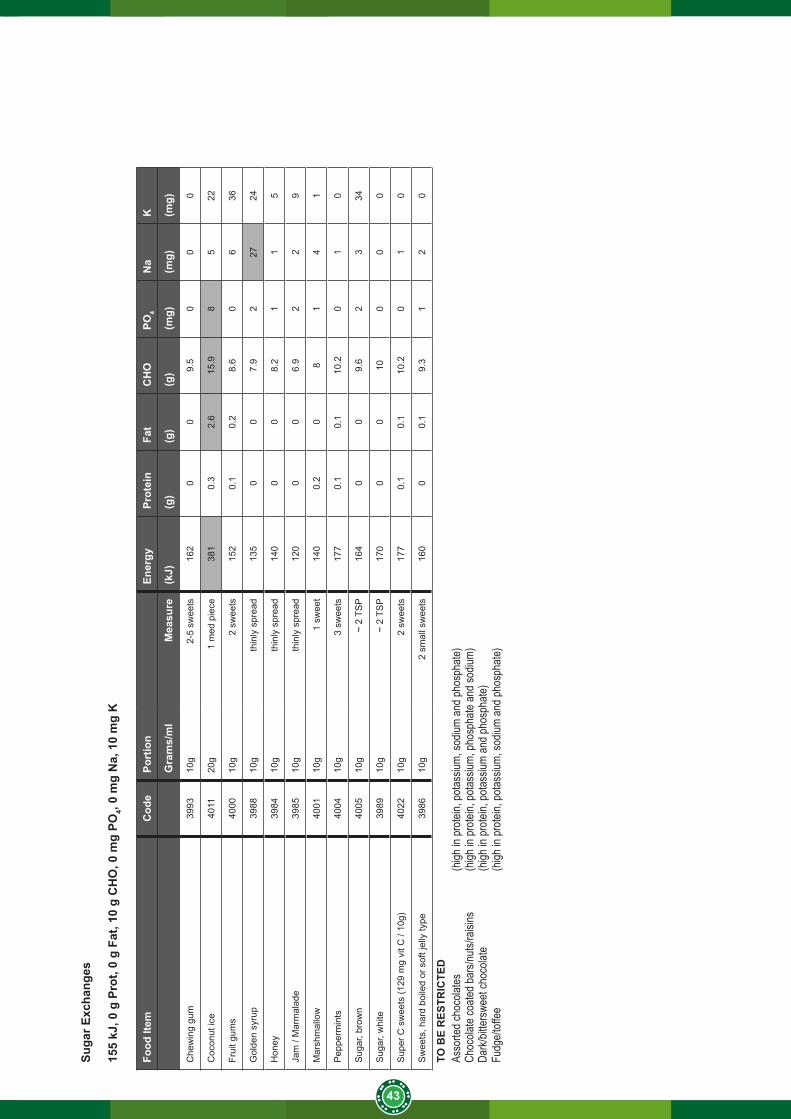
43
Suga
r Exc
hang
es
155
kJ, 0
g P
rot,
0 g
Fat,
10 g
CH
O, 0
mg
PO4,
0 m
g N
a, 1
0 m
g K
Food
Item
Cod
ePo
rtio
n
Ener
gyPr
otei
nFa
tC
HO
PO4
Na
K
Gra
ms/
ml
Mea
sure
(kJ)
(g)
(g)
(g)
(mg)
(mg)
(mg)
Che
win
g gu
m39
9310
g2-
5 sw
eets
162
00
9.5
00
0
Coc
onut
ice
4011
20g
1 m
ed p
iece
381
0.3
2.6
15.9
85
22
Frui
t gum
s40
0010
g2
swee
ts15
20.
10.
28.
60
636
Gol
den
syru
p39
8810
gth
inly
spr
ead
135
00
7.9
227
24
Hon
ey39
8410
gth
inly
spr
ead
140
00
8.2
11
5
Jam
/ M
arm
alad
e
3985
10g
thin
ly s
prea
d12
00
06.
92
29
Mar
shm
allo
w40
0110
g1
swee
t14
00.
20
81
41
Pep
perm
ints
4004
10g
3 sw
eets
177
0.1
0.1
10.2
01
0
Sug
ar, b
row
n40
0510
g ~
2 T
SP
164
00
9.6
23
34
Sug
ar, w
hite
3989
10g
~ 2
TSP
170
00
100
00
Sup
er C
sw
eets
(129
mg
vit C
/ 10
g)40
2210
g2
swee
ts17
70.
10.
110
.20
10
Sw
eets
, har
d bo
iled
or s
oft j
elly
type
3986
10g
2 sm
all s
wee
ts16
00
0.1
9.3
12
0
TO B
E R
ESTR
ICTE
DAs
sorte
d cho
colat
es
(h
igh in
prote
in, po
tassiu
m, so
dium
and p
hosp
hate)
Choc
olate
coate
d bar
s/nuts
/raisi
ns
(high
in pr
otein,
potas
sium,
phos
phate
and s
odium
)Da
rk/bit
tersw
eet c
hoco
late
(h
igh in
prote
in, po
tassiu
m an
d pho
spha
te)Fu
dge/t
offee
(h
igh in
prote
in, po
tassiu
m, so
dium
and p
hosp
hate)
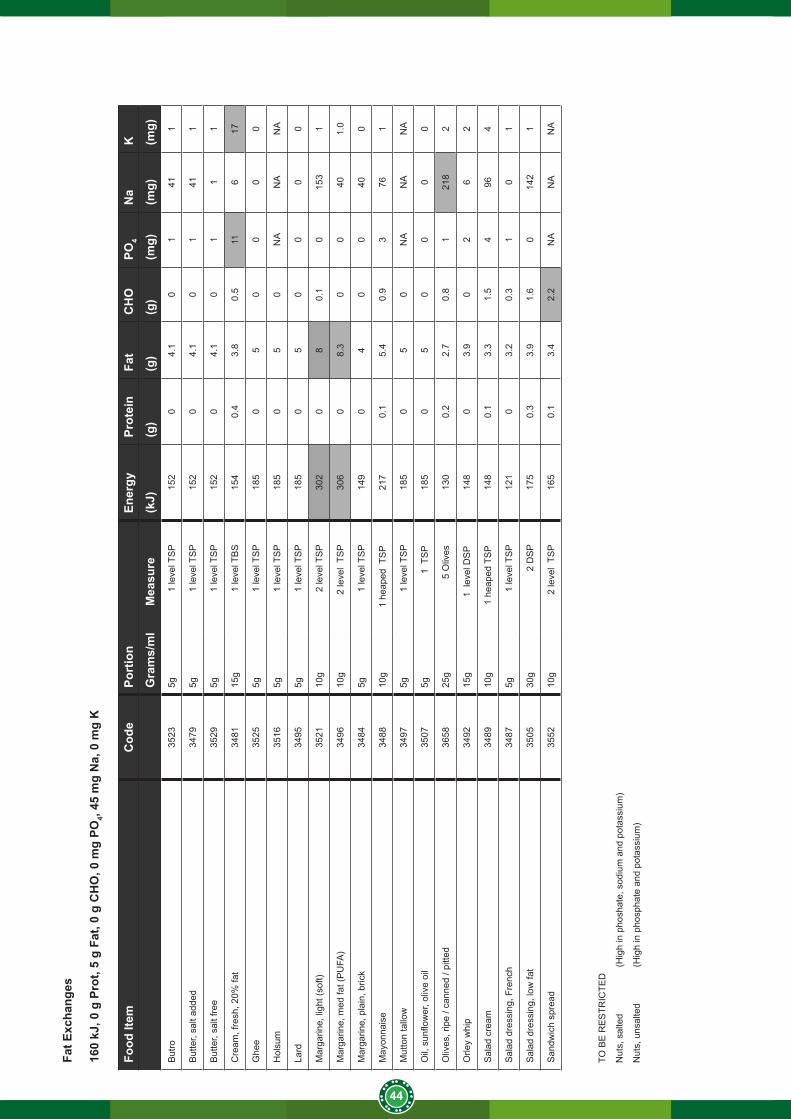
44
Fat E
xcha
nges
160
kJ, 0
g P
rot,
5 g
Fat,
0 g
CH
O, 0
mg
PO4,
45 m
g N
a, 0
mg
K
Food
Item
Cod
ePo
rtio
n
Ener
gyPr
otei
nFa
tC
HO
PO4
Na
K
Gra
ms/
ml
Mea
sure
(kJ)
(g)
(g)
(g)
(mg)
(mg)
(mg)
But
ro35
235g
1
leve
l TS
P15
20
4.1
01
411
But
ter,
salt
adde
d34
795g
1
leve
l TS
P15
20
4.1
01
411
But
ter,
salt
free
3529
5g
1 le
vel T
SP
152
04.
10
11
1
Cre
am, f
resh
, 20%
fat
3481
15g
1 le
vel T
BS
154
0.4
3.8
0.5
116
17
Ghe
e35
255g
1
leve
l TS
P18
50
50
00
0
Hol
sum
35
165g
1
leve
l TS
P18
50
50
NA
NA
NA
Lard
3495
5g
1 le
vel T
SP
185
05
00
00
Mar
garin
e, li
ght (
soft)
3521
10g
2 le
vel T
SP
302
08
0.1
015
31
Mar
garin
e, m
ed fa
t (P
UFA
)34
9610
g
2 le
vel
TSP
306
08.
30
040
1.0
Mar
garin
e, p
lain
, bric
k34
845g
1
leve
l TS
P14
90
40
040
0
May
onna
ise
3488
10g
1 he
aped
TS
P21
70.
15.
40.
93
761
Mut
ton
tallo
w34
975g
1
leve
l TS
P18
50
50
NA
NA
NA
Oil,
sun
flow
er, o
live
oil
3507
5g
1 T
SP
185
05
00
00
Oliv
es, r
ipe
/ can
ned
/ pitt
ed36
5825
g
5 O
lives
130
0.2
2.7
0.8
121
82
Orle
y w
hip
3492
15g
1
lev
el D
SP
148
03.
90
26
2
Sal
ad c
ream
3489
10g
1 h
eape
d TS
P14
80.
13.
31.
54
964
Sal
ad d
ress
ing,
Fre
nch
3487
5g
1 le
vel T
SP
121
03.
20.
31
01
Sal
ad d
ress
ing,
low
fat
3505
30g
2 D
SP
175
0.3
3.9
1.6
014
21
San
dwic
h sp
read
3552
10g
2
leve
l TS
P16
50.
13.
42.
2N
AN
AN
A
TO B
E R
ES
TRIC
TED
Nut
s, s
alte
d
(Hig
h in
pho
shat
e, s
odiu
m a
nd p
otas
sium
)
Nut
s, u
nsal
ted
(H
igh
in p
hosp
hate
and
pot
assi
um)
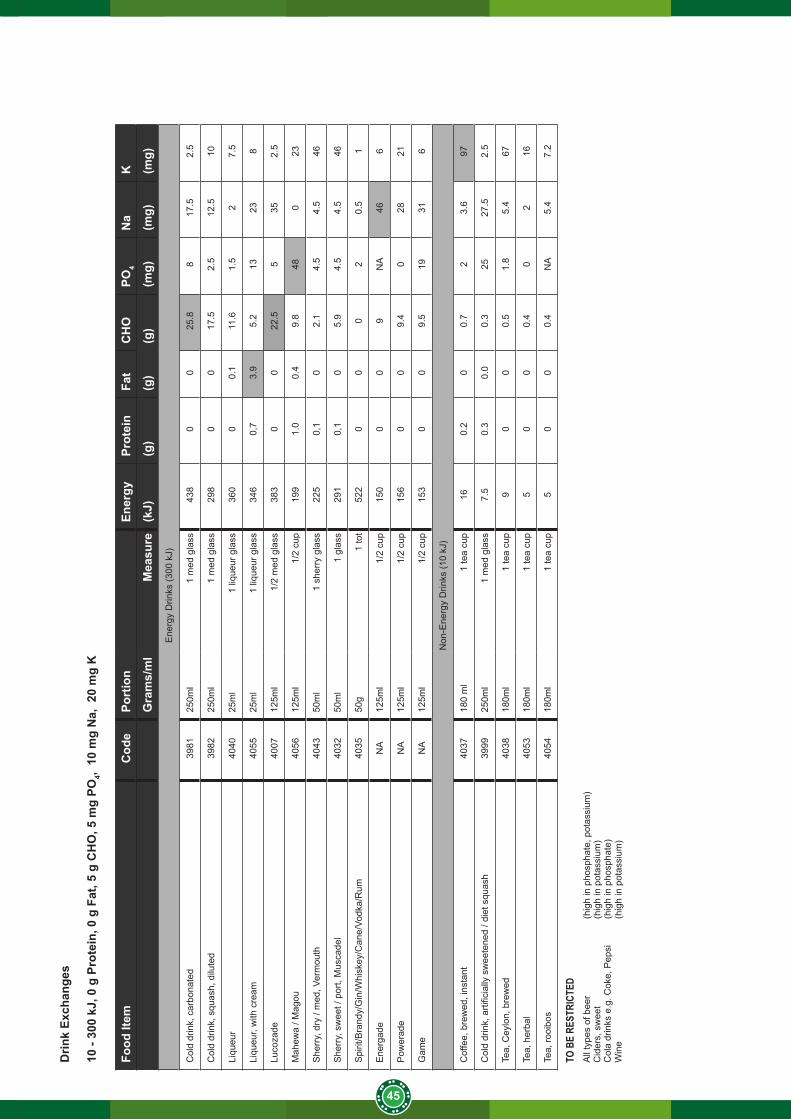
45
Drin
k Ex
chan
ges
10 -
300
kJ, 0
g P
rote
in, 0
g F
at, 5
g C
HO
, 5 m
g PO
4, 1
0 m
g N
a, 2
0 m
g K
Food
Item
Cod
ePo
rtio
n
Ener
gyPr
otei
nFa
tC
HO
PO4
Na
K
Gra
ms/
ml
Mea
sure
(kJ)
(g)
(g)
(g)
(mg)
(mg)
(mg)
Ene
rgy
Drin
ks (3
00 k
J)
Col
d dr
ink,
car
bona
ted
3981
250m
l1
med
gla
ss43
80
025
.88
17.5
2.5
Col
d dr
ink,
squ
ash,
dilu
ted
3982
250m
l1
med
gla
ss29
80
017
.52.
512
.510
Liqu
eur
4040
25m
l1
lique
ur g
lass
360
00.
111
.61.
52
7.5
Liqu
eur,
with
cre
am40
5525
ml
1 liq
ueur
gla
ss34
60,
73.
95.
213
238
Luco
zade
4007
125m
l1/
2 m
ed g
lass
383
00
22.5
535
2.5
Mah
ewa
/ Mag
ou40
5612
5ml
1/2
cup
199
1.0
0.4
9.8
480
23
She
rry,
dry
/ m
ed, V
erm
outh
40
4350
ml
1 sh
erry
gla
ss22
50,
10
2.1
4.5
4.5
46
She
rry,
sw
eet /
por
t, M
usca
del
4032
50m
l1
glas
s29
10,
10
5.9
4.5
4.5
46
Spi
rit/B
rand
y/G
in/W
hisk
ey/C
ane/
Vodk
a/R
um40
3550
g1
tot
522
00
02
0.5
1
Ene
rgad
eN
A12
5ml
1/2
cup
150
00
9N
A46
6
Pow
erad
eN
A12
5ml
1/2
cup
156
00
9.4
028
21
Gam
eN
A12
5ml
1/2
cup
153
00
9.5
1931
6
Non
-Ene
rgy
Drin
ks (1
0 kJ
)
Cof
fee,
bre
wed
, ins
tant
4037
180
ml
1 te
a cu
p16
0.2
00.
72
3.6
97
Col
d dr
ink,
arti
ficia
lly s
wee
tene
d / d
iet s
quas
h 39
9925
0ml
1 m
ed g
lass
7.5
0.3
0.0
0.3
2527
.52.
5
Tea,
Cey
lon,
bre
wed
4038
180m
l1
tea
cup
90
00.
51.
85.
467
Tea,
her
bal
4053
180m
l1
tea
cup
50
00.
40
216
Tea,
rooi
bos
4054
180m
l1
tea
cup
50
00.
4N
A5.
47.
2
TO B
E RE
STRI
CTED
All
type
s of
bee
r
(hig
h in
pho
spha
te, p
otas
sium
)C
ider
s, s
wee
t
(hig
h in
pot
assi
um)
Col
a dr
inks
e.g
. Cok
e, P
epsi
(h
igh
in p
hosp
hate
)W
ine
(h
igh
in p
otas
sium
)

46

National Department of Health Civitas Building Cnr Thabo Sehume and Struben StreetsPretoria0001
Switchboard: 012 395 8000