Embed Size (px)
Citation preview


NATIONAL REMOTE SENSING CENTRE
REPORT / DOCUMENT CONTROL SHEET
1. Security Classification Official
2. Distribution Official
3. Report / Document version (a) Issue no. One (b) Revision & Date
4. Report / Document Type Project Report
5. Document Control Number NRSC-RSAA-ERG-G&GD-OCT'-TR- 453
6. Title Okhimath landslides in 2012 - satellite based study
7. Particulars of collation
Pages
18
Figures
10
Tables
2
References
-
8. Author(s) Dr. K. Vinod Kumar and Dr. Tapas Ranjan Martha
9. Affiliation of authors Geosciences Division, RSA-A, NRSC
10. Scrutiny mechanism
Compiled/
Controlled by
Geosciences
Division
Reviewed by
Head,
Geosciences
Division
Approved by
DD (RSA-A)
11. Originating unit National Remote Sensing Centre (NRSC), Hyderabad
12. Sponsor(s) / Name and
Address Indian Space Research Organisation (ISRO)
13. Date of Initiation September 15, 2012
14. Date of Publication October 15, 2012
15.
Abstract (with Keywords): On September 14, 2012, large scale occurrence of landslides
is reported due to cloud burst around Okhimath area in the Rudraprayag district of
Uttarakhand state. This event resulted in death of 51 people and wide spread loss of
property. This report highlights results derived from the analysis of high resolution cloud
free satellite data acquired by ISRO and International Charter Space and Major Disasters
after the event.
Keywords: Okhimath, Damage, Landslide, Building, agricultural land, Disaster

i
Summary
Okhimath area in the Rudraprayag district of Uttarakhand state witnessed large scale
occurrence of landslides on 14 September 2012 due to cloudburst. This event resulted in
death of 51 people and significant loss to property. In this report, damage assessment results
of Okhimath landslides derived from the analysis of very high resolution (VHR) satellite data
such as Cartosat-2, Resourcesat-2 LISS-IV Mx, Kompsat-2 and GeoEye-1, are presented.
These datasets were acquired through a coordinated effort of ISRO and the International
Charter Space and Major Disasters. The landslide affected area being in inaccessible
Himalayan mountainous terrain, VHR data from these satellites provided an opportunity to
quickly view the terrain both spatially and temporally. The damage caused by the event was
assessed using visual change analysis technique through comparison of pre- and post-
landslide images. Villages such as Mangali, Chunni, Brahman Kholi, Semla, Paldwadi, Saari,
Giriyagaon are most affected in this event. Following are the summary of damage details
based on the VHR satellite data interpretation in and around Okhimath area.
No. of buildings damaged - 126
Agricultural land affected - 34.5 hectare
Road affected - 7.78 line km
No. of landslides occurred - 473

ii
Acknowledgements
This work was carried out under the Decision Support Centre (DSC) activities of NRSC. The
support by Dr. V. K. Dadhwal, Director, NRSC, Dr. P.G. Diwakar, Director, EOS, Dr. V.
Raghavaswamy, Deputy Director, RSA-A, NRSC, Dr. G. Sreenivas Rao, Head, DMSD,
NRSC and Dr. N. K. Srivastava, ISTRAC, is duly acknowledged. We thank International
Charter Space and Major Disasters, particularly CNES, DLR, USGS and KARI for providing
VHR satellite data for assessment of the landslide affected area for the Charter call 411. We
also thank Dr. N. Aparna, Head, PP&US, NDC, NRSC and Dr. R Nagaraja, Group Head,
NDC, NRSC for quick dissemination of IRS data for the analysis purpose.

Table of Contents
Page No.
Summary i
Acknowledgements ii
1. Introduction 1
2. Study area 2
2.1. Geological setting 3
3. Previous study by NRSC in Okhimath 3
4. Data sources 4
5. Methodology 5
5.1. Data processing 5
5.2. Data analysis 5
5.3. Semi-automatic detection of landslides 6
6. Results and Discussion 6
6.1. Building damage 6
6.2. Agricultural damage 9
6.3. Road damage 11
6.4. Landslide inventory 13
7. Dissemination of information 14
7.1. DSC Portal 15
7.2. Bhuvan Portal 16
7.3. NRSC Portal 16
8. Conclusion 16
9. References 17

1
1. Introduction
On 14 September 2012, a series of landslides triggered by heavy rain and cloudburst caused
large scale damage to the property and death of 51 people. Several people are still missing
and suspected to be buried under the debris (Fig 1). The villages that were most affected due
to this event include Chunni, Mangali, Giriyagaon, Brahman Kholi, Kimana, Semla, Barsal,
Paldwadi, Saari etc. Occurrence of landslides is not new in Okhimath area. In August 1998, a
total of 466 landslides were triggered by a major rainfall event, which killed 103 people and
damaged 47 villages in the entire Mandakini valley (Naithani, 2002). Some of the landslides
in the area are as much as a century old but permanently active.
Fig 1. Buildings affected by landslides in Okhimath area on 14 September 2012.
(Source: The Times of India)
In recent times, disaster support activities are becoming dependent on results derived
from satellite data analysis (Tralli et al., 2005; Voigt et al., 2007). This is primarily due to the
availability of large number Earth Observation satellites, and better coordination among
space faring nations to share data in emergency scenarios. Space-based data is particularly
more useful when a disaster occur in a mountainous area, which is mostly inaccessible.
Previously, NRSC has carried out similar damage assessment studies for landslides using
high resolution satellite data and aerial photographs such as the Varunawat landslide in
Uttarkashi in the year 2003 and landslides in Sikkim in the year 2011.
ISRO as a part of its disaster management support activities has programmed its
satellites on 14 September 2012 to acquire data over Okhimath area immediately after the

2
event. At the same time International Charter Space and Major Disasters (ICSMD) was
activated on 15 September 2012 to acquire data from other satellites over the landslide
affected region as more reports about the extent of the damage were received.
The main objective of this study is to carry out a rapid assessment of the landslide
affected areas around Okhimath using VHR data so that maps can be disseminated to support
disaster management activities. The assessment was mainly focussed on identifying damage
to roads, buildings, agricultural land and demarcating number of landslides triggered by the
cloudburst.
2. Study area
Okhimath is situated at an average elevation of 1300 m near the confluence of the Mandakini
and Madhyamaheshwar rivers (Fig.2). It is a place of pilgrim attraction due to the famous
Okhimath temple. Other important places near Okhimath are Guptkashi, Kalimath and
Chopta.
Fig 2. 3D synoptic view of the Mandakini valley around Okhimath. The yellow outline
corresponds to the area for which damage assessment was carried using VHR satellite data.

3
2.1. Geological setting
This area is very rugged with a high relative relief. Glacial landforms dominate this region,
but are frequently modified by denudational activity. Some of the glacial landforms (e.g.
moraines and solifluction lobes) with relatively gentle slopes have been converted into
terraces for cultivation. Being a tectonically active zone, structural landforms such as
escarpments and structurally controlled valleys are also found in this area. Lithological units
exposed in this area are granite gneisses, quartzite-sericite schist, quartzite, garnetiferous
mica schist, marble and occasional basic intrusives (Rawat and Rawat, 1998). The foliations
dip at moderate angles in NE to NNW directions. The main central thrust (MCT) dipping N
to NE directions is the cause of neo-tectonic activity in this region, and has caused significant
shearing of the rocks, rendering them vulnerable to landsliding. The soil in this area is
transported and composed of sub-angular rock fragments with high proportion of sandy to
sandy-silty matrix. However, small patches of silty and clayey soil, remnants of glacial
deposits, are also present (Rawat and Rawat, 1998).
3. Previous work by NRSC in Okhimath area
NRSC has carried out landslide hazard/susceptibility (LHZ) zonation studies in Okhimath on
1:25,000 scale as a part of the LHZ mapping project in the major tourists and pilgrim routes
in the states of Uttarakhand and Himachal Pradesh. These maps were prepared in the year
2001. Atlases consisting of these maps were provided to the district authorities. These maps
are also available in the NRSC website (http://dsc.nrsc.gov.in/DSC/Landslide/
Lanslide_hazard_Mapping.jsp). Figure 3 shows the LHZ map of parts of Okhimath wherein
the areas such as Chunni and Mangali villages, where maximum damage due to the landslide
reported this year, were demarcated as high and very hazard categories.

4
Fig 3. Landslide hazard zonation map of Okhimath area prepared in the year 2001. The debris
flow that buried the Chunni and Mangali villages has the source in the area that is demarcated
as high hazard.
4. Data sources
To assess damage caused by the landslide, ISRO has programmed its satellites to acquire
VHR images of Okhimath immediately after the event. But, due to high cloud cover, the
optical datasets could not be interpreted immediately. To avoid the cloud problem,
microwave data from TerraSAR-X, provided by German Aerospace Centre were analysed.
However, these microwave datasets could not be interpreted for damage assessment in this
area due to: i) unavailability of pre-earthquake microwave data with acquisition parameters
similar to the post-earthquake data, ii) high geometric distortion due to foreshortening and
layover effects, which is typical in steep terrains such as the Himalayas, and iii) difficulty in
characterising landslides from the back scatter images.

5
ISRO and other agencies of ICSMD continued their watch over Okhimath, and first
cloud free VHR data for this area were available on 19 September 2012 from Kompsat-2. On
20 September 2012, major part of the Okhimath was captured by Resourcesat-2 LISS-IV Mx.
A list of satellite data used for this event is provided in table 1. Several pre-earthquake
images from same satellites as listed in table 1 were also used during analysis.
Table 1 Satellite data used in the Okhimath landslide study.
Satellite Date of Acquisition Sensor type
(resolution) Source
Resourcesat-2 LISS-IV Mx 20 September 2012 Multispectral (5.8 m) ISRO
Cartosat-2 21 September 2012 Panchromatic (1 m) ISRO
GeoEye-1 19 September 2012
Panchromatic (38 cm)
Multispectral (1.5 m)
USGS
Kompsat-2 19 September 2012
Panchromatic (1 m)
Multispectral (4 m)
KARI
TerraSAR-X 16 September 2012 Microwave (4 m) DLR
5. Methodology
5.1. Data processing
Post-landslide GeoEye-1 images were orthorectified using the Cartosat-1 master data. Pan-
sharpening of VHR data was carried using Brovey transformation technique. For example,
pan-sharpening of the GeoEye-1 panchromatic image (38 cm) with its multispectral image
(1.5 m) resulted in a 38 cm (resolution) post-disaster colour image that provided information
about the damages those were intuitive and detailed.
5.2. Data analysis
A combination of panchromatic, multispectral, monoscopic and stereoscopic data were used
for image interpretation. Visual change analysis by comparing post-landslide images with the

6
pre-landslide images was mainly used to find landslide induced changes in the terrain. The
focus of the image interpretation was to find out the damage to roads, buildings and
agricultural land. ERDAS s/w was used mainly for image analysis.
5.3. Semi-automatic detection of landslides
Landslides were detected from post-landslide Resourcesat-2 LISS IV Mx images using a
semi-automatic technique developed by NRSC (Martha et al., 2010; Martha et al., 2011,
2012). Object-based image analysis using the eCognition s/w was carried out for this
purpose. Available Cartosat-1 DEM (10 m) and its second order derivatives such as hillshade,
relief and drainage network were used during the semi-automatic detection process. Initially
landslide candidates were identified through a NDVI threshold, and subsequently the false
positives such as river sand, barren land, build up area were eliminated sequentially using a
generic approach.
6. Results and discussion
Damage assessment using VHR data carried out and the landslide affected buildings, roads
and agricultural lands were identified. The damage assessment details are discussed
separately in the following sections. Figure 4 provides an overview of the affected area
around Okhimath.
6.1. Building damage
As per the news report, several buildings are destroyed by the landslides that have occurred in
the wee hours of 14 September 2012. The timing of the event has caused several deaths.
Image elements such as regular shape of the building, tone and association were used to
identify the damaged buildings. The building that were mostly damaged by the landslides or
buried under the debris was manually counted by comparing pre- and post-landslide GeoEye-
1 merged (38 cm) images. The damaged buildings in this report refer to the identification of
foot prints. It is difficult to provide any details if the foot print has more than one floor since
only monoscopic data were used for image interpretation. Table 2 lists no. of affected
buildings in some of the villages. Figure 5 shows the affected buildings in some of the
villages. Maximum damaged buildings were identified in the Mangali village (Fig 5A1).
Several villages in the Kakra Gad valley, a tributary to Mandakini river, area also affected.

7
As shown in the figure 5A2, a landslide has changed the course of the Madhyamaheshwar
river, due to which a Ashram located in the abandoned river bed was washed away. In almost
all the place it is observed that the buildings are affected due to the debris in the run-out zone
and source of the landslides are located in the far away upslope areas.
Fig. 4. Post-landslide Kompsat-2 (19-september-2012) false colour composite showing the
overview of the landslide affected area in Okhimath. Rectangles in yellow colour, highlights
the parts in which detail damage assessment results are shown in subsequent figures.

8
Table 2 No. of buildings damaged in villages
Sl. No. Village name No. of damaged buildings
1 Chunni 10
2 Mangali 32
3 Brahman Kholi 8
4 Barsal 5
5 Giriyagaon 3
6 Semla 12
7 Saari 4
8 Paldwadi 8
9 Pab 5
10 Others 39
Total 126
9
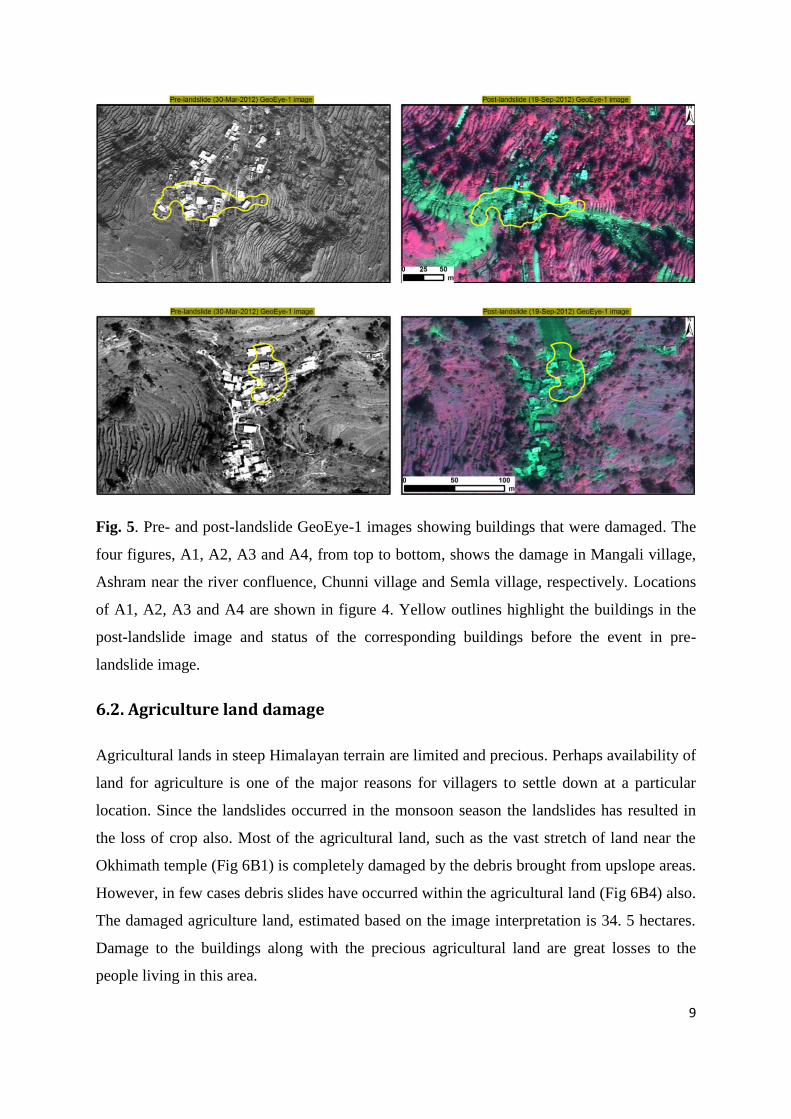
Fig. 5. Pre- and post-landslide GeoEye-1 images showing buildings that were damaged. The
four figures, A1, A2, A3 and A4, from top to bottom, shows the damage in Mangali village,
Ashram near the river confluence, Chunni village and Semla village, respectively. Locations
of A1, A2, A3 and A4 are shown in figure 4. Yellow outlines highlight the buildings in the
post-landslide image and status of the corresponding buildings before the event in pre-
landslide image.
6.2. Agriculture land damage
Agricultural lands in steep Himalayan terrain are limited and precious. Perhaps availability of
land for agriculture is one of the major reasons for villagers to settle down at a particular
location. Since the landslides occurred in the monsoon season the landslides has resulted in
the loss of crop also. Most of the agricultural land, such as the vast stretch of land near the
Okhimath temple (Fig 6B1) is completely damaged by the debris brought from upslope areas.
However, in few cases debris slides have occurred within the agricultural land (Fig 6B4) also.
The damaged agriculture land, estimated based on the image interpretation is 34. 5 hectares.
Damage to the buildings along with the precious agricultural land are great losses to the
people living in this area.

10
Fig. 6. Pre- and post-landslide GeoEye-1 images showing agricultural lands that were
damaged. The four figures, B1, B2, B3 and B4, from top to bottom shows the damage of

11
agricultural lands in north and south of Okhimath, Kimana village and Barsal village,
respectively. Locations of B1, B2, B3 and B4 are shown in figure 4. Yellow outlines
highlight the lands in the post-landslide image and status of the corresponding lands before
the event in pre-landslide image.
6.3. Road damage
Roads are only means transportation in Okhimath area. NH-109, from Rudraprayag to
Gaurikund, passing through this area was completely destroyed at several places. Figure 7C2
shows hair pin bends of NH-109 between Kund and Guptkashi was affected at several places.
Similarly, the road between Kund and Okhimath was affected at many places by the same
debris flow that has buried Mangali and Chunni villages. The road between Guptkashi and
Kalimath was completely destroyed (Fig 7C4) before the bridge over Mandakini river. The
same road was also affected at multiple places after the bridge. The road connecting
Okhimath to Chopta, a place popularly known was ‘mini switzerland’, was also affected at
multiple places by landslides (Fig 7C3). Based on satellite data interpretation, a road length
of 7.78 km was found to be affected by landslides in and around Okhimath area. Given the
extent of the damage to the roads, restoring the road network will be herculean task for the
district administration. However, sufficient care should be taken to restore the road so that the
natural slope is not destabilised much.

12
Fig. 7. Pre- and post-landslide GeoEye-1 images showing roads that were damaged. The four
figures, C1, C2, C3 and C4, from top to bottom shows the damage of roads between Kund

13
and Okhimath, Kund-Guptkashi, Okhimath-Chopta and Guptkashi-Kalimath, respectively.
Locations of C1, C2, C3 and C4 are shown in figure 4. Yellow outlines highlight the road in
the post-landslide image and status of the corresponding road before the event in pre-
landslide image.
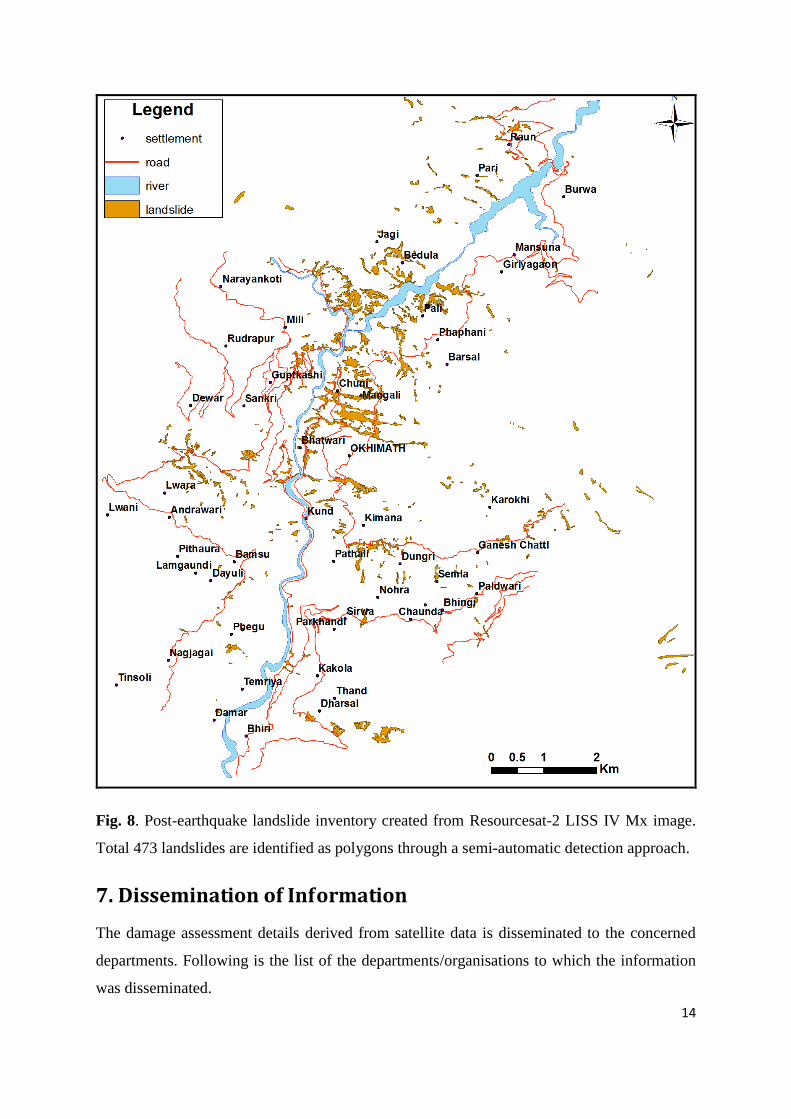
6.4. Landslide inventory
Demarcation of landslides as polygons manually is time consuming, particularly when
the no. of occurrences are high. Therefore, landslide locations were marked as points by
previous workers (Gorum et al. (2011) for the 2008 Wenchuan earthquake. However, for
mapping landslides as polygons, for event in Okhimath, a semi-automatic method developed
by NRSC was used. A total 473 new landslides were mapped using post-earthquake
Resourcesat-2 LISS IV Mx image (Fig. 8). Apart from satellite images the pre-landslides
Cartosat-1 DEM was also used in the detection process. Few false positives, such as built-up
area and barren land those could not be eliminated by this method were removed manually.
The semi-automatic method of landslide detection could produce the landslide inventory map
in a short time.
Most of the landslides are debris slide. However the largest landslide (north of
Okhimath) is a derbis flow which was initiated in the far upslope areas in an escarpment
region. This was initially a rock slide and subsequently became a debris flow as it gather
more material from the run-out path.
14
Fig. 8. Post-earthquake landslide inventory created from Resourcesat-2 LISS IV Mx image.
Total 473 landslides are identified as polygons through a semi-automatic detection approach.
7. Dissemination of Information
The damage assessment details derived from satellite data is disseminated to the concerned
departments. Following is the list of the departments/organisations to which the information
was disseminated.
15
National Disaster Management Authority (NDMA)
Geological Survey of India (GSI)
Ministry of Home Affairs (MHA)
Central Water Commission (CWC)
India Meteorological Department (IMD)
Disaster Management Mitigation Centre (DMMC), Uttarakhand
Uttarakhand Space Application Centre (USAC)
District Magistrate, Rudraprayag
In addition to above, the relevant information is hosted on the following websites.
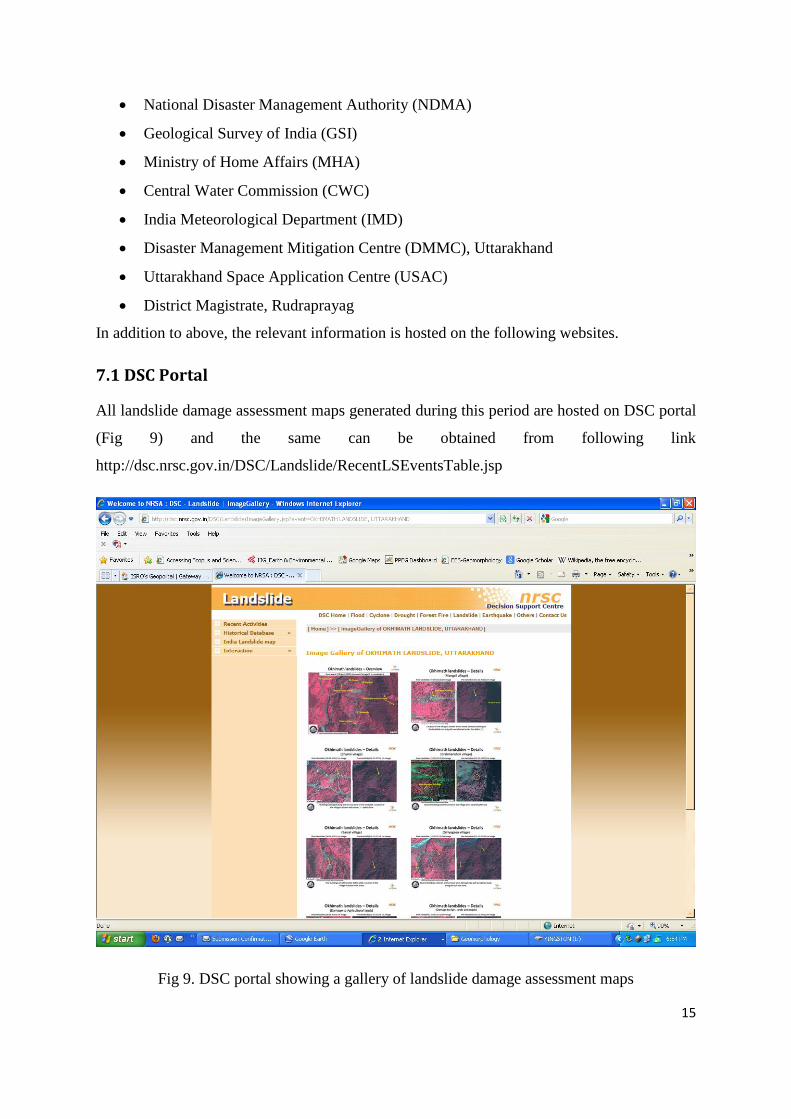
7.1 DSC Portal
All landslide damage assessment maps generated during this period are hosted on DSC portal
(Fig 9) and the same can be obtained from following link
http://dsc.nrsc.gov.in/DSC/Landslide/RecentLSEventsTable.jsp
Fig 9. DSC portal showing a gallery of landslide damage assessment maps

16
7.2 Bhuvan Portal
The landslide inventory layer in GIS format is hosted on Bhuvan portal and users can
visualize spatially the distribution of landslides in the Bhuvan portal. This can be obtained by
using "http://bhuvan.nrsc.gov.in"
7.3 NRSC Website
The damage assessment details were also hosted on NRSC website (www.nrsc.gov.in) (Fig
10).
Fig 10. NRSC website showing damage assessment details of Okhimath landslide affected
area.
8. Conclusions
This report highlights the importance of VHR images in a disaster situation. The main
contribution of the report is rapid assessment and quantification of the damage to the
buildings, road and agricultural land around Okhimath area. Acquisition of satellite images

17
under the coordinated effort ISRO and ICSMD was very helpful since the data for the
affected area was made available in short time, which helped in rapid assessment and quick
dissemination of results. GeoEye-1 was particularly useful in identifying the buildings that
were damaged by the landslides.
A total of 473 new landslides were mapped in the Okhimath area. The landslides are
mostly debris flow or debris slide. These landslides collectively damaged 126 building, 34.5
hectares of agricultural land and 7.78 km length of road. The results of damage assessment
shown in this report is based VHR satellite data interpretation. The damages (e.g. buildings,
roads and agricultural land) those are in the topographic shadow areas or covered by trees in
the image might have been missed during interpretation. Building damage in this report
mainly refers to the collapse of the roof top, either fully or partly. The buildings, those have
damaged walls and intact roof, which is possible due to the impact of boulders carried by
landslides, are not identifiable from satellite data interpretation. The use of semi-automatic
method was very useful for landslide inventory mapping. Resurcesat-2 LISS IV Mx data was
found to be very useful for this purpose. The areas where landslides occurred were already
demarcated as high hazard areas by the Atlas prepared by NRSC. Future development and
landslide restoration work should refer the Atlas.
Although, first results were disseminated shortly after receiving the cloud free optical
image, there was an initial delay in the information dissemination due to the non availability
of cloud free data. Nevertheless, the report presented a rapid and detail assessment of vastly
inaccessible areas in Sikkim which otherwise would have been difficult and time consuming.
9. References
Gorum, T., Fan, X., van Westen, C.J., Huang, R.Q., Xu, Q., Tang, C., & Wang, G. (2011).
Distribution Pattern of Earthquake-induced Landslides Triggered by the 12 May
2008 Wenchuan Earthquake. Geomorphology, 133, 152-167
Martha, T.R., Kerle, N., Jetten, V., van Westen, C.J., & Vinod Kumar, K. (2010).
Characterising spectral, spatial and morphometric properties of landslides for
automatic detection using object-oriented methods. Geomorphology, 116, 24-36
Martha, T.R., Kerle, N., van Westen, C.J., Jetten, V., & Vinod Kumar, K. (2011). Segment
Optimisation and Data-Driven Thresholding for Knowledge-Based Landslide

18
Detection by Object-Based Image Analysis. IEEE Transactions on Geoscience and
Remote Sensing, 49, 4928-4943
Martha, T.R., Kerle, N., van Westen, C.J., Jetten, V., & Vinod Kumar, K. (2012). Object-
oriented analysis of multi-temporal panchromatic images for creation of historical
landslide inventories. ISPRS Journal of Photogrammetry & Remote Sensing, 67,
105-119
Naithani, A.K. (2002). The August, 1998 Okhimath tragedy in Rudraprayag district of
Garhwal Himalaya, Uttaranchal, India. GAIA, 16, 145-156
Rawat, U.S., & Rawat, J.S. (1998). A report on geotechnical reconnaissance of the excessive
landsliding in August, 1998 near Okhimath, Rudraprayag district, U.P. Lucknow:
Technical report. Geological Survey of India, Northern Region
Tralli, D.M., Blom, R.G., Zlotnicki, V., Donnellan, A., & Evans, D.L. (2005). Satellite
remote sensing of earthquake, volcano, flood, landslide and coastal inundation
hazards. ISPRS Journal of Photogrammetry and Remote Sensing, 59, 185-198
Voigt, S., Kemper, T., Riedlinger, T., Kiefl, R., Scholte, K., & Mehl, H. (2007). Satellite
Image Analysis for Disaster and Crisis-Management Support. IEEE Transactions on
Geoscience and Remote Sensing, 45, 1520-1528