Embed Size (px)
Citation preview
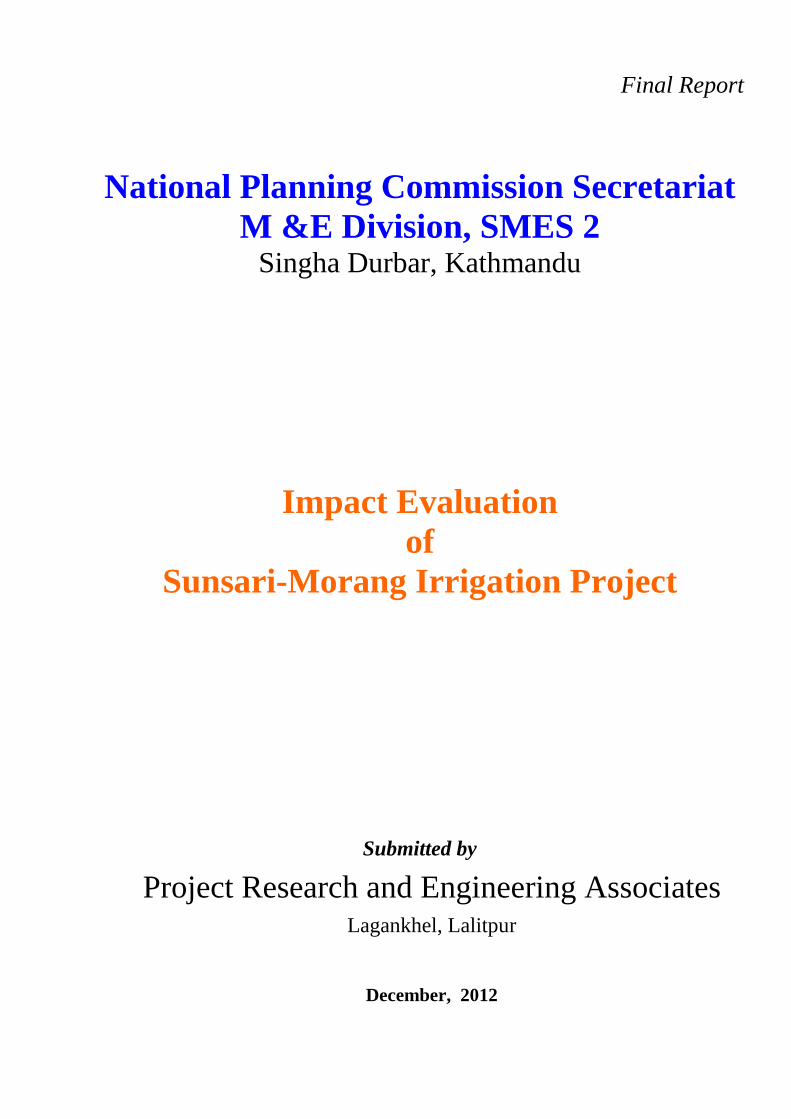
Final Report
National Planning Commission Secretariat M &E Division, SMES 2
Singha Durbar, Kathmandu
Impact Evaluation of
Sunsari-Morang Irrigation Project
Submitted by
Project Research and Engineering Associates Lagankhel, Lalitpur
December, 2012
ii
Contents
Preface Summary 1. Introduction ......................................................................................................................................... 1.1 Background of the Evaluation......................................................................................................... 1 1.2 Objective of the Impact Evaluation..................................................................................................3 1.3 Description of Evaluators ……………………………………....................................................... 4 1.4 Approach and Methodology of Impact Evaluation......................................................................... 4 -Qualitative Method -Quantitative Method -Triangulation Method 2. Basic Information of Sunsari Morang IrrigationProject .................................................................. 16 2.1 Background of SMIP ..................................................................................................................... 16
2.2 Objectives of SMIP........................................................................................................................18
2.3 Description of SMIP ...................................................................................................................... 18 2.4 Cost Invested of SMIP...................................................................................................................24 2.5 Plan and Achievement of SMIP .................................................................................................. .25 2.6 Comparative Investment of SMIP and MIP.................................................................................. 25 3. Evaluation Result 3.1 Relevance.......................................................................................................................................27 3.2 Effectiveness (Short-term/Direct effect)........................................................................................30 3.3 Impact (Long-term/Indirect effect)................................................................................................40 3.4 Efficiency (Cost-benefit comparison or narrative cost-efficiency)................................................51 3.5 Sustainability 3.5.1 Financial Aspect..........................................................................................................................51 3.5.2 Technical Aspect.........................................................................................................................52 3.5.3 Organizational Aspect.................................................................................................................57 3.5.4 Environmental Aspect.................................................................................................................59 3.5.5 Others .........................................................................................................................................61 3.6 Overall Conclusions ......................................................................................................................61 4. Recommendations 4.1 Recommendations for Future Policy-Planning..............................................................................64 4.2 Recommendations for Project Target............................................................................................64 4.3 Recommendations for Technical Aspect.......................................................................................65 4,4 Recommendations for Management Aspect..................................................................................65 4.3 Recommendation for Financial Aspect......... ...............................................................................66 Annexes
Annex I: Sample Questionnaire of Household Survey Annex II: Sample Checklist of Water User Association Annex III: Technical Sustainability Annex IV: Focused Group Discusssion Annex V: Key Informants Interviews Annex VI: Approved Post of SMIP Annex VII: ERR Calculation
Annex VIII: Sample Size of HH Survey
iii
List of Tables Table No. Page Table 1.1 : Phase Construction and Command Area of SMIP 3 Table 1.2 : Sample Size on Control Group 10 Table 1.3 : Focused group discussion in Study Areas 11 Table 2.1 : Population of Sunsari and Morang district 21 Table 2.2 : Cast/Ethnicity of Sampled HH 22 Table 2.3 : Family Size of Sample HH 22 Table 2.4 : Period of Living 23 Table 2.5 : Major Occupation Sampled HH 23 Table 2.6 : Food Sufficiency of Sampled HH 24 Table 2.7 : Cost Invested in SMIP 24 Table 2.8 : Plan and Achievement of the Project 25 Table 2.9: Comparative Investment of SMIP and MIP 25 Table 2.10: Comparative Budget of SMIP and MIP 26 Table 3.1 : Target of Interim Plan (Irrigation Sector) 27 Table 3.2 : Mean Productivity of Paddy, Wheat and Cash Crops (Overall) 31 Table 3.3 : Mean Productivity of Paddy Before and After (Overall) 33 Table 3.4 : Mean Productivity of Paddy case vs. control 33 Table 3.5 : Mean Productivity of Paddy before and after (Sunsari) 34 Table 3.6 : Mena Productivity of Paddy case vs. control (Sunsari) 34 Table 3.7 : Productivity of Paddy before and after (Morang) 35 Table 3.8 : Productivity of Paddy case vs. control (Morang) 35 Table 3.9 : Mean Productivity of Wheat (overall) 36 Table 3.10 : Mean Productivity of Wheat case vs. control 36 Table 3.11 : Productivity of Wheat before and after (Sunsari) 37 Table 3.12 : Productivity of Wheat case vs. control (Sunsari) 37 Table 3.13 : Productivity of Wheat before and after (Morang) 37 Table 3.14 : Wheat Productivity case vs. control (Morang) 38 Table 3.15 : Effect of Irrigation in cropping pattern case vs. control 39 Table 3.16 : Change in cropping intensity case vs. control 39 Table 3.17 : Comparative Analysis of SMIP and others 40 Table 3.18 : Income from agriculture case vs. control 41 Table 3.19 : Expenditure on Education case vs. control 42 Table 3.20 : Expenditure on Health services case vs. control 42 Table 3.21 : Expenditure on Durable household goods 43 Table 3.22 : Expenditure on construction/maintenance case vs. control 44 Table 3.23 : Investment of farm income 44 Table 3.24 : Effect of Irrigation on women’s drudgery on household works 45 Table 3.25 : Comparative study on cropping intensities 46 Table 3.26 : Comparative Crop budgeting of crops 47 Table 3.27 Comparative Crop budgeting of 2011/2012 48 Table 3 28 : Change in major crops Productivity 49 Table 3.29: Seasonal Crops Productivity 50 Table 3.30 : Level of Satisfaction of WUAs Work 50 Table 3.31 : Use of Service Roads 50 Table 3.32 : Financial Investment of SMIP 51 Table 3.33 : ISF Payment Status 52 Table 3.34 : Water Distribution in SMIP 52 Table 3.35 : Water Quantity Availability 53 Table 3.36 : Water measurement of various chainage and productivity 53 Table 3.37: Water Users Associations 58 Table 3.38 : Overall Evaluation Result of SMIP 62
iv
List of Charts
Chart Page
Chart 1 : Logical Model of SMIP 29 Chart 2 : Overall Productivity of major cereal and cash crops 31 Chart 3 : Productivity of Paddy (Overall) 32 Chart 4 : Productivity of Paddy (Sunsari) 33 Chart 5 : Productivity Paddy (Morang) 34 Chart 6 : Productivity of Wheat (Overall) 35 Chart 7 : Productivity of Wheat (Sunsari) 36 Chart 8 : Productivity of Wheat (Morang) 37 Chart 9 : Cropping Pattern 38 Chart 10 : Cropping Intensity of Agriculture Crops 39 Chart 11 : Increase in income from Agriculture Production 41 Chart 12 : Expenditure on Education 41 Chart 13 : Expenditure on Health Services 42 Chart 14 : Expenditure on Durable HH Goods 43 Chart 15 : Expenditure on Construction/Maintenance of Buildings 43 Chart 16 : Investment of Farm Income 44 Chart 17 : Women’s Drudgery on HH Works 45
v
ABBREVIATION AND ACRONYMS CA Command Area CAD Command Area Development CMC Chatara Main Canal DADO District Agriculture Development Office DDC District Development Committee DG Director General DOA Department of Agriculture DOI Department of Irrigation EEC European Economic Commission EER Economic Rate of Return FGD Focused Group Discussion FMIS Farmers Managed Irrigation System GDP Gross Domestic Product GOI Government of India GON Government of Nepal HR Head Regulator HRD Human Resource Development ICR Implementation Completion Report IDA International Development Association INGO International Non Governmental Organization IP Irrigation Policy IRR Internal Rate of Return ISF Irrigation Service Fee IWRMP Irrigation & Water Resources Management Project KII Key Informants Interview M & E Monitoring and Evaluation MOI Ministry of Irrigation MIS Management Information System MOU Memorandum of Understanding NEA Nepal Electricity Authority NPC National Planning Commission NPCS National Planning Commission Secretariat O &M Operation and Maintenance POE Panel of Experts RBME Result Based Monitoring and Evaluation RD Reduced Distance SAR Staff Appraisal Report SMES Strengthening the Monitoring & Evaluation System SMHP Sunsari Morang Headworks Project SMIDB Sunsari Morang Irrigation Development Board SMIP Sunsari Morang Irrigation Project TOR Terms of Reference WB World Bank WUA Water Users Association WUC Water Users Committee WUCC Water Users Coordination Committee WUCCC Water Users Central Coordination Committee WUG Water Users Group
vi
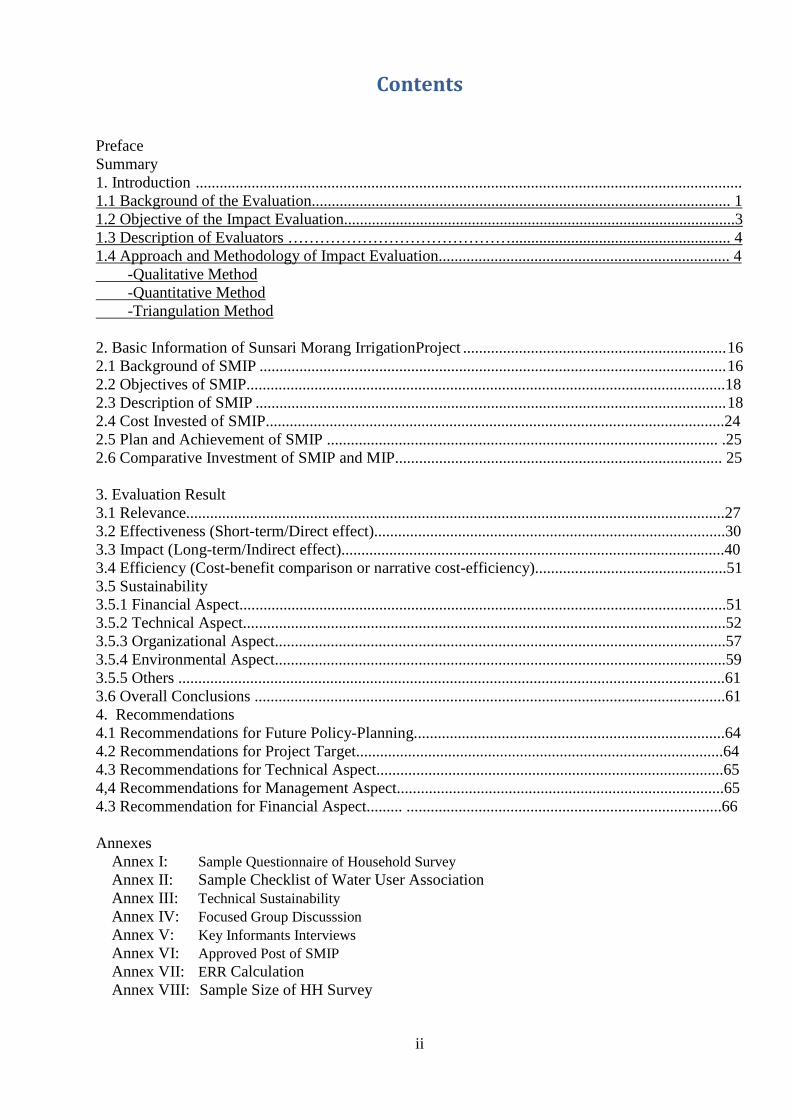
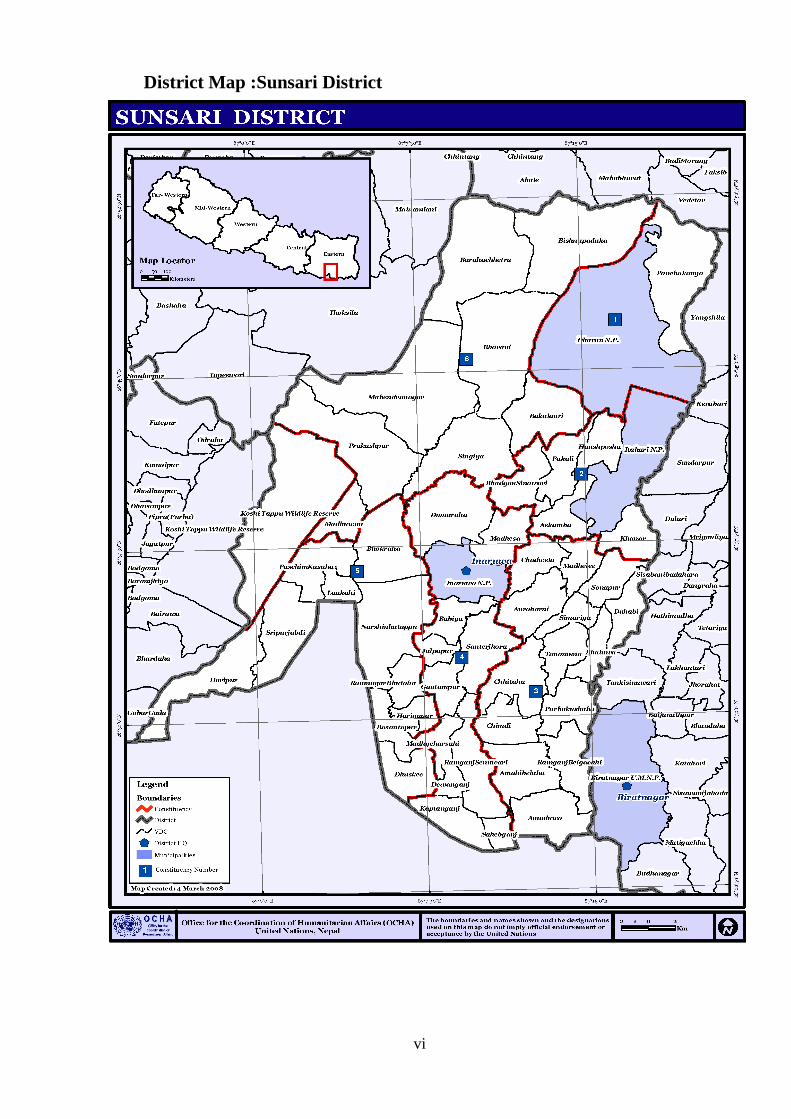
District Map :Sunsari District
vii
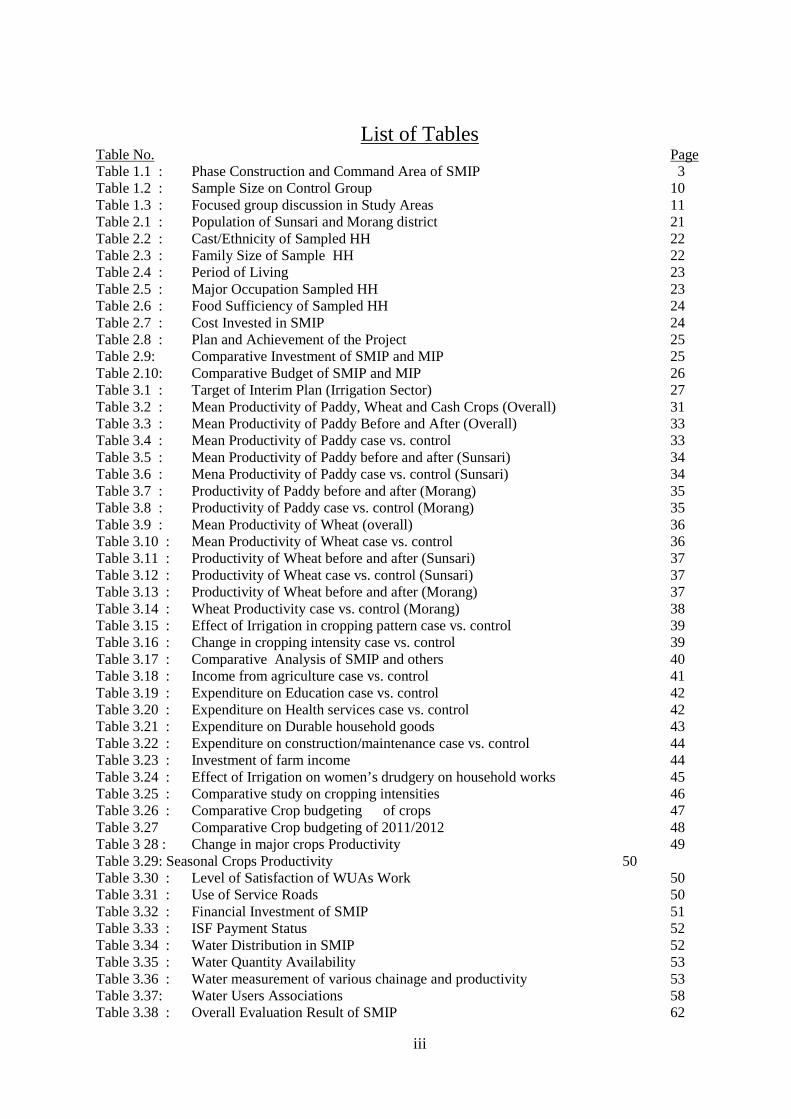
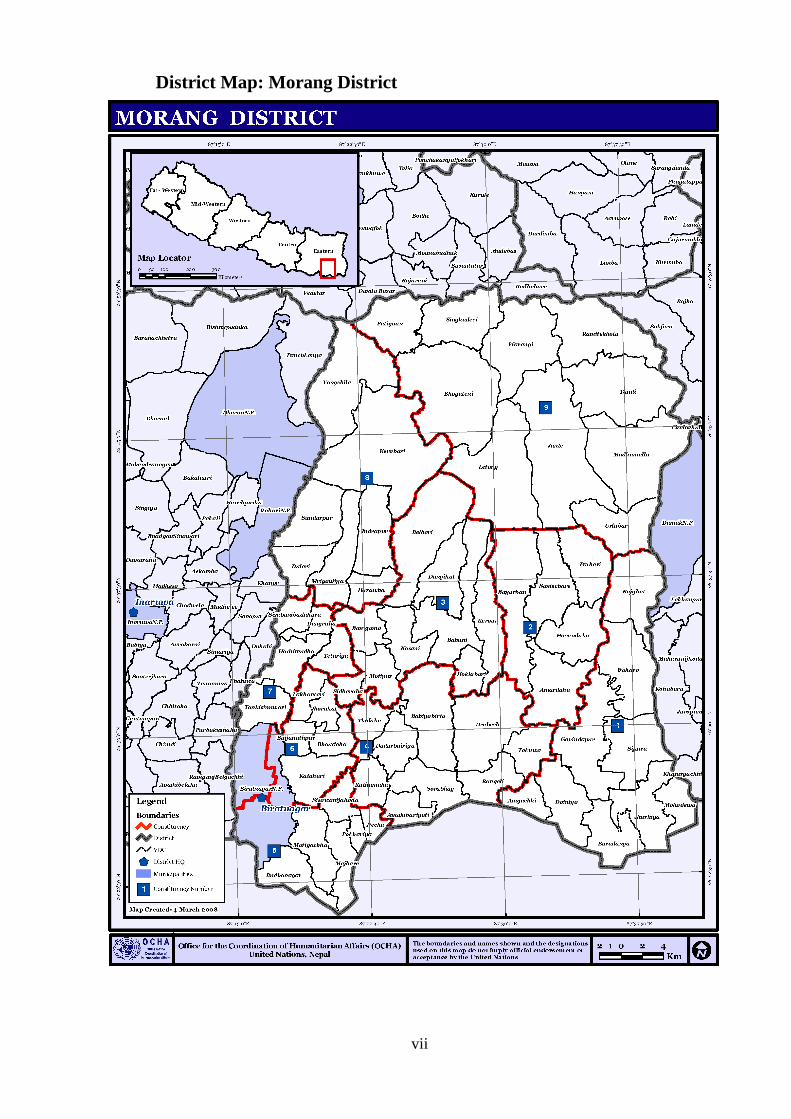
District Map: Morang District
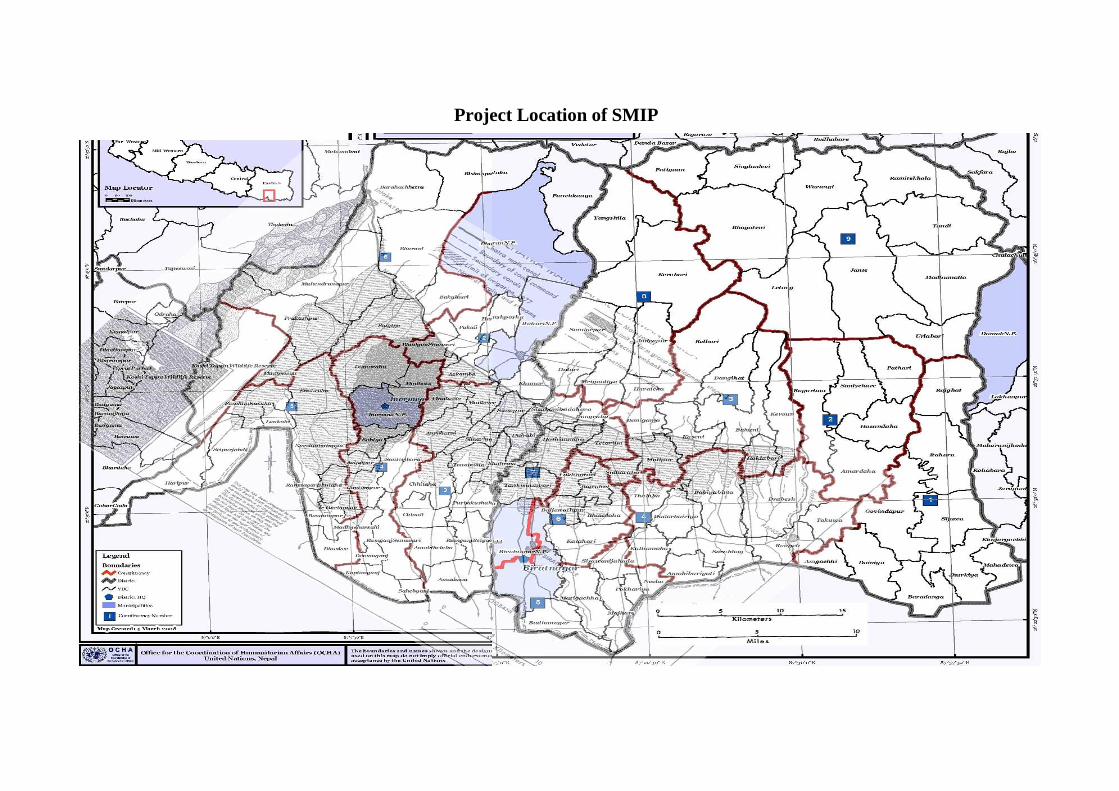
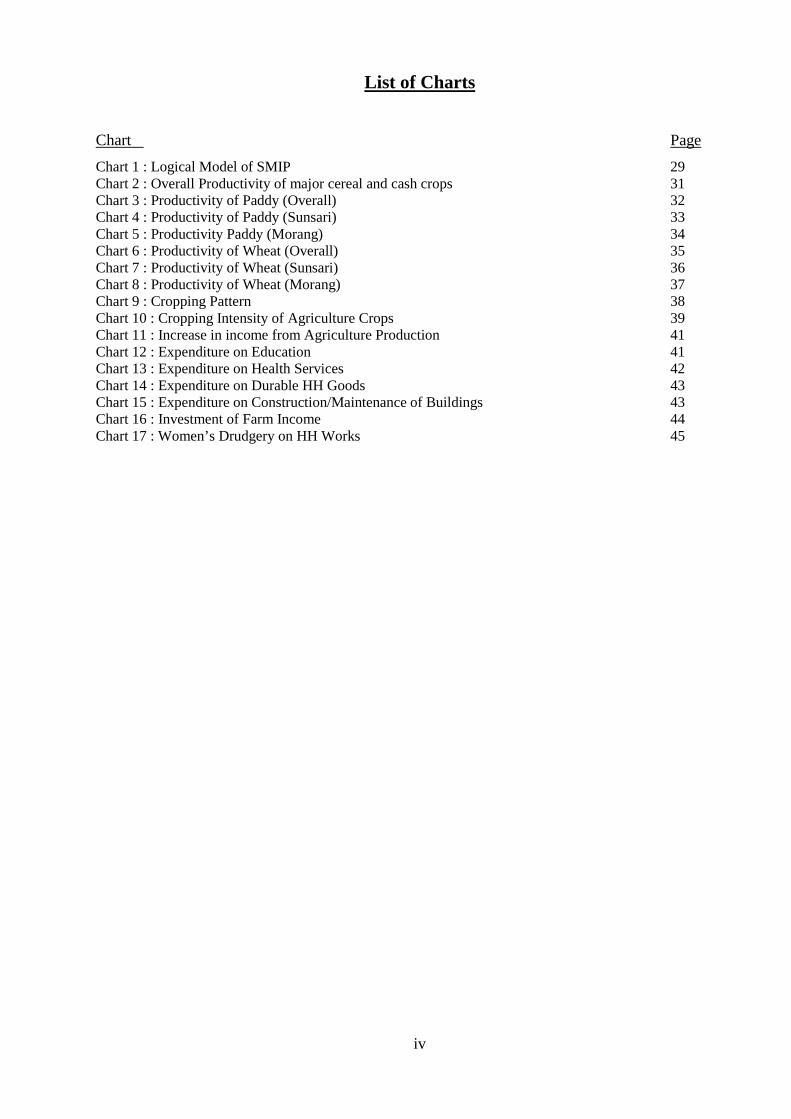
Project Location of SMIP
ix
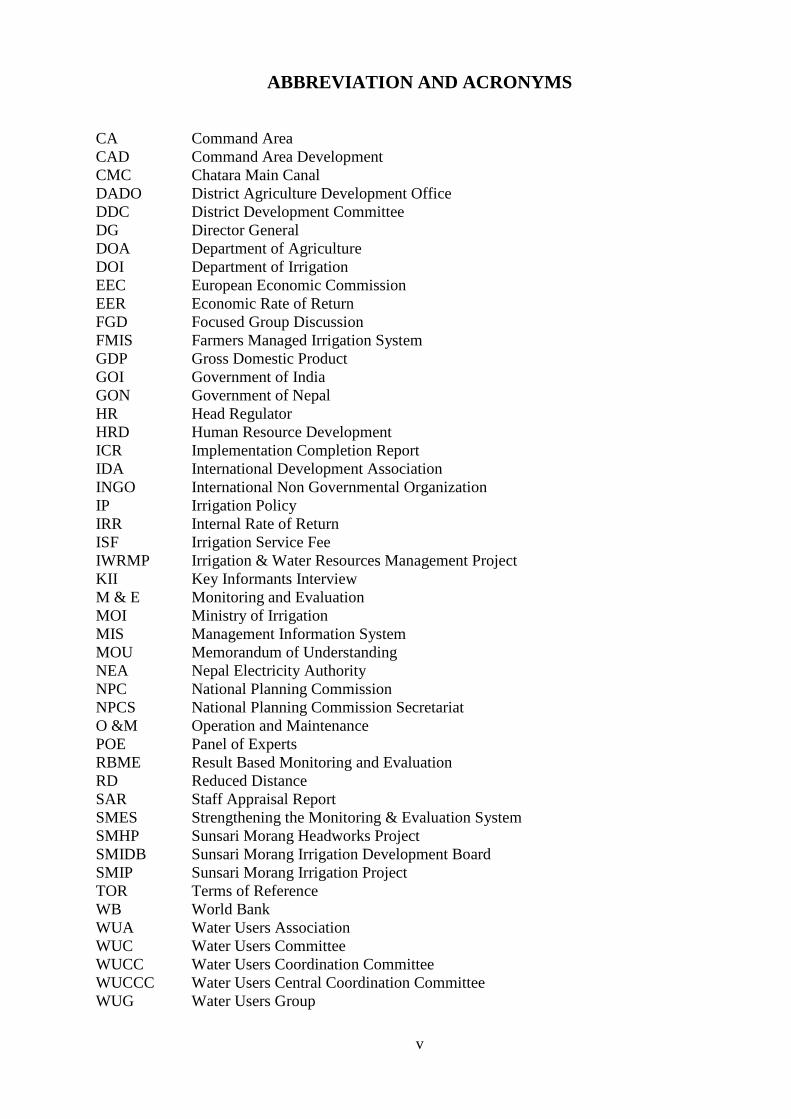
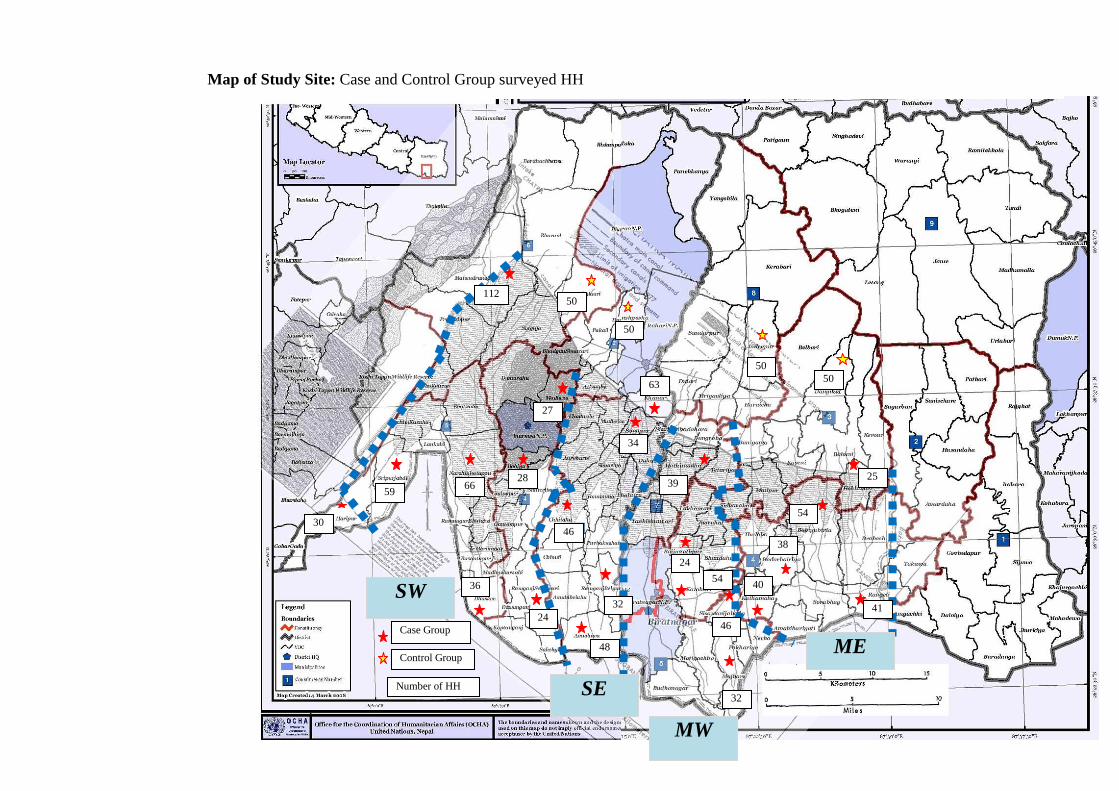
Map of Study Site: Case and Control Group surveyed HH
SW
SE
MW
ME
50 50
50
50
54
38
41
25
40
24
39
36
32
46
48
46
63
54
34
28
32
30
27
112
666
24
59
Number of HH
Case Group
Control Group
x
Preface Sunsari- Morang Irrigation Project (SMIP) is one of the largest irrigation projects of Nepal that covers 68000 ha. of arable land in Sunsari and Morang districts. National Planning Commission Secretariat (NPCS) assigned a task to conduct an impact evaluation study of SMIP to PRENA under the technical and financial support of SMES 2 during 2012. An evaluation team comprising engineers, agronomist and socio-economist carried out an impact study of SMIP. Studies were focused mainly on the prescribed indicators of the project like relevance, effectiveness, impact, efficiency and sustainability. While conducting the studies special attention were also given to the SMIPs physical, socio-economic and technical dimensions. Conclusions and recommendation were made to improve the level of management of SMIP and to formulate the future plan of similar irrigation projects in the country. We extend our sincere appreciation for the support by Mr. TeerthaDhakal, Joint Secretary, NPCS, Mr. Sushil C. Tiwari, Joint Secretary, MOI and Mr. Kamal Regmi Joint Secretary, MOI, Mr. Khom Raj Dahal DG, DOI and Dr Ryo Sasaki, Team Leader, SMES 2, NPCS. We are also thankful to Mr. Pashupati P. Bhandari, Under Secretary of NPCS, Mr. P. Maskey, SDE of MOI, S.D.H.G Mr. NirShakya of MOI, Mr. BadriDahal, Planning Officer (Eastern Regional Agriculture Directorate), Mr. ManojYadav, DADO (Morang), Mr. K.P. Dawadi DADO (Sunsari) for their valuable support while carrying out the study. Similarly, we are grateful to Mrs. IndraKumariThapaliya, Planning Officer NPCS, and KhagendraSubbha, PC SMES-2 and Mr. Bhim Kumar Shrestha, PO SMES-2 for their valuable support in filed work with us and to give fine shape of the study. We are also indebted to Mr. P.K. Shahi, Project Manager, Mr. S.N. Yadav, SDE and all concerned field and station based staffs of SMIP for their cooperation throughout the study period. We would like to heart full gratitude to Mr. ArjunNarsingRayamajhi, Team Leader, Dr. Kiran Joshi, Agri-economist, Mr. Tika B. Karki, Senior Agronomist and HemantaKharel, socio economist for their meticulous and timely help bestowed throughout the course of study in the preparation of this manuscript. We owe profound thanks to Mr. Ram P. Meheta, the Chairman and other committee members of WUCCC, beneficiaries and civil societies, political parties who selflessly helped while carrying out the field studies and preparing the report.
Project Research and Engineering Associates
xi
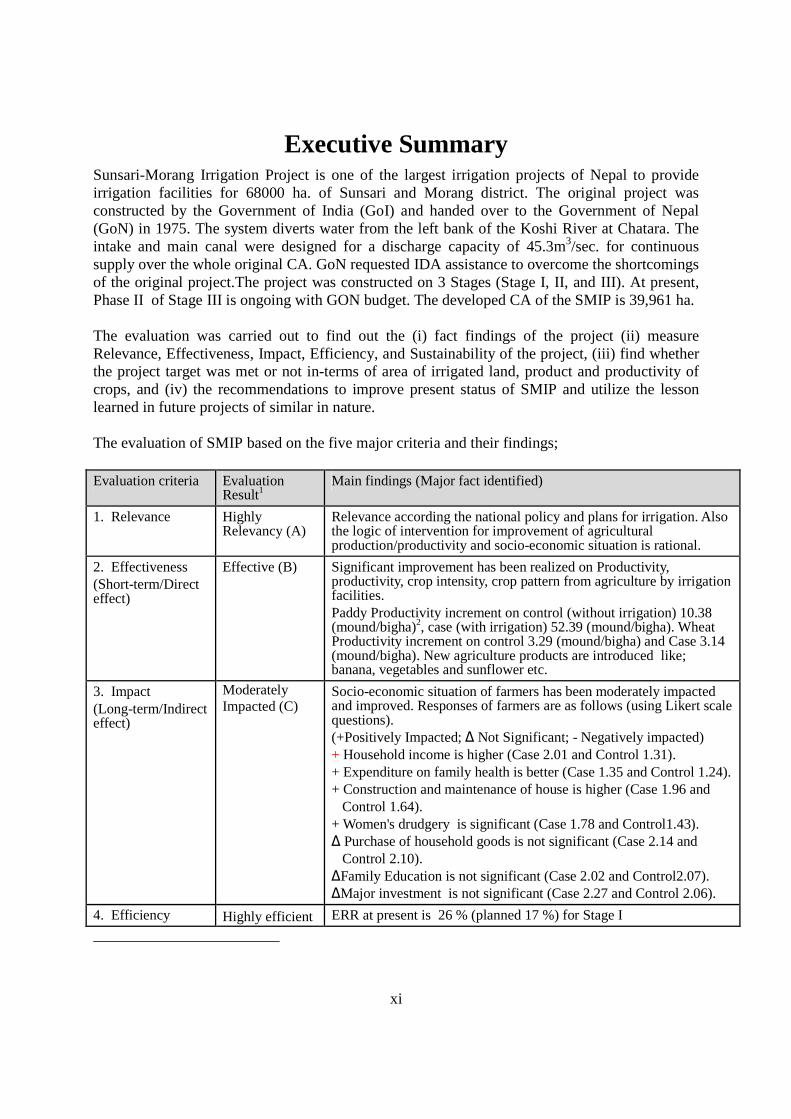
Executive Summary Sunsari-Morang Irrigation Project is one of the largest irrigation projects of Nepal to provide irrigation facilities for 68000 ha. of Sunsari and Morang district. The original project was constructed by the Government of India (GoI) and handed over to the Government of Nepal (GoN) in 1975. The system diverts water from the left bank of the Koshi River at Chatara. The intake and main canal were designed for a discharge capacity of 45.3m3/sec. for continuous supply over the whole original CA. GoN requested IDA assistance to overcome the shortcomings of the original project.The project was constructed on 3 Stages (Stage I, II, and III). At present, Phase II of Stage III is ongoing with GON budget. The developed CA of the SMIP is 39,961 ha. The evaluation was carried out to find out the (i) fact findings of the project (ii) measure Relevance, Effectiveness, Impact, Efficiency, and Sustainability of the project, (iii) find whether the project target was met or not in-terms of area of irrigated land, product and productivity of crops, and (iv) the recommendations to improve present status of SMIP and utilize the lesson learned in future projects of similar in nature. The evaluation of SMIP based on the five major criteria and their findings; Evaluation criteria Evaluation
Result1 Main findings (Major fact identified)
1. Relevance
Highly Relevancy (A)
Relevance according the national policy and plans for irrigation. Also the logic of intervention for improvement of agricultural production/productivity and socio-economic situation is rational.
2. Effectiveness (Short-term/Direct effect)
Effective (B) Significant improvement has been realized on Productivity, productivity, crop intensity, crop pattern from agriculture by irrigation facilities. Paddy Productivity increment on control (without irrigation) 10.38 (mound/bigha)2, case (with irrigation) 52.39 (mound/bigha). Wheat Productivity increment on control 3.29 (mound/bigha) and Case 3.14 (mound/bigha). New agriculture products are introduced like; banana, vegetables and sunflower etc.
3. Impact (Long-term/Indirect effect)
Moderately Impacted (C)
Socio-economic situation of farmers has been moderately impacted and improved. Responses of farmers are as follows (using Likert scale questions). (+Positively Impacted; ∆ Not Significant; - Negatively impacted) + Household income is higher (Case 2.01 and Control 1.31). + Expenditure on family health is better (Case 1.35 and Control 1.24). + Construction and maintenance of house is higher (Case 1.96 and Control 1.64). + Women's drudgery is significant (Case 1.78 and Control1.43). ∆ Purchase of household goods is not significant (Case 2.14 and Control 2.10). ∆Family Education is not significant (Case 2.02 and Control2.07). ∆Major investment is not significant (Case 2.27 and Control 2.06).
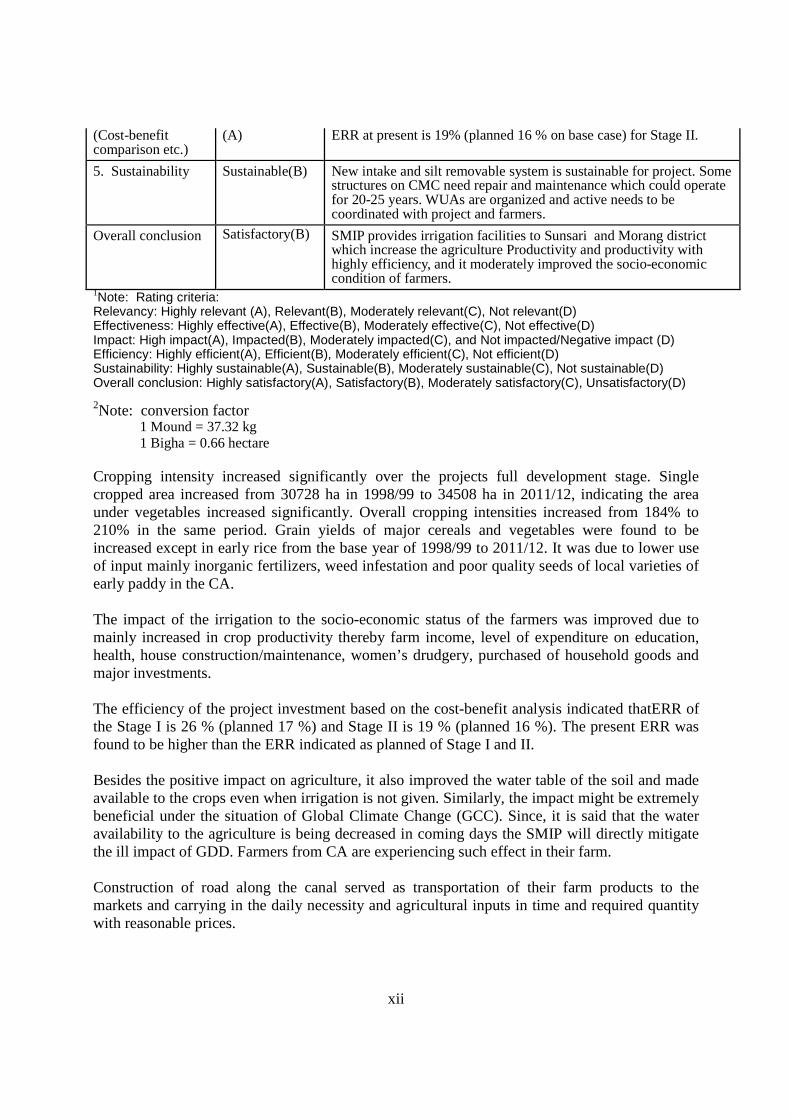
4. Efficiency Highly efficient ERR at present is 26 % (planned 17 %) for Stage I
xii
(Cost-benefit comparison etc.)
(A) ERR at present is 19% (planned 16 % on base case) for Stage II.
5. Sustainability Sustainable(B) New intake and silt removable system is sustainable for project. Some structures on CMC need repair and maintenance which could operate for 20-25 years. WUAs are organized and active needs to be coordinated with project and farmers.
Overall conclusion Satisfactory(B)
SMIP provides irrigation facilities to Sunsari and Morang district which increase the agriculture Productivity and productivity with highly efficiency, and it moderately improved the socio-economic condition of farmers.
1Note: Rating criteria: Relevancy: Highly relevant (A), Relevant(B), Moderately relevant(C), Not relevant(D) Effectiveness: Highly effective(A), Effective(B), Moderately effective(C), Not effective(D) Impact: High impact(A), Impacted(B), Moderately impacted(C), and Not impacted/Negative impact (D) Efficiency: Highly efficient(A), Efficient(B), Moderately efficient(C), Not efficient(D) Sustainability: Highly sustainable(A), Sustainable(B), Moderately sustainable(C), Not sustainable(D) Overall conclusion: Highly satisfactory(A), Satisfactory(B), Moderately satisfactory(C), Unsatisfactory(D) 2Note: conversion factor 1 Mound = 37.32 kg 1 Bigha = 0.66 hectare Cropping intensity increased significantly over the projects full development stage. Single cropped area increased from 30728 ha in 1998/99 to 34508 ha in 2011/12, indicating the area under vegetables increased significantly. Overall cropping intensities increased from 184% to 210% in the same period. Grain yields of major cereals and vegetables were found to be increased except in early rice from the base year of 1998/99 to 2011/12. It was due to lower use of input mainly inorganic fertilizers, weed infestation and poor quality seeds of local varieties of early paddy in the CA. The impact of the irrigation to the socio-economic status of the farmers was improved due to mainly increased in crop productivity thereby farm income, level of expenditure on education, health, house construction/maintenance, women’s drudgery, purchased of household goods and major investments. The efficiency of the project investment based on the cost-benefit analysis indicated thatERR of the Stage I is 26 % (planned 17 %) and Stage II is 19 % (planned 16 %). The present ERR was found to be higher than the ERR indicated as planned of Stage I and II. Besides the positive impact on agriculture, it also improved the water table of the soil and made available to the crops even when irrigation is not given. Similarly, the impact might be extremely beneficial under the situation of Global Climate Change (GCC). Since, it is said that the water availability to the agriculture is being decreased in coming days the SMIP will directly mitigate the ill impact of GDD. Farmers from CA are experiencing such effect in their farm. Construction of road along the canal served as transportation of their farm products to the markets and carrying in the daily necessity and agricultural inputs in time and required quantity with reasonable prices.
xiii
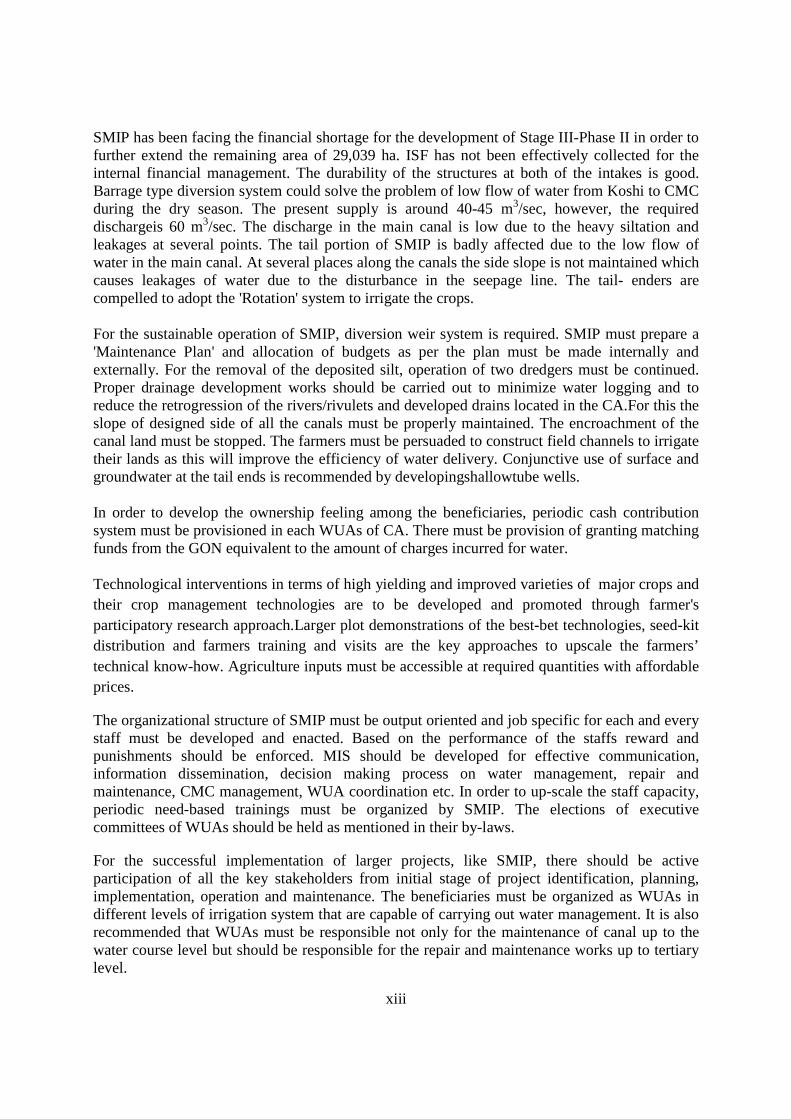
SMIP has been facing the financial shortage for the development of Stage III-Phase II in order to further extend the remaining area of 29,039 ha. ISF has not been effectively collected for the internal financial management. The durability of the structures at both of the intakes is good. Barrage type diversion system could solve the problem of low flow of water from Koshi to CMC during the dry season. The present supply is around 40-45 m3/sec, however, the required dischargeis 60 m3/sec. The discharge in the main canal is low due to the heavy siltation and leakages at several points. The tail portion of SMIP is badly affected due to the low flow of water in the main canal. At several places along the canals the side slope is not maintained which causes leakages of water due to the disturbance in the seepage line. The tail- enders are compelled to adopt the 'Rotation' system to irrigate the crops. For the sustainable operation of SMIP, diversion weir system is required. SMIP must prepare a 'Maintenance Plan' and allocation of budgets as per the plan must be made internally and externally. For the removal of the deposited silt, operation of two dredgers must be continued. Proper drainage development works should be carried out to minimize water logging and to reduce the retrogression of the rivers/rivulets and developed drains located in the CA.For this the slope of designed side of all the canals must be properly maintained. The encroachment of the canal land must be stopped. The farmers must be persuaded to construct field channels to irrigate their lands as this will improve the efficiency of water delivery. Conjunctive use of surface and groundwater at the tail ends is recommended by developingshallowtube wells. In order to develop the ownership feeling among the beneficiaries, periodic cash contribution system must be provisioned in each WUAs of CA. There must be provision of granting matching funds from the GON equivalent to the amount of charges incurred for water. Technological interventions in terms of high yielding and improved varieties of major crops and their crop management technologies are to be developed and promoted through farmer's participatory research approach.Larger plot demonstrations of the best-bet technologies, seed-kit distribution and farmers training and visits are the key approaches to upscale the farmers’ technical know-how. Agriculture inputs must be accessible at required quantities with affordable prices.
The organizational structure of SMIP must be output oriented and job specific for each and every staff must be developed and enacted. Based on the performance of the staffs reward and punishments should be enforced. MIS should be developed for effective communication, information dissemination, decision making process on water management, repair and maintenance, CMC management, WUA coordination etc. In order to up-scale the staff capacity, periodic need-based trainings must be organized by SMIP. The elections of executive committees of WUAs should be held as mentioned in their by-laws.
For the successful implementation of larger projects, like SMIP, there should be active participation of all the key stakeholders from initial stage of project identification, planning, implementation, operation and maintenance. The beneficiaries must be organized as WUAs in different levels of irrigation system that are capable of carrying out water management. It is also recommended that WUAs must be responsible not only for the maintenance of canal up to the water course level but should be responsible for the repair and maintenance works up to tertiary level.
1
Chapter I
Introduction
1.1 Background of the Impact Evaluation
Nepal is predominantly an agricultural country that provides employment of 2/3rd of the people and contributes 34.9 percent of GDP (Economic Survey, 2010/11). Until 1980, Nepal used to export surplus food grains. However, in recent years, due to ever increasing population growth and static in productivity of major agricultural crops many of the districts are under acute food deficit. Static or meager increase in production and productivities major crops in Nepal were mainly due to decline soil fertility, poor access of irrigation, poor or no adoption of improved agricultural technologies (varieties, breads and management) along with inappropriate government policies. Of the all factors of productivity, irrigation plays the vital role and at present of the total cultivated area of 2642000 ha. 2/3rd of is potentially irrigable, however, only 17 % area has year round irrigation. About 4/5th of the agriculture land is under rain fed conditions. An estimate shows that < 8% of the country's water potential is used for irrigation (WECS, 2011). The crops productivity under rainfed is fairly low as compared to irrigated. Under such condition, increase of area under irrigation through new projects or efficiency of existing projects need to be improved. Of the few irrigation projects, SMIP has been one of the largest projects so far in the country. The Project was started in 1978 and completed its three stages in 2002. The developed command area is 39,961 hectare (Status Report of SMIP, 2069). At present the second stage of the third phase is ongoing. Now the Project is funded by Government of Nepal and only maintenance works are carried out. The main objectives of the Project were to ensure reliable and equitable water supply, to protect the system from siltation, to improve operation and maintenance procedures with beneficiary participation, to strengthen local capacity through trainings and finally to strengthen linkages between the Department of Agriculture and Department of Irrigation.
Every year Government of Nepal is allocating a substantial amount of budget for several high priority projects. Sunsari-Morang Irrigation Project is one of the recipients of the budget from last 15 years. Further expansion of command area depends from its operation, effectiveness, sustainability and other relevant impacts.
With the introduction of Result Based Monitoring and Evaluation (RBME) guideline, National Planning Commission has started evaluation of high priority and peoples concerned program from independent consulting firms. For future planning of the Sunsari-Morang Irrigation Project, NPC is intended to assess the impact of the Project on agricultural production, employment generation, relevancy, efficiency, sustainability, effectiveness and others aspects. The Ground Water Irrigation Schemes, Farmers Managed Irrigation Systems and other tradtional irrigation
2
systemsare not considered for evaluation works.The results of the evaluation help for future investment and adaption of necessary policies.
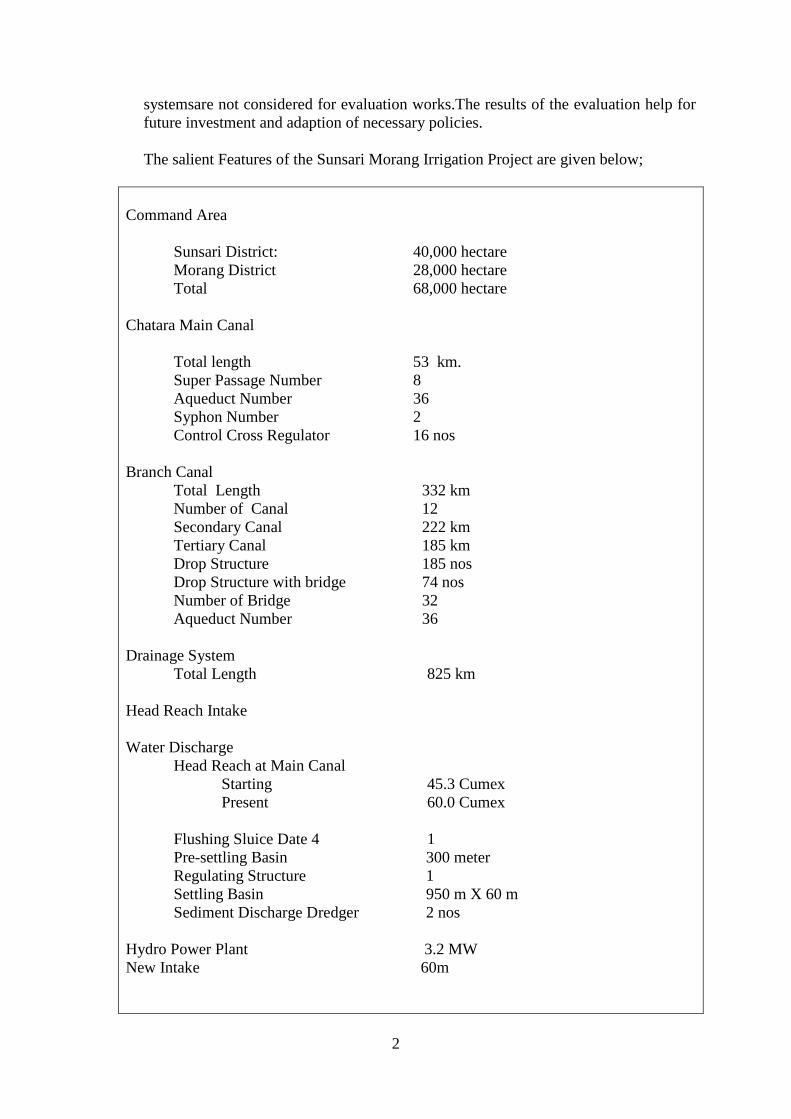
The salient Features of the Sunsari Morang Irrigation Project are given below;
Command Area Sunsari District: 40,000 hectare Morang District 28,000 hectare Total 68,000 hectare Chatara Main Canal Total length 53 km. Super Passage Number 8 Aqueduct Number 36 Syphon Number 2 Control Cross Regulator 16 nos Branch Canal
Total Length 332 km Number of Canal 12 Secondary Canal 222 km Tertiary Canal 185 km Drop Structure 185 nos Drop Structure with bridge 74 nos Number of Bridge 32 Aqueduct Number 36
Drainage System
Total Length 825 km Head Reach Intake Water Discharge
Head Reach at Main Canal Starting 45.3 Cumex Present 60.0 Cumex
Flushing Sluice Date 4 1 Pre-settling Basin 300 meter Regulating Structure 1 Settling Basin 950 m X 60 m Sediment Discharge Dredger 2 nos
Hydro Power Plant 3.2 MW New Intake 60m
3
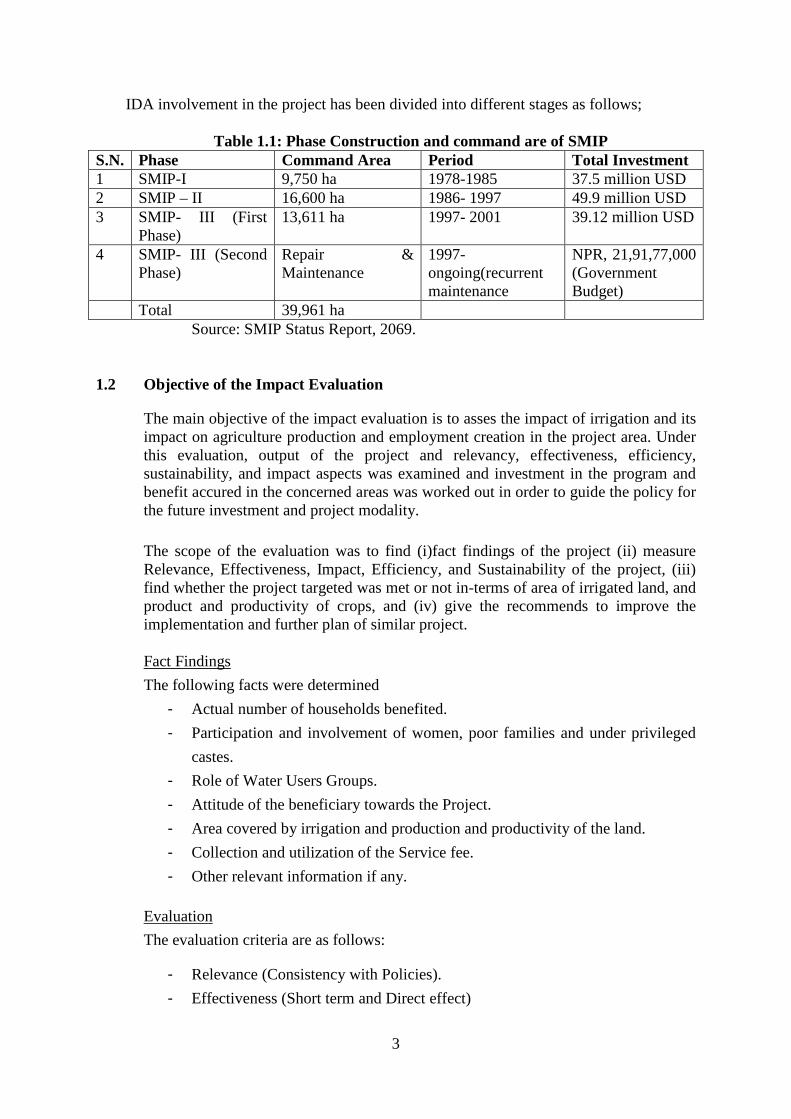
IDA involvement in the project has been divided into different stages as follows;
Table 1.1: Phase Construction and command are of SMIP S.N. Phase Command Area Period Total Investment 1 SMIP-I 9,750 ha 1978-1985 37.5 million USD 2 SMIP – II 16,600 ha 1986- 1997 49.9 million USD 3 SMIP- III (First
Phase) 13,611 ha 1997- 2001 39.12 million USD
4 SMIP- III (Second Phase)
Repair & Maintenance
1997-ongoing(recurrent maintenance
NPR, 21,91,77,000 (Government Budget)
Total 39,961 ha Source: SMIP Status Report, 2069.
1.2 Objective of the Impact Evaluation
The main objective of the impact evaluation is to asses the impact of irrigation and its impact on agriculture production and employment creation in the project area. Under this evaluation, output of the project and relevancy, effectiveness, efficiency, sustainability, and impact aspects was examined and investment in the program and benefit accured in the concerned areas was worked out in order to guide the policy for the future investment and project modality.
The scope of the evaluation was to find (i)fact findings of the project (ii) measure Relevance, Effectiveness, Impact, Efficiency, and Sustainability of the project, (iii) find whether the project targeted was met or not in-terms of area of irrigated land, and product and productivity of crops, and (iv) give the recommends to improve the implementation and further plan of similar project.
Fact Findings
The following facts were determined
- Actual number of households benefited.
- Participation and involvement of women, poor families and under privileged
castes.
- Role of Water Users Groups.
- Attitude of the beneficiary towards the Project.
- Area covered by irrigation and production and productivity of the land.
- Collection and utilization of the Service fee.
- Other relevant information if any.
Evaluation
The evaluation criteria are as follows:
- Relevance (Consistency with Policies).
- Effectiveness (Short term and Direct effect)
4
- Impact (Long term and Indirect effect).
- Sustainability (Financial, Technical, Organizational arrangement and Environmental aspects).
- Overall conclusion (integration of five evaluation results)
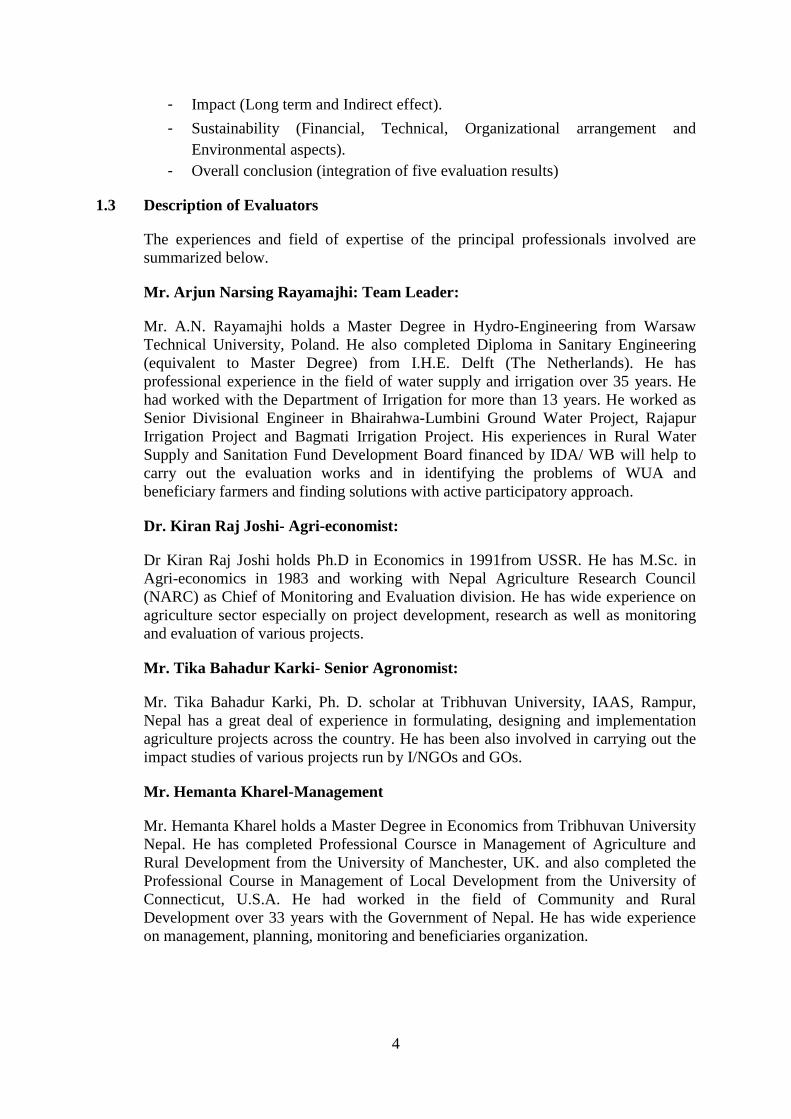
1.3 Description of Evaluators
The experiences and field of expertise of the principal professionals involved are summarized below.
Mr. Arjun Narsing Rayamajhi: Team Leader:
Mr. A.N. Rayamajhi holds a Master Degree in Hydro-Engineering from Warsaw Technical University, Poland. He also completed Diploma in Sanitary Engineering (equivalent to Master Degree) from I.H.E. Delft (The Netherlands). He has professional experience in the field of water supply and irrigation over 35 years. He had worked with the Department of Irrigation for more than 13 years. He worked as Senior Divisional Engineer in Bhairahwa-Lumbini Ground Water Project, Rajapur Irrigation Project and Bagmati Irrigation Project. His experiences in Rural Water Supply and Sanitation Fund Development Board financed by IDA/ WB will help to carry out the evaluation works and in identifying the problems of WUA and beneficiary farmers and finding solutions with active participatory approach.
Dr. Kiran Raj Joshi- Agri-economist:
Dr Kiran Raj Joshi holds Ph.D in Economics in 1991from USSR. He has M.Sc. in Agri-economics in 1983 and working with Nepal Agriculture Research Council (NARC) as Chief of Monitoring and Evaluation division. He has wide experience on agriculture sector especially on project development, research as well as monitoring and evaluation of various projects.
Mr. Tika Bahadur Karki- Senior Agronomist:
Mr. Tika Bahadur Karki, Ph. D. scholar at Tribhuvan University, IAAS, Rampur, Nepal has a great deal of experience in formulating, designing and implementation agriculture projects across the country. He has been also involved in carrying out the impact studies of various projects run by I/NGOs and GOs.
Mr. Hemanta Kharel-Management
Mr. Hemanta Kharel holds a Master Degree in Economics from Tribhuvan University Nepal. He has completed Professional Coursce in Management of Agriculture and Rural Development from the University of Manchester, UK. and also completed the Professional Course in Management of Local Development from the University of Connecticut, U.S.A. He had worked in the field of Community and Rural Development over 33 years with the Government of Nepal. He has wide experience on management, planning, monitoring and beneficiaries organization.
5
Mr. Raghab Bista - Project Analyst
Mr. Raghab Bista holds MBA from Tribhuvan University and working as local infrastructure planner and project analyst of the different sectoral and sub-sectoral projects in Nepal since 20 years. He has professional experience on rural transport planning, socio-economic study, cost benefit analysis of the project, impact evaluation of the projects. He worked as team leader on various studies and preparation of DTMP, periodic plans, energy plan with different donor agencies.
1.4 Approach and Methodology of Evaluation
The study approach and methodology of the impact evaluation study has been carried out based on the scope of services of the study. The Consultant's efforts during the assignment arecomprehensively streamlined to meet the objectives by covering scope of services outlined in Terms of Reference. The Consultant feels that the timely completion of the present assignment is extremely important in the overall implementation of the Impact Evaluation work of Sunsari-Morang Irrigation Project. The inputs of professional manpower and resources were mobilized in order to carry out the evaluation activities as scheduled. The Consultant carried out coordination meetings with the Client agencies, local bodies, users’ committees and farmers.
The following general approaches were followed during the study period: � Selection of those methods and technologies which have been tested and are
effective. � Application of an optimal combination of the methods and technologies
based on practicality, project aim, site-specific analysis, and sound professional judgment.
� Selection and mobilization of appropriate technical professional personnel. � Full use of available and applicable reports, standards, maps/drawings,
specification, other information as well as lesson learned in similar projects. � Completion of the proposed services within the stipulated time and budget.
1.4.1 Management Approach The following management approaches were pertinent and adopted by the
Consultant during the service period:
� Clearly defined roles and responsibilities for each member of the proposed Team � Work products of high quality with systematic procedures to meet all project
objectives. � Application of financial and management information system at all times. � Strict adherence to the work schedule. � Final Report tol be submitted after the approval of the Draft Report.
6
1.4.2 Approach to Field Works
The field works were planned meticulously and implemented systematically.
• Effective co-ordination and liaison with the Client, field staffs, beneficiaries and Water Uses Groups.
• Close interaction between the team members. • Good management of logistics. • Repetition of works to be minimized by good planning and timely
communication. • Preparation and use of standard workable formats.
• Planning of work in such a way that timing is optimized. • Approach to evaluate routine operation and maintenance plan of action. • Assess the ownership of project.
1.4.3 Methodology
The methodology has been outlined in the following sub-sections in order to carry out the tasks and activities to meet the scope and objectives of the evaluation. The methodology is based on the analysis of qualitative, quantitative and triangulation of the data and information of the project impact on five evaluation criteria.
1.4.3.1 Desk Study Stage
During this stage of study, the following tasks were performed.
Task-1- Preparatory Meetings
The study team meetings was held at project office and discussed on the study methodology, work plan and preparation of inception report. The tentative field plan was discussed and finalized to carry out the filed work in Sunsari and Morang district. The necessary logistics of the field and office work was managed.
Task-2- Review of the Documents and Information
The secondary information were collected from various sources as; SMIP office, DOI, Ministry of Irrigation, DADO office Sunsari and Morang, web-site and other sources. The document wasreviewed by the team and discussed. The consultant reviewed the reports, documents and publications (referBiblography).
Task-3- Preparation of Questionnaire and Checklist
The team member developed the semi-structured questionnaire for the household survey in order to collect the household information, socio-economic, agriculture production/productivity, impact of irrigation on production, livelihood change etc. Checklist was prepared for the Focused Group Discussion (FGD), discussion with Water User Committee, SMIP staffs, Mixed Groups and other stakeholders. Technical Assessment checklist was prepared to carry out technical observation and assessment.
7
1.4.3.2 Field Work
The main objectives of the field studywas to assess the existing irrigation system, data collection, observation, focused group discussion, meetings with project office, meeting and discussion with Water User committee and other stakeholders. The field team also verified the data collected during the desk study stage, seked additional data and also carried out observation in the filed data and information relating to the issues as mentioned in TOR.
1.4.3.3Team Field Visit
The study team headed by Team Leader, Agro-economist, Agriculturist, Socio-economist, Project Analyst visited in the Sunsari- Morang Irrigation Project Office and its field offices and interacted with Office in- Charges, technicians, concern officials, farmers and Water User Association officials. The interaction was focused on procedures so far adopted in project identification, implementation, monitoring etc. Other aspects such as role of WUA in project process, level of their participation, linkages and coordination with stakeholders was discussed. The team carried out the discussion, meetings, mini-workshop, observation, technical audit and interaction with Water User's Committee in order to identify the fact finding of the irrigation system in Sunsari and Morang districts. The team divided into groups of technical team, project analyst team and agriculture team in the field. The evaluation was carried out based on the criteria of relevance, effectiveness, impact, efficiency and sustainability of Sunsari-Morang irrigation project. The checklists for different evaluations were used (Annex II). The Consultants visited both districtsand concern institutions in order to collect the data and information. The Consultants reviewed Investment pattern of Government, farmers, private sector within the project area.
Technical Team
The Technical team with SMIP official, visited the Intake and main canal (certain sections) and gave their general assessment of the irrigation system. For, branch canal as a sample, the best performed and worst performed branch canal section in both districts were observed. The structures located in the studied section of the canal were also being observed. Measurement of discharge at Head, Middle and Tail of one branch canal in each district is conducted to find the efficiency of the canal. Water management aspect is also being generally assessed.
Agriculture Team
Agriculture team visited the command area and observed the agriculture field in respect with the production and productivity,cropping pattern, crop intensity, crop diversification, modernization and commercialization of agriculture products. The team assessed the impact of agriculture on livelihood of farmers.
Project analyst Team
Project analyst team visited the field to collect the socio-economic benefits of the irrigation system, project investment, cost involvement on repair and maintenance, income of WUA, budget and financial aspect of the project.
8
1.4.3.4 Data Collection
Secondary Data collection
The information was collected from the World Bank, Department of Irrigation, Sunsari-Morang Irrigation Project, Water Users Associations etc.
Primary Data collection
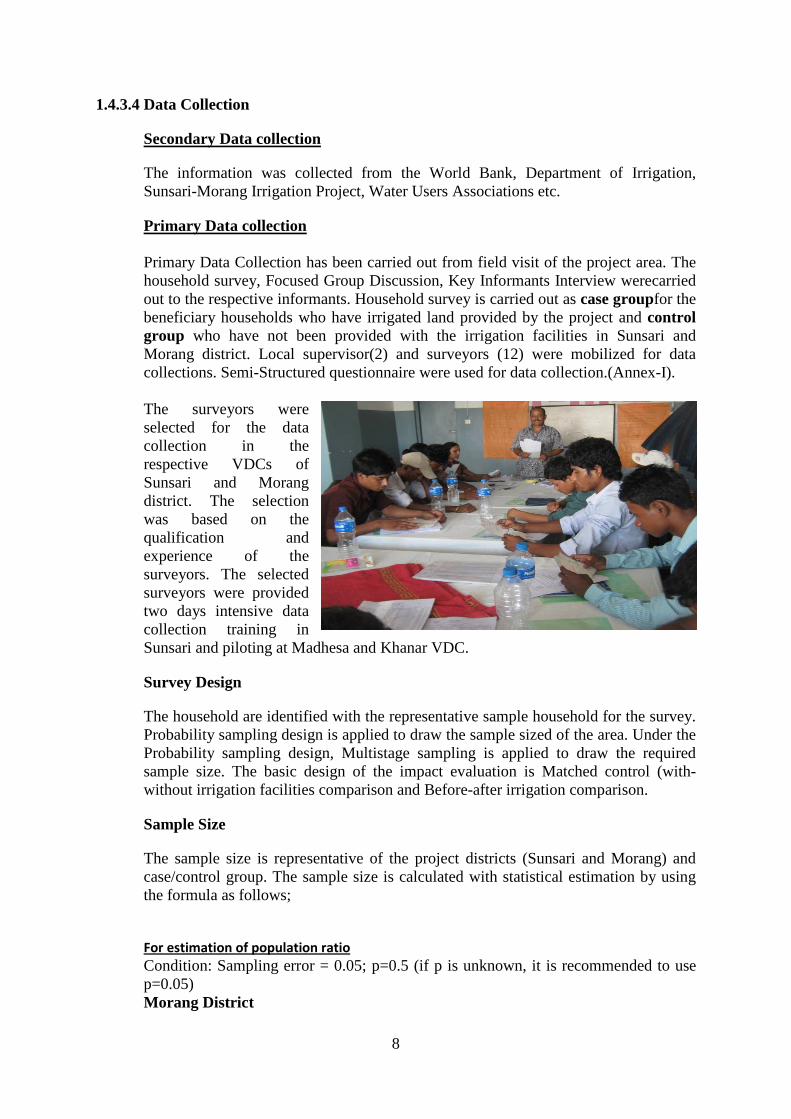
Primary Data Collection has been carried out from field visit of the project area. The household survey, Focused Group Discussion, Key Informants Interview werecarried out to the respective informants. Household survey is carried out as case groupfor the beneficiary households who have irrigated land provided by the project and control group who have not been provided with the irrigation facilities in Sunsari and Morang district. Local supervisor(2) and surveyors (12) were mobilized for data collections. Semi-Structured questionnaire were used for data collection.(Annex-I). The surveyors were selected for the data collection in the respective VDCs of Sunsari and Morang district. The selection was based on the qualification and experience of the surveyors. The selected surveyors were provided two days intensive data collection training in Sunsari and piloting at Madhesa and Khanar VDC.
Survey Design
The household are identified with the representative sample household for the survey. Probability sampling design is applied to draw the sample sized of the area. Under the Probability sampling design, Multistage sampling is applied to draw the required sample size. The basic design of the impact evaluation is Matched control (with-without irrigation facilities comparison and Before-after irrigation comparison.
Sample Size
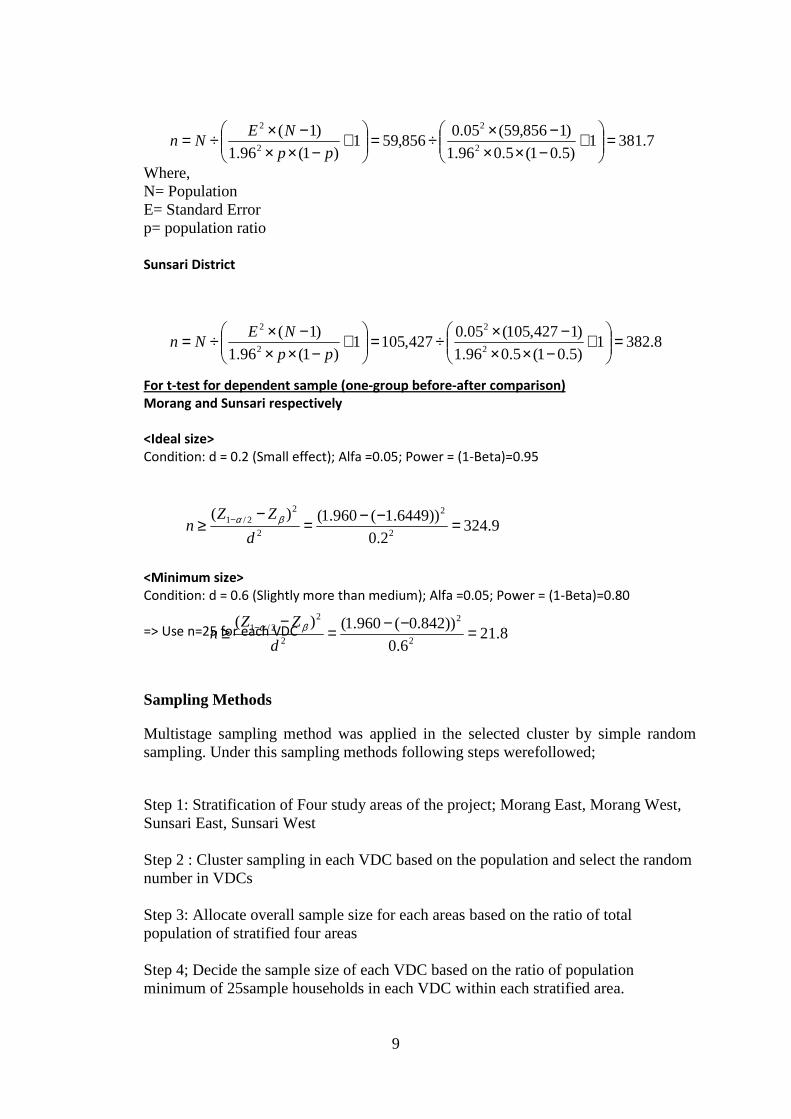
The sample size is representative of the project districts (Sunsari and Morang) and case/control group. The sample size is calculated with statistical estimation by using the formula as follows;
For estimation of population ratio
Condition: Sampling error = 0.05; p=0.5 (if p is unknown, it is recommended to use p=0.05) Morang District
9
Where, N= Population E= Standard Error p= population ratio
Sunsari District
For t-test for dependent sample (one-group before-after comparison)
Morang and Sunsari respectively
<Ideal size>
Condition: d = 0.2 (Small effect); Alfa =0.05; Power = (1-Beta)=0.95
<Minimum size>
Condition: d = 0.6 (Slightly more than medium); Alfa =0.05; Power = (1-Beta)=0.80
=> Use n=25 for each VDC
Sampling Methods
Multistage sampling method was applied in the selected cluster by simple random sampling. Under this sampling methods following steps werefollowed;
Step 1: Stratification of Four study areas of the project; Morang East, Morang West, Sunsari East, Sunsari West Step 2 : Cluster sampling in each VDC based on the population and select the random number in VDCs Step 3: Allocate overall sample size for each areas based on the ratio of total population of stratified four areas Step 4; Decide the sample size of each VDC based on the ratio of population minimum of 25sample households in each VDC within each stratified area.
7.3811)5.01(5.096.1
)1856,59(05.0856,591
)1(96.1
)1(2
2
2
2
=
+
−××−×÷=
+
−××−×÷=
pp
NENn
8.3821)5.01(5.096.1
)1427,105(05.0427,1051
)1(96.1
)1(2
2
2
2
=
+
−××−×÷=
+
−××−×÷=
pp
NENn
9.3242.0
))6449.1(960.1()(2
2
2
22/1 =−−=
−≥ −
d
ZZn βα
8.216.0
))842.0(960.1()(2
2
2
22/1 =−−=
−≥ −
d
ZZn βα
10
Sample Size
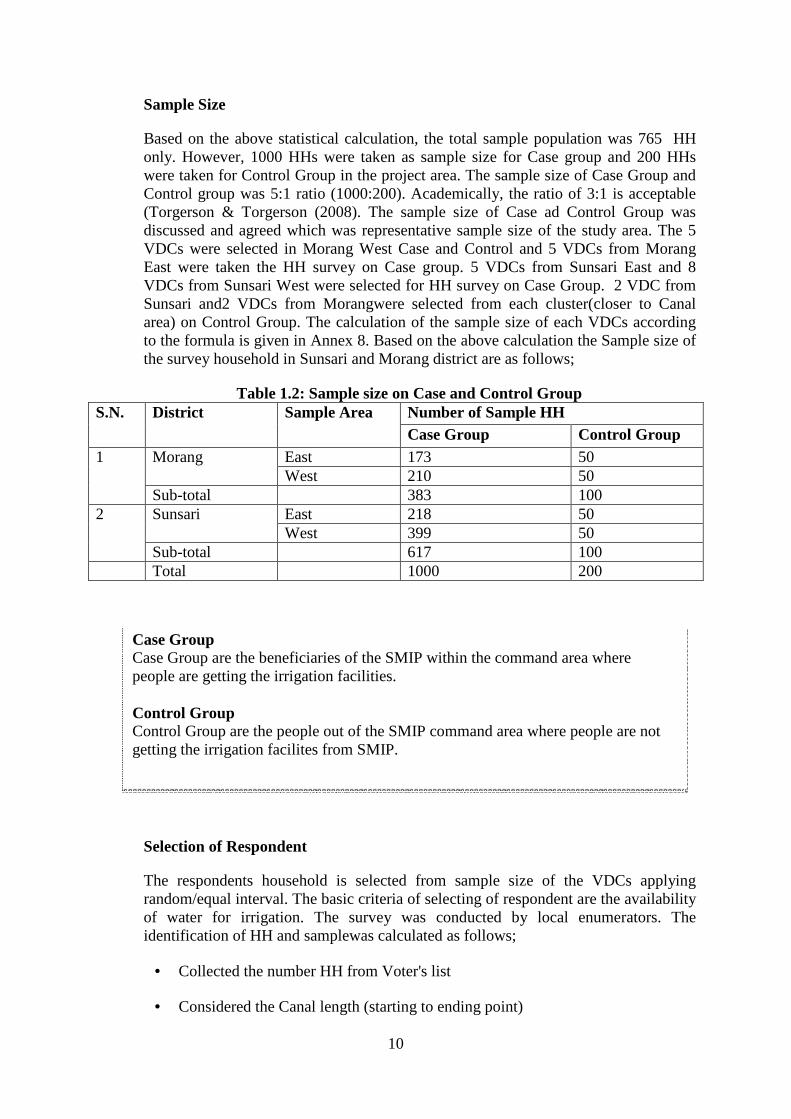
Based on the above statistical calculation, the total sample population was 765 HH only. However, 1000 HHs were taken as sample size for Case group and 200 HHs were taken for Control Group in the project area. The sample size of Case Group and Control group was 5:1 ratio (1000:200). Academically, the ratio of 3:1 is acceptable (Torgerson & Torgerson (2008). The sample size of Case ad Control Group was discussed and agreed which was representative sample size of the study area. The 5 VDCs were selected in Morang West Case and Control and 5 VDCs from Morang East were taken the HH survey on Case group. 5 VDCs from Sunsari East and 8 VDCs from Sunsari West were selected for HH survey on Case Group. 2 VDC from Sunsari and2 VDCs from Morangwere selected from each cluster(closer to Canal area) on Control Group. The calculation of the sample size of each VDCs according to the formula is given in Annex 8. Based on the above calculation the Sample size of the survey household in Sunsari and Morang district are as follows;
Table 1.2: Sample size on Case and Control Group S.N. District Sample Area Number of Sample HH
Case Group Control Group 1 Morang East 173 50
West 210 50 Sub-total 383 100
2 Sunsari East 218 50 West 399 50
Sub-total 617 100 Total 1000 200
Selection of Respondent
The respondents household is selected from sample size of the VDCs applying random/equal interval. The basic criteria of selecting of respondent are the availability of water for irrigation. The survey was conducted by local enumerators. The identification of HH and samplewas calculated as follows;
• Collected the number HH from Voter's list
• Considered the Canal length (starting to ending point)
Case Group Case Group are the beneficiaries of the SMIP within the command area where people are getting the irrigation facilities. Control Group Control Group are the people out of the SMIP command area where people are not getting the irrigation facilites from SMIP.
11
• HH are selected randomly with the interval of as per table
• Interview of Selected HH of case and control group.
Piloting of Questionnaire
The survey questionnaire was pre-tested in the Madhesa and Khanar VDC. After the field test, the Consultant finalized the questionnaire incorporating the comments and field corrections.
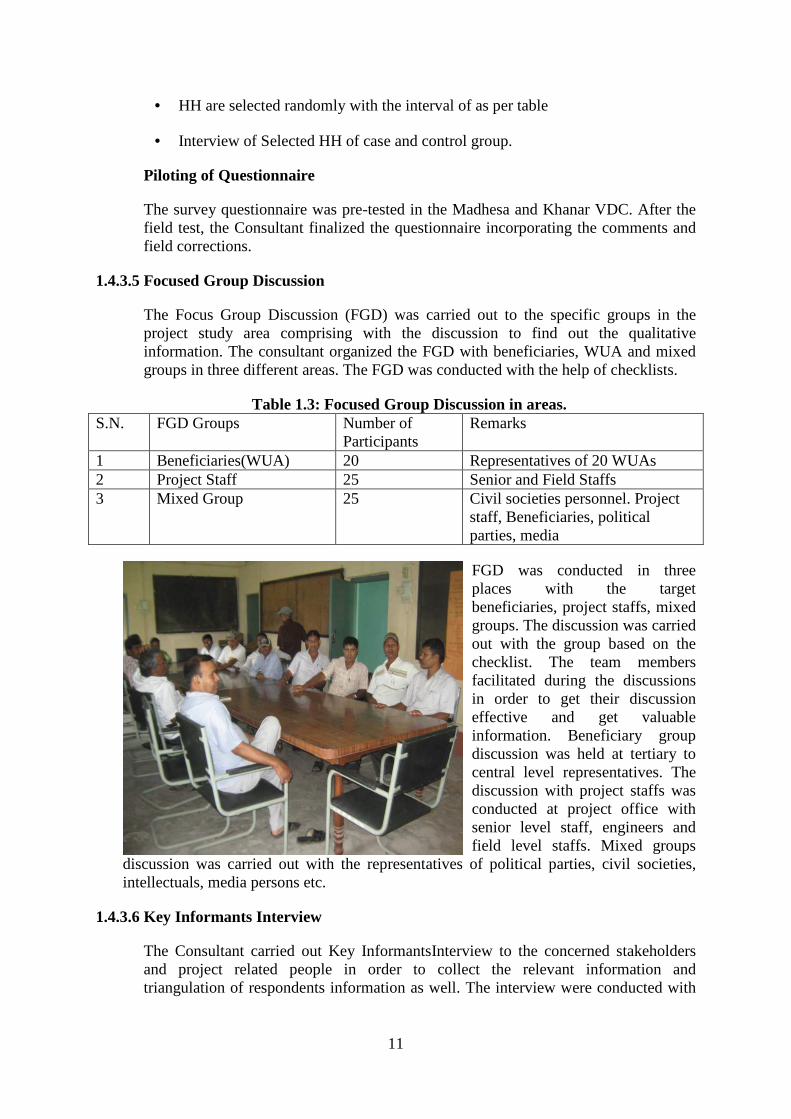
1.4.3.5 Focused Group Discussion
The Focus Group Discussion (FGD) was carried out to the specific groups in the project study area comprising with the discussion to find out the qualitative information. The consultant organized the FGD with beneficiaries, WUA and mixed groups in three different areas. The FGD was conducted with the help of checklists.
Table 1.3: Focused Group Discussion in areas. S.N. FGD Groups Number of
Participants Remarks
1 Beneficiaries(WUA) 20 Representatives of 20 WUAs 2 Project Staff 25 Senior and Field Staffs 3 Mixed Group 25 Civil societies personnel. Project
staff, Beneficiaries, political parties, media
FGD was conducted in three places with the target beneficiaries, project staffs, mixed groups. The discussion was carried out with the group based on the checklist. The team members facilitated during the discussions in order to get their discussion effective and get valuable information. Beneficiary group discussion was held at tertiary to central level representatives. The discussion with project staffs was conducted at project office with senior level staff, engineers and field level staffs. Mixed groups
discussion was carried out with the representatives of political parties, civil societies, intellectuals, media persons etc.
1.4.3.6 Key Informants Interview
The Consultant carried out Key InformantsInterview to the concerned stakeholders and project related people in order to collect the relevant information and triangulation of respondents information as well. The interview were conducted with
12
the following officials and people. The checklist was used for the key informants interview.
• Ministry of Irrigation
• Department of Irrigation
• District Agriculture Office
• Sunsari-Morang Project Office
• Water Users Association (central level)
• Political parties
• Local Communities
• Civil Societies
1.4.3.7 Data Analysis
Data analysis is the function to determine the impacts whether occured or not occurred by the project interventions and the degree to which extent of effects were occurred. The approach of data analysis was quantitative methods by comparison and qualitative methods of constructing information.
Quantitative methods
Quantitative methodswasapplied to analyse the data in order to compare with the previous data and current data, compare on Case and Control group before and after irrigation facilities and compare with case group (irrigated area) and control group (unirrigated area).
SPSS program is used for the data analysis. The statistical analysis method is used for the analysis of two values (i.e. before and after). Independent/dependent t-test and multiple comparison tests (ANOVA and post-hoc analysis) are applied.
Qualitative methods
A qualitative method is used to analyse the qualitative information collected from FGD, literature review, interview with key informants and consultant's observation. The analysis comprises with the facts of the project, relationship between the internal and external, issues, and future plan and policies implications. The qualitative analysis methods are given below;
• Situation of the Project
• Classify information according to issues
• Examine relationship among the information
o Implementation process and input/output of project
13
o Logical relationship between project implementation and effects
o Relationship between project and beneficiaries.
Triangulation
Triangulation methods were applied to examine data from different perspectives and sources with the reality and cross check. It was combination of qualitative and quantitative data to achieve triangulation with minimum error. The triangulation was used for the verification and validation of analysis as;
• Methods Triangulation; checking the consistency of findings generated by different data collection methods (Quantitative and Qualitative)
• Triangulation of Sources: checking the consistency of different data sources (beneficiary, WUA, local people, key informants)
• Triangulation of Respondents ; Triangulation of the respondents were carried out with the piloting and interview with different respondents.
Consolidating Analyzed Data and Outcomes
Using the quantitative and qualitative analysis, the data is consolidated with the outcomes of the impact evaluation. Cross-tabulation of the data was drawn with basic indicators of the result. The result of the analysis interpretswith value judgment of the study.
1.4.3.8 Impact Evaluation
Based on the data analysis, the output tables are preparedfor the field data which indicates the different aspect of the project helped on fact findings. The basic indicators and parameters are considered for the impact evaluation of the project using five evaluation criteria. The impact evaluation was carried out time comparision of Before and After the SMIP. The time line of Before and After is assumed as in 1985 A.D.before the construction of Stage I and After the completion of Stage I in the command area of 9,750 ha. Similarly, the before and after was assumed in 2001 A.D. where the construction of Stage II and Stage III (first phase) was completed. The evaluation was carried out as follows;
1. Relevance
The government irrigation policy (2060) isanalyzed in respect to Sunsari-Morang Irrigation project. Project analysis is reviewed in terms of relevancy of the Run-off river system.
2. Effectiveness
Effectiveness of irrigation facilities in terms of production/productivity of agriculture in the command area was analyzed on Case and Control group. The direct effect of the irrigation system to farmers especially the marginalized group and change in the livelihood of the farmers was also studied. The statistical analysis was applied with the independent/dependent t-test; multiple comparison test (ANOVA and post-hoc
14
analysis) for the effectiveness of the project interventions of Sunsari-Morang Irrigation Project.
The descriptive statistics is calculated from the t-test of some relevant questions regarding the irrigation facilities, agri-culture production, effect of irrigation etc. The test is comparison of case and control groups. The case group is the beneficiary of the SMIP having irrigation facilities and control croup is out of SMIP command area.
3. Efficiency
Cost-benefit analysis of the project was evaluated based on the cost benefit ratio of Project Documents. Economic Rate of Return (ERR) was applied for the analysis of efficiency of the project in terms of investment, output and financial sustainability. A comparative analysis was carried out as per project documents and present scenario. 10 % Discounted ratewas taken for the calculation of ERR. ERR was calculated on phase I and phase II of the SMIP implementation.
4. Sustainability
Sustainability is major criteria of evaluation which consist the overall impact of the project. The sustainability is considered with the;
• Financial Sustainability; Government investment in the project, IDA loan, the irrigation tariff, income from farmers, repair and maintenance expenditure, short term financial shortcomings, long term financial requirement, Budget allocation etc.
• Technical Sustainability; discharge, water flow in canal section, life of the canal and existing structure, repair and maintenance of canal etc. Technical information was gathered from the project staff regarding the sustainability.
• Organizational arrangement/Management; Existing organizational structure, Staffing pattern, Staff movement, Job analysis, Field staff, supervision and monitoring, MIS on irrigation.
• Environmental Sustainability: Environmental degradation, soil erosion, flood, plantation and vegetation etc.
• Other general information; WUA's meeting observation and minutee, observation of repair and maintenance, decision making process of WUA's were analysed.
1.4.3.9 Dissemination of Impact Evaluation
The first draft report was submitted to the NPCS. The powerpoint presentation was carried out to the Task Force of SMES and discussed. Second Draft Report was prepared incorporating all the comments from the concerned line agencies, project, NPCS and SMES office. The second draft report was submitted to the NPCS and power point presentaton was also carried out. Final Draft Report waspresented at Harka Gurung Hall at NPCS on December 7, 2012. The Final Report is prepared after incorporating all the comments on final draft report.
15
1.5. Limitation of the Evaluation
The impact evaluation study of SMIP was carried out in the filed as per the provided ToR and instructions provided from the NPC, SMES. The limitations of the study are given below;
1.5.1 The study time was not favorable for field work due to the heavy rainy season which
hampered the completion of Field Survey. 1.5.2 Due to busy and working season, most of the respondents were reluctant and
aggressive to provide the information. There were number of surveys and interview conducted so many times by different organization in the area. Farmers were worried about fertilizer; seed and water for paddy plantation during our survey time and they were not interested for this study.
16
Chapter 2
Background of SMIP
2.1 Background of the SMIP
Nepal has abundant water resources, including major river systems with annual discharge totaling 150 billion m3, and capable of irrigating 6 to 8 MT/ha. Irrigation sector has been developing from the First Five Year Plan in 1957. The emphasis has given in the Fifth Plan towards the completion of on-going schemes and new investment in projects with short gestation period and high returns.
Under the Koshi Project Agreement in 1954, as amended in 1966,Nepal has the right to withdraw any required quantity of water from the Koshi river and itstributaries, and India has the right to regulate the balance and to generate power at the Indian-built Koshi Barrageabout 30 km downstream of Chatara. In 1964, HMGN entered into an agreement with the Government of India (GOI) under which GOI undertook to construction of the Chatara Canal Project (CCP) as part of the overall aid made available by India to Nepal. Headworks for the withdrawal of water for the project were constructed at Chatara, immediately downstream of the gorge from which the Koshi debouches on to the Terai plain.
CMC runs along a contour 100m above sea level and commands the area limited by the Bakra River to the east, the boundary between Nepal and India to the south, and by a flood bund on the left bank of Koshi to the west. The irrigation scheme is about 45 km from east to west, and varies in width between 20 and 25 km from north to south. The irrigation system consists of the 50 km CMC, 17 km of branch canals, 210 km of secondary, and only 105 km of tertiaries. The system is designate to irrigate an area of 68,000 ha. of Sunsari and Morang district.
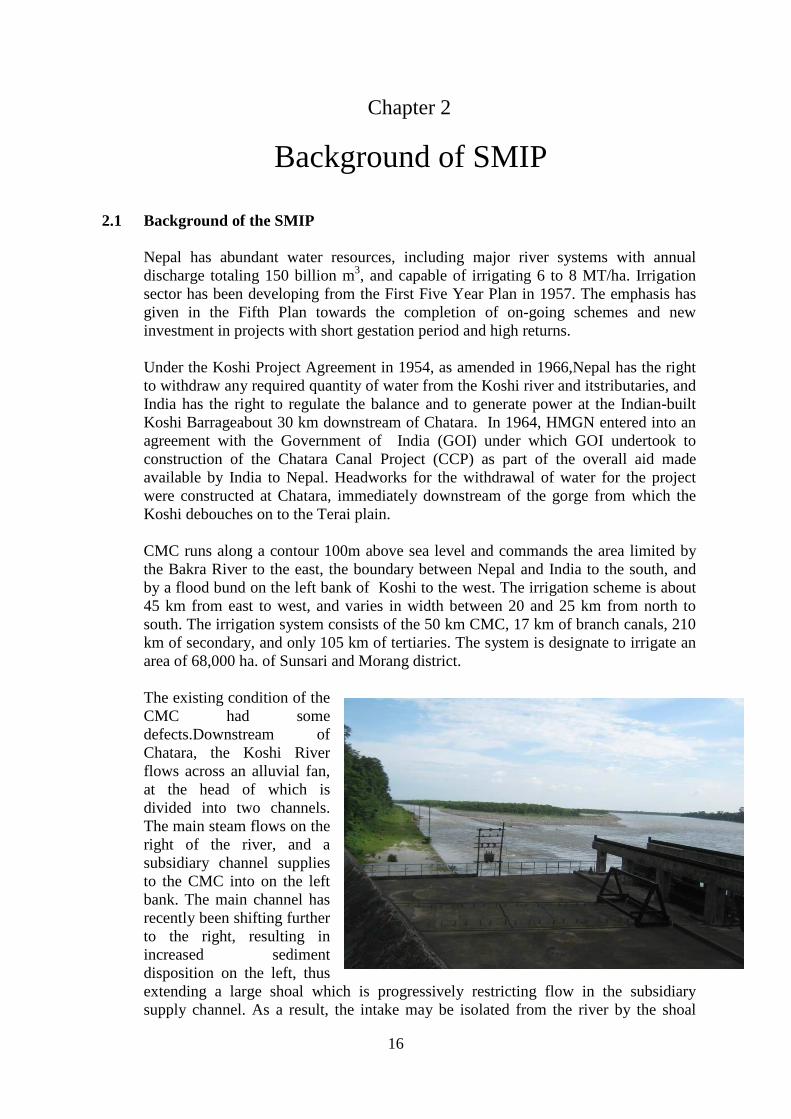
The existing condition of the CMC had some defects.Downstream of Chatara, the Koshi River flows across an alluvial fan, at the head of which is divided into two channels. The main steam flows on the right of the river, and a subsidiary channel supplies to the CMC into on the left bank. The main channel has recently been shifting further to the right, resulting in increased sediment disposition on the left, thus extending a large shoal which is progressively restricting flow in the subsidiary supply channel. As a result, the intake may be isolated from the river by the shoal
17
during the dry season within the next four years and suspended sediment content in the intake channel exceeds 3 grams/liter(the World Bank, 1978, pp7).
Below the intake, CMC passes through a 9 km long headreach in 10 m deep cutting. It is crossed by 6 large super passages (cross drainages structures) in the headreach for disposal of the flood flows from the foothills.Due to inadequate design of these structures, flood flows have occasionally spilled into the canal, causing considerable damage and interrupting irrigation supplies. Other frequent cause of canal closure is breaches which occurthrough weak embankments. This weakness is aggravated by the high water levels at which CMC has to be operated due to heavy sediment deposits. Removable of sediment requires canal closure for maintenance to be lengthened from one month to at least 4 months, thus limiting operation of CMC in dry season.
There was no flow regulating structures in the secondary and tertiary canals. The distribution system was therefore uncontrolled. Construction of distributary canals was terminated wherever each canal decreased in capacity to 0.14 m3/sec and the system was therefore incomplete. As a result only about 35,000 ha command area receives some irrigation supplies (ibid).
Koshi River has a catchment are of 58,000 km2 , of which almost a third lies in China. The river is notorious for its high sediment content which rises to about 20 gram/liter (2 % by weight) during monsoon floods (June-August) is reported to the fourth most sediment-laden river in the world.
SMIP Stage -I Sunsari Morang Irrigation and Drainage Development Stage I Project was identified by 1975 IDA mission in line with HMG's objectives of upgrading and exploiting existing irrigation schemes as well as to develop the capacity of CMC and irrigation system. HMGN later engaged the consultant's service of Nippon Koei (Japan) to assist in the project feasibility study. During IDA appraisal in September 1977, a careful review of implementation capacity, project organization and farmers' participation was carried out, to determine an appropriate project design, including the construction schedule. SMIP-I was IDA financed to overcome these shortcomings by modification and rehabilitation of the system in planned manner with the development of 9,700 ha.
SMIP Stage-II
After completion of SMIP-I stage from 1978-1985 and completed with extension of three year in 1987. The SMIP –II was implemented to support for modification and rehabilitation of Sunsari Morang Irrigation System (SMIS). The total command area of SMIP was originally defined as 68,000 ha. The project aims at increasing agricultural production and farmer's incomes through the rehabilitation and improvement of existing irrigation and drainage system and the efficient utilization of available resources. Sunsari Morang Headworks Project (SMHP)
18
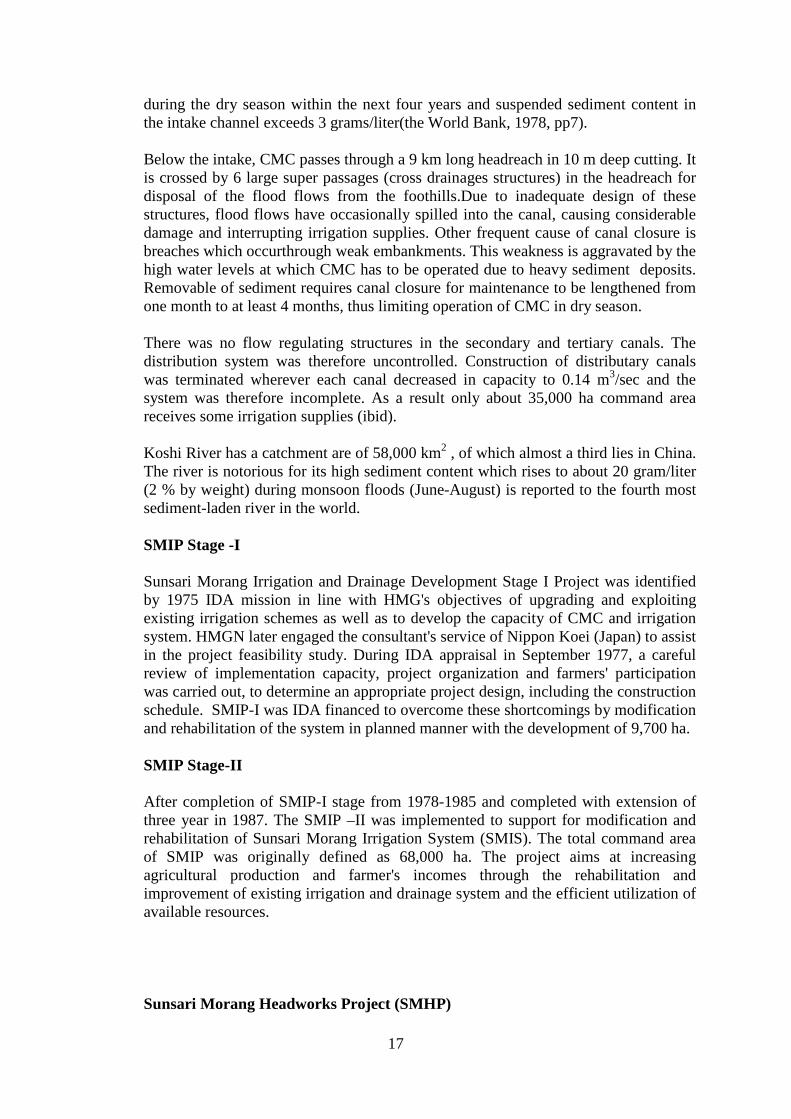
The existing intake has less efficient and problems on water supply to CMC. The
discharge of the CMC was reduced and not maintained as per the designed discharge. IDA team carried out the study for the new intake system with good efficiency and adequate discharge. The components of SMHP was not only the construction of intake but it has
constructed the pre-settling basin, settling basin, regulating feeder tunnel canal, 3.2 MW hydro electricity.
SIMP-Stage III, Phase I
The stage III -Phase I project was carried out for the further development of the command area and rehabilitation of the CMC and improvement of the Budhi Aqueduct. This phase has continuation of the second phase for the development of the remaining command area of the SMIP. The stage was funded by the World Bank and GoN contribution.
2.2 Objectives of the SMIP
The major objective of SMIP-I is aimed to rehabilitate the largest existing irrigation schemes with the objectives of a) restoring the system to its original scope and capability; b) improving the reliability of water deliveries, and therefore to increase farmer's confidence in the system and c) accelerating agricultural development and thus increasing farmer's income and rural employment.
SMHP had provisioned for construction of new intake in the upstream of old intake for the reviving the discharge to CMC in order to full fill the objective of SMIP to enhance the capacity of CMC. The settling basin and operation of two dredgers are another important work to control the silt.
2.3 Description of SMIP
SMIP project was located in Sunsari and Morang districts in the Eastern Development Region of Nepal. The project was developed for the irrigation of the terai plain land which is highly potential for agriculture. There is some description of the project;
2.3.1 Topography
19
The topography of the project is flat land with subdued micro-relief features. The slopes from north to south with an average gradient of 1:700lackening to south. The elevation of the project area varies from 60m AMSL to 107 m AMSl at intake site. There are number of river and rivulets crossing the CMC.
2.3.2 Project components
The project was carried out in different construction works and implementation in periodic basis. The overall project was completed with different stage and phases are given below; SMIP-I
Main Project Components:
a) River control and flood protection works on the Koshi river in the vicinity of the
Chatara Main Canal (CMC) intake b) Sediment control arrangement at the CMC intake and along CMC c) Restoration and improvement of the canal system and provision of about 180 new
structures throughout 66,000 ha. d) Planning and design of complete minor distribution canals extending to outlets
serving 10 ha groups of farms throughout an area of about 18000 ha. And within this area, construction of canals and drains serving 6,400 ha.
e) Drainage improvement covering 12000-15,000 ha. f) Pilot schemes for tubewells, improved water management and canal micro-
hydroelectric developments; g) Strengthening agricultural extension, research and training activities throughout
Sunsari and Morang districts h) Equipment and vehicles for construction, survey and laboratory activities and
project operation and maintenance i) Building for engineering and agricultural activities and staff housing; j) Technical Assistance
Benefits and Justification of SMIP-I
The overall impact of the project at full development can be summarized as follows:
• Increase in Net irrigated area (ha) 31,000 • Increase in crop area under irrigation (ha) 49,000 • Increase in net foreign exchange earnings (US$) 2M per year • Farm Employment generated (jobs) 10,000 • Non-farm employment generated (jobs) 5,000-7,000 • Economic Rate of Return 17 % • Discounted costs and benefits over 50 Years period • Command Area Development of 9,700 ha SMIP-II
20
Project Components
a) Improvement of Chatara Main Canal (CMC) including modification of head
regulator, repair to main super passages, rehabilitation of drainage chutes on the headreach, replacement of gates and repair of head regulators of distributary canals, completion of bridges; repair and improvements to cross drainage works, siphons and access structures, replacement of cross aqueduct structures and other miscellaneous minor works including desilting of CMC
b) Improvement of desilting operations to provide a feasible desilting facility determined by the studies during the first two project years by evaluating further the viability of mechanical solutions (larger desilting basin provided with portable suction-cutter dredgers)against hydraulic flushing.
c) Rehabilitation and Improvement of irrigation distribution and drainage networks in Stage II area (16,700 ha)
d) Modification to the irrigation block headquarters e) Procurement of equipment, vehicles and spares of O & M and installation of
radio communication for the system operation and equipment necessary for desilting
f) Technical Support and Training through the provision of consultancy services for design and supervision of construction, training, monitoring and evaluation and studies and
g) Support for incremental project establishment and maintenance costs. Technical Panel of Experts (POE) invited to review the sediment study in 1990 in order to find out the solution of sediment removable by mechanical desilting versus hydraulic flushing. The consultant and POE advised to make the intake site upstream to solve sediment problems in monsoon and acute water intake problem in dry season. The IDA agreed on Consultant's and POE's recommendations and decided to modify the SMIP-II by i) moving the intake site 1,300 m upstream of existing intake; ii) constructing a larger capacity desilting basin c) utilizing dredgers to remove deposited silt from the desilting basin; and iii) constructing a micro-hydro unit in headreach of the main canal to provide hydro-power for dredger operations. The amendment of the SMIP II did not cover full funding requirement for thee additional facilities. Then the ID credit is added in 1992 for implementation of a new Sunsari Morang Head Works Project (SMHP). There was a time gap of about four years in between the commencement of SMIP and SMHP.
Benefits and Justification of SMIP-II
The overall impact of the project at full development can be summarized as follows:
• Increase in irrigated area (ha) 16700 • Incremental food grain production (ton/yr) 31920 • Incremental oilseed production (ton/yr) 1870 • Farm Employment generated (man/year) 2,400 • Directly benefiting farm families (no) 8,560 • Economic Rate of Return 16 % • Discounted costs and benefits over 30 Years period
21
• Command Area Development of 16,700 ha
SMHP Project Components a) Construction of new intake at upstream of Koshi river 1300 m from old intake at
capacity of 60 cumex. b) RCC culvert 1000 m of 3 barrel c) 300 m Pre-settling basin d) Regulator structure at old intake e) Construction of Tunnel of 4.57 diameter 180 m on Regulating structure to Feeder
Canal f) Settling Basin of 900m length and 60 m width. g) 3.2 MW hydro power h) Two dredgers with 14 inch cutter i) Transmission line of 33 KV to Dharan substation.
SMIP Stage III-Phase I Project Components a) Improvement works on CMC b) Command area development of 13611ha. from Biratnagar branch to
Harinagara Branch c) Construction of 5.5. km. left Embankments on Koshi river d) Improvement works on Budhi Aqueduct.
2.3.3 Socio-economic
The project has directly affected to 34 VDCs in Morang and 33 VDCs in Sunsari district. The socio-economic status of the project area comprises with the irrigated area of SMIP and control groups.
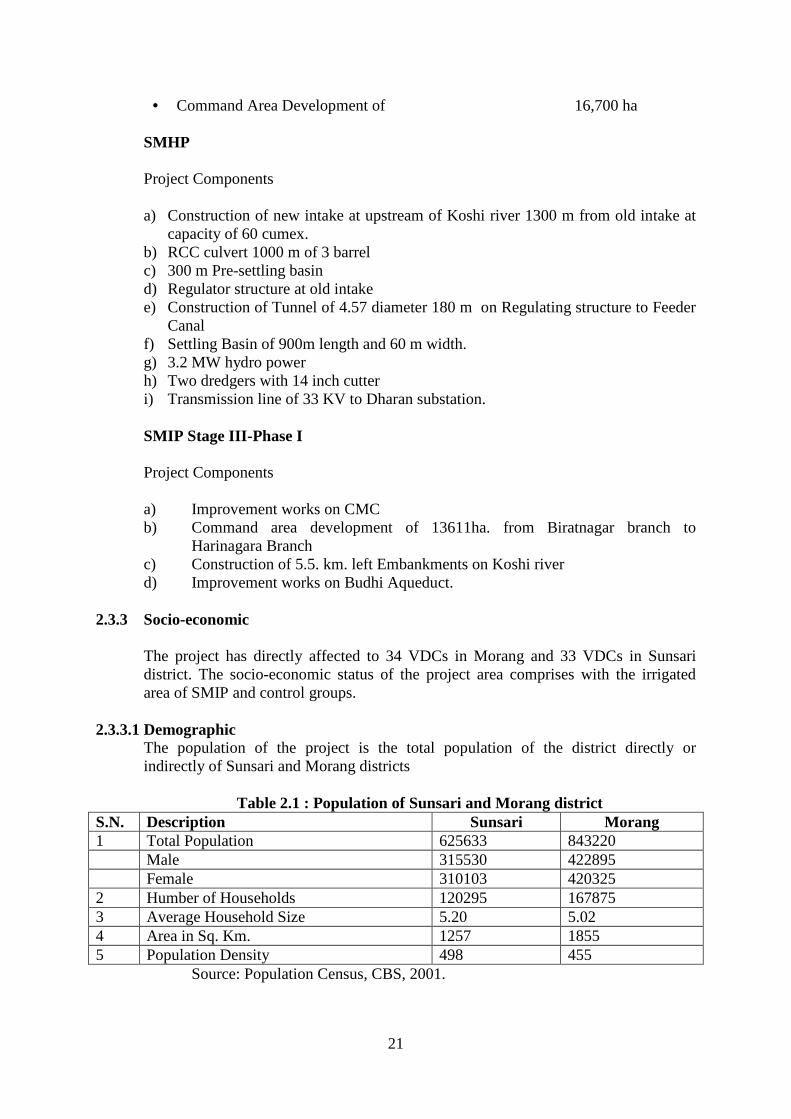
2.3.3.1 Demographic The population of the project is the total population of the district directly or indirectly of Sunsari and Morang districts
Table 2.1 : Population of Sunsari and Morang district S.N. Description Sunsari Morang 1 Total Population 625633 843220 Male 315530 422895 Female 310103 420325 2 Humber of Households 120295 167875 3 Average Household Size 5.20 5.02 4 Area in Sq. Km. 1257 1855 5 Population Density 498 455
Source: Population Census, CBS, 2001.
22
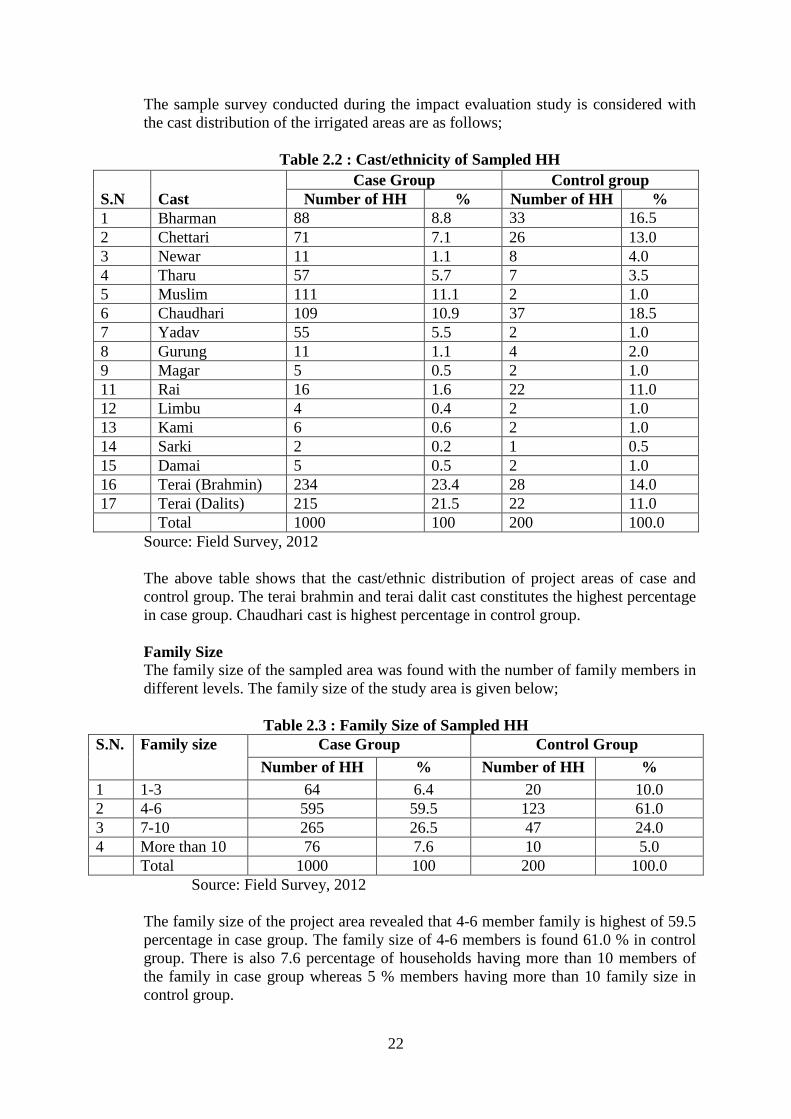
The sample survey conducted during the impact evaluation study is considered with the cast distribution of the irrigated areas are as follows;
Table 2.2 : Cast/ethnicity of Sampled HH
Source: Field Survey, 2012
The above table shows that the cast/ethnic distribution of project areas of case and control group. The terai brahmin and terai dalit cast constitutes the highest percentage in case group. Chaudhari cast is highest percentage in control group.
Family Size
The family size of the sampled area was found with the number of family members in different levels. The family size of the study area is given below;
Table 2.3 : Family Size of Sampled HH
S.N. Family size Case Group Control Group Number of HH % Number of HH %
1 1-3 64 6.4 20 10.0 2 4-6 595 59.5 123 61.0 3 7-10 265 26.5 47 24.0 4 More than 10 76 7.6 10 5.0 Total 1000 100 200 100.0
Source: Field Survey, 2012
The family size of the project area revealed that 4-6 member family is highest of 59.5 percentage in case group. The family size of 4-6 members is found 61.0 % in control group. There is also 7.6 percentage of households having more than 10 members of the family in case group whereas 5 % members having more than 10 family size in control group.
S.N Cast Case Group Control group
Number of HH % Number of HH % 1 Bharman 88 8.8 33 16.5 2 Chettari 71 7.1 26 13.0 3 Newar 11 1.1 8 4.0 4 Tharu 57 5.7 7 3.5 5 Muslim 111 11.1 2 1.0 6 Chaudhari 109 10.9 37 18.5 7 Yadav 55 5.5 2 1.0 8 Gurung 11 1.1 4 2.0 9 Magar 5 0.5 2 1.0 11 Rai 16 1.6 22 11.0 12 Limbu 4 0.4 2 1.0 13 Kami 6 0.6 2 1.0 14 Sarki 2 0.2 1 0.5 15 Damai 5 0.5 2 1.0 16 Terai (Brahmin) 234 23.4 28 14.0 17 Terai (Dalits) 215 21.5 22 11.0 Total 1000 100 200 100.0
23
Period of Living
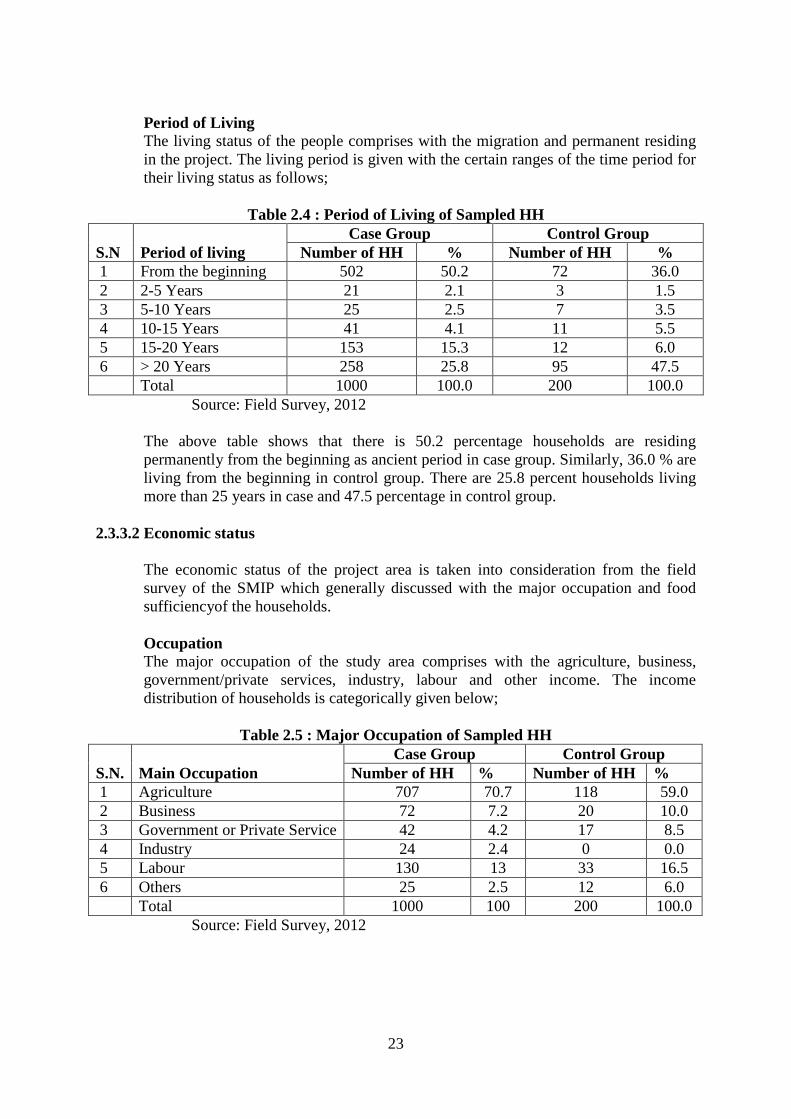
The living status of the people comprises with the migration and permanent residing in the project. The living period is given with the certain ranges of the time period for their living status as follows;
Table 2.4 : Period of Living of Sampled HH
S.N Period of living Case Group Control Group
Number of HH % Number of HH % 1 From the beginning 502 50.2 72 36.0 2 2-5 Years 21 2.1 3 1.5 3 5-10 Years 25 2.5 7 3.5 4 10-15 Years 41 4.1 11 5.5 5 15-20 Years 153 15.3 12 6.0 6 > 20 Years 258 25.8 95 47.5 Total 1000 100.0 200 100.0
Source: Field Survey, 2012
The above table shows that there is 50.2 percentage households are residing permanently from the beginning as ancient period in case group. Similarly, 36.0 % are living from the beginning in control group. There are 25.8 percent households living more than 25 years in case and 47.5 percentage in control group.
2.3.3.2 Economic status
The economic status of the project area is taken into consideration from the field survey of the SMIP which generally discussed with the major occupation and food sufficiencyof the households. Occupation The major occupation of the study area comprises with the agriculture, business, government/private services, industry, labour and other income. The income distribution of households is categorically given below;
Table 2.5 : Major Occupation of Sampled HH
S.N. Main Occupation Case Group Control Group
Number of HH % Number of HH % 1 Agriculture 707 70.7 118 59.0 2 Business 72 7.2 20 10.0 3 Government or Private Service 42 4.2 17 8.5 4 Industry 24 2.4 0 0.0 5 Labour 130 13 33 16.5 6 Others 25 2.5 12 6.0 Total 1000 100 200 100.0
Source: Field Survey, 2012
24
The above table indicates that the income of household is dominated by agriculture with 70.7 percent in case group and 59.0 percentage in control group. The wage labour are 13 percent in case group and 16.5 percent in control group.
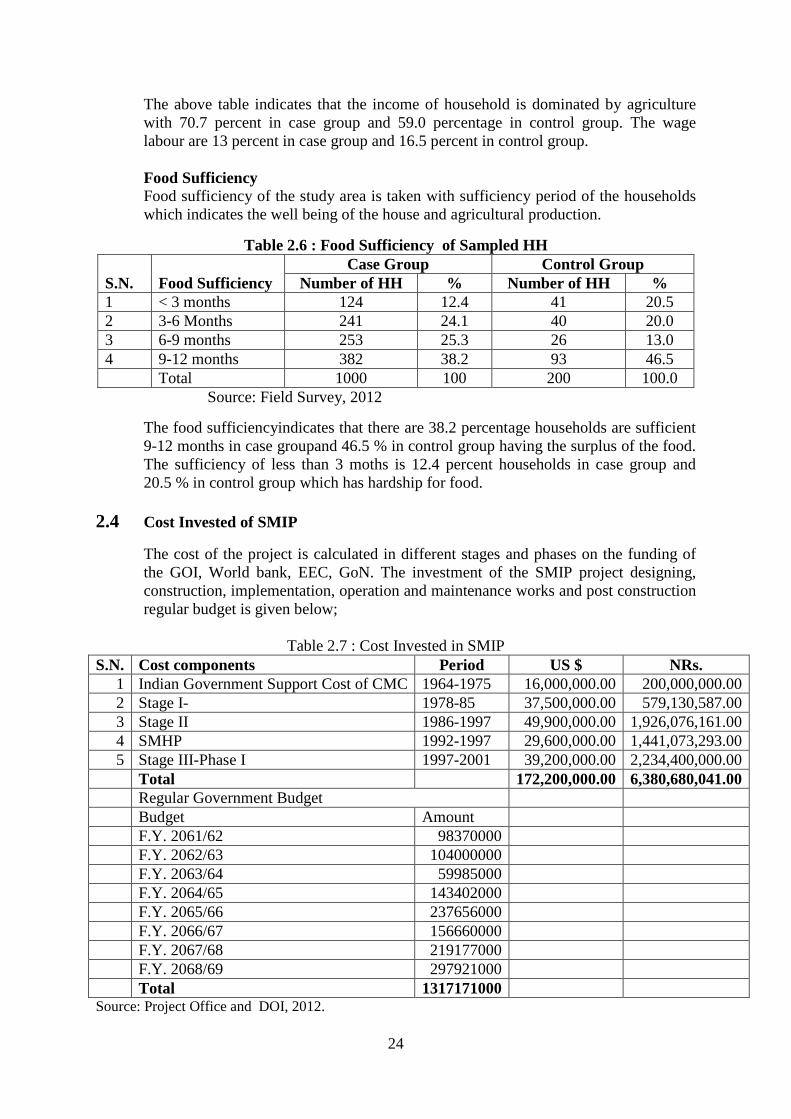
Food Sufficiency Food sufficiency of the study area is taken with sufficiency period of the households which indicates the well being of the house and agricultural production.
Table 2.6 : Food Sufficiency of Sampled HH
S.N. Food Sufficiency Case Group Control Group
Number of HH % Number of HH % 1 < 3 months 124 12.4 41 20.5 2 3-6 Months 241 24.1 40 20.0 3 6-9 months 253 25.3 26 13.0 4 9-12 months 382 38.2 93 46.5 Total 1000 100 200 100.0
Source: Field Survey, 2012
The food sufficiencyindicates that there are 38.2 percentage households are sufficient 9-12 months in case groupand 46.5 % in control group having the surplus of the food. The sufficiency of less than 3 moths is 12.4 percent households in case group and 20.5 % in control group which has hardship for food.
2.4 Cost Invested of SMIP
The cost of the project is calculated in different stages and phases on the funding of the GOI, World bank, EEC, GoN. The investment of the SMIP project designing, construction, implementation, operation and maintenance works and post construction regular budget is given below;
Table 2.7 : Cost Invested in SMIP S.N. Cost components Period US $ NRs.
1 Indian Government Support Cost of CMC 1964-1975 16,000,000.00 200,000,000.00 2 Stage I- 1978-85 37,500,000.00 579,130,587.00 3 Stage II 1986-1997 49,900,000.00 1,926,076,161.00 4 SMHP 1992-1997 29,600,000.00 1,441,073,293.00 5 Stage III-Phase I 1997-2001 39,200,000.00 2,234,400,000.00
Total 172,200,000.00 6,380,680,041.00 Regular Government Budget Budget Amount F.Y. 2061/62 98370000 F.Y. 2062/63 104000000 F.Y. 2063/64 59985000 F.Y. 2064/65 143402000 F.Y. 2065/66 237656000 F.Y. 2066/67 156660000 F.Y. 2067/68 219177000 F.Y. 2068/69 297921000 Total 1317171000 Source: Project Office and DOI, 2012.
25
The total investment cost of the project was US $ 172,200,000.00 USD and NRs.6,380,680,041.00 and the regular budget of NRs. 1,317,171,000.00
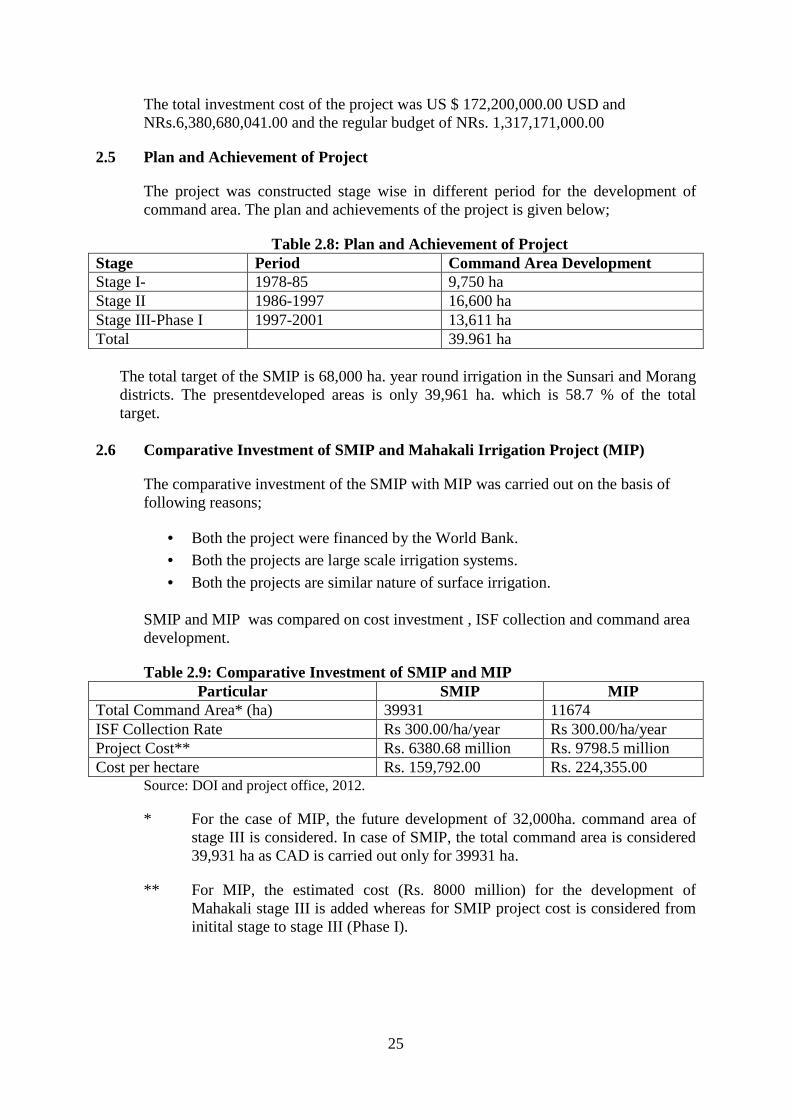
2.5 Plan and Achievement of Project
The project was constructed stage wise in different period for the development of command area. The plan and achievements of the project is given below;
Table 2.8: Plan and Achievement of Project Stage Period Command Area Development Stage I- 1978-85 9,750 ha Stage II 1986-1997 16,600 ha Stage III-Phase I 1997-2001 13,611 ha Total 39.961 ha
The total target of the SMIP is 68,000 ha. year round irrigation in the Sunsari and Morang districts. The presentdeveloped areas is only 39,961 ha. which is 58.7 % of the total target.
2.6 Comparative Investment of SMIP and Mahakali Irrigation Project (MIP)
The comparative investment of the SMIP with MIP was carried out on the basis of following reasons;
• Both the project were financed by the World Bank. • Both the projects are large scale irrigation systems.
• Both the projects are similar nature of surface irrigation.
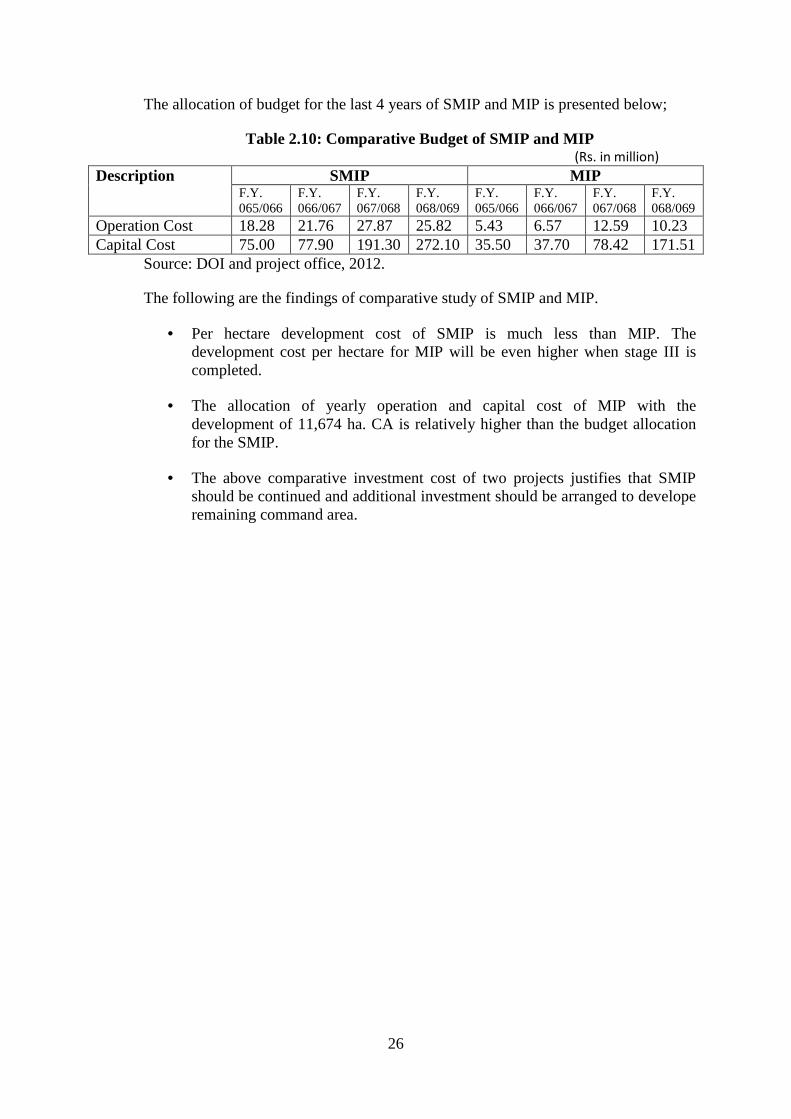
SMIP and MIP was compared on cost investment , ISF collection and command area development.
Table 2.9: Comparative Investment of SMIP and MIP Particular SMIP MIP
Total Command Area* (ha) 39931 11674 ISF Collection Rate Rs 300.00/ha/year Rs 300.00/ha/year Project Cost** Rs. 6380.68 million Rs. 9798.5 million Cost per hectare Rs. 159,792.00 Rs. 224,355.00 Source: DOI and project office, 2012.
* For the case of MIP, the future development of 32,000ha. command area of stage III is considered. In case of SMIP, the total command area is considered 39,931 ha as CAD is carried out only for 39931 ha.
** For MIP, the estimated cost (Rs. 8000 million) for the development of Mahakali stage III is added whereas for SMIP project cost is considered from initital stage to stage III (Phase I).
26
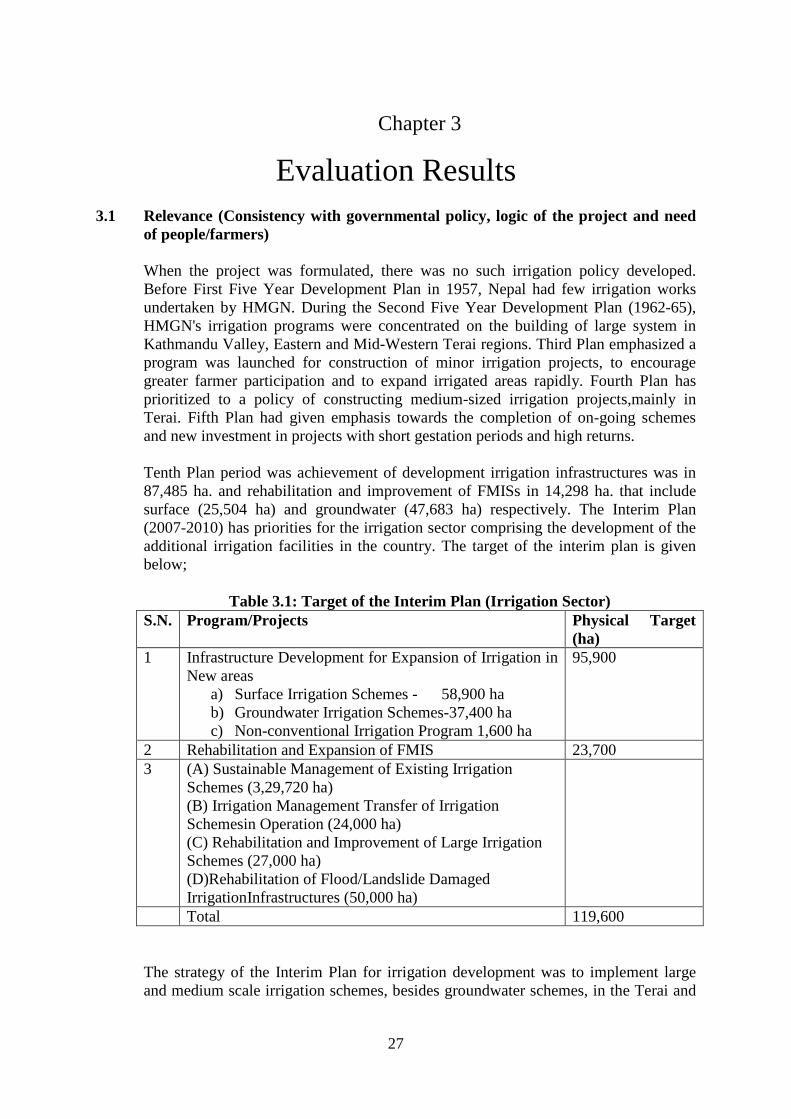
The allocation of budget for the last 4 years of SMIP and MIP is presented below;
Table 2.10: Comparative Budget of SMIP and MIP (Rs. in million)
Description SMIP MIP F.Y. 065/066
F.Y. 066/067
F.Y. 067/068
F.Y. 068/069
F.Y. 065/066
F.Y. 066/067
F.Y. 067/068
F.Y. 068/069
Operation Cost 18.28 21.76 27.87 25.82 5.43 6.57 12.59 10.23 Capital Cost 75.00 77.90 191.30 272.10 35.50 37.70 78.42 171.51
Source: DOI and project office, 2012.
The following are the findings of comparative study of SMIP and MIP.
• Per hectare development cost of SMIP is much less than MIP. The development cost per hectare for MIP will be even higher when stage III is completed.
• The allocation of yearly operation and capital cost of MIP with the development of 11,674 ha. CA is relatively higher than the budget allocation for the SMIP.
• The above comparative investment cost of two projects justifies that SMIP should be continued and additional investment should be arranged to develope remaining command area.
27
Chapter 3
Evaluation Results
3.1 Relevance (Consistency with governmental policy, logic of the project and need of people/farmers)
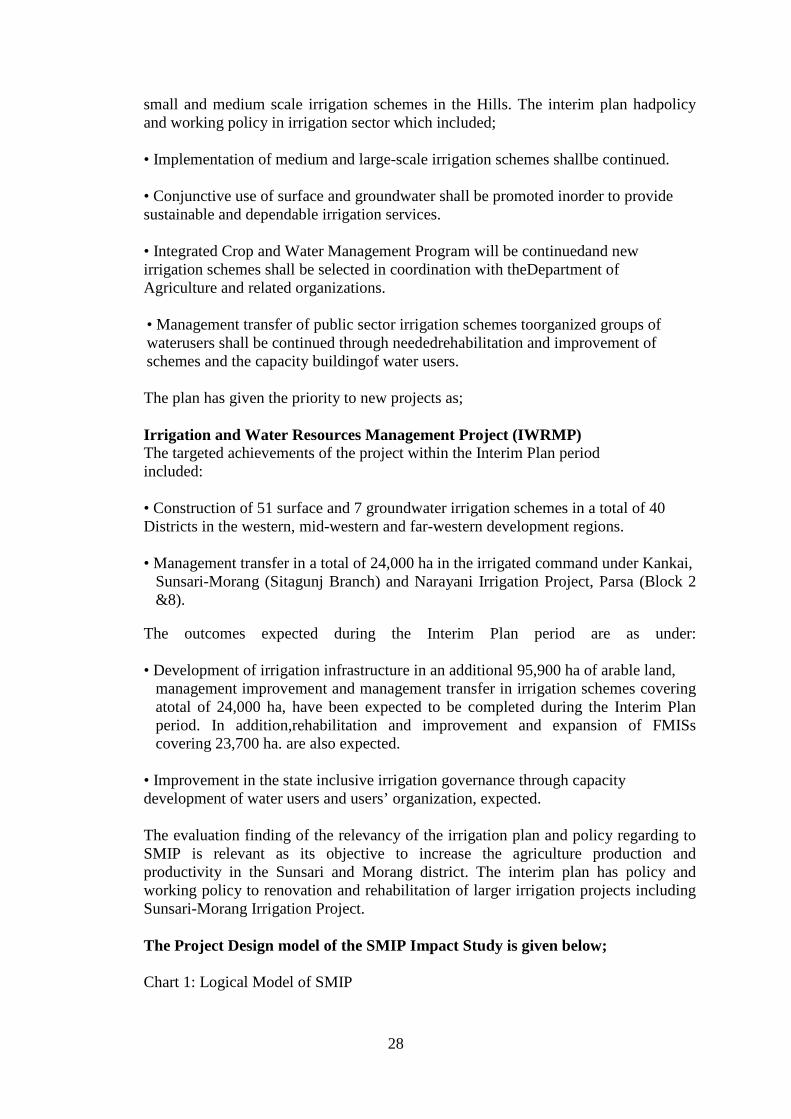
When the project was formulated, there was no such irrigation policy developed. Before First Five Year Development Plan in 1957, Nepal had few irrigation works undertaken by HMGN. During the Second Five Year Development Plan (1962-65), HMGN's irrigation programs were concentrated on the building of large system in Kathmandu Valley, Eastern and Mid-Western Terai regions. Third Plan emphasized a program was launched for construction of minor irrigation projects, to encourage greater farmer participation and to expand irrigated areas rapidly. Fourth Plan has prioritized to a policy of constructing medium-sized irrigation projects,mainly in Terai. Fifth Plan had given emphasis towards the completion of on-going schemes and new investment in projects with short gestation periods and high returns. Tenth Plan period was achievement of development irrigation infrastructures was in 87,485 ha. and rehabilitation and improvement of FMISs in 14,298 ha. that include surface (25,504 ha) and groundwater (47,683 ha) respectively. The Interim Plan (2007-2010) has priorities for the irrigation sector comprising the development of the additional irrigation facilities in the country. The target of the interim plan is given below;
Table 3.1: Target of the Interim Plan (Irrigation Sector) S.N. Program/Projects Physical Target
(ha) 1 Infrastructure Development for Expansion of Irrigation in
New areas a) Surface Irrigation Schemes - 58,900 ha b) Groundwater Irrigation Schemes-37,400 ha c) Non-conventional Irrigation Program 1,600 ha
95,900
2 Rehabilitation and Expansion of FMIS 23,700 3 (A) Sustainable Management of Existing Irrigation
Schemes (3,29,720 ha) (B) Irrigation Management Transfer of Irrigation Schemesin Operation (24,000 ha) (C) Rehabilitation and Improvement of Large Irrigation Schemes (27,000 ha) (D)Rehabilitation of Flood/Landslide Damaged IrrigationInfrastructures (50,000 ha)
Total 119,600 The strategy of the Interim Plan for irrigation development was to implement large and medium scale irrigation schemes, besides groundwater schemes, in the Terai and
28
small and medium scale irrigation schemes in the Hills. The interim plan hadpolicy and working policy in irrigation sector which included; • Implementation of medium and large-scale irrigation schemes shallbe continued.
• Conjunctive use of surface and groundwater shall be promoted inorder to provide sustainable and dependable irrigation services. • Integrated Crop and Water Management Program will be continuedand new irrigation schemes shall be selected in coordination with theDepartment of Agriculture and related organizations. • Management transfer of public sector irrigation schemes toorganized groups of waterusers shall be continued through neededrehabilitation and improvement of schemes and the capacity buildingof water users. The plan has given the priority to new projects as;
Irrigation and Water Resources Management Project (IWRMP) The targeted achievements of the project within the Interim Plan period included: • Construction of 51 surface and 7 groundwater irrigation schemes in a total of 40 Districts in the western, mid-western and far-western development regions. • Management transfer in a total of 24,000 ha in the irrigated command under Kankai,
Sunsari-Morang (Sitagunj Branch) and Narayani Irrigation Project, Parsa (Block 2 &8).
The outcomes expected during the Interim Plan period are as under: • Development of irrigation infrastructure in an additional 95,900 ha of arable land,
management improvement and management transfer in irrigation schemes covering atotal of 24,000 ha, have been expected to be completed during the Interim Plan period. In addition,rehabilitation and improvement and expansion of FMISs covering 23,700 ha. are also expected.
• Improvement in the state inclusive irrigation governance through capacity development of water users and users’ organization, expected. The evaluation finding of the relevancy of the irrigation plan and policy regarding to SMIP is relevant as its objective to increase the agriculture production and productivity in the Sunsari and Morang district. The interim plan has policy and working policy to renovation and rehabilitation of larger irrigation projects including Sunsari-Morang Irrigation Project. The Project Design model of the SMIP Impact Study is given below; Chart 1: Logical Model of SMIP
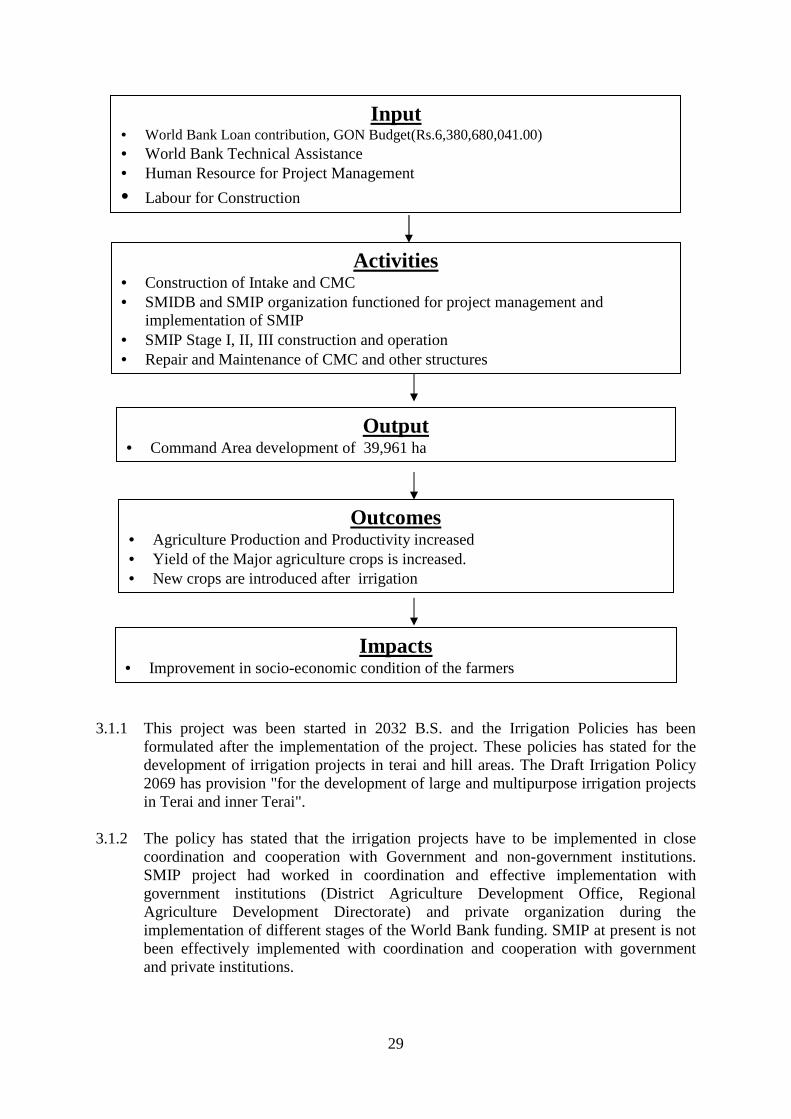
29
3.1.1 This project was been started in 2032 B.S. and the Irrigation Policies has been formulated after the implementation of the project. These policies has stated for the development of irrigation projects in terai and hill areas. The Draft Irrigation Policy 2069 has provision "for the development of large and multipurpose irrigation projects in Terai and inner Terai".
3.1.2 The policy has stated that the irrigation projects have to be implemented in close coordination and cooperation with Government and non-government institutions. SMIP project had worked in coordination and effective implementation with government institutions (District Agriculture Development Office, Regional Agriculture Development Directorate) and private organization during the implementation of different stages of the World Bank funding. SMIP at present is not been effectively implemented with coordination and cooperation with government and private institutions.
Input • World Bank Loan contribution, GON Budget(Rs.6,380,680,041.00) • World Bank Technical Assistance • Human Resource for Project Management
• Labour for Construction
Activities • Construction of Intake and CMC • SMIDB and SMIP organization functioned for project management and
implementation of SMIP • SMIP Stage I, II, III construction and operation • Repair and Maintenance of CMC and other structures
Output • Command Area development of 39,961 ha
Outcomes • Agriculture Production and Productivity increased • Yield of the Major agriculture crops is increased. • New crops are introduced after irrigation
Impacts • Improvement in socio-economic condition of the farmers
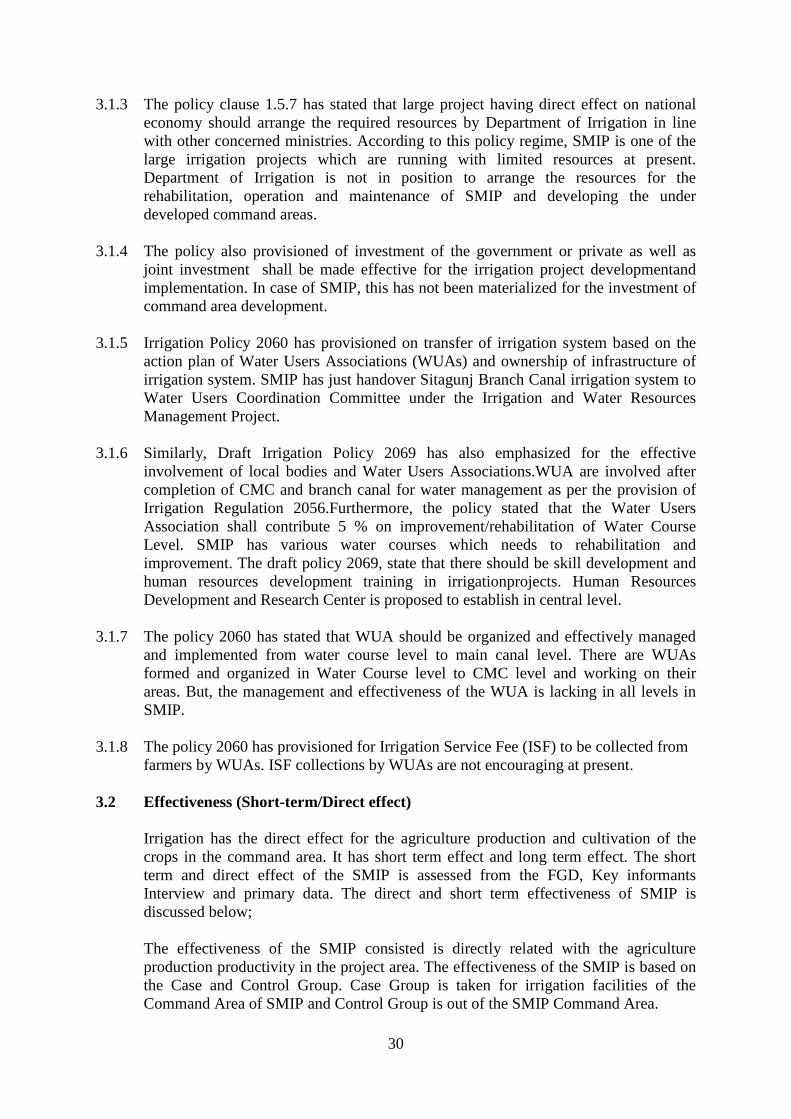
30
3.1.3 The policy clause 1.5.7 has stated that large project having direct effect on national economy should arrange the required resources by Department of Irrigation in line with other concerned ministries. According to this policy regime, SMIP is one of the large irrigation projects which are running with limited resources at present. Department of Irrigation is not in position to arrange the resources for the rehabilitation, operation and maintenance of SMIP and developing the under developed command areas.
3.1.4 The policy also provisioned of investment of the government or private as well as
joint investment shall be made effective for the irrigation project developmentand implementation. In case of SMIP, this has not been materialized for the investment of command area development.
3.1.5 Irrigation Policy 2060 has provisioned on transfer of irrigation system based on the
action plan of Water Users Associations (WUAs) and ownership of infrastructure of irrigation system. SMIP has just handover Sitagunj Branch Canal irrigation system to Water Users Coordination Committee under the Irrigation and Water Resources Management Project.
3.1.6 Similarly, Draft Irrigation Policy 2069 has also emphasized for the effective
involvement of local bodies and Water Users Associations.WUA are involved after completion of CMC and branch canal for water management as per the provision of Irrigation Regulation 2056.Furthermore, the policy stated that the Water Users Association shall contribute 5 % on improvement/rehabilitation of Water Course Level. SMIP has various water courses which needs to rehabilitation and improvement. The draft policy 2069, state that there should be skill development and human resources development training in irrigationprojects. Human Resources Development and Research Center is proposed to establish in central level.
3.1.7 The policy 2060 has stated that WUA should be organized and effectively managed
and implemented from water course level to main canal level. There are WUAs formed and organized in Water Course level to CMC level and working on their areas. But, the management and effectiveness of the WUA is lacking in all levels in SMIP.
3.1.8 The policy 2060 has provisioned for Irrigation Service Fee (ISF) to be collected from
farmers by WUAs. ISF collections by WUAs are not encouraging at present. 3.2 Effectiveness (Short-term/Direct effect)
Irrigation has the direct effect for the agriculture production and cultivation of the crops in the command area. It has short term effect and long term effect. The short term and direct effect of the SMIP is assessed from the FGD, Key informants Interview and primary data. The direct and short term effectiveness of SMIP is discussed below; The effectiveness of the SMIP consisted is directly related with the agriculture production productivity in the project area. The effectiveness of the SMIP is based on the Case and Control Group. Case Group is taken for irrigation facilities of the Command Area of SMIP and Control Group is out of the SMIP Command Area.
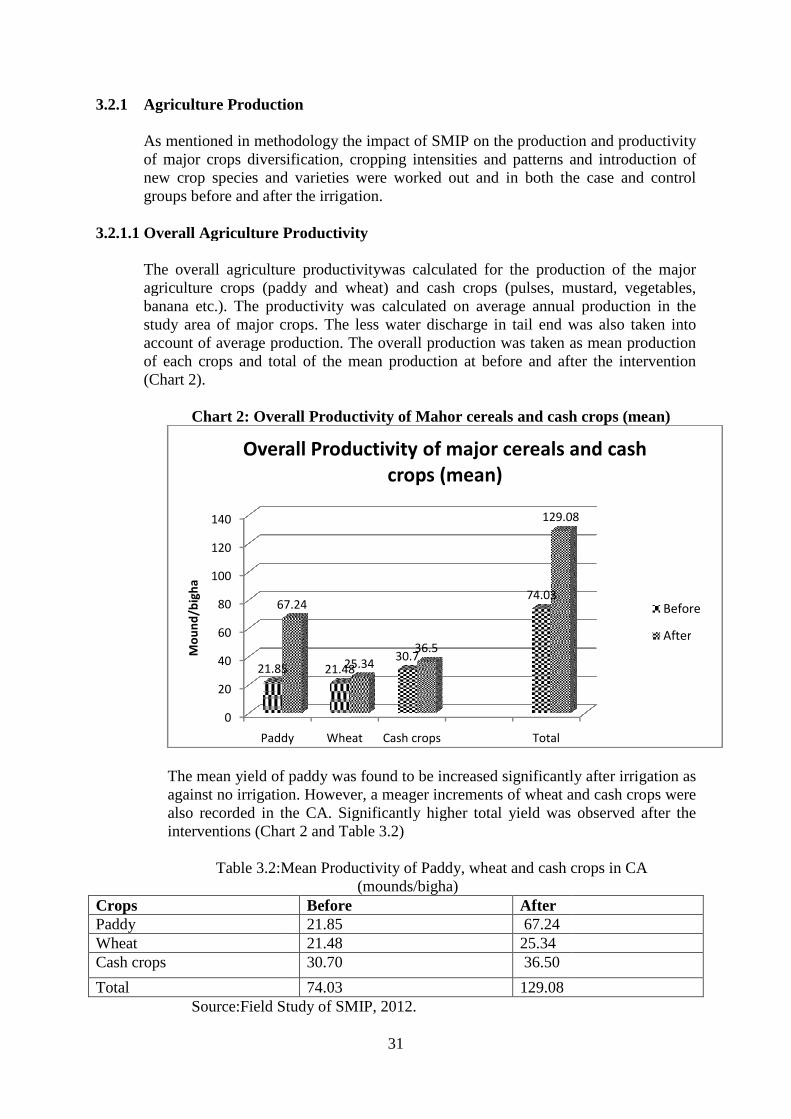
3.2.1 Agriculture Production As mentioned in methodology the impact of SMIP on the production and productivity of major crops diversification, cropping intensities and patterns and introduction of new crop species and varietiesgroups before and after the irrigation.
3.2.1.1 Overall Agriculture Producti
The overall agriculture productiagriculture crops (paddy and wheat) and banana etc.). The productivity was calculated on average annual production in the study area of major crops. account of average production. of each crops and total of the mean production at before and after the intervention(Chart 2).
Chart 2: Overall
The mean yield of paddy was found to be increased significantly after irrigation as against no irrigation. However, a also recorded in the CA. Significantly higher total yield was observed after the interventions (Chart
Table 3.2:Mean Productivity of Paddy, wheat and cash crops in CA
Crops Paddy Wheat Cash crops
Total Source:Field Study of SMIP, 2012.
0
20
40
60
80
100
120
140
Paddy
21.85
67.24
Mo
un
d/b
igh
a
Overall Productivity of major cereals and cash
31
Agriculture Production
As mentioned in methodology the impact of SMIP on the production and productivity of major crops diversification, cropping intensities and patterns and introduction of new crop species and varieties were worked out and in both the case and control groups before and after the irrigation.
Agriculture Producti vity
griculture productivitywas calculated for the production of the major agriculture crops (paddy and wheat) and cash crops (pulses, mustard, vegetables,
The productivity was calculated on average annual production in the study area of major crops. The less water discharge in tail end was account of average production. The overall production was taken as mean production of each crops and total of the mean production at before and after the intervention
Overall Productivity of Mahor cereals and cash crops (mean)
mean yield of paddy was found to be increased significantly after irrigation as against no irrigation. However, a meager increments of wheat and cash crops were also recorded in the CA. Significantly higher total yield was observed after the
Chart 2 and Table 3.2)
Mean Productivity of Paddy, wheat and cash crops in CA (mounds/bigha)
Before After 21.85 67.24 21.48 25.34 30.70 36.50
74.03 129.08 Source:Field Study of SMIP, 2012.
Paddy Wheat Cash crops Total
21.85 21.4830.7
74.0367.24
25.34
36.5
129.08
Overall Productivity of major cereals and cash
crops (mean)
As mentioned in methodology the impact of SMIP on the production and productivity of major crops diversification, cropping intensities and patterns and introduction of
were worked out and in both the case and control
the production of the major cash crops (pulses, mustard, vegetables,
The productivity was calculated on average annual production in the was also taken into
s taken as mean production of each crops and total of the mean production at before and after the intervention
ash crops (mean)
mean yield of paddy was found to be increased significantly after irrigation as increments of wheat and cash crops were
also recorded in the CA. Significantly higher total yield was observed after the
Mean Productivity of Paddy, wheat and cash crops in CA
129.08
Overall Productivity of major cereals and cash
Before
After
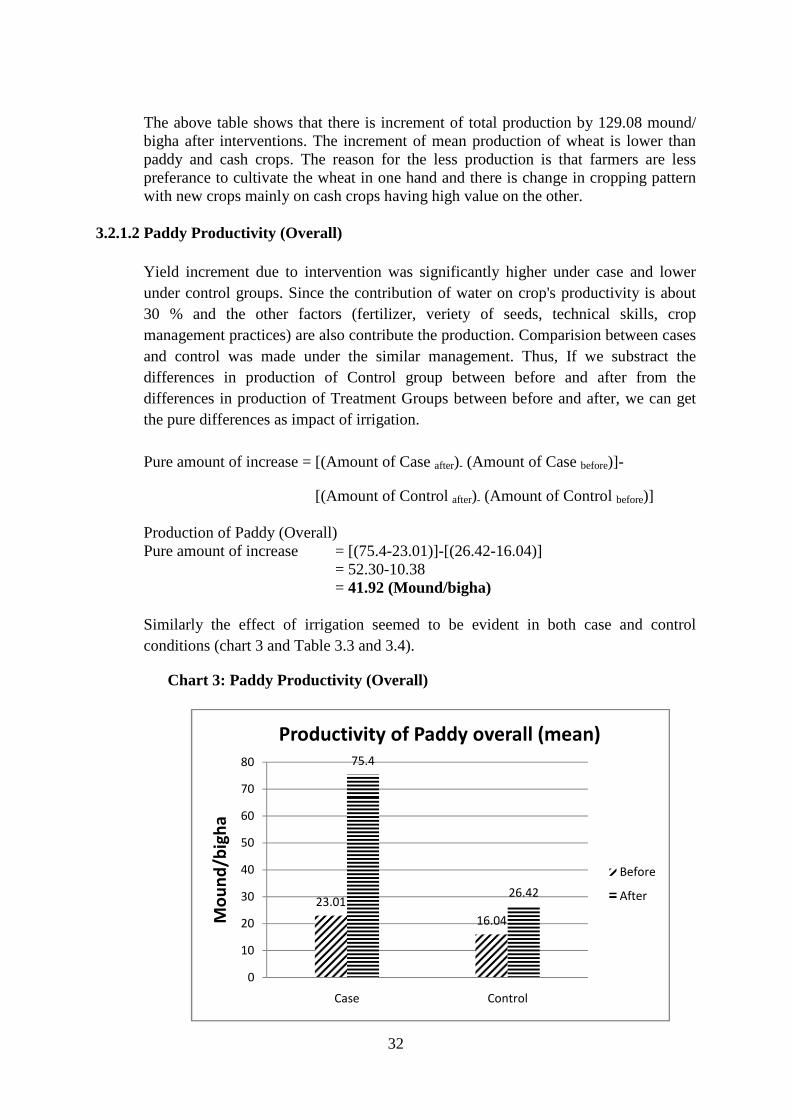
32
The above table shows that there is increment of total production by 129.08 mound/ bigha after interventions. The increment of mean production of wheat is lower than paddy and cash crops. The reason for the less production is that farmers are less preferance to cultivate the wheat in one hand and there is change in cropping pattern with new crops mainly on cash crops having high value on the other.
3.2.1.2 Paddy Productivity (Overall)
Yield increment due to intervention was significantly higher under case and lower under control groups. Since the contribution of water on crop's productivity is about 30 % and the other factors (fertilizer, veriety of seeds, technical skills, crop management practices) are also contribute the production. Comparision between cases and control was made under the similar management. Thus, If we substract the differences in production of Control group between before and after from the differences in production of Treatment Groups between before and after, we can get the pure differences as impact of irrigation. Pure amount of increase = [(Amount of Case after)- (Amount of Case before)]-
[(Amount of Control after)- (Amount of Control before)] Production of Paddy (Overall) Pure amount of increase = [(75.4-23.01)]-[(26.42-16.04)] = 52.30-10.38 = 41.92 (Mound/bigha)
Similarly the effect of irrigation seemed to be evident in both case and control conditions (chart 3 and Table 3.3 and 3.4).
Chart 3: Paddy Productivity (Overall)
23.01
16.04
75.4
26.42
0
10
20
30
40
50
60
70
80
Case Control
Mo
un
d/b
igh
a
Productivity of Paddy overall (mean)
Before
After
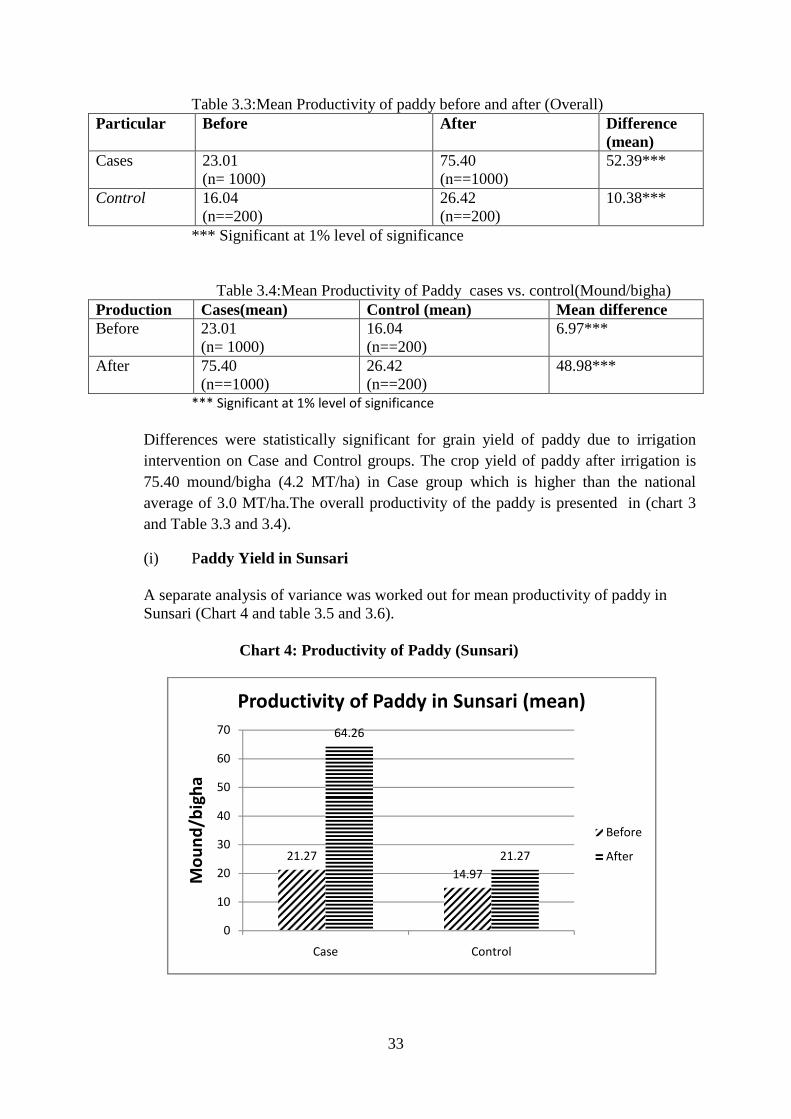
33
Table 3.3:Mean Productivity of paddy before and after (Overall) Particular Before After Difference
(mean) Cases 23.01
(n= 1000) 75.40 (n==1000)
52.39***
Control 16.04 (n==200)
26.42 (n==200)
10.38***
*** Significant at 1% level of significance
Table 3.4:Mean Productivity of Paddy cases vs. control(Mound/bigha)
Production Cases(mean) Control (mean) Mean difference Before 23.01
(n= 1000) 16.04 (n==200)
6.97***
After 75.40 (n==1000)
26.42 (n==200)
48.98***
*** Significant at 1% level of significance
Differences were statistically significant for grain yield of paddy due to irrigation intervention on Case and Control groups. The crop yield of paddy after irrigation is 75.40 mound/bigha (4.2 MT/ha) in Case group which is higher than the national average of 3.0 MT/ha.The overall productivity of the paddy is presented in (chart 3 and Table 3.3 and 3.4).
(i) Paddy Yield in Sunsari
A separate analysis of variance was worked out for mean productivity of paddy in Sunsari (Chart 4 and table 3.5 and 3.6).
Chart 4: Productivity of Paddy (Sunsari)
21.27
14.97
64.26
21.27
0
10
20
30
40
50
60
70
Case Control
Mo
un
d/b
igh
a
Productivity of Paddy in Sunsari (mean)
Before
After
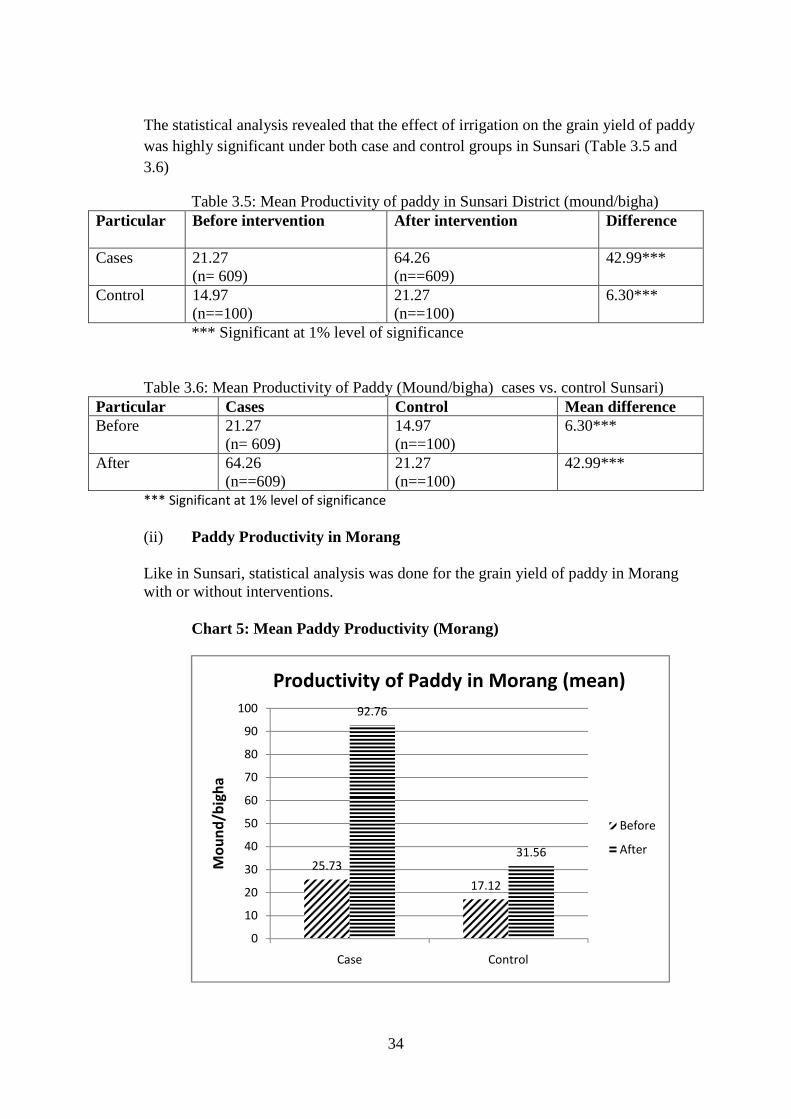
34
The statistical analysis revealed that the effect of irrigation on the grain yield of paddy was highly significant under both case and control groups in Sunsari (Table 3.5 and 3.6)
Table 3.5: Mean Productivity of paddy in Sunsari District (mound/bigha) Particular Before intervention
After intervention
Difference
Cases 21.27 (n= 609)
64.26 (n==609)
42.99***
Control 14.97 (n==100)
21.27 (n==100)
6.30***
*** Significant at 1% level of significance
Table 3.6: Mean Productivity of Paddy (Mound/bigha) cases vs. control Sunsari)
Particular Cases Control Mean difference Before 21.27
(n= 609) 14.97 (n==100)
6.30***
After 64.26 (n==609)
21.27 (n==100)
42.99***
*** Significant at 1% level of significance
(ii) Paddy Productivity in Morang
Like in Sunsari, statistical analysis was done for the grain yield of paddy in Morang with or without interventions.
Chart 5: Mean Paddy Productivity (Morang)
25.73
17.12
92.76
31.56
0
10
20
30
40
50
60
70
80
90
100
Case Control
Mo
un
d/b
igh
a
Productivity of Paddy in Morang (mean)
Before
After
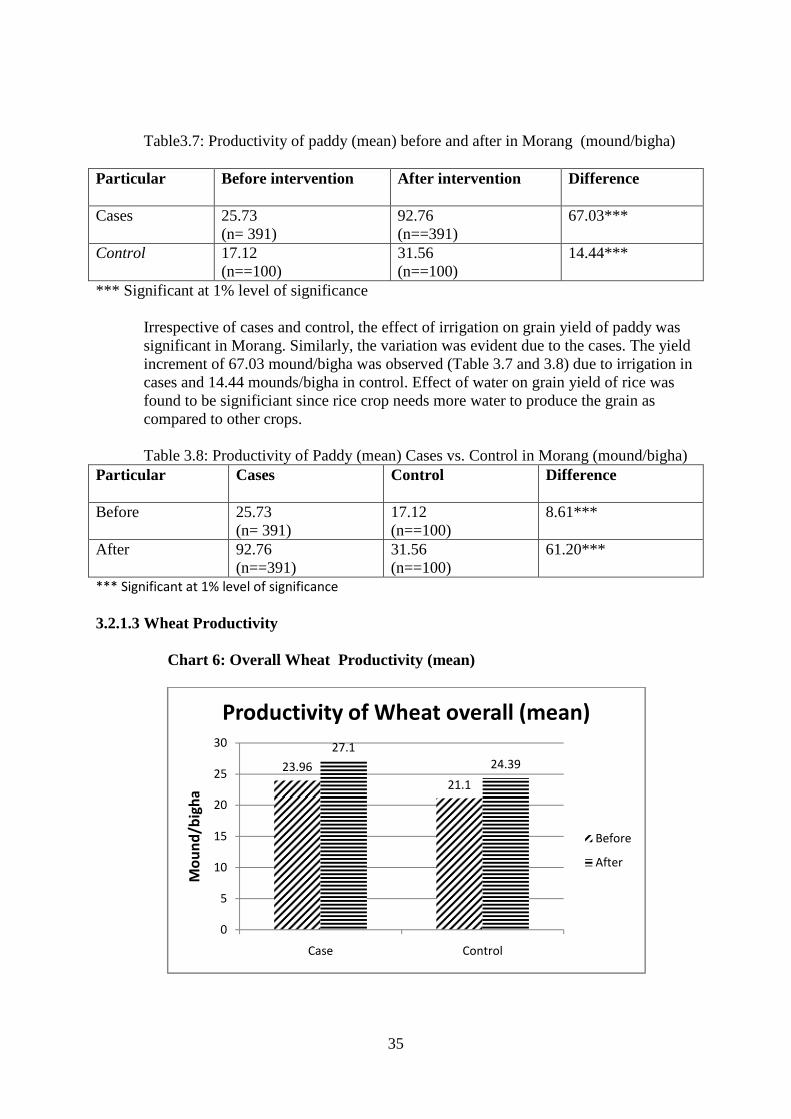
35
Table3.7: Productivity of paddy (mean) before and after in Morang (mound/bigha)
Particular Before intervention
After intervention
Difference
Cases 25.73 (n= 391)
92.76 (n==391)
67.03***
Control 17.12 (n==100)
31.56 (n==100)
14.44***
*** Significant at 1% level of significance
Irrespective of cases and control, the effect of irrigation on grain yield of paddy was significant in Morang. Similarly, the variation was evident due to the cases. The yield increment of 67.03 mound/bigha was observed (Table 3.7 and 3.8) due to irrigation in cases and 14.44 mounds/bigha in control. Effect of water on grain yield of rice was found to be significiant since rice crop needs more water to produce the grain as compared to other crops.
Table 3.8: Productivity of Paddy (mean) Cases vs. Control in Morang (mound/bigha)
Particular Cases Control
Difference
Before 25.73 (n= 391)
17.12 (n==100)
8.61***
After 92.76 (n==391)
31.56 (n==100)
61.20***
*** Significant at 1% level of significance
3.2.1.3 Wheat Productivity
Chart 6: Overall Wheat Productivity (mean)
23.96
21.1
27.1
24.39
0
5
10
15
20
25
30
Case Control
Mo
un
d/b
igh
a
Productivity of Wheat overall (mean)
Before
After
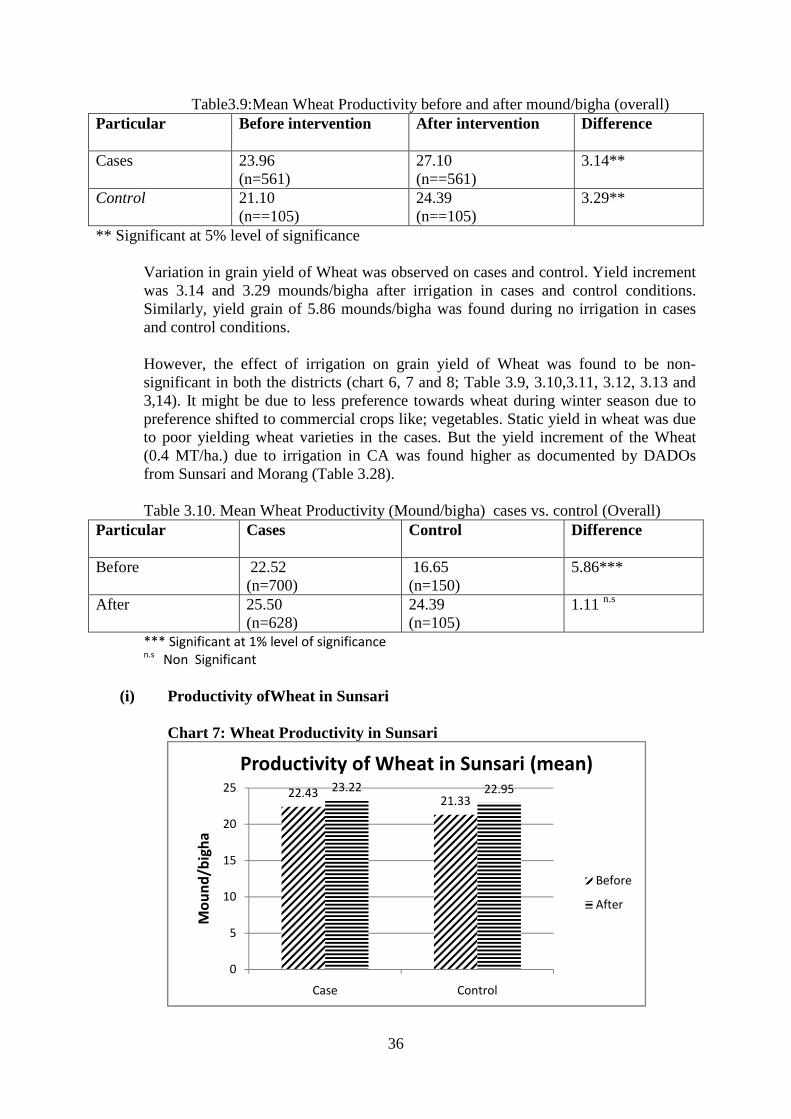
36
Table3.9:Mean Wheat Productivity before and after mound/bigha (overall) Particular Before intervention
After intervention
Difference
Cases 23.96 (n=561)
27.10 (n==561)
3.14**
Control 21.10 (n==105)
24.39 (n==105)
3.29**
** Significant at 5% level of significance Variation in grain yield of Wheat was observed on cases and control. Yield increment was 3.14 and 3.29 mounds/bigha after irrigation in cases and control conditions. Similarly, yield grain of 5.86 mounds/bigha was found during no irrigation in cases and control conditions. However, the effect of irrigation on grain yield of Wheat was found to be non-significant in both the districts (chart 6, 7 and 8; Table 3.9, 3.10,3.11, 3.12, 3.13 and 3,14). It might be due to less preference towards wheat during winter season due to preference shifted to commercial crops like; vegetables. Static yield in wheat was due to poor yielding wheat varieties in the cases. But the yield increment of the Wheat (0.4 MT/ha.) due to irrigation in CA was found higher as documented by DADOs from Sunsari and Morang (Table 3.28). Table 3.10. Mean Wheat Productivity (Mound/bigha) cases vs. control (Overall)
Particular Cases Control
Difference
Before 22.52 (n=700)
16.65 (n=150)
5.86***
After 25.50 (n=628)
24.39 (n=105)
1.11 n.s
*** Significant at 1% level of significance n.s
Non Significant
(i) Productivity ofWheat in Sunsari
Chart 7: Wheat Productivity in Sunsari
22.4321.33
23.22 22.95
0
5
10
15
20
25
Case Control
Mo
un
d/b
igh
a
Productivity of Wheat in Sunsari (mean)
Before
After
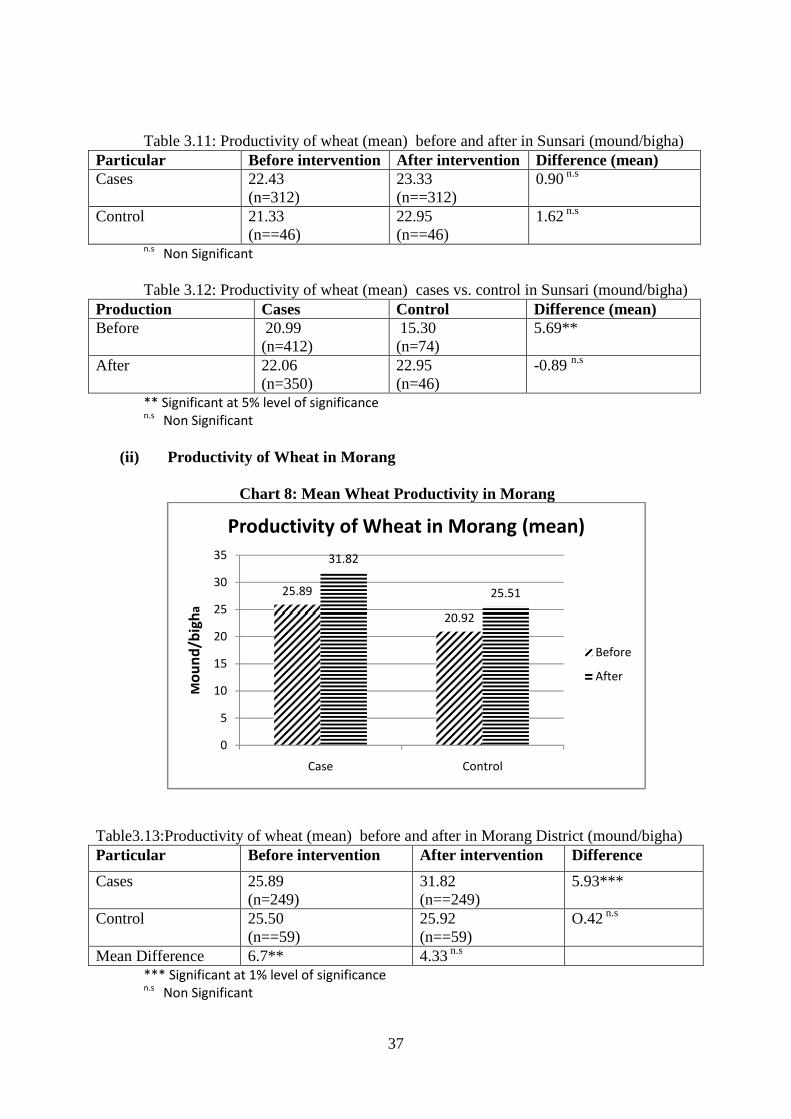
37
Table 3.11: Productivity of wheat (mean) before and after in Sunsari (mound/bigha)
Particular Before intervention After intervention D ifference (mean) Cases 22.43
(n=312) 23.33 (n==312)
0.90 n.s
Control 21.33 (n==46)
22.95 (n==46)
1.62 n.s
n.s Non Significant
Table 3.12: Productivity of wheat (mean) cases vs. control in Sunsari (mound/bigha)
Production Cases Control Difference (mean) Before 20.99
(n=412) 15.30 (n=74)
5.69**
After 22.06 (n=350)
22.95 (n=46)
-0.89 n.s
** Significant at 5% level of significance n.s
Non Significant
(ii) Productivity of Wheat in Morang
Chart 8: Mean Wheat Productivity in Morang
Table3.13:Productivity of wheat (mean) before and after in Morang District (mound/bigha) Particular Before intervention After intervention D ifference
Cases 25.89 (n=249)
31.82 (n==249)
5.93***
Control 25.50 (n==59)
25.92 (n==59)
O.42 n.s
Mean Difference 6.7** 4.33 n.s *** Significant at 1% level of significance n.s
Non Significant
25.89
20.92
31.82
25.51
0
5
10
15
20
25
30
35
Case Control
Mo
un
d/b
igh
a
Productivity of Wheat in Morang (mean)
Before
After
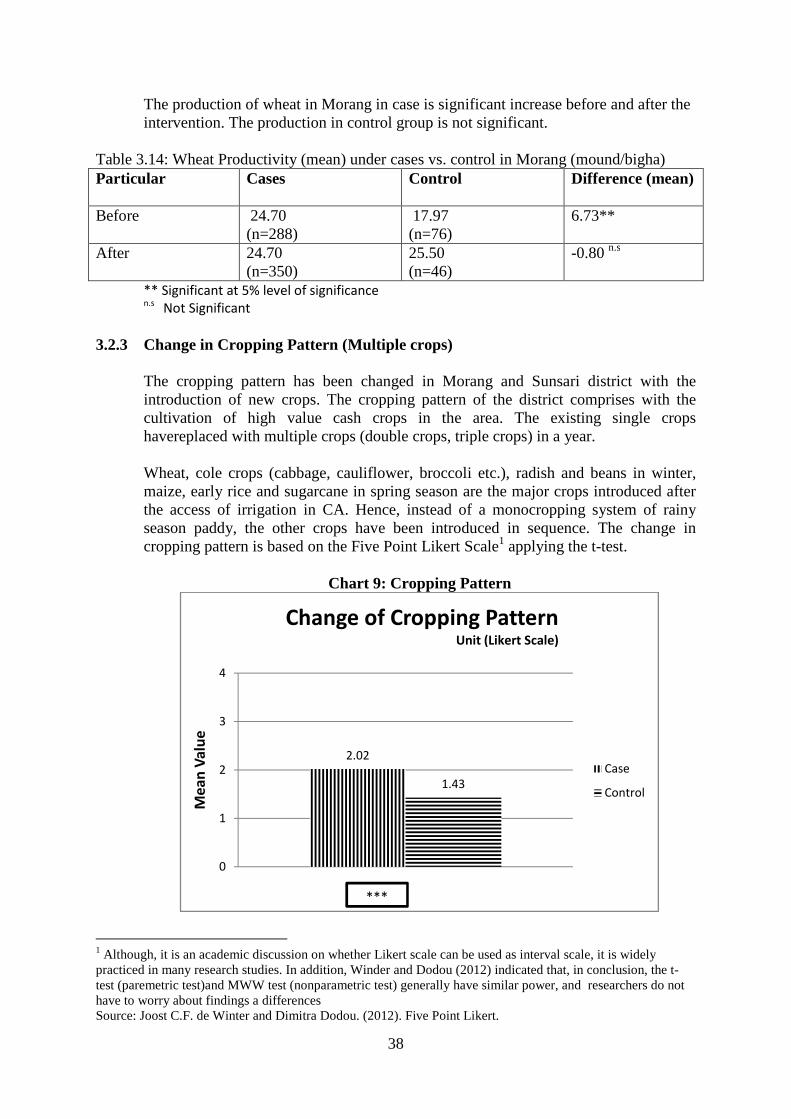
38
The production of wheat in Morang in case is significant increase before and after the intervention. The production in control group is not significant.
Table 3.14: Wheat Productivity (mean) under cases vs. control in Morang (mound/bigha) Particular Cases Control
Difference (mean)
Before 24.70 (n=288)
17.97 (n=76)
6.73**
After 24.70 (n=350)
25.50 (n=46)
-0.80 n.s
** Significant at 5% level of significance n.s
Not Significant
3.2.3 Change in Cropping Pattern (Multiple crops)
The cropping pattern has been changed in Morang and Sunsari district with the introduction of new crops. The cropping pattern of the district comprises with the cultivation of high value cash crops in the area. The existing single crops havereplaced with multiple crops (double crops, triple crops) in a year. Wheat, cole crops (cabbage, cauliflower, broccoli etc.), radish and beans in winter, maize, early rice and sugarcane in spring season are the major crops introduced after the access of irrigation in CA. Hence, instead of a monocropping system of rainy season paddy, the other crops have been introduced in sequence. The change in cropping pattern is based on the Five Point Likert Scale1 applying the t-test.
Chart 9: Cropping Pattern
1 Although, it is an academic discussion on whether Likert scale can be used as interval scale, it is widely practiced in many research studies. In addition, Winder and Dodou (2012) indicated that, in conclusion, the t-test (paremetric test)and MWW test (nonparametric test) generally have similar power, and researchers do not have to worry about findings a differences Source: Joost C.F. de Winter and Dimitra Dodou. (2012). Five Point Likert.
2.02
1.43
0
1
2
3
4
Me
an
Va
lue
Change of Cropping PatternUnit (Likert Scale)
Case
Control
***
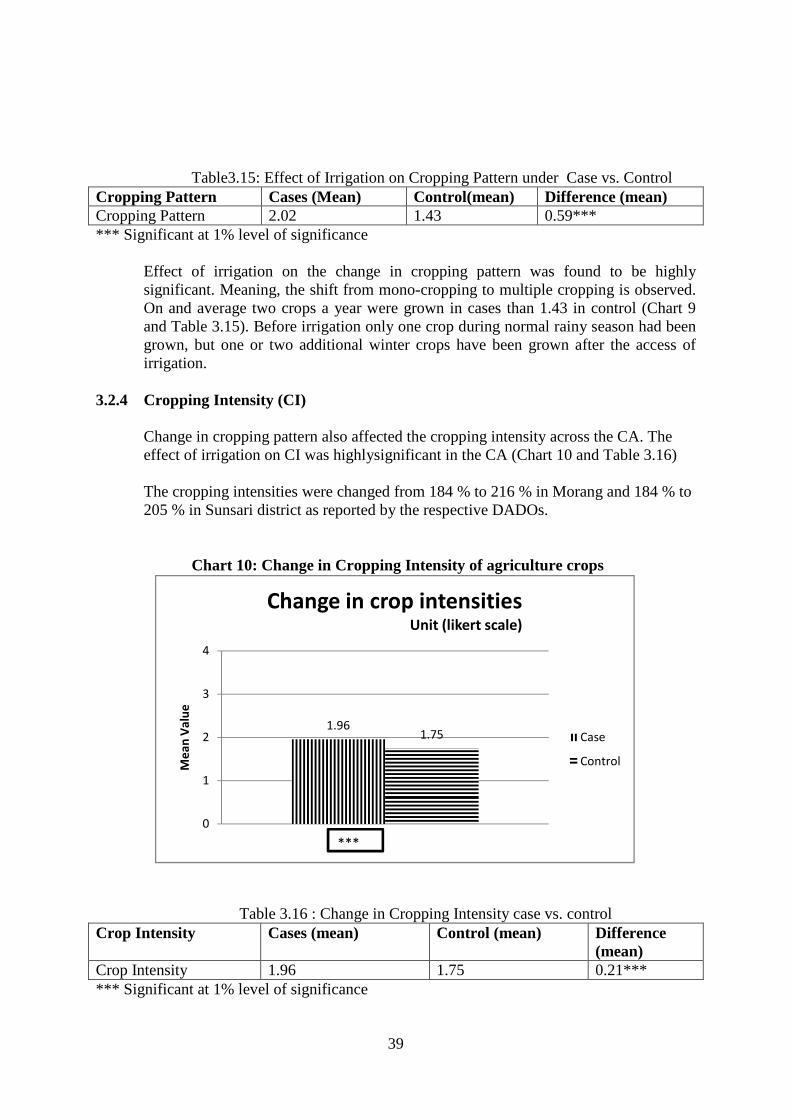
39
1.961.75
0
1
2
3
4
Me
an
Va
lue
Change in crop intensities Unit (likert scale)
Case
Control
***
Table3.15: Effect of Irrigation on Cropping Pattern under Case vs. Control
Cropping Pattern Cases (Mean) Control(mean) Difference (mean) Cropping Pattern 2.02 1.43 0.59*** *** Significant at 1% level of significance
Effect of irrigation on the change in cropping pattern was found to be highly significant. Meaning, the shift from mono-cropping to multiple cropping is observed. On and average two crops a year were grown in cases than 1.43 in control (Chart 9 and Table 3.15). Before irrigation only one crop during normal rainy season had been grown, but one or two additional winter crops have been grown after the access of irrigation.
3.2.4 Cropping Intensity (CI)
Change in cropping pattern also affected the cropping intensity across the CA. The effect of irrigation on CI was highlysignificant in the CA (Chart 10 and Table 3.16) The cropping intensities were changed from 184 % to 216 % in Morang and 184 % to 205 % in Sunsari district as reported by the respective DADOs.
Chart 10: Change in Cropping Intensity of agriculture crops
Table 3.16 : Change in Cropping Intensity case vs. control
Crop Intensity
Cases (mean) Control (mean) Difference (mean)
Crop Intensity 1.96 1.75 0.21*** *** Significant at 1% level of significance
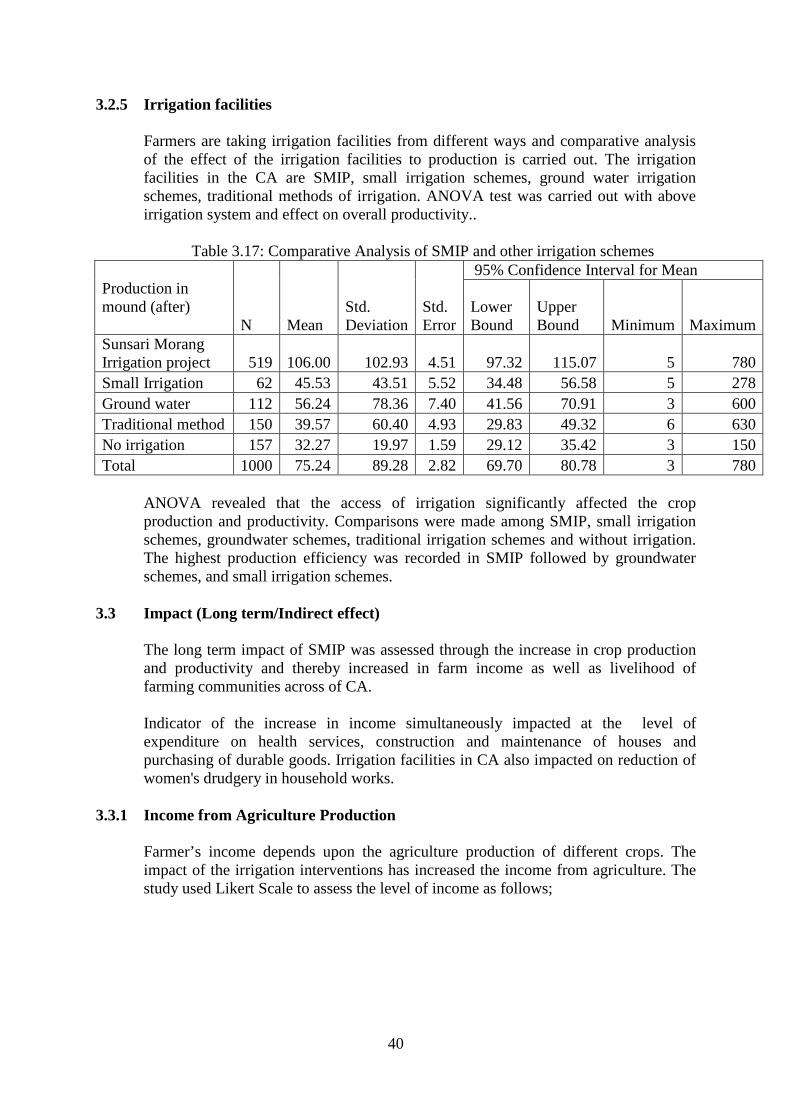
40
3.2.5 Irrigation facilities Farmers are taking irrigation facilities from different ways and comparative analysis of the effect of the irrigation facilities to production is carried out. The irrigation facilities in the CA are SMIP, small irrigation schemes, ground water irrigation schemes, traditional methods of irrigation. ANOVA test was carried out with above irrigation system and effect on overall productivity..
Table 3.17: Comparative Analysis of SMIP and other irrigation schemes
Production in mound (after)
N
Mean
Std. Deviation
Std. Error
95% Confidence Interval for Mean
Lower Bound
Upper Bound Minimum Maximum
Sunsari Morang Irrigation project 519 106.00 102.93 4.51 97.32 115.07 5 780 Small Irrigation 62 45.53 43.51 5.52 34.48 56.58 5 278 Ground water 112 56.24 78.36 7.40 41.56 70.91 3 600 Traditional method 150 39.57 60.40 4.93 29.83 49.32 6 630 No irrigation 157 32.27 19.97 1.59 29.12 35.42 3 150 Total 1000 75.24 89.28 2.82 69.70 80.78 3 780
ANOVA revealed that the access of irrigation significantly affected the crop production and productivity. Comparisons were made among SMIP, small irrigation schemes, groundwater schemes, traditional irrigation schemes and without irrigation. The highest production efficiency was recorded in SMIP followed by groundwater schemes, and small irrigation schemes.
3.3 Impact (Long term/Indirect effect)
The long term impact of SMIP was assessed through the increase in crop production and productivity and thereby increased in farm income as well as livelihood of farming communities across of CA. Indicator of the increase in income simultaneously impacted at the level of expenditure on health services, construction and maintenance of houses and purchasing of durable goods. Irrigation facilities in CA also impacted on reduction of women's drudgery in household works.
3.3.1 Income from Agriculture Production Farmer’s income depends upon the agriculture production of different crops. The impact of the irrigation interventions has increased the income from agriculture. The study used Likert Scale to assess the level of income as follows;
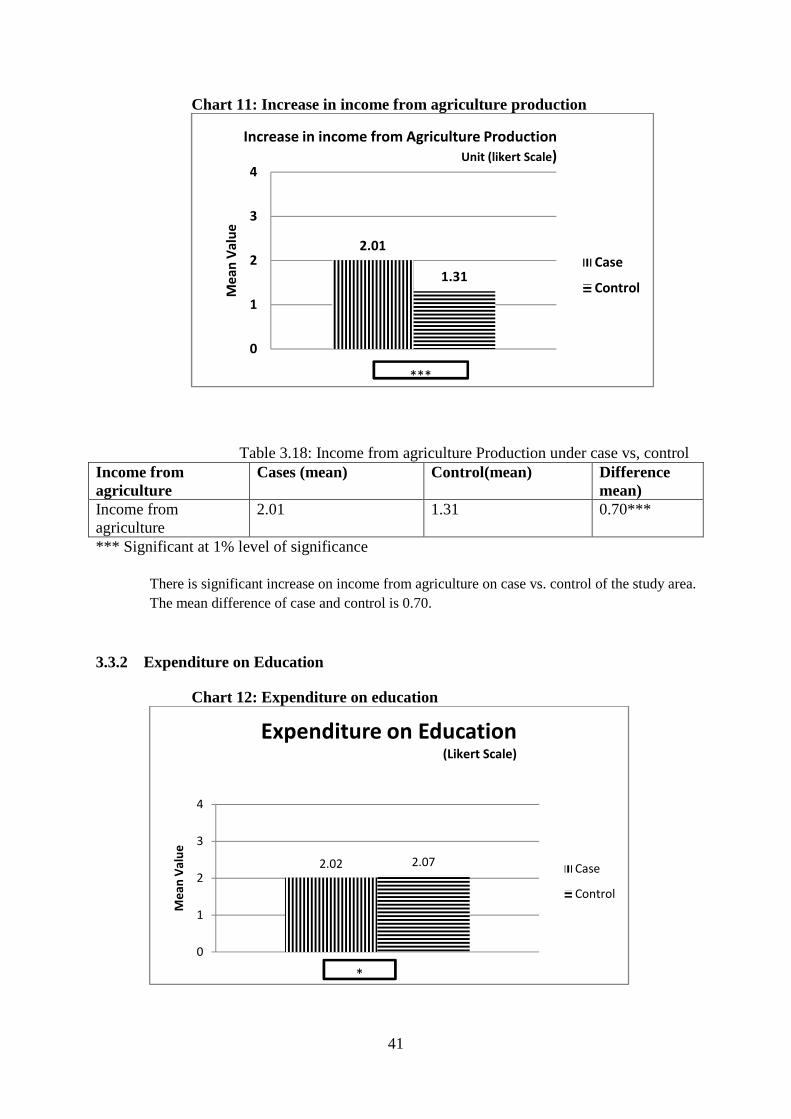
41
Chart 11: Increase in income from agriculture production
Table 3.18: Income from agriculture Production under case vs, control
Income from agriculture
Cases (mean) Control(mean) Difference mean)
Income from agriculture
2.01 1.31 0.70***
*** Significant at 1% level of significance There is significant increase on income from agriculture on case vs. control of the study area. The mean difference of case and control is 0.70.
3.3.2 Expenditure on Education
Chart 12: Expenditure on education
2.01
1.31
0
1
2
3
4
Me
an
Va
lue
Increase in income from Agriculture Production
Unit (likert Scale)
Case
Control
***
2.02 2.07
0
1
2
3
4
Me
an
Va
lue
Expenditure on Education(Likert Scale)
Case
Control
*
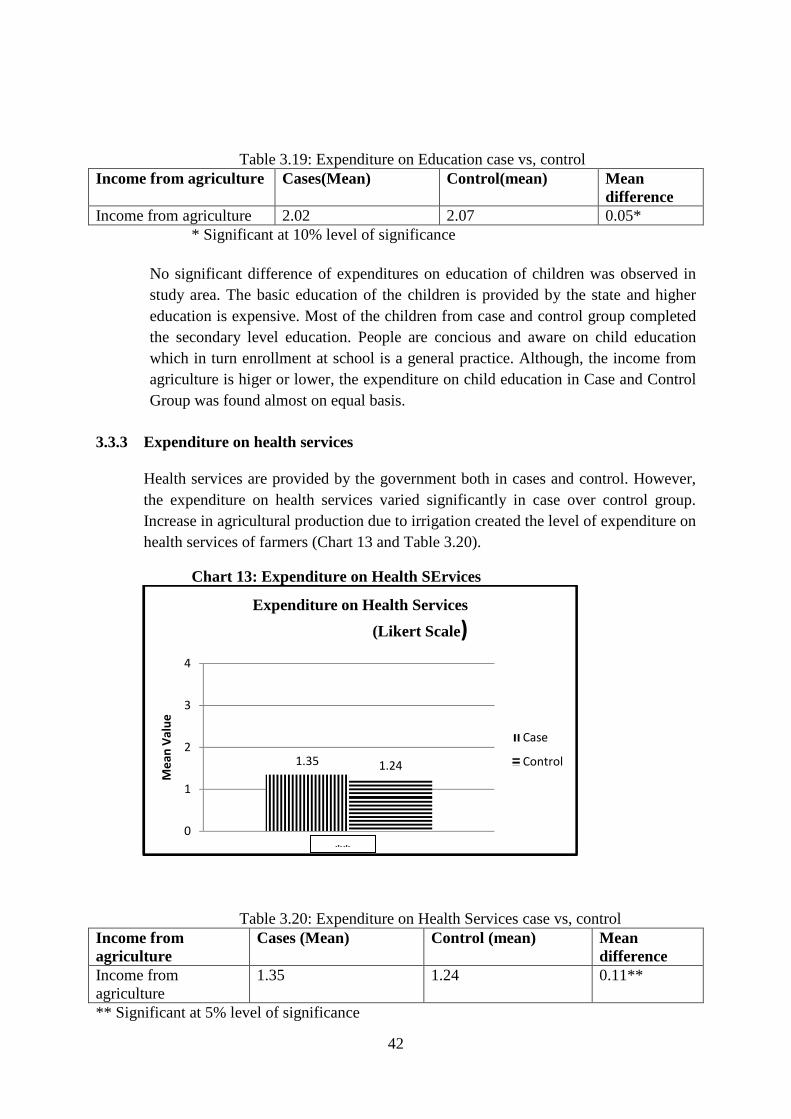
42
Table 3.19: Expenditure on Education case vs, control
Income from agriculture Cases(Mean) Control(mean) Mean difference
Income from agriculture 2.02 2.07 0.05* * Significant at 10% level of significance
No significant difference of expenditures on education of children was observed in study area. The basic education of the children is provided by the state and higher education is expensive. Most of the children from case and control group completed the secondary level education. People are concious and aware on child education which in turn enrollment at school is a general practice. Although, the income from agriculture is higer or lower, the expenditure on child education in Case and Control Group was found almost on equal basis.
3.3.3 Expenditure on health services Health services are provided by the government both in cases and control. However, the expenditure on health services varied significantly in case over control group. Increase in agricultural production due to irrigation created the level of expenditure on health services of farmers (Chart 13 and Table 3.20).
Chart 13: Expenditure on Health SErvices
Table 3.20: Expenditure on Health Services case vs, control
Income from agriculture
Cases (Mean) Control (mean) Mean difference
Income from agriculture
1.35 1.24 0.11**
** Significant at 5% level of significance
1.35 1.24
0
1
2
3
4
Me
an
Va
lue
Expenditure on Health Services
(Likert Scale)
Case
Control
**
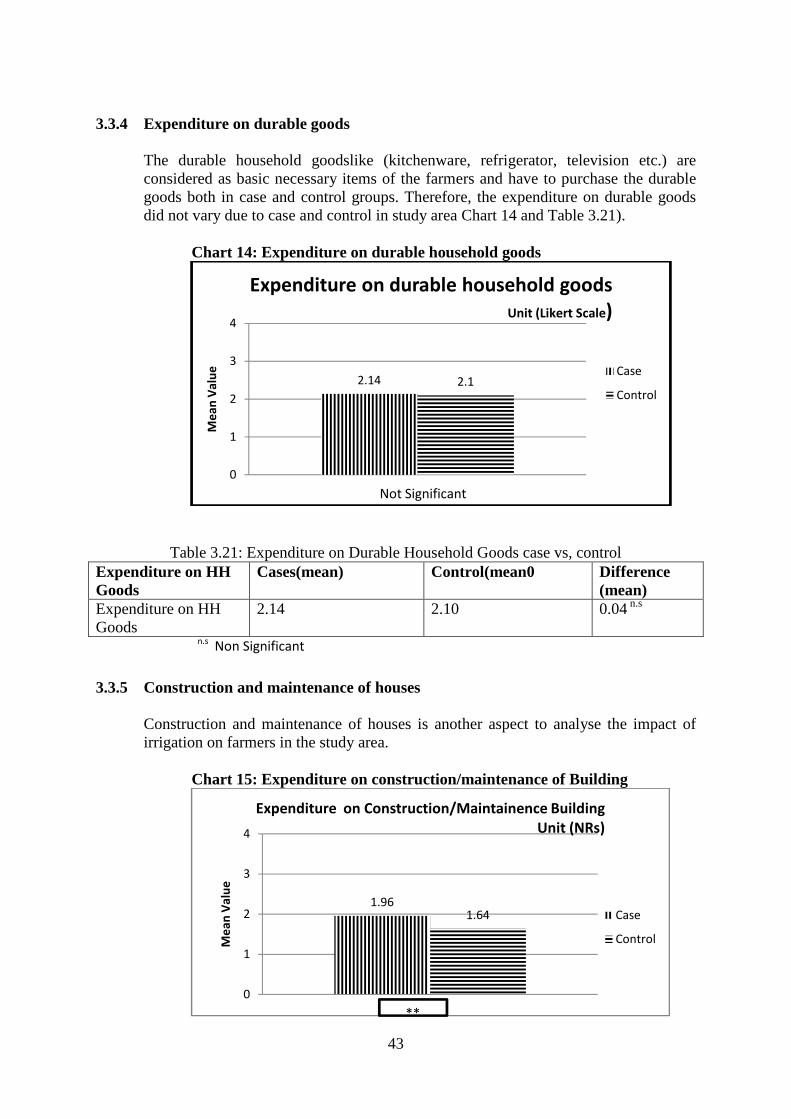
43
3.3.4 Expenditure on durable goods
The durable household goodslike (kitchenware, refrigerator, television etc.) are considered as basic necessary items of the farmers and have to purchase the durable goods both in case and control groups. Therefore, the expenditure on durable goods did not vary due to case and control in study area Chart 14 and Table 3.21).
Chart 14: Expenditure on durable household goods
Table 3.21: Expenditure on Durable Household Goods case vs, control Expenditure on HH Goods
Cases(mean) Control(mean0 Difference (mean)
Expenditure on HH Goods
2.14 2.10 0.04 n.s
n.s Non Significant
3.3.5 Construction and maintenance of houses
Construction and maintenance of houses is another aspect to analyse the impact of irrigation on farmers in the study area.
Chart 15: Expenditure on construction/maintenance of Building
2.14 2.1
0
1
2
3
4
Me
an
Va
lue
Expenditure on durable household goods
Unit (Likert Scale)
Case
Control
Not Significant
1.961.64
0
1
2
3
4
Me
an
Va
lue
Expenditure on Construction/Maintainence Building
Unit (NRs)
Case
Control
**
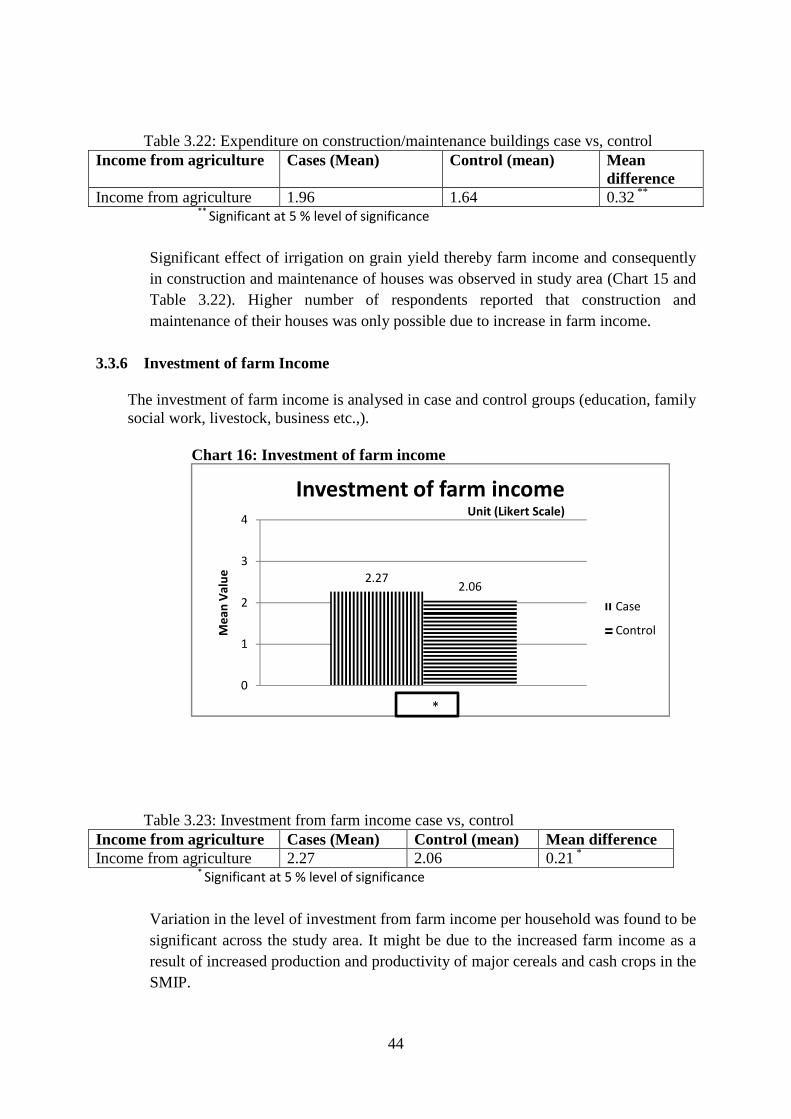
44
Table 3.22: Expenditure on construction/maintenance buildings case vs, control Income from agriculture Cases (Mean) Control (mean) Mean
difference Income from agriculture 1.96 1.64 0.32 **
** Significant at 5 % level of significance
Significant effect of irrigation on grain yield thereby farm income and consequently in construction and maintenance of houses was observed in study area (Chart 15 and Table 3.22). Higher number of respondents reported that construction and maintenance of their houses was only possible due to increase in farm income.
3.3.6 Investment of farm Income The investment of farm income is analysed in case and control groups (education, family social work, livestock, business etc.,).
Chart 16: Investment of farm income
Table 3.23: Investment from farm income case vs, control
Income from agriculture Cases (Mean) Control (mean) Mean difference Income from agriculture 2.27 2.06 0.21 *
* Significant at 5 % level of significance
Variation in the level of investment from farm income per household was found to be significant across the study area. It might be due to the increased farm income as a result of increased production and productivity of major cereals and cash crops in the SMIP.
2.272.06
0
1
2
3
4
Me
an
Va
lue
Investment of farm income Unit (Likert Scale)
Case
Control
*
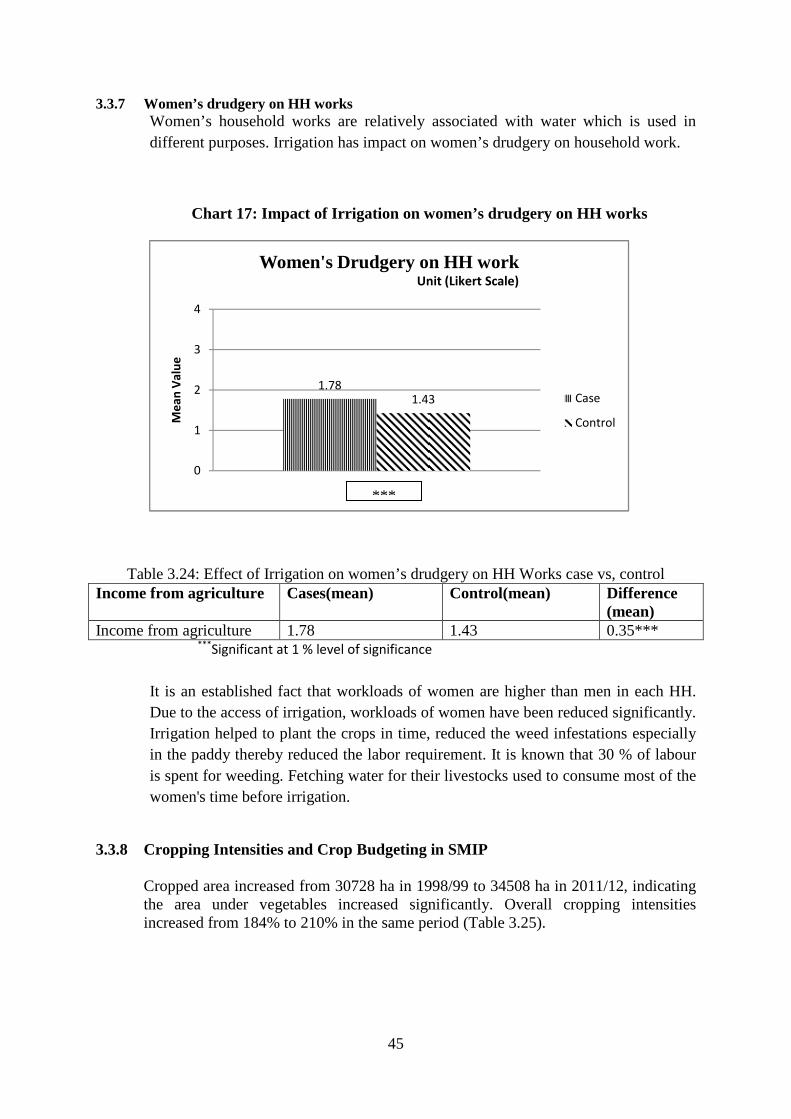
45
3.3.7 Women’s drudgery on HH works Women’s household works are relatively associated with water which is used in different purposes. Irrigation has impact on women’s drudgery on household work.
Chart 17: Impact of Irrigation on women’s drudgery on HH works
Table 3.24: Effect of Irrigation on women’s drudgery on HH Works case vs, control Income from agriculture Cases(mean) Control(mean) Difference
(mean) Income from agriculture 1.78 1.43 0.35***
***Significant at 1 % level of significance
It is an established fact that workloads of women are higher than men in each HH. Due to the access of irrigation, workloads of women have been reduced significantly. Irrigation helped to plant the crops in time, reduced the weed infestations especially in the paddy thereby reduced the labor requirement. It is known that 30 % of labour is spent for weeding. Fetching water for their livestocks used to consume most of the women's time before irrigation.
3.3.8 Cropping Intensities and Crop Budgeting in SMIP
Cropped area increased from 30728 ha in 1998/99 to 34508 ha in 2011/12, indicating the area under vegetables increased significantly. Overall cropping intensities increased from 184% to 210% in the same period (Table 3.25).
1.781.43
0
1
2
3
4
Me
an
Va
lue
Women's Drudgery on HH workUnit (Likert Scale)
Case
Control
***
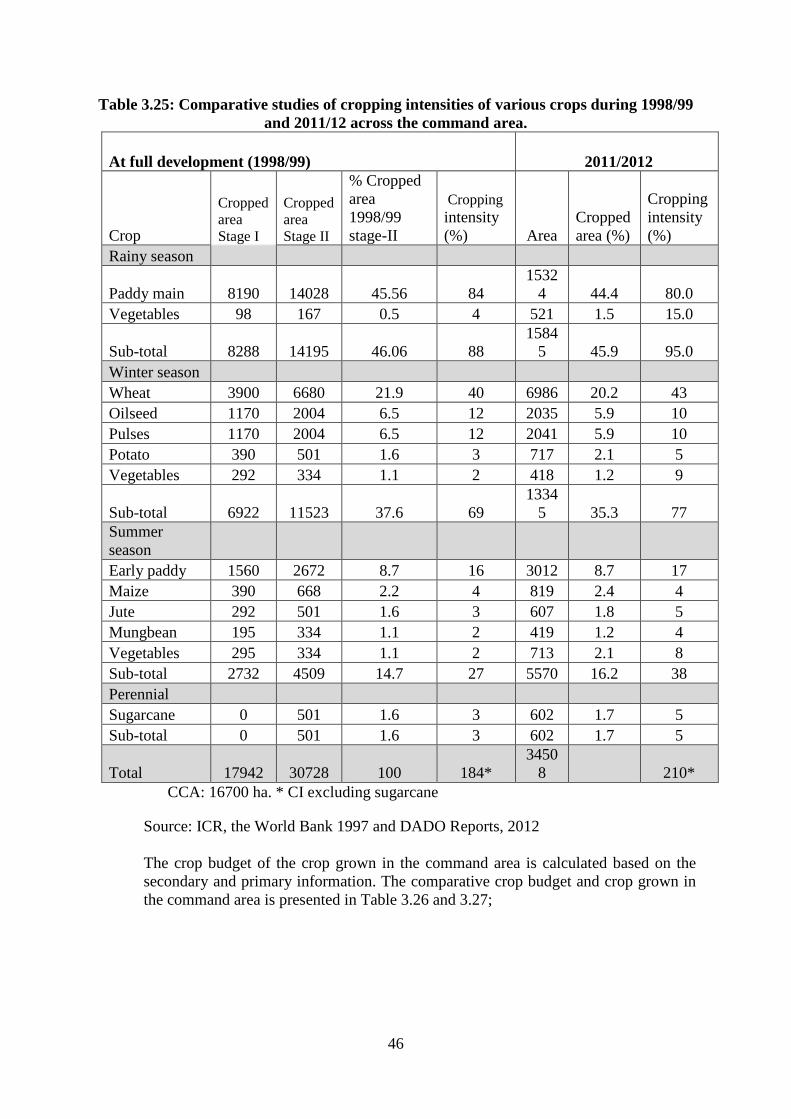
46
Table 3.25: Comparative studies of cropping intensities of various crops during 1998/99 and 2011/12 across the command area.
At full development (1998/99)
2011/2012
Crop
Cropped area Stage I
Cropped area Stage II
% Cropped area 1998/99 stage-II
Cropping intensity (%) Area
Cropped area (%)
Cropping intensity (%)
Rainy season
Paddy main 8190 14028 45.56 84 1532
4 44.4 80.0 Vegetables 98 167 0.5 4 521 1.5 15.0
Sub-total 8288 14195 46.06 88 1584
5 45.9 95.0 Winter season Wheat 3900 6680 21.9 40 6986 20.2 43 Oilseed 1170 2004 6.5 12 2035 5.9 10 Pulses 1170 2004 6.5 12 2041 5.9 10 Potato 390 501 1.6 3 717 2.1 5 Vegetables 292 334 1.1 2 418 1.2 9
Sub-total 6922 11523 37.6 69 1334
5 35.3 77 Summer season Early paddy 1560 2672 8.7 16 3012 8.7 17 Maize 390 668 2.2 4 819 2.4 4 Jute 292 501 1.6 3 607 1.8 5 Mungbean 195 334 1.1 2 419 1.2 4 Vegetables 295 334 1.1 2 713 2.1 8 Sub-total 2732 4509 14.7 27 5570 16.2 38 Perennial Sugarcane 0 501 1.6 3 602 1.7 5 Sub-total 0 501 1.6 3 602 1.7 5
Total 17942 30728 100 184* 3450
8 210* CCA: 16700 ha. * CI excluding sugarcane
Source: ICR, the World Bank 1997 and DADO Reports, 2012 The crop budget of the crop grown in the command area is calculated based on the
secondary and primary information. The comparative crop budget and crop grown in the command area is presented in Table 3.26 and 3.27;
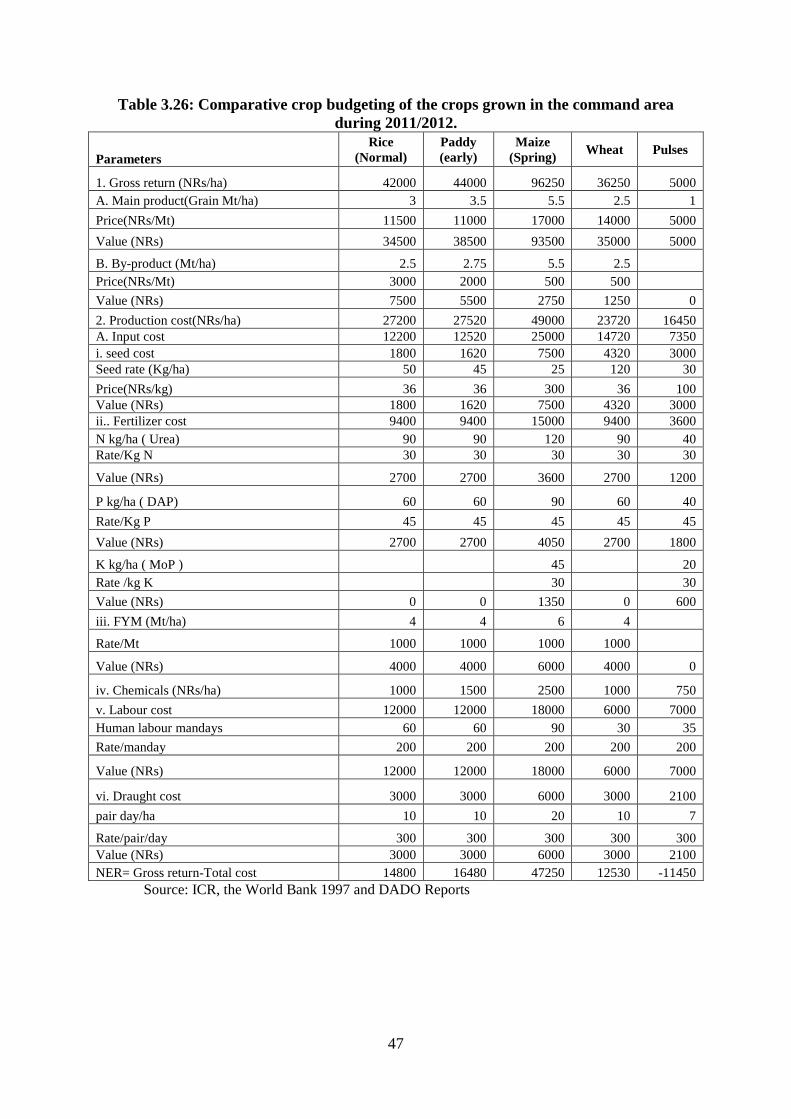
47
Table 3.26: Comparative crop budgeting of the crops grown in the command area during 2011/2012.
Parameters Rice
(Normal) Paddy (early)
Maize (Spring)
Wheat Pulses
1. Gross return (NRs/ha) 42000 44000 96250 36250 5000 A. Main product(Grain Mt/ha) 3 3.5 5.5 2.5 1
Price(NRs/Mt) 11500 11000 17000 14000 5000
Value (NRs) 34500 38500 93500 35000 5000
B. By-product (Mt/ha) 2.5 2.75 5.5 2.5 Price(NRs/Mt) 3000 2000 500 500
Value (NRs) 7500 5500 2750 1250 0
2. Production cost(NRs/ha) 27200 27520 49000 23720 16450 A. Input cost 12200 12520 25000 14720 7350 i. seed cost 1800 1620 7500 4320 3000 Seed rate (Kg/ha) 50 45 25 120 30
Price(NRs/kg) 36 36 300 36 100 Value (NRs) 1800 1620 7500 4320 3000 ii.. Fertilizer cost 9400 9400 15000 9400 3600 N kg/ha ( Urea) 90 90 120 90 40 Rate/Kg N 30 30 30 30 30
Value (NRs) 2700 2700 3600 2700 1200
P kg/ha ( DAP) 60 60 90 60 40
Rate/Kg P 45 45 45 45 45
Value (NRs) 2700 2700 4050 2700 1800
K kg/ha ( MoP ) 45 20 Rate /kg K 30 30
Value (NRs) 0 0 1350 0 600
iii. FYM (Mt/ha) 4 4 6 4
Rate/Mt 1000 1000 1000 1000
Value (NRs) 4000 4000 6000 4000 0
iv. Chemicals (NRs/ha) 1000 1500 2500 1000 750
v. Labour cost 12000 12000 18000 6000 7000 Human labour mandays 60 60 90 30 35
Rate/manday 200 200 200 200 200
Value (NRs) 12000 12000 18000 6000 7000
vi. Draught cost 3000 3000 6000 3000 2100
pair day/ha 10 10 20 10 7
Rate/pair/day 300 300 300 300 300 Value (NRs) 3000 3000 6000 3000 2100 NER= Gross return-Total cost 14800 16480 47250 12530 -11450
Source: ICR, the World Bank 1997 and DADO Reports
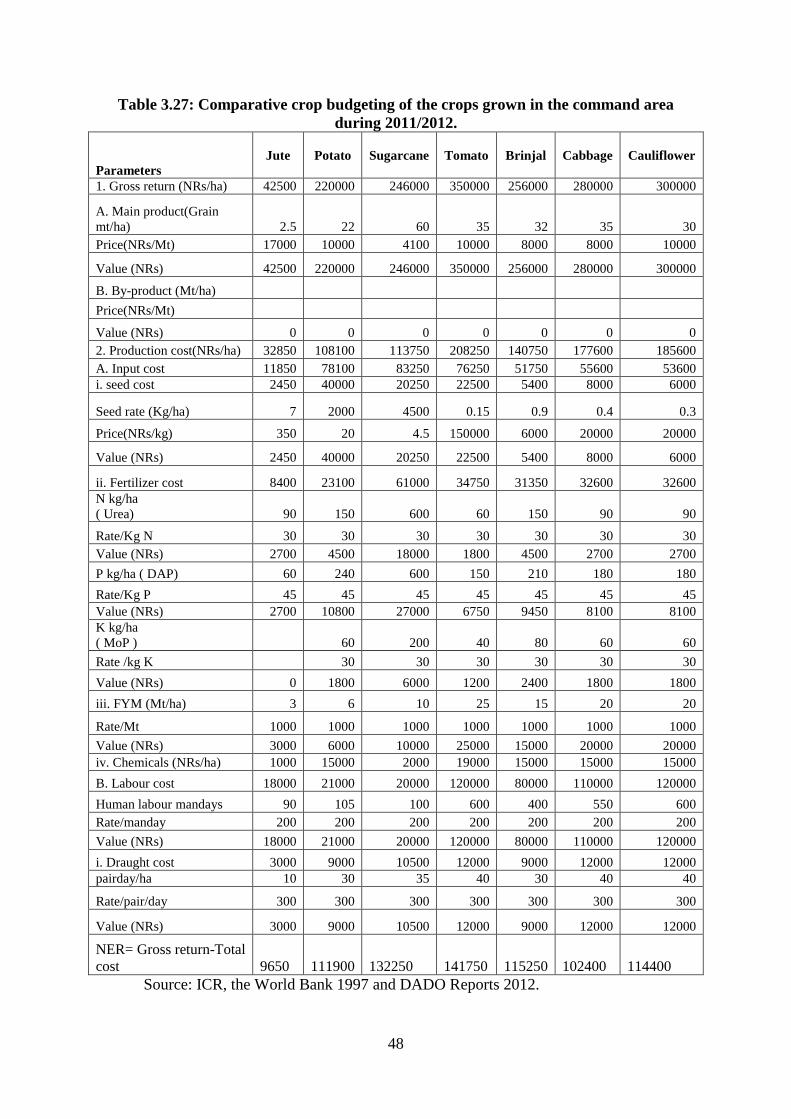
48
Table 3.27: Comparative crop budgeting of the crops grown in the command area during 2011/2012.
Parameters Jute Potato Sugarcane Tomato Brinjal Cabbage Cauliflower
1. Gross return (NRs/ha) 42500 220000 246000 350000 256000 280000 300000
A. Main product(Grain mt/ha) 2.5 22 60 35 32 35 30 Price(NRs/Mt) 17000 10000 4100 10000 8000 8000 10000
Value (NRs) 42500 220000 246000 350000 256000 280000 300000
B. By-product (Mt/ha)
Price(NRs/Mt)
Value (NRs) 0 0 0 0 0 0 0 2. Production cost(NRs/ha) 32850 108100 113750 208250 140750 177600 185600 A. Input cost 11850 78100 83250 76250 51750 55600 53600 i. seed cost 2450 40000 20250 22500 5400 8000 6000
Seed rate (Kg/ha) 7 2000 4500 0.15 0.9 0.4 0.3
Price(NRs/kg) 350 20 4.5 150000 6000 20000 20000
Value (NRs) 2450 40000 20250 22500 5400 8000 6000
ii. Fertilizer cost 8400 23100 61000 34750 31350 32600 32600 N kg/ha ( Urea) 90 150 600 60 150 90 90
Rate/Kg N 30 30 30 30 30 30 30 Value (NRs) 2700 4500 18000 1800 4500 2700 2700
P kg/ha ( DAP) 60 240 600 150 210 180 180
Rate/Kg P 45 45 45 45 45 45 45 Value (NRs) 2700 10800 27000 6750 9450 8100 8100 K kg/ha ( MoP ) 60 200 40 80 60 60
Rate /kg K 30 30 30 30 30 30
Value (NRs) 0 1800 6000 1200 2400 1800 1800
iii. FYM (Mt/ha) 3 6 10 25 15 20 20
Rate/Mt 1000 1000 1000 1000 1000 1000 1000
Value (NRs) 3000 6000 10000 25000 15000 20000 20000 iv. Chemicals (NRs/ha) 1000 15000 2000 19000 15000 15000 15000
B. Labour cost 18000 21000 20000 120000 80000 110000 120000
Human labour mandays 90 105 100 600 400 550 600 Rate/manday 200 200 200 200 200 200 200
Value (NRs) 18000 21000 20000 120000 80000 110000 120000
i. Draught cost 3000 9000 10500 12000 9000 12000 12000 pairday/ha 10 30 35 40 30 40 40
Rate/pair/day 300 300 300 300 300 300 300
Value (NRs) 3000 9000 10500 12000 9000 12000 12000
NER= Gross return-Total cost 9650 111900 132250 141750 115250 102400 114400
Source: ICR, the World Bank 1997 and DADO Reports 2012.
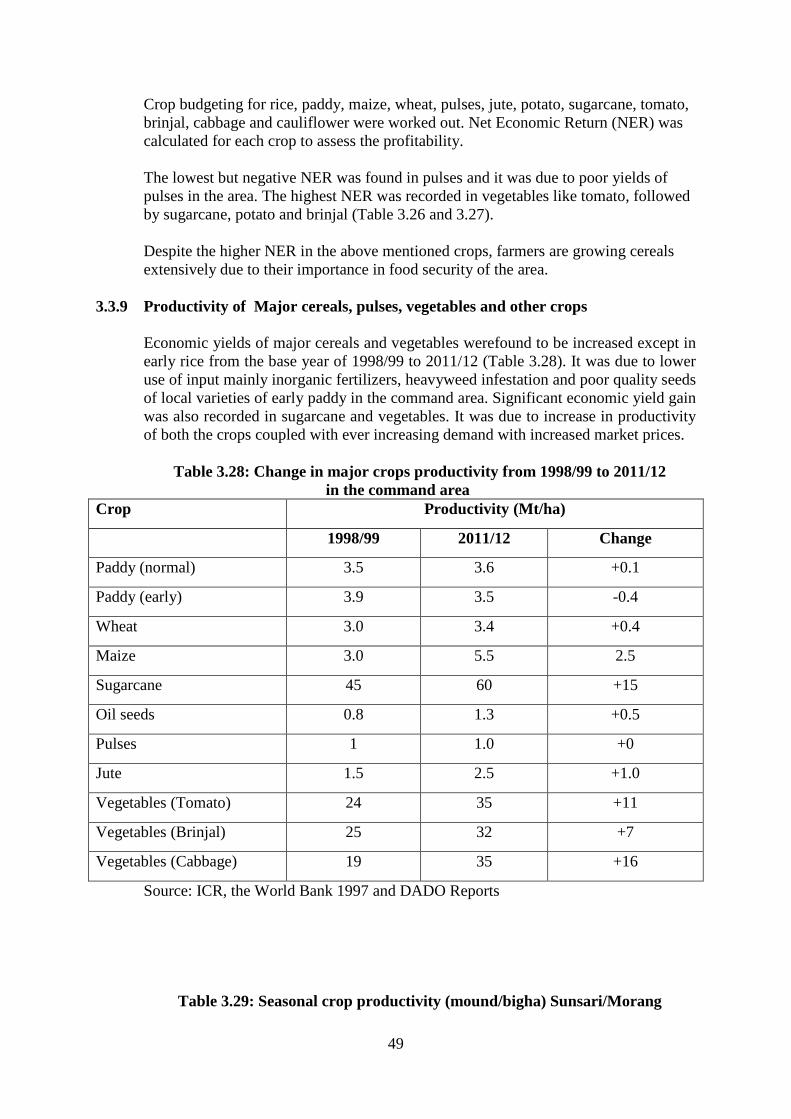
49
Crop budgeting for rice, paddy, maize, wheat, pulses, jute, potato, sugarcane, tomato, brinjal, cabbage and cauliflower were worked out. Net Economic Return (NER) was calculated for each crop to assess the profitability. The lowest but negative NER was found in pulses and it was due to poor yields of pulses in the area. The highest NER was recorded in vegetables like tomato, followed by sugarcane, potato and brinjal (Table 3.26 and 3.27). Despite the higher NER in the above mentioned crops, farmers are growing cereals extensively due to their importance in food security of the area.
3.3.9 Productivity of Major cereals, pulses, vegetables and other crops Economic yields of major cereals and vegetables werefound to be increased except in early rice from the base year of 1998/99 to 2011/12 (Table 3.28). It was due to lower use of input mainly inorganic fertilizers, heavyweed infestation and poor quality seeds of local varieties of early paddy in the command area. Significant economic yield gain was also recorded in sugarcane and vegetables. It was due to increase in productivity of both the crops coupled with ever increasing demand with increased market prices.
Table 3.28: Change in major crops productivity from 1998/99 to 2011/12
in the command area Crop Productivity (Mt/ha)
1998/99 2011/12 Change
Paddy (normal) 3.5 3.6 +0.1
Paddy (early) 3.9 3.5 -0.4
Wheat 3.0 3.4 +0.4
Maize 3.0 5.5 2.5
Sugarcane 45 60 +15
Oil seeds 0.8 1.3 +0.5
Pulses 1 1.0 +0
Jute 1.5 2.5 +1.0
Vegetables (Tomato) 24 35 +11
Vegetables (Brinjal) 25 32 +7
Vegetables (Cabbage) 19 35 +16
Source: ICR, the World Bank 1997 and DADO Reports
Table 3.29: Seasonal crop productivity (mound/bigha) Sunsari/Morang
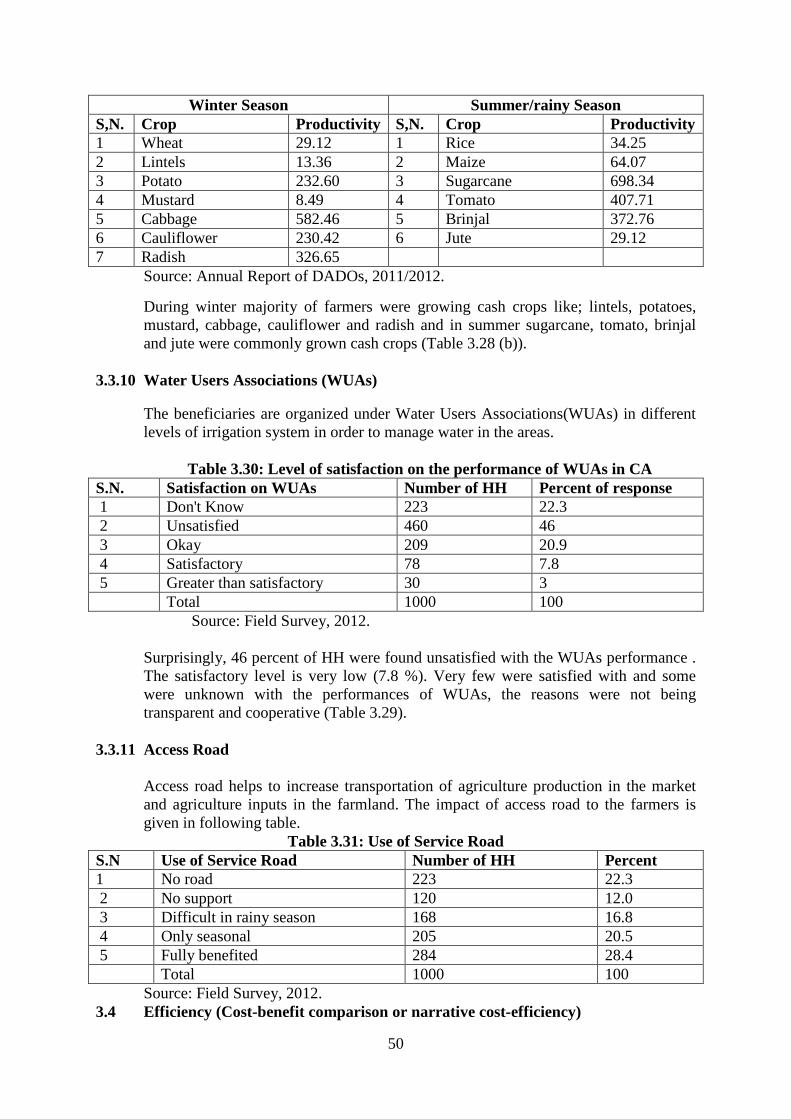
50
Winter Season Summer/rainy Season S,N. Crop Productivity S,N. Crop Productivity 1 Wheat 29.12 1 Rice 34.25 2 Lintels 13.36 2 Maize 64.07 3 Potato 232.60 3 Sugarcane 698.34 4 Mustard 8.49 4 Tomato 407.71 5 Cabbage 582.46 5 Brinjal 372.76 6 Cauliflower 230.42 6 Jute 29.12 7 Radish 326.65 Source: Annual Report of DADOs, 2011/2012.
During winter majority of farmers were growing cash crops like; lintels, potatoes, mustard, cabbage, cauliflower and radish and in summer sugarcane, tomato, brinjal and jute were commonly grown cash crops (Table 3.28 (b)).
3.3.10 Water Users Associations (WUAs)
The beneficiaries are organized under Water Users Associations(WUAs) in different levels of irrigation system in order to manage water in the areas.
Table 3.30: Level of satisfaction on the performance of WUAs in CA
S.N. Satisfaction on WUAs Number of HH Percent of response 1 Don't Know 223 22.3 2 Unsatisfied 460 46 3 Okay 209 20.9 4 Satisfactory 78 7.8 5 Greater than satisfactory 30 3 Total 1000 100
Source: Field Survey, 2012. Surprisingly, 46 percent of HH were found unsatisfied with the WUAs performance .
The satisfactory level is very low (7.8 %). Very few were satisfied with and some were unknown with the performances of WUAs, the reasons were not being transparent and cooperative (Table 3.29).
3.3.11 Access Road
Access road helps to increase transportation of agriculture production in the market and agriculture inputs in the farmland. The impact of access road to the farmers is given in following table.
Table 3.31: Use of Service Road S.N Use of Service Road Number of HH Percent 1 No road 223 22.3 2 No support 120 12.0 3 Difficult in rainy season 168 16.8 4 Only seasonal 205 20.5 5 Fully benefited 284 28.4 Total 1000 100 Source: Field Survey, 2012. 3.4 Efficiency (Cost-benefit comparison or narrative cost-efficiency)
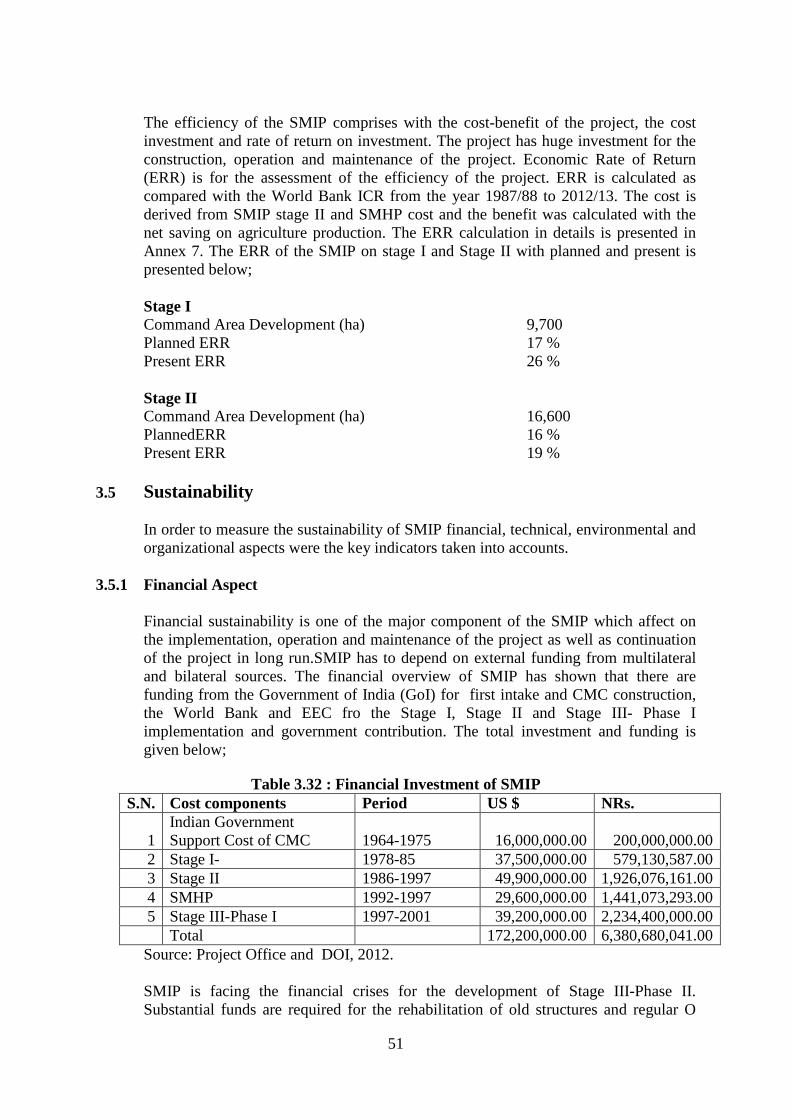
51
The efficiency of the SMIP comprises with the cost-benefit of the project, the cost investment and rate of return on investment. The project has huge investment for the construction, operation and maintenance of the project. Economic Rate of Return (ERR) is for the assessment of the efficiency of the project. ERR is calculated as compared with the World Bank ICR from the year 1987/88 to 2012/13. The cost is derived from SMIP stage II and SMHP cost and the benefit was calculated with the net saving on agriculture production. The ERR calculation in details is presented in Annex 7. The ERR of the SMIP on stage I and Stage II with planned and present is presented below; Stage I Command Area Development (ha) 9,700 Planned ERR 17 % Present ERR 26 % Stage II Command Area Development (ha) 16,600 PlannedERR 16 % Present ERR 19 %
3.5 Sustainability
In order to measure the sustainability of SMIP financial, technical, environmental and organizational aspects were the key indicators taken into accounts.
3.5.1 Financial Aspect
Financial sustainability is one of the major component of the SMIP which affect on the implementation, operation and maintenance of the project as well as continuation of the project in long run.SMIP has to depend on external funding from multilateral and bilateral sources. The financial overview of SMIP has shown that there are funding from the Government of India (GoI) for first intake and CMC construction, the World Bank and EEC fro the Stage I, Stage II and Stage III- Phase I implementation and government contribution. The total investment and funding is given below;
Table 3.32 : Financial Investment of SMIP S.N. Cost components Period US $ NRs.
1 Indian Government Support Cost of CMC 1964-1975 16,000,000.00 200,000,000.00
2 Stage I- 1978-85 37,500,000.00 579,130,587.00 3 Stage II 1986-1997 49,900,000.00 1,926,076,161.00 4 SMHP 1992-1997 29,600,000.00 1,441,073,293.00 5 Stage III-Phase I 1997-2001 39,200,000.00 2,234,400,000.00
Total 172,200,000.00 6,380,680,041.00 Source: Project Office and DOI, 2012.
SMIP is facing the financial crises for the development of Stage III-Phase II. Substantial funds are required for the rehabilitation of old structures and regular O
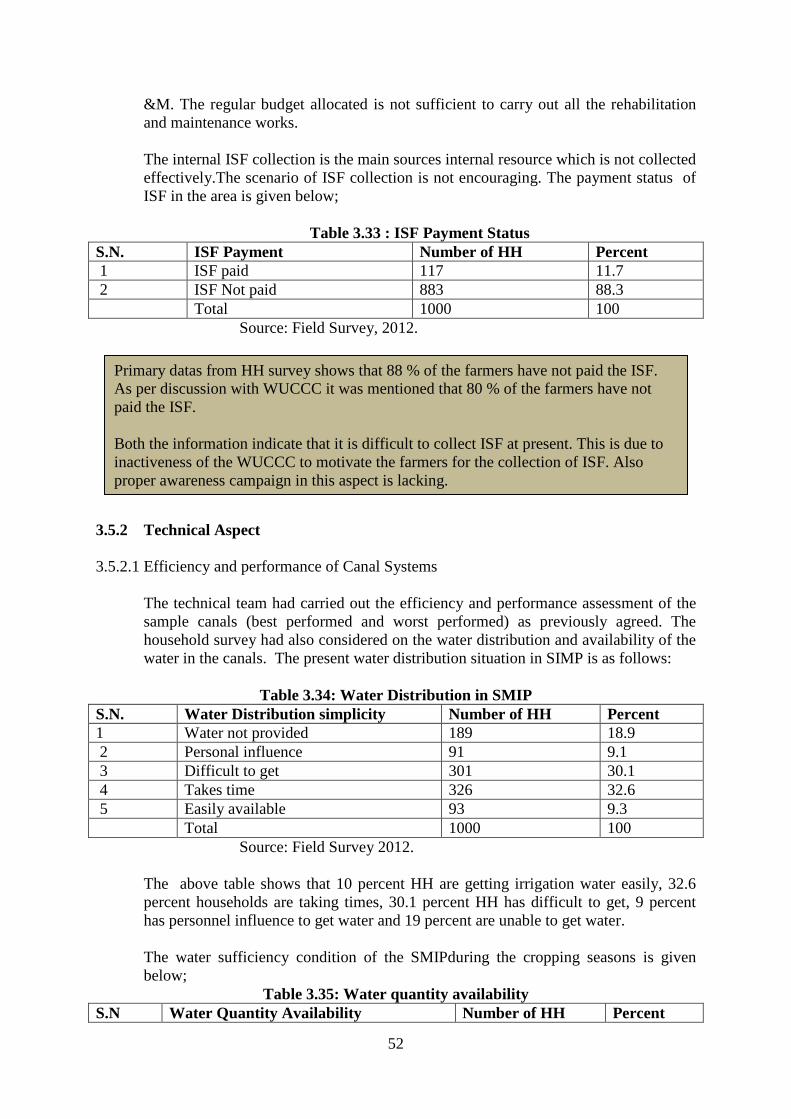
52
&M. The regular budget allocated is not sufficient to carry out all the rehabilitation and maintenance works.
The internal ISF collection is the main sources internal resource which is not collected effectively.The scenario of ISF collection is not encouraging. The payment status of ISF in the area is given below;
Table 3.33 : ISF Payment Status S.N. ISF Payment Number of HH Percent 1 ISF paid 117 11.7 2 ISF Not paid 883 88.3 Total 1000 100
Source: Field Survey, 2012.
3.5.2 Technical Aspect 3.5.2.1 Efficiency and performance of Canal Systems
The technical team had carried out the efficiency and performance assessment of the sample canals (best performed and worst performed) as previously agreed. The household survey had also considered on the water distribution and availability of the water in the canals. The present water distribution situation in SIMP is as follows:
Table 3.34: Water Distribution in SMIP S.N. Water Distribution simplicity Number of HH Percent 1 Water not provided 189 18.9 2 Personal influence 91 9.1 3 Difficult to get 301 30.1 4 Takes time 326 32.6 5 Easily available 93 9.3 Total 1000 100
Source: Field Survey 2012. The above table shows that 10 percent HH are getting irrigation water easily, 32.6
percent households are taking times, 30.1 percent HH has difficult to get, 9 percent has personnel influence to get water and 19 percent are unable to get water.
The water sufficiency condition of the SMIPduring the cropping seasons is given
below; Table 3.35: Water quantity availability
S.N Water Quantity Availability Number of HH Percent
Primary datas from HH survey shows that 88 % of the farmers have not paid the ISF. As per discussion with WUCCC it was mentioned that 80 % of the farmers have not paid the ISF. Both the information indicate that it is difficult to collect ISF at present. This is due to inactiveness of the WUCCC to motivate the farmers for the collection of ISF. Also proper awareness campaign in this aspect is lacking.
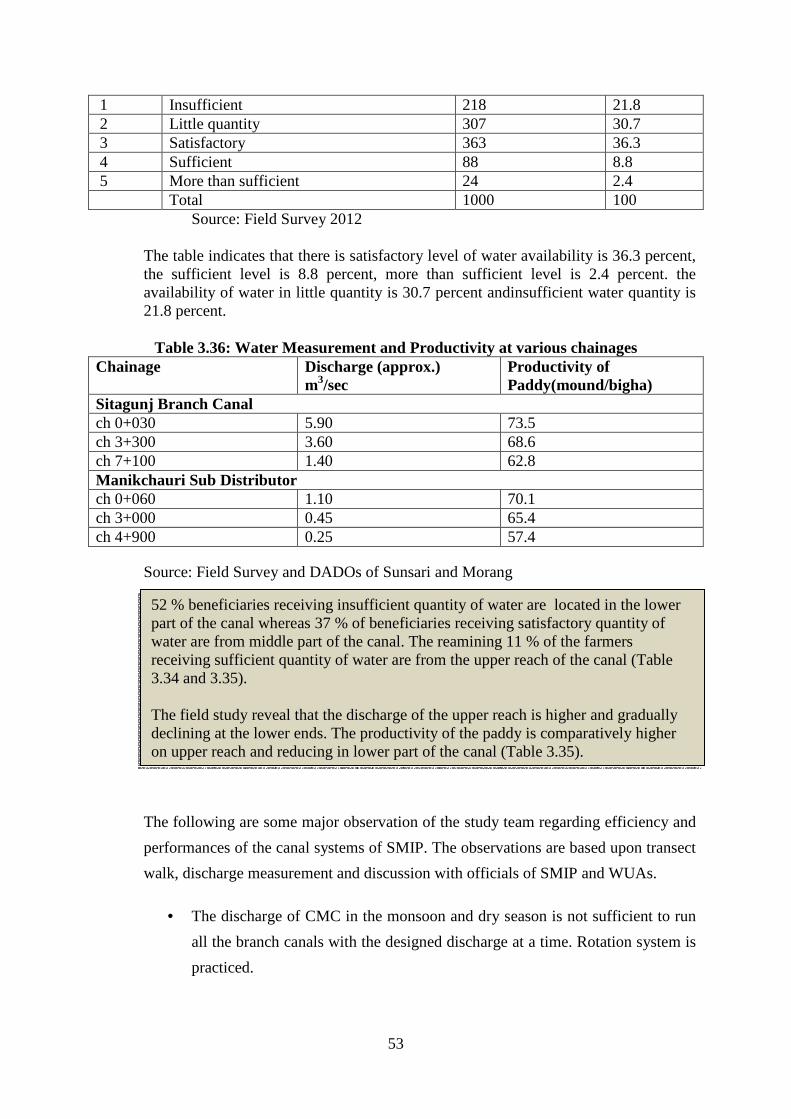
53
1 Insufficient 218 21.8 2 Little quantity 307 30.7 3 Satisfactory 363 36.3 4 Sufficient 88 8.8 5 More than sufficient 24 2.4 Total 1000 100
Source: Field Survey 2012 The table indicates that there is satisfactory level of water availability is 36.3 percent,
the sufficient level is 8.8 percent, more than sufficient level is 2.4 percent. the availability of water in little quantity is 30.7 percent andinsufficient water quantity is 21.8 percent.
Table 3.36: Water Measurement and Productivity at various chainages
Chainage Discharge (approx.) m3/sec
Productivity of Paddy(mound/bigha)
Sitagunj Branch Canal ch 0+030 5.90 73.5 ch 3+300 3.60 68.6 ch 7+100 1.40 62.8 Manikchauri Sub Distributor ch 0+060 1.10 70.1 ch 3+000 0.45 65.4 ch 4+900 0.25 57.4
Source: Field Survey and DADOs of Sunsari and Morang
The following are some major observation of the study team regarding efficiency and
performances of the canal systems of SMIP. The observations are based upon transect
walk, discharge measurement and discussion with officials of SMIP and WUAs.
• The discharge of CMC in the monsoon and dry season is not sufficient to run
all the branch canals with the designed discharge at a time. Rotation system is
practiced.
52 % beneficiaries receiving insufficient quantity of water are located in the lower part of the canal whereas 37 % of beneficiaries receiving satisfactory quantity of water are from middle part of the canal. The reamining 11 % of the farmers receiving sufficient quantity of water are from the upper reach of the canal (Table 3.34 and 3.35). The field study reveal that the discharge of the upper reach is higher and gradually declining at the lower ends. The productivity of the paddy is comparatively higher on upper reach and reducing in lower part of the canal (Table 3.35).
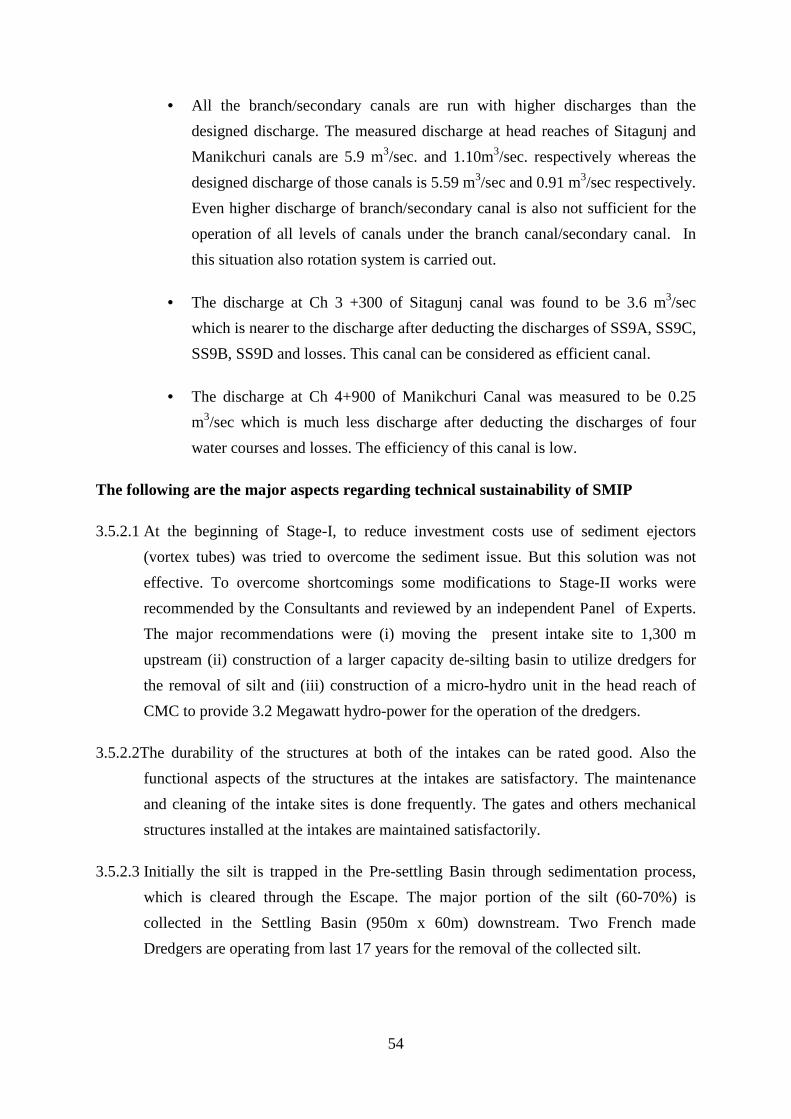
54
• All the branch/secondary canals are run with higher discharges than the
designed discharge. The measured discharge at head reaches of Sitagunj and
Manikchuri canals are 5.9 m3/sec. and 1.10m3/sec. respectively whereas the
designed discharge of those canals is 5.59 m3/sec and 0.91 m3/sec respectively.
Even higher discharge of branch/secondary canal is also not sufficient for the
operation of all levels of canals under the branch canal/secondary canal. In
this situation also rotation system is carried out.
• The discharge at Ch 3 +300 of Sitagunj canal was found to be 3.6 m3/sec
which is nearer to the discharge after deducting the discharges of SS9A, SS9C,
SS9B, SS9D and losses. This canal can be considered as efficient canal.
• The discharge at Ch 4+900 of Manikchuri Canal was measured to be 0.25
m3/sec which is much less discharge after deducting the discharges of four
water courses and losses. The efficiency of this canal is low.
The following are the major aspects regarding technical sustainability of SMIP
3.5.2.1 At the beginning of Stage-I, to reduce investment costs use of sediment ejectors
(vortex tubes) was tried to overcome the sediment issue. But this solution was not
effective. To overcome shortcomings some modifications to Stage-II works were
recommended by the Consultants and reviewed by an independent Panel of Experts.
The major recommendations were (i) moving the present intake site to 1,300 m
upstream (ii) construction of a larger capacity de-silting basin to utilize dredgers for
the removal of silt and (iii) construction of a micro-hydro unit in the head reach of
CMC to provide 3.2 Megawatt hydro-power for the operation of the dredgers.
3.5.2.2The durability of the structures at both of the intakes can be rated good. Also the
functional aspects of the structures at the intakes are satisfactory. The maintenance
and cleaning of the intake sites is done frequently. The gates and others mechanical
structures installed at the intakes are maintained satisfactorily.
3.5.2.3 Initially the silt is trapped in the Pre-settling Basin through sedimentation process,
which is cleared through the Escape. The major portion of the silt (60-70%) is
collected in the Settling Basin (950m x 60m) downstream. Two French made
Dredgers are operating from last 17 years for the removal of the collected silt.
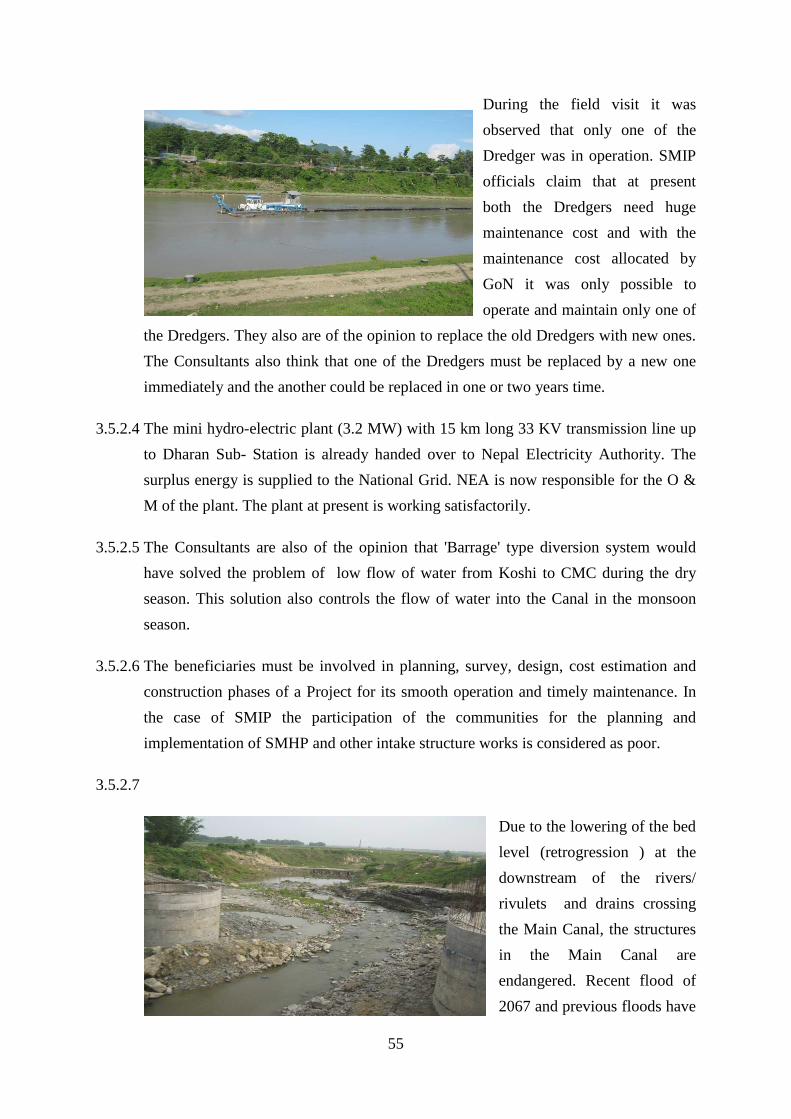
55
During the field visit it was
observed that only one of the
Dredger was in operation. SMIP
officials claim that at present
both the Dredgers need huge
maintenance cost and with the
maintenance cost allocated by
GoN it was only possible to
operate and maintain only one of
the Dredgers. They also are of the opinion to replace the old Dredgers with new ones.
The Consultants also think that one of the Dredgers must be replaced by a new one
immediately and the another could be replaced in one or two years time.
3.5.2.4 The mini hydro-electric plant (3.2 MW) with 15 km long 33 KV transmission line up
to Dharan Sub- Station is already handed over to Nepal Electricity Authority. The
surplus energy is supplied to the National Grid. NEA is now responsible for the O &
M of the plant. The plant at present is working satisfactorily.
3.5.2.5 The Consultants are also of the opinion that 'Barrage' type diversion system would
have solved the problem of low flow of water from Koshi to CMC during the dry
season. This solution also controls the flow of water into the Canal in the monsoon
season.
3.5.2.6 The beneficiaries must be involved in planning, survey, design, cost estimation and
construction phases of a Project for its smooth operation and timely maintenance. In
the case of SMIP the participation of the communities for the planning and
implementation of SMHP and other intake structure works is considered as poor.
3.5.2.7
Due to the lowering of the bed
level (retrogression ) at the
downstream of the rivers/
rivulets and drains crossing
the Main Canal, the structures
in the Main Canal are
endangered. Recent flood of
2067 and previous floods have
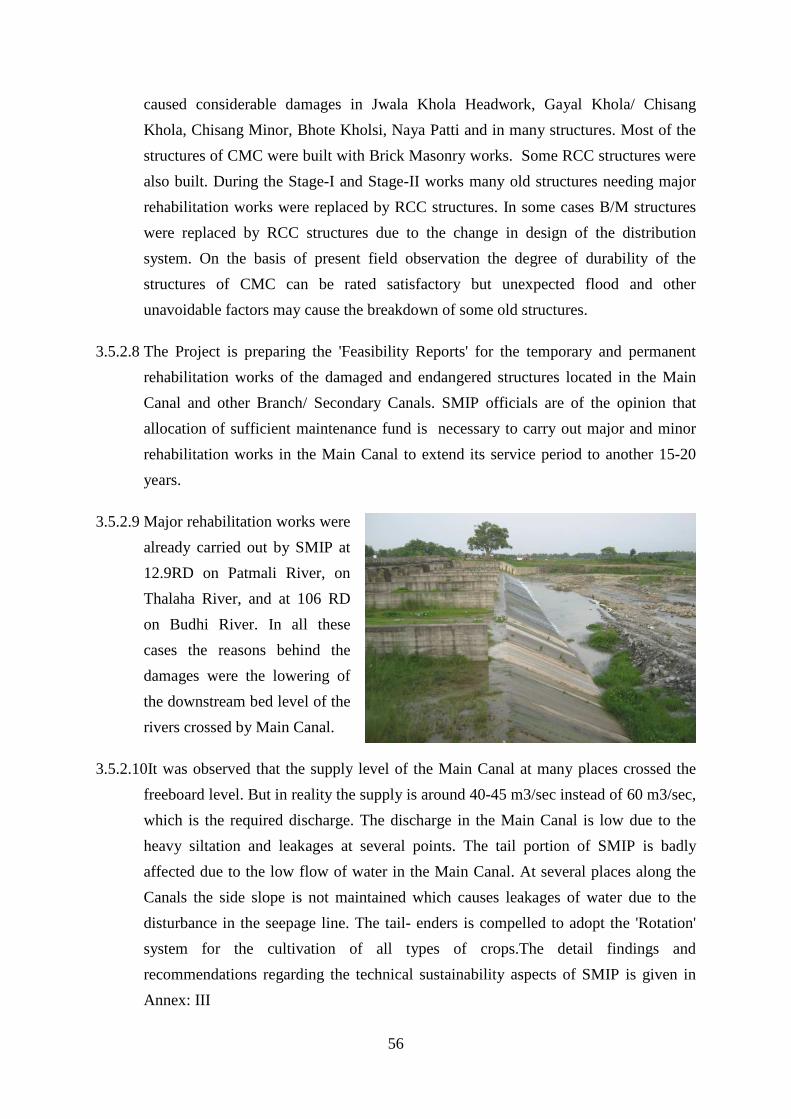
56
caused considerable damages in Jwala Khola Headwork, Gayal Khola/ Chisang
Khola, Chisang Minor, Bhote Kholsi, Naya Patti and in many structures. Most of the
structures of CMC were built with Brick Masonry works. Some RCC structures were
also built. During the Stage-I and Stage-II works many old structures needing major
rehabilitation works were replaced by RCC structures. In some cases B/M structures
were replaced by RCC structures due to the change in design of the distribution
system. On the basis of present field observation the degree of durability of the
structures of CMC can be rated satisfactory but unexpected flood and other
unavoidable factors may cause the breakdown of some old structures.
3.5.2.8 The Project is preparing the 'Feasibility Reports' for the temporary and permanent
rehabilitation works of the damaged and endangered structures located in the Main
Canal and other Branch/ Secondary Canals. SMIP officials are of the opinion that
allocation of sufficient maintenance fund is necessary to carry out major and minor
rehabilitation works in the Main Canal to extend its service period to another 15-20
years.
3.5.2.9 Major rehabilitation works were
already carried out by SMIP at
12.9RD on Patmali River, on
Thalaha River, and at 106 RD
on Budhi River. In all these
cases the reasons behind the
damages were the lowering of
the downstream bed level of the
rivers crossed by Main Canal.
3.5.2.10It was observed that the supply level of the Main Canal at many places crossed the
freeboard level. But in reality the supply is around 40-45 m3/sec instead of 60 m3/sec,
which is the required discharge. The discharge in the Main Canal is low due to the
heavy siltation and leakages at several points. The tail portion of SMIP is badly
affected due to the low flow of water in the Main Canal. At several places along the
Canals the side slope is not maintained which causes leakages of water due to the
disturbance in the seepage line. The tail- enders is compelled to adopt the 'Rotation'
system for the cultivation of all types of crops.The detail findings and
recommendations regarding the technical sustainability aspects of SMIP is given in
Annex: III
57
3.5.3 Organizational Aspect 3.5.3.1 The organization of the Sunsari Morang Irrigation Project (SMIP) was initially
formed as Chatara Canal Project (CCP) under the agreement between Government of Nepal and Government of India in 1964. Sunsari Morang Irrigation and Drainage Development Board was a governing board created for executing the project under the Development Board Act of 1956. Project Manager (PM) was deputed by the government for overall responsibility of the project. Under the PM,three wings were established as; a)planning and control wing b) Engineering Wing c) Agricultural Wing.
Sunsari Morang Irrigation Development Board (SMIDB) was formed in 1979 to execute Sunsari Morang Irrigation Project chaired by the Secretary, Ministry of Irrigation and has nine members as follows:
Secretary, Ministry of Irrigation Chairman Representative, Ministry of Finance Member Representative, Ministry of Irrigation Member Representative, National Planning Commission Secretariat Member Director General, Department of Irrigation Member Director General, Department of Agriculture Member Director, Eastern Region Irrigation Directorate Member Director, Eastern Region Agriculture Directorate Member Chairperson, Water Users Central Coordination Committee Member Project Manager, Sunsari Morang Irrigation Project Member Secretary
SMIDB was functioned well in policy decision making, approval of annual program and budget and necessary policy level decisions during the construction period in Stage I, Stage II and Stage III-Phase I. The board has played significant role in project implementation, organization management, project management etc. At present the board has been functioning with regular meetings and regular procedural administrative works. The context of Development Board Act 1956 is over ruled by Procurement Act, which affect on function of the board to some extent.
For the sustainable organizational management, SMIDB should be made effective for timely decision making relating to project management and policy guidance.
3.5.3.2 The present organization structure of SMIP is headed by Project Manager (PM) with
four Divisions headed by SDEs and one mechanical unit headed by a Mechanical Engineer. The mechanical division at present is under Regional Irrigation Directorate. The divisions consisted of two operation and Maintenance Divisions (O & M) , one for Sunsari and one for Morang district, one Water Management Division and one Construction Division of the construction, operation and management of Stage I and II (PCR, August 1998 pp. 1.5).There was frequent turnover of key management staff (Project Manager and Senior Divisional Engineers) and some delays in establishing a Monitoring and Evaluation Division has affected on project management.
The organization of SMIP consist of PM, under 4 Divisions, 10 sub-division, 6 branch
offices are working with 95 staff out of 13 approved position at present. For the next Fiscal Year, according to workload of the project 100 positions are approved whereas
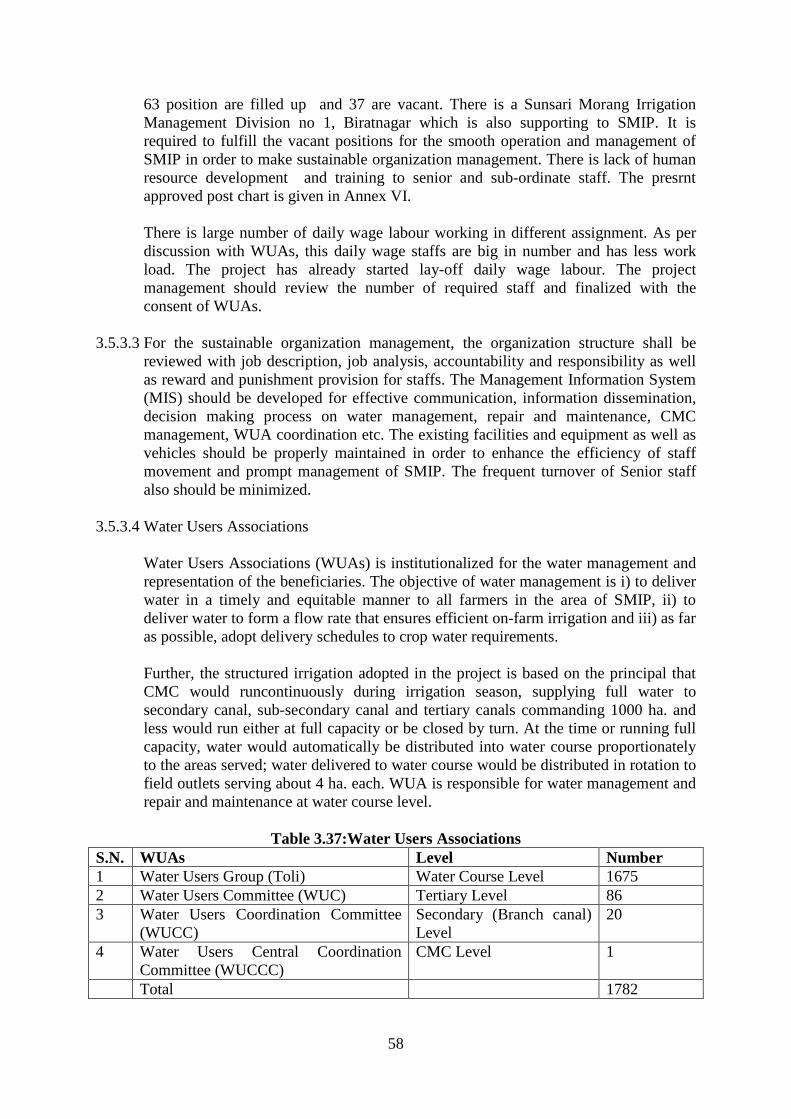
58
63 position are filled up and 37 are vacant. There is a Sunsari Morang Irrigation Management Division no 1, Biratnagar which is also supporting to SMIP. It is required to fulfill the vacant positions for the smooth operation and management of SMIP in order to make sustainable organization management. There is lack of human resource development and training to senior and sub-ordinate staff. The presrnt approved post chart is given in Annex VI.
There is large number of daily wage labour working in different assignment. As per
discussion with WUAs, this daily wage staffs are big in number and has less work load. The project has already started lay-off daily wage labour. The project management should review the number of required staff and finalized with the consent of WUAs.
3.5.3.3 For the sustainable organization management, the organization structure shall be
reviewed with job description, job analysis, accountability and responsibility as well as reward and punishment provision for staffs. The Management Information System (MIS) should be developed for effective communication, information dissemination, decision making process on water management, repair and maintenance, CMC management, WUA coordination etc. The existing facilities and equipment as well as vehicles should be properly maintained in order to enhance the efficiency of staff movement and prompt management of SMIP. The frequent turnover of Senior staff also should be minimized.
3.5.3.4 Water Users Associations Water Users Associations (WUAs) is institutionalized for the water management and
representation of the beneficiaries. The objective of water management is i) to deliver water in a timely and equitable manner to all farmers in the area of SMIP, ii) to deliver water to form a flow rate that ensures efficient on-farm irrigation and iii) as far as possible, adopt delivery schedules to crop water requirements.
Further, the structured irrigation adopted in the project is based on the principal that
CMC would runcontinuously during irrigation season, supplying full water to secondary canal, sub-secondary canal and tertiary canals commanding 1000 ha. and less would run either at full capacity or be closed by turn. At the time or running full capacity, water would automatically be distributed into water course proportionately to the areas served; water delivered to water course would be distributed in rotation to field outlets serving about 4 ha. each. WUA is responsible for water management and repair and maintenance at water course level.
Table 3.37:Water Users Associations
S.N. WUAs Level Number 1 Water Users Group (Toli) Water Course Level 1675 2 Water Users Committee (WUC) Tertiary Level 86 3 Water Users Coordination Committee
(WUCC) Secondary (Branch canal) Level
20
4 Water Users Central Coordination Committee (WUCCC)
CMC Level 1
Total 1782
59
The WUAs are registered and functioning as per the rules and regulation prevailing to
the act, Irrigation Regulation 2056, Irrigation Policy 2060. The formation of Water Users Groups has taken long timelap which was started in 2049 B.S and completed in 2065 B.S. The institutionalization and collective representation of Water Users Associations were not on time within certain period which affected the water management of command areas.
The elections of WUAs were not held as per scheduled time which affected the
efficient management and representation of beneficiaries. Some WUCC are working efficiently and some are less efficient in water management, ISF collection, coordination with farmers as well as project, repair and maintenance work etc.
For the Sustainability of WUAs, there should be consideration on management aspect
as follows;
1) Timely election of WUCC and WUCCC. The WUA should be updated and renewed on stipulated time. There should be coordination and involvement on planning, implementation and supervision and water management.Empowerment of WUAs by providing different kinds of training (organizational development, account management, technical skill etc.)Make effective and efficient on ISF collection with responsibility and authority to WUA.There should be transparency on management aspect of project and WUA in order to minimize the gap and misunderstanding.
2) One of the function of WUA is repair and maintenance of water system. There is high siltation in canal. There is shortage of labour for the silt removal and other works in the area which creates the problem for WUA to use the required labour on time to complete the works. According to procurement Act, WUA is not able to use heavy machines. As per the discussion with WUAs, there should be provision to use heavy machines to carry out the repair and maintenance work effectively and timely.
3) To transfer the ownership of canal to WUA, management handover of the system is necessary. The management of Sitagunj Branch Canal is handed over to WUCC under Irrigation and Water Resource Management Project. The handover process shall be continued to other canal system on SMIP.There should be joint project meetings with Project and WUCCC. The meetings of WUAs in all levels should be in timely and decision should be materialized.ISF collection should be made effective by creating the awareness and empowerment to farmers to encourage the use of ISF. WUA should be transparent on ISF collection and expenditure.
3.5.4 Environmental Aspect
The environmental aspect of the sustainability of the SMIP is presented below;
3.5.4.1 Environmental degradation plays vital role for the sustainability of the big project like
SMIP. In many causes it is out of control. SMIP diverts water from one of largest
rivers of the World. The intake site is located in a geologically fragile zone. The risk
of change in river flow pattern due to sudden unexpected landslides or glacier
outbursts upstream always exists. Koshi River is considered as the fourth highest
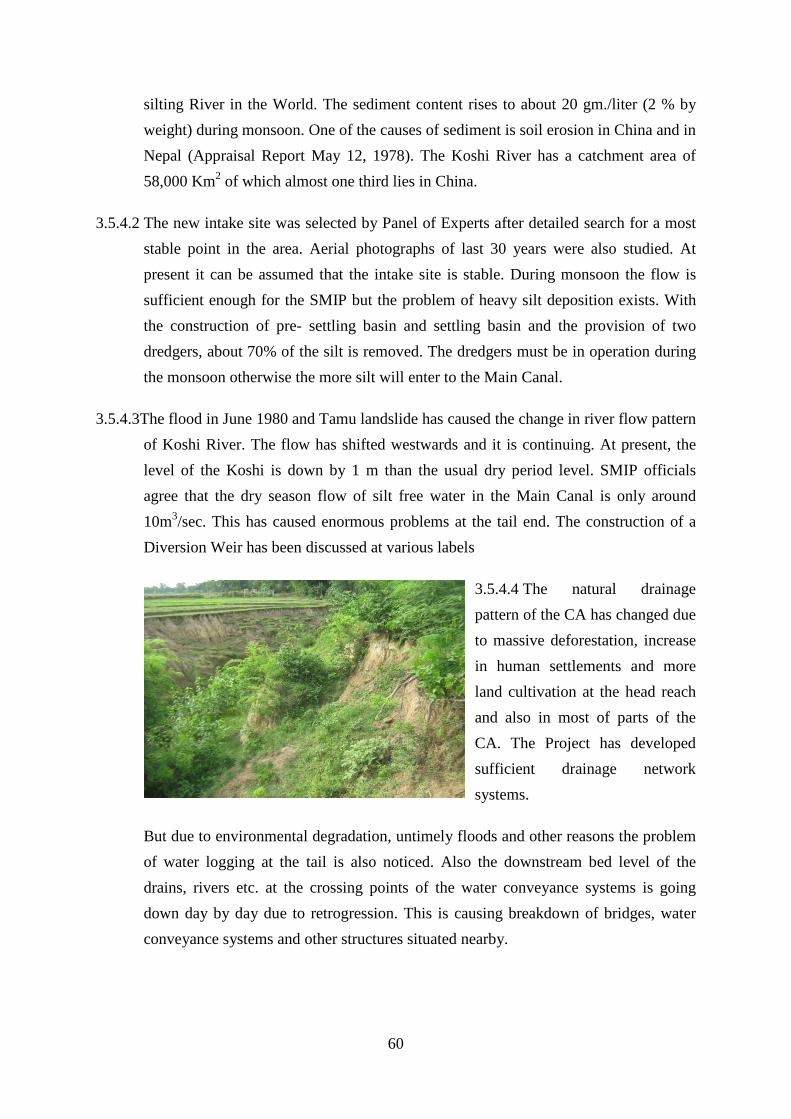
60
silting River in the World. The sediment content rises to about 20 gm./liter (2 % by
weight) during monsoon. One of the causes of sediment is soil erosion in China and in
Nepal (Appraisal Report May 12, 1978). The Koshi River has a catchment area of
58,000 Km2 of which almost one third lies in China.
3.5.4.2 The new intake site was selected by Panel of Experts after detailed search for a most
stable point in the area. Aerial photographs of last 30 years were also studied. At
present it can be assumed that the intake site is stable. During monsoon the flow is
sufficient enough for the SMIP but the problem of heavy silt deposition exists. With
the construction of pre- settling basin and settling basin and the provision of two
dredgers, about 70% of the silt is removed. The dredgers must be in operation during
the monsoon otherwise the more silt will enter to the Main Canal.
3.5.4.3The flood in June 1980 and Tamu landslide has caused the change in river flow pattern
of Koshi River. The flow has shifted westwards and it is continuing. At present, the
level of the Koshi is down by 1 m than the usual dry period level. SMIP officials
agree that the dry season flow of silt free water in the Main Canal is only around
10m3/sec. This has caused enormous problems at the tail end. The construction of a
Diversion Weir has been discussed at various labels
3.5.4.4 The natural drainage
pattern of the CA has changed due
to massive deforestation, increase
in human settlements and more
land cultivation at the head reach
and also in most of parts of the
CA. The Project has developed
sufficient drainage network
systems.
But due to environmental degradation, untimely floods and other reasons the problem
of water logging at the tail is also noticed. Also the downstream bed level of the
drains, rivers etc. at the crossing points of the water conveyance systems is going
down day by day due to retrogression. This is causing breakdown of bridges, water
conveyance systems and other structures situated nearby.
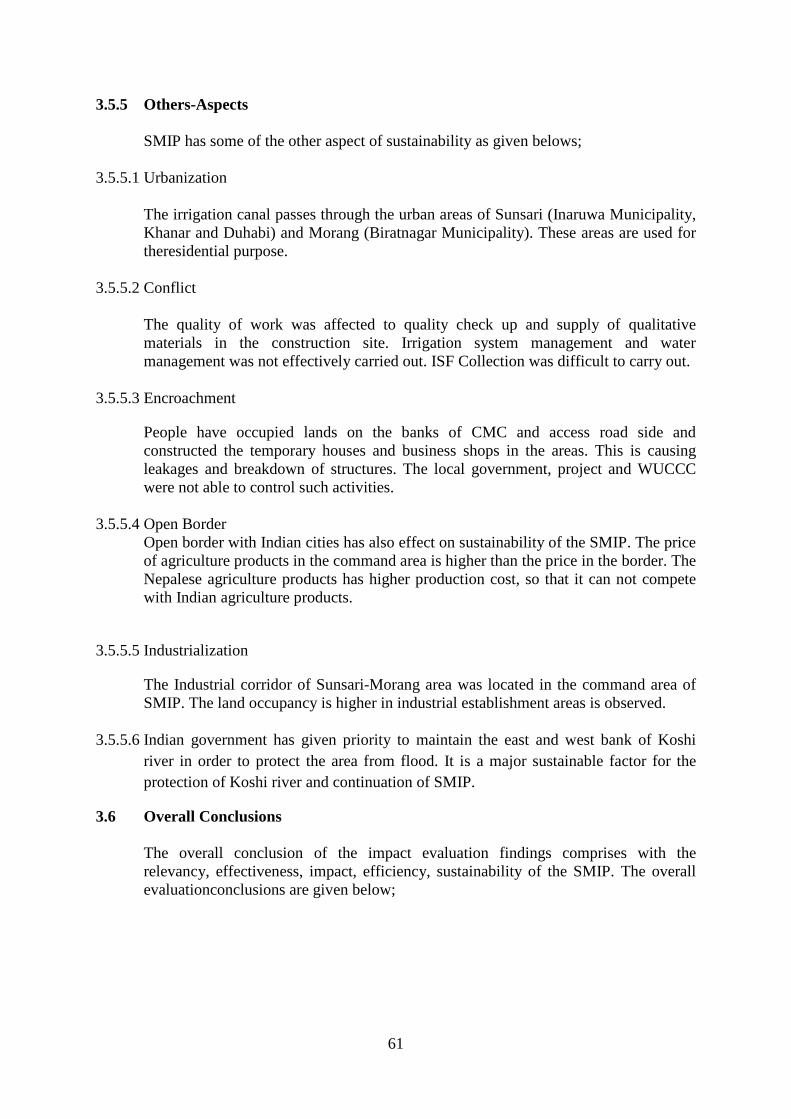
61
3.5.5 Others-Aspects
SMIP has some of the other aspect of sustainability as given belows;
3.5.5.1 Urbanization
The irrigation canal passes through the urban areas of Sunsari (Inaruwa Municipality, Khanar and Duhabi) and Morang (Biratnagar Municipality). These areas are used for theresidential purpose.
3.5.5.2 Conflict
The quality of work was affected to quality check up and supply of qualitative materials in the construction site. Irrigation system management and water management was not effectively carried out. ISF Collection was difficult to carry out.
3.5.5.3 Encroachment
People have occupied lands on the banks of CMC and access road side and constructed the temporary houses and business shops in the areas. This is causing leakages and breakdown of structures. The local government, project and WUCCC were not able to control such activities.
3.5.5.4 Open Border Open border with Indian cities has also effect on sustainability of the SMIP. The price of agriculture products in the command area is higher than the price in the border. The Nepalese agriculture products has higher production cost, so that it can not compete with Indian agriculture products.
3.5.5.5 Industrialization
The Industrial corridor of Sunsari-Morang area was located in the command area of SMIP. The land occupancy is higher in industrial establishment areas is observed.
3.5.5.6 Indian government has given priority to maintain the east and west bank of Koshi river in order to protect the area from flood. It is a major sustainable factor for the protection of Koshi river and continuation of SMIP.
3.6 Overall Conclusions
The overall conclusion of the impact evaluation findings comprises with the relevancy, effectiveness, impact, efficiency, sustainability of the SMIP. The overall evaluationconclusions are given below;
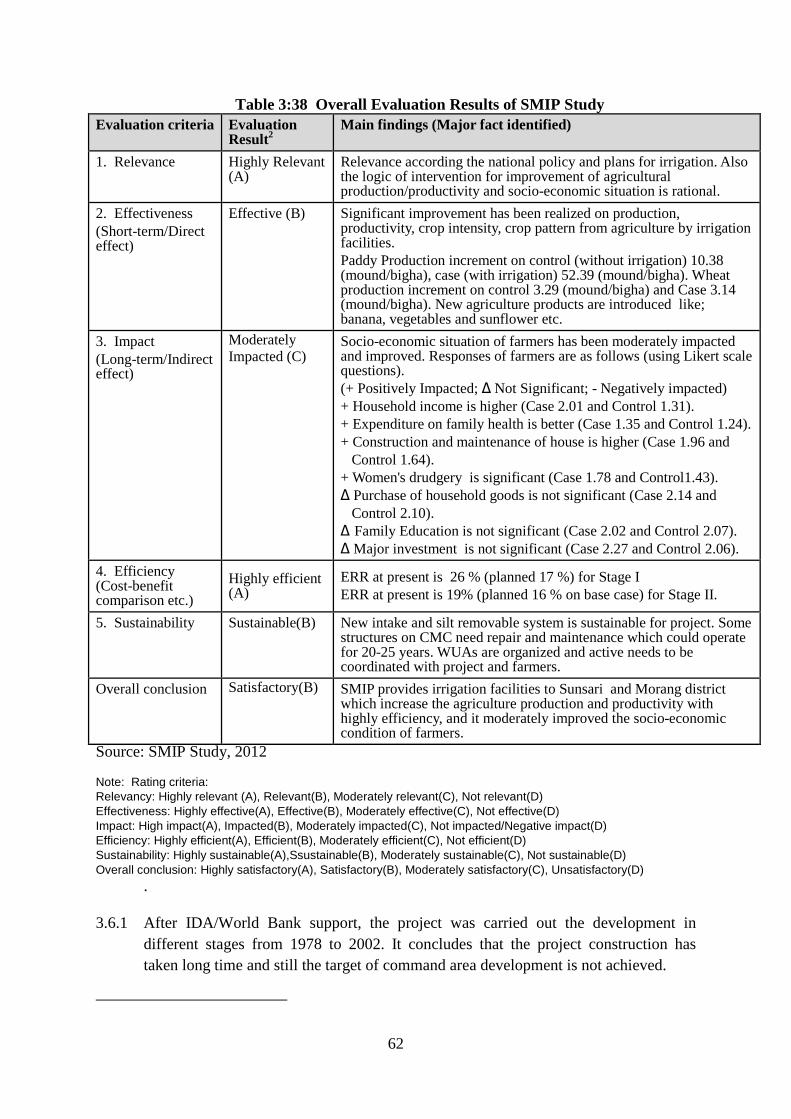
62
Table 3:38 Overall Evaluation Results of SMIP Study Evaluation criteria Evaluation
Result2 Main findings (Major fact identified)
1. Relevance
Highly Relevant (A)
Relevance according the national policy and plans for irrigation. Also the logic of intervention for improvement of agricultural production/productivity and socio-economic situation is rational.
2. Effectiveness (Short-term/Direct effect)
Effective (B) Significant improvement has been realized on production, productivity, crop intensity, crop pattern from agriculture by irrigation facilities. Paddy Production increment on control (without irrigation) 10.38 (mound/bigha), case (with irrigation) 52.39 (mound/bigha). Wheat production increment on control 3.29 (mound/bigha) and Case 3.14 (mound/bigha). New agriculture products are introduced like; banana, vegetables and sunflower etc.
3. Impact (Long-term/Indirect effect)
Moderately Impacted (C)
Socio-economic situation of farmers has been moderately impacted and improved. Responses of farmers are as follows (using Likert scale questions). (+ Positively Impacted; ∆ Not Significant; - Negatively impacted) + Household income is higher (Case 2.01 and Control 1.31). + Expenditure on family health is better (Case 1.35 and Control 1.24). + Construction and maintenance of house is higher (Case 1.96 and Control 1.64). + Women's drudgery is significant (Case 1.78 and Control1.43). ∆ Purchase of household goods is not significant (Case 2.14 and Control 2.10). ∆ Family Education is not significant (Case 2.02 and Control 2.07). ∆ Major investment is not significant (Case 2.27 and Control 2.06).
4. Efficiency (Cost-benefit comparison etc.)
Highly efficient (A)
ERR at present is 26 % (planned 17 %) for Stage I ERR at present is 19% (planned 16 % on base case) for Stage II.
5. Sustainability Sustainable(B) New intake and silt removable system is sustainable for project. Some structures on CMC need repair and maintenance which could operate for 20-25 years. WUAs are organized and active needs to be coordinated with project and farmers.
Overall conclusion Satisfactory(B)
SMIP provides irrigation facilities to Sunsari and Morang district which increase the agriculture production and productivity with highly efficiency, and it moderately improved the socio-economic condition of farmers.
Source: SMIP Study, 2012 Note: Rating criteria: Relevancy: Highly relevant (A), Relevant(B), Moderately relevant(C), Not relevant(D) Effectiveness: Highly effective(A), Effective(B), Moderately effective(C), Not effective(D) Impact: High impact(A), Impacted(B), Moderately impacted(C), Not impacted/Negative impact(D) Efficiency: Highly efficient(A), Efficient(B), Moderately efficient(C), Not efficient(D) Sustainability: Highly sustainable(A),Ssustainable(B), Moderately sustainable(C), Not sustainable(D) Overall conclusion: Highly satisfactory(A), Satisfactory(B), Moderately satisfactory(C), Unsatisfactory(D)
.
3.6.1 After IDA/World Bank support, the project was carried out the development in different stages from 1978 to 2002. It concludes that the project construction has taken long time and still the target of command area development is not achieved.
63
3.6.2 There was not sufficient participation of beneficiaries on planning, implementation, monitoring and supervision from the beginning which has affected on development of ownership feeling.
3.6.3 The project management aspect is not efficient as desired at present which also affect on operation of irrigation system. Clear cut job description of the staffs is not prepared. The staffs are not made accountable for their performances. Also frequent transfer of the senior staffs is practiced.The coordination and cooperation with agricultural credit agency are not effective.
3.6.4 Discharge in the CMC is lowered to 10m3/sec. in the dry period due to the lack of the diversion system at the upstream of the present intake site.
3.6.5 The two dredgers working in the settling basin are very old and need huge investment for maintenance.
3.6.6 Massive defforestation, increase in human settlement and other environmental factors as well as effect of Climate Change have caused lowering of the bed level of the river/rivulets and drains (retrogression) in the CA. The slide slopes of the canal banks are not maintained at many places which cause leakages and breakdown in the system
3.6.7 The mechanical equipment at the HR and other structures are not well maintained. This is causing improper distribution of water at the tail ends and especially at water courses.
3.6.8 Emergency rehabilitation works could not be carried out at needed places due to shortage of funds and other facilities. As for example huge investment was needed afterwards for the rehabilitation works at Thalaha and Budhi Khola.
3.6.9 The alignments of water courses are deficient. Beneficiaries are not well persuaded to construct field channel for irrigation.
3.6.10 Augmentation of the flow at the tail ends is necessary.
3.6.11 Productivity of major crops productivities are slightly increasing. However the yield potentials have not been attained yet. It might be due to poor adoption of high yielding genotypes and better crop management technologies. Planting of early paddy and growing of hybrid seeds of maize and vegetables are introduced in the area.Cropped area increased by 30728 ha in 1998/99 II stage to 34508 ha in 2011/12, cropping intensities (from 184 to 216% in Morang and from 184 to 205% in Sunsari’s SMIP command area) along with crop diversities (mono to multiple cropping) also increased. Net economic return from normal paddy, early paddy, wheat and sugarcane were NRs. 14800, 16480, 12530 and 132250 per hectare.
3.6.12 Mission oriented targeted crop-livestock integrated program need to be implemented
in the SMIP’s command area with the strong commitments and collaboration of all the stakeholders like SMIP, DADO, DLSO, I/NGOs, DDC, VDCs and so on.
64
Chapter IV
Recommendations 4.1 Recommendation for future policy-planning
4.1.1 SMIP should be continued. There should be people's participation from initial stage of project identification, planning to implementation, operation and maintenance of project. There should be involvement of Project Affected Persons (PAFs) of the project area in future projects.
4.1.2 Formation and mobilization of WUAs should be carried out as per the demand driven approach. It will enhance the ownership feelings and also increases the capacity of the beneficiaries for running the project successfully.
4.1.3 The decision making process of the policy related matters and regulatory system should be authorized to a special project management body (Board/Project). The timely decision on project implementation issues should be decided in order to minimize the project risk and cost increment.
4.1.4 WUAs should be made responsible for the repair and maintenance works to tertiary level. The capabilities of WUA in this respect must be improved.
4.1.5 The irrigation projects should be planned and designed on less urbanized area. Rapid urbanization causes increase in human settlements and industries which reduces the CA.
4.1.6 The management of the irrigation schemes should be handover to beneficiaries with specific action plan.
4.1.7 An adequate amount of budget for the development and promotion of agriculture need to be allocated. Adequate supports by GoN to develop the post harvest storage structures and marketing incentives should be rendered to the farmers from command area in order to streamlining the markets.
4.1.8 The policy and national plan should consider an integrated approach on irrigation development and agriculture development.
4.1.9 The financial resources must be generated for the full construction, operation and maintenance as well as post construction activities of the irrigation projects.
4.2 Recommendations for the Project Target 4.2.1 Provision of 'Diversion' system at the upstream of the present new intake site is
needed. NPC, MoI and other stakeholders should act promptly in this regard. 4,2,2 Strong collaboration and cooperation between and among the SMIP, DADOs at
community level should be developed.
65
4.2.3 For the implementation of Maintenance Plan (as prepared by SMIP), the resources should be made available to the project by exploring internal and external source of funding.
4.2.4 The operation of two dredgers must be continued for overall sustainability of the whole system. The deposited silt in the Main Canal, Branch Canals, Secondary Canals, Tertiary Canals, Water Courses etc. must be cleared as far as practicable. Flow of water above the free board level must not be allowed at any case.
4.3. Recommendation for Technical Aspect 4.3.1 Proper drainage development works are to be carried out to minimize water logging
and to reduce the retrogression of the rivers/rivulets and developed drains in the CA. Soil conservation works along with the afforestation programs need to be carried out in the CA.
4.3.2 Utmost care should be given to the durability of the old physical structures.
Temporary rehabilitation works is also necessary to prevent further damages that may need heavy investments afterwards as it has happened in the past.
4.3.3 The farmers must be persuaded to construct field channels to irrigate their lands as
this will improve the efficiency of water delivery. Conjunctive use of surface and groundwater at the tail ends can be improved by developing the shallow tube wells. More inlets should be made in order to augment flow at the tail end.
4.3.4 The present condition of the service roads must be improved and the movement of heavy vehicles must be stopped.
4.4 Recommendations for Management Aspect
4.4.1 In order to increase the agronomic efficiency of SMIP, technological interventions in terms of high yielding and improved varieties of major crops and their crop management technologies are to be developed and promoted through farmers participatory research approach. Larger plot demonstrations of the best-bet technologies, seed-kit distribution and farmers training and visits are the key approaches to upscale the farmers’ technical know-how.
4.4.2 Agricultural officers and veterinarians from SMIP should be deployed and trained
frequently to up-scale and update their technical know-how on improved agro-techniques.
4.4.3 The organization structure of the SMIP must be output oriented and for each and
every staffs must be developed and enacted. Based on the performance of the staffs rewards and punishments should be enforced.
4.4.4 WUAs in different levels should be accountable and functional ontheir duties,
responsibility and authorities. The project should provide the trainings, awareness campaign, InformationCommunication and Services (ICS) materials to WUA and beneficiaries. The project (social unit) should facilitate and monitor the WUAs
66
management and election process. The project should provide the technical guidance and facilitating role in operationalizing the system.
4.4.5 There should be coordination committee for irrigation management and agriculture
development as mission program. The committee shall be formed as follows: Director, Regional Irrigation Directorate Coordinator Director, Regional Agriculture Directorate Member
District Agriculture Development Office Member Agriculture Inputs Corporation Member Irrigation Division Office Member Agriculture Development Bank Member WUCCC Member District Livestock Development Office Member Project Manager (SMIP) Member Secretary
4.4.6 Heavy equipment needed for O & M must be repaired and maintained timely and must be made available for O & M works. Better co-ordination and co-operation between Regional Irrigation Directorate and SMIP is needed for the timely use of the heavy equipments.
4.5 Recommendation for Financial Aspect 4.5.1 Timely release of the budget and delegation of necessary authority including the
financial authority from top to the bottom should be made with corresponding emphasis on accountability.
4.5.2 ISF collection rate is in decreasing trend. The responsibility need to be given to
WUAs for ISF collection. Act related to ISF collection and management should be formulated and enacted.The act should made provision to collect ISF with the land revenue. The government should provide the matching funds to the WUAs as equivalent to the collected ISF to increase its collection.
67
Bibliography
1. Three Years Interim Plan, NPC 2010. 2. Present Status Report. SMIP, 2012 3. Project Completion Report of SMHO, NEPECO, 1998. 4. Follow up Review Mission of SMHP, 1996 5. Main Canal and Cropping Potential of SMIP, SG Naryamurty, 1991. 6. Study of Agronomic Effect of SMIP, Nippon Koei, J.V. 1990. 7. Progress Report on Water Management Activity, SMIDB, 1992. 8. Irrigation Policy DOI, 2003. 9. Irrigation Regulation 2056 (Amend 2060), DOI. 10. Inception Report Headworks Improvement Desilting Facilities, NEDECO, Silt J.V. 1991. 11. Project Completion Report of SMIP Stage II, Nippon Koei co. ltd. 1994. 12. ICR on Irrigation Sector Project, WB (South Asia Regional Office, 2005. 13. Socio-economic Bench Mark Study of SMIP , APROSC, 1987 14. Report & Recommendation to President for IDA Credit, WB, 1978. 15. Staff Appraisal Report SMIDD Stage I, WB, 1978 16. ICR of SMIP Stage III, NEDECO, 2003. 17. Staff Appraisal Report of SMIP II, Project WB, 1987. 18. ICR of SMIP II Project , WB, 1996. 19. District Agriculture Profile, DADO, Biratnagar 20. District Agriculture Profile, DADO, Sunsari 21. Population Census, 2001, CBS 22. Annual Report, DOI 23. Voter's List of Morang and Sunsari district
68
Annex-I Sample Questionnaire of Household Survey
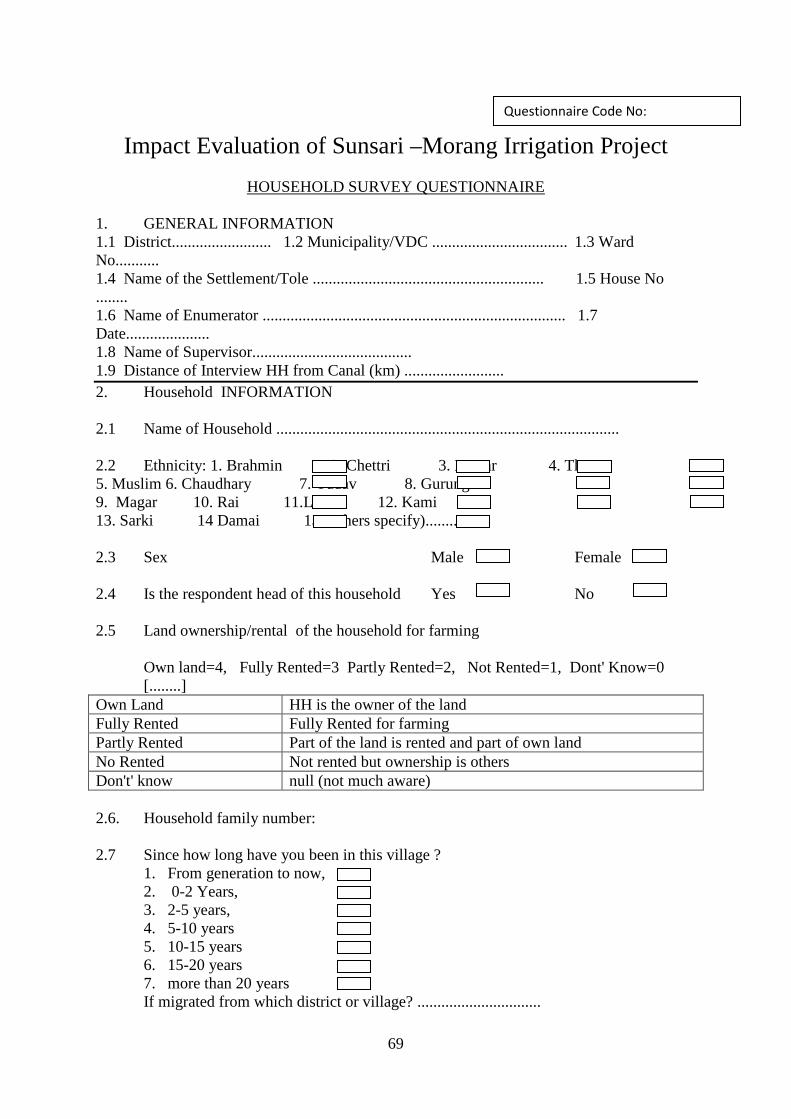
69
Impact Evaluation of Sunsari –Morang Irrigation Project
HOUSEHOLD SURVEY QUESTIONNAIRE 1. GENERAL INFORMATION 1.1 District......................... 1.2 Municipality/VDC .................................. 1.3 Ward No........... 1.4 Name of the Settlement/Tole .......................................................... 1.5 House No ........ 1.6 Name of Enumerator ............................................................................ 1.7 Date..................... 1.8 Name of Supervisor........................................ 1.9 Distance of Interview HH from Canal (km) ......................... 2. Household INFORMATION 2.1 Name of Household ...................................................................................... 2.2 Ethnicity: 1. Brahmin 2. Chettri 3. Newar 4. Tharu 5. Muslim 6. Chaudhary 7. Yadav 8. Gurung 9. Magar 10. Rai 11.Limbu 12. Kami 13. Sarki 14 Damai 15. Others specify)............ 2.3 Sex Male Female 2.4 Is the respondent head of this household Yes No 2.5 Land ownership/rental of the household for farming
Own land=4, Fully Rented=3 Partly Rented=2, Not Rented=1, Dont' Know=0 [........]
Own Land HH is the owner of the land Fully Rented Fully Rented for farming Partly Rented Part of the land is rented and part of own land No Rented Not rented but ownership is others Don't' know null (not much aware) 2.6. Household family number: 2.7 Since how long have you been in this village ?
1. From generation to now, 2. 0-2 Years, 3. 2-5 years, 4. 5-10 years 5. 10-15 years 6. 15-20 years 7. more than 20 years
If migrated from which district or village? ...............................
Questionnaire Code No:
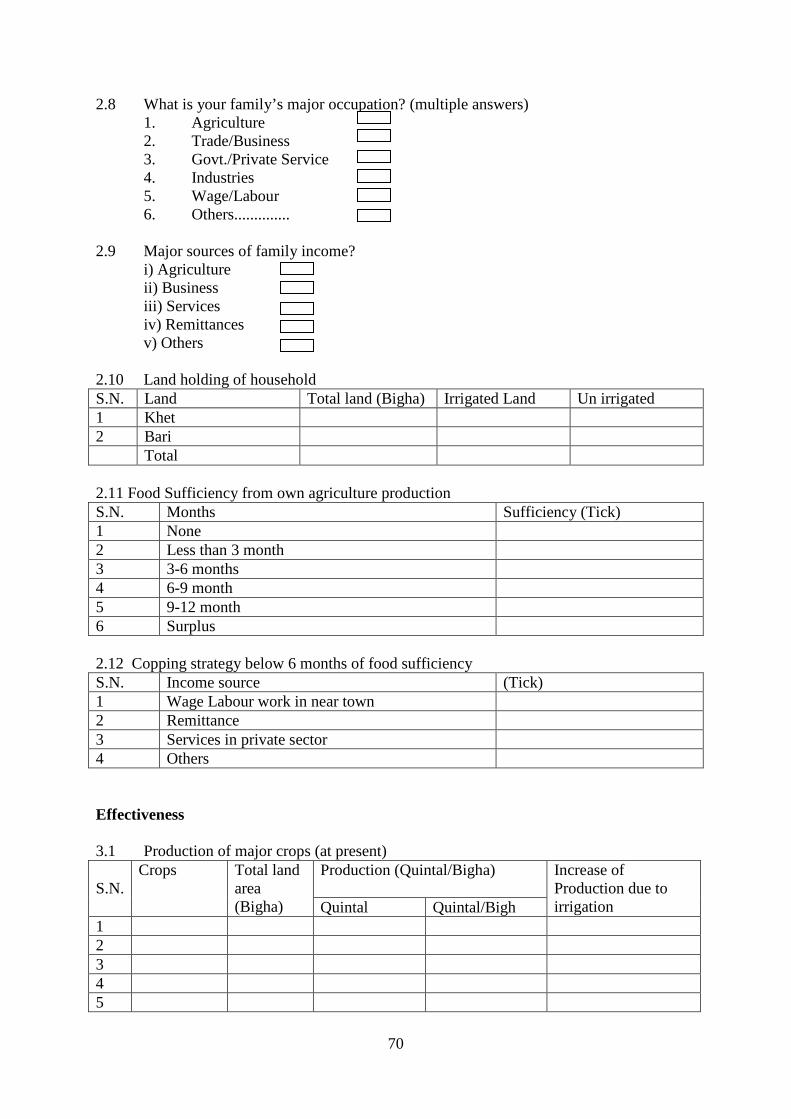
70
2.8 What is your family’s major occupation? (multiple answers) 1. Agriculture 2. Trade/Business 3. Govt./Private Service 4. Industries 5. Wage/Labour 6. Others.............. 2.9 Major sources of family income?
i) Agriculture ii) Business iii) Services iv) Remittances v) Others
2.10 Land holding of household S.N. Land Total land (Bigha) Irrigated Land Un irrigated 1 Khet 2 Bari Total 2.11 Food Sufficiency from own agriculture production S.N. Months Sufficiency (Tick) 1 None 2 Less than 3 month 3 3-6 months 4 6-9 month 5 9-12 month 6 Surplus 2.12 Copping strategy below 6 months of food sufficiency S.N. Income source (Tick) 1 Wage Labour work in near town 2 Remittance 3 Services in private sector 4 Others Effectiveness 3.1 Production of major crops (at present) S.N.
Crops Total land area (Bigha)
Production (Quintal/Bigha)
Increase of Production due to irrigation Quintal Quintal/Bigh
1 2 3 4 5
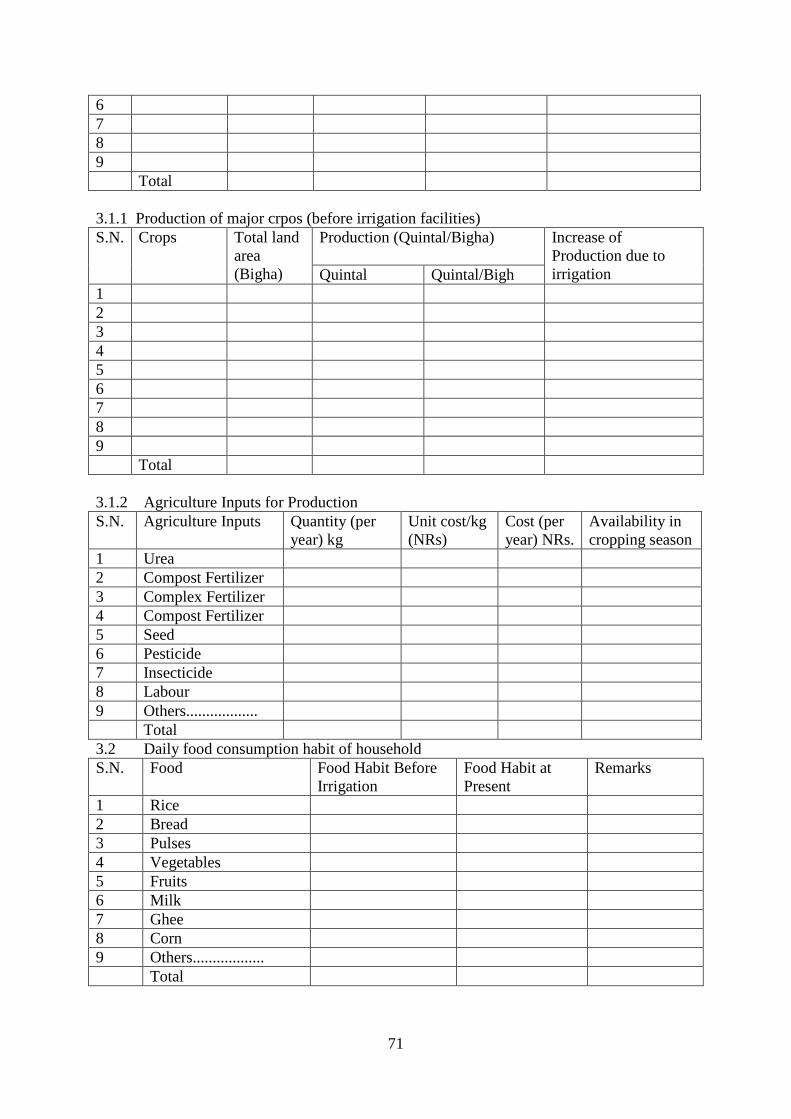
71
6 7 8 9 Total 3.1.1 Production of major crpos (before irrigation facilities) S.N.
Crops Total land area (Bigha)
Production (Quintal/Bigha)
Increase of Production due to irrigation Quintal Quintal/Bigh
1 2 3 4 5 6 7 8 9 Total 3.1.2 Agriculture Inputs for Production S.N. Agriculture Inputs Quantity (per
year) kg Unit cost/kg (NRs)
Cost (per year) NRs.
Availability in cropping season
1 Urea 2 Compost Fertilizer 3 Complex Fertilizer 4 Compost Fertilizer 5 Seed 6 Pesticide 7 Insecticide 8 Labour 9 Others.................. Total 3.2 Daily food consumption habit of household S.N. Food Food Habit Before
Irrigation Food Habit at Present
Remarks
1 Rice 2 Bread 3 Pulses 4 Vegetables 5 Fruits 6 Milk 7 Ghee 8 Corn 9 Others.................. Total
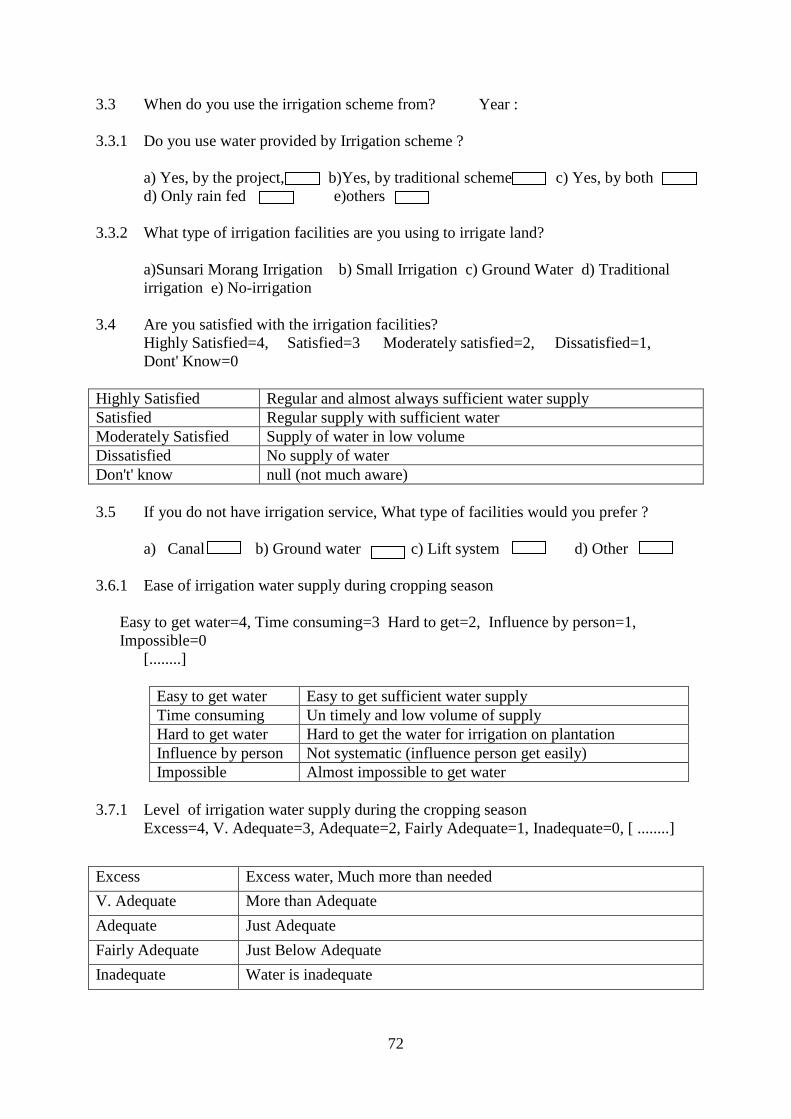
72
3.3 When do you use the irrigation scheme from? Year : 3.3.1 Do you use water provided by Irrigation scheme ?
a) Yes, by the project, b)Yes, by traditional scheme c) Yes, by both d) Only rain fed e)others
3.3.2 What type of irrigation facilities are you using to irrigate land?
a)Sunsari Morang Irrigation b) Small Irrigation c) Ground Water d) Traditional irrigation e) No-irrigation
3.4 Are you satisfied with the irrigation facilities?
Highly Satisfied=4, Satisfied=3 Moderately satisfied=2, Dissatisfied=1, Dont' Know=0
Highly Satisfied Regular and almost always sufficient water supply Satisfied Regular supply with sufficient water Moderately Satisfied Supply of water in low volume Dissatisfied No supply of water Don't' know null (not much aware) 3.5 If you do not have irrigation service, What type of facilities would you prefer ?
a) Canal b) Ground water c) Lift system d) Other 3.6.1 Ease of irrigation water supply during cropping season
Easy to get water=4, Time consuming=3 Hard to get=2, Influence by person=1, Impossible=0 [........]
Easy to get water Easy to get sufficient water supply Time consuming Un timely and low volume of supply Hard to get water Hard to get the water for irrigation on plantation Influence by person Not systematic (influence person get easily) Impossible Almost impossible to get water
3.7.1 Level of irrigation water supply during the cropping season
Excess=4, V. Adequate=3, Adequate=2, Fairly Adequate=1, Inadequate=0, [ ........]
Excess Excess water, Much more than needed
V. Adequate More than Adequate
Adequate Just Adequate
Fairly Adequate Just Below Adequate
Inadequate Water is inadequate

73
3.8 Are you a member of Water User Association ?
i) Yes ii) No. 3.9 If Yes, what is your present responsibility under irrigation committee? 1. Position........................ 2. No of Meetings attended.......................... 3.10 Interval of meetings being held ? i) Once in a month ii) Twice in a month iii) Bimonthly iv) as required 3.11 Are you satisfied with the mobilization of User’s Community in maintaining and
improvement of irrigation facilities? Highly Satisfied=4, Satisfied=3 Moderately satisfied=2, Dissatisfied=1, Dont' Know=0 [..........]
Highly Satisfied Well maintained canal/regular water in farm by WUA Satisfied WUA members working as per demand Moderately Satisfied Mobilized members in minimum level Dissatisfied No mobilization and no work for improvement of irrigation
facilities Don't' know null (not much aware)
3.12 How much do you pay for Irrigation Charges ?
NRs. 3.13 Are you satisfied with the Charges ?
Highly Satisfied=4, Satisfied=3 Moderately satisfied=2, Dissatisfied=1, Dont' Know=0 [..........]
Highly Satisfied The irrigation charges are appropriate for sufficient water Satisfied The charges is satisfied for existing services Moderately Satisfied The charges is little bit high for low volume of water Dissatisfied Charges is high and burden for farmers having no sufficient
irrigation Don't' know null (not much aware)
Impact 4.1 Has the cropping intensity changed in your land after irrigation?
Totally Change=4, Changed=3 Moderately changed=2, No change=1, Dont' Know=0 [..........]
Totally Change The cropping intensity has changed totally after irrigation Changed Cropping intensity is changed Moderately Changed
Cropping intensity is changed in some extent
No Change No change on cropping intensity after irrigation Don't' know null (not much aware)
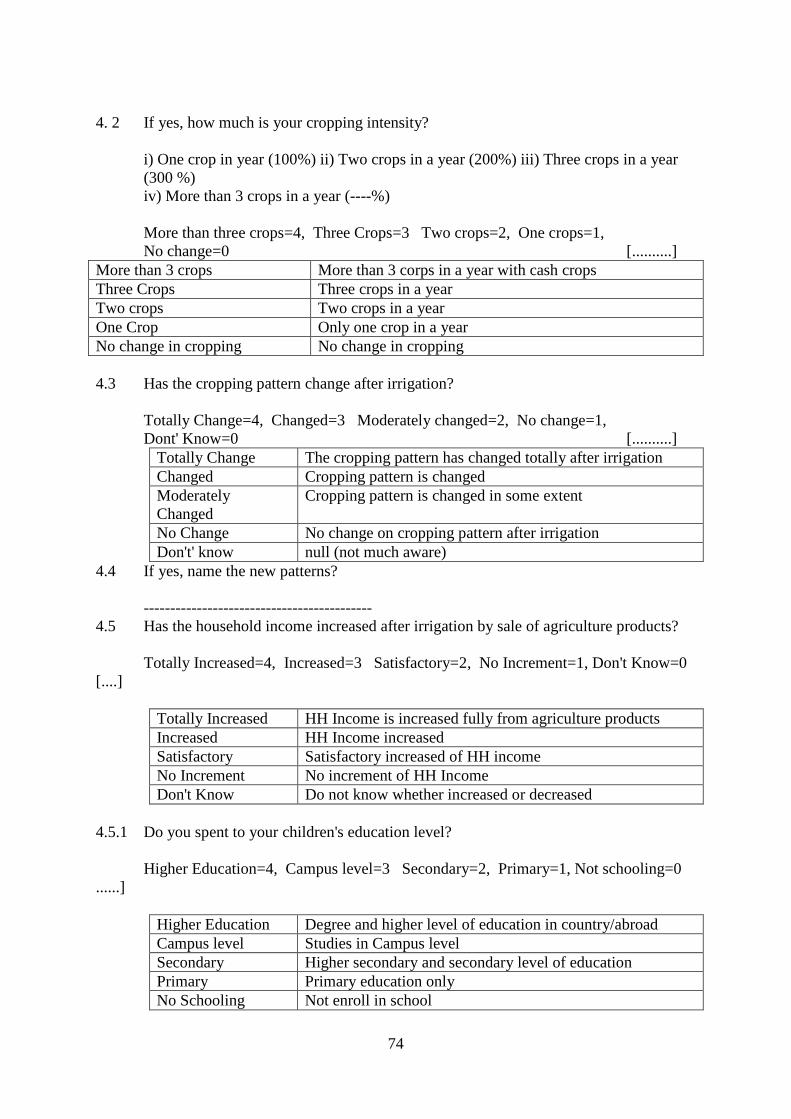
74
4. 2 If yes, how much is your cropping intensity?
i) One crop in year (100%) ii) Two crops in a year (200%) iii) Three crops in a year (300 %) iv) More than 3 crops in a year (----%) More than three crops=4, Three Crops=3 Two crops=2, One crops=1, No change=0 [..........]
More than 3 crops More than 3 corps in a year with cash crops Three Crops Three crops in a year Two crops Two crops in a year One Crop Only one crop in a year No change in cropping No change in cropping 4.3 Has the cropping pattern change after irrigation?
Totally Change=4, Changed=3 Moderately changed=2, No change=1, Dont' Know=0 [..........]
Totally Change The cropping pattern has changed totally after irrigation Changed Cropping pattern is changed Moderately Changed
Cropping pattern is changed in some extent
No Change No change on cropping pattern after irrigation Don't' know null (not much aware)
4.4 If yes, name the new patterns? ------------------------------------------- 4.5 Has the household income increased after irrigation by sale of agriculture products?
Totally Increased=4, Increased=3 Satisfactory=2, No Increment=1, Don't Know=0
[....]
Totally Increased HH Income is increased fully from agriculture products Increased HH Income increased Satisfactory Satisfactory increased of HH income No Increment No increment of HH Income Don't Know Do not know whether increased or decreased
4.5.1 Do you spent to your children's education level?
Higher Education=4, Campus level=3 Secondary=2, Primary=1, Not schooling=0 ......]
Higher Education Degree and higher level of education in country/abroad Campus level Studies in Campus level Secondary Higher secondary and secondary level of education Primary Primary education only No Schooling Not enroll in school
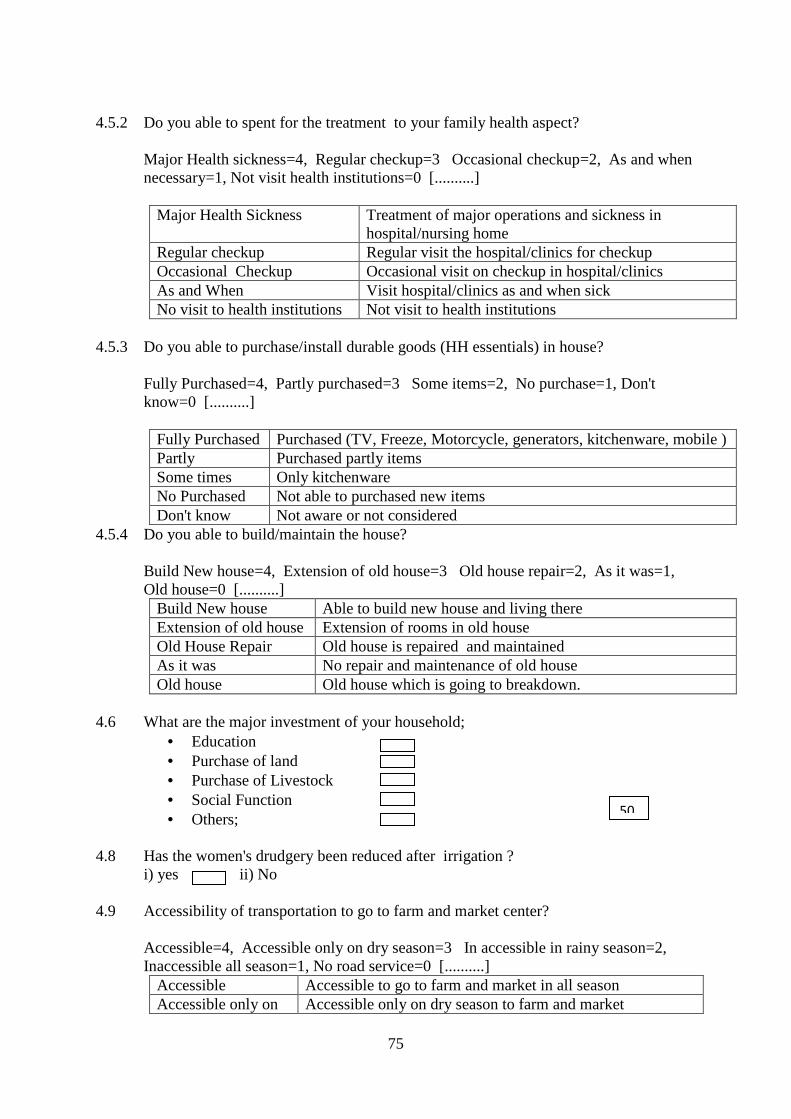
75
4.5.2 Do you able to spent for the treatment to your family health aspect?
Major Health sickness=4, Regular checkup=3 Occasional checkup=2, As and when necessary=1, Not visit health institutions=0 [..........]
Major Health Sickness Treatment of major operations and sickness in
hospital/nursing home Regular checkup Regular visit the hospital/clinics for checkup Occasional Checkup Occasional visit on checkup in hospital/clinics As and When Visit hospital/clinics as and when sick No visit to health institutions Not visit to health institutions
4.5.3 Do you able to purchase/install durable goods (HH essentials) in house?
Fully Purchased=4, Partly purchased=3 Some items=2, No purchase=1, Don't know=0 [..........]
Fully Purchased Purchased (TV, Freeze, Motorcycle, generators, kitchenware, mobile ) Partly Purchased partly items Some times Only kitchenware No Purchased Not able to purchased new items Don't know Not aware or not considered
4.5.4 Do you able to build/maintain the house?
Build New house=4, Extension of old house=3 Old house repair=2, As it was=1, Old house=0 [..........]
Build New house Able to build new house and living there Extension of old house Extension of rooms in old house Old House Repair Old house is repaired and maintained As it was No repair and maintenance of old house Old house Old house which is going to breakdown.
4.6 What are the major investment of your household;
• Education • Purchase of land • Purchase of Livestock • Social Function • Others;
4.8 Has the women's drudgery been reduced after irrigation ?
i) yes ii) No 4.9 Accessibility of transportation to go to farm and market center?
Accessible=4, Accessible only on dry season=3 In accessible in rainy season=2, Inaccessible all season=1, No road service=0 [..........]
Accessible Accessible to go to farm and market in all season Accessible only on Accessible only on dry season to farm and market
50
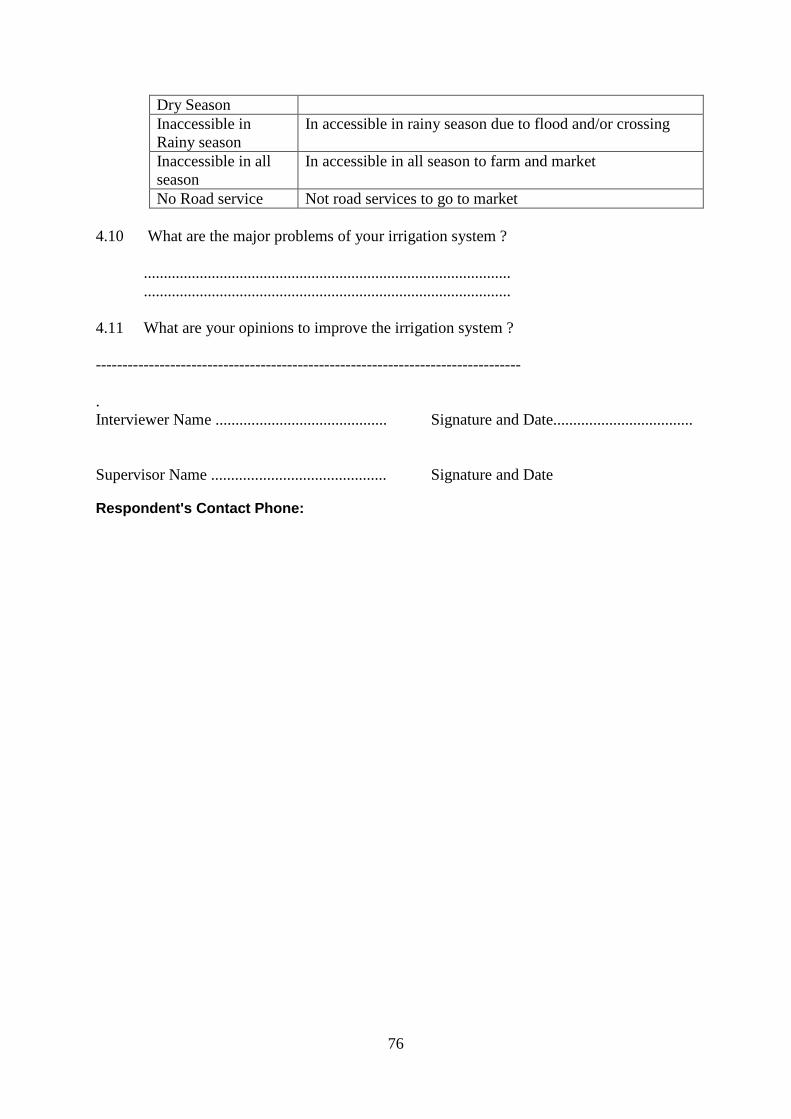
76
Dry Season Inaccessible in Rainy season
In accessible in rainy season due to flood and/or crossing
Inaccessible in all season
In accessible in all season to farm and market
No Road service Not road services to go to market
4.10 What are the major problems of your irrigation system ? ............................................................................................ ............................................................................................ 4.11 What are your opinions to improve the irrigation system ? -------------------------------------------------------------------------------- . Interviewer Name ........................................... Signature and Date................................... Supervisor Name ............................................ Signature and Date
Respondent's Contact Phone:
77
Annex-II Sample Checklist of FGD and Technical study

78
CHECKLIST FOR -Beneficiaries (Water Users Associations) 1. GENERAL INFORMATION 1.1 Name of Participating WUAs
a. b; c; d; e; f
1.2 General Objective of WUAs a. b. c. d. e.
1.3 Major Activities of Irrigation facilities a. b. c. d. e
2. Water User's Association Management 2.1 WUA Members : Total farmers 2.2 Formation of Executive Committee
• Election of process EC • Women Participation • Social Inclusion
S.N. Name Position
1
2
3
4
5
6

79
7
8
9
10
11
12
13
2.2 Number of Meetings held in last year: 2.2 Major Topics of Discussion on Irrigation and Farming (minutes of the meetings) 2.2 Major income source of the WUA (Last year 2067/68)
S.N. Income Source Amount
1
2
3
4
5
Total
2.3 Main Expenditure of WUA
S.N. Main Expenditure Amount
1
2
3
4
5
Total
2.4 Irrigation Charges per month : Rs.............................
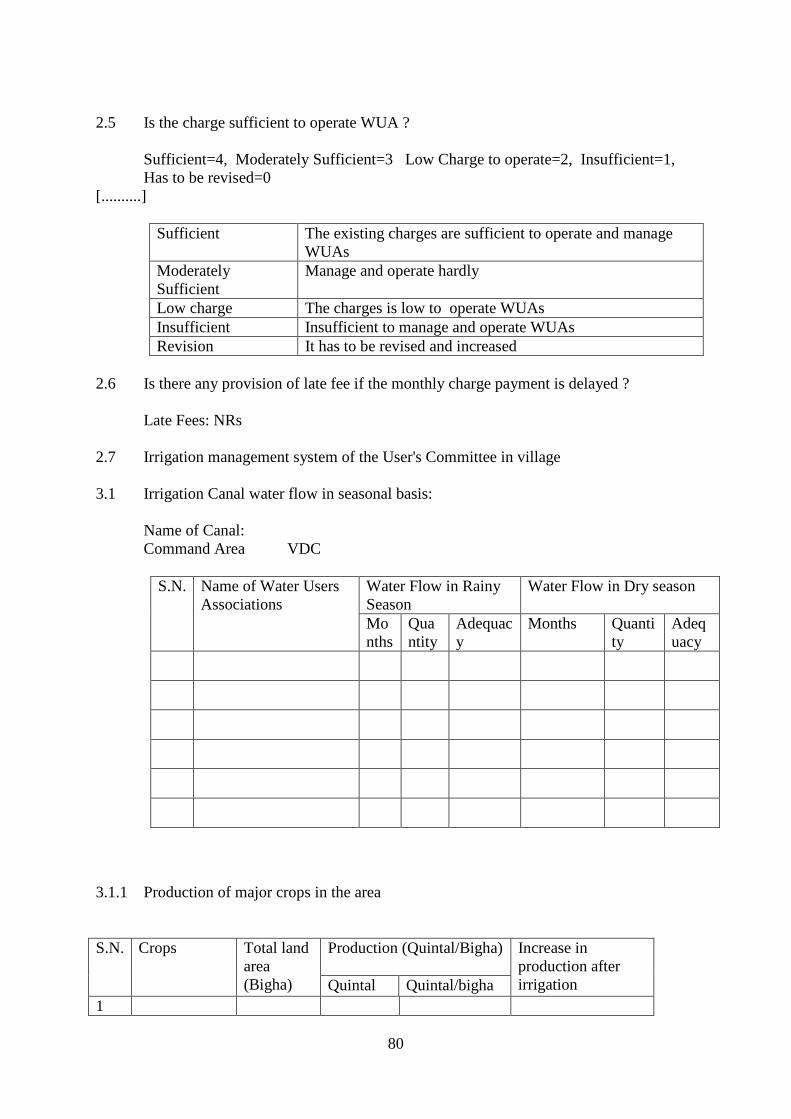
80
2.5 Is the charge sufficient to operate WUA ?
Sufficient=4, Moderately Sufficient=3 Low Charge to operate=2, Insufficient=1, Has to be revised=0
[..........]
Sufficient The existing charges are sufficient to operate and manage WUAs
Moderately Sufficient
Manage and operate hardly
Low charge The charges is low to operate WUAs Insufficient Insufficient to manage and operate WUAs Revision It has to be revised and increased
2.6 Is there any provision of late fee if the monthly charge payment is delayed ?
Late Fees: NRs 2.7 Irrigation management system of the User's Committee in village 3.1 Irrigation Canal water flow in seasonal basis:
Name of Canal: Command Area VDC
S.N. Name of Water Users
Associations Water Flow in Rainy Season
Water Flow in Dry season
Months
Quantity
Adequacy
Months Quantity
Adequacy
3.1.1 Production of major crops in the area S.N. Crops Total land
area (Bigha)
Production (Quintal/Bigha)
Increase in production after irrigation Quintal Quintal/bigha
1
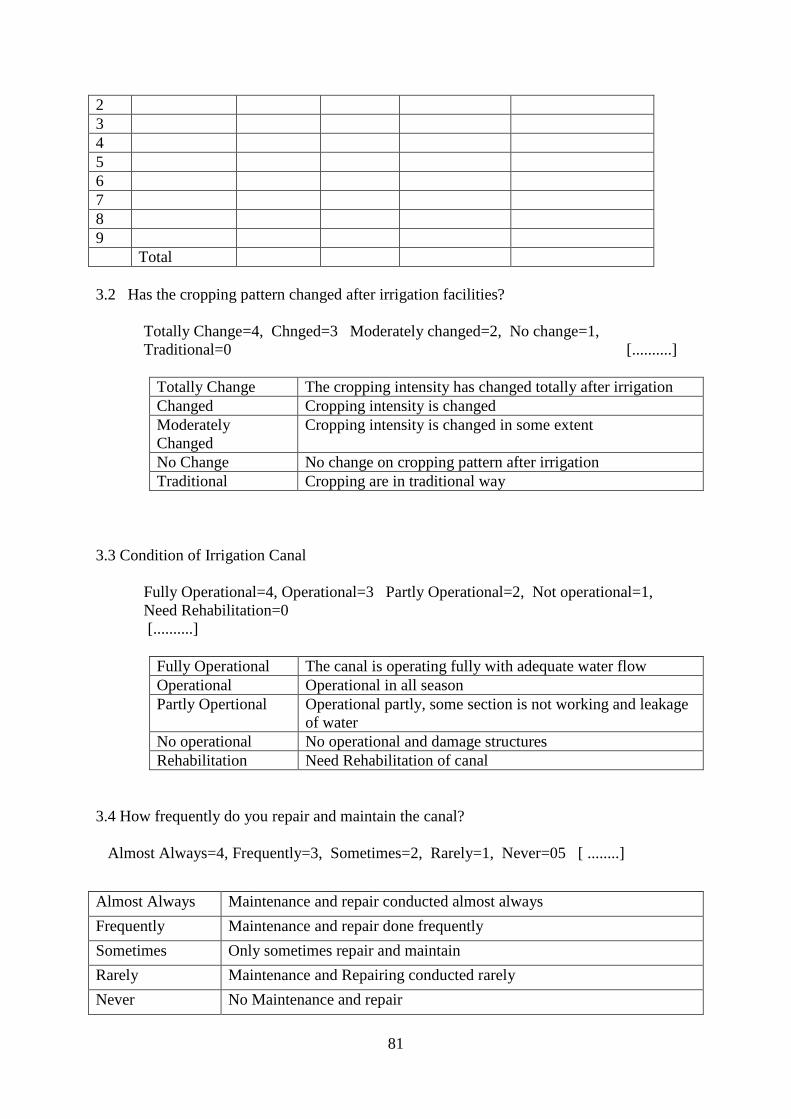
81
2 3 4 5 6 7 8 9 Total 3.2 Has the cropping pattern changed after irrigation facilities?
Totally Change=4, Chnged=3 Moderately changed=2, No change=1, Traditional=0 [..........]
Totally Change The cropping intensity has changed totally after irrigation Changed Cropping intensity is changed Moderately Changed
Cropping intensity is changed in some extent
No Change No change on cropping pattern after irrigation Traditional Cropping are in traditional way
3.3 Condition of Irrigation Canal
Fully Operational=4, Operational=3 Partly Operational=2, Not operational=1, Need Rehabilitation=0
[..........]
Fully Operational The canal is operating fully with adequate water flow Operational Operational in all season Partly Opertional Operational partly, some section is not working and leakage
of water No operational No operational and damage structures Rehabilitation Need Rehabilitation of canal
3.4 How frequently do you repair and maintain the canal?
Almost Always=4, Frequently=3, Sometimes=2, Rarely=1, Never=05 [ ........]
Almost Always Maintenance and repair conducted almost always
Frequently Maintenance and repair done frequently
Sometimes Only sometimes repair and maintain
Rarely Maintenance and Repairing conducted rarely
Never No Maintenance and repair
82
3.5 Please enlist the major problems of your irrigation system. ----------------------------------------------------------------------------------------- --------------------------------------------------------------------------------------------- --------------------------------------------------------------------------------------------- --------------------------------------------------------------------------------------------- --------------------------------------------------------------------------------------------- What are your suggestions for improvements of irrigation facilities in your area, please enlist according to priority? --------------------------------------------------------------------------------------------- --------------------------------------------------------------------------------------------- --------------------------------------------------------------------------------------------- ---------------------------------------------------------------------------------------------
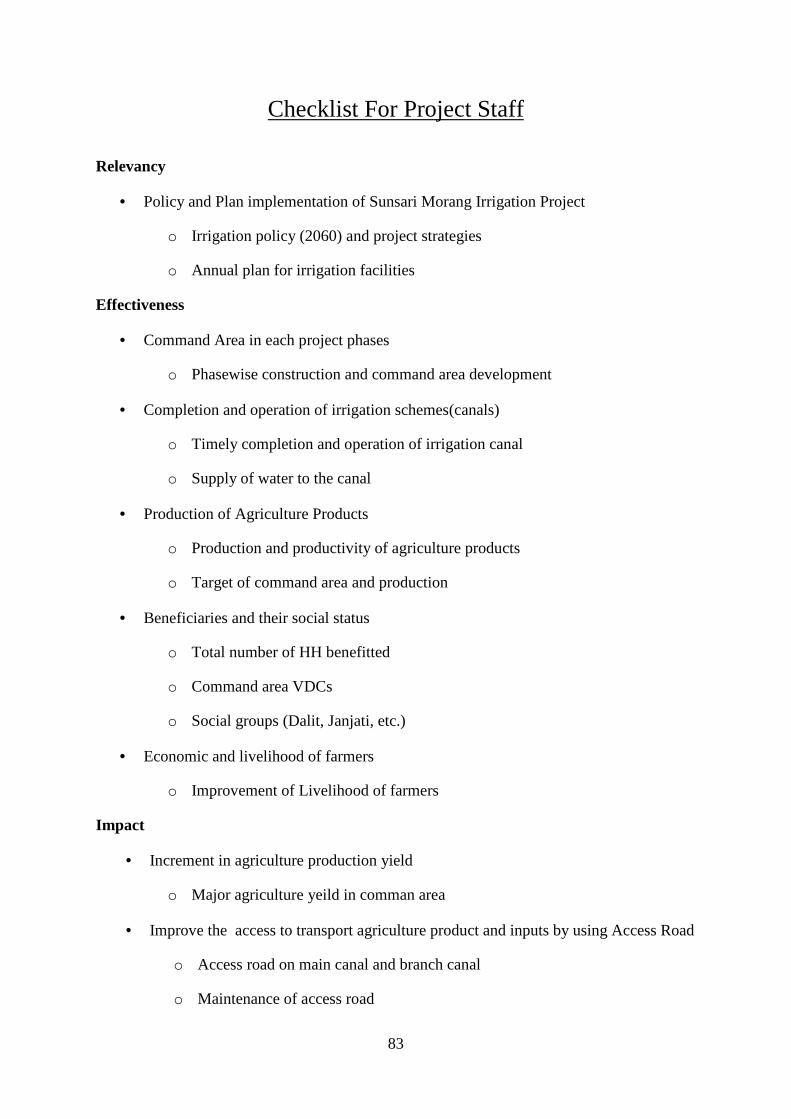
83
Checklist For Project Staff
Relevancy
• Policy and Plan implementation of Sunsari Morang Irrigation Project
o Irrigation policy (2060) and project strategies
o Annual plan for irrigation facilities
Effectiveness
• Command Area in each project phases
o Phasewise construction and command area development
• Completion and operation of irrigation schemes(canals)
o Timely completion and operation of irrigation canal
o Supply of water to the canal
• Production of Agriculture Products
o Production and productivity of agriculture products
o Target of command area and production
• Beneficiaries and their social status
o Total number of HH benefitted
o Command area VDCs
o Social groups (Dalit, Janjati, etc.)
• Economic and livelihood of farmers
o Improvement of Livelihood of farmers
Impact
• Increment in agriculture production yield
o Major agriculture yeild in comman area
• Improve the access to transport agriculture product and inputs by using Access Road
o Access road on main canal and branch canal
o Maintenance of access road
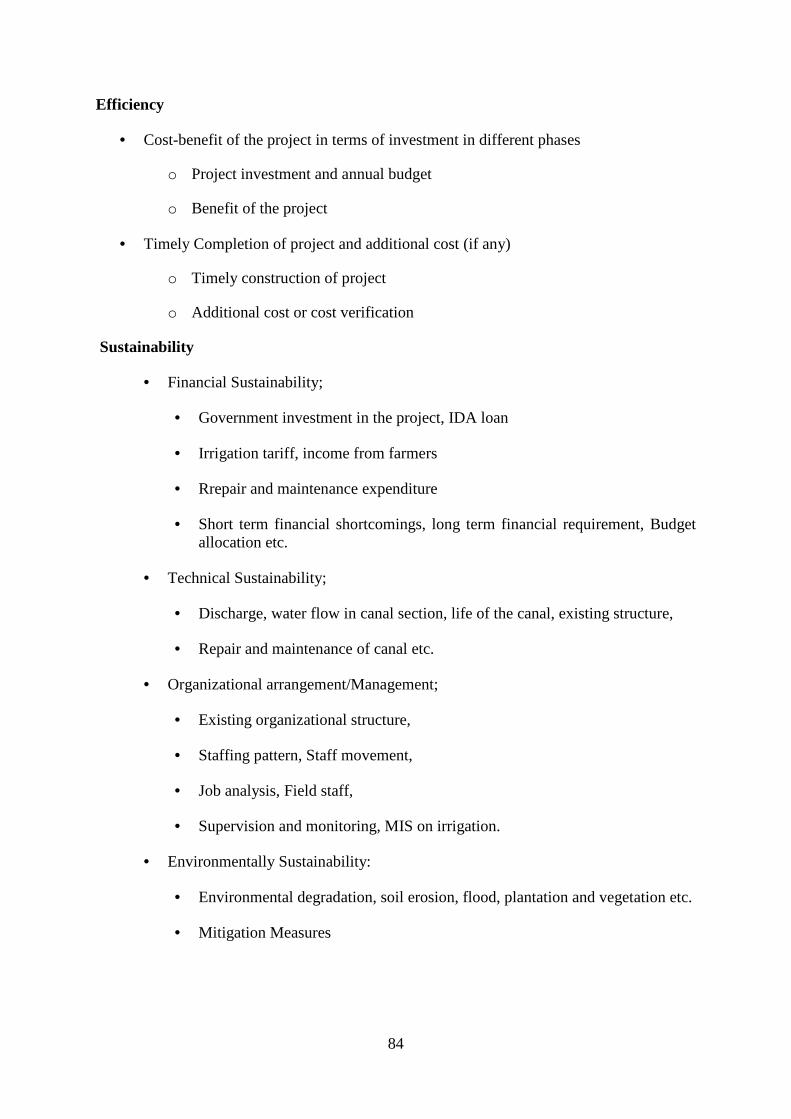
84
Efficiency
• Cost-benefit of the project in terms of investment in different phases
o Project investment and annual budget
o Benefit of the project
• Timely Completion of project and additional cost (if any)
o Timely construction of project
o Additional cost or cost verification
Sustainability
• Financial Sustainability;
• Government investment in the project, IDA loan
• Irrigation tariff, income from farmers
• Rrepair and maintenance expenditure
• Short term financial shortcomings, long term financial requirement, Budget allocation etc.
• Technical Sustainability;
• Discharge, water flow in canal section, life of the canal, existing structure,
• Repair and maintenance of canal etc.
• Organizational arrangement/Management;
• Existing organizational structure,
• Staffing pattern, Staff movement,
• Job analysis, Field staff,
• Supervision and monitoring, MIS on irrigation.
• Environmentally Sustainability:
• Environmental degradation, soil erosion, flood, plantation and vegetation etc.
• Mitigation Measures
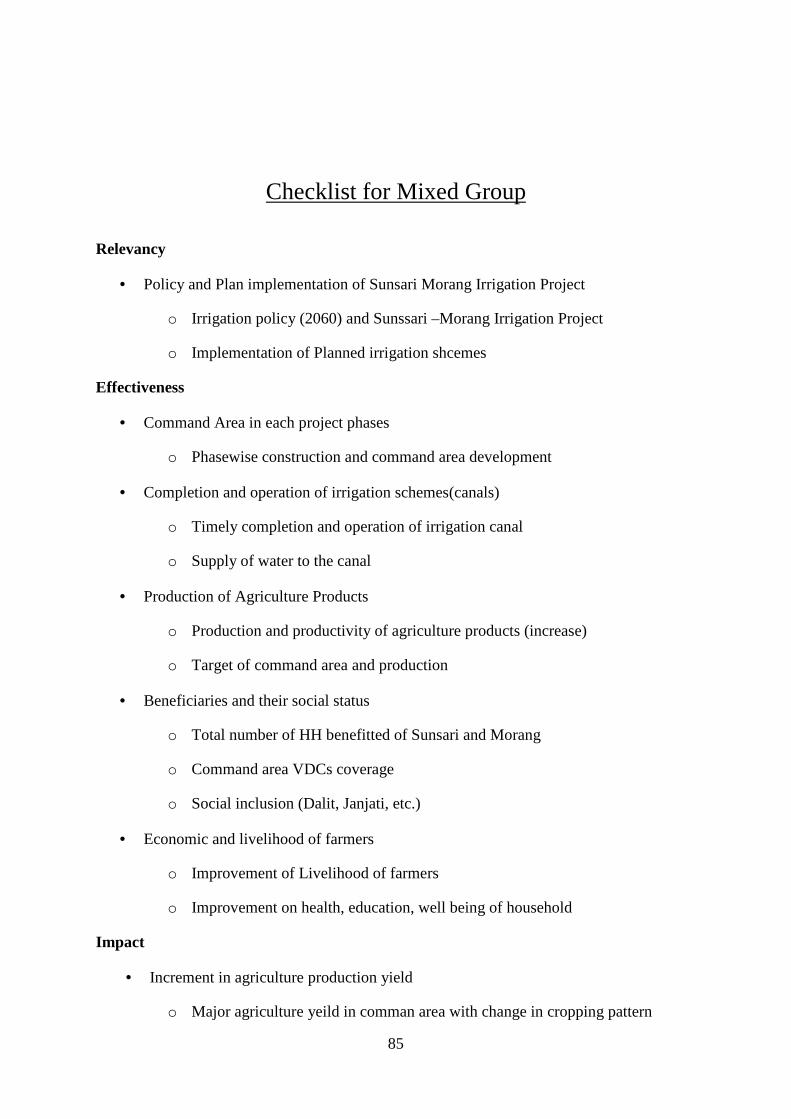
85
Checklist for Mixed Group
Relevancy
• Policy and Plan implementation of Sunsari Morang Irrigation Project
o Irrigation policy (2060) and Sunssari –Morang Irrigation Project
o Implementation of Planned irrigation shcemes
Effectiveness
• Command Area in each project phases
o Phasewise construction and command area development
• Completion and operation of irrigation schemes(canals)
o Timely completion and operation of irrigation canal
o Supply of water to the canal
• Production of Agriculture Products
o Production and productivity of agriculture products (increase)
o Target of command area and production
• Beneficiaries and their social status
o Total number of HH benefitted of Sunsari and Morang
o Command area VDCs coverage
o Social inclusion (Dalit, Janjati, etc.)
• Economic and livelihood of farmers
o Improvement of Livelihood of farmers
o Improvement on health, education, well being of household
Impact
• Increment in agriculture production yield
o Major agriculture yeild in comman area with change in cropping pattern
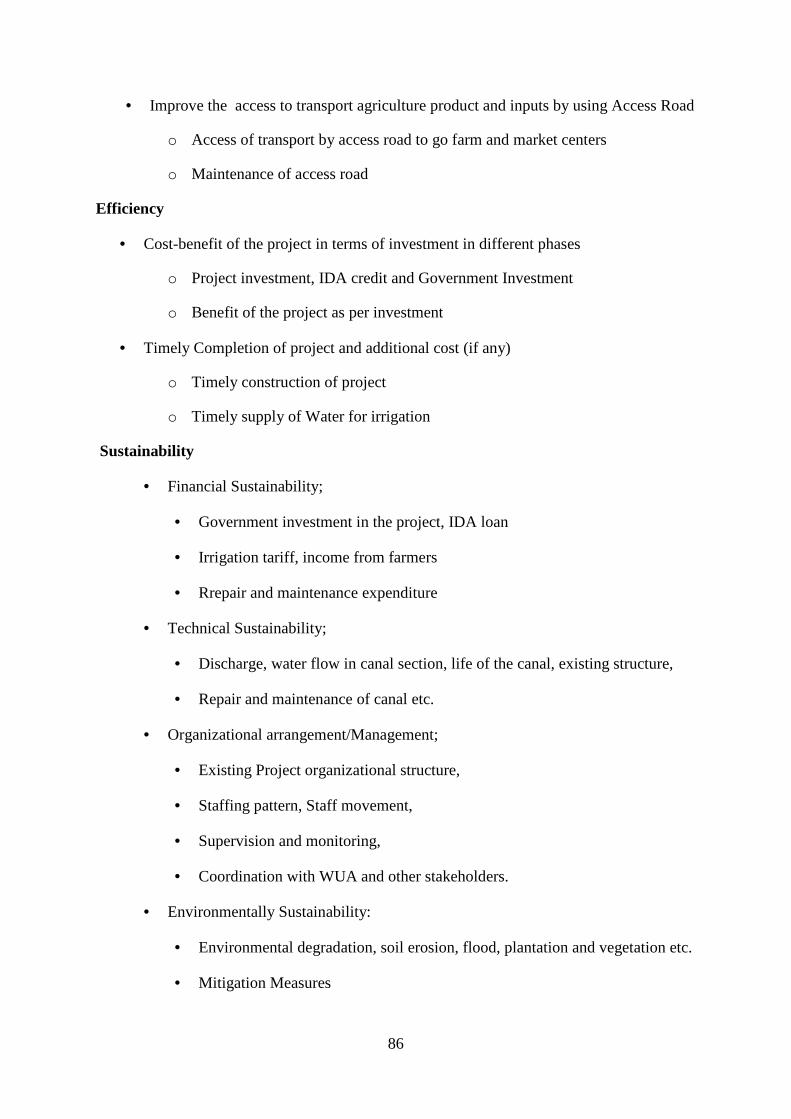
86
• Improve the access to transport agriculture product and inputs by using Access Road
o Access of transport by access road to go farm and market centers
o Maintenance of access road
Efficiency
• Cost-benefit of the project in terms of investment in different phases
o Project investment, IDA credit and Government Investment
o Benefit of the project as per investment
• Timely Completion of project and additional cost (if any)
o Timely construction of project
o Timely supply of Water for irrigation
Sustainability
• Financial Sustainability;
• Government investment in the project, IDA loan
• Irrigation tariff, income from farmers
• Rrepair and maintenance expenditure
• Technical Sustainability;
• Discharge, water flow in canal section, life of the canal, existing structure,
• Repair and maintenance of canal etc.
• Organizational arrangement/Management;
• Existing Project organizational structure,
• Staffing pattern, Staff movement,
• Supervision and monitoring,
• Coordination with WUA and other stakeholders.
• Environmentally Sustainability:
• Environmental degradation, soil erosion, flood, plantation and vegetation etc.
• Mitigation Measures
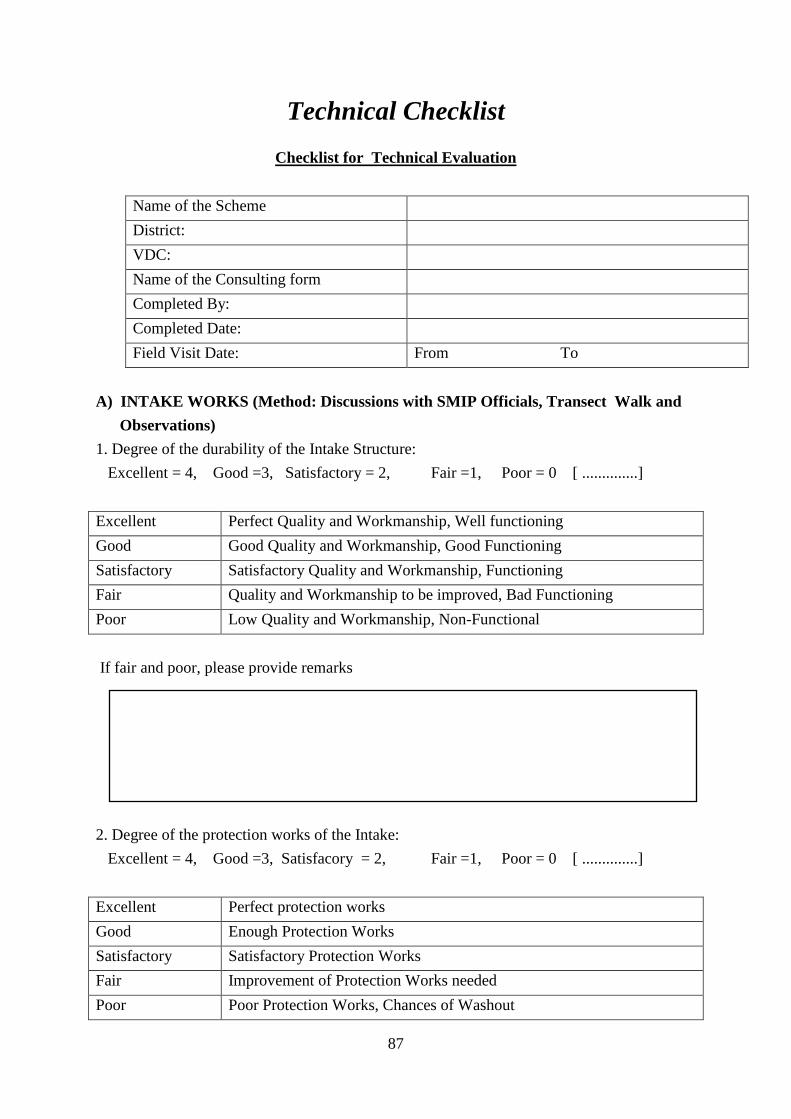
87
Technical Checklist
Checklist for Technical Evaluation
Name of the Scheme
District:
VDC:
Name of the Consulting form
Completed By:
Completed Date:
Field Visit Date: From To
A) INTAKE WORKS (Method: Discussions with SMIP Off icials, Transect Walk and
Observations)
1. Degree of the durability of the Intake Structure:
Excellent = 4, Good =3, Satisfactory = 2, Fair =1, Poor = 0 [ ..............]
Excellent Perfect Quality and Workmanship, Well functioning
Good Good Quality and Workmanship, Good Functioning
Satisfactory Satisfactory Quality and Workmanship, Functioning
Fair Quality and Workmanship to be improved, Bad Functioning
Poor Low Quality and Workmanship, Non-Functional
If fair and poor, please provide remarks
2. Degree of the protection works of the Intake:
Excellent = 4, Good =3, Satisfacory = 2, Fair =1, Poor = 0 [ ..............]
Excellent Perfect protection works
Good Enough Protection Works
Satisfactory Satisfactory Protection Works
Fair Improvement of Protection Works needed
Poor Poor Protection Works, Chances of Washout
88
If fair and poor, please provide remarks
3. Frequency of cleaning and maintenance of Intake:
Almost Always=4, Frequently=3, Sometimes=2, Rarely=1,Never=0 [ ........]
Almost Always Maintenance and Cleaning conducted almost always
Frequently Maintenance and cleaning done frequently
Sometimes Only sometimes clean and maintain
Rarely Maintenance and Cleaning conducted rarely
Never No Maintenance and Cleaning
If rarely and never, please provide remarks
4. Degree of Community Participation in O & M works:
Excellent = 4, Good =3, Satisfactory = 2, Fair =1, Poor = 0 [ ............]
Excellent Full Participation in Decision Making and Implementation of O&M
works
Good Good Participation in all aspects of O & M
Satisfactory Satisfactory Participation in O &M Works
Fair Less Participation in O&M Works as desired
Poor Almost No Participation in O & M Works
If fair and poor, please provide remarks
89
B) MAIN/BRANCH CANAL SECTION (Method: Transect Walk , Observation, Discussion with Official of SMIP) Chainage No: ............................ to Chainage No.........................
1. Adequacy of water demand:
Excess=4, Adequate=3, Satisfactory=2, Fairly Adequate=1, Inadequate=0, .]
Excess Excess water, Much more than needed
Adequate Adequate of water
Satisfactory Satisfactory of water flow
Fairly Adequate Just Below Adequate
Inadequate Water is inadequate
If inadequate, please provide remarks
2. Adequacy of Service level:
Very High=4, High=3, Adequate= 2, Fairly Adequate=1, Inadequate=0 [ ]
Very High Service level to full and utmost satisfaction
High Service level to satisfaction
Adequate Adequate service level
Fairly Adequate Service level fairly adequate
Inadequate Inadequate Service Level
If inadequate, please provide remarks
3. Degree of the functional aspects of Main/Branch Canal Section (damaged, ,malfunctioned,
leakage etc.) :
Excellent = 4, Good =3, Satisfactory = 2, Fair =1, Poor =0 [ ..............]
Excellent No leakage, no breakdown, and no damaged section
Good Good functioning as required
Satisfactory Satisfactory functioning with minor problems
Fair Unsatisfactory functioning
Poor Leakages, breakdowns and damaged section
90
If fair and poor, please provide remarks
4. Frequency of Silt removal on the studied section: Almost Always=4, Frequently=3, Sometimes=2, Rarely=1, Never=05 [ ......]
Almost Always Removable of Silt almost always
Frequently Frequently removable of silt
Sometimes Silt remove sometimes
Rarely Silt remove rarely
Never No silt removable
If rarely and never, please provide remarks
5. Frequency of maintenance of the studied section:
Almost Always=4, Frequently=3, Sometimes=2, Rarely=1, Never=05 [ ....]
Almost Always Maintenance conducted almost always
Frequently Maintenance done frequently
Sometimes Only sometimes maintained
Rarely Maintenance conducted rarely
Never No Maintenance
If rarely and never, please provide remarks
6.Degree of the condition and durability of the Structure on Main/Branch Canal Section:
Excellent = 4, V. Good =3, Good = 2, Fair =1, Poor = 0 [ ..............]
Excellent Perfect Quality and Workmanship, Well functioning
91
Good Good Quality and Workmanship, Good Functioning
Satisfactory Satisfactory Quality and Workmanship, Functioning
Fair Quality and Workmanship to be improved, Bad Functioning
Poor Low Quality and Workmanship, Non-Functional
If fair and poor, please provide remarks
7. Degree of the functional matter of the Structures on Main/Branch Canal Section
(damaged, ,malfunctioned, leakage etc.) :
Excellent = 4, Very Good =3, Good = 2, Fair =1, Poor =0 [ ..............]
Excellent No leakage, no breakdown, and no damaged section
Good Good functioning as required
Satisfactory Satisfactory functioning with minor problems
Fair Unsatisfactory functioning
Poor Leakages, breakdowns and damaged section
92
Annex-III Technical Study of SMIP
93
Annex III- Technical Study: Findings
The new intake, pre-settling basin, old intake, settling basin, mini hydro plant, transmission
lines and main canal up to 106RD of SMIP was visited by the technical team together with
the concerned project officials. The following are the main findings and recommendations:
• The new intake is built about 1300 m upstream of the old intake to increase the
discharge of CMC from 45 m3/sec to 60 m3/sec.
• In between the new intake and old intake a 300 m long pre-settling basin is
constructed where the velocity of flow is low in order to collect as much silt as
possible through sedimentation process. The collected silt is removed through the
escape built on the right side of the old intake.
• The durability of structures at both of the intakes can be rated good.
• The maintenance and cleaning of the intake sites is done frequently.
• More protection worked are needed upstream of the new intake.
• Beneficiaries and the project official pointed out that the flow of Kosi River is
shifting westwards year by year. This has caused the low flow of water in CMC
during the dry season. Some kind of diversion system is needed to divert enough flow
from Kosi River to CMC during dry season.
• A bridge on Kosi River just upstream of the new intake is being built by The Road
Department. It is strongly recommended that the officials of National Planning
Commission and concerned Ministries take up the matter seriously to construct the
bridge with the diversion system for SMIP.
• So far as community participation for O & M works of the intake sites is concerned it
can be said that it is poor. The WUACC & the Project must discuss themselves for
more and more involvement of the beneficiaries in O & M works of the intakes. Also
the beneficiaries are advice to follow up the construction. aspects of the diversion
system.
• The gates and other mechanical structures installed at the intakes are maintained
satisfactorily.
• A de-silting basin (length 990 m and bed with 60m) is constructed to collect the silt
of the second highest silting river (Kosi) of the World. The silt is removed with the
help of French made two- cutter suction dredgers of 14.0m3/hr capacity. Both the
94
dredgers are in operation from last 17 years and at present they need heavy
maintenance works for their operation.
• During the field visit it was found that only one dredger was working and the another
was out of order. It is strongly suggested that the Ministry allocate sufficient funds to
SMIP for the procurement of new dredgers.
• 3.2 Megawatt of power is also generated downstream of the de-silting basin with the
head available due to the construction of the new intake. The power generated is used
to operate the dredgers and the surplus energy is connected with the National Grid.
The mini hydro-power plant was under maintenance works during the field visit.
• At 12. 9 RD of the Main Canal the bed level of Patmali River has lowered beyond
expectations. This was caused by flood on the river and progressive lowering of the
downstream levels. The bridge over the Patmali River and the water conveyance
works were effected. The project carried out protection works with enough energy
dissipation system, cut offs and side protections works. Now all the structures are
safe. The project officials are of the opinion that if the rehabilitation works were
carried out earlier, the cost of the repairing works would have been much less.
• The supply of water in the Main Canal section can be considered satisfactory. It was
observed that the silt deposit is not cleared for a long duration of time. This means
that the present supply level is below the required supply level. As discussed with
SMIP officials the present supply is around 45 m3/sec instead of 60 m3/sec, which is
the required discharge. The discharge in the Main Canal is lowered not only by the
deposition of silt nut also due to leakages in several points. The tail portion of SMIP
is badly effected due to the low flow of water in the main canal. The irrigation water
is inadequate which causes several problems at the tail. It was known that there is a
problem of closing the Main Canal for a long period for maintenance works. It is
recommended that the SMIP with the help of WUACC take prompt action for the
clearance of deposited silt and repair of the leakages. The Main Canal must be closed
for repairing works in such a way that it did not disturb the cropping practices of the
beneficiaries. WUACC has a big role to play in this aspect. It must be carried out in a
planned way with the acceptance of all stakeholders.
• Another problem in the Main Canal is the encroachment of banks in several places
specially in Jhumka and Khanar areas. Houses are built on the top of the banks.
Toilets are built on the inner slope of the banks. Kitchen gardening and animal
95
husbandry development works are carried out in both the side slopes. The houses built
on the top of the banks have electricity connections. How it is possible on the
government land ? The slopes are cut in several places and the initial designed slope
is not maintained. The seepage line is disturbed causing leakages at several places.
The operation and maintenance of the Main Canal is also effected. The houses must
be immediately removed and the damaged portions repaired to avoid leakages. The
side slopes of the banks must be maintained as per the design. Plantation of tree is
recommended.
• The condition of the service roads is fair. In some sections immediate maintenance is
needed. The roads are built for O & M works of SMIP. But at present most of the
roads, especially from Jhumka to Chatara is used for regular traffic. Heavy loaded
trucks and buses filled with passengers are using the service roads. Accident can take
place at any time. In past a bus plunged into the canal causing several deaths. Also
recently a tractor fell down the canal which also caused some casualties of human
being. This type of activities must be controlled.
• The Aqueduct at 48 RD of the Main Canal is functioning satisfactory. But due to the
lowering of the bed level of the river, the bridge and the Aqueduct is effected. At
present a new bridge is being constructed to replace the old bridge. Sufficient energy
dissipation works & protection works on the bed of the river is recommended to
protect further lowering of the bed level due to retrogression. Also the movement of
heavy vehicles through the old bridge is to be stopped immediately.
• The Escape built at 52RD is closed now to prevent further damages downstream and
the nearby settlement. The side drain is also not functioning. The guide wall is also
damaged. Necessary protection works downstream, rehabilitation of the guide wall
and the repair of the drain is to be carried out as soon as possible. The Escape can not
be closed for ever as the possibility of opening the Escape always exists in case of
emergency.
• The Cross Drainage works at 52 RD needs minor repairing works like plastering etc.
• Also at 56 RD the bridge is damaged due to the lowering of the bed level
downstream. Protection works to prevent further damages is needed.
• The Head Regulator at 64 RD is functioning satisfactorily.
• At 70 RD there is a small Escape which functions well. The floor downstream of the
bridge is damaged. Protection works are recommended.
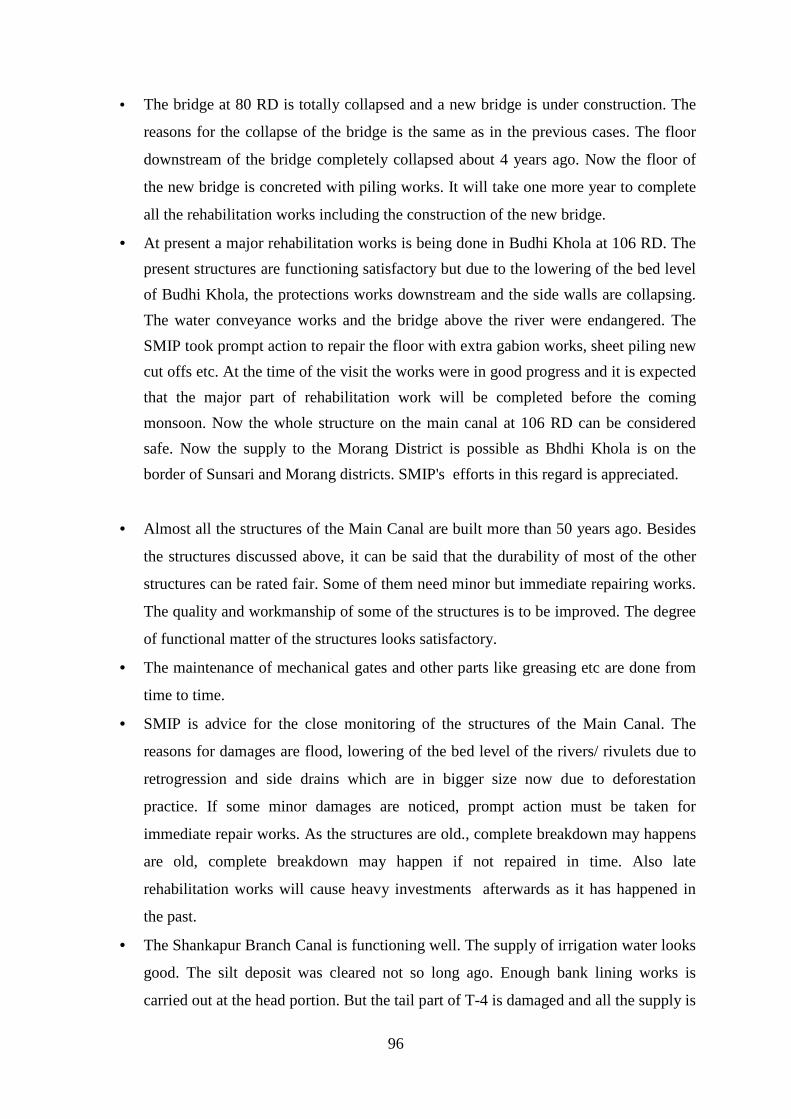
96
• The bridge at 80 RD is totally collapsed and a new bridge is under construction. The
reasons for the collapse of the bridge is the same as in the previous cases. The floor
downstream of the bridge completely collapsed about 4 years ago. Now the floor of
the new bridge is concreted with piling works. It will take one more year to complete
all the rehabilitation works including the construction of the new bridge.
• At present a major rehabilitation works is being done in Budhi Khola at 106 RD. The
present structures are functioning satisfactory but due to the lowering of the bed level
of Budhi Khola, the protections works downstream and the side walls are collapsing.
The water conveyance works and the bridge above the river were endangered. The
SMIP took prompt action to repair the floor with extra gabion works, sheet piling new
cut offs etc. At the time of the visit the works were in good progress and it is expected
that the major part of rehabilitation work will be completed before the coming
monsoon. Now the whole structure on the main canal at 106 RD can be considered
safe. Now the supply to the Morang District is possible as Bhdhi Khola is on the
border of Sunsari and Morang districts. SMIP's efforts in this regard is appreciated.
• Almost all the structures of the Main Canal are built more than 50 years ago. Besides
the structures discussed above, it can be said that the durability of most of the other
structures can be rated fair. Some of them need minor but immediate repairing works.
The quality and workmanship of some of the structures is to be improved. The degree
of functional matter of the structures looks satisfactory.
• The maintenance of mechanical gates and other parts like greasing etc are done from
time to time.
• SMIP is advice for the close monitoring of the structures of the Main Canal. The
reasons for damages are flood, lowering of the bed level of the rivers/ rivulets due to
retrogression and side drains which are in bigger size now due to deforestation
practice. If some minor damages are noticed, prompt action must be taken for
immediate repair works. As the structures are old., complete breakdown may happens
are old, complete breakdown may happen if not repaired in time. Also late
rehabilitation works will cause heavy investments afterwards as it has happened in
the past.
• The Shankapur Branch Canal is functioning well. The supply of irrigation water looks
good. The silt deposit was cleared not so long ago. Enough bank lining works is
carried out at the head portion. But the tail part of T-4 is damaged and all the supply is
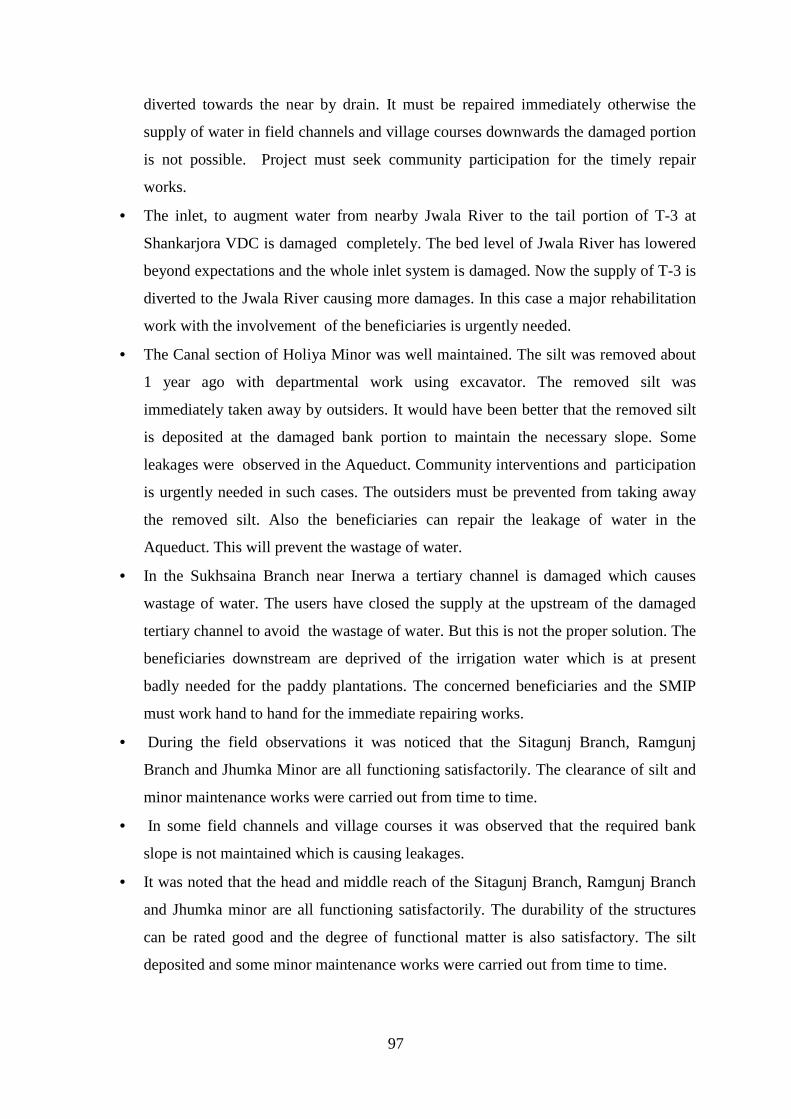
97
diverted towards the near by drain. It must be repaired immediately otherwise the
supply of water in field channels and village courses downwards the damaged portion
is not possible. Project must seek community participation for the timely repair
works.
• The inlet, to augment water from nearby Jwala River to the tail portion of T-3 at
Shankarjora VDC is damaged completely. The bed level of Jwala River has lowered
beyond expectations and the whole inlet system is damaged. Now the supply of T-3 is
diverted to the Jwala River causing more damages. In this case a major rehabilitation
work with the involvement of the beneficiaries is urgently needed.
• The Canal section of Holiya Minor was well maintained. The silt was removed about
1 year ago with departmental work using excavator. The removed silt was
immediately taken away by outsiders. It would have been better that the removed silt
is deposited at the damaged bank portion to maintain the necessary slope. Some
leakages were observed in the Aqueduct. Community interventions and participation
is urgently needed in such cases. The outsiders must be prevented from taking away
the removed silt. Also the beneficiaries can repair the leakage of water in the
Aqueduct. This will prevent the wastage of water.
• In the Sukhsaina Branch near Inerwa a tertiary channel is damaged which causes
wastage of water. The users have closed the supply at the upstream of the damaged
tertiary channel to avoid the wastage of water. But this is not the proper solution. The
beneficiaries downstream are deprived of the irrigation water which is at present
badly needed for the paddy plantations. The concerned beneficiaries and the SMIP
must work hand to hand for the immediate repairing works.
• During the field observations it was noticed that the Sitagunj Branch, Ramgunj
Branch and Jhumka Minor are all functioning satisfactorily. The clearance of silt and
minor maintenance works were carried out from time to time.
• In some field channels and village courses it was observed that the required bank
slope is not maintained which is causing leakages.
• It was noted that the head and middle reach of the Sitagunj Branch, Ramgunj Branch
and Jhumka minor are all functioning satisfactorily. The durability of the structures
can be rated good and the degree of functional matter is also satisfactory. The silt
deposited and some minor maintenance works were carried out from time to time.
98
Annex-IV Focused Group Discussion
99
FGD with SMIP Staff(S..D.E. Chief Accountant, Engineers, Field Staffs, PRENA) Presentation 1. Mr. Surya Naraya Thakur Engineer 2. Suk Dev Thakur Engineer 3. Mr. Dharma raj Adhikari Overseer 4. Prem Chandra Jha Engineer 5. Naumidin Hok Overseer 6. Suk Dev Sharma engineer 7. Durga Pl Pokhrel 8. Balaram Yadav Asst. engineer 9. Sujin K. Chaudhari Supervisor 10. Nar B. Basnet Engineer 11 Mahesh K. Pokhrel Engineer 12. Ramesh L. Karna Engineer 13. Pramod K. Das Overseer 14. Ajaya K. Mandal Asst. Engineer 15. Kali Pl Dev engineer 16. Shailendra Sigh engineer ] 17. Purnendra K. Kayastha engineer 18. Sambhu Pl Ojha Account Officer 19. Udin P. Dev Engineer 20 Girija P. Karna Secition Officer 21. Shyam Nadin Yadav SDE 22. Hiranya P. Sharma Agri Officer 23. Mohan P. Shrestha Supervisor 24. Harikrishan Acharya Engineer
Major discussions and observations are as follows:
- The works not completed in the First Stage of SMIP are revised and carried over
to the later Stages. The revision is need on types of work also.
- The fund allocated for the 2nd phase of the Third Stage is not sufficient. GoN is
not fulfilling its commitments. SMIP is like a 'White Elephant'.
- Due to siltation the flow of water in the Main Canal is less than the designed
discharge. If the flow is increased from 50 m3/sec, the level crosses the free broad
level. The reduced flow of water causes problem at the tail end.
- The water management is also poor. The water is not sufficient in the dry season.
The beneficiaries at the head reach do not follow the water delivery schedule in
the paddy season.
100
- Diversion with protection works and de-silting of the Main Canal is urgently
needed to increase the discharge. If the normal level of Kosi River goes 1m down,
the flow in CMC will be around 40-45 m3/sec.
- Also the whole Command Area is not developed.
- Encroachment of River Bank is increasing. This must be stopped and all the
illegally built infrastructure should be removed.
- Boys & girls are swimming in the canal. Sometimes accident occurs and the canal
must be closed. This effects the supply of water in the system for more than 5
days.
- All the structures of CMC are old. The brick masonry work in several places is
damaged and exposed. The conditions of the bridges are also poor. Heavy loaded
buses and trucks are using the service roads. This effects the old structures. Also
the banks get weak. The bed level of most of the rivers and drains is lowering day
by day effecting the bridges and the structures.
- Due to environmental degradation now the drains developed are of bigger sizes
which cause the lowering of bed level of rivers nearby Also the flood water from
time to time effects the whole system.
- There is a need of developing 'Maintenance Master Plan' for SMIP. The
involvement and participation of the beneficiaries for O & M works must be made
compulsory.
- At present the beneficiaries are taking the responsibilities of repairing works in
some cases with Project support. But much improvements are needed for this type
of works. If properly conducted this system is good.
- During the discussion it was agreed that the agricultural activities has increased.
Different types of crops are cultivated and the production is higher than before the
Project.
- In 2 to 3 canal systems the water tax is collected. Also money is raised among the
beneficiaries to clean the water courses. It seems the present water tax collection
procedures needs rectifications. The formulation of Act in this regard is a
welcome step.
- The present organizational structure is good and the manpower is sufficient for all
sorts of works including supervision and monitoring.
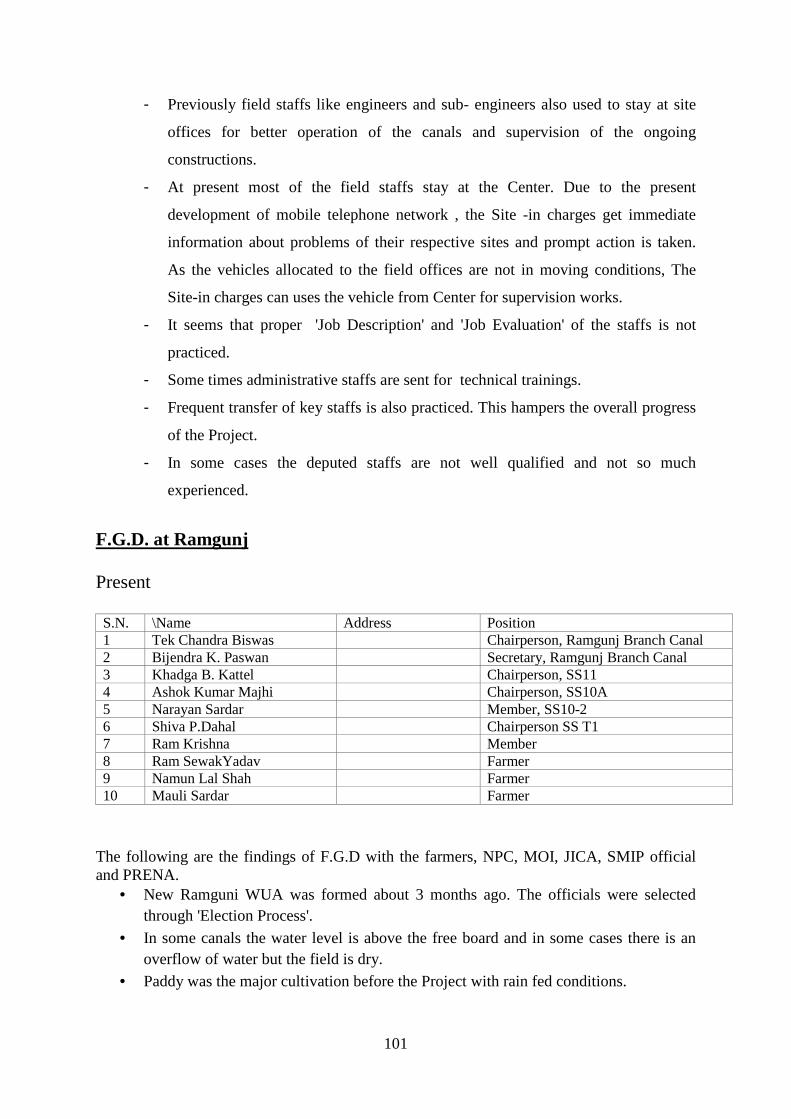
101
- Previously field staffs like engineers and sub- engineers also used to stay at site
offices for better operation of the canals and supervision of the ongoing
constructions.
- At present most of the field staffs stay at the Center. Due to the present
development of mobile telephone network , the Site -in charges get immediate
information about problems of their respective sites and prompt action is taken.
As the vehicles allocated to the field offices are not in moving conditions, The
Site-in charges can uses the vehicle from Center for supervision works.
- It seems that proper 'Job Description' and 'Job Evaluation' of the staffs is not
practiced.
- Some times administrative staffs are sent for technical trainings.
- Frequent transfer of key staffs is also practiced. This hampers the overall progress
of the Project.
- In some cases the deputed staffs are not well qualified and not so much
experienced.
F.G.D. at Ramgunj Present S.N. \Name Address Position 1 Tek Chandra Biswas Chairperson, Ramgunj Branch Canal 2 Bijendra K. Paswan Secretary, Ramgunj Branch Canal 3 Khadga B. Kattel Chairperson, SS11 4 Ashok Kumar Majhi Chairperson, SS10A 5 Narayan Sardar Member, SS10-2 6 Shiva P.Dahal Chairperson SS T1 7 Ram Krishna Member 8 Ram SewakYadav Farmer 9 Namun Lal Shah Farmer 10 Mauli Sardar Farmer
The following are the findings of F.G.D with the farmers, NPC, MOI, JICA, SMIP official and PRENA.
• New Ramguni WUA was formed about 3 months ago. The officials were selected through 'Election Process'.
• In some canals the water level is above the free board and in some cases there is an overflow of water but the field is dry.
• Paddy was the major cultivation before the Project with rain fed conditions.
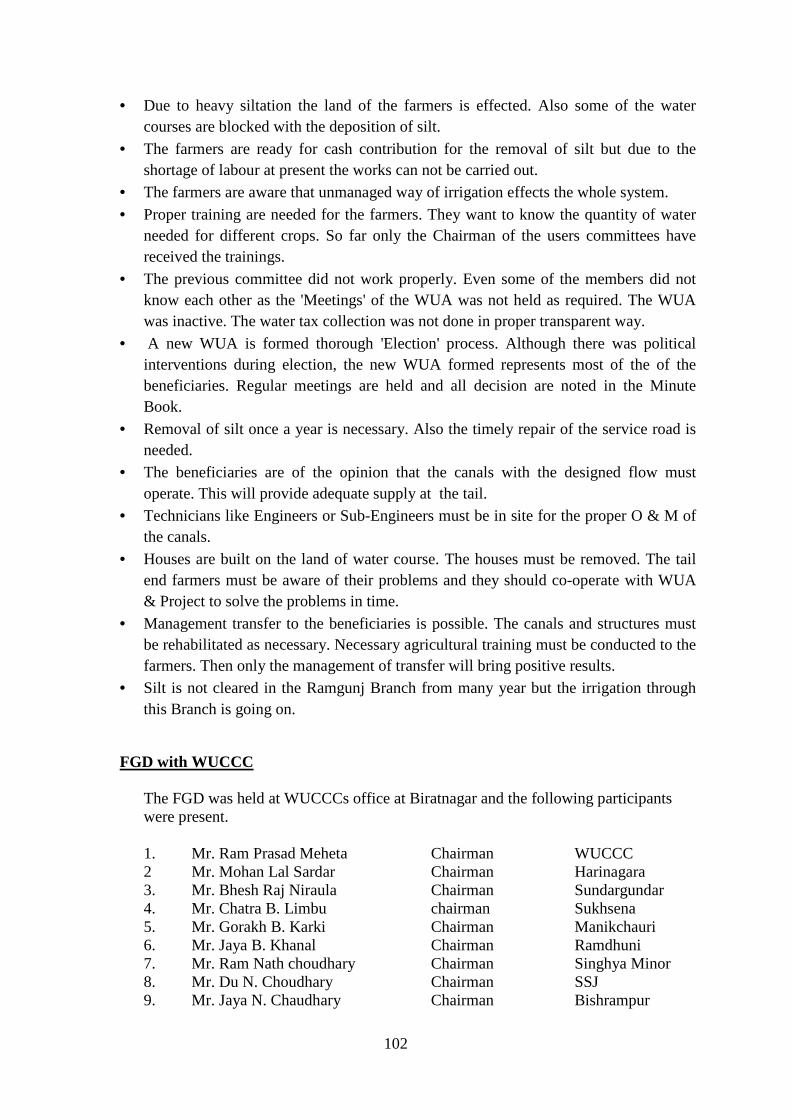
102
• Due to heavy siltation the land of the farmers is effected. Also some of the water courses are blocked with the deposition of silt.
• The farmers are ready for cash contribution for the removal of silt but due to the shortage of labour at present the works can not be carried out.
• The farmers are aware that unmanaged way of irrigation effects the whole system.
• Proper training are needed for the farmers. They want to know the quantity of water needed for different crops. So far only the Chairman of the users committees have received the trainings.
• The previous committee did not work properly. Even some of the members did not know each other as the 'Meetings' of the WUA was not held as required. The WUA was inactive. The water tax collection was not done in proper transparent way.
• A new WUA is formed thorough 'Election' process. Although there was political interventions during election, the new WUA formed represents most of the of the beneficiaries. Regular meetings are held and all decision are noted in the Minute Book.
• Removal of silt once a year is necessary. Also the timely repair of the service road is needed.
• The beneficiaries are of the opinion that the canals with the designed flow must operate. This will provide adequate supply at the tail.
• Technicians like Engineers or Sub-Engineers must be in site for the proper O & M of the canals.
• Houses are built on the land of water course. The houses must be removed. The tail end farmers must be aware of their problems and they should co-operate with WUA & Project to solve the problems in time.
• Management transfer to the beneficiaries is possible. The canals and structures must be rehabilitated as necessary. Necessary agricultural training must be conducted to the farmers. Then only the management of transfer will bring positive results.
• Silt is not cleared in the Ramgunj Branch from many year but the irrigation through this Branch is going on.
FGD with WUCCC
The FGD was held at WUCCCs office at Biratnagar and the following participants were present.
1. Mr. Ram Prasad Meheta Chairman WUCCC 2 Mr. Mohan Lal Sardar Chairman Harinagara 3. Mr. Bhesh Raj Niraula Chairman Sundargundar 4. Mr. Chatra B. Limbu chairman Sukhsena 5. Mr. Gorakh B. Karki Chairman Manikchauri 6. Mr. Jaya B. Khanal Chairman Ramdhuni 7. Mr. Ram Nath choudhary Chairman Singhya Minor 8. Mr. Du N. Choudhary Chairman SSJ 9. Mr. Jaya N. Chaudhary Chairman Bishrampur
103
10. Mr. Tapan K. Das Chairman Sitagunj 11. Mr. Tek Chandra Bishwas Chairman Ramgunj 12. Mrl Hem N. Bishwas Chairman Duhabi 13. Mr. Birendra K. Bishwas Chairman Biratnagar 14. Mr. Deb N. Gachhadar Chairman Hurhuriay 15. Mr. Mohan Shrestha Chairman Bariyati 16. Mr. Shibu Thapa chairman Nayapatti 17. Mr. Tharka Basnet Chairman Amjhora 18. Mr. Uma Nath Karki Chairman Ranjani Minor 19. Mr. Bhakta Thapa Chairman Chisang Minor 20 Mr. Khanga lal Shah Chairman Jhamanpur Branch The following are the major observation of the meeting;
• WUCCC chairperson were not involved for the preparation of annual CMC maintenance plan.
• The local administration must be involved to resolve the 'Encroachment Issues'. • The number of daily wages workers in SMIP is about 400. This number is very
high. Only the workers actually needed must be employed and paid with the recommendations of WUAs.
• For the smooth operation and maintenance of SMIP, more transparency is needed in the works carried by the Project Office as well as by WUAs.
• Agriculture inputs, extension service and new technology are not provided in time and in quantity to the farmers which reflected for the decrease in agricultural production and productivity.
• At present there is shortage of labour in the CA as many unskilled labour have gone abroad for better earning.
• If the WUAs can used the heavy equipments of SMIP, for the maintenance works, the labour shortage problems will be solved and more work will also be carried out.
• The 'Dhalpas' working with SMIP should be trained for better water management. • The ISF must be collected all the canals and the present rate of ISF must be
increased. For this, irrigation rules and regulations should be revised. • The process of awarding direct maintenance work contracts to the individual must
be systemized with the involvement of WUAs. • Some of the HR in the head reach of SMIP are not functioning well which causes
shortage of water at the tail end. • The role of the beneficiaries for the smooth O &M and water management of
SMIP is not clear due to the inadequate efforts form the project and WUAs side. • The maintenance budget must be allocated as per the need of the rehabilitation of
the canal.
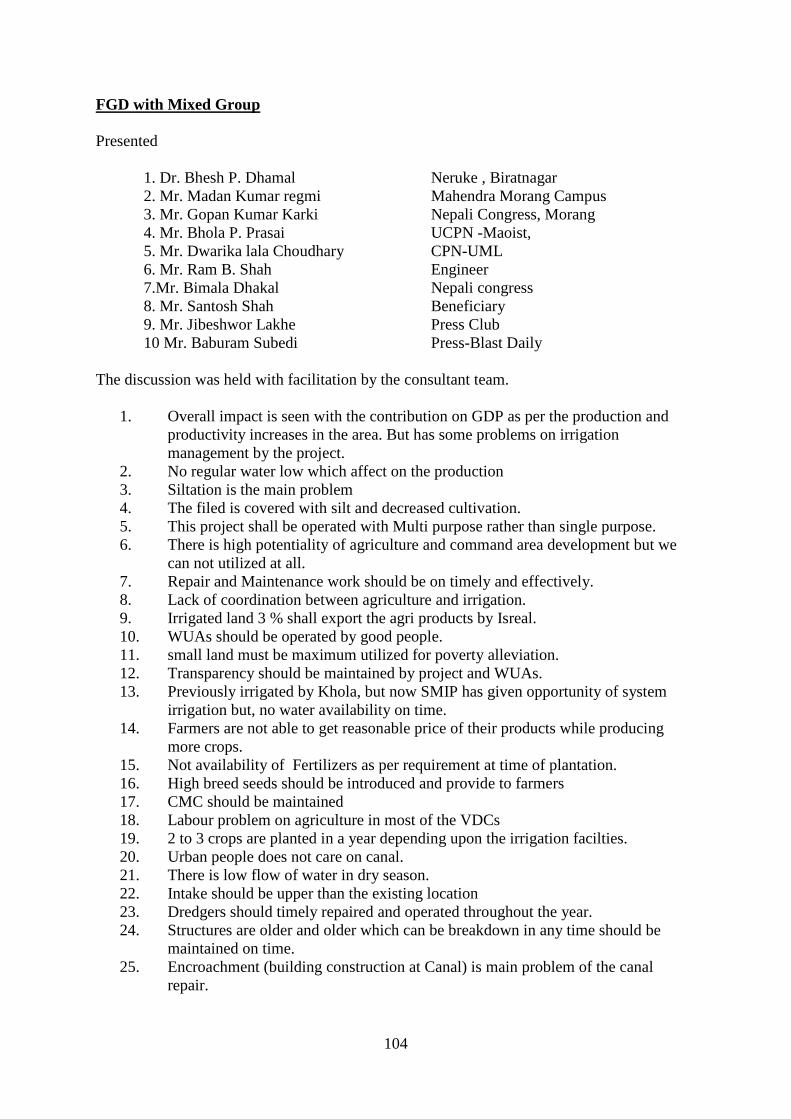
104
FGD with Mixed Group Presented 1. Dr. Bhesh P. Dhamal Neruke , Biratnagar 2. Mr. Madan Kumar regmi Mahendra Morang Campus 3. Mr. Gopan Kumar Karki Nepali Congress, Morang 4. Mr. Bhola P. Prasai UCPN -Maoist, 5. Mr. Dwarika lala Choudhary CPN-UML 6. Mr. Ram B. Shah Engineer 7.Mr. Bimala Dhakal Nepali congress 8. Mr. Santosh Shah Beneficiary 9. Mr. Jibeshwor Lakhe Press Club 10 Mr. Baburam Subedi Press-Blast Daily The discussion was held with facilitation by the consultant team.
1. Overall impact is seen with the contribution on GDP as per the production and productivity increases in the area. But has some problems on irrigation management by the project.
2. No regular water low which affect on the production 3. Siltation is the main problem 4. The filed is covered with silt and decreased cultivation. 5. This project shall be operated with Multi purpose rather than single purpose. 6. There is high potentiality of agriculture and command area development but we
can not utilized at all. 7. Repair and Maintenance work should be on timely and effectively. 8. Lack of coordination between agriculture and irrigation. 9. Irrigated land 3 % shall export the agri products by Isreal. 10. WUAs should be operated by good people. 11. small land must be maximum utilized for poverty alleviation. 12. Transparency should be maintained by project and WUAs. 13. Previously irrigated by Khola, but now SMIP has given opportunity of system
irrigation but, no water availability on time. 14. Farmers are not able to get reasonable price of their products while producing
more crops. 15. Not availability of Fertilizers as per requirement at time of plantation. 16. High breed seeds should be introduced and provide to farmers 17. CMC should be maintained 18. Labour problem on agriculture in most of the VDCs 19. 2 to 3 crops are planted in a year depending upon the irrigation facilties. 20. Urban people does not care on canal. 21. There is low flow of water in dry season. 22. Intake should be upper than the existing location 23. Dredgers should timely repaired and operated throughout the year. 24. Structures are older and older which can be breakdown in any time should be
maintained on time. 25. Encroachment (building construction at Canal) is main problem of the canal
repair.

105
Annex-V Key Informants Interviews
106
K.I.I. With Mr. Mehta (NPC, MOI, JICA, PRENA)
The general comments and observations are as follows:
- The Gov can not always look after O & M of SMIP.
- WUACC's role for O & M of SMIP is very vital.
- Before the Project the supply of irrigation water was disorganized. The major crop
was Paddy.
- Now after the Project the production has increased. Agricultural advices for
proper farming was given Farmer started cultivating wheat and others cash crops.
- The new intake should have been built more upstream of the present site. The
perfect location was upstream of the Khahare River. Now the Khahare River has
deposited big boulders in front of the new intake.
- Provision of diversion works was also necessary. With the Barrage system
irrigation services to other districts was also possible.
- Lot of benefits from multipurpose scheme like lift irrigation to the mountain areas,
power generation etc. is achieved with low costs.
- The structures of CMC are more than 40 years old. Several of them are damaged .
Also the structures of Branch & Tertiary Canals need repairing works.
- The bed level of most of the rivers, drains etc of the Project area is lowering day
by day. This must be controlled with proper technical solutions.
- Encroachment of Canal land by building houses, toilets etc must be stopped and
the land must be cleared by removing the built infrastructures. Department of
Road can demolish the houses built on the unauthorized land but Department of
Irrigation is not taking any actions. Electrical connections to the houses are
provided. How it is possible without 'LalPurja'?
- With the rehabilitation of major damages the handover of the irrigation system to
the respective beneficiaries must be practiced step by step. The maintenance fund
from IWRMP must be used for repairing works. Proper trainings on agricultural
aspects should be conducted to the farmers for their capacity building. In case of
necessity the farmers can under take major rehabilitation works with Project help
and the provision of mechanical equipments.
- Some sort of maintenance fund is to be established. The draft of the Rules on
water tax collection is submitted by WUACC to the Ministry of Irrigation. The
'Bill' regarding this must be passed by the Concerned Agencies.
107
- With the collection of water tax the beneficiaries are capable of O & M of their
canals.
- Improvement on the procedures of water users committee's involvement for the
construction works is necessary.
K.I.I with PM, S.D.E, NPC, CONSULTANTS, JICA
The major findings & observations are as follows: • While travelling to Biratnagar the monitoring team from NPC flew over the C.A. of
SMIP & observed that there is no flow of water in most of the canals and the paddy cultivation is delayed.
• The project officials claim that much efforts are made with the provision of extra labours to supply water to the farmers for paddy cultivation and the farmers are satisfied. It could be at the tail end and in some areas where the canal is closed due to unavoidable reasons, the supply of irrigation water is disturbed.
• The flow of water in the canals of SMIP depends upon the level of water in the Kosi River. The Kosi River is flowing westwards day by day.
• There is a shortage of Manpower capable of working with the procurement guidelines of the Donor Agency and our own procurement Act. On the other hand the contractors are bidding well below the estimated amount. It is difficult to get desired quality of works from such contractors. There is also the problem of contract management. All these factors effects the completion of works in time.
• The Commend Area Development works are not carried out at many places. Especially Morang Districts lacks C.A.D. works.
• All the structures of CMC are more than 50 years old. Major maintenance works are needed.
• Due to silt (sand) deposit throughout the whole CMC, the cross sectional area of the canal is about half of the designed section. The fund available for the removal of the silt is not sufficient. The efficiency of the two dredging equipments is at present 50% less. The dredgers are working form last 17 years.
• Community only take care of the Water Courses. With the rehabilitation of the major structures and necessary repairing works the CMC can operate 15-20 years more. For this a comprehensive 'Maintenance Plan' with the participation of the Community is necessary.
• There is the encroachment problem. The houses built on the bank tops can not be removed. Service roads are being used by heavy trucks and buses causing further deterioration of the road surface. There is no provision of Royalty payment for the use of such roads by public vehicles.
• The maintenance fund allocated by the GoN is not sufficient for major works. The Project is compelled to spread the available budgets on several maintenance works. Outsiders give much present to carry out the repairing works in their respective areas. The rehabilitation works at Thalaha which cost around 4 million rupees in the previous years could not be started due to shortage of funds. At present Rs. 80 million
108
is spent for the rehabilitation works of the Thalaha. Similar is the case of Budhi Khola rehabilitation works.
• The Project is of the opinion that SMIP is providing round the year irrigation as per NPC's Norms. The cropping intensity is around 250 % and various types of crops are cultivated. The overall production has also increased.
• During winter time SMIP is supplying irrigation facilitates to 25000-30000 Ha. The supply is adequate although the quality of services may not be up to standards.
• There are direct and indirect benefits from irrigation. The network of service roads have raised the living standard of the farmers. Also the price of the lands has gone up with the construction of the service roads.
• Although there is the shortage of manpower, agricultural inputs etc the farmers have tried their best to increase the production.
• Due to the open border there is no competition in agriculture. The products grown across the border are cheaper. Nepalese farmers are deprived of the advantages from agricultures which is their right.
K. I. I. With Mr. Regmi (MoI) The following are the findings and observations of the meeting held by PRENA with Mr. Kamal Regmi who is the Joint Secretary at MoI looking after Monitoring and Evaluation Division. Mr Nir Shakya, the Division Chief was also present.
• The cropping pattern of the C.A is now changed. The cropping pattern is around 200%. At present paddy, wheat, banana etc are cultivated.
• The maintenance of SMIP is not satisfactory.
• The CAD program of the Project is not completed. There is conflict between the developed and under developed areas. The whole CA must be developed.
• Most of the Water User Groups are inactive. Elections for new WUG are not held for a long time. The formation of the Groups is not practical . Lack of transparency is observed in the works performed by them.
• At present the problem of the labour is also one of the factor effecting the O & M works.
• Involvement of the beneficiaries in planning and implementation works of the Project is not done in a proper way 'Ownership' building is effected by such activities. At present only the O & M of the water courses is the responsibility of the WUG.
• The power generation works is creating back flow of water at the intake site. • All the structures of the Main Canal are old and need rehabilitation works. The silt
deposited in the Canal is not cleared for a long time. The decrease in flow of the water in CMC is causing lot of problems at the tail end portions. So the supply of water is done by 'Rotation.'
• Also the rehabilitation of the whole CMC is needed.
• With all these existing constraints the agricultural production of Sunsari and Morang districts has increased. So far about Rs. 15000 Million is spent for SMIP but the return (benefit) is also very high. This is an encouraging factor.
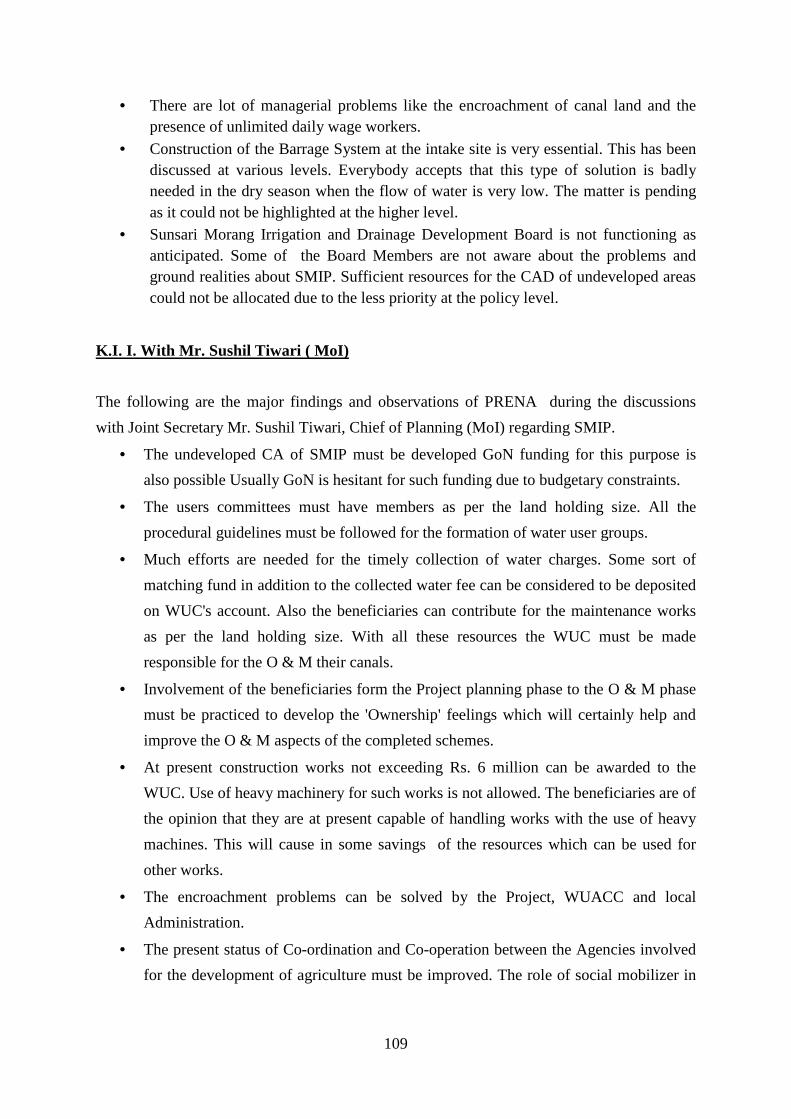
109
• There are lot of managerial problems like the encroachment of canal land and the presence of unlimited daily wage workers.
• Construction of the Barrage System at the intake site is very essential. This has been discussed at various levels. Everybody accepts that this type of solution is badly needed in the dry season when the flow of water is very low. The matter is pending as it could not be highlighted at the higher level.
• Sunsari Morang Irrigation and Drainage Development Board is not functioning as anticipated. Some of the Board Members are not aware about the problems and ground realities about SMIP. Sufficient resources for the CAD of undeveloped areas could not be allocated due to the less priority at the policy level.
K.I. I. With Mr. Sushil Tiwari ( MoI)
The following are the major findings and observations of PRENA during the discussions
with Joint Secretary Mr. Sushil Tiwari, Chief of Planning (MoI) regarding SMIP.
• The undeveloped CA of SMIP must be developed GoN funding for this purpose is
also possible Usually GoN is hesitant for such funding due to budgetary constraints.
• The users committees must have members as per the land holding size. All the
procedural guidelines must be followed for the formation of water user groups.
• Much efforts are needed for the timely collection of water charges. Some sort of
matching fund in addition to the collected water fee can be considered to be deposited
on WUC's account. Also the beneficiaries can contribute for the maintenance works
as per the land holding size. With all these resources the WUC must be made
responsible for the O & M their canals.
• Involvement of the beneficiaries form the Project planning phase to the O & M phase
must be practiced to develop the 'Ownership' feelings which will certainly help and
improve the O & M aspects of the completed schemes.
• At present construction works not exceeding Rs. 6 million can be awarded to the
WUC. Use of heavy machinery for such works is not allowed. The beneficiaries are of
the opinion that they are at present capable of handling works with the use of heavy
machines. This will cause in some savings of the resources which can be used for
other works.
• The encroachment problems can be solved by the Project, WUACC and local
Administration.
• The present status of Co-ordination and Co-operation between the Agencies involved
for the development of agriculture must be improved. The role of social mobilizer in
110
these areas is very important. The social mobilizer also play vital role to pursue the
farmers for the increase in agricultural production.
K.I. I. With Mr. Khom Raj Dahal, DG ( DoI)
The general comments and observatios are as follows;
• The use of dredgers is very successful for the removal of the deposited silt in the settling basin, which has helped for the required flow of water in CMC.
• The responsibility of the project and WUA for the smooth O & M of SMIP must be clearly defined. This should be done with the consultation and interactions of the WUA and SMIP the capabilities of WUA in this respect must be considered.
• Collection of ISF must be one of the main resource for meeting the O & M cost. In addition to this GoN may consider to provide some sort of matching grant amount to meet the O &M cost to the WUA if the service fees is collected satisfactory.
• Department of Irrigation is aware of the importance of Diversion Weir' at the new intake site of the SMIP. In this regard, several discussions with the concerned authorities are being held.
• New technology must be considered for the distribution of water where the discharge is low compared to its requirement. New technology will support for the effective water management of the CA.
• All sectoral agencies for the development of agriculture must be responsible for the completion of their respective works as outlined in National plan and policies.
• SMIP has indirect impact on the fertility of land of Sunsari and Morang districts due to the recharge of ground and surface water. In comparison of land of Siraha and Saptari (adjoining districts) are dry and most of the farmers are depended on rain water for irrigation.
111
Annex-VI Approved Post Chart of SMIP
112
Annex-VII
ERR Calculations
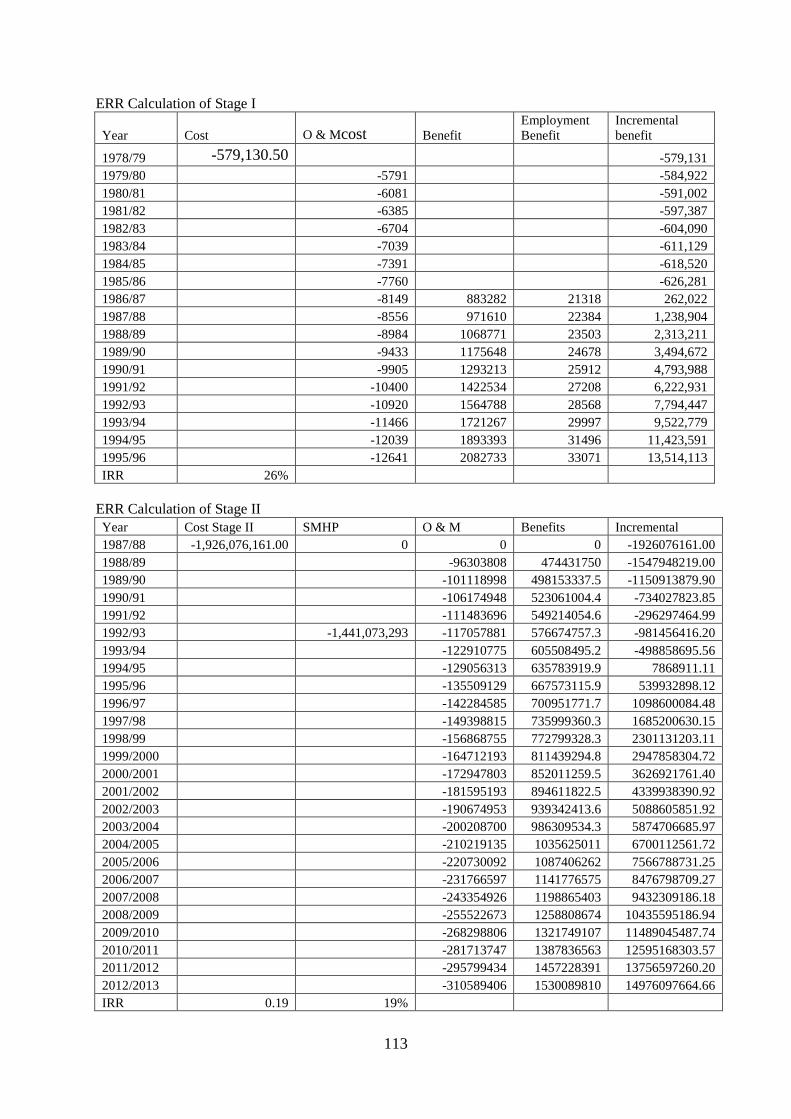
113
ERR Calculation of Stage I
Year Cost O & Mcost Benefit Employment Benefit
Incremental benefit
1978/79 -579,130.50 -579,131 1979/80 -5791 -584,922 1980/81 -6081 -591,002 1981/82 -6385 -597,387 1982/83 -6704 -604,090 1983/84 -7039 -611,129 1984/85 -7391 -618,520 1985/86 -7760 -626,281 1986/87 -8149 883282 21318 262,022 1987/88 -8556 971610 22384 1,238,904 1988/89 -8984 1068771 23503 2,313,211 1989/90 -9433 1175648 24678 3,494,672 1990/91 -9905 1293213 25912 4,793,988 1991/92 -10400 1422534 27208 6,222,931 1992/93 -10920 1564788 28568 7,794,447 1993/94 -11466 1721267 29997 9,522,779 1994/95 -12039 1893393 31496 11,423,591 1995/96 -12641 2082733 33071 13,514,113 IRR 26%
ERR Calculation of Stage II Year Cost Stage II SMHP O & M Benefits Incremental 1987/88 -1,926,076,161.00 0 0 0 -1926076161.00 1988/89 -96303808 474431750 -1547948219.00 1989/90 -101118998 498153337.5 -1150913879.90 1990/91 -106174948 523061004.4 -734027823.85 1991/92 -111483696 549214054.6 -296297464.99 1992/93 -1,441,073,293 -117057881 576674757.3 -981456416.20 1993/94 -122910775 605508495.2 -498858695.56 1994/95 -129056313 635783919.9 7868911.11 1995/96 -135509129 667573115.9 539932898.12 1996/97 -142284585 700951771.7 1098600084.48 1997/98 -149398815 735999360.3 1685200630.15 1998/99 -156868755 772799328.3 2301131203.11 1999/2000 -164712193 811439294.8 2947858304.72 2000/2001 -172947803 852011259.5 3626921761.40 2001/2002 -181595193 894611822.5 4339938390.92 2002/2003 -190674953 939342413.6 5088605851.92 2003/2004 -200208700 986309534.3 5874706685.97 2004/2005 -210219135 1035625011 6700112561.72 2005/2006 -220730092 1087406262 7566788731.25 2006/2007 -231766597 1141776575 8476798709.27 2007/2008 -243354926 1198865403 9432309186.18 2008/2009 -255522673 1258808674 10435595186.94 2009/2010 -268298806 1321749107 11489045487.74 2010/2011 -281713747 1387836563 12595168303.57 2011/2012 -295799434 1457228391 13756597260.20 2012/2013 -310589406 1530089810 14976097664.66 IRR 0.19 19%

114
Annex-VIII
Sample Size for HH Survey
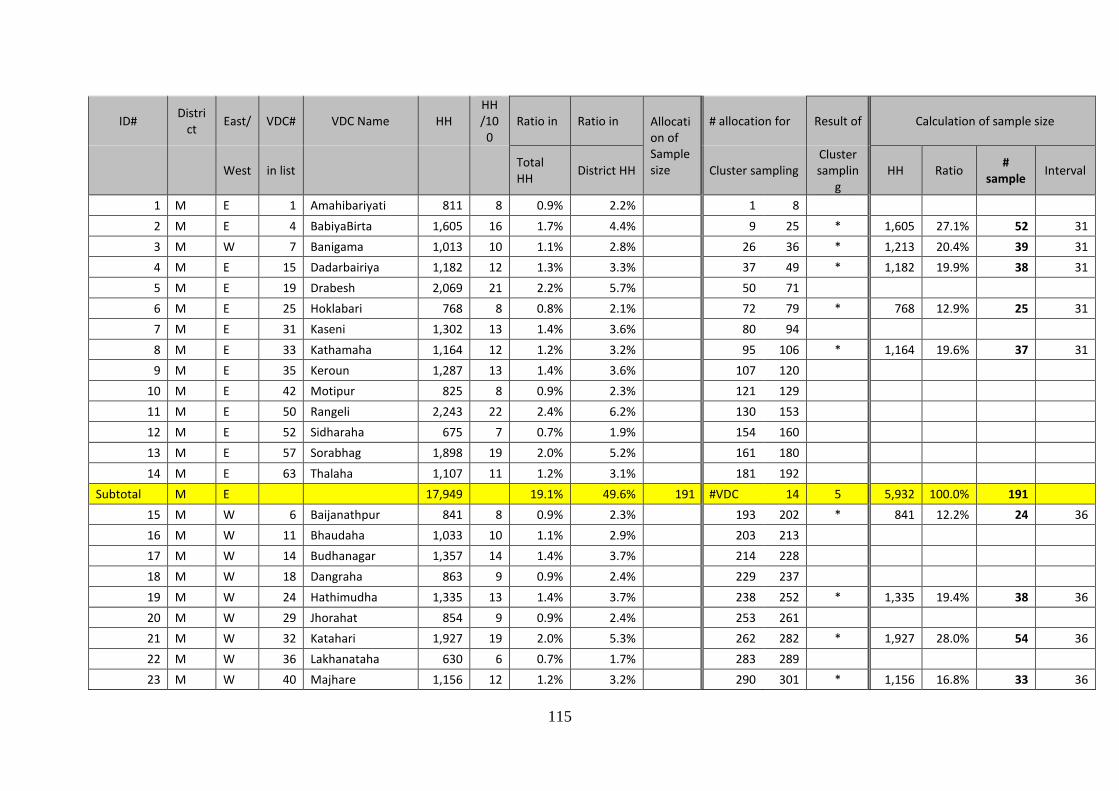
115
ID# Distri
ct East/ VDC# VDC Name HH
HH
/10
0
Ratio in Ratio in Allocati
on of
Sample
size
# allocation for Result of Calculation of sample size
West in list Total
HH District HH Cluster sampling
Cluster
samplin
g
HH Ratio #
sample Interval
1 M E 1 Amahibariyati 811 8 0.9% 2.2% 1 8
2 M E 4 BabiyaBirta 1,605 16 1.7% 4.4% 9 25 * 1,605 27.1% 52 31
3 M W 7 Banigama 1,013 10 1.1% 2.8% 26 36 * 1,213 20.4% 39 31
4 M E 15 Dadarbairiya 1,182 12 1.3% 3.3% 37 49 * 1,182 19.9% 38 31
5 M E 19 Drabesh 2,069 21 2.2% 5.7% 50 71
6 M E 25 Hoklabari 768 8 0.8% 2.1% 72 79 * 768 12.9% 25 31
7 M E 31 Kaseni 1,302 13 1.4% 3.6% 80 94
8 M E 33 Kathamaha 1,164 12 1.2% 3.2% 95 106 * 1,164 19.6% 37 31
9 M E 35 Keroun 1,287 13 1.4% 3.6% 107 120
10 M E 42 Motipur 825 8 0.9% 2.3% 121 129
11 M E 50 Rangeli 2,243 22 2.4% 6.2% 130 153
12 M E 52 Sidharaha 675 7 0.7% 1.9% 154 160
13 M E 57 Sorabhag 1,898 19 2.0% 5.2% 161 180
14 M E 63 Thalaha 1,107 11 1.2% 3.1% 181 192
Subtotal M E 17,949 19.1% 49.6% 191 #VDC 14 5 5,932 100.0% 191
15 M W 6 Baijanathpur 841 8 0.9% 2.3% 193 202 * 841 12.2% 24 36
16 M W 11 Bhaudaha 1,033 10 1.1% 2.9% 203 213
17 M W 14 Budhanagar 1,357 14 1.4% 3.7% 214 228
18 M W 18 Dangraha 863 9 0.9% 2.4% 229 237
19 M W 24 Hathimudha 1,335 13 1.4% 3.7% 238 252 * 1,335 19.4% 38 36
20 M W 29 Jhorahat 854 9 0.9% 2.4% 253 261
21 M W 32 Katahari 1,927 19 2.0% 5.3% 262 282 * 1,927 28.0% 54 36
22 M W 36 Lakhanataha 630 6 0.7% 1.7% 283 289
23 M W 40 Majhare 1,156 12 1.2% 3.2% 290 301 * 1,156 16.8% 33 36
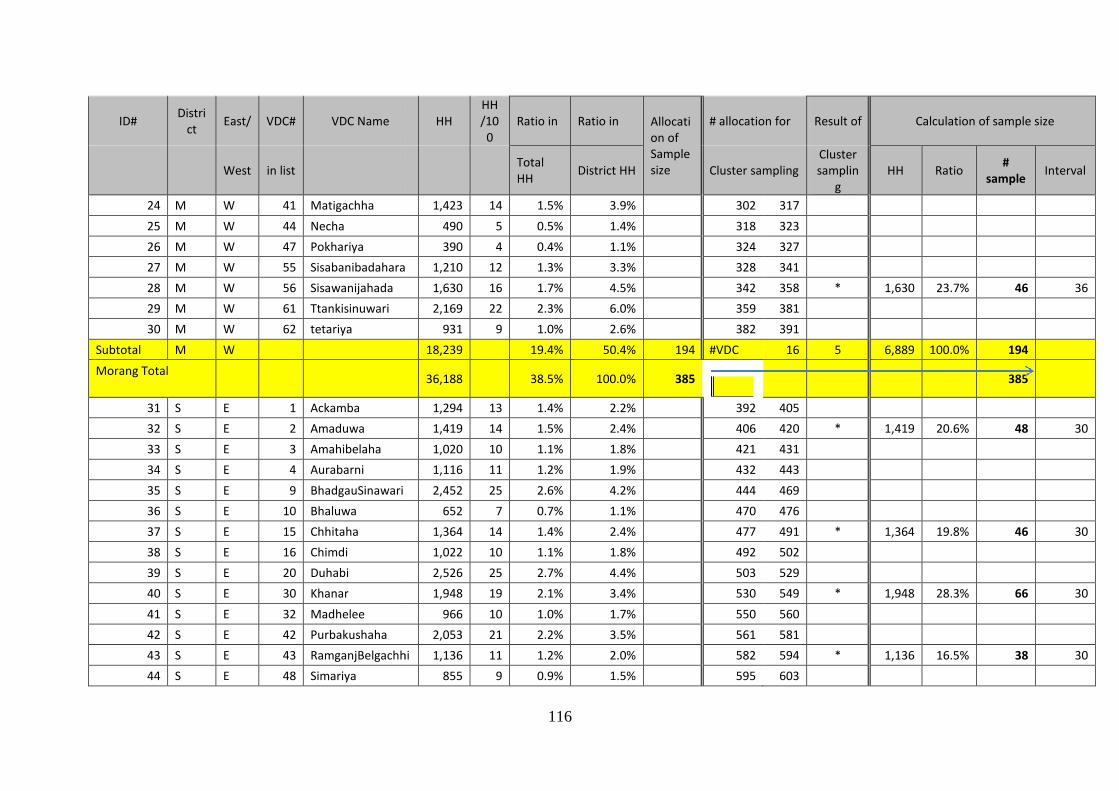
ID# Distri
ct East/ VDC# VDC Name
West in list
24 M W 41 Matigachha
25 M W 44 Necha
26 M W 47 Pokhariya
27 M W 55 Sisabanibadahara
28 M W 56 Sisawanijahada
29 M W 61 Ttankisinuwari
30 M W 62 tetariya
Subtotal M W
Morang Total
31 S E 1 Ackamba
32 S E 2 Amaduwa
33 S E 3 Amahibelaha
34 S E 4 Aurabarni
35 S E 9 BhadgauSinawari
36 S E 10 Bhaluwa
37 S E 15 Chhitaha
38 S E 16 Chimdi
39 S E 20 Duhabi
40 S E 30 Khanar
41 S E 32 Madhelee
42 S E 42 Purbakushaha
43 S E 43 RamganjBelgachhi
44 S E 48 Simariya
116
HH
HH
/10
0
Ratio in Ratio in Allocati
on of
Sample
size
# allocation for
Total
HH District HH Cluster sampling
1,423 14 1.5% 3.9% 302 317
490 5 0.5% 1.4% 318 323
390 4 0.4% 1.1% 324 327
Sisabanibadahara 1,210 12 1.3% 3.3% 328 341
1,630 16 1.7% 4.5% 342 358
2,169 22 2.3% 6.0% 359 381
931 9 1.0% 2.6% 382 391
18,239 19.4% 50.4% 194 #VDC 16
36,188 38.5% 100.0% 385
1,294 13 1.4% 2.2% 392 405
1,419 14 1.5% 2.4% 406 420
1,020 10 1.1% 1.8% 421 431
1,116 11 1.2% 1.9% 432 443
2,452 25 2.6% 4.2% 444 469
652 7 0.7% 1.1% 470 476
1,364 14 1.4% 2.4% 477 491
1,022 10 1.1% 1.8% 492 502
2,526 25 2.7% 4.4% 503 529
1,948 19 2.1% 3.4% 530 549
966 10 1.0% 1.7% 550 560
2,053 21 2.2% 3.5% 561 581
RamganjBelgachhi 1,136 11 1.2% 2.0% 582 594
855 9 0.9% 1.5% 595 603
Result of Calculation of sample size
Cluster
samplin
g
HH Ratio #
sample Interval
* 1,630 23.7% 46 36
5 6,889 100.0% 194
385
* 1,419 20.6% 48 30
* 1,364 19.8% 46 30
* 1,948 28.3% 66 30
* 1,136 16.5% 38 30
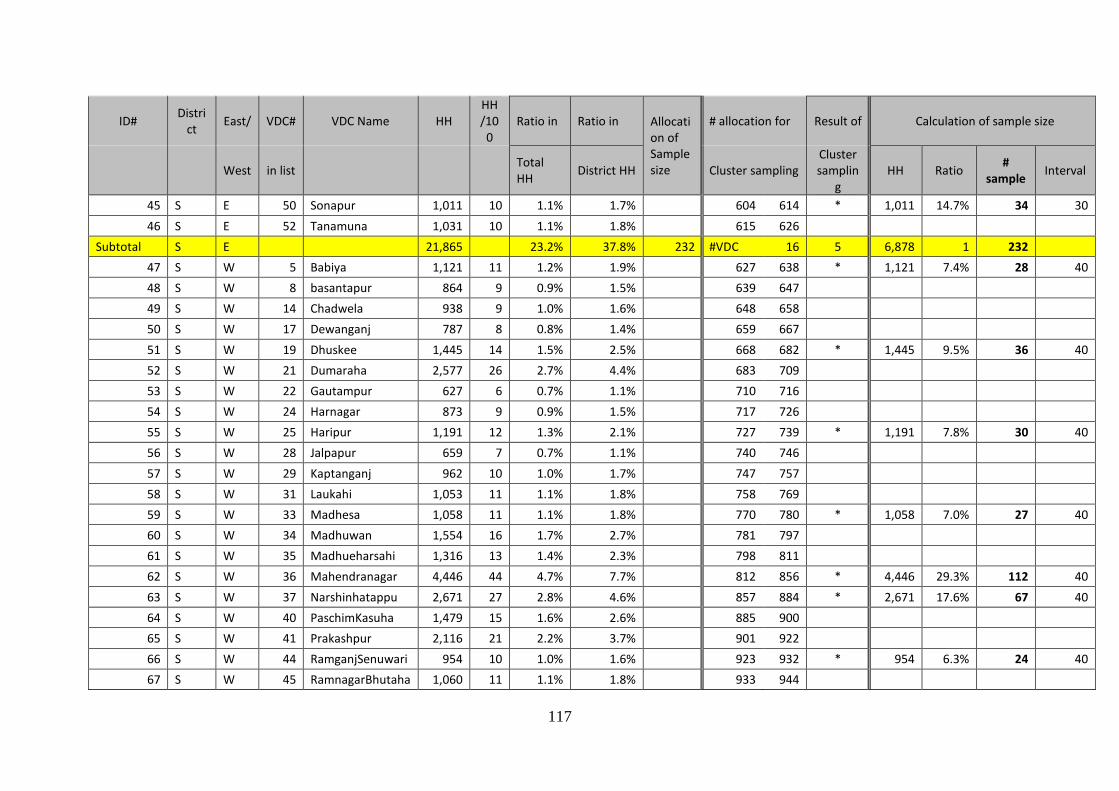
117
ID# Distri
ct East/ VDC# VDC Name HH
HH
/10
0
Ratio in Ratio in Allocati
on of
Sample
size
# allocation for Result of Calculation of sample size
West in list Total
HH District HH Cluster sampling
Cluster
samplin
g
HH Ratio #
sample Interval
45 S E 50 Sonapur 1,011 10 1.1% 1.7% 604 614 * 1,011 14.7% 34 30
46 S E 52 Tanamuna 1,031 10 1.1% 1.8% 615 626
Subtotal S E 21,865 23.2% 37.8% 232 #VDC 16 5 6,878 1 232
47 S W 5 Babiya 1,121 11 1.2% 1.9% 627 638 * 1,121 7.4% 28 40
48 S W 8 basantapur 864 9 0.9% 1.5% 639 647
49 S W 14 Chadwela 938 9 1.0% 1.6% 648 658
50 S W 17 Dewanganj 787 8 0.8% 1.4% 659 667
51 S W 19 Dhuskee 1,445 14 1.5% 2.5% 668 682 * 1,445 9.5% 36 40
52 S W 21 Dumaraha 2,577 26 2.7% 4.4% 683 709
53 S W 22 Gautampur 627 6 0.7% 1.1% 710 716
54 S W 24 Harnagar 873 9 0.9% 1.5% 717 726
55 S W 25 Haripur 1,191 12 1.3% 2.1% 727 739 * 1,191 7.8% 30 40
56 S W 28 Jalpapur 659 7 0.7% 1.1% 740 746
57 S W 29 Kaptanganj 962 10 1.0% 1.7% 747 757
58 S W 31 Laukahi 1,053 11 1.1% 1.8% 758 769
59 S W 33 Madhesa 1,058 11 1.1% 1.8% 770 780 * 1,058 7.0% 27 40
60 S W 34 Madhuwan 1,554 16 1.7% 2.7% 781 797
61 S W 35 Madhueharsahi 1,316 13 1.4% 2.3% 798 811
62 S W 36 Mahendranagar 4,446 44 4.7% 7.7% 812 856 * 4,446 29.3% 112 40
63 S W 37 Narshinhatappu 2,671 27 2.8% 4.6% 857 884 * 2,671 17.6% 67 40
64 S W 40 PaschimKasuha 1,479 15 1.6% 2.6% 885 900
65 S W 41 Prakashpur 2,116 21 2.2% 3.7% 901 922
66 S W 44 RamganjSenuwari 954 10 1.0% 1.6% 923 932 * 954 6.3% 24 40
67 S W 45 RamnagarBhutaha 1,060 11 1.1% 1.8% 933 944
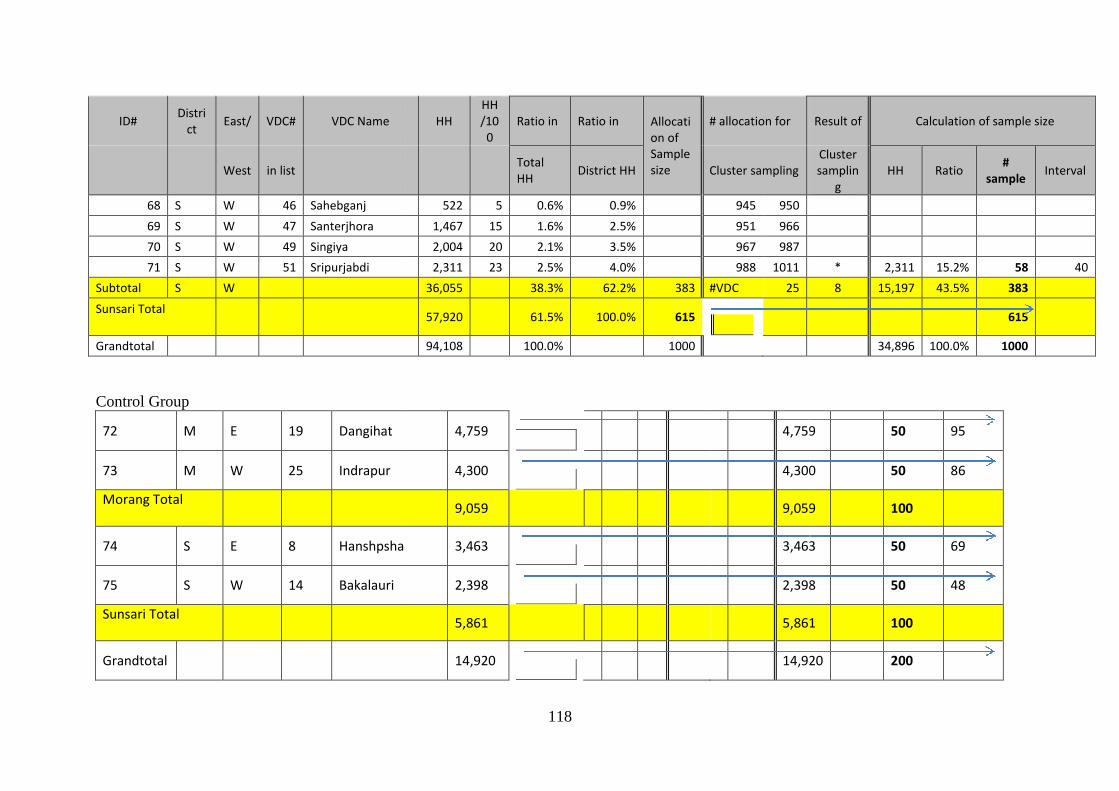
ID# Distri
ct East/ VDC# VDC Name
West in list
68 S W 46 Sahebganj
69 S W 47 Santerjhora
70 S W 49 Singiya
71 S W 51 Sripurjabdi
Subtotal S W
Sunsari Total
Grandtotal
Control Group
72 M E 19 Dangihat
73 M W 25 Indrapur
Morang Total
74 S E 8 Hanshpsha
75 S W 14 Bakalauri
Sunsari Total
Grandtotal
118
HH
HH
/10
0
Ratio in Ratio in Allocati
on of
Sample
size
# allocation for
Total
HH District HH Cluster sampling
522 5 0.6% 0.9% 945 950
1,467 15 1.6% 2.5% 951 966
2,004 20 2.1% 3.5% 967 987
2,311 23 2.5% 4.0% 988 1011
36,055 38.3% 62.2% 383 #VDC 25
57,920 61.5% 100.0% 615
94,108 100.0% 1000
4,759
4,759
4,300
4,300
9,059 9,059
3,463
3,463
2,398
2,398
5,861 5,861
14,920
14,920
Result of Calculation of sample size
Cluster
samplin
g
HH Ratio #
sample Interval
* 2,311 15.2% 58 40
8 15,197 43.5% 383
615
34,896 100.0% 1000
4,759 50 95
4,300 50 86
9,059 100
3,463 50 69
2,398 50 48
5,861 100
14,920 200

119