Embed Size (px)
Citation preview
National Park Service U.S. Department of the Interior
Natural Resource Stewardship and Science
Mapping Threats to Wilderness Character in the Black Canyon of the Gunnison National Park Natural Resource Report NPS/BLCA/NRR—2018/1664

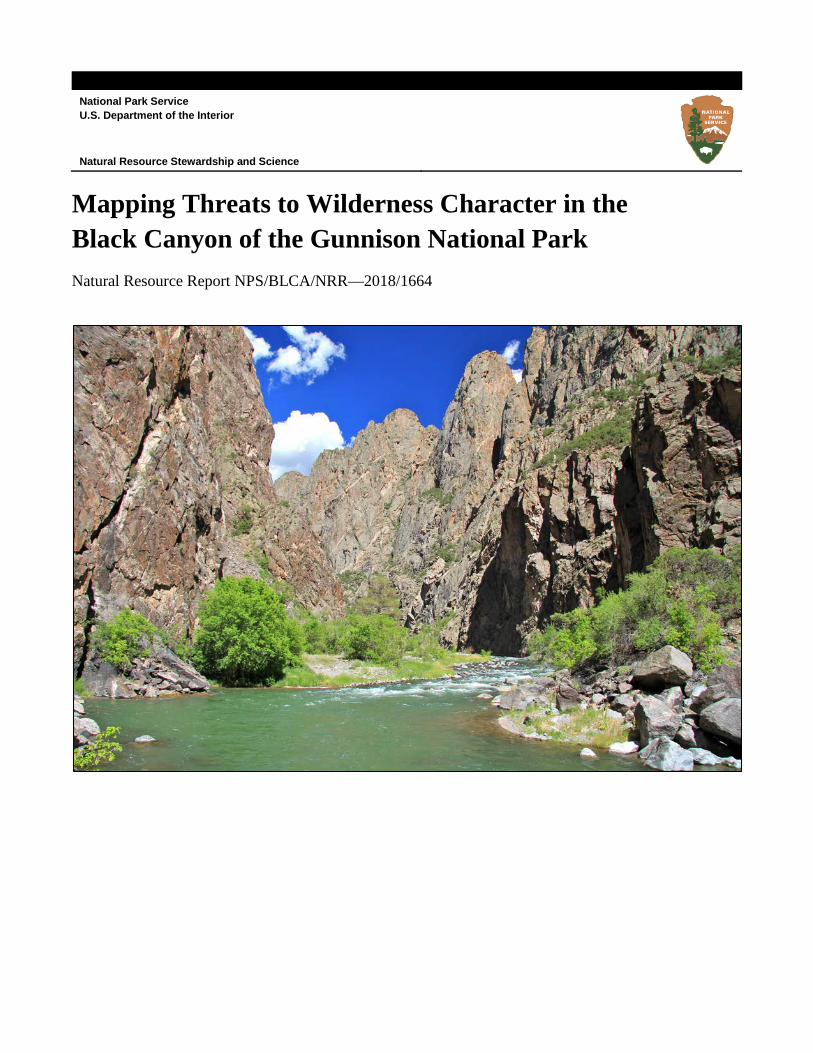
ON THE COVER Gunnison River at Sunset View Photo by: Jeremy Matlock
Mapping Threats to Wilderness Character in the Black Canyon of the Gunnison National Park Natural Resource Report NPS/BLCA/NRR—2018/1664
James Tricker1, Danguole Bockus2, Forest Frost2, and Matt Rothrock2 1Aldo Leopold Wilderness Research Institute 790 East Beckwith Avenue Missoula, Montana 59801 2National Park Service Black Canyon of the Gunnison National Park 102 Elk Creek, Gunnison, CO 81230
June 2018 U.S. Department of the Interior National Park Service Natural Resource Stewardship and Science Fort Collins, Colorado
ii
The National Park Service, Natural Resource Stewardship and Science office in Fort Collins, Colorado, publishes a range of reports that address natural resource topics. These reports are of interest and applicability to a broad audience in the National Park Service and others in natural resource management, including scientists, conservation and environmental constituencies, and the public.
The Natural Resource Report Series is used to disseminate comprehensive information and analysis about natural resources and related topics concerning lands managed by the National Park Service. The series supports the advancement of science, informed decision-making, and the achievement of the National Park Service mission. The series also provides a forum for presenting more lengthy results that may not be accepted by publications with page limitations.
All manuscripts in the series receive the appropriate level of peer review to ensure that the information is scientifically credible, technically accurate, appropriately written for the intended audience, and designed and published in a professional manner.
This report received informal peer review by subject-matter experts who were not directly involved in the collection, analysis, or reporting of the data.
Views, statements, findings, conclusions, recommendations, and data in this report do not necessarily reflect views and policies of the National Park Service, U.S. Department of the Interior. Mention of trade names or commercial products does not constitute endorsement or recommendation for use by the U.S. Government.
This report is available in digital format from the Natural Resource Publications Management website. If you have difficulty accessing information in this publication, particularly if using assistive technology, please email [email protected].
Please cite this publication as:
Tricker, J., D. Bockus, F. Frost, and M. Rothrock. 2018. Mapping threats to wilderness character in the Black Canyon of the Gunnison National Park. Natural Resource Report NPS/BLCA/NRR—2018/1664. National Park Service, Fort Collins, Colorado.
NPS 144/146159, June 2018
iii
Contents Page
Figures.................................................................................................................................................... v
Tables .................................................................................................................................................... vi
Executive Summary ............................................................................................................................viii
Acknowledgments ................................................................................................................................. ix
Acronyms and Abbreviations................................................................................................................ ix
Introduction ............................................................................................................................................ 1
Black Canyon of the Gunnison Wilderness .................................................................................... 1
Purpose of this mapping project ..................................................................................................... 5
Concerns and cautions .................................................................................................................... 5
Report outline ................................................................................................................................. 6
Overview of the Process for Developing the Map of Threats to Wilderness Character ........................ 8
The five qualities of wilderness character ...................................................................................... 9
The mapping framework ................................................................................................................ 9
Methods ................................................................................................................................................ 13
Weighting measures ..................................................................................................................... 13
Data sources and processing techniques ....................................................................................... 14
Untrammeled Quality ................................................................................................................... 15
Indicators and measures .......................................................................................................... 15
Data sources, processing, and cautions ................................................................................... 16
Weighting ................................................................................................................................ 18
Maps ........................................................................................................................................ 19
Natural Quality ............................................................................................................................. 22
Indicators and measures .......................................................................................................... 22
Data gap measures ................................................................................................................... 23
Data sources, processing, and cautions ................................................................................... 23
Weighting ................................................................................................................................ 26
iv
Contents (continued) Page
Maps ........................................................................................................................................ 26
Undeveloped Quality .................................................................................................................... 30
Indicators and measures .......................................................................................................... 30
Data sources, processing, and cautions ................................................................................... 31
Weighting ................................................................................................................................ 32
Maps ........................................................................................................................................ 33
Solitude or Primitive and Unconfined Recreation Quality ........................................................... 36
Indicators and measures .......................................................................................................... 36
Data gap measures ................................................................................................................... 37
Data sources, processing, and cautions ................................................................................... 38
Weighting ................................................................................................................................ 47
Maps ........................................................................................................................................ 48
Map of Threats to Wilderness Character ...................................................................................... 52
Improvements .......................................................................................................................... 55
Final concerns about mapping threats to wilderness character ............................................... 56
References ............................................................................................................................................ 57
v
Figures Page
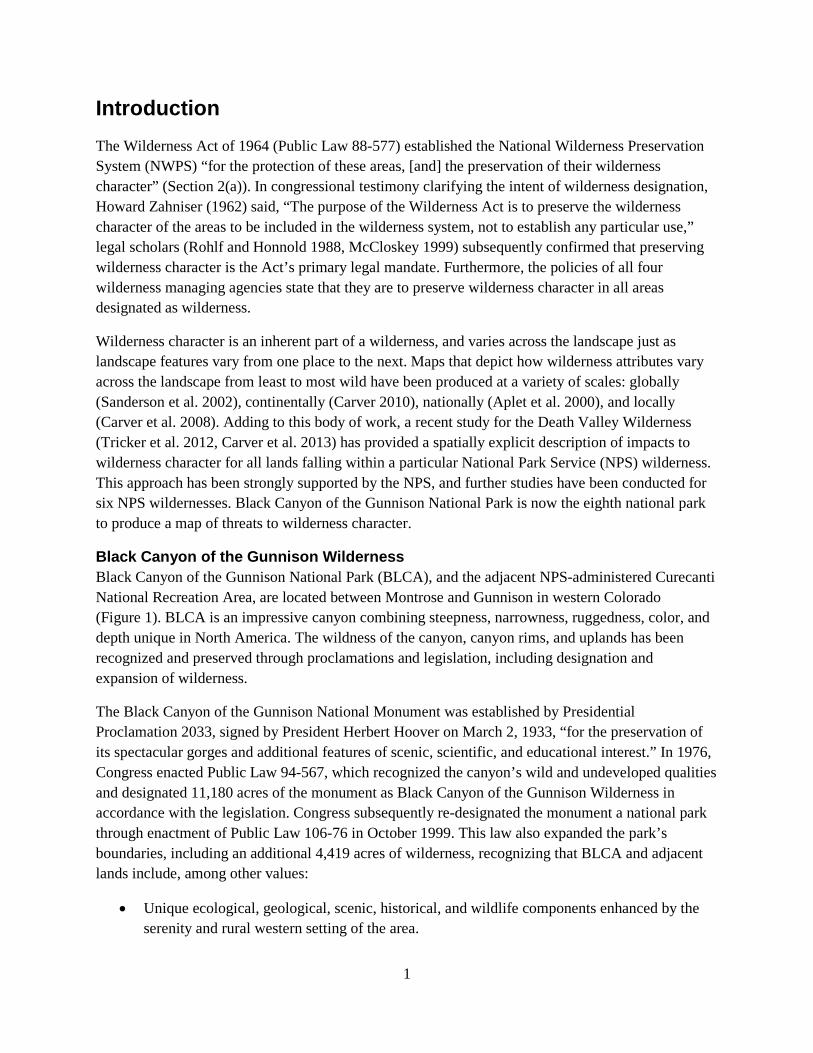
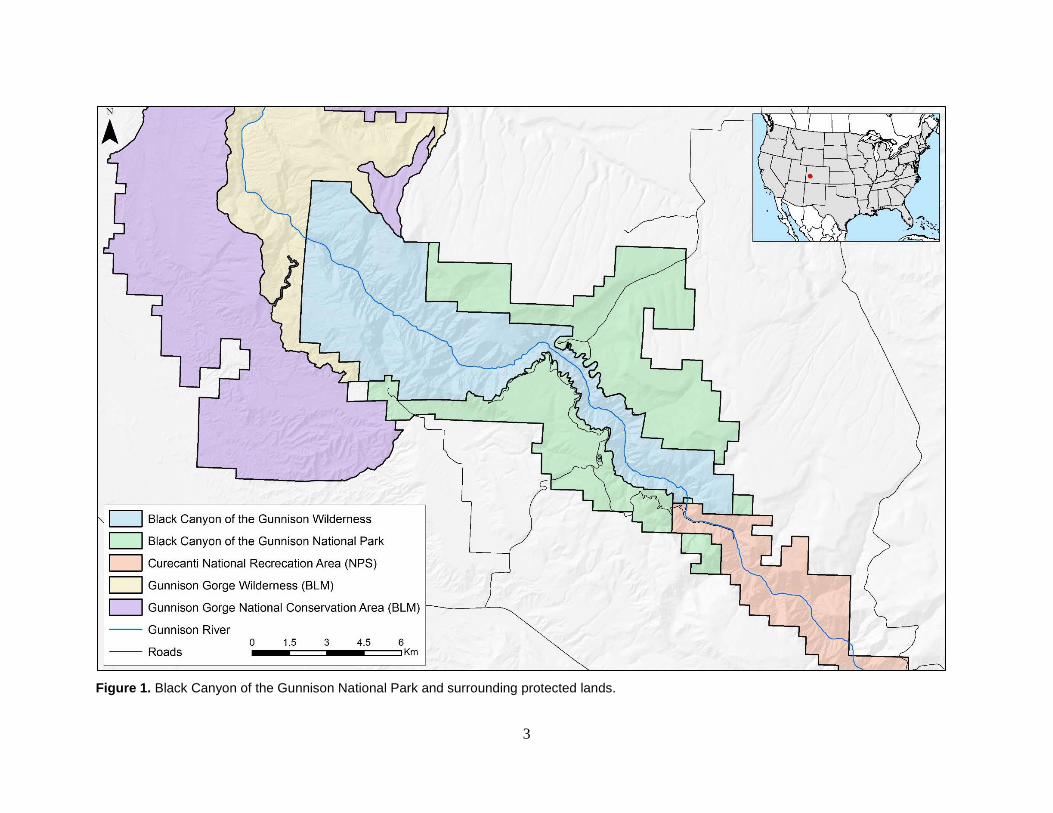
Figure 1. Black Canyon of the Gunnison National Park and surrounding protected lands. ................. 3
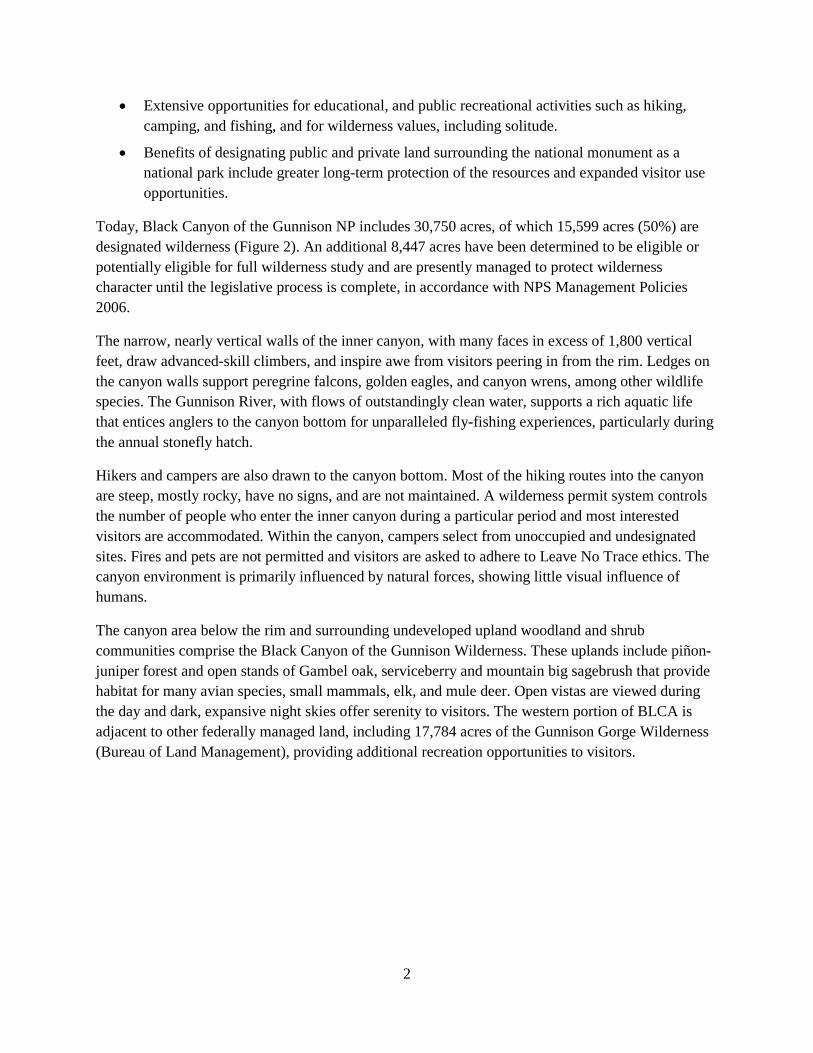
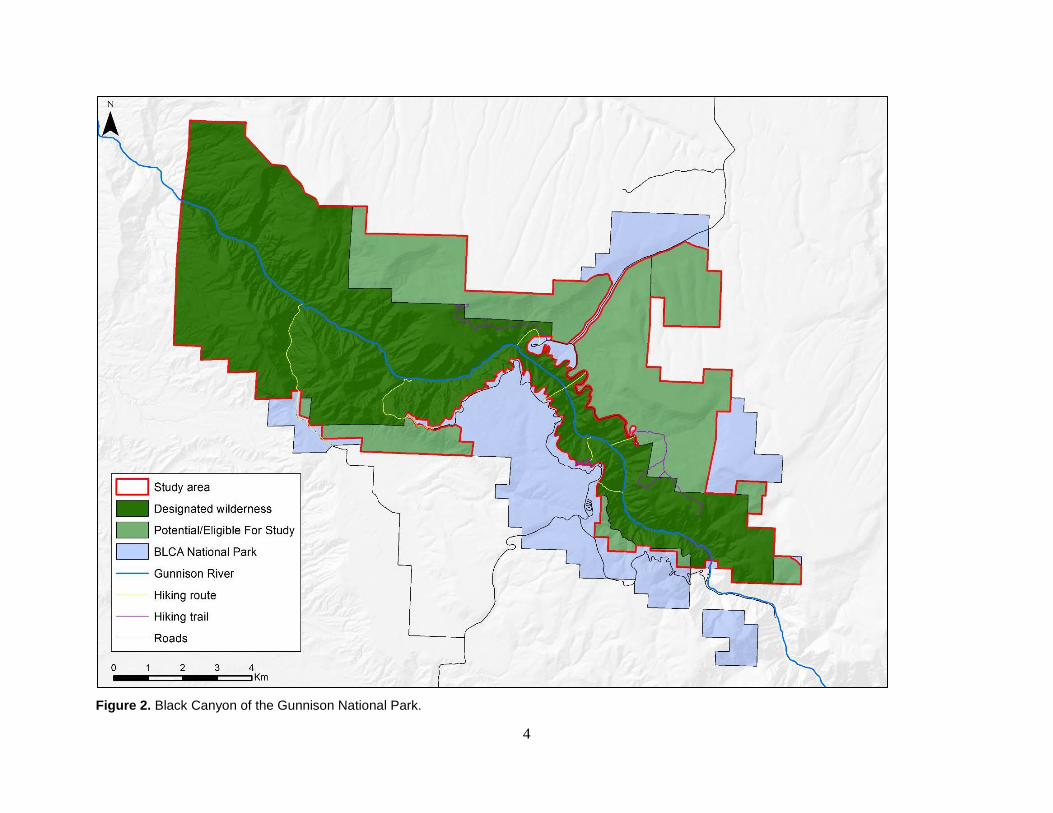
Figure 2. Black Canyon of the Gunnison National Park. ...................................................................... 4
Figure 3. Flow chart of the framework used for mapping threats to wilderness character. ................ 10
Figure 4. Indicator maps for actions authorized by the federal land manager that intentionally manipulate the biophysical environment and actions not authorized by the federal land manager that intentionally manipulate the biophysical environment.. ............................ 20
Figure 5. Map of the untrammeled quality of wilderness character.................................................... 21
Figure 6. Indicator maps for plants, animals, air and water, and ecological processes.. .................... 28
Figure 7. Map of the natural quality of wilderness character.............................................................. 29
Figure 8. Indicator maps for presence of non-recreational structures, installations, and developments and use of motor vehicles, motorized equipment, or mechanical transport. ................. 34
Figure 9. Map of the undeveloped quality of wilderness character.. .................................................. 35
Figure 10. Viewshed impacts for features inside the wilderness and features outside the wilderness. ........................................................................................................................................... 45
Figure 11. Indicator maps for remoteness from sights and sounds of human activity inside wilderness, remoteness from sights and sounds of human activity outside the wilderness, facilities that decrease self-reliant recreation, and management restrictions on visitor behavior. ................................................................................................................................... 49
Figure 12. Combined indicator maps for opportunities for solitude inside wilderness, and opportunities for primitive and unconfined recreation inside wilderness. ........................................... 50
Figure 13. Map of the solitude or primitive and unconfined recreation quality of wilderness character. ............................................................................................................................ 51
Figure 14. Map of threats to wilderness character in the Black Canyon of the Gunnison Wilderness.. .......................................................................................................................................... 53
Figure 15. Map of threats to wilderness character in the Black Canyon of the Gunnison Wilderness reclassed into ten equal categories. ................................................................................... 54
Figure 16. Histogram of the values for the map of threats to wilderness character.. .......................... 55
vi
Tables Page
Table 1. Untrammeled quality datasets.. ............................................................................................. 17
Table 2. Measure weights and rationales for the untrammeled quality. .............................................. 19
Table 3. Natural quality datasets. ........................................................................................................ 24
Table 4. Measure weights and rationales for the natural quality. ........................................................ 26
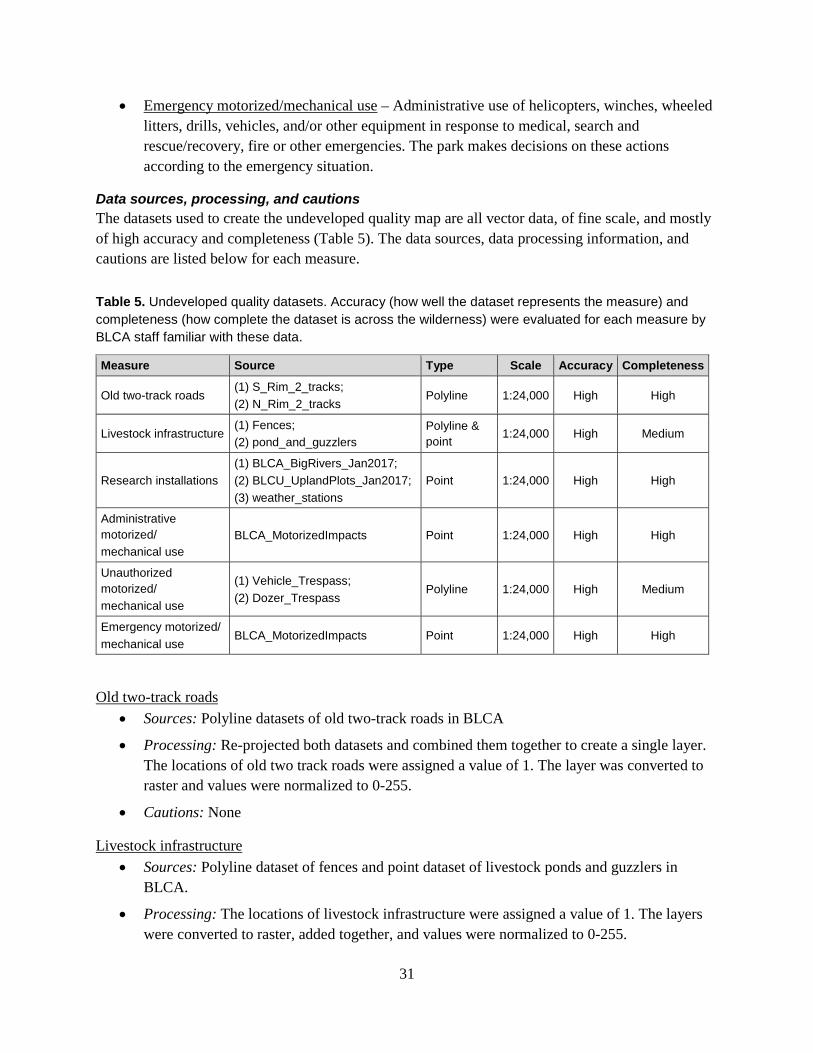
Table 5. Undeveloped quality datasets. ............................................................................................... 31
Table 6. Measure weights and rationales for the undeveloped quality. .............................................. 33
Table 7. Solitude or primitive and unconfined recreation quality datasets.. ....................................... 38
Table 8. Modern human features impacting viewshed. ....................................................................... 43
Table 9. Measure weights and rationales for the solitude or primitive and unconfined recreation quality. ................................................................................................................................ 48
vii
List of Roles and Contributors Principal Contact Danguole Bockus – Ecologist Black Canyon of the Gunnison National Park 102 Elk Creek, Gunnison, CO 81230 Phone: 970- 249-1914 ext.432, Email: [email protected]
Aldo Leopold Wilderness Research Institute James Tricker – GIS Analyst
BLCA Project Team Theresa Childers – Wildlife Biologist Forest Frost – Archeologist Kim Hartwig – Chief, Resource Stewardship & Science Chris Mengel – Chief, Visitor & Resource Protection Bruce Noble – Superintendent Matt Rothrock – Biological Science Technician Sandy Snell-Dobert – Chief, Interpretation, Education & Technology Ryan Thrush – BLCA District Ranger Paul Zaenger – Interpretive Specialist
BLCA Advisors Michael Dale – Hydrologist Steve Kay – Park Ranger Nick Myers – Park Ranger
External Consultation Sharolyn Anderson – Physical Scientist, National Park Service Natural Sounds & Night Skies Nell Conti – GIS Chief, National Park Service Intermountain Region Steve Hammond – Fire GIS specialist, National Park Service Intermountain Region Fire & Aviation
Management Dan Mennitt – Research Scientist, Department of Electrical and Computer Engineering, Colorado
State University (in partnership with the Natural Sounds and Night Sky Division, Natural Resource Stewardship and Science Directorate, National Park Service)
Lynae Rogers – Rangeland Management Specialist, Bureau of Land Management Scott Thompson-Buchanan – Cartographer, National Park Service Intermountain Region Aneth Wight – Cartographic Technician, Northern Colorado Plateau Inventory & Monitoring
Network
viii
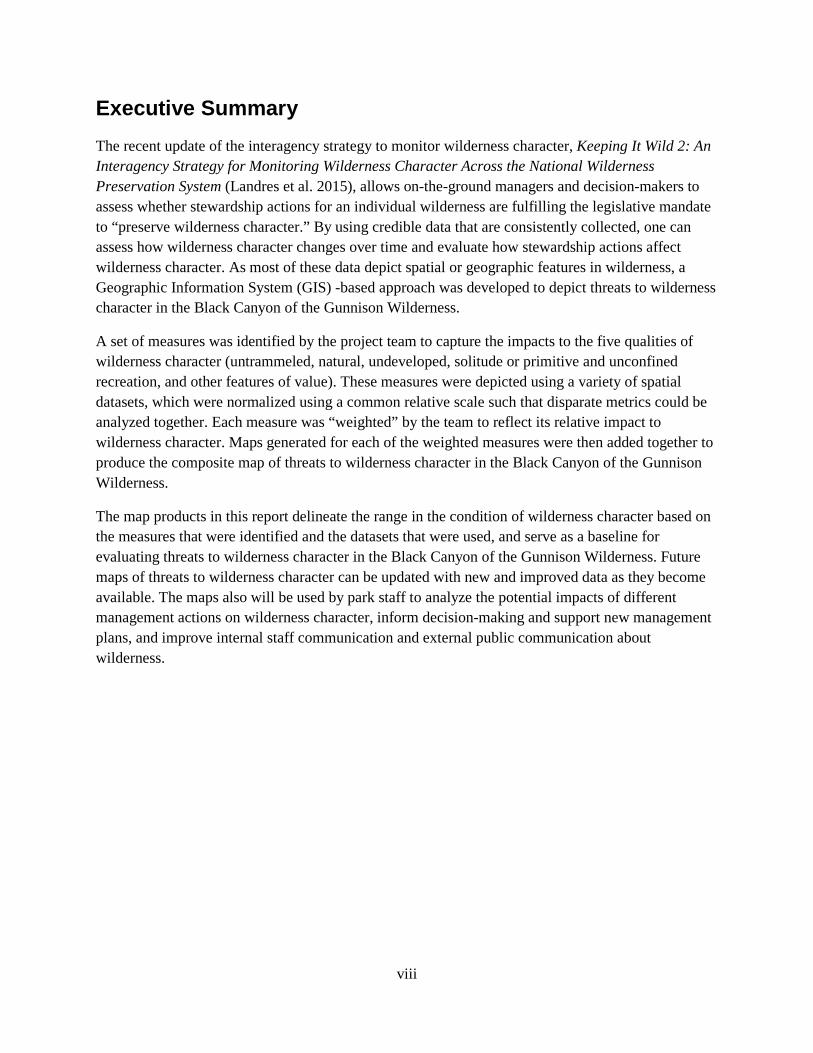
Executive Summary The recent update of the interagency strategy to monitor wilderness character, Keeping It Wild 2: An Interagency Strategy for Monitoring Wilderness Character Across the National Wilderness Preservation System (Landres et al. 2015), allows on-the-ground managers and decision-makers to assess whether stewardship actions for an individual wilderness are fulfilling the legislative mandate to “preserve wilderness character.” By using credible data that are consistently collected, one can assess how wilderness character changes over time and evaluate how stewardship actions affect wilderness character. As most of these data depict spatial or geographic features in wilderness, a Geographic Information System (GIS) -based approach was developed to depict threats to wilderness character in the Black Canyon of the Gunnison Wilderness.
A set of measures was identified by the project team to capture the impacts to the five qualities of wilderness character (untrammeled, natural, undeveloped, solitude or primitive and unconfined recreation, and other features of value). These measures were depicted using a variety of spatial datasets, which were normalized using a common relative scale such that disparate metrics could be analyzed together. Each measure was “weighted” by the team to reflect its relative impact to wilderness character. Maps generated for each of the weighted measures were then added together to produce the composite map of threats to wilderness character in the Black Canyon of the Gunnison Wilderness.
The map products in this report delineate the range in the condition of wilderness character based on the measures that were identified and the datasets that were used, and serve as a baseline for evaluating threats to wilderness character in the Black Canyon of the Gunnison Wilderness. Future maps of threats to wilderness character can be updated with new and improved data as they become available. The maps also will be used by park staff to analyze the potential impacts of different management actions on wilderness character, inform decision-making and support new management plans, and improve internal staff communication and external public communication about wilderness.
ix
Acknowledgments Special thanks to Bruce Noble (Superintendent, Black Canyon of the Gunnison National Park and Curecanti National Recreation Area) for encouraging and supporting this project. We are also indebted to the project team and other park staff who were always available to provide their expert opinion on all aspects of this project. We thank them for their continued passion and dedication to protecting the wilderness resource in the Black Canyon of the Gunnison National Park. Thanks are also extended to those from other land management agencies and research facilities/entities for providing data and consultation.
Acronyms and Abbreviations AUM – Animal Unit Months BLCA - Black Canyon of the Gunnison National Park BLM – Bureau of Land Management CFS – Cubic feet per second DEM – Digital Elevation Model DSM – Digital Surface Model EPA – Environmental Protection Agency GIS – Geographic Information System NCPN – Northern Colorado Plateau Network Inventory and Monitoring Program NWPS – National Wilderness Preservation System RAWS – Remote Automated Weather Station TIFF – Tagged Image File Format USGS – U.S. Geological Survey
1
Introduction The Wilderness Act of 1964 (Public Law 88-577) established the National Wilderness Preservation System (NWPS) “for the protection of these areas, [and] the preservation of their wilderness character” (Section 2(a)). In congressional testimony clarifying the intent of wilderness designation, Howard Zahniser (1962) said, “The purpose of the Wilderness Act is to preserve the wilderness character of the areas to be included in the wilderness system, not to establish any particular use,” legal scholars (Rohlf and Honnold 1988, McCloskey 1999) subsequently confirmed that preserving wilderness character is the Act’s primary legal mandate. Furthermore, the policies of all four wilderness managing agencies state that they are to preserve wilderness character in all areas designated as wilderness.
Wilderness character is an inherent part of a wilderness, and varies across the landscape just as landscape features vary from one place to the next. Maps that depict how wilderness attributes vary across the landscape from least to most wild have been produced at a variety of scales: globally (Sanderson et al. 2002), continentally (Carver 2010), nationally (Aplet et al. 2000), and locally (Carver et al. 2008). Adding to this body of work, a recent study for the Death Valley Wilderness (Tricker et al. 2012, Carver et al. 2013) has provided a spatially explicit description of impacts to wilderness character for all lands falling within a particular National Park Service (NPS) wilderness. This approach has been strongly supported by the NPS, and further studies have been conducted for six NPS wildernesses. Black Canyon of the Gunnison National Park is now the eighth national park to produce a map of threats to wilderness character.
Black Canyon of the Gunnison Wilderness Black Canyon of the Gunnison National Park (BLCA), and the adjacent NPS-administered Curecanti National Recreation Area, are located between Montrose and Gunnison in western Colorado (Figure 1). BLCA is an impressive canyon combining steepness, narrowness, ruggedness, color, and depth unique in North America. The wildness of the canyon, canyon rims, and uplands has been recognized and preserved through proclamations and legislation, including designation and expansion of wilderness.
The Black Canyon of the Gunnison National Monument was established by Presidential Proclamation 2033, signed by President Herbert Hoover on March 2, 1933, “for the preservation of its spectacular gorges and additional features of scenic, scientific, and educational interest.” In 1976, Congress enacted Public Law 94-567, which recognized the canyon’s wild and undeveloped qualities and designated 11,180 acres of the monument as Black Canyon of the Gunnison Wilderness in accordance with the legislation. Congress subsequently re-designated the monument a national park through enactment of Public Law 106-76 in October 1999. This law also expanded the park’s boundaries, including an additional 4,419 acres of wilderness, recognizing that BLCA and adjacent lands include, among other values:
• Unique ecological, geological, scenic, historical, and wildlife components enhanced by the serenity and rural western setting of the area.
2
• Extensive opportunities for educational, and public recreational activities such as hiking, camping, and fishing, and for wilderness values, including solitude.
• Benefits of designating public and private land surrounding the national monument as a national park include greater long-term protection of the resources and expanded visitor use opportunities.
Today, Black Canyon of the Gunnison NP includes 30,750 acres, of which 15,599 acres (50%) are designated wilderness (Figure 2). An additional 8,447 acres have been determined to be eligible or potentially eligible for full wilderness study and are presently managed to protect wilderness character until the legislative process is complete, in accordance with NPS Management Policies 2006.
The narrow, nearly vertical walls of the inner canyon, with many faces in excess of 1,800 vertical feet, draw advanced-skill climbers, and inspire awe from visitors peering in from the rim. Ledges on the canyon walls support peregrine falcons, golden eagles, and canyon wrens, among other wildlife species. The Gunnison River, with flows of outstandingly clean water, supports a rich aquatic life that entices anglers to the canyon bottom for unparalleled fly-fishing experiences, particularly during the annual stonefly hatch.
Hikers and campers are also drawn to the canyon bottom. Most of the hiking routes into the canyon are steep, mostly rocky, have no signs, and are not maintained. A wilderness permit system controls the number of people who enter the inner canyon during a particular period and most interested visitors are accommodated. Within the canyon, campers select from unoccupied and undesignated sites. Fires and pets are not permitted and visitors are asked to adhere to Leave No Trace ethics. The canyon environment is primarily influenced by natural forces, showing little visual influence of humans.
The canyon area below the rim and surrounding undeveloped upland woodland and shrub communities comprise the Black Canyon of the Gunnison Wilderness. These uplands include piñon-juniper forest and open stands of Gambel oak, serviceberry and mountain big sagebrush that provide habitat for many avian species, small mammals, elk, and mule deer. Open vistas are viewed during the day and dark, expansive night skies offer serenity to visitors. The western portion of BLCA is adjacent to other federally managed land, including 17,784 acres of the Gunnison Gorge Wilderness (Bureau of Land Management), providing additional recreation opportunities to visitors.
3
Figure 1. Black Canyon of the Gunnison National Park and surrounding protected lands.
4
Figure 2. Black Canyon of the Gunnison National Park.
5
Purpose of this mapping project The purpose of this project was to develop an approach that spatially depicts threats to wilderness character in the BLCA designated and eligible wilderness and how they vary across the landscape. This mapping effort:
• Shows the current extent and magnitude of threats to wilderness character and how they vary across the BLCA wilderness.
• Provides a measurement baseline from which future monitoring can show how threats to wilderness character change spatially over time.
• Allows BLCA to analyze the potential impacts of different management actions on wilderness character.
• Identifies areas within the wilderness where resource managers should make an effort to control or mitigate impacts. These efforts may include monitoring conditions, establishing thresholds, or taking direct action.
• Identifies specific activities or impacts outside the wilderness that may pose a substantial risk of degrading wilderness character inside wilderness.
• Improves internal staff communication about wilderness and wilderness character and improves external communication between the park and the public on related issues.
• Identifies and fills data gaps by collecting information from local staff and digitizing new spatial data.
In addition to the immediate benefits described above, this project improved and consolidated existing spatial datasets and generated new datasets. These datasets and the maps produced by this project lay the groundwork for future wilderness character mapping efforts at BLCA. When and if the park is able to conduct future iterations of the map of threats to wilderness character, the maps in this report can serve as the baseline for assessing how threats to wilderness character change spatially over time.
Concerns and cautions There are a number of potential concerns about producing maps of threats to wilderness character. Despite these concerns, managers have recognized these maps as the best available tool for spatially representing impacts to wilderness character. Major cautions about this overall effort include:
• Creating sacrifice zones – The map may facilitate the inappropriate creation of “sacrifice zones” or internal buffers within the wilderness, directly contravening congressional and agency mandates to preserve wilderness character across an entire wilderness. For example, if the map shows that some areas are “better” or of “higher quality” than others, the tendency may be to focus efforts on preserving wilderness character only in these specific areas while allowing wilderness character to degrade in “lower quality” areas. By showing the current extent and magnitude of threats to wilderness character and how they vary across the entire
6
wilderness, the intent of the map is to help staff maintain high quality areas while improving lower quality areas.
• Comparing wilderness character among wildernesses – Since this approach has been used for other wilderness areas, the map may facilitate inappropriate comparisons of wilderness character among different wildernesses. These maps show the current extent and magnitude of threats to wilderness character in different colors (representing pixel values), and it would be easy for users to compare the quantity of a given color from one wilderness to another. Comparing these maps among different wildernesses, however, is neither valid nor appropriate because each map is built with data from the unique context of a particular wilderness.
• Assuming that the resulting map completely describes wilderness character – The map may be misconstrued as an accurate and precise description of wilderness character. The map is instead only an estimate of selected threats to wilderness character for which spatial data were available for this particular wilderness. As an approximate representation of threats to wilderness character, the map should not be considered an absolute and complete description. In addition, the map does not portray the threats to the symbolic, intangible, spiritual, or experiential values of wilderness character. In short, while this map is useful for the purposes outlined above, it does not describe the complexity, richness, or depth of wilderness character.
• Updating datasets in the future such that maps are not directly comparable – As datasets are updated over time, future iterations of the map may not be comparable with the original map. Each map is a product of both the best available spatial data and the locally defined methods for processing those data. As with all long-term monitoring efforts, changes in the type and quality of data or in the data processing techniques can make comparisons between original and subsequent data invalid. Therefore, proposals to use new or altered data, or to change data processing methods, need to be assessed carefully to ensure the comparability of map products over time.
Report outline A team approach was used to develop the map of threats to wilderness character in the BLCA wilderness, tapping the experience and knowledge of park staff (see page vii for a full list of staff involved). Together, the project core team and other park staff have more than 80 person-years of on-the-ground experience in and with the BLCA wilderness. The project core team, and other park staff as required, conducted multiple face-to-face meetings and had numerous phone and email conversations while developing the map products described in this report. All decisions about developing the map were made by project core team consensus.
This report provides an in-depth discussion of how the map of threats to wilderness character was developed. It is divided into three major sections:
• Overview of the process for developing the map of threats to wilderness character – describes the conceptual foundation for how the map was developed.

7
• Methods – describes the measures that were used to represent the degradation of wilderness character, along with the data sources, data processing methods, data and measure cautions, and the rationale for measure weighting.
• Map of threats to wilderness character – discusses some of the patterns revealed in the map, approaches to improving map development in the future, and final concerns about the overall process.
8
Overview of the Process for Developing the Map of Threats to Wilderness Character This wilderness character mapping project used a Geographic Information System (GIS) to spatially describe and assess impacts to wilderness character in the BLCA wilderness. With this approach, it is essential to understand the variety of activities and influences that threaten wilderness character, as well as the role of wilderness managers in mitigating or responding to such threats. NPS policy states that “The purpose of wilderness in the national parks includes the preservation of wilderness character and wilderness resources in an unimpaired condition” (NPS Management Policies, 2006). Only by understanding the myriad of human influences that affect or threaten wilderness character can managers meet wilderness stewardship goals.
For this report, threats to wilderness character are defined as a combination of:
• Historical activities that continue to degrade wilderness character (e.g. grazing, departure from natural fire regimes).
• Current actions or influences that degrade wilderness character (e.g. non-native invasive species, regulated flow of the Gunnison River).
• Impending issues that are likely to degrade wilderness character into the future (e.g. night sky obfuscation, increased visitor use and increased management actions associated with increased use).
By identifying and depicting threats to wilderness character, the maps produced in this report provide managers with a tool to better understand the extent and magnitude of impacts to wilderness character in the BLCA wilderness and thereby improve wilderness stewardship.
This project adheres to the interagency strategy for monitoring wilderness character, as described in Keeping it Wild 2: An Updated Interagency Strategy to Monitor Trends in Wilderness Character Across the National Wilderness Preservation System (Landres et al. 2015). This interagency strategy was formally endorsed in the fall 2015 by the Interagency Wilderness Policy Council (which is composed of the highest policy-level personnel responsible for wilderness in each of the four wilderness managing agencies). Therefore, by adhering to the interagency strategy, this project is consistent with NPS and interagency policies, terminology1, and monitoring protocols for wilderness character.
1 Terminology used in this report to describe threats to wilderness character—including “degraded,” “negative impact,” “significant,” etc.—reflects common vocabulary used in laws, policies, and interagency wilderness character monitoring documents. These terms do not imply an analysis of impacts or determination of significant effects, such as required by the National Environmental Policy Act or other agency decision-making processes.
9
The five qualities of wilderness character Keeping It Wild 2 provides a tangible definition of wilderness character and identifies five qualities of wilderness character that apply uniquely to every wilderness: untrammeled, natural, undeveloped, solitude or primitive and unconfined recreation, and other features of value. These qualities apply to all designated wilderness areas because they are based on the legal definition of wilderness from the Wilderness Act (Section 2(c)).
Actions managers choose to take or not take in wilderness have the potential to degrade or improve these qualities and affect wilderness character. Challengingly, actions taken to protect or improve one quality of wilderness character may often result in the degradation of another quality (Landres et al. 2015). For example, although maintaining toilets at campsites protects water quality and benefits the natural quality, the toilets are also facilities that decrease opportunities for primitive recreation and installations that diminish the undeveloped quality. These types of tradeoffs are inherent to many aspects of wilderness stewardship, and understanding how a single action may have different effects on the qualities of wilderness character is essential for evaluating management decisions and actions in wilderness.
In addition to the actions, or inaction, of managers, wilderness character may also be affected by factors outside the jurisdiction of BLCA. For example, air pollution, night sky light pollution, and climate change are not under the direct control of wilderness managers but can still have substantial effects on the qualities of wilderness character. The inclusion of these types of external impacts in the interagency wilderness character monitoring strategy (and, consequently, in this mapping project) does not constitute an application of wilderness laws, policies, and restrictions to non-wilderness areas (i.e. the creation of a “buffer” around wilderness); instead, it is an acknowledgement that broad-scale social and ecological changes may affect wilderness character (Landres et al. 2015).
Certain activities may be legally allowed in wilderness and yet also threaten wilderness character. Although the Wilderness Act prohibits “nonconforming” uses (such as motorized use, mechanical transport, or the installation of permanent developments), specific exceptions have been permitted through special provisions in the Wilderness Act itself and in subsequent wilderness legislation. The Wilderness Act states that nonconforming uses or activities may be permitted only “as necessary to meet minimum requirements for the administration of the area for the purpose of this Act (including measures required in emergencies involving the health and safety of persons within the area)” (Section 4(c)). Additional special provisions may also be legislated for a specific wilderness to allow, or require, nonconforming activities by managers or visitors. Even in situations where such uses are both legal and justifiable, however, nonconforming activities still degrade wilderness character (Landres et al. 2005, Landres et al. 2015). Over time, the cumulative effects of these legal yet nonconforming uses may cause a substantial impact to wilderness character, which emphasizes the need to carefully weigh future decisions related to such activities.
The mapping framework The five qualities of wilderness character form the foundation of the interagency monitoring strategy, and are the first level of the hierarchical monitoring framework. For this project, 4 of the 5 qualities of wilderness character were analyzed: Untrammeled, Natural, Undeveloped, Solitude or primitive
10
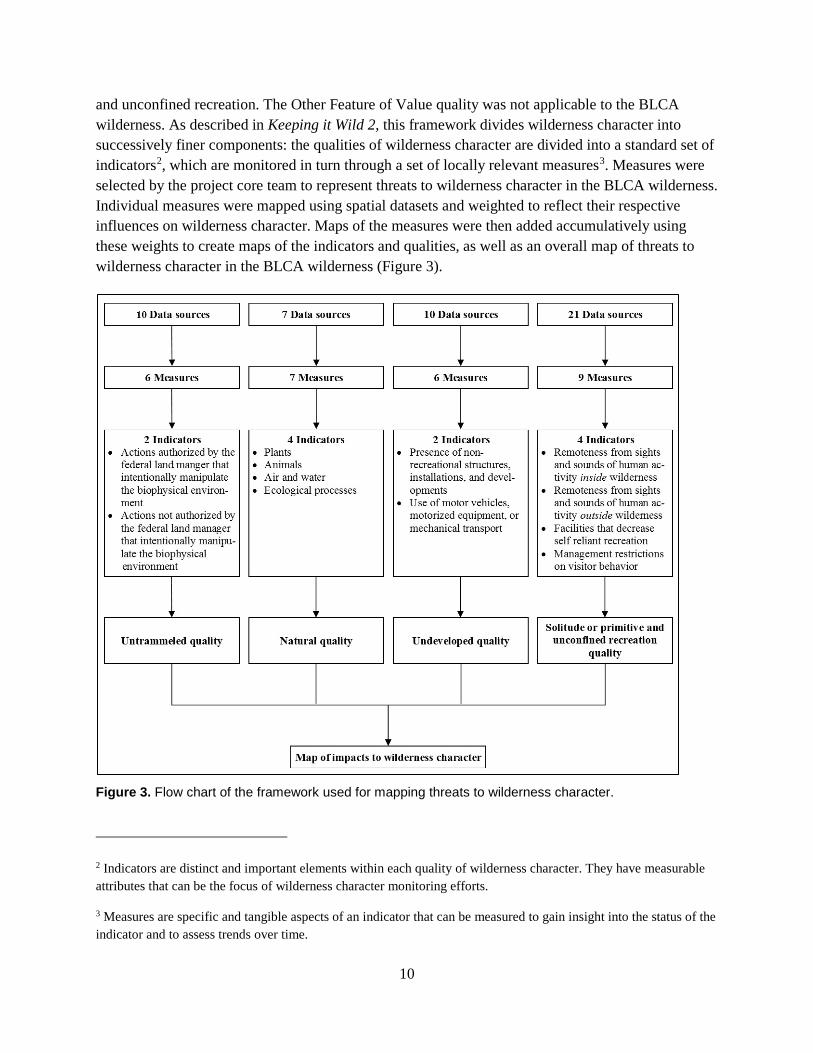
and unconfined recreation. The Other Feature of Value quality was not applicable to the BLCA wilderness. As described in Keeping it Wild 2, this framework divides wilderness character into successively finer components: the qualities of wilderness character are divided into a standard set of indicators2, which are monitored in turn through a set of locally relevant measures3. Measures were selected by the project core team to represent threats to wilderness character in the BLCA wilderness. Individual measures were mapped using spatial datasets and weighted to reflect their respective influences on wilderness character. Maps of the measures were then added accumulatively using these weights to create maps of the indicators and qualities, as well as an overall map of threats to wilderness character in the BLCA wilderness (Figure 3).
Figure 3. Flow chart of the framework used for mapping threats to wilderness character.
2 Indicators are distinct and important elements within each quality of wilderness character. They have measurable attributes that can be the focus of wilderness character monitoring efforts.
3 Measures are specific and tangible aspects of an indicator that can be measured to gain insight into the status of the indicator and to assess trends over time.
11
For this mapping project, measures were explicitly selected to represent features, conditions, and actions that threaten wilderness character in the BLCA wilderness. For example, the livestock infrastructure measure depicts where the undeveloped quality has been degraded by the presence of fences, guzzlers, and ponds. While some actions, conditions, or features in wilderness may have a positive influence on wilderness character (such as the preservation of an endangered keystone species), such “value added” features are not encompassed by the selected measures. Similarly, when actions or features have a mix of both positive and negative effects (such as management regulations that confine visitors in order to protect natural resources), the selected measures only quantify the negative impacts. The BLCA project team decided to adopt this “negative mapping” approach because it allows for the full magnitude of threats to be depicted. In contrast, simultaneously displaying positive and negative impacts on a single map would result in these opposing influences being mutually offset or cancelled out, thereby obscuring the true extent of their individual effects on wilderness character. Therefore, the map products presented in this report only depict threats to wilderness character and do not capture management activities that benefit or improve wilderness character.
At first glance, it could appear inappropriate or meaningless to combine measures into a single overall map since each measure captures a unique and distinct impact to wilderness character. For example, it may seem counterintuitive to combine the aerial extent of invasive plants with the probability of encounters with other visitors. However, since all measures quantify threats to wilderness character, combining measures is both appropriate and important for understanding and recording the magnitude of their cumulative effects. Additional information on the rationale and methods for accumulatively combining disparate measures to produce an overall map of threats to wilderness character are described by Carver et al. (2013). While data and maps for individual measures are relevant for local management purposes, the intent of this mapping project is also to understand and report on the big picture: to represent the cumulative spatial pattern and variation of threats to wilderness character. This big picture is a powerful and effective tool for communicating wilderness issues within the agency and with external audiences (Landres et al. 2008b).
Mapping threats to wilderness character differs from wilderness character monitoring in a key way. While monitoring efforts focus on assessing change in wilderness character over time by producing a single overall trend direction (i.e. improving/upward, stable, or degrading/downward), this mapping project examined the current (baseline) extent and magnitude of threats to wilderness character and how those cumulative threats vary across the wilderness. The overall map of threats to wilderness character was therefore generated directly from the weighted measures, and did not undergo a standardization process at each level of the hierarchical framework (as is the case when deriving trends for wilderness character monitoring). This approach allowed the magnitude of threats to be depicted so that qualities with few or lightly weighted measures (i.e. fewer or milder threats) had a proportionally smaller influence on the overall map of threats to wilderness character than qualities with many or heavily weighted measures (i.e. more or greater threats).
The maps produced through this project depict the BLCA wilderness’ current degree of departure or degradation from an “optimal condition” of wilderness character. This optimal condition reflects an
12
ideal manifestation of wilderness character as expressed in the Wilderness Act; in other words, a state in which there are no threats to wilderness character. Each measure is depicted across the wilderness on a scale from its “optimal condition” (i.e. no threat) to its most “degraded condition” (i.e. highest current threat level). When the measures are combined accumulatively, therefore, the overall map of threats to wilderness character is similarly depicted on a scale from its optimal condition (i.e. no threats to wilderness character) to its most degraded condition (i.e. highest cumulative threat level from all measures). The optimal conditions depicted in the map products do not represent the condition of wilderness character in the 11,180 acres of BLCA wilderness designated in 1976, and therefore cannot be used to determine if threats to wilderness character have increased or decreased since the time of designation.
13
Methods Selecting measures under each indicator of the four qualities was an iterative and collaborative decision-making process. Possible measures were first identified by the project core team, and then evaluated for both their relevance to the indicator and the availability and quality of the required data. BLCA staff assessed data quality for each dataset using two metrics: accuracy (how well the dataset represents the measure) and completeness (how complete the dataset is across the wilderness). In general, only measures that were relevant, and that had readily available data of sufficient quality, were included. For certain measures this involved developing new datasets based on institutional knowledge (i.e. drawing known locations of impacts onto paper maps). In some cases, potential measures had insufficient or non-existent data but were acknowledged by BLCA staff for their significance to their respective indicators; these “data gap” measures are noted below under each applicable quality. As data improve or become available, the data gap measures should be re-evaluated for inclusion in future iterations of the map of threats to wilderness character.
Weighting measures Once all measures were selected, each was evaluated independently to determine the magnitude of its effect on wilderness character. Some measures have a greater impact to wilderness character than others; for example, the climbing restrictions measure has a relatively smaller impact (because it only occurs at one location, the Painted Wall, and for a short period of the year during the falcon nesting season), whereas the encounter rates on canyon routes measure has a relatively greater impact (because there are only seven routes down to the canyon, and only two or three are suitable for the majority of park visitors). To accurately portray the variable magnitudes of the measures’ effects, each measure was assigned a “weight”—a value from 1 (low impact) to 10 (high impact)—by the project core team. The project core team then reviewed the map outputs and modified the weighting scheme to reflect their knowledge of the condition of wilderness character on the ground. While this interactive process runs the risk of allowing staff to “game the system” to produce a desired outcome, staff experience has been shown to be highly accurate in judging resource conditions (Cook et al. 2009). The project core team used caution and consensus-driven oversight to ensure accuracy in the maps produced.
Specific rationales for weights assigned to each measure can be found in tables 2, 4, 6, 8, and 10 under their respective qualities. The following questions were used to help determine weights for all measures:
• Is the measure specific to a particular area (lower weight) or spread throughout the wilderness (higher weight)?
• Does the measure represent a major management issue, e.g. non-native invasive species (higher weight), or is it something relatively benign, e.g. departure from fire return interval (lower weight).
• Does the measure depict an emerging threat that requires intensive management?
14
• Is the measure relevant to a particular time of year or season (lower weight), or is it an issue year-round (higher weight)?
• Are the data representing the measure accurate and complete (higher weight) or are they of poorer quality (lower weight)?
• Are the data qualitative (lower weight) or quantitative (higher weight)?
Data sources and processing techniques Measures were mapped by applying GIS-based techniques to their respective datasets. A total of 48 datasets were used for measuring and delineating threats to wilderness character in the BLCA. These datasets were obtained from a variety of sources and comprised local, regional, and national spatial data at varying scales, accuracy, and completeness. This variation placed limitations on how the map products were developed and necessitated the use of adaptable data processing methods, as described below. Metadata were developed for each data layer used in this mapping project, and include documentation of processing flows, quality/completeness, editing, development, and cautionary notes. All data and metadata were organized and stored on a network drive to ensure accessibility and facilitate use in future analyses. Datasets included:
• Commonly-used data layers that are stored in the GIS data (\\inpblcas3\GISDATA83)(K:) and Resource (\\inpblcas3\resource)(R:) drives (centrally-located geospatial repositories that are accessible to BLCA staff).
• Existing data layers associated with previous or on-going BLCA projects (BLCA and NCPN).
• Existing datasets that were edited, combined, or refined as a prerequisite for use in this project.
• Original datasets that were developed from local sources (including records, reports, and expert knowledge) and converted into a geospatial format.
A number of basic processing tasks were performed using ArcGIS4 for datasets before they were used as measures to create the map of threats to wilderness character. All datasets were projected in ArcGIS using the NAD_1983_UTM_Zone_13N coordinate system. For vector5 datasets, a value was assigned to each feature by the project core team to represent its spatial impact in the BLCA wilderness. Some of the vector datasets had features with a range of values because of the data they represent; for example, under the encounter rates on canyon routes measure, each route had a different value based on the yearly averages collated in the wilderness entry spreadsheet. The vector datasets were then converted to raster grids6 whereby locations of the features or their associated
4 GIS software developed by Environmental Systems Research Institute.
5 Vector data type uses points, lines, and polygons to represent features.
6 Raster data type consists of rows and columns of cells, with each cell storing a single value.
15
effects were represented by the assigned values; unaffected areas of the wilderness (i.e. where no degradation occurs) were set to a value of 0.
The values for all raster grid layers were normalized7 by stretching them to a standardized range of values (0–255). This normalized range of values allows datasets, and therefore measures, to be evaluated together on a common relative scale (Carver et al. 2008). For example, the soundscape and night sky measures use different units (decibels vs. anthropogenic light ratio values) and cannot be directly compared without normalization. Lower values of normalized measures were used to represent optimal conditions (i.e. no threat) and higher values to represent degraded conditions (i.e. high threat level).
In the following sections, the measures and datasets used are described for each of the five qualities of wilderness character. Measures are organized by their weight within each quality, with higher weighted measures listed first. For each measure included in this analysis, the specific data sources, processing, and cautions are also described. All datasets and measures used the units of the original data source(s); throughout this report, metric units (e.g. kilometers) and imperial units (e.g. miles) are used interchangeably. The maps represent a grid of values (approximately 1 million pixels at a 10m resolution) and use a blue-red color ramp and the “minimum-maximum” stretch method8 to enhance the color contrast; areas of optimal condition (no threat) are shown in blue, while areas of degraded condition (high threat level) are shown in red.
Untrammeled Quality The untrammeled quality focuses on the degree to which wilderness is unhindered and free from modern human control or manipulation. The untrammeled quality is degraded by actions that intentionally manipulate or control ecological systems (in contrast to the natural quality, which is degraded by the effects of modern civilization) (Landres et al. 2015).
To spatially depict the baseline of threats to untrammeled quality in the BLCA wilderness, the project core team decided to provide a cumulative summary of all trammeling actions for the past 10 years.
Indicators and measures Keeping it Wild 2 delineates two indicators under the untrammeled quality. The measures selected for the BLCA wilderness are described below for each of these indicators.
7 Normalization of measures was achieved using a linear rescaling of the input values (slicing) onto a 0–255 scale on an equal interval basis.
8 The stretch method defines the type of histogram stretching that was applied to raster datasets to enhance their appearance. The minimum-maximum stretch applies a linear stretch on the output minimum and output maximum pixel values, which were used as endpoints for the histogram (ESRI 2015).
16
Indicator: Actions authorized by the federal land manager that manipulate the biophysical environment
• Non-native invasive plant control/removal – The intentional control/removal of plants by primarily mechanical (cutting, mowing), manual (pulling, digging) or chemical (applying herbicide) methods. Despite the goal of restoring habitat for native species, these treatments are a deliberate manipulation of natural processes.
• Fire suppression – Naturally ignited fires that receive a suppression response. Suppressing these fires degrades the untrammeled quality by directly manipulating natural biophysical processes.
• Inner canyon visitor use – The number of wilderness permits issued to park visitors to access routes into the inner canyon. The untrammeled quality is degraded with increased human use.
• Restoration of native vegetation – The intentional soil preparation, seeding, planting and/or salvage of native plant species in disturbed soils. Restoration methods degrade the untrammeled quality by manipulating natural processes.
• Prescribed fire and mechanical fuels management – The intentional use of fire ignitions and mechanical removal of vegetation to accomplish habitat enhancement and/or reduce hazardous fuels. These actions deliberately manipulate the natural landscape which degrades the untrammeled quality.
Indicator: Actions not authorized by the federal land manager that manipulate the biophysical environment
• User violations – Visitor actions that violate wilderness permit conditions of use (e.g., campfires, litter, vandalism, dogs). These intentional actions have negative impacts to natural communities and biophysical processes that degrade the untrammeled quality.
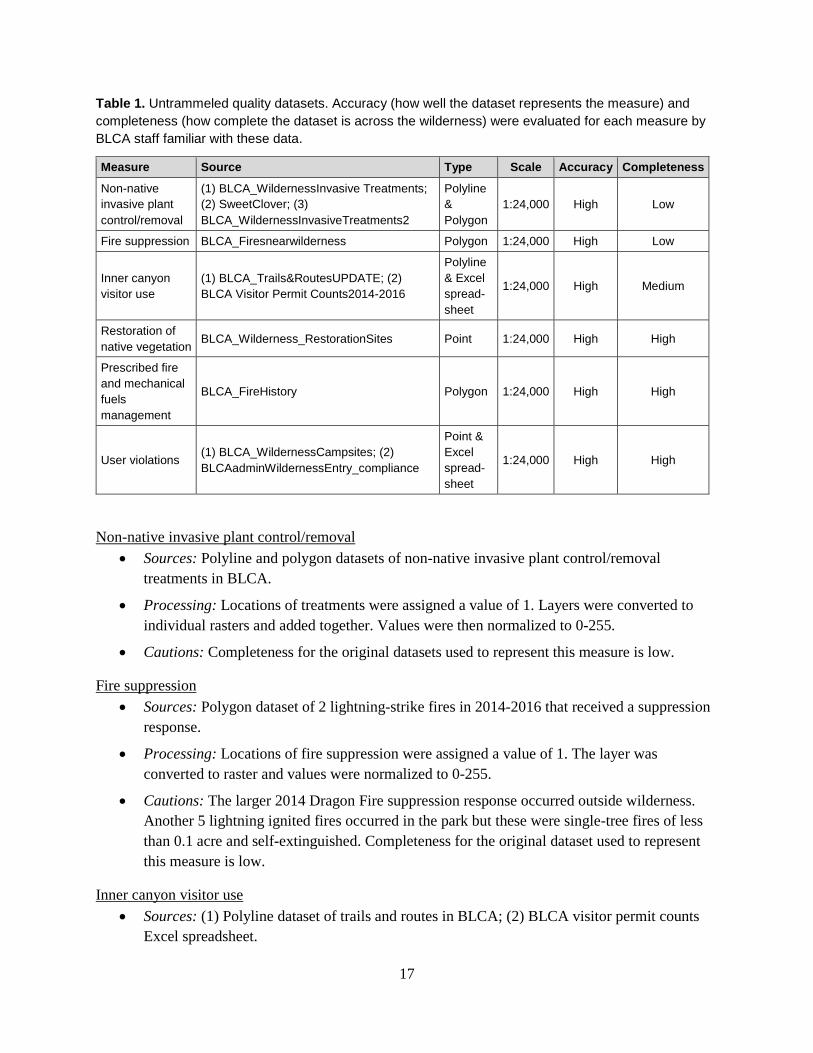
Data sources, processing, and cautions The datasets used to create the untrammeled quality map are all vector data, of fine scale, and generally of high accuracy and completeness (with the exception of completeness being low for Non-native invasive plant control/removal and Fire suppression) (Table 1). The data sources, data processing information, and cautions are listed below for each measure.
17
Table 1. Untrammeled quality datasets. Accuracy (how well the dataset represents the measure) and completeness (how complete the dataset is across the wilderness) were evaluated for each measure by BLCA staff familiar with these data.
Measure Source Type Scale Accuracy Completeness Non-native invasive plant control/removal
(1) BLCA_WildernessInvasive Treatments; (2) SweetClover; (3) BLCA_WildernessInvasiveTreatments2
Polyline & Polygon
1:24,000 High Low
Fire suppression BLCA_Firesnearwilderness Polygon 1:24,000 High Low
Inner canyon visitor use
(1) BLCA_Trails&RoutesUPDATE; (2) BLCA Visitor Permit Counts2014-2016
Polyline & Excel spread-sheet
1:24,000 High Medium
Restoration of native vegetation BLCA_Wilderness_RestorationSites Point 1:24,000 High High
Prescribed fire and mechanical fuels management
BLCA_FireHistory Polygon 1:24,000 High High
User violations (1) BLCA_WildernessCampsites; (2) BLCAadminWildernessEntry_compliance
Point & Excel spread-sheet
1:24,000 High High
Non-native invasive plant control/removal • Sources: Polyline and polygon datasets of non-native invasive plant control/removal
treatments in BLCA.
• Processing: Locations of treatments were assigned a value of 1. Layers were converted to individual rasters and added together. Values were then normalized to 0-255.
• Cautions: Completeness for the original datasets used to represent this measure is low.
Fire suppression • Sources: Polygon dataset of 2 lightning-strike fires in 2014-2016 that received a suppression
response.
• Processing: Locations of fire suppression were assigned a value of 1. The layer was converted to raster and values were normalized to 0-255.
• Cautions: The larger 2014 Dragon Fire suppression response occurred outside wilderness. Another 5 lightning ignited fires occurred in the park but these were single-tree fires of less than 0.1 acre and self-extinguished. Completeness for the original dataset used to represent this measure is low.
Inner canyon visitor use • Sources: (1) Polyline dataset of trails and routes in BLCA; (2) BLCA visitor permit counts
Excel spreadsheet.
18
• Processing: Queried all inner canyon routes from the trails polyline dataset. Summed monthly visitor permit counts in 2014-2016 for each route in Excel spreadsheet to create yearly visitor permit totals for each route. Joined spreadsheet annual encounter rate numbers to queried polyline dataset. The layer was converted to raster and the values were normalized to 0-255.
• Cautions: The visitor permit counts database is incomplete but represents the best available information on visitor numbers per route in the inner canyon.
Restoration of native vegetation • Sources: Polygon dataset of restoration sites on the edge of or in designated/eligible
wilderness.
• Processing: Locations of stock pond restorations were buffered to 25m to account for the larger footprint of this impact. All locations of restoration activities were assigned a value of 1. The layer was converted to raster and values were normalized to 0-255.
• Cautions: None
Prescribed fire and mechanical fuels management • Sources: Polygon dataset of prescribed fires in BLCA.
• Processing: Dataset was reprojected to NAD_1983_UTM_Zone_13N. Locations of prescribed fires were assigned a value of 1. The layer was converted to raster and values were normalized to 0-255.
• Cautions: None
User violations • Sources: (1) Point dataset of wilderness campsites in BLCA; (2) BLCA administrative
wilderness entry compliance Excel spreadsheet.
• Processing: Generated yearly totals from 2009 to 2016 for all permit condition violation incidents (litter, campfires, dogs, vandalism) per route into the inner canyon. Calculated the yearly average per route, and related this value to the wilderness campsites that are accessed by each route. The wilderness campsites layer was converted to raster and values were normalized to 0-255.
• Cautions: Violation incidents are recorded per route but are related to the campsites that they provide access to. Therefore, certain incidences such as dogs in wilderness may relate to the routes and not to the campsites.
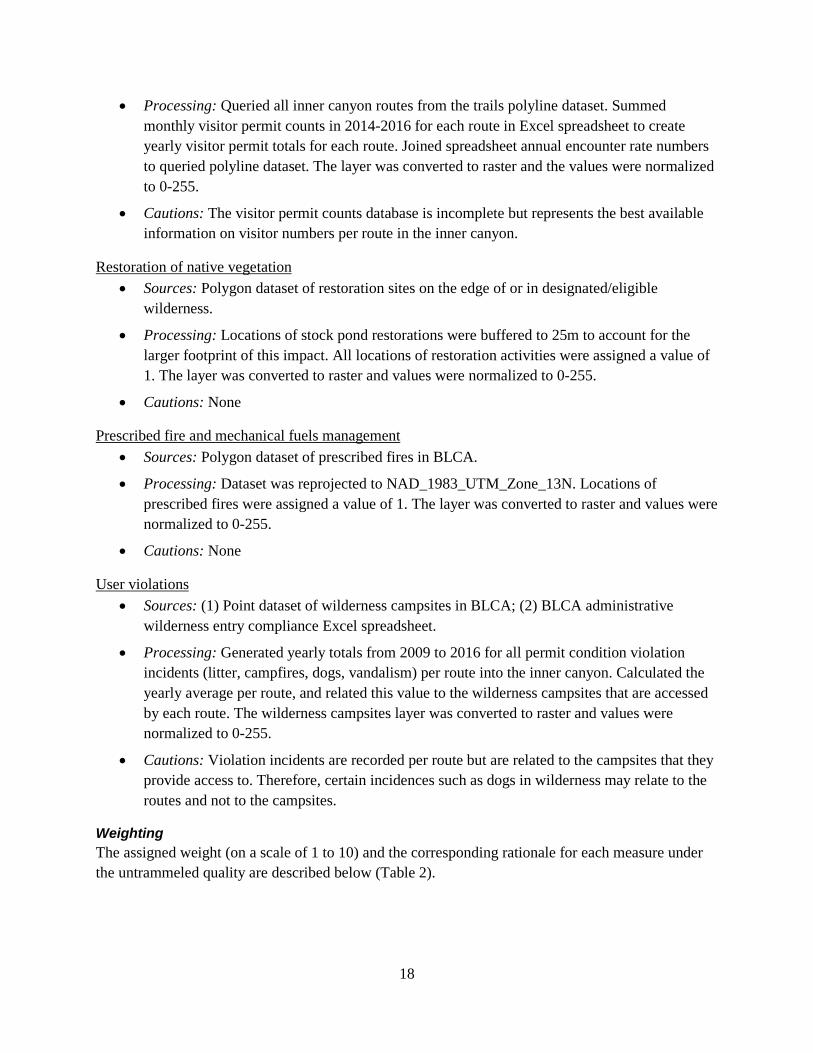
Weighting The assigned weight (on a scale of 1 to 10) and the corresponding rationale for each measure under the untrammeled quality are described below (Table 2).
19
Table 2. Measure weights and rationales for the untrammeled quality.
Indicator Measure Weight Rationale
Actions authorized by the federal land manager that intentionally manipulate the biophysical environment
Non-native invasive plant control/removal 7
Important to track how often and how much area is treated. Treatments are limited by accessibility and usually occur in corridors where invasive plants are easily spread.
Fire suppression 6 Important to know areas and impacts of fire suppression responses.
Inner canyon visitor use 5 This use has direct impacts on the inner
canyon environment.
Restoration of native vegetation 5 Few and small sites, but well documented and
monitored to understand impacts of actions.
Prescribed fire and mechanical fuels management
2 Small in number and area but could become more important management tools.
Actions not authorized by the federal land manager that intentionally manipulate the biophysical environment
User violations 8
Important to measure violation incidents to understand impacts of increased future use of these access routes into core areas. Data influenced by randomness of staff monitoring and reporting.
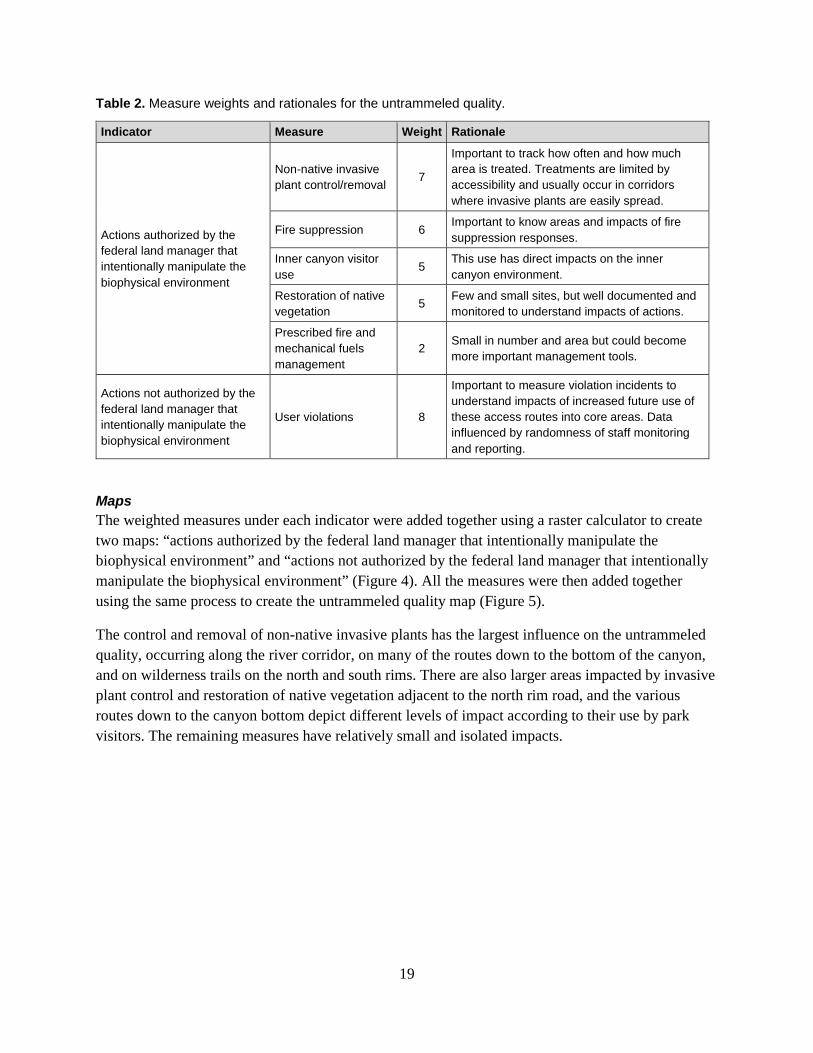
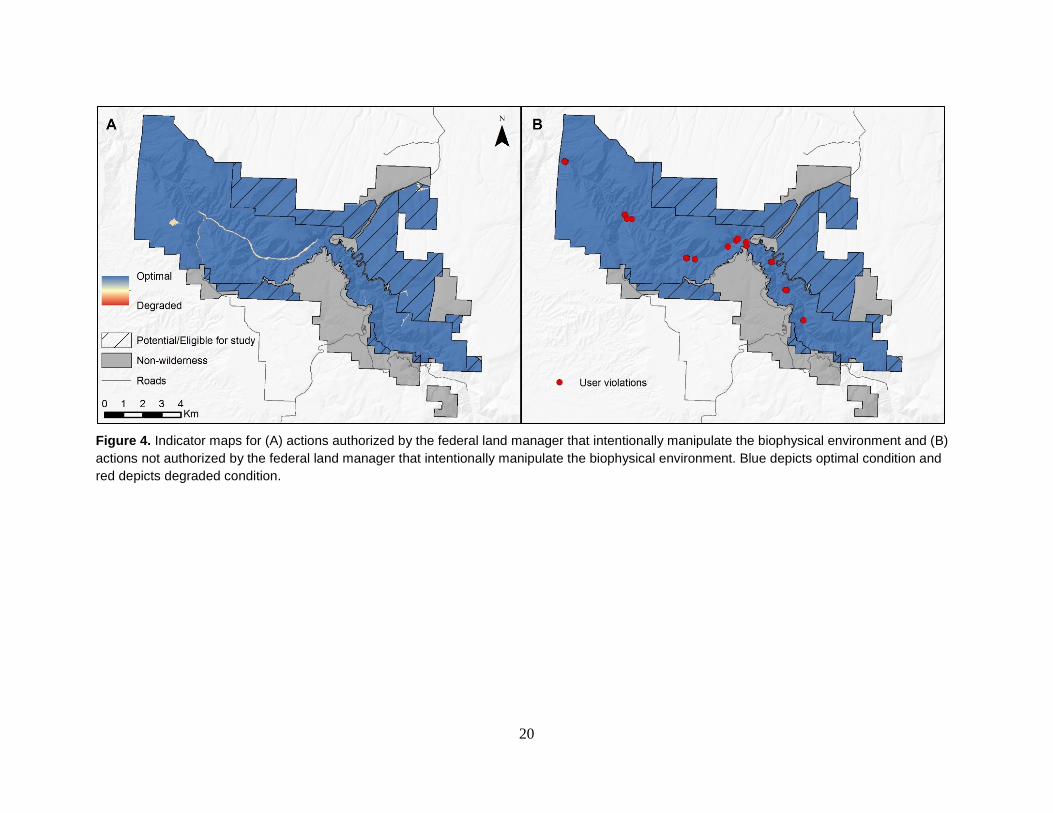
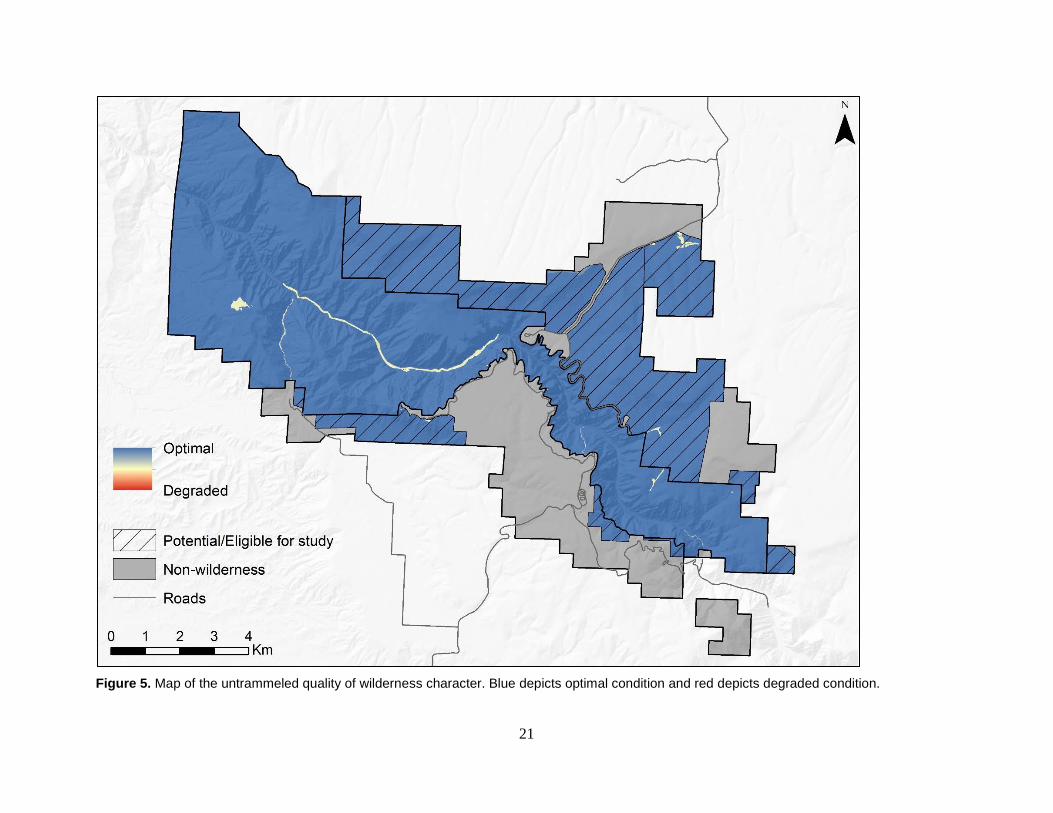
Maps The weighted measures under each indicator were added together using a raster calculator to create two maps: “actions authorized by the federal land manager that intentionally manipulate the biophysical environment” and “actions not authorized by the federal land manager that intentionally manipulate the biophysical environment” (Figure 4). All the measures were then added together using the same process to create the untrammeled quality map (Figure 5).
The control and removal of non-native invasive plants has the largest influence on the untrammeled quality, occurring along the river corridor, on many of the routes down to the bottom of the canyon, and on wilderness trails on the north and south rims. There are also larger areas impacted by invasive plant control and restoration of native vegetation adjacent to the north rim road, and the various routes down to the canyon bottom depict different levels of impact according to their use by park visitors. The remaining measures have relatively small and isolated impacts.
20
Figure 4. Indicator maps for (A) actions authorized by the federal land manager that intentionally manipulate the biophysical environment and (B) actions not authorized by the federal land manager that intentionally manipulate the biophysical environment. Blue depicts optimal condition and red depicts degraded condition.
21
Figure 5. Map of the untrammeled quality of wilderness character. Blue depicts optimal condition and red depicts degraded condition.
22
Natural Quality The natural quality centers on the idea that wilderness contains ecological systems that are substantially free from the effects of modern civilization. This quality is degraded by the intended or unintended effects of modern people on ecological systems inside wilderness (Landres et al. 2015).
Indicators and measures Keeping it Wild 2 delineates four indicators under the natural quality. The measures selected for the BLCA wilderness are described below for each of these indicators.
Indicator: Plants • Non-native invasive plants – Plant species that invade and actively compete with and
displace native plants. Populations of these species are monitored and mapped in areas where they are mostly likely to occur and spread, such as riparian corridors, roads, trails, areas of high human impact (e.g., campgrounds) and park boundaries. Invasive exotic plant species fragment native ecosystems, displace native plants and animals, and alter ecosystem function.
Indicator: Animals • Stocked fish – Trout species (principally rainbow and brown trout) are the principal fish
population in the Gunnison River within the BLCA wilderness. The State of Colorado stocks rainbow trout downstream of the park in the Gunnison Gorge and upstream between Crystal Dam and the Gunnison Tunnel diversion dam. These fish have replaced the native fish (Rocky Mountain cutthroat trout, and roundtail, flannel mouth and blue head suckers).
• Beetles – Piñon pine bark beetles (Ips confuses) are native insects that may become forest pests that cause negative impacts on forest health during poor climatic conditions (e.g., prolonged drought). Beetle impacts to tree health are monitored on select high value trees in 2 areas in and adjacent to the wilderness.
Indicator: Air and water • Departure from natural water flows – The metric for departure of the peak flow magnitude is
the change in frequency of the 9,700 cubic feet per second (cfs) peak flow. It was (prior to the construction of the Aspinall Unit) about 1 to 2 runoff seasons and is now about 1 in 7 runoff seasons. This approximate frequency is a result of the peak flows as determined by formula(s) in the 2008 Black Canyon decree for water. Also, hydrologically very rare high peak flows are curtailed by the Aspinall operations flood prevention criteria.
• Night sky darkness – Anthropogenic light ratio (ALR) across the wilderness. ALR is the proportion of artificial light compared to the brightness of the night sky (for example, an ALR of 0.3 indicates that it is 30% brighter than under natural conditions). The largest source of anthropogenic light near BLCA is the city of Montrose, located approximately 10 kilometers to the southwest of the park.
Indicator: Ecological processes • Grazing – The use of land to feed domestic livestock as authorized by a federal grazing
permit. The permit specifies the type of livestock permitted (e.g., cattle, sheep), amount of
23
use measured in AUMs (Animal Unit Month), season of use, and grazing period (number of days of use). Grazing impacts the composition and structure of native plant and wildlife communities, thus affecting ecosystem processes.
• Departure from fire return interval – The degree of departure from the historical fire regime across the wilderness. Fire regime patterns are fundamental ecosystem processes that play a critical role in determining vegetation composition and structure. Departure from the historical fire regime can cause significant changes in plant and animal communities. Humans have altered natural fire regimes over time through fire suppression, fuel management, timber harvest, etc.
Data gap measures Additional measures under this quality were identified by BLCA staff but were excluded for a variety of reasons. For each data gap measure, the indicator, description, and rationale for their dismissal are listed below.
Human-caused change in water quality • Indicator: Air and Water
• Description: Metric 1 is water temperature and construction of the Aspinall dams has resulted in a warmer (by about 2oC) winter discharge. This warmer discharge does not freeze and the river no longer has the natural winter-freeze, spring-thaw character. This also affects seasonal storage of organic matter and transport of dissolved organic carbon. The summer discharge is cooler by about 3 to 4oC which causes a general downstream migration of, and spatial compression of native fish habitat while favoring trout habitat. Metric 2 is concentration of sulfate, silica and nutrients. The park has limited data showing sulfate concentration is reduced in the Aspinall reservoirs in an upstream to downstream direction. This is also true of dissolved silica which is likely used in the construction of diatom (brown algae) shells. Upstream nutrients (nitrogen and phosphorus) are also diminished in concentration with travel through the reservoirs. This was the general condition in 1999 with the designation of the National Park and the inclusion of lands to the wilderness system.
• Rationale for Dismissal: Data describing Gunnison River water quality through the wilderness is collected only at one point, just upstream of the wilderness boundary. The data allowing interpretation of the upstream human impacts (the ones of quantitative importance to the river) were only first collected in the last half of the summer of 2016. Therefore, the park does not collect data at a spatial scale sufficient to quantify or state what affects this measure has had on the Gunnison River.
Data sources, processing, and cautions A wide variety of datasets were used to create the natural quality map. These datasets included both vector and raster data, were mostly of fine scale, had mostly high levels of accuracy, and had differing levels of completeness (Table 3). The data sources, data processing information, and cautions are listed below for each measure.
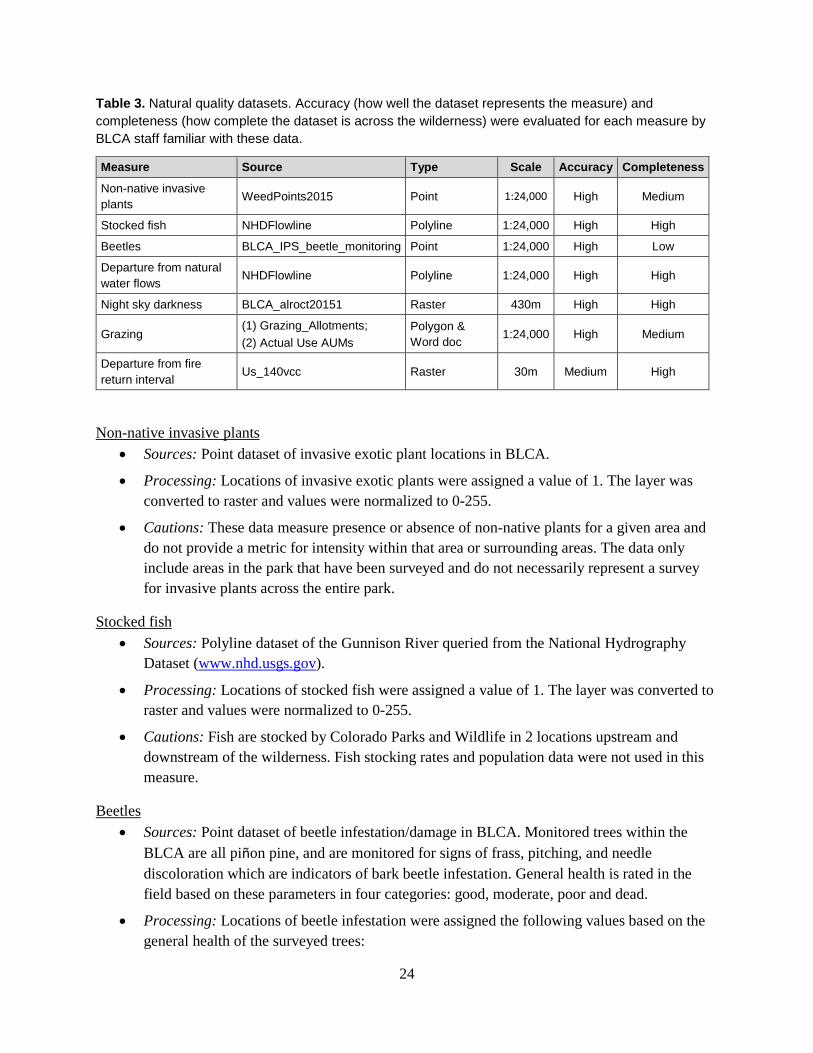
24
Table 3. Natural quality datasets. Accuracy (how well the dataset represents the measure) and completeness (how complete the dataset is across the wilderness) were evaluated for each measure by BLCA staff familiar with these data.
Measure Source Type Scale Accuracy Completeness Non-native invasive plants WeedPoints2015 Point 1:24,000 High Medium
Stocked fish NHDFlowline Polyline 1:24,000 High High
Beetles BLCA_IPS_beetle_monitoring Point 1:24,000 High Low
Departure from natural water flows NHDFlowline Polyline 1:24,000 High High
Night sky darkness BLCA_alroct20151 Raster 430m High High
Grazing (1) Grazing_Allotments; (2) Actual Use AUMs
Polygon & Word doc 1:24,000 High Medium
Departure from fire return interval Us_140vcc Raster 30m Medium High
Non-native invasive plants • Sources: Point dataset of invasive exotic plant locations in BLCA.
• Processing: Locations of invasive exotic plants were assigned a value of 1. The layer was converted to raster and values were normalized to 0-255.
• Cautions: These data measure presence or absence of non-native plants for a given area and do not provide a metric for intensity within that area or surrounding areas. The data only include areas in the park that have been surveyed and do not necessarily represent a survey for invasive plants across the entire park.
Stocked fish • Sources: Polyline dataset of the Gunnison River queried from the National Hydrography
Dataset (www.nhd.usgs.gov).
• Processing: Locations of stocked fish were assigned a value of 1. The layer was converted to raster and values were normalized to 0-255.
• Cautions: Fish are stocked by Colorado Parks and Wildlife in 2 locations upstream and downstream of the wilderness. Fish stocking rates and population data were not used in this measure.
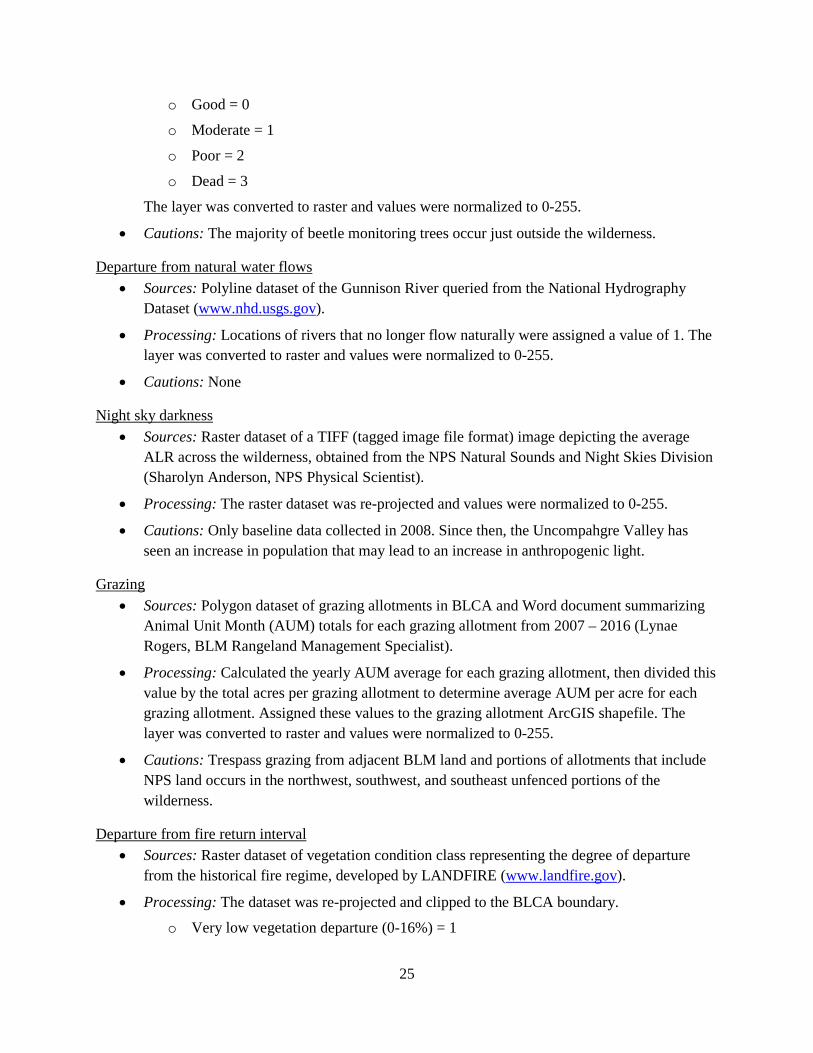
Beetles • Sources: Point dataset of beetle infestation/damage in BLCA. Monitored trees within the
BLCA are all piñon pine, and are monitored for signs of frass, pitching, and needle discoloration which are indicators of bark beetle infestation. General health is rated in the field based on these parameters in four categories: good, moderate, poor and dead.
• Processing: Locations of beetle infestation were assigned the following values based on the general health of the surveyed trees:
25
o Good = 0
o Moderate = 1
o Poor = 2
o Dead = 3
The layer was converted to raster and values were normalized to 0-255.
• Cautions: The majority of beetle monitoring trees occur just outside the wilderness.
Departure from natural water flows • Sources: Polyline dataset of the Gunnison River queried from the National Hydrography
Dataset (www.nhd.usgs.gov).
• Processing: Locations of rivers that no longer flow naturally were assigned a value of 1. The layer was converted to raster and values were normalized to 0-255.
• Cautions: None
Night sky darkness • Sources: Raster dataset of a TIFF (tagged image file format) image depicting the average
ALR across the wilderness, obtained from the NPS Natural Sounds and Night Skies Division (Sharolyn Anderson, NPS Physical Scientist).
• Processing: The raster dataset was re-projected and values were normalized to 0-255.
• Cautions: Only baseline data collected in 2008. Since then, the Uncompahgre Valley has seen an increase in population that may lead to an increase in anthropogenic light.
Grazing • Sources: Polygon dataset of grazing allotments in BLCA and Word document summarizing
Animal Unit Month (AUM) totals for each grazing allotment from 2007 – 2016 (Lynae Rogers, BLM Rangeland Management Specialist).
• Processing: Calculated the yearly AUM average for each grazing allotment, then divided this value by the total acres per grazing allotment to determine average AUM per acre for each grazing allotment. Assigned these values to the grazing allotment ArcGIS shapefile. The layer was converted to raster and values were normalized to 0-255.
• Cautions: Trespass grazing from adjacent BLM land and portions of allotments that include NPS land occurs in the northwest, southwest, and southeast unfenced portions of the wilderness.
Departure from fire return interval • Sources: Raster dataset of vegetation condition class representing the degree of departure
from the historical fire regime, developed by LANDFIRE (www.landfire.gov).
• Processing: The dataset was re-projected and clipped to the BLCA boundary.
o Very low vegetation departure (0-16%) = 1
26
o Low to moderate vegetation departure (17-33%) = 2
o Moderate to low vegetation departure (34-50%) = 3
o Moderate to high vegetation departure (51-66%) = 4
o High vegetation departure (67-83%) = 5
o Very high vegetation departure (84-100%) = 6
Values were then normalized to 0-255.
• Cautions: None
Weighting The assigned weight (on a scale of 1 to 10) and the corresponding rationale for each measure under the natural quality are described below (Table 4).
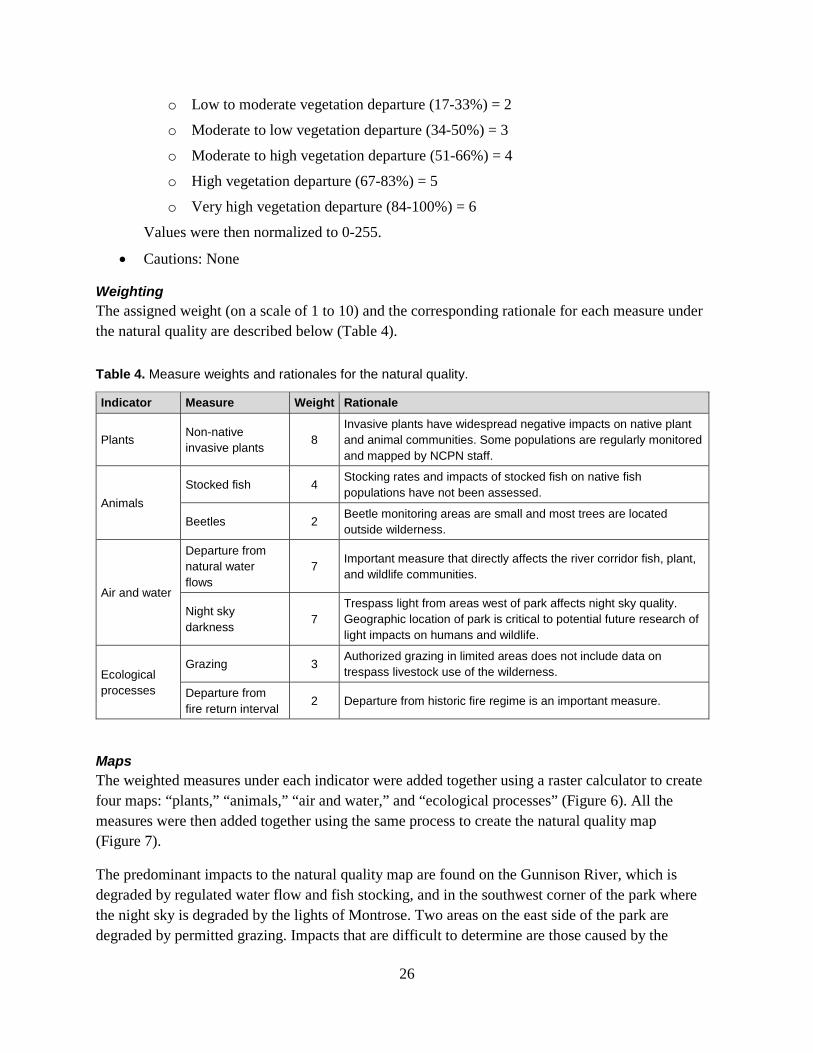
Table 4. Measure weights and rationales for the natural quality.
Indicator Measure Weight Rationale
Plants Non-native invasive plants 8
Invasive plants have widespread negative impacts on native plant and animal communities. Some populations are regularly monitored and mapped by NCPN staff.
Animals Stocked fish 4 Stocking rates and impacts of stocked fish on native fish
populations have not been assessed.
Beetles 2 Beetle monitoring areas are small and most trees are located outside wilderness.
Air and water
Departure from natural water flows
7 Important measure that directly affects the river corridor fish, plant, and wildlife communities.
Night sky darkness 7
Trespass light from areas west of park affects night sky quality. Geographic location of park is critical to potential future research of light impacts on humans and wildlife.
Ecological processes
Grazing 3 Authorized grazing in limited areas does not include data on trespass livestock use of the wilderness.
Departure from fire return interval 2 Departure from historic fire regime is an important measure.
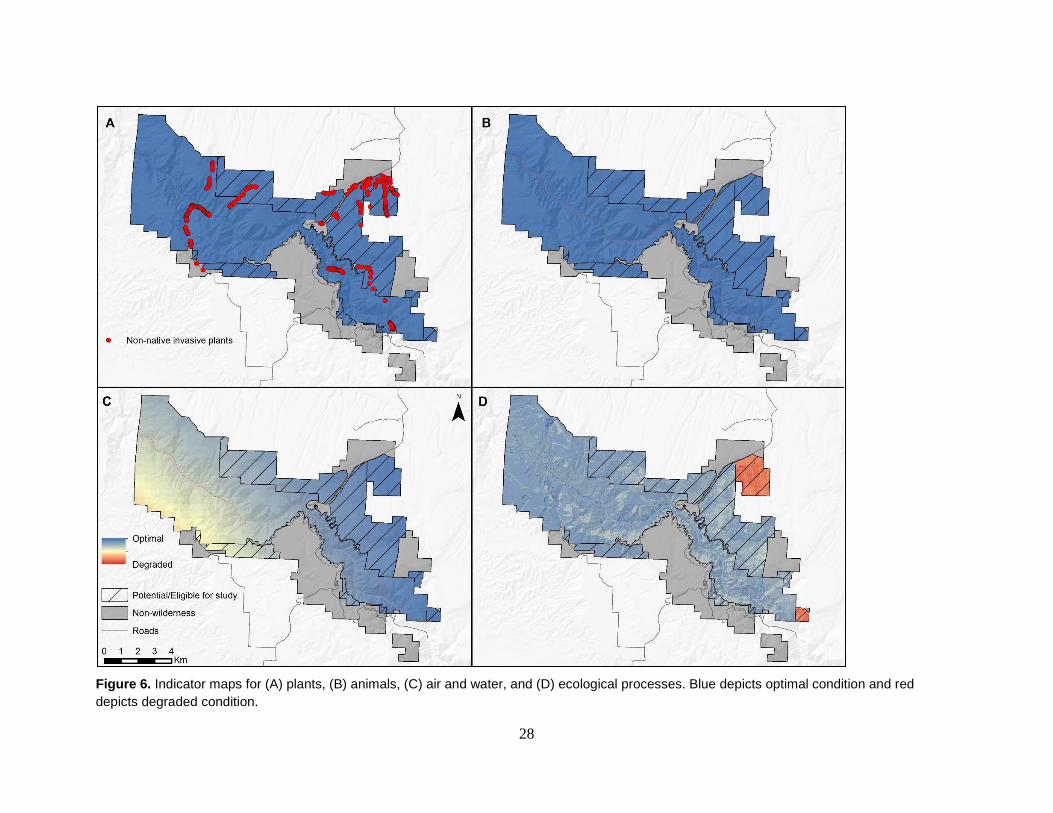
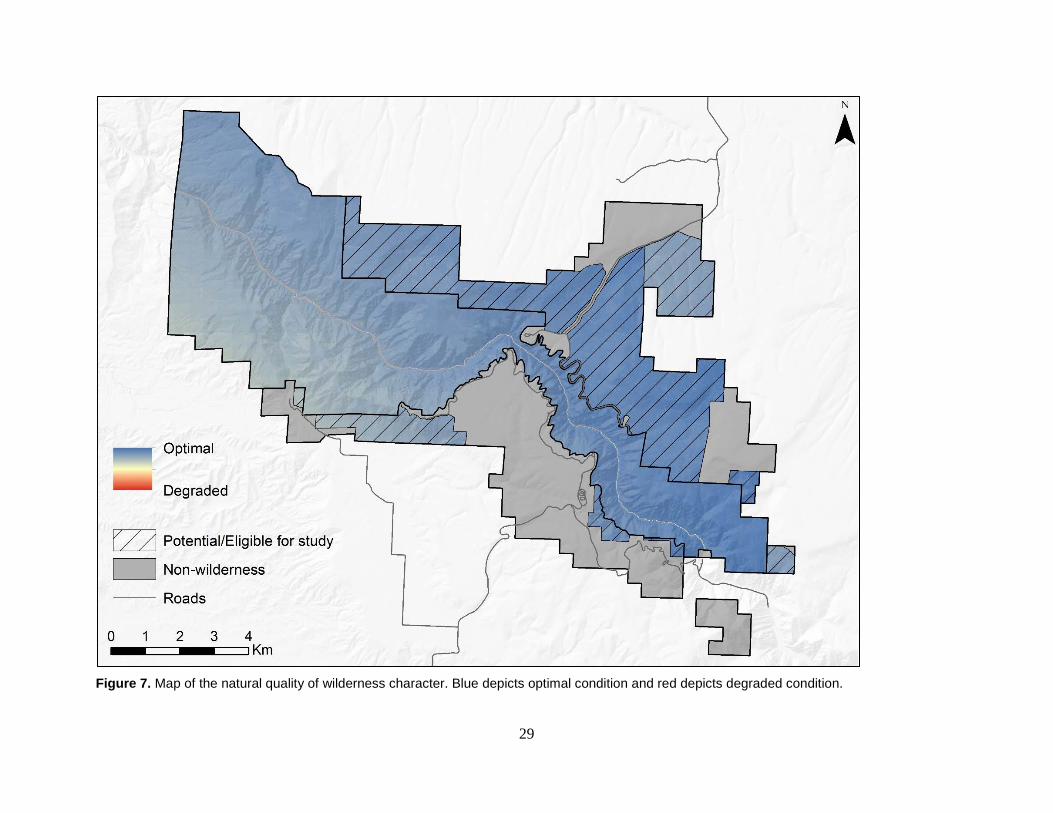
Maps The weighted measures under each indicator were added together using a raster calculator to create four maps: “plants,” “animals,” “air and water,” and “ecological processes” (Figure 6). All the measures were then added together using the same process to create the natural quality map (Figure 7).
The predominant impacts to the natural quality map are found on the Gunnison River, which is degraded by regulated water flow and fish stocking, and in the southwest corner of the park where the night sky is degraded by the lights of Montrose. Two areas on the east side of the park are degraded by permitted grazing. Impacts that are difficult to determine are those caused by the

27
numerous locations of non-native invasive plants, which occur predominantly in the northeast corner of the park near or in grazed areas, on hiking routes and trails, and along the river corridor.
28
Figure 6. Indicator maps for (A) plants, (B) animals, (C) air and water, and (D) ecological processes. Blue depicts optimal condition and red depicts degraded condition.
29
Figure 7. Map of the natural quality of wilderness character. Blue depicts optimal condition and red depicts degraded condition.
30
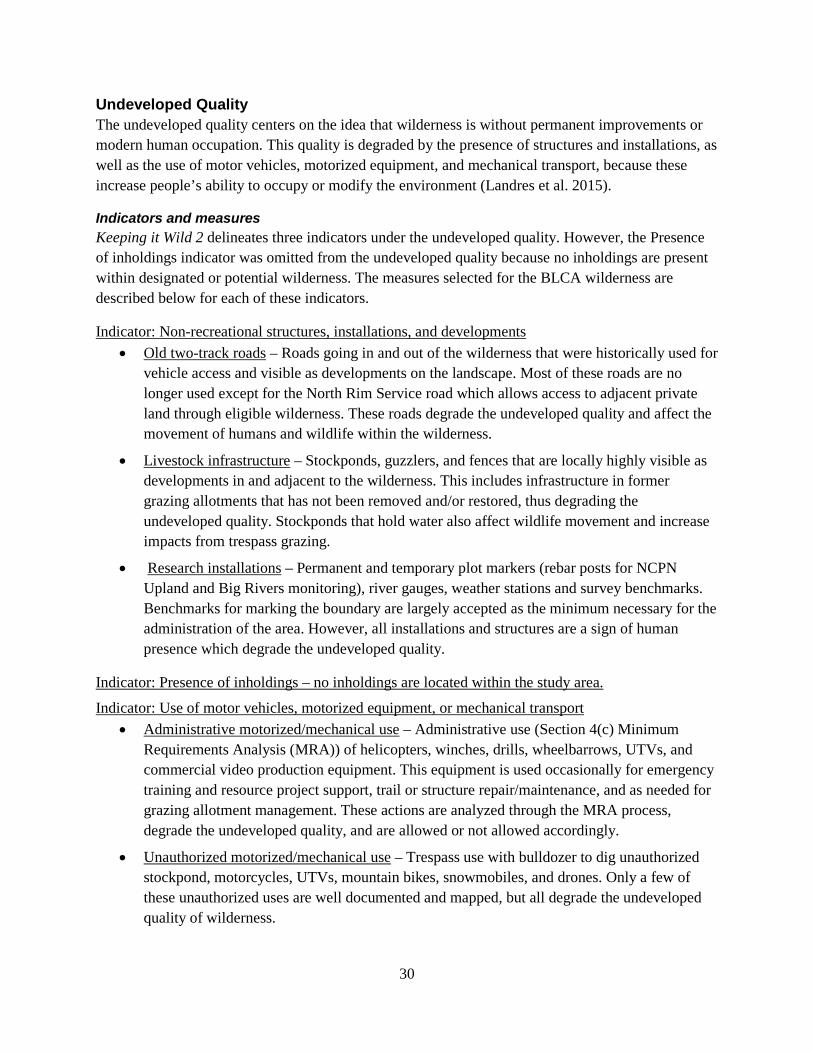
Undeveloped Quality The undeveloped quality centers on the idea that wilderness is without permanent improvements or modern human occupation. This quality is degraded by the presence of structures and installations, as well as the use of motor vehicles, motorized equipment, and mechanical transport, because these increase people’s ability to occupy or modify the environment (Landres et al. 2015).
Indicators and measures Keeping it Wild 2 delineates three indicators under the undeveloped quality. However, the Presence of inholdings indicator was omitted from the undeveloped quality because no inholdings are present within designated or potential wilderness. The measures selected for the BLCA wilderness are described below for each of these indicators.
Indicator: Non-recreational structures, installations, and developments • Old two-track roads – Roads going in and out of the wilderness that were historically used for
vehicle access and visible as developments on the landscape. Most of these roads are no longer used except for the North Rim Service road which allows access to adjacent private land through eligible wilderness. These roads degrade the undeveloped quality and affect the movement of humans and wildlife within the wilderness.
• Livestock infrastructure – Stockponds, guzzlers, and fences that are locally highly visible as developments in and adjacent to the wilderness. This includes infrastructure in former grazing allotments that has not been removed and/or restored, thus degrading the undeveloped quality. Stockponds that hold water also affect wildlife movement and increase impacts from trespass grazing.
• Research installations – Permanent and temporary plot markers (rebar posts for NCPN Upland and Big Rivers monitoring), river gauges, weather stations and survey benchmarks. Benchmarks for marking the boundary are largely accepted as the minimum necessary for the administration of the area. However, all installations and structures are a sign of human presence which degrade the undeveloped quality.
Indicator: Presence of inholdings – no inholdings are located within the study area.
Indicator: Use of motor vehicles, motorized equipment, or mechanical transport • Administrative motorized/mechanical use – Administrative use (Section 4(c) Minimum
Requirements Analysis (MRA)) of helicopters, winches, drills, wheelbarrows, UTVs, and commercial video production equipment. This equipment is used occasionally for emergency training and resource project support, trail or structure repair/maintenance, and as needed for grazing allotment management. These actions are analyzed through the MRA process, degrade the undeveloped quality, and are allowed or not allowed accordingly.
• Unauthorized motorized/mechanical use – Trespass use with bulldozer to dig unauthorized stockpond, motorcycles, UTVs, mountain bikes, snowmobiles, and drones. Only a few of these unauthorized uses are well documented and mapped, but all degrade the undeveloped quality of wilderness.
31
• Emergency motorized/mechanical use – Administrative use of helicopters, winches, wheeled litters, drills, vehicles, and/or other equipment in response to medical, search and rescue/recovery, fire or other emergencies. The park makes decisions on these actions according to the emergency situation.
Data sources, processing, and cautions The datasets used to create the undeveloped quality map are all vector data, of fine scale, and mostly of high accuracy and completeness (Table 5). The data sources, data processing information, and cautions are listed below for each measure.
Table 5. Undeveloped quality datasets. Accuracy (how well the dataset represents the measure) and completeness (how complete the dataset is across the wilderness) were evaluated for each measure by BLCA staff familiar with these data.
Measure Source Type Scale Accuracy Completeness
Old two-track roads (1) S_Rim_2_tracks; (2) N_Rim_2_tracks
Polyline 1:24,000 High High
Livestock infrastructure (1) Fences; (2) pond_and_guzzlers
Polyline & point 1:24,000 High Medium
Research installations (1) BLCA_BigRivers_Jan2017; (2) BLCU_UplandPlots_Jan2017; (3) weather_stations
Point 1:24,000 High High
Administrative motorized/ mechanical use
BLCA_MotorizedImpacts Point 1:24,000 High High
Unauthorized motorized/ mechanical use
(1) Vehicle_Trespass; (2) Dozer_Trespass
Polyline 1:24,000 High Medium
Emergency motorized/ mechanical use
BLCA_MotorizedImpacts Point 1:24,000 High High
Old two-track roads • Sources: Polyline datasets of old two-track roads in BLCA
• Processing: Re-projected both datasets and combined them together to create a single layer. The locations of old two track roads were assigned a value of 1. The layer was converted to raster and values were normalized to 0-255.
• Cautions: None
Livestock infrastructure • Sources: Polyline dataset of fences and point dataset of livestock ponds and guzzlers in
BLCA.
• Processing: The locations of livestock infrastructure were assigned a value of 1. The layers were converted to raster, added together, and values were normalized to 0-255.
32
• Cautions: Applied small adjustments to the locations of fence lines so they fell within the BLCA boundary when converted to raster.
Research installations • Sources: Point datasets of research installations in BLCA (Aneth Wight, NCPN Cartographic
Technician).
• Processing: Assigned the following values to the different types of research installations
o vegetation monitoring installations = 1
o weather stations = 10
The layers were converted to raster, added together, and values were normalized to 0-255.
• Cautions: The weather stations are located just outside the wilderness boundary.
Administrative motorized/mechanical use • Sources: Point dataset of motorized/mechanical use in BLCA.
• Processing: Removed all emergency motorized use. The locations of administrative and non-emergency motorized use were assigned a value of 1. The layer was converted to raster and values were normalized to 0-255.
• Cautions: Wilderness entry form initiated in 2009, but data not collected each year by all staff. To date, motorized/mechanical administrative use (e.g., use associated with grazing and trail maintenance) is not well documented as it occurs.
Unauthorized motorized/mechanical use • Sources: Polyline dataset of unauthorized motorized/mechanical use in BLCA.
• Processing: The locations of unauthorized motorized/mechanical use were assigned a value of 1. The layers were converted to raster, added together, and values were normalized to 0-255.
• Cautions: Not all unauthorized use is well-documented and UTV trespass info from June 2017 not included in data.
Emergency motorized/mechanical use • Sources: Point dataset of motorized/mechanical use in BLCA.
• Processing: Removed all administrative and non-emergency motorized/mechanical use. The locations of emergency motorized use were assigned a value of 1. The layer was converted to raster and values were normalized to 0-255.
• Cautions: None
Weighting The assigned weight (on a scale of 1 to 10) and the corresponding rationale for each measure under the undeveloped quality are described below (Table 6).
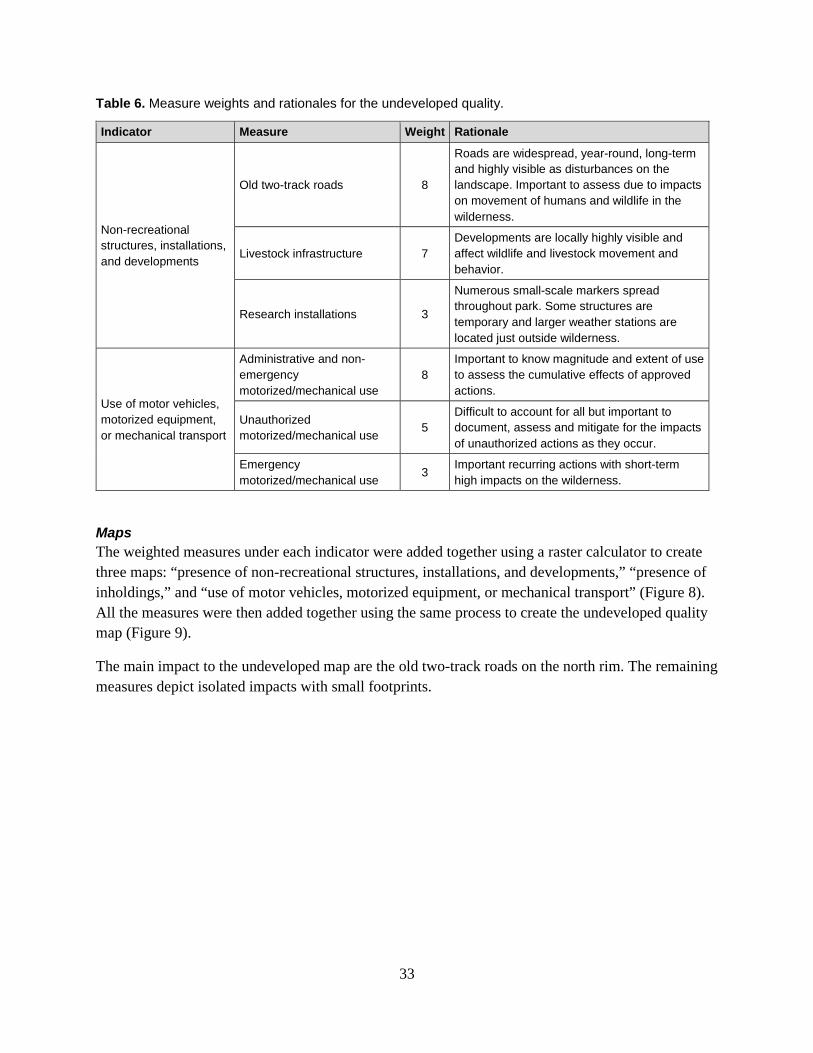
33
Table 6. Measure weights and rationales for the undeveloped quality.
Indicator Measure Weight Rationale
Non-recreational structures, installations, and developments
Old two-track roads 8
Roads are widespread, year-round, long-term and highly visible as disturbances on the landscape. Important to assess due to impacts on movement of humans and wildlife in the wilderness.
Livestock infrastructure 7 Developments are locally highly visible and affect wildlife and livestock movement and behavior.
Research installations 3
Numerous small-scale markers spread throughout park. Some structures are temporary and larger weather stations are located just outside wilderness.
Use of motor vehicles, motorized equipment, or mechanical transport
Administrative and non-emergency motorized/mechanical use
8 Important to know magnitude and extent of use to assess the cumulative effects of approved actions.
Unauthorized motorized/mechanical use 5
Difficult to account for all but important to document, assess and mitigate for the impacts of unauthorized actions as they occur.
Emergency motorized/mechanical use 3 Important recurring actions with short-term
high impacts on the wilderness.
Maps The weighted measures under each indicator were added together using a raster calculator to create three maps: “presence of non-recreational structures, installations, and developments,” “presence of inholdings,” and “use of motor vehicles, motorized equipment, or mechanical transport” (Figure 8). All the measures were then added together using the same process to create the undeveloped quality map (Figure 9).
The main impact to the undeveloped map are the old two-track roads on the north rim. The remaining measures depict isolated impacts with small footprints.
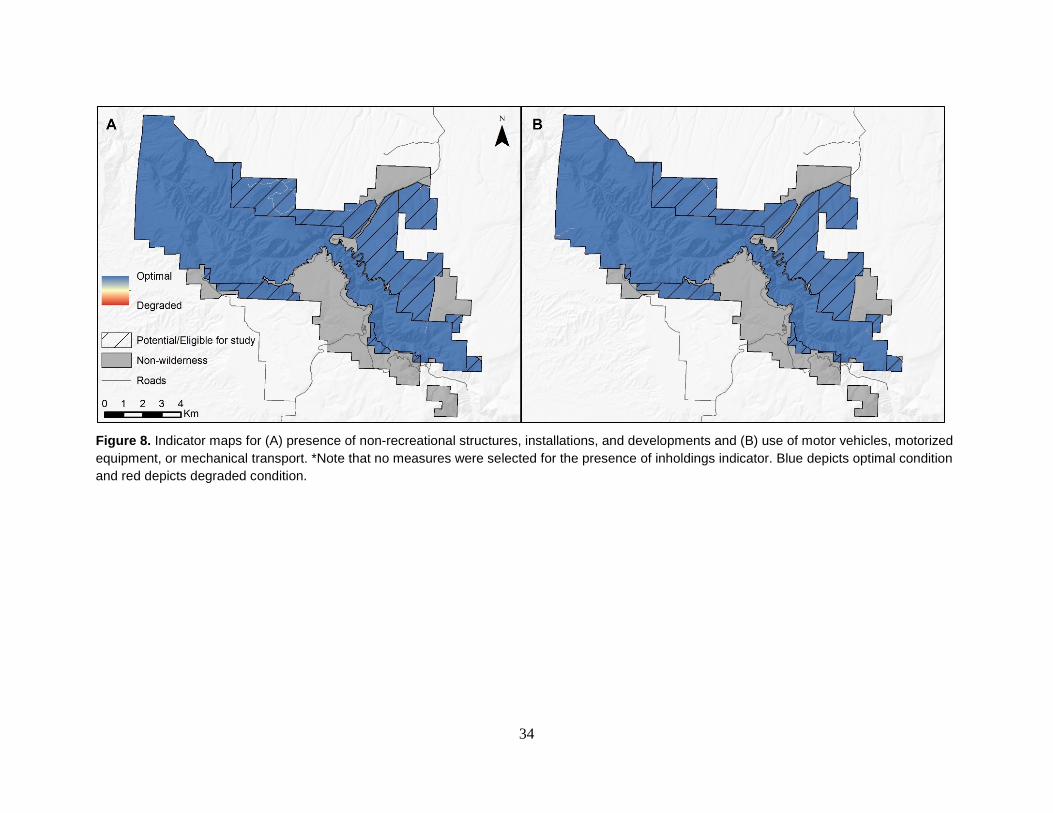
34
Figure 8. Indicator maps for (A) presence of non-recreational structures, installations, and developments and (B) use of motor vehicles, motorized equipment, or mechanical transport. *Note that no measures were selected for the presence of inholdings indicator. Blue depicts optimal condition and red depicts degraded condition.
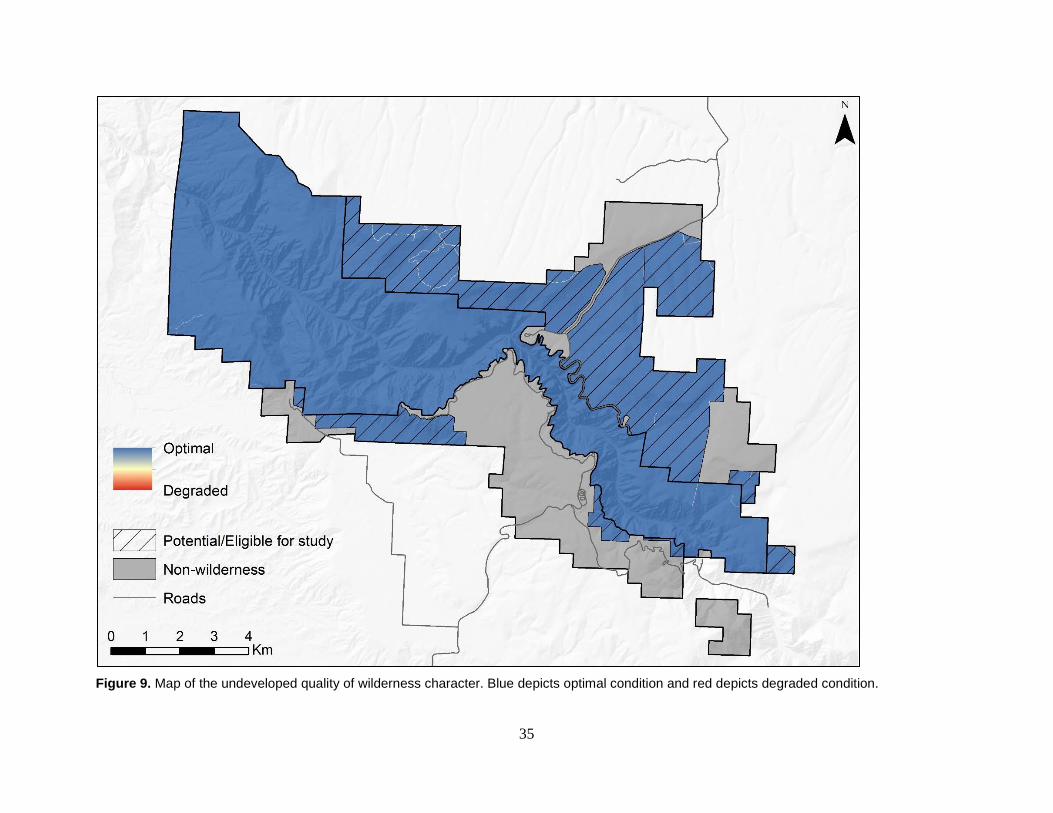
35
Figure 9. Map of the undeveloped quality of wilderness character. Blue depicts optimal condition and red depicts degraded condition.
36
Solitude or Primitive and Unconfined Recreation Quality The solitude or primitive and unconfined recreation quality focuses on the outstanding opportunities that exist in wilderness to experience solitude, remoteness, and primitive recreation free from the constraints of modern society. This quality is degraded by tangible attributes of the setting that reduce these opportunities, such as visitor encounters, signs of modern civilization, recreation facilities, and management restriction on visitor behavior (Landres et al. 2015).
Indicators and measures Keeping it Wild 2 delineates four indicators under the solitude or primitive and unconfined recreation quality. The measures selected for the BLCA wilderness are described below for each of these indicators.
Indicator: Remoteness from sights and sounds of people inside the wilderness • Encounter rates on canyon routes – The number of encounters with individuals from other
parties on canyon routes. A measure of the level of human presence degrading the opportunity for solitude or primitive and unconfined recreation.
• Viewshed impacts from features inside the park boundary – Line of sight impacts of modern human features inside BLCA. The presence of human features detracts from a sense of solitude. Viewshed analyses depict the line of sight impacts of modern human features within the park boundary, as determined by their visibility and size.
Indicator: Remoteness from occupied and modified areas outside the wilderness • Soundscape – Georeferenced maps of expected environmental sound levels across the United
States. These maps were generated from Random Forest models (Breiman 2001) that investigated relationships between long term measurements of the ambient sound pressure level and non-acoustic geospatial features such as topography, climate, hydrology, and anthropogenic activity. These models were used to project expected sound levels under existing conditions and a natural scenario on landscape scales. The existing sound pressure level is the condition as measured; it includes all acoustic energy. A natural level was estimated by systematically minimizing contributions from all anthropogenic model inputs, leaving only biotic and abiotic sources of sound. The impact level is defined as the difference between the existing and natural sound pressure levels; this is most informative on local scales, like within park boundaries. The L50 is the sound pressure level exceeded half of the time and A-weighting is an adjustment that reflects how the human ear perceives sound. All conditions are predicted for a typical summer daytime hour.
• Viewshed impacts from features outside the park boundary – Line of sight impacts from modern human features outside of BLCA. Features of modern civilization located outside the park can be visible from inside the area and have an effect on visitor solitude. The viewshed analysis for this measure depicted the areas within wilderness where it is possible to observe modern features on the other side of the boundary; the line of sight distance for each feature was determined by its size and visibility.
37
Indicator: Facilities that decrease self-reliant recreation • Recreational facilities – Facilities include toilets, campsites, food storage cable, and
Gunnison route chain. These facilities concentrate use, provide ease-of-use, and are permanent signs of human presence, affecting solitude, remoteness, and self-reliance.
• Climbing infrastructure – Infrastructure includes bolts, belay stations, and Tyrolian rope that are permanent signs of human presence on climbing routes. These structures concentrate use by providing for ease-of-use and safety, degrading a sense of solitude and self-reliance.
• Trails, routes and social trailing – This measure accounts for hiking trails that are developed and maintained to established trail class standards (Class 3), undeveloped, unmaintained, steep routes along drainages from the canyon rim to the canyon bottom, and visitor-created, unofficial social trails that are commonly found at the top of climbing routes and at the bottom of the canyon along the river for climber or angler access. All of these concentrate and direct visitor use and degrade the opportunity for solitude and unconfined recreation.
Indicator: Management restrictions on visitor behavior • Visitor access and use restrictions – Agency restrictions include the number of wilderness
permits issued to visitors each day per route, group size and camping capacity levels per route, permit reservation via lottery for Red Rock Canyon access, no open fires, and no pets. Restrictions vary according to zones of use with the uplands least restrictive (no wilderness permit required to access) and Red Rock Canyon the most restrictive with the reservation via lottery system in place to acquire a permit. Although limiting the number of visitors using routes into the wilderness each day is intended to provide for solitude for wilderness users, these and other restrictions constrain recreation and the freedom of movement overall, therefore degrading the opportunity for primitive and unconfined recreation.
• Climbing restrictions – Specific climbing areas are closed to use during important nesting and brood-rearing seasons to limit disturbance to protected wildlife species. Currently, Painted Wall is closed to climbing in spring and early summer for peregrine falcon nesting and brood-rearing. Restrictions like these may concentrate use in other areas and degrade the opportunity for solitude, remoteness, and unconfined recreation.
Data gap measures Additional measures under this quality were identified by BLCA staff but were excluded for a variety of reasons. For each data gap measure, the indicator, description, and rationale for their dismissal are listed below.
Presence of human waste/toilet paper/litter • Indicator: Remoteness from sights and sounds of people inside wilderness.
• Description: Human waste and the associated toilet paper/litter is a sign of human presence that degrades the opportunity for solitude and remoteness in the wilderness. The increased presence of this type of litter would lead to requirements that visitors use waste disposal bags and pack out all waste. This issue has become a large problem in some wilderness areas that have recently seen large increases in visitor use.
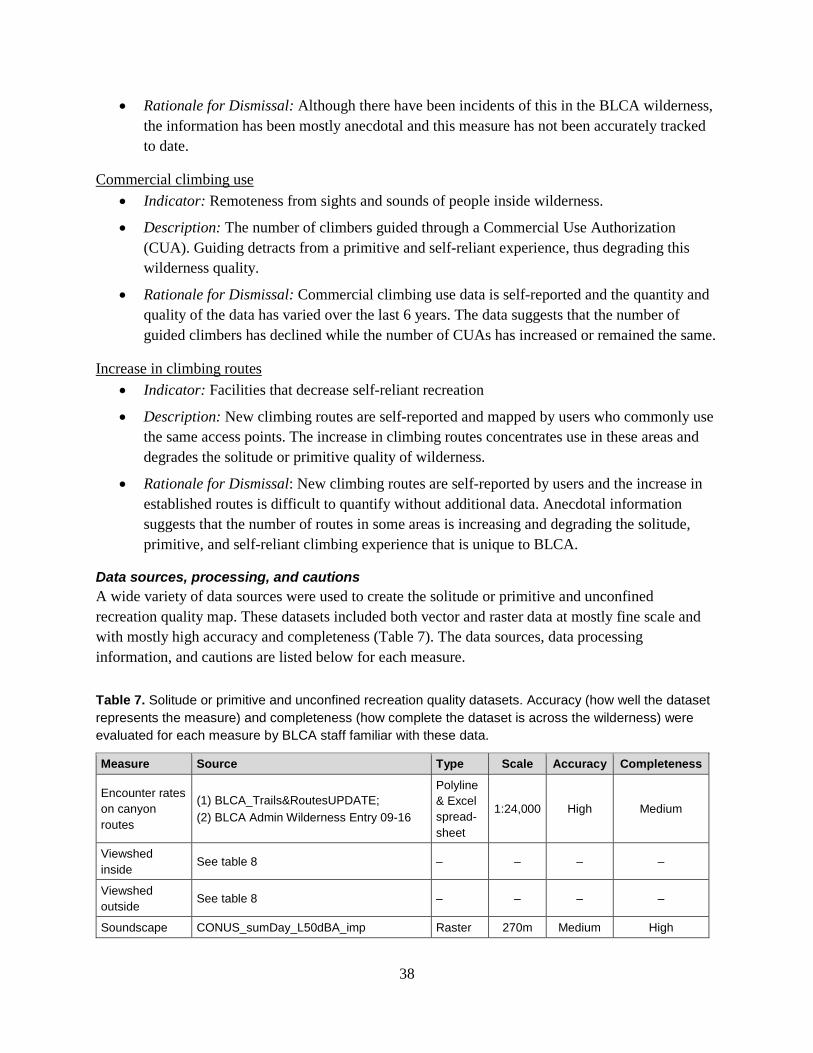
38
• Rationale for Dismissal: Although there have been incidents of this in the BLCA wilderness, the information has been mostly anecdotal and this measure has not been accurately tracked to date.
Commercial climbing use • Indicator: Remoteness from sights and sounds of people inside wilderness.
• Description: The number of climbers guided through a Commercial Use Authorization (CUA). Guiding detracts from a primitive and self-reliant experience, thus degrading this wilderness quality.
• Rationale for Dismissal: Commercial climbing use data is self-reported and the quantity and quality of the data has varied over the last 6 years. The data suggests that the number of guided climbers has declined while the number of CUAs has increased or remained the same.
Increase in climbing routes • Indicator: Facilities that decrease self-reliant recreation
• Description: New climbing routes are self-reported and mapped by users who commonly use the same access points. The increase in climbing routes concentrates use in these areas and degrades the solitude or primitive quality of wilderness.
• Rationale for Dismissal: New climbing routes are self-reported by users and the increase in established routes is difficult to quantify without additional data. Anecdotal information suggests that the number of routes in some areas is increasing and degrading the solitude, primitive, and self-reliant climbing experience that is unique to BLCA.
Data sources, processing, and cautions A wide variety of data sources were used to create the solitude or primitive and unconfined recreation quality map. These datasets included both vector and raster data at mostly fine scale and with mostly high accuracy and completeness (Table 7). The data sources, data processing information, and cautions are listed below for each measure.
Table 7. Solitude or primitive and unconfined recreation quality datasets. Accuracy (how well the dataset represents the measure) and completeness (how complete the dataset is across the wilderness) were evaluated for each measure by BLCA staff familiar with these data.
Measure Source Type Scale Accuracy Completeness
Encounter rates on canyon routes
(1) BLCA_Trails&RoutesUPDATE; (2) BLCA Admin Wilderness Entry 09-16
Polyline & Excel spread-sheet
1:24,000 High Medium
Viewshed inside See table 8 – – – –
Viewshed outside See table 8 – – – –
Soundscape CONUS_sumDay_L50dBA_imp Raster 270m Medium High
39
Table 7 (continued). Solitude or primitive and unconfined recreation quality datasets. Accuracy (how well the dataset represents the measure) and completeness (how complete the dataset is across the wilderness) were evaluated for each measure by BLCA staff familiar with these data.
Measure Source Type Scale Accuracy Completeness
Recreational facilities
(1) BLCA_WildernessCampsites; (2) FAC-Toilets; (3) Black_Canyon_Of_The_Gunnison_National_Park_and_Curecanti_National_Recreation_Area__Overlooks; (4) BLCA_ClimbingInfrastructure_Points
Point 1:24,000 High High
Trails, routes, and social trailing
(1) BLCA_Trails&RoutesUPDATE; (2) BLCA_SocialTrials
Polyline 1:24,000 High High
Climbing infrastructure
(1) BLCA_ClimbingInfrastructure_Points; (2) BLCA_ClimbingInfrastructure_Lines
Point & polyline 1:24,000 High High
Visitor restrictions BLCA_ManagementRestrictions Polygon 1:24,000 High High
Climbing restrictions Peregrine_closure Polygon 1:24,000 High High
Viewshed inside wilderness and Viewshed outside wilderness The line of sight visual impacts of modern anthropogenic features inside and outside the BLCA were modeled using a custom-built software tool. This tool analyzed a variety of inputs—including terrain, land cover, road networks, and all modern human developments occurring in and around the wilderness—to delineate the impacts of modern human features on visitor solitude. To account for edge effects9 from visible human features immediately outside the wilderness boundary, the viewshed analysis was extended into a 5-kilometer (km) buffer zone around the wilderness.
Viewshed analyses such as these have traditionally been extremely costly in terms of computer processing time. Detailed analyses can take weeks, months, or even years to process depending on the number of anthropogenic features in the database. Previous work on the effects of human features on perceptions of wilderness, carried out at national and global scales, has focused on simple distance measures (Lesslie 1993, Carver 1996, Sanderson et al. 2002). Recent improvements to viewshed modelling algorithms have utilized measures of the visibility of anthropogenic features in 3D landscapes using digital terrain models10 (Fritz et al. 2000, Carver and Wrightham 2003). These algorithms calculate the line of sight between a person standing anywhere on a landscape and a
9 A problem created during spatial analysis when patterns of interaction or interdependency across borders of the bounded region are ignored or distorted (ESRI 2015).
10 Digital terrain models are 3D representations of the earth’s surface that contain elevation data.
40
particular feature (e.g. a building or radio antennae), and account for places where this line of sight is interrupted by intervening higher ground.
Incorporating these improvements, Washtell (2007) has shown that it is possible to both dramatically decrease processing times and improve overall accuracy through judicious use of a voxel-based landscape model11 and a highly optimized ray-casting algorithm. This algorithm, which is similar to those used in real-time rendering applications and in some computer games, was designed to perform hundreds of traditional point viewshed operations per second. By integrating this approach into a custom-built software tool that has been designed to work directly with GIS data, it is possible to estimate the visibility between every pair of cells in a high-resolution landscape model utilizing only moderate computing resources. With this approach (called a “viewshed transform”) an inverse square distance function is used in calculating the significance of visible cells. Put simply, this tool determines the relative viewshed value for each cell by calculating the proportion of the features that can be seen and the distance between the cell and the particular features. Thus, the smaller the proportion of the feature in view and the further away it is, the lower the viewshed value for the particular cell. The greater the proportion of the feature in view and the closer it is, the higher the viewshed value of the particular cell.
In summary, the approach described above represents a maturation of traditional cumulative viewshed techniques (Carver et al. 2008) and is used to:
1. Calculate the viewshed for every single feature.
2. Incorporate estimations of the proportional area of each feature that is visible.
3. Run separate viewshed calculations for categories of features with different viewshed distances, which can then be combined together to create overall viewshed maps.
Sources: The viewshed transform tool was used to conduct the viewshed analyses for modern human features inside and outside the BLCA wilderness. Viewshed analyses rely on the ability to calculate the line of sight from one point on a landscape to another. It has been shown that the accuracy of a viewshed analysis produced in GIS is strongly dependent on the accuracy of the terrain model used and the inclusion of intervening features or “terrain clutter” (Fisher 1993). While previous studies have made use of a digital surface model (DSM)12 for obtaining terrain clutter data (Carver et al. 2008), the large spatial extent of the BLCA and the relative lack of anthropogenic features allows feature information to be collated and formatted manually. A resolution of 10m for feature inputs was considered adequate for this analysis. The USGS 10m Digital Elevation Model (DEM) was used to provide the base terrain elevation data. The DEM was then augmented with surface data, including both land cover data and anthropogenic features. The land cover layer was created by assigning
11 A voxel is a volumetric pixel.
12 Digital surface models are a type of terrain model that include objects on the surface of the earth, such as buildings, vegetation, or other features.
41
heights to the different classes in the (1) Northern Colorado Plateau Network Inventory and Monitoring Program (NCPN) vegetation map, and (2) LANDFIRE (2017) vegetation height database13. Modern anthropogenic features in and adjacent to the BLCA wilderness were identified by the project team; viewshed distance and height information were then assigned for each feature (Table 8).
Processing: Two data inputs are required for the viewshed model: (1) a terrain layer and (2) a viewshed feature layer. The terrain layer is a model of the environment being analyzed. The feature layer is used to identify the features being analyzed in the terrain model and sets their associated viewshed distances.
The major processing tasks performed for the terrain layer are summarized chronologically below:
1. The height information was related to the land cover datasets.
2. All viewshed features (listed in Table 8) were converted to raster at 10m, setting the pixel values to the height information.
3. The viewshed features were combined together using the MERGE tool. The merge order was set from the tallest features to the shortest (such that taller features are given priority when features overlap).
4. The combined viewshed features were added to the land cover raster using the MERGE tool, giving priority to the viewshed features (such that features always override the land cover heights wherever they occur).
5. The above raster was added to the DEM using the raster calculator.
6. The raster was converted to a floating point grid (as required by the viewshed software).
The major processing tasks performed for the viewshed feature layer are summarized chronologically below:
1. All viewshed features (listed in Table 8) were converted to raster at 10m, setting the pixel values to the height information.
2. The viewshed features were combined together for each viewshed distance category (1km and 5km) using the MERGE tool.
3. Each of the rasters for the viewshed distance categories was converted to a floating point grid (as required by the viewshed software).
13 The NCPN vegetation dataset provided coverage for all of BLCA and one mile beyond the park boundary. The LANDFIRE vegetation heights database was used to complete coverage in the rest of the 5km buffer zone.
42
The software was used to analyze the viewshed distance categories for both features inside and outside wilderness (see Table 8). When necessary for the analysis of a distance category, the viewshed landscape was split into a number of overlapping tiles such that they could be simultaneously analyzed by a cluster of desktop computers.
The model outputs for the different viewshed distances were combined together using the MINIMUM function in ArcGIS to produce grids of viewshed impacts for features inside and adjacent to the wilderness. Raster values were normalized to 0–255. The normalized values were then inverted to reflect high degradation of solitude near human features and lower degradation further away from those features (Figure 10).
Cautions: The viewshed model replicates the natural environment using a number of rules and compromises. While necessary for the purposes of this analysis, these compromises should be carefully considered when discussing results.
1. For this analysis, a “pessimistic” re-sampling was done to generate the 10m feature inputs guaranteeing that features smaller than this area were included14 and that the viewsheds produced an accurate representation of the visual impacts of these features.
2. Categorizing the anthropogenic features in and adjacent to the BLCA into specific viewshed distances requires careful consideration as to how well each type of feature may blend in with the local background. For example, old two track roads and fences are largely unnoticeable at a distance because of their shape and profile; they were therefore assigned a maximum viewshed distance of 1km. Larger and more prominent features, such as the buildings and campgrounds, were assigned a maximum viewshed distance of 5km.
3. The viewshed analysis may not realistically represent certain re-sampled feature inputs. For example, fence lines in the north of the park are represented in the model as a solid 1m high “wall,” even though those features are significantly less visible than a wall would be.
4. The current version of the viewshed tool places the “person” in the analysis on top of all the viewshed features (such as vegetation or buildings), as opposed to placing them in among those features. Areas where the vegetation exceeds 3m must therefore be removed manually from the output. This limitation is being addressed for future versions of the software.
14 Re-sampling of feature layers in GIS is normally carried out on a “majority class” basis wherein the value of a grid cell takes on the value of the largest feature by area that it contains. Using this rule, a 5 x 5m building in a 10 x 10m grid cell that was otherwise not classified as a feature would not be recorded on re-sampling. The “pessimistic” re-sampling used here operates on presence/absence basis such that any grid cell containing a human feature will be classified as such even though the actual area or footprint of the feature may not cover the majority of the grid cell.
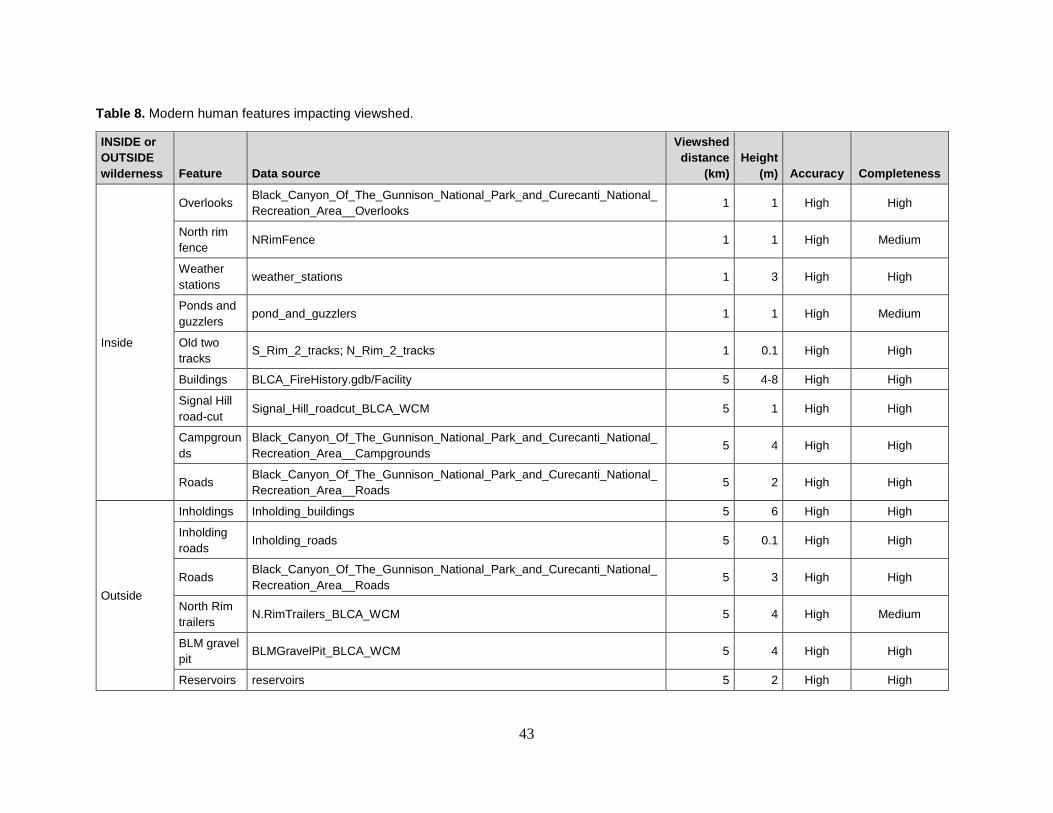
43
Table 8. Modern human features impacting viewshed.
INSIDE or OUTSIDE wilderness Feature Data source
Viewshed distance
(km) Height
(m) Accuracy Completeness
Inside
Overlooks Black_Canyon_Of_The_Gunnison_National_Park_and_Curecanti_National_Recreation_Area__Overlooks 1 1 High High
North rim fence NRimFence 1 1 High Medium
Weather stations weather_stations 1 3 High High
Ponds and guzzlers pond_and_guzzlers 1 1 High Medium
Old two tracks S_Rim_2_tracks; N_Rim_2_tracks 1 0.1 High High
Buildings BLCA_FireHistory.gdb/Facility 5 4-8 High High
Signal Hill road-cut Signal_Hill_roadcut_BLCA_WCM 5 1 High High
Campgrounds
Black_Canyon_Of_The_Gunnison_National_Park_and_Curecanti_National_Recreation_Area__Campgrounds 5 4 High High
Roads Black_Canyon_Of_The_Gunnison_National_Park_and_Curecanti_National_Recreation_Area__Roads 5 2 High High
Outside
Inholdings Inholding_buildings 5 6 High High
Inholding roads Inholding_roads 5 0.1 High High
Roads Black_Canyon_Of_The_Gunnison_National_Park_and_Curecanti_National_Recreation_Area__Roads 5 3 High High
North Rim trailers N.RimTrailers_BLCA_WCM 5 4 High Medium
BLM gravel pit BLMGravelPit_BLCA_WCM 5 4 High High
Reservoirs reservoirs 5 2 High High
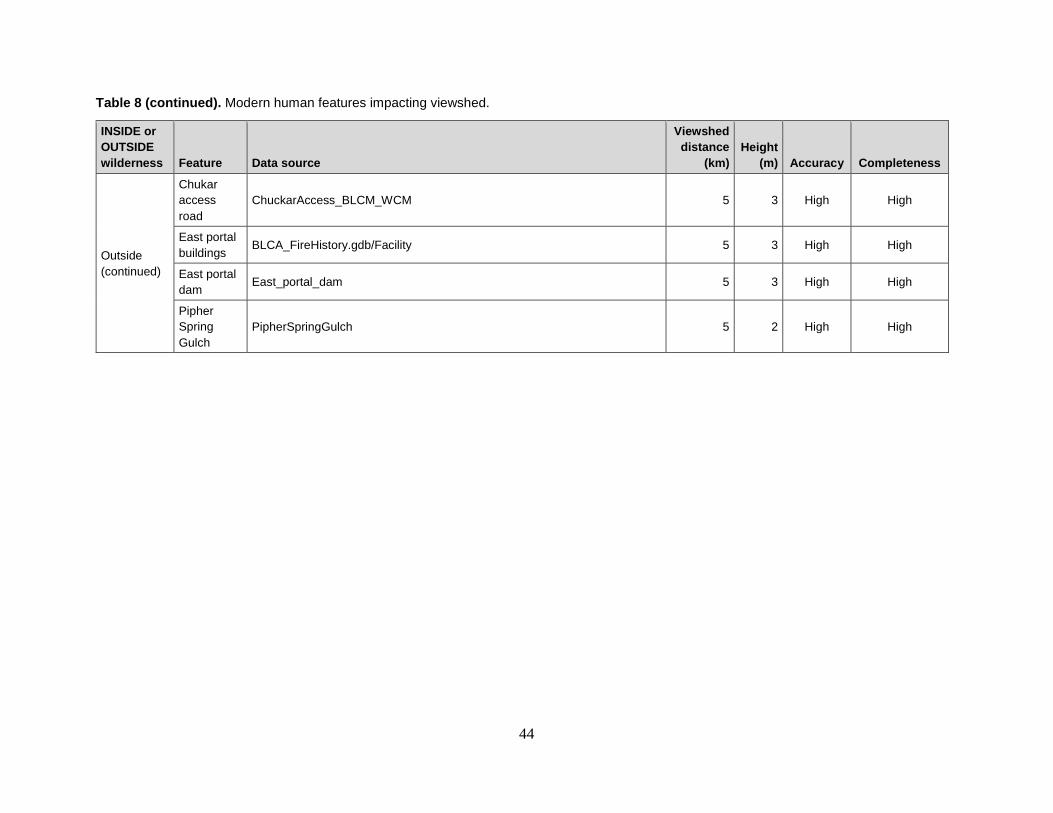
44
Table 8 (continued). Modern human features impacting viewshed.
INSIDE or OUTSIDE wilderness Feature Data source
Viewshed distance
(km) Height
(m) Accuracy Completeness
Outside (continued)
Chukar access road
ChuckarAccess_BLCM_WCM 5 3 High High
East portal buildings BLCA_FireHistory.gdb/Facility 5 3 High High
East portal dam East_portal_dam 5 3 High High
Pipher Spring Gulch
PipherSpringGulch 5 2 High High
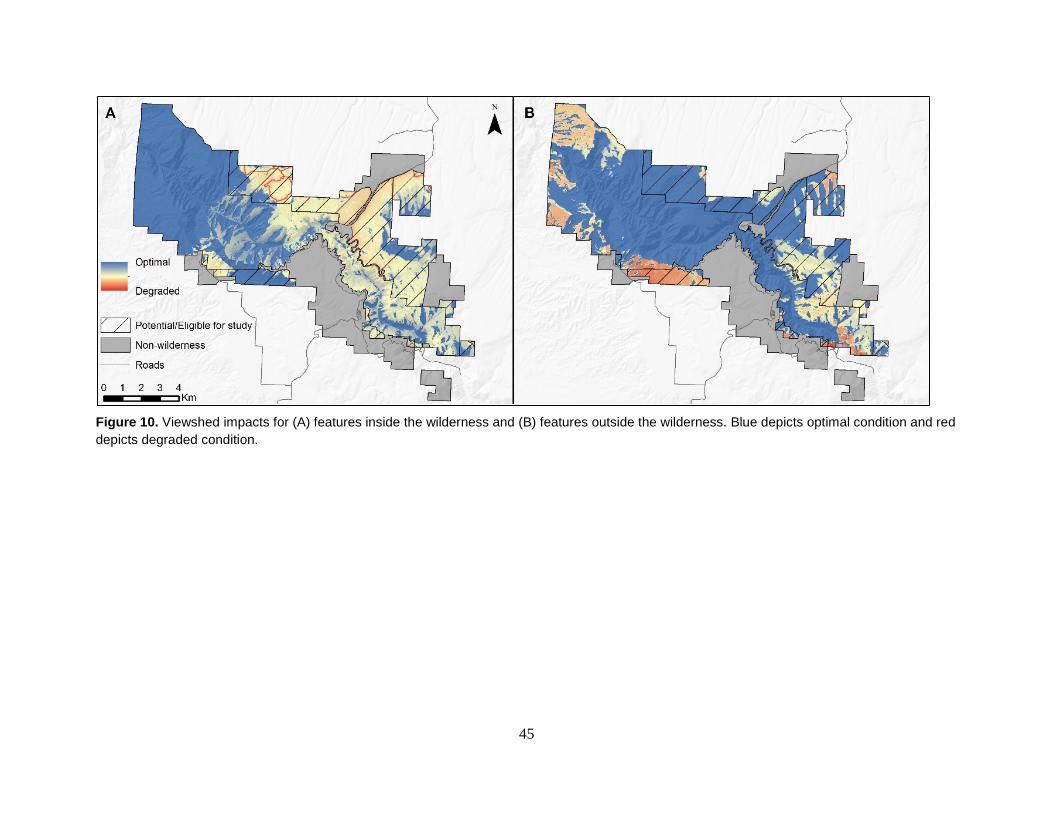
45
Figure 10. Viewshed impacts for (A) features inside the wilderness and (B) features outside the wilderness. Blue depicts optimal condition and red depicts degraded condition.
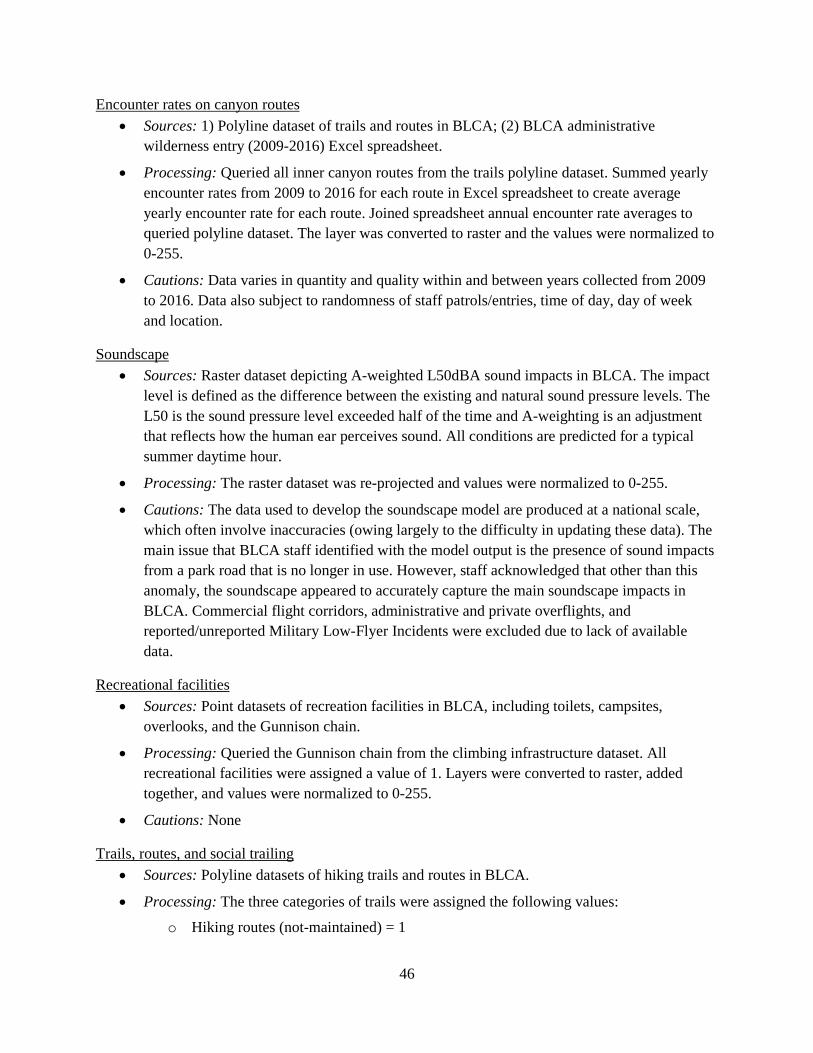
46
Encounter rates on canyon routes • Sources: 1) Polyline dataset of trails and routes in BLCA; (2) BLCA administrative
wilderness entry (2009-2016) Excel spreadsheet.
• Processing: Queried all inner canyon routes from the trails polyline dataset. Summed yearly encounter rates from 2009 to 2016 for each route in Excel spreadsheet to create average yearly encounter rate for each route. Joined spreadsheet annual encounter rate averages to queried polyline dataset. The layer was converted to raster and the values were normalized to 0-255.
• Cautions: Data varies in quantity and quality within and between years collected from 2009 to 2016. Data also subject to randomness of staff patrols/entries, time of day, day of week and location.
Soundscape • Sources: Raster dataset depicting A-weighted L50dBA sound impacts in BLCA. The impact
level is defined as the difference between the existing and natural sound pressure levels. The L50 is the sound pressure level exceeded half of the time and A-weighting is an adjustment that reflects how the human ear perceives sound. All conditions are predicted for a typical summer daytime hour.
• Processing: The raster dataset was re-projected and values were normalized to 0-255.
• Cautions: The data used to develop the soundscape model are produced at a national scale, which often involve inaccuracies (owing largely to the difficulty in updating these data). The main issue that BLCA staff identified with the model output is the presence of sound impacts from a park road that is no longer in use. However, staff acknowledged that other than this anomaly, the soundscape appeared to accurately capture the main soundscape impacts in BLCA. Commercial flight corridors, administrative and private overflights, and reported/unreported Military Low-Flyer Incidents were excluded due to lack of available data.
Recreational facilities • Sources: Point datasets of recreation facilities in BLCA, including toilets, campsites,
overlooks, and the Gunnison chain.
• Processing: Queried the Gunnison chain from the climbing infrastructure dataset. All recreational facilities were assigned a value of 1. Layers were converted to raster, added together, and values were normalized to 0-255.
• Cautions: None
Trails, routes, and social trailing • Sources: Polyline datasets of hiking trails and routes in BLCA.
• Processing: The three categories of trails were assigned the following values:
o Hiking routes (not-maintained) = 1
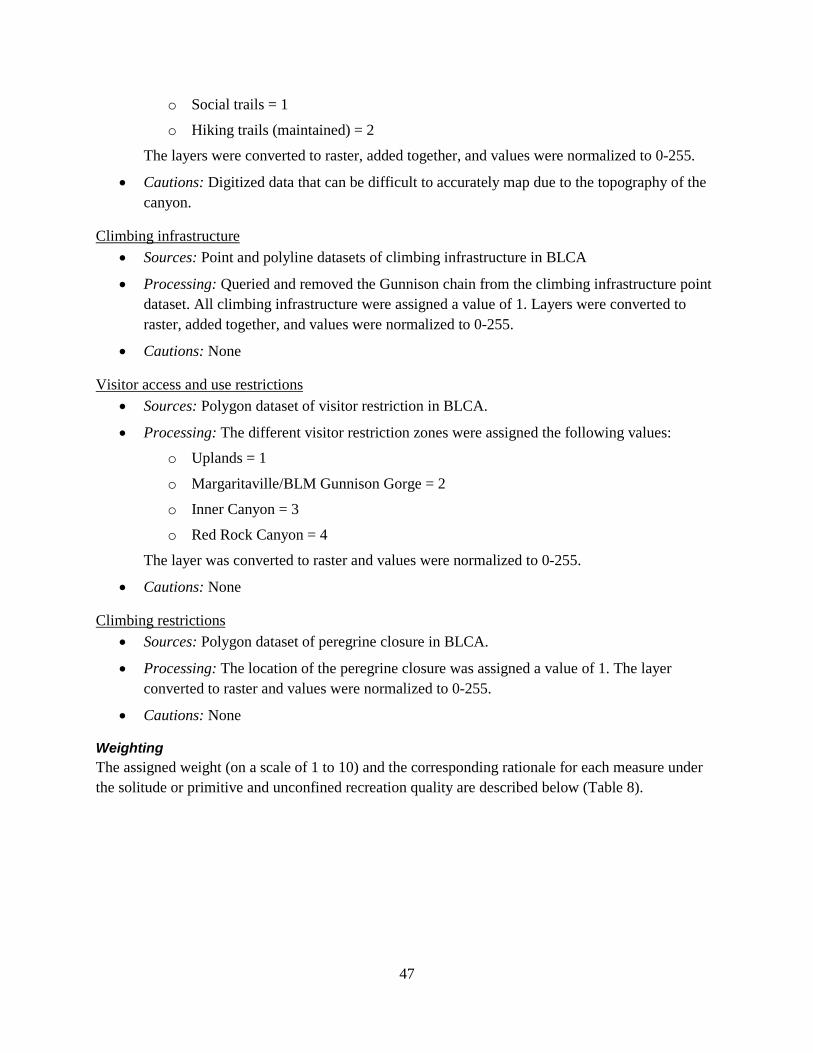
47
o Social trails = 1
o Hiking trails (maintained) = 2
The layers were converted to raster, added together, and values were normalized to 0-255.
• Cautions: Digitized data that can be difficult to accurately map due to the topography of the canyon.
Climbing infrastructure • Sources: Point and polyline datasets of climbing infrastructure in BLCA
• Processing: Queried and removed the Gunnison chain from the climbing infrastructure point dataset. All climbing infrastructure were assigned a value of 1. Layers were converted to raster, added together, and values were normalized to 0-255.
• Cautions: None
Visitor access and use restrictions • Sources: Polygon dataset of visitor restriction in BLCA.
• Processing: The different visitor restriction zones were assigned the following values:
o Uplands = 1
o Margaritaville/BLM Gunnison Gorge = 2
o Inner Canyon = 3
o Red Rock Canyon = 4
The layer was converted to raster and values were normalized to 0-255.
• Cautions: None
Climbing restrictions • Sources: Polygon dataset of peregrine closure in BLCA.
• Processing: The location of the peregrine closure was assigned a value of 1. The layer converted to raster and values were normalized to 0-255.
• Cautions: None
Weighting The assigned weight (on a scale of 1 to 10) and the corresponding rationale for each measure under the solitude or primitive and unconfined recreation quality are described below (Table 8).
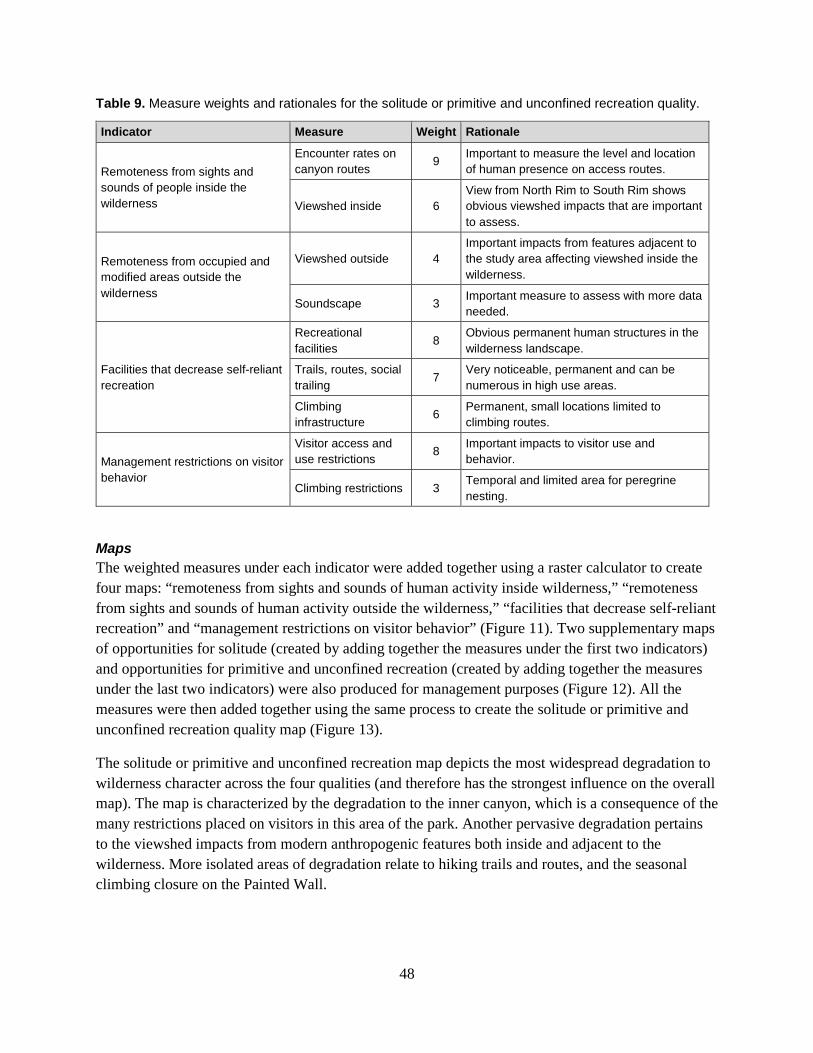
48
Table 9. Measure weights and rationales for the solitude or primitive and unconfined recreation quality.
Indicator Measure Weight Rationale
Remoteness from sights and sounds of people inside the wilderness
Encounter rates on canyon routes 9 Important to measure the level and location
of human presence on access routes.
Viewshed inside 6 View from North Rim to South Rim shows obvious viewshed impacts that are important to assess.
Remoteness from occupied and modified areas outside the wilderness
Viewshed outside 4 Important impacts from features adjacent to the study area affecting viewshed inside the wilderness.
Soundscape 3 Important measure to assess with more data needed.
Facilities that decrease self-reliant recreation
Recreational facilities 8 Obvious permanent human structures in the
wilderness landscape.
Trails, routes, social trailing 7 Very noticeable, permanent and can be
numerous in high use areas.
Climbing infrastructure 6 Permanent, small locations limited to
climbing routes.
Management restrictions on visitor behavior
Visitor access and use restrictions 8 Important impacts to visitor use and
behavior.
Climbing restrictions 3 Temporal and limited area for peregrine nesting.
Maps The weighted measures under each indicator were added together using a raster calculator to create four maps: “remoteness from sights and sounds of human activity inside wilderness,” “remoteness from sights and sounds of human activity outside the wilderness,” “facilities that decrease self-reliant recreation” and “management restrictions on visitor behavior” (Figure 11). Two supplementary maps of opportunities for solitude (created by adding together the measures under the first two indicators) and opportunities for primitive and unconfined recreation (created by adding together the measures under the last two indicators) were also produced for management purposes (Figure 12). All the measures were then added together using the same process to create the solitude or primitive and unconfined recreation quality map (Figure 13).
The solitude or primitive and unconfined recreation map depicts the most widespread degradation to wilderness character across the four qualities (and therefore has the strongest influence on the overall map). The map is characterized by the degradation to the inner canyon, which is a consequence of the many restrictions placed on visitors in this area of the park. Another pervasive degradation pertains to the viewshed impacts from modern anthropogenic features both inside and adjacent to the wilderness. More isolated areas of degradation relate to hiking trails and routes, and the seasonal climbing closure on the Painted Wall.
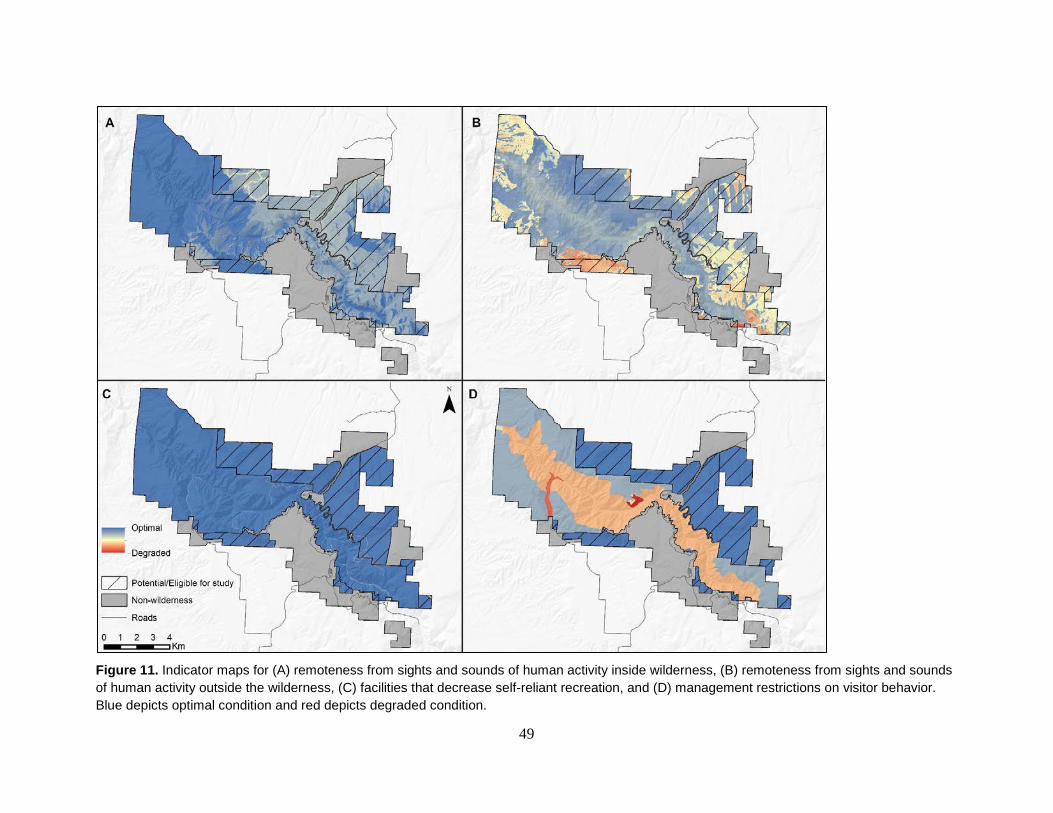
49
Figure 11. Indicator maps for (A) remoteness from sights and sounds of human activity inside wilderness, (B) remoteness from sights and sounds of human activity outside the wilderness, (C) facilities that decrease self-reliant recreation, and (D) management restrictions on visitor behavior. Blue depicts optimal condition and red depicts degraded condition.
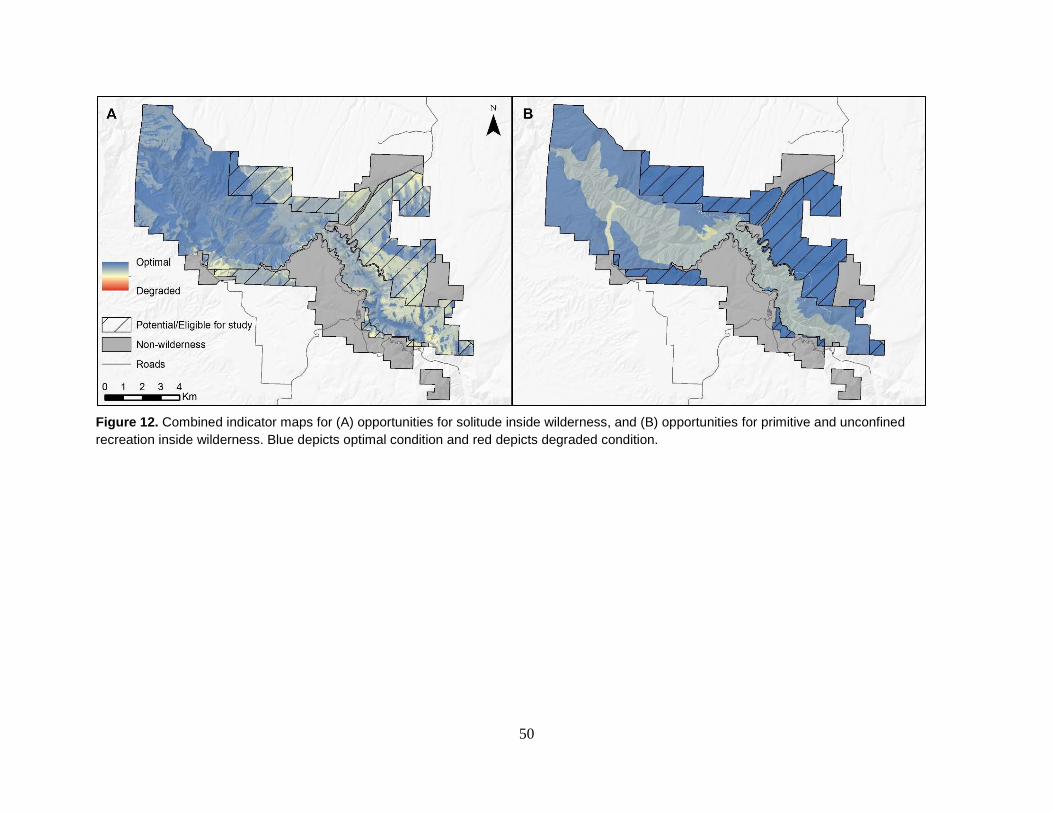
50
Figure 12. Combined indicator maps for (A) opportunities for solitude inside wilderness, and (B) opportunities for primitive and unconfined recreation inside wilderness. Blue depicts optimal condition and red depicts degraded condition.
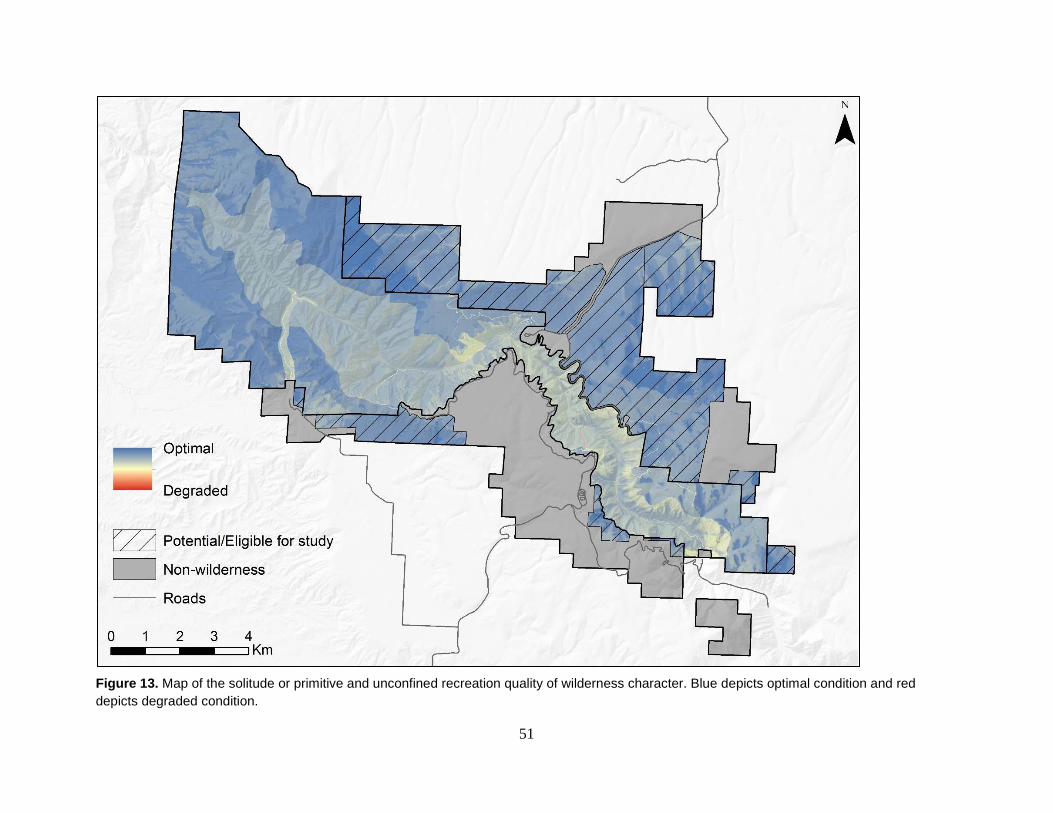
51
Figure 13. Map of the solitude or primitive and unconfined recreation quality of wilderness character. Blue depicts optimal condition and red depicts degraded condition.
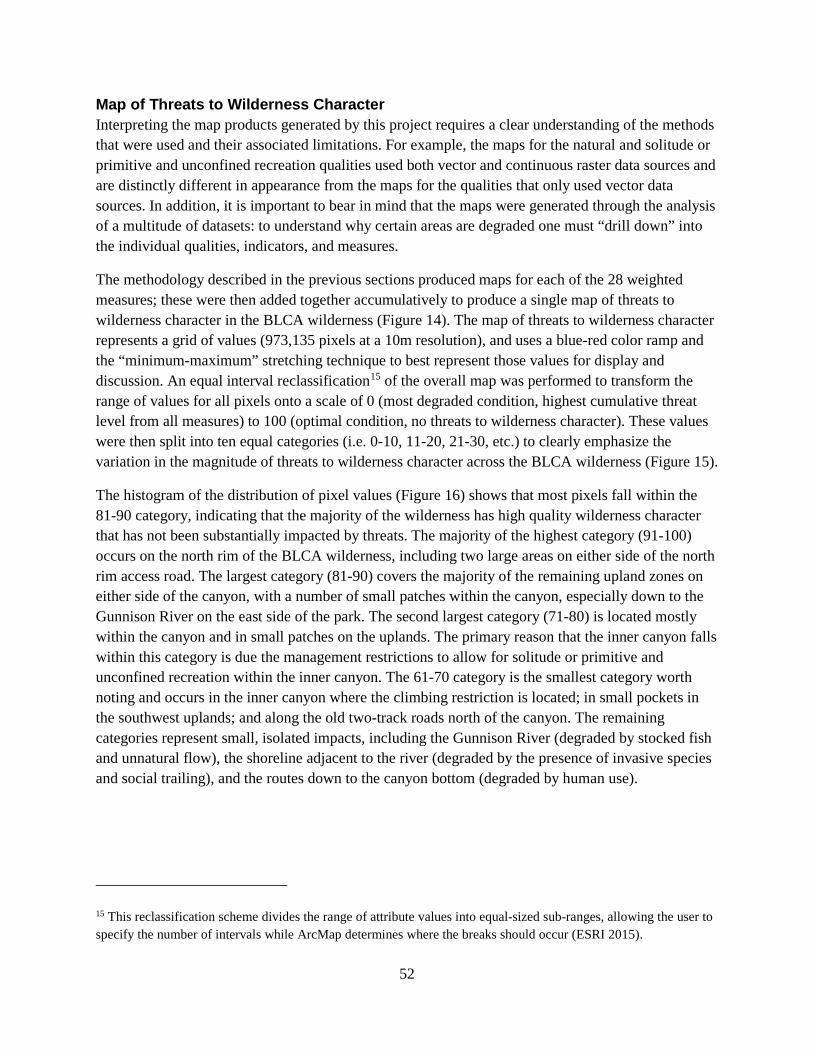
52
Map of Threats to Wilderness Character Interpreting the map products generated by this project requires a clear understanding of the methods that were used and their associated limitations. For example, the maps for the natural and solitude or primitive and unconfined recreation qualities used both vector and continuous raster data sources and are distinctly different in appearance from the maps for the qualities that only used vector data sources. In addition, it is important to bear in mind that the maps were generated through the analysis of a multitude of datasets: to understand why certain areas are degraded one must “drill down” into the individual qualities, indicators, and measures.
The methodology described in the previous sections produced maps for each of the 28 weighted measures; these were then added together accumulatively to produce a single map of threats to wilderness character in the BLCA wilderness (Figure 14). The map of threats to wilderness character represents a grid of values (973,135 pixels at a 10m resolution), and uses a blue-red color ramp and the “minimum-maximum” stretching technique to best represent those values for display and discussion. An equal interval reclassification15 of the overall map was performed to transform the range of values for all pixels onto a scale of 0 (most degraded condition, highest cumulative threat level from all measures) to 100 (optimal condition, no threats to wilderness character). These values were then split into ten equal categories (i.e. 0-10, 11-20, 21-30, etc.) to clearly emphasize the variation in the magnitude of threats to wilderness character across the BLCA wilderness (Figure 15).
The histogram of the distribution of pixel values (Figure 16) shows that most pixels fall within the 81-90 category, indicating that the majority of the wilderness has high quality wilderness character that has not been substantially impacted by threats. The majority of the highest category (91-100) occurs on the north rim of the BLCA wilderness, including two large areas on either side of the north rim access road. The largest category (81-90) covers the majority of the remaining upland zones on either side of the canyon, with a number of small patches within the canyon, especially down to the Gunnison River on the east side of the park. The second largest category (71-80) is located mostly within the canyon and in small patches on the uplands. The primary reason that the inner canyon falls within this category is due the management restrictions to allow for solitude or primitive and unconfined recreation within the inner canyon. The 61-70 category is the smallest category worth noting and occurs in the inner canyon where the climbing restriction is located; in small pockets in the southwest uplands; and along the old two-track roads north of the canyon. The remaining categories represent small, isolated impacts, including the Gunnison River (degraded by stocked fish and unnatural flow), the shoreline adjacent to the river (degraded by the presence of invasive species and social trailing), and the routes down to the canyon bottom (degraded by human use).
15 This reclassification scheme divides the range of attribute values into equal-sized sub-ranges, allowing the user to specify the number of intervals while ArcMap determines where the breaks should occur (ESRI 2015).
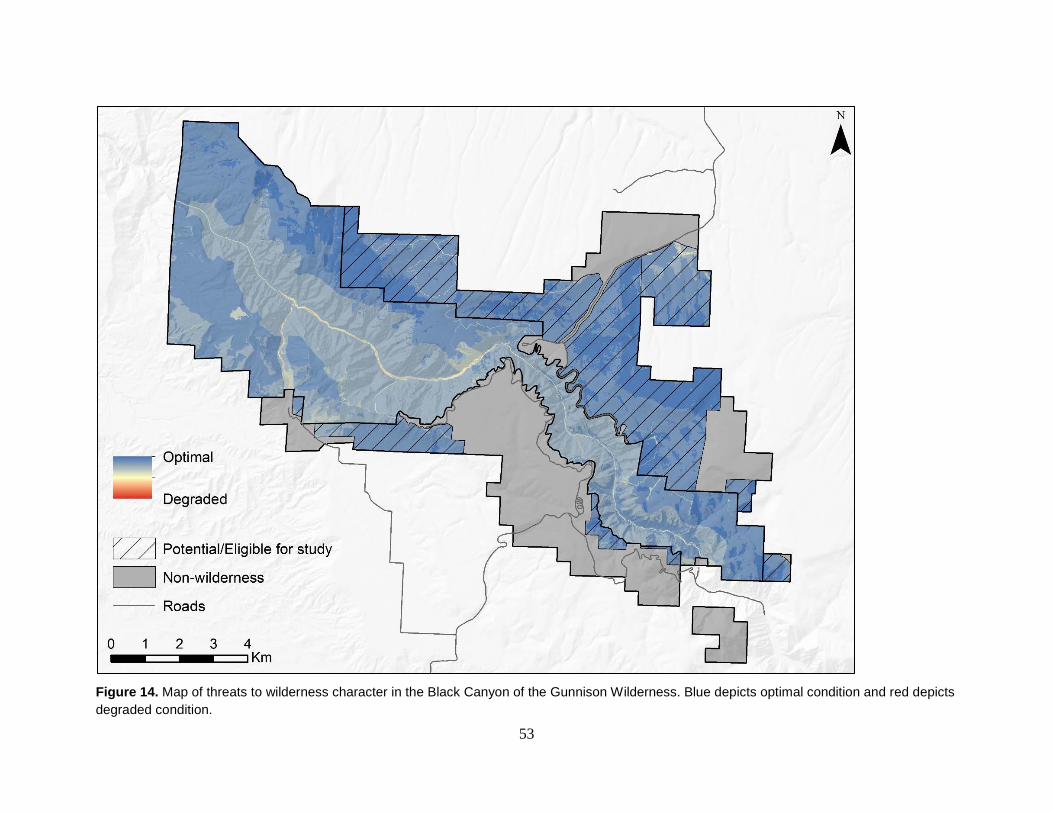
53
Figure 14. Map of threats to wilderness character in the Black Canyon of the Gunnison Wilderness. Blue depicts optimal condition and red depicts degraded condition.
54
Figure 15. Map of threats to wilderness character in the Black Canyon of the Gunnison Wilderness reclassed into ten equal categories. Blue depicts optimal condition and red depicts degraded condition.
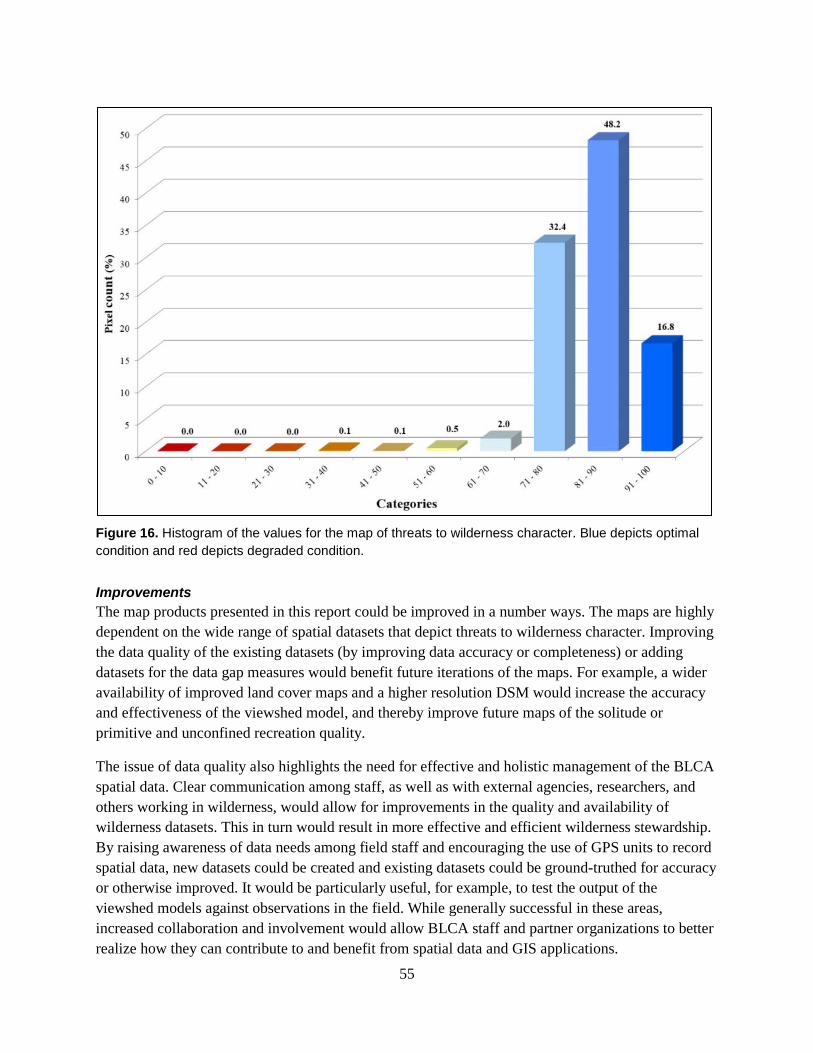
55
Figure 16. Histogram of the values for the map of threats to wilderness character. Blue depicts optimal condition and red depicts degraded condition.
Improvements The map products presented in this report could be improved in a number ways. The maps are highly dependent on the wide range of spatial datasets that depict threats to wilderness character. Improving the data quality of the existing datasets (by improving data accuracy or completeness) or adding datasets for the data gap measures would benefit future iterations of the maps. For example, a wider availability of improved land cover maps and a higher resolution DSM would increase the accuracy and effectiveness of the viewshed model, and thereby improve future maps of the solitude or primitive and unconfined recreation quality.
The issue of data quality also highlights the need for effective and holistic management of the BLCA spatial data. Clear communication among staff, as well as with external agencies, researchers, and others working in wilderness, would allow for improvements in the quality and availability of wilderness datasets. This in turn would result in more effective and efficient wilderness stewardship. By raising awareness of data needs among field staff and encouraging the use of GPS units to record spatial data, new datasets could be created and existing datasets could be ground-truthed for accuracy or otherwise improved. It would be particularly useful, for example, to test the output of the viewshed models against observations in the field. While generally successful in these areas, increased collaboration and involvement would allow BLCA staff and partner organizations to better realize how they can contribute to and benefit from spatial data and GIS applications.
56
Final concerns about mapping threats to wilderness character A major concern of this work is that end-users will ascribe false levels of accuracy to the map products. The tendency to attribute higher levels of reliability and precision to maps because they look accurate is common to almost all GIS analyses. The maps produced through this project are only an estimate of selected measures of wilderness character and their spatial variability and pattern; they are not a final determination of wilderness character in the BLCA wilderness. Underscoring this point, the maps do not portray the symbolic, intangible, spiritual, and experiential values of wilderness character that are unique to individual persons, locations, and moments. Wilderness researchers and managers have debated the merits of even attempting to quantify or map threats to wilderness character; while some emphasize the need to develop indicators that can be used to aid wilderness monitoring, management, and long-term planning (e.g. Landres 2004), others point out that quantitative analyses do not reflect important qualitative attributes of wilderness character, such as how wilderness affects each of us in different ways (e.g. Watson 2004). Although the maps do not depict all nuances of wilderness character, they still provide useful information on tangible threats. Ultimately, the maps should be viewed as a tool that wilderness stewards can use to further refine the effectiveness of their efforts to “preserv[e] the wilderness character of the area” and perpetuate the “enduring resource of wilderness” (Wilderness Act of 1964).
57
References Aplet, G., J. Thomson, and M. Wilbert. 2000. Indicators of wildness: Using attributes of the land to
assess the context of wilderness. Pages 89-98 in: S. F. McCool, D. N. Cole, W. T. Borrie, and J. O’Loughlin, comps. Wilderness science in a time of change conference—Volume 2: Wilderness within the context of larger systems. Proceedings RMRS-P-15-VOL-2. 1999 May 23-27, Missoula, MT. U.S. Department of Agriculture, Forest Service, Rocky Mountain Research Station, Ogden, UT.
Breiman, L. 2001. Random forests. Machine Learning 45(1):5-32.
Carver, S. 1996. Mapping the wilderness continuum using raster GIS. Pages 283-288 in: S. Morain, and S. Lopez-Baros, editors. Raster imagery in geographic information systems. OnWord Press, NM.
Carver, S., and M. Wrightham. 2003. Assessment of historic trends in the extent of wild land in Scotland: A pilot study. Scottish Natural Heritage Commissioned Report No. 012 (ROAME No. FO2NC11A).
Carver, S. L. Comber, S. Fritz, R. McMorran, S. Taylor, and J. Washtell. 2008. Wildness study in the Cairngorms National Park. Final Report, commissioned by the Cairngorms National Park Authority and Scottish Natural Heritage. March, 2008. Available at: http://www.wildlandresearch.org/Cairngorm2008.pdf.
Carver, S. 2010. 10.3 Mountains and wilderness in European Environment Agency: Europe's ecological backbone: recognizing the true value of our mountains. EEA Report No 6/2010: 192-201.
Carver, S., J. Tricker, and P. Landres. 2013. Keeping it wild: Mapping wilderness character in the United States. Journal of Environmental Management 131:238-255.
Cook, C. N., M. Hockings, and R. W. Carter. 2009. Conservation in the dark? The information used to support management decisions. Frontiers in Ecology and the Environment 8(4):181-186.
ESRI. 2015. ESRI Support. Environmental Systems Research Institute, Redlands, CA. Retrieved from http://support.esri.com.
Fritz, S., S. Carver, and L. See. 2000. New approaches to wild land mapping in Europe. Proceedings of I5-VOL-2. Missoula, MT.
Landres, P. 2004. Developing indicators to monitor the “outstanding opportunities” quality of wilderness character. International Journal of Wilderness 10(3):8-12, 20.
Landres, P., S. Boutcher, L. Merigliano, C. Barns, D. Davis, T. Hall, S. Henry, B. Hunter, P. Janiga, M. Laker, A. McPherson, D. S. Powell, M. Rowan, and S. Sater. 2005. Monitoring selected conditions related to wilderness character: A national framework. Gen. Tech. Rep. RMRS-GTR-
58
151. U.S. Department of Agriculture, Forest Service, Rocky Mountain Research Station, Fort Collins, CO.
Landres, P., M. B. Hennessy, K. Schlenker, D. N. Cole, and S. Boutcher. 2008. Applying the concept of wilderness character to National Forest planning, monitoring, and management. Gen. Tech. Rep. RMRS-GTR-217. U.S. Department of Agriculture, Forest Service, Rocky Mountain Research Station, Fort Collins, CO.
Landres, P., C. Barns, S. Boutcher, T. Devine, P. Dratch, A. Lindholm, L. Merigliano, N. Roeper, and E. Simpson. 2015. Keeping it wild 2: An updated interagency strategy to monitor trends in wilderness character across the National Wilderness Preservation System. Gen. Tech. Rep. RMRS-GTR-340. U.S. Department of Agriculture, Forest Service, Rocky Mountain Research Station, Fort Collins, CO.
LANDFIRE. 2017. Available at https://www.landfire.gov/NationalProductDescriptions22.php.
Lesslie, R. 1993. The national wilderness inventory: Wilderness identification, assessment and monitoring in Australia. International wilderness allocation, management and research. Proceedings of the 5th World Wilderness Congress: 31-36.
Management Policies. 2006. National Park Service, U.S. Department of the Interior.
McCloskey, M. 1999. Changing views of what the wilderness system is all about. Denver University Law Review 76:369-381.
Rohlf, D., and D. L. Honnold. 1988. Managing the balance of nature: The legal framework of wilderness management. Ecology Law Quarterly 15(2):249-279.
Sanderson, E. W., M. Jaiteh, M. A. Levy, K. H. Redford, A. V. Wannebo, and G. Woolmer. 2002. The human footprint and the last of the wild. Bioscience 52(10):891-904.
Tricker, J., P. Landres, S. Dingman, C. Callagan, J. Stark, L. Bonstead, K. Fuhrman, and S. Carver. 2012. Mapping wilderness character in Death Valley National Park. Natural Resource Report NPS/DEVA/NRR-2012/503. National Park Service, Fort Collins, CO.
Watson, A. E. 2004. Human relationships with wilderness: the fundamental definition of wilderness character. International Journal of Wilderness 10(3):4-7.
Wilderness Act of 1964; 16. U.S.C. 1121 (note), 1131-1136.
Wolter, P. T., D. J. Mladenoff, G. E. Host, and T. R. Crow. 1995. Improved forest classification in the Northern Lake states using multi-temporal Landsat imagery. Photogrammetric Engineering & Remote Sensing 61(9):1129-1143.
Zahniser, H. 1962. Hearings before the Subcommittee on Public Lands of the Committee on Interior Affairs, House of Representatives, 87th Congress, 2nd session, May 7-11, serial no. 12, part IV.


The Department of the Interior protects and manages the nation’s natural resources and cultural heritage; provides scientific and other information about those resources; and honors its special responsibilities to American Indians, Alaska Natives, and affiliated Island Communities. NPS 144/146159, June 2018
National Park Service U.S. Department of the Interior
Natural Resource Stewardship and Science 1201 Oakridge Drive, Suite 150 Fort Collins, CO 80525
EXPERIENCE YOUR AMERICA TM