Embed Size (px)
Citation preview
NATIONAL MINIMUM WAGE
Final Government evidence to the Low Pay Commission 2011
DECEMBER 2011

National Minimum Wage - Final Government evidence to the Low Pay Commission 2011
MINISTERIAL FOREWORD The Coalition Government continues to fully support the National Minimum Wage and the independent Low Pay Commission. We believe that the protection the National Minimum Wage gives to low income workers, whilst incentivising them to work continues to be of great importance, particularly in the current economic climate. We greatly value the work of the Low Pay Commission and welcome their historically consistent focus on helping as many low paid workers as possible without adversely impacting employment prospects or inflation. We encourage the Commission to retain this focus for their next report. We have given the Commission a particularly challenging remit this year, where we are asking for rate recommendations to be made against a difficult economic background. Consumer price inflation remains high and economic growth is expected to remain relatively subdued - and where the labour market position for youths remains relatively more vulnerable compared to adults. As the National Minimum Wage has been in existence for more than a decade, we think its time to take stock and explore whether the system can be made simpler. We know that many find the minimum wage system simple and easy to understand, however, there may be some employers or individuals that don’t and wish for some simplification to take place. We have therefore asked the Commission to consult and make recommendations on whether the regulations can be made even simpler and easier to administer. In the forthcoming Employment-related Law spotlight in the Red Tape Challenge (Autumn 2011), we will ask for ideas to simplify the National Minimum Wage legislation. We will send these suggestions to the Commission for them to consider for their report to the Government by the end of February 2012.
Edward Davey Minister for Employment Relations, Consumer and Postal Affairs September 2011
1
National Minimum Wage - Final Government evidence to the Low Pay Commission 2011
CONTENTS
MINISTERIAL FOREWORD ............................................................................1 SECTION 1 EXECUTIVE SUMMARY............................................................4 SECTION 2 REMIT ISSUES – NMW RATES...............................................7
Economic background ..............................................................................7 Macroeconomic conditions and outlook ................................................7
Summary ..................................................................................................7 Evidence on pay..................................................................................16
Summary ................................................................................................16 Impact of the NMW on the labour market............................................25
Summary ................................................................................................25 Particular groups of workers (other than young workers) ....................31
Summary ................................................................................................31 Enterprise size ....................................................................................33
Summary ................................................................................................33 Policy background ..................................................................................37
Benefit reform......................................................................................37 Government support for Small Firms ..................................................38 Workplace Pension Reforms...............................................................41 National insurance and personal tax ...................................................43
SECTION 3 REMIT ISSUES – THE YOUTH LABOUR MARKET..................44
Summary ................................................................................................44 Economic background ............................................................................45
Labour market background for young people by participation in full-time education.............................................................................................45 16-17 Age group .................................................................................48 18-20 age group..................................................................................49 Distribution of earnings of young employees earning the NMW for different age groups ............................................................................51
Policy background ..................................................................................55 Young people and the Participation Strategy ......................................55 Apprenticeships...................................................................................60 Work experience (including internships) .............................................62
SECTION 4 OTHER REMIT ISSUES...........................................................66
Summary ................................................................................................66 Simplification of NMW rules ....................................................................66
Agricultural Wages Board....................................................................67 Employment Law Review....................................................................67
Greater clarity on future NMW levels ......................................................69 SECTION 5 RESPONSE TO POLICY ISSUES IN 2011 REPORT..............71
2011 rate recommendations ...................................................................71 Seafarers ................................................................................................71
2
National Minimum Wage - Final Government evidence to the Low Pay Commission 2011
3
Social Care .............................................................................................72 Migrant domestic workers.......................................................................74
SECTION 6 OTHER POLICY ISSUES.........................................................75
Employed students and the accommodation offset ................................75 Travel schemes ......................................................................................75 Compliance and enforcement .................................................................76
Implementing the National Minimum Wage Compliance Strategy.......76 Targeted enforcement.........................................................................83 Guidance on the NMW........................................................................85 Awareness Raising .............................................................................87 Statistics on NMW enforcement ..........................................................90 Wider Enforcement of Workplace Rights.............................................94
ANNEX A GOVERNMENT RESPONSE TO LPC’s 2011 RECOMMENDATIONS..................................................................................98 ANNEX B REMIT FOR THE LOW PAY COMMISSION 2012 REPORT ...99 ANNEX C BENEFICIARIES OF THE 2011 NMW UPRATING BY SEX AND REGION…………….....................................................................................100 ANNEX D TECHNICAL NOTE ................................................................101 ANNEX E SUMMARY OF OBR CENTRAL FORECAST AND CHANGES SINCE MARCH 2011...................................................................................104
National Minimum Wage - Final Government evidence to the Low Pay Commission 2011
SECTION 1 EXECUTIVE SUMMARY 1.1 The Government welcomes this opportunity to present the Low Pay Commission (LPC) with its evidence on the National Minimum Wage (NMW). The Coalition Government fully supports the NMW and considers it as one of the most important workplace rights. 1.2 This document includes both the Government’s economic and non-economic evidence. This is a change from previous practice where the economic evidence was published later in order to incorporate the latest information on earnings and economic forecasts. 1.3 This report is an updated version from the September 2011 report to reflect the latest information on earnings and economic forecasts. We have also updated policy issues on workplace pension reforms (page 42), young people and the participation strategy (page 57) and the Employment Law Review (pages 68-70). 1.4 The evidence is structured according to the remit for the LPC’s 2012 report, a copy of which can be found at Annex B. 1.5 Section 2 provides evidence on issues relevant to the LPC’s task of monitoring, evaluating and reviewing the NMW and its impact and making recommendations. 1.6 Section 3 concentrated on reviewing the labour market position of young people, including those in apprenticeships and internships. 1.7 Section 4 concerns the other remit issues – whether the NMW regulations can be simplified and whether business can be given greater clarity on future levels of the NMW. 1.8 Sections 5 and 6 detail other policy issues, including those referred to in the LPC’s 2011 report and details of the Government’s work on compliance and enforcement. REMIT ISSUES – THE NMW RATES 1.9 Section 2 provides details on the economic and non-economic evidence relating to the NMW rate. This section includes macroeconomic conditions and outlook, evidence of the NMW on pay, the impact of the NMW on the labour market, benefit and pension reform and support for small firms. 1.10 From the launch of the NMW until 2007, the UK labour market performed strongly. Then the UK experienced the deepest recession in the post war period resulting in GDP falling for five consecutive quarters, a total decline of 7.1 per cent.
4
National Minimum Wage - Final Government evidence to the Low Pay Commission 2011
1.11 In their November 2011 Economic and fiscal outlook, the Office for Budget Responsibility (OBR) downgraded economic prospects since the Budget 2011 in March. 2011 GDP growth is now forecast to be 0.9 per cent (reduced from 1.7 per cent), following lower outturn data than the OBR expected at Budget 2011. Weaker growth since Budget 2011 is explained by commodity and energy price increases keeping inflation higher than expected, reducing household income and expenditure. 1.12 OBR have reduced GDP growth in 2012 to 0.7 per cent (from 2.5 per cent at the Budget). The main reason driving the weaker short-term outlook for GDP going forward is the sentiment effects of ongoing difficulties in the euro area and the associated tightening of credit conditions. 1.13 The last five annual adult upratings have been in-line with average earnings growth. The October 2011 adult rate of £6.08 will represent a nominal increase of 2.5 per cent from the October 2010 rate, again in line with forecast average earnings growth at the time of the LPC’s report. However, since its introduction, the NMW has increased substantially faster than both average earnings and prices, especially since 2001. 1.14 Empirical studies from the UK have not shown significant evidence that the adult NMW has reduced employment; indeed over the year to Q2 2011 employee jobs in the low paying sectors increased by 0.2 per cent which was more than job growth in the whole economy which was -0.1 per cent. 1.15 The NMW “bite” (the NMW as a percentage of median earnings) is higher for small firms than for medium or large firms and has grown in recent years. In addition, the proportion of employees earning at or below the NMW is substantially higher for small firms than for large firms. 1.16 The Government would want the LPC in their 2012 report to consider concentrating their attention on the effect of a rise in the adult NMW on employment and also how to mitigate any adverse impacts on inflation, growth and employment in the future. REMIT ISSUES – THE YOUTH LABOUR MARKET 1.17 Section 3 provides details on the labour market position of young people. 1.18 All of the factors affecting the main adult NMW (as described above) also apply to young people as well and there are also extra reasons to be cautious and moderate in recommending NMW rates for young people. A further consideration is that currently, employment for the over 25s has recovered to pre-recessionary levels but for under 25s it has not. This is a different pattern to previous economic downturns, where employment of young people fell earlier and faster than for older people but recovered faster. 1.19 The labour market has proved challenging for 16 - 17 year olds with the economic downturn still impacting on their market position. The number of 16-
5
National Minimum Wage - Final Government evidence to the Low Pay Commission 2011
6
17 year olds that have never had a paid job or a place on a scheme has been rising between 2007 and 2010. The ‘bite’ of the NMW for 16-17 year olds has increased between 2010 and 2011 as an increasing proportion of employees are paid at the 16- 17 year old rate indicating more firms are using the youth rates in preference to higher rates. 1.20 The economic downturn also had a significant impact on 18 - 20 year olds. The number of 18-20 year olds that have never had a paid job or a place on a scheme has risen considerably between 2007 and 2010 excluding those in full time education. A greater proportion of jobs for 18-20 year olds are being paid the development rate in 2011. 1.21 We outline steps taken to address the on-going concern over the use of interns and the risk of exploitation and we are working on guidance to clarify if and when interns may be entitled to NMW. 1.22 Given the position of young people in the labour market, we would like the LPC to explore all of the elements of the NMW on young people, including those on the apprentice rate, in order to see if recommendations in these areas could help to improve the employment status for young people. OTHER REMIT ISSUES 1.23 Shortly after the election, Government announced the Employment Law Review as the means of creating the right framework of laws to allow effective functioning of the labour market. 1.24 Last July the Government announced its proposal to abolish the Agricultural Wages Board and has asked the LPC to review the implications for the NMW framework, subject to Parliamentary approval for the Public Bodies Bill and the consultation process. POLICY ISSUES 1.25 Sections 5 and 6 provide details on a range of NMW policy areas aimed at particular groups of workers. This includes details on seafarers, travel schemes, social care and migrant domestic workers. We also provide details about our work on compliance and enforcement. During 2010/2011 HMRC identified over £3.8m in arrears owed to almost 23,000 workers. 1.26 In agreement with the LPC, since 1 January 2011, BIS has a new policy to name employers who flout NMW law. HMRC has used a campaign approach to enforcement targetting certain sectors. During 2011 HMRC, with the British Hospitality Association targetted 80 London hotels.
National Minimum Wage - Final Government evidence to the Low Pay Commission 2011
SECTION 2 REMIT ISSUES – NMW RATES
Economic background
Macroeconomic conditions and outlook
Summary In the period from the introduction of the NMW in 1999 to 2007, the UK labour market performed strongly, with the level of employment increasing by around 2.4 million in the nine years to the end of 2007. However, with the global economic recession, the UK experienced the deepest decline in output of the post-war period. Gross Domestic Product (GDP) fell for five consecutive quarters, a total decline of 7.1 per cent. The decline was arrested during the middle of 2009, but the recovery has been choppy and relatively subdued. In their November 2011 Economic and fiscal outlook, the Office for Budget Responsibility (OBR) downgraded economic prospects since the Budget 2011 in March. 2011 GDP growth is now forecast to be 0.9 per cent (reduced from 1.7 per cent), following lower outturn data than the OBR expected at Budget 2011. Weaker growth since Budget 2011 is explained by commodity and energy price increases keeping inflation higher than expected, reducing household income and expenditure. OBR have reduced GDP growth in 2012 to 0.7 per cent (from 2.5 per cent at the Budget). The main reason driving the weaker short-term outlook for GDP going forward is the sentiment effects of ongoing difficulties in the euro area and the associated tightening of credit conditions. The labour market has reacted flexibly and shown resilience; partly reflecting the effectiveness of a liberal employment regulatory regime and welfare-to-work policies. However, the effects of the economic downturn are still being felt in the UK labour market in the recovery. The latest at the time this evidence was written Office for Budget Responsibility (OBR) forecasts were made in November 2011. In these forecasts, OBR expected consumer price inflation to fall back sharply in the first half of 2012. Average earnings were expected to continue to grow relatively slowly over the near term. This is consistent with evidence of inflation expectations remaining anchored and limited pass through from higher inflation to wage growth. Government would want the LPC in their 2012 report to consider concentrating their attention on the effect of a rise in the adult NMW on employment and also how to mitigate any adverse impacts on inflation, growth and employment in the future.
7
National Minimum Wage - Final Government evidence to the Low Pay Commission 2011
Economic growth 2.1 The UK has recently experienced the deepest recession in the post-war period. The economy entered recession in the second quarter of 2008 and growth fell for five quarters. GDP declined by 7.1 per cent in total. 2.2 In the first two quarters of 2011 growth was weaker than OBR expected in March 2011, at 0.4 per cent in the first quarter and 0.1 in the second quarter. The second quarter was affected by the additional bank holiday and the disruption to international supply chains arising from the earthquake in Japan, which temporarily reduced economic activity. The ONS estimate that GDP growth for the third quarter of 2011 was 0.5 per cent, part of which is likely to have been a bounce-back from the temporary factors in the second quarter. GDP grew at an average rate of only 0.3 per cent over the second and third quarters of 2011 together. Outlook 2.3 In their November 2011 Economic and fiscal outlook, the Office for Budget Responsibility (OBR), forecast GDP to grow by 0.9 per cent in 2011. This was down from their previous forecast of 1.7 per cent, primarily because higher-than-expected inflation has squeezed household incomes and consumer spending. In 2012 annual GDP growth is expected to be 0.7 per cent, down from the March forecast of 2.5 per cent. 2.4 The OBR argue that business and consumer surveys point to further weakness in the fourth quarter of 2011. On the assumption that the euro area struggles through its current difficulties, OBR expect the underlying momentum of the economy to pick up through next year, but with the headline measure of GDP broadly flat until the second half. Growth is expected to be below 3.0 per cent up until 2015. 2.5 Since the March 2011 Economic and fiscal outlook, other external forecasters have further revised down their expectations of growth for 2011. The UK outlook according to both the OBR and the average of independent forecasters as drawn together by HM Treasury is shown in Table 2.1.
8
National Minimum Wage - Final Government evidence to the Low Pay Commission 2011
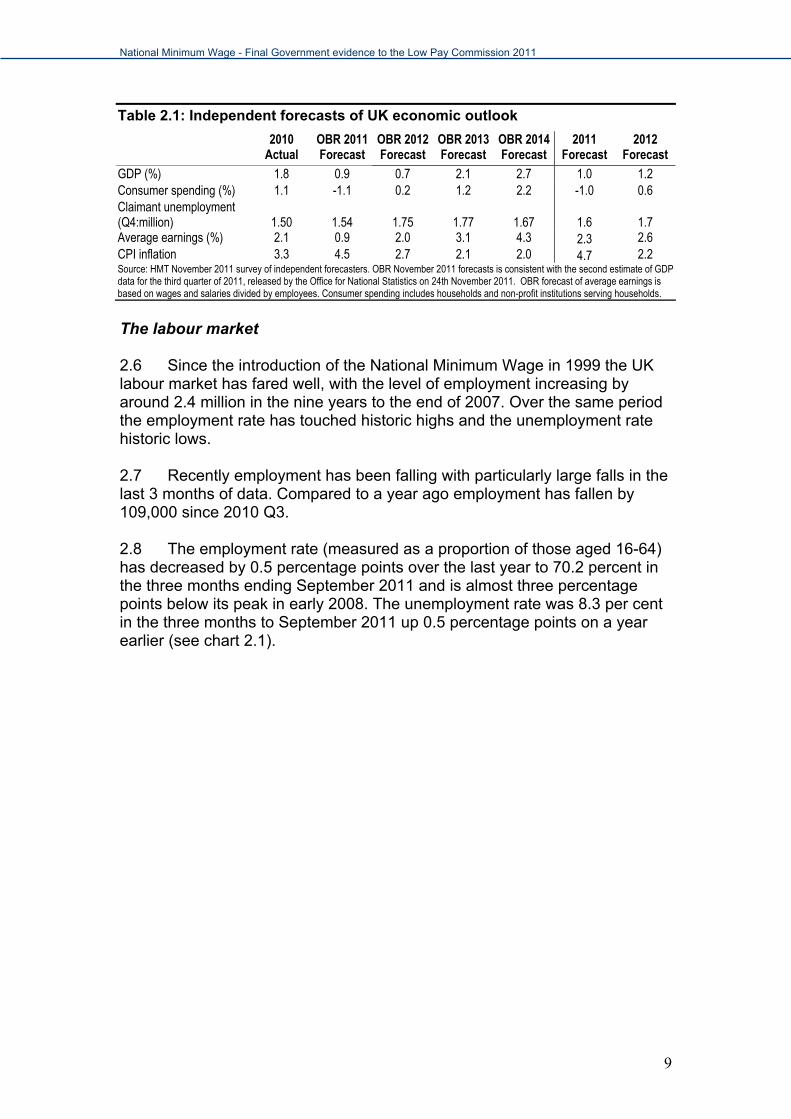
Table 2.1: Independent forecasts of UK economic outlook
2010 Actual
OBR 2011 Forecast
OBR 2012 Forecast
OBR 2013 Forecast
OBR 2014 Forecast
2011 Forecast
2012 Forecast
GDP (%) 1.8 0.9 0.7 2.1 2.7 1.0 1.2 Consumer spending (%) 1.1 -1.1 0.2 1.2 2.2 -1.0 0.6 Claimant unemployment (Q4:million)
1.50
1.54
1.75
1.77
1.67 1.6
1.7
Average earnings (%) 2.1 0.9 2.0 3.1 4.3 2.3 2.6 CPI inflation 3.3 4.5 2.7 2.1 2.0 4.7 2.2 Source: HMT November 2011 survey of independent forecasters. OBR November 2011 forecasts is consistent with the second estimate of GDP data for the third quarter of 2011, released by the Office for National Statistics on 24th November 2011. OBR forecast of average earnings is based on wages and salaries divided by employees. Consumer spending includes households and non-profit institutions serving households.
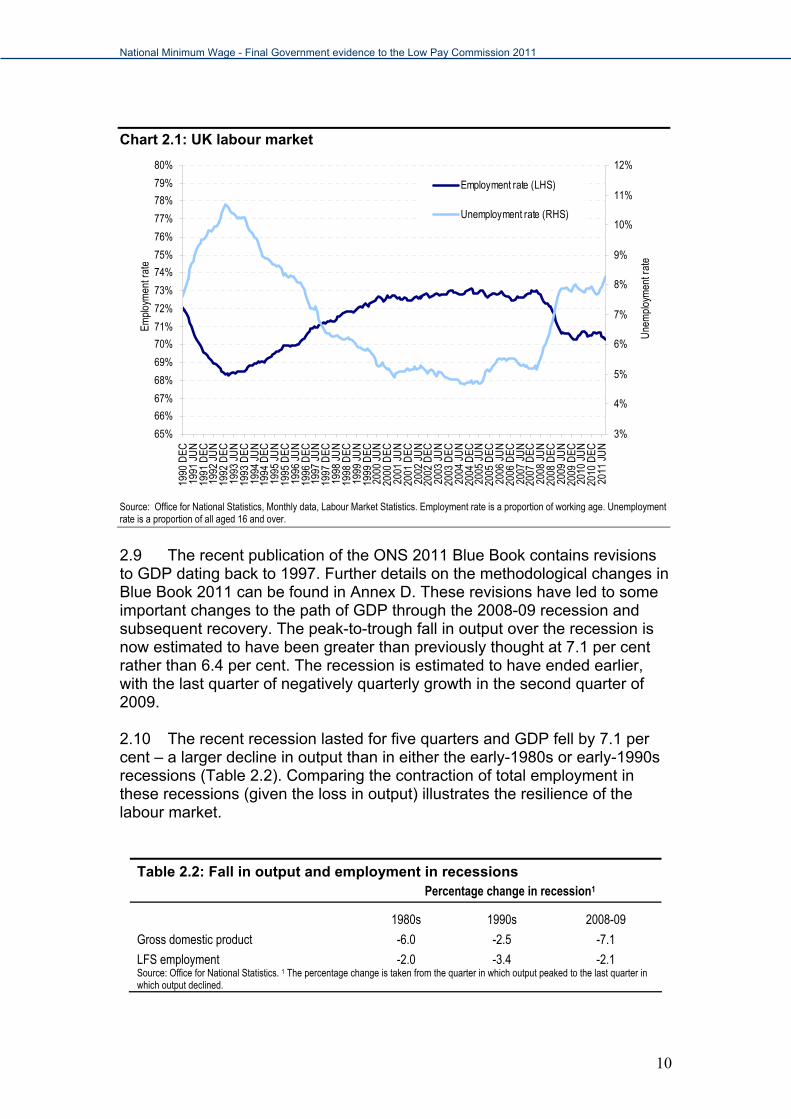
The labour market 2.6 Since the introduction of the National Minimum Wage in 1999 the UK labour market has fared well, with the level of employment increasing by around 2.4 million in the nine years to the end of 2007. Over the same period the employment rate has touched historic highs and the unemployment rate historic lows. 2.7 Recently employment has been falling with particularly large falls in the last 3 months of data. Compared to a year ago employment has fallen by 109,000 since 2010 Q3. 2.8 The employment rate (measured as a proportion of those aged 16-64) has decreased by 0.5 percentage points over the last year to 70.2 percent in the three months ending September 2011 and is almost three percentage points below its peak in early 2008. The unemployment rate was 8.3 per cent in the three months to September 2011 up 0.5 percentage points on a year earlier (see chart 2.1).
9
National Minimum Wage - Final Government evidence to the Low Pay Commission 2011
Chart 2.1: UK labour market
65%
66%
67%
68%
69%
70%
71%
72%
73%
74%
75%
76%
77%
78%
79%
80%
1990
DEC
1991
JU
N19
91 D
EC19
92 J
UN
1992
DEC
1993
JU
N19
93 D
EC19
94 J
UN
1994
DEC
1995
JU
N19
95 D
EC19
96 J
UN
1996
DEC
1997
JU
N19
97 D
EC19
98 J
UN
1998
DEC
1999
JU
N19
99 D
EC20
00 J
UN
2000
DEC
2001
JU
N20
01 D
EC20
02 J
UN
2002
DEC
2003
JU
N20
03 D
EC20
04 J
UN
2004
DEC
2005
JU
N20
05 D
EC20
06 J
UN
2006
DEC
2007
JU
N20
07 D
EC20
08 J
UN
2008
DEC
2009
JU
N20
09 D
EC20
10 J
UN
2010
DEC
2011
JU
N
Empl
oym
ent r
ate
3%
4%
5%
6%
7%
8%
9%
10%
11%
12%
Une
mpl
oym
ent r
ate
Employment rate (LHS)
Unemployment rate (RHS)
Source: Office for National Statistics, Monthly data, Labour Market Statistics. Employment rate is a proportion of working age. Unemployment rate is a proportion of all aged 16 and over.
2.9 The recent publication of the ONS 2011 Blue Book contains revisions to GDP dating back to 1997. Further details on the methodological changes in Blue Book 2011 can be found in Annex D. These revisions have led to some important changes to the path of GDP through the 2008-09 recession and subsequent recovery. The peak-to-trough fall in output over the recession is now estimated to have been greater than previously thought at 7.1 per cent rather than 6.4 per cent. The recession is estimated to have ended earlier, with the last quarter of negatively quarterly growth in the second quarter of 2009. 2.10 The recent recession lasted for five quarters and GDP fell by 7.1 per cent – a larger decline in output than in either the early-1980s or early-1990s recessions (Table 2.2). Comparing the contraction of total employment in these recessions (given the loss in output) illustrates the resilience of the labour market.
Table 2.2: Fall in output and employment in recessions
Percentage change in recession1
1980s 1990s 2008-09
Gross domestic product -6.0 -2.5 -7.1
LFS employment -2.0 -3.4 -2.1 Source: Office for National Statistics. 1 The percentage change is taken from the quarter in which output peaked to the last quarter in which output declined.
10
National Minimum Wage - Final Government evidence to the Low Pay Commission 2011
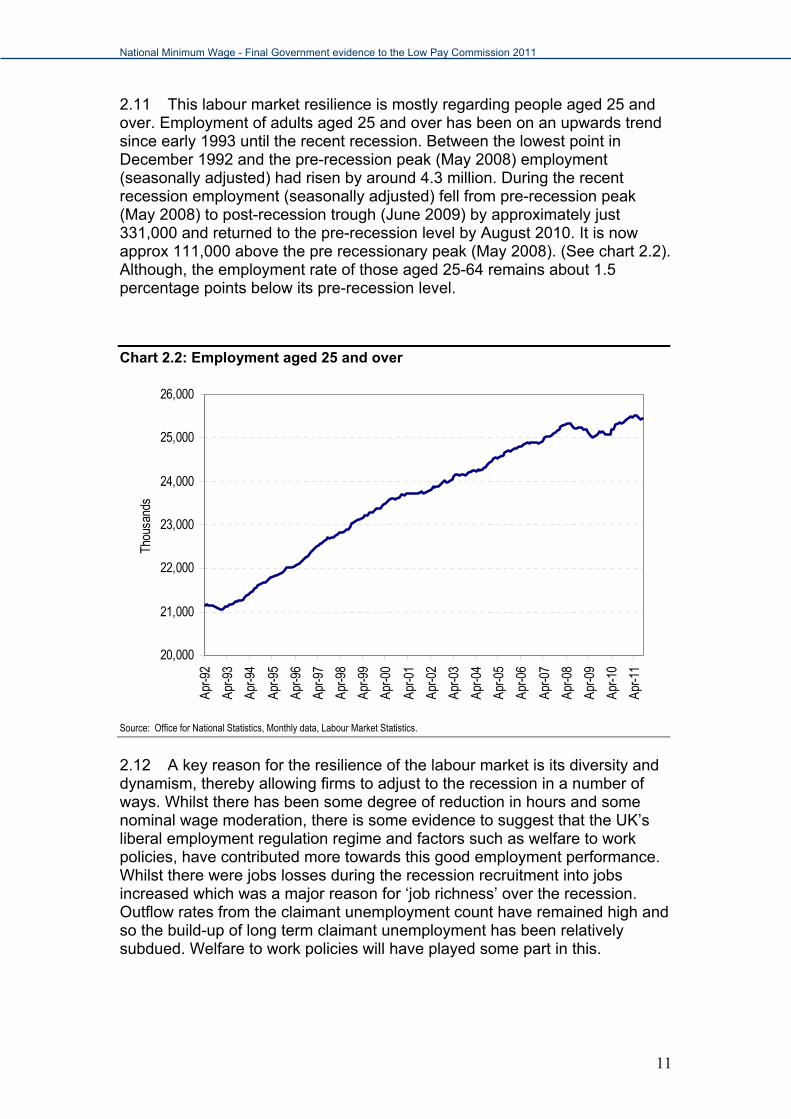
2.11 This labour market resilience is mostly regarding people aged 25 and over. Employment of adults aged 25 and over has been on an upwards trend since early 1993 until the recent recession. Between the lowest point in December 1992 and the pre-recession peak (May 2008) employment (seasonally adjusted) had risen by around 4.3 million. During the recent recession employment (seasonally adjusted) fell from pre-recession peak (May 2008) to post-recession trough (June 2009) by approximately just 331,000 and returned to the pre-recession level by August 2010. It is now approx 111,000 above the pre recessionary peak (May 2008). (See chart 2.2). Although, the employment rate of those aged 25-64 remains about 1.5 percentage points below its pre-recession level.
Chart 2.2: Employment aged 25 and over
20,000
21,000
22,000
23,000
24,000
25,000
26,000
Apr-9
2
Apr-9
3
Apr-9
4
Apr-9
5
Apr-9
6
Apr-9
7
Apr-9
8
Apr-9
9
Apr-0
0
Apr-0
1
Apr-0
2
Apr-0
3
Apr-0
4
Apr-0
5
Apr-0
6
Apr-0
7
Apr-0
8
Apr-0
9
Apr-1
0
Apr-1
1
Thou
sand
s
Source: Office for National Statistics, Monthly data, Labour Market Statistics.
2.12 A key reason for the resilience of the labour market is its diversity and dynamism, thereby allowing firms to adjust to the recession in a number of ways. Whilst there has been some degree of reduction in hours and some nominal wage moderation, there is some evidence to suggest that the UK’s liberal employment regulation regime and factors such as welfare to work policies, have contributed more towards this good employment performance. Whilst there were jobs losses during the recession recruitment into jobs increased which was a major reason for ‘job richness’ over the recession. Outflow rates from the claimant unemployment count have remained high and so the build-up of long term claimant unemployment has been relatively subdued. Welfare to work policies will have played some part in this.
11
National Minimum Wage - Final Government evidence to the Low Pay Commission 2011
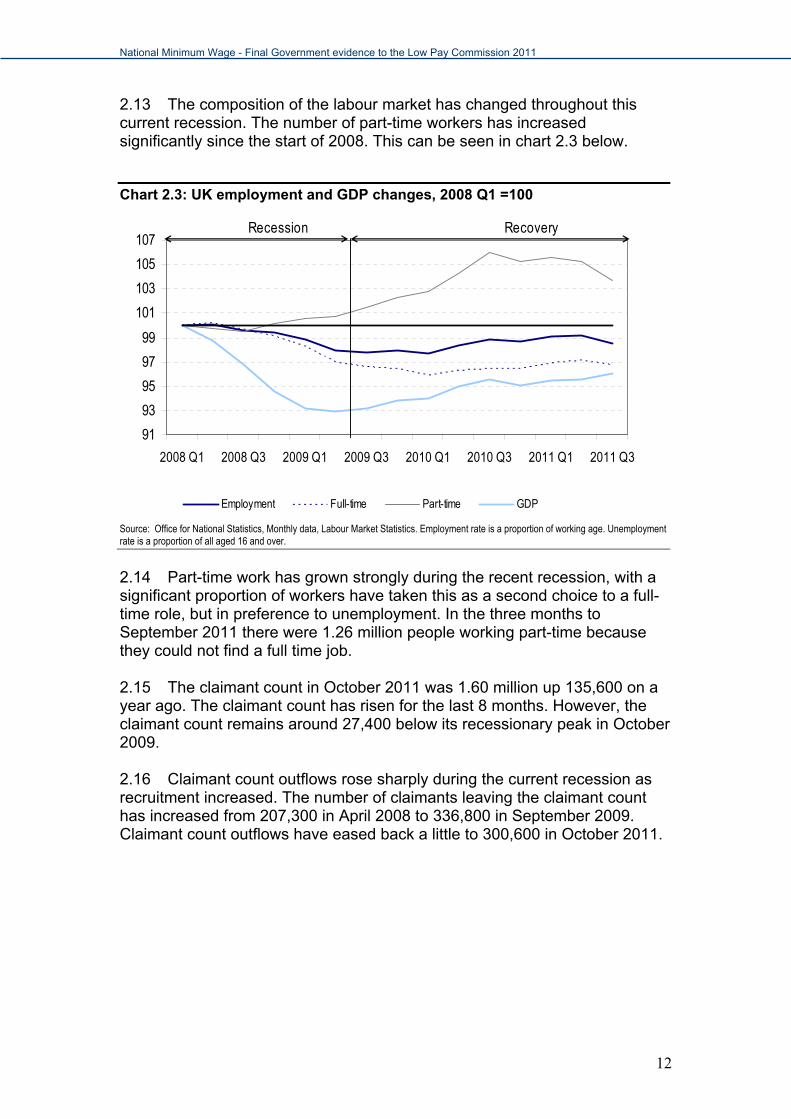
2.13 The composition of the labour market has changed throughout this current recession. The number of part-time workers has increased significantly since the start of 2008. This can be seen in chart 2.3 below.
Chart 2.3: UK employment and GDP changes, 2008 Q1 =100
Source: Office for National Statistics, Monthly data, Labour Market Statistics. Employment rate is a proportion of working age. Unemployment rate is a proportion of all aged 16 and over.
91
93
95
97
99
101
103
105
107
2008 Q1 2008 Q3 2009 Q1 2009 Q3 2010 Q1 2010 Q3 2011 Q1 2011 Q3
Employment Full-time Part-time GDP Series4
Recovery Recession
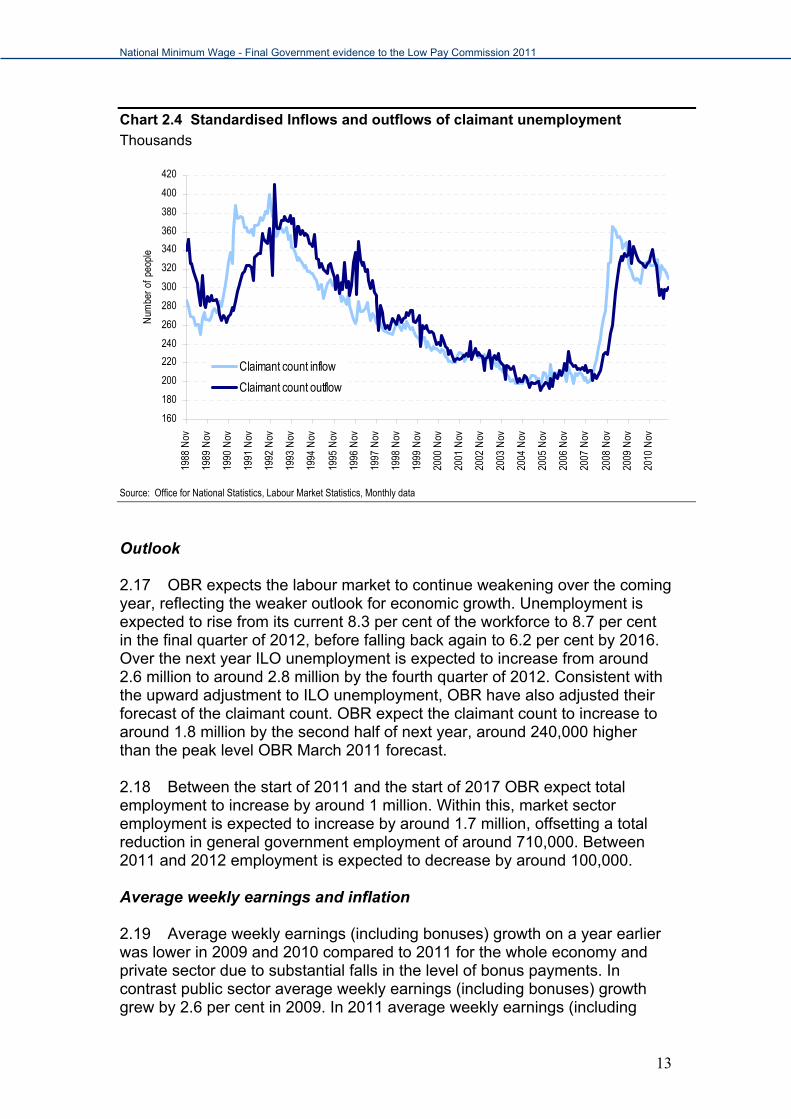
2.14 Part-time work has grown strongly during the recent recession, with a significant proportion of workers have taken this as a second choice to a full- time role, but in preference to unemployment. In the three months to September 2011 there were 1.26 million people working part-time because they could not find a full time job. 2.15 The claimant count in October 2011 was 1.60 million up 135,600 on a year ago. The claimant count has risen for the last 8 months. However, the claimant count remains around 27,400 below its recessionary peak in October 2009. 2.16 Claimant count outflows rose sharply during the current recession as recruitment increased. The number of claimants leaving the claimant count has increased from 207,300 in April 2008 to 336,800 in September 2009. Claimant count outflows have eased back a little to 300,600 in October 2011.
12
National Minimum Wage - Final Government evidence to the Low Pay Commission 2011
Chart 2.4 Standardised Inflows and outflows of claimant unemployment
Thousands
160
180
200
220
240
260
280
300
320
340
360
380
400
42019
88 N
ov
1989
Nov
1990
Nov
1991
Nov
1992
Nov
1993
Nov
1994
Nov
1995
Nov
1996
Nov
1997
Nov
1998
Nov
1999
Nov
2000
Nov
2001
Nov
2002
Nov
2003
Nov
2004
Nov
2005
Nov
2006
Nov
2007
Nov
2008
Nov
2009
Nov
2010
Nov
Num
ber o
f peo
ple
Claimant count inflow
Claimant count outflow
Source: Office for National Statistics, Labour Market Statistics, Monthly data
Outlook 2.17 OBR expects the labour market to continue weakening over the coming year, reflecting the weaker outlook for economic growth. Unemployment is expected to rise from its current 8.3 per cent of the workforce to 8.7 per cent in the final quarter of 2012, before falling back again to 6.2 per cent by 2016. Over the next year ILO unemployment is expected to increase from around 2.6 million to around 2.8 million by the fourth quarter of 2012. Consistent with the upward adjustment to ILO unemployment, OBR have also adjusted their forecast of the claimant count. OBR expect the claimant count to increase to around 1.8 million by the second half of next year, around 240,000 higher than the peak level OBR March 2011 forecast. 2.18 Between the start of 2011 and the start of 2017 OBR expect total employment to increase by around 1 million. Within this, market sector employment is expected to increase by around 1.7 million, offsetting a total reduction in general government employment of around 710,000. Between 2011 and 2012 employment is expected to decrease by around 100,000. Average weekly earnings and inflation 2.19 Average weekly earnings (including bonuses) growth on a year earlier was lower in 2009 and 2010 compared to 2011 for the whole economy and private sector due to substantial falls in the level of bonus payments. In contrast public sector average weekly earnings (including bonuses) growth grew by 2.6 per cent in 2009. In 2011 average weekly earnings (including
13
National Minimum Wage - Final Government evidence to the Low Pay Commission 2011
bonuses) growth picked up and by the three months to September 2011 whole economy AWE growth (including bonuses) was 2.3 per cent on a year earlier. 2.20 Average weekly earnings (excluding bonuses) growth has been less volatile than the AWE (including bonuses). In 2011 AWE growth (excluding bonuses) for the whole economy in the three months to September 2011 was 1.7 per cent.
Table 2.3 Growth in various wage measures
Annual per cent change, 3 month average to September
2009 2010 2011 Average weekly earnings (incl. bonuses) - all sectors 0.7 2.1 2.3 Average weekly earnings (incl. bonuses) - private sector -0.2 1.9 2.4 Average weekly earnings (incl. bonuses) - public sector excluding financial services 2.6 2.2 1.8 Average weekly earnings (excl. bonuses) - all sectors 1.4 2.2 1.7 Average weekly earnings (excl. bonuses) - private sector 0.5 2.1 1.7 Average weekly earnings (excl. bonuses) - public sector excluding financial services 2.9 2.0 1.8 Source: Office for National Statistics, Monthly Wages and Salaries Survey (Note: The AWE uses data collected from the Monthly Wages and Salaries Survey. It is a measure of the level of average earnings, derived by separately weighting the earnings and employment data for the sampled businesses in each month and then calculating the ratio. The AWE replaced the Average Earnings Index (AEI) which used the same data sources and measured growth by calculating the changes in the weighted average pay only for businesses responding to the survey in successive months (the ‘matched’ sample).
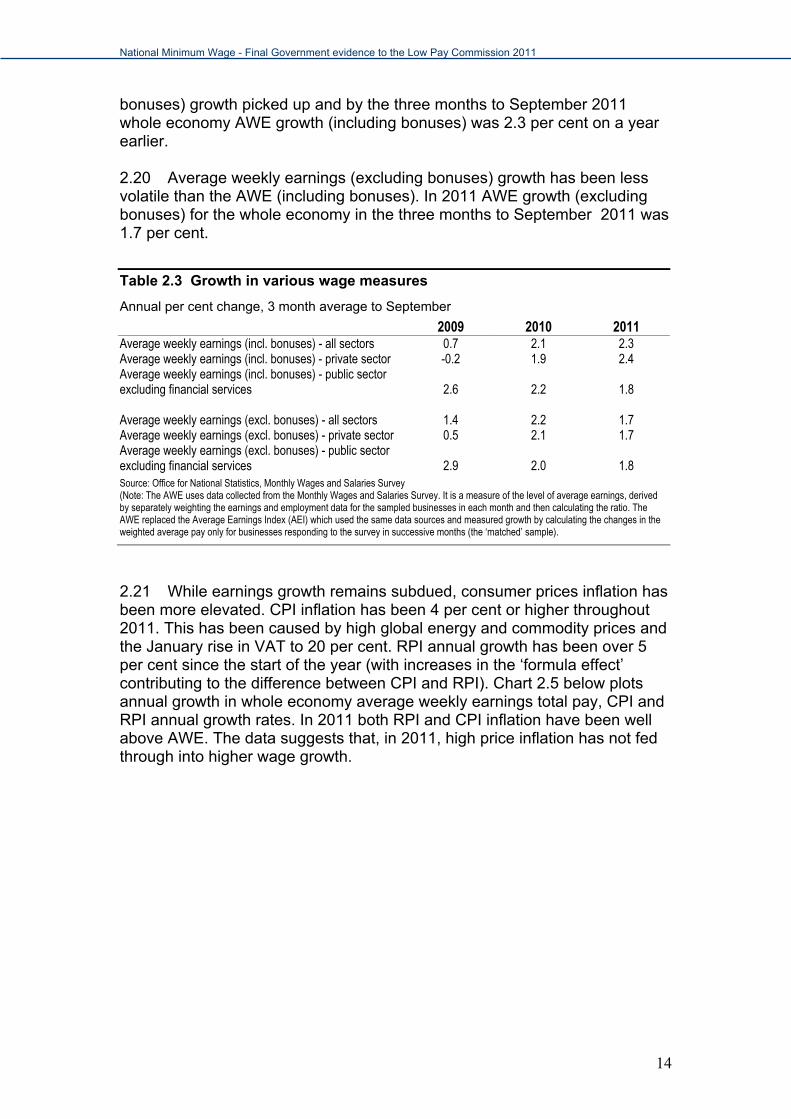
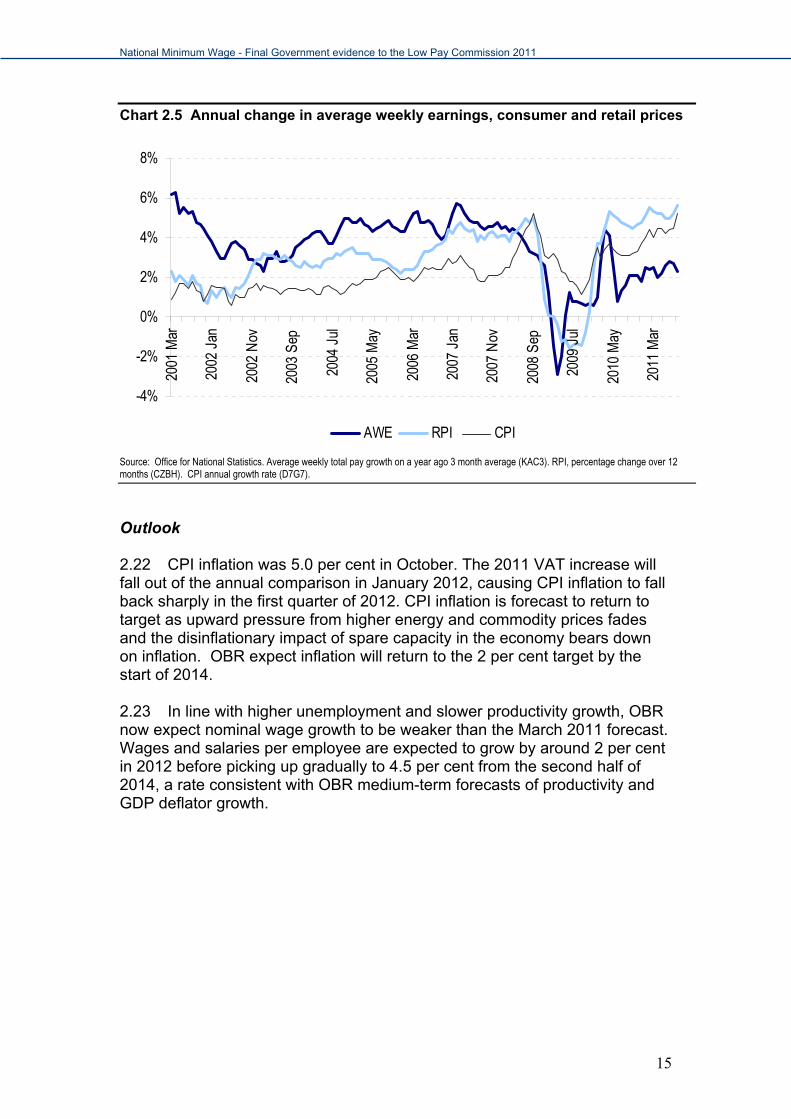
2.21 While earnings growth remains subdued, consumer prices inflation has been more elevated. CPI inflation has been 4 per cent or higher throughout 2011. This has been caused by high global energy and commodity prices and the January rise in VAT to 20 per cent. RPI annual growth has been over 5 per cent since the start of the year (with increases in the ‘formula effect’ contributing to the difference between CPI and RPI). Chart 2.5 below plots annual growth in whole economy average weekly earnings total pay, CPI and RPI annual growth rates. In 2011 both RPI and CPI inflation have been well above AWE. The data suggests that, in 2011, high price inflation has not fed through into higher wage growth.
14
National Minimum Wage - Final Government evidence to the Low Pay Commission 2011
15
Chart 2.5 Annual change in average weekly earnings, consumer and retail prices
-4%
-2%
0%
2%
4%
6%
8%20
01 M
ar
2002
Jan
2002
Nov
2003
Sep
2004
Jul
2005
May
2006
Mar
2007
Jan
2007
Nov
2008
Sep
2009
Jul
2010
May
2011
Mar
AWE RPI CPI
Source: Office for National Statistics. Average weekly total pay growth on a year ago 3 month average (KAC3). RPI, percentage change over 12 months (CZBH). CPI annual growth rate (D7G7).
Outlook 2.22 CPI inflation was 5.0 per cent in October. The 2011 VAT increase will fall out of the annual comparison in January 2012, causing CPI inflation to fall back sharply in the first quarter of 2012. CPI inflation is forecast to return to target as upward pressure from higher energy and commodity prices fades and the disinflationary impact of spare capacity in the economy bears down on inflation. OBR expect inflation will return to the 2 per cent target by the start of 2014. 2.23 In line with higher unemployment and slower productivity growth, OBR now expect nominal wage growth to be weaker than the March 2011 forecast. Wages and salaries per employee are expected to grow by around 2 per cent in 2012 before picking up gradually to 4.5 per cent from the second half of 2014, a rate consistent with OBR medium-term forecasts of productivity and GDP deflator growth.
National Minimum Wage - Final Government evidence to the Low Pay Commission 2011
Evidence on pay
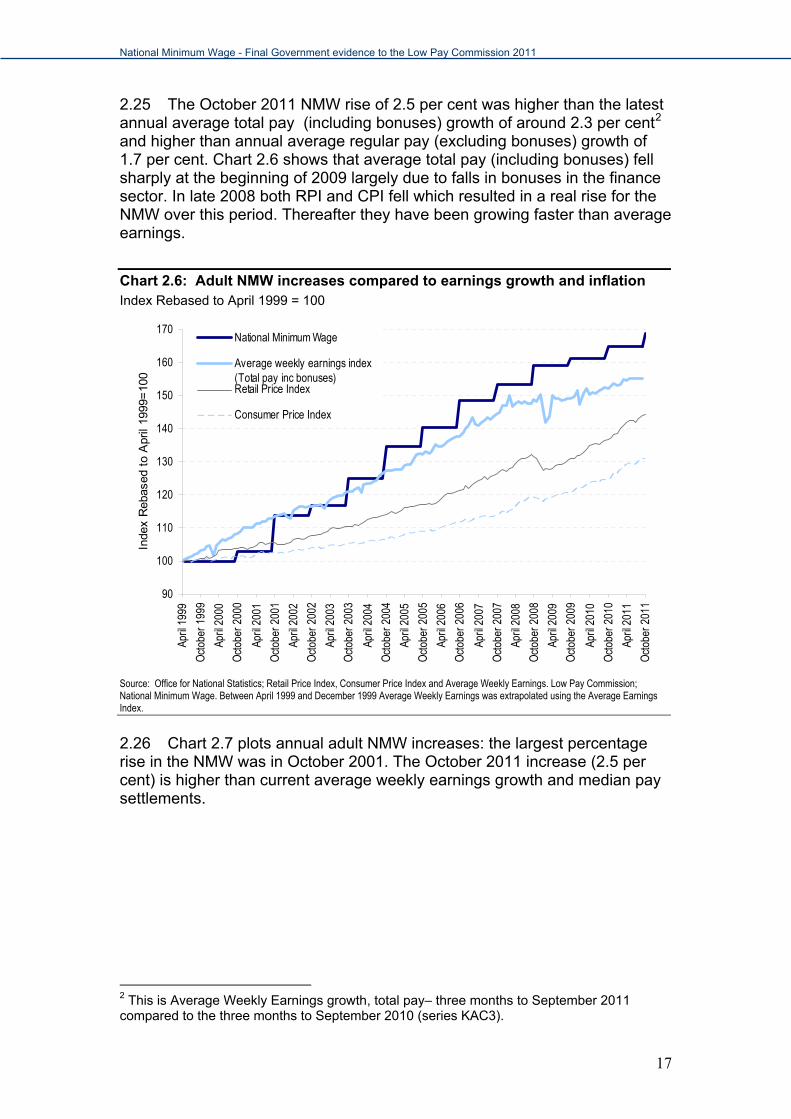
Summary The last five annual adult NMW upratings (2011 to 2007) have been in-line with average earnings growth. This followed increases in the adult NMW in 2001, 2003 and 2004 which were substantially above average earnings growth. The October 2011 adult rate of £6.08 will represent a nominal increase of 2.5 per cent from the October 2010 rate, in line with the average earnings growth increase at the time of the LPC’s recommendations. This increase is below OBR November forecasts for CPI inflation (4.5 per cent) but is higher than OBR average earnings estimates (0.9 per cent) in 2011. The NMW as a percentage of the median wage – known as the ‘bite’ - is now around 52.6 per cent, an increase of around seven percentage points since 1999. Given the adult NMW has risen in line with average earnings in recent years the bite has remained flat between 2007 and 2010. As the NMW has risen, an increasing proportion of the working population are earning wages at or near the statutory minimum. We estimate that around 1.5 million individuals will be covered by the October 2011 NMW uprating1. Growth in the NMW 2.24 The NMW has increased substantially faster than both average earnings and prices, especially since 2001. The October 2011 adult rate is almost 69 per cent higher than the introductory April 1999 rate. Chart 2.1 plots increases in the adult NMW against earnings and inflation from April 1999 to October 2011. Over this period the adult NMW increased by around 69 per cent. In comparison, Average Weekly Earnings (total pay) has risen by only around 55 per cent between April 1999 and the end of September 2011. The Retail Price Index (RPI) has increased by around 44 per cent, and the CPI rose by around 31 per cent between April 1999 and October 2011.
1 See Annex C for further coverage statistics and methodology.
16
National Minimum Wage - Final Government evidence to the Low Pay Commission 2011
2.25 The October 2011 NMW rise of 2.5 per cent was higher than the latest annual average total pay (including bonuses) growth of around 2.3 per cent2 and higher than annual average regular pay (excluding bonuses) growth of 1.7 per cent. Chart 2.6 shows that average total pay (including bonuses) fell sharply at the beginning of 2009 largely due to falls in bonuses in the finance sector. In late 2008 both RPI and CPI fell which resulted in a real rise for the NMW over this period. Thereafter they have been growing faster than average earnings.
Chart 2.6: Adult NMW increases compared to earnings growth and inflation Index Rebased to April 1999 = 100
90
100
110
120
130
140
150
160
170
April
199
9
Oct
ober
199
9
April
200
0
Oct
ober
200
0
April
200
1
Oct
ober
200
1
April
200
2
Oct
ober
200
2
April
200
3
Oct
ober
200
3
April
200
4
Oct
ober
200
4
April
200
5
Oct
ober
200
5
April
200
6
Oct
ober
200
6
April
200
7
Oct
ober
200
7
April
200
8
Oct
ober
200
8
April
200
9
Oct
ober
200
9
April
201
0
Oct
ober
201
0
April
201
1
Oct
ober
201
1
Inde
x R
ebas
ed t
o A
pril
1999
=10
0
National Minimum Wage
Average weekly earnings index(Total pay inc bonuses)Retail Price Index
Consumer Price Index
Source: Office for National Statistics; Retail Price Index, Consumer Price Index and Average Weekly Earnings. Low Pay Commission; National Minimum Wage. Between April 1999 and December 1999 Average Weekly Earnings was extrapolated using the Average Earnings Index.
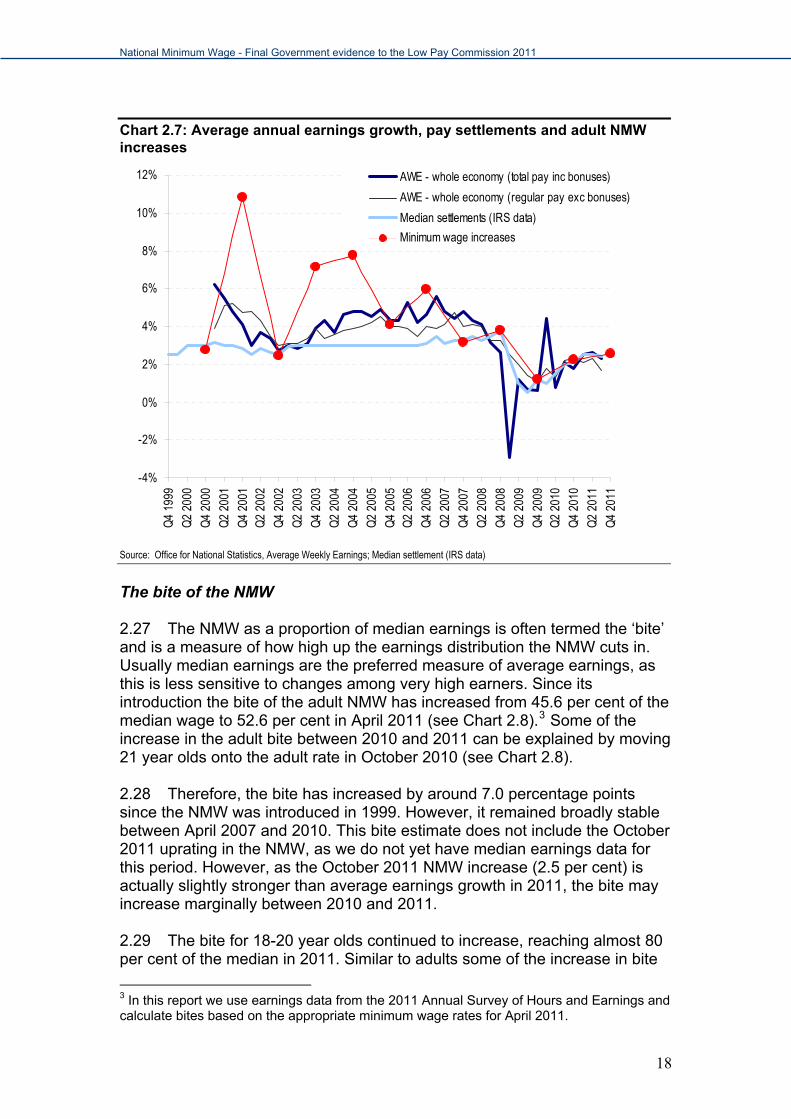
2.26 Chart 2.7 plots annual adult NMW increases: the largest percentage rise in the NMW was in October 2001. The October 2011 increase (2.5 per cent) is higher than current average weekly earnings growth and median pay settlements.
2 This is Average Weekly Earnings growth, total pay– three months to September 2011 compared to the three months to September 2010 (series KAC3).
17
National Minimum Wage - Final Government evidence to the Low Pay Commission 2011
Chart 2.7: Average annual earnings growth, pay settlements and adult NMW increases
-4%
-2%
0%
2%
4%
6%
8%
10%
12%Q
4 19
99
Q2
2000
Q4
2000
Q2
2001
Q4
2001
Q2
2002
Q4
2002
Q2
2003
Q4
2003
Q2
2004
Q4
2004
Q2
2005
Q4
2005
Q2
2006
Q4
2006
Q2
2007
Q4
2007
Q2
2008
Q4
2008
Q2
2009
Q4
2009
Q2
2010
Q4
2010
Q2
2011
Q4
2011
AWE - whole economy (total pay inc bonuses)
AWE - whole economy (regular pay exc bonuses)
Median settlements (IRS data)
Minimum wage increases
Source: Office for National Statistics, Average Weekly Earnings; Median settlement (IRS data)
The bite of the NMW 2.27 The NMW as a proportion of median earnings is often termed the ‘bite’ and is a measure of how high up the earnings distribution the NMW cuts in. Usually median earnings are the preferred measure of average earnings, as this is less sensitive to changes among very high earners. Since its introduction the bite of the adult NMW has increased from 45.6 per cent of the median wage to 52.6 per cent in April 2011 (see Chart 2.8).3 Some of the increase in the adult bite between 2010 and 2011 can be explained by moving 21 year olds onto the adult rate in October 2010 (see Chart 2.8). 2.28 Therefore, the bite has increased by around 7.0 percentage points since the NMW was introduced in 1999. However, it remained broadly stable between April 2007 and 2010. This bite estimate does not include the October 2011 uprating in the NMW, as we do not yet have median earnings data for this period. However, as the October 2011 NMW increase (2.5 per cent) is actually slightly stronger than average earnings growth in 2011, the bite may increase marginally between 2010 and 2011. 2.29 The bite for 18-20 year olds continued to increase, reaching almost 80 per cent of the median in 2011. Similar to adults some of the increase in bite
3 In this report we use earnings data from the 2011 Annual Survey of Hours and Earnings and calculate bites based on the appropriate minimum wage rates for April 2011.
18
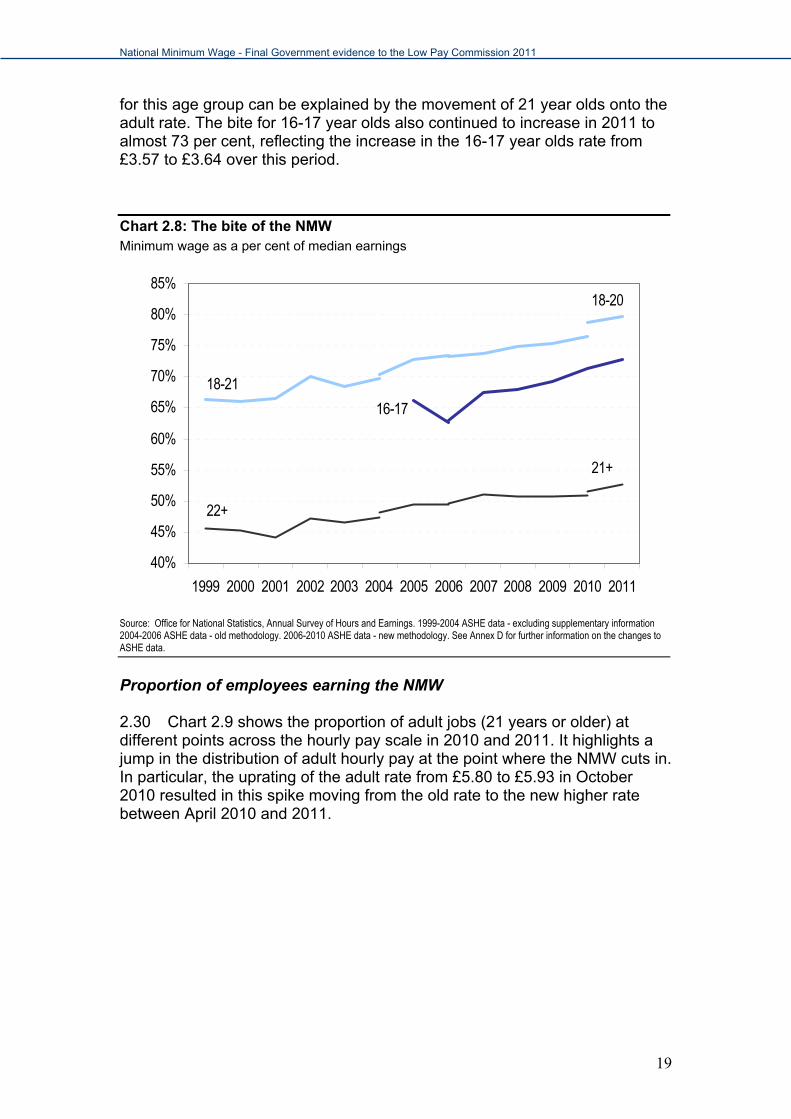
National Minimum Wage - Final Government evidence to the Low Pay Commission 2011
for this age group can be explained by the movement of 21 year olds onto the adult rate. The bite for 16-17 year olds also continued to increase in 2011 to almost 73 per cent, reflecting the increase in the 16-17 year olds rate from £3.57 to £3.64 over this period.
Chart 2.8: The bite of the NMW Minimum wage as a per cent of median earnings
40%
45%
50%
55%
60%
65%
70%
75%
80%
85%
1999 2000 2001 2002 2003 2004 2005 2006 2007 2008 2009 2010 2011
21+
18-20
16-17
18-21
22+
Source: Office for National Statistics, Annual Survey of Hours and Earnings. 1999-2004 ASHE data - excluding supplementary information 2004-2006 ASHE data - old methodology. 2006-2010 ASHE data - new methodology. See Annex D for further information on the changes to ASHE data.
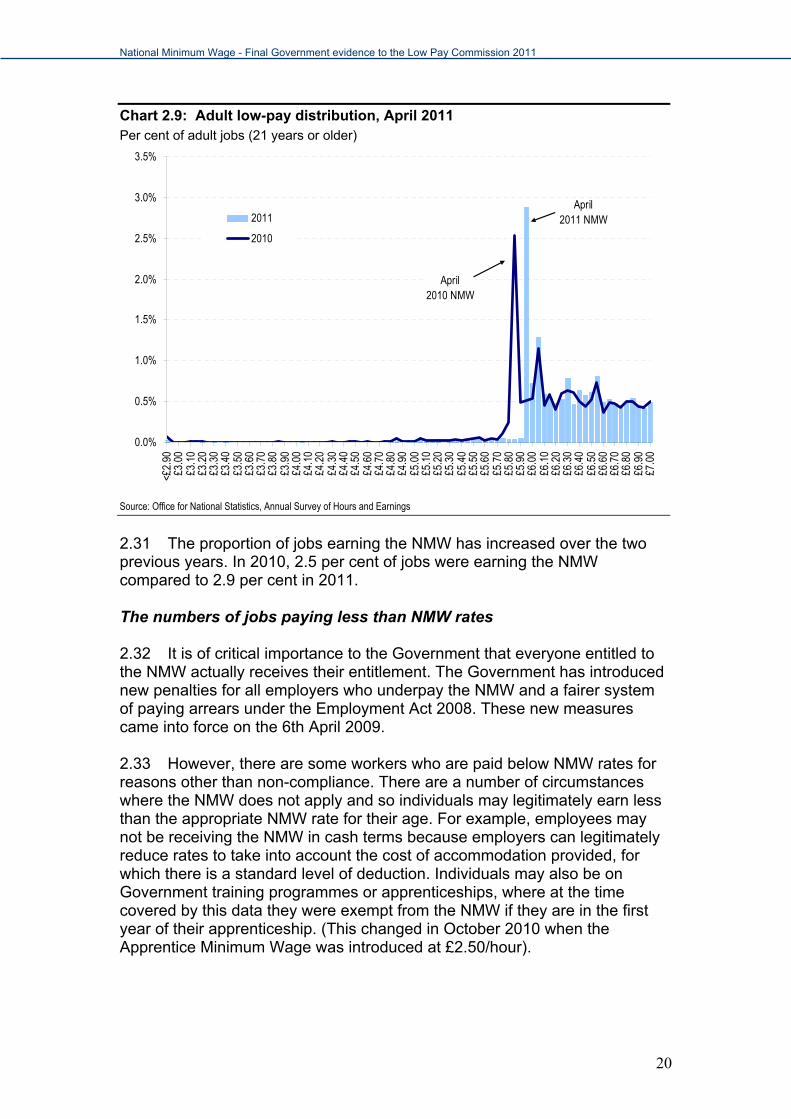
Proportion of employees earning the NMW 2.30 Chart 2.9 shows the proportion of adult jobs (21 years or older) at different points across the hourly pay scale in 2010 and 2011. It highlights a jump in the distribution of adult hourly pay at the point where the NMW cuts in. In particular, the uprating of the adult rate from £5.80 to £5.93 in October 2010 resulted in this spike moving from the old rate to the new higher rate between April 2010 and 2011.
19
National Minimum Wage - Final Government evidence to the Low Pay Commission 2011
Chart 2.9: Adult low-pay distribution, April 2011 Per cent of adult jobs (21 years or older)
April2011 NMW
April 2010 NMW
0.0%
0.5%
1.0%
1.5%
2.0%
2.5%
3.0%
3.5%<£
2.90
£3.0
0£3
.10
£3.2
0£3
.30
£3.4
0£3
.50
£3.6
0£3
.70
£3.8
0£3
.90
£4.0
0£4
.10
£4.2
0£4
.30
£4.4
0£4
.50
£4.6
0£4
.70
£4.8
0£4
.90
£5.0
0£5
.10
£5.2
0£5
.30
£5.4
0£5
.50
£5.6
0£5
.70
£5.8
0£5
.90
£6.0
0£6
.10
£6.2
0£6
.30
£6.4
0£6
.50
£6.6
0£6
.70
£6.8
0£6
.90
£7.0
0
2011
2010
Source: Office for National Statistics, Annual Survey of Hours and Earnings
2.31 The proportion of jobs earning the NMW has increased over the two previous years. In 2010, 2.5 per cent of jobs were earning the NMW compared to 2.9 per cent in 2011. The numbers of jobs paying less than NMW rates 2.32 It is of critical importance to the Government that everyone entitled to the NMW actually receives their entitlement. The Government has introduced new penalties for all employers who underpay the NMW and a fairer system of paying arrears under the Employment Act 2008. These new measures came into force on the 6th April 2009. 2.33 However, there are some workers who are paid below NMW rates for reasons other than non-compliance. There are a number of circumstances where the NMW does not apply and so individuals may legitimately earn less than the appropriate NMW rate for their age. For example, employees may not be receiving the NMW in cash terms because employers can legitimately reduce rates to take into account the cost of accommodation provided, for which there is a standard level of deduction. Individuals may also be on Government training programmes or apprenticeships, where at the time covered by this data they were exempt from the NMW if they are in the first year of their apprenticeship. (This changed in October 2010 when the Apprentice Minimum Wage was introduced at £2.50/hour).
20
National Minimum Wage - Final Government evidence to the Low Pay Commission 2011
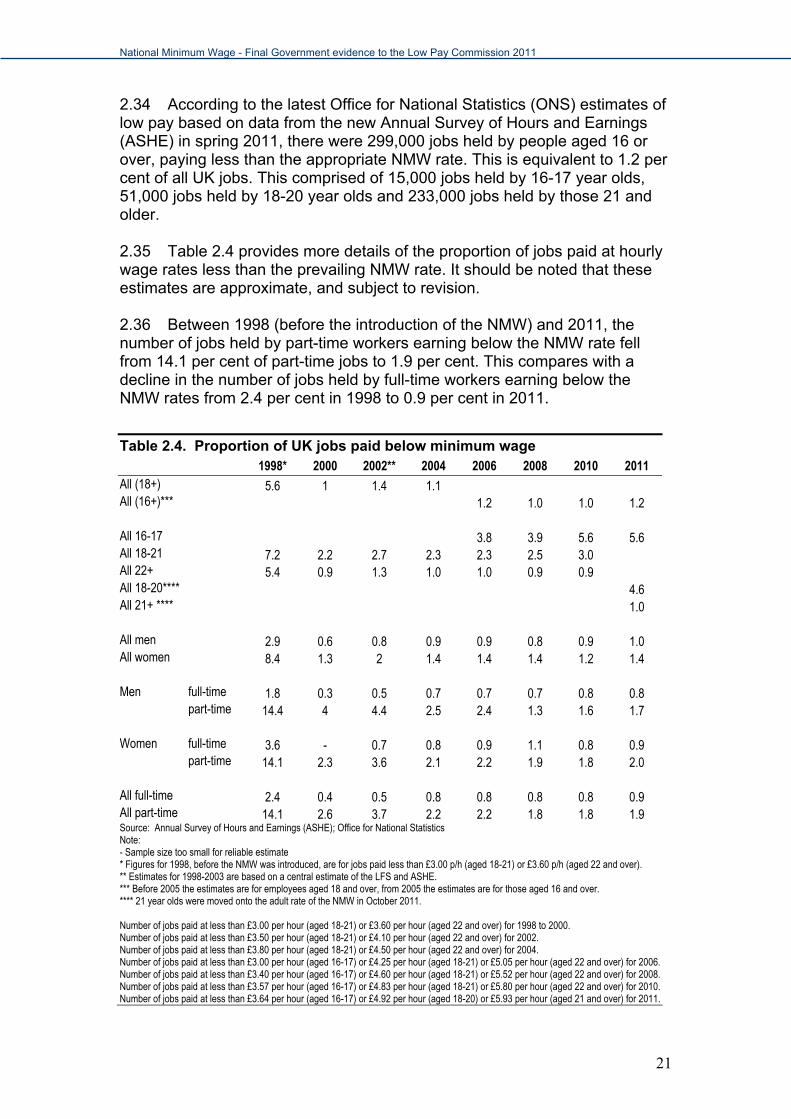
2.34 According to the latest Office for National Statistics (ONS) estimates of low pay based on data from the new Annual Survey of Hours and Earnings (ASHE) in spring 2011, there were 299,000 jobs held by people aged 16 or over, paying less than the appropriate NMW rate. This is equivalent to 1.2 per cent of all UK jobs. This comprised of 15,000 jobs held by 16-17 year olds, 51,000 jobs held by 18-20 year olds and 233,000 jobs held by those 21 and older. 2.35 Table 2.4 provides more details of the proportion of jobs paid at hourly wage rates less than the prevailing NMW rate. It should be noted that these estimates are approximate, and subject to revision. 2.36 Between 1998 (before the introduction of the NMW) and 2011, the number of jobs held by part-time workers earning below the NMW rate fell from 14.1 per cent of part-time jobs to 1.9 per cent. This compares with a decline in the number of jobs held by full-time workers earning below the NMW rates from 2.4 per cent in 1998 to 0.9 per cent in 2011.
Table 2.4. Proportion of UK jobs paid below minimum wage 1998* 2000 2002** 2004 2006 2008 2010 2011 All (18+) 5.6 1 1.4 1.1 All (16+)*** 1.2 1.0 1.0 1.2 All 16-17 3.8 3.9 5.6 5.6 All 18-21 7.2 2.2 2.7 2.3 2.3 2.5 3.0 All 22+ 5.4 0.9 1.3 1.0 1.0 0.9 0.9 All 18-20**** 4.6 All 21+ **** 1.0 All men 2.9 0.6 0.8 0.9 0.9 0.8 0.9 1.0 All women 8.4 1.3 2 1.4 1.4 1.4 1.2 1.4 Men full-time 1.8 0.3 0.5 0.7 0.7 0.7 0.8 0.8 part-time 14.4 4 4.4 2.5 2.4 1.3 1.6 1.7 Women full-time 3.6 - 0.7 0.8 0.9 1.1 0.8 0.9 part-time 14.1 2.3 3.6 2.1 2.2 1.9 1.8 2.0 All full-time 2.4 0.4 0.5 0.8 0.8 0.8 0.8 0.9 All part-time 14.1 2.6 3.7 2.2 2.2 1.8 1.8 1.9 Source: Annual Survey of Hours and Earnings (ASHE); Office for National Statistics Note: - Sample size too small for reliable estimate * Figures for 1998, before the NMW was introduced, are for jobs paid less than £3.00 p/h (aged 18-21) or £3.60 p/h (aged 22 and over). ** Estimates for 1998-2003 are based on a central estimate of the LFS and ASHE. *** Before 2005 the estimates are for employees aged 18 and over, from 2005 the estimates are for those aged 16 and over. **** 21 year olds were moved onto the adult rate of the NMW in October 2011. Number of jobs paid at less than £3.00 per hour (aged 18-21) or £3.60 per hour (aged 22 and over) for 1998 to 2000. Number of jobs paid at less than £3.50 per hour (aged 18-21) or £4.10 per hour (aged 22 and over) for 2002. Number of jobs paid at less than £3.80 per hour (aged 18-21) or £4.50 per hour (aged 22 and over) for 2004. Number of jobs paid at less than £3.00 per hour (aged 16-17) or £4.25 per hour (aged 18-21) or £5.05 per hour (aged 22 and over) for 2006. Number of jobs paid at less than £3.40 per hour (aged 16-17) or £4.60 per hour (aged 18-21) or £5.52 per hour (aged 22 and over) for 2008. Number of jobs paid at less than £3.57 per hour (aged 16-17) or £4.83 per hour (aged 18-21) or £5.80 per hour (aged 22 and over) for 2010. Number of jobs paid at less than £3.64 per hour (aged 16-17) or £4.92 per hour (aged 18-20) or £5.93 per hour (aged 21 and over) for 2011.
21
National Minimum Wage - Final Government evidence to the Low Pay Commission 2011
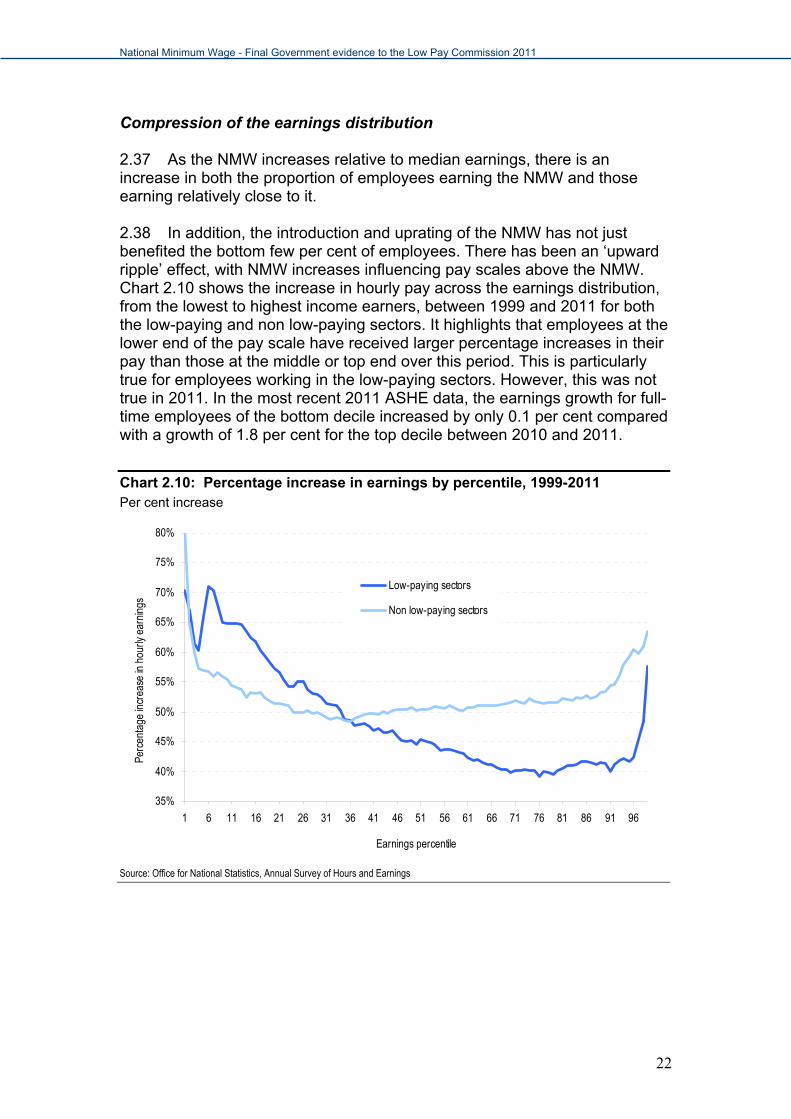
Compression of the earnings distribution 2.37 As the NMW increases relative to median earnings, there is an increase in both the proportion of employees earning the NMW and those earning relatively close to it. 2.38 In addition, the introduction and uprating of the NMW has not just benefited the bottom few per cent of employees. There has been an ‘upward ripple’ effect, with NMW increases influencing pay scales above the NMW. Chart 2.10 shows the increase in hourly pay across the earnings distribution, from the lowest to highest income earners, between 1999 and 2011 for both the low-paying and non low-paying sectors. It highlights that employees at the lower end of the pay scale have received larger percentage increases in their pay than those at the middle or top end over this period. This is particularly true for employees working in the low-paying sectors. However, this was not true in 2011. In the most recent 2011 ASHE data, the earnings growth for full-time employees of the bottom decile increased by only 0.1 per cent compared with a growth of 1.8 per cent for the top decile between 2010 and 2011.
Chart 2.10: Percentage increase in earnings by percentile, 1999-2011 Per cent increase
35%
40%
45%
50%
55%
60%
65%
70%
75%
80%
1 6 11 16 21 26 31 36 41 46 51 56 61 66 71 76 81 86 91 96
Earnings percentile
Perc
enta
ge in
crea
se in
hou
rly e
arni
ngs
Low-paying sectors
Non low-paying sectors
Source: Office for National Statistics, Annual Survey of Hours and Earnings
22
National Minimum Wage - Final Government evidence to the Low Pay Commission 2011
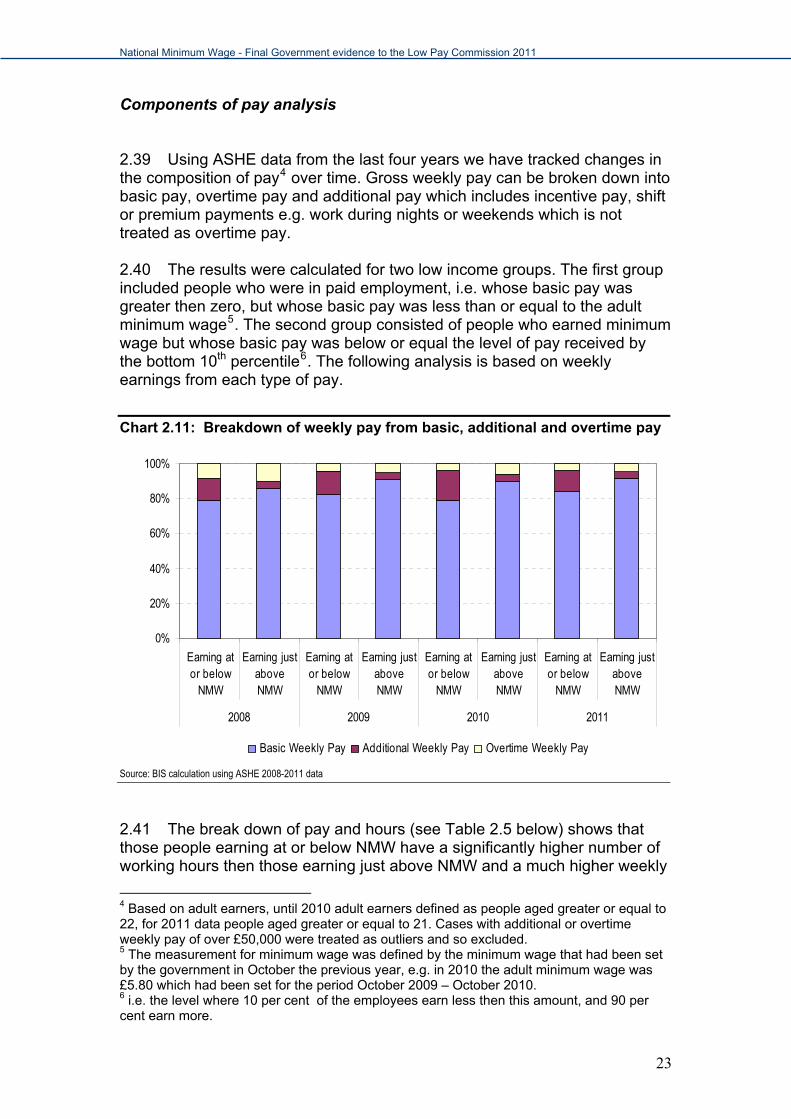
Components of pay analysis 2.39 Using ASHE data from the last four years we have tracked changes in the composition of pay4 over time. Gross weekly pay can be broken down into basic pay, overtime pay and additional pay which includes incentive pay, shift or premium payments e.g. work during nights or weekends which is not treated as overtime pay. 2.40 The results were calculated for two low income groups. The first group included people who were in paid employment, i.e. whose basic pay was greater then zero, but whose basic pay was less than or equal to the adult minimum wage5. The second group consisted of people who earned minimum wage but whose basic pay was below or equal the level of pay received by the bottom 10th percentile6. The following analysis is based on weekly earnings from each type of pay.
Chart 2.11: Breakdown of weekly pay from basic, additional and overtime pay
0%
20%
40%
60%
80%
100%
Earning ator below
NMW
Earning justaboveNMW
Earning ator below
NMW
Earning justaboveNMW
Earning ator below
NMW
Earning justaboveNMW
Earning ator below
NMW
Earning justaboveNMW
2008 2009 2010 2011
Basic Weekly Pay Additional Weekly Pay Overtime Weekly Pay
Source: BIS calculation using ASHE 2008-2011 data
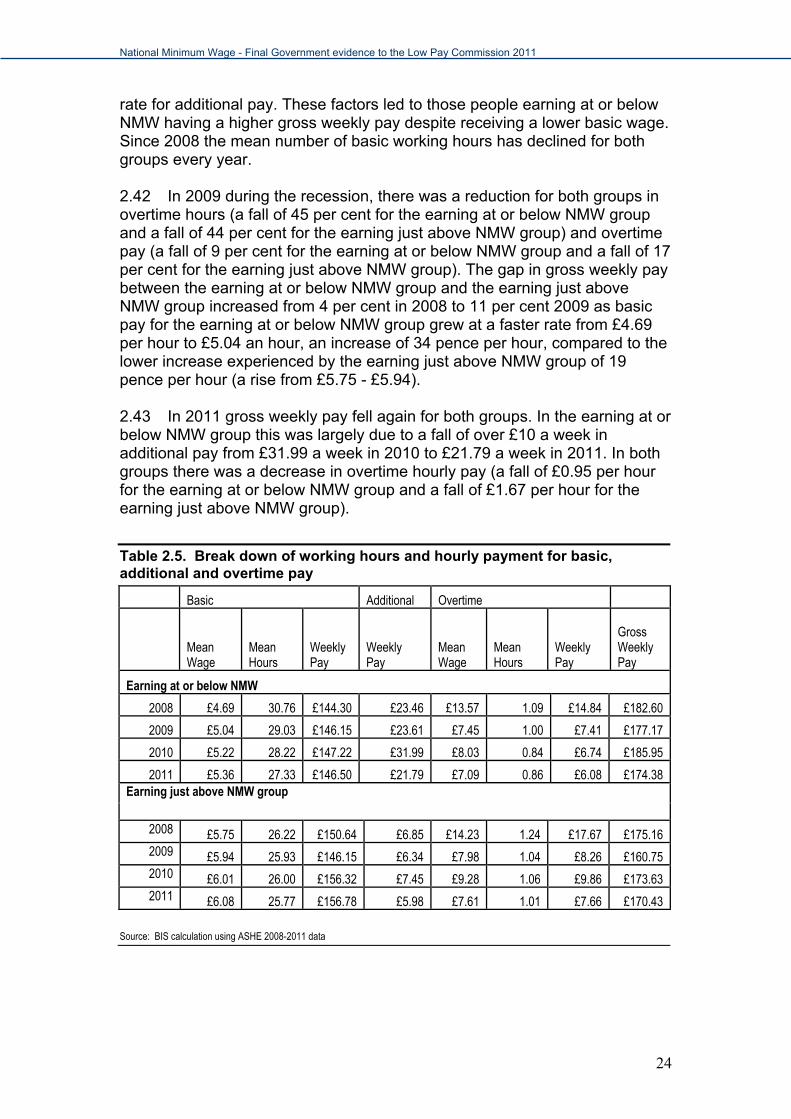
2.41 The break down of pay and hours (see Table 2.5 below) shows that those people earning at or below NMW have a significantly higher number of working hours then those earning just above NMW and a much higher weekly
4 Based on adult earners, until 2010 adult earners defined as people aged greater or equal to 22, for 2011 data people aged greater or equal to 21. Cases with additional or overtime weekly pay of over £50,000 were treated as outliers and so excluded. 5 The measurement for minimum wage was defined by the minimum wage that had been set by the government in October the previous year, e.g. in 2010 the adult minimum wage was £5.80 which had been set for the period October 2009 – October 2010. 6 i.e. the level where 10 per cent of the employees earn less then this amount, and 90 per cent earn more.
23
National Minimum Wage - Final Government evidence to the Low Pay Commission 2011
24
rate for additional pay. These factors led to those people earning at or below NMW having a higher gross weekly pay despite receiving a lower basic wage. Since 2008 the mean number of basic working hours has declined for both groups every year. 2.42 In 2009 during the recession, there was a reduction for both groups in overtime hours (a fall of 45 per cent for the earning at or below NMW group and a fall of 44 per cent for the earning just above NMW group) and overtime pay (a fall of 9 per cent for the earning at or below NMW group and a fall of 17 per cent for the earning just above NMW group). The gap in gross weekly pay between the earning at or below NMW group and the earning just above NMW group increased from 4 per cent in 2008 to 11 per cent 2009 as basic pay for the earning at or below NMW group grew at a faster rate from £4.69 per hour to £5.04 an hour, an increase of 34 pence per hour, compared to the lower increase experienced by the earning just above NMW group of 19 pence per hour (a rise from £5.75 - £5.94). 2.43 In 2011 gross weekly pay fell again for both groups. In the earning at or below NMW group this was largely due to a fall of over £10 a week in additional pay from £31.99 a week in 2010 to £21.79 a week in 2011. In both groups there was a decrease in overtime hourly pay (a fall of £0.95 per hour for the earning at or below NMW group and a fall of £1.67 per hour for the earning just above NMW group).
Table 2.5. Break down of working hours and hourly payment for basic, additional and overtime pay
Basic Additional Overtime
Mean Wage
Mean Hours
Weekly Pay
Weekly Pay
Mean Wage
Mean Hours
Weekly Pay
Gross Weekly Pay
Earning at or below NMW
2008 £4.69 30.76 £144.30 £23.46 £13.57 1.09 £14.84 £182.60
2009 £5.04 29.03 £146.15 £23.61 £7.45 1.00 £7.41 £177.17
2010 £5.22 28.22 £147.22 £31.99 £8.03 0.84 £6.74 £185.95
2011 £5.36 27.33 £146.50 £21.79 £7.09 0.86 £6.08 £174.38 Earning just above NMW group
2008 £5.75 26.22 £150.64 £6.85 £14.23 1.24 £17.67 £175.16 2009 £5.94 25.93 £146.15 £6.34 £7.98 1.04 £8.26 £160.75 2010 £6.01 26.00 £156.32 £7.45 £9.28 1.06 £9.86 £173.63 2011 £6.08 25.77 £156.78 £5.98 £7.61 1.01 £7.66 £170.43
Source: BIS calculation using ASHE 2008-2011 data
National Minimum Wage - Final Government evidence to the Low Pay Commission 2011
Impact of the NMW on the labour market
Summary Empirical studies from the UK have not shown significant evidence that the adult NMW has reduced adult employment. However, most of the evidence focuses on a period in which there was a growing labour market. The evidence base, both in the UK and internationally, of a possible impact of minimum wages in an economic downturn has only started to emerge. Although, there has been an absolute increase in employment there has also been a slight decline in the relative share of UK employment in low-paying sectors since 1999. However, this is a trend that predates the introduction of the NMW. Over the year to Q2 2011 employee jobs in the low paying sectors increased by 0.2 per cent which was more than job growth in the whole economy - 0.1 per cent. 2.44 A simple perfectly competitive model of the labour market would suggest that the introduction of a minimum wage above the market-clearing wage will lead to the supply of workers outstripping demand, resulting in a fall in employment and a rise in ‘involuntary unemployment’. ‘Involuntary unemployment’ will rise also because the high wage will attract new entrants into the labour market increasing the labour supply; but, as supply outstrips demand they will be unable to find jobs. However, if the labour market is not highly competitive or there are labour market frictions, there may be opportunities for firms to limit their employment to restrain wages below the market-clearing wage. In these circumstances a minimum wage will not necessarily lead to increased unemployment, and might even increase employment. 2.45 Empirical work from the UK has not found significant evidence that the adult NMW has reduced employment. However, most of the evidence focuses on a period in which there was a growing labour market and only very recently is the evidence base, both in the UK and internationally, of the possible impact of minimum wages in an economic downturn emerging. Dickens and Dolton 20117 examined data from the 1980s and 1990s to attempt to identify the effect of recessions on the impact of minimum wages set by Wage Councils. Their results suggest that minimum rates of pay set by the Wages Councils had a positive impact on employment growth and that this finding remained true through the 1980s and 1990s recessions.
7 Dickens, R and P. Dolton, 2011, Using wage council data to identify the effect of recessions on the impact of the minimum wage, Research report for the Low Pay Commission. University of Sussex, Royal Holloway, and Centre for Economic Performance, London School of Economics.)
25
National Minimum Wage - Final Government evidence to the Low Pay Commission 2011
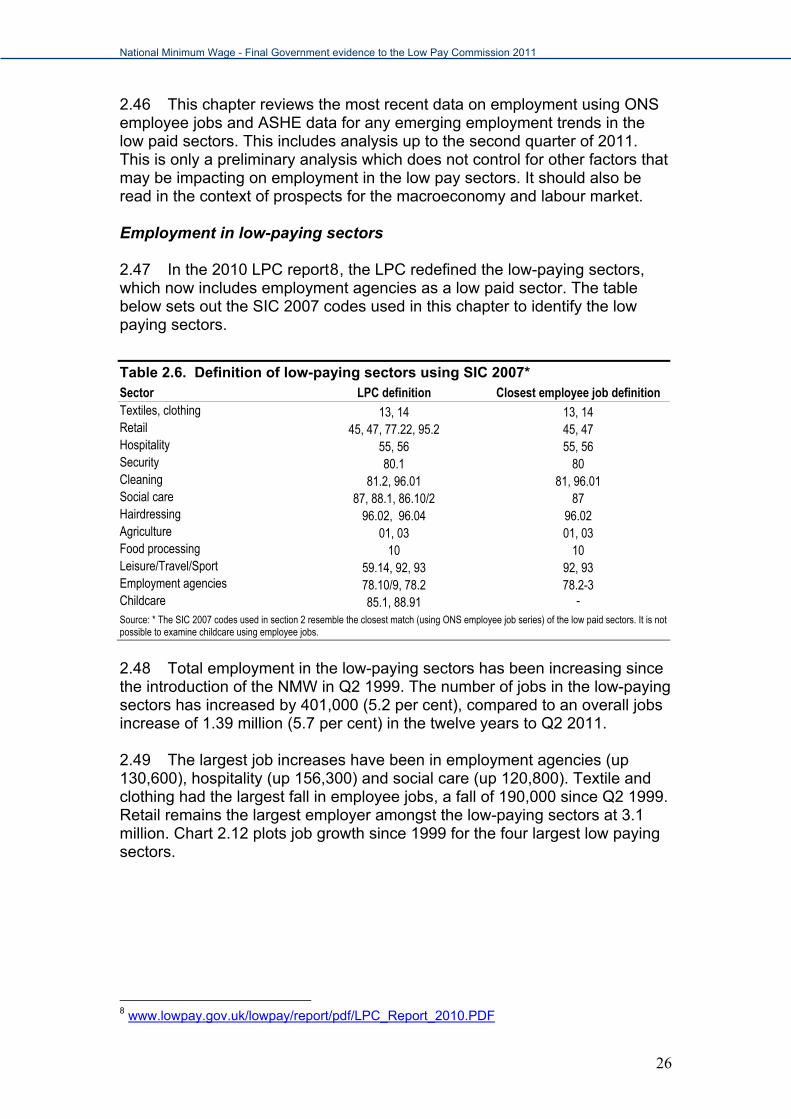
2.46 This chapter reviews the most recent data on employment using ONS employee jobs and ASHE data for any emerging employment trends in the low paid sectors. This includes analysis up to the second quarter of 2011. This is only a preliminary analysis which does not control for other factors that may be impacting on employment in the low pay sectors. It should also be read in the context of prospects for the macroeconomy and labour market. Employment in low-paying sectors 2.47 In the 2010 LPC report8, the LPC redefined the low-paying sectors, which now includes employment agencies as a low paid sector. The table below sets out the SIC 2007 codes used in this chapter to identify the low paying sectors.
Table 2.6. Definition of low-paying sectors using SIC 2007* Sector LPC definition Closest employee job definition Textiles, clothing 13, 14 13, 14 Retail 45, 47, 77.22, 95.2 45, 47 Hospitality 55, 56 55, 56 Security 80.1 80 Cleaning 81.2, 96.01 81, 96.01 Social care 87, 88.1, 86.10/2 87 Hairdressing 96.02, 96.04 96.02 Agriculture 01, 03 01, 03 Food processing 10 10 Leisure/Travel/Sport 59.14, 92, 93 92, 93 Employment agencies 78.10/9, 78.2 78.2-3 Childcare 85.1, 88.91 - Source: * The SIC 2007 codes used in section 2 resemble the closest match (using ONS employee job series) of the low paid sectors. It is not possible to examine childcare using employee jobs.
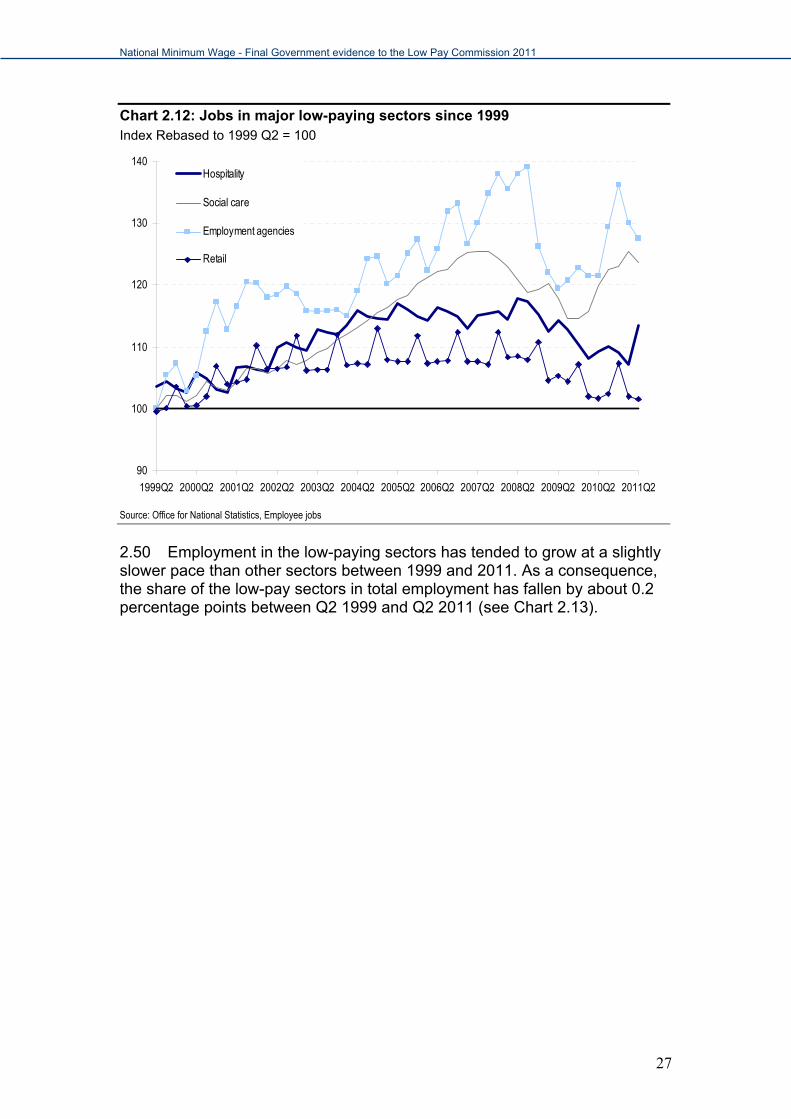
2.48 Total employment in the low-paying sectors has been increasing since the introduction of the NMW in Q2 1999. The number of jobs in the low-paying sectors has increased by 401,000 (5.2 per cent), compared to an overall jobs increase of 1.39 million (5.7 per cent) in the twelve years to Q2 2011. 2.49 The largest job increases have been in employment agencies (up 130,600), hospitality (up 156,300) and social care (up 120,800). Textile and clothing had the largest fall in employee jobs, a fall of 190,000 since Q2 1999. Retail remains the largest employer amongst the low-paying sectors at 3.1 million. Chart 2.12 plots job growth since 1999 for the four largest low paying sectors.
8 www.lowpay.gov.uk/lowpay/report/pdf/LPC_Report_2010.PDF
26
National Minimum Wage - Final Government evidence to the Low Pay Commission 2011
Chart 2.12: Jobs in major low-paying sectors since 1999 Index Rebased to 1999 Q2 = 100
90
100
110
120
130
140
1999Q2 2000Q2 2001Q2 2002Q2 2003Q2 2004Q2 2005Q2 2006Q2 2007Q2 2008Q2 2009Q2 2010Q2 2011Q2
Hospitality
Social care
Employment agencies
Retail
Source: Office for National Statistics, Employee jobs
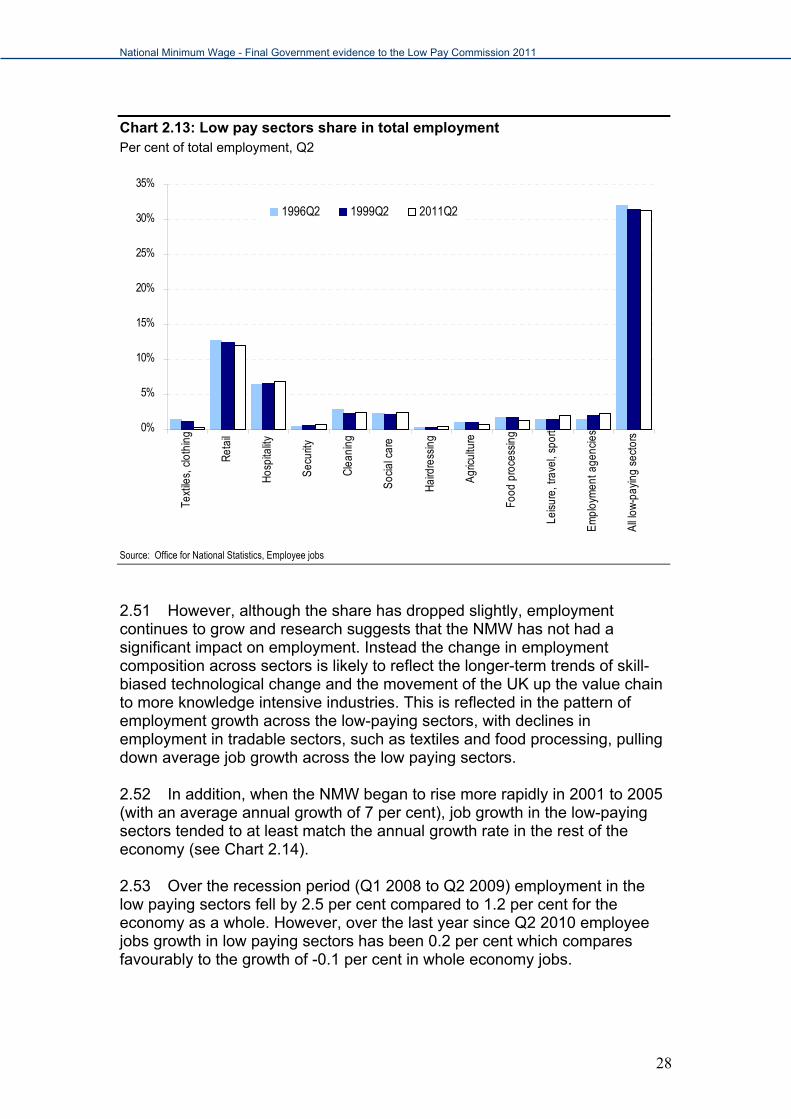
2.50 Employment in the low-paying sectors has tended to grow at a slightly slower pace than other sectors between 1999 and 2011. As a consequence, the share of the low-pay sectors in total employment has fallen by about 0.2 percentage points between Q2 1999 and Q2 2011 (see Chart 2.13).
27
National Minimum Wage - Final Government evidence to the Low Pay Commission 2011
Chart 2.13: Low pay sectors share in total employment Per cent of total employment, Q2
0%
5%
10%
15%
20%
25%
30%
35%Te
xtile
s, c
loth
ing
Ret
ail
Hos
pita
lity
Sec
urity
Cle
anin
g
Soc
ial c
are
Hai
rdre
ssin
g
Agr
icul
ture
Food
pro
cess
ing
Leis
ure,
trav
el, s
port
Em
ploy
men
t age
ncie
s
All
low
-pay
ing
sect
ors
1996Q2 1999Q2 2011Q2
Source: Office for National Statistics, Employee jobs
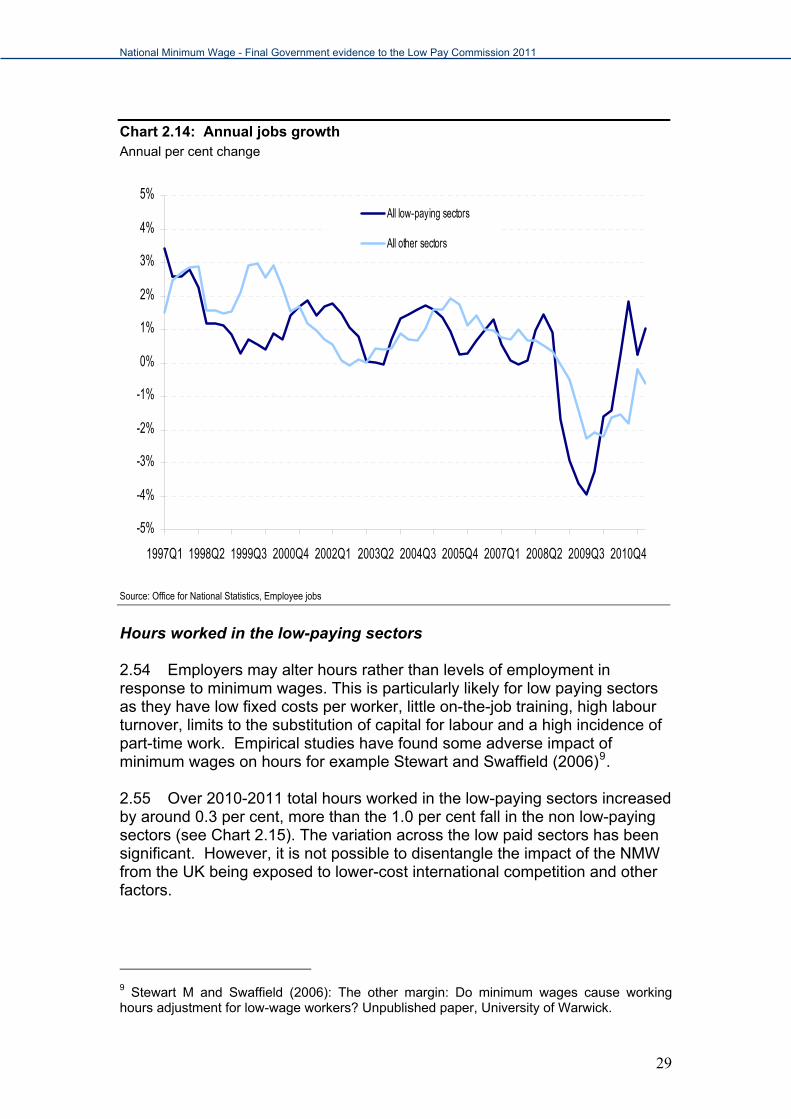
2.51 However, although the share has dropped slightly, employment continues to grow and research suggests that the NMW has not had a significant impact on employment. Instead the change in employment composition across sectors is likely to reflect the longer-term trends of skill-biased technological change and the movement of the UK up the value chain to more knowledge intensive industries. This is reflected in the pattern of employment growth across the low-paying sectors, with declines in employment in tradable sectors, such as textiles and food processing, pulling down average job growth across the low paying sectors. 2.52 In addition, when the NMW began to rise more rapidly in 2001 to 2005 (with an average annual growth of 7 per cent), job growth in the low-paying sectors tended to at least match the annual growth rate in the rest of the economy (see Chart 2.14). 2.53 Over the recession period (Q1 2008 to Q2 2009) employment in the low paying sectors fell by 2.5 per cent compared to 1.2 per cent for the economy as a whole. However, over the last year since Q2 2010 employee jobs growth in low paying sectors has been 0.2 per cent which compares favourably to the growth of -0.1 per cent in whole economy jobs.
28
National Minimum Wage - Final Government evidence to the Low Pay Commission 2011
Chart 2.14: Annual jobs growth Annual per cent change
-5%
-4%
-3%
-2%
-1%
0%
1%
2%
3%
4%
5%
1997Q1 1998Q2 1999Q3 2000Q4 2002Q1 2003Q2 2004Q3 2005Q4 2007Q1 2008Q2 2009Q3 2010Q4
All low-paying sectors
All other sectors
Source: Office for National Statistics, Employee jobs
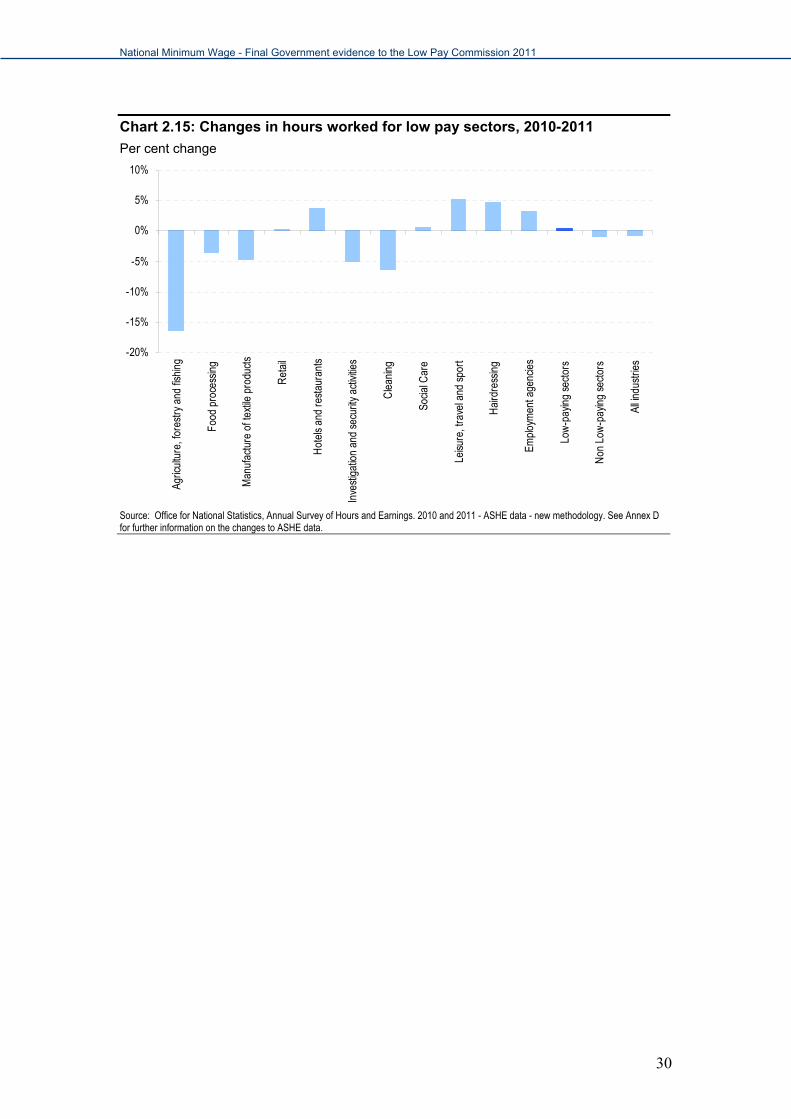
Hours worked in the low-paying sectors 2.54 Employers may alter hours rather than levels of employment in response to minimum wages. This is particularly likely for low paying sectors as they have low fixed costs per worker, little on-the-job training, high labour turnover, limits to the substitution of capital for labour and a high incidence of part-time work. Empirical studies have found some adverse impact of minimum wages on hours for example Stewart and Swaffield (2006)9. 2.55 Over 2010-2011 total hours worked in the low-paying sectors increased by around 0.3 per cent, more than the 1.0 per cent fall in the non low-paying sectors (see Chart 2.15). The variation across the low paid sectors has been significant. However, it is not possible to disentangle the impact of the NMW from the UK being exposed to lower-cost international competition and other factors.
9 Stewart M and Swaffield (2006): The other margin: Do minimum wages cause working hours adjustment for low-wage workers? Unpublished paper, University of Warwick.
29
National Minimum Wage - Final Government evidence to the Low Pay Commission 2011
30
Chart 2.15: Changes in hours worked for low pay sectors, 2010-2011
Per cent change
-20%
-15%
-10%
-5%
0%
5%
10%Ag
ricul
ture
, for
estry
and
fish
ing
Food
pro
cess
ing
Man
ufac
ture
of t
extile
pro
duct
s
Ret
ail
Hot
els
and
rest
aura
nts
Inve
stig
atio
n an
d se
curit
y ac
tivitie
s
Cle
anin
g
Socia
l Car
e
Leisu
re, t
rave
l and
spo
rt
Hai
rdre
ssin
g
Empl
oym
ent a
genc
ies
Low
-pay
ing
sect
ors
Non
Low
-pay
ing
sect
ors
All in
dust
ries
Source: Office for National Statistics, Annual Survey of Hours and Earnings. 2010 and 2011 - ASHE data - new methodology. See Annex D for further information on the changes to ASHE data.
National Minimum Wage - Final Government evidence to the Low Pay Commission 2011
Particular groups of workers (other than young workers)
Summary Since the introduction of the NMW there is no strong evidence to suggest that the NMW has had an adverse impact on the employment prospects of minority employment groups. 2.56 This section reports on the recent labour market performance of other vulnerable groups who may be affected by the NMW. 2.57 Since the introduction of the NMW, around 1.2 million more people of working age10 who are Disability Discrimination Act (DDA) disabled11 and/or have a work-limiting disability entered employment (change in employment levels since 1999 Q1 to 2011 Q3). The employment rate for this group has increased by 3.2 percentage points from 45.6 per cent in 1999 Q1 to 48.8 per cent in 2011 Q3. The rate has increased by 0.4 percentage points from 10.5 per cent to 10.8 per cent over the same period. Inactivity rates have fallen by 3.8 percentage points from 49.1 per cent in 1999 Q1 to 45.3 per cent in 2011 Q2. 2.58 Between 2001 Q2 and 2011 Q3 around 1.3 million more people of working age12 from ethnic minorities have entered employment. The employment rate of minority groups has increased by around 3.7 percentage points over the same period, from 56.0 per cent to 59.6 per cent. The unemployment rate has increased by 2.4 percentage points from 12.0 per cent to 14.4 per cent again over the same period. Inactivity rates have fallen by 6.1 percentage points from 36.4 per cent in 2001 Q2 to 30.3 per cent in 2011 Q4. 2.59 Since the introduction of the NMW, employment for both males and females has increased by around 1.9 million. The working age13 employment
10 The estimation uses the current definition of working age, 16-64, which changed in 2010 from the definition of 16-59 for women and 16-64 for men. 11 The Disability Discrimination Act defines a person as DDA disabled as someone who has a physical or mental impairment that has a substantial and long-term adverse effect on his or her ability to carry out normal day-to-day activities. 12 The estimation uses the current definition of working age, 16-64, which changed in 2010 from the definition of 16-59 for women and 16-64 for men. 13 The estimation uses the current definition of working age, 16-64, which changed in 2010 from the definition of 16-59 for women and 16-64 for men.
31

National Minimum Wage - Final Government evidence to the Low Pay Commission 2011
32
rate for men decreased by 2.7 percentage points from 78.2 per cent in 1999 Q1 to 75.5 per cent in 2011 Q3. The working age employment rate for women increased by 0.6 percentage points from 65.0 to 65.6 per cent over the same period. The working age unemployment rate for men rose from 7.0 per cent in 1999 Q1 to 9.4 per cent in 2011 Q3, for women the unemployment rate rose from 5.4 per cent to 7.9 per cent over the same period. The working age economic inactivity rate for men increased by 0.8 percentage points from 15.9 per cent in 1999 Q1 to 16.7 per cent in 2011 Q3. For women the economic inactivity rate fell from 31.3 per cent to 28.8 per cent over the same period.
National Minimum Wage - Final Government evidence to the Low Pay Commission 2011
Enterprise size
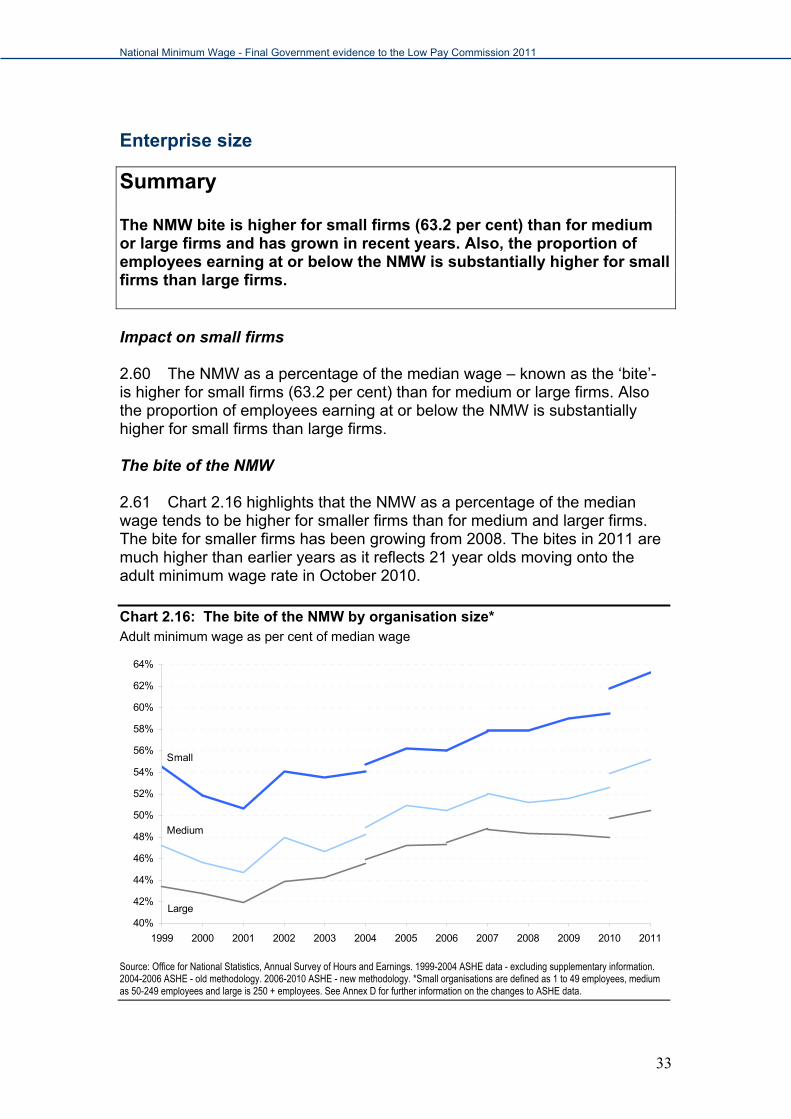
Summary The NMW bite is higher for small firms (63.2 per cent) than for medium or large firms and has grown in recent years. Also, the proportion of employees earning at or below the NMW is substantially higher for small firms than large firms. Impact on small firms 2.60 The NMW as a percentage of the median wage – known as the ‘bite’- is higher for small firms (63.2 per cent) than for medium or large firms. Also the proportion of employees earning at or below the NMW is substantially higher for small firms than large firms. The bite of the NMW 2.61 Chart 2.16 highlights that the NMW as a percentage of the median wage tends to be higher for smaller firms than for medium and larger firms. The bite for smaller firms has been growing from 2008. The bites in 2011 are much higher than earlier years as it reflects 21 year olds moving onto the adult minimum wage rate in October 2010.
Chart 2.16: The bite of the NMW by organisation size* Adult minimum wage as per cent of median wage
40%
42%
44%
46%
48%
50%
52%
54%
56%
58%
60%
62%
64%
1999 2000 2001 2002 2003 2004 2005 2006 2007 2008 2009 2010 2011
Small
Medium
Large
Source: Office for National Statistics, Annual Survey of Hours and Earnings. 1999-2004 ASHE data - excluding supplementary information. 2004-2006 ASHE - old methodology. 2006-2010 ASHE - new methodology. *Small organisations are defined as 1 to 49 employees, medium as 50-249 employees and large is 250 + employees. See Annex D for further information on the changes to ASHE data.
33
National Minimum Wage - Final Government evidence to the Low Pay Commission 2011
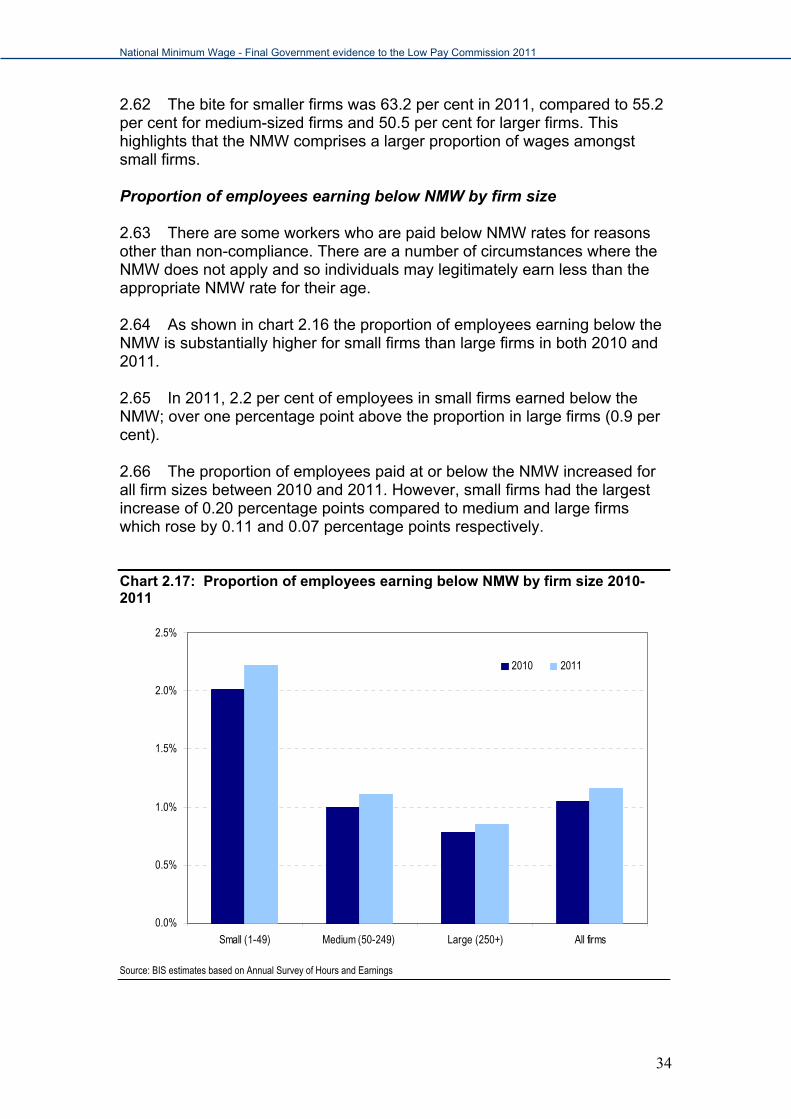
2.62 The bite for smaller firms was 63.2 per cent in 2011, compared to 55.2 per cent for medium-sized firms and 50.5 per cent for larger firms. This highlights that the NMW comprises a larger proportion of wages amongst small firms. Proportion of employees earning below NMW by firm size 2.63 There are some workers who are paid below NMW rates for reasons other than non-compliance. There are a number of circumstances where the NMW does not apply and so individuals may legitimately earn less than the appropriate NMW rate for their age. 2.64 As shown in chart 2.16 the proportion of employees earning below the NMW is substantially higher for small firms than large firms in both 2010 and 2011. 2.65 In 2011, 2.2 per cent of employees in small firms earned below the NMW; over one percentage point above the proportion in large firms (0.9 per cent). 2.66 The proportion of employees paid at or below the NMW increased for all firm sizes between 2010 and 2011. However, small firms had the largest increase of 0.20 percentage points compared to medium and large firms which rose by 0.11 and 0.07 percentage points respectively.
Chart 2.17: Proportion of employees earning below NMW by firm size 2010-2011
0.0%
0.5%
1.0%
1.5%
2.0%
2.5%
Small (1-49) Medium (50-249) Large (250+) All firms
2010 2011
Source: BIS estimates based on Annual Survey of Hours and Earnings
34
National Minimum Wage - Final Government evidence to the Low Pay Commission 2011
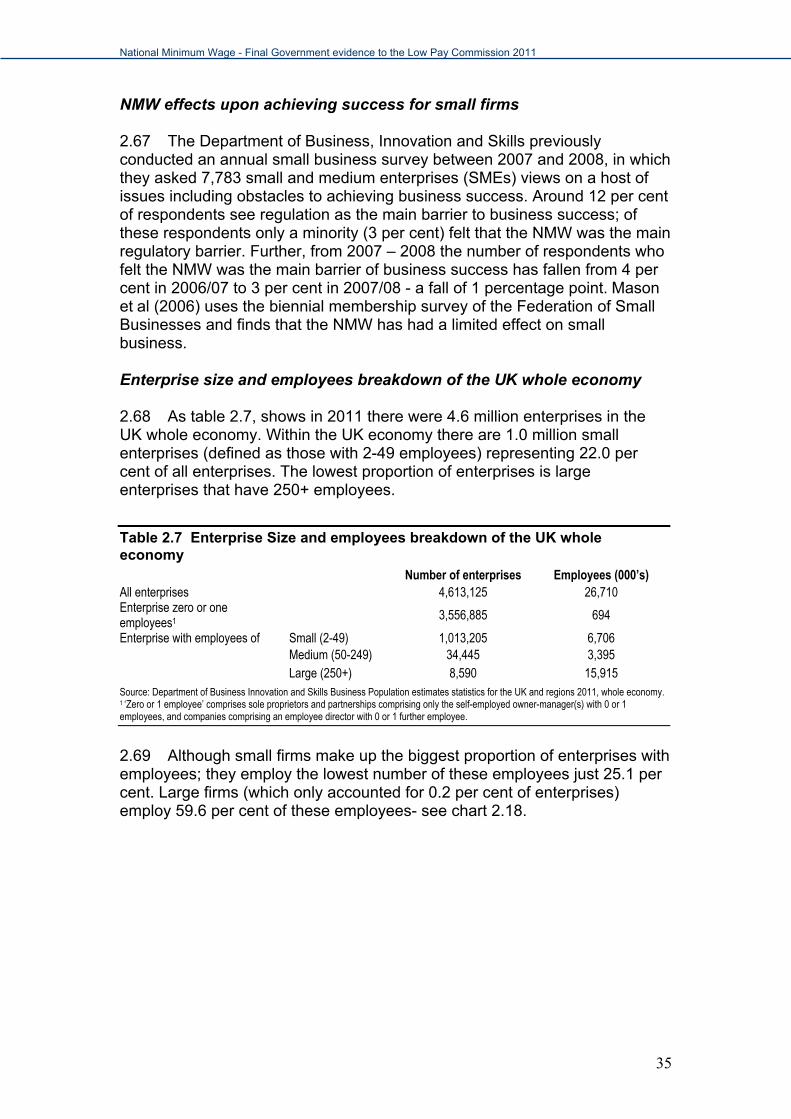
NMW effects upon achieving success for small firms 2.67 The Department of Business, Innovation and Skills previously conducted an annual small business survey between 2007 and 2008, in which they asked 7,783 small and medium enterprises (SMEs) views on a host of issues including obstacles to achieving business success. Around 12 per cent of respondents see regulation as the main barrier to business success; of these respondents only a minority (3 per cent) felt that the NMW was the main regulatory barrier. Further, from 2007 – 2008 the number of respondents who felt the NMW was the main barrier of business success has fallen from 4 per cent in 2006/07 to 3 per cent in 2007/08 - a fall of 1 percentage point. Mason et al (2006) uses the biennial membership survey of the Federation of Small Businesses and finds that the NMW has had a limited effect on small business. Enterprise size and employees breakdown of the UK whole economy 2.68 As table 2.7, shows in 2011 there were 4.6 million enterprises in the UK whole economy. Within the UK economy there are 1.0 million small enterprises (defined as those with 2-49 employees) representing 22.0 per cent of all enterprises. The lowest proportion of enterprises is large enterprises that have 250+ employees.
Table 2.7 Enterprise Size and employees breakdown of the UK whole economy Number of enterprises Employees (000’s) All enterprises 4,613,125 26,710 Enterprise zero or one employees1
3,556,885 694
Enterprise with employees of Small (2-49) 1,013,205 6,706 Medium (50-249) 34,445 3,395
Large (250+) 8,590 15,915 Source: Department of Business Innovation and Skills Business Population estimates statistics for the UK and regions 2011, whole economy. 1 ‘Zero or 1 employee’ comprises sole proprietors and partnerships comprising only the self-employed owner-manager(s) with 0 or 1 employees, and companies comprising an employee director with 0 or 1 further employee.
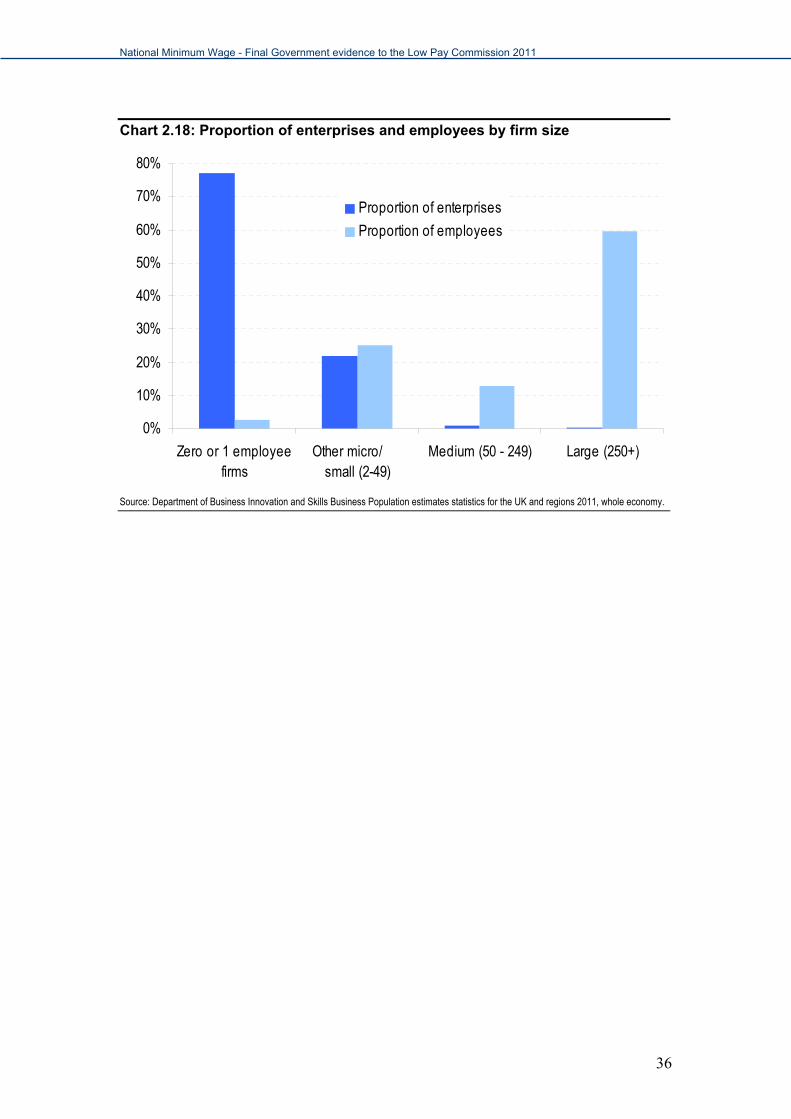
2.69 Although small firms make up the biggest proportion of enterprises with employees; they employ the lowest number of these employees just 25.1 per cent. Large firms (which only accounted for 0.2 per cent of enterprises) employ 59.6 per cent of these employees- see chart 2.18.
35
National Minimum Wage - Final Government evidence to the Low Pay Commission 2011
36
Chart 2.18: Proportion of enterprises and employees by firm size
0%
10%
20%
30%
40%
50%
60%
70%
80%
Zero or 1 employeefirms
Other micro/ small (2-49)
Medium (50 - 249) Large (250+)
Proportion of enterprises
Proportion of employees
Source: Department of Business Innovation and Skills Business Population estimates statistics for the UK and regions 2011, whole economy.
National Minimum Wage - Final Government evidence to the Low Pay Commission 2011
Policy background
Benefit reform 2.70 Many people on benefits perceive the financial risks of moving into work as just too great. For some groups the gains to work, particularly at low hours, are small, and any gain can easily be wiped out altogether by in-work costs such as transport. 2.71 The Government has identified two key problems with the current system: work incentives are poor, and the system is too complex. Our aim is to reform the system to help people to move into and progress in work, while supporting the most vulnerable. Reforming the benefit system aims to make it fairer, more affordable and better able to tackle poverty, worklessness and welfare dependency. 2.72 The White Paper “Universal Credit: welfare that works”, published on 11 November 2010, sets out the Coalition Government’s plans to introduce legislation to reform the welfare system by creating a new Universal Credit. Universal Credit is an integrated working-age credit that will provide a basic allowance with additional elements for children, disability, housing and caring. It will support people both in and out of work, replacing Working Tax Credit (WTC), Child Tax Credit (CTC), Housing Benefit (HB), Income Support, income-based Jobseeker’s Allowance (JSA) and income-related Employment and Support Allowance 2.73 Universal Credit represents a fundamental change for the welfare system, which will radically restructure the way benefits are calculated and is designed to remove the financial and administrative barriers to work that are inherent in the current system. 2.74 Under the current system, financial returns to work can be very weak, particularly at low earnings or hours. Many low earners can have all or almost all of their earnings deducted from their benefits if they begin working. Separate systems for out-of-work and in-work support mean that a move into work entails a recalculation of entitlement and possible delays and gaps in payment. As a result many people are not prepared to take the risk of moving into work. 2.75 Universal Credit will improve work incentives by ensuring that support is reduced at a consistent and predictable rate, and that people generally keep a higher proportion of their earning. It will ensure that work pays (in particular, low-hours work); by reducing the complexity of the system, and removing the distinction between in-work and out-of-work support. This will make clear the potential gains to work and reducing the risks associated with moves into employment.
37
National Minimum Wage - Final Government evidence to the Low Pay Commission 2011
2.76 The first new claims to Universal Credit are expected to begin from October 2013. The transition to the new system will take around five years to complete. Impact on Work Incentives 2.77 Universal Credit will remove the current multiplicity of tapers for in-work support and replace them with a single taper of around 65 per cent on net income. In addition there will be increases in earnings disregards for many households. As a result, Universal Credit will increase the incentive to start work for many households by increasing the proportion of earnings which people keep when they move into work – measured through changes in the participation tax rate (PTR). Generally it will also mean that as they increase their hours they get to keep more of their income – reflected in reductions in the marginal deduction rate (MDR). 2.78 The current system mainly rewards those working 16 or 30 hours, whereas under Universal Credit all hours of work are rewarded. The higher earnings disregards and lower taper rate means that many households will be able to keep a higher proportion of their earnings. Therefore, Universal Credit will provide greater incentives for workless households to take up work for a few hours per week. Universal Credit will also lead to a large reduction in the number of households facing PTRs of over 70 per cent. 2.79 Under the current system, many households have poor incentives to increase their hours worked due to high MDRs. There are two particularly notable circumstances in which very high MDRs occur. First, MDRs are 100% for anyone working while in receipt of IS/ESA/JSA and whose earnings are above the disregard level. Secondly, people who have exhausted their ESA/JSA but are simultaneously in receipt of Housing Benefit, Council Tax Benefit and Tax Credits, can have MDRs as high as 96 per cent. 2.80 By bringing in a single, consistent taper for working households of around 65 per cent, and removing the current 100 per cent taper for out of work benefits, Universal Credit will reduce the highest MDRs and so increase the incentive to work more.
Government support for Small Firms 2.81 The Government wants to make the UK the best place in the world to start and grow a business, and for the next decade to be the most entrepreneurial and dynamic in Britain’s history. To promote growth in the economy, we know we need to inspire people to want to set up their own business and create an environment where their ideas can flourish. 2.82 The importance of Small and Medium-sized Enterprises (SMEs) cannot be underestimated:
SMEs contribute almost as much as large business to UK output (49.6 per cent of GVA) and turnover (48.6 per cent);
38
National Minimum Wage - Final Government evidence to the Low Pay Commission 2011
Just 6 per cent of UK SMEs (with 10-250 employees) are classed as 'high growth' and these generated around a quarter of all new jobs amongst existing businesses between 2005-08;
There are almost 4 million (3.962 million) people in the UK that say they are self-employed (first quarter 2011) - or 1 in 7 people employed in the UK - and this has increased by approximately 700,000 since 2000.
2.83 The Government wants to make it easier to start, invest in and grow a business, especially SMEs. This is being achieved by:
simplifying the tax system and cutting the small business rates to 20p extending the small business rates relief scheme increasing the Research and Development tax credit for SMEs to 225
per cent by next April opening up Government contracts to enable SMEs to get a fairer
share of Government work. Access to Finance 2.84 The Government is committed to ensuring that SMEs have the access to finance they need to start and grow. It has continued to demonstrate its support for SME businesses through lending commitments agreed with the major banks, policies such as the Enterprise Finance Guarantee, and other measures such as Business Coaching for Growth. 2.85 The UK’s prosperity depends on a thriving SME sector, and access to finance is essential to support burgeoning growth. Ensuring the flow of credit to viable SMEs is essential for supporting growth and is a core priority for this Government. 2.86 The Government wants to ensure that the financial sector can supply affordable credit that businesses need, and would like to see more diverse sources of finance for SMEs including, where appropriate, access to equity finance. 2.87 With regard to access to bank finance, the five major UK banks have committed to make available £190bn of new credit in 2011. £76bn of this new lending capacity will be to SMEs, which represents a 15 per cent increase on the £66bn they lent in 2010. 2.88 While demand for finance remains subdued, the majority of SMEs applying for finance do continue to receive the finance they require. Approval rates have remained consistent at around two thirds of applications from firms with a turnover below £1m, and upwards of 80 per cent for loans and 90 per cent for overdrafts for firms with a turnover between £1m and £25m.
39

National Minimum Wage - Final Government evidence to the Low Pay Commission 2011
Plan for Growth 2.89 The Government set out its Plan for Growth at Budget 2011, following the initial phase of the Growth Review. The plan is based around four overarching ambitions for the economy:
1. To create the most competitive tax system in the G20; 2. To make the UK the best place in Europe to start, finance and grow
a business; 3. To encourage investment and exports as a route to a more
balanced economy; and 4. To create a more educated workforce that is the most flexible in
Europe 2.90 The Government needs to be proactive in ensuring all policy supports growth rather than hampers it. That is why we responded to business calls to set out an ambitious plan for how we will support growth. It requires tough choices, putting economic growth ahead of other priorities whenever we can. 2.91 Effective implementation of the 117 measures announced in ‘The Plan for Growth’ is crucial and is a priority for Government. The majority of measures are incorporated in published Departmental Business Plans so that progress can be monitored. 2.92 The following key milestones have recently been delivered:
Launch of presumption in favour of sustainable development Regulatory moratorium for micros and start-ups in force Regulatory Enforcement Discussion Paper and Primary Authority
Consultation published Launch of £2.5bn Business Growth Fund Red Tape Challenge launched Enterprise Finance Guarantee Scheme extended 9 new centres for innovative manufacturing funded First enterprise zones announced Creative industries council established £40m Space innovation Centre opened Launch of £100m “Britain, you’re invited” campaign
2.93 The Government is continuing to listen to business through an intensive programme of engagement as it takes the Growth Review forward. In addition to implementation of Phase 1, the next phase of the Growth Review will cover:
Infrastructure; Education & Skills; Mid-sized businesses; Open data; Rural Economy; and Logistics
40
National Minimum Wage - Final Government evidence to the Low Pay Commission 2011
2.94 The Government will consider the impact on SMEs, as well as the opportunities from the green economy, across all Phase 2 projects.
Workplace Pension Reforms 2.95 An ageing population, combined with millions of people under-saving, is one of the biggest long-term challenges the UK faces, with approximately 7 million people currently not saving enough to deliver the pension income they want or expect in retirement. 2.96 To address this, the Government is introducing automatic enrolment, which places new duties on employers to automatically enrol their eligible employees into a workplace pension scheme. Schemes used for automatic enrolment must meet minimum qualifying standards including, where the scheme is a money purchase scheme, a minimum level of employer contribution. 2.97 These reforms aim to overcome the decision-making inertia that characterises many individuals’ attitudes to saving for retirement. The Department for Work and Pensions (DWP) estimates that between five and eight million people will be newly saving in a workplace pension scheme as a result of the reforms. 2.98 An eligible jobholder is defined as an employee who earns more than the minimum earnings threshold14, works or ordinarily works in Great Britain and is aged at least 22 years old who has not yet reached State Pension age. 2.99 Implementation of the employer’s duty to automatically enrol will be staged in from October 2012. Large employers will be the first to register and automatically enrol their jobholders, followed in later tranches by medium and then small and micro-employers. Employers will be free to choose the pension scheme(s) that best suits them. This may include Defined Benefit, Defined Contribution, Hybrid or Group Personal Pension schemes. 2.100 On 28 November 2011 the Government announced changes to the automatic enrolment timetable to help small businesses (1-49 employees), who will not begin automatically enrolling their staff until June 2015, instead of the current timing of April 2014. A detailed staging profile for all employers will be published in January 2012. 2.101 The minimum level of contributions will be phased in during implementation to help both employers and individuals adjust gradually to the additional costs of the reforms:
14 The Pensions Act 2008 set this threshold at £5,035 a year (in 2006/07 earnings terms). The Pensions Bill, which is currently going through Parliament, will align the earnings threshold for automatic enrolment with the threshold for income tax (£7,475 in 2011 earnings terms).
41
National Minimum Wage - Final Government evidence to the Low Pay Commission 2011
42
during the staging period the total contribution level (including tax relief)
will be two per cent (on a band of earnings) with a minimum of one per cent coming from the employer;
following the end of staging, the total contribution level will be five per cent with a minimum of two per cent coming from the employer; and
once fully phased in, the total contribution level will be eight per cent with a minimum of three per cent coming from the employer.
2.102 However, the gradual phasing of contributions is not possible for Defined Benefit and some Hybrid schemes. Instead, employers providing these types of scheme will be able to delay their automatic enrolment duty for prescribed jobholders until after the staging period. These jobholders will be able to opt into the scheme if they wish during this period. 2.103 The National Employment Savings Trust is being set up as a qualifying occupational money purchase scheme to provide a suitable, low cost savings vehicle for those workers that the existing pension provision industry currently finds it difficult to serve (typically low to moderate and those working for smaller employers). 2.104 DWP analysis15 shows that in 2009 just over two per cent (in a range of 2.2-2.4 per cent) of those eligible for automatic enrolment earned within pence of the NMW. Figures were slightly higher for women than men (2.9-3.2 per cent and 1.8-2.0 per cent respectively).
5
15http://research.dwp.gov.uk/asd/asd1/adhoc_analysis/2011/wpr_eligible_target_groups.pdf
National Minimum Wage - Final Government evidence to the Low Pay Commission 2011
National insurance and personal tax 2.105 In the Government’s Coalition agreement document16 the Government set out that it believes that the tax system needs to be reformed to make it more competitive, simpler, greener and fairer.
Changes to personal allowance 2.106 The Government believes the income tax system should give more support to those on low to middle incomes, rewarding the efforts of those who choose to work. In the June 2010 Budget the Government announced a £1000 increase in the income tax personal allowance for those aged under 65, taking it from £6,475 in 2010-11 to £7,475 in 2011-12. A further £630 increase in the personal allowance was announced in Budget 2011, taking it to £8,105 in 2012-13. Together these increases will benefit 25 million individuals, and take 1.1 million low income individuals out of tax from April 2012. As a result, basic rate taxpayers will gain by £210 a year in real terms in 2012-13. 2.107 This is part of the Government’s long term objective to increase the personal allowance to £10,000, with real terms steps in that direction every year. Changes to NICs and thresholds 2.108 Under inherited plans, the Government increased the main and additional rates of National Insurance Contributions (NICs) for 2011-12 by one per cent. Also from 2011-12, the primary threshold has increased by £24 per week above the Retail Prices Index (RPI), or £29 in cash terms, to £139 per week, the secondary threshold for employer NICs has increased by £21 per week above RPI indexation, or £26 in cash terms, to £136 per week. The upper earnings and profits limits for NICs have been reduced by £1,400 so that they remain aligned to the higher rate threshold.
16 The Coalition: our programme for government: http://www.direct.gov.uk/prod_consum_dg/groups/dg_digitalassets/@dg/@en/documents/digitalasset/dg_187876.pdf
43
National Minimum Wage - Final Government evidence to the Low Pay Commission 2011
SECTION 3 REMIT ISSUES – THE YOUTH LABOUR MARKET
Summary All of the factors that affect the main adult NMW apply to young people and there are also extra reasons to be cautious and moderate in recommending NMW rates for young people. Employment for the over 25s is already above pre-recessionary levels but for under 25s it is not. This is at odds to the usual response to economic downturns where employment of young people tends to turn down earlier and faster than for older people but then to also recover faster. This time they have not as yet recovered faster. Furthermore, evidence suggests that labour market outcomes of younger workers are more at risk from the uprating of the NMW. Over recent years, the proportion of 16-17 year olds participating in education and work based learning has risen sharply, while the percentage in the labour force has fallen. However, for those not in education, the labour market has proved challenging for 16 - 17 year olds with the economic downturn still impacting on their market position. The number of 16-17 year olds that have never had a paid job or a place on a scheme has been rising between 2007 and 2010. The ‘bite’ of the NMW for 16-17 year olds has increased between 2010 and 2011 as an increasing proportion of employees are paid at the 16- 17 year old rate indicating more firms are using the youth rates in preference to higher rates. The economic downturn also had a significant impact on 18 - 20 year olds. The number of 18-20 year olds that have never had a paid job or a place on a scheme has risen considerably between 2007 and 2010 excluding those in full time education. A greater proportion of jobs for 18-20 year olds are being paid the development rate in 2011.17 Given the position of young people in the labour market, we would like the LPC to explore all of the elements of the NMW on young people, including those on the apprentice rate, in order to see if recommendations in these areas could help to improve the employment status for young people.
17 In this report we use earnings data from the 2011 Annual Survey of Hours and Earnings and calculate bites based on the appropriate minimum wage rates for April 2011. Therefore we use the age group 18-20 for the development rate as 21 year olds were moved onto the adult rate in October 2010.
44
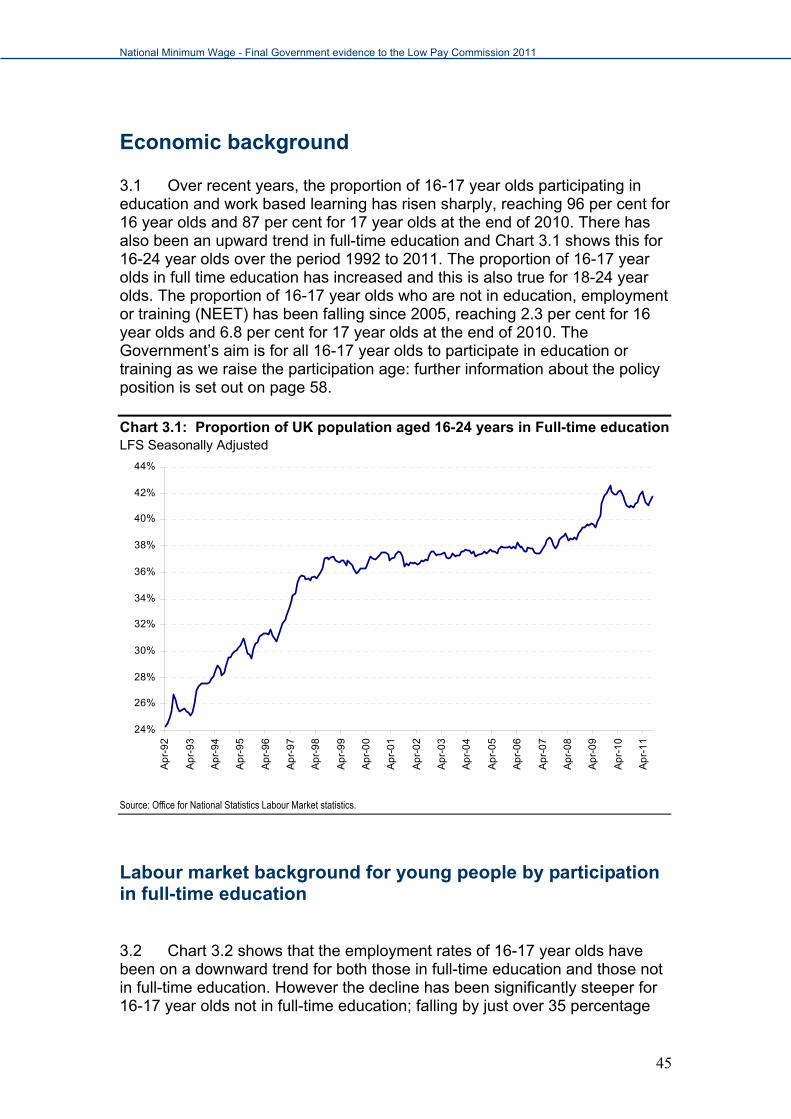
National Minimum Wage - Final Government evidence to the Low Pay Commission 2011
Economic background 3.1 Over recent years, the proportion of 16-17 year olds participating in education and work based learning has risen sharply, reaching 96 per cent for 16 year olds and 87 per cent for 17 year olds at the end of 2010. There has also been an upward trend in full-time education and Chart 3.1 shows this for 16-24 year olds over the period 1992 to 2011. The proportion of 16-17 year olds in full time education has increased and this is also true for 18-24 year olds. The proportion of 16-17 year olds who are not in education, employment or training (NEET) has been falling since 2005, reaching 2.3 per cent for 16 year olds and 6.8 per cent for 17 year olds at the end of 2010. The Government’s aim is for all 16-17 year olds to participate in education or training as we raise the participation age: further information about the policy position is set out on page 58. Chart 3.1: Proportion of UK population aged 16-24 years in Full-time educationLFS Seasonally Adjusted
24%
26%
28%
30%
32%
34%
36%
38%
40%
42%
44%
Ap
r-9
2
Ap
r-9
3
Ap
r-9
4
Ap
r-9
5
Ap
r-9
6
Ap
r-9
7
Ap
r-9
8
Ap
r-9
9
Ap
r-0
0
Ap
r-0
1
Ap
r-0
2
Ap
r-0
3
Ap
r-0
4
Ap
r-0
5
Ap
r-0
6
Ap
r-0
7
Ap
r-0
8
Ap
r-0
9
Ap
r-1
0
Ap
r-1
1
Source: Office for National Statistics Labour Market statistics.
Labour market background for young people by participation in full-time education
3.2 Chart 3.2 shows that the employment rates of 16-17 year olds have been on a downward trend for both those in full-time education and those not in full-time education. However the decline has been significantly steeper for 16-17 year olds not in full-time education; falling by just over 35 percentage
45
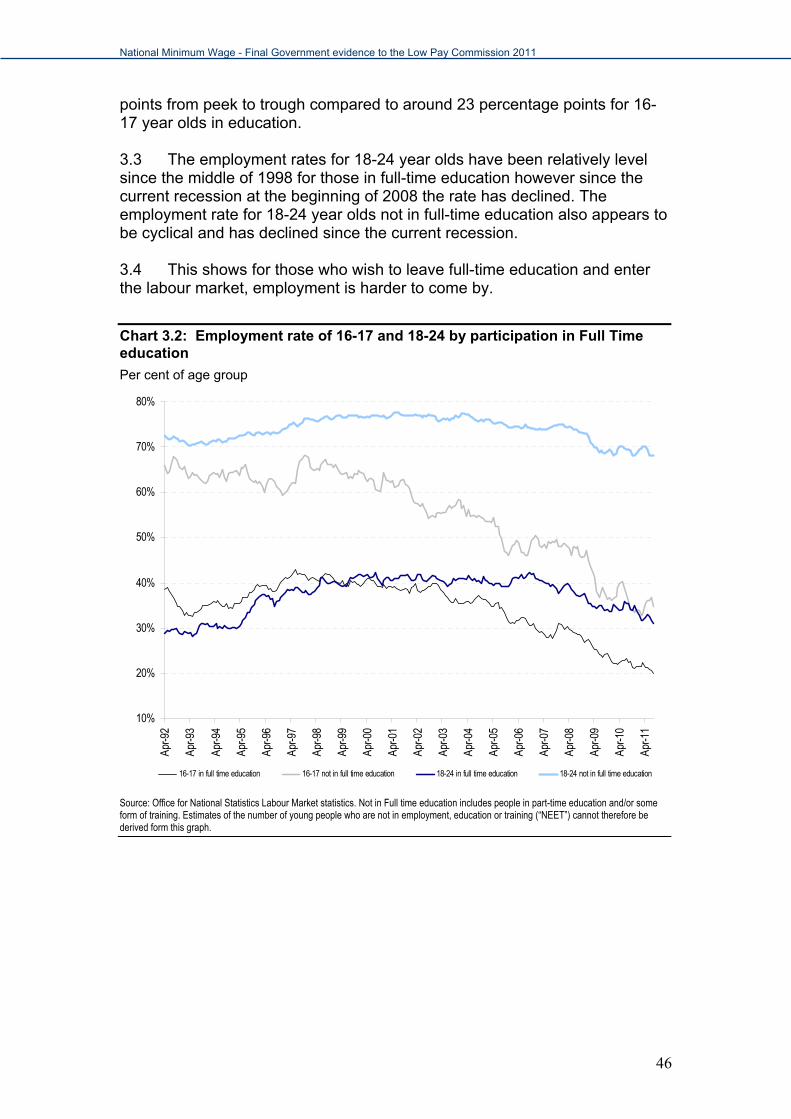
National Minimum Wage - Final Government evidence to the Low Pay Commission 2011
points from peek to trough compared to around 23 percentage points for 16-17 year olds in education. 3.3 The employment rates for 18-24 year olds have been relatively level since the middle of 1998 for those in full-time education however since the current recession at the beginning of 2008 the rate has declined. The employment rate for 18-24 year olds not in full-time education also appears to be cyclical and has declined since the current recession. 3.4 This shows for those who wish to leave full-time education and enter the labour market, employment is harder to come by.
Chart 3.2: Employment rate of 16-17 and 18-24 by participation in Full Time education
Per cent of age group
10%
20%
30%
40%
50%
60%
70%
80%
Apr-9
2
Apr-9
3
Apr-9
4
Apr-9
5
Apr-9
6
Apr-9
7
Apr-9
8
Apr-9
9
Apr-0
0
Apr-0
1
Apr-0
2
Apr-0
3
Apr-0
4
Apr-0
5
Apr-0
6
Apr-0
7
Apr-0
8
Apr-0
9
Apr-1
0
Apr-1
1
16-17 in full time education 16-17 not in full time education 18-24 in full time education 18-24 not in full time education
Source: Office for National Statistics Labour Market statistics. Not in Full time education includes people in part-time education and/or some form of training. Estimates of the number of young people who are not in employment, education or training (“NEET”) cannot therefore be derived form this graph.
46
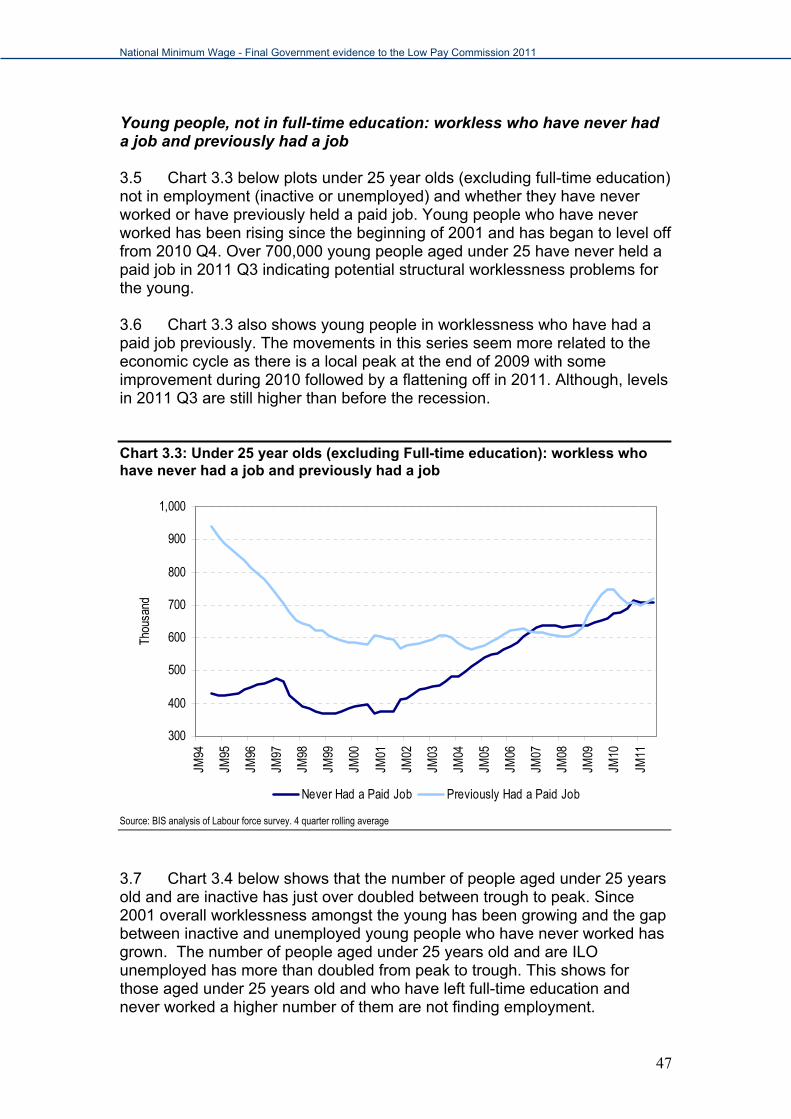
National Minimum Wage - Final Government evidence to the Low Pay Commission 2011
Young people, not in full-time education: workless who have never had a job and previously had a job 3.5 Chart 3.3 below plots under 25 year olds (excluding full-time education) not in employment (inactive or unemployed) and whether they have never worked or have previously held a paid job. Young people who have never worked has been rising since the beginning of 2001 and has began to level off from 2010 Q4. Over 700,000 young people aged under 25 have never held a paid job in 2011 Q3 indicating potential structural worklessness problems for the young. 3.6 Chart 3.3 also shows young people in worklessness who have had a paid job previously. The movements in this series seem more related to the economic cycle as there is a local peak at the end of 2009 with some improvement during 2010 followed by a flattening off in 2011. Although, levels in 2011 Q3 are still higher than before the recession.
Chart 3.3: Under 25 year olds (excluding Full-time education): workless who have never had a job and previously had a job
300
400
500
600
700
800
900
1,000
JM94
JM95
JM96
JM97
JM98
JM99
JM00
JM01
JM02
JM03
JM04
JM05
JM06
JM07
JM08
JM09
JM10
JM11
Thou
sand
Never Had a Paid Job Previously Had a Paid Job
Source: BIS analysis of Labour force survey. 4 quarter rolling average
3.7 Chart 3.4 below shows that the number of people aged under 25 years old and are inactive has just over doubled between trough to peak. Since 2001 overall worklessness amongst the young has been growing and the gap between inactive and unemployed young people who have never worked has grown. The number of people aged under 25 years old and are ILO unemployed has more than doubled from peak to trough. This shows for those aged under 25 years old and who have left full-time education and never worked a higher number of them are not finding employment.
47
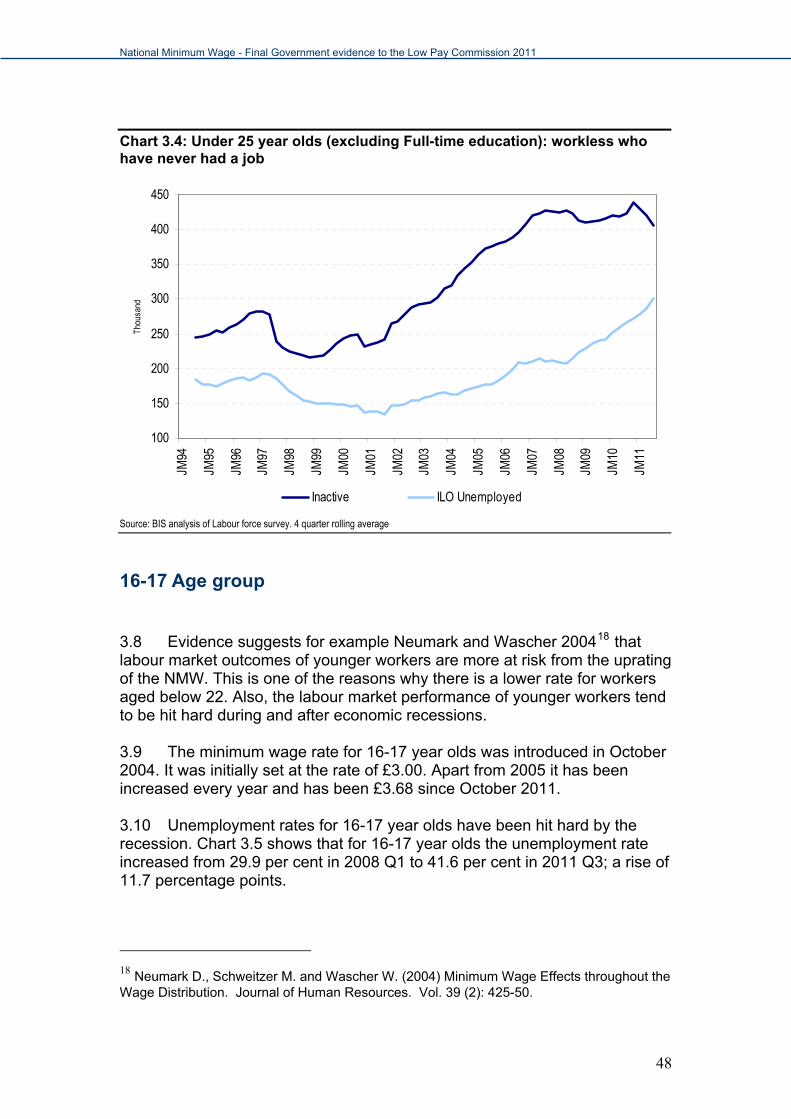
National Minimum Wage - Final Government evidence to the Low Pay Commission 2011
Chart 3.4: Under 25 year olds (excluding Full-time education): workless who have never had a job
100
150
200
250
300
350
400
450JM
94
JM95
JM96
JM97
JM98
JM99
JM00
JM01
JM02
JM03
JM04
JM05
JM06
JM07
JM08
JM09
JM10
JM11
Thou
sand
Inactive ILO Unemployed
Source: BIS analysis of Labour force survey. 4 quarter rolling average
16-17 Age group
3.8 Evidence suggests for example Neumark and Wascher 200418 that labour market outcomes of younger workers are more at risk from the uprating of the NMW. This is one of the reasons why there is a lower rate for workers aged below 22. Also, the labour market performance of younger workers tend to be hit hard during and after economic recessions. 3.9 The minimum wage rate for 16-17 year olds was introduced in October 2004. It was initially set at the rate of £3.00. Apart from 2005 it has been increased every year and has been £3.68 since October 2011. 3.10 Unemployment rates for 16-17 year olds have been hit hard by the recession. Chart 3.5 shows that for 16-17 year olds the unemployment rate increased from 29.9 per cent in 2008 Q1 to 41.6 per cent in 2011 Q3; a rise of 11.7 percentage points.
18 Neumark D., Schweitzer M. and Wascher W. (2004) Minimum Wage Effects throughout the Wage Distribution. Journal of Human Resources. Vol. 39 (2): 425-50.
48
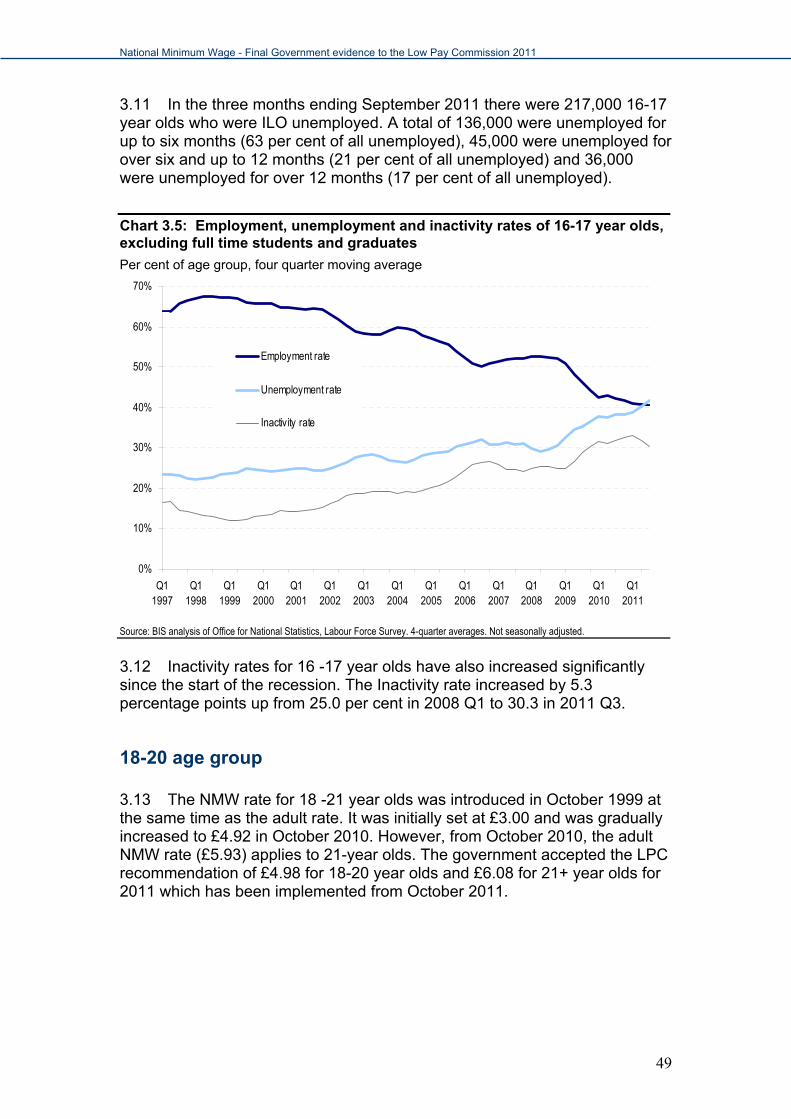
National Minimum Wage - Final Government evidence to the Low Pay Commission 2011
49
3.11 In the three months ending September 2011 there were 217,000 16-17 year olds who were ILO unemployed. A total of 136,000 were unemployed for up to six months (63 per cent of all unemployed), 45,000 were unemployed for over six and up to 12 months (21 per cent of all unemployed) and 36,000 were unemployed for over 12 months (17 per cent of all unemployed).
Chart 3.5: Employment, unemployment and inactivity rates of 16-17 year olds, excluding full time students and graduates
Per cent of age group, four quarter moving average
0%
10%
20%
30%
40%
50%
60%
70%
Q11997
Q11998
Q11999
Q12000
Q12001
Q12002
Q12003
Q12004
Q12005
Q12006
Q12007
Q12008
Q12009
Q12010
Q12011
Employment rate
Unemployment rate
Inactivity rate
Source: BIS analysis of Office for National Statistics, Labour Force Survey. 4-quarter averages. Not seasonally adjusted.
3.12 Inactivity rates for 16 -17 year olds have also increased significantly since the start of the recession. The Inactivity rate increased by 5.3 percentage points up from 25.0 per cent in 2008 Q1 to 30.3 in 2011 Q3.
18-20 age group 3.13 The NMW rate for 18 -21 year olds was introduced in October 1999 at the same time as the adult rate. It was initially set at £3.00 and was gradually increased to £4.92 in October 2010. However, from October 2010, the adult NMW rate (£5.93) applies to 21-year olds. The government accepted the LPC recommendation of £4.98 for 18-20 year olds and £6.08 for 21+ year olds for 2011 which has been implemented from October 2011.
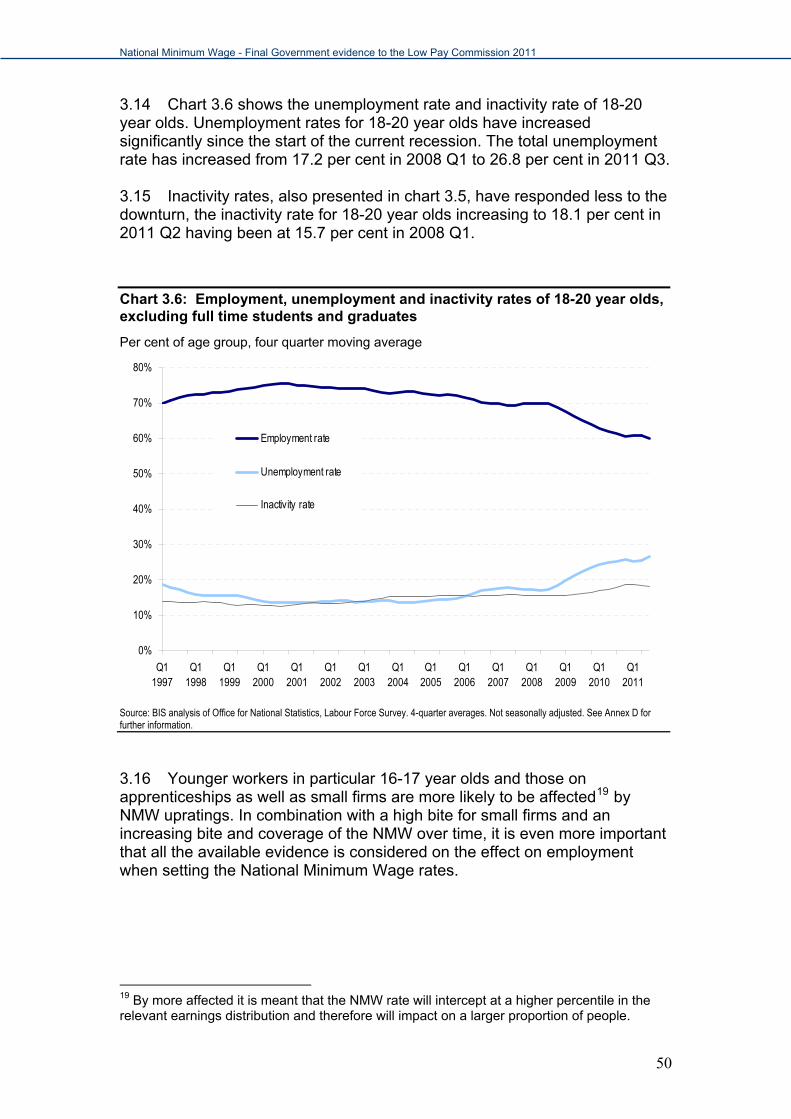
National Minimum Wage - Final Government evidence to the Low Pay Commission 2011
3.14 Chart 3.6 shows the unemployment rate and inactivity rate of 18-20 year olds. Unemployment rates for 18-20 year olds have increased significantly since the start of the current recession. The total unemployment rate has increased from 17.2 per cent in 2008 Q1 to 26.8 per cent in 2011 Q3. 3.15 Inactivity rates, also presented in chart 3.5, have responded less to the downturn, the inactivity rate for 18-20 year olds increasing to 18.1 per cent in 2011 Q2 having been at 15.7 per cent in 2008 Q1.
Chart 3.6: Employment, unemployment and inactivity rates of 18-20 year olds, excluding full time students and graduates
Per cent of age group, four quarter moving average
0%
10%
20%
30%
40%
50%
60%
70%
80%
Q11997
Q11998
Q11999
Q12000
Q12001
Q12002
Q12003
Q12004
Q12005
Q12006
Q12007
Q12008
Q12009
Q12010
Q12011
Employment rate
Unemployment rate
Inactivity rate
Source: BIS analysis of Office for National Statistics, Labour Force Survey. 4-quarter averages. Not seasonally adjusted. See Annex D for further information.
3.16 Younger workers in particular 16-17 year olds and those on apprenticeships as well as small firms are more likely to be affected19 by NMW upratings. In combination with a high bite for small firms and an increasing bite and coverage of the NMW over time, it is even more important that all the available evidence is considered on the effect on employment when setting the National Minimum Wage rates.
19 By more affected it is meant that the NMW rate will intercept at a higher percentile in the relevant earnings distribution and therefore will impact on a larger proportion of people.
50
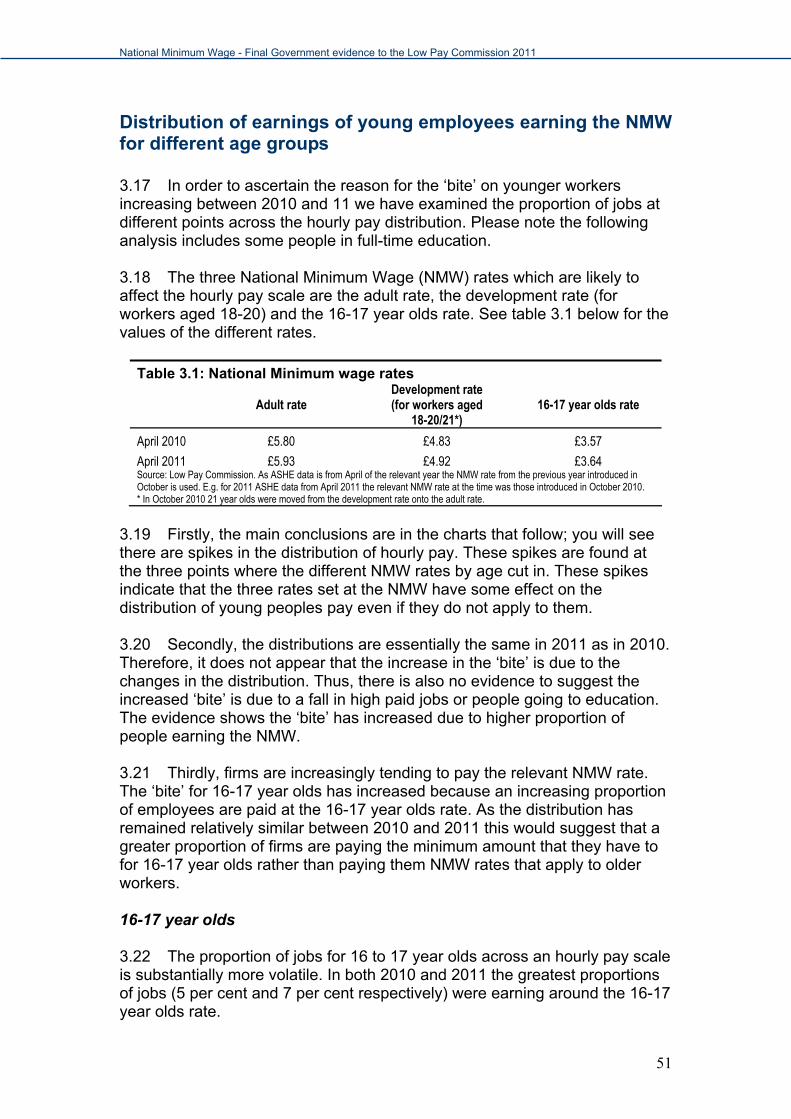
National Minimum Wage - Final Government evidence to the Low Pay Commission 2011
Distribution of earnings of young employees earning the NMW for different age groups 3.17 In order to ascertain the reason for the ‘bite’ on younger workers increasing between 2010 and 11 we have examined the proportion of jobs at different points across the hourly pay distribution. Please note the following analysis includes some people in full-time education. 3.18 The three National Minimum Wage (NMW) rates which are likely to affect the hourly pay scale are the adult rate, the development rate (for workers aged 18-20) and the 16-17 year olds rate. See table 3.1 below for the values of the different rates.
Table 3.1: National Minimum wage rates
Adult rate
Development rate (for workers aged
18-20/21*) 16-17 year olds rate
April 2010 £5.80 £4.83 £3.57
April 2011 £5.93 £4.92 £3.64 Source: Low Pay Commission. As ASHE data is from April of the relevant year the NMW rate from the previous year introduced in October is used. E.g. for 2011 ASHE data from April 2011 the relevant NMW rate at the time was those introduced in October 2010. * In October 2010 21 year olds were moved from the development rate onto the adult rate.
3.19 Firstly, the main conclusions are in the charts that follow; you will see there are spikes in the distribution of hourly pay. These spikes are found at the three points where the different NMW rates by age cut in. These spikes indicate that the three rates set at the NMW have some effect on the distribution of young peoples pay even if they do not apply to them. 3.20 Secondly, the distributions are essentially the same in 2011 as in 2010. Therefore, it does not appear that the increase in the ‘bite’ is due to the changes in the distribution. Thus, there is also no evidence to suggest the increased ‘bite’ is due to a fall in high paid jobs or people going to education. The evidence shows the ‘bite’ has increased due to higher proportion of people earning the NMW. 3.21 Thirdly, firms are increasingly tending to pay the relevant NMW rate. The ‘bite’ for 16-17 year olds has increased because an increasing proportion of employees are paid at the 16-17 year olds rate. As the distribution has remained relatively similar between 2010 and 2011 this would suggest that a greater proportion of firms are paying the minimum amount that they have to for 16-17 year olds rather than paying them NMW rates that apply to older workers. 16-17 year olds 3.22 The proportion of jobs for 16 to 17 year olds across an hourly pay scale is substantially more volatile. In both 2010 and 2011 the greatest proportions of jobs (5 per cent and 7 per cent respectively) were earning around the 16-17 year olds rate.
51
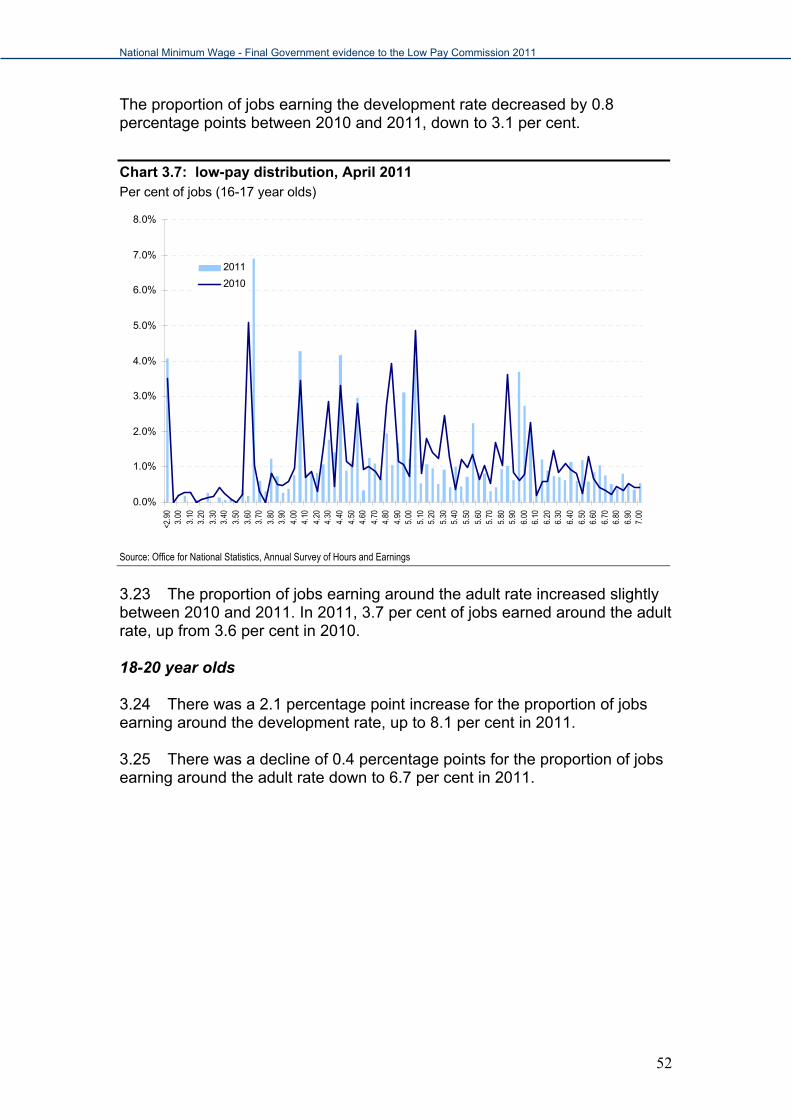
National Minimum Wage - Final Government evidence to the Low Pay Commission 2011
The proportion of jobs earning the development rate decreased by 0.8 percentage points between 2010 and 2011, down to 3.1 per cent.
Chart 3.7: low-pay distribution, April 2011 Per cent of jobs (16-17 year olds)
0.0%
1.0%
2.0%
3.0%
4.0%
5.0%
6.0%
7.0%
8.0%
<2.9
03.
003.
103.
203.
303.
403.
503.
603.
703.
803.
904.
004.
104.
204.
304.
404.
504.
604.
704.
804.
905.
005.
105.
205.
305.
405.
505.
605.
705.
805.
906.
006.
106.
206.
306.
406.
506.
606.
706.
806.
907.
00
2011
2010
Source: Office for National Statistics, Annual Survey of Hours and Earnings
3.23 The proportion of jobs earning around the adult rate increased slightly between 2010 and 2011. In 2011, 3.7 per cent of jobs earned around the adult rate, up from 3.6 per cent in 2010. 18-20 year olds 3.24 There was a 2.1 percentage point increase for the proportion of jobs earning around the development rate, up to 8.1 per cent in 2011. 3.25 There was a decline of 0.4 percentage points for the proportion of jobs earning around the adult rate down to 6.7 per cent in 2011.
52
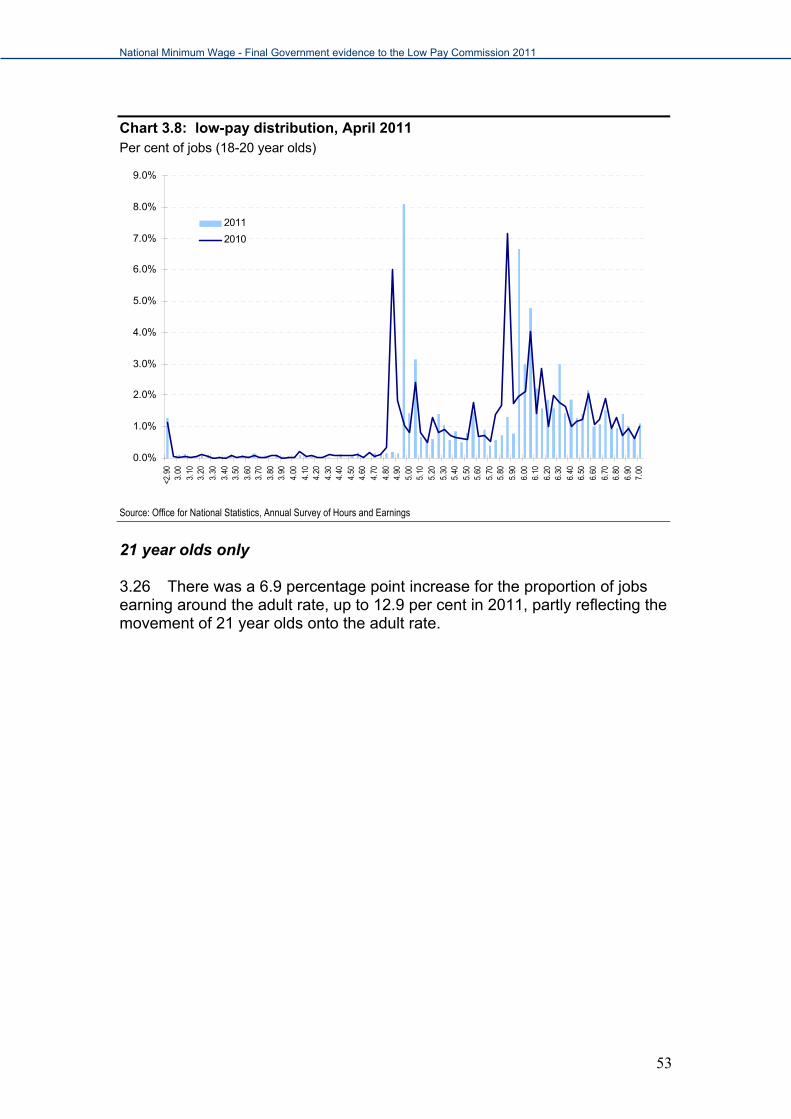
National Minimum Wage - Final Government evidence to the Low Pay Commission 2011
Chart 3.8: low-pay distribution, April 2011 Per cent of jobs (18-20 year olds)
0.0%
1.0%
2.0%
3.0%
4.0%
5.0%
6.0%
7.0%
8.0%
9.0%<2
.90
3.00
3.10
3.20
3.30
3.40
3.50
3.60
3.70
3.80
3.90
4.00
4.10
4.20
4.30
4.40
4.50
4.60
4.70
4.80
4.90
5.00
5.10
5.20
5.30
5.40
5.50
5.60
5.70
5.80
5.90
6.00
6.10
6.20
6.30
6.40
6.50
6.60
6.70
6.80
6.90
7.00
2011
2010
Source: Office for National Statistics, Annual Survey of Hours and Earnings
21 year olds only 3.26 There was a 6.9 percentage point increase for the proportion of jobs earning around the adult rate, up to 12.9 per cent in 2011, partly reflecting the movement of 21 year olds onto the adult rate.
53
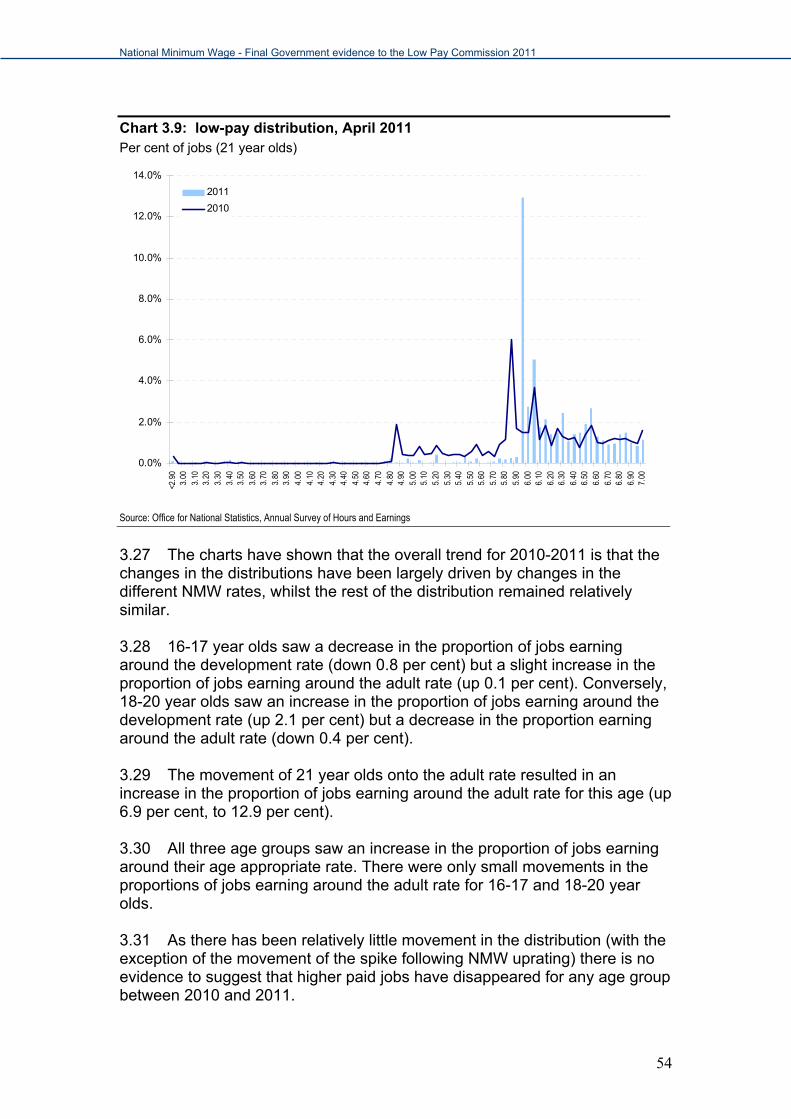
National Minimum Wage - Final Government evidence to the Low Pay Commission 2011
Chart 3.9: low-pay distribution, April 2011 Per cent of jobs (21 year olds)
0.0%
2.0%
4.0%
6.0%
8.0%
10.0%
12.0%
14.0%<2
.90
3.00
3.10
3.20
3.30
3.40
3.50
3.60
3.70
3.80
3.90
4.00
4.10
4.20
4.30
4.40
4.50
4.60
4.70
4.80
4.90
5.00
5.10
5.20
5.30
5.40
5.50
5.60
5.70
5.80
5.90
6.00
6.10
6.20
6.30
6.40
6.50
6.60
6.70
6.80
6.90
7.00
2011
2010
Source: Office for National Statistics, Annual Survey of Hours and Earnings
3.27 The charts have shown that the overall trend for 2010-2011 is that the changes in the distributions have been largely driven by changes in the different NMW rates, whilst the rest of the distribution remained relatively similar. 3.28 16-17 year olds saw a decrease in the proportion of jobs earning around the development rate (down 0.8 per cent) but a slight increase in the proportion of jobs earning around the adult rate (up 0.1 per cent). Conversely, 18-20 year olds saw an increase in the proportion of jobs earning around the development rate (up 2.1 per cent) but a decrease in the proportion earning around the adult rate (down 0.4 per cent). 3.29 The movement of 21 year olds onto the adult rate resulted in an increase in the proportion of jobs earning around the adult rate for this age (up 6.9 per cent, to 12.9 per cent). 3.30 All three age groups saw an increase in the proportion of jobs earning around their age appropriate rate. There were only small movements in the proportions of jobs earning around the adult rate for 16-17 and 18-20 year olds. 3.31 As there has been relatively little movement in the distribution (with the exception of the movement of the spike following NMW uprating) there is no evidence to suggest that higher paid jobs have disappeared for any age group between 2010 and 2011.
54

National Minimum Wage - Final Government evidence to the Low Pay Commission 2011
Policy background
Young people and the Participation Strategy 3.32 Whilst participation in education or training has risen significantly in recent years, the proportion of young people who are not in education, employment or training (NEET) remains too high. At the end of 2010, 57,700 (4.5%) 16-17 year olds were NEET in England. 3.33 The Government is committed to tackling this issue and in May 2011 published Supporting Youth Employment20, which set out our high-level approach. Our aim is to raise attainment and ensure that young people have the skills they need to compete in the global economy, whilst intervening early to help those who are at risk of falling through the net. Simultaneously, we will act to create the conditions for sustainable growth in the economy and reduce regulatory burdens that prevent employers from expanding and creating new jobs. We will also encourage employers in both the public and private sectors to help inspire young people and to offer more work experience, internships and apprenticeship opportunities, whilst reforming the benefits system to ensure that work pays and those on out-of-work benefits get the support they need to reengage. 3.34 We know that attainment at age 16 is the best protective factor against disengagement and the radical reforms of the schools system we set out in the Schools White Paper21 will help to raise standards for all young people. Academies and Free Schools will provide heads and teachers with freedom and flexibility to meet pupils’ needs; the English Baccalaureate will ensure that pupils have a wide and balanced curriculum that appeals to employers; and the Pupil Premium will focus additional resources on those from deprived backgrounds. 3.35 Post-16, we are increasing investment in education and training places and funding local authorities, through the consolidated Early Intervention Grant (EIG), to provide targeted support to young people in their area to help them participate. This will prepare for our commitment to raise the participation age to 17 in 2013 and 18 in 2015.
20 www.number10.gov.uk/wp-content/uploads/support-youth-employment.pdf 21 The Importance of Teaching - The Schools White Paper 2010: www.education.gov.uk/publications/standard/publicationdetail/page1/CM%207980
55

National Minimum Wage - Final Government evidence to the Low Pay Commission 2011
3.36 To help those young people who have taken longer to attain the skills they need in the labour market, we have committed to continue to fully fund first Level 2 and Level 3 qualifications up to age 24 and are extending full funding to cover Foundation Learning for those age 19-24 who do not yet have a full level 2 qualification. For those who are out of work, the new Work Programme will provide a much greater degree of personalised support from providers to help people into sustainable employment. Young people will be able to access this from 9 months from the commencement of a claim, with early entry at 3 months for the most vulnerable young people, such as those who claimed JSA at age 16-17 or who have already been NEET for six months when they sign on at age 18. 3.37 Since the September 2011 NMW Government evidence to the Low Pay Commission the Government has set out its approach in more detail in a Participation Strategy that was published on December 15th 2011. The strategy focuses on how we intend to maximise the participation of 16-24 year olds in education, training and work and tackle the long-term consequences of young people being NEET for an extended period. It builds on the clear reform plans that are already in place, with a particular focus on improving young people’s experience of transition from school to further education and into work. The box below provides a brief update. Box 1: Update on Young People and the Participation Strategy The majority of young people succeed in education and make a positive transition to adult life and the world of work. But we face a very real challenge in terms of opportunities for young people, with 1.16 million young people in England aged 16-24 not in education, employment or training (NEET): 150,000 are 16-17 year olds who may need additional opportunities or
support to re-engage in education or training; 523,000 are 18-24 year olds who are unemployed, not in education,
and looking for work. 249,000 have been unemployed for over six months and may need significant help to find work; and
490,000 are 18-24 year olds who are economically inactive. Of these, 371,000 are looking after family or home, or are sick or disabled. The remaining 119,000 are inactive for a wide range of other reasons.
On 15] December, the Government published Building Engagement, Building Futures, its strategy to maximise the participation of 16-24 year olds in education, training and work. Alongside creating the conditions for balanced and sustainable growth in the wider economy, the Strategy set out the Government’s five priorities for action:
Priority 1: Raising attainment in school and beyond to ensure that young people have the skills they need to compete in a global economy;
56
National Minimum Wage - Final Government evidence to the Low Pay Commission 2011
Priority 2: Helping local partners to provide effective and coordinated services that support all young people, including the most vulnerable, putting us on track to achieve full participation for 16-17 year olds by 2015; Priority 3: Encouraging and incentivising employers to inspire and recruit young people by offering more high quality Apprenticeships and work experience places; Priority 4: Ensuring that work pays and giving young people the personalised support they need to find it, through Universal Credit, the Work Programme and our Get Britain Working measures; and Priority 5: Putting in place a new Youth Contract worth almost £1 billion over the next three years to help get young people learning or earning before long term damage is done. Raising the Participation Age (RPA) 3.38 From 2015, young people will be required to participate in learning until their 18th birthday or until they achieve a full level 3 qualification (the equivalent of 2 A Levels), whichever is sooner. From 2013 (until 2015) the requirement will be to participate in learning until the end of the school year in which they turn 17. They will be able to participate in a number of ways:
full-time education, such as school, college or home education; work-based learning, such as an Apprenticeship; or full-time work, if they are employed, self-employed or volunteering for
more than 20 hours a week, with part-time accredited education alongside for 280 hours per year (the equivalent of 1 day per week)
3.39 The vast majority of employers will not be affected by RPA. There are no duties on employers who do not employ 16-17 year olds or on employers who are employing 16-17 year olds for less than 20 hours per week. Where businesses are employing a 16-17 year old for more than 20 hours a week and for more than 8 weeks, and are not providing accredited training, they will need to agree reasonable hours of work so that the young person can access training elsewhere. This would need to be a minimum of 280 guided learning hours per year, the equivalent of one day per week - and the young person would not have to be paid by the employer for this time. There will be no ongoing duty on employers to check that the young person is attending learning.
57
National Minimum Wage - Final Government evidence to the Low Pay Commission 2011
Young People and Employment “Supporting youth employment” set out five key priorities for action:
1. Raising attainment and ensuring young people have the skills they need: for those aged 16–17, our priority is to help them engage in high quality education or training that gives them the skills and qualifications to be attractive to employers. We have also accepted all of the recommendations of the Wolf Review of Vocational Education; this will result in a higher quality system of learning for 14–18 year olds and help to address the long term weaknesses in practical learning. Apprenticeships are at the heart of our system of vocational training and we are increasing funding in 2011-12 to over £1.4bn, sufficient to train 360,000 apprentices. In addition, we are introducing a new Access to Apprenticeships pathway that will benefit up to 10,000 vulnerable young people.
2. Helping young people at risk of falling through the net: there is a
wide range of support from local and central government to help young people at risk of falling out of education, employment or training and to support them to make a successful transition to education, training and work. We provide fully-funded flexible work-focussed training for unemployed people on active benefits prior to Work Programme entry and, in certain sectors such as retail and hospitality, new work academies combine training and work experience, and provide a guaranteed interview. In addition to early entry to the Work Programme for vulnerable 18 year olds, we are increasing the capacity of Jobcentre Plus, to support the 5,000 most disadvantaged 16–17 year olds claiming Jobseeker’s Allowance each year. We are also be funding a new £10m per annum Innovation Fund which will give delivery organisations, particularly those in the voluntary and community sector, a real chance to develop innovative solutions to help disadvantaged people.
3. Encouraging employers to help inspire young people and offer more
work experience, internships and apprenticeship places to young people: work experience and internships are often formally integrated into an employer’s recruitment structures so that successful placements or interns become future employees. The Government is supporting this agenda, both by placing work experience at the heart of its overall request to the business community through its ‘Every Business Commits’ initiative, and also by additional funding for 80,000 work experience places for young people. Additionally, we will continue to encourage the use of Work Trials in Jobcentre Plus, currently benefitting around 46,000 people a year, and support jobseekers by allowing them to undertake work experience for up to eight weeks while still claiming out-of-work benefits.
58

National Minimum Wage - Final Government evidence to the Low Pay Commission 2011
4. Promoting personal responsibility by ensuring that work pays: personal responsibility will be enhanced by radical reform of the welfare system, which includes introducing the Universal Credit. By combining in work and out of work support and ensuring that benefits are withdrawn at a simple, single rate as earnings increase, the Universal Credit will make the transition into work simpler and easier to understand – helping to break the cycle of welfare dependency. Additionally, we are making focused job search a core requirement for jobseekers – to support this, the new National Careers Service, in partnership with Jobcentre Plus, will offer face-to-face advice and guidance about careers, skills and the labour market.
5. Creating the wider conditions for balanced sustainable growth - The
final component is to create the conditions where business can flourish and create jobs. To do this, we are:
identifying and removing barriers to growth in key sectors of the
UK economy; introducing measures to help create the most competitive tax
system in the G20, including through a reduction in corporation tax;
encouraging investment and exports as a route to a more
balanced economy, including through reforms to the planning system;
introducing reforms to help make the UK the best place in Europe
to start, finance and grow a business, including by reducing the burden of regulation;
establishing a new Growth and Innovation Fund to overcome
obstacles that get in the way of employer led innovation to raise skills in sectors; and
ensuring that the UK maintains the flexible labour markets that
have helped to ensure high and stable levels of employment in recent decades, as indicated by the reforms to the employment tribunal system, for example.
59
National Minimum Wage - Final Government evidence to the Low Pay Commission 2011
Apprenticeships 3.40 Apprenticeships are the Government’s preferred vocational route for people of all ages to gain the skills they need to succeed and progress in their careers, and for employers to build a workforce with the motivation and expertise they need to compete globally. Apprenticeship training for 16-18 year olds is fully funded by the Government, to provide an additional incentive to employers to take on a younger person and reflect their relative inexperience in the workplace. 3.41 The Government is committed to establishing apprenticeships as a key route to building the national skills base, working with employers to help young people and adults get the skills and qualifications valued by employers. 3.42 Following the introduction of the hourly £2.50 apprenticeship minimum wage there are important supply and demand side issues that need consideration when reviewing the apprenticeship minimum wage. In order to encourage supply to apprenticeship schemes, an apprentice minimum wage needs to be set at a level which provides appropriate incentives for individuals to participate in schemes. However, a too high increase in the apprentice minimum wage will lead to higher wage costs for employers and this could dissuade employers from providing schemes. It is too early to assess the impact of the apprentice minimum wage rate so far but we are mindful of the vulnerable position of apprentices, particularly young apprentices, in the economy given current labour market conditions. 3.43 In 2007 it was found that 5 per cent of all apprentices were receiving less than the then minimum weekly wage of £95 (Apprenticeship Pay: 2007 Survey of Earnings by Sector). Volumes 3.44 In May 2010, we announced an additional £150 million to fund 50,000 new adult (19 years or older) apprenticeship starts in the 2010 -11 financial year. The latest provisional data, based on data returned to date for apprenticeships, show that we have achieved the ambition of 203,200 19+ apprenticeship starts over the 2010-11 financial year, by delivering 257,000 19+ apprenticeship starts. Final data covering this period will be reported in the October Release. Pay 3.45 The Apprenticeship Pay Survey 2011 is currently underway. For the first time this is a UK-wide survey covering four countries. Interim findings were shared with BIS and the LPC in mid-September – the final report will be published in early 2012 and a copy will be sent to the LPC.
60

National Minimum Wage - Final Government evidence to the Low Pay Commission 2011
Emerging Issues 3.46 It is essential that we encourage and promote routes other than university, particularly apprenticeships. We are too used to thinking of higher education in a narrow, institutional fashion. 3.47 Apprenticeships provide an important vocational route for people to develop their employment skills and progress at work, or move into higher level skills development. We are looking much more ambitiously at creating clear progression routes into higher level skills, career and professional development, including, but not exclusively Level 4 Apprenticeships, and want further education colleges and providers to work closely with Higher Education institutions and employers to achieve this. 3.48 We will ensure that there are clear qualification and career pathways from foundation qualifications through to higher level skills, career and professional development. An advanced economy needs advanced skills, so we want to improve progression routes through apprenticeships into higher level skills. 3.49 As we move to expanding the higher level apprenticeship programme – consideration will need to be given as to whether the same rate of pay is relevant to say an 18 year old on an Intermediate Level (level 2) apprenticeship, as for an 18 yr old on a Higher Level Apprenticeship (level 4), for example. The NMW Regulations and the apprentice minimum wage rate 3.50 Paragraph 3.75 of the LPC’s 2011 report refers to concerns from stakeholders about whether or not certain categories of apprentices were covered by the new apprentice minimum wage rate. 3.51 From 1 August 2011, all apprentices on the Foundation Modern Apprenticeships and Foundation Apprenticeships programmes in Wales will be employed and therefore eligible for the appropriate minimum wage rate. From that date, unwaged learners will be on the Steps to Employment or Traineeship programmes and the NMW Regulations have been amended to make it clear that participants on these programmes are not eligible for the NMW. 3.52 Officials in the Scottish Government are aiming to take forward work this year to change the names of the programmes for Level 4 and Level 5 apprentices so that the apprenticeship programme stipulated in the NMW Regulations (Modern Apprenticeships) only covers Level 2 and 3 apprentices.
61
National Minimum Wage - Final Government evidence to the Low Pay Commission 2011
Work experience (including internships) 3.53 The Government sees the provision of internships as a legitimate and, for the most part, helpful addition to the youth labour market. Internships can provide valuable opportunities to gain skills and experience and strengthen job applications. The best of them have a training element and can be an important way for young people to develop workplace skills. We do, however, recognise the concern that has been expressed by the LPC and others about the inappropriate use of internships in certain sectors, particularly in the entertainment sector. Therefore, whilst encouraging employers to offer more internship, we have also been considering what more can be done to: address potential exploitation without choking off valuable
opportunities; deliver effective enforcement of any breaches of employment law; and ensure those from disadvantaged backgrounds have greater access to
this method of gaining employment experience. Graduate internships 3.54 In 2009/10, a number of subsidised internship schemes were established, which between them delivered over 10,000 subsidised graduate internship opportunities by the end of March 2011. Funding was provided for a set number of internship places on a one-off basis. There are no current plans to repeat the scheme; however, we will be examining recent graduate internship policy initiatives to explore where there are lessons to be learned on internship provision 3.55 The Higher Education Funding Council for England has recently published (July 2011) research on increasing the opportunities for high quality higher education work experience, including the majority of subsidised internship schemes referred to above. Findings showed students, graduates and employers, all had a very positive experience of internships. For example, students and graduates reported strong development of employability skills and an increase in confidence directly attributable to their internship experience. However, the report concluded that more could be done to inform the participants – universities, students and employers – of the benefits of internships.
62
National Minimum Wage - Final Government evidence to the Low Pay Commission 2011
3.56 We will continue to work to raise awareness of the benefits of internships, particularly amongst SMEs. To support this we are providing funding to continue the Graduate Talent Pool (GTP) website for another year, as a free internships vacancy matching service for employers and recent graduates. The GTP is designed to support the growth of graduate internships and to appeal particularly to SMEs, to encourage them, perhaps for the first time, to tap into graduate skills and knowledge. Since its inception in 2009, over 37,000 graduate internship vacancies have appeared on the GTP site, 60% of which have been paid. When employers register on the GTP, they are reminded of the need to comply with employment law, such as NMW legislation, and a link is provided to Business Link guidance on internships. Social Mobility Strategy 3.57 The Social Mobility Strategy, published in April 2011, recognised the important role that internships currently play in the youth labour market, explaining that as a result and in order to promote fair access to jobs internships need to be opened up to all young people. The Government called on businesses to sign up to the Business Compact, offer internships openly and transparently, and provide financial support to ensure fair access. The Government is also leading by example in reforming the way internship opportunities are offered in Whitehall, with a new Whitehall Internship Scheme extending the programme of internships to attract talented individuals from under-represented groups. Guidance 3.58 An individual is entitled to the NMW if they are a worker and an exemption in NMW legislation does not apply to them. Whether an intern is a worker will be determined by the contractual relationship, if any, with their (purported) employer. There are many different types of internships, varying in length, content and quality. 3.59 As promised, we have been working with stakeholders to produce guidance to clarify when individuals performing work experience, including interns, are entitled to the minimum wage. This guidance, reflecting the current legal position, has now been published and includes a worker checklist and several case studies. We have not been able to address all the concerns raised by stakeholders in their comments on the draft guidance. It is usually clear whether an individual is a worker for the purposes of the NMW. However, sometimes this is not clear-cut, and HMRC and Employment Tribunals may need to deal with difficult factual scenarios from time to time. The Courts and Tribunals will look at the reality of the situation, which could mean that in some cases they disregard express contractual clauses to give effect to what they determine are the ‘true intentions’ of the parties on the facts of a particular case. In this context, we believe that the updated guidance on Business Link and Direct.gov is helpful in providing greater clarity for employers and individuals.
63

National Minimum Wage - Final Government evidence to the Low Pay Commission 2011
3.60 BIS is collaborating with the Gateways to the Professions Collaborative Forum on its work to improve the quality of, and access to, internships, especially for those from disadvantaged backgrounds. This is in response to the Milburn Panel on Fair Access to the Professions, which pointed out that internships are increasingly a prerequisite for entry into the professions and that lack of access to them for young people without the contacts to obtain a placement or the means to undertake an unpaid internship constitutes a barrier to access to the professions. The Forum published its voluntary Code of Best Practice for High Quality Internships, with Government endorsement, on 18 July. The Code promotes high quality internships relevant to careers in the professions and encourages employers to pay interns at least the minimum wage where national minimum wage legislation applies. This will go some way to ensuring that interns have a well-structured and beneficial experience and are not exploited. 3.61 In addition, Creative & Cultural Skills and Arts Council England are producing their own sector-specific Internships Guidelines, which they hope to publish later this year. They are committed to opening up entry routes in the creative and cultural industries, and are aware of the sector’s reliance on unpaid labour. They intend to raise awareness within their sector of employer’s legal obligations, particularly those under National Minimum Wage legislation, following the publication of their guidelines. Entertainment sector 3.62 In response to the LPC’s recommendation in 2010 for the Government to produce sector specific guidance on the NMW for the entertainment sector, we promised to take this forward by updating the internships and work experience guidance on Business Link to provide more clarification and to include entertainment sector-based examples. As mentioned above, we have now published this guidance, which includes examples from the entertainment sector – on Direct.gov, as well as Business Link. Views from entertainment sector-based organisations were sought and considered in producing this guidance. Enforcement 3.63 We will ensure enforcement of the National Minimum Wage continues to be effective, and resources are focused where they will have maximum impact. HMRC will conduct a targeted enforcement campaign in sectors where internships are commonplace later this financial year.
64

National Minimum Wage - Final Government evidence to the Low Pay Commission 2011
Work Programme 3.64 On 10 June 2011, the Government launched the Work Programme to provide additional support for people who are at risk of long-term unemployment. Everyone who receives Jobseeker’s Allowance or Employment and Support Allowance (including graduates claiming out of work benefits) will be able to access the Work Programme at a time that is right for them. Work Programme providers will be free to design support based on individual and local need and will be paid primarily for supporting claimants into sustained employment, with higher payments for supporting the hardest to help.
65
National Minimum Wage - Final Government evidence to the Low Pay Commission 2011
SECTION 4 OTHER REMIT ISSUES
Summary In order for the NMW regime to be effective, it is important that workers know what they are entitled to and that employers are able to easily demonstrate that they have met their obligations. In the current economic climate, it is also important to consider whether the NMW legislation could be made simpler and easier to administer, to see if it is possible to reduce burdens on employers. We have therefore asked the LPC to consider whether the NMW regulations could be made simpler and easier to administer. In the Employment-related spotlight in the Red Tape Challenge, we asked for ideas to simplify the NMW. We did not receive any such suggestions from business. We have also asked them to consider the best way to give businesses greater clarity on future levels of the NMW (including the option of two-year recommendations). Until 2007, the LPC provided a main rate recommendation for the forthcoming year and a provisional one for the following year. We recognise that the continuing economic uncertainty may not make two-year recommendations possible. However, increased clarity may be achievable through other means.
Simplification of NMW rules 4.1 As part of the Employment Law Review (see para 4.8 for further details), we are exploring whether NMW legislation can be made even simpler and easier to administer. In June, we asked the LPC, to consider this and explained that this might include the removal, simplification or consolidation of any elements of the NMW. 4.2 Over time, we have been trying to embed the principle that workers receive a core basic wage of at least the NMW. For instance, tips paid to workers do not count towards the minimum wage. This core minimum wage cannot include benefits in kind, except for accommodation. 4.3 We would be keen to explore the extent to which we could make the requirement that workers are always remunerated in money, which would ensure that it was absolutely clear when employers were paying, and employees receiving, the NMW.
66
National Minimum Wage - Final Government evidence to the Low Pay Commission 2011
4.4 In addition, as part of this agenda, we asked the LPC to review the implications for the NMW framework of the proposed abolition of the Agricultural Minimum Wage in England and Wales, assuming Parliamentary approval for the Public Bodies Bill, and, pending consultation and the legislative progress – see below for further details.
Agricultural Wages Board 4.5 In July 2010, the Government announced its intention to bring forward legislation to abolish the Agricultural Wages Board and bring agricultural workers within scope of the National Minimum Wage Act. 4.6 The Public Bodies Bill, which is currently going through Parliament, would provide for the Secretary of State to lay an Order to abolish the Board and make the necessary amendments to bring agricultural workers within scope of the National Minimum Wage and Working Time Regulations. 4.7 Following changes during the Committee stage in the House of Lords, as the Bill stands, Ministers will be required to consult before making Orders under the Bill. Defra plans to consult publicly on the Agricultural Wages Board after the Bill has received Royal Assent, and following consideration of the responses to the consultation exercise, the Government will make its decision on the future of the Board.
Employment Law Review 4.8 The Government’s key priority is to ensure economic stability and growth. It is therefore important to ensure that the underpinning regulatory framework of employment law helps rather than hinders growth, striking a clear balance between basic standards that safeguard the rights of individuals and flexibility for businesses to operate efficiently and effectively. We are clear that it is essential that the labour market functions in a way that gives employers the confidence to take on staff. The Employment Law Review, a cross-Government review, co-ordinated by BIS and running for the life of the Parliament, is considering the obligations employment law places on employers to ensure they maximise flexibility, without compromising fairness for individuals. The aims of the review include considering whether:
we can simplify existing regulation to make it easier to understand, whilst recognising there is a balance to be maintained between simplifying complex legislation and removing or changing requirements that many businesses are now familiar and comfortable with;
compliance can be made easier for employers, looking at how regulation is implemented, complied with and enforced; and
67
National Minimum Wage - Final Government evidence to the Low Pay Commission 2011
we can improve available information, so employers are making informed decisions and not knee-jerk reactions to misperception or fear of the unknown.
There are alternative ways of managing the employer / employee relationship and for the Government to step back.
Since the launch of the Review last year, we have:
consulted on a package of reforms to the employment tribunal system, aimed at encouraging earlier resolution of disputes in the workplace and reducing the number of tribunal cases (which are costly for employers, employees and Government) - the Government Response to the consultation is expected to be published in late 2011;
launched an Employer’s Charter that reassures employers about what they can already do to deal with staff issues in the workplace;
launched a review of workplace compliance and enforcement arrangements, with the aim of streamlining the system;
removed the Default Retirement Age, thus removing significant paperwork obligations for employers and bringing wider benefits to the economy, encouraging older people to continue working;
announced the proposed abolition of the Agricultural Wages Board and Agricultural Minimum Wage, pending consultation and the Parliamentary process;
commissioned an independent review jointly with DWP of the system for managing sickness absence;
repealed the planned extension of the right to request flexible working to parents of 17 year olds;
decided not to proceed with the dual discrimination provision in the Equality Act;
decided not to extend the right to request time to train to companies with fewer than 250 staff; and
exempted small businesses with fewer than ten employees (and start ups) from new domestic regulation for three years, from 1st April 2011.
In May, the Government announced its medium term plans for the review which include:
looking at simplifying the regulations on the National Minimum Wage (by inviting the LPC to consider and make recommendations to the Government);
examining the consultation periods and rules on collective redundancy;
reviewing the TUPE regulations; and
looking at discrimination awards made by employment tribunals.
68

National Minimum Wage - Final Government evidence to the Low Pay Commission 2011
4.9 In November, the Secretary of State announced the results of the consultation on resolving workplace disputes and the Red Tape Challenge review of employment law. The package of measures retains key protections for employees whilst also fundamentally improving the way employers take people on, manage disputes and let people go. Changes will include:
an overhaul of employment tribunals;
a call for evidence on:
o A proposal to introduce compensated no fault dismissal for micro firms with fewer than 10 employees; and
o Looking at ways to slim down existing dismissal procedures, how they may be simplified, including potentially working with Acas to make changes to their Code, or supplementary guidance for small businesses;
In response to the Red tape Challenge, more than 70 employment related regulations are to be merged, simplified or scrapped. The Government will:
Publish a call for evidence on proposals to simplify the Transfer of Undertakings (Protection of Employment) rules which many businesses say are too complex and bureaucratic;
Close a whistleblowing case law loophole which allows employees to blow the whistle about their own personal work contract;
Merge 17 NMW regulations into one set, to complement the work the LPC is doing on how best to streamline the system;
Consult in the spring to streamline the current regulatory regime for the recruitment sector; and
Create a universally portable Criminal Records Bureau check that can be viewed by employers instantly online, from early 2013. these policy changes are being led by the Home Office.
4.10 In the Employment-related spotlight in the Red Tape Challenge, we asked for ideas to simplify the NMW. We did not receive any such suggestions from business.
Greater clarity on future NMW levels 4.11 The Growth Review was set up to ensure that Government is doing all it can to support economic recovery. It is a cross-Whitehall programme to forensically look at the barriers to growth and what the Government can do to address them. 4.12 Following engagement with the retail sector, we invited the LPC in its next report to consider and implement the best way to give business clarity on future levels of the National Minimum Wage, including consideration of two-year recommendations. This would provide greater certainty for small and large retailers, and other businesses, when planning employment and
69
National Minimum Wage - Final Government evidence to the Low Pay Commission 2011
investment decision. For example, greater certainty of future NMW levels would reduce risks for employers, enabling them to take on staff with greater confidence. Large retailers need to formulate and finalise their business plans well before the start of their financial years and certainty on costs is a vital element in creating investment. 4.13 Until 2007, the LPC provided a main rate recommendation for the forthcoming year and a provisional one for the following year. More recently, the LPC has moved to providing a one-year recommendation due to the inability to provide forward rates with any confidence, in light of the level of economic uncertainty and the lack of robust forecasts on which to base future rates. We would be interested to learn whether they believe that the position has sufficiently improved for them to feel able to provide two-year rates recommendations with any confidence. We recognise that the continuing economic uncertainty may not make this possible. However, increased clarity may still be achievable through, for example, giving greater visibility of their thought processes (as done by the Monetary Policy Committee) or, instead of a specific rate for the second year, a descriptive steer on its likely region, or its upper and lower bounds, or a range of probabilities (as done by the Bank of England in its Inflation Report).
70
National Minimum Wage - Final Government evidence to the Low Pay Commission 2011
SECTION 5 RESPONSE TO POLICY ISSUES IN 2011 REPORT
2011 rate recommendations 5.1 The Government published the Low Pay Commission’s 2011 report in April this year. The report recommended the following changes to the NMW rates from 1 October 2011:
an increase in the adult rate of the NMW from £5.93 to £6.08 per hour.
an increase in the Youth Development rate from £4.92 to £4.98 and the 16 – 17 year old rate from £3.64 to £3.68 per hour.
an increase in the apprentice minimum wage from £2.50 per hour to £2.60 per hour.
An increase in the accommodation offset rate from £4.61 to £4.73 per day.
Further details about all the LPC’s recommendations and the Government’s response to them can be found at Annex B. 5.2 This year, the Government has passed two sets of regulations. The National Minimum Wage (Amendment) Regulations 2011 implemented the LPC rate recommendations set out in paragraph 2 above; provided that workers participating in Government schemes provided under the Work programme were not eligible for the NMW; and made consequential changes to the names of certain pre-apprenticeship schemes in Wales. The Regulations were debated in the House of Commons on 5 July and the House of Lords on 12 July. The National Minimum Wage (Amendment) (No.2) Regulations 2011 exempt Higher and Further Education Institutions from the accommodation offset rules where the accommodation is provided to a worker who is enrolled on a full-time course with that institution. These Regulations were debated in the House of Lords on 12 July and the House of Commons on 6 September. Both sets of Regulations will come into force on 1 October 2011.
Seafarers 5.3 The Government has met with the trade unions to discuss the legal position of applying the NMW to non-UK ships travelling between UK ports. This discussion included the implications of a judgment by the Court of Appeal, which concluded that instead of looking at where the ship is registered, the court should look at where the seafarer in question is based. The Government is currently considering this issue.
71
National Minimum Wage - Final Government evidence to the Low Pay Commission 2011
Social Care 5.4 The social care workforce plays a vital role in helping to put people who use social care services in control of their lives. We are aware that low pay can be a concern for some working in the sector. However, the Government does not directly employ care workers. The Government allocates resources to local authorities who make decisions on what proportion of their budgets are spent on adult social care. Local authorities have to ensure that they, and the service providers from whom they commission, offer best value and a quality service. The Government’s position is that the terms and conditions of social care workers, including pay, are a matter for local employers within the existing requirements of employment legislation. 5.5 Analysis of recent available data from the National Minimum Data Set for Social Care (September 2009) shows that average hourly rates of pay for care workers ranged from £6.16 to £8.20, pay for senior care workers ranged from £6.80 to £10.46 and for community, support and outreach workers ranged from £6.68 to £9.71. This compares with the applicable NMW at the time of £5.73/hour. Higher rates are paid by the voluntary and public sectors with lower rates paid by the private sector; and rates for social care workers are higher in domiciliary care than in care homes. 5.6 As a result of the greater take-up of personal budgets, people who use services are increasingly employing Personal Assistants. Wages paid to Personal Assistants tend to be higher than the average for care workers (private sector) with a 2008 survey undertaken by Skills for Care for the Department of Health (DH) showing an average hourly pay rate of £7.60 for Personal Assistants who participated in the research. 5.7 DH will continue to work with local authorities to ensure that the providers from whom they commission services offer fair terms and conditions, including payment of the NMW. 5.8 DH is aware of the need to support vulnerable employers. Adult social care transformation objectives support the establishment of local user-led organisations and the encouragement of local capacity building through local authorities. Good information, advice and guidance and an appropriate level of support should be provided to personal budget recipients. 5.9 DH, the Association of Directors of Adult Social Services and the Local Government Authority agreed key priorities and milestones dates for adult social care transformation in September 2009. These include:
Effective partnerships with people using services, carers and other local citizens – by April 2011, that every council has at least one user-led organisation who are directly contributing to the transformation to personal budgets;
Information and advice – by April 2011, that the public are informed about where they can go to get the best information and advice about their care and support needs.
72
National Minimum Wage - Final Government evidence to the Low Pay Commission 2011
5.10 A further development has seen the setting up of Think Local Act Personal (TLAP) a new sector wide partnership for transforming adult social carer. Their work programme includes the following:
Develop outcomes and agreed ways to measure the success of TLAP Based upon feedback and intelligence, support the sector to find
solutions to key delivery challenges and to share effective and innovative practice
Provide direct leadership in the delivery of TLAP via the action of Partnership members within their own organisations and constituencies
Work with Government and key agencies outside of the Partnership to support delivery of TLAP.
5.11 Reform and personalisation are central to the Government’s approach to social care. The Coalition Agreement proposes reform of the system of social care to provide more control to individuals and their carers, and to ease the cost burden that they and their families face. This includes:
a Commission on long-term care, which reported in July this year and
a forthcoming White Paper, which will contain a workforce element; extending the greater roll-out of personal budgets to give people and
their carers more control and purchasing power; and using direct payments to carers and better community-based provision
to improve access to respite care. 5.12 DH is continuing to work with partner organisations on the strategic priorities for the social care workforce, as follows:
Leadership, management and commissioning Recruitment, retention and career pathways Workforce development and remodelling Joint and integrated working between social and health care and other
services Regulation
5.13 DH has worked with Skills for Care and other partners on the Personal Assistant Framework, ‘working for personalised care’, which sets a strategy for supporting personal assistants working in adult social care. The Framework was published on 27 July 2011. In addition, Skills for Care have recently produced a Workforce Development Strategy and a Recruitment and Retention Strategy that provide advice to employers on the way their workforce needs to develop, recruit, and retain a quality workforce in order to meet the new policy context and rising demand for services. Moreover, the National Skills Academy for Social Care is working on a social care leadership strategy.
73

National Minimum Wage - Final Government evidence to the Low Pay Commission 2011
Migrant domestic workers 5.14 We note the LPC’s views in para 4.7 of their 2011 report that complaints from migrant domestic workers should be given a high priority. We are clear that all those who are entitled to the national minimum wage should receive it. We have worked with staff on the Pay and Work Rights Helpline to ensure that they provide as accurate advice as possible to overseas domestic workers. Helpline operators have access to Language Line which provides accurate live first person interpretation, regardless of the country of origin of the worker.
74
National Minimum Wage - Final Government evidence to the Low Pay Commission 2011
SECTION 6 OTHER POLICY ISSUES
Employed students and the accommodation offset 6.1 The only exception to the general principle of the NMW that workers should be remunerated in money, not in benefits in kind, is accommodation. As a safeguard to protect workers from unreasonable charges, the NMW Regulations set a maximum daily amount that an employer can deduct for the cost of the accommodation (the accommodation offset). 6.2 Last year, the Government became aware that there was a potential problem with the accommodation offset where a Higher Education Institution provides accommodation to a student and also employs them, for example as a student mentor. 6.3 The problem arises because the relationship between an educational institution and its students is primarily educational and accommodation is provided on that basis. Where an institution employs a student part-time, this does not change the basis on which the accommodation is provided. It is not analogous to the circumstances which the accommodation offset was designed to cover – the protection of vulnerable workers whose employers might have sought to avoid paying the minimum wage by levying excessive rent for their accommodation. 6.4 The Government conducted a full public consultation on this issue earlier this year. We received 38 responses to our consultation – from universities and their representative groups and from student representatives and there was an overwhelming consensus supporting the principle that we should address this issue. 6.5 The Government therefore concluded that Higher and Further Education Institutions should be exempt from the accommodation offset rules where the accommodation is provided to a worker who is enrolled on a full-time course with that institution. The overall consistent response to our consultation was that the test for exemption should be based on the educational relationship that a student has with an institution. We have therefore based the test on whether a worker is undertaking a course with the institution. We have limited the exemption to full-time students as we consider that this approach is in line with the principle behind the exemption.
Travel schemes 6.6 As noted in paragraphs 4.46 to 4.48 of the Low Pay Commission’s 2011 report, the Government consulted last year on proposals to change the NMW rules so that tax-free travel and subsistence payments would not count towards pay for NMW purposes. Following the consultation, the Government brought Regulations into force on 1 January 2011 which provided that payments by an employer for travel expenses to a temporary workplace which are eligible for tax relief do not count as pay for NMW purposes.
75
National Minimum Wage - Final Government evidence to the Low Pay Commission 2011
76
6.7 The Government is aware that a number of travel schemes and umbrella business models have been marketed which claim to continue to provide savings for the employer and be compliant with the NMW from 1 January 2011. These include: paying subsistence expenses rather than travelling expenses; classifying workers as directors; holiday pay adjustments; and under recording hours worked. None of the models seen by Government, including those listed here, would comply with the requirements of NMW legislation for workers paid at, or close to the NMW. HMRC continue to seek to identify businesses seeking to circumvent the NMW and take appropriate action.
Compliance and enforcement 6.8 The Department for Business, Innovation and Skills (BIS) is responsible for the policy on NMW compliance and enforcement. HM Revenue and Customs (HMRC) enforce the NMW on BIS’s behalf and work closely with BIS to ensure that BIS’ policy and priorities for enforcement are informed by HMRC’s experience and intelligence obtained by them. BIS and HMRC also work closely with other stakeholders, for example, business representative groups, Local Authorities and unions. This ensures that BIS’ priorities are informed by what is happening in the workplace. 6.9 HMRC’s enforcement budget for 2011/12 was £8,265,000. This represents a 2.4 per cent increase on the enforcement budget for 2010/11 of £8,100,000. 6.10 The Government published the National Minimum Wage annual compliance report for 2010/11 in December 2011. This report can be viewed at: www.bis.gov.uk/assets/biscore/employment-matters/docs/n/11-280-national-minimum-wage-annual-report-2011.pdf
Implementing the National Minimum Wage Compliance Strategy The National Minimum Wage Compliance Strategy 6.11 The Government’s vision is clear – everyone who is entitled to the NMW should receive it. We are taking action with both workers and employers to achieve this. 6.12 Following its publication in March 2010, BIS and HMRC have been working on implementing the National Minimum Wage Compliance Strategy (the NMW Strategy). This has largely involved moving towards a more risk based approach to compliance and enforcement, with HMRC developing and adopting new ways of working to enable them to support the approach to compliance set out in the NMW strategy namely: prioritising according to risk; identifying opportunities to free up resources to focus on the most ‘at risk’ employers and workers; and using a range of leverage tools and techniques to reach different customers.
National Minimum Wage - Final Government evidence to the Low Pay Commission 2011
Risk-based approach to enforcement 6.13 HMRC’s risk assessment process, and consequently our understanding of risk, is continually being refined using data trends extracted from past cases and intelligence from a variety of sources, e.g. wider HMRC data, feedback from unions, the LPC’s report and sources such as Local Authorities. Information is also obtained via information sharing gateways with other enforcement bodies, e.g. the Employment Agency Standards (EAS) inspectorate. Complaints from workers remain a valuable source of information, although we have seen these reduce over the last year (see paragraph 6.71). 6.14 During 2010/11, HMRC were remitted by BIS to investigate all complaints from workers. This has necessitated HMRC conducting an employer compliance visit in the vast majority of cases, but a small number of HMRC compliance teams trialled a new way of working using a ‘triage’ approach to interventions on worker complaint cases. This involved contacting employers by phone and letter to resolve complaints using less resource intensive measures, as well as continuing with compliance visits to employers where the risk of non-compliance indicated that this would be the most effective intervention. This is an approach that is employed elsewhere in HMRC and the trials were used to identify the operational process changes and products that might be required to support this new approach to working complaints cases. BIS and HMRC are committed to rolling this new approach out across HMRC’s NMW teams and believe that this will, in due course, ensure a more efficient and effective use of HMRC’s resources while minimising the risk of burdening NMW compliant employers with unnecessary compliance visits. 6.15 HMRC also collect data and intelligence from a variety of other sources, which is used to identify workers ‘at risk’ of being underpaid and employers ‘at risk’ of being non-compliant. This informs priorities, for example, in targeted enforcement and awareness-raising campaigns.
6.16 With a view to obtaining maximum impact from HMRC’s resources and ensuring that HMRC are effective in tackling the right risks at the right time, HMRC have further refined their risk assessment process, to include:
the creation of a Risk Governance Board (whose main purpose is to ensure that operational activity is consistent with the NMW strategy and fully reflects operational priorities);
the adoption of a campaign approach to NMW investigations identified through HMRC’s risk assessment process (this approach is geared to focussing on certain trade sectors where the risk assessment process indicates there to be a high risk of non-compliance; and
the introduction of different interventions that are tailored to the risk of non-compliance (resolution by phone, letter or face-to-face is an example of this, though HMRC and BIS are exploring other models, for example, whether it is possible to offer a ‘health check’ to employers that falls short of a full NMW investigation).
77
National Minimum Wage - Final Government evidence to the Low Pay Commission 2011
6.17 These changes were put into effect in the latter part of the year. Whilst it is too early to evaluate the impact on operational delivery, BIS and HMRC are committed to the effective implementation of the NMW strategy and it is envisaged that the news ways of working will play a key role in this. Making wider use of leverage 6.18 HMRC’s NMW team are building an increasing number of links with specialised units within HMRC, e.g. the Hidden Economy Team, the Labour Provider Team (LPT) and HMRC’s Large Business Service Team. These links have facilitated information-sharing and the sharing of best practice and intelligence across HMRC to inform their picture of risk. 6.19 HMRC’s Dynamic Response Team (DRT) worked closely with the LPT on the targeted enforcement initiative on hotel cleaners (see paragraph 6.42). This made use of the LPT’s experience and intelligence on labour providers to identify and tackle the issues caused by labour providers operating in the hotel sector. It included a due diligence exercise that involved disseminating guidance on labour providers to hotel chains. DRT also enlisted support from the British Hospitality Association, which publicised the targeted enforcement campaign through their members’ newsletter. This enabled HMRC to reach a large number of hotels and highlight the responsibilities that hotels have to the people who work in the hotel business, in particular with regard to checking that sub-contractors are paying the NMW. BIS scheme to name employers who flout NMW law 6.20 The BIS scheme to name employers who flout NMW law was introduced on 1 January 2011. As the scheme title suggests, it is envisaged that cases that are identified for naming will involve acts or omissions, which, whilst falling short of the selection criteria for prosecution, point to the employer deliberately falling short of required standards or being negligent in some respect. The criteria for naming are as follows: there is evidence that the employer knowingly or deliberately failed to
comply with their NMW obligations; there is evidence that the employer has previously received advice from
HMRC about the steps they need to take to ensure future compliance with the NMW and has not taken those steps;
there is evidence that the employer has failed to take adequate steps to
keep or preserve NMW records; there is evidence that the employer has delayed or obstructed a NMW
compliance officer in the performance of their duties; there is evidence that the employer has refused or neglected to answer
questions put to them by a NMW compliance officer;
78
National Minimum Wage - Final Government evidence to the Low Pay Commission 2011
there is evidence that the employer has refused or neglected to provide information or produce documents to a NMW compliance officer; and
there is evidence that the employer refused or neglected to pay arrears of
the NMW to workers, following HMRC intervention, which has resulted in HMRC taking action against the employer to ensure payment of arrears to workers.
6.21 The objective of the naming scheme is to raise awareness of NMW enforcement and deter employers who would otherwise be tempted to flout NMW law. The Government recognises that some employers are more likely to respond to the social and economic sanctions that may flow from details of their payment practices being made public, than from financial deterrents. The naming scheme will ensure that the public and businesses, including workers, prospective workers, and law-abiding employers, have access to information that will enable them to make informed choices about who they work for (in the case of workers) and who they do business with (in the case of employers). The Government envisages that raising awareness of NMW enforcement in this way could also encourage more workers who have been underpaid to come forward. 6.22 HMRC will not normally refer cases to BIS unless the total arrears owed to workers are at least £2,000 and the average arrears per worker are at least £500. This financial criterion will be kept under review to ensure that the naming scheme continues to meet the policy objectives of the scheme. Initial indicators are that this additional criterion has led to the right type of cases being referred to BIS for further consideration. It should, however, be noted that BIS’s policy on naming gives HMRC scope to refer cases where the arrears are less than specified in the published policy. 6.23 Since the scheme was introduced on 1 January 2011, 7 cases have been referred to BIS for consideration. Prosecutions 6.24 BIS and HMRC believe that prosecutions can have a deterrent effect as part of an integrated compliance strategy. To improve the capability of compliance officers in identifying suitable cases for prosecution and gathering appropriate evidence to underpin their referrals for prosecution, HMRC has put in place a NMW single point of contact (SPOC) to work with the SPOCs in HMRC’s Criminal Investigations (CI), Risk and Intelligence, and NMW Technical teams. The SPOCs share best practice (and ensure that this is disseminated to teams) and ensure that compliance officers learn from experience (i.e. they understand why cases are rejected for criminal enforcement proceedings, as well as why cases are accepted). Case review meetings are held with the SPOCs bi-monthly and information from these meetings is shared with the compliance teams to enable cases under consideration to be progressed. This has resulted in improved guidance for compliance officers and a new Memorandum of Understanding between NMW, technical advisors and CI which sets out the protocol for dealing with
79
National Minimum Wage - Final Government evidence to the Low Pay Commission 2011
80
criminal investigation cases. Investigative skills refresher courses have been rolled out across the NMW teams and fraud awareness training is planned for later in the year.
6.25 Whilst it is too early to evaluate these initiatives, there has been an improvement in the quality of cases being identified for criminal investigation and during 2010/11:
24 potential criminal investigation cases were referred to HMRC’s NMW Technical team
6 of these cases were forwarded to CI for investigation. 2 cases are currently with the Crown Prosecution Service - 1 case was
accepted for prosecution and the other is under consideration.
6.26 Criminal investigation is resource intensive work in terms of fact finding, evidence gathering and prosecution activity in HMRC but BIS are committed to continuing to prosecute the most serious cases. It should be noted that BIS and HMRC are clear that the new naming scheme is not, and never can be, an alternative to prosecuting offences under the NMW Act. 6.27 There have been 7 successful prosecutions since the then DTI agreed a policy on NMW enforcement and prosecutions with HMRC and the Revenue and Customs Prosecutions Office in May 2006. The case of the Manchester Optician, reported in last year’s evidence to the LPC demonstrates the extensive media interest in the outcome of these cases. Work on the hidden economy – Making use of unannounced visits 6.28 There are a number of employers who knowingly operate under HMRC’s radar in terms of non-compliance with tax and NMW legislation. DRT continues to scrutinise such businesses by exploiting close cross government working arrangements with HMRC’s Hidden Economy Group (HEG), Gangmasters Licensing Authority (GLA), UK Border Agency (UKBA), EAS, Local Authorities and the police. This work has now expanded to address particular risks posed by the forthcoming 2012 Olympic Games. 6.29 In 2010/11 DRT cross agency investigation work focused on unannounced ‘street sweeps’ of businesses suspected of operating in the informal economy in major cities. This involved unannounced ‘blitz’ approaches where large numbers of trade-specific employers were visited in particular geographic areas over a short period of time. This raised the profile of NMW enforcement and collaboration with other enforcement bodies to employers operating in the target area and sent a strong signal that failure to pay the NMW will not be tolerated.
National Minimum Wage - Final Government evidence to the Low Pay Commission 2011
6.30 Examples of work on the hidden economy include an operation in London where DRT and HMRC’s HEG team carried out a day time ‘blitz’ of eight non-trade specific employers, followed up by a later night time sweep on 11 fast food retailers over an eight-hour period. Working alongside the police, DRT also visited 11 ‘Off Licences’ in a particular Olympic borough. 6.31 In Leicester and Exeter DRT officers worked alongside EAS colleagues in a series of unannounced visits to employment agencies/businesses in two separate two-day operations. Over the four days 52 agencies were jointly investigated with a significant number of employers found to have breached NMW legislation and employment agency standards. One particular investigation has identified arrears of wages exceeding £80,000 payable to 1,400 workers. 6.32 In the first half of 2011/12, DRT officers worked alongside UKBA, HEG, the Department for Work and Pensions, the Health and Safety Executive, and the police during a major operation in Leicester city centre focussing on migrant workers employed in the textile manufacturing businesses. The operation was based on intelligence provided by DRT to the UKBA and it involved over 100 officers and attracted widespread media coverage. 6.33 In Northern Ireland, NMW and DRT officers worked alongside GLA inspectors in an operation that involved a series of unannounced visits to employers operating within the food production industry over a period of three days. 29 employers were inspected and the operation identified a number of NMW irregularities and one unlicensed gangmaster. Large and complex cases 6.34 HMRC’s NMW team has established a working protocol with HMRC Customer Relationship Managers who work closely with large and complex UK businesses on various tax compliance issues. The protocol has raised awareness of NMW amongst wider HMRC staff and has helped to ensure the expedient resolution of NMW complaints and enquiries on large and complex cases. The new protocol resulted in NMW compliance staff participating in a presentation to a large UK High Street Retailer’s supply chain to raise their awareness of NMW legislation and their responsibilities as employers. HMRC’s NMW team has also established contact with the British Retail Consortium and are exploring options for raising awareness of compliance issues amongst their members. Working with Local Authorities 6.35 DRT continued to work with a number of Local Authorities to raise awareness of NMW enforcement and the NMW generally. During the first part of the year the DRT participated in various initiatives that sprung from the Migration Impact Fund (MIF) project, such as the workshop that was organised by the Yorkshire and Humber Regional Migration Partnership thatwas attended by over 40 delegates from councils, police and migration groups across that area. This led to subsequent invitations to attend similar events.
81
National Minimum Wage - Final Government evidence to the Low Pay Commission 2011
6.36 Work to date has involved making presentations to council enforcement officers, carrying out joint visits with Local Authorities, producing a NMW help card, providing dedicated contact points and organising job shadowing. Examples of outreach events that HMRC’s NMW team have participated in include the Building on Opportunities Skills and Training (BOOST) project event organised by Leicester Council. The aim of BOOST was to develop 10 Council trainers from the migrant community to pass on information to migrant workers about their entitlements to social benefits, welfare and workplace rights. 6.37 In addition, DRT are working closely with Newham Council to gain a better understanding of perceived issues with NMW enforcement in the London Borough of Newham. There are plans to build on this work later in the year, and BIS and HMRC are currently considering the scope for a pilot into ‘local enforcement’ that would involve some form of joint working between HMRC and other Government enforcement bodies and Local Authority enforcement teams. A range of options are on the table and will need careful consideration. Ultimately the aim is to develop a ‘model’ for working with councils across the country that fosters collaboration and makes best use of ‘local information’. Working with the Maritime and Coastguard Agency 6.38 HMRC continues to collaborate with the Maritime and Coastguard Agency (MCA) on raising awareness of the NMW amongst seafarers. HMRC worked with the MCA on updating the MCA’s Wage Complaints Guidance Card, which gives seafarers advice on entitlement to the NMW and what they need to do if they consider they are not being paid the NMW. HMRC and MCA have also met to review the scope and content of MCA’s internal guidance. The outcome of this was greater clarity for MCA surveyors about the NMW complaints process; the nature of information needed to support a seafarer’s complaint; and the identity of a single point of contact in HMRC who MCA can liaise with on general enquiries. Working with unions 6.39 Building on the regional briefing sessions for local union officials that HMRC’s NMW team participated in, in February and March 2010, as part of the third round of Union Modernisation Fund projects, the Trade Union Congress produced a video on the enforcement of employment rights, in collaboration with the enforcement bodies that sit behind the Pay and Work Rights Helpline. The video can be viewed at: www.tuc.org.uk/workplace/tuc-19833-f0.cfm Working with Citizens Advice Bureau 6.40 Priority has been given this year to building closer links with Citizens Advice Bureau (CAB) and a member of BIS’s Labour Market team was seconded to CAB for a four-month period to explore how to make best use of
82
National Minimum Wage - Final Government evidence to the Low Pay Commission 2011
83
information gathered by CAB and how CAB could promote awareness of the NMW. The project resulted in an update of CAB's system, ensuring that information held by CAB on the NMW and HMRC enforcement was accurate; the distribution of NMW messages through CAB's extensive local network; and the introduction of measures to allow CAB's to feed better quality information through to HMRC – primarily this has entailed raising awareness in CAB of the types of information that HMRC requires to investigate complaints about non-payment of the NMW.
Targeted enforcement
6.41 In tandem with the campaign approach to enforcing the NMW that has been a feature of NMW enforcement this year, HMRC have also carried out targeted enforcement in the hotel cleaning sector and in hospitality. There are plans to carry out targeted enforcement in other sectors later this financial year. Hotels and Hospitality 6.42 In 2010/11HMRC worked with the British Hospitality Association to target hotels in London who employed agency cleaning staff. Using a campaign approach to enforcement, HMRC wrote to around 80 London hotels that were using hotel cleaning services provided by of a large employment agency. This resulted in a number of compliance interventions with arrears of the NMW being identified in nine of the 14 cases that were identified for further investigation. These investigations are ongoing. 6.43 The casework involves extensive enquiries into employers, end users and significant numbers of contract cleaning workers in a variety of locations. Challenge has been made on the basis of the number of rooms cleaned and piece-work rates, and early indicators suggest that the main issue with regard to the employers who were investigated was that workers had not been paid the NMW for all of the hours that they worked. HMRC also investigated two large employment agencies providing cleaning services to more than 200 hotels. Again, these investigations are ongoing but arrears in excess of £21,000 for nearly 300 workers have already been identified. 6.44 On 16 May 2011 HMRC announced the creation of new task forces to tackle non-compliance as part of HMRC’s broader remit to tackle tax evasion and avoidance. The task forces will undertake intensive bursts of compliance activity to identify tax dodgers and NMW rule breakers in specific high risk trade sectors and locations across the UK. The first task forces have focused on the restaurant trade in Scotland, London and the North West. HMRC are planning a further nine task forces in 2011/12. This work will be supplemented by a number of NMW specific investigations across the UK in the restaurant and take-away food sector. Work is also planned to investigate the operation of holiday camps across various locations in the South, timed to fit with the seasonal nature of this type of business.
National Minimum Wage - Final Government evidence to the Low Pay Commission 2011
Interns and work experience 6.45 The Government recognises the concern raised by many stakeholders, including the LPC, about the increase in internships, in particular unpaid internships, and the risk of exploitation. BIS has published revised guidance on a range of NMW topics and for the first time this includes a ‘Worker Checklist’ to help employers and individuals alike, to determine when someone who is performing work experience is entitled to the NMW. 6.46 Whilst the Government wants as many internship opportunities as possible to be made available to talented young people from all backgrounds, BIS and HMRC are clear that those who are entitled to the minimum wage should receive it. In addition to improving the guidance to clarify when individuals performing work experience, including interns, are entitled to the minimum wage, we will ensure enforcement of the NMW in sectors were internships and work experience positions are prevalent is effective. 6.47 In 2011/12 HMRC will commence a multi-stranded approach to investigating complaints about unpaid internships and work experience placements. This will entail:
the Pay and Work Rights Helpline fast tracking and referring all complaints and enquiries about unpaid work to HMRC. This new approach will dove-tail with the launch of the revised guidance; and
targeted enforcement activity in sectors where unpaid internships are common place. Initially the focus will be on the fashion and TV / film production sectors. BIS and HMRC will consider whether to extend the campaign to other sectors in light of HMRC’s findings. These campaigns are scheduled for commencement later this financial year.
BIS and HMRC Research into Employer Behaviour 6.48 At the end of 2010/11, BIS commissioned Ipsos MORI, an independent market research company, to conduct a survey into what influences employer behaviour. This study had three important overall aims: to gauge the range of attitudes that influence employers’ behaviour
towards compliance with the NMW - which will help to inform the implementation of the NMW Compliance Strategy;
to assess awareness and attitudes towards the NMW enforcement regime and measure its impact on employer behaviour; and
to assess employer attitudes to NMW compliance visits and other HMRC interventions.
This is an important piece of work that will feed into BIS’s objective of moving towards an outcome-based approach to measuring HMRC’s performance. The findings of this research were published in October and can be viewed at: www.bis.gov.uk/assets/biscore/employment-matters/docs/r/11-1335-research-employers-attitude-national-minimum-wage BIS Mini Review of best practice amongst enforcement bodies
84
National Minimum Wage - Final Government evidence to the Low Pay Commission 2011
6.49 In November 2009, BIS conducted a mini review of best practice, which involved the enforcement agencies that sit behind the Pay and Work Rights Helpline and other enforcers who have a similar role or who conduct document-based enquires, for example, Companies Investigations Branch, the Insolvency Service and the UK Borders Agency. The findings of this review have been shared with participants and will feed into the wider review of enforcement and workplace rights (see below) – particularly with regard to the strand of work that will look at powers and penalties.
Guidance on the NMW 6.50 Key to the NMW Strategy is ensuring that employers and workers have easy access to information they can rely on. BIS and HMRC have worked together to refresh the guidance on Business Link and Direct.gov to ensure that it is up-to-date, pitched at the right level and accessible. 6.51 Employers must be able to comply and in addition to providing on-line guidance, employers have access to an on-line tool, hosted by Business Link, which helps employers to decide if an individual is entitled to the NMW, and if so at what rate. It also allows them to calculate arrears of the NMW where there has been an underpayment (or confirms that no arrears are due). Employer facing guidance 6.52 The employer facing guidance is hosted by Business Link and in 2010/11 the NMW content on the Business Link website received the following visits: 106,585 visits to the Business Link web guidance 6,034 successful completions of the NMW entitlement, rate and arrears
checker (the NMW calculator).
85
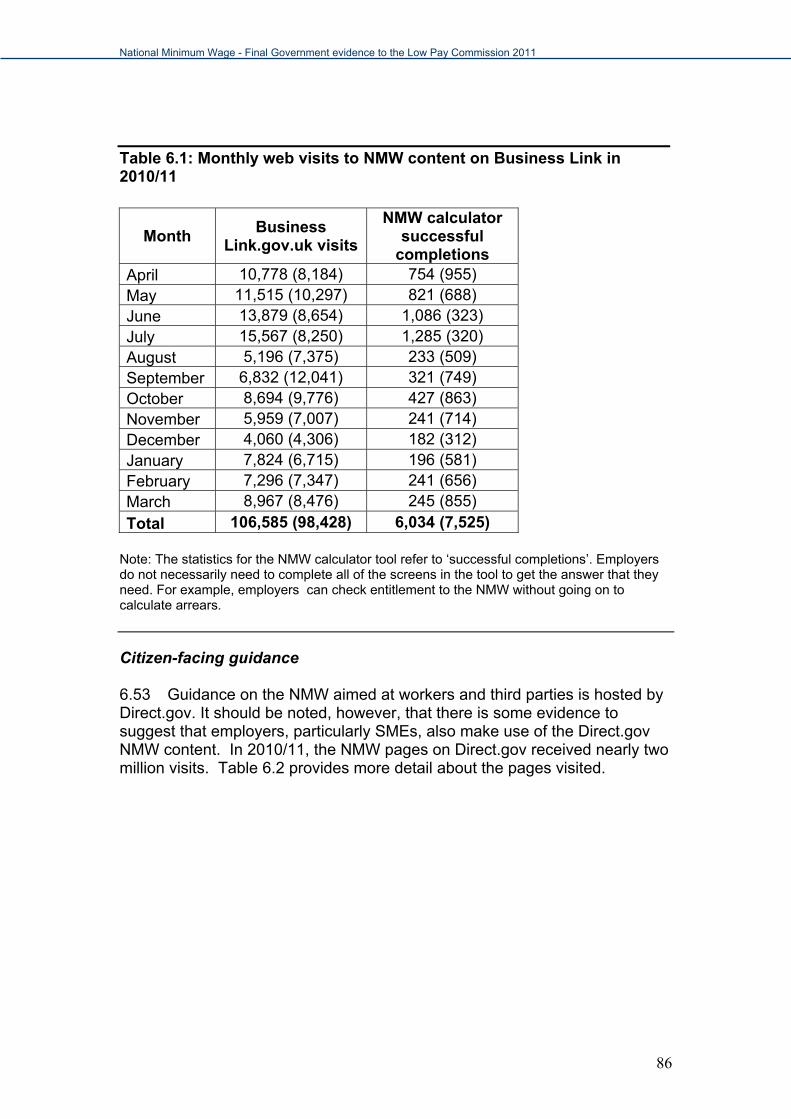
National Minimum Wage - Final Government evidence to the Low Pay Commission 2011
86
Table 6.1: Monthly web visits to NMW content on Business Link in 2010/11
Month Business
Link.gov.uk visits
NMW calculator successful
completions April 10,778 (8,184) 754 (955) May 11,515 (10,297) 821 (688) June 13,879 (8,654) 1,086 (323) July 15,567 (8,250) 1,285 (320) August 5,196 (7,375) 233 (509) September 6,832 (12,041) 321 (749) October 8,694 (9,776) 427 (863) November 5,959 (7,007) 241 (714) December 4,060 (4,306) 182 (312) January 7,824 (6,715) 196 (581) February 7,296 (7,347) 241 (656) March 8,967 (8,476) 245 (855)
Total 106,585 (98,428) 6,034 (7,525) Note: The statistics for the NMW calculator tool refer to ‘successful completions’. Employers do not necessarily need to complete all of the screens in the tool to get the answer that they need. For example, employers can check entitlement to the NMW without going on to calculate arrears.
Citizen-facing guidance 6.53 Guidance on the NMW aimed at workers and third parties is hosted by Direct.gov. It should be noted, however, that there is some evidence to suggest that employers, particularly SMEs, also make use of the Direct.gov NMW content. In 2010/11, the NMW pages on Direct.gov received nearly two million visits. Table 6.2 provides more detail about the pages visited.
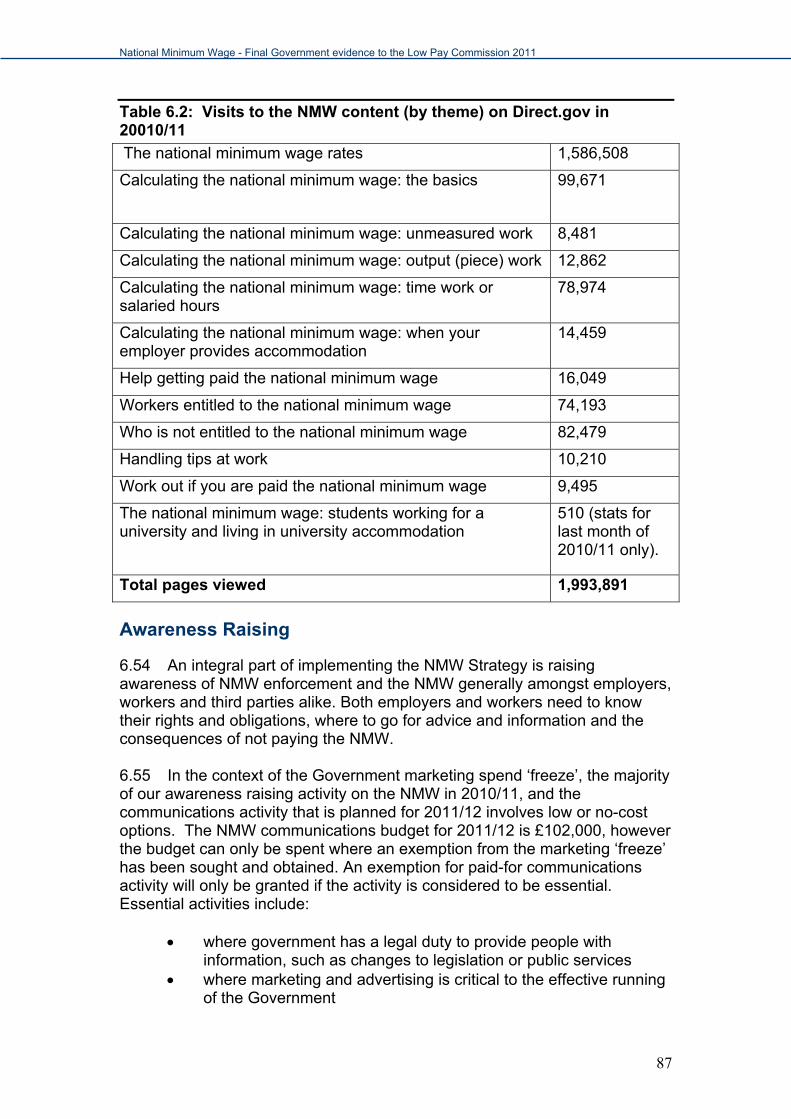
National Minimum Wage - Final Government evidence to the Low Pay Commission 2011
Table 6.2: Visits to the NMW content (by theme) on Direct.gov in 20010/11
The national minimum wage rates 1,586,508
Calculating the national minimum wage: the basics 99,671
Calculating the national minimum wage: unmeasured work 8,481
Calculating the national minimum wage: output (piece) work 12,862
Calculating the national minimum wage: time work or salaried hours
78,974
Calculating the national minimum wage: when your employer provides accommodation
14,459
Help getting paid the national minimum wage 16,049
Workers entitled to the national minimum wage 74,193
Who is not entitled to the national minimum wage 82,479
Handling tips at work 10,210
Work out if you are paid the national minimum wage 9,495
The national minimum wage: students working for a university and living in university accommodation
510 (stats for last month of 2010/11 only).
Total pages viewed 1,993,891
Awareness Raising
6.54 An integral part of implementing the NMW Strategy is raising awareness of NMW enforcement and the NMW generally amongst employers, workers and third parties alike. Both employers and workers need to know their rights and obligations, where to go for advice and information and the consequences of not paying the NMW. 6.55 In the context of the Government marketing spend ‘freeze’, the majority of our awareness raising activity on the NMW in 2010/11, and the communications activity that is planned for 2011/12 involves low or no-cost options. The NMW communications budget for 2011/12 is £102,000, however the budget can only be spent where an exemption from the marketing ‘freeze’ has been sought and obtained. An exemption for paid-for communications activity will only be granted if the activity is considered to be essential. Essential activities include:
where government has a legal duty to provide people with information, such as changes to legislation or public services
where marketing and advertising is critical to the effective running of the Government
87
National Minimum Wage - Final Government evidence to the Low Pay Commission 2011
where there is robust evidence that marketing and advertising delivers measurable outcomes that meet government objectives
Report on communications for 2010/11 6.56 In 2010/11 BIS made an application for an exemption from the marketing ‘freeze’ on the grounds that there was a legal duty to inform employers about forthcoming changes to NMW legislation. The application was rejected by the Cabinet Office who considered that BIS had discharged its legal obligation by informing employers of the changes via HMRC’s Employer Bulletin. A considerable amount of effort went into alerting employers who may have missed the article in the Employer Bulletin. Businesslink carried news on the NMW rate changes prominently in its news section for several weeks. Business stakeholders were also engaged to distribute information to their members, with emails and news updates made available to both CBI and FSB members. 6.57 Particular focus was placed on communication channels that would reach the younger worker audience, given that entitlement to the main NMW rate moved from 22 to 21 years of age and a new rate for apprentices was introduced that year. We took advantage of near saturation of internet access and confident usage amongst those under 25 to disseminate information via the internet. Directgov news pages and information pages linking to the new rates were updated and the changes were carried as a significant news story for over a week. Information on Citizens Advice Bureau’s system was reviewed and updated to ensure that its internal database for advisers and its external facing website carried current information – again the website carried this as a highlighted news story for several days. 6.58 For both the business and worker audiences literature was updated to show the latest rates. Budget constraints meant that the business leaflet could only be made available in electronic format, but both a print run and electronic version of the worker leaflet was made available. 6.59 The central press release from BIS, complemented the predominantly online communications campaign and supporting press releases from the TUC and CBI, amongst others, resulted in significant media coverage at the time of the rate change. In addition to inclusion within the majority of national newspapers, the rate change remained within the top 10 most viewed news stories on the BBC News website for the 1st October (the date the NMW changes came into effect). BIS NMW Communications Strategy for 2011/12 6.60 In light of the continuing ‘freeze’ on paid for Government marketing, the communications strategy for 2011/12 is primarily focused on maximising low or no cost awareness raising opportunities. A number of awareness raising campaigns are planned.
88
National Minimum Wage - Final Government evidence to the Low Pay Commission 2011
6.61 In addition to publicising the October 2011 rate changes in HMRC’s Employer Bulletin, an article will also be included in the BIS bulletin – which is distributed to around 600 key stakeholders and media contacts. Awareness raising of the rate changes through stakeholders will be maximised through the development of a toolkit which can be used across multiple channels. Options currently being explored include: a leaflet, poster, Q&A and a short article conveying key NMW messages. These resources would be made available on the BIS website and a link to this will be emailed to stakeholders. 6.62 Rate changes will also be publicised through a BIS press release and updates on both the Businesslink and DirectGov websites. Further options for digital communications under consideration include:
a feature on the BIS website announcements on Twitter (the BIS twitter account has roughly 20,000
followers) an entry on the BIS blog other blogs/forums as appropriate
Also being explored is the option of writing direct to employers in low paying sectors, subject to approved funding. 6.63 A communications campaign is also planned around the launch of the updated NMW guidance on interns and work experience. A ‘virtual stakeholder group’ has been created to ensure that the guidance is distributed as widely as possible. Members of the stakeholder group – including sector bodies, interns awareness groups and the NUS – will receive links to the updated guidance and have been asked to carry these on their websites and in communications with their members. The updated guidance will also be publicised through HMRC’s Employer Bulletin. 6.64 Options for an online toolkit for stakeholders with an interest in internships/work experience are also being explored. This could include posters and leaflets including a link to the updated guidance. The toolkit would be made available on the BIS website and a link sent to stakeholders. HMRC Communications Officer 6.65 HMRC provides outreach to employers, through regular seminars and have been working with trade associations or other bodies to raise the profile of NMW enforcement and the NMW generally (see paragraphs 6.34-6.40). 6.66 In May 2011 HMRC appointed a part-time Communications Officer who also works as a Compliance Officer. The intention is that HMRC’s NMW communications activity will be informed by actual experience of enforcing the NMW wage, and working with employers and workers.
89
National Minimum Wage - Final Government evidence to the Low Pay Commission 2011
90
Statistics on NMW enforcement 6.67 Since its introduction in 1999 more than £42 million in NMW arrears for around 163,000 workers22 has been identified. Penalties and Fair Arrears 6.68 In 2010/11, HMRC issued 1,126 notices of underpayment and identified just over £3,8m in arrears owed to almost 23,000 workers. Workers are now entitled to be repaid arrears of the NMW at current rates23. This means that where HMRC identify arrears the worker is entitled to be paid those arrears at the current rate and not the rate that applied at the time the arrears were incurred. The additional element of arrears recovered in this way for workers in 2010/11 was £296,000. 6.69 Penalties have been imposed in 937 cases amounting to just over £560,000. Of those penalties, 620 were paid within 14 days and were therefore subject a 50% discount. The penalty that is charged is based on total arrears for pay reference periods starting on or after 6 April 2009 (when the new enforcement regime came into effect). The penalty is 50% x post 6 April arrears, capped at £5,000. The minimum penalty is £100 (discounted to £50 if the arrears to workers and the penalty are both settled within 14 days). Compliance Officer Recruitment 6.70 The staff in post position remained fairly constant throughout the year. At 31st March 2011 there were 152 staff in post (which mirrored the state of play on 1st April 2010). However over the course of the year there was a reduced level of available resource at Compliance Officer grade. This arose primarily because of the delivery of business development initiatives such as Pacesetter and uncertainty around financial budgets in the light of the Comprehensive Spending Review that inhibited the ability to backfill posts. HMRC has ongoing resource plans to address natural churn (e.g. staff retirements) to ensure that, over the long term, staff in post fully reflects the salary budget allocation. Complaints 6.71 In 2010/11, HMRC received almost 2,000 complaints from workers and third parties about non-payment of minimum wage.
22 At 31 March 2011 HMRC had recovered arrears for 162,618 workers. Note: HMRC did not start recording information on the number of workers until 2001/2002 so the actual number of workers who have been helped will be more than this. 23 Where the current rate is more than the rate that was in force at the time of underpayment.
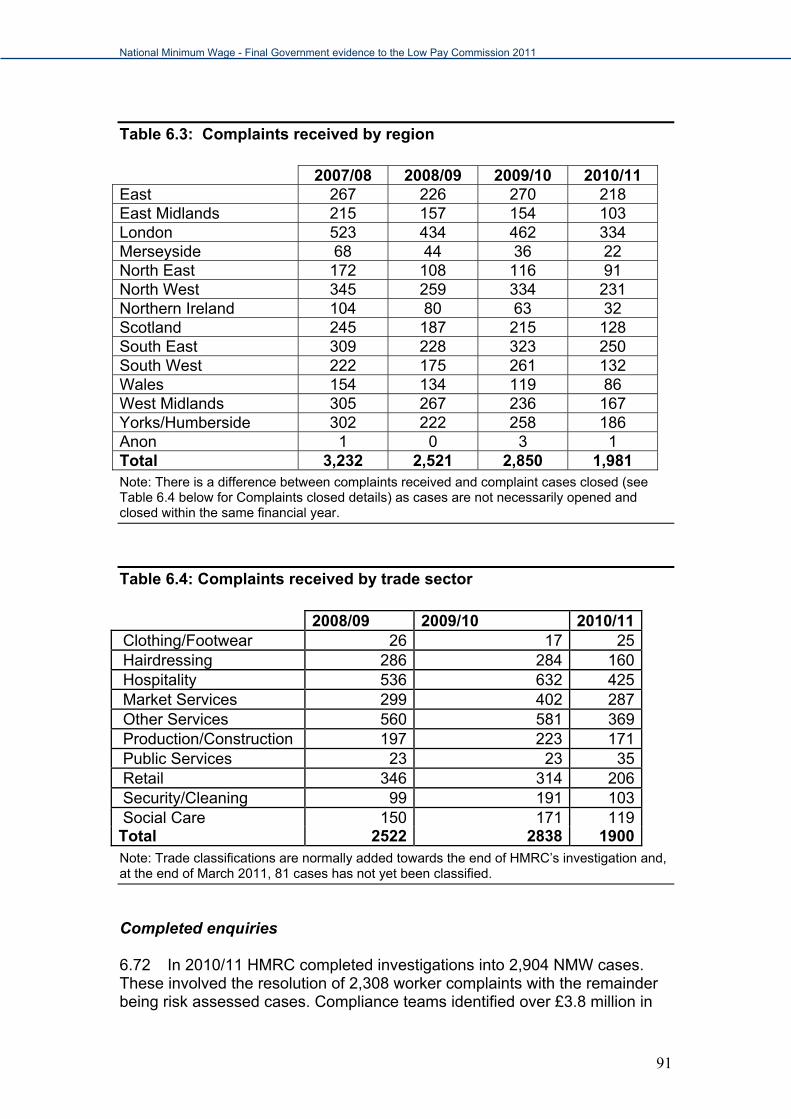
National Minimum Wage - Final Government evidence to the Low Pay Commission 2011
Table 6.3: Complaints received by region
2007/08 2008/09 2009/10 2010/11 East 267 226 270 218 East Midlands 215 157 154 103 London 523 434 462 334 Merseyside 68 44 36 22 North East 172 108 116 91 North West 345 259 334 231 Northern Ireland 104 80 63 32 Scotland 245 187 215 128 South East 309 228 323 250 South West 222 175 261 132 Wales 154 134 119 86 West Midlands 305 267 236 167 Yorks/Humberside 302 222 258 186 Anon 1 0 3 1 Total 3,232 2,521 2,850 1,981 Note: There is a difference between complaints received and complaint cases closed (see Table 6.4 below for Complaints closed details) as cases are not necessarily opened and closed within the same financial year.
Table 6.4: Complaints received by trade sector 2008/09 2009/10 2010/11 Clothing/Footwear 26 17 25 Hairdressing 286 284 160 Hospitality 536 632 425 Market Services 299 402 287 Other Services 560 581 369 Production/Construction 197 223 171 Public Services 23 23 35 Retail 346 314 206 Security/Cleaning 99 191 103 Social Care 150 171 119 Total 2522 2838 1900 Note: Trade classifications are normally added towards the end of HMRC’s investigation and, at the end of March 2011, 81 cases has not yet been classified.
Completed enquiries 6.72 In 2010/11 HMRC completed investigations into 2,904 NMW cases. These involved the resolution of 2,308 worker complaints with the remainder being risk assessed cases. Compliance teams identified over £3.8 million in
91
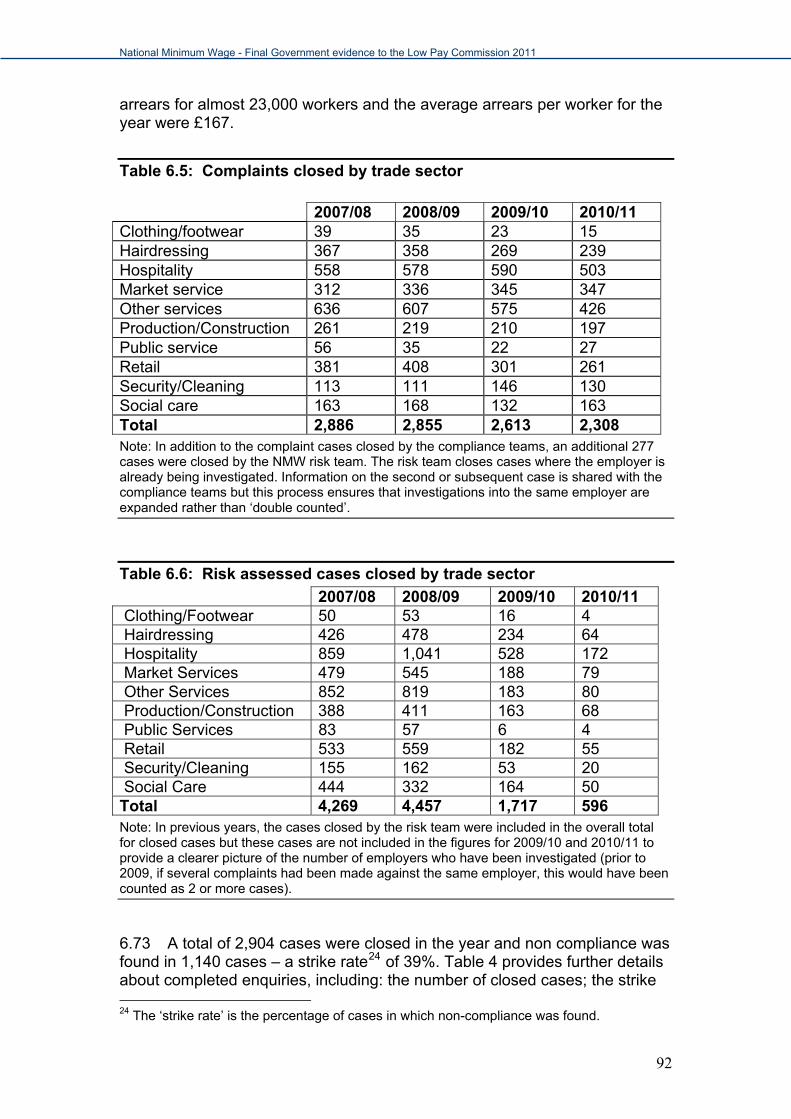
National Minimum Wage - Final Government evidence to the Low Pay Commission 2011
arrears for almost 23,000 workers and the average arrears per worker for the year were £167.
Table 6.5: Complaints closed by trade sector
2007/08 2008/09 2009/10 2010/11 Clothing/footwear 39 35 23 15 Hairdressing 367 358 269 239 Hospitality 558 578 590 503 Market service 312 336 345 347 Other services 636 607 575 426 Production/Construction 261 219 210 197 Public service 56 35 22 27 Retail 381 408 301 261 Security/Cleaning 113 111 146 130 Social care 163 168 132 163 Total 2,886 2,855 2,613 2,308 Note: In addition to the complaint cases closed by the compliance teams, an additional 277 cases were closed by the NMW risk team. The risk team closes cases where the employer is already being investigated. Information on the second or subsequent case is shared with the compliance teams but this process ensures that investigations into the same employer are expanded rather than ‘double counted’.
Table 6.6: Risk assessed cases closed by trade sector
2007/08 2008/09 2009/10 2010/11 Clothing/Footwear 50 53 16 4 Hairdressing 426 478 234 64 Hospitality 859 1,041 528 172 Market Services 479 545 188 79 Other Services 852 819 183 80 Production/Construction 388 411 163 68 Public Services 83 57 6 4 Retail 533 559 182 55 Security/Cleaning 155 162 53 20 Social Care 444 332 164 50 Total 4,269 4,457 1,717 596 Note: In previous years, the cases closed by the risk team were included in the overall total for closed cases but these cases are not included in the figures for 2009/10 and 2010/11 to provide a clearer picture of the number of employers who have been investigated (prior to 2009, if several complaints had been made against the same employer, this would have been counted as 2 or more cases).
6.73 A total of 2,904 cases were closed in the year and non compliance was found in 1,140 cases – a strike rate24 of 39%. Table 4 provides further details about completed enquiries, including: the number of closed cases; the strike 24 The ‘strike rate’ is the percentage of cases in which non-compliance was found.
92
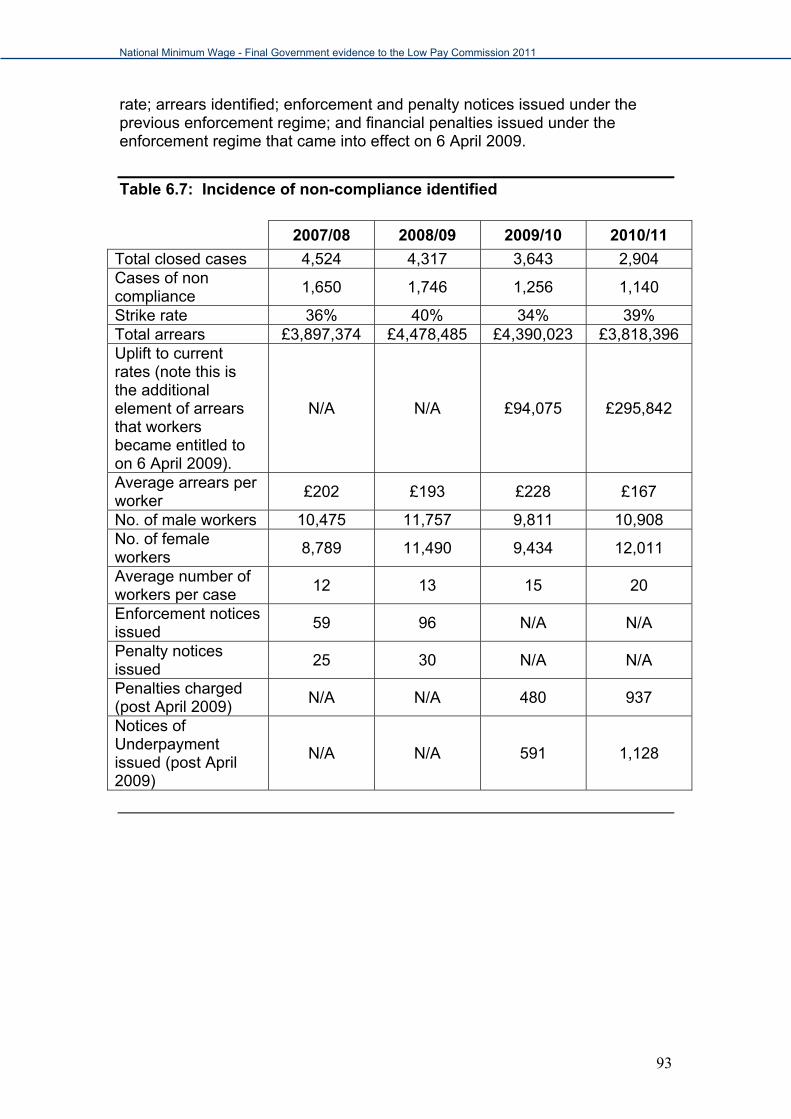
National Minimum Wage - Final Government evidence to the Low Pay Commission 2011
93
rate; arrears identified; enforcement and penalty notices issued under the previous enforcement regime; and financial penalties issued under the enforcement regime that came into effect on 6 April 2009.
Table 6.7: Incidence of non-compliance identified
2007/08 2008/09 2009/10 2010/11
Total closed cases 4,524 4,317 3,643 2,904 Cases of non compliance
1,650 1,746 1,256 1,140
Strike rate 36% 40% 34% 39% Total arrears £3,897,374 £4,478,485 £4,390,023 £3,818,396 Uplift to current rates (note this is the additional element of arrears that workers became entitled to on 6 April 2009).
N/A N/A £94,075 £295,842
Average arrears per worker
£202 £193 £228 £167
No. of male workers 10,475 11,757 9,811 10,908 No. of female workers
8,789 11,490 9,434 12,011
Average number of workers per case
12 13 15 20
Enforcement notices issued
59 96 N/A N/A
Penalty notices issued
25 30 N/A N/A
Penalties charged (post April 2009)
N/A N/A 480 937
Notices of Underpayment issued (post April 2009)
N/A N/A 591 1,128
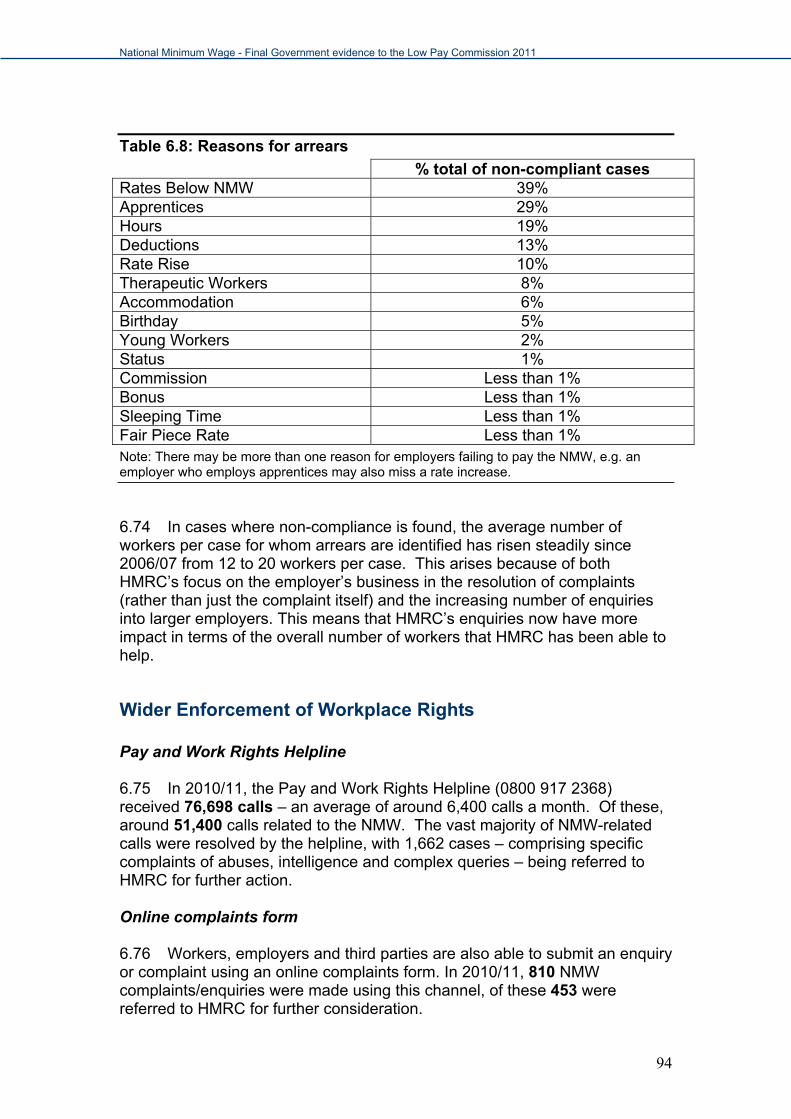
National Minimum Wage - Final Government evidence to the Low Pay Commission 2011
Table 6.8: Reasons for arrears
% total of non-compliant cases Rates Below NMW 39% Apprentices 29% Hours 19% Deductions 13% Rate Rise 10% Therapeutic Workers 8% Accommodation 6% Birthday 5% Young Workers 2% Status 1% Commission Less than 1% Bonus Less than 1% Sleeping Time Less than 1% Fair Piece Rate Less than 1% Note: There may be more than one reason for employers failing to pay the NMW, e.g. an employer who employs apprentices may also miss a rate increase.
6.74 In cases where non-compliance is found, the average number of workers per case for whom arrears are identified has risen steadily since 2006/07 from 12 to 20 workers per case. This arises because of both HMRC’s focus on the employer’s business in the resolution of complaints (rather than just the complaint itself) and the increasing number of enquiries into larger employers. This means that HMRC’s enquiries now have more impact in terms of the overall number of workers that HMRC has been able to help.
Wider Enforcement of Workplace Rights Pay and Work Rights Helpline 6.75 In 2010/11, the Pay and Work Rights Helpline (0800 917 2368) received 76,698 calls – an average of around 6,400 calls a month. Of these, around 51,400 calls related to the NMW. The vast majority of NMW-related calls were resolved by the helpline, with 1,662 cases – comprising specific complaints of abuses, intelligence and complex queries – being referred to HMRC for further action. Online complaints form 6.76 Workers, employers and third parties are also able to submit an enquiry or complaint using an online complaints form. In 2010/11, 810 NMW complaints/enquiries were made using this channel, of these 453 were referred to HMRC for further consideration.
94
National Minimum Wage - Final Government evidence to the Low Pay Commission 2011
Joint working between the workplace enforcement bodies that sit behind the Pay and Work Rights Helpline 6.77 The helpline continues to deliver significant benefits from an enforcement perspective as helpline operators are trained in the full range of government-enforced rights. The two most common combinations of multi-issues complaints continue to be NMW cases which involve an employment agency, and NMW and working time issues. 6.78 The BIS-sponsored Best Practice Group continued to meet in 2010/11. Since successfully launching the helpline the group has primarily focussed on sharing intelligence and best practice and effective joint working. Where specific legal gateways don’t exist the group is still able to share information on trends, sectors and risk assessment techniques. This year the group has: approved use of simple telephone options for people wanting basic
information on National Minimum Wage rates and considered other uses for this technology.
appointed and maintained a network of ‘single points of contact’ responsible for liaising on multi-issue cases when they are first referred
worked with the TUC, who used money awarded by BIS as part of the Union Modernisation Fund (UMF), to produce an information video on the work of the Pay and Work Rights Helpline and the enforcement bodies for training union workplace representatives
worked with other unions, such as the General Federation of Trade Unions and UCATT, to educate workplace representatives of the rights of agency workers and those who work for gangmasters
provided a cross-agency forum for discussing issues arising from the operation of the Pay and Work Rights Helpline, and
arranged training for the Pay and Work Rights helpline staff on each of their areas, including briefing them on changes in NMW rates, the introduction of the apprenticeship rate and changes to the regulations for agency workers in entertainment and modelling
6.79 The Group will continue to focus on ensuring effective joint working and will look to share more details on past and future enforcement activity, risk assessment techniques and other enforcement best practice, and sector and geographical intelligence wherever possible. Workshop on enforcement 6.80 In June 2011, Edward Davey, Minister for Employment Relations, Consumer and Postal Affairs, hosted a workshop for the enforcement bodies that sit behind the Pay and Work Rights Helpline, Citizens Advice, and Unions. The workshop considered attendees respective experiences of engaging lower paid workers and their employers. It identified lessons learnt and best practice examples from the Migration Impacts Fund (MIF) projects, by HSE, GLA and HMRC; Citizens Advice outreach work with community and voluntary organisations; and the Union Modernisation Fund (UMF). The
95
National Minimum Wage - Final Government evidence to the Low Pay Commission 2011
outputs from this workshop will feed into the Review of Workplace Rights (see paragraph 6.84) Employment Agency Standards (EAS) Inspectorate 6.81 Between April 2010 and March 2011, EAS recovered over £290,000 for agency workers, a large proportion of which comprised unpaid wages. This compares with a sum of £200,000 for the previous year. EAS also prohibited 8 individuals from being involved in the running of an employment business. EAS also had 2 successful prosecutions, and currently have two warrants out for arrest of agency owners who failed to appear at court. There are also 2 prosecution cases being prepared, with charges yet to be laid. Changes to the Regulations 6.82 On 1 October 2010 changes to the Conduct Regulations came into force which gives additional protections to agency workers in the entertainment and modelling sectors. The changes ban the taking of upfront fees for photographic and fashion models. They also provide an extension of the current cooling off period from seven days to 30 days for actors, background artists, dancers, extras, musicians, singers or other performers.
6.83 Where these groups are charged an up-front fee they will have the right to a refund if no publication is produced, and made available to potential hirers, 60 days after payment has been made.
6.84 Following the introduction of the changes, EAS carried out a national targeted enforcement operation in the entertainment and modelling sector. This operation was to check that agencies had changed their practices to comply with the new regulations. A summary of infringements found will be published in the EAS annual report later this year.
EAS - Joint working with HMRC
6.85 During 2010/2011, apart from jointly investigating multi-issue referrals from the Pay and Work Rights Helpline, EAS carried out 2 large joint operations with NMW enforcement staff. Leicester and Exeter were targeted, following information provided by HMRC about non-compliance in the agency sector in these geographical locations. A large number of infringements of the Conduct Regulations were found in both operations and a number of possible underpayments of National Minimum Wage were also uncovered. Press notices were issued to highlight the activity and to raise levels of awareness in the sector. Further joint operations are planned for September 2011 and beyond.
Union Modernisation Fund
6.86 A third and final round of the Union Modernisation Fund was launched in February 2009. The remaining 13 projects commenced in late 2009/early 2010 and will, typically, run for two years, completing in late 2011/early 2012. Themes for these projects are raising awareness of employment rights and
96
National Minimum Wage - Final Government evidence to the Low Pay Commission 2011
97
the development of new models for working with the workplace enforcement bodies. The learning and good practice that emerges from these projects will be shared across the union movement as well as with other stakeholders. Review of Workplace Rights 6.87 In December 2010, BIS launched a review of its workplace rights compliance and enforcement arrangements to see what scope there is to streamline them and make them more effective. In particular, the review will:
Identify and assess the cost and operational benefits of different compliance and enforcement models ranging from incremental improvements to current arrangements through to models consolidating enforcement functions in a single or fewer number of bodies.
Examine whether government can do more to reduce compliance and inspection burdens on business through, for example, improved advice and guidance and better risk-based approaches to inspection.
Examine whether current enforcement powers and penalties are fit for purpose.
Consider whether helpline services can be linked more coherently to online advice channels and whether overlapping helpline services can be streamlined to deliver an improved and more cost effective service.
Examine how government can work more effectively with third parties such as advice bodies, community groups, local authorities, business groups, unions and others to facilitate and ensure compliance.
6.88 The review is limited to the employment rights and related protections that are enforced by Government agencies, namely the national minimum wage, the employment agency conduct regulations, gangmaster licensing and those aspects of the Working time regulations that are enforced by the Government (primarily the 48-hour working time limits). The first phase of the compliance review will be carried out internally within government, but involve meetings with key interested parties to solicit views and test initial thinking. In October, BIS will publish a statement of findings and intended next steps in the context of a progress report on the Government’s wider employment law review. There will be public consultation following the statement of initial findings if the nature and scale of any proposed changes makes this appropriate.
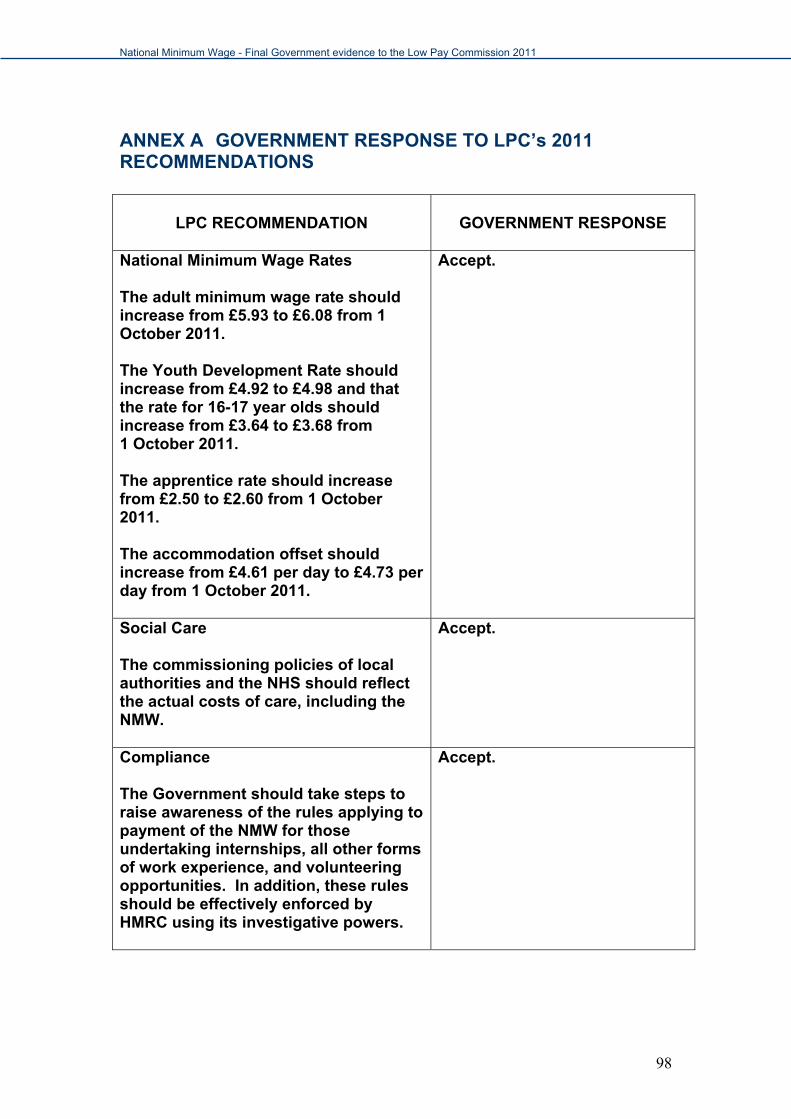
National Minimum Wage - Final Government evidence to the Low Pay Commission 2011
ANNEX A GOVERNMENT RESPONSE TO LPC’s 2011 RECOMMENDATIONS
LPC RECOMMENDATION
GOVERNMENT RESPONSE
National Minimum Wage Rates The adult minimum wage rate should increase from £5.93 to £6.08 from 1 October 2011. The Youth Development Rate should increase from £4.92 to £4.98 and that the rate for 16-17 year olds should increase from £3.64 to £3.68 from 1 October 2011. The apprentice rate should increase from £2.50 to £2.60 from 1 October 2011. The accommodation offset should increase from £4.61 per day to £4.73 per day from 1 October 2011.
Accept.
Social Care The commissioning policies of local authorities and the NHS should reflect the actual costs of care, including the NMW.
Accept.
Compliance The Government should take steps to raise awareness of the rules applying to payment of the NMW for those undertaking internships, all other forms of work experience, and volunteering opportunities. In addition, these rules should be effectively enforced by HMRC using its investigative powers.
Accept.
98
National Minimum Wage - Final Government evidence to the Low Pay Commission 2011
ANNEX B REMIT FOR THE LOW PAY COMMISSION 2012 REPORT The Government supports the National Minimum Wage. The Low Pay Commission is asked to evaluate and make recommendations in the areas set out below, taking account of the economic and labour market context, including pensions’ reform. Specifically, the Low Pay Commission is asked to:- 1. Monitor, evaluate and review the levels of each of the different minimum
wage rates, with particular reference to previously identified groups and sectors, and make recommendations for October 2012.
2. Review the labour market position of young people, including those in
apprenticeships and internships. 3. Consider whether NMW regulations can be made even simpler and easier
to administer. This might include the removal, simplification or consolidation of any elements of the NMW.
In addition, as part of the simplification agenda, the LPC is asked to consider the implications of the proposed abolition of the Agricultural Wages Board for England and Wales, pending the outcomes of legislative process and consultation.
4. Consider the best way to give business greater clarity on future levels of the NMW, including the option of two-year recommendations, and implement the chosen solution as part of the 2012 report. Also, consider whether any of the other recommendations could be introduced more promptly.
TIMING The Low Pay Commission is asked to report to the Prime Minister and the Secretary of State for Business, Innovation and Skills by the end of February 2012.
99
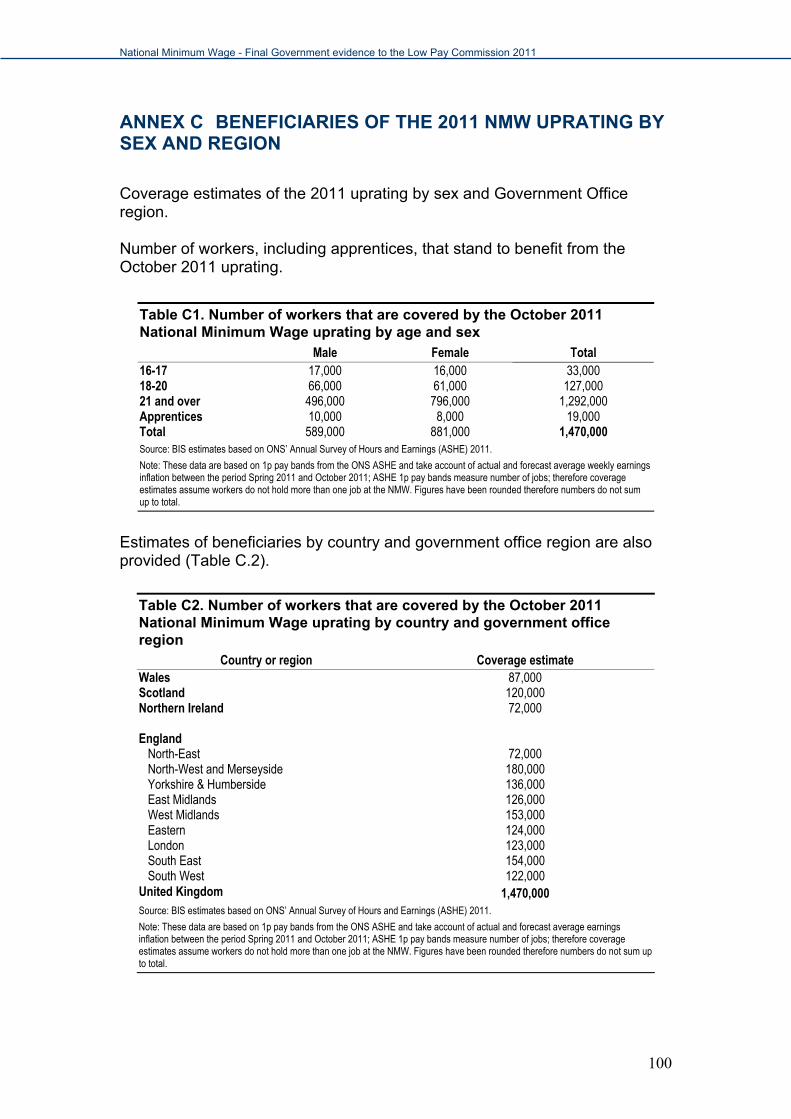
National Minimum Wage - Final Government evidence to the Low Pay Commission 2011
ANNEX C BENEFICIARIES OF THE 2011 NMW UPRATING BY SEX AND REGION
Coverage estimates of the 2011 uprating by sex and Government Office region. Number of workers, including apprentices, that stand to benefit from the October 2011 uprating.
Table C1. Number of workers that are covered by the October 2011 National Minimum Wage uprating by age and sex
Male Female Total 16-17 17,000 16,000 33,000 18-20 66,000 61,000 127,000 21 and over 496,000 796,000 1,292,000 Apprentices 10,000 8,000 19,000 Total 589,000 881,000 1,470,000 Source: BIS estimates based on ONS’ Annual Survey of Hours and Earnings (ASHE) 2011.
Note: These data are based on 1p pay bands from the ONS ASHE and take account of actual and forecast average weekly earnings inflation between the period Spring 2011 and October 2011; ASHE 1p pay bands measure number of jobs; therefore coverage estimates assume workers do not hold more than one job at the NMW. Figures have been rounded therefore numbers do not sum up to total.
Estimates of beneficiaries by country and government office region are also provided (Table C.2).
Table C2. Number of workers that are covered by the October 2011 National Minimum Wage uprating by country and government office region
Country or region Coverage estimate Wales 87,000 Scotland 120,000 Northern Ireland 72,000 England North-East 72,000 North-West and Merseyside 180,000 Yorkshire & Humberside 136,000 East Midlands 126,000 West Midlands 153,000 Eastern 124,000 London 123,000 South East 154,000 South West 122,000 United Kingdom 1,470,000 Source: BIS estimates based on ONS’ Annual Survey of Hours and Earnings (ASHE) 2011.
Note: These data are based on 1p pay bands from the ONS ASHE and take account of actual and forecast average earnings inflation between the period Spring 2011 and October 2011; ASHE 1p pay bands measure number of jobs; therefore coverage estimates assume workers do not hold more than one job at the NMW. Figures have been rounded therefore numbers do not sum up to total.
100
National Minimum Wage - Final Government evidence to the Low Pay Commission 2011
ANNEX D TECHNICAL NOTE Annual Survey of Hours and Earnings (ASHE)
The ASHE is an annual survey based on a one per cent sample of employee jobs taken from HM Revenue & Customs (HMRC) PAYE records (referenced to April each year). The survey provides information about the levels, distribution and make-up of earnings and hours paid for employees within industries, occupations and regions. While almost everything collected on ASHE is collected on the LFS, the employer rather than the individual reports the information and this means greater accuracy of the reporting on hours worked and wages earned. ASHE has a much lower refusal rate as employers must supply this information under the Statistics of Trade Act, and it also has the advantage of being based on payroll records rather than recall. In this report, charts and figures stating the bite of the NMW have been calculated using the standard weight of the ASHE, in line with ONS and LPC methodologies. From 2009, ASHE moved from using Standard Industrial Classification (SIC) 2003 to SIC 2007.
Estimates for 2004-2010 have been produced using ASHE, which replaced the New Earnings Survey (NES) in 2004. ASHE improves on the NES by extending the coverage of the survey sample and introducing weighting. From 1997-2003, estimates are based on NES datasets that have been reworked using ASHE methodology. Extending the coverage of the survey sample introduced a discontinuity between estimates in 2003 and 2004 and between estimates in 2004 and 2005. However, these datasets exclude the supplementary ASHE information and as a result there is an inconsistency between estimates in 2003 and 2004. There was a further discontinuity break in the data occurred in 2006 when ONS introduced a small number of methodological changes, including changes to the sample design itself as well as the introduction of an automatic occupation coding tool., ONS published two estimates for both 2004 and 2006 to identify these changes – one using the new methodology and one based on the previous methodology; where appropriate these inconsistencies are identified in this report.
Finally, the sample size was reduced to 0.8 per cent of employee workforce in the 2007 and 2008 surveys before being restored by Government departments’ in an agreement for funding until 2011. ONS is currently exploring the potential of collecting survey data from other sources such as administrative data, payroll data and electronic data capture committed to look at new ways of running the survey from 2012. Employee jobs series
The ONS employee job series is derived from a variety of surveys;
Private sector jobs (except construction and agriculture) come from the Short Term Employer Surveys (STES)
Construction and agriculture jobs from the LFS
Public sector jobs come from Public Sector Employment (PSE) estimates using the Quarterly Public Sector Employment Surveys
101
National Minimum Wage - Final Government evidence to the Low Pay Commission 2011
(QPSES) covering LAs, the civil service and public bodies; and administrative sources from the devolved administrations (WAG, SG) and OGDs such as DoH for the NHS and the Home Office for police and probation.
Finally, employee jobs in Northern Ireland are provided by their Department for Enterprise, Technology and Industry (DETINI) from their Quarterly Employer Survey.
From 2010 Q1 the series was redeveloped and moved from using Standard Industrial Classification (SIC) 2003 to SIC 2007. In addition to changes in SIC codes other major changes to the employee job series included a new ratio estimator which replaced the non-standard ‘matched pairs’ method. Changes were made to the method for apportioning reporting units by their local units. Great Britain quarterly employee jobs series is now benchmarked to the latest Business Register Employment Survey (BRES) estimates for 2009. Benchmarking discontinuities have been removed, PSE inputs have been revised, LFS inputs and systems have been revised. There were also changes to the sample design, size allocation and periodicity of the STES. Further information on the redevelopment of the workforce jobs series (of which employee jobs is a component) can be found on the ONS website, see http://www.statistics.gov.uk/StatBase/Product.asp?vlnk=9765&Pos=&ColRank=1&Rank=422 .
Labour Force Survey (LFS) The LFS is a quarterly survey of around 52,000 responding households (120 thousand people) with the survey data also provided in a number of variants like the household and longitudinal LFS, and the rolling annual LFS known as the Annual Population Survey (APS) which is based on an achieved sample of 300 thousand individuals aged 16 or over. (the APS forms the largest component of the Integrated Household Survey (IHS)). The LFS provides the best estimates of employment and individual socio-economic characteristics and is widely used across Government and wider labour market analytical work. The LFS is not just useful for its frequency, size and flexible structure, but the vast amount of information it collects on an individual’s workplace, job and personal characteristics. The survey is mandated by Europe and every member state is required to carry one out on a periodic basis. From 2009 Q1, the LFS moved from using Standard Industrial Classification 1992 (SIC 92) to SIC 2007. All unemployment estimates comply with the International Labour Organisation (ILO) definition of unemployment. All unemployment rates are shown as the proportion of economically active individuals which are defined as unemployed by the ILO definition. For more information see www.ilo.org.
102
National Minimum Wage - Final Government evidence to the Low Pay Commission 2011
103
Methodology changes in Blue Book 2011 Each year the publication of the Blue Book provides the ONS with an opportunity to make methodological changes to the National Accounts. This year has seen a number of relatively significant changes25, including
A revised Standard Industrial Classification (SIC) system, to reflect changes in the structure of the economy. For example, the National Accounts now contain more disaggregated information on the service sector;
A revised product classification system, which is used when collecting and calculating statistics on goods and services; and
Changes to the way in which nominal GDP (the total amount of cash spending in the economy) is deflated to calculate real GDP (the volume of goods and services produced and consumed).
These changes have only been applied to data since 1997. This means that there is a break in the real GDP series from the first quarter of 1997, which complicates the task of assessing the long-term evolution of the economy. The ONS intends to address this issue in due course.
25 See: Everett G, 2011, Content of Blue Book, 2011 Edition, ONS.
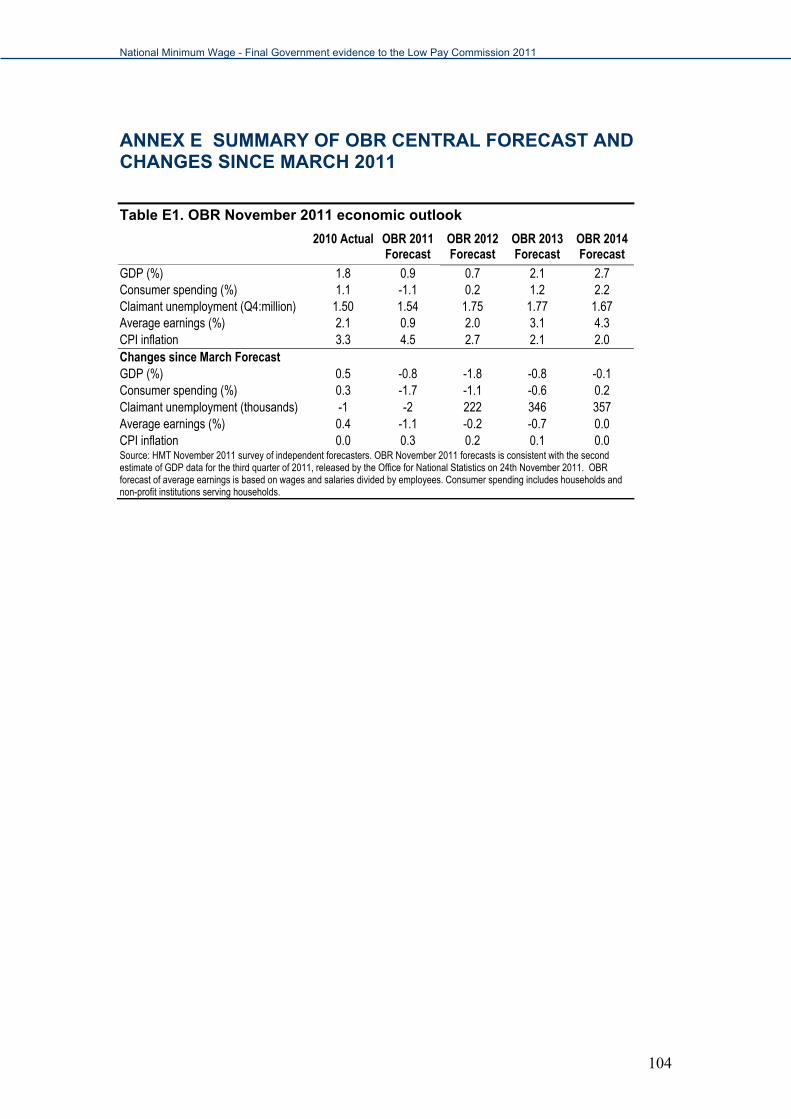
National Minimum Wage - Final Government evidence to the Low Pay Commission 2011
ANNEX E SUMMARY OF OBR CENTRAL FORECAST AND CHANGES SINCE MARCH 2011
Table E1. OBR November 2011 economic outlook
2010 Actual OBR 2011 Forecast
OBR 2012 Forecast
OBR 2013 Forecast
OBR 2014 Forecast
GDP (%) 1.8 0.9 0.7 2.1 2.7 Consumer spending (%) 1.1 -1.1 0.2 1.2 2.2 Claimant unemployment (Q4:million) 1.50 1.54 1.75 1.77 1.67 Average earnings (%) 2.1 0.9 2.0 3.1 4.3 CPI inflation 3.3 4.5 2.7 2.1 2.0 Changes since March Forecast GDP (%) 0.5 -0.8 -1.8 -0.8 -0.1 Consumer spending (%) 0.3 -1.7 -1.1 -0.6 0.2 Claimant unemployment (thousands) -1 -2 222 346 357 Average earnings (%) 0.4 -1.1 -0.2 -0.7 0.0 CPI inflation 0.0 0.3 0.2 0.1 0.0 Source: HMT November 2011 survey of independent forecasters. OBR November 2011 forecasts is consistent with the second estimate of GDP data for the third quarter of 2011, released by the Office for National Statistics on 24th November 2011. OBR forecast of average earnings is based on wages and salaries divided by employees. Consumer spending includes households and non-profit institutions serving households.
104
© Crown copyright 2012
You may re-use this information (not including logos) free of charge in any format or medium, under the terms of the Open Government Licence. Visit www.nationalarchives.gov.uk/doc/open-government-licence, write to the Information Policy Team, The National Archives, Kew, London TW9 4DU, or email: [email protected].
This publication is also available on our website at www.bis.gov.uk
Any enquiries regarding this publication should be sent to:
Department for Business, Innovation and Skills 1 Victoria Street London SW1H 0ET Tel: 020 7215 5000 If you require this publication in an alternative format, email [email protected], or call 020 7215 5000. URN 12/513