Embed Size (px)
Citation preview
National Lakes Assessment 2012
Water chemistry, lake morphometry, and watershed characteristics of Minnesota’s 2012 NLA lakes This is part of a series based on Minnesota’s participation in the United States Environmental Protection Agency’s 2012 National Lakes Assessment
January 2016

Authors Steve Heiskary, Environmental Analysis and Outcomes Division
Report review Jesse Anderson Pam Anderson Lee Engel
Contributors/acknowledgements Minnesota’s 2012 National Lakes Assessment was led by MPCA’s Water Quality Monitoring Unit. A total of 150 lakes were sampled during summer 2012 in this effort.
Team leads for the survey, which included responsibility for field reconnaissance, assembling and purchasing needed equipment, office logistics, and sampling of the lakes was led by Pam Anderson, Jesse Anderson, Kelly O’Hara, Lee Engel, Dereck Richter, and Steve Heiskary. Other staff assisting with sampling included: Amy Garcia, Courtney Ahlers-Nelson, Mike Kennedy and Andrew Swanson. Student workers Will Long and Ben Larson also assisted with the sampling.
In addition to MPCA staff, Minnesota Department of Natural Resources, U.S. Forest Service, Red Lake Band of the Chippewa and White Earth Band of the Ojibwe natural resources staff were instrumental in support of sampling and reconnaissance for many of the lakes in this survey.
Pictures on front cover are examples of lakes sampled in this 150-lake survey effort.
The MPCA is reducing printing and mailing costs by using the Internet to distribute reports and information to wider audience. Visit our website for more information.
MPCA reports are printed on 100% post-consumer recycled content paper manufactured without chlorine or chlorine derivatives.
Minnesota Pollution Control Agency 520 Lafayette Road North | Saint Paul, MN 55155-4194 | www.pca.state.mn.us | 651-296-6300
Toll free 800-657-3864 | TTY 651-282-5332
This report is available in alternative formats upon request, and online at www.pca.state.mn.us .
Document number: wq-nlap1-14
Contents
Executive summary ............................................................................................................................1
Introduction ......................................................................................................................................2
National Lakes Assessment overview and lake selection for 2012 ................................................................... 2
Minnesota’s NLA overview and report focus .................................................................................................... 3
Background .......................................................................................................................................4
Climate comparison: summer 2007 and 2012 .................................................................................................. 4
Methods ............................................................................................................................................8
Comparison of EPA and MDH Data .................................................................................................................. 9
Results and discussion ...................................................................................................................... 11
Description of the population of lakes and morphometry ....................................................................... 12
Description of lake watershed areas and land use composition .............................................................. 14
Water chemistry and physical characteristics ....................................................................................... 20
Field measurements: temperature, dissolved oxygen (DO), and DO saturation ............................................ 22
Nutrients and Trophic Status Indicators ......................................................................................................... 26
Organic carbon and color ............................................................................................................................... 34
Ion Chemistry .................................................................................................................................................. 35
Applications of NLA data ..................................................................................................................... 44
1. Trends and variability in lake condition based on 2007 and 2012 ............................................................. 44
2. Regional patterns, interrelationships, and watershed and lake morphometry as they influence lake condition and chemistry .......................................................................................................... 48
Summary and conclusions ................................................................................................................ 54
References ....................................................................................................................................... 56
Appendix ......................................................................................................................................... 57
List of tables Table 1. Land use composition (percent of watershed) based on a) 2012 NLA lake watersheds and Level 3 aggregated ecoregions and b) ecoregion reference lakes and Level 3 ecoregions.. ...................... 16 Table 2. Statewide summary of 2012 NLA data. Includes: 10th, 25th, 50th, 75th, and 90th (unweighted) percentiles for each parameter. ................................................................................................................. 21 Table 3. Ecoregion reference lake database summary. .............................................................................. 22 Table 4. Comparison of un-weighted mean concentrations for 2012 re-sample lakes.............................. 45 Table 5. Comparison of unweighted percentile distributions of select parameters from 2007 and 2012.. .......................................................................................................................................... 48
List of figures Figure 1. Minnesota’s 2012 NLA lakes overlain on Level 3 ecoregion map. ................................................. 4 Figure 2. Summer normal mean temperatures and monthly mean temperatures from select sites in 2007 and 2012 and summaries for select locations. .................................................................................... 5 Figure 3. Water year precipitation and departure for 2007 and 2012. ........................................................ 6 Figure 4. Drought monitor map for Minnesota, September 2012. .............................................................. 7 Figure 5. Lakes that were dropped from the survey. Dry implies either completely dry or too shallow (<1 m). ........................................................................................................................................................... 7 Figure 6. Comparison of EPA and MDH water chemistry measures for paired 2012 NLA samples. Laboratory measured unless noted otherwise. 1:1 line provided to allow for comparison. ..................... 10 Figure 7. NLA sampled lakes by size class as compared to Minnesota’s population of lakes. Comparison of 2007 (state N=50), 2012 (state N=56), 2012 (by ecoregion: Northern Forest [NF] =50; Eastern Temperate Forests [ETF] =50, Great Plains [GP] =49) and Minnesota overall (N=22,581). .......... 12 Figure 8. 2012 NLA lakes surface area coded by ecoregion and shows relative size of lakes and CDF. Maximum of 4,820 ha excluded from CDF. ................................................................................................ 13 Figure 9. 2012 NLA lakes maximum depth (m) coded by ecoregion and shows relative depth of lakes. Maximum depth of 78 m in Northern Forests omitted from CDF. ............................................................. 13 Figure 10. Lake mixing status by ecoregion: a. relative percentages and b. statewide map. .................... 14 Figure 11. Lake watershed area and watershed: lake (Wshed: lake) ratio maps and CDFs by ecoregion. Maximum values not included on CDFs. ..................................................................................................... 15 Figure 12. Land use composition bubble plot maps and CDFs by ecoregion as follows: % forested (For), % cropped (Crop), % wetland (Wet), % wetland + water (wet wat), % rangeland (Rang), % developed (Dev) and number of feedlots. .................................................................................................................... 17 Figure 13. 2012 NLA lake surface temperature CDF and percent by class by ecoregion. Classes used: <21 cool, 21-25 warm, and >25 C very warm. ............................................................................................ 23 Figure 14. Temperature as a function of sample date (DATEVALUE function), by ecoregion. Sampling period ran from June 2- September 5, 2012. ............................................................................................. 23 Figure 15. Surface DO regional distributions and maps. Minnesota based thresholds: <5 low, 5-10 typical, and>10 mg/L elevated. .............................................................................................. 24 Figure 16. DO saturation just below surface (expressed as a percent) as follows: <90% undersaturated, 90-110% saturated, & >110% supersaturated. ................................................................ 25 Figure 17. Surface DO and saturation measurements for NLA study lakes. 5 ppm (mg/L) DO standard and 100% saturation noted for visual reference. ....................................................................................... 25

Figure 18. Oxidation reduction potential (ORP) regional distributions and maps. Thresholds based on statewide IQ range: <200 low, 200-350 moderate, and >350 mV high. ................................................ 26 Figure 19. Total phosphorus regional distributions and bubble-plots. Categories correspond to Carlson’s TSI as follows: oligotrophic <12, mesotrophic, 12-30, eutrophic 30-100, and hypereutrophic >100 µg/L. ................................................................................................................................................... 27 Figure 20. Chlorophyll-a regional distributions and bubble-plots. Categories correspond to Carlson’s TSI as follows: oligotrophic <3.5, mesotrophic, 3.5-10, eutrophic 10-60, and hypereutrophic >60 µg/L. Maximum GP ecoregion value 522 µg/L omitted from CDF. ...................................................................... 28 Figure 21. Chlorophyll-a nuisance bloom frequency. Categories as follows: <10 no bloom, 10-20 mild bloom and >20 µg/L nuisance bloom. Includes percentage distribution and maps by category. .............. 29 Figure 22. Microcystin distribution and bubble plot. Proportion of lakes with MC< 0.15 (MDL), 0.15-1.0 µg/L, and > 1 µg/L. ........................................................................................................................ 30 Figure 23. Secchi transparency CDF and plots by region. Trophic categories as follows: oligo > 3.5 m, meso 2.0-3.5 m, eutrophic 0.7-2.0 m, and hypereutrophic <0.7 m. [Secchi (w/>) indicates greater than values included in these calculations.] ............................................................................................... 30 Figure 24. Total nitrogen (TN) CDF and maps by ecoregion. Trophic categories as follows: <0.7 oligotrophic, 0.7-1.0 mesotrophic, 1.0-2.0 eutrophic, and >2.0 mg/L hypereutrophic.............................. 32 Figure 25. TN: TP ratios for NLA lakes. CDF and maps by ecoregion. Categories: <10:1 N-limited, 10-17:1 Intermediate, and >17:1 P-limited. Two high values (281:1 & 480:1) excluded from CDF. .......... 32 Figure 26. Dissolved ortho-phosphorus relative percent and maps ecoregion. Categories used: ≤5 below RL, 6-20 moderate, and >20 µg/L high. ....................................................................................... 33 Figure 27. Color distributions and regional maps. Categories as follows: <20 clear, 20-50 moderate, 50-100 dark, and >100 PCU very dark. ....................................................................................................... 34 Figure 28. Dissolved organic carbon CDF and ecoregion maps. Categories used are: <7 low, 7-14 moderate, and >14 mg/L high. ................................................................................................................... 35 Figure 29. Conductivity regional distribution and maps. Minnesota based categories (NLA IQ range) used: <170 low, 170-500 moderate, and >500 µmhos/cm high. ................................................................ 37 Figure 30. pH regional distributions and maps. Minnesota and EPA based thresholds used: <7.5 low, 7.5-8.5 typical, and >8.5 high. ..................................................................................................................... 37 Figure 31. Calcium regional distributions and maps. Minnesota-based categories used: <10 low (soft), 10-20 moderate, and >20 mg/L high. ......................................................................................................... 38 Figure 32. Magnesium regional distributions and maps. EPA-proposed categories used: <7 low, 7-27 moderate, >27 mg/L high. .................................................................................................................. 38 Figure 33. Sodium regional distributions and maps. EPA-proposed thresholds as follows: <3 low, 3-7 moderate, and >7 mg/L high ................................................................................................................ 39 Figure 34. Potassium regional distributions and maps. EPA proposed thresholds <1.5 low, 1.5-5.0 moderate, and > 5 mg/L high. ..................................................................................................................... 40 Figure 35. Silica regional distributions and maps. EPA-proposed thresholds: <2 low, 2-11 moderate, and >11 mg/L high. ..................................................................................................................................... 40 Figure 36. Alkalinity regional distributions and maps. EPA and MN-based thresholds used: <50 soft, 50-150 moderate, and >150 mg/L hard. ..................................................................................................... 42 Figure 37. Sulfate regional distributions and maps. Minnesota-based thresholds: <10 low, 10-50 moderate, and >50 mg/L high. Values below 1 mg/L RL treated as 1 mg/L for this analysis. CDF scaled to 100 mg/L was included to allow for resolution for NF and ETF regions. ................................................ 43 Figure 38. Chloride regional distributions and maps. EPA proposed thresholds used: <2 low, 2-25 moderate, and >25 mg/L high. Note Minnesota’s standard is 230 mg/L. .................................................. 44
Figure 39. Comparison of 2007 and 2012 measurements for select parameters. 1:1 line included for visual comparison. Charts scaled to allow resolution for majority of data. ............................................... 46 Figure 40. Comparison of color and DOC, color and Chl-a, and color and Secchi by region (measures where disk is on the bottom treated as actual measures). Color and Secchi (no regions) excludes all lakes with Secchi on bottom. ..................................................................................................................... 50 Figure 41. Quantile regression of Secchi and Color. Based on RQSSCIfit in R (tau=0.90, lambda=125; R 2009) ........................................................................................................................................................ 50 Figure 42. Total organic carbon as a function of a) DOC and b) % forest & wetland. Data sorted by ecoregion. ................................................................................................................................................... 51 Figure 43. Chlorophyll-a as a function of sample date (DATEVALUE function), by ecoregion. Sampling period ran from June 2- September 5, 2012. ............................................................................................. 51 Figure 44. TP, TN, and Chl-a relative to disturbed land use. Regression-tree (changepoint) calculated in R (rpartboot, c (0.9), type=norm). Primary (first split) in green solid and secondary in blue (dashed). .... 53 Figure 45. Chloride and percentage developed land use. Primary (first split) in green solid and secondary in blue (dashed). Note outlier value at 150 mg/L is South Lake, which receives a WWTF discharge. .................................................................................................................................................... 53
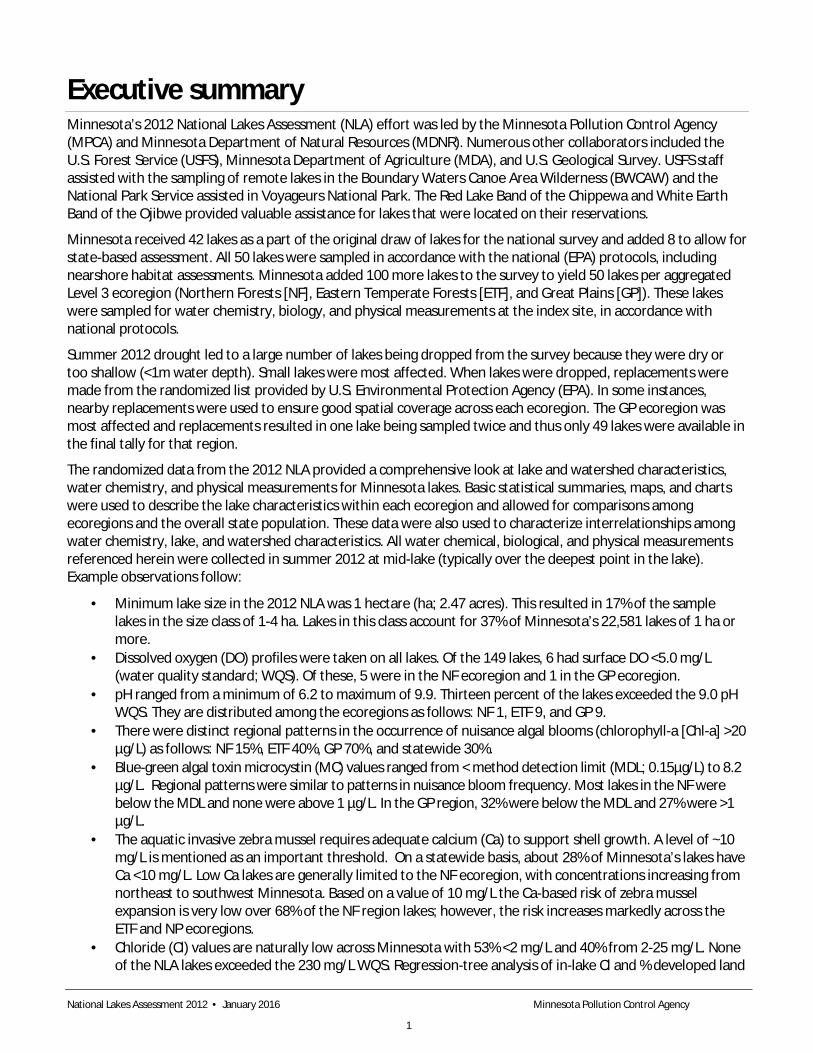
Executive summary Minnesota’s 2012 National Lakes Assessment (NLA) effort was led by the Minnesota Pollution Control Agency (MPCA) and Minnesota Department of Natural Resources (MDNR). Numerous other collaborators included the U.S. Forest Service (USFS), Minnesota Department of Agriculture (MDA), and U.S. Geological Survey. USFS staff assisted with the sampling of remote lakes in the Boundary Waters Canoe Area Wilderness (BWCAW) and the National Park Service assisted in Voyageurs National Park. The Red Lake Band of the Chippewa and White Earth Band of the Ojibwe provided valuable assistance for lakes that were located on their reservations.
Minnesota received 42 lakes as a part of the original draw of lakes for the national survey and added 8 to allow for state-based assessment. All 50 lakes were sampled in accordance with the national (EPA) protocols, including nearshore habitat assessments. Minnesota added 100 more lakes to the survey to yield 50 lakes per aggregated Level 3 ecoregion (Northern Forests [NF], Eastern Temperate Forests [ETF], and Great Plains [GP]). These lakes were sampled for water chemistry, biology, and physical measurements at the index site, in accordance with national protocols.
Summer 2012 drought led to a large number of lakes being dropped from the survey because they were dry or too shallow (<1m water depth). Small lakes were most affected. When lakes were dropped, replacements were made from the randomized list provided by U.S. Environmental Protection Agency (EPA). In some instances, nearby replacements were used to ensure good spatial coverage across each ecoregion. The GP ecoregion was most affected and replacements resulted in one lake being sampled twice and thus only 49 lakes were available in the final tally for that region.
The randomized data from the 2012 NLA provided a comprehensive look at lake and watershed characteristics, water chemistry, and physical measurements for Minnesota lakes. Basic statistical summaries, maps, and charts were used to describe the lake characteristics within each ecoregion and allowed for comparisons among ecoregions and the overall state population. These data were also used to characterize interrelationships among water chemistry, lake, and watershed characteristics. All water chemical, biological, and physical measurements referenced herein were collected in summer 2012 at mid-lake (typically over the deepest point in the lake). Example observations follow:
· Minimum lake size in the 2012 NLA was 1 hectare (ha; 2.47 acres). This resulted in 17% of the sample lakes in the size class of 1-4 ha. Lakes in this class account for 37% of Minnesota’s 22,581 lakes of 1 ha or more.
· Dissolved oxygen (DO) profiles were taken on all lakes. Of the 149 lakes, 6 had surface DO <5.0 mg/L (water quality standard; WQS). Of these, 5 were in the NF ecoregion and 1 in the GP ecoregion.
· pH ranged from a minimum of 6.2 to maximum of 9.9. Thirteen percent of the lakes exceeded the 9.0 pH WQS. They are distributed among the ecoregions as follows: NF 1, ETF 9, and GP 9.
· There were distinct regional patterns in the occurrence of nuisance algal blooms (chlorophyll-a [Chl-a] >20 µg/L) as follows: NF 15%, ETF 40%, GP 70%, and statewide 30%.
· Blue-green algal toxin microcystin (MC) values ranged from < method detection limit (MDL; 0.15µg/L) to 8.2 µg/L. Regional patterns were similar to patterns in nuisance bloom frequency. Most lakes in the NF were below the MDL and none were above 1 µg/L. In the GP region, 32% were below the MDL and 27% were >1 µg/L.
· The aquatic invasive zebra mussel requires adequate calcium (Ca) to support shell growth. A level of ~10 mg/L is mentioned as an important threshold. On a statewide basis, about 28% of Minnesota’s lakes have Ca <10 mg/L. Low Ca lakes are generally limited to the NF ecoregion, with concentrations increasing from northeast to southwest Minnesota. Based on a value of 10 mg/L the Ca-based risk of zebra mussel expansion is very low over 68% of the NF region lakes; however, the risk increases markedly across the ETF and NP ecoregions.
· Chloride (Cl) values are naturally low across Minnesota with 53% <2 mg/L and 40% from 2-25 mg/L. None of the NLA lakes exceeded the 230 mg/L WQS. Regression-tree analysis of in-lake Cl and % developed land
National Lakes Assessment 2012 • January 2016 Minnesota Pollution Control Agency
1

use indicated a primary changepoint at 15% and a secondary at 3.5%. The very low secondary threshold suggests that even a very low percentage of developed land use can increase the normally low Cl in lakes.
· A level 10 mg/L sulfate has been Minnesota’s WQS for waters that support wild rice. Ninety-seven percent of NF and 72% of ETF region lakes were below this level. In contrast, the GP region is dominated by high sulfate with 65% >50 mg/L, primarily because of naturally high levels in in soils.
· Color is often used as a relative indicator of the degree of humic substances in water and at high levels may reduce water transparency. Quantile regression analysis of Secchi and color data indicate a significant breakpoint at 50 platinum-cobalt units (PCU); whereby, above 50 PCU Secchi was significantly lower as compared to measures <50 PCU. This suggests that a color value of 50 or more can be used as an indication of when color has a significant influence on transparency.
· Regression-tree analysis of in-lake total phosphorus (TP) and percentage of the lake’s watershed in disturbed land use (includes cropped and developed land uses) found a significant breakpoint at 45.5%. A practical implication of this and similar findings in the literature suggests that for lakes with less than 40-45% disturbed land use in their watershed, it is desirable to avoid increases above this threshold if significant increases in TP are to be avoided.
This is but a brief summary of the findings from this study. More details and potential applications of these findings are addressed herein.
Introduction
National Lakes Assessment overview and lake selection for 2012 The EPA has a responsibility to assess the health of the nation’s water resources. One of the methods for assessment is a statistically based survey. The Survey of the Nation’s Lakes, conducted in 2007, is one of a series of water surveys being conducted by states, tribes, EPA, and other partners. In addition to lakes, partners will also study coastal waters, wadeable streams, rivers, and wetlands in a revolving sequence. The purpose of these surveys is to generate statistically valid and environmentally relevant reports on the condition of the nation’s streams, lakes, wetlands, and estuaries at nation-wide and regional scales.
The goal of the lakes survey is to address two key questions about the quality of the nation’s lakes, ponds, and reservoirs:
· What percent of the nation’s lakes are in good, fair, and poor condition for key indicators of trophic state, ecological health, and recreation?
· What is the relative importance of key stressors such as nutrients and pathogens? The sampling design for this survey is a probability-based network that provides statistically valid estimates of the condition of all lakes, with a known degree of confidence. Sample sites are selected at random to represent the condition of all lakes across the nation and each region. A total of 1,000 lakes in the conterminous United States are included in the lakes survey. The sample set is comprised of natural and built freshwater lakes, ponds, and reservoirs greater than 1 hectare (ha [2.47 acre]) and at least one meter in depth located in the conterminous United States. This is a change from the 2007 NLA when the minimum lake size was 4 ha (10 acre). This change to 1 ha resulted in a much larger pool (population) of lakes for Minnesota and the nation as a whole.
The typical sampling effort at each site includes a variety of samples and measurements collected at a mid-lake index site, which is often at the deepest point in the lake. Samples include a two meter integrated sample for water chemistry, chlorophyll-a (Chl-a), MC and algal identification; oxygen and temperature profiles; zooplankton tow; and sediment core sample for diatom reconstruction of TP (based on top and bottom slices from the core) and surface sediment sample for mercury. In addition, 10 random near-shore sites are qualitatively assessed for various littoral and riparian habitat-related measures and a sample for a bacterial indicator was collected. Further
National Lakes Assessment 2012 • January 2016 Minnesota Pollution Control Agency
2
details on the survey including methods, parameters measured, and statistical design may be found on the EPA NLA webpage at: http://www.epa.gov/owow/lakes/lakessurvey/.
Minnesota’s NLA overview and report focus Minnesota’s 2012 NLA effort was led by the MPCA and MDNR. Various other collaborators were engaged in this study as well including the USFS, and MDA. The MPCA and MDNR cooperated on initial planning of the survey and conducted a vast majority of the sampling, which took place in July and August for most lakes. USFS staff assisted in sampling remote lakes in the BWCAW and National Parks Service staff assisted in Voyageur’s National Park.
The EPA uses the Generalized Random-Tessellation Stratified (GRTS) design to generate a sample list of lakes. The number of lakes to be sampled (n) was determined by the EPA using a binomial distribution applied to estimate a proportion of lakes with good conditions with 90% confidence. This impacts both the overall national survey design as well as any state survey designs. The GRTS design allows for probabilistic survey that can be stratified by multiple lake size classes, while maintaining special balance throughout the state. A list of lakes is generated through GRTS to include a given number of lakes plus an overdraw pool to replace un-sampleable lakes from the original list. The list generated includes a set of weights for each lake. These weights are based on lake hectare size class (1-4, 4-10, 10-20, 20-50, and >50 ha) combined with relative abundance in each of the seven Level 3 ecoregions in Minnesota. After sampling is completed, the weights are adjusted based on how many lakes from the original list needed to be replaced with overdraw lakes. The weighing process is the same as the methods for the national lakes survey (Peck et al. 2013).
At the state level, 50 lakes are considered the target population to satisfy the 90% confidence interval and is also a manageable sample for time and cost considerations. Minnesota received 42 lakes as a part of the original draw of lakes for the national survey and added 8 to allow for state-based assessment. All 50 lakes were sampled in accordance with the national approach as described above and thus contribute to the national dataset. In addition, Minnesota added 100 lakes to the survey to yield the 50 lakes per aggregated Level 3 ecoregion as follows: Northern Forests (NF), Eastern Temperate Forests (ETF) and Great Plains (GP). This allowed for an ecoregion-based assessment for Minnesota. When a lake was deemed un-sampleable the next lake on the EPA-provided list was substituted. This occurred on several occasions and was most pronounced in the GP because of the drought (Figure 5). In the course of the sampling season this resulted in one GP lake being sampled twice. This oversight was not caught until completion of the sampling and resulted in only 49 separate lakes being sampled for the GP ecoregion.
The purpose of this report is to provide a summary of the water chemistry, lake morphometric and watershed characteristics for Minnesota’s lakes based on the NLA data collected in summer 2012 and serves as an update to the analysis of the 2007 survey data (Heiskary 2010). It will also serve as basis for a subsequent report that focuses on lake condition based on various EPA metrics and thresholds. That report will serve to provide comparisons among Minnesota, the nation and potentially surrounding states in the Upper Midwest. Following are several topics that will be addressed in this report
1. A statewide evaluation and ecoregion-based characterization of the data will be conducted. Because of its statistically-based nature, this data set provides a good basis for describing the typical range of constituents and interrelationships in Minnesota’s lakes on a statewide and ecoregion basis. Comparisons with previously-published typical ranges of water quality parameters, lake morphometry, and watershed land use will be made. Cumulative distribution functions (CDFs), maps, and bar charts will be used to express data at the ecoregion and statewide levels and included in the appendix of the report.
2. Comparisons will also be made with data from 2007 based on 20 lakes that were sampled in both years and an overall comparison of the statewide data for the 50 lakes sampled in each year. These two years of data are not sufficient for trend assessment; however they are valuable for describing lake condition and statewide patterns.
3. Interrelationships among water quality parameters, lake morphometry, and watershed characteristics will be explored with these data. When relevant, ecoregion patterns will be noted.
National Lakes Assessment 2012 • January 2016 Minnesota Pollution Control Agency
3
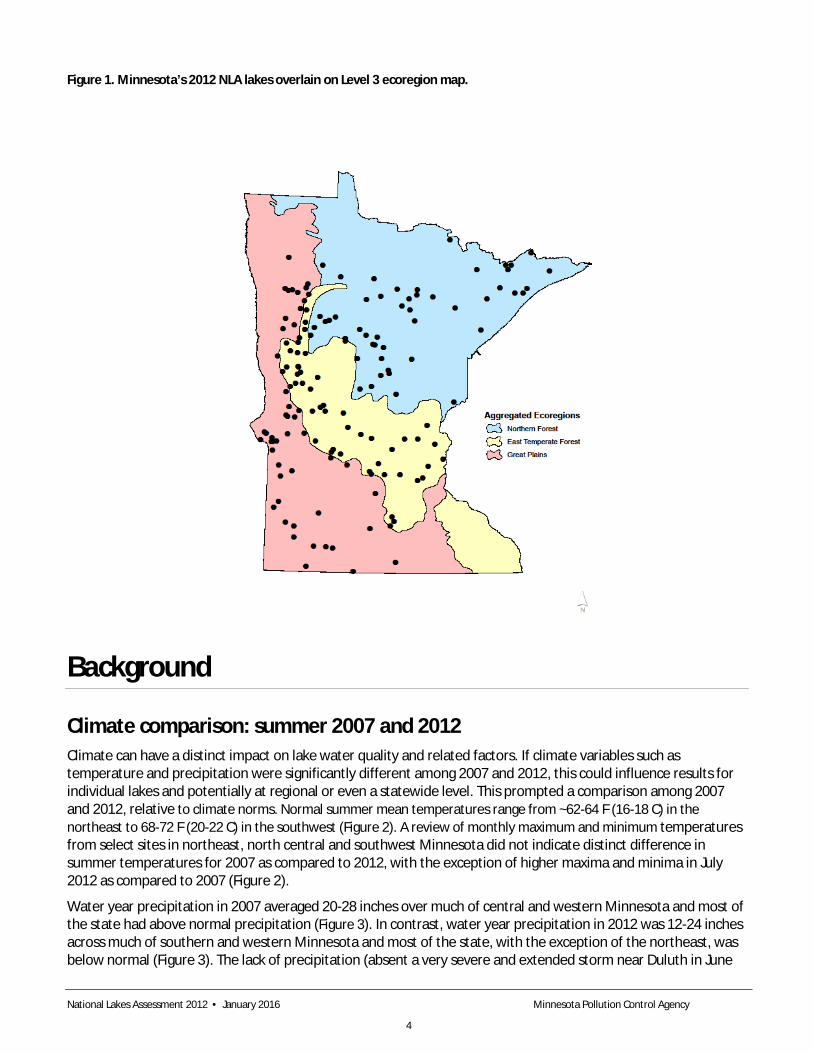
Figure 1. Minnesota’s 2012 NLA lakes overlain on Level 3 ecoregion map.
Background
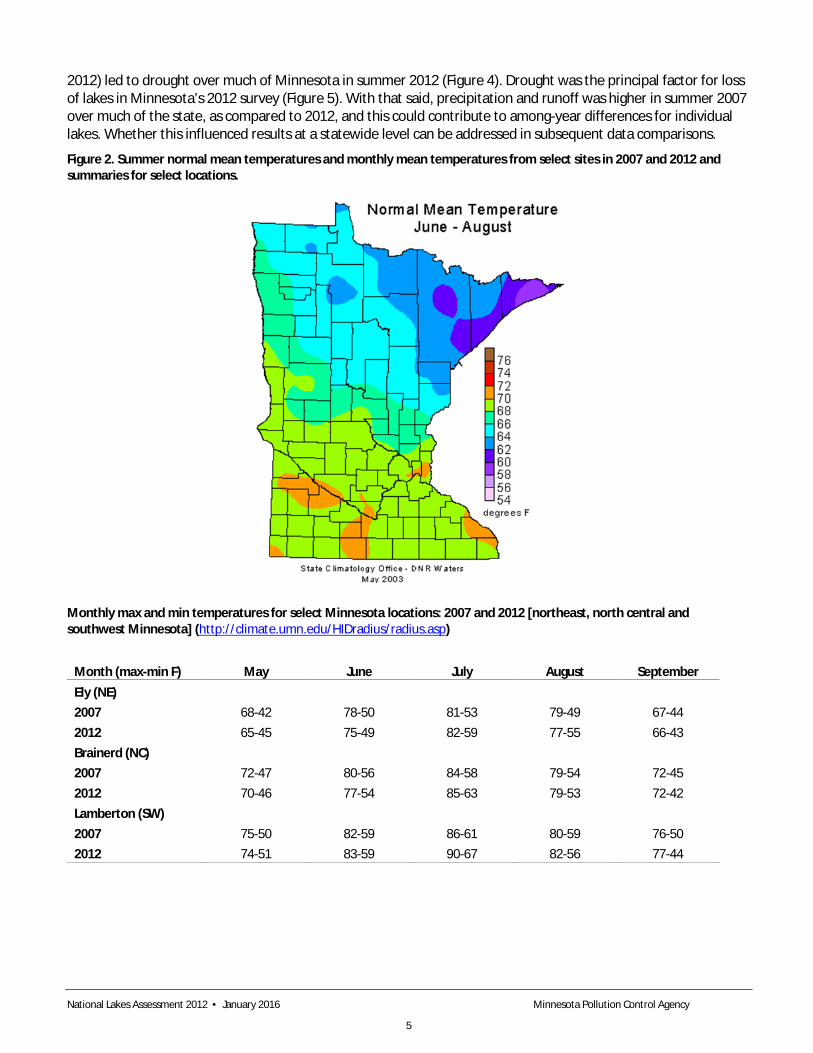
Climate comparison: summer 2007 and 2012 Climate can have a distinct impact on lake water quality and related factors. If climate variables such as temperature and precipitation were significantly different among 2007 and 2012, this could influence results for individual lakes and potentially at regional or even a statewide level. This prompted a comparison among 2007 and 2012, relative to climate norms. Normal summer mean temperatures range from ~62-64 F (16-18 C) in the northeast to 68-72 F (20-22 C) in the southwest (Figure 2). A review of monthly maximum and minimum temperatures from select sites in northeast, north central and southwest Minnesota did not indicate distinct difference in summer temperatures for 2007 as compared to 2012, with the exception of higher maxima and minima in July 2012 as compared to 2007 (Figure 2).
Water year precipitation in 2007 averaged 20-28 inches over much of central and western Minnesota and most of the state had above normal precipitation (Figure 3). In contrast, water year precipitation in 2012 was 12-24 inches across much of southern and western Minnesota and most of the state, with the exception of the northeast, was below normal (Figure 3). The lack of precipitation (absent a very severe and extended storm near Duluth in June
National Lakes Assessment 2012 • January 2016 Minnesota Pollution Control Agency
4
2012) led to drought over much of Minnesota in summer 2012 (Figure 4). Drought was the principal factor for loss of lakes in Minnesota’s 2012 survey (Figure 5). With that said, precipitation and runoff was higher in summer 2007 over much of the state, as compared to 2012, and this could contribute to among-year differences for individual lakes. Whether this influenced results at a statewide level can be addressed in subsequent data comparisons.
Figure 2. Summer normal mean temperatures and monthly mean temperatures from select sites in 2007 and 2012 and summaries for select locations.
Monthly max and min temperatures for select Minnesota locations: 2007 and 2012 [northeast, north central and southwest Minnesota] (http://climate.umn.edu/HIDradius/radius.asp)
Month (max-min F) May June July August September Ely (NE) 2007 68-42 78-50 81-53 79-49 67-44 2012 65-45 75-49 82-59 77-55 66-43 Brainerd (NC) 2007 72-47 80-56 84-58 79-54 72-45 2012 70-46 77-54 85-63 79-53 72-42 Lamberton (SW) 2007 75-50 82-59 86-61 80-59 76-50 2012 74-51 83-59 90-67 82-56 77-44
National Lakes Assessment 2012 • January 2016 Minnesota Pollution Control Agency
5

Figure 3. Water year precipitation and departure for 2007 and 2012.
National Lakes Assessment 2012 • January 2016 Minnesota Pollution Control Agency
6

Figure 4. Drought monitor map for Minnesota, September 2012.
Figure 5. Lakes that were dropped from the survey. Dry implies either completely dry or too shallow (<1 m).
National Lakes Assessment 2012 • January 2016 Minnesota Pollution Control Agency
7
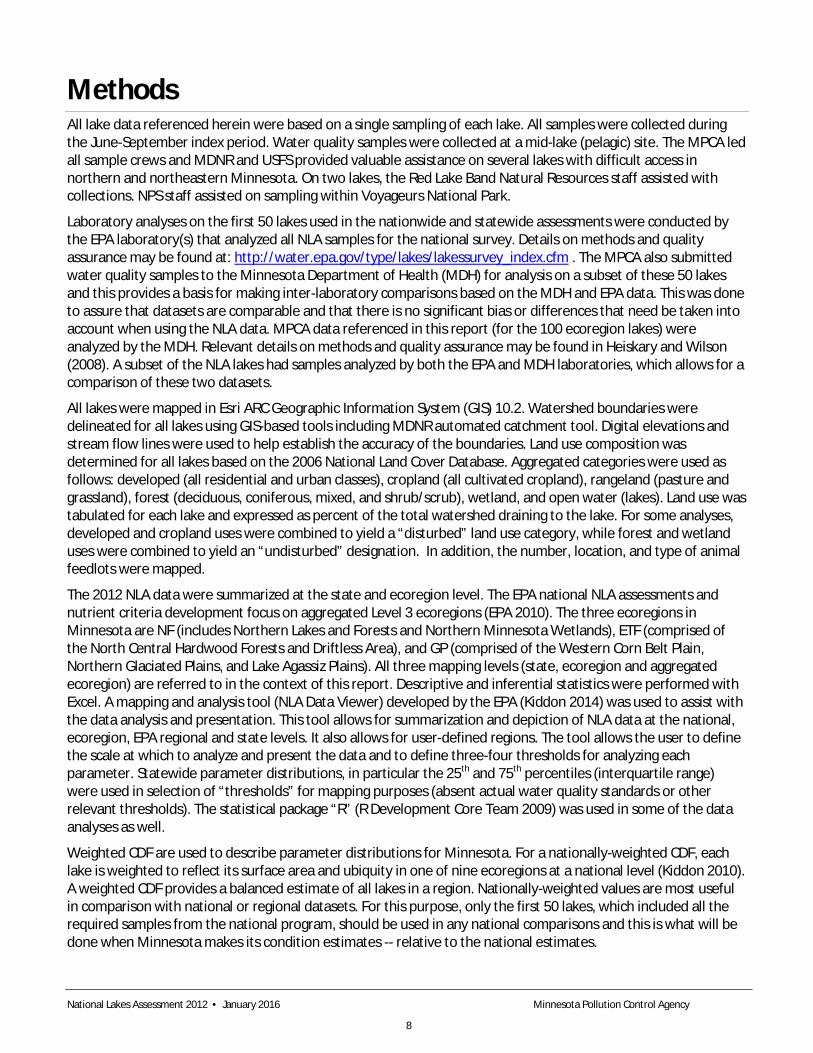
Methods All lake data referenced herein were based on a single sampling of each lake. All samples were collected during the June-September index period. Water quality samples were collected at a mid-lake (pelagic) site. The MPCA led all sample crews and MDNR and USFS provided valuable assistance on several lakes with difficult access in northern and northeastern Minnesota. On two lakes, the Red Lake Band Natural Resources staff assisted with collections. NPS staff assisted on sampling within Voyageurs National Park.
Laboratory analyses on the first 50 lakes used in the nationwide and statewide assessments were conducted by the EPA laboratory(s) that analyzed all NLA samples for the national survey. Details on methods and quality assurance may be found at: http://water.epa.gov/type/lakes/lakessurvey_index.cfm . The MPCA also submitted water quality samples to the Minnesota Department of Health (MDH) for analysis on a subset of these 50 lakes and this provides a basis for making inter-laboratory comparisons based on the MDH and EPA data. This was done to assure that datasets are comparable and that there is no significant bias or differences that need be taken into account when using the NLA data. MPCA data referenced in this report (for the 100 ecoregion lakes) were analyzed by the MDH. Relevant details on methods and quality assurance may be found in Heiskary and Wilson (2008). A subset of the NLA lakes had samples analyzed by both the EPA and MDH laboratories, which allows for a comparison of these two datasets.
All lakes were mapped in Esri ARC Geographic Information System (GIS) 10.2. Watershed boundaries were delineated for all lakes using GIS-based tools including MDNR automated catchment tool. Digital elevations and stream flow lines were used to help establish the accuracy of the boundaries. Land use composition was determined for all lakes based on the 2006 National Land Cover Database. Aggregated categories were used as follows: developed (all residential and urban classes), cropland (all cultivated cropland), rangeland (pasture and grassland), forest (deciduous, coniferous, mixed, and shrub/scrub), wetland, and open water (lakes). Land use was tabulated for each lake and expressed as percent of the total watershed draining to the lake. For some analyses, developed and cropland uses were combined to yield a “disturbed” land use category, while forest and wetland uses were combined to yield an “undisturbed” designation. In addition, the number, location, and type of animal feedlots were mapped.
The 2012 NLA data were summarized at the state and ecoregion level. The EPA national NLA assessments and nutrient criteria development focus on aggregated Level 3 ecoregions (EPA 2010). The three ecoregions in Minnesota are NF (includes Northern Lakes and Forests and Northern Minnesota Wetlands), ETF (comprised of the North Central Hardwood Forests and Driftless Area), and GP (comprised of the Western Corn Belt Plain, Northern Glaciated Plains, and Lake Agassiz Plains). All three mapping levels (state, ecoregion and aggregated ecoregion) are referred to in the context of this report. Descriptive and inferential statistics were performed with Excel. A mapping and analysis tool (NLA Data Viewer) developed by the EPA (Kiddon 2014) was used to assist with the data analysis and presentation. This tool allows for summarization and depiction of NLA data at the national, ecoregion, EPA regional and state levels. It also allows for user-defined regions. The tool allows the user to define the scale at which to analyze and present the data and to define three-four thresholds for analyzing each parameter. Statewide parameter distributions, in particular the 25th and 75th percentiles (interquartile range) were used in selection of “thresholds” for mapping purposes (absent actual water quality standards or other relevant thresholds). The statistical package “R” (R Development Core Team 2009) was used in some of the data analyses as well.
Weighted CDF are used to describe parameter distributions for Minnesota. For a nationally-weighted CDF, each lake is weighted to reflect its surface area and ubiquity in one of nine ecoregions at a national level (Kiddon 2010). A weighted CDF provides a balanced estimate of all lakes in a region. Nationally-weighted values are most useful in comparison with national or regional datasets. For this purpose, only the first 50 lakes, which included all the required samples from the national program, should be used in any national comparisons and this is what will be done when Minnesota makes its condition estimates -- relative to the national estimates.
National Lakes Assessment 2012 • January 2016 Minnesota Pollution Control Agency
8

For this report, state-weighted estimates are a primary focus, which weight the lake relative to its surface area and it’s ubiquity in Minnesota. The entire 149 lake dataset can be used in this analysis and allows for improved description of statewide patterns and distributions. Since lakes were selected to allow for examination of regional patterns for the three aggregated ecoregions: NF, EF, and GP, CDF and related plots and maps will be used to describe regional differences in various parameters.
Data are presented in maps as well. Bubble plot maps show location of the site (lake) and the relative magnitude of the parameter value as compared to other values in the data set. These maps are useful for demonstrating regional patterns and can be used to show outlier values. Maps with user-defined classifications (e.g. based on water quality standards, trophic status, etc.) are also used to depict regional patterns and demonstrate extent of specified concentrations ranges.
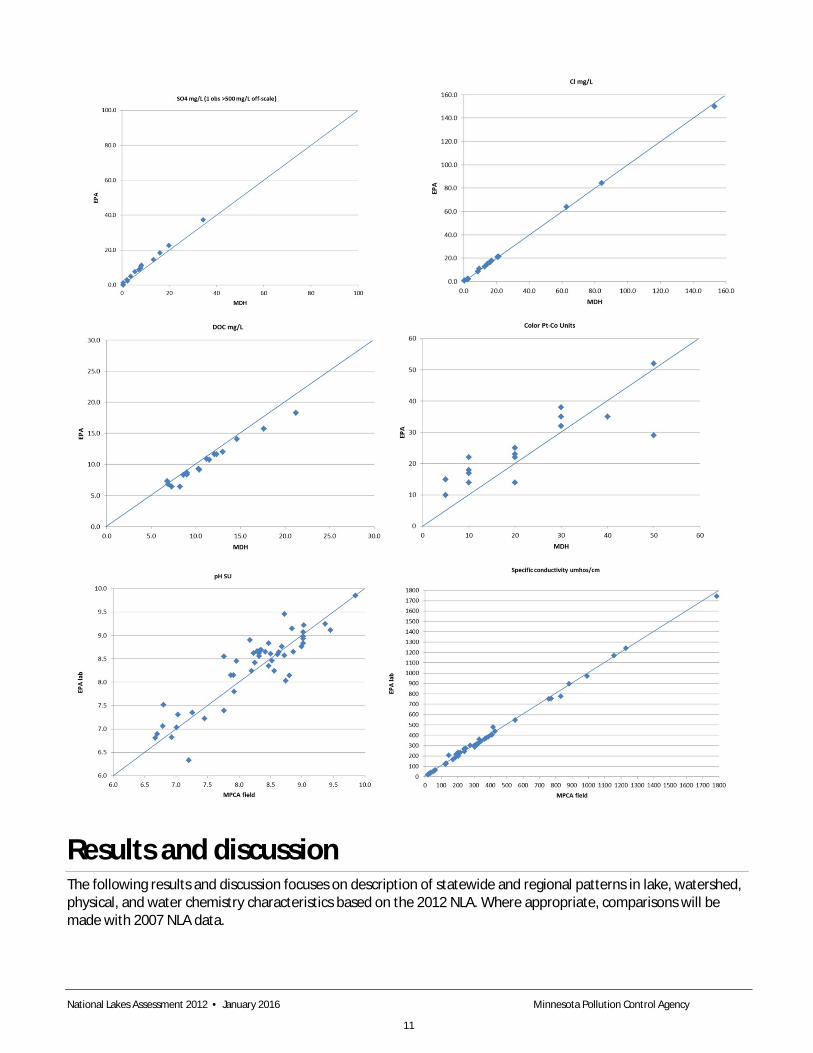
Comparison of EPA and MDH data A subset of the NLA lakes had samples analyzed for select parameters by both the EPA and MDH laboratories. This allowed for a comparison among laboratories and provides a basis to determine if there are any significant differences that need be accounted for in the data analysis. To help facilitate this, Minnesota collected duplicate water samples from 18 of the 50 national lakes and submitted samples to both laboratories. This provided a basis for determining the compatibility of the two data sets.
Data from the two laboratories was compared via scatterplots with a 1:1 line to allow for visual comparison of the data sets (Figure 6). This approach was chosen, as opposed to more complex statistical approaches, since our interest was in comparability of the data sets, rather than evaluating performance of either laboratory. In general, there was very good correspondence between the two laboratories for all cations, anions, and Chl-a. The Chl-a results are particularly important given that inter-lab comparisons often exhibit greater variability than that observed here and Chl-a is a very significant variable in the overall assessment of trophic status in the NLA.
Total phosphorus (TP) data were not comparable among the two laboratories. In general, MDH TP values were low relative to EPA TP values (Figure 6). MDH values were found to be low in other MPCA datasets as well in 2012. This was determined to be caused by a change in the MDH analytical method, which did not allow for complete breakdown of organic matter (e.g. algae) in the sample, resulting in lower than expected values. The MDH TP values will be carried forward with the overall data set; however, their value for characterizing regional patterns and interrelationships will be limited. As such Chl-a will be used as the primary indicator of trophic status for the 2012 survey.
Total nitrogen (TN) and total Kjeldahl nitrogen (TKN) yielded fairly close correspondence for most data pairs, which is good considering values are generated from two different analytical techniques. Nitrate-N was added to the MDH TKN to estimate TN. Nitrate-N is typically at or below the reporting limit in Minnesota lakes and so TKN often provides a reasonable estimate of TN. MN-106 (Cokato Lake) was an exception with a nitrate-N of 3.0 mg/L. The one lake with the highest TKN was MN-118 (South) which is point source-impacted and had an extremely high chlorophyll-a, which accounts for high organic N.
The MDH dissolved organic carbon (DOC) measurements were slightly higher than the respective EPA DOC; however correspondence among the two measures was pretty good across the range of measurements (Figure 6). Agreement among color values was poor and is in part an artifact of how color is measured and scales (detection) used in the two laboratories. MDH data are reported in increments of five PCU; whereas the EPA used increments of one PCU. However, if the color data are used to indicate a relative “class” of color, e.g. clear, moderate or dark, the laboratory differences should not be an issue.
Also included in this analysis is a comparison of Environmental Research Laboratory (ERL) lab-generated pH and conductivity and MPCA field-generated (field sonde) measurements. Conductivity measures were quite comparable among the lab and field data, while pH was more variable among the two methods. Since field measurements were taken on all lake visits, these data will be used in further analysis for these two parameters.
National Lakes Assessment 2012 • January 2016 Minnesota Pollution Control Agency
9
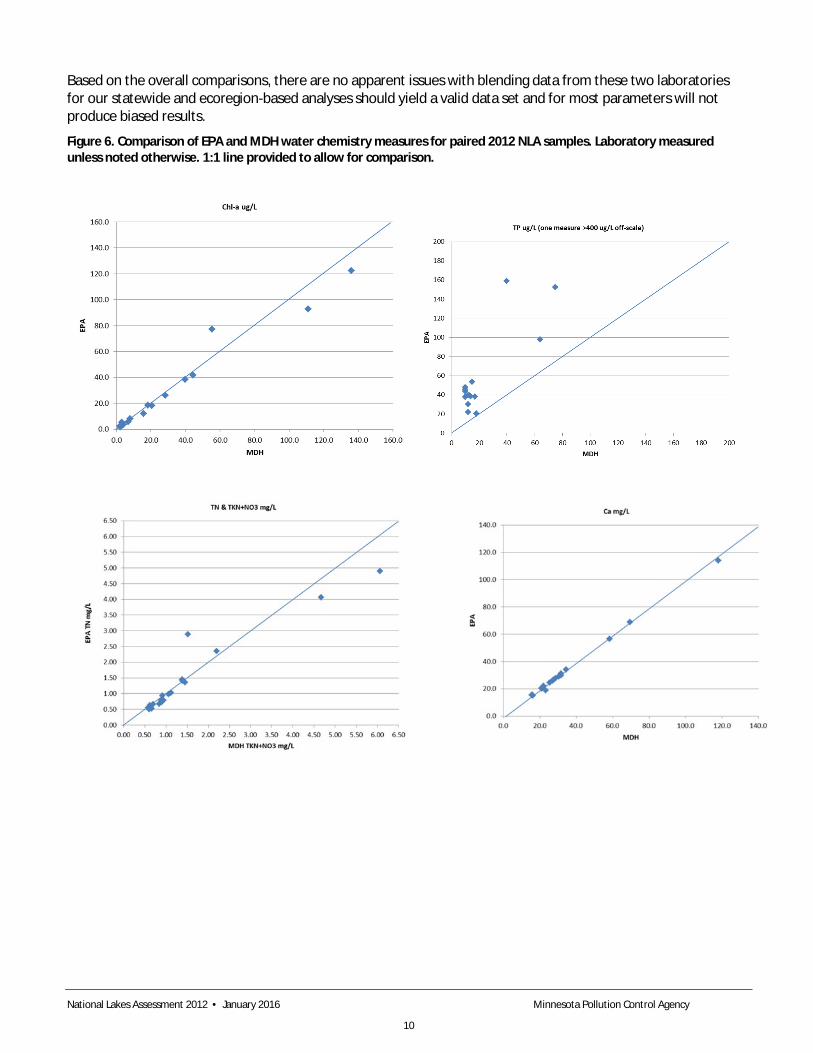
Based on the overall comparisons, there are no apparent issues with blending data from these two laboratories for our statewide and ecoregion-based analyses should yield a valid data set and for most parameters will not produce biased results.
Figure 6. Comparison of EPA and MDH water chemistry measures for paired 2012 NLA samples. Laboratory measured unless noted otherwise. 1:1 line provided to allow for comparison.
National Lakes Assessment 2012 • January 2016 Minnesota Pollution Control Agency
10
Results and discussion The following results and discussion focuses on description of statewide and regional patterns in lake, watershed, physical, and water chemistry characteristics based on the 2012 NLA. Where appropriate, comparisons will be made with 2007 NLA data.
National Lakes Assessment 2012 • January 2016 Minnesota Pollution Control Agency
11
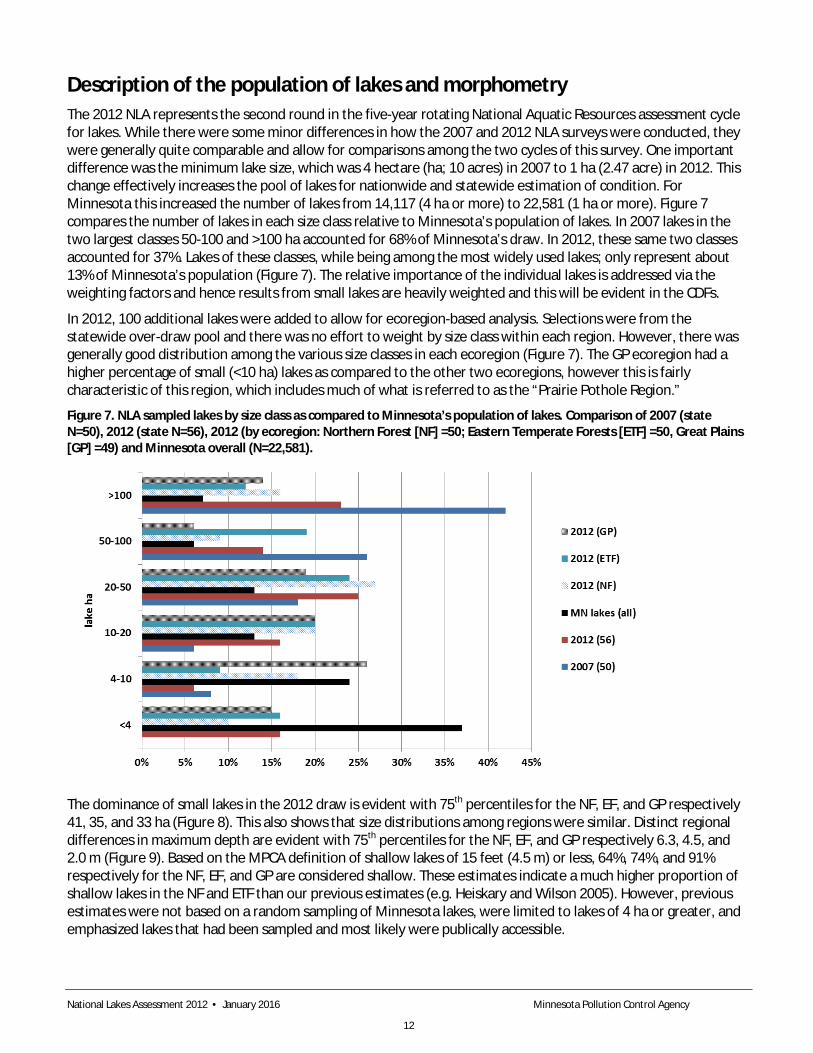
Description of the population of lakes and morphometry The 2012 NLA represents the second round in the five-year rotating National Aquatic Resources assessment cycle for lakes. While there were some minor differences in how the 2007 and 2012 NLA surveys were conducted, they were generally quite comparable and allow for comparisons among the two cycles of this survey. One important difference was the minimum lake size, which was 4 hectare (ha; 10 acres) in 2007 to 1 ha (2.47 acre) in 2012. This change effectively increases the pool of lakes for nationwide and statewide estimation of condition. For Minnesota this increased the number of lakes from 14,117 (4 ha or more) to 22,581 (1 ha or more). Figure 7 compares the number of lakes in each size class relative to Minnesota’s population of lakes. In 2007 lakes in the two largest classes 50-100 and >100 ha accounted for 68% of Minnesota’s draw. In 2012, these same two classes accounted for 37%. Lakes of these classes, while being among the most widely used lakes; only represent about 13% of Minnesota’s population (Figure 7). The relative importance of the individual lakes is addressed via the weighting factors and hence results from small lakes are heavily weighted and this will be evident in the CDFs.
In 2012, 100 additional lakes were added to allow for ecoregion-based analysis. Selections were from the statewide over-draw pool and there was no effort to weight by size class within each region. However, there was generally good distribution among the various size classes in each ecoregion (Figure 7). The GP ecoregion had a higher percentage of small (<10 ha) lakes as compared to the other two ecoregions, however this is fairly characteristic of this region, which includes much of what is referred to as the “Prairie Pothole Region.”
Figure 7. NLA sampled lakes by size class as compared to Minnesota’s population of lakes. Comparison of 2007 (state N=50), 2012 (state N=56), 2012 (by ecoregion: Northern Forest [NF] =50; Eastern Temperate Forests [ETF] =50, Great Plains [GP] =49) and Minnesota overall (N=22,581).
The dominance of small lakes in the 2012 draw is evident with 75th percentiles for the NF, EF, and GP respectively 41, 35, and 33 ha (Figure 8). This also shows that size distributions among regions were similar. Distinct regional differences in maximum depth are evident with 75th percentiles for the NF, EF, and GP respectively 6.3, 4.5, and 2.0 m (Figure 9). Based on the MPCA definition of shallow lakes of 15 feet (4.5 m) or less, 64%, 74%, and 91% respectively for the NF, EF, and GP are considered shallow. These estimates indicate a much higher proportion of shallow lakes in the NF and ETF than our previous estimates (e.g. Heiskary and Wilson 2005). However, previous estimates were not based on a random sampling of Minnesota lakes, were limited to lakes of 4 ha or greater, and emphasized lakes that had been sampled and most likely were publically accessible.
National Lakes Assessment 2012 • January 2016 Minnesota Pollution Control Agency
12
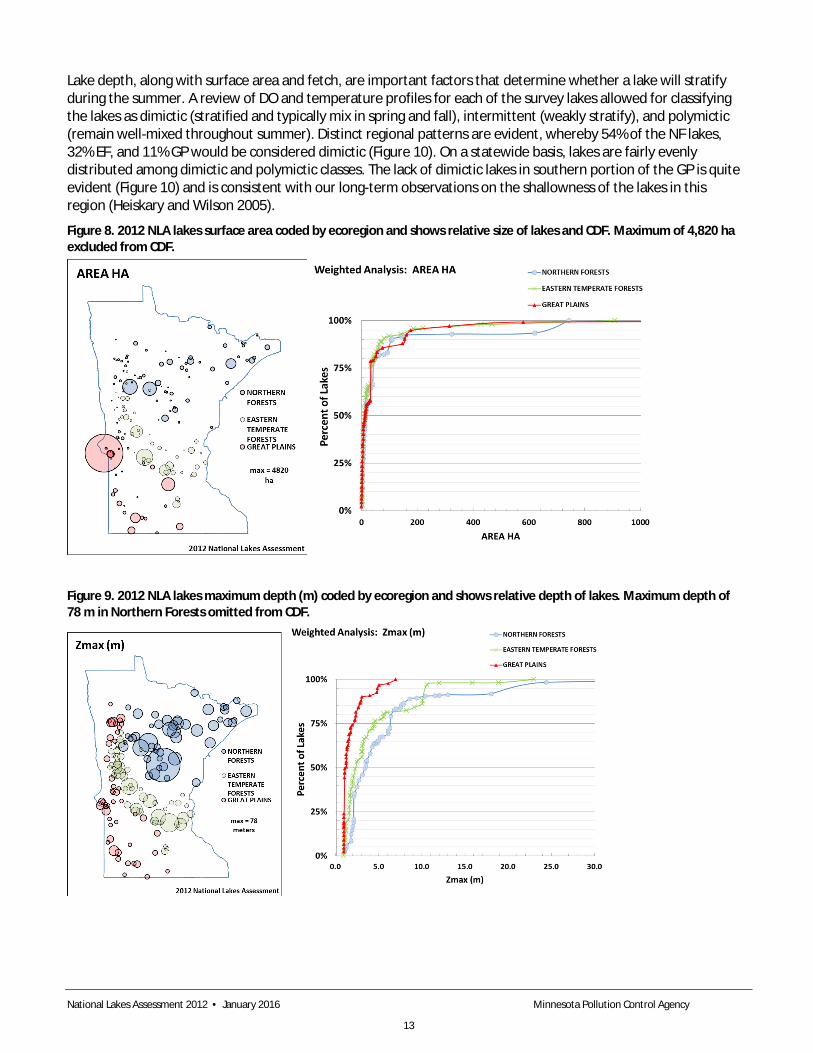
Lake depth, along with surface area and fetch, are important factors that determine whether a lake will stratify during the summer. A review of DO and temperature profiles for each of the survey lakes allowed for classifying the lakes as dimictic (stratified and typically mix in spring and fall), intermittent (weakly stratify), and polymictic (remain well-mixed throughout summer). Distinct regional patterns are evident, whereby 54% of the NF lakes, 32% EF, and 11% GP would be considered dimictic (Figure 10). On a statewide basis, lakes are fairly evenly distributed among dimictic and polymictic classes. The lack of dimictic lakes in southern portion of the GP is quite evident (Figure 10) and is consistent with our long-term observations on the shallowness of the lakes in this region (Heiskary and Wilson 2005).
Figure 8. 2012 NLA lakes surface area coded by ecoregion and shows relative size of lakes and CDF. Maximum of 4,820 ha excluded from CDF.
Figure 9. 2012 NLA lakes maximum depth (m) coded by ecoregion and shows relative depth of lakes. Maximum depth of 78 m in Northern Forests omitted from CDF.
National Lakes Assessment 2012 • January 2016 Minnesota Pollution Control Agency
13

Figure 10. Lake mixing status by ecoregion: a. relative percentages and b. statewide map.
a.
b.
Description of lake watershed areas and land use composition Watershed areas were delineated for all lakes in the study. Watershed areas ranged from a minimum of 18 ha for an Unnamed Lake in the EF up to 197,188 ha for Big Stone Lake on the border of South Dakota. Watershed area distributions were somewhat similar among regions (Figure 4). IQ ranges of 93-1,200 ha (NF), 65-435 ha (EF), and 70-850 ha (NP) suggest that typical watershed areas were larger in the NF region; however some of the largest watersheds (South Walnut, Talcott and Big Stone Lakes) were in the NP region.
Watershed: lake area ratios are often used to describe the relative size of the watershed to the lake surface area and can be used to estimate the relative importance for watershed runoff (water and pollutant loading) as compared to atmospheric deposition or groundwater inputs. For example, lakes with small ratios (~10:1 or less) often have relatively low amounts of runoff from the watershed as compared to lakes with large ratios (~50:1 or more). Precipitation on the surface of the lake and groundwater inflow is often the largest sources of water loading to lakes with small watershed: lake ratios. In contrast, lakes with large watersheds are often dominated by
National Lakes Assessment 2012 • January 2016 Minnesota Pollution Control Agency
14
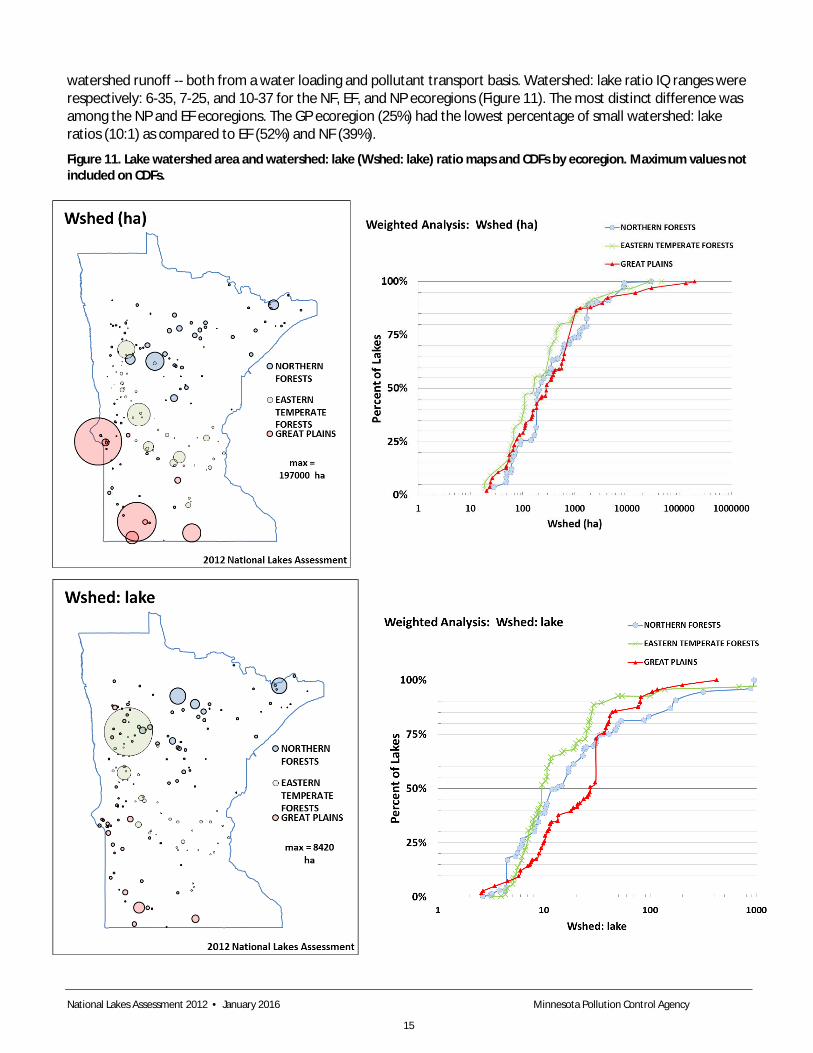
watershed runoff -- both from a water loading and pollutant transport basis. Watershed: lake ratio IQ ranges were respectively: 6-35, 7-25, and 10-37 for the NF, EF, and NP ecoregions (Figure 11). The most distinct difference was among the NP and EF ecoregions. The GP ecoregion (25%) had the lowest percentage of small watershed: lake ratios (10:1) as compared to EF (52%) and NF (39%).
Figure 11. Lake watershed area and watershed: lake (Wshed: lake) ratio maps and CDFs by ecoregion. Maximum values not included on CDFs.
National Lakes Assessment 2012 • January 2016 Minnesota Pollution Control Agency
15
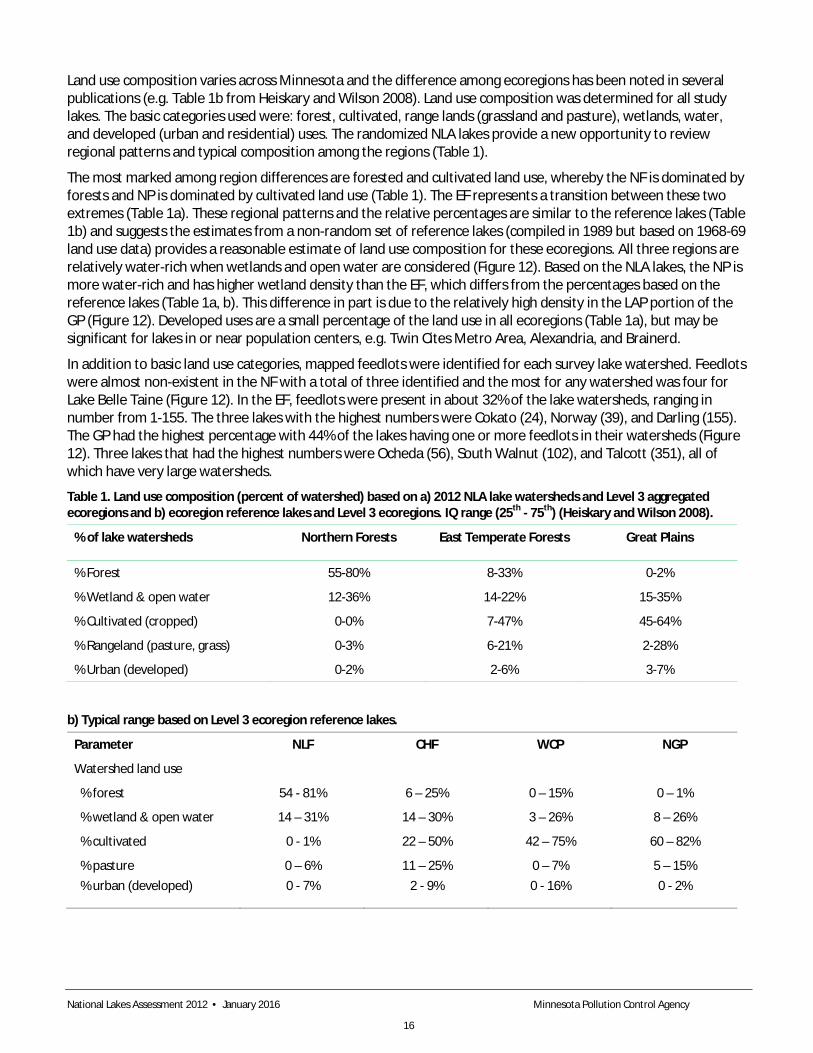
Land use composition varies across Minnesota and the difference among ecoregions has been noted in several publications (e.g. Table 1b from Heiskary and Wilson 2008). Land use composition was determined for all study lakes. The basic categories used were: forest, cultivated, range lands (grassland and pasture), wetlands, water, and developed (urban and residential) uses. The randomized NLA lakes provide a new opportunity to review regional patterns and typical composition among the regions (Table 1).
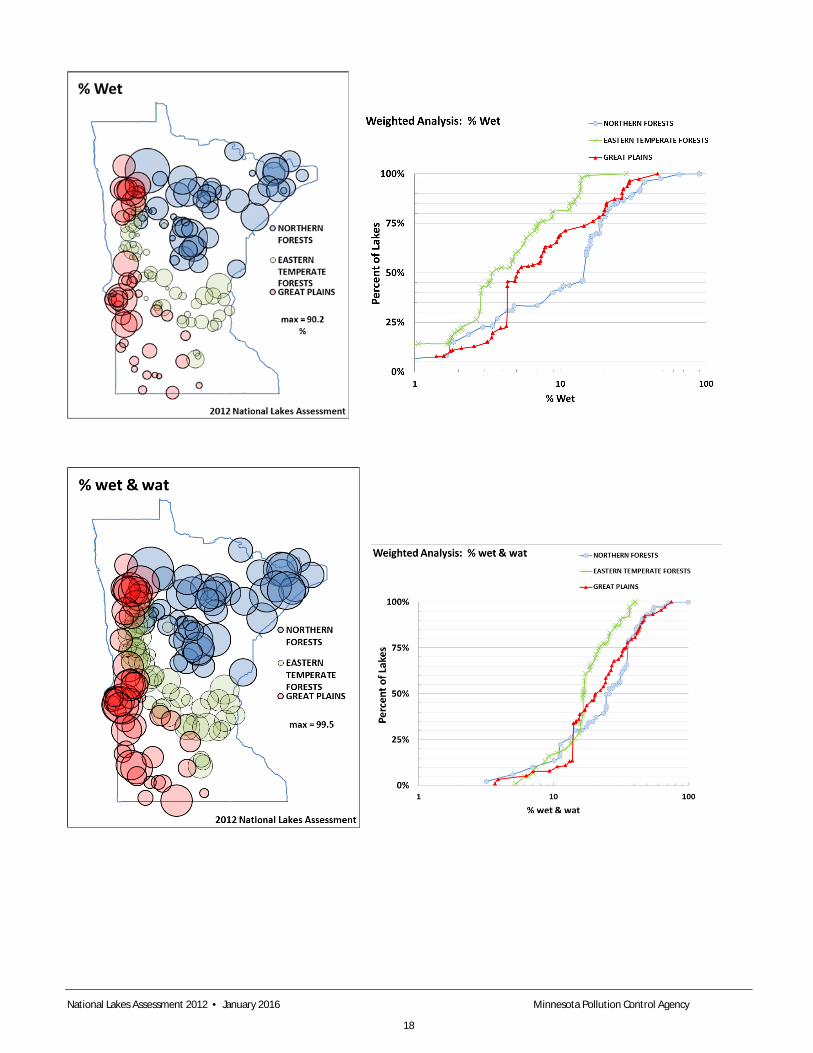
The most marked among region differences are forested and cultivated land use, whereby the NF is dominated by forests and NP is dominated by cultivated land use (Table 1). The EF represents a transition between these two extremes (Table 1a). These regional patterns and the relative percentages are similar to the reference lakes (Table 1b) and suggests the estimates from a non-random set of reference lakes (compiled in 1989 but based on 1968-69 land use data) provides a reasonable estimate of land use composition for these ecoregions. All three regions are relatively water-rich when wetlands and open water are considered (Figure 12). Based on the NLA lakes, the NP is more water-rich and has higher wetland density than the EF, which differs from the percentages based on the reference lakes (Table 1a, b). This difference in part is due to the relatively high density in the LAP portion of the GP (Figure 12). Developed uses are a small percentage of the land use in all ecoregions (Table 1a), but may be significant for lakes in or near population centers, e.g. Twin Cites Metro Area, Alexandria, and Brainerd.
In addition to basic land use categories, mapped feedlots were identified for each survey lake watershed. Feedlots were almost non-existent in the NF with a total of three identified and the most for any watershed was four for Lake Belle Taine (Figure 12). In the EF, feedlots were present in about 32% of the lake watersheds, ranging in number from 1-155. The three lakes with the highest numbers were Cokato (24), Norway (39), and Darling (155). The GP had the highest percentage with 44% of the lakes having one or more feedlots in their watersheds (Figure 12). Three lakes that had the highest numbers were Ocheda (56), South Walnut (102), and Talcott (351), all of which have very large watersheds.
Table 1. Land use composition (percent of watershed) based on a) 2012 NLA lake watersheds and Level 3 aggregated ecoregions and b) ecoregion reference lakes and Level 3 ecoregions. IQ range (25th - 75th) (Heiskary and Wilson 2008).
% of lake watersheds Northern Forests East Temperate Forests Great Plains
% Forest 55-80% 8-33% 0-2%
% Wetland & open water 12-36% 14-22% 15-35%
% Cultivated (cropped) 0-0% 7-47% 45-64%
% Rangeland (pasture, grass) 0-3% 6-21% 2-28%
% Urban (developed) 0-2% 2-6% 3-7%
b) Typical range based on Level 3 ecoregion reference lakes.
Parameter NLF CHF WCP NGP
Watershed land use
% forest 54 - 81% 6 – 25% 0 – 15% 0 – 1%
% wetland & open water 14 – 31% 14 – 30% 3 – 26% 8 – 26%
% cultivated 0 - 1% 22 – 50% 42 – 75% 60 – 82%
% pasture % urban (developed)
0 – 6% 0 - 7%
11 – 25% 2 - 9%
0 – 7% 0 - 16%
5 – 15% 0 - 2%
National Lakes Assessment 2012 • January 2016 Minnesota Pollution Control Agency
16

Figure 12. Land use composition bubble plot maps and CDFs by ecoregion as follows: % forested (For), % cropped (Crop), % wetland (Wet), % wetland + water (wet wat), % rangeland (Rang), % developed (Dev) and number of feedlots.
National Lakes Assessment 2012 • January 2016 Minnesota Pollution Control Agency
17
National Lakes Assessment 2012 • January 2016 Minnesota Pollution Control Agency
18

National Lakes Assessment 2012 • January 2016 Minnesota Pollution Control Agency
19

Water chemistry and physical characteristics Patterns in lake water chemistry in Minnesota have been described in previous efforts and a couple of relevant studies are noted here. Moyle (1945) made several observations on regional patterns in water chemistry and described concentrations that have relevance to aquatic plant growth. In follow-up articles, Moyle (1946, 1954) addressed some indices of lake productivity with an emphasis on fish production. For example, he noted increased ionic content of lakes moving from northeastern to southwestern Minnesota and how fish productivity increased as well over this gradient. Gorham et al. (1983) provided a rather pertinent analysis of the chemical composition of lakes in a four-state region that included Wisconsin, Minnesota, North Dakota, and South Dakota. This detailed work describes distinct regional patterns that were largely felt to be a function of underlying geology and transitions in climate (rainfall, runoff, and evaporation) across the region. Eilers et al. (1988) provided a description of the water chemistry of northeastern Minnesota, north central Wisconsin, and the upper peninsula of Michigan as a part of the statistically-based Eastern Lake Survey, which was conducted to assess acid rain impacts and sensitivity.
Regional patterns have long-been described using the ecoregion framework (Heiskary and Wilson 1989 and 2008). These characterizations provide a basis for evaluating water chemistry and lake trophic status in a regional context. These summaries are used in conjunction with the NLA data to provide perspective on water chemistry, trophic status and regional patterns for Minnesota’s lakes. Water chemistry data from Minnesota’s 2007 NLA were described in a statewide context and relative to surrounding states (Heiskary 2010). The analysis in this report focuses on regional and statewide patterns based on the 149 lake dataset gathered during the 2012 NLA. Percentile distributions, weighted CDFs, bubble-plots and related statistical summaries from EPA’s DataViewer will be used to describe parameter condition and patterns at state and regional levels. Where appropriate, reference will be made to water quality standards and percent of lakes in compliance with the standards.
A statewide statistical summary of basic field and laboratory measurements from the 2012 NLA is presented in Table 2. This summary reflects statewide condition or ranges for selected parameters and serves as a basic resource for comparison of individual data (e.g. Are measured values high, low, or typical as compared to randomized data from Minnesota lakes) and serves to complement the ecoregion-based analysis that is a primary focus of this report. The summary of typical ranges based on ecoregion reference lakes is provided for comparative purposes (Table 3). The actual ranking of a lake’s water chemistry or physical data is more appropriately compared to the weighted cumulative distribution functions presented later in this report.
National Lakes Assessment 2012 • January 2016 Minnesota Pollution Control Agency
20
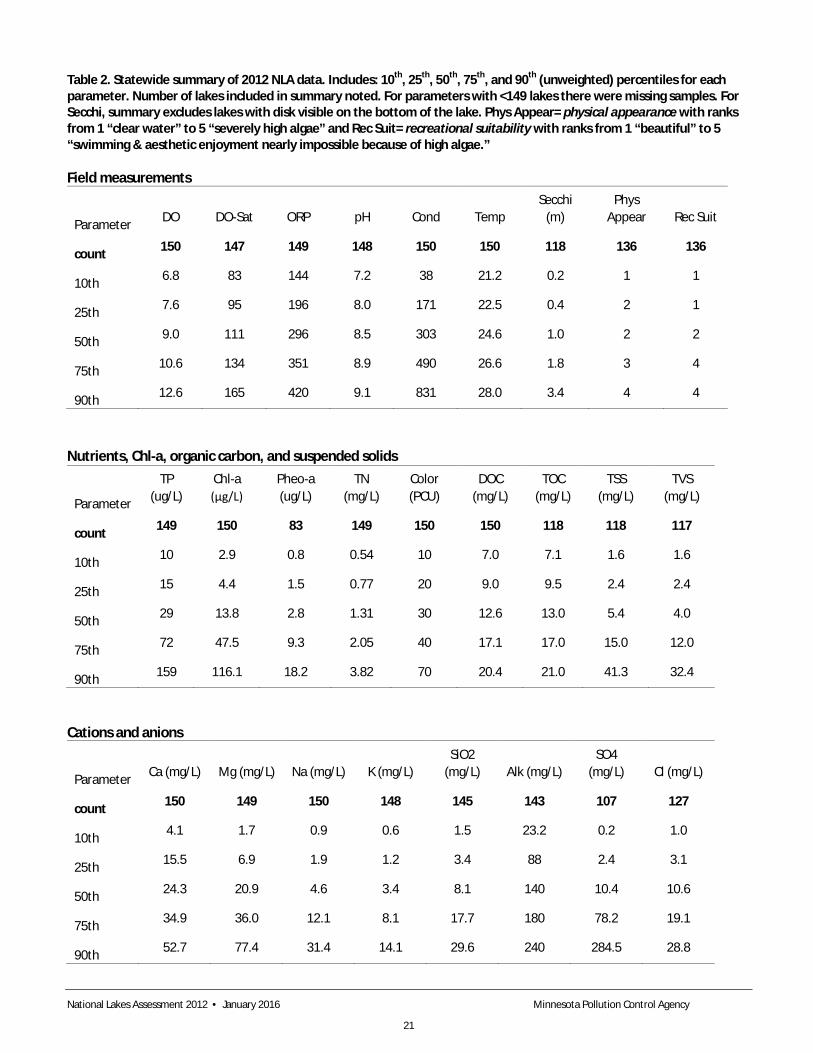
Table 2. Statewide summary of 2012 NLA data. Includes: 10th, 25th, 50th, 75th, and 90th (unweighted) percentiles for each parameter. Number of lakes included in summary noted. For parameters with <149 lakes there were missing samples. For Secchi, summary excludes lakes with disk visible on the bottom of the lake. Phys Appear= physical appearance with ranks from 1 “clear water” to 5 “severely high algae” and Rec Suit= recreational suitability with ranks from 1 “beautiful” to 5 “swimming & aesthetic enjoyment nearly impossible because of high algae.”
Field measurements
Parameter DO DO-Sat ORP pH Cond Temp Secchi
(m) Phys
Appear Rec Suit
count 150 147 149 148 150 150 118 136 136
10th 6.8 83 144 7.2 38 21.2 0.2 1 1
25th 7.6 95 196 8.0 171 22.5 0.4 2 1
50th 9.0 111 296 8.5 303 24.6 1.0 2 2
75th 10.6 134 351 8.9 490 26.6 1.8 3 4
90th 12.6 165 420 9.1 831 28.0 3.4 4 4
Nutrients, Chl-a, organic carbon, and suspended solids
Parameter
TP (ug/L)
Chl-a (μg/L)
Pheo-a (ug/L)
TN (mg/L)
Color (PCU)
DOC (mg/L)
TOC (mg/L)
TSS (mg/L)
TVS (mg/L)
count 149 150 83 149 150 150 118 118 117
10th 10 2.9 0.8 0.54 10 7.0 7.1 1.6 1.6
25th 15 4.4 1.5 0.77 20 9.0 9.5 2.4 2.4
50th 29 13.8 2.8 1.31 30 12.6 13.0 5.4 4.0
75th 72 47.5 9.3 2.05 40 17.1 17.0 15.0 12.0
90th 159 116.1 18.2 3.82 70 20.4 21.0 41.3 32.4
Cations and anions
Parameter Ca (mg/L) Mg (mg/L) Na (mg/L) K (mg/L) SiO2
(mg/L) Alk (mg/L) SO4
(mg/L) Cl (mg/L)
count 150 149 150 148 145 143 107 127
10th 4.1 1.7 0.9 0.6 1.5 23.2 0.2 1.0
25th 15.5 6.9 1.9 1.2 3.4 88 2.4 3.1
50th 24.3 20.9 4.6 3.4 8.1 140 10.4 10.6
75th 34.9 36.0 12.1 8.1 17.7 180 78.2 19.1
90th 52.7 77.4 31.4 14.1 29.6 240 284.5 28.8
National Lakes Assessment 2012 • January 2016 Minnesota Pollution Control Agency
21
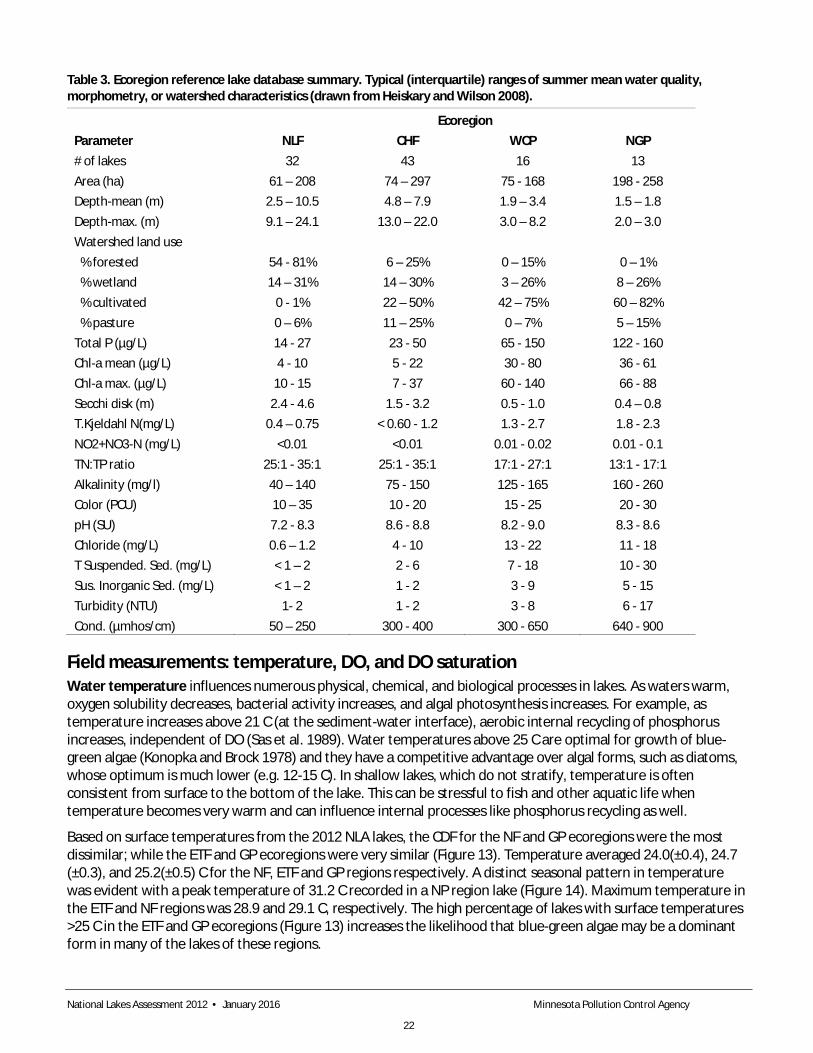
Table 3. Ecoregion reference lake database summary. Typical (interquartile) ranges of summer mean water quality, morphometry, or watershed characteristics (drawn from Heiskary and Wilson 2008).
Ecoregion Parameter NLF CHF WCP NGP # of lakes 32 43 16 13 Area (ha) 61 – 208 74 – 297 75 - 168 198 - 258 Depth-mean (m) 2.5 – 10.5 4.8 – 7.9 1.9 – 3.4 1.5 – 1.8 Depth-max. (m) 9.1 – 24.1 13.0 – 22.0 3.0 – 8.2 2.0 – 3.0 Watershed land use % forested 54 - 81% 6 – 25% 0 – 15% 0 – 1% % wetland 14 – 31% 14 – 30% 3 – 26% 8 – 26% % cultivated 0 - 1% 22 – 50% 42 – 75% 60 – 82% % pasture 0 – 6% 11 – 25% 0 – 7% 5 – 15% Total P (µg/L) 14 - 27 23 - 50 65 - 150 122 - 160 Chl-a mean (µg/L) 4 - 10 5 - 22 30 - 80 36 - 61 Chl-a max. (µg/L) 10 - 15 7 - 37 60 - 140 66 - 88 Secchi disk (m) 2.4 - 4.6 1.5 - 3.2 0.5 - 1.0 0.4 – 0.8 T.Kjeldahl N(mg/L) 0.4 – 0.75 < 0.60 - 1.2 1.3 - 2.7 1.8 - 2.3 NO2+NO3-N (mg/L) <0.01 <0.01 0.01 - 0.02 0.01 - 0.1 TN:TP ratio 25:1 - 35:1 25:1 - 35:1 17:1 - 27:1 13:1 - 17:1 Alkalinity (mg/l) 40 – 140 75 - 150 125 - 165 160 - 260 Color (PCU) 10 – 35 10 - 20 15 - 25 20 - 30 pH (SU) 7.2 - 8.3 8.6 - 8.8 8.2 - 9.0 8.3 - 8.6 Chloride (mg/L) 0.6 – 1.2 4 - 10 13 - 22 11 - 18 T Suspended. Sed. (mg/L) < 1 – 2 2 - 6 7 - 18 10 - 30 Sus. Inorganic Sed. (mg/L) < 1 – 2 1 - 2 3 - 9 5 - 15 Turbidity (NTU) 1- 2 1 - 2 3 - 8 6 - 17 Cond. (µmhos/cm) 50 – 250 300 - 400 300 - 650 640 - 900
Field measurements: temperature, DO, and DO saturation Water temperature influences numerous physical, chemical, and biological processes in lakes. As waters warm, oxygen solubility decreases, bacterial activity increases, and algal photosynthesis increases. For example, as temperature increases above 21 C (at the sediment-water interface), aerobic internal recycling of phosphorus increases, independent of DO (Sas et al. 1989). Water temperatures above 25 C are optimal for growth of blue-green algae (Konopka and Brock 1978) and they have a competitive advantage over algal forms, such as diatoms, whose optimum is much lower (e.g. 12-15 C). In shallow lakes, which do not stratify, temperature is often consistent from surface to the bottom of the lake. This can be stressful to fish and other aquatic life when temperature becomes very warm and can influence internal processes like phosphorus recycling as well.
Based on surface temperatures from the 2012 NLA lakes, the CDF for the NF and GP ecoregions were the most dissimilar; while the ETF and GP ecoregions were very similar (Figure 13). Temperature averaged 24.0(±0.4), 24.7 (±0.3), and 25.2(±0.5) C for the NF, ETF and GP regions respectively. A distinct seasonal pattern in temperature was evident with a peak temperature of 31.2 C recorded in a NP region lake (Figure 14). Maximum temperature in the ETF and NF regions was 28.9 and 29.1 C, respectively. The high percentage of lakes with surface temperatures >25 C in the ETF and GP ecoregions (Figure 13) increases the likelihood that blue-green algae may be a dominant form in many of the lakes of these regions.
National Lakes Assessment 2012 • January 2016 Minnesota Pollution Control Agency
22

Figure 13. 2012 NLA lake surface temperature CDF and percent by class by ecoregion. Classes used: <21 cool, 21-25 warm, and >25 C very warm.
Figure 14. Temperature as a function of sample date (DATEVALUE function), by ecoregion. Sampling period ran from June 2- September 5, 2012.
Dissolved oxygen (DO) is an essential measurement and is central to the support of aquatic life in lakes and rivers. DO profiles were taken on all lakes. DO saturation, which is a measure of the amount of DO in water relative to air saturation. At 100% air saturation water is holding as much DO as it can at equilibrium. The actual amount of DO varies dependent on temperature, pressure, and solubility. At 20C DO at 100% saturation is ~10 mg/L and at 30C it is ~8 mg/L. Supersaturation may occur with rapid reaeration (streams) or with excessive algal productivity (lakes and rivers).
National Lakes Assessment 2012 • January 2016 Minnesota Pollution Control Agency
23
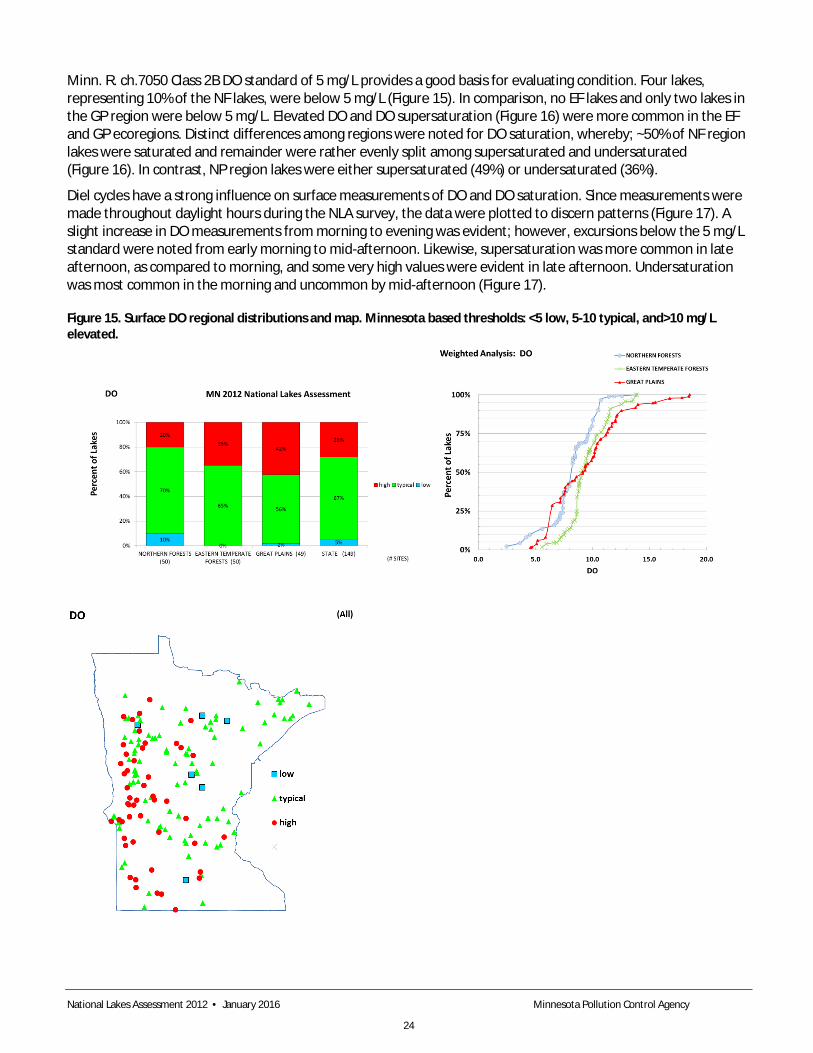
Minn. R. ch.7050 Class 2B DO standard of 5 mg/L provides a good basis for evaluating condition. Four lakes, representing 10% of the NF lakes, were below 5 mg/L (Figure 15). In comparison, no EF lakes and only two lakes in the GP region were below 5 mg/L. Elevated DO and DO supersaturation (Figure 16) were more common in the EF and GP ecoregions. Distinct differences among regions were noted for DO saturation, whereby; ~50% of NF region lakes were saturated and remainder were rather evenly split among supersaturated and undersaturated (Figure 16). In contrast, NP region lakes were either supersaturated (49%) or undersaturated (36%).
Diel cycles have a strong influence on surface measurements of DO and DO saturation. Since measurements were made throughout daylight hours during the NLA survey, the data were plotted to discern patterns (Figure 17). A slight increase in DO measurements from morning to evening was evident; however, excursions below the 5 mg/L standard were noted from early morning to mid-afternoon. Likewise, supersaturation was more common in late afternoon, as compared to morning, and some very high values were evident in late afternoon. Undersaturation was most common in the morning and uncommon by mid-afternoon (Figure 17).
Figure 15. Surface DO regional distributions and map. Minnesota based thresholds: <5 low, 5-10 typical, and>10 mg/L elevated.
National Lakes Assessment 2012 • January 2016 Minnesota Pollution Control Agency
24

Figure 16. DO saturation just below surface (expressed as a percent) as follows: <90% undersaturated, 90-110% saturated, & >110% supersaturated.
Figure 17. Surface DO and saturation measurements for NLA study lakes. 5 ppm (mg/L) DO standard and 100% saturation noted for visual reference.
National Lakes Assessment 2012 • January 2016 Minnesota Pollution Control Agency
25

Oxidation reduction potential (ORP), also referred to as redox, is routinely measured with multi-probes but is often not used in data analysis. ORP by definition is the activity or strength of oxidizers and reducers in relation to their concentration. In lakes, ORP is related to DO and in a typical profile in stratified lakes, ORP is very high at the surface and declines with depth and reduced DO. As DO approaches 0 mg/L in the hypolimnion, ORP values also approach 0 and may have negative values near the bottom of the lake because of elevated concentrations of reducers like hydrogen sulfide.
Distinct regional patterns in surface ORP were evident. In the NF and ETF regions, 83% and 87%, respectively, had moderate to high values; whereas in the GP region 49% had low values (Figure 18). Three GP region lakes had ORP <100, which is very low for surface water. All three lakes were supersaturated and DO values ranged from 9.2-14.0 mg/L.
Figure 18. Oxidation reduction potential (ORP) regional distributions and maps Thresholds based on statewide IQ range: <200 low, 200-350 moderate, and >350 mV high.
Nutrients and trophic status indicators Regional patterns in nutrients, chlorophyll and Secchi have long been recognized for Minnesota (Heiskary and Wilson 1989) and are reflected in Minnesota’s lake eutrophication standards (Heiskary and Wilson 2008). The NLA data serve to reinforce these patterns and the interrelationships among these variables. These patterns, which are a reflection of the underlying ecoregions, extend into the adjacent states as well. Heiskary (2010) described these patterns for Minnesota and made comparisons to adjacent states and the nation.
National Lakes Assessment 2012 • January 2016 Minnesota Pollution Control Agency
26
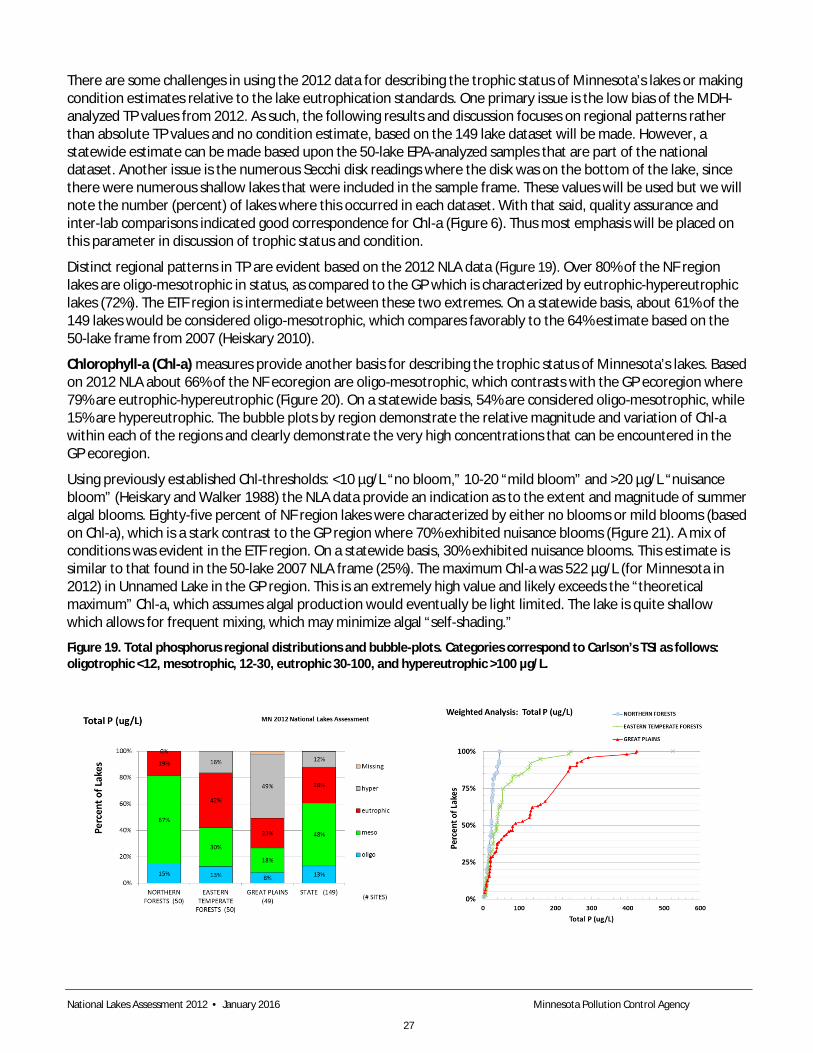
There are some challenges in using the 2012 data for describing the trophic status of Minnesota’s lakes or making condition estimates relative to the lake eutrophication standards. One primary issue is the low bias of the MDH-analyzed TP values from 2012. As such, the following results and discussion focuses on regional patterns rather than absolute TP values and no condition estimate, based on the 149 lake dataset will be made. However, a statewide estimate can be made based upon the 50-lake EPA-analyzed samples that are part of the national dataset. Another issue is the numerous Secchi disk readings where the disk was on the bottom of the lake, since there were numerous shallow lakes that were included in the sample frame. These values will be used but we will note the number (percent) of lakes where this occurred in each dataset. With that said, quality assurance and inter-lab comparisons indicated good correspondence for Chl-a (Figure 6). Thus most emphasis will be placed on this parameter in discussion of trophic status and condition.
Distinct regional patterns in TP are evident based on the 2012 NLA data (Figure 19). Over 80% of the NF region lakes are oligo-mesotrophic in status, as compared to the GP which is characterized by eutrophic-hypereutrophic lakes (72%). The ETF region is intermediate between these two extremes. On a statewide basis, about 61% of the 149 lakes would be considered oligo-mesotrophic, which compares favorably to the 64% estimate based on the 50-lake frame from 2007 (Heiskary 2010).
Chlorophyll-a (Chl-a) measures provide another basis for describing the trophic status of Minnesota’s lakes. Based on 2012 NLA about 66% of the NF ecoregion are oligo-mesotrophic, which contrasts with the GP ecoregion where 79% are eutrophic-hypereutrophic (Figure 20). On a statewide basis, 54% are considered oligo-mesotrophic, while 15% are hypereutrophic. The bubble plots by region demonstrate the relative magnitude and variation of Chl-a within each of the regions and clearly demonstrate the very high concentrations that can be encountered in the GP ecoregion.
Using previously established Chl-thresholds: <10 µg/L “no bloom,” 10-20 “mild bloom” and >20 µg/L “nuisance bloom” (Heiskary and Walker 1988) the NLA data provide an indication as to the extent and magnitude of summer algal blooms. Eighty-five percent of NF region lakes were characterized by either no blooms or mild blooms (based on Chl-a), which is a stark contrast to the GP region where 70% exhibited nuisance blooms (Figure 21). A mix of conditions was evident in the ETF region. On a statewide basis, 30% exhibited nuisance blooms. This estimate is similar to that found in the 50-lake 2007 NLA frame (25%). The maximum Chl-a was 522 µg/L (for Minnesota in 2012) in Unnamed Lake in the GP region. This is an extremely high value and likely exceeds the “theoretical maximum” Chl-a, which assumes algal production would eventually be light limited. The lake is quite shallow which allows for frequent mixing, which may minimize algal “self-shading.”
Figure 19. Total phosphorus regional distributions and bubble-plots. Categories correspond to Carlson’s TSI as follows: oligotrophic <12, mesotrophic, 12-30, eutrophic 30-100, and hypereutrophic >100 µg/L.
National Lakes Assessment 2012 • January 2016 Minnesota Pollution Control Agency
27

Figure 20. Chlorophyll-a regional distributions and bubble-plots. Categories correspond to Carlson’s TSI as follows: oligotrophic <3.5, mesotrophic, 3.5-10, eutrophic 10-60, and hypereutrophic >60 µg/L. Maximum GP ecoregion value 522 µg/L omitted from CDF.
National Lakes Assessment 2012 • January 2016 Minnesota Pollution Control Agency
28
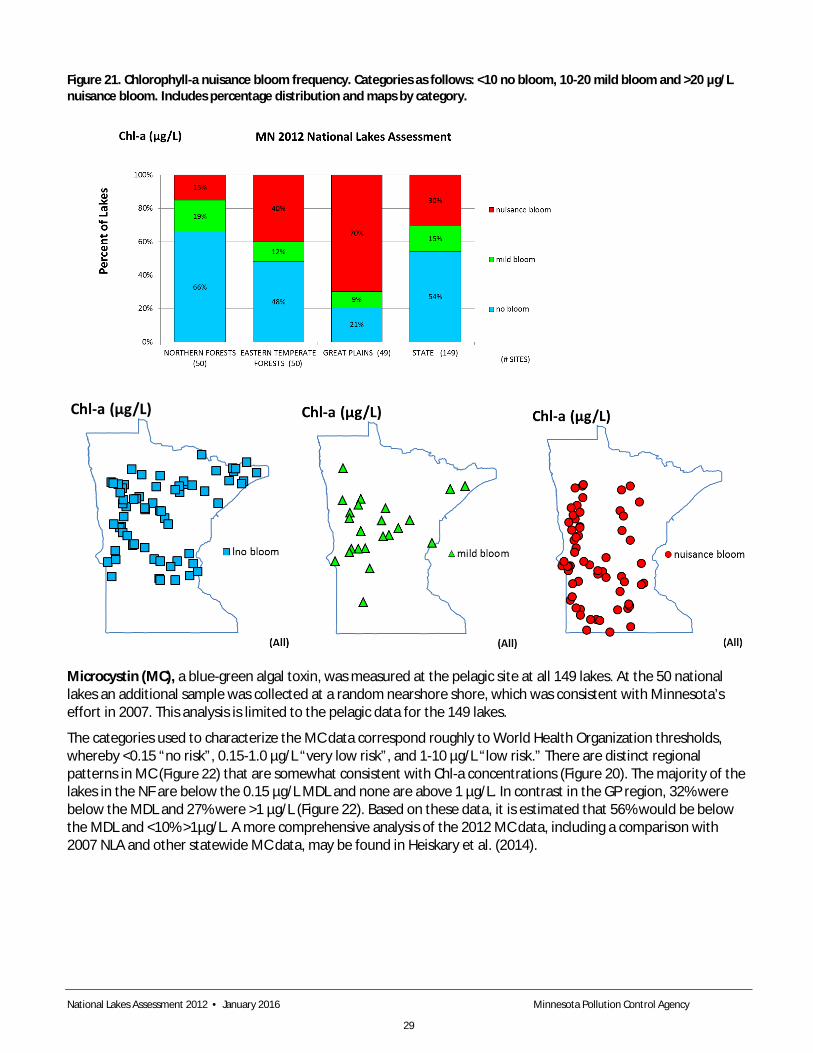
Figure 21. Chlorophyll-a nuisance bloom frequency. Categories as follows: <10 no bloom, 10-20 mild bloom and >20 µg/L nuisance bloom. Includes percentage distribution and maps by category.
Microcystin (MC), a blue-green algal toxin, was measured at the pelagic site at all 149 lakes. At the 50 national lakes an additional sample was collected at a random nearshore shore, which was consistent with Minnesota’s effort in 2007. This analysis is limited to the pelagic data for the 149 lakes.
The categories used to characterize the MC data correspond roughly to World Health Organization thresholds, whereby <0.15 “no risk”, 0.15-1.0 µg/L “very low risk”, and 1-10 µg/L “low risk.” There are distinct regional patterns in MC (Figure 22) that are somewhat consistent with Chl-a concentrations (Figure 20). The majority of the lakes in the NF are below the 0.15 µg/L MDL and none are above 1 µg/L. In contrast in the GP region, 32% were below the MDL and 27% were >1 µg/L (Figure 22). Based on these data, it is estimated that 56% would be below the MDL and <10% >1µg/L. A more comprehensive analysis of the 2012 MC data, including a comparison with 2007 NLA and other statewide MC data, may be found in Heiskary et al. (2014).
National Lakes Assessment 2012 • January 2016 Minnesota Pollution Control Agency
29

Figure 22. Microcystin distribution and bubble plot. Proportion of lakes with MC< 0.15 (MDL), 0.15-1.0 µg/L, and > 1 µg/L.
Secchi transparency in Minnesota lakes is often a direct reflection of the amount of algae (Chl-a) in the lakes and is a part of Carlson’s Trophic State Index. For purposes of data analysis, the following categories were used: oligotrophic >3.5m, mesotrophic 2.0-3.5 m, eutrophic 0.7-2.0 m, and hypereutrophic <0.7 m. As noted previously, there were numerous measurements where the Secchi disk was on the bottom of the lake. The number per ecoregion where this occurred and range of the measures is as follows: NF 8 lakes (1.0-2.2 m), EF 11 lakes (1.0-4.0), and NP 11 lakes (1-1.6 m). In most instances, this was because of the extreme shallowness of the lake; however, in some lakes with moderate depth, transparency was relatively high. For the purpose of this analysis (Figure 23), these values were treated as actual measurements. The relatively large percent of greater than measures (16-22% per region) has a distinct effect on the percent of lakes in the various trophic status classes and the CDFs (Figure 23). This is most pronounced in the NF ecoregion where the percent of eutrophic lakes is much higher than the Chl-a based estimate (Figure 21).
Figure 23. Secchi transparency CDF and plots by region. Trophic categories as follows: oligo > 3.5 m, meso 2.0-3.5 m, eutrophic 0.7-2.0 m, and hypereutrophic <0.7 m. [Secchi (w/>) indicates greater than values included in these calculations.]
National Lakes Assessment 2012 • January 2016 Minnesota Pollution Control Agency
30

Several forms of nitrogen (N) were measured in the NLA lakes including: TN, ammonia-N, nitrite nitrate N and nitrate N. TN includes organic N (e.g. algal bound) and inorganic N (ammonia, nitrate and nitrate). Minnesota (and many other states) typically measure TKN, which includes organic-N and ammonia N, and then add nitrate-N to yield TN. A comparison of “calculated” to “measured” TN was conducted in the methods section of this report and a good relationship was established among these two measures, which indicated we could combine the EPA TN measures with the MDH TKN (plus nitrate-N) measures.
Trophic categories for TN were estimated based on groupings offered by Vollenweider and others. A majority of TN is in the organic (algal-bound) form and in general TN increases in a NE to SW pattern (Figure 24). About 75% of the NF region lakes had low TN (<1.0 mg/L) and are considered oligotrophic-mesotrophic. In contrast, over 90% of the GP region lakes are above this level and are considered eutrophic to hypereutrophic based on TN. The very high TN in the GP lakes is consistent with the high TP (Figure 19) and high Chl-a (Figure 20) measured in these lakes as well.
Nitrate-N is dissolved and is readily used by algae and macrophytes. Consistent with our ecoregion-based assessments (Table 3) nitrate-N is typically at or below detection. Differing detection limits for the EPA (RL=0.002 mg/L) and MDH (RL=0.05 mg/L) make it difficult to combine the two datasets. However, based on an inspection of the data, of the 100 MDH measures only one was above the 0.05 mg/L RL (High Island Lake in GP ecoregion, 0.96 mg/L). Based on the EPA data, only two lakes were >0.05 mg/L (Unnamed Pool in GP ecoregion: 0.236 mg/L and Cokato Lake, EF ecoregion: 2.8 mg/L). Cokato Lake is a former NES and point-source impacted lake; however the discharge was diverted from the lake in the late 1970’s so that would not account for this extremely high nitrate-N value. Overall, the NLA data reaffirm that nitrate-N is very low in Minnesota lakes, with over 95% below 0.05 mg/L.
Ammonia-N is infrequently measured in Minnesota lakes. Similar to nitrate-N, report limits varied among the EPA (RL=0.002 mg/L) and MDH (0.05 mg/L) labs. Of the 100 samples analyzed at MDH, only 7 exceeded 0.05 mg/L. Of these, the highest measures were: 1.44 mg/L High Island Lake (GP), 1.39 mg/L Thielke Lake (GP), 0.3 mg/L South Walnut (GP), and 0.14 mg/L Unnamed Lake (EF). All other reportable measures were near the RL. Of the lakes analyzed by the EPA lab, only three exceeded 0.05 mg/L: 0.892 mg/L Lindgren Lake (GP), 0.329 mg/L Unnamed Pool (GP), 0.242 mg/L Richey Lake (NF). Based on the NLA data, ammonia-N levels are very low in Minnesota lakes with over 90% <0.05 mg/L.
TN: TP ratios have been used as a means for estimating which nutrient may be limiting algal production and provides a relative comparison among TP and TN supply. Ratios <10:1 (concentration-based) indicate potential for “N-limitation” while >17:1 indicates the potential for “P-limitation.” Ratios in between suggest that either P or N could be limiting. Minnesota’s lakes are strongly P-limited with 78% >17:1 and 7% less than 10:1). P limitation is most frequent in the NF ecoregion (85%) and least in the GP ecoregion (60%). While N-limitation occurs at a low frequency overall in the NLA data, it occurred most frequently in the EF ecoregion (Figure 25).
National Lakes Assessment 2012 • January 2016 Minnesota Pollution Control Agency
31
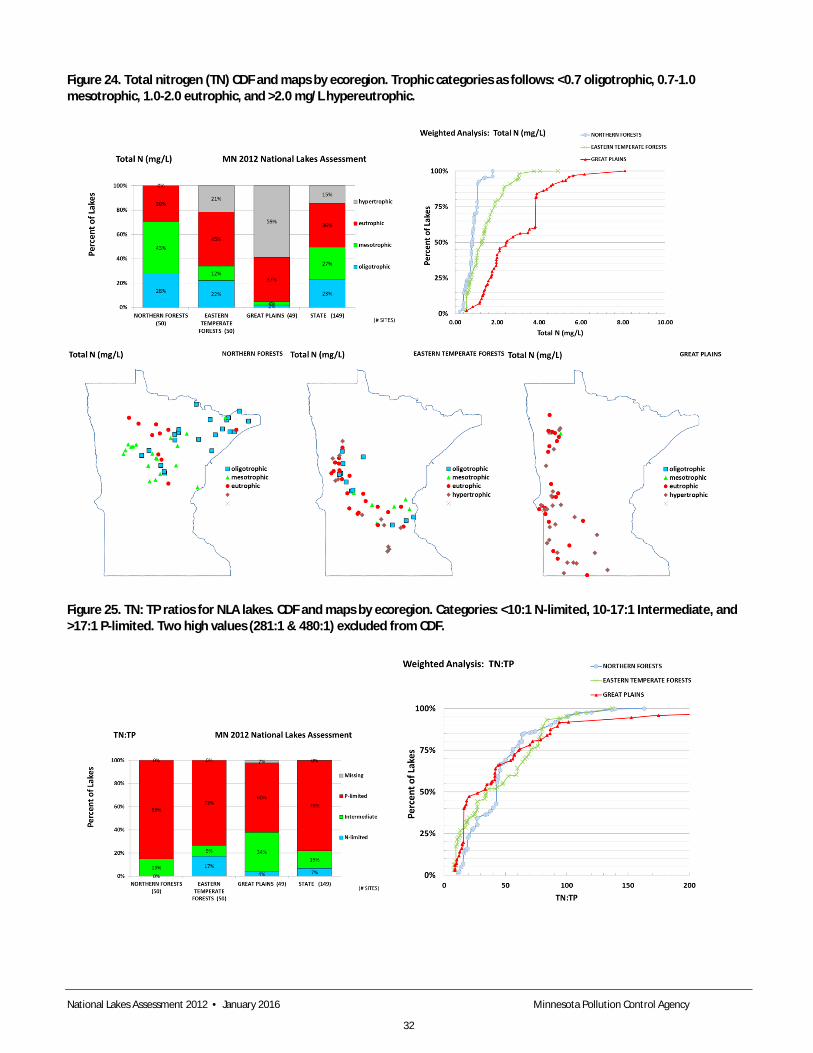
Figure 24. Total nitrogen (TN) CDF and maps by ecoregion. Trophic categories as follows: <0.7 oligotrophic, 0.7-1.0 mesotrophic, 1.0-2.0 eutrophic, and >2.0 mg/L hypereutrophic.
Figure 25. TN: TP ratios for NLA lakes. CDF and maps by ecoregion. Categories: <10:1 N-limited, 10-17:1 Intermediate, and >17:1 P-limited. Two high values (281:1 & 480:1) excluded from CDF.
National Lakes Assessment 2012 • January 2016 Minnesota Pollution Control Agency
32
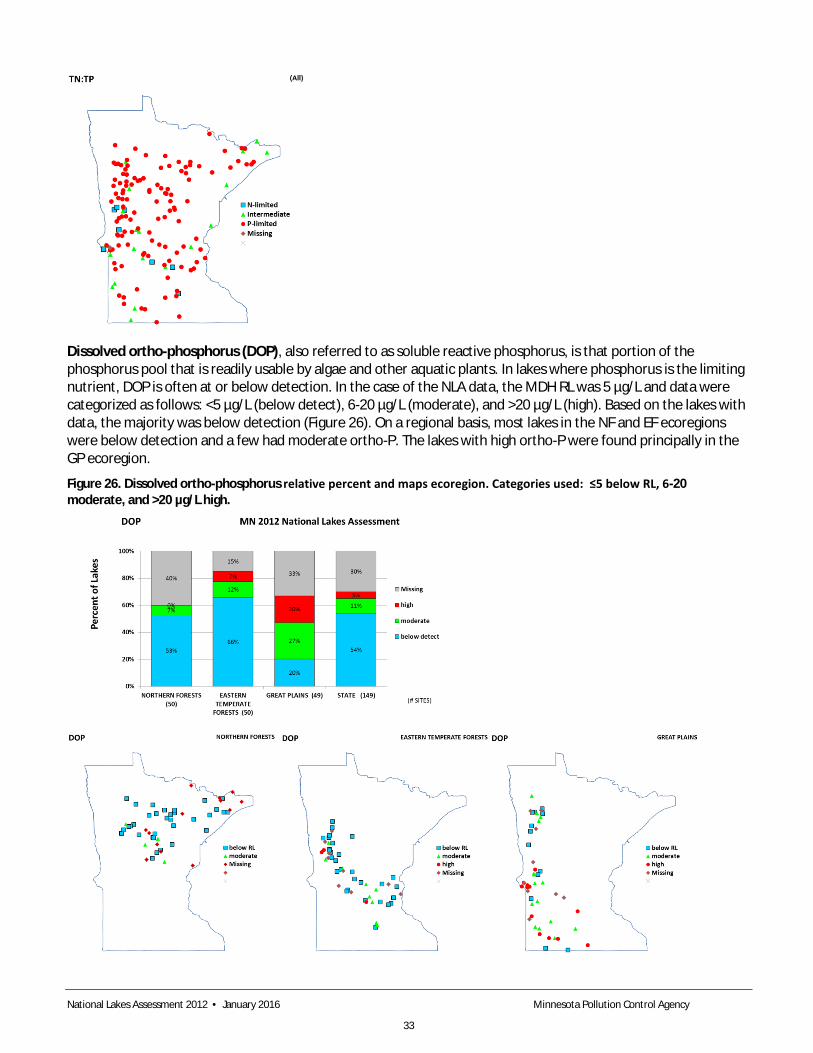
Dissolved ortho-phosphorus (DOP), also referred to as soluble reactive phosphorus, is that portion of the phosphorus pool that is readily usable by algae and other aquatic plants. In lakes where phosphorus is the limiting nutrient, DOP is often at or below detection. In the case of the NLA data, the MDH RL was 5 µg/L and data were categorized as follows: <5 µg/L (below detect), 6-20 µg/L (moderate), and >20 µg/L (high). Based on the lakes with data, the majority was below detection (Figure 26). On a regional basis, most lakes in the NF and EF ecoregions were below detection and a few had moderate ortho-P. The lakes with high ortho-P were found principally in the GP ecoregion.
Figure 26. Dissolved ortho-phosphorus relative percent and maps ecoregion. Categories used: ≤5 below RL, 6-20 moderate, and >20 µg/L high.
National Lakes Assessment 2012 • January 2016 Minnesota Pollution Control Agency
33
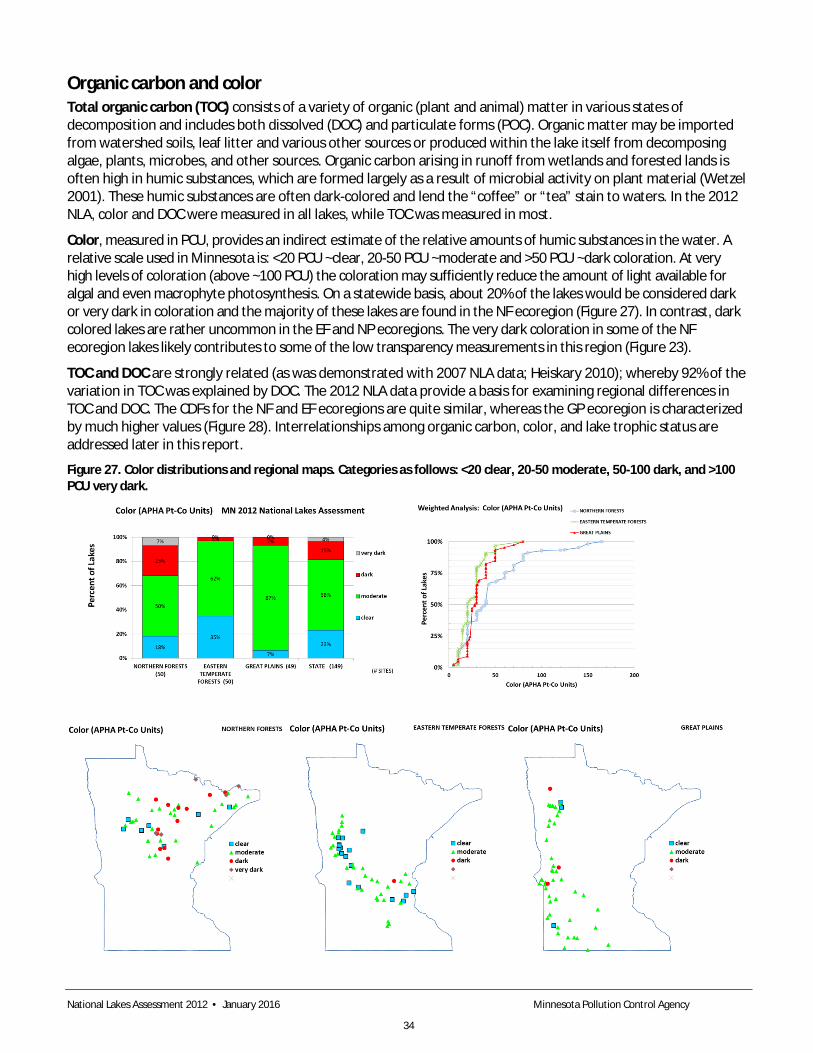
Organic carbon and color Total organic carbon (TOC) consists of a variety of organic (plant and animal) matter in various states of decomposition and includes both dissolved (DOC) and particulate forms (POC). Organic matter may be imported from watershed soils, leaf litter and various other sources or produced within the lake itself from decomposing algae, plants, microbes, and other sources. Organic carbon arising in runoff from wetlands and forested lands is often high in humic substances, which are formed largely as a result of microbial activity on plant material (Wetzel 2001). These humic substances are often dark-colored and lend the “coffee” or “tea” stain to waters. In the 2012 NLA, color and DOC were measured in all lakes, while TOC was measured in most.
Color, measured in PCU, provides an indirect estimate of the relative amounts of humic substances in the water. A relative scale used in Minnesota is: <20 PCU ~clear, 20-50 PCU ~moderate and >50 PCU ~dark coloration. At very high levels of coloration (above ~100 PCU) the coloration may sufficiently reduce the amount of light available for algal and even macrophyte photosynthesis. On a statewide basis, about 20% of the lakes would be considered dark or very dark in coloration and the majority of these lakes are found in the NF ecoregion (Figure 27). In contrast, dark colored lakes are rather uncommon in the EF and NP ecoregions. The very dark coloration in some of the NF ecoregion lakes likely contributes to some of the low transparency measurements in this region (Figure 23).
TOC and DOC are strongly related (as was demonstrated with 2007 NLA data; Heiskary 2010); whereby 92% of the variation in TOC was explained by DOC. The 2012 NLA data provide a basis for examining regional differences in TOC and DOC. The CDFs for the NF and EF ecoregions are quite similar, whereas the GP ecoregion is characterized by much higher values (Figure 28). Interrelationships among organic carbon, color, and lake trophic status are addressed later in this report.
Figure 27. Color distributions and regional maps. Categories as follows: <20 clear, 20-50 moderate, 50-100 dark, and >100 PCU very dark.
National Lakes Assessment 2012 • January 2016 Minnesota Pollution Control Agency
34
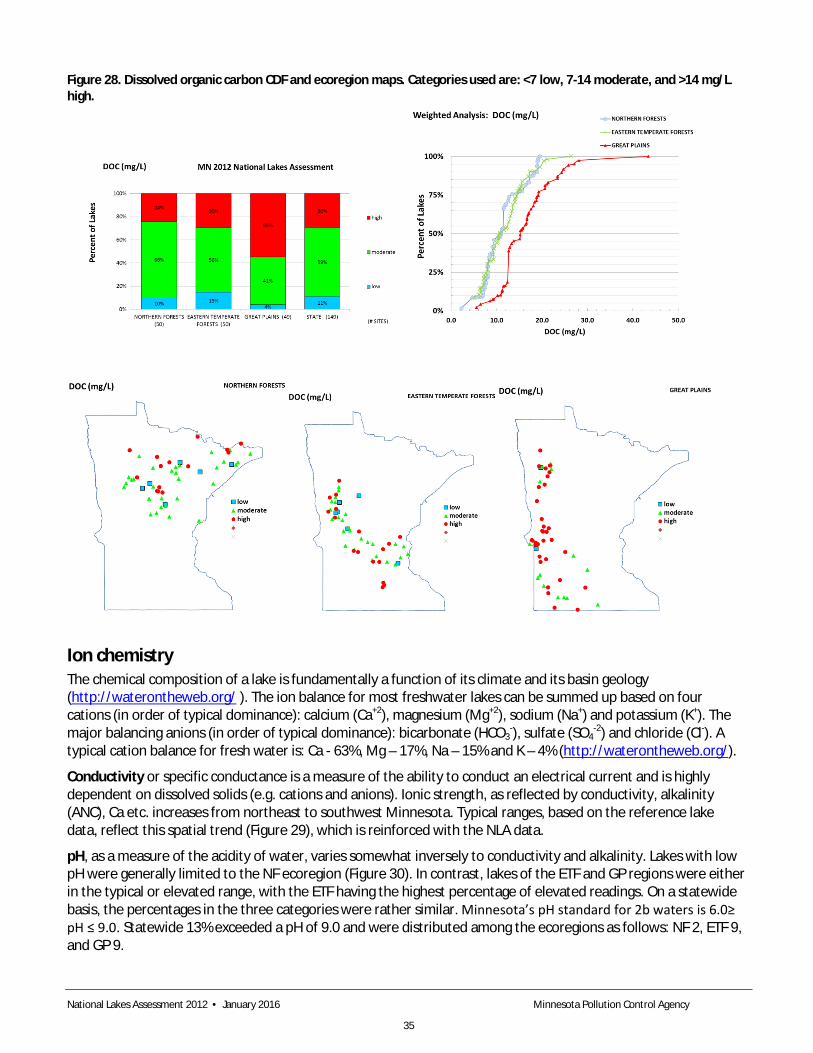
Figure 28. Dissolved organic carbon CDF and ecoregion maps. Categories used are: <7 low, 7-14 moderate, and >14 mg/L high.
Ion chemistry The chemical composition of a lake is fundamentally a function of its climate and its basin geology (http://waterontheweb.org/ ). The ion balance for most freshwater lakes can be summed up based on four cations (in order of typical dominance): calcium (Ca+2), magnesium (Mg+2), sodium (Na+) and potassium (K+). The major balancing anions (in order of typical dominance): bicarbonate (HCO3
-), sulfate (SO4-2) and chloride (Cl-). A
typical cation balance for fresh water is: Ca - 63%, Mg – 17%, Na – 15% and K – 4% (http://waterontheweb.org/).
Conductivity or specific conductance is a measure of the ability to conduct an electrical current and is highly dependent on dissolved solids (e.g. cations and anions). Ionic strength, as reflected by conductivity, alkalinity (ANC), Ca etc. increases from northeast to southwest Minnesota. Typical ranges, based on the reference lake data, reflect this spatial trend (Figure 29), which is reinforced with the NLA data.
pH, as a measure of the acidity of water, varies somewhat inversely to conductivity and alkalinity. Lakes with low pH were generally limited to the NF ecoregion (Figure 30). In contrast, lakes of the ETF and GP regions were either in the typical or elevated range, with the ETF having the highest percentage of elevated readings. On a statewide basis, the percentages in the three categories were rather similar. Minnesota’s pH standard for 2b waters is 6.0≥ pH ≤ 9.0. Statewide 13% exceeded a pH of 9.0 and were distributed among the ecoregions as follows: NF 2, ETF 9, and GP 9.
National Lakes Assessment 2012 • January 2016 Minnesota Pollution Control Agency
35

Calcium (Ca) and magnesium (Mg) are the dominant cations in Minnesota lakes and are equally dominant on average. Calcium influences growth and population dynamics of freshwater flora and fauna and is considered a dynamic ion (Wetzel 2001). Freshwater organism distribution has been often associated with Ca, with Ca-poor waters (<10 mg/L) and hard waters (>20 mg/L) often being referenced. Recent discussions concerning the expansion of zebra mussels in Minnesota lakes have suggested that the mussels may not prosper in low Ca waters, with a level of ~10 mg/L mentioned as an important threshold. Whittier et al. (2008) suggest Ca <12 mg/L as very low risk of invasion, 12-20 mg/L as low, 20-28 mg/L moderate, and >28 mg/L as high based on an analysis of 300 river and stream sites. On a statewide basis, about 28% of Minnesota’s lakes would be considered Ca “poor (low)” (Ca <10 mg/L) and about 54% “hardwater” based on Wetzel (2001) and Moyle (1946) classifications. The low Ca lakes are generally limited to the NF ecoregion, with concentrations increasing across the EF ecoregion (Figure 31). The GP ecoregion is dominated by hardwater lakes. Based on a conservative value of 10 mg/L the calcium-based risk of zebra mussel expansion is very low to low over 67% of the NF region lakes; however the risk increases markedly across the ETF and NP ecoregions (Figure 31).
Magnesium, in contrast, is relatively conservative and undergoes relatively minor changes from biotic utilization (Wetzel 2001). Mg is essential for chlorophyll-bearing plants and algae but Mg demand is often minor compared to its general availability (Wetzel 2001 Mg exhibits a similar pattern with 68% of the NF lakes exhibiting low Mg and 86% of GP ecoregion high Mg (Figure 32). On a statewide basis, 40% of Minnesota’s lakes are considered low in Mg. The increasing significance of Mg as the major cation increases from the NF ecoregion to the GP ecoregion.
Sodium (Na) and potassium (K) are relatively low in most Minnesota lakes as compared to the Ca and Mg (Table 2). Both increase in a NE to SW pattern (Figure 33 Figure 34). Na has been noted to be important for blue-green algal growth with reference to 4 mg/L as required for near optimal growth in several species and maximal growth at concentrations up to 40 mg/L (Wetzel 2001). Over 61% of Minnesota’s lakes have Na <4.0 mg/L, below a level suggested as being “optimal” for blue-green growth (Figure 33). The vast majority of lakes with low Na are in the NF or EF ecoregions. Lakes with high Na that are “outliers” from the “regional pattern” are either point-source impacted (e.g. South) or have highly urbanized watersheds (Snail, Nokomis and Edina). In most instances, elevated Na is balanced by elevated Cl. K is low over 70% of the NF lakes in contrast to the GP lakes where 80% are considered high (Figure 34). The highest recorded K for each region was: 2.4 mg/L in the NF (Waymier), 23.8 mg/L in the EF (Glorvigan), and 29.0 mg/L in the GP (Cucumber).
Silica (Si) is moderately abundant in freshwater and is used by diatoms, Chrysophytes, and higher plants (Wetzel 2001). Diatoms commonly grow abundantly in Si-rich waters in the spring and it is often a shortage of Si that eventually contributes to a crash in the diatoms in late spring in Minnesota lakes. While there is an increasing Si gradient from northeast to southwest Minnesota, it is not quite as marked as with the other cations (Figure 35) and all three regions have lakes in all three classes. The highest values found for each region are: 23 mg/L NF (Spring), 32 mg/L EF (Krueger’s Slough), and 47 mg/L GP (North Ash).
National Lakes Assessment 2012 • January 2016 Minnesota Pollution Control Agency
36
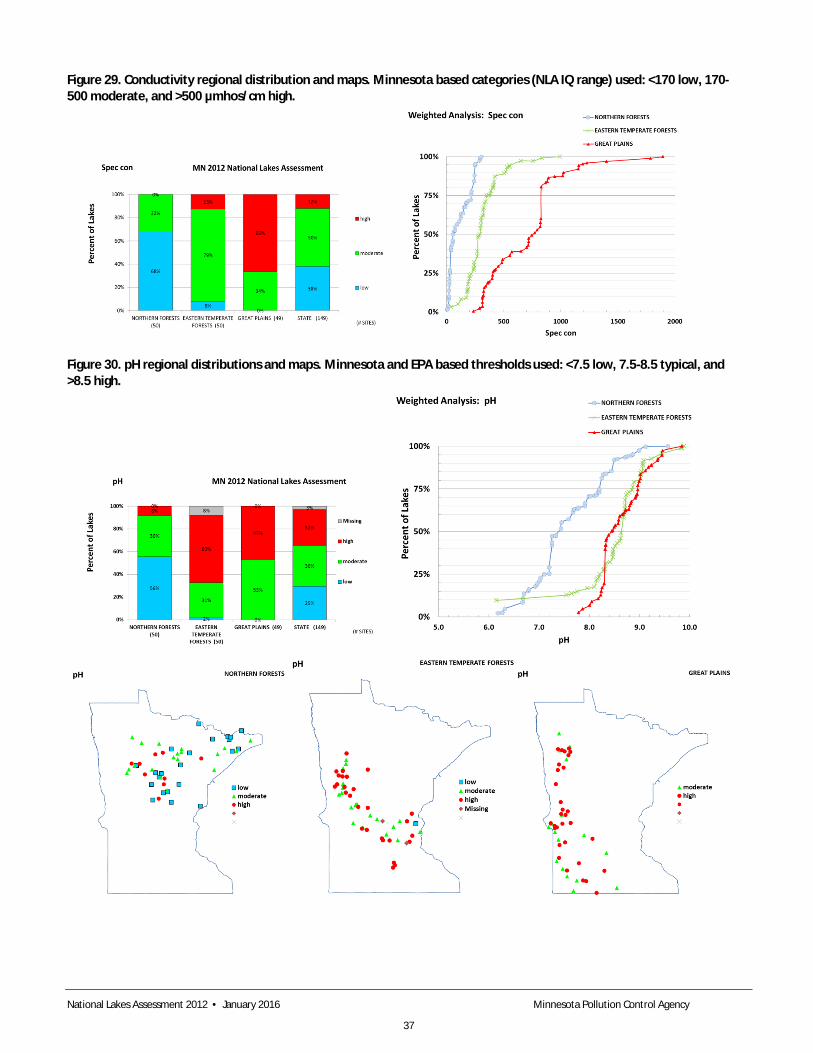
Figure 29. Conductivity regional distribution and maps. Minnesota based categories (NLA IQ range) used: <170 low, 170-500 moderate, and >500 µmhos/cm high.
Figure 30. pH regional distributions and maps. Minnesota and EPA based thresholds used: <7.5 low, 7.5-8.5 typical, and >8.5 high.
National Lakes Assessment 2012 • January 2016 Minnesota Pollution Control Agency
37

Figure 31. Calcium regional distributions and maps. Minnesota-based categories used: <10 low (soft), 10-20 moderate, and >20 mg/L high.
Figure 32. Magnesium regional distributions and maps. EPA-proposed categories used: <7 low, 7-27 moderate, >27 mg/L high.
National Lakes Assessment 2012 • January 2016 Minnesota Pollution Control Agency
38
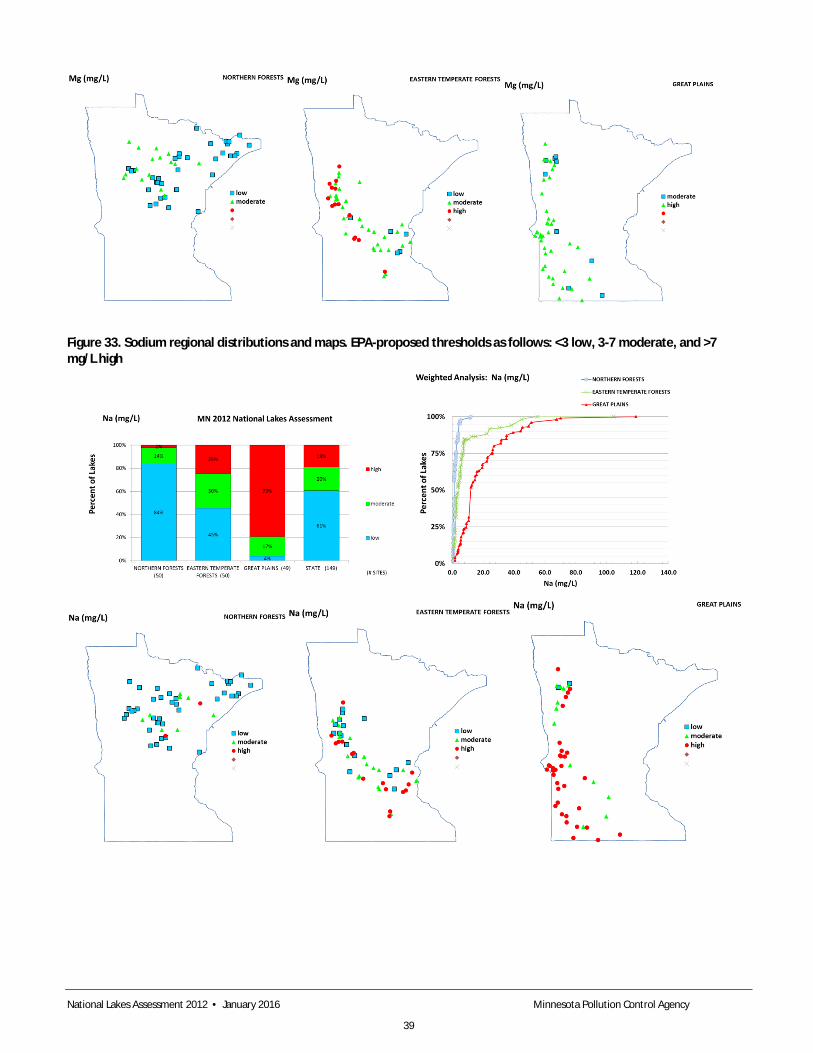
Figure 33. Sodium regional distributions and maps. EPA-proposed thresholds as follows: <3 low, 3-7 moderate, and >7 mg/L high
National Lakes Assessment 2012 • January 2016 Minnesota Pollution Control Agency
39
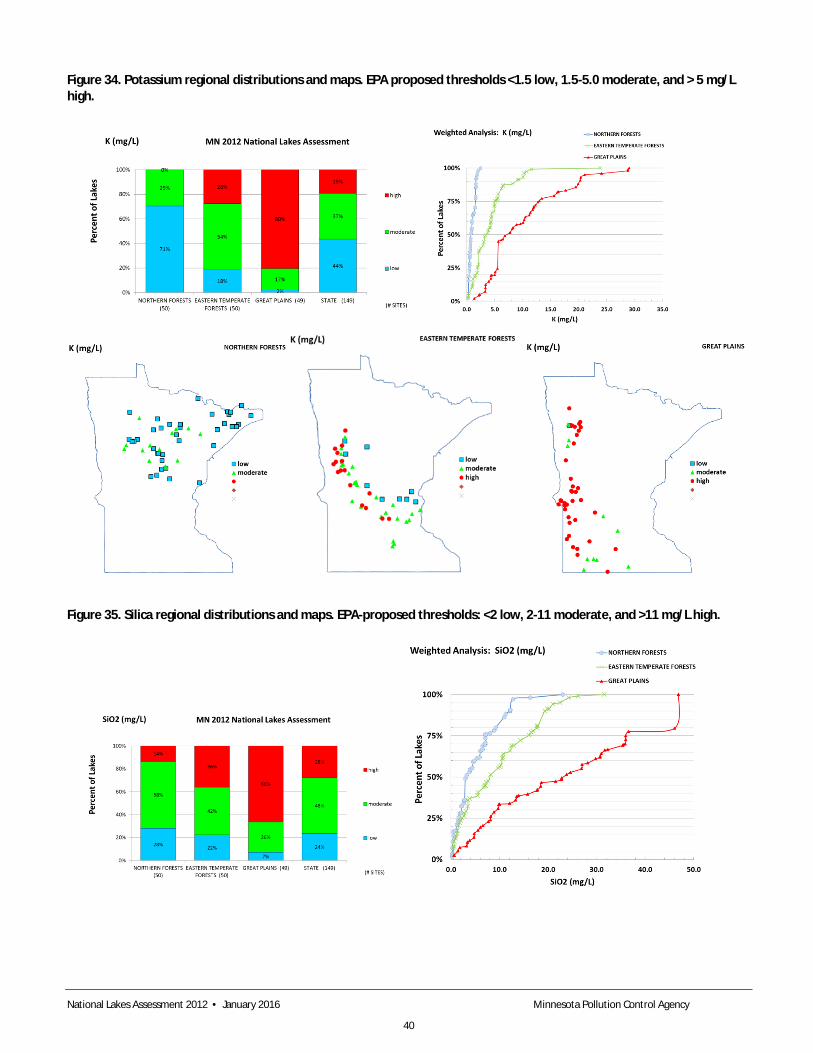
Figure 34. Potassium regional distributions and maps. EPA proposed thresholds <1.5 low, 1.5-5.0 moderate, and > 5 mg/L high.
Figure 35. Silica regional distributions and maps. EPA-proposed thresholds: <2 low, 2-11 moderate, and >11 mg/L high.
National Lakes Assessment 2012 • January 2016 Minnesota Pollution Control Agency
40
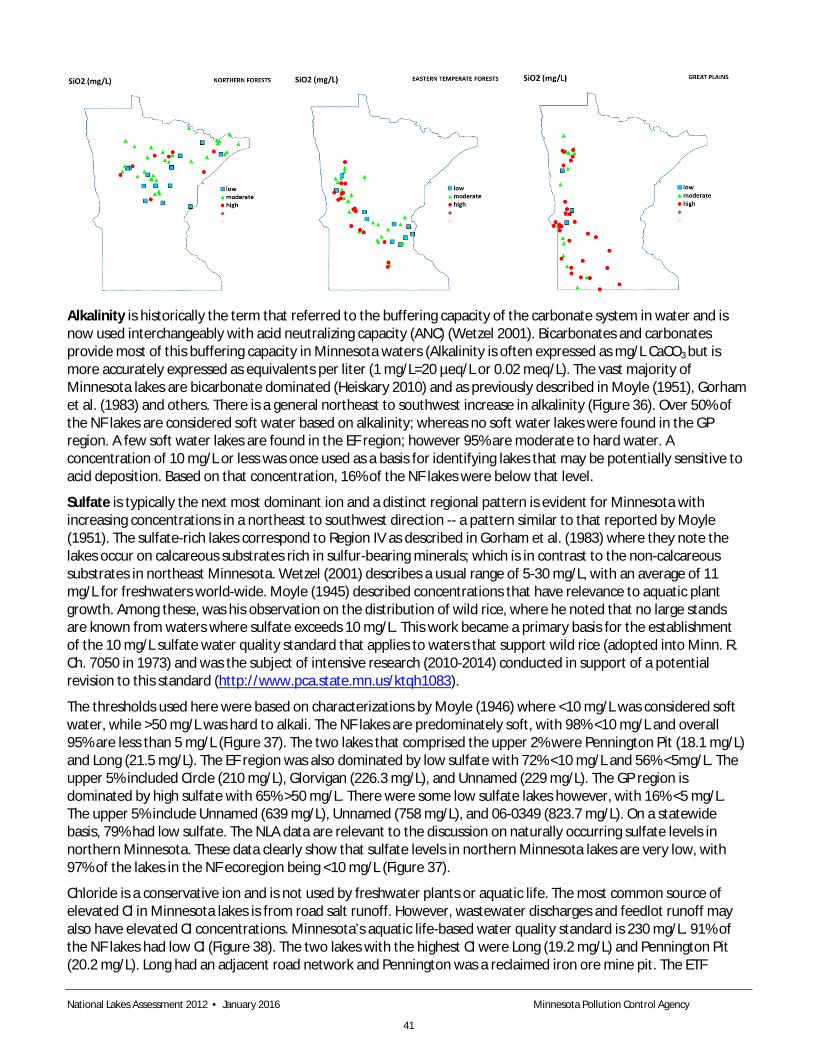
Alkalinity is historically the term that referred to the buffering capacity of the carbonate system in water and is now used interchangeably with acid neutralizing capacity (ANC) (Wetzel 2001). Bicarbonates and carbonates provide most of this buffering capacity in Minnesota waters (Alkalinity is often expressed as mg/L CaCO3
but is more accurately expressed as equivalents per liter (1 mg/L=20 µeq/L or 0.02 meq/L). The vast majority of Minnesota lakes are bicarbonate dominated (Heiskary 2010) and as previously described in Moyle (1951), Gorham et al. (1983) and others. There is a general northeast to southwest increase in alkalinity (Figure 36). Over 50% of the NF lakes are considered soft water based on alkalinity; whereas no soft water lakes were found in the GP region. A few soft water lakes are found in the EF region; however 95% are moderate to hard water. A concentration of 10 mg/L or less was once used as a basis for identifying lakes that may be potentially sensitive to acid deposition. Based on that concentration, 16% of the NF lakes were below that level.
Sulfate is typically the next most dominant ion and a distinct regional pattern is evident for Minnesota with increasing concentrations in a northeast to southwest direction -- a pattern similar to that reported by Moyle (1951). The sulfate-rich lakes correspond to Region IV as described in Gorham et al. (1983) where they note the lakes occur on calcareous substrates rich in sulfur-bearing minerals; which is in contrast to the non-calcareous substrates in northeast Minnesota. Wetzel (2001) describes a usual range of 5-30 mg/L, with an average of 11 mg/L for freshwaters world-wide. Moyle (1945) described concentrations that have relevance to aquatic plant growth. Among these, was his observation on the distribution of wild rice, where he noted that no large stands are known from waters where sulfate exceeds 10 mg/L. This work became a primary basis for the establishment of the 10 mg/L sulfate water quality standard that applies to waters that support wild rice (adopted into Minn. R. Ch. 7050 in 1973) and was the subject of intensive research (2010-2014) conducted in support of a potential revision to this standard (http://www.pca.state.mn.us/ktqh1083).
The thresholds used here were based on characterizations by Moyle (1946) where <10 mg/L was considered soft water, while >50 mg/L was hard to alkali. The NF lakes are predominately soft, with 98% <10 mg/L and overall 95% are less than 5 mg/L (Figure 37). The two lakes that comprised the upper 2% were Pennington Pit (18.1 mg/L) and Long (21.5 mg/L). The EF region was also dominated by low sulfate with 72% <10 mg/L and 56% <5mg/L. The upper 5% included Circle (210 mg/L), Glorvigan (226.3 mg/L), and Unnamed (229 mg/L). The GP region is dominated by high sulfate with 65% >50 mg/L. There were some low sulfate lakes however, with 16% <5 mg/L. The upper 5% include Unnamed (639 mg/L), Unnamed (758 mg/L), and 06-0349 (823.7 mg/L). On a statewide basis, 79% had low sulfate. The NLA data are relevant to the discussion on naturally occurring sulfate levels in northern Minnesota. These data clearly show that sulfate levels in northern Minnesota lakes are very low, with 97% of the lakes in the NF ecoregion being <10 mg/L (Figure 37).
Chloride is a conservative ion and is not used by freshwater plants or aquatic life. The most common source of elevated Cl in Minnesota lakes is from road salt runoff. However, wastewater discharges and feedlot runoff may also have elevated Cl concentrations. Minnesota’s aquatic life-based water quality standard is 230 mg/L. 91% of the NF lakes had low Cl (Figure 38). The two lakes with the highest Cl were Long (19.2 mg/L) and Pennington Pit (20.2 mg/L). Long had an adjacent road network and Pennington was a reclaimed iron ore mine pit. The ETF
National Lakes Assessment 2012 • January 2016 Minnesota Pollution Control Agency
41
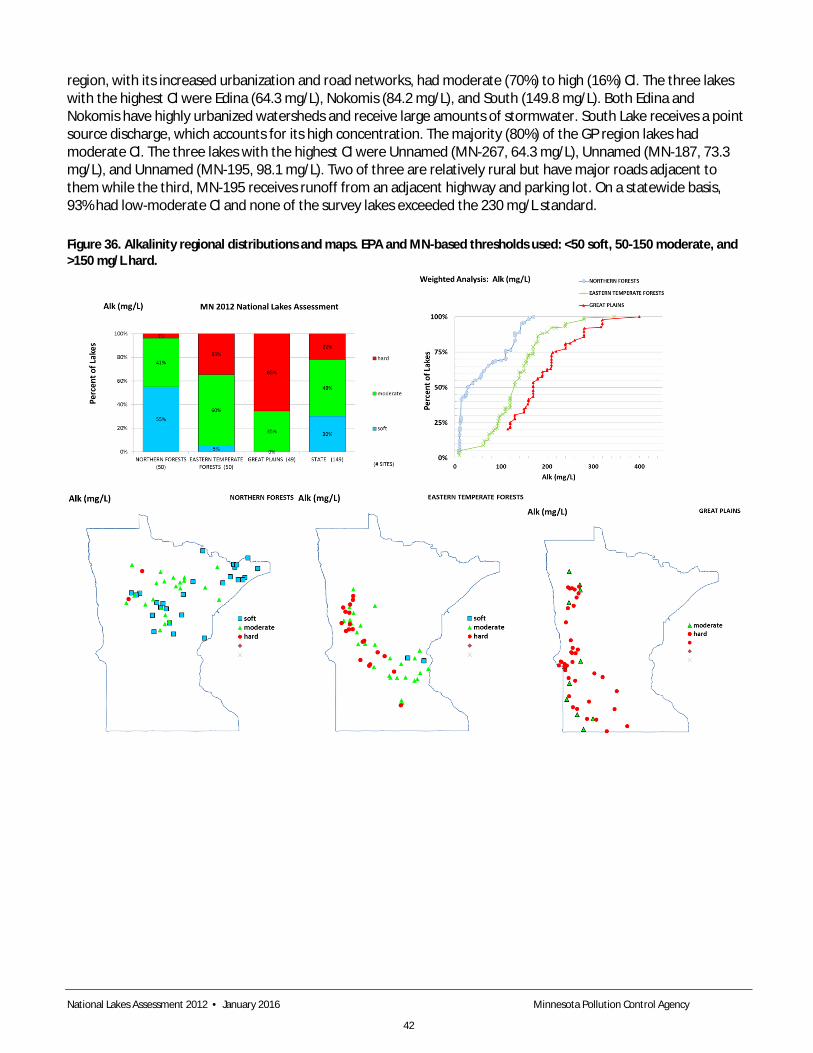
region, with its increased urbanization and road networks, had moderate (70%) to high (16%) Cl. The three lakes with the highest Cl were Edina (64.3 mg/L), Nokomis (84.2 mg/L), and South (149.8 mg/L). Both Edina and Nokomis have highly urbanized watersheds and receive large amounts of stormwater. South Lake receives a point source discharge, which accounts for its high concentration. The majority (80%) of the GP region lakes had moderate Cl. The three lakes with the highest Cl were Unnamed (MN-267, 64.3 mg/L), Unnamed (MN-187, 73.3 mg/L), and Unnamed (MN-195, 98.1 mg/L). Two of three are relatively rural but have major roads adjacent to them while the third, MN-195 receives runoff from an adjacent highway and parking lot. On a statewide basis, 93% had low-moderate Cl and none of the survey lakes exceeded the 230 mg/L standard. Figure 36. Alkalinity regional distributions and maps. EPA and MN-based thresholds used: <50 soft, 50-150 moderate, and >150 mg/L hard.
National Lakes Assessment 2012 • January 2016 Minnesota Pollution Control Agency
42

Figure 37. Sulfate regional distributions and maps. Minnesota-based thresholds: <10 low, 10-50 moderate, and >50 mg/L high. Values below 1 mg/L RL treated as 1 mg/L for this analysis. CDF scaled to 100 mg/L was included to allow for resolution for NF and ETF regions.
National Lakes Assessment 2012 • January 2016 Minnesota Pollution Control Agency
43
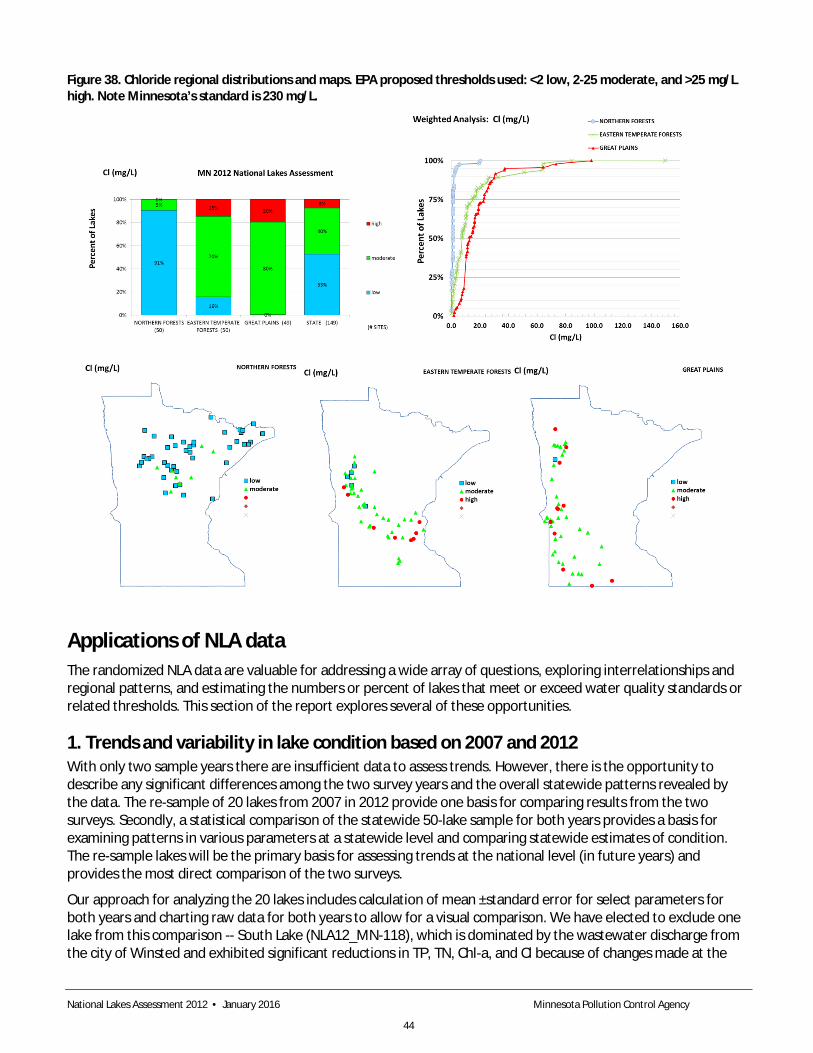
Figure 38. Chloride regional distributions and maps. EPA proposed thresholds used: <2 low, 2-25 moderate, and >25 mg/L high. Note Minnesota’s standard is 230 mg/L.
Applications of NLA data The randomized NLA data are valuable for addressing a wide array of questions, exploring interrelationships and regional patterns, and estimating the numbers or percent of lakes that meet or exceed water quality standards or related thresholds. This section of the report explores several of these opportunities.
1. Trends and variability in lake condition based on 2007 and 2012 With only two sample years there are insufficient data to assess trends. However, there is the opportunity to describe any significant differences among the two survey years and the overall statewide patterns revealed by the data. The re-sample of 20 lakes from 2007 in 2012 provide one basis for comparing results from the two surveys. Secondly, a statistical comparison of the statewide 50-lake sample for both years provides a basis for examining patterns in various parameters at a statewide level and comparing statewide estimates of condition. The re-sample lakes will be the primary basis for assessing trends at the national level (in future years) and provides the most direct comparison of the two surveys.
Our approach for analyzing the 20 lakes includes calculation of mean ±standard error for select parameters for both years and charting raw data for both years to allow for a visual comparison. We have elected to exclude one lake from this comparison -- South Lake (NLA12_MN-118), which is dominated by the wastewater discharge from the city of Winsted and exhibited significant reductions in TP, TN, Chl-a, and Cl because of changes made at the
National Lakes Assessment 2012 • January 2016 Minnesota Pollution Control Agency
44

Winsted Wastewater Treatment Facility. Because of the magnitude of concentrations (e.g., TP [2007] 1,118 µg/L and [2012] 524 µg/L) and small sample size (20 lakes) this one lake skews results and diminishes the resolution of the charts. EPA data is used for all lab-analyzed data comparisons.
In general, there were minimal differences among the means from 2007 as compared to 2012, when considering the standard error of each measurement. TP was higher in 2012 as compared to 2007 (Table 4 Figure 39); however, this difference is most likely because of changes in sample handling. In 2007 samples were not acid-preserved upon collection and TP values were low when compared to paired samples analyzed at MDH. This was found to be the case in other state and EPA data comparisons as well. Given the drought and seemingly high temperatures in summer 2012, we anticipated higher surface water temperatures in 2012 as compared to 2007, but that was not the case (Table 4 ).
Pairing the data in scatterplots provides a basis for observing differences/similarities among the years and variability for individual lakes (Figure 39). In several cases, large changes for a given lake can be explained by when the lakes was sampled. For example, Flat Lake was sampled in August in 2007 and in June in 2012, hence the significant difference in temperature. This would also explain the large difference in Chl-a and Secchi for Jennie Lake which was sampled in August 2007 and June 2012 (Figure 39). Cokato Lake was sampled in August 2007 and June 2012 and had large differences in TP, TN, Chl-a, and Ca between the two dates – with 2012 being much higher than 2007. The very high TN is a direct function of the elevated nitrate-N on that date (2.8 mg/L), which is exceedingly high as nitrate-N is typically at or below 0.01 mg/L in most Minnesota lakes. Sample date does not explain all outliers, however. North Ash Lake was sampled in mid-July in both years and exhibits extremely different TN and Chl-a among the two years. Overall, these comparisons for the 19 re-sampled lakes suggest that while an individual lake may vary in condition among sample visits and years, the overall “population” of values was quite comparable among the two time periods.
Table 4. Comparison of un-weighted mean concentrations for 2012 re-sample lakes based on EPA data. N=19 lakes.
Parameter 2007 mean (±std. err)
2012 mean (±std. err)
Temperature C 24.2 (0.1) 23.6 (0.2)
pH 8.5 (0.0) 8.3 (0.0)
Conductivity µmhos/cm 268 (9) 285 (9)
Total phosphorus µg/L 53 (3) 63 (3)
Chlorophyll-a µg/L 24.4 (1.7) 29.9 (2.6)
Total Nitrogen mg/L 1.19 (0.05) 1.30 (0.06)
Secchi m 1.6 (0.1) 2.2 (0.1)
Calcium mg/L 27.7 (1.3) 25.2 (0.9)
Magnesium mg/L 18.5 (0.9) 16.9 (0.7)
Sodium mg/L 9.4 (0.7) 9.8 (0.7)
Potassium mg/L 2.8 (0.1) 2.7 (0.1)
Silica mg/L 10.2 (0.4) 12.7 (0.5)
Chloride mg/L 17.0 (1.1) 15.9 (1.1)
Sulfate mg/L 29.3 (4.5) 21.8 (3.2)
National Lakes Assessment 2012 • January 2016 Minnesota Pollution Control Agency
45

Figure 39. Comparison of 2007 and 2012 measurements for select parameters. 1:1 line included for visual comparison. Charts scaled to allow resolution for majority of data.
National Lakes Assessment 2012 • January 2016 Minnesota Pollution Control Agency
46
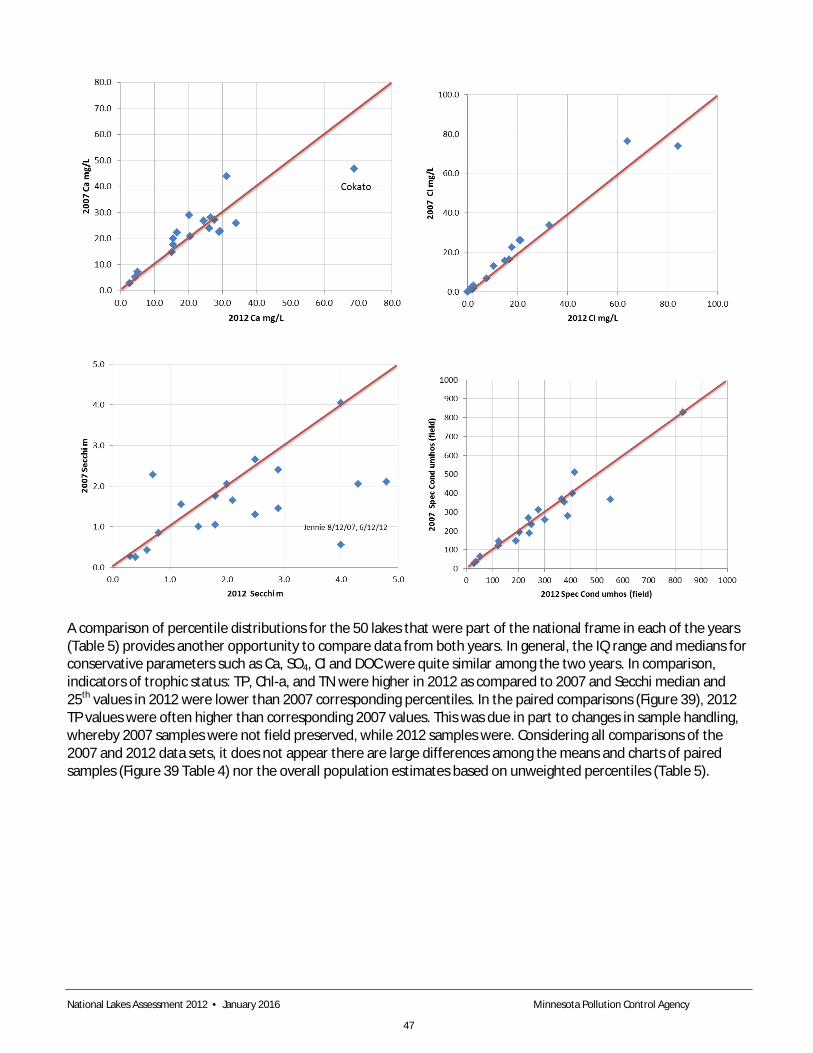
A comparison of percentile distributions for the 50 lakes that were part of the national frame in each of the years (Table 5) provides another opportunity to compare data from both years. In general, the IQ range and medians for conservative parameters such as Ca, SO4, Cl and DOC were quite similar among the two years. In comparison, indicators of trophic status: TP, Chl-a, and TN were higher in 2012 as compared to 2007 and Secchi median and 25th values in 2012 were lower than 2007 corresponding percentiles. In the paired comparisons (Figure 39), 2012 TP values were often higher than corresponding 2007 values. This was due in part to changes in sample handling, whereby 2007 samples were not field preserved, while 2012 samples were. Considering all comparisons of the 2007 and 2012 data sets, it does not appear there are large differences among the means and charts of paired samples (Figure 39 Table 4) nor the overall population estimates based on unweighted percentiles (Table 5).
National Lakes Assessment 2012 • January 2016 Minnesota Pollution Control Agency
47

Table 5. Comparison of unweighted percentile distributions of select parameters from 2007 and 2012 MN NLA. Based on 50 lakes that were part of the national frame in each year. All analysis by EPA lab.
% tiles & # lakes.
2007 TP
2012 TP
2007 Chl-a
2012 Chl-a
2007 TN
2012 TN
2007 Secchi
2012 Secchi
N 50 51 45 51 50 51 50 50 10th 7 22 2.9 2.9 0.39 0.52 0.4 0.3 25th 12 29 5.1 4.5 0.50 0.66 0.9 0.5 50th 20 45 7.6 12.2 0.77 0.90 1.7 1.3 75th 65 102 21.3 41.3 1.34 1.82 2.4 2.5 90th 198 236 73.4 92.8 2.43 3.84 3.9 3.6 2007
Ca 2012 Ca
2007 SO4
2012 SO4
2007 Cl
2012 Cl
2007 DOC 2012 DOC
N 50 51 50 51 50 50 50 51 10th 4.1 3.3 1.1 0.0 0.3 0.2 5.3 6.4 25th 15.4 14.5 2.0 0.3 1.6 1.0 6.8 7.8 50th 24.7 22.0 5.6 3.0 6.4 7.6 8.8 9.4 75th 31.6 30.1 13.4 12.5 21.5 12.7 12.8 15.2 90th 44.2 56.5 33.8 214.7 38.1 22.5 16.9 18.3
NES case study - South Lake In 2012, three National Eutrophication Survey (NES) lakes were part of the re-survey: Cokato, Woodcock, and South. Of these, South Lake is most strongly impacted by a WWTF discharge. Recent changes in effluent quality were quite evident in the 2012 data as compared to the 2007 NLA as follows:
TP µg/L TN mg/L Chl-a µg/L Cl mg/L 2007 1,118 15.6 936 338 2012 524 4.9 122 150
In 2007 monthly TP effluent concentrations from the city of Winsted ranged from 2.0-7.0 mg/L and was at 7.0 mg/L in July when the lakes was sampled. Implementation of a 1.0 mg/L P limit was underway in 2012 and effluent concentrations were declining. In 2012, effluent TP ranged from 0.5-4.0 mg/L and was at 1.2 mg/L in June when the lake was sampled. Advanced treatment was more fully on-line by late 2012 and into 2013 when effluent TP was consistently below 1 mg/L. The reduced in-lake TP contributed to lower Chl-a, which accounts, in part for the lower TN. Cl and other anions and cations were all lower in 2012 and are likely a reflection of the changes in wastewater treatment. The continued reduction of TP loading from Winsted ~1,000 kg P/yr. (c2007) to ~200 kg P/yr. (2012) should yield further improvements in the condition of South Lake over time. These improvements will likely be measureable by NLA if South Lake is included in the 2017 survey.
2. Regional patterns, interrelationships, and watershed and lake morphometry as they influence lake condition and chemistry There has been extensive research devoted to describing factors that can influence the condition and chemistry of lakes in Minnesota and elsewhere (e.g. Moyle 1945, Gorham 1983, and Heiskary and Wilson 2008). For example, it has long been recognized that cultivated and urbanized lands export higher amounts of phosphorus and nitrogen, as compared to forest or prairie and “exports” of these constituents are adjusted accordingly in empirical water quality models (e.g. Reckhow and Simpson, 1980). More recently, Cross and Jacobsen (2013) demonstrated that in-lake TP increased steadily as watershed disturbance (defined as % urban + % cultivated) increased and increased significantly above 40% disturbance. Given the extent of data compiled for the 2012 NLA, random nature of lake selection, and regionalized approach this data set provides a unique opportunity to further explore
National Lakes Assessment 2012 • January 2016 Minnesota Pollution Control Agency
48
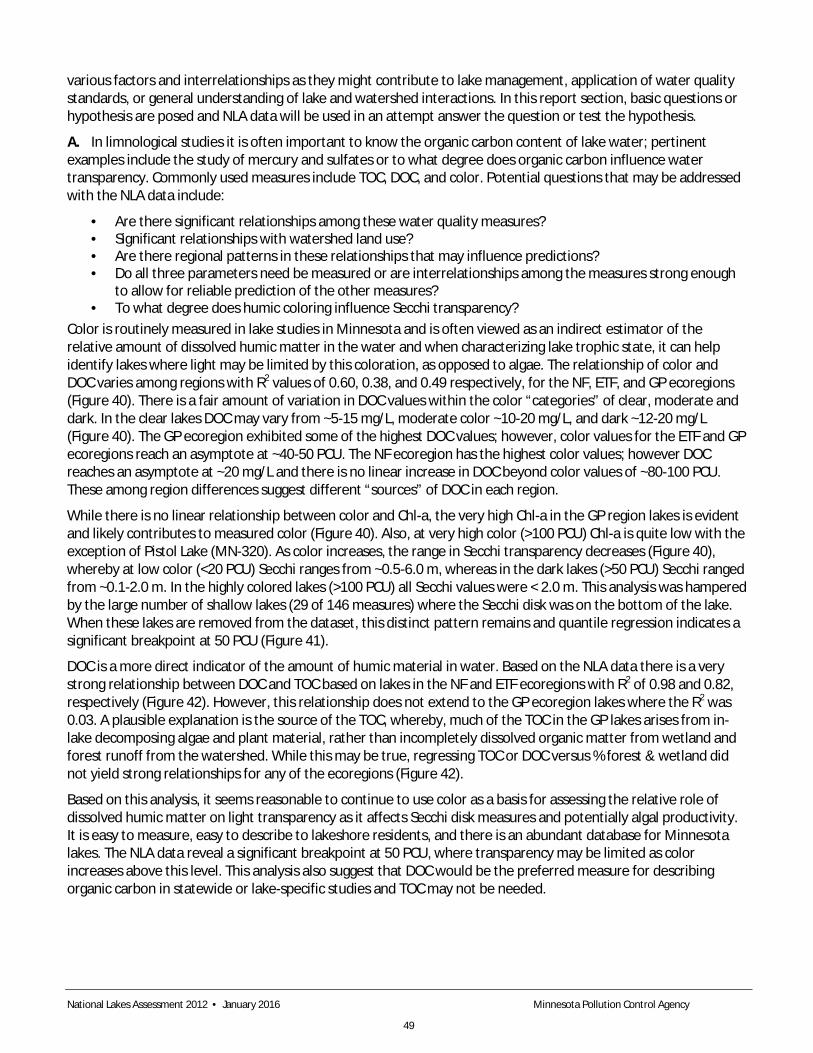
various factors and interrelationships as they might contribute to lake management, application of water quality standards, or general understanding of lake and watershed interactions. In this report section, basic questions or hypothesis are posed and NLA data will be used in an attempt answer the question or test the hypothesis.
A. In limnological studies it is often important to know the organic carbon content of lake water; pertinent examples include the study of mercury and sulfates or to what degree does organic carbon influence water transparency. Commonly used measures include TOC, DOC, and color. Potential questions that may be addressed with the NLA data include:
· Are there significant relationships among these water quality measures? · Significant relationships with watershed land use? · Are there regional patterns in these relationships that may influence predictions? · Do all three parameters need be measured or are interrelationships among the measures strong enough
to allow for reliable prediction of the other measures? · To what degree does humic coloring influence Secchi transparency?
Color is routinely measured in lake studies in Minnesota and is often viewed as an indirect estimator of the relative amount of dissolved humic matter in the water and when characterizing lake trophic state, it can help identify lakes where light may be limited by this coloration, as opposed to algae. The relationship of color and DOC varies among regions with R2 values of 0.60, 0.38, and 0.49 respectively, for the NF, ETF, and GP ecoregions (Figure 40). There is a fair amount of variation in DOC values within the color “categories” of clear, moderate and dark. In the clear lakes DOC may vary from ~5-15 mg/L, moderate color ~10-20 mg/L, and dark ~12-20 mg/L (Figure 40). The GP ecoregion exhibited some of the highest DOC values; however, color values for the ETF and GP ecoregions reach an asymptote at ~40-50 PCU. The NF ecoregion has the highest color values; however DOC reaches an asymptote at ~20 mg/L and there is no linear increase in DOC beyond color values of ~80-100 PCU. These among region differences suggest different “sources” of DOC in each region.
While there is no linear relationship between color and Chl-a, the very high Chl-a in the GP region lakes is evident and likely contributes to measured color (Figure 40). Also, at very high color (>100 PCU) Chl-a is quite low with the exception of Pistol Lake (MN-320). As color increases, the range in Secchi transparency decreases (Figure 40), whereby at low color (<20 PCU) Secchi ranges from ~0.5-6.0 m, whereas in the dark lakes (>50 PCU) Secchi ranged from ~0.1-2.0 m. In the highly colored lakes (>100 PCU) all Secchi values were < 2.0 m. This analysis was hampered by the large number of shallow lakes (29 of 146 measures) where the Secchi disk was on the bottom of the lake. When these lakes are removed from the dataset, this distinct pattern remains and quantile regression indicates a significant breakpoint at 50 PCU (Figure 41).
DOC is a more direct indicator of the amount of humic material in water. Based on the NLA data there is a very strong relationship between DOC and TOC based on lakes in the NF and ETF ecoregions with R2 of 0.98 and 0.82, respectively (Figure 42). However, this relationship does not extend to the GP ecoregion lakes where the R2 was 0.03. A plausible explanation is the source of the TOC, whereby, much of the TOC in the GP lakes arises from in-lake decomposing algae and plant material, rather than incompletely dissolved organic matter from wetland and forest runoff from the watershed. While this may be true, regressing TOC or DOC versus % forest & wetland did not yield strong relationships for any of the ecoregions (Figure 42).
Based on this analysis, it seems reasonable to continue to use color as a basis for assessing the relative role of dissolved humic matter on light transparency as it affects Secchi disk measures and potentially algal productivity. It is easy to measure, easy to describe to lakeshore residents, and there is an abundant database for Minnesota lakes. The NLA data reveal a significant breakpoint at 50 PCU, where transparency may be limited as color increases above this level. This analysis also suggest that DOC would be the preferred measure for describing organic carbon in statewide or lake-specific studies and TOC may not be needed.
National Lakes Assessment 2012 • January 2016 Minnesota Pollution Control Agency
49
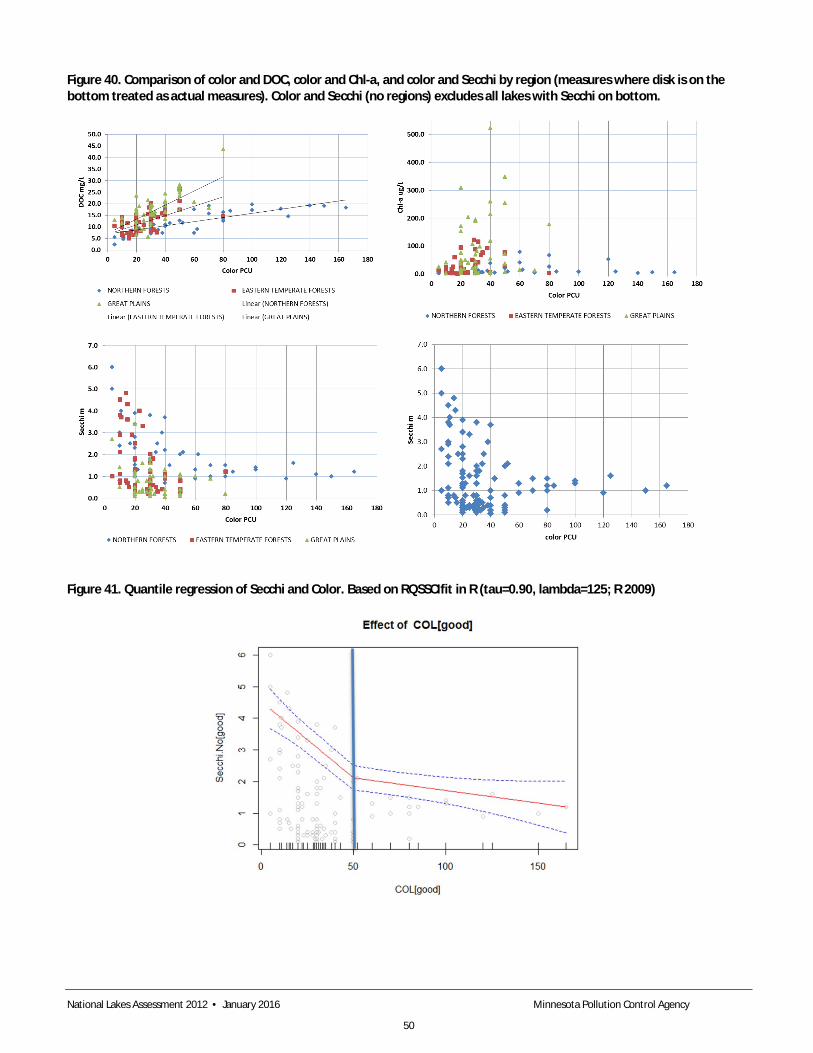
Figure 40. Comparison of color and DOC, color and Chl-a, and color and Secchi by region (measures where disk is on the bottom treated as actual measures). Color and Secchi (no regions) excludes all lakes with Secchi on bottom.
Figure 41. Quantile regression of Secchi and Color. Based on RQSSCIfit in R (tau=0.90, lambda=125; R 2009)
National Lakes Assessment 2012 • January 2016 Minnesota Pollution Control Agency
50

Figure 42. Total organic carbon as a function of a) DOC and b) % forest & wetland. Data sorted by ecoregion.
B. It was challenging to complete sampling of 150 lakes during a single summer season. Sampling was initiated in early June (June 2) and completed by early September (September 5). It also required long sampling days. Relevant questions include:
· Did collecting data across an entire summer create any bias in the data, which might affect subsequent among-region or statewide analysis of the data? Four parameters that often exhibit strong seasonal or diurnal patterns were selected for this analysis: temperature and Chl-a as a function of sample date, and DO and Secchi as a function of time of day.
Lakes from NF and ETF regions were most evenly spread across the index period; whereas, more GP lakes were sampled later in the index period (Figure 43). The warmer temperature of the GP lakes was evident as well and in general, lakes sampled in July or early August were warmer than those in June or later in August (Figure 14) and sample date would influence this measure. Higher Chl-a was common in July through September; however, these elevated values were associated with the nutrient-rich GP lakes. It should also be noted that there were many GP lakes with low Chl-a during late summer and thus it appears timing of sampling may not have had a big among region influence on Chl-a.
Figure 43. Chlorophyll-a as a function of sample date (DATEVALUE function), by ecoregion. Sampling period ran from June 2- September 5, 2012.
National Lakes Assessment 2012 • January 2016 Minnesota Pollution Control Agency
51
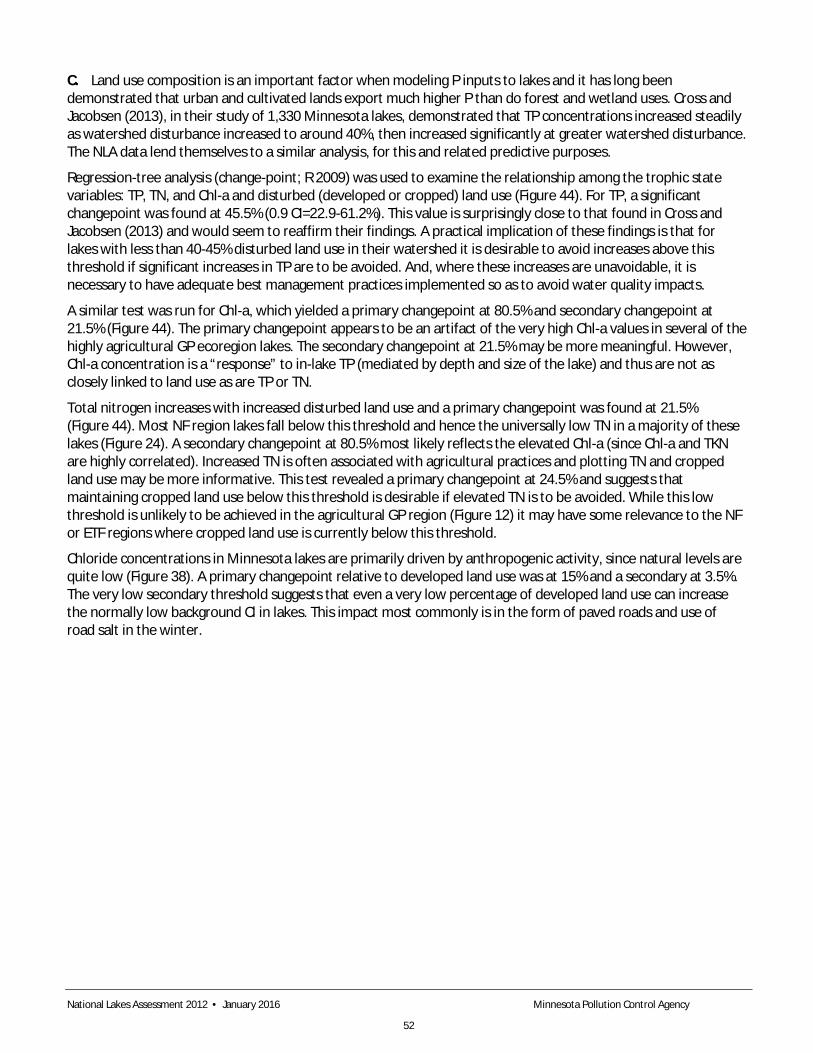
C. Land use composition is an important factor when modeling P inputs to lakes and it has long been demonstrated that urban and cultivated lands export much higher P than do forest and wetland uses. Cross and Jacobsen (2013), in their study of 1,330 Minnesota lakes, demonstrated that TP concentrations increased steadily as watershed disturbance increased to around 40%, then increased significantly at greater watershed disturbance. The NLA data lend themselves to a similar analysis, for this and related predictive purposes.
Regression-tree analysis (change-point; R 2009) was used to examine the relationship among the trophic state variables: TP, TN, and Chl-a and disturbed (developed or cropped) land use (Figure 44). For TP, a significant changepoint was found at 45.5% (0.9 CI=22.9-61.2%). This value is surprisingly close to that found in Cross and Jacobsen (2013) and would seem to reaffirm their findings. A practical implication of these findings is that for lakes with less than 40-45% disturbed land use in their watershed it is desirable to avoid increases above this threshold if significant increases in TP are to be avoided. And, where these increases are unavoidable, it is necessary to have adequate best management practices implemented so as to avoid water quality impacts.
A similar test was run for Chl-a, which yielded a primary changepoint at 80.5% and secondary changepoint at 21.5% (Figure 44). The primary changepoint appears to be an artifact of the very high Chl-a values in several of the highly agricultural GP ecoregion lakes. The secondary changepoint at 21.5% may be more meaningful. However, Chl-a concentration is a “response” to in-lake TP (mediated by depth and size of the lake) and thus are not as closely linked to land use as are TP or TN.
Total nitrogen increases with increased disturbed land use and a primary changepoint was found at 21.5% (Figure 44). Most NF region lakes fall below this threshold and hence the universally low TN in a majority of these lakes (Figure 24). A secondary changepoint at 80.5% most likely reflects the elevated Chl-a (since Chl-a and TKN are highly correlated). Increased TN is often associated with agricultural practices and plotting TN and cropped land use may be more informative. This test revealed a primary changepoint at 24.5% and suggests that maintaining cropped land use below this threshold is desirable if elevated TN is to be avoided. While this low threshold is unlikely to be achieved in the agricultural GP region (Figure 12) it may have some relevance to the NF or ETF regions where cropped land use is currently below this threshold.
Chloride concentrations in Minnesota lakes are primarily driven by anthropogenic activity, since natural levels are quite low (Figure 38). A primary changepoint relative to developed land use was at 15% and a secondary at 3.5%. The very low secondary threshold suggests that even a very low percentage of developed land use can increase the normally low background Cl in lakes. This impact most commonly is in the form of paved roads and use of road salt in the winter.
National Lakes Assessment 2012 • January 2016 Minnesota Pollution Control Agency
52
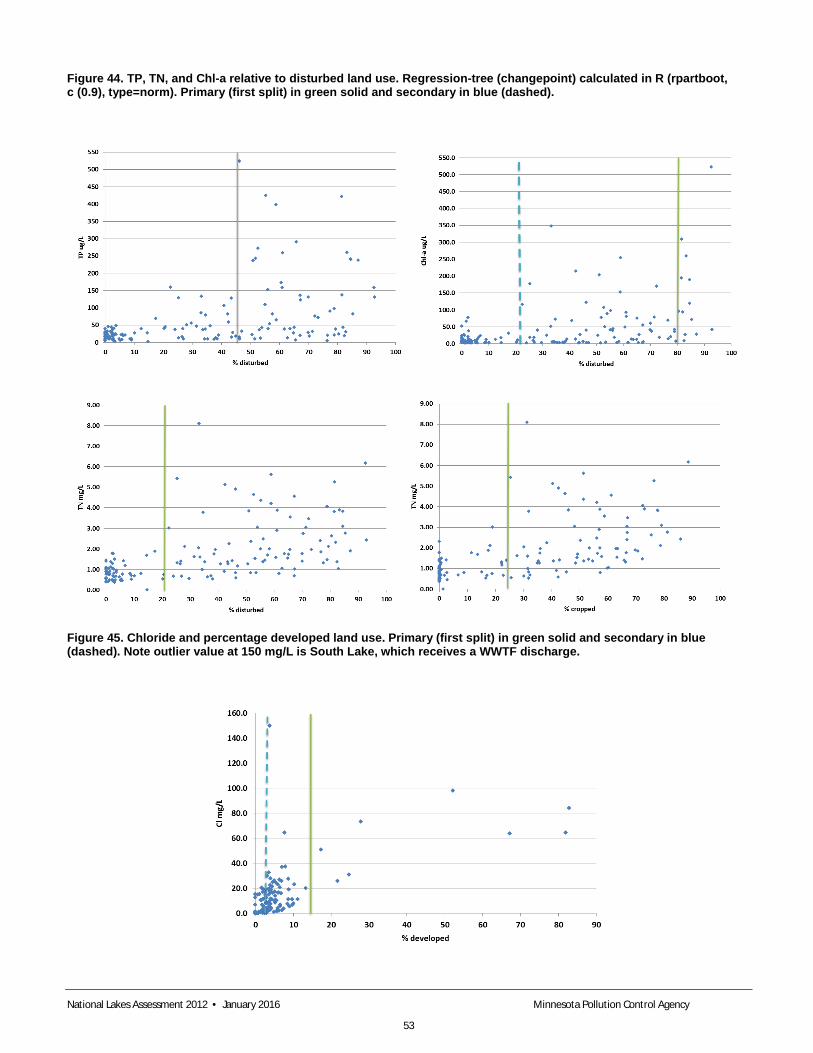
Figure 44. TP, TN, and Chl-a relative to disturbed land use. Regression-tree (changepoint) calculated in R (rpartboot, c (0.9), type=norm). Primary (first split) in green solid and secondary in blue (dashed).
Figure 45. Chloride and percentage developed land use. Primary (first split) in green solid and secondary in blue (dashed). Note outlier value at 150 mg/L is South Lake, which receives a WWTF discharge.
National Lakes Assessment 2012 • January 2016 Minnesota Pollution Control Agency
53

While these are very low levels of Cl (relative to the WQS), they nonetheless, can be considered an initial indicator of anthropogenic impact in lakes. The Center for Watershed Protection (2003) makes reference to a similarly low threshold (using impervious area in their application) of 10% as being a transition from “sensitive” to “impacted” in reference to stream water quality in their Impervious Cover Model.
Summary and conclusions Minnesota’s 2012 NLA effort was led by the Minnesota Pollution Control Agency (MPCA) and Minnesota Department of Natural Resources (MDNR). Numerous other collaborators were engaged in this study as well including the U.S. Forest Service (USFS), Minnesota Department of Agriculture (MDA), and U.S. Geological Survey. The MPCA and MDNR cooperated on initial planning of the survey and conducted a vast majority of the sampling, which took place in July and August for most lakes. USFS staff assisted with the sampling of remote lakes in the Boundary Waters Canoe Area Wilderness (BWCAW) and National Park Service assisted in Voyageurs National Park. The Red Lake Band of the Chippewa and White Earth Band of the Ojibwe provided valuable assistance for lakes that were located on their reservations.
Minnesota received 42 lakes as a part of the original draw of lakes for the national survey and added 8 to allow for state-based assessment. All 50 lakes were sampled in accordance with the national approach and contribute to the national dataset. In addition, Minnesota added 100 lakes to the survey to yield the 50 lakes per aggregated Level 3 ecoregion. This allowed for an ecoregion-based assessment for Minnesota. When a lake was deemed un-sampleable, the next lake on the EPA-provided list was used as a substitute to complete the 50-lake national and state frame. In a few instances in remote areas, nearby lakes of similar size were used to ensure that these lake-rich regions (e.g. BWCAW) were represented in the survey.
The 2012 summer drought impacted lake levels statewide and was a primary reason for survey lakes in the 100-lake ecoregion frame being deemed un-sampleable (Figure 5). Small lakes were most often impacted and many were dry or had < 1m depth. In these instances the next lake on the EPA list (for that ecoregion) was used as a replacement. This was most pronounced in the GP and some nearby replacements were used to ensure that good spatial coverage of the ecoregion was maintained. In the course of the sampling season, this resulted in one GP lake being sampled twice. This oversight was not caught until completion of the sampling and resulted in only 49 separate lakes being sampled for the GP ecoregion.
A primary purpose of this current report was to provide a summary of the water chemistry, lake morphometric, and watershed characteristics for Minnesota’s lakes based on the NLA data collected in summer 2012. It also serves as basis for a subsequent report that focuses on lake condition based on various EPA metrics and thresholds. All reports on the 2012 NLA may be accessed at http://www.pca.state.mn.us/qzqh141c.
The randomized data from the 2012 NLA provide a comprehensive summary of lake and watershed characteristics, water chemistry, and physical measurements for Minnesota lakes. The study design allows for both ecoregion and state-based analysis and comparison and provides a basis for ranking lake condition or characteristics relative to other lakes in its ecoregion or statewide. These data also provide a basis for characterizing interrelationships among water chemistry, lake and watershed characteristics. Some of these reinforce previously identified relationships, while others provide new insights. Example findings are as follows.
National Lakes Assessment: 2012 • January 2016 Minnesota Pollution Control Agency
54

1. One somewhat anecdotal observation from the study, was the widespread impact of drought on shallow lakes; whereby the highest percentage of lakes that were deemed unsampleable in the survey was because of excessively low water levels (<1 m in depth) or basins being completely dry. Small lakes were most affected.
2. Because minimum lake size in the 2012 NLA was 1 ha this resulted in 17% of the 149 lakes in the size class of 1-4 ha. Lakes in this class account for 37% of Minnesota’s 22,581 lakes of 1 ha or more.
3. Dissolved oxygen profiles were taken on all lakes. Of these, 6 had surface DO <5.0 mg/L and of these 5 were in the NF ecoregion and 1 in the GP ecoregion. The NF region had the highest percentage of saturated lakes (49%), while the ETF had the highest percentage of supersaturated lakes (58%). GP ecoregion lakes were predominately supersaturated (49%) or undersaturated (36%). Undersaturation was most common between the hours of 7:30 to 11:30, while supersaturation was most common in the afternoon.
4. pH values ranged from a minimum of 6.2 to maximum of 9.9. 13% of the 149 lakes exceeded the 9.0 pH WQS and were distributed as follows: NF 1, ETF 9, and GP 9. Exceedance of the WQS is often driven by excessive algal productivity.
5. There were distinct regional patterns in the occurrence of nuisance algal blooms (Chl-a >20 µg/L) as follows: NF 15%, ETF 40%, GP 70% and statewide 30%.
6. The blue-green algal toxin MC was measured in all 149 lakes at the pelagic site. Values ranged from <MDL (0.15µg/L) to 8.2 µg/L. There are distinct regional patterns in MC that are somewhat consistent with nuisance algal bloom occurrence. The majority of the lakes in the NF are below the MDL and none are above 1 µg/L. In contrast in the GP region, 32% were below the MDL and 27% were >1 µg/L.
7. Recent discussions concerning the expansion of zebra mussels in Minnesota lakes have suggested that the mussels may not prosper in low Ca waters, with a level of ~10 mg/L mentioned as an important threshold. On a statewide basis, about 28% of Minnesota’s lakes would be considered Ca “poor (low)” (Ca <10 mg/L) and about 54% “hardwater” based on Wetzel (2001) and Moyle (1946) classifications. The low Ca lakes are generally limited to the NF ecoregion, with concentrations increasing across the EF ecoregion (Figure 31). Based on a conservative value of 10 mg/L the calcium-based risk of zebra mussel expansion is very low to low over 68% of the NF region lakes; however the risk increases markedly across the ETF and NP ecoregions.
8. Chloride values are naturally low across Minnesota with 53% <2 mg/L and 40% from 2-25 mg/L. None of the survey lakes exceeded the 230 mg/L WQS. The most common source of Cl to lakes is from use of salt on roads in winter. Regression-tree analysis indicated a primary changepoint, relative to developed land use, was at 15% and a secondary at 3.5%. The very low secondary threshold suggests that even a very low percentage of developed land use can increase the normally low Cl in lakes.
9. A level 10 mg/L sulfate has been Minnesota’s WQS for waters that support wild rice. As of 2015 that WQS was under revision. Sulfate across much of the NF and ETF regions is quite low with 97% and 72% respectively <10 mg/L. Overall in the NF, 95% are less than 5 mg/L. In contrast, the GP region is dominated by high sulfate with 65% >50 mg/L, primarily because of naturally high levels in in soils.
10. Analysis of color, DOC, TOC, and Secchi transparency provided several useful findings · DOC and TOC are highly correlated in the lakes of the NF and ETF ecoregions. This is not true
for the GP where algae (Chl-a) is a large component of TOC and where wetland and forest influence is minimal. Based on this analysis it appears measurement of TOC may not be needed, if the measurement of humic substances (dissolved and incompletely dissolved organic compounds) is of primary interest.
· DOC and color relationship varies among ecoregions. Respective R2 values are: NF 0.60, ETF 0.38, and GP 0.49. Based on these relationships color is probably best used as an estimator of DOC in the NF region, where a majority of the DOC arises from forest and wetland runoff.
National Lakes Assessment: 2012 • January 2016 Minnesota Pollution Control Agency
55

· Color is often used as a relative indicator of the degree of humic substances in water, which at high levels may inhibit water transparency. Quantile regression analysis of Secchi and color data indicate a significant breakpoint at 50 PCU; whereby at levels above 50 PCU Secchi was significantly lower as compared to measures below this level. This suggests that a color value of 50 or more can be used as an indication of when color has a significant influence on transparency. This is of particular value in lake eutrophication assessments for NF region lakes, where elevated color is common.
11. Regression-tree analysis (change-point) was used to examine the relationship among the trophic state variables: TP, TN, and Chl-a and disturbed land use. For TP, a significant changepoint was found at 45.5%. This value is close to that found in Cross and Jacobsen (2013) and would seem to reaffirm their findings. A practical implication of these findings is that for lakes with less than 40-45% disturbed land use in their watershed, it is desirable to avoid increases above this threshold if significant increases in TP are to be avoided. This concept is being considered for inclusion in an interagency effort to develop a prioritization process for protecting lakes of good quality and would seem to be relevant in analyses of environmental impact.
This represents a brief summary of the findings in this report. There are other 2012 NLA reports that share results on topics including: zooplankton, pesticides, emerging contaminants, and nearshore physical-habitat analysis. The 2012 NLA dataset is quite extensive and further work can be done with this data and data that was collected in the survey but not incorporated into this analysis. This current report will hopefully be a springboard for further use of this data.
References Center for Watershed Protection. 2003. Impacts of impervious cover on aquatic systems. Ellicott City, MD 21043. www.cwp.org
Cross T and P Jacobsen. 2013. Landscape factors influencing lake phosphorus concentrations across Minnesota. Lake and Reserve. Manage.: 29(1) 1-12.
Eilers, J., D. Brakke, and D. Landers. 1988. Chemical and physical characteristics of lakes in the Upper Midwest United States. Environ. Sci. Technol. 22(2): 164-172.
Gorham, E. W. Dean and J. Sanger. 1983. The chemical composition of lakes in the north-central United States. Limnol Oceangr 28(2):287-301.
Heiskary, S and E. Swain. 2002. Water quality reconstruction from fossil diatoms: applications for trend assessment, model verification, and development of nutrient criteria for lakes in Minnesota, USA. Environmental Analysis and Outcomes Division, Minnesota Pollution Control Agency, St. Paul MN
Heiskary, S and C. B. Wilson. 2005. Minnesota lake Water Quality Assessment Report: Developing Nutrient Criteria. Third Edition. MPCA St. Paul MN
Heiskary, S. and C.B. Wilson. 2008. Minnesota’s approach to lake nutrient criteria development. Lake and Reserv. Manage. 24: 282-297.
Heiskary, S, M. Lindon, and J. Anderson. 2014. Summary of microcystin concentrations in Minnesota lakes. Lake and Reserv. Manage. 30:268-272.
Heiskary, S. and W.W. Walker, Jr. 1988. Developing phosphorus criteria for Minnesota lakes. Lake and Reserv. Manage. 4:1-9.
Kiddon. J. 2014. NLA Data Viewer. USEPA, National Health and Environmental Effects Research Laboratory, Atlantic Ecology Division
Kiddon, J. 2010. USEPA, personal communication.
National Lakes Assessment: 2012 • January 2016 Minnesota Pollution Control Agency
56

Konopka A and T. Brock. 1978. Effect of temperature on blue-green algae (Cyanobacteria) in Lake Mendota. Applied Environ. Microbiol. 36(4): 572-576.
Monson, B. 2007. Effectiveness of Stormwater Ponds/Constructed Wetlands in the Collection of Total Mercury and Production of Methylmercury
Moyle, J.B. 1945. Some chemical factors influencing the distribution of aquatic plants in Minnesota. Amer. Midland Naturalist 34:402-420.
Moyle, J.B. 1946. Some indices of lake productivity. Trans. Amer. Fish. Soc. 46:322-334.
Moyle, J.B. 1951. Some aspects of chemistry of Minnesota surface waters as related to game and fish management. Fisheries Investigational Report #111.
Peck, D., A. Olsen, M. Weber, C. Peterson, and S. Holdsworth. 2013. Survey design and extent estimates for the National Lakes Assessment. Freshwater Science 32(4):1231-1245.
R Development Core Team. 2009. R: A language and environment for statistical computing. Vienna, Austria.
Sas, H. (ed) 1989. Lake restoration by reduction of nutrient loading: expectations, experiences, extrapolations. Academia Verlag Richarz GmbH 497 pp.
U.S. EPA. 2010 National Lakes Assessment: A collaborative survey of the Nation’s lakes. EPA 841-R-09-001. U.S. Environmental Protection Agency, Office of Water and Office of Research and Development, Washington, D.C. http://www.epa.gov/owow/LAKES/lakessurvey/pdf/nla_chapter0.pdf
U.S. EPA. 1975. National Eutrophication Survey: Working Paper Series (various). Pacific NW ERL, Corvallis and National ERC Las Vegas
Wetzel. R. G. 2001. Limnology: Lake and River ecosystems. 3rd Ed. Academic Press. San Diego
Whittier T., P. Ringold, A. Herlihy, and S. Pierson. 2008. A calcium based invasion risk assessment for zebra and quagga mussels (Dreissenia spp). Front. Ecol. Environ. 6, doi:10.1890/0700773
Appendix 1. I. Definition of CDF curves and weighted vs. non-weighted results
II. List of Minnesota’s 2012 NLA Lakes and data summaries
I. Definition of a CDF curve and weighted vs. un-weighted results (Kiddon 2010)
Definition of a CDF curve: A Cumulative Distribution Function (CDF) expresses the relative ranking of a value in a dataset, for example the ranking of one lake's chlorophyll value relative to values in all lakes of a state or region. A CDF curve plots the rank on the Y-axis (values = zero to one) vs. the measured parameter values on the X-axis. The CDF curve is interpreted as the probability (Y axis) that a lake will exhibit a value less than or equal to a given parameter value (read on the X-axis).
Weighted vs. un-weighted CDF: In an un-weighted CDF, all lakes have equal weighting; therefore, the probability is simply the percent rank of the lake's value in a list of all values measured in an unbiased manner. The spreadsheet uses the Excel function PERCENTRANK in calculations. The un-weighted CDF curve is relatively smooth, with uniform vertical spacing between observations. Un-weighted CDFs are appropriate in cases where all lakes in a region have equal probability of being sampled. This is not the case in the NLA design (see below). An un-weighted CDF of NLA observation gives undue emphasis to larger lakes in lake-poor localities.
National Lakes Assessment: 2012 • January 2016 Minnesota Pollution Control Agency
57

For a weighted CDF, each lake is weighted to reflect its surface area and ubiquity in one of nine ecoregions, Small lakes in lake-rich regions are weighted more heavily because they represent a greater portion of the entire lake population. In other words, lake selection is biased to assure adequate representation of lake size and ubiquity in an ecoregion, and the importance of observations is re-balanced by the weighting factor. Operationally in this spreadsheet, lakes are listed in increasing order of parameter value, a cumulative sum of weights is calculated for each lake (i.e., the sum of all prior weights in the list), and this value is divided by the sum of all weights, thus creating an uneven progression of values ranging from zero to one. The weighted CDF curve is therefore irregular, with large vertical jumps reflecting enhanced weighting of an observation. A weighted CDF provides a balanced estimate of all lakes in a region
Tips regarding interpretation of CDF curves: For parameters for which larger values are considered detrimental (e.g., TP), portions of the CDF plot positioned to the right and below the CDF curve denote poorer conditions. Conversely, portions of the plot positioned to the left and upward of the CDF curve denote better conditions. The opposite relationships hold for parameters for which lower parameter values are detrimental (e.g., Secchi depth or DO). Thus, for example, when comparing State and regional CDF curves for TP, the case where the state CDF curve is positioned to the right of the regional curve indicates that the State exhibits poorer conditions than the region as a whole. Conversely, a state CDF curve for DO that is displaced to the right relative to the regional curve signifies that that state exhibits better conditions (higher DO values) than the region.
National Lakes Assessment: 2012 • January 2016 Minnesota Pollution Control Agency
58
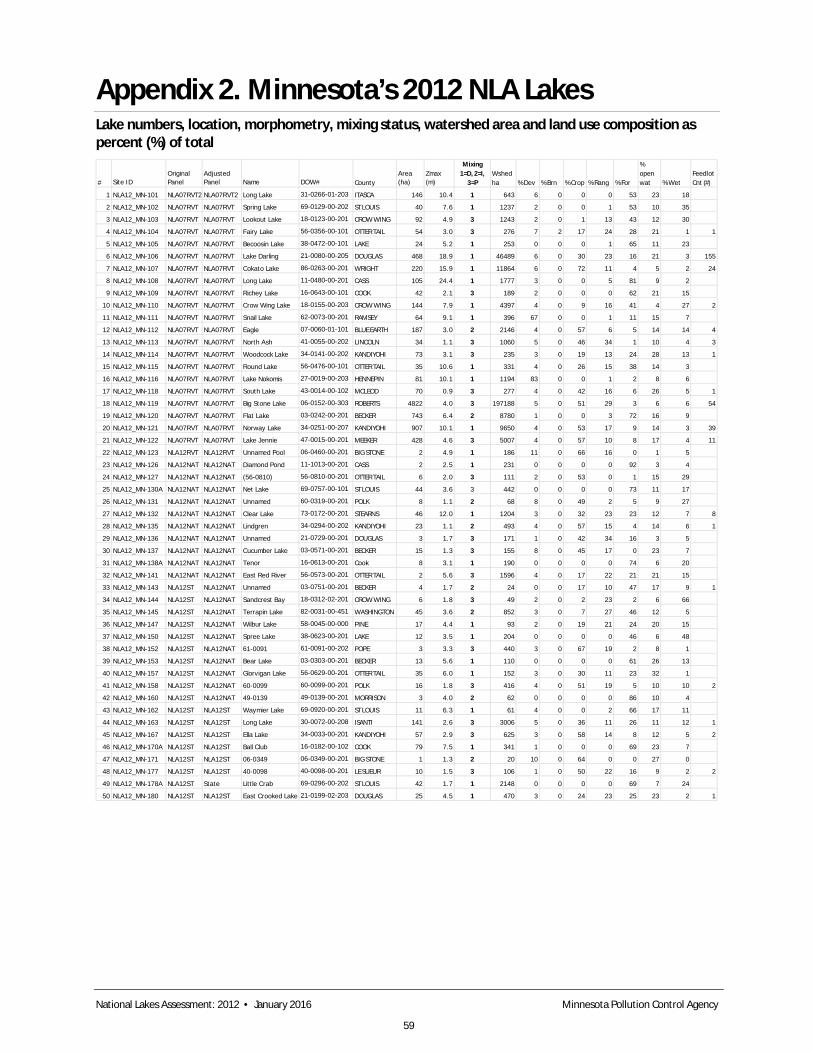
Appendix 2. Minnesota’s 2012 NLA Lakes Lake numbers, location, morphometry, mixing status, watershed area and land use composition as percent (%) of total
# Site IDOriginal Panel
Adjusted Panel Name DOW# County
Area (ha)
Zmax (m)
Mixing 1=D, 2=I,
3=PWshed ha % Dev % Brn % Crop % Rang % For
% open wat % Wet
Feedlot Cnt (#)
1 NLA12_MN-101 NLA07RVT2 NLA07RVT2 Long Lake 31-0266-01-203 ITASCA 146 10.4 1 643 6 0 0 0 53 23 18
2 NLA12_MN-102 NLA07RVT NLA07RVT Spring Lake 69-0129-00-202 ST LOUIS 40 7.6 1 1237 2 0 0 1 53 10 35
3 NLA12_MN-103 NLA07RVT NLA07RVT Lookout Lake 18-0123-00-201 CROW WING 92 4.9 3 1243 2 0 1 13 43 12 30
4 NLA12_MN-104 NLA07RVT NLA07RVT Fairy Lake 56-0356-00-101 OTTER TAIL 54 3.0 3 276 7 2 17 24 28 21 1 1
5 NLA12_MN-105 NLA07RVT NLA07RVT Becoosin Lake 38-0472-00-101 LAKE 24 5.2 1 253 0 0 0 1 65 11 23
6 NLA12_MN-106 NLA07RVT NLA07RVT Lake Darling 21-0080-00-205 DOUGLAS 468 18.9 1 46489 6 0 30 23 16 21 3 155
7 NLA12_MN-107 NLA07RVT NLA07RVT Cokato Lake 86-0263-00-201 WRIGHT 220 15.9 1 11864 6 0 72 11 4 5 2 24
8 NLA12_MN-108 NLA07RVT NLA07RVT Long Lake 11-0480-00-201 CASS 105 24.4 1 1777 3 0 0 5 81 9 2
9 NLA12_MN-109 NLA07RVT NLA07RVT Richey Lake 16-0643-00-101 COOK 42 2.1 3 189 2 0 0 0 62 21 15
10 NLA12_MN-110 NLA07RVT NLA07RVT Crow Wing Lake 18-0155-00-203 CROW WING 144 7.9 1 4397 4 0 9 16 41 4 27 2
11 NLA12_MN-111 NLA07RVT NLA07RVT Snail Lake 62-0073-00-201 RAMSEY 64 9.1 1 396 67 0 0 1 11 15 7
12 NLA12_MN-112 NLA07RVT NLA07RVT Eagle 07-0060-01-101 BLUE EARTH 187 3.0 2 2146 4 0 57 6 5 14 14 4
13 NLA12_MN-113 NLA07RVT NLA07RVT North Ash 41-0055-00-202 LINCOLN 34 1.1 3 1060 5 0 46 34 1 10 4 3
14 NLA12_MN-114 NLA07RVT NLA07RVT Woodcock Lake 34-0141-00-202 KANDIYOHI 73 3.1 3 235 3 0 19 13 24 28 13 1
15 NLA12_MN-115 NLA07RVT NLA07RVT Round Lake 56-0476-00-101 OTTER TAIL 35 10.6 1 331 4 0 26 15 38 14 3
16 NLA12_MN-116 NLA07RVT NLA07RVT Lake Nokomis 27-0019-00-203 HENNEPIN 81 10.1 1 1194 83 0 0 1 2 8 6
17 NLA12_MN-118 NLA07RVT NLA07RVT South Lake 43-0014-00-102 MCLEOD 70 0.9 3 277 4 0 42 16 6 26 5 1
18 NLA12_MN-119 NLA07RVT NLA07RVT Big Stone Lake 06-0152-00-303 ROBERTS 4822 4.0 3 197188 5 0 51 29 3 6 6 54
19 NLA12_MN-120 NLA07RVT NLA07RVT Flat Lake 03-0242-00-201 BECKER 743 6.4 2 8780 1 0 0 3 72 16 9
20 NLA12_MN-121 NLA07RVT NLA07RVT Norway Lake 34-0251-00-207 KANDIYOHI 907 10.1 1 9650 4 0 53 17 9 14 3 39
21 NLA12_MN-122 NLA07RVT NLA07RVT Lake Jennie 47-0015-00-201 MEEKER 428 4.6 3 5007 4 0 57 10 8 17 4 11
22 NLA12_MN-123 NLA12RVT NLA12RVT Unnamed Pool 06-0460-00-201 BIG STONE 2 4.9 1 186 11 0 66 16 0 1 5
23 NLA12_MN-126 NLA12NAT NLA12NAT Diamond Pond 11-1013-00-201 CASS 2 2.5 1 231 0 0 0 0 92 3 4
24 NLA12_MN-127 NLA12NAT NLA12NAT (56-0810) 56-0810-00-201 OTTER TAIL 6 2.0 3 111 2 0 53 0 1 15 29
25 NLA12_MN-130A NLA12NAT NLA12NAT Net Lake 69-0757-00-101 ST LOUIS 44 3.6 3 442 0 0 0 0 73 11 17
26 NLA12_MN-131 NLA12NAT NLA12NAT Unnamed 60-0319-00-201 POLK 8 1.1 2 68 8 0 49 2 5 9 27
27 NLA12_MN-132 NLA12NAT NLA12NAT Clear Lake 73-0172-00-201 STEARNS 46 12.0 1 1204 3 0 32 23 23 12 7 8
28 NLA12_MN-135 NLA12NAT NLA12NAT Lindgren 34-0294-00-202 KANDIYOHI 23 1.1 2 493 4 0 57 15 4 14 6 1
29 NLA12_MN-136 NLA12NAT NLA12NAT Unnamed 21-0729-00-201 DOUGLAS 3 1.7 3 171 1 0 42 34 16 3 5
30 NLA12_MN-137 NLA12NAT NLA12NAT Cucumber Lake 03-0571-00-201 BECKER 15 1.3 3 155 8 0 45 17 0 23 7
31 NLA12_MN-138A NLA12NAT NLA12NAT Tenor 16-0613-00-201 Cook 8 3.1 1 190 0 0 0 0 74 6 20
32 NLA12_MN-141 NLA12NAT NLA12NAT East Red River 56-0573-00-201 OTTER TAIL 2 5.6 3 1596 4 0 17 22 21 21 15
33 NLA12_MN-143 NLA12ST NLA12NAT Unnamed 03-0751-00-201 BECKER 4 1.7 2 24 0 0 17 10 47 17 9 1
34 NLA12_MN-144 NLA12ST NLA12NAT Sandcrest Bay 18-0312-02-201 CROW WING 6 1.8 3 49 2 0 2 23 2 6 66
35 NLA12_MN-145 NLA12ST NLA12NAT Terrapin Lake 82-0031-00-451 WASHINGTON 45 3.6 2 852 3 0 7 27 46 12 5
36 NLA12_MN-147 NLA12ST NLA12NAT Wilbur Lake 58-0045-00-000 PINE 17 4.4 1 93 2 0 19 21 24 20 15
37 NLA12_MN-150 NLA12ST NLA12NAT Spree Lake 38-0623-00-201 LAKE 12 3.5 1 204 0 0 0 0 46 6 48
38 NLA12_MN-152 NLA12ST NLA12NAT 61-0091 61-0091-00-202 POPE 3 3.3 3 440 3 0 67 19 2 8 1
39 NLA12_MN-153 NLA12ST NLA12NAT Bear Lake 03-0303-00-201 BECKER 13 5.6 1 110 0 0 0 0 61 26 13
40 NLA12_MN-157 NLA12ST NLA12NAT Glorvigan Lake 56-0629-00-201 OTTER TAIL 35 6.0 1 152 3 0 30 11 23 32 1
41 NLA12_MN-158 NLA12ST NLA12NAT 60-0099 60-0099-00-201 POLK 16 1.8 3 416 4 0 51 19 5 10 10 2
42 NLA12_MN-160 NLA12ST NLA12NAT 49-0139 49-0139-00-201 MORRISON 3 4.0 2 62 0 0 0 0 86 10 4
43 NLA12_MN-162 NLA12ST NLA12ST Waymier Lake 69-0920-00-201 ST LOUIS 11 6.3 1 61 4 0 0 2 66 17 11
44 NLA12_MN-163 NLA12ST NLA12ST Long Lake 30-0072-00-208 ISANTI 141 2.6 3 3006 5 0 36 11 26 11 12 1
45 NLA12_MN-167 NLA12ST NLA12ST Ella Lake 34-0033-00-201 KANDIYOHI 57 2.9 3 625 3 0 58 14 8 12 5 2
46 NLA12_MN-170A NLA12ST NLA12ST Ball Club 16-0182-00-102 COOK 79 7.5 1 341 1 0 0 0 69 23 7
47 NLA12_MN-171 NLA12ST NLA12ST 06-0349 06-0349-00-201 BIG STONE 1 1.3 2 20 10 0 64 0 0 27 0
48 NLA12_MN-177 NLA12ST NLA12ST 40-0098 40-0098-00-201 LE SUEUR 10 1.5 3 106 1 0 50 22 16 9 2 2
49 NLA12_MN-178A NLA12ST State Little Crab 69-0296-00-202 ST LOUIS 42 1.7 1 2148 0 0 0 0 69 7 24
50 NLA12_MN-180 NLA12ST NLA12ST East Crooked Lake 21-0199-02-203 DOUGLAS 25 4.5 1 470 3 0 24 23 25 23 2 1
National Lakes Assessment: 2012 • January 2016 Minnesota Pollution Control Agency
59
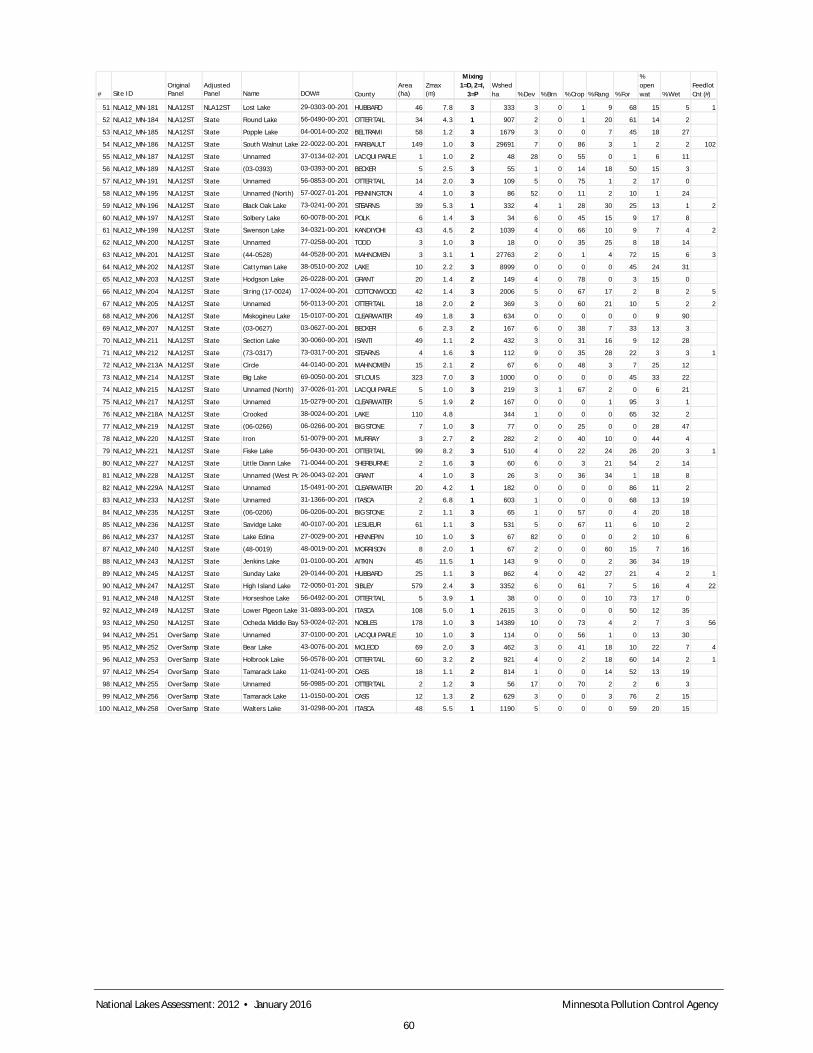
# Site IDOriginal Panel
Adjusted Panel Name DOW# County
Area (ha)
Zmax (m)
Mixing 1=D, 2=I,
3=PWshed ha % Dev % Brn % Crop % Rang % For
% open wat % Wet
Feedlot Cnt (#)
51 NLA12_MN-181 NLA12ST NLA12ST Lost Lake 29-0303-00-201 HUBBARD 46 7.8 3 333 3 0 1 9 68 15 5 1
52 NLA12_MN-184 NLA12ST State Round Lake 56-0490-00-201 OTTER TAIL 34 4.3 1 907 2 0 1 20 61 14 2
53 NLA12_MN-185 NLA12ST State Popple Lake 04-0014-00-202 BELTRAMI 58 1.2 3 1679 3 0 0 7 45 18 27
54 NLA12_MN-186 NLA12ST State South Walnut Lake 22-0022-00-201 FARIBAULT 149 1.0 3 29691 7 0 86 3 1 2 2 102
55 NLA12_MN-187 NLA12ST State Unnamed 37-0134-02-201 LAC QUI PARLE 1 1.0 2 48 28 0 55 0 1 6 11
56 NLA12_MN-189 NLA12ST State (03-0393) 03-0393-00-201 BECKER 5 2.5 3 55 1 0 14 18 50 15 3
57 NLA12_MN-191 NLA12ST State Unnamed 56-0853-00-201 OTTER TAIL 14 2.0 3 109 5 0 75 1 2 17 0
58 NLA12_MN-195 NLA12ST State Unnamed (North) 57-0027-01-201 PENNINGTON 4 1.0 3 86 52 0 11 2 10 1 24
59 NLA12_MN-196 NLA12ST State Black Oak Lake 73-0241-00-201 STEARNS 39 5.3 1 332 4 1 28 30 25 13 1 2
60 NLA12_MN-197 NLA12ST State Solbery Lake 60-0078-00-201 POLK 6 1.4 3 34 6 0 45 15 9 17 8
61 NLA12_MN-199 NLA12ST State Swenson Lake 34-0321-00-201 KANDIYOHI 43 4.5 2 1039 4 0 66 10 9 7 4 2
62 NLA12_MN-200 NLA12ST State Unnamed 77-0258-00-201 TODD 3 1.0 3 18 0 0 35 25 8 18 14
63 NLA12_MN-201 NLA12ST State (44-0528) 44-0528-00-201 MAHNOMEN 3 3.1 1 27763 2 0 1 4 72 15 6 3
64 NLA12_MN-202 NLA12ST State Cattyman Lake 38-0510-00-202 LAKE 10 2.2 3 8999 0 0 0 0 45 24 31
65 NLA12_MN-203 NLA12ST State Hodgson Lake 26-0228-00-201 GRANT 20 1.4 2 149 4 0 78 0 3 15 0
66 NLA12_MN-204 NLA12ST State String (17-0024) 17-0024-00-201 COTTONWOOD 42 1.4 3 2006 5 0 67 17 2 8 2 5
67 NLA12_MN-205 NLA12ST State Unnamed 56-0113-00-201 OTTER TAIL 18 2.0 2 369 3 0 60 21 10 5 2 2
68 NLA12_MN-206 NLA12ST State Miskogineu Lake 15-0107-00-201 CLEARWATER 49 1.8 3 634 0 0 0 0 0 9 90
69 NLA12_MN-207 NLA12ST State (03-0627) 03-0627-00-201 BECKER 6 2.3 2 167 6 0 38 7 33 13 3
70 NLA12_MN-211 NLA12ST State Section Lake 30-0060-00-201 ISANTI 49 1.1 2 432 3 0 31 16 9 12 28
71 NLA12_MN-212 NLA12ST State (73-0317) 73-0317-00-201 STEARNS 4 1.6 3 112 9 0 35 28 22 3 3 1
72 NLA12_MN-213A NLA12ST State Circle 44-0140-00-201 MAHNOMEN 15 2.1 2 67 6 0 48 3 7 25 12
73 NLA12_MN-214 NLA12ST State Big Lake 69-0050-00-201 ST LOUIS 323 7.0 3 1000 0 0 0 0 45 33 22
74 NLA12_MN-215 NLA12ST State Unnamed (North) 37-0026-01-201 LAC QUI PARLE 5 1.0 3 219 3 1 67 2 0 6 21
75 NLA12_MN-217 NLA12ST State Unnamed 15-0279-00-201 CLEARWATER 5 1.9 2 167 0 0 0 1 95 3 1
76 NLA12_MN-218A NLA12ST State Crooked 38-0024-00-201 LAKE 110 4.8 344 1 0 0 0 65 32 2
77 NLA12_MN-219 NLA12ST State (06-0266) 06-0266-00-201 BIG STONE 7 1.0 3 77 0 0 25 0 0 28 47
78 NLA12_MN-220 NLA12ST State Iron 51-0079-00-201 MURRAY 3 2.7 2 282 2 0 40 10 0 44 4
79 NLA12_MN-221 NLA12ST State Fiske Lake 56-0430-00-201 OTTER TAIL 99 8.2 3 510 4 0 22 24 26 20 3 1
80 NLA12_MN-227 NLA12ST State Little Diann Lake 71-0044-00-201 SHERBURNE 2 1.6 3 60 6 0 3 21 54 2 14
81 NLA12_MN-228 NLA12ST State Unnamed (West Po 26-0043-02-201 GRANT 4 1.0 3 26 3 0 36 34 1 18 8
82 NLA12_MN-229A NLA12ST State Unnamed 15-0491-00-201 CLEARWATER 20 4.2 1 182 0 0 0 0 86 11 2
83 NLA12_MN-233 NLA12ST State Unnamed 31-1366-00-201 ITASCA 2 6.8 1 603 1 0 0 0 68 13 19
84 NLA12_MN-235 NLA12ST State (06-0206) 06-0206-00-201 BIG STONE 2 1.1 3 65 1 0 57 0 4 20 18
85 NLA12_MN-236 NLA12ST State Savidge Lake 40-0107-00-201 LE SUEUR 61 1.1 3 531 5 0 67 11 6 10 2
86 NLA12_MN-237 NLA12ST State Lake Edina 27-0029-00-201 HENNEPIN 10 1.0 3 67 82 0 0 0 2 10 6
87 NLA12_MN-240 NLA12ST State (48-0019) 48-0019-00-201 MORRISON 8 2.0 1 67 2 0 0 60 15 7 16
88 NLA12_MN-243 NLA12ST State Jenkins Lake 01-0100-00-201 AITKIN 45 11.5 1 143 9 0 0 2 36 34 19
89 NLA12_MN-245 NLA12ST State Sunday Lake 29-0144-00-201 HUBBARD 25 1.1 3 862 4 0 42 27 21 4 2 1
90 NLA12_MN-247 NLA12ST State High Island Lake 72-0050-01-201 SIBLEY 579 2.4 3 3352 6 0 61 7 5 16 4 22
91 NLA12_MN-248 NLA12ST State Horseshoe Lake 56-0492-00-201 OTTER TAIL 5 3.9 1 38 0 0 0 10 73 17 0
92 NLA12_MN-249 NLA12ST State Lower Pigeon Lake 31-0893-00-201 ITASCA 108 5.0 1 2615 3 0 0 0 50 12 35
93 NLA12_MN-250 NLA12ST State Ocheda Middle Bay 53-0024-02-201 NOBLES 178 1.0 3 14389 10 0 73 4 2 7 3 56
94 NLA12_MN-251 OverSamp State Unnamed 37-0100-00-201 LAC QUI PARLE 10 1.0 3 114 0 0 56 1 0 13 30
95 NLA12_MN-252 OverSamp State Bear Lake 43-0076-00-201 MCLEOD 69 2.0 3 462 3 0 41 18 10 22 7 4
96 NLA12_MN-253 OverSamp State Holbrook Lake 56-0578-00-201 OTTER TAIL 60 3.2 2 921 4 0 2 18 60 14 2 1
97 NLA12_MN-254 OverSamp State Tamarack Lake 11-0241-00-201 CASS 18 1.1 2 814 1 0 0 14 52 13 19
98 NLA12_MN-255 OverSamp State Unnamed 56-0985-00-201 OTTER TAIL 2 1.2 3 56 17 0 70 2 2 6 3
99 NLA12_MN-256 OverSamp State Tamarack Lake 11-0150-00-201 CASS 12 1.3 2 629 3 0 0 3 76 2 15
100 NLA12_MN-258 OverSamp State Walters Lake 31-0298-00-201 ITASCA 48 5.5 1 1190 5 0 0 0 59 20 15
National Lakes Assessment: 2012 • January 2016 Minnesota Pollution Control Agency
60

101 NLA12_MN-264 OverSamp State Kruegers Slough 21-0060-00-202 DOUGLAS 23 1.2 3 442 5 0 32 29 15 11 8
102 NLA12_MN-265 OverSamp State Gandrud Lake 03-0414-00-201 BECKER 12 1.2 3 91 3 0 32 21 18 14 13
103 NLA12_MN-267 OverSamp State Unnamed 26-0205-00-201 GRANT 14 1.3 2 355 8 0 51 0 1 36 4
104 NLA12_MN-268 OverSamp State Talcott 17-0060-00-201 COTTONWOOD 317 1.8 3 134519 5 0 79 8 0 4 3 351
105 NLA12_MN-269 OverSamp State Unnamed 56-0147-00-201 OTTER TAIL 13 4.4 1 73 4 0 23 34 20 19 0
106 NLA12_MN-271 OverSamp State Unnamed 56-1582-00-201 OTTER TAIL 3 1.8 3 19 7 0 60 7 12 9 5
107 NLA12_MN-272A OverSamp State Pennington Pit Lake18-0439-00-201 CROW WING 19 78.0 1 72 13 2 1 0 35 28 21
108 NLA12_MN-273 OverSamp State North Little Long 27-0179-01-201 HENNEPIN 20 23.0 1 100 5 0 0 10 48 28 9
109 NLA12_MN-274 OverSamp State Hay Lake 31-0407-00-201 ITASCA 22 12.0 1 792 3 0 0 0 66 10 21
110 NLA12_MN-275 OverSamp State Unnamed 13-0061-00-201 CHISAGO 10 1.2 3 97 22 0 32 14 14 12 7
111 NLA12_MN-276 OverSamp State Unnamed 86-0065-00-201 WRIGHT 25 1.0 3 193 2 0 32 32 18 12 5
112 NLA12_MN-277A OverSamp State Unnamed 44-0244-00-201 MAHNOMEN 19 1.0 3 396 3 0 36 15 14 13 20
113 NLA12_MN-280 OverSamp State Unnamed 61-0189-00-201 POPE 11 1.0 3 1258 4 0 89 3 0 1 3 2
114 NLA12_MN-281 OverSamp State Unnamed 03-0236-00-201 BECKER 8 1.0 3 49 6 0 0 6 67 16 5
115 NLA12_MN-283 OverSamp State Unnamed 75-0205-00-201 STEVENS 6 1.0 3 54 1 0 79 0 1 14 5
116 NLA12_MN-284 OverSamp State Unnamed 64-0096-00-201 REDWOOD 4 1.0 2 111 6 0 71 0 0 13 9
117 NLA12_MN-287 OverSamp State unnamed 14-0081-00-201 CLAY 8 2.3 1 287 7 0 72 3 2 6 10
118 NLA12_MN-288 OverSamp State Unnamed 11-0440-00-201 CASS 8 3.5 1 49 0 0 0 0 89 10 2
119 NLA12_MN-290 OverSamp State Becker Lake 31-0211-00-201 ITASCA 7 8.6 1 72 1 0 0 5 70 10 14
120 NLA12_MN-293 OverSamp State Unnamed (South) 15-0213-02-201 CLEARWATER 2 1.8 3 373 1 0 0 1 92 4 1
121 NLA12_MN-297 OverSamp State Unnamed 31-1367-00-201 ITASCA 2 3.4 1 1692 0 0 0 1 58 3 38
122 NLA12_MN-299 OverSamp State Bentsen Lake 06-0090-01-201 BIG STONE 163 1.3 3 562 2 0 31 2 2 46 17
123 NLA12_MN-300 OverSamp State Lieberg Lake 07-0124-00-201 BLUE EARTH 27 1.8 3 558 4 0 81 0 0 6 9
124 NLA12_MN-303 OverSamp State unnamed 60-0275-00-202 POLK 16 6.1 3 186 7 0 0 32 6 34 21 1
125 NLA12_MN-304 OverSamp State Unnamed 18-0527-00-201 CROW WING 6 2.1 2 306 31 0 15 23 13 2 16
126 NLA12_MN-306A Replace State Two Deer 38-0671-00-201 LAKE 18 2.1 2 341 2 0 0 0 52 25 20
127 NLA12_MN-313 OverSamp State Lake Belle Taine 29-0146-00-204 HUBBARD 620 18.0 1 29123 3 0 3 7 69 15 3 4
128 NLA12_MN-315 OverSamp State Popowski 41-0044-00-201 LINCOLN 53 3.1 3 604 3 0 56 28 0 10 3 4
129 NLA12_MN-318 OverSamp State Unnamed 11-1033-00-201 CASS 3 2.7 1 28 2 0 0 0 88 7 3
130 NLA12_MN-320 OverSamp State Pistol Lake 11-0110-00-201 CASS 32 3.6 1 780 0 0 0 0 83 5 12
131 NLA12_MN-322A OverSamp State Charlie Lake 31-0419-00-201 ITASCA 15 6.1 1 1454 3 0 0 1 57 23 16
132 NLA12_MN-325 OverSamp State Unnamed 44-0228-00-201 MAHNOMEN 3 1.3 3 145 3 0 63 2 0 5 27
133 NLA12_MN-334 OverSamp State Fox Lake 04-0251-00-201 BELTRAMI 15 6.1 1 91 2 0 0 0 74 15 10
134 NLA12_MN-335 OverSamp State Unnamed 14-0389-00-201 CLAY 2 2.4 1 24 10 0 67 0 0 24 0
135 NLA12_MN-338 OverSamp State Cottonwood Lake 31-0594-00-202 ITASCA 47 13.0 1 1903 1 0 0 1 72 12 14
136 NLA12_MN-341 OverSamp State Engemoen Lake 60-0211-00-201 POLK 13 1.6 3 102 2 0 43 1 11 8 35
137 NLA12_MN-342 OverSamp State Long Lake 69-0653-00-202 ST LOUIS 61 9.4 1 890 9 1 0 6 47 12 24
138 NLA12_MN-346 OverSamp State Divide Lake 38-0256-00-201 LAKE 22 4.7 1 59 3 0 0 0 30 42 24
139 NLA12_MN-367 OverSamp State Unnamed 60-0281-00-201 POLK 2 5.1 1 159 6 0 32 13 17 12 20 1
140 NLA12_MN-378 OverSamp State Dutton Slough 46-0098-00-201 MARTIN 18 1.5 3 49 4 0 49 0 0 40 7
141 NLA12_MN-395 OverSamp State Unnamed 26-0217-00-201 GRANT 4 1.6 2 56 25 0 22 6 2 31 15
142 NLA12_MN-396A OverSamp State Summitt 17-0073-00-201 COTTONWOOD 32 2.9 3 275 5 0 76 5 0 12 1 1
143 NLA12_MN-414A OverSamp State Syverson 60-0129-00-201 POLK 9 4.8 2 23 10 0 18 4 1 37 30
144 NLA12_MN-415 OverSamp State Home 54-0013-00-202 NORMAN 26 2.7 3 352 3 1 22 26 13 8 26
145 NLA12_MN-420 OverSamp State Silver Lake 75-0164-00-201 GRANT 31 2.3 3 231 2 0 63 0 1 29 5
146 NLA12_MN-427A OverSamp State Thielke 06-0102-00-201 BIG STONE 156 1.5 3 4278 7 0 59 5 1 21 7 1
147 NLA12_MN-443 OverSamp State East Twin Lake 42-0070-00-202 LYON 76 7.0 1 349 2 0 49 7 1 42 0
148 NLA12_MN-444A OverSamp State Summitt 51-0068-00-201 MURRAY 31 1.7 3 232 9 0 56 17 0 15 2 1
149 NLA12_MN-475 OverSamp State Taffe Pond 06-0251-00-201 BIG STONE 14 3.0 3 390 7 0 78 1 0 13 2
National Lakes Assessment: 2012 • January 2016 Minnesota Pollution Control Agency
61
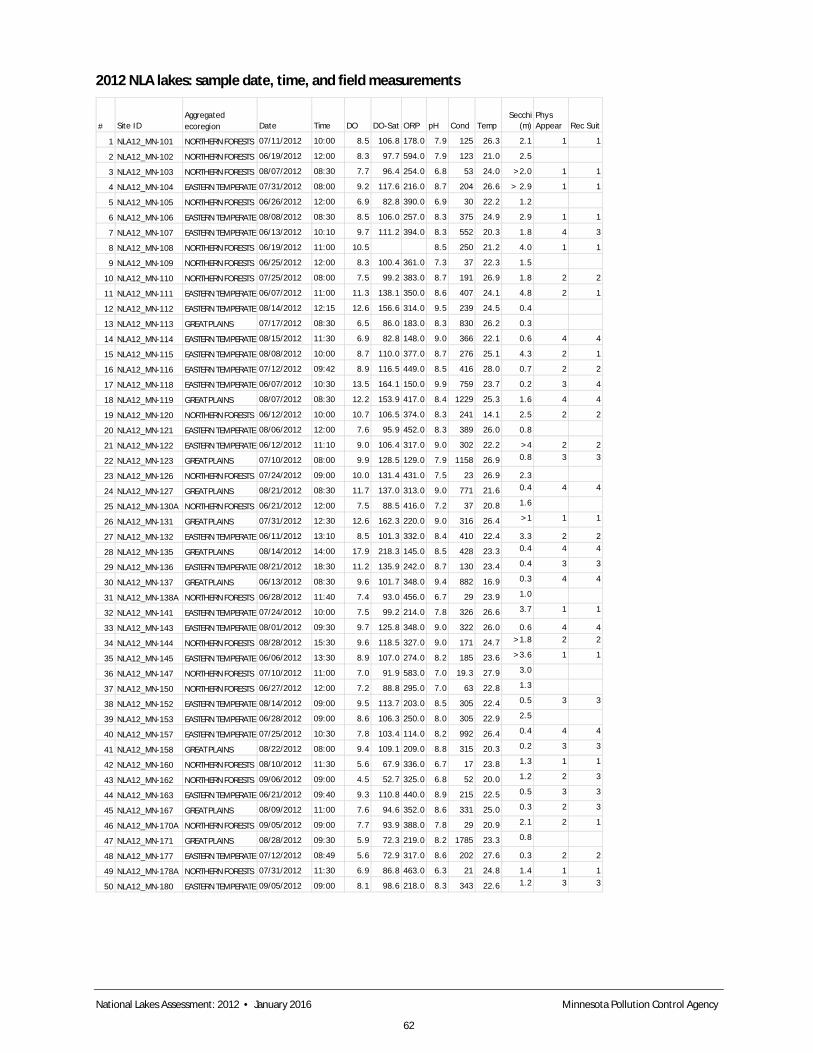
2012 NLA lakes: sample date, time, and field measurements
# Site IDAggregated ecoregion Date Time DO DO-Sat ORP pH Cond Temp
Secchi (m)
Phys Appear Rec Suit
1 NLA12_MN-101 NORTHERN FORESTS 07/11/2012 10:00 8.5 106.8 178.0 7.9 125 26.3 2.1 1 1
2 NLA12_MN-102 NORTHERN FORESTS 06/19/2012 12:00 8.3 97.7 594.0 7.9 123 21.0 2.5
3 NLA12_MN-103 NORTHERN FORESTS 08/07/2012 08:30 7.7 96.4 254.0 6.8 53 24.0 >2.0 1 1
4 NLA12_MN-104 EASTERN TEMPERATE 07/31/2012 08:00 9.2 117.6 216.0 8.7 204 26.6 > 2.9 1 1
5 NLA12_MN-105 NORTHERN FORESTS 06/26/2012 12:00 6.9 82.8 390.0 6.9 30 22.2 1.2
6 NLA12_MN-106 EASTERN TEMPERATE 08/08/2012 08:30 8.5 106.0 257.0 8.3 375 24.9 2.9 1 1
7 NLA12_MN-107 EASTERN TEMPERATE 06/13/2012 10:10 9.7 111.2 394.0 8.3 552 20.3 1.8 4 3
8 NLA12_MN-108 NORTHERN FORESTS 06/19/2012 11:00 10.5 8.5 250 21.2 4.0 1 1
9 NLA12_MN-109 NORTHERN FORESTS 06/25/2012 12:00 8.3 100.4 361.0 7.3 37 22.3 1.5
10 NLA12_MN-110 NORTHERN FORESTS 07/25/2012 08:00 7.5 99.2 383.0 8.7 191 26.9 1.8 2 2
11 NLA12_MN-111 EASTERN TEMPERATE 06/07/2012 11:00 11.3 138.1 350.0 8.6 407 24.1 4.8 2 1
12 NLA12_MN-112 EASTERN TEMPERATE 08/14/2012 12:15 12.6 156.6 314.0 9.5 239 24.5 0.4
13 NLA12_MN-113 GREAT PLAINS 07/17/2012 08:30 6.5 86.0 183.0 8.3 830 26.2 0.3
14 NLA12_MN-114 EASTERN TEMPERATE 08/15/2012 11:30 6.9 82.8 148.0 9.0 366 22.1 0.6 4 4
15 NLA12_MN-115 EASTERN TEMPERATE 08/08/2012 10:00 8.7 110.0 377.0 8.7 276 25.1 4.3 2 1
16 NLA12_MN-116 EASTERN TEMPERATE 07/12/2012 09:42 8.9 116.5 449.0 8.5 416 28.0 0.7 2 2
17 NLA12_MN-118 EASTERN TEMPERATE 06/07/2012 10:30 13.5 164.1 150.0 9.9 759 23.7 0.2 3 4
18 NLA12_MN-119 GREAT PLAINS 08/07/2012 08:30 12.2 153.9 417.0 8.4 1229 25.3 1.6 4 4
19 NLA12_MN-120 NORTHERN FORESTS 06/12/2012 10:00 10.7 106.5 374.0 8.3 241 14.1 2.5 2 2
20 NLA12_MN-121 EASTERN TEMPERATE 08/06/2012 12:00 7.6 95.9 452.0 8.3 389 26.0 0.8
21 NLA12_MN-122 EASTERN TEMPERATE 06/12/2012 11:10 9.0 106.4 317.0 9.0 302 22.2 >4 2 2
22 NLA12_MN-123 GREAT PLAINS 07/10/2012 08:00 9.9 128.5 129.0 7.9 1158 26.9 0.8 3 3
23 NLA12_MN-126 NORTHERN FORESTS 07/24/2012 09:00 10.0 131.4 431.0 7.5 23 26.9 2.3
24 NLA12_MN-127 GREAT PLAINS 08/21/2012 08:30 11.7 137.0 313.0 9.0 771 21.6 0.4 4 4
25 NLA12_MN-130A NORTHERN FORESTS 06/21/2012 12:00 7.5 88.5 416.0 7.2 37 20.8 1.6
26 NLA12_MN-131 GREAT PLAINS 07/31/2012 12:30 12.6 162.3 220.0 9.0 316 26.4 >1 1 1
27 NLA12_MN-132 EASTERN TEMPERATE 06/11/2012 13:10 8.5 101.3 332.0 8.4 410 22.4 3.3 2 2
28 NLA12_MN-135 GREAT PLAINS 08/14/2012 14:00 17.9 218.3 145.0 8.5 428 23.3 0.4 4 4
29 NLA12_MN-136 EASTERN TEMPERATE 08/21/2012 18:30 11.2 135.9 242.0 8.7 130 23.4 0.4 3 3
30 NLA12_MN-137 GREAT PLAINS 06/13/2012 08:30 9.6 101.7 348.0 9.4 882 16.9 0.3 4 4
31 NLA12_MN-138A NORTHERN FORESTS 06/28/2012 11:40 7.4 93.0 456.0 6.7 29 23.9 1.0
32 NLA12_MN-141 EASTERN TEMPERATE 07/24/2012 10:00 7.5 99.2 214.0 7.8 326 26.6 3.7 1 1
33 NLA12_MN-143 EASTERN TEMPERATE 08/01/2012 09:30 9.7 125.8 348.0 9.0 322 26.0 0.6 4 4
34 NLA12_MN-144 NORTHERN FORESTS 08/28/2012 15:30 9.6 118.5 327.0 9.0 171 24.7 >1.8 2 2
35 NLA12_MN-145 EASTERN TEMPERATE 06/06/2012 13:30 8.9 107.0 274.0 8.2 185 23.6 >3.6 1 1
36 NLA12_MN-147 NORTHERN FORESTS 07/10/2012 11:00 7.0 91.9 583.0 7.0 19.3 27.9 3.0
37 NLA12_MN-150 NORTHERN FORESTS 06/27/2012 12:00 7.2 88.8 295.0 7.0 63 22.8 1.3
38 NLA12_MN-152 EASTERN TEMPERATE 08/14/2012 09:00 9.5 113.7 203.0 8.5 305 22.4 0.5 3 3
39 NLA12_MN-153 EASTERN TEMPERATE 06/28/2012 09:00 8.6 106.3 250.0 8.0 305 22.9 2.5
40 NLA12_MN-157 EASTERN TEMPERATE 07/25/2012 10:30 7.8 103.4 114.0 8.2 992 26.4 0.4 4 4
41 NLA12_MN-158 GREAT PLAINS 08/22/2012 08:00 9.4 109.1 209.0 8.8 315 20.3 0.2 3 3
42 NLA12_MN-160 NORTHERN FORESTS 08/10/2012 11:30 5.6 67.9 336.0 6.7 17 23.8 1.3 1 1
43 NLA12_MN-162 NORTHERN FORESTS 09/06/2012 09:00 4.5 52.7 325.0 6.8 52 20.0 1.2 2 3
44 NLA12_MN-163 EASTERN TEMPERATE 06/21/2012 09:40 9.3 110.8 440.0 8.9 215 22.5 0.5 3 3
45 NLA12_MN-167 GREAT PLAINS 08/09/2012 11:00 7.6 94.6 352.0 8.6 331 25.0 0.3 2 3
46 NLA12_MN-170A NORTHERN FORESTS 09/05/2012 09:00 7.7 93.9 388.0 7.8 29 20.9 2.1 2 1
47 NLA12_MN-171 GREAT PLAINS 08/28/2012 09:30 5.9 72.3 219.0 8.2 1785 23.3 0.8
48 NLA12_MN-177 EASTERN TEMPERATE 07/12/2012 08:49 5.6 72.9 317.0 8.6 202 27.6 0.3 2 2
49 NLA12_MN-178A NORTHERN FORESTS 07/31/2012 11:30 6.9 86.8 463.0 6.3 21 24.8 1.4 1 1
50 NLA12_MN-180 EASTERN TEMPERATE 09/05/2012 09:00 8.1 98.6 218.0 8.3 343 22.6 1.2 3 3
National Lakes Assessment: 2012 • January 2016 Minnesota Pollution Control Agency
62
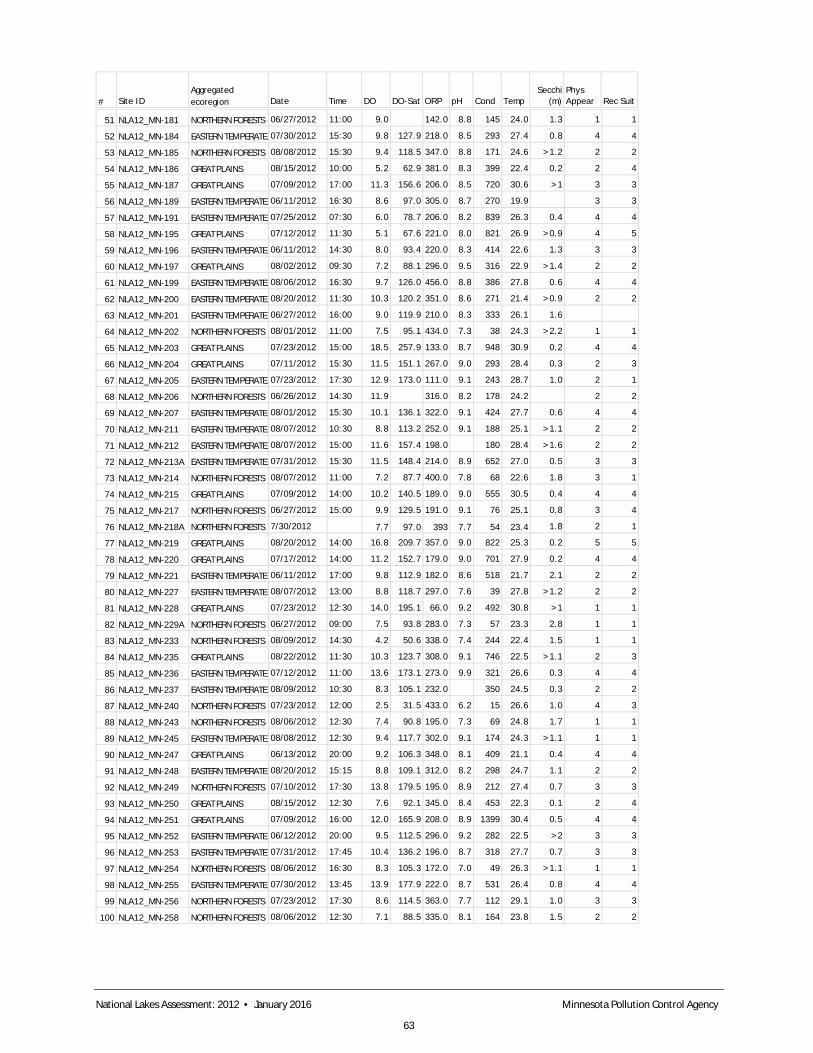
# Site IDAggregated ecoregion Date Time DO DO-Sat ORP pH Cond Temp
Secchi (m)
Phys Appear Rec Suit
51 NLA12_MN-181 NORTHERN FORESTS 06/27/2012 11:00 9.0 142.0 8.8 145 24.0 1.3 1 1
52 NLA12_MN-184 EASTERN TEMPERATE F07/30/2012 15:30 9.8 127.9 218.0 8.5 293 27.4 0.8 4 4
53 NLA12_MN-185 NORTHERN FORESTS 08/08/2012 15:30 9.4 118.5 347.0 8.8 171 24.6 >1.2 2 2
54 NLA12_MN-186 GREAT PLAINS 08/15/2012 10:00 5.2 62.9 381.0 8.3 399 22.4 0.2 2 4
55 NLA12_MN-187 GREAT PLAINS 07/09/2012 17:00 11.3 156.6 206.0 8.5 720 30.6 >1 3 3
56 NLA12_MN-189 EASTERN TEMPERATE F06/11/2012 16:30 8.6 97.0 305.0 8.7 270 19.9 3 3
57 NLA12_MN-191 EASTERN TEMPERATE F07/25/2012 07:30 6.0 78.7 206.0 8.2 839 26.3 0.4 4 4
58 NLA12_MN-195 GREAT PLAINS 07/12/2012 11:30 5.1 67.6 221.0 8.0 821 26.9 >0.9 4 5
59 NLA12_MN-196 EASTERN TEMPERATE F06/11/2012 14:30 8.0 93.4 220.0 8.3 414 22.6 1.3 3 3
60 NLA12_MN-197 GREAT PLAINS 08/02/2012 09:30 7.2 88.1 296.0 9.5 316 22.9 >1.4 2 2
61 NLA12_MN-199 EASTERN TEMPERATE F08/06/2012 16:30 9.7 126.0 456.0 8.8 386 27.8 0.6 4 4
62 NLA12_MN-200 EASTERN TEMPERATE F08/20/2012 11:30 10.3 120.2 351.0 8.6 271 21.4 >0.9 2 2
63 NLA12_MN-201 EASTERN TEMPERATE F06/27/2012 16:00 9.0 119.9 210.0 8.3 333 26.1 1.6
64 NLA12_MN-202 NORTHERN FORESTS 08/01/2012 11:00 7.5 95.1 434.0 7.3 38 24.3 >2.2 1 1
65 NLA12_MN-203 GREAT PLAINS 07/23/2012 15:00 18.5 257.9 133.0 8.7 948 30.9 0.2 4 4
66 NLA12_MN-204 GREAT PLAINS 07/11/2012 15:30 11.5 151.1 267.0 9.0 293 28.4 0.3 2 3
67 NLA12_MN-205 EASTERN TEMPERATE F07/23/2012 17:30 12.9 173.0 111.0 9.1 243 28.7 1.0 2 1
68 NLA12_MN-206 NORTHERN FORESTS 06/26/2012 14:30 11.9 316.0 8.2 178 24.2 2 2
69 NLA12_MN-207 EASTERN TEMPERATE F08/01/2012 15:30 10.1 136.1 322.0 9.1 424 27.7 0.6 4 4
70 NLA12_MN-211 EASTERN TEMPERATE F08/07/2012 10:30 8.8 113.2 252.0 9.1 188 25.1 >1.1 2 2
71 NLA12_MN-212 EASTERN TEMPERATE F08/07/2012 15:00 11.6 157.4 198.0 180 28.4 >1.6 2 2
72 NLA12_MN-213A EASTERN TEMPERATE F07/31/2012 15:30 11.5 148.4 214.0 8.9 652 27.0 0.5 3 3
73 NLA12_MN-214 NORTHERN FORESTS 08/07/2012 11:00 7.2 87.7 400.0 7.8 68 22.6 1.8 3 1
74 NLA12_MN-215 GREAT PLAINS 07/09/2012 14:00 10.2 140.5 189.0 9.0 555 30.5 0.4 4 4
75 NLA12_MN-217 NORTHERN FORESTS 06/27/2012 15:00 9.9 129.5 191.0 9.1 76 25.1 0.8 3 4
76 NLA12_MN-218A NORTHERN FORESTS 7/30/2012 7.7 97.0 393 7.7 54 23.4 1.8 2 1
77 NLA12_MN-219 GREAT PLAINS 08/20/2012 14:00 16.8 209.7 357.0 9.0 822 25.3 0.2 5 5
78 NLA12_MN-220 GREAT PLAINS 07/17/2012 14:00 11.2 152.7 179.0 9.0 701 27.9 0.2 4 4
79 NLA12_MN-221 EASTERN TEMPERATE F06/11/2012 17:00 9.8 112.9 182.0 8.6 518 21.7 2.1 2 2
80 NLA12_MN-227 EASTERN TEMPERATE F08/07/2012 13:00 8.8 118.7 297.0 7.6 39 27.8 >1.2 2 2
81 NLA12_MN-228 GREAT PLAINS 07/23/2012 12:30 14.0 195.1 66.0 9.2 492 30.8 >1 1 1
82 NLA12_MN-229A NORTHERN FORESTS 06/27/2012 09:00 7.5 93.8 283.0 7.3 57 23.3 2.8 1 1
83 NLA12_MN-233 NORTHERN FORESTS 08/09/2012 14:30 4.2 50.6 338.0 7.4 244 22.4 1.5 1 1
84 NLA12_MN-235 GREAT PLAINS 08/22/2012 11:30 10.3 123.7 308.0 9.1 746 22.5 >1.1 2 3
85 NLA12_MN-236 EASTERN TEMPERATE F07/12/2012 11:00 13.6 173.1 273.0 9.9 321 26.6 0.3 4 4
86 NLA12_MN-237 EASTERN TEMPERATE F08/09/2012 10:30 8.3 105.1 232.0 350 24.5 0.3 2 2
87 NLA12_MN-240 NORTHERN FORESTS 07/23/2012 12:00 2.5 31.5 433.0 6.2 15 26.6 1.0 4 3
88 NLA12_MN-243 NORTHERN FORESTS 08/06/2012 12:30 7.4 90.8 195.0 7.3 69 24.8 1.7 1 1
89 NLA12_MN-245 EASTERN TEMPERATE F08/08/2012 12:30 9.4 117.7 302.0 9.1 174 24.3 >1.1 1 1
90 NLA12_MN-247 GREAT PLAINS 06/13/2012 20:00 9.2 106.3 348.0 8.1 409 21.1 0.4 4 4
91 NLA12_MN-248 EASTERN TEMPERATE F08/20/2012 15:15 8.8 109.1 312.0 8.2 298 24.7 1.1 2 2
92 NLA12_MN-249 NORTHERN FORESTS 07/10/2012 17:30 13.8 179.5 195.0 8.9 212 27.4 0.7 3 3
93 NLA12_MN-250 GREAT PLAINS 08/15/2012 12:30 7.6 92.1 345.0 8.4 453 22.3 0.1 2 4
94 NLA12_MN-251 GREAT PLAINS 07/09/2012 16:00 12.0 165.9 208.0 8.9 1399 30.4 0.5 4 4
95 NLA12_MN-252 EASTERN TEMPERATE F06/12/2012 20:00 9.5 112.5 296.0 9.2 282 22.5 >2 3 3
96 NLA12_MN-253 EASTERN TEMPERATE F07/31/2012 17:45 10.4 136.2 196.0 8.7 318 27.7 0.7 3 3
97 NLA12_MN-254 NORTHERN FORESTS 08/06/2012 16:30 8.3 105.3 172.0 7.0 49 26.3 >1.1 1 1
98 NLA12_MN-255 EASTERN TEMPERATE F07/30/2012 13:45 13.9 177.9 222.0 8.7 531 26.4 0.8 4 4
99 NLA12_MN-256 NORTHERN FORESTS 07/23/2012 17:30 8.6 114.5 363.0 7.7 112 29.1 1.0 3 3
100 NLA12_MN-258 NORTHERN FORESTS 08/06/2012 12:30 7.1 88.5 335.0 8.1 164 23.8 1.5 2 2
National Lakes Assessment: 2012 • January 2016 Minnesota Pollution Control Agency
63
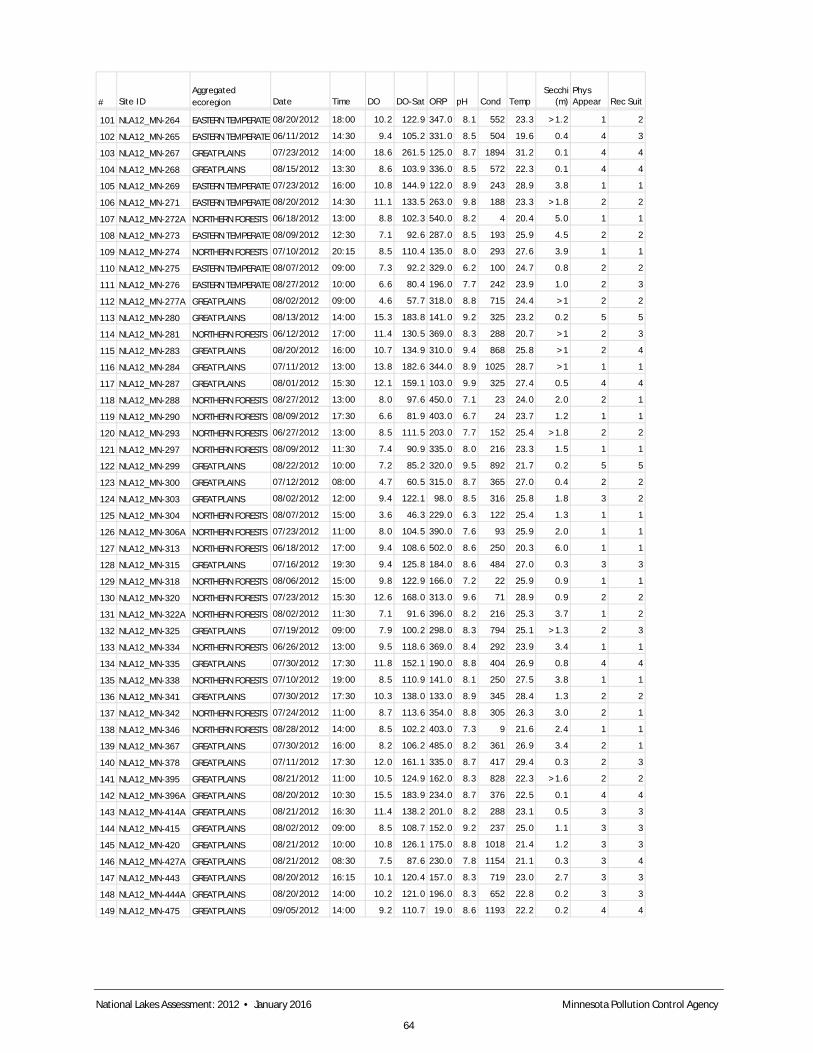
# Site IDAggregated ecoregion Date Time DO DO-Sat ORP pH Cond Temp
Secchi (m)
Phys Appear Rec Suit
101 NLA12_MN-264 EASTERN TEMPERATE F08/20/2012 18:00 10.2 122.9 347.0 8.1 552 23.3 >1.2 1 2
102 NLA12_MN-265 EASTERN TEMPERATE F06/11/2012 14:30 9.4 105.2 331.0 8.5 504 19.6 0.4 4 3
103 NLA12_MN-267 GREAT PLAINS 07/23/2012 14:00 18.6 261.5 125.0 8.7 1894 31.2 0.1 4 4
104 NLA12_MN-268 GREAT PLAINS 08/15/2012 13:30 8.6 103.9 336.0 8.5 572 22.3 0.1 4 4
105 NLA12_MN-269 EASTERN TEMPERATE F07/23/2012 16:00 10.8 144.9 122.0 8.9 243 28.9 3.8 1 1
106 NLA12_MN-271 EASTERN TEMPERATE F08/20/2012 14:30 11.1 133.5 263.0 9.8 188 23.3 >1.8 2 2
107 NLA12_MN-272A NORTHERN FORESTS 06/18/2012 13:00 8.8 102.3 540.0 8.2 4 20.4 5.0 1 1
108 NLA12_MN-273 EASTERN TEMPERATE F08/09/2012 12:30 7.1 92.6 287.0 8.5 193 25.9 4.5 2 2
109 NLA12_MN-274 NORTHERN FORESTS 07/10/2012 20:15 8.5 110.4 135.0 8.0 293 27.6 3.9 1 1
110 NLA12_MN-275 EASTERN TEMPERATE F08/07/2012 09:00 7.3 92.2 329.0 6.2 100 24.7 0.8 2 2
111 NLA12_MN-276 EASTERN TEMPERATE F08/27/2012 10:00 6.6 80.4 196.0 7.7 242 23.9 1.0 2 3
112 NLA12_MN-277A GREAT PLAINS 08/02/2012 09:00 4.6 57.7 318.0 8.8 715 24.4 >1 2 2
113 NLA12_MN-280 GREAT PLAINS 08/13/2012 14:00 15.3 183.8 141.0 9.2 325 23.2 0.2 5 5
114 NLA12_MN-281 NORTHERN FORESTS 06/12/2012 17:00 11.4 130.5 369.0 8.3 288 20.7 >1 2 3
115 NLA12_MN-283 GREAT PLAINS 08/20/2012 16:00 10.7 134.9 310.0 9.4 868 25.8 >1 2 4
116 NLA12_MN-284 GREAT PLAINS 07/11/2012 13:00 13.8 182.6 344.0 8.9 1025 28.7 >1 1 1
117 NLA12_MN-287 GREAT PLAINS 08/01/2012 15:30 12.1 159.1 103.0 9.9 325 27.4 0.5 4 4
118 NLA12_MN-288 NORTHERN FORESTS 08/27/2012 13:00 8.0 97.6 450.0 7.1 23 24.0 2.0 2 1
119 NLA12_MN-290 NORTHERN FORESTS 08/09/2012 17:30 6.6 81.9 403.0 6.7 24 23.7 1.2 1 1
120 NLA12_MN-293 NORTHERN FORESTS 06/27/2012 13:00 8.5 111.5 203.0 7.7 152 25.4 >1.8 2 2
121 NLA12_MN-297 NORTHERN FORESTS 08/09/2012 11:30 7.4 90.9 335.0 8.0 216 23.3 1.5 1 1
122 NLA12_MN-299 GREAT PLAINS 08/22/2012 10:00 7.2 85.2 320.0 9.5 892 21.7 0.2 5 5
123 NLA12_MN-300 GREAT PLAINS 07/12/2012 08:00 4.7 60.5 315.0 8.7 365 27.0 0.4 2 2
124 NLA12_MN-303 GREAT PLAINS 08/02/2012 12:00 9.4 122.1 98.0 8.5 316 25.8 1.8 3 2
125 NLA12_MN-304 NORTHERN FORESTS 08/07/2012 15:00 3.6 46.3 229.0 6.3 122 25.4 1.3 1 1
126 NLA12_MN-306A NORTHERN FORESTS 07/23/2012 11:00 8.0 104.5 390.0 7.6 93 25.9 2.0 1 1
127 NLA12_MN-313 NORTHERN FORESTS 06/18/2012 17:00 9.4 108.6 502.0 8.6 250 20.3 6.0 1 1
128 NLA12_MN-315 GREAT PLAINS 07/16/2012 19:30 9.4 125.8 184.0 8.6 484 27.0 0.3 3 3
129 NLA12_MN-318 NORTHERN FORESTS 08/06/2012 15:00 9.8 122.9 166.0 7.2 22 25.9 0.9 1 1
130 NLA12_MN-320 NORTHERN FORESTS 07/23/2012 15:30 12.6 168.0 313.0 9.6 71 28.9 0.9 2 2
131 NLA12_MN-322A NORTHERN FORESTS 08/02/2012 11:30 7.1 91.6 396.0 8.2 216 25.3 3.7 1 2
132 NLA12_MN-325 GREAT PLAINS 07/19/2012 09:00 7.9 100.2 298.0 8.3 794 25.1 >1.3 2 3
133 NLA12_MN-334 NORTHERN FORESTS 06/26/2012 13:00 9.5 118.6 369.0 8.4 292 23.9 3.4 1 1
134 NLA12_MN-335 GREAT PLAINS 07/30/2012 17:30 11.8 152.1 190.0 8.8 404 26.9 0.8 4 4
135 NLA12_MN-338 NORTHERN FORESTS 07/10/2012 19:00 8.5 110.9 141.0 8.1 250 27.5 3.8 1 1
136 NLA12_MN-341 GREAT PLAINS 07/30/2012 17:30 10.3 138.0 133.0 8.9 345 28.4 1.3 2 2
137 NLA12_MN-342 NORTHERN FORESTS 07/24/2012 11:00 8.7 113.6 354.0 8.8 305 26.3 3.0 2 1
138 NLA12_MN-346 NORTHERN FORESTS 08/28/2012 14:00 8.5 102.2 403.0 7.3 9 21.6 2.4 1 1
139 NLA12_MN-367 GREAT PLAINS 07/30/2012 16:00 8.2 106.2 485.0 8.2 361 26.9 3.4 2 1
140 NLA12_MN-378 GREAT PLAINS 07/11/2012 17:30 12.0 161.1 335.0 8.7 417 29.4 0.3 2 3
141 NLA12_MN-395 GREAT PLAINS 08/21/2012 11:00 10.5 124.9 162.0 8.3 828 22.3 >1.6 2 2
142 NLA12_MN-396A GREAT PLAINS 08/20/2012 10:30 15.5 183.9 234.0 8.7 376 22.5 0.1 4 4
143 NLA12_MN-414A GREAT PLAINS 08/21/2012 16:30 11.4 138.2 201.0 8.2 288 23.1 0.5 3 3
144 NLA12_MN-415 GREAT PLAINS 08/02/2012 09:00 8.5 108.7 152.0 9.2 237 25.0 1.1 3 3
145 NLA12_MN-420 GREAT PLAINS 08/21/2012 10:00 10.8 126.1 175.0 8.8 1018 21.4 1.2 3 3
146 NLA12_MN-427A GREAT PLAINS 08/21/2012 08:30 7.5 87.6 230.0 7.8 1154 21.1 0.3 3 4
147 NLA12_MN-443 GREAT PLAINS 08/20/2012 16:15 10.1 120.4 157.0 8.3 719 23.0 2.7 3 3
148 NLA12_MN-444A GREAT PLAINS 08/20/2012 14:00 10.2 121.0 196.0 8.3 652 22.8 0.2 3 3
149 NLA12_MN-475 GREAT PLAINS 09/05/2012 14:00 9.2 110.7 19.0 8.6 1193 22.2 0.2 4 4
National Lakes Assessment: 2012 • January 2016 Minnesota Pollution Control Agency
64

NLA 2012 lakes: nutrient and chlorophyll data
# Site IDTotal P (ug/L)
DOP (mg/L)
Chl-a (μg/L)
Pheo-a (ug/L)
Microcystin (ug/L)
TKN (mg/L)
Total N (mg/L)
NO3 (mg N/L)
NH3-N (mg/L)
1 NLA12_MN-101 22 < 0.005 8.0 1.7 < 0.15 0.64 0.52 0.002 0.011
2 NLA12_MN-102 44 < 0.005 5.7 1.7 0.26 0.58 0.50 0.004 0.025
3 NLA12_MN-103 36 14.0 <0.15 0.69 0.008 0.019
4 NLA12_MN-104 38 < 0.005 1.8 < 0.81 < 0.15 0.68 0.66 0.002 0.017
5 NLA12_MN-105 26 5.5 0.40 0.016 0.074
6 NLA12_MN-106 48 < 0.005 2.9 < 0.53 < 0.15 0.60 0.63 0.000 0.011
7 NLA12_MN-107 98 0.012 41.8 2.0 < 0.15 1.67 4.06 2.795 0.032
8 NLA12_MN-108 21 3.5 <0.15 0.40 0.002 0.021
9 NLA12_MN-109 25 4.1 <0.15 1.06 0.016 0.242
10 NLA12_MN-110 40 < 0.005 12.2 < 0.95 < 0.15 0.87 0.79 0.003 0.025
11 NLA12_MN-111 20 < 0.005 2.7 < 0.61 < 0.15 0.82 0.68 0.003 0.026
12 NLA12_MN-112 159 < 0.005 92.8 6.7 1.3 1.50 2.89 0.000 0.019
13 NLA12_MN-113 236 203.4 2.79 3.84 0.000 0.020
14 NLA12_MN-114 159 115.7 0.92 3.01 0.000 0.021
15 NLA12_MN-115 56 < 0.005 3.5 0.7 < 0.15 0.56 0.54 0.002 0.011
16 NLA12_MN-116 30 < 0.005 26.2 < 0.54 0.17 1.10 1.03 0.002 0.009
17 NLA12_MN-118 524 0.008 122.4 13.5 0.54 6.04 4.90 0.002 0.022
18 NLA12_MN-119 152 0.027 38.3 < 2.38 < 0.15 1.43 1.36 0.002 0.030
19 NLA12_MN-120 46 < 0.005 2.6 < 0.99 0.19 0.88 0.73 0.000 0.014
20 NLA12_MN-121 54 < 0.005 18.5 < 1.21 0.18 1.36 1.45 0.000 0.014
21 NLA12_MN-122 38 < 0.005 3.4 < 1.14 < 0.15 0.87 0.79 0.005 0.033
22 NLA12_MN-123 91 20.4 < 0.15 1.31 0.236 0.329
23 NLA12_MN-126 28 14.0 0.19 0.77 0.000 0.027
24 NLA12_MN-127 110 40.8 < 0.15 1.99 0.000 0.015
25 NLA12_MN-130A 31 7.5 < 0.15 0.56 0.004 0.015
26 NLA12_MN-131 82 3.0 < 0.15 1.70 0.002 0.016
27 NLA12_MN-132 38 < 0.005 5.2 0.9 < 0.15 0.95 0.98 0.090 0.046
28 NLA12_MN-135 259 80.0 0.41 3.88 0.003 0.892
29 NLA12_MN-136 82 13.4 < 0.15 0.90 0.000 0.010
30 NLA12_MN-137 272 107.2 8.20 4.64 0.000 0.026
31 NLA12_MN-138A 28 4.6 < 0.15 0.38 0.013 0.017
32 NLA12_MN-141 41 4.4 < 0.15 0.53 0.002 0.017
33 NLA12_MN-143 69 30.1 1.89 0.000 0.013
34 NLA12_MN-144 25 1.6 < 0.15 0.67 0.000 0.012
35 NLA12_MN-145 28 3.0 < 0.15 0.69 0.000 0.017
36 NLA12_MN-147 45 10.2 < 0.15 0.74 0.002 0.013
37 NLA12_MN-150 17 6.1 < 0.15 0.76 0.003 0.013
38 NLA12_MN-152 132 59.6 0.17 1.76 0.000 0.011
39 NLA12_MN-153 22 6.7 < 0.15 0.59 0.000 0.020
40 NLA12_MN-157 86 50.4 0.17 2.05 0.002 0.018
41 NLA12_MN-158 425 97.6 0.54 4.36 0.000 0.019
42 NLA12_MN-160 40 15.2 0.17 0.90 0.002 0.008
43 NLA12_MN-162 23 7.5 < 0.15 0.87 0.004 0.013
44 NLA12_MN-163 107 68.2 1.04 1.27 0.000 0.008
45 NLA12_MN-167 172 48.8 0.38 1.58 0.002 0.015
46 NLA12_MN-170A 32 5.5 < 0.15 0.40 0.003 0.011
47 NLA12_MN-171 72 18.7 0.23 1.96 0.002 0.036
48 NLA12_MN-177 243 0.020 77.2 18.4 0.23 2.18 2.36 0.002 0.040
49 NLA12_MN-178A 5 < 0.005 8.0 3.0 < 0.15 0.58 0.58 < 0.05 < 0.05
50 NLA12_MN-180 40 < 0.005 18.3 < 1.24 0.25 1.37 1.40 0.002 0.017
National Lakes Assessment: 2012 • January 2016 Minnesota Pollution Control Agency
65

51 NLA12_MN-181 49 < 0.005 2.6 < 0.15 0.90 0.94 0.003 0.054
52 NLA12_MN-184 19 < 0.005 20.4 2.8 0.29 1.28 1.28 < 0.05 < 0.05
53 NLA12_MN-185 10 < 0.005 2.4 0.6 0.29 1.01 1.01 < 0.05 < 0.05
54 NLA12_MN-186 131 0.092 42.0 17.2 < 0.15 2.43 2.43 < 0.05 0.30
55 NLA12_MN-187 19 < 0.005 8.1 < 0.88 < 0.15 1.37 1.37 < 0.05 < 0.05
56 NLA12_MN-189 28 < 0.005 17.1 4.7 < 0.15 1.68 1.68 < 0.05 < 0.05
57 NLA12_MN-191 24 0.006 95.2 4.6 0.29 2.62 2.62 < 0.05 < 0.05
58 NLA12_MN-195 40 0.010 11.8 2.0 0.2 1.76 1.76 < 0.05 < 0.05
59 NLA12_MN-196 47 < 0.005 24.2 3.8 < 0.15 1.61 1.61 < 0.05 < 0.05
60 NLA12_MN-197 10 < 0.005 2.2 < 0.94 < 0.15 0.84 0.84 < 0.05 < 0.05
61 NLA12_MN-199 29 < 0.005 40.3 2.3 1.40 1.40 < 0.05 0.09
62 NLA12_MN-200 10 < 0.005 3.5 < 1.58 0.22 1.37 1.37 < 0.05 < 0.05
63 NLA12_MN-201 41 < 0.005 9.0 3.9 0.19 1.49 1.49 < 0.05 < 0.05
64 NLA12_MN-202 5 < 0.005 3.0 0.6 < 0.15 0.54 0.54 < 0.05 < 0.05
65 NLA12_MN-203 422 0.305 194.0 16.5 0.24 3.80 3.80 < 0.05 < 0.05
66 NLA12_MN-204 76 0.006 170.0 14.2 < 0.15 3.46 3.46 < 0.05 < 0.05
67 NLA12_MN-205 13 < 0.005 13.0 1.5 0.19 1.05 1.05 < 0.05 < 0.05
68 NLA12_MN-206 10 < 0.005 6.3 1.8 < 0.15 1.39 1.39 < 0.05 < 0.05
69 NLA12_MN-207 29 0.005 26.5 1.1 1.13 2.24 2.24 < 0.05 < 0.05
70 NLA12_MN-211 10 < 0.005 4.8 0.7 < 0.15 1.00 1.00 < 0.05 < 0.05
71 NLA12_MN-212 15 0.007 3.3 0.7 0.17 1.26 1.26 < 0.05 < 0.05
72 NLA12_MN-213A 43 < 0.005 88.3 5.5 2.2 3.05 3.05 < 0.05 < 0.05
73 NLA12_MN-214 9 < 0.005 10.2 2.0 0.24 0.57 0.57 < 0.05 < 0.05
74 NLA12_MN-215 18 0.010 36.8 < 2.59 0.35 2.75 2.75 < 0.05 < 0.05
75 NLA12_MN-217 23 0.009 14.6 < 5.61 < 0.15 0.92 0.92 < 0.05 < 0.05
76 NLA12_MN-218A 10 <0.005 9.5 1.7 <0.15 0.48 0.48 <0.05 <0.05
77 NLA12_MN-219 129 0.042 177.0 23.3 1 5.42 5.42 < 0.05 0.06
78 NLA12_MN-220 59 0.006 214.0 9.8 0.56 5.12 5.12 < 0.05 < 0.05
79 NLA12_MN-221 16 < 0.005 9.0 < 0.78 < 0.15 1.27 1.27 < 0.05 < 0.05
80 NLA12_MN-227 10 < 0.005 3.6 1.9 < 0.15 0.80 0.80 < 0.05 < 0.05
81 NLA12_MN-228 21 < 0.005 13.7 3.4 0.2 1.97 1.97 < 0.05 < 0.05
82 NLA12_MN-229A 15 < 0.005 3.2 1.0 < 0.15 0.83 0.83 < 0.05 < 0.05
83 NLA12_MN-233 23 < 0.005 26.3 3.5 0.17 1.05 1.05 < 0.05 < 0.05
84 NLA12_MN-235 0.828 6.7 3.2 < 0.15 2.00 2.00 < 0.05 < 0.05
85 NLA12_MN-236 32 0.007 78.4 < 1.94 1.44 3.04 3.04 < 0.05 < 0.05
86 NLA12_MN-237 44 0.005 93.2 11.8 0.64 2.31 2.31 < 0.05 < 0.05
87 NLA12_MN-240 32 0.017 66.1 26.6 < 0.15 1.36 1.36 < 0.05 < 0.05
88 NLA12_MN-243 10 < 0.005 11.9 2.5 0.17 0.70 0.70 < 0.05 < 0.05
89 NLA12_MN-245 10 < 0.005 3.3 0.6 < 0.15 0.59 0.59 < 0.05 < 0.05
90 NLA12_MN-247 136 0.087 55.2 9.3 0.63 3.60 4.56 0.96 1.44
91 NLA12_MN-248 17 < 0.005 23.7 3.1 < 0.15 1.09 1.09 < 0.05 < 0.05
92 NLA12_MN-249 27 < 0.005 37.5 2.8 0.24 1.77 1.77 < 0.05 < 0.05
93 NLA12_MN-250 260 < 0.005 259.0 103.0 0.23 3.89 3.89 < 0.05 < 0.05
94 NLA12_MN-251 40 0.009 43.6 < 1.35 < 0.15 2.48 2.48 < 0.05 < 0.05
95 NLA12_MN-252 128 0.080 2.4 < 0.98 0.23 1.36 1.36 < 0.05 < 0.05
96 NLA12_MN-253 19 0.006 18.2 < 1.15 1.3 1.41 1.41 < 0.05 < 0.05
97 NLA12_MN-254 10 < 0.005 2.4 0.9 < 0.15 0.90 0.90 < 0.05 < 0.05
98 NLA12_MN-255 238 0.142 27.9 11.0 0.22 1.90 1.90 < 0.05 < 0.05
99 NLA12_MN-256 6 < 0.005 3.4 1.4 0.15 0.82 0.82 < 0.05 < 0.05
100 NLA12_MN-258 10 < 0.005 8.9 3.1 < 0.15 0.63 0.63 < 0.05 < 0.05
National Lakes Assessment: 2012 • January 2016 Minnesota Pollution Control Agency
66

# Site IDTotal P (ug/L)
DOP (mg/L)
Chl-a (μg/L)
Pheo-a (ug/L)
Microcystin (ug/L)
TKN (mg/L)
Total N (mg/L)
NO3 (mg N/L)
NH3-N (mg/L)
101 NLA12_MN-264 9 0.008 3.6 1.7 < 0.15 0.69 0.69 < 0.05 < 0.05
102 NLA12_MN-265 79 < 0.005 71.7 20.6 < 0.15 3.78 3.78 < 0.05 < 0.05
103 NLA12_MN-267 65 0.013 254.0 18.7 0.18 5.62 5.62 < 0.05 < 0.05
104 NLA12_MN-268 240 0.143 189.0 12.6 0.25 3.09 3.09 < 0.05 < 0.05
105 NLA12_MN-269 10 < 0.005 4.5 0.6 0.15 0.66 0.66 < 0.05 < 0.05
106 NLA12_MN-271 123 0.089 5.1 < 1.24 < 0.15 1.02 1.02 < 0.05 < 0.05
107 NLA12_MN-272A 2 < 0.005 3.1 < 0.75 < 0.15 < 0.2 < 0.2 < 0.05 < 0.05
108 NLA12_MN-273 6 < 0.005 2.7 < 0.5 < 0.15 0.47 0.47 < 0.05 < 0.05
109 NLA12_MN-274 10 < 0.005 2.8 1.0 < 0.15 0.64 0.64 < 0.05 < 0.05
110 NLA12_MN-275 12 < 0.005 3.8 1.7 < 0.15 0.83 0.83 < 0.05 < 0.05
111 NLA12_MN-276 37 0.006 5.5 1.4 0.36 1.60 1.60 < 0.05 0.14
112 NLA12_MN-277A 10 0.007 7.6 < 0.96 < 0.15 1.75 1.75 < 0.05 < 0.05
113 NLA12_MN-280 159 0.014 522.0 47.6 1.7 6.16 6.16 < 0.05 < 0.05
114 NLA12_MN-281 23 < 0.005 14.6 2.8 < 0.15 0.77 0.77 < 0.05 < 0.05
115 NLA12_MN-283 39 0.006 7.0 < 2.32 < 0.15 2.12 2.12 < 0.05 < 0.05
116 NLA12_MN-284 20 0.008 13.9 < 0.95 0.4 1.85 1.85 < 0.05 < 0.05
117 NLA12_MN-287 21 < 0.005 35.8 < 0.77 2.92 1.47 1.47 < 0.05 < 0.05
118 NLA12_MN-288 18 0.009 19.5 5.1 < 0.15 0.90 0.90 < 0.05 < 0.05
119 NLA12_MN-290 13 < 0.005 24.3 2.0 < 0.15 0.80 0.80 < 0.05 < 0.05
120 NLA12_MN-293 17 < 0.005 3.1 3.3 < 0.15 0.78 0.78 < 0.05 < 0.05
121 NLA12_MN-297 12 < 0.005 6.8 1.5 < 0.15 1.04 1.04 < 0.05 < 0.05
122 NLA12_MN-299 133 0.015 347.0 10.1 0.27 8.10 8.10 < 0.05 < 0.05
123 NLA12_MN-300 82 0.009 71.0 15.4 < 0.15 2.76 2.76 < 0.05 < 0.05
124 NLA12_MN-303 21 < 0.005 23.7 1.7 < 0.15 1.18 1.18 < 0.05 < 0.05
125 NLA12_MN-304 15 < 0.005 39.9 13.8 < 0.15 0.84 0.84 < 0.05 < 0.05
126 NLA12_MN-306A 10 < 0.005 3.4 < 0.8 0.15 0.44 0.44 < 0.05 < 0.05
127 NLA12_MN-313 8 < 0.005 1.7 < 0.6 < 0.15 0.45 0.45 < 0.05 < 0.05
128 NLA12_MN-315 398 0.180 152.0 9.2 0.54 4.20 4.20 < 0.05 < 0.05
129 NLA12_MN-318 28 <0.05 77.7 19.1 0.24 1.78 1.78 <0.05 <0.05
130 NLA12_MN-320 12 0.017 51.6 6.7 0.58 1.44 1.44 < 0.05 < 0.05
131 NLA12_MN-322A 6 < 0.005 1.9 0.9 < 0.15 0.36 0.36 < 0.05 < 0.05
132 NLA12_MN-325 7 0.009 3.1 0.7 < 0.15 1.97 1.97 < 0.05 < 0.05
133 NLA12_MN-334 12 < 0.005 1.9 1.1 < 0.15 1.12 1.12 < 0.05 < 0.05
134 NLA12_MN-335 5 < 0.005 69.5 6.3 0.31 2.40 2.40 < 0.05 < 0.05
135 NLA12_MN-338 11 < 0.005 3.4 < 0.96 < 0.15 0.79 0.79 < 0.05 < 0.05
136 NLA12_MN-341 18 0.006 6.6 1.0 1.18 1.42 1.42 < 0.05 < 0.05
137 NLA12_MN-342 7 < 0.005 4.4 0.9 0.61 0.52 0.52 < 0.05 < 0.05
138 NLA12_MN-346 3 < 0.005 10.5 2.3 < 0.15 0.49 0.49 < 0.05 < 0.05
139 NLA12_MN-367 13 < 0.005 3.0 0.8 < 0.15 0.54 0.54 < 0.05 < 0.05
140 NLA12_MN-378 37 < 0.005 49.4 < 2.51 2.42 1.53 1.53 < 0.05 < 0.05
141 NLA12_MN-395 33 0.014 3.4 <0.79 < 0.15 1.16 1.16 < 0.05 < 0.05
142 NLA12_MN-396A 137 0.032 309.0 2.5 0.59 5.26 5.26 < 0.05 < 0.05
143 NLA12_MN-414A 51 < 0.005 39.7 2.3 < 0.15 2.12 2.12 < 0.05 0.10
144 NLA12_MN-415 13 0.005 18.1 1.5 1.23 1.32 1.32 < 0.05 < 0.05
145 NLA12_MN-420 27 0.005 12.6 < 0.79 0.15 1.55 1.55 < 0.05 < 0.05
146 NLA12_MN-427A 291 0.235 26.3 7.5 0.15 3.46 3.54 0.08 1.39
147 NLA12_MN-443 22 0.009 24.7 < 0.81 0.17 1.26 1.26 < 0.05 < 0.05
148 NLA12_MN-444A 44 0.025 74.8 < 4.86 < 0.15 1.73 1.73 < 0.05 < 0.05
149 NLA12_MN-475 241 0.129 119.0 4.5 0.23 3.82 3.82 < 0.05 < 0.05
National Lakes Assessment: 2012 • January 2016 Minnesota Pollution Control Agency
67

NLA 2012 lakes: cation, anion, color, and organic carbon data
# Site IDCa
(mg/L)Mg
(mg/L)Na
(mg/L)K (mg/L)
SiO2
(mg/L)Alk (mg/L)
SO4
(mg/L)Cl (mg/L)
Color (Pt-Co Units)
DOC (mg/L)
TOC (mg/L)
1 NLA12_MN-101 15.6 3.8 3.7 1.1 7.0 56 1.3 1.8 52 11.6 12.0
2 NLA12_MN-102 15.1 5.1 4.9 0.5 23.0 55 2.4 1.8 35 8.6 8.9
3 NLA12_MN-103 5.1 2.2 1.6 0.9 4.3 23 0.1 1.2 62 9.0
4 NLA12_MN-104 15.5 17.5 2.0 1.1 16.5 110 0.0 2.5 18 6.4 6.6
5 NLA12_MN-105 2.6 1.8 1.2 0.6 3.2 11 1.8 0.2 165 18.2
6 NLA12_MN-106 27.7 26.5 8.4 4.3 13.0 170 11.3 16.6 10 6.8 7.4
7 NLA12_MN-107 68.9 26.5 10.8 4.3 7.1 220 37.2 20.8 32 8.7 10.0
8 NLA12_MN-108 29.4 16.1 4.3 1.6 11.0 145 1.7 1.9 11 4.6
9 NLA12_MN-109 4.4 1.4 1.2 0.3 2.9 14 2.5 0.1 43 11.5
10 NLA12_MN-110 34.0 6.9 2.8 0.6 16.3 110 3.1 2.4 32 10.9 11.0
11 NLA12_MN-111 29.1 10.3 38.5 2.1 0.9 98 9.5 63.9 14 7.3 7.7
12 NLA12_MN-112 20.5 17.6 7.2 4.5 12.4 280 10.4 17.7 38 15.7 17.0
13 NLA12_MN-113 65.2 56.9 12.1 5.7 46.9 115 280.9 10.4 25 12.7
14 NLA12_MN-114 16.7 29.0 15.1 5.3 20.2 143 2.3 32.6 32 14.9
15 NLA12_MN-115 24.6 23.5 2.3 2.2 19.3 130 14.1 7.6 15 5.0 6.6
16 NLA12_MN-116 31.3 6.0 55.2 3.9 5.5 95 7.5 84.2 15 6.4 7.4
17 NLA12_MN-118 18.9 12.8 104.5 9.3 17.9 120 14.4 149.8 29 18.3 31.0
18 NLA12_MN-119 114.1 81.7 49.5 9.6 30.8 180 513.1 16.5 25 9.2 11.0
19 NLA12_MN-120 26.1 16.5 2.6 1.6 12.8 130 0.0 0.9 17 8.4 8.8
20 NLA12_MN-121 26.5 30.5 5.1 6.5 12.2 170 18.4 14.9 14 11.6 14.0
21 NLA12_MN-122 20.2 23.3 6.6 3.8 7.2 120 8.8 21.3 23 8.3 8.0
22 NLA12_MN-123 128.3 77.0 31.4 5.1 46.1 281 374.4 11.4 28 5.6
23 NLA12_MN-126 2.9 1.1 0.4 0.8 0.3 12 0.0 0.0 20 9.1
24 NLA12_MN-127 47.6 67.7 12.6 11.9 31.0 189 214.7 10.6 25 15.1
25 NLA12_MN-130A 4.0 1.7 1.3 0.6 2.7 13 3.3 0.3 125 14.4
26 NLA12_MN-131 22.1 28.9 3.0 3.4 36.6 158 2.9 7.6 32 15.2
27 NLA12_MN-132 56.5 18.5 4.8 4.5 10.0 200 5.0 12.8 25 10.8 11.0
28 NLA12_MN-135 30.4 34.2 7.3 7.8 17.8 208 3.5 18.7 31 19.1
29 NLA12_MN-136 15.1 5.4 0.9 4.4 14.3 64 0.0 0.4 30 8.0
30 NLA12_MN-137 13.9 87.3 44.3 29.0 3.2 317 135.5 37.5 28 21.3
31 NLA12_MN-138A 3.8 1.2 1.2 0.3 7.0 11 1.5 0.2 150 19.0
32 NLA12_MN-141 26.7 21.3 5.2 2.2 19.9 155 6.0 7.7 11 6.1
33 NLA12_MN-143 21.1 29.6 2.8 5.0 6.8 177 0.1 1.5 30 12.7
34 NLA12_MN-144 19.6 8.3 3.7 0.2 1.8 82 1.7 2.4 30 7.7
35 NLA12_MN-145 19.4 8.5 3.9 1.6 1.0 81 0.2 8.2 15 7.3
36 NLA12_MN-147 1.9 0.8 0.6 0.9 0.2 8 0.2 0.5 38 7.3
37 NLA12_MN-150 11.6 0.0 0.1 0.4 5.3 25 3.4 0.1 100 19.5
38 NLA12_MN-152 21.4 26.3 2.6 3.1 24.2 158 3.0 5.1 16 8.0
39 NLA12_MN-153 38.1 15.3 1.1 1.5 5.6 154 0.0 0.3 20 7.3
40 NLA12_MN-157 27.9 106.6 30.7 23.8 22.5 345 226.3 12.6 28 15.4
41 NLA12_MN-158 23.6 20.0 4.0 17.7 22.8 153 0.0 11.7 33 16.6
42 NLA12_MN-160 1.8 0.7 0.4 0.9 0.3 8 0.0 0.1 30 9.4
43 NLA12_MN-162 3.5 1.3 3.9 2.4 0.2 13 0.5 5.6 85 16.8
44 NLA12_MN-163 31.1 8.5 5.7 1.0 10.3 104 7.1 10.5 34 7.6
45 NLA12_MN-167 30.9 27.1 4.4 4.3 17.7 179 13.8 8.8 23 8.6
46 NLA12_MN-170A 3.3 1.1 1.0 0.3 6.1 13 2.5 0.2 34 8.0
47 NLA12_MN-171 80.9 191.7 67.6 21.1 4.8 212 823.7 6.7 22 18.8
48 NLA12_MN-177 22.0 12.8 4.2 4.1 10.8 96 0.2 10.8 35 14.1 14.0
49 NLA12_MN-178A 2.0 0.7 1.2 0.5 1.9 < 10 2.12 < 1 100 17.1 15.0
50 NLA12_MN-180 29.9 24.4 3.5 5.6 4.8 150 22.6 8.4 22 12.0 13.0
National Lakes Assessment: 2012 • January 2016 Minnesota Pollution Control Agency
68

# Site IDCa
(mg/L)Mg
(mg/L)Na
(mg/L)K (mg/L)
SiO2
(mg/L)Alk (mg/L)
SO4
(mg/L)Cl (mg/L)
Color (Pt-Co Units)
DOC (mg/L)
TOC (mg/L)
51 NLA12_MN-181 26.7 9.7 2.0 1.2 16.9 73 0.0 0.4 22 9.3
52 NLA12_MN-184 28.2 18.8 3.9 6.6 3.9 150 < 1 6.8 10 14.2 12.0
53 NLA12_MN-185 20.7 9.6 1.9 1.3 5.9 88 < 1 1.1 20 11.4 11.0
54 NLA12_MN-186 44.4 25.0 10.8 2.2 26.9 170 11.3 25.9 20 11.2 11.0
55 NLA12_MN-187 35.0 53.0 31.8 20.4 5.6 240 34.6 73.3 40 16.4 16.0
56 NLA12_MN-189 21.6 24.6 1.9 4.9 3.5 150 < 2 1.1 20 13.1 14.0
57 NLA12_MN-191 26.7 86.9 22.3 11.6 17.7 190 229 26.3 20 14.0 14.0
58 NLA12_MN-195 48.1 51.6 39.4 10.3 8.2 150 123 98.1 70 18.1 17.0
59 NLA12_MN-196 43.5 25.5 7.0 8.2 0.6 160 6 17.9 20 10.3 12.0
60 NLA12_MN-197 15.5 26.7 9.2 5.5 8.9 130 < 1 26.8 10 11.5 9.8
61 NLA12_MN-199 31.2 36.0 6.1 4.9 6.9 180 17.2 20 15.1 14.0
62 NLA12_MN-200 25.4 18.8 5.3 1.1 1.6 120 3.56 6.8 40 17.0 16.0
63 NLA12_MN-201 31.4 24.2 2.7 4.3 3.5 170 4.49 2.9 30 13.4 14.0
64 NLA12_MN-202 4.1 1.7 1.2 0.7 2.6 13 2.6 < 1 40 10.2 9.3
65 NLA12_MN-203 71.8 84.4 15.7 12.3 22.8 190 322 19.8 30 15.7 15.0
66 NLA12_MN-204 24.6 22.7 5.5 2.4 10.0 130 19.1 14.0 20 9.4 12.0
67 NLA12_MN-205 14.0 22.6 3.1 2.5 2.8 110 < 1 14.8 5 10.4 9.1
68 NLA12_MN-206 21.7 9.9 2.5 1.2 7.1 85 1.04 < 1 40 18.9 19.0
69 NLA12_MN-207 24.8 39.4 5.9 6.2 10.6 180 35.9 10.4 30 20.4 18.0
70 NLA12_MN-211 23.1 11.6 1.5 0.5 7.7 92 < 1 4.1 40 15.1 14.0
71 NLA12_MN-212 15.0 11.9 3.8 1.0 8.2 74 < 1 11.3 30 13.6 13.0
72 NLA12_MN-213A 45.3 60.5 7.2 9.1 21.0 140 210 4.4 30 19.6 19.0
73 NLA12_MN-214 5.7 4.8 1.5 0.6 6.5 29 2.74 < 1 30 9.4 9.2
74 NLA12_MN-215 26.4 57.5 14.9 8.1 35.4 210 72.5 19.3 50 23.4 24.0
75 NLA12_MN-217 9.6 2.9 0.4 0.5 3.8 38 < 1 < 1 10 11.1 11.0
76 NLA12_MN-218A 6.8 1.8 1.5 0.5 2.1 23 2.39 1.2 20 7.0 7.0
77 NLA12_MN-219 29.6 71.8 51.2 20.3 36.0 320 128 12.7 80 43.4 45.0
78 NLA12_MN-220 23.8 65.0 27.0 16.2 27.0 280 79.8 19.0 40 24.3 25.0
79 NLA12_MN-221 30.1 54.9 8.0 10.7 2.7 280 2.85 11.3 10 12.3 13.0
80 NLA12_MN-227 5.1 1.6 0.7 < 0.3 < 0.5 11 1.04 2.0 80 14.7 14.0
81 NLA12_MN-228 20.2 53.1 10.6 10.5 1.8 210 30 30.0 60 20.7 19.0
82 NLA12_MN-229A 6.7 2.5 0.4 1.5 < 0.5 28 < 1 < 1 20 7.9 8.2
83 NLA12_MN-233 37.9 10.2 1.0 1.0 4.6 130 < 1 < 1 80 16.3 15.0
84 NLA12_MN-235 63.1 58.7 19.4 28.8 18.5 400 20.2 15.4 50 24.7 24.0
85 NLA12_MN-236 25.5 27.6 7.9 5.0 26.2 120 27.5 24.7 50 21.2 20.0
86 NLA12_MN-237 18.1 4.4 45.1 1.9 < 0.5 62 5.34 64.3 20 9.5 8.6
87 NLA12_MN-240 2.6 1.0 0.4 0.8 1.4 < 10 < 1 < 1 80 12.5 11.0
88 NLA12_MN-243 6.4 2.0 3.7 1.6 0.9 24 < 1 5.7 20 8.1 7.1
89 NLA12_MN-245 16.0 13.2 1.7 < 0.3 10.7 88 < 1 3.1 10 6.5 5.6
90 NLA12_MN-247 44.8 23.5 5.8 4.3 13.6 160 20.9 16.4 40 13.3 14.0
91 NLA12_MN-248 39.4 14.7 0.9 3.3 9.7 140 < 1 < 1 10 10.0 9.9
92 NLA12_MN-249 30.3 9.7 2.0 0.8 12.2 110 < 2 < 1 40 18.1 17.0
93 NLA12_MN-250 47.4 31.7 13.5 3.9 9.8 150 73.6 23.3 40 16.7 16.0
94 NLA12_MN-251 76.3 122.0 70.2 13.0 6.6 120 639 15.2 30 17.1 17.0
95 NLA12_MN-252 21.1 23.0 6.7 5.5 2.0 120 2.02 19.0 30 14.4 15.0
96 NLA12_MN-253 22.7 27.9 5.1 3.4 17.7 160 < 1 9.9 10 12.1 12.0
97 NLA12_MN-254 7.3 1.6 1.4 0.6 2.7 18 < 1 1.3 140 19.1 18.0
98 NLA12_MN-255 47.5 28.5 24.2 10.3 16.1 210 6.16 51.0 50 17.4 17.0
99 NLA12_MN-256 18.3 4.6 2.1 0.6 9.2 58 < 1 3.6 70 15.6 15.0
100 NLA12_MN-258 21.4 5.6 4.9 1.3 12.2 82 < 1 1.3 20 6.6 7.2
National Lakes Assessment: 2012 • January 2016 Minnesota Pollution Control Agency
69

# Site IDCa
(mg/L)Mg
(mg/L)Na
(mg/L)K (mg/L)
SiO2
(mg/L)Alk (mg/L)
SO4
(mg/L)Cl (mg/L)
Color (Pt-Co Units)
DOC (mg/L)
TOC (mg/L)
101 NLA12_MN-264 70.3 31.4 7.5 2.0 31.6 240 15.2 8.6 30 10.8 9.6
102 NLA12_MN-265 44.3 43.4 5.1 10.1 1.3 240 30.8 7.9 50 26.4 28.0
103 NLA12_MN-267 57.4 171.0 119.0 28.8 15.8 220 758 64.3 50 27.1 24.0
104 NLA12_MN-268 60.7 40.3 16.1 3.3 36.0 170 125 24.8 30 10.2 9.4
105 NLA12_MN-269 12.6 25.7 2.4 1.9 2.3 130 < 1 4.2 10 7.2 6.5
106 NLA12_MN-271 19.1 11.8 1.5 5.7 0.7 93 < 1 3.7 20 9.3 9.5
107 NLA12_MN-272A 44.1 12.2 11.5 2.1 8.9 130 18.1 20.2 5 2.2 2.2
108 NLA12_MN-273 22.9 8.7 2.7 2.9 1.8 84 < 1 9.4 10 7.1 6.3
109 NLA12_MN-274 39.0 12.5 2.5 1.5 7.0 150 1.11 1.1 20 10.6 9.7
110 NLA12_MN-275 3.2 1.8 12.4 0.3 1.3 < 10 < 1 25.7 30 10.4 10.0
111 NLA12_MN-276 26.0 14.1 3.0 4.3 3.1 110 < 1 5.8 40 15.4 14.0
112 NLA12_MN-277A 23.2 79.2 14.7 11.2 24.6 280 103 12.6 20 23.4 22.0
113 NLA12_MN-280 21.2 25.4 5.1 12.0 28.2 120 10.9 22.5 40 19.1 19.0
114 NLA12_MN-281 45.2 12.8 1.4 1.9 7.0 160 < 1 < 1 20 8.1 8.3
115 NLA12_MN-283 21.0 105.0 22.9 19.9 0.7 320 172 15.0 50 25.8 27.0
116 NLA12_MN-284 48.7 110.0 35.2 11.8 18.6 170 409 23.1 30 19.3 18.0
117 NLA12_MN-287 10.4 37.8 6.9 3.4 1.4 170 2.8 5.8 20 17.6 14.0
118 NLA12_MN-288 2.3 0.9 0.7 1.6 < 0.5 < 10 < 1 < 1 50 12.6 12.0
119 NLA12_MN-290 3.1 0.9 0.5 0.6 1.6 < 10 < 1 < 1 80 13.4 13.0
120 NLA12_MN-293 19.3 6.8 0.7 0.4 1.2 73 < 1 < 1 20 8.1 8.4
121 NLA12_MN-297 29.6 11.7 0.9 0.5 6.0 110 < 1 < 1 70 18.9 19.0
122 NLA12_MN-299 59.8 70.6 26.3 15.6 31.7 130 335 11.4 50 28.1 26.0
123 NLA12_MN-300 34.6 28.4 5.2 5.0 35.5 170 12.7 19.1 50 17.1 15.0
124 NLA12_MN-303 20.5 27.7 3.6 8.3 3.9 160 < 1 7.0 30 11.3 10.0
125 NLA12_MN-304 16.7 5.4 1.6 0.7 6.5 63 < 1 < 1 60 7.3 7.4
126 NLA12_MN-306A 10.3 4.8 2.1 0.6 11.2 44 1.77 < 1 30 7.0 6.3
127 NLA12_MN-313 29.7 17.5 5.3 1.8 6.8 140 < 1 3.1 5 5.4 5.6
128 NLA12_MN-315 38.0 33.6 7.4 7.7 3.4 170 53.2 16.6 20 12.4 12.0
129 NLA12_MN-318 2.7 0.9 0.5 1.7 2.1 <10 <1.0 <1.0 60 17.4 16.0
130 NLA12_MN-320 10.9 3.6 1.5 0.9 2.2 38 < 1 < 1 120 17.7 17.0
131 NLA12_MN-322A 34.3 6.7 2.5 1.6 12.1 110 < 1 < 1 40 10.9 10.0
132 NLA12_MN-325 30.5 101.0 22.4 11.4 23.8 260 253 3.1 40 20.6 21.0
133 NLA12_MN-334 37.2 20.6 2.1 1.8 4.0 170 < 2 < 1 20 11.9 12.0
134 NLA12_MN-335 23.8 38.1 5.5 8.9 4.8 210 6.4 11.4 30 16.9 15.0
135 NLA12_MN-338 32.8 10.5 2.7 1.8 2.8 120 < 2 < 1 30 10.8 9.9
136 NLA12_MN-341 11.4 30.7 3.7 6.2 8.1 200 < 2 4.1 30 18.8 17.0
137 NLA12_MN-342 26.8 16.1 11.9 1.6 8.1 100 21.5 19.2 10 6.9 6.9
138 NLA12_MN-346 1.0 < 0.5 0.3 0.4 < 0.5 < 10 < 1 < 1 10 6.0 5.4
139 NLA12_MN-367 23.2 20.9 1.8 1.4 13.3 190 4.84 2.2 20 6.5 5.5
140 NLA12_MN-378 36.5 31.0 9.0 10.1 21.6 200 < 1 28.0 20 16.7 17.0
141 NLA12_MN-395 44.4 73.9 25.5 6.8 7.7 210 178 31.0 30 15.2 13.0
142 NLA12_MN-396A 29.4 30.2 7.8 4.5 32.3 170 12.9 17.5 20 10.9 12.0
143 NLA12_MN-414A 33.0 13.4 1.9 13.4 6.1 120 < 1 8.0 10 13.8 14.0
144 NLA12_MN-415 15.5 23.7 3.7 2.2 13.9 120 5.96 1.9 20 11.9 12.0
145 NLA12_MN-420 23.4 123.0 26.1 16.4 12.1 250 309 20.6 20 15.8 15.0
146 NLA12_MN-427A 64.8 91.9 45.4 19.5 29.8 280 290 37.1 30 18.4 18.0
147 NLA12_MN-443 38.9 64.0 19.6 12.7 9.7 240 111 17.2 5 12.9 11.0
148 NLA12_MN-444A 52.3 45.2 17.3 6.5 35.9 120 166 27.4 20 15.6 16.0
149 NLA12_MN-475 63.8 122.0 35.1 24.1 30.7 240 402 16.1 40 21.1 21.0
National Lakes Assessment: 2012 • January 2016 Minnesota Pollution Control Agency
70