Embed Size (px)
Citation preview

National Instruments at a Glance• Leaders in Computer‐Based
Measurement and Automation
• Long‐term Track Record of Growth and Profitability
• Record Revenue: $821M in 2008
• Fortune “100 Best Companies to Work For” ten years in a row
• FT 50 Best Workplaces UK 2006 ‐• FT 50 Best Workplaces UK 2006 ‐2009
• More than 5000 employees; operations in 40+ countries p
• Founded in 1976 with focus on Instrument Control
• LabVIEW 1 0 released in 1986
1
• LabVIEW 1.0 released in 1986
Virtual Instrumentation“To do for test and measurement
what the spreadsheet did for financial analysis.”
2

Virtual Instrumentation EvolvedEvolved
Test and MeasurementTest and Measurement Data AcquisitionData Acquisition
Automated TestAutomated Test Industrial ControlIndustrial Control
Embedded ControlEmbedded ControlDigital TestDigital Testgg
CommunicationsCommunications Medical DevicesMedical Devices
A d iA d i
CommunicationsCommunications Medical DevicesMedical Devices
3
AcademiaAcademia

Acquiring Data With LabVIEW
4

PC‐Based Data Acquisition (DAQ)
5
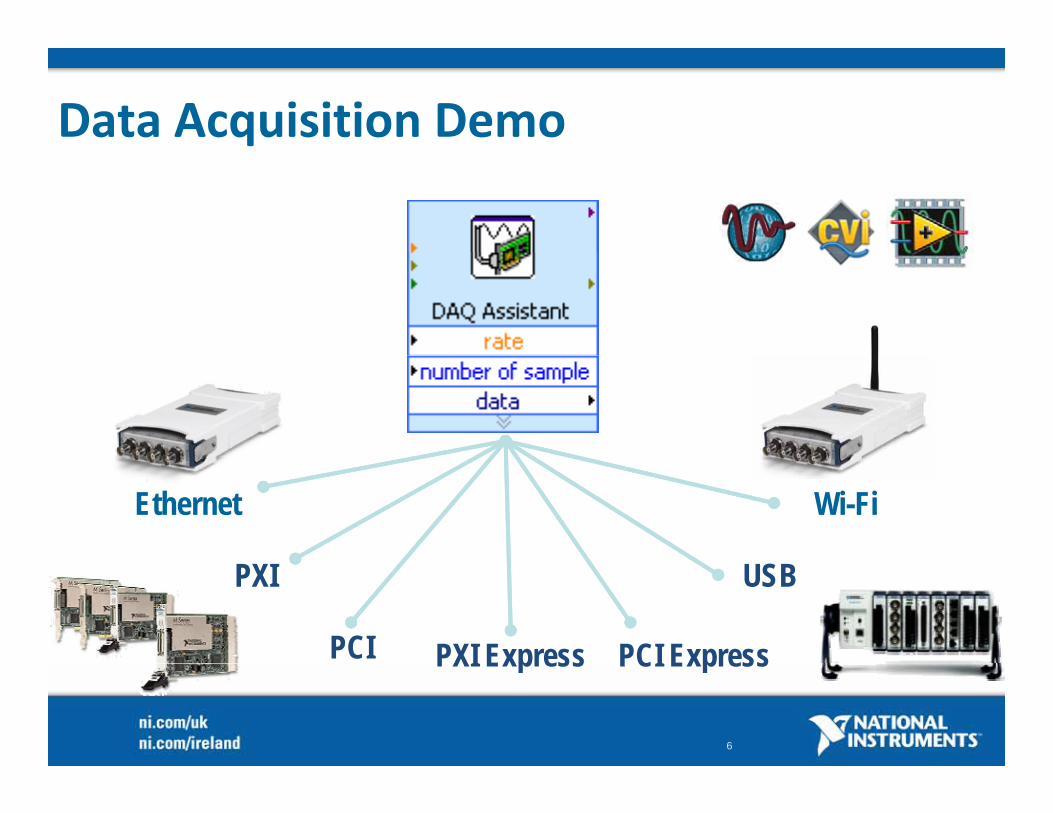
Data Acquisition Demo
Wi-FiEthernet
PXI Express
PXI
PCI PCI Express
USB
6
PXI Express PCI Express

Measuring Analogue Input Signals
Important Factors to Consider:
•Architecture Multiplexed p
Simultaneous sampling
To PC
•Sampling rate
•Resolution Analogue Input…
Resolution
•Signal conditioning
7

What is a Transducer?
SignalPhysicalPhenomena
Transducer orSensor
A transducer or sensor converts a physical phenomena into a measurable electrical signal that a DAQ system measures.
8

What is a Transducer?What is a Transducer?Phenomena Transducer/SensorTemperature Thermocouples
Resistive Temperature Devices (RTDs)Thermistors
Light Vacuum tubePhoto sensorsPhoto sensors
Sound MicrophoneForce and Pressure Strain gages
Piezoelectric transducersPosition and Displacement Potentiometers
Linear voltage differential transformerOptical encoder
Fluid Head metersFluid Head metersRotational flowmeters
pH pH electrodes
9

Signal ConditioningHigh voltage signals and most sensors require signal conditioning to properly
read the signal
Sensors/Signals
Amplification, Linearization, andThermocouples
Signal Conditioning
Cold-Junction Compensation, FilteringThermocouples
RTDs Current Excitation,Linearization, Filtering
Strain Gauges
ea at o , te g
Voltage Excitation, BridgeConfiguration, Linearization, Filtering
IsolationCommon Mode or High Voltages DAQ Device
10

Analog Input – Architecturesg pMultiplexed
Channel 0
Channel 1ADC
Channel 0
Channel 1MUX AMP
Simultaneous sampling
Channel 0 ADC Channel 0AMP
ADCChannel 1Channel 1
AMP
11

Analog Input – Sampling Ratesg p p g
• Undersampling may result in the misrepresentation of the d i l ( li i )measured signal (aliasing).
• After a signal is aliased, it is impossible to reconstruct the original signaloriginal signal.
• For accurate frequency representation:Sample at least 2x the highest frequency signal being measured.Sample at least 2x the highest frequency signal being measured.
• For accurate shape representationSample 5–10x the highest frequency signal being measured.
12
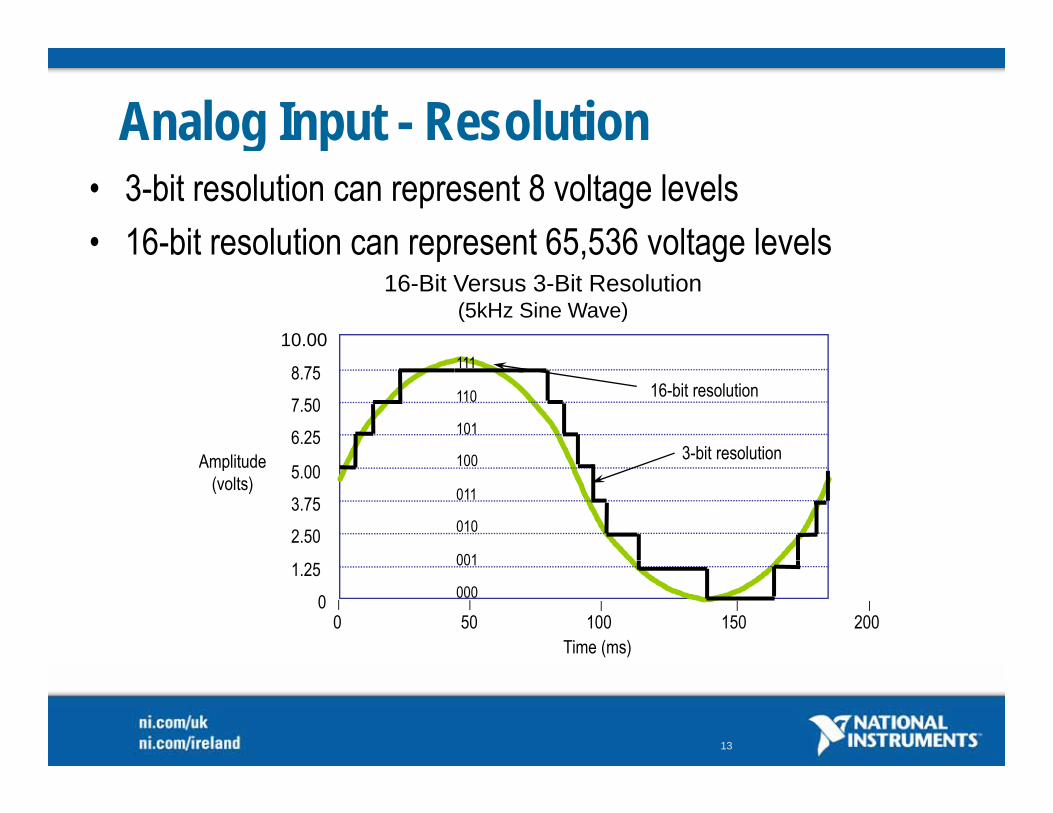
Analog Input - Resolutiong p• 3-bit resolution can represent 8 voltage levels• 16-bit resolution can represent 65,536 voltage levels
16-Bit Versus 3-Bit Resolution(5kHz Sine Wave)
10.00
16 bit resolution can represent 65,536 voltage levels
6.257.508.75
Amplit de
16-bit resolution
3-bit resolution100
101
110
111
5.00
2.503.75
Amplitude(volts)
3 bit resolution
001
010
011
100
100 200150500Time (ms)
0
1.25000
001
| ||||
13

Analog Input – Range and Analog Input Range and Amplification
ADC
10 mV signal 32 levels of resolution
ADC
Resolution: 16-bit Range: ± 10 V10 mV signal 32 levels of resolutionRange: ± 10 V
WITHOUT AMPLIFICATION
14

Analog Input – Range and Analog Input Range and Amplification
65,536 levels of resolution,
AMP ADCX100
10 mV signal
ADC
Resolution: 16-bit Range: ± 10 V
WITH AMPLIFICATION
Range: ± 10 V
** Amplification optimizes resolution over the range of measurement **
15

Accuracy versus Resolutiony• Resolution
A property of the ADC• Accuracy
A specification of the entire DAQ device t
A R
or systemIncludes many components and factors
• ADC nonlinearities• Temperature• System noise• Amplifier gain and offset errorsp g
• Higher resolution does not always equal more accurate!Look for Absolute Accuracy specification
16

Grounding Issues• To get correct measurements you must properly ground
your systemy y• How the signal is grounded will affect how we ground the
instrumentation amplifier on the measurement devicep• Steps to proper grounding of your system:
– Determine how your signal is groundedDetermine how your signal is grounded– Choose a grounding mode for your Measurement System
M t S tSi l+
Measurement SystemSignalSource VS
-
VM
17

Signal Source Categoriesg gSignal Source
Grounded Ungrounded
+
g
+
_Vs
_Vs
18

Grounded Signal Source
Signal is referenced to a Signal Source
• Signal is referenced to a system ground
Earth groundGrounded – Earth ground– Building ground
• Examples:+ Examples:– Power supplies– Signal Generators
_Vs
g– Anything that plugs into a
grounded electrical wall socket
19

Floating Signal SourceSignal Source
Floating• Signal is NOT referenced to a system ground gsystem ground
– Earth ground– Building ground
• Examples: +• Examples:– Batteries– Thermocouples– Transformers
_Vs
– Isolation Amplifiers
20

Best Practices for DAQ: GroundingBest Practices for DAQ: GroundingFloating Signal Sources
(Not connected to Building or Ground)
Grounded Signal Source
Differential (DIFF)
Single-Ended-GroundReferenced (GRSE)
Single-Ended-Nonreferenced(NRSE)
21
( )

What is noise?
• Noise is any unwanted signal that interferes with the desired signalg
Noise can be periodicNoise can be randomNoise can be randomUsually considered separate from drift and accuracy errors
22

Sources of Noise
• Intrinsic Thermal noiseThermal noise1/F noise
• Externally induced • Externally induced RF Line frequencyLine frequency
• Noise “floor” of instrumentation
23

Noise Induced Into Interconnects• Measurement setup
I t t Interconnect • another circuit element• Example : Twisted pair wiring
Environment• Line frequency fields generate Common
mode noise• Radiation from fluorescent lights
60 Hz to 100 MHz • Conductive coupling between noisy loads
and sensitive measurement instruments
24

Noise ReductionNoise ReductionPre-acquisition
Setup pShielding, cabling, careful physical placement etcInstrument mode (Filtering, Integrating)
P t i iti Post-acquisition Filtering, Averaging
NOTE: Be careful with post-acquisition
Instrument performance may have been degraded enough that the data is “beyond repair”
•Input stage saturationInput stage saturation
•Noise is consuming dynamic range of the instrument
25

Analog Input – Noise and Filteringg p gLowpassFilterFilter
Time Domain Time Domain
LowpassFilter
• Removes noise
Frequency Domain Frequency Domain
• Blocks unwanted frequencies• Prevents aliasing
26

Best Practices for DAQ: Isolation• Two reasons for isolation:
El t i l I l tiElectrical IsolationSafety Isolation
Opto-isolator Transformer Capacitor
27

Best Practices for DAQ: Isolation• Consider isolation for measurement systems that involve
any of the following:any of the following:Close vicinity to hazardous voltagesIndustrial environments with possibility of transient voltagesp y gEnvironments with common-mode voltage or fluctuating ground potentialsEl t i ll i i t h th ith i d t i l tElectrically noisy environments such as those with industrial motorsTransient-sensitive applications where it is imperative to prevent voltage spikes from being transmitted through the measurement g p g gsystem
28

Common Mode Voltage Rejectiong j
What will a non-isolated DAQ board read?
DAQ BoardAI+
5 V
DAQ Board
5 V?+-
AI-GND
5 V Common Mode V lt
-
5 V Voltage
29

Isolated boards will reject the common mode voltage and read 5 VWhat will a non isolated DAQ board read now?
Common Mode Voltage Rejection
AI+
DAQ BoardIsolated boards will reject the common mode voltage and read 5 VWhat will a non-isolated DAQ board read now?
AI+
AI-
5 V ?5 V Automotive measurements• 42 V and 12 V common
mode
+-
GND55 V Common Mode Voltage
Isolation mode
Battery stack testing• Small individual 1 V cells
≤ ±60 V
• Small individual 1 V cells
Signal + Common mode = ± 60 VDCSi l 10 V ( th i l t d b d)
30
Signal = ± 10 V (same as the non-isolated board)

Analogue Output – Considerations• Accuracy: digital‐to‐analog converter (DAC) resolution
• Update Rate: settling time and waveform frequencyp g q y
• Range: fixed or adjustable output voltage/current
Channel 0 DAC Channel 0
DACChannel 1Channel 1
16 bi• 16‐bit• 100 kS/sec• ±10 VDC, 0–20 mA
31
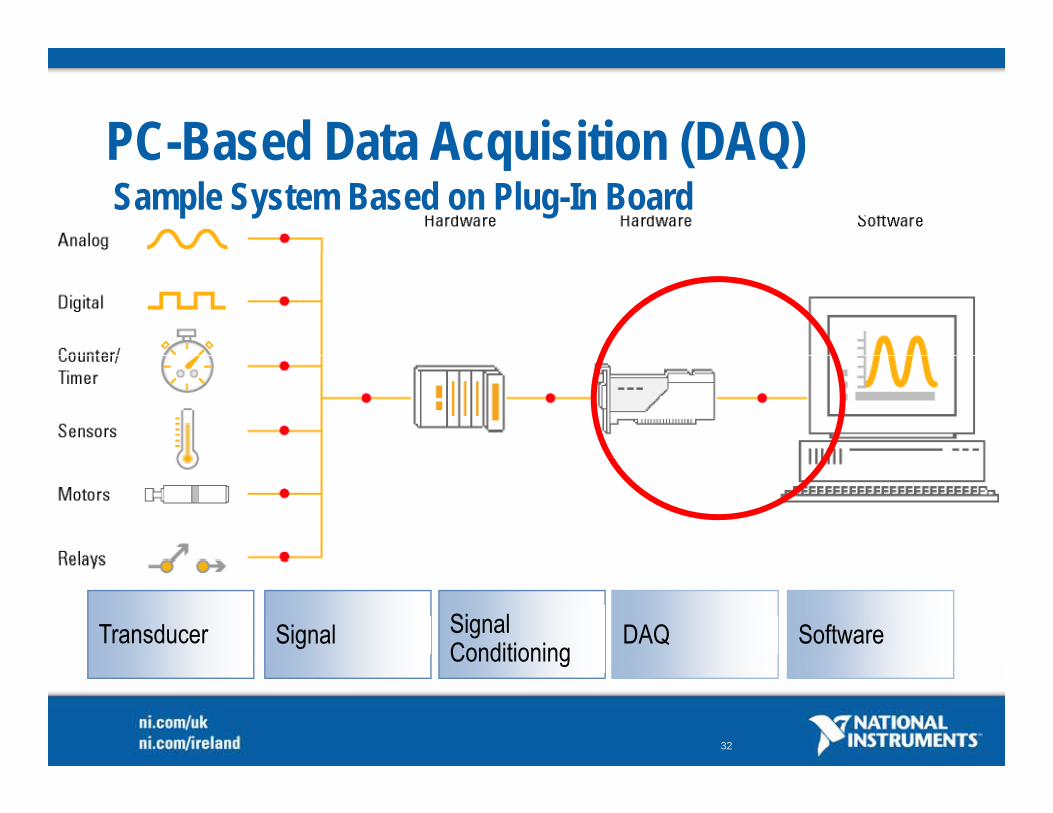
PC-Based Data Acquisition (DAQ)PC Based Data Acquisition (DAQ)Sample System Based on Plug-In Board
SoftwareDAQSignal ConditioningSignalTransducer
32
g

Many Different Bus ChoicesMany Different Bus Choices
Fast Ethernet
PCI
Gigabit EthernetGigabit Ethernet
33

Bus Support Takes Different Form FactorsBus Support Takes Different Form FactorsNational Instruments Data Acquisition Devices
PXI/PXI ExpressPCI PCI Express Wireless Sensor NetworksNetworks
Ethernet/Wi-Fi
USB USB w Chassis Ethernet w Chassis
34

Loop Rate and Waveform Speed:Loop Rate and Waveform Speed:Latency and Bandwidth
Best for applications with large data sets
Best for applications with frequent reads/writes, like single-point updatesBest for applications with large data sets
35

Dedicated Bandwidth Per Device Additi l Ad t f Hi h Ch l C tAdditional Advantage for High Channel CountApplies to PCIExpress and PXIExpress
36
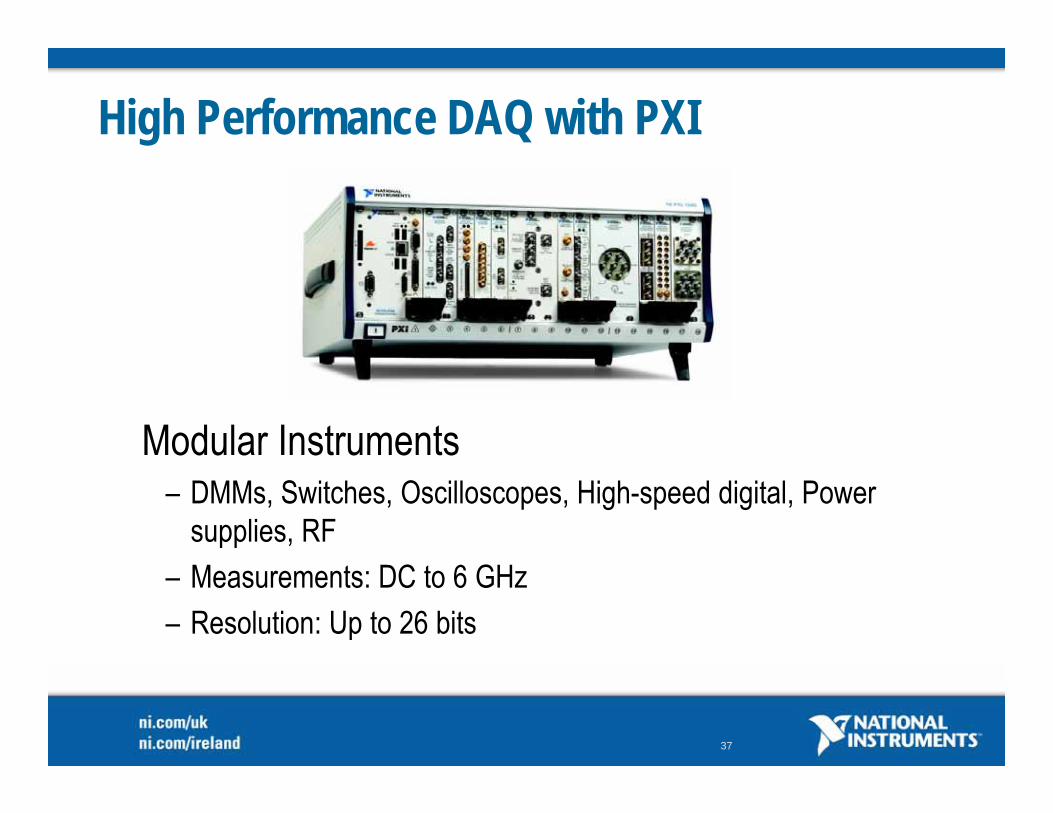
High Performance DAQ with PXI
Modular Instruments– DMMs, Switches, Oscilloscopes, High-speed digital, Power
supplies, RF– Measurements: DC to 6 GHz– Resolution: Up to 26 bits
37

Modular Instruments -Filter Characterisation Demo
38

Instrument Control with LabVIEW
h
Over 5,000 Instrument drivers online, from over 250 vendors
GPIB ‐ USB ‐ Ethernet
RS 232 ‐ RS 485 ‐ LXI
ni.com/idnet
39

Scientific Imaging Approach
Lighting, Lens, Camera, HW, SW
Transducer Signal Conditioning A/D SWTransducer, Signal Conditioning, A/D, SW
40

NI Frame Grabbers• PCI, PCIe, PXI and PXIe boards• Analog • Analog
Standard and non-standard
• Camera Link• Camera LinkBase, medium and full
IEEE 1394 control adaptors• IEEE 1394 control adaptorsIEEE 1394a and 1394b
Gi E Vi i i t f• GigE Vision interfacesOptimized for NI software
41
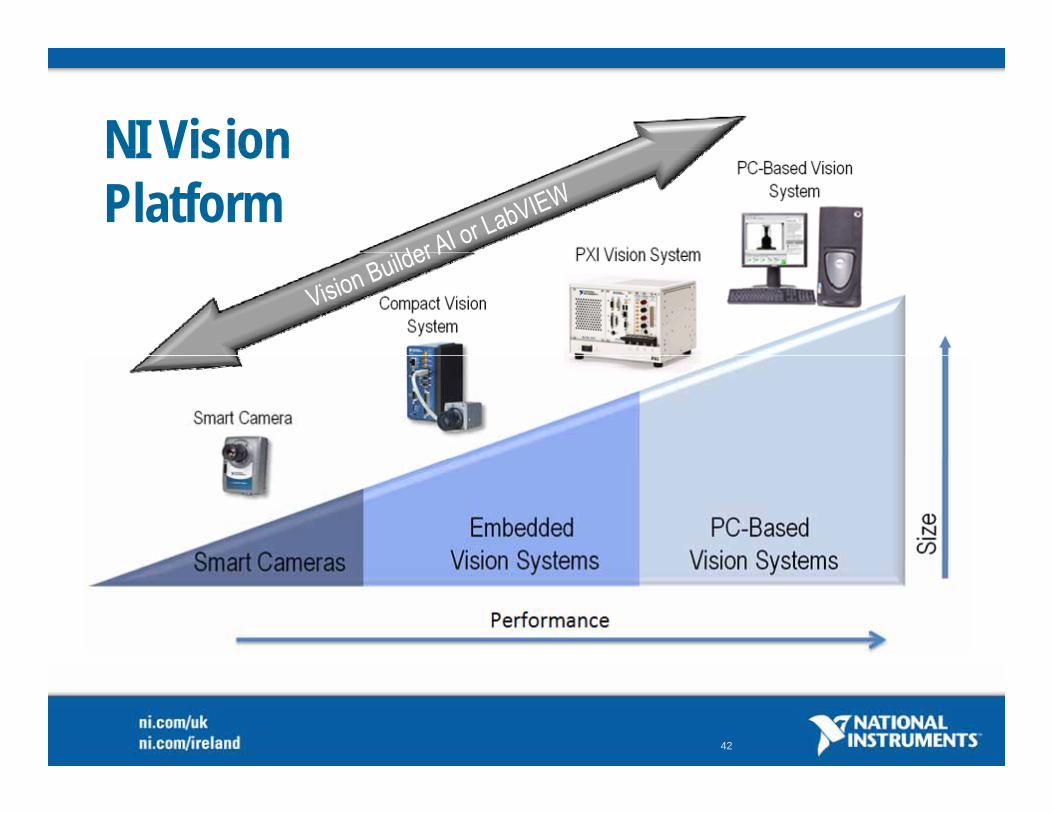
NI Vision NI Vision Platform
42

Image Acquisition Demo
43

Signal Processing with LabVIEW
44

The Role of Signal Processing, Analysis and MathAcquire Analyse Present
Signal Processing, Analysis and Math:Fundamental Components of
Virtual Instrumentation and Graphical System DesignVirtual Instrumentation and Graphical System Design
45
Design Prototype Deploy

An Effective Platform for Signal Processing & Analysis: Signal Processing & Analysis
Choose an appropriate approach Reuse your existing code
Instrument your algorithms Prototype and deploy to
46
y g yp p yembedded targets

UIUC Innovators develop Mind-Computer Interface with NI LabVIEW
Application: University of Illinois at Urbana-Champaign (UIUC) engineering students developed a device that translates thought i t h d f t l into speech or commands for control over wheelchairs and other devices. They used LabVIEW to develop the signal processing algorithms for translation algorithms and to i l t t t implement prototypes.
NI Products: Signal Processing in LabVIEW, USB DAQ
“Working with LabVIEW simplifies development and encourages innovation by offering
www.theaudeo.com
an intuitive graphical programming approach that allows you to focus on innovationrather than programming details.”
Michael Callahan, CEO, Ambient Corporation
47

Interactive Math with the MathScript Window• Fully integrated into
LabVIEW Access from LabVIEW menu (Tools MathScript Window)
C d Li i t f• Command Line interfaceEnter .m file commands / scripts, see an immediate p ,responseOpen / run your .m file scriptsView textual output command View textual output, command history, variables, and plots
48

Built-in Graphical Tools (VIs) for Signal Processing Analysis and Math (Abridged List)Processing, Analysis and Math (Abridged List)
• Signal Processing & Analysis • Mathematics– Waveform Generation– Waveform Conditioning– Waveform Monitoring
W f M t
– Numeric– Elementary and Special Functions– BLAS/LAPAC-based Linear Algebra
C Fitti– Waveform Measurements– Signal Generation– Signal Operations
Windows
– Curve Fitting– Interpolation / Extrapolation– Probability and Statistics
Optimization– Windows– Digital Filters– Spectral Analysis– Transforms
– Optimization– Ordinary Differential Equations– Geometry– PolynomialTransforms
– Point-by-PointPolynomial
– Formula Parsing– 1D & 2D Evaluation– Calculus
49
– Zeros

LabVIEW Toolkits for Signal Processing and Analysis(Sound & Vibration)(Sound & Vibration)
Sound and Vibration Order Analysis
Distortion, Octave Analysis, Swept Sine, S&V Level, Frequency Measurements, Limit Testing, Transient Time-Domain Integration
Order Tracking, Order Extraction, Online Order Analysis, Order Spectrum Selection, Tachometer Signal Processing Waterfall Transient, Time Domain Integration,
Weighting, Waterfall Plot, …Signal Processing, Waterfall Displays, Orbit / Polar Plots, Bode Plots, …
50

LabVIEW Add-On Toolkits for Signal Processing and Analysis(RF & Communications)( )
Modulation Spectral Measurements
Analog / Digital Modulation/Demodulation, Channel Models, Bit Generation, Bit Error Rate Channel Coding Modulation
Zoom FFT, Power-in-Band, Adjacent Channel Power, Tone Detection, …
Rate, Channel Coding, Modulation Measurements, AWGN, Phase Noise, Constellation Plots, Eye Diagrams, …
51

LabVIEW Toolkits for Signal Processing and Analysis(Multi-Purpose)(Multi Purpose)
Advanced Signal Processing
Digital Filter Design
Wavelets FIR / IIR Filter Design / Analysis Wavelets,Time-Series Analysis (Independent Component Analysis, Principal Component Analysis, Model-Based Spectral Analysis )
FIR / IIR Filter Design / Analysis, Quantization, Fixed-point Modeling, Fixed-point Simulation, FPGA deployment,
Spectral Analysis,…),Time-Frequency Analysis (Gabor, STFT, …)
…
52

Signal Processing Demog g
53

Optical Coherence Tomography ResearchEarly Cancer Detection with LabVIEW & PXIEarly Cancer Detection with LabVIEW & PXI
Optical Coherence Tomography, or OCT, can provide sub-surface, cross-sectional images of opaque materials for visualization of tissues. For his next generation commercial system, Dr. Ohbayashi needs to perform 1 4 Million 1K FFTs every second for online analysis on the Ohbayashi needs to perform 1.4 Million 1K FFTs every second for online analysis on the acquired data.
Dr. Kohji Ohbayashi
54
Kitasato University, Center for Fundamental Sciences

OCT Image Processing
Laser Line Digitize Restore Slice More
Yes
Scan Reflections
256 Channels
DigitizeReflections
256 Samples
Restore Slice with a 2D FFT
More Slices?
No256 Channels p
Per ChannelDisplay
3D OCT Scan
55

National Instruments OCT Solution
256 ChannelsReflections 2D FFT
Scan Complete
Yes(Auto-detected)
Complete?
No256
LabVIEW
256 Samples
per Channel
~ 1.5 M FFTs / sec for Real-Time Performance
Iso-surfaceDisplay
56

Image Processing With LabVIEW
57

NI Vision PlatformVision Application
Configuration ProgrammingVi i D l t M d l g
- Vision Builder AI - -Vision Development Module -LabVIEW / LabVIEW RT
NI Vision Acquisition Software
58
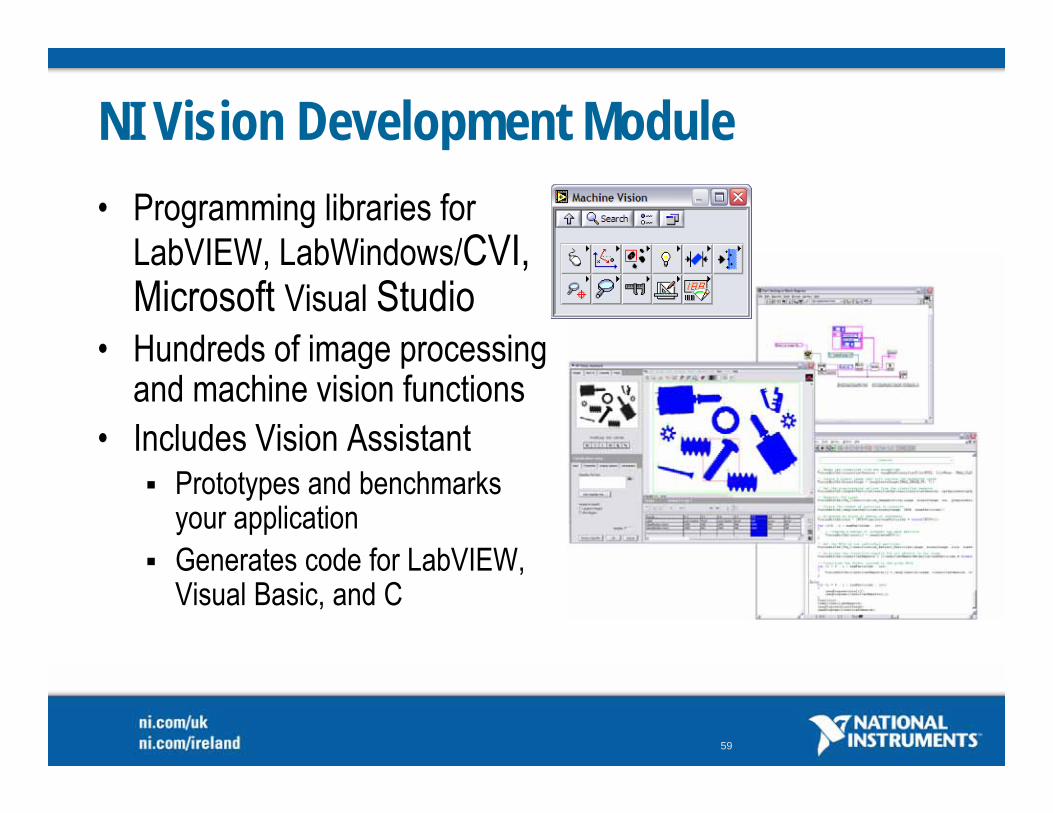
NI Vision Development Module• Programming libraries for
LabVIEW LabWindows/CVI LabVIEW, LabWindows/CVI, Microsoft Visual Studio
• Hundreds of image processing Hundreds of image processing and machine vision functions
• Includes Vision AssistantPrototypes and benchmarks your applicationGenerates code for LabVIEW Generates code for LabVIEW, Visual Basic, and C
59

Image Processing Demog g
60

Realtime Signal Processing, Analysis, and Mathematics
Code Reuse
M th ti
Simplified Interactivity Hybrid Graphical / Textual Programming
MathematicsNumericElementary and Special FunctionsBLAS/LAPAC-based Linear AlgebraCurve FittingInterpolation / ExtrapolationProbability and StatisticsOptimizationOrdinary Differential EquationsGeometryP l i l
Signal Processing & Analysis
Waveform GenerationWaveform Conditioning
Waveform MonitoringWaveform Measurements
Signal GenerationSi l O ti
Core 1
Core 2
IntuitiveHigh- / Low-Level
Extensive Built-in Signal Processing, Analysis,
PolynomialFormula Parsing1D & 2D EvaluationCalculusZeros
Signal OperationsWindows
Digital FiltersSpectral Analysis
TransformsPoint-by-Point
Tight HW IntegrationIntuitive Parallelism/Timing,Multicore Performance
61
Abstractiong g y
and MathMulticore Performance

Presenting Data With LabVIEW
62
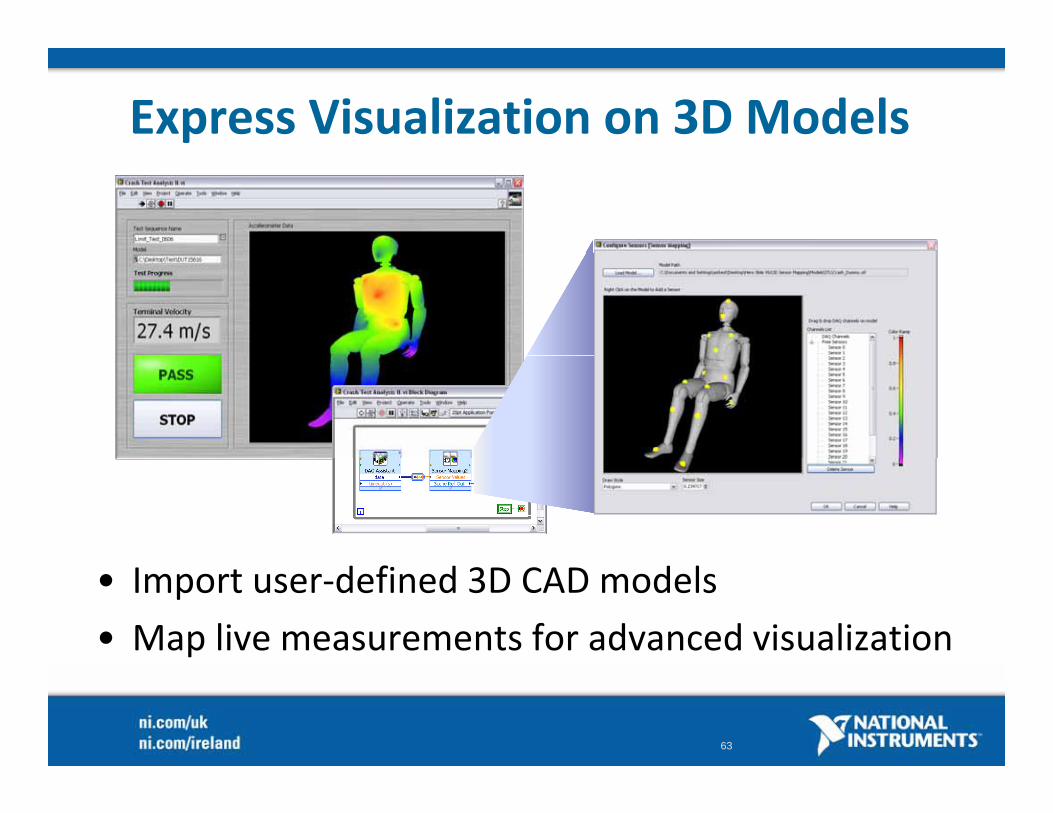
Express Visualization on 3D Models
• Import user‐defined 3D CAD models
• Map live measurements for advanced visualization
63

Data Visualisation and CommunicationData Visualisation and CommunicationVisualisation• Built in user interface objects
Reporting and Data Storage• File I/O functionality• Built‐in user interface objects
• Charting and graphing capabilities
• Remote application control
• File I/O functionality
• HTML reports for the Web
• Microsoft Word and Excel reports
64