Embed Size (px)
Citation preview

National Institute on Drug AbuseNational Institute on Drug Abuse
Prescription Drug Abuse:An Escalating Public Health Threat
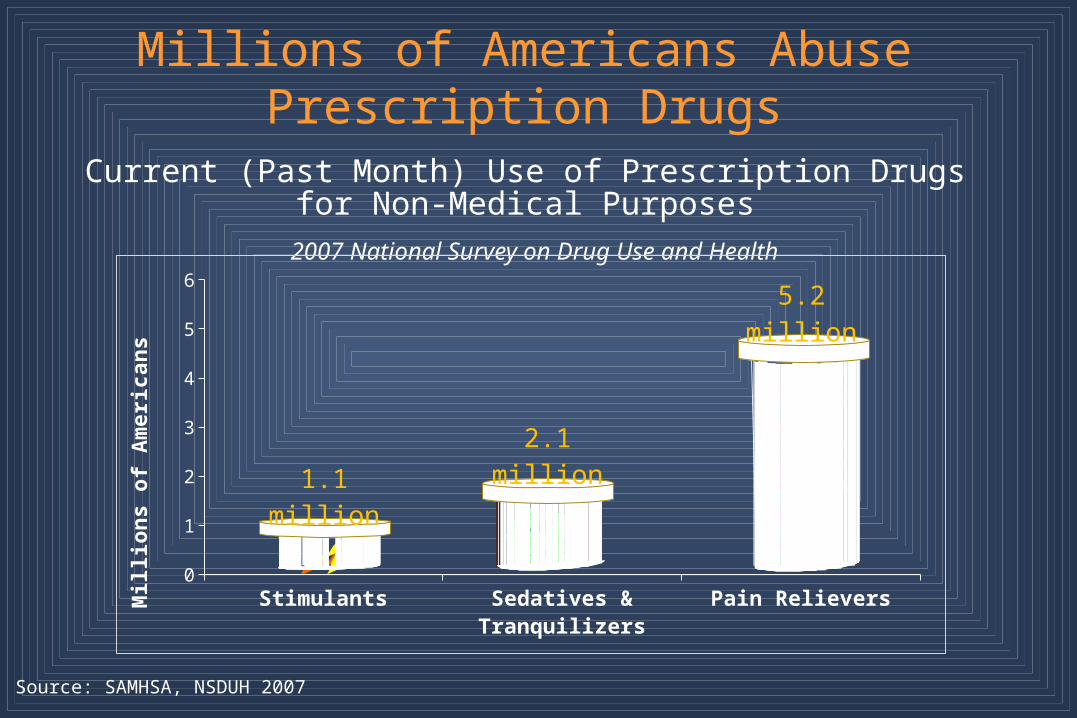
Millions of Americans Abuse Prescription Drugs
Current (Past Month) Use of Prescription Drugs for Non-Medical Purposes
2007 National Survey on Drug Use and Health
Source: SAMHSA, NSDUH 2007
Stimulants Sedatives & Tranquilizers Pain Relievers0
1
2
3
4
5
6
1.1 million
2.1 million
5.2 million
Mil
lion
s of
Am
eric
ans

Annual Numbers of New Nonmedical Usersof Pain Relievers: 1965-2002
Thousands of New Users
0
500
1,000
1,500
2,000
2,500
3,000
1965 1970 1975 1980 1985 1990 1995 2000
All Ages
Aged Under 18
Aged 18 or Older
Source: SAMHSA, NSDUH 2007
1995 1996 1997 1998 1999 2000 2001 20020
20000
40000
60000
80000
100000
120000
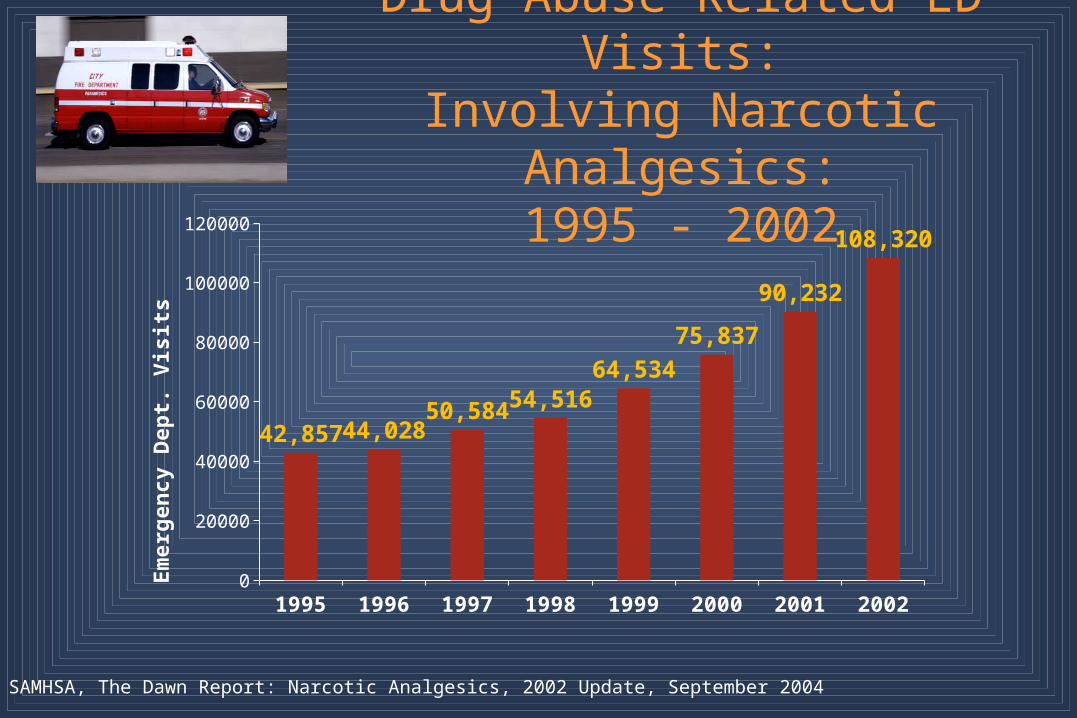
42,857 44,02850,584 54,516
64,534
75,837
90,232
108,320
Em
erge
ncy
Dep
t. V
isit
s
Drug Abuse Related ED Visits:Involving Narcotic Analgesics:
1995 - 2002
Source: SAMHSA, The Dawn Report: Narcotic Analgesics, 2002 Update, September 2004
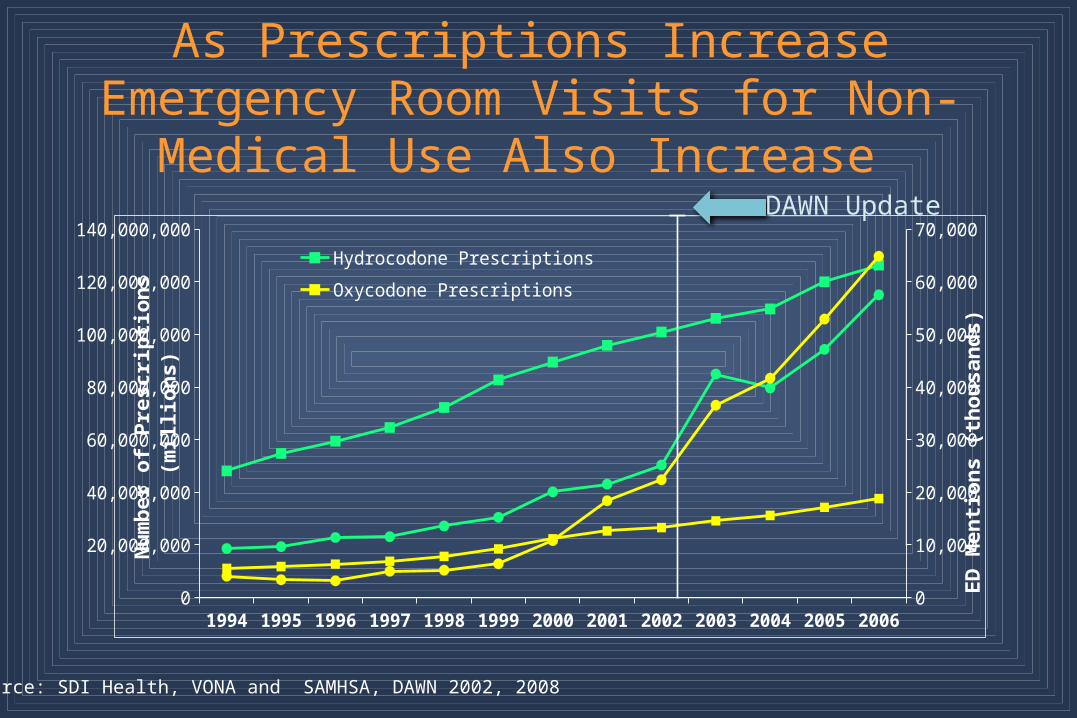
As Prescriptions Increase Emergency Room Visits for Non-Medical Use Also Increase
1994 1995 1996 1997 1998 1999 2000 2001 2002 2003 2004 2005 20060
20,000,000
40,000,000
60,000,000
80,000,000
100,000,000
120,000,000
140,000,000
0
10,000
20,000
30,000
40,000
50,000
60,000
70,000
Hydrocodone Prescriptions Oxycodone Prescriptions
Emergency Visits Emergency Visits
Num
ber
of P
resc
ript
ions
(mill
ions
)
ED
Men
tion
s (t
hous
ands
)
Source: SDI Health, VONA and SAMHSA, DAWN 2002, 2008
DAWN Update

Number of Past Year Initiates of Substance Use Among Persons Aged 12 or Older
Source: SAMHSA, NSDUH 2007
Pain R
eliev
ers
Mar
ijuan
a
Tranquili
zers
Cocai
ne
Ecsta
sy
Inhal
ants
Stimula
ntsLSD
Sedat
ives
Heroi
nPCP
0
500
1000
1500
2000
2500
2147 2090
1232
906781 775
642
270 198 106 58
Nu
mb
er o
f P
ast
Yea
r In
itia
tes
(t-
hou
san
ds)

Percentage of U.S. 12th Grade Students Reporting Past Month Use of
Cigarettes and Marijuana, 1975 to 2008
CESAR FAX January 19, 2009, Vol. 18, Issue 2.Adapted by CESAR from University of Michigan, “Trends in 30-Day Prevalence of Use of Various Drugs in Grades 8, 10, and 12,”Monitoring the Future study, 2008.
Cigarettes
Marijuana
40%
30%
20%
10% 1978 1982 1986 1990 1994 1998 2002 20061976 1980 1984 1988 1992 1996 2000 2004 2008
Oxycontin Vicodin0
2
4
6
8
10
12
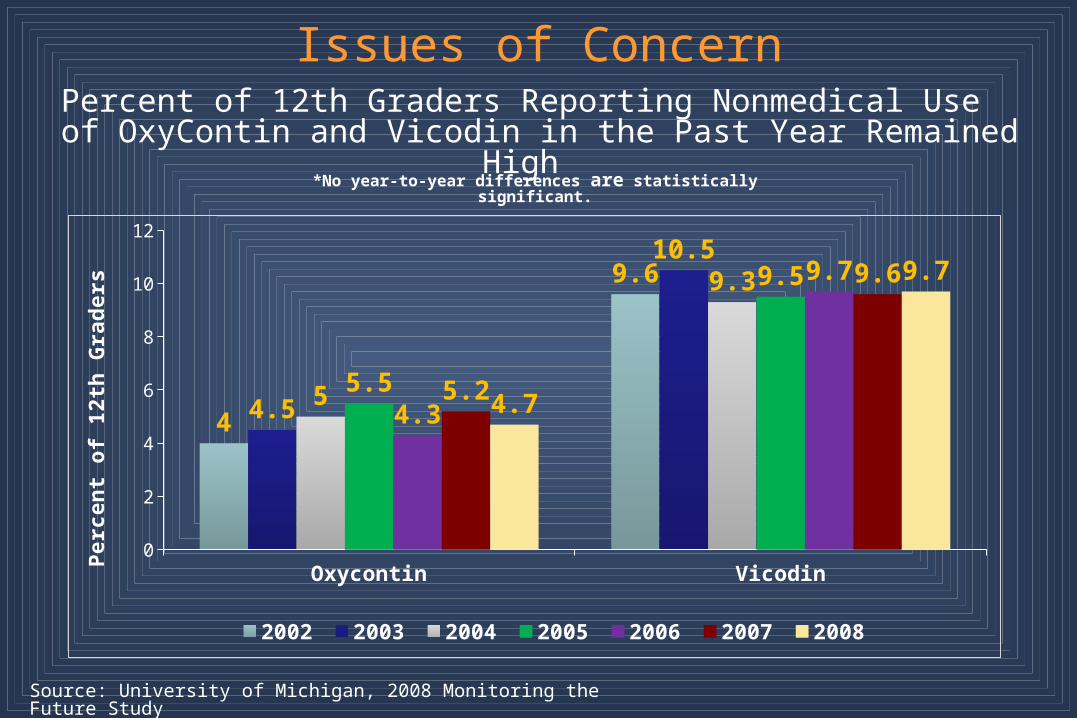
4
9.6
4.5
10.5
5
9.3
5.5
9.5
4.3
9.7
5.2
9.6
4.7
9.7
2002 2003 2004 2005 2006 2007 2008
Per
cen
t of
12t
h G
rad
ers
Issues of ConcernPercent of 12th Graders Reporting Nonmedical Use
of OxyContin and Vicodin in the Past Year Remained High
Source: University of Michigan, 2008 Monitoring the Future Study
*No year-to-year differences are statistically significant.

32.4
9.76.8 5.8 6.2 5.5 5.9 4.4 4.7 4.3 3.4
05
101520253035
Prescription/Over-the-Counter Drugs Account for 7 out of 11 of the Most Frequently Abused Drugs
In 2008, 15.4% of 12th graders reported abusing prescription drugs within the past year.
Source: University of Michigan, 2008 Monitoring the Future Study
Prevalence of Past Year Drug Use Among 12th GradersP
erce
nt
of 1
2th G
rad
ers

Mean Age at First Use Among Past Year Initiates of Substance Use Aged 12 to 49
Age
in Y
ears
Source: SAMHSA, NSDUH 2007

Sources of Prescription Drugs among Nonmedical Users
Source: SAMHSA, NSDUH 2007
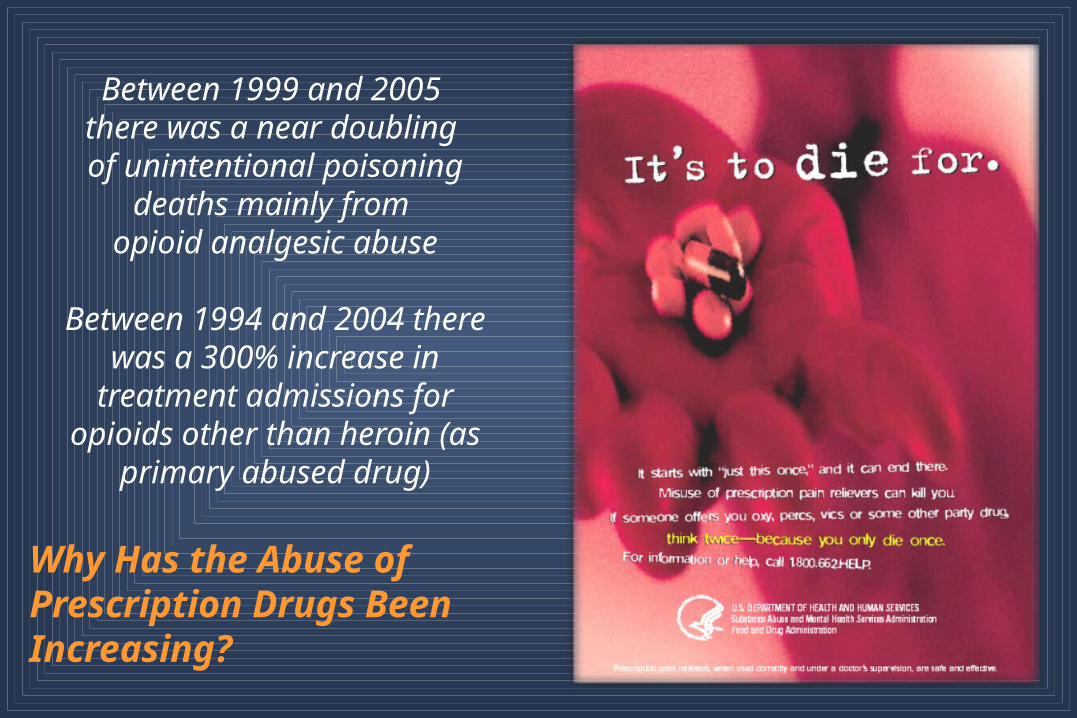
Between 1999 and 2005 there was a near doubling of unintentional poisoning
deaths mainly from opioid analgesic abuse
Between 1994 and 2004 there was a 300% increase in treatment admissions for
opioids other than heroin (as primary abused drug)
Why Has the Abuse of Prescription Drugs Been Increasing?

Reasons Youth Give For Abusing Prescription Medications:
• Safer than illicit drugs
• Inexpensive, easy to get
• Not illegal
• Less social stigma than illicit drugs
• Parents soft attitudes about their use
• Performance enhancement (stimulants)
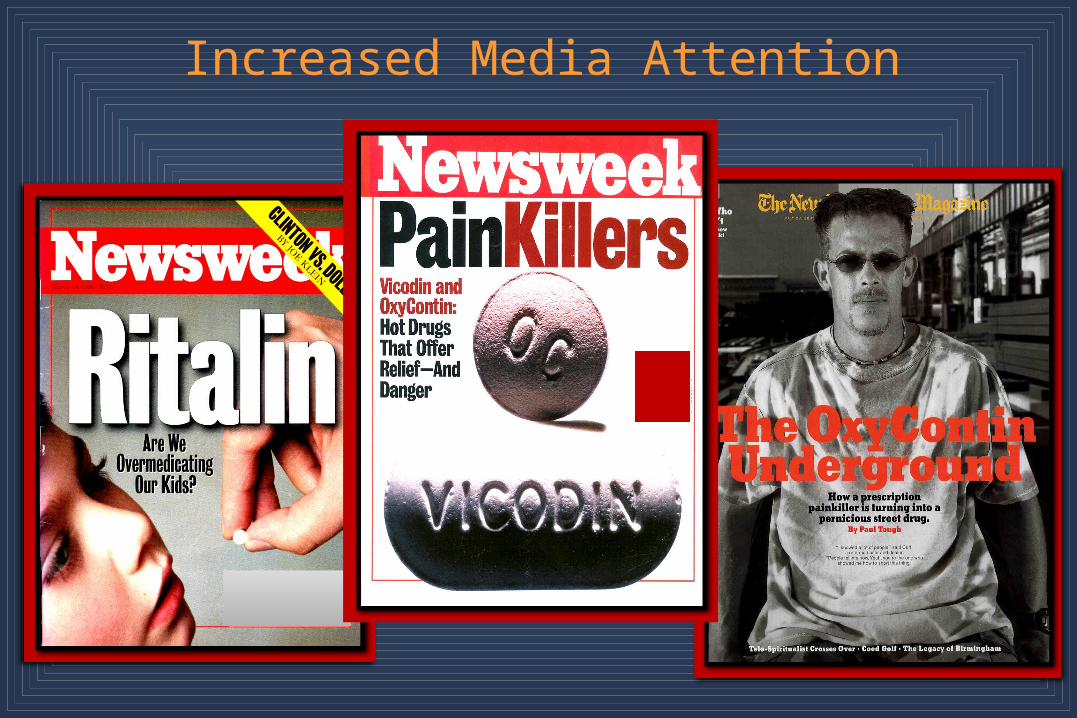
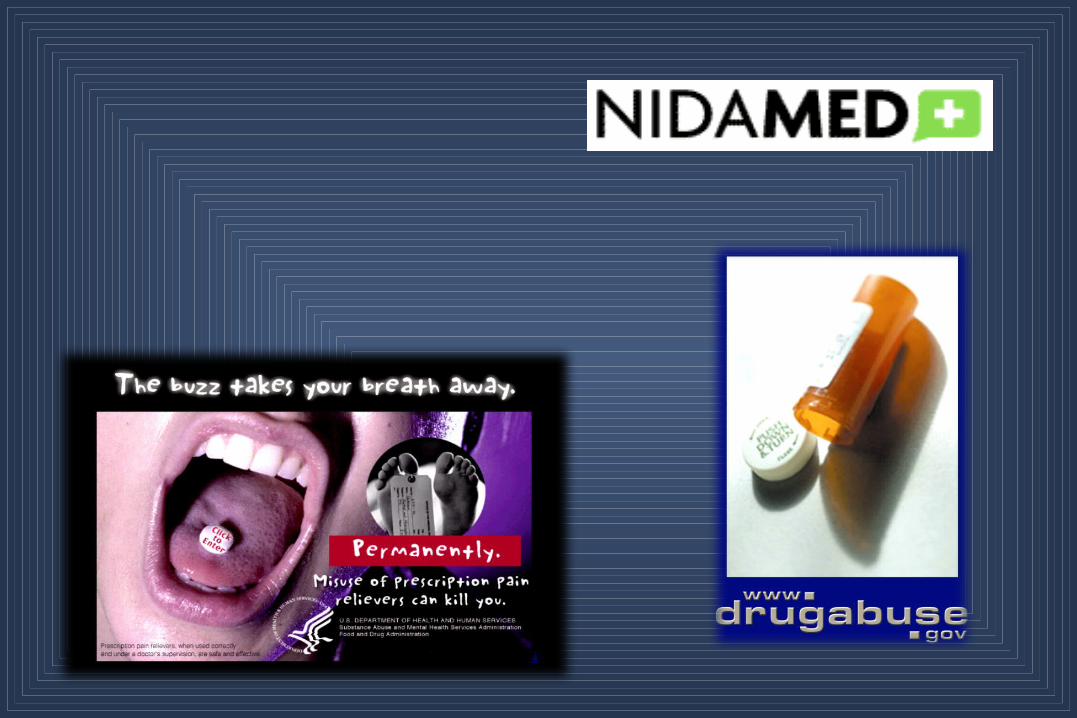
Increased Media Attention

Find the Balance:• Reduce suffering for
patients with pain• Increase awareness of the
abuse potential of opioid medications
NIDA is working to engage primary care physicians and dentists as our partners in recognizing, preventing & treating drug abuse
Find the Balance:• Reduce suffering for
patients with pain• Increase awareness of the
abuse potential of opioid medications
NIDA is working to engage primary care physicians and dentists as our partners in recognizing, preventing & treating drug abuse
What Do We Do?
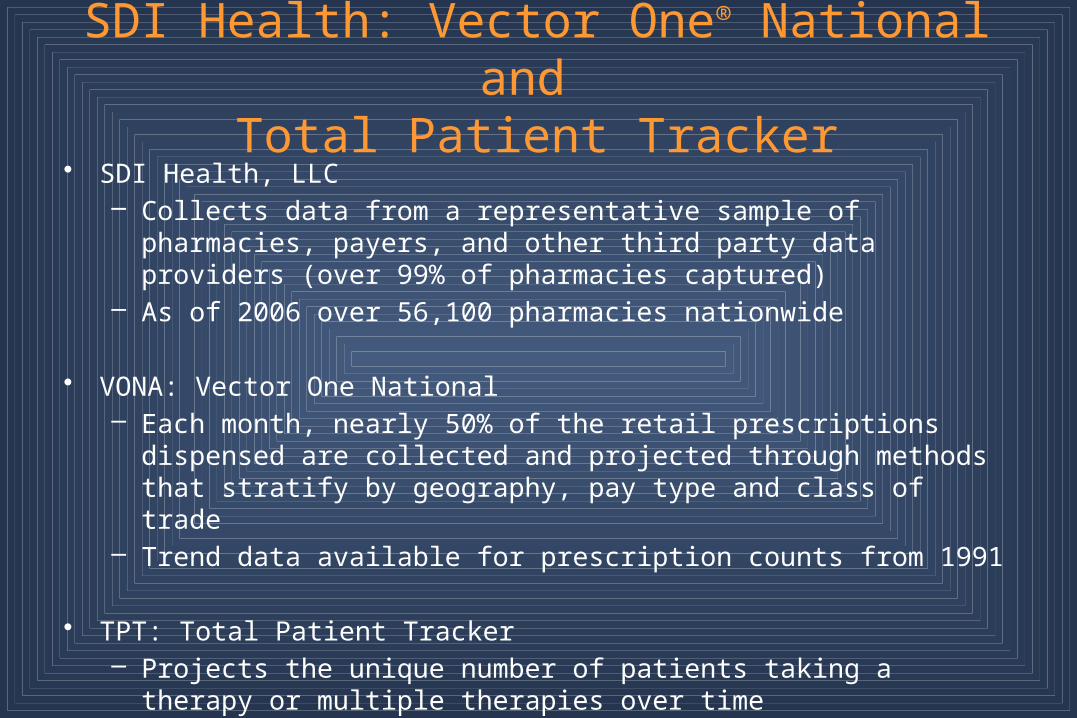
SDI Health: Vector One® National and Total Patient Tracker
• SDI Health, LLC– Collects data from a representative sample of pharmacies, payers, and other third
party data providers (over 99% of pharmacies captured)– As of 2006 over 56,100 pharmacies nationwide
• VONA: Vector One National– Each month, nearly 50% of the retail prescriptions dispensed are collected and
projected through methods that stratify by geography, pay type and class of trade– Trend data available for prescription counts from 1991
• TPT: Total Patient Tracker – Projects the unique number of patients taking a therapy or multiple therapies over
time– Patient based data available as of 2002

Opioids Include Codeine & Comb NON-INJ (USC 02232), Morphine & Opium NON-INJ (USC 0222), Morphine & Opium INJ (USC 0221), Codeine & Comb INJ (USC 02231).
Source: SDI Health, TPT 2008 09-29-08 Opiates and US Census
National Estimated Prevalence (Rate per 1,000 Population, aged 0 to 85+)
Of Persons with a Dispensed Opioid Prescription, by Specialty, 2007
0-4 5-9 10-14 15-19 20-24 25-29 30+ 0
10
20
30
40
50
60
70
26
12
53 5458
49
GP/FM/DO Dentists IM EM Ortho Surg Uspec
Age Group
Pre
vale
nce
Rat
e/1,
000
Pop
.

Opioids Include Codeine & Comb NON-INJ (USC 02232), Morphine & Opium NON-INJ (USC 0222), Morphine & Opium INJ (USC 0221), Codeine & Comb INJ (USC 02231).
Source: SDI Health, TPT 2008 09-29-08 Opiates and US Census
National Estimated Prevalence (Rate per 1,000 Population, aged 0 to 85+)
Of Persons with a Dispensed Opioid Prescription, by a Dentist, by Year
0-4 5-9 10-14 15-19 20-24 25-29 30+ 0
10
20
30
40
50
60
70
2002 2003 2004 2005 2006 2007
Age Group
Pre
vale
nce
Rat
e/1,
000
Pop
.
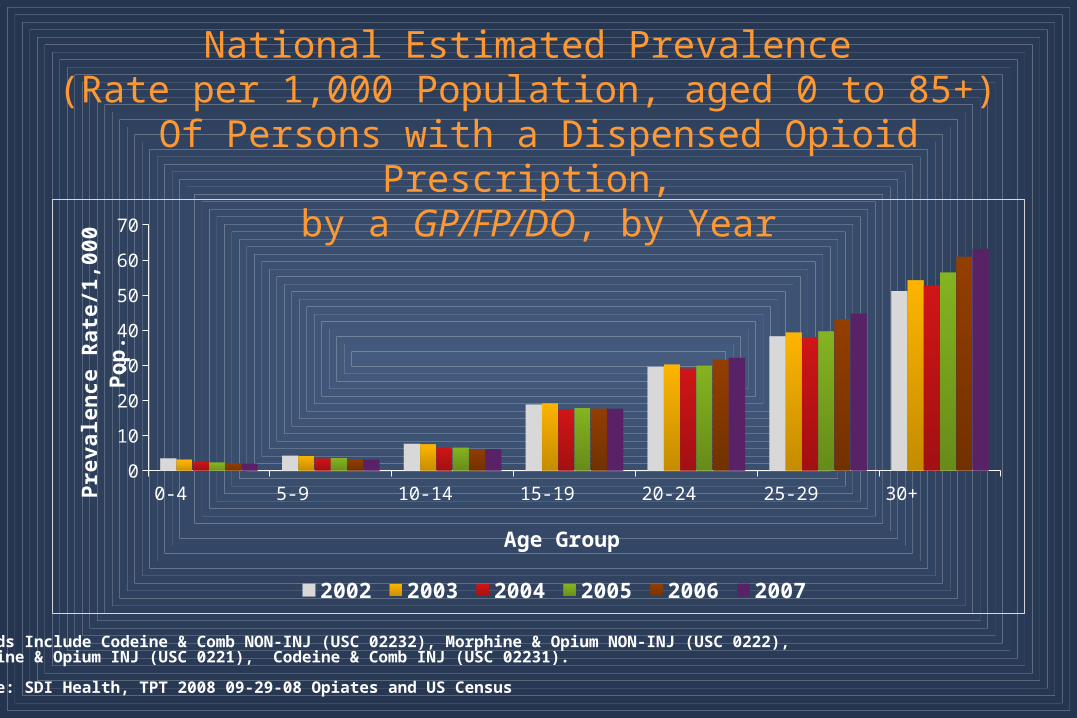
Opioids Include Codeine & Comb NON-INJ (USC 02232), Morphine & Opium NON-INJ (USC 0222), Morphine & Opium INJ (USC 0221), Codeine & Comb INJ (USC 02231).
Source: SDI Health, TPT 2008 09-29-08 Opiates and US Census
National Estimated Prevalence (Rate per 1,000 Population, aged 0 to 85+)
Of Persons with a Dispensed Opioid Prescription, by a GP/FP/DO, by Year
0-4 5-9 10-14 15-19 20-24 25-29 30+ 0
10
20
30
40
50
60
70
2002 2003 2004 2005 2006 2007
Age Group
Pre
vale
nce
Rat
e/1,
000
Pop
.
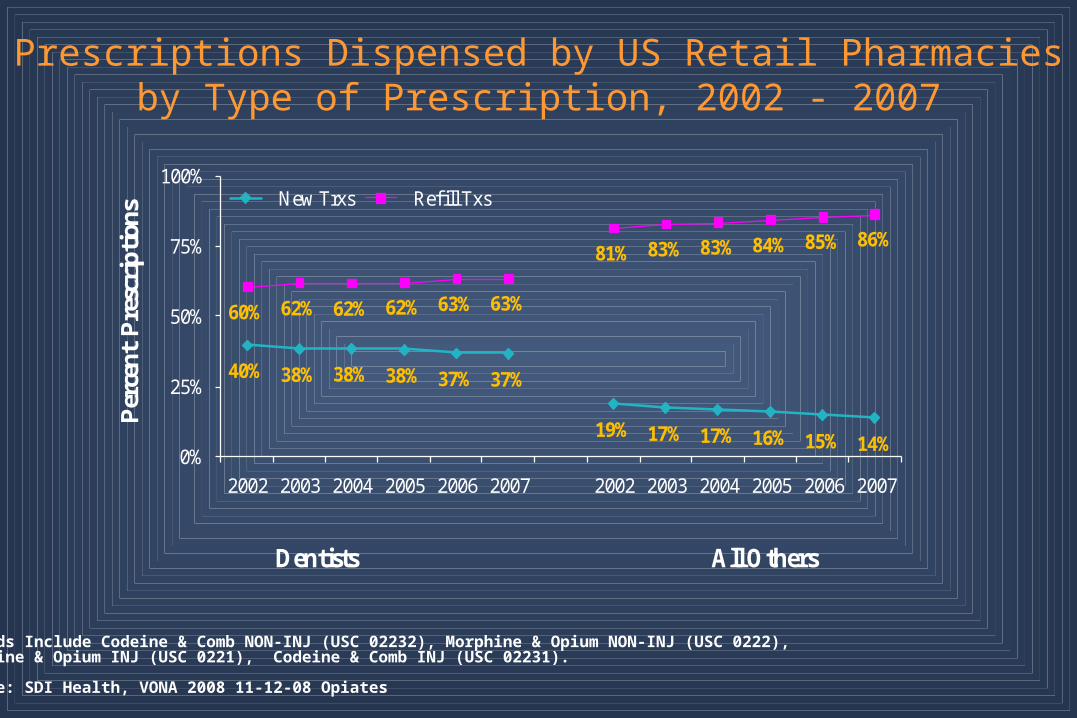
40% 38% 38% 38% 37% 37%
19% 17% 17% 16% 15% 14%
60% 62% 62% 62% 63% 63%
81% 83% 83% 84% 85% 86%
0%
25%
50%
75%
100%
2002 2003 2004 2005 2006 2007 2002 2003 2004 2005 2006 2007
Per
cent
Pre
scri
ptio
ns
Dentists All Others
New Trxs Refill Txs
Opioids Include Codeine & Comb NON-INJ (USC 02232), Morphine & Opium NON-INJ (USC 0222), Morphine & Opium INJ (USC 0221), Codeine & Comb INJ (USC 02231).
Source: SDI Health, VONA 2008 11-12-08 Opiates
Prescriptions Dispensed by US Retail Pharmacies by Type of Prescription, 2002 - 2007
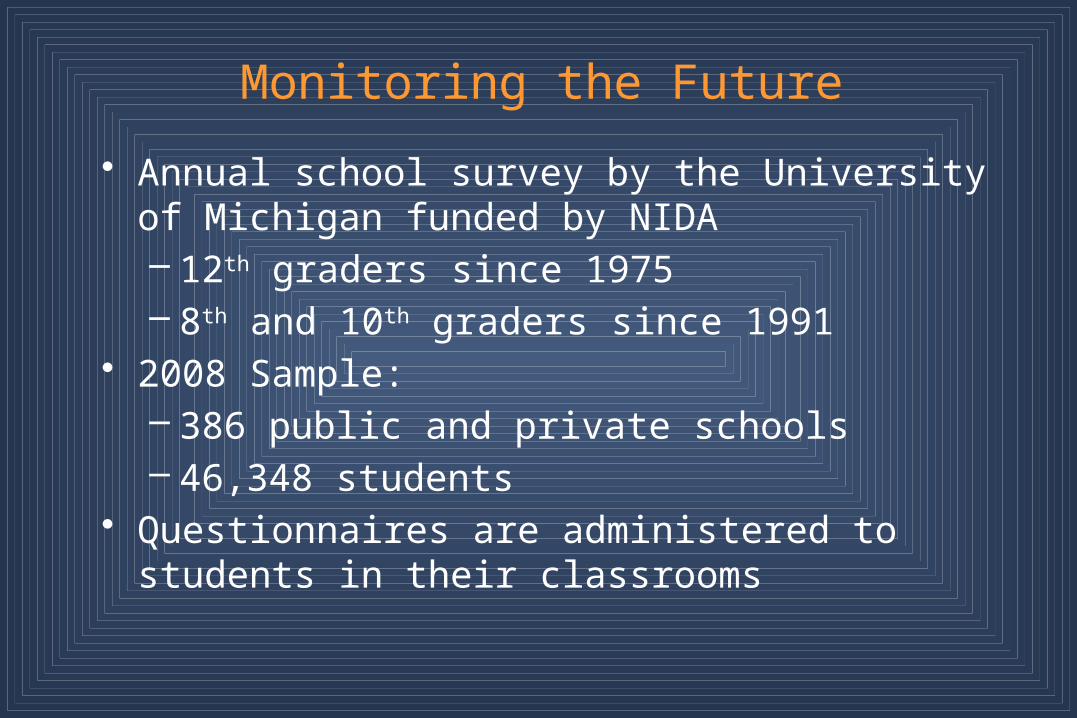
Monitoring the Future
• Annual school survey by the University of Michigan funded by NIDA– 12th graders since 1975– 8th and 10th graders since 1991
• 2008 Sample:– 386 public and private schools– 46,348 students
• Questionnaires are administered to students in their classrooms

NSDUH National Survey on Drug Use & Health
• Annual nationwide survey funded by SAMHSA– Includes civilian, noninstitutionalized population aged 12 years old or older
residing within the United States• 2007 survey
– Respondent sample of 67,870 persons representative of the U.S. general population aged 12 or older (since 1991, the civilian, noninstitutionalized population)
• Data collection– In-person computer assisted interviews with sample persons, incorporating
procedures that would be likely to increase respondents' cooperation and willingness to report honestly about their illicit drug use behavior