Embed Size (px)
Citation preview
National Instituteof Economic and Social Research
An Introduction to the Analysis of WERS 2004
John Forth & Lucy StokesWERS 2004 Information & Advice Service
Aims
• Introduce the publicly-available data files– Content– Availability and access procedures– Key features
• Analytical issues– First steps– Weighting and statistical inference– Linking data files
• Where to get help and advice
Assumptions
• Know something about nature and content of WERS 2004
• Yet to obtain or use the data, or
• At the very early stages in your analysis
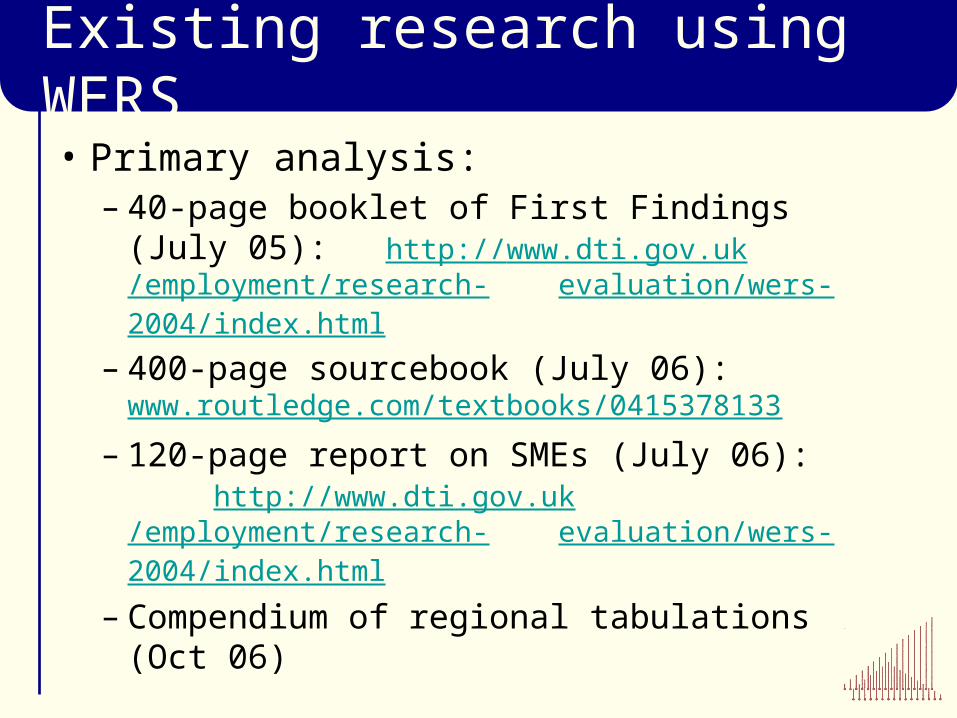
Existing research using WERS
• Primary analysis:– 40-page booklet of First Findings (July
05): http://www.dti.gov.uk/employment/research-evaluation/wers-2004/index.html
– 400-page sourcebook (July 06): www.routledge.com/textbooks/0415378133
– 120-page report on SMEs (July 06): http://www.dti.gov.uk/employment/research-
evaluation/wers-2004/index.html
– Compendium of regional tabulations (Oct 06)
Existing research using WERS
• Secondary analysis:– Bibliography of research using WERS
1980-1998– Searchable on-line database of research
using WERS 2004
Both available at:http://www.wers2004.info/research/search.php
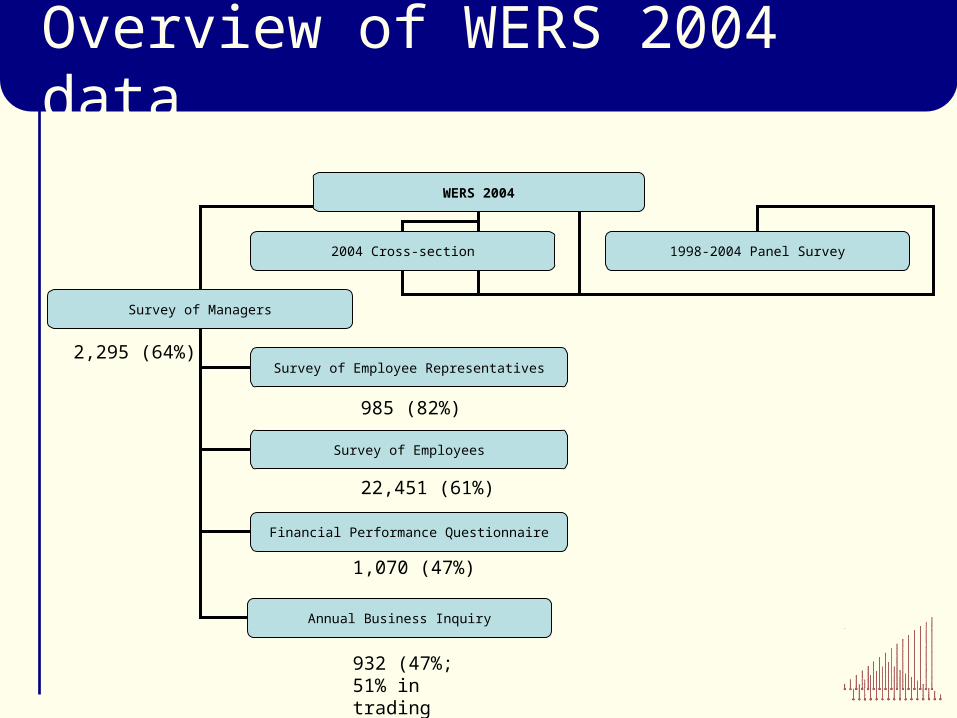
Overview of WERS 2004 data
WERS 2004
2004 Cross-section 1998-2004 Panel Survey
Survey of Managers
Survey of Employee Representatives
Survey of Employees
Financial Performance Questionnaire
2,295 (64%)
985 (82%)
22,451 (61%)
1,070 (47%)
Annual Business Inquiry
932 (47%; 51% in trading sector)

Cross-Section: Managers• Workforce composition • Management of personnel and employment
relations • Recruitment and training • Workplace flexibility and the organisation of
work • Consultation and information • Employee representation • Payment systems and pay determination • Grievance, disciplinary and dispute procedures • Equal opportunities, work-life balance • Workplace performance
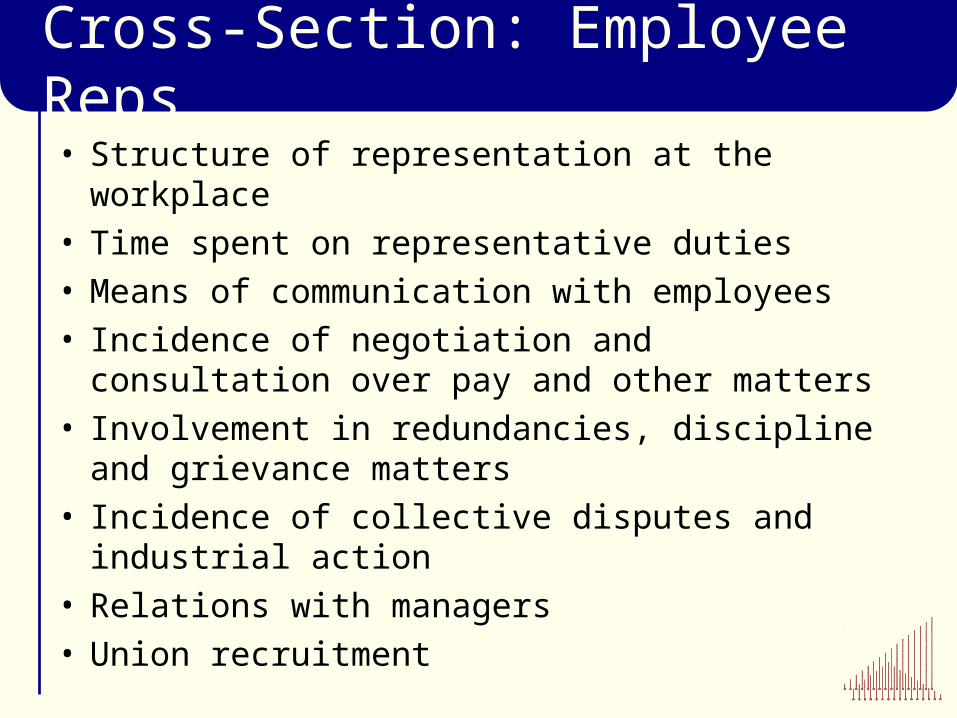
Cross-Section: Employee Reps• Structure of representation at the workplace • Time spent on representative duties • Means of communication with employees • Incidence of negotiation and consultation
over pay and other matters • Involvement in redundancies, discipline and
grievance matters • Incidence of collective disputes and
industrial action • Relations with managers • Union recruitment
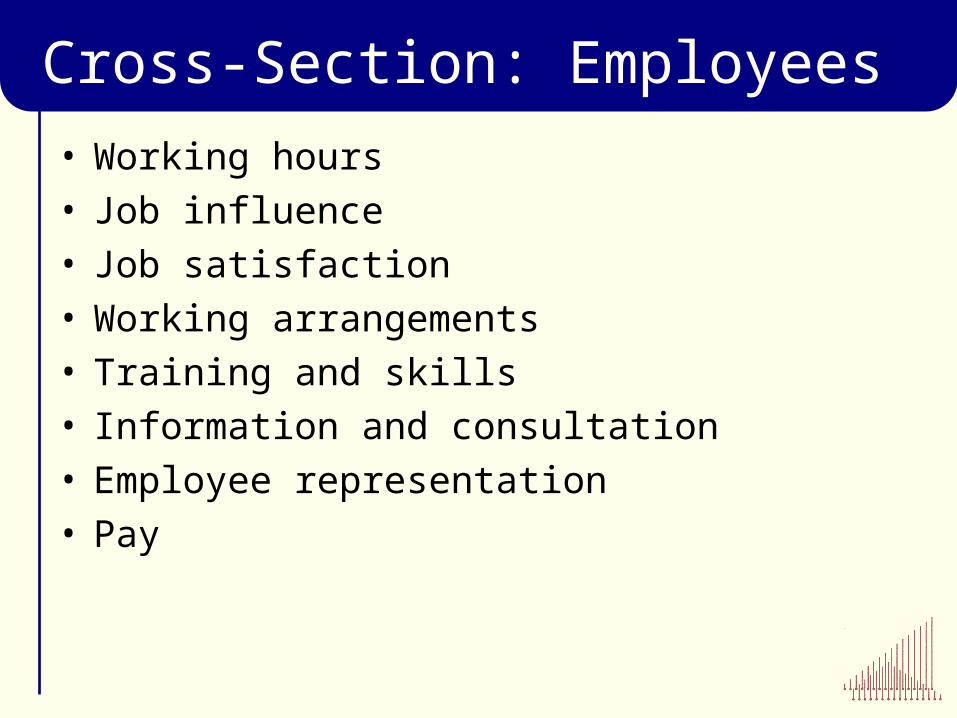
Cross-Section: Employees• Working hours • Job influence • Job satisfaction • Working arrangements • Training and skills • Information and consultation • Employee representation • Pay

Cross-Section: FPQ / ABI• Turnover• Employment costs• Purchases• Capital stocks• Capital expenditure (acquisitions and
disposals)• R&D activity

Longitudinal analysis
• Each XS: independent samples – no overlap between surveys
• Time-series with 5 data points– Changes to questionnaires over time– 1998 a major break point– Expansion of population in 1998 and
2004 to include smaller workplaces
Longitudinal analysis
• Two-wave Panel Surveys provide longitudinal data on individual workplaces– 1984-1990 (trading sector only)– 1990-1998 (all workplaces with 25+)– 1998-2004 (all workplaces with 10+)
• Survival status of original x-section• Changes in practice in continuing
workplaces (headline practices only)
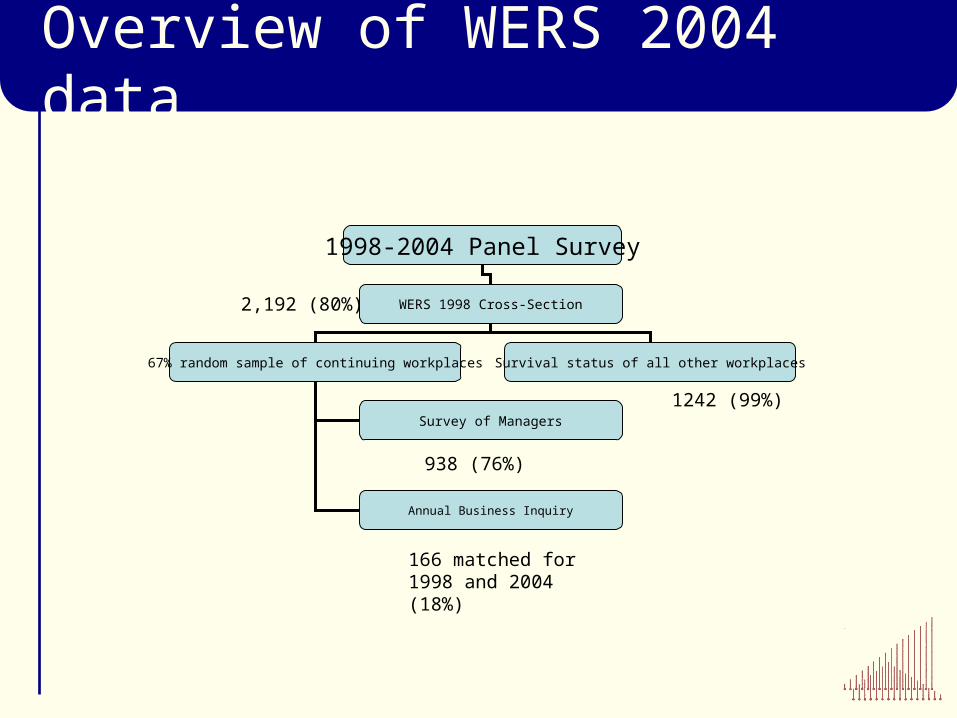
Overview of WERS 2004 data
1998-2004 Panel Survey
WERS 1998 Cross-Section2,192 (80%)
1242 (99%)
67% random sample of continuing workplaces Survival status of all other workplaces
Survey of Managers
Annual Business Inquiry
938 (76%)
166 matched for 1998 and 2004 (18%)
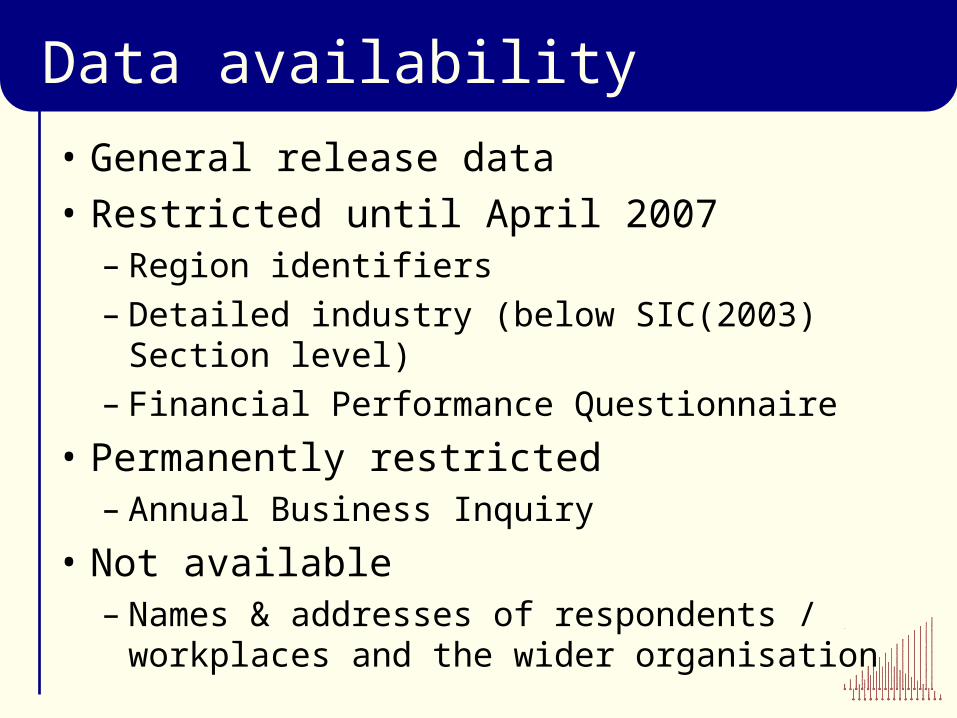
Data availability
• General release data• Restricted until April 2007
– Region identifiers– Detailed industry (below SIC(2003) Section
level)– Financial Performance Questionnaire
• Permanently restricted– Annual Business Inquiry
• Not available– Names & addresses of respondents /
workplaces and the wider organisation
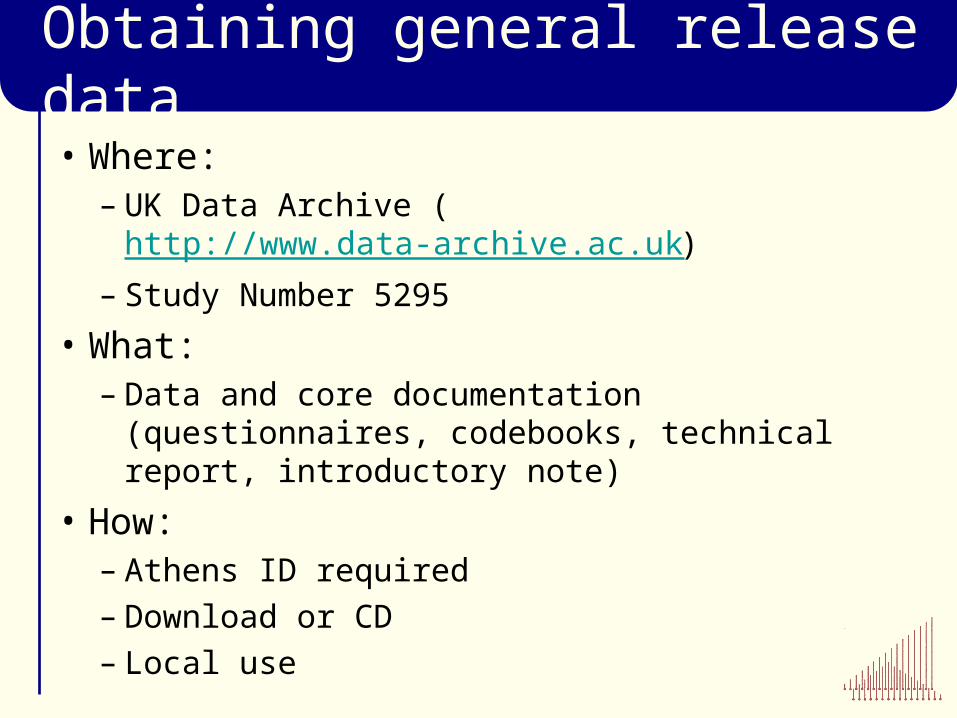
Obtaining general release data• Where:
– UK Data Archive (http://www.data-archive.ac.uk)
– Study Number 5295
• What:– Data and core documentation
(questionnaires, codebooks, technical report, introductory note)
• How:– Athens ID required– Download or CD– Local use
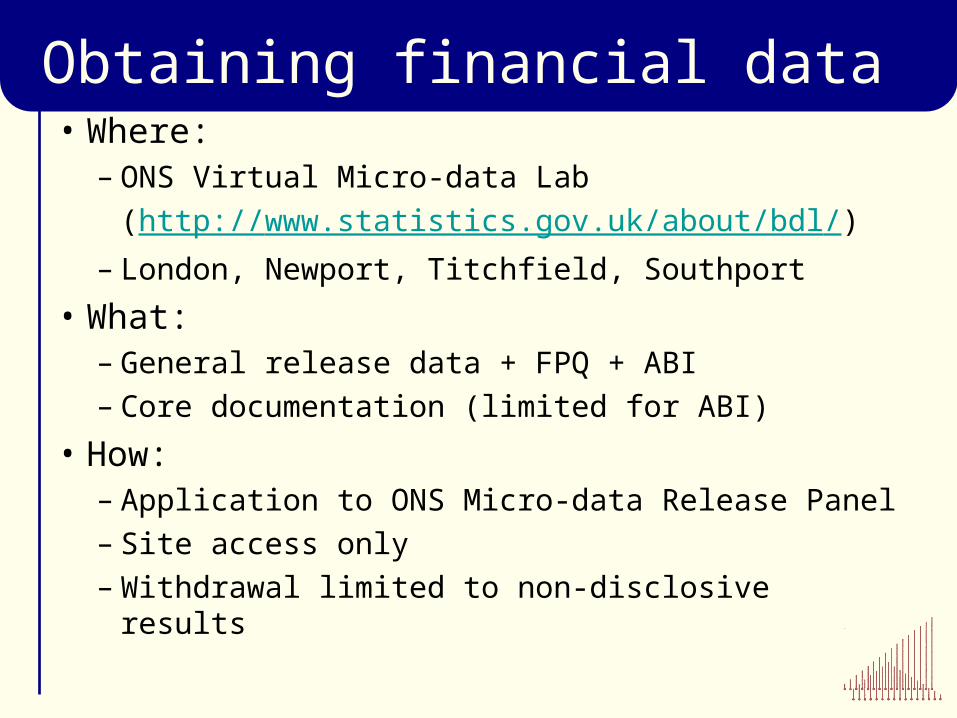
Obtaining financial data• Where:
– ONS Virtual Micro-data Lab (http://www.statistics.gov.uk/about/bdl/)
– London, Newport, Titchfield, Southport
• What:– General release data + FPQ + ABI – Core documentation (limited for ABI)
• How:– Application to ONS Micro-data Release Panel– Site access only– Withdrawal limited to non-disclosive results

Timed release of restricted data• In April 2007:
– FPQ to the UK Data Archive– Region codes and detailed industry
codes to UKDA and ONS
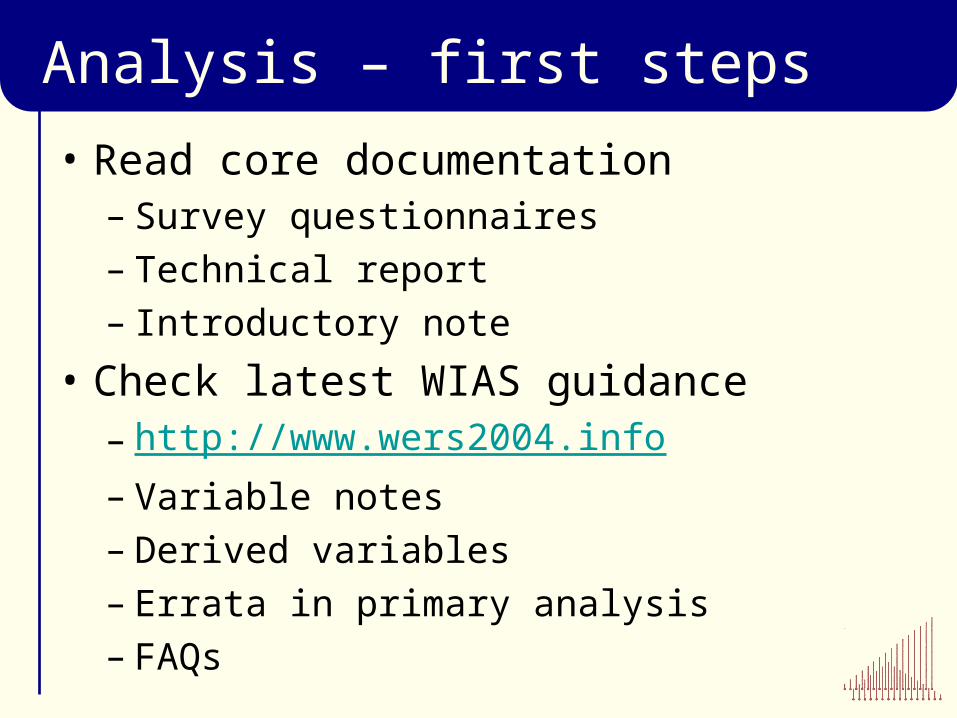
Analysis – first steps
• Read core documentation– Survey questionnaires– Technical report– Introductory note
• Check latest WIAS guidance– http://www.wers2004.info– Variable notes– Derived variables– Errata in primary analysis– FAQs
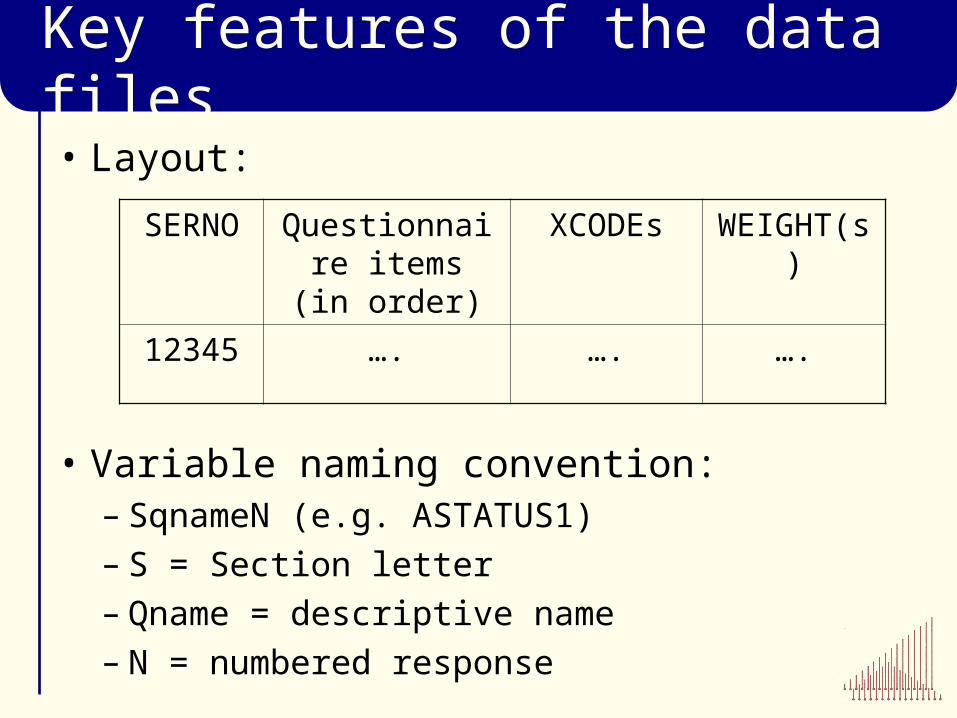
Key features of the data files
• Layout:
• Variable naming convention:– SqnameN (e.g. ASTATUS1)– S = Section letter– Qname = descriptive name– N = numbered response
SERNO Questionnaire items (in
order)
XCODEs WEIGHT(s)
12345 …. …. ….
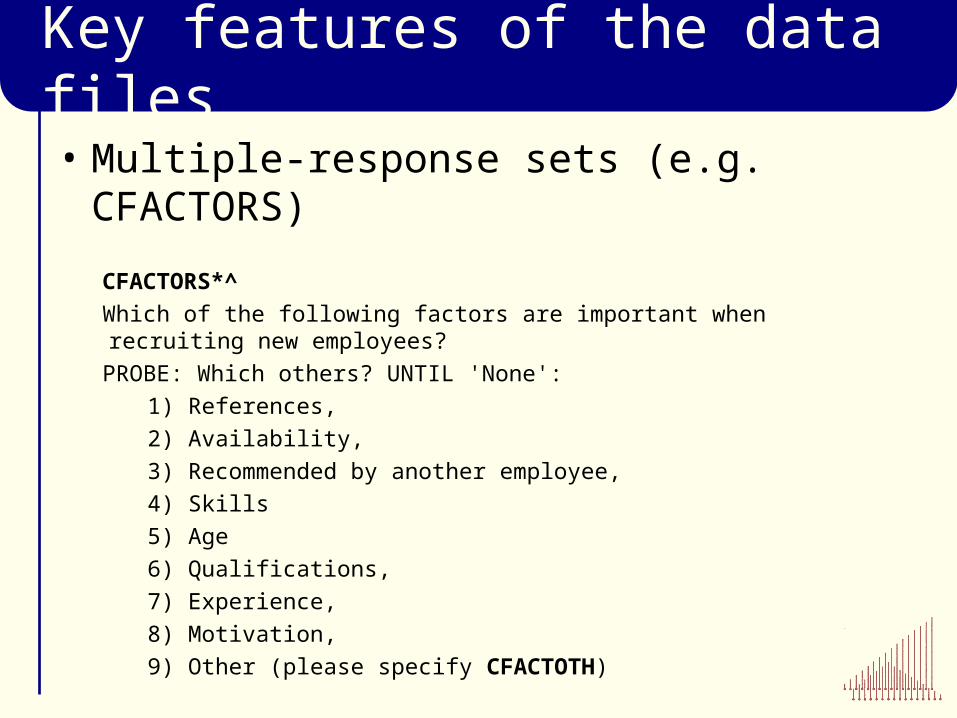
Key features of the data files
• Multiple-response sets (e.g. CFACTORS)
CFACTORS*^ Which of the following factors are important when recruiting new employees? PROBE: Which others? UNTIL 'None':
1) References, 2) Availability, 3) Recommended by another employee, 4) Skills5) Age6) Qualifications, 7) Experience, 8) Motivation, 9) Other (please specify CFACTOTH)
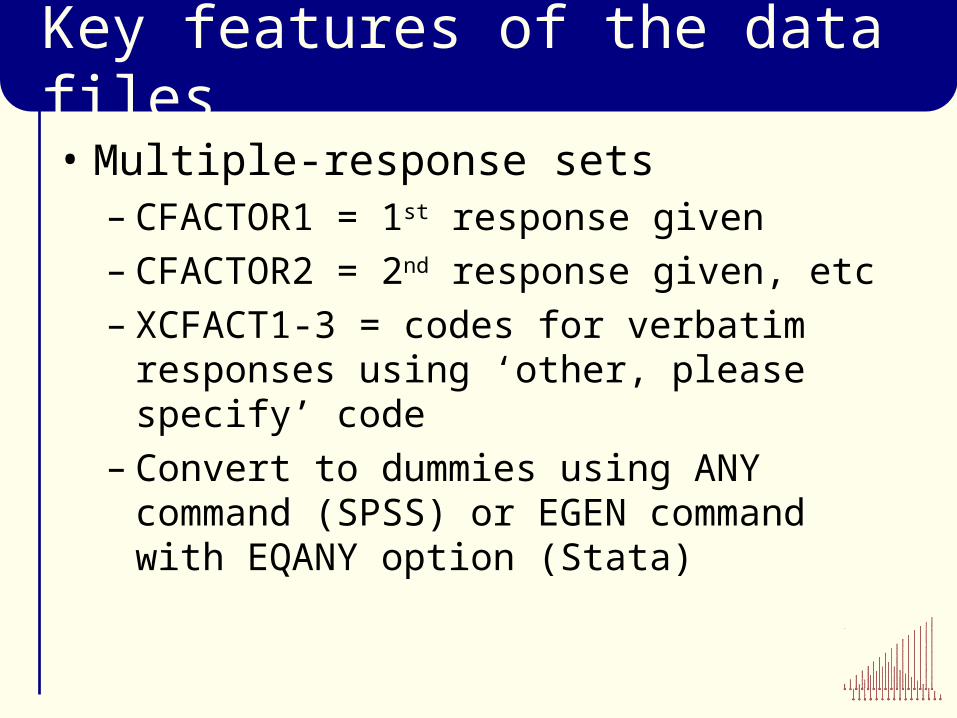
Key features of the data files
• Multiple-response sets– CFACTOR1 = 1st response given– CFACTOR2 = 2nd response given, etc– XCFACT1-3 = codes for verbatim
responses using ‘other, please specify’ code
– Convert to dummies using ANY command (SPSS) or EGEN command with EQANY option (Stata)

Key features of the data files
•T variables (e.g. FMEASPR, FMEASPRT)FMEASPR* What proportion of non-managerial employees at this workplace have their performance formally appraised? INTERVIEWER: If respondent gives answer as an exact number you can code “97” here and record the number of the next question 1) All (100%), 2) Almost all (80-99%), 3) Most (60-79%), 4) Around half (40-59%), 5) Some (20-39%), 6) Just a few (1-19%), 97) Number
{If giving exact number } FMEASPRT How many non-managerial employees here have their performance formally appraised? ENTER NUMBER
Key features of the data files
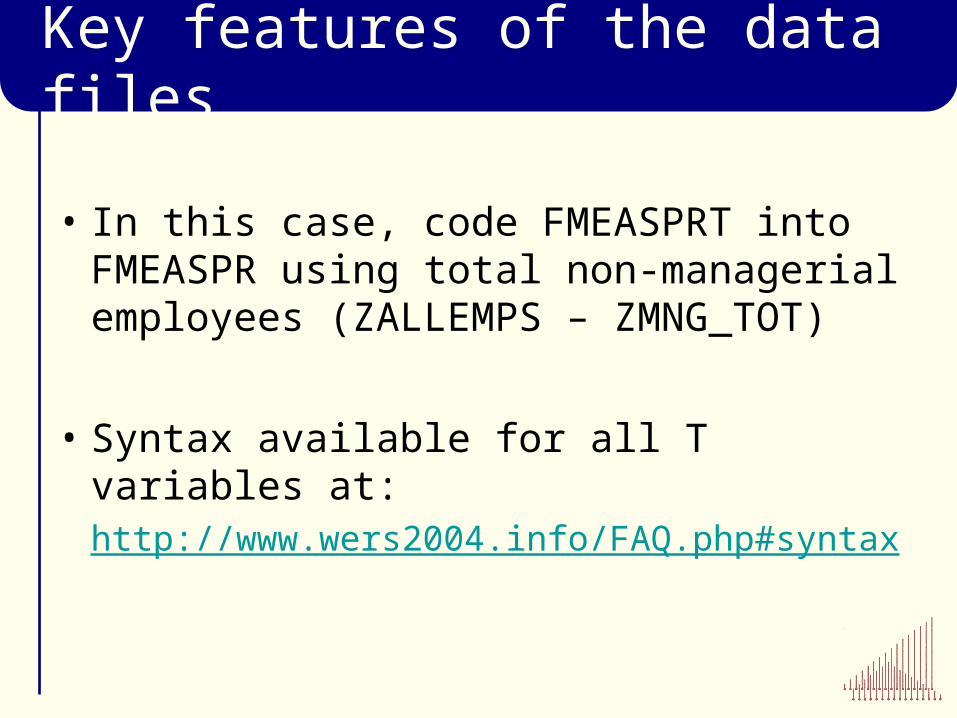
• In this case, code FMEASPRT into FMEASPR using total non-managerial employees (ZALLEMPS – ZMNG_TOT)
• Syntax available for all T variables at:
http://www.wers2004.info/FAQ.php#syntax
Key features of the data files
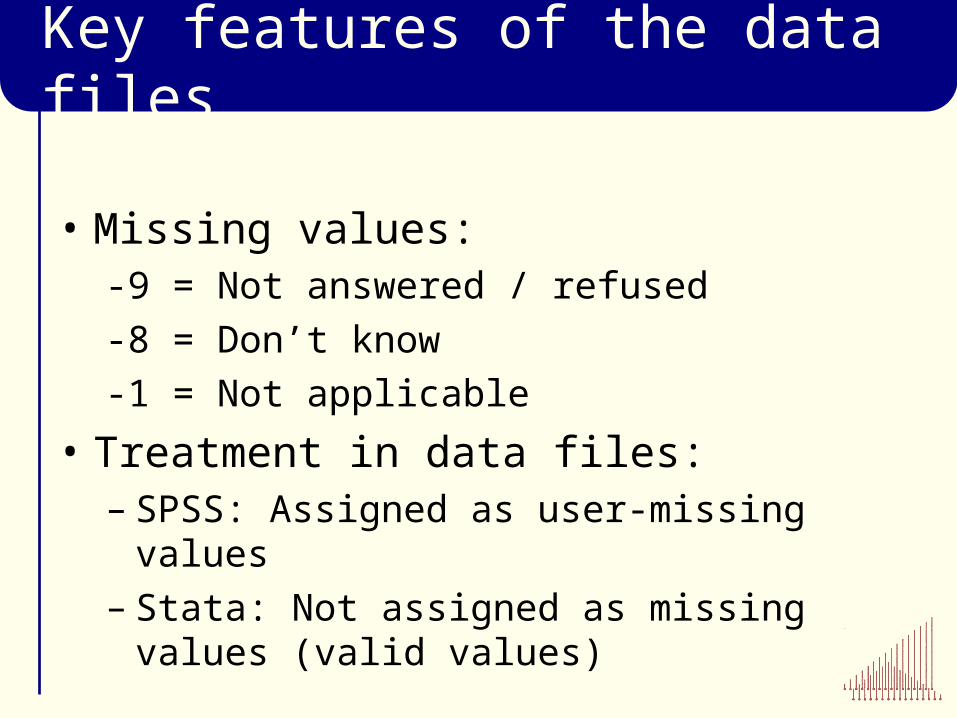
• Missing values:-9 = Not answered / refused-8 = Don’t know-1 = Not applicable
• Treatment in data files:– SPSS: Assigned as user-missing values– Stata: Not assigned as missing values
(valid values)
Producing reliable estimates
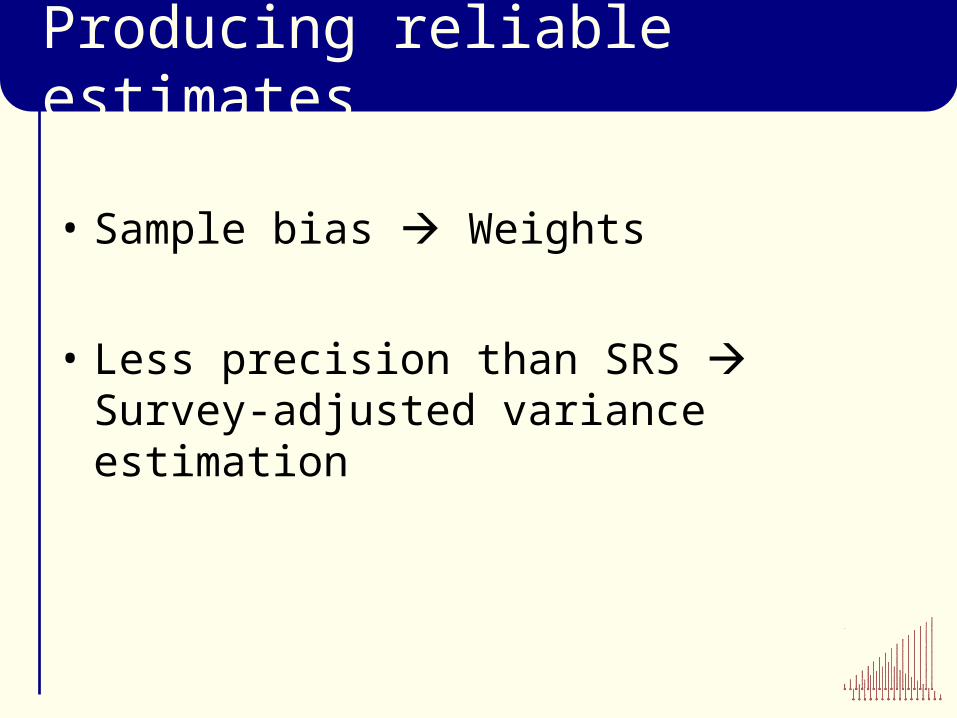
• Sample bias Weights
• Less precision than SRS Survey-adjusted variance estimation
Importance of weighting
• Sample of workplaces not SRS• Unequal probabilities of selection by
workplace size and industry (IDBR)• Large workplaces and small industries
over-represented vs population• Also: variations in response rates by size
and industry (at least)• Weight = 1 / p(selection and response)• Weighted estimates free of known
biases (i.e. representative of wider population)
Correctly estimating variances• Textbook formulae assume SRSWR• WERS not sampled according to SRSWR• Unequal p(selection) & clustering of
employee sample larger standard errors than SRSWR (50-60% larger, on average)
• Textbook formulae Type I or II errors• Linearization or replication methods
SEs that account for the survey design
Software options
• Stata version 5 onwards:– ‘svy’ suite of commands (included)– svyset informs Stata about the sample
design– svy: prefix can be used with wide range
of statistical procedures– iweights will remove bias but
incorrectly estimate variances (SEs)– Syntax examples at:
http://www.wers2004.info/FAQ.php#stata

Software options
• SPSS version 12 onwards:– Complex Samples module (add-on)– CSPLAN ANALYSIS informs SPSS about
the sample design– Limited range of CS procedures then
available (descriptives, x-tabs, logit, ordinal, GLM)
– WEIGHT BY will remove bias but incorrectly estimate variances (SEs)
– Syntax examples at: http://www.wers2004.info/FAQ.php#spss
Linking data files
• Combining data from different questionnaires for linked analysis
• Examples:– Using data on payment practices from
MQ in analysis of employees’ wages– Comparing managers’ and employee
representatives’ ratings of climate– Linking 1998 and 2004 observations in
Panel
• Link via unique workplace identifier (SERNO)
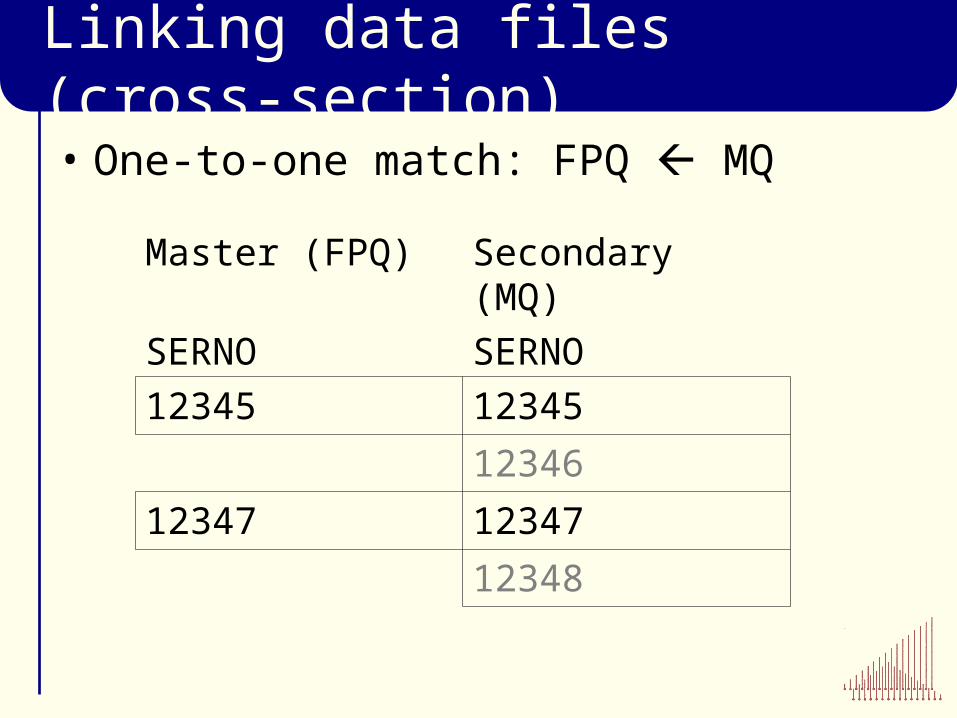
Linking data files (cross-section)• One-to-one match: FPQ MQ
Master (FPQ) Secondary (MQ)
SERNO SERNO
12345 12345
12346
12347 12347
12348
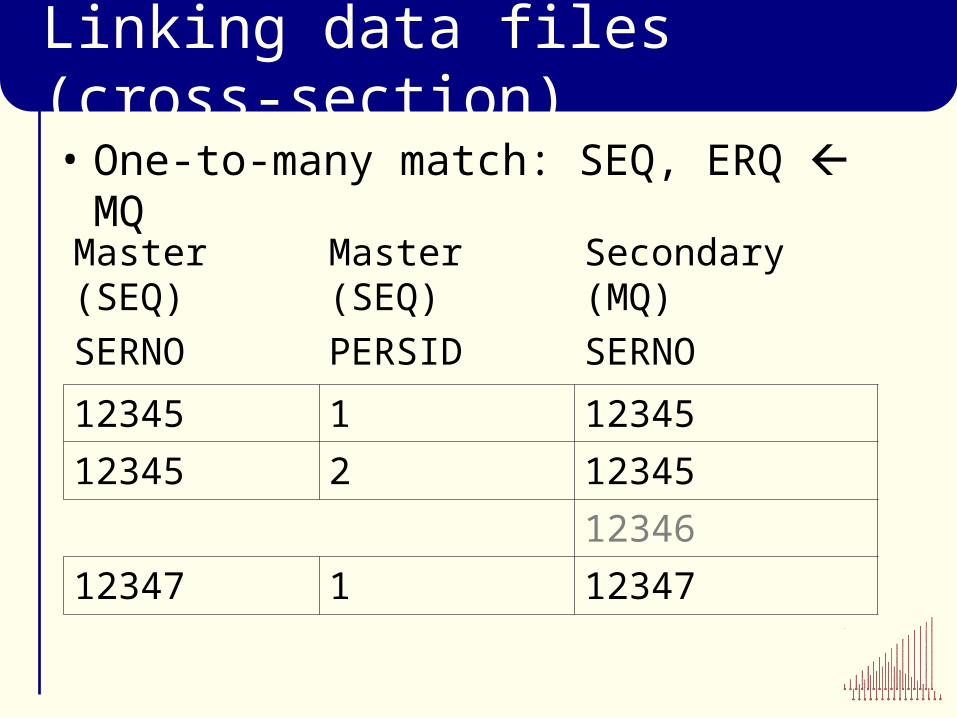
Linking data files (cross-section)• One-to-many match: SEQ, ERQ MQ
Master (SEQ)
Master (SEQ)
Secondary (MQ)
SERNO PERSID SERNO
12345 1 12345
12345 2 12345
12346
12347 1 12347

Software options
• SPSS:MATCH FILES FILE=master file
/TABLE=secondary file/BY serno
• Stata:get file=master file
merge serno using secondary file
drop _merge==2
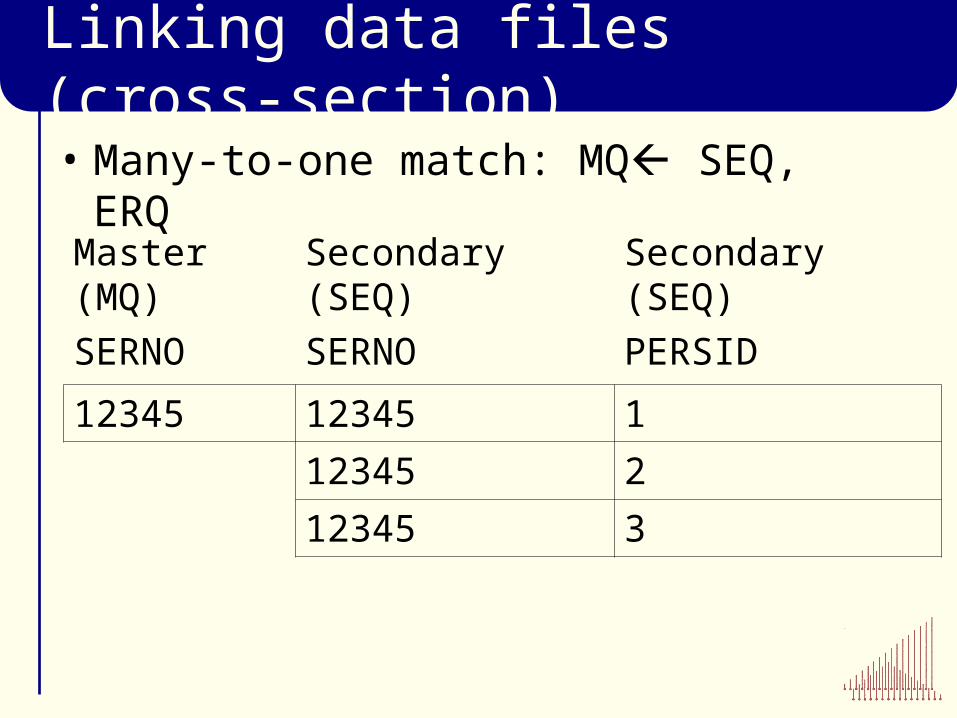
Linking data files (cross-section)• Many-to-one match: MQ SEQ, ERQ
Master (MQ)
Secondary (SEQ)
Secondary (SEQ)
SERNO SERNO PERSID
12345 12345 1
12345 2
12345 3
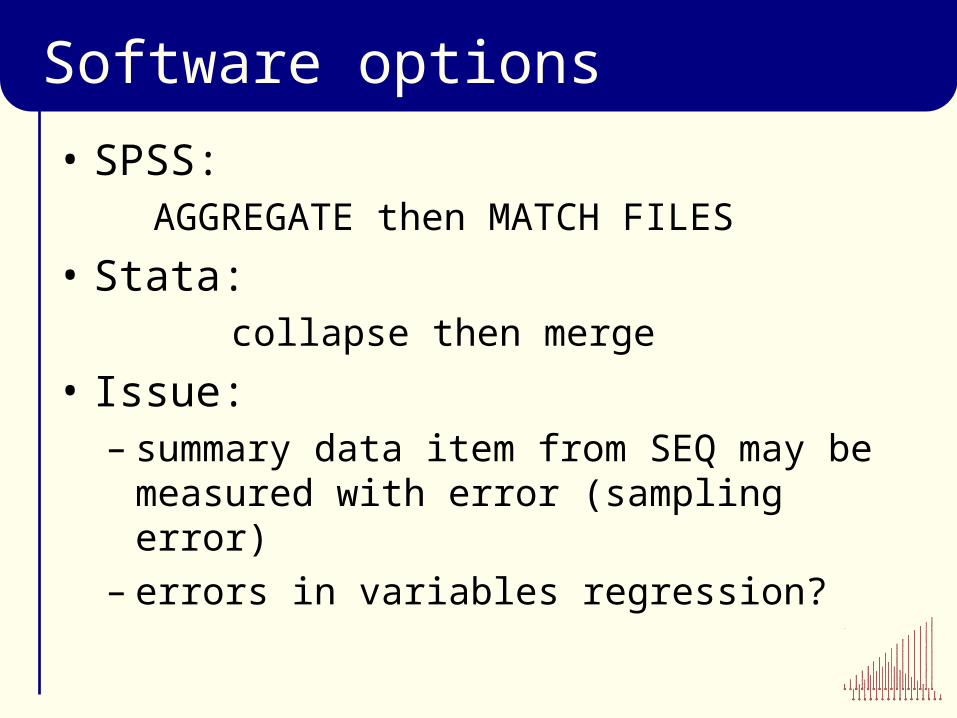
Software options
• SPSS:AGGREGATE then MATCH FILES
• Stata:collapse then merge
• Issue:– summary data item from SEQ may be
measured with error (sampling error)– errors in variables regression?
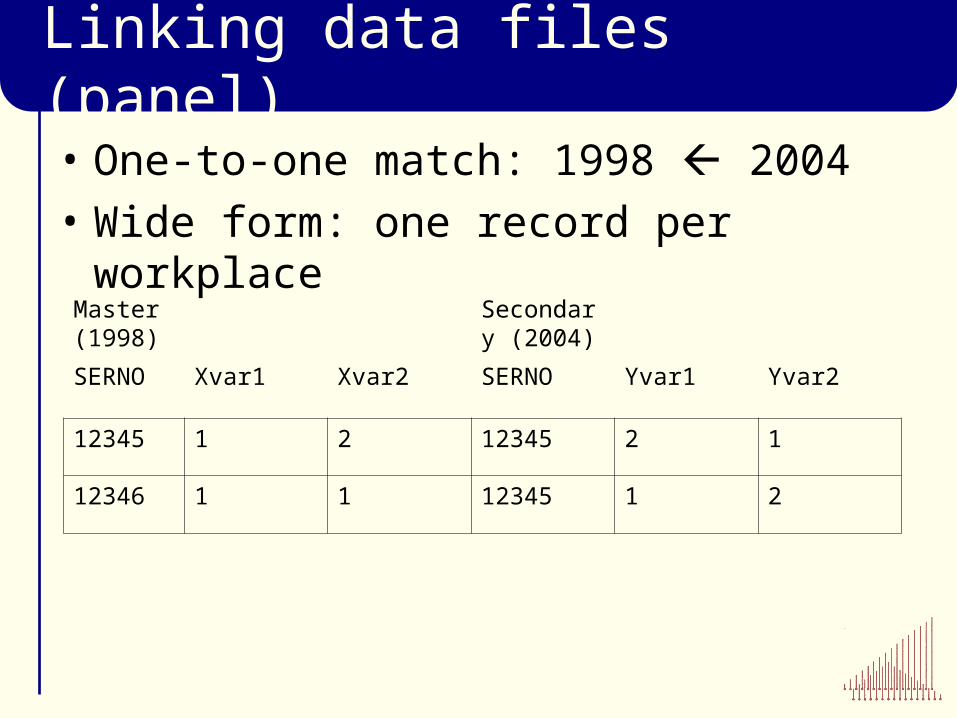
Linking data files (panel)
• One-to-one match: 1998 2004• Wide form: one record per workplace
Master (1998)
Secondary (2004)
SERNO Xvar1 Xvar2 SERNO Yvar1 Yvar2
12345 1 2 12345 2 1
12346 1 1 12345 1 2
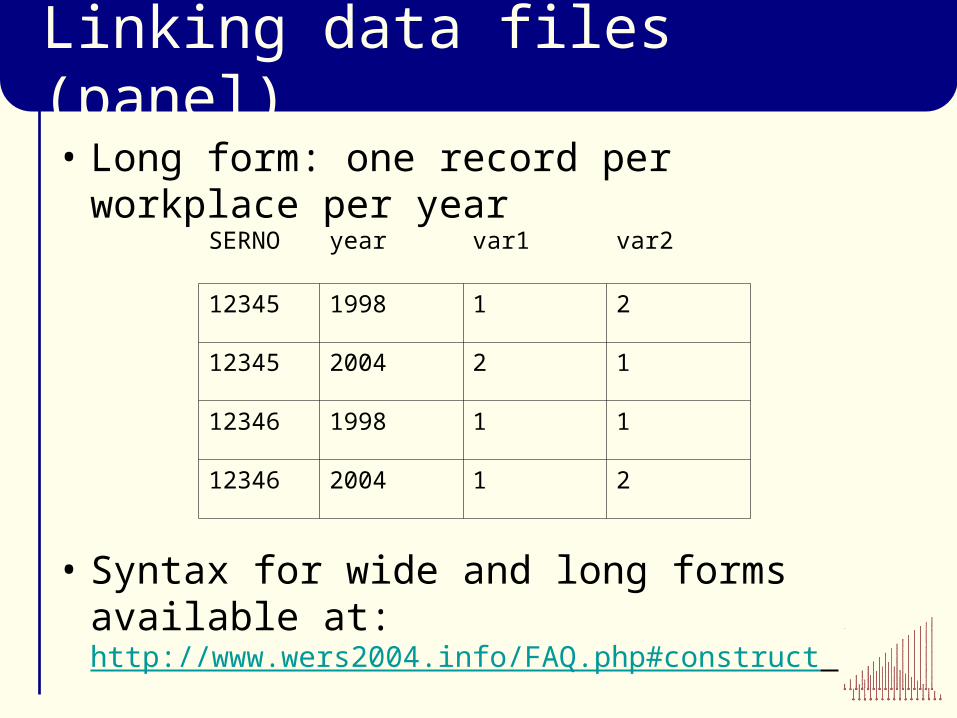
Linking data files (panel)
• Long form: one record per workplace per year
• Syntax for wide and long forms available at: http://www.wers2004.info/FAQ.php#construct
SERNO year var1 var2
12345 1998 1 2
12345 2004 2 1
12346 1998 1 1
12346 2004 1 2

Aims
• Introduce the publicly-available data files– Content– Availability and access procedures– Key features
• Analytical issues– First steps– Weighting and statistical inference– Linking data files
• Where to get help and advice

Further info and advice
WERS 2004 Information and Advice Service
Website: http://www.wers2004.info
Email: [email protected]
Telephone: +44 (0) 20 7654 1933