Embed Size (px)
Citation preview
National Indicators for Local Authorities and Local Authority Partnerships:Handbook of Definitions
Annex 4: Local Economy and Environmental Sustainability

2 National Indicators for Local Authorities and Local Authority Partnerships: Handbook of Definitions
Annex 4: Local Economy and Environmental Sustainability 3
Introduction
On 11 October 2007 the Secretary of State for Communities and Local Government announced a new set of 198 national indicators for English local authorities and local authority partnerships. The set underpins the new performance framework for local government and meets the Government’s commitment, as set out in the local Government White Paper Strong and Prosperous Communities, to introduce a clear set of national outcomes and a single set of national indicators by which to measure them.
A consultation exercise on the Government’s proposed technical definitions for the 198 indicators ran from 8 November to 21 December 2007. Communities and Local Government have been working with other Government Departments and stakeholders to agree final definitions for inclusion in the handbook, taking into account the many helpful and informed comments received from consultees on individual indicators.
This handbook contains the final full definitions for all indicators to be introduced for 2008/09 and an outline of plans for introduction of those indicators delayed until 2009/10. Methodology from the Place Survey will be published shortly.
In line with the consultation document the indicator definitions are split into four annexes as follows.
Annex 1: Stronger and Safer Communities
Annex 2: Children and Young People
Annex 3: Adult Health & Well-being and Tackling Exclusion & Promoting Equality
Annex 4: Local Economy and Environmental Sustainability
This document is Annex 4 to the document National indicators for Local Authorities and Local Authority Partnerships: Handbook of Definitions.
4 National Indicators for Local Authorities and Local Authority Partnerships: Handbook of Definitions
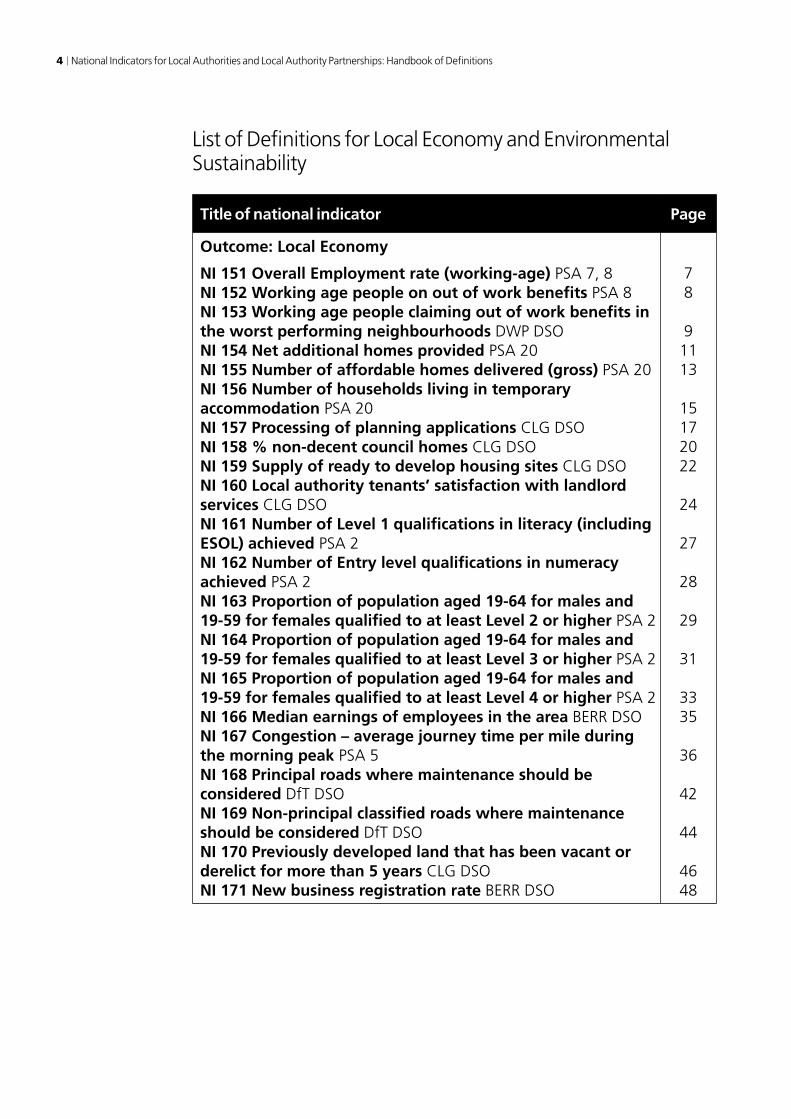
List of Definitions for Local Economy and Environmental Sustainability
Title of national indicator Page
Outcome: Local Economy
NI 151 Overall Employment rate (working-age) PSA 7, 8NI 152 Working age people on out of work benefits PSA 8NI 153 Working age people claiming out of work benefits in the worst performing neighbourhoods DWP DSONI 154 Net additional homes provided PSA 20NI 155 Number of affordable homes delivered (gross) PSA 20NI 156 Number of households living in temporary accommodation PSA 20NI 157 Processing of planning applications CLG DSO NI 158 % non-decent council homes CLG DSO NI 159 Supply of ready to develop housing sites CLG DSO NI 160 Local authority tenants’ satisfaction with landlord services CLG DSO NI 161 Number of Level 1 qualifications in literacy (including ESOL) achieved PSA 2 NI 162 Number of Entry level qualifications in numeracy achieved PSA 2 NI 163 Proportion of population aged 19-64 for males and 19-59 for females qualified to at least Level 2 or higher PSA 2NI 164 Proportion of population aged 19-64 for males and 19-59 for females qualified to at least Level 3 or higher PSA 2NI 165 Proportion of population aged 19-64 for males and 19-59 for females qualified to at least Level 4 or higher PSA 2NI 166 Median earnings of employees in the area BERR DSO NI 167 Congestion – average journey time per mile during the morning peak PSA 5NI 168 Principal roads where maintenance should be considered DfT DSONI 169 Non-principal classified roads where maintenance should be considered DfT DSONI 170 Previously developed land that has been vacant or derelict for more than 5 years CLG DSO NI 171 New business registration rate BERR DSO
78
91113
15172022
24
27
28
29
31
3335
36
42
44
4648

Annex 4: Local Economy and Environmental Sustainability 5
Title of national indicator Page
Outcome: Local Economy (continued)
NI 172 Percentage of small businesses in an area showing employment growth BERR DSO NI 173 Flows on to incapacity benefits from employment DWP DSO NI 174 Skills gaps in the current workforce reported by employers DIUS DSONI 175 Access to services and facilities by public transport, walking and cycling DfT DSONI 176 Working age people with access to employment by public transport (and other specified modes) DfT DSONI 177 Local bus and light rail passenger journeys originating in the authority area DfT DSONI 178 Bus services running on time DfT DSONI 179 Value for money – total net value of on-going cash-releasing value for money gains that have impacted since the start of the 2008-9 financial year CLG DSONI 180 The number of changes of circumstances which affect customers’ HB/CTB entitlements within the year DWP DSO NI 181 Time taken to process Housing Benefit/Council Tax Benefit new claims and change events DWP DSO NI 182 Satisfaction of businesses with local authority regulatory services BERR DSO NI 183 Impact of local authority regulatory services on the fair trading environment BERR DSO NI 184 Food establishments in the area which are broadly compliant with food hygiene law
50
53
56
58
61
6466
69
73
75
77
88
94

6 National Indicators for Local Authorities and Local Authority Partnerships: Handbook of Definitions
Title of national indicator Page
Outcome: Environmental Sustainability
NI 185 CO2 reduction from Local Authority operations PSA 27NI 186 Per capita reduction in CO2 emissions in the LA area PSA 27NI 187 Tackling fuel poverty – % of people receiving income based benefits living in homes with a low energy efficiency rating Defra DSONI 188 Planning to Adapt to climate change PSA 27 NI 189 Flood and coastal erosion risk management Defra DSO NI 190 Achievement in meeting standards for the control system for animal health. For introduction in 2009/10 NI 191 Residual household waste per household Defra DSONI 192 Percentage of household waste sent for reuse, recycling and composting Defra DSONI 193 Percentage of municipal waste land filled Defra DSONI 194 Air quality – % reduction in NOx and primary PM10 emissions through local authority’s estate and operations. PSA 28NI 195 Improved street and environmental cleanliness (levels of litter, detritus, graffiti and fly posting) Defra DSONI 196 Improved street and environmental cleanliness – fly tipping Defra DSONI 197 Improved local biodiversity – proportion of local sites where positive conservation management has been or is being implemented Defra DSONI 198 Children travelling to school – mode of transport usually used DfT DSO
96
98
102105109
111112
119126
129
133
138
142
145
Annex 4: Local Economy and Environmental Sustainability 7
Definitions for Local Economy and Environmental Sustainability
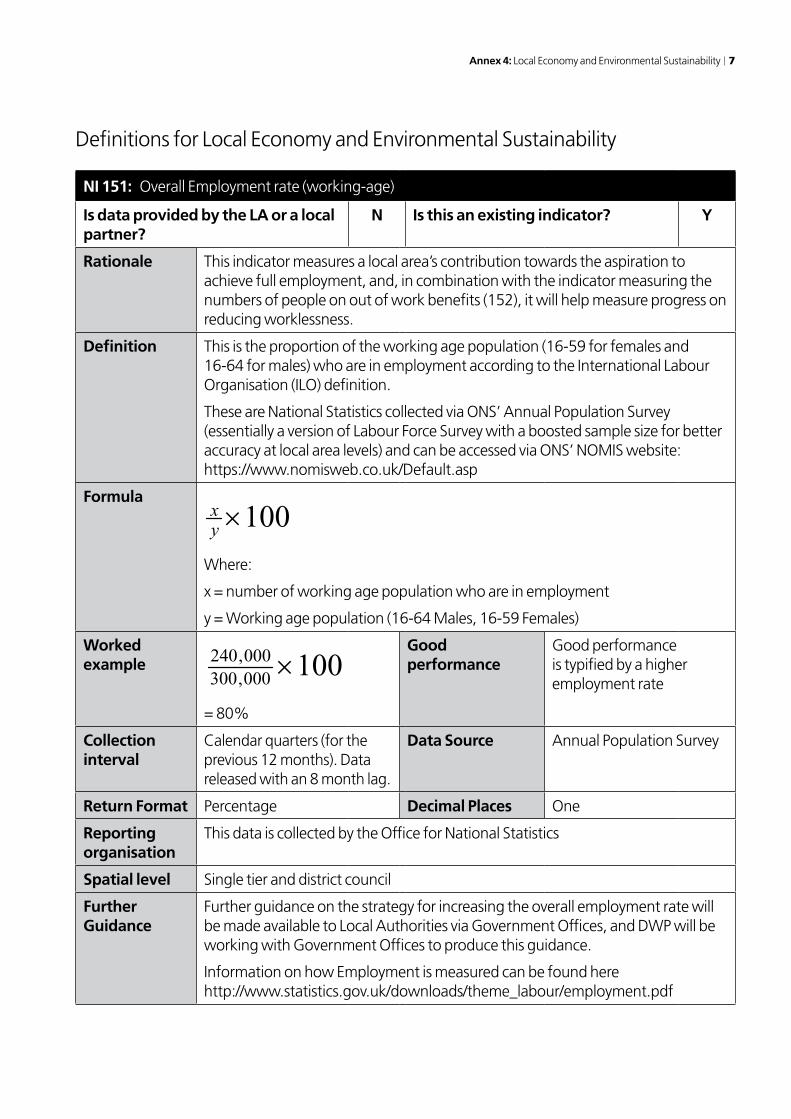
NI 151: Overall Employment rate (working-age)
Is data provided by the LA or a local partner?
N Is this an existing indicator? Y
Rationale This indicator measures a local area’s contribution towards the aspiration to achieve full employment, and, in combination with the indicator measuring the numbers of people on out of work benefits (152), it will help measure progress on reducing worklessness.
Definition This is the proportion of the working age population (16-59 for females and 16-64 for males) who are in employment according to the International Labour Organisation (ILO) definition.
These are National Statistics collected via ONS’ Annual Population Survey (essentially a version of Labour Force Survey with a boosted sample size for better accuracy at local area levels) and can be accessed via ONS’ NOMIS website: https://www.nomisweb.co.uk/Default.asp
Formula
100yx
Where:
x = number of working age population who are in employment
y = Working age population (16-64 Males, 16-59 Females)
Worked example 100000,300
000,240
= 80%
Good performance
Good performance is typified by a higher employment rate
Collection interval
Calendar quarters (for the previous 12 months). Data released with an 8 month lag.
Data Source Annual Population Survey
Return Format Percentage Decimal Places One
Reporting organisation
This data is collected by the Office for National Statistics
Spatial level Single tier and district council
Further Guidance
Further guidance on the strategy for increasing the overall employment rate will be made available to Local Authorities via Government Offices, and DWP will be working with Government Offices to produce this guidance.
Information on how Employment is measured can be found here http://www.statistics.gov.uk/downloads/theme_labour/employment.pdf

8 National Indicators for Local Authorities and Local Authority Partnerships: Handbook of Definitions
NI 152: Working age people on out of work benefits
Is data provided by the LA or a local partner?
N Is this an existing indicator? Y
Rationale This indicator will measure progress on reducing worklessness and, in combination with the indicator on the overall employment rate (NI 151), assesses a local area’s contribution towards the Government’s aspiration to achieve full employment.
Definition This indicator measures the percentage of the working age population who are claiming out of work benefits.Working age benefits include the main out-of-work client group categories (unemployed people on Jobseekers Allowance, Lone Parents on Income Support, Incapacity Benefits customers, and others on income-related benefits) and exclude the carer, disabled and bereaved client groups who are not subject to activation policies in the same way as other groups.The working age population is defined as the sum of females aged 16-59 plus males aged 16-64.Data are presented as a rolling average of 4 quarters to account for seasonal variationThese figures can be accessed at single tier and county council level via ONS’ NOMIS website: https://www.nomisweb.co.uk/Default.asp
Formula
1004321
4321
yyyy
qqqq
Where:q1 to q4 = Number of working age people claiming out of work benefits in quarters 1 to 4.Y = Working age population (16-64 males, 16-59 females) in quarters 1 to 4
Worked example
100489200488800488500487000
65700645006470065300
= 13.3%
Good performance
Good performance will be typified by a reduction in the rate.
Collection interval
Calendar Quarters (for the previous 3 months)
Data Source Work and Pensions Longitudinal Study (WPLS)
Return Format Percentage Decimal Places One
Reporting organisation
Jobcentre Plus (administrative data)
Spatial level Single tier and district council
Further Guidance
http://www.dwp.gov.uk/asd/statistics.asp
Further guidance on the strategy for increasing the overall employment rate will be made available to Local Authorities via Government Offices, and DWP will be working with Government Offices to produce this guidance.

Annex 4: Local Economy and Environmental Sustainability 9
NI 153: Working age people claiming out of work benefits in the worst performing neighbourhoods
Is data provided by the LA or a local partner?
N Is this an existing indicator? N
Rationale This indicator will measure progress on reducing concentrations of worklessness within each LAA.
It will be particularly useful where local authorities are in receipt of the Working Neighbourhoods Fund (WNF), eligibility for which was partly determined by the levels of neighbourhood employment deprivation within them. Areas might also wish to consider whether NI 151 or 152 are more appropriate, for example, where the majority of the LAA is made up from worst performing neighbourhoods, or where the gap between the worst neighbourhoods and the rest is not very wide. Some LAAs will not have any areas which meet the ‘worst performing neighbourhoods’ criterion. This indicator will not be appropriate in those areas.
The indicator supports:
CLG’s strategy for regeneration and renewal, which aims to unlock potential in the most deprived communities through a focus on enterprise and employment; and
DWP’s employment PSA targets – to improve the employment rate of disadvantaged groups and places. The majority of areas identified by this indicator fall within DWP ‘worst wards’ and improvements within these places will directly contribute towards the delivery of DWP’s worst wards target.
Definition This indicator measures the percentage of the working age population claiming out-of-work benefits in the worst performing neighbourhoods.
Working age benefits include the main out-of-work client group categories (unemployed people on Jobseekers Allowance, Lone Parents on Income Support, Incapacity Benefits customers, and others on income-related benefits) and exclude the carer, disabled and bereaved client groups who are not subject to activation policies in the same way as other groups.
Worst performing neighbourhoods are defined as Lower Super Output Areas (LSOAs) with a benefit claim rate (as defined above) of 25% or more based on a 4 quarter average between May 2006 and February 2007. The areas covered will remain the same throughout the lifetime of the Indicator.
LSOAs are statistical areas smaller than wards. An average LSOA contains around 1,500 people.
The working age population is defined as the sum of females aged 16-59 plus males aged 16-64.
Data are presented as a rolling average of 4 quarters to account for seasonal variation.
This indicator gives the benefit rate for the aggregate of all the worst performing neighbourhoods in the LAA, not for each individual neighbourhood.

10 National Indicators for Local Authorities and Local Authority Partnerships: Handbook of Definitions
NI 153: Working age people claiming out of work benefits in the worst performing neighbourhoods (continued)
Formula( )
1004
1
14321
×+++
∑
∑
=
=n
ii
n
iiiii
y
xxxx
Where:
xi1 to xi4 = number of working age people claiming out-of-work benefits in quarters 1 to 4 in LSOA i;
yi = latest working age population (16-64 males, 16-59 females) in LSOA i; and
n = the number of LSOAs meeting the selection criteria in the LAA.
Worked example
If two LSOAs meet the selection criteria:
100)1015907(4
)333350372325()232272212250(×
+×+++++++
= 30.5%
Good performance
Good performance is typified by a reduction in the rate.
Collection interval
Quarterly (with a 6 month time lag)
Data Source Benefit data from Work and Pensions.
Longitudinal Study (WPLS).
Working age population from latest ONS’ mid-year population estimates.
Return Format Percentage Decimal Places One
Reporting organisation
Jobcentre Plus (administrative data)
Spatial level Single tier and district council
Further Guidance
Neighbourhood Renewal Analysis Division, CLG

Annex 4: Local Economy and Environmental Sustainability 11
NI 154: Net additional homes provided
Is data provided by the LA or a local partner?
Y Is this an existing indicator? Y
Rationale Encourage a greater supply of new homes in England to address the long term housing affordability issue.
Definition This indicator measures the net increase in dwelling stock over one year.
Dwelling stock – The definition of dwelling (in line with the 2001 Census) is a self-contained unit of accommodation. Self-containment is where all the rooms in a household are behind a door, which only that household can use. Non-self contained household spaces at the same address should be counted together as a single dwelling. Therefore, a dwelling can consist of one self-contained household space or two or more non-self-contained spaces at the same address.
Formula The net increase in dwelling stock over one year is calculated as the sum of new build completions, minus demolitions, plus any gains or losses through change of use and conversions:
dcba
Where:
a = new build completions;
b = demolitions;
c = change of use (net change)
d = conversions (net change)
Worked example
For example, 2005/06:
New Build = 522
Demolitions = 135
Change of UseGains = 0 Losses =2Net gain = 0 - 2 = -2
ConversionsGains = 12 Losses = 4Net gain = 12 - 4 = 8
Net Additions =522 – 135 – 2 + 8 = 393
Good performance
Good performance is typified by an increase in numbers of net additional homes.
Green paper target to reach 240,000 net additions per annum in England by 2016. Latest figure for 2005/06 is 185,000 net additions per annum.

12 National Indicators for Local Authorities and Local Authority Partnerships: Handbook of Definitions
NI 154: Net additional homes provided (continued)
Collection interval
Annual. Data collected for each financial year.
Housing Flows reconciliation form is collected mid September following the financial year end.
The Joint Return is collected around December or January.
Data Source Net additional supply is collected by CLG through 2 streams:
(1) Northern and Midlands local authorities provide net additions information to CLG through the Housing Flows Reconciliation return.
(2) Southern (London, SE,E and SW), local authorities provide net additions information to their Regional Assemblies through the “Joint Return”, which is jointly badged between the regional assemblies and CLG. Information is shared with CLG.
Return Format Number Decimal Places Zero
Reporting organisation
Northern and Midlands local authorities directly through the Housing Flows Return.
Southern local authorities report to their regional assemblies through the “joint return”, which is jointly badged by the regional assembly and CLG.
Spatial level Single tier and district council
Further Guidance

Annex 4: Local Economy and Environmental Sustainability 13
NI 155: Number of affordable homes delivered (gross)
Is data provided by the LA or a local partner?
Y Is this an existing indicator? Y
Rationale To promote an increase in the supply of affordable housing.
Definition Total supply of social rent housing and intermediate housing.
Affordable housing is as set out in PPS3 (Planning Policy Statement 3), “The Government defines affordable housing as including social-rented and intermediate housing”. Note this can include pitches on Gypsy and Traveller sites owned and managed by local authorities or registered social landlords.
PPS3 specifies further:
Social-rented housing• Rentedhousingownedbylocalauthoritiesandregisteredsociallandlordsfor
which guideline target rents are determined through the national rent regime, set out in the “Guide to Social Rent Reforms” published in March 2001.
• Alsorentedhousingownedbyotherpersonsandprovidedunderequivalentrental arrangements to the above, as agreed with the local authority or funded with grant from the Housing Corporation, as provided for in the Housing Act 2004.
Intermediate housingHousing at prices or rents above those of social-rent but below market prices or rents. This can include shared equity products (for example HomeBuy) and intermediate rent (i.e. rents above social-rented level but below market rents).
Gross supply – Affordable housing is measured as the numbers of affordable dwellings provided in each year, through new build and acquisitions. This does not take account of losses through sales of affordable housing and demolitions. New build completions are as defined in the P2 new build return, when they become ready for occupation
Formula Figure represents the simple count of affordable housing units provided (newly built, including gains from conversions such as subdivision, or acquired). Total supply is the sum of social rent housing and intermediate housing (low cost home ownership and intermediate rent):
ba
Where:a = sum of social rented housing;b = sum of intermediate housing.
Worked example
Social rent homes provided = 160Intermediate homes provided = 124Affordable homes provided = 160+124= 284
Good performance
Good performance is typified by high numbers, in relation to targets and objectives set out in local strategies and assessments of need.

14 National Indicators for Local Authorities and Local Authority Partnerships: Handbook of Definitions
NI 155: Number of affordable homes delivered (gross) (continued)
Collection interval
Annual. Housing Corporation data is provided to CLG in May following the end of the financial year.
P2 – Information available in May following the end of the financial year.
Housing Strategy Statistical Appendix (HSSA) information is available in September.
Data Source The Housing Corporation information management system provides a breakdown of centrally funded “social rent” and “intermediate” units.
Local authority returns to Communities:
– HSSA provides information on units funded solely through planning agreements (S106)
P2 – local authority new build social rent.
Return Format Number Decimal Places Zero
Reporting organisation
CLG (Housing Markets and Planning Analysis Division)
Spatial level Single tier and district council
Further Guidance

Annex 4: Local Economy and Environmental Sustainability 15
NI 156: Number of households living in temporary accommodation
Is data provided by the LA or a local partner?
Y Is this an existing indicator? Y
Rationale To monitor progress towards halving the number of households in temporary accommodation provided under the homelessness legislation from 101,000 households in Q4 2004 to 50,500 households by 2010.
Definition This indicator measures the numbers of households living in temporary accommodation provided under the homelessness legislation.
Temporary accommodation provided under homelessness provisions – Local housing must secure accommodation for homeless people in certain circumstances and have powers to do so in others. Under the main homelessness duty (owed to people accepted by a local housing authority as eligible for assistance, unintentionally homeless and in priority need) they must secure suitable temporary accommodation until a settled home becomes available.
Household – Under the legislation, authorities must secure accommodation for the applicant and his or her household (including everyone who might reasonably be expected to live with the applicant). One person living alone, or a group of people living at the same address who share common housekeeping or a living room.
Data collected on the P1E housing return includes “snapshot” information on the numbers of households being housed in various types of temporary accommodation by the local authority on the last day of the quarter. The figures include the households of all applicants being provided with accommodation under the homelessness legislation, the majority of which will have been accepted as owed the main homelessness duty.
Formula Simple count of households living in temporary accommodation provided under the homelessness legislation.
Worked example
Number of households living in temporary accommodation provided under the homelessness legislation in Q4 2004 = 101,000
Good performance
Each LA has submitted projections showing how they plan to reach their own target, which we monitor against actual performance each quarter. Good performance is typified by a lower number.
Collection interval
Quarterly – However performance is judged on Q4.
Data Source P1E data – total households in temporary accommodation provided under the homelessness legislation
Return Format Number Decimal Places Zero
Reporting organisation
CLG (Housing and Communities Analysis Division)

16 National Indicators for Local Authorities and Local Authority Partnerships: Handbook of Definitions
NI 156: Number of households living in temporary accommodation (continued)
Spatial level Single tier and district council
Further Guidance

Annex 4: Local Economy and Environmental Sustainability 17
NI 157: Processing of planning applications
Is data provided by the LA or a local partner?
Y Is this an existing indicator? Y
Rationale To ensure local planning authorities determine planning applications in a timely manner.
This indicator measures the percentage of planning applications dealt with in a timely manner. Averaging out performance across very different types of application would render any target as meaningless. Therefore we have broken them down into four broad categories: major, minor, other, and a measure for all county matter applications. The fourth category only applies to county councils and those authorities who determine predominantly county level minerals and waste applications.
Definition Percentage of planning applications by type determined in a timely manner.
A timely manner is defined as
• within13weeksforMajorapplications;
• within8weeksforMinorandOtherapplications;and
• within13weeksforallCountyMatterapplications.
Applications that are part of a Planning Performance Agreement and the timetable agreed with developers is adhered to will be excluded from the calculations.
All local planning authorities except county matter planning authorities should use CLG form PS2 for supplying information on the planning applications determined. County matter planning authorities should use CLG form CPS1/2.
Separate values are required for:
• Majorapplications;
• Minorapplications;
• Otherapplications;and
• Countymatterapplications.
Definitions for Major, Minor and Other applications are given on the PS2 form. Major applications are entered in rows 1-12; minor applications in rows 13-18; other applications in rows 19-27. The rows referred to above relate to the PS2 form which will take effect from 1 April 2008. The PS2 forms may be subject to change depending on policy data requirements.
Definitions for County Matter applications are given on the CPS1/2 form. For county matter authorities, the indicator measured will be the percentage of total planning decisions determined in 13 weeks as shown in the section giving details of all planning decisions made on CLG form CPS1/2. County matter authorities assess time for completion of all applications within 13 weeks regardless of whether major or not.

18 National Indicators for Local Authorities and Local Authority Partnerships: Handbook of Definitions
NI 157: Processing of planning applications (continued)
Decisions where environmental assessments have taken place should be excluded from the indicator calculation by county matter authorities but not by other local authorities.
Determining the processing period of an application: Applications should be marked with the date of receipt. The time period from application to decision for non planning performance agreements (whether paper-based or electronic applications) begins on the day after a valid application and the correct fee (where a fee is payable) have been received and counts as “day 1”. The processing period ends on the date a decision notice is despatched.
The notes to the PS2 state that “Time spent in abeyance should be included in the total time taken (on no account should the clock be stopped) and the processing period must not be suspended awaiting amended plans nor restarted upon receipt of amended plans”.
Situations where the applicant withdraws a planning application, for example, they have changed their mind about the development, should not be part of the indicator calculation.
Cases where the decision goes to appeal: the clock stops ticking on the date when the local authority issues a decision notice. Therefore the period of the appeal is not taken into account.
Formula100*
y
x
Where:
x = number of planning applications determined in a timely manner;y = total number of planning applications determined.
Repeat the following calculation separately for major, minor, other and county matter planning applications using the timescales detailed below:
Major – 13 weeksMinor – 8 weeksOther – 8 weeksCounty Matter – 13 weeks
When calculating the indicator value please ensure that both the numerator and denominator include only major, minor or other applications, except for county matter applications where both the numerator and denominator should include all applications and be calculated within 13 weeks.

Annex 4: Local Economy and Environmental Sustainability 19
NI 157: Processing of planning applications (continued)
Worked example
For Major applications:
The number of Major planning applications determined in 13 weeks is 120, while the total number of major planning applications determined is 670. The proportion of major planning applications dealt with in a timely manner is therefore:
%91.17100*670
120
Similar calculations will be done for Minor, Other and County Matter planning applications.
Good performance
Good performance is typified by reaching or exceeding the target.
Collection interval
Quarterly (Apr-Jun, July-Sept, Aug-Dec, Jan-Mar)
Data Source From CLG-PS2 form.
CLG – CPS1/2 form for county matter authorities
Return Format Percentage Decimal Places Two
Reporting organisation
Communities and Local Government (Housing Markets and Planning Analysis Division) based on information supplied by local planning authorities.
Spatial level Single tier, district, county councils, urban development corporations and national parks authority.
Further Guidance
County matter authorities are county councils and those authorities who determine predominantly county level minerals and waste planning applications.

20 National Indicators for Local Authorities and Local Authority Partnerships: Handbook of Definitions
NI 158: % non-decent council homes
Is data provided by the LA or a local partner?
Y Is this an existing indicator? Y
Rationale To measure progress in ensuring all council homes meet the decent homes standard.
Definition This indicator measures the number of non decent council homes and the proportion this represents of the total council housing stock. This is being calculated in order to demonstrate the progress towards making all council housing decent.
The numbers of council homes and non-decent council homes is recorded by each authority in its Business Plans Statistical Appendix at the end of each financial year. This process is well established and the definitions and time frames are clearly understood by authorities.
Data collection date
The BPSA is a snapshot as at 1 April each year asking for information on the position at the latest point in time e.g. the 2006-07 collection required the non-decent figure as at 1 April 2007. Data on the previous financial year is required elsewhere in the BPSA form but is not needed for NI 158 reporting purposes.
Treatment of tenant refusals
Reporting of non-decency should be in line with CLG guidance on Decent Homes. Landlords are not expected to make a home decent if this is against a tenant’s wishes as work can be undertaken when the dwelling is next void (empty). For reporting purposes, these properties are not counted as non-decent until they are void.
Treatment of property void/awaiting disposal
CLG guidance states that non-decent dwellings scheduled for demolition before 2010 and RTB sales/partial transfers should not be counted in the non-decency numbers. Non-decent dwellings which are void are counted as non-decent. It is when properties are vacant that authorities need to act quickly to ensure works are carried out before the property is let again.
Formula100*
y
x
where,
x = the number of non-decent council housing stock
y = the total council housing stock

Annex 4: Local Economy and Environmental Sustainability 21
NI 158: % non-decent council homes (continued)
Worked example
Number of no decent council houses is: 487; the total council housing stock is 2,775. The proportion of non-decent housing stock is therefore:
%18100*2755
487
The return should be in the above format.
Good performance
Good performance is typified by lower numbers and percentages of non-decent council homes.
Collection interval
Annual (financial year) Data Source Business Plan Statistical Appendix from the LA
Return Format Stock numbers for non-decent and total housing stock and percentage of non decent housing stock
Decimal Places
One
Reporting organisation
CLG (Housing and Communities Analysis Division)
Spatial level Metropolitan Authorities, London Boroughs, Unitary Authorities, County Councils, District Councils, Council of the Isles of Scilly, owning housing stock.
Further Guidance
Decent Homes Guidance at: www.communities.gov.uk Guidance on completing the BPSA at: www.communities.gov.uk.

22 National Indicators for Local Authorities and Local Authority Partnerships: Handbook of Definitions
NI 159: Supply of ready to develop housing sites
Is data provided by the LA or a local partner?
Y Is this an existing indicator? Y
Rationale Planning Policy Statement 3 requires Local Planning Authorities to maintain a 5 year supply of deliverable sites for housing through their Local Development Framework. To ensure there is a continuous 5 year supply, authorities should monitor the supply of deliverable sites on an annual basis, through their Annual Monitoring Reports (AMR).
This indicator supports PPS3, and links to the AMR requirement, as a means of ensuring that a 5 year supply of deliverable sites is being identified and maintained.
Authorities should already have demonstrated a 5 year supply of deliverable sites, as required by PPS3. An advice note, explaining how authorities can do this is available on the PINS website at http://www.planning-inspectorate.gov.uk/pins/advice_for_insp/advice_produced_by_dclg.htm
To ensure that plans maintain a continuous approach to housing delivery; as well as regular monitoring through AMRs, authorities are also required to collect evidence of sites with potential for housing by undertaking Strategic Housing Land Availability Assessments.
Definition The total number of net additional dwellings that are deliverable as a percentage of the planned housing provision (in net additional dwellings) for the 5 year period.
The indicator assesses the degree to which authorities are maintaining a 5 year supply of deliverable sites as required by PPS3 (Planning Policy Statement 3 – link in ‘Further Guidance’)
Net additional dwellings are defined as future new build plus future gains and losses from conversions change of use and demolitions.
The indicator provides a forward look in terms of there being enough deliverable sites to meet planned housing provision over a 5 year period. So, for AMRs submitted in December 2008, the 5 year period will be April 2009 to March 2014, and so on.
The definition of dwelling (in line with the 2001 Census) is a self-contained unit of accommodation. Self-containment is where all the rooms in a household are behind a door, which only that household can use. Non-self contained household spaces at the same address should be counted together as a single dwelling. Therefore, a dwelling can consist of one self-contained household space or two or more non-self-contained spaces at the same address. Communal establishments are excluded.

Annex 4: Local Economy and Environmental Sustainability 23
NI 159: Supply of ready to develop housing sites (continued)
Formula
100*y
x
where,
X = the amount of housing that can be built on deliverable sites for the 5 year period (net additional dwellings)
Y = the planned housing provision required for the 5 year period (net additional dwellings)
Worked example
The planned housing provision for 1st April 2009 – 31st March 2014 is 2232 net additional dwellings.
The supply of deliverable housing for the same period will provide 2046 net additional dwellings.
The indicator of the degree to which a supply of ready to develop housing sites is being maintained is:
%67.91100*2232
2046*100 = 91.7%�
Good performance
Good performance is where the percentage is 100% or greater.
Collection interval
Annual Data is based on the financial year, and the collection is annual, every December.
Data Source Local Planning Authority: Annual Monitoring Report
Return Format Percentage Decimal Places One
Reporting organisation
CLG (Analytical Services Directorate) based on data provided by local planning authorities in the Annual Monitoring Report.
Spatial level Single tier and district council
Further Guidance
Planning Policy Statement 3 Housing, particularly paragraphs 52-61: http://www.communities.gov.uk/statements/corporate/planning-policy-statement3
Guidance Note on How to Demonstrate a 5 Year Supply of Deliverable Sites:http://www.planning-inspectorate.gov.uk/pins/advice_for_insp/advice_produced_by_dclg.htm
Practice Guidance – Strategic Housing Land Availability Assessment (Identifying a 15 year supply of developable land for housing) http://www.communities.gov.uk/index.asp?id=1511886

24 National Indicators for Local Authorities and Local Authority Partnerships: Handbook of Definitions
NI 160: Local authority tenants’ satisfaction with landlord services
Is data provided by the LA or a local partner?
Y Is this an existing indicator? Y
Rationale To encourage delivery of good housing management services by local authorities where they retain ownership of council housing (covering management retention of LAs and those with ALMOs).This will help make sure authorities and management organisations focus on effective delivery of those core services which matter most to tenants (customer services, responsiveness, involvement opportunities and quality of service, including performance on lettings, repairs, rent collection and tenancy & estate management).
Definition This indicator is to measure the percentage of local authority/ALMO tenants who say they are: Very satisfied”or ”Fairly satisfied” with the overall service provided by their landlord.
Local authorities that have retained ownership of 1,000 or more general needs dwellings at the beginning of the relevant financial year in which the survey is required to be carried out and local authorities that have transferred their stock to an ALMO/s are required to report this indicator. Local authorities that have transferred all of their housing stock to housing associations are not required to report this indicator.
For those local authorities that are required to report the indicator, the definition of local authority tenants includes general needs tenants and excludes sheltered and supported housing tenants, leaseholders and tenants of other landlords.
The data source will be the standard tenant satisfaction survey that all social landlords will be required to carry out, which will ask the question:
“Taking everything into account, how satisfied or dissatisfied are you with the overall service provided by your landlord?”
Respondents will have the choice of five response categories. These are:
“Very satisfied”, “Fairly satisfied”, “Neither satisfied nor dissatisfied”, “Fairly dissatisfied” and “Very dissatisfied”. A “Don’t Know” option should not be offered and guidance will cover treatment of any write-in responses of this kind.
The tenant satisfaction survey should be carried out every two years. The survey must follow the National Housing Federation STATUS standard tenant satisfaction methodology. The method will be a postal survey.
Numerator
The number of local authority tenants who say that they are “Very satisfied” or “Fairly satisfied” with the overall service provided by their landlord.
Denominator
The number of tenants answering the question who gave valid answers: (Very satisfied, Fairly satisfied, Neither satisfied nor dissatisfied, Fairly dissatisfied, Very dissatisfied).
Annex 4: Local Economy and Environmental Sustainability 25
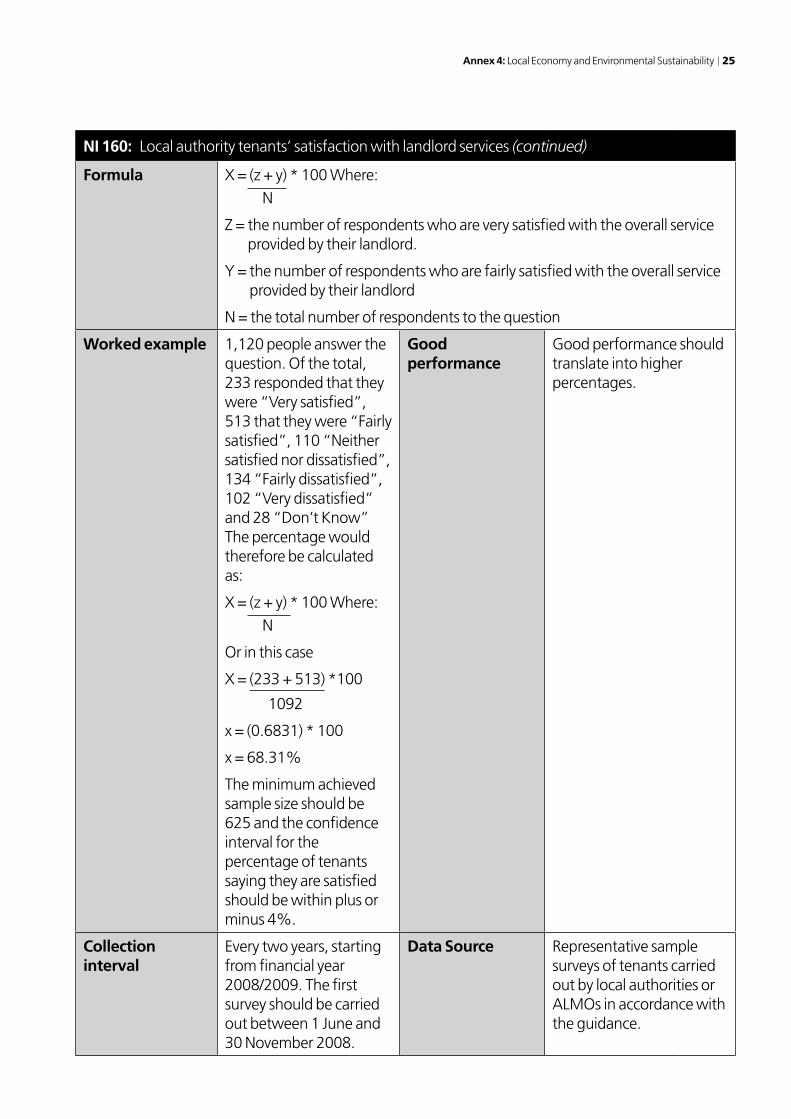
NI 160: Local authority tenants’ satisfaction with landlord services (continued)
Formula X = (z + y) * 100 Where: N
Z = the number of respondents who are very satisfied with the overall service provided by their landlord.
Y = the number of respondents who are fairly satisfied with the overall service provided by their landlord
N = the total number of respondents to the question
Worked example 1,120 people answer the question. Of the total, 233 responded that they were “Very satisfied”, 513 that they were “Fairly satisfied”, 110 “Neither satisfied nor dissatisfied”, 134 “Fairly dissatisfied”, 102 “Very dissatisfied” and 28 “Don’t Know” The percentage would therefore be calculated as:
X = (z + y) * 100 Where: N
Or in this case
X = (233 + 513) *100
1092
x = (0.6831) * 100
x = 68.31%
The minimum achieved sample size should be 625 and the confidence interval for the percentage of tenants saying they are satisfied should be within plus or minus 4%.
Good performance
Good performance should translate into higher percentages.
Collection interval
Every two years, starting from financial year 2008/2009. The first survey should be carried out between 1 June and 30 November 2008.
Data Source Representative sample surveys of tenants carried out by local authorities or ALMOs in accordance with the guidance.

26 National Indicators for Local Authorities and Local Authority Partnerships: Handbook of Definitions
NI 160: Local authority tenants’ satisfaction with landlord services (continued)
Return Format Percentage Decimal Places Two
Reporting organisation
Local Authorities that have retained all or part (with ownership of 1,000 or more general needs) management of the housing stock and that have transferred the housing stock to an ALMO/s.
Spatial level Every Local Authority (boroughs, unitaries and districts) retaining ownership of council housing.
Further Guidance Local authorities that are required to report the indicator must use the STATUS standard tenant satisfaction survey method. This was previously specified for the BVPI tenant satisfaction surveys so there will be continuity in methods and authorities, regulators and residents will be able to track results over time. Further guidance is provided at www.housing.org.uk

Annex 4: Local Economy and Environmental Sustainability 27
NI 161: Number of Level 1 qualifications in literacy (including ESOL) achieved
Is data provided by the LA or a local partner?
N Is this an existing indicator? N
Rationale Improving basic literacy levels and other skills activities related directly to economic development in which local authorities have an important role.
Definition Number of achievements in approved Level 1 qualifications in literacy (Including ESOL), reported for each academic year.
Levels: learning aims are given a “level” in the National Qualifications Framework (NQF).
Literacy: those qualifications which count as literacy and ESOL are defined in the NQF and the Qualifications and Curriculum Framework (QCF).
All learners aged 16 and over achieving via an LSC funded course are covered.
Achievement: Reported by learning providers in the ILR that the learning aim is achieved.
Approved qualifications are stated within sections 96 and 97 (http://www.dfes.gov.uk/section96/ and http://www.dfes.gov.uk/section97/).
Formula This is a count of a full census of administrative data during the academic year.
Worked example
No calculation required. Simple count.
Good performance
Good performance is typified by higher numbers
Collection interval
Annually for academic year (August to July).
Data Source The Learning and Skills Council’s Individualised Learner Record (ILR)
Return Format Number Decimal Places Zero
Reporting organisation
Learning and Skills Council
Spatial level Single tier and county level (based on residency)
Further Guidance
Details of the ILR are available on the Information Authority’s web site. http://www.theia.org.uk/
Achievement data for each academic year will be generated in the April following the end of the academic year i.e. 2008/09 will be generated in April 2010, or as soon as possible thereafter.

28 National Indicators for Local Authorities and Local Authority Partnerships: Handbook of Definitions
NI 162: Number of Entry Level qualifications in numeracy achieved
Is data provided by the LA or a local partner?
N Is this an existing indicator? N
Rationale Improving basic numeracy levels and other skills activities related directly to economic development in which local authorities have an important role.
Definition Number of achievements in an approved Entry Level qualification in numeracy, reported for each academic year.
Level: learning aims are given a “level” in the National Qualifications Framework (NQF).
Numeracy: those qualifications which count as numeracy are defined in the NQF and Qualification and Curriculum Framework (QCF).
All learners aged 16 and over achieving via an LSC funded course are covered.
Achievement: Reported by learning providers in the ILR that the learning aim is achieved.
Approved qualifications are stated within sections 96 and 97 (http://www.dfes.gov.uk/section96/ and http://www.dfes.gov.uk/section97/).
Formula This is a count of a full census of administrative data during the academic year.
Worked example
No calculation required Good performance
Good performance is typified by higher numbers
Collection interval
Annually for academic year (August to July).
Data Source The Learning and Skills Council’s Individualised Learner Record (ILR)
Return Format Number Decimal Places Zero
Reporting organisation
Learning and Skills Council
Spatial level Single tier and county level (based on residency)
Further Guidance
Details of the ILR are available on the Information Authority’s web site. http://www.theia.org.uk/
Achievement data for each academic year will be generated in the April following the end of the academic year i.e. 2008/09 will be generated in April 2010, or as soon as possible thereafter.

Annex 4: Local Economy and Environmental Sustainability 29
NI 163: Proportion of population aged 19-64 for males and 19-59 for females qualified to at least Level 2 or higher
Is data provided by the LA or a local partner?
N Is this an existing indicator? N
Rationale This indicator is needed because of the important role local authorities have with regard to economic development and the key part which skills and qualifications play in supporting economic development.
Definition Proportion of population aged 19-64 for males and 19-59 for females qualified to at least level 2 or higher.
Qualified to level 2 and above
People are counted as being qualified to level 2 and above if they have achieved at least either 5 GCSEs grades A*-C (or equivalent, i.e., O levels, CSE Grade 1s), two A/S levels, or any equivalent or higher qualification in the Qualifications and Credit Framework.
Age group
19 to 59 inclusive for women and 19-64 inclusive for men.
Reference period and data source
Calendar year data from the Office for National Statistics (ONS) Annual Population Survey (APS), essentially a locally boosted Labour Force Survey (LFS) to be used, the results of which are available the following August.
Formula Proportion of population aged 19-64 for males and 19-59 for females qualified to at least level 2 or higher is calculated as follows:
100*y
x
Where:
x = number of males aged 19-64 and females aged 19-59 qualified to at least level 2 or higher;
y = the population of males aged 19-64 and females aged 19-59.
with both x and y being estimated from the APS.
Worked example
E.g. 50,000 people out of 100,000 have a Level 2+ qualification. Proportion qualified to level 2+ is therefore:
%0.50100*10000
50000100000
Good performance
Typified by higher percentages

30 National Indicators for Local Authorities and Local Authority Partnerships: Handbook of Definitions
NI 163: Proportion of population aged 19-64 for males and 19-59 for females qualified to at least Level 2 or higher (continued)
Collection interval
Annually (calendar year) Data Source Derived by the Department for Innovation, University and Skills (DIUS) from the ONS Annual Population Survey (LFS/Integrated Household Survey)
Return Format Percentage Decimal Places One
Reporting organisation
DIUS
Spatial level Regional- LSC, Single Tier and County Council
Further Guidance
The Annual Population Survey, which is effectively a boosted Labour Force Survey sample, can provide annual estimates of the working age population at Level 2+, Level 3+ and Level 4+ by LSC.

Annex 4: Local Economy and Environmental Sustainability 31
NI 164: Proportion of population aged 19-64 for males and 19-59 for females qualified to at least Level 3 or higher
Is data provided by the LA or a local partner?
N Is this an existing indicator? N
Rationale This indicator is needed because of the important role local authorities have with regard to economic development and the key part which skills and qualifications play in supporting economic development.
Definition Proportion of population aged 19-64 for males and 19-59 for females qualified to at least level 3 or higher.
Qualified to level 3 or abovePeople are counted as being qualified to level 3 or above if they have achieved either at least 2 A-levels grades A-E, 4 A/S levels graded A-E, or any equivalent (or higher) qualification in the Qualifications and Credit Framework. (http://www.qca.org.uk/qca_8150.aspx)
Age group19 to 59 inclusive for women and 19-64 inclusive for men.
Reference period and data sourceCalendar year data from the Office for National Statistics (ONS) Annual Population Survey (APS), essentially a locally boosted Labour Force Survey (LFS) to be used, the results of which are available the following August.
Formula Proportion of population aged 19-64 for males and 19-59 for females qualified to at least level 3 or higher is calculated as follows:
100*y
x
Where:
x = number of males aged 19-64 and number of females 19-59 qualified to at least level 3 or higher;
y = the population of males aged 19-64 and females aged 19-59.
Worked example
E.g., 50,000 people out of 100,000 have a Level 3+ qualification. Proportion qualified to level 3+ is therefore:
%0.50100*10000
50000100000
Good performance
Typified by higher percentages

32 National Indicators for Local Authorities and Local Authority Partnerships: Handbook of Definitions
NI 164: Proportion of population aged 19-64 for males and 19-59 for females qualified to at least Level 3 or higher (continued)
Collection interval
Annually (calendar year) Data Source Derived by the Department for Innovation, University and Skills (DIUS) from the ONS Annual Population Survey (LFS/Integrated Household Survey)
Return Format Percentage Decimal Places One
Reporting organisation
DIUS
Spatial level Regional – LSC, single tier and county council
Further Guidance
The Annual Population Survey, which is effectively a boosted Labour Force Survey sample, can provide annual estimates of the working age population at Level 2+, Level 3+ and Level 4+ by LSC.

Annex 4: Local Economy and Environmental Sustainability 33
NI 165: Proportion of population aged 19-64 for males and 19-59 for females qualified to at least Level 4 or higher
Is data provided by the LA or a local partner?
N Is this an existing indicator? N
Rationale This indicator is needed because of the important role local authorities have with regard to economic development and the key part which skills and qualifications play in supporting economic development.
Definition Proportion of population aged 19-64 for males and 19-59 for females qualified to at least level 4 or higher.
Qualified to Level 4 and aboveHolding qualifications equivalent to National Qualifications Framework (NQF) levels 4-8. Level 4-6 qualifications include foundation or first degrees, recognised degree-level professional qualifications, teaching or nursing qualifications, diploma in higher education, HNC/HND or equivalent vocational qualification. Qualifications at level 7-8 include higher degrees, and postgraduate level professional qualifications.
Age group19 to 59 inclusive for women and 19-64 inclusive for men.
Reference period and data sourceCalendar year data from the Office for National Statistics (ONS) Annual Population Survey (APS), essentially a locally boosted Labour Force Survey (LFS) to be used, the results of which are available the following August.
Formula Proportion of population aged 19-64 for males and 19-59 for females qualified to at least level 4 or higher is calculated as follows:
100*y
x
Where:
x = number of males aged 19-64 and females aged 19-59 qualified to at least level 4 or higher;
y = the population of males aged 19-64 and females aged 19-59.
Worked example
E.g., 50,000 people out of 100,000 have a Level 4+ qualification. Proportion qualified to level 4+ is therefore:
%0.50100*10000
50000100000
Good performance
Typified by higher percentages
34 National Indicators for Local Authorities and Local Authority Partnerships: Handbook of Definitions
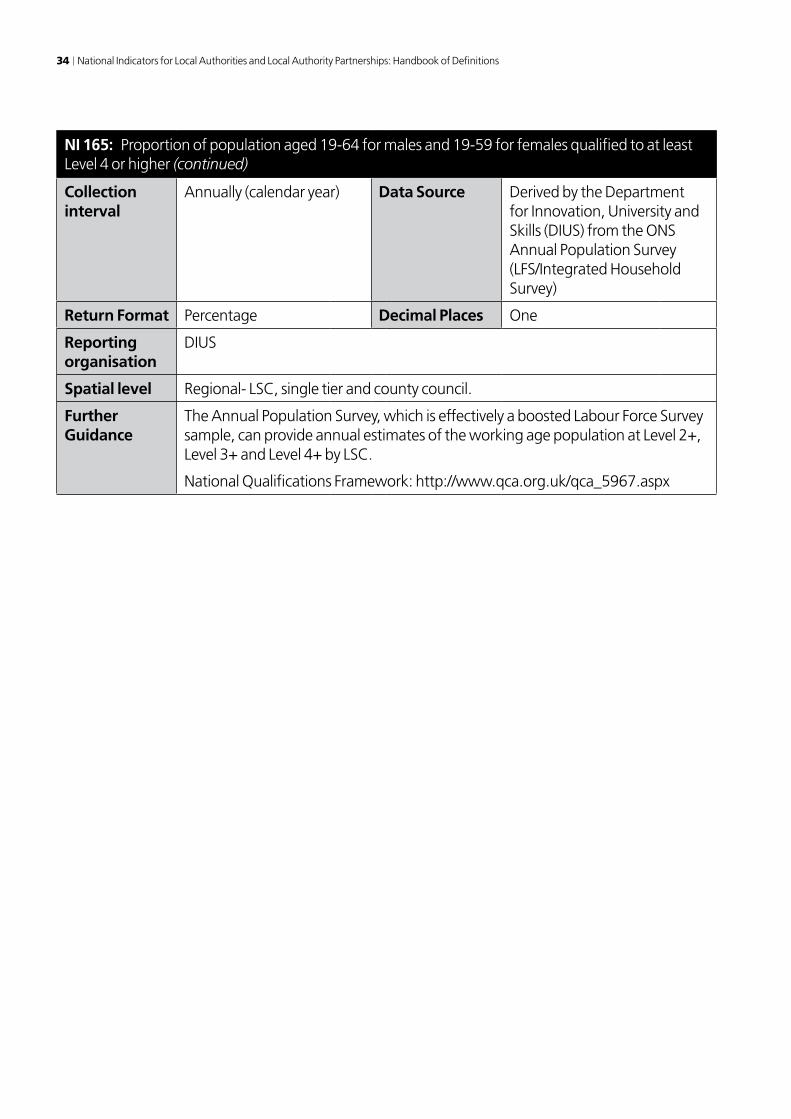
NI 165: Proportion of population aged 19-64 for males and 19-59 for females qualified to at least Level 4 or higher (continued)
Collection interval
Annually (calendar year) Data Source Derived by the Department for Innovation, University and Skills (DIUS) from the ONS Annual Population Survey (LFS/Integrated Household Survey)
Return Format Percentage Decimal Places One
Reporting organisation
DIUS
Spatial level Regional- LSC, single tier and county council.
Further Guidance
The Annual Population Survey, which is effectively a boosted Labour Force Survey sample, can provide annual estimates of the working age population at Level 2+, Level 3+ and Level 4+ by LSC.
National Qualifications Framework: http://www.qca.org.uk/qca_5967.aspx

Annex 4: Local Economy and Environmental Sustainability 35
NI 166: Median earnings of employees in the area
Is data provided by the LA or a local partner?
N Is this an existing indicator? Y
Rationale While Gross Value Added per job can be used in many areas to measure productivity, the geographical scope does not allow it to be used for all local authorities. Earnings per job is a suitable proxy that can, ie measurement of earnings allows all local authorities to monitor a rough proxy for productivity. Used with the employment rate this indicator allows local areas to make a broad assessment of their economic output.
Definition Median earnings by employees in an area.
Several measures of earnings are available. The one used here, as the most appropriate indicator of average earnings, is median gross weekly pay of full-time employees on a workplace basis. This measure is available directly in the results of the Annual Survey of Hours and Earnings (ASHE -see data source below).
Median earnings are based on the pay period containing a particular date in April each year. Data are published in October of the same year.
As estimates are based on survey data, they are subject to statistical margins of error. In many cases, these errors will be sizeable. Although the data are robust for large authorities, for smaller authorities apparent changes in earnings from one year to the next should be treated with caution. For a minority, even apparent changes over two years or more may not reflect real changes. Particular caution should be applied in the case of district councils choosing to monitor this indicator. More information on statistical errors in the ASHE dataset can be found at the Data Source listed below.
Formula Median gross weekly pay of full-time employees on a workplace basis.
Worked example
N/A Good performance
Good performance is typified by a higher number.
Collection interval
Annual (data relates to a specific pay period in April of each year)
Data Source Annual Survey of Hours and Earnings (ASHE), Table 7.1a (Weekly pay – Gross (£) – For full-time employee jobs: United Kingdom, 2007) National Statistics website: http://www.statistics.gov.uk/StatBase/Product.asp?vlnk=13101
Return Format Currency (£/week) Decimal Places One
Reporting organisation
Office for National Statistics
Spatial level Single tier and county council
Further Guidance
http://www.statistics.gov.uk/StatBase/Product.asp?vlnk=13101
36 National Indicators for Local Authorities and Local Authority Partnerships: Handbook of Definitions
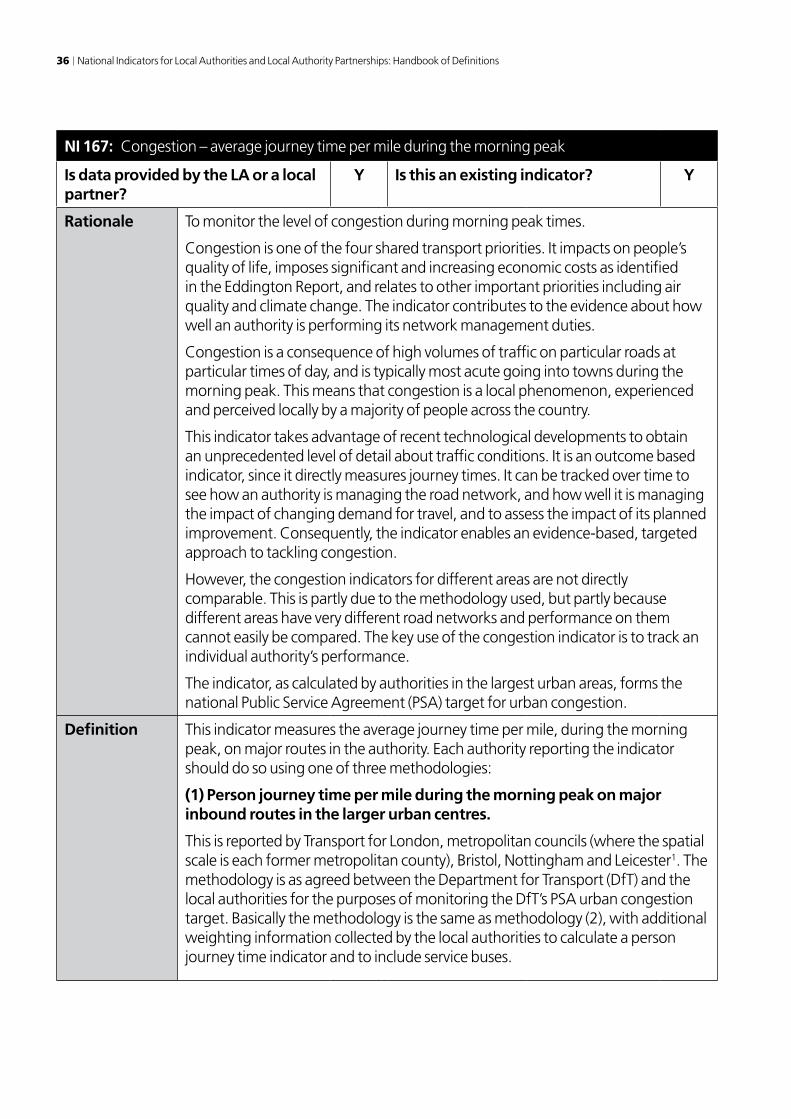
NI 167: Congestion – average journey time per mile during the morning peak
Is data provided by the LA or a local partner?
Y Is this an existing indicator? Y
Rationale To monitor the level of congestion during morning peak times.
Congestion is one of the four shared transport priorities. It impacts on people’s quality of life, imposes significant and increasing economic costs as identified in the Eddington Report, and relates to other important priorities including air quality and climate change. The indicator contributes to the evidence about how well an authority is performing its network management duties.
Congestion is a consequence of high volumes of traffic on particular roads at particular times of day, and is typically most acute going into towns during the morning peak. This means that congestion is a local phenomenon, experienced and perceived locally by a majority of people across the country.
This indicator takes advantage of recent technological developments to obtain an unprecedented level of detail about traffic conditions. It is an outcome based indicator, since it directly measures journey times. It can be tracked over time to see how an authority is managing the road network, and how well it is managing the impact of changing demand for travel, and to assess the impact of its planned improvement. Consequently, the indicator enables an evidence-based, targeted approach to tackling congestion.
However, the congestion indicators for different areas are not directly comparable. This is partly due to the methodology used, but partly because different areas have very different road networks and performance on them cannot easily be compared. The key use of the congestion indicator is to track an individual authority’s performance.
The indicator, as calculated by authorities in the largest urban areas, forms the national Public Service Agreement (PSA) target for urban congestion.
Definition This indicator measures the average journey time per mile, during the morning peak, on major routes in the authority. Each authority reporting the indicator should do so using one of three methodologies:
(1) Person journey time per mile during the morning peak on major inbound routes in the larger urban centres.
This is reported by Transport for London, metropolitan councils (where the spatial scale is each former metropolitan county), Bristol, Nottingham and Leicester1. The methodology is as agreed between the Department for Transport (DfT) and the local authorities for the purposes of monitoring the DfT’s PSA urban congestion target. Basically the methodology is the same as methodology (2), with additional weighting information collected by the local authorities to calculate a person journey time indicator and to include service buses.
Annex 4: Local Economy and Environmental Sustainability 37
NI 167: Congestion – average journey time per mile during the morning peak (continued)
Definition (continued)
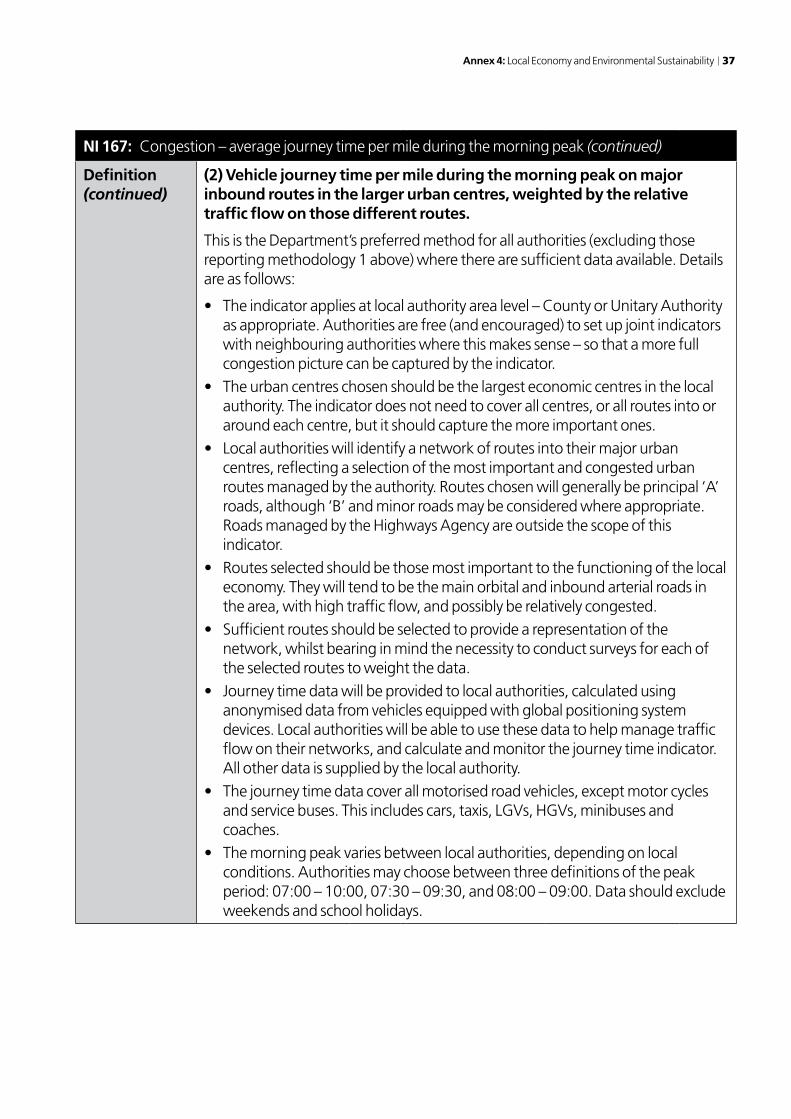
(2) Vehicle journey time per mile during the morning peak on major inbound routes in the larger urban centres, weighted by the relative traffic flow on those different routes.
This is the Department’s preferred method for all authorities (excluding those reporting methodology 1 above) where there are sufficient data available. Details are as follows:
• Theindicatorappliesatlocalauthorityarealevel–CountyorUnitaryAuthorityas appropriate. Authorities are free (and encouraged) to set up joint indicators with neighbouring authorities where this makes sense – so that a more full congestion picture can be captured by the indicator.
• Theurbancentreschosenshouldbethelargesteconomiccentresinthelocalauthority. The indicator does not need to cover all centres, or all routes into or around each centre, but it should capture the more important ones.
• Localauthoritieswillidentifyanetworkofroutesintotheirmajorurbancentres, reflecting a selection of the most important and congested urban routes managed by the authority. Routes chosen will generally be principal ‘A’ roads, although ‘B’ and minor roads may be considered where appropriate. Roads managed by the Highways Agency are outside the scope of this indicator.
• Routesselectedshouldbethosemostimportanttothefunctioningofthelocaleconomy. They will tend to be the main orbital and inbound arterial roads in the area, with high traffic flow, and possibly be relatively congested.
• Sufficientroutesshouldbeselectedtoprovidearepresentationofthenetwork, whilst bearing in mind the necessity to conduct surveys for each of the selected routes to weight the data.
• Journeytimedatawillbeprovidedtolocalauthorities,calculatedusinganonymised data from vehicles equipped with global positioning system devices. Local authorities will be able to use these data to help manage traffic flow on their networks, and calculate and monitor the journey time indicator. All other data is supplied by the local authority.
• Thejourneytimedatacoverallmotorisedroadvehicles,exceptmotorcyclesand service buses. This includes cars, taxis, LGVs, HGVs, minibuses and coaches.
• Themorningpeakvariesbetweenlocalauthorities,dependingonlocalconditions. Authorities may choose between three definitions of the peak period: 07:00 – 10:00, 07:30 – 09:30, and 08:00 – 09:00. Data should exclude weekends and school holidays.

38 National Indicators for Local Authorities and Local Authority Partnerships: Handbook of Definitions
NI 167: Congestion – average journey time per mile during the morning peak (continued)
Definition (continued)
• Eachroutewillbeweightedwithintheindicatorbyrelativetrafficflow.Thesedata must be collected by the local authority for each route making up the local authority indicator. It is expected that local authorities will already be conducting traffic flow surveys in order to help them manage their networks and meet the Network Management Duty. It is not necessary that all local authorities use the same traffic measurement methodology, only that the methodology used is consistent over time for, and within, an authority and adequately reflects the relative traffic flow on each route. Traffic flow surveys need only be conducted once for weighting the indicator, although authorities may wish to conduct further surveys in the future, for example if traffic flows are expected to change substantially on some of the routes.
(3) Vehicle journey time per mile during the morning peak on all major ‘A’ roads across the local authority.
This is for generally smaller or less urban authorities that do not yet have the capacity to calculate the indicator, for example because they are not able to handle large databases of link level journey time data. This should only apply to authorities where congestion is less of a problem. In such cases, a simplified version of the indicator will be used.
This is journey time per mile during the morning peak on all major A roads across the local authority. In this case the indicator includes both urban and rural A roads where there are sufficient data to calculate reliable journey times, and each included road has the same weight; no traffic surveys are used to increase the weight of busy roads. For this version of the indicator, DfT will calculate the indicator on behalf of the local authority.
DfT will check that this version of the indicator is sufficiently robust to represent a meaningful return and, where it is not, they will instruct the local authority to file a ‘nil’ return.
Annex 4: Local Economy and Environmental Sustainability 39
NI 167: Congestion – average journey time per mile during the morning peak (continued)
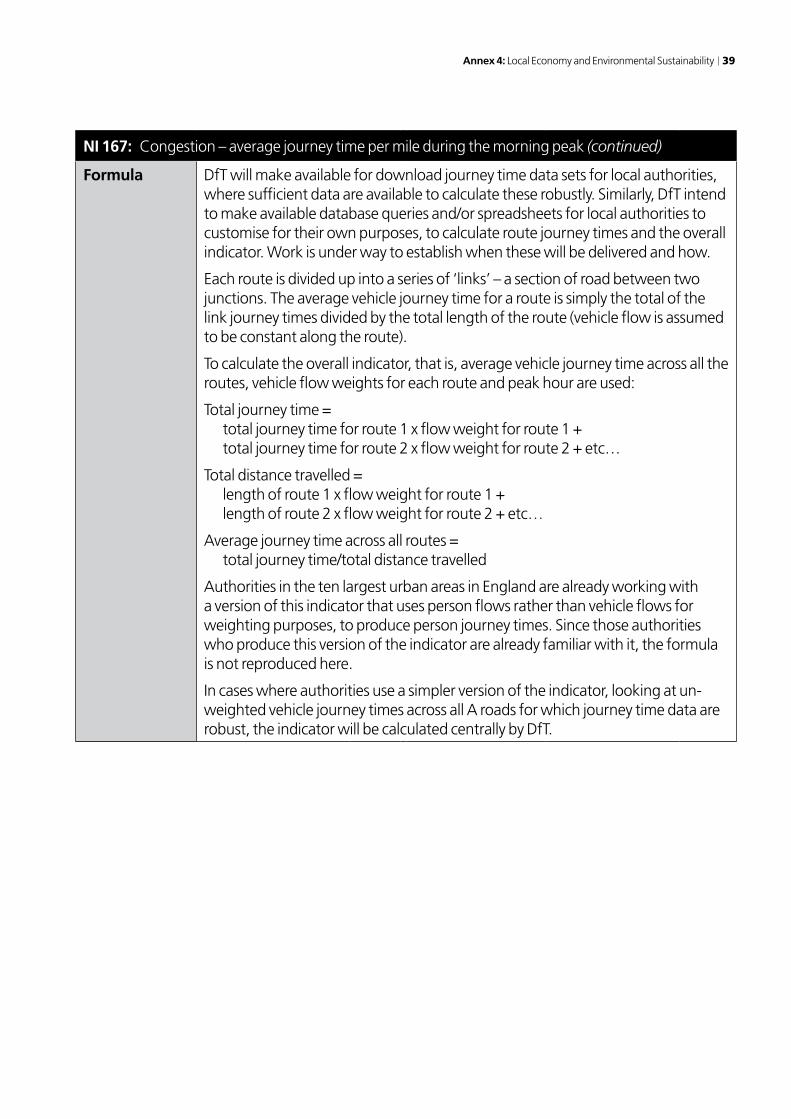
Formula DfT will make available for download journey time data sets for local authorities, where sufficient data are available to calculate these robustly. Similarly, DfT intend to make available database queries and/or spreadsheets for local authorities to customise for their own purposes, to calculate route journey times and the overall indicator. Work is under way to establish when these will be delivered and how.
Each route is divided up into a series of ‘links’ – a section of road between two junctions. The average vehicle journey time for a route is simply the total of the link journey times divided by the total length of the route (vehicle flow is assumed to be constant along the route).
To calculate the overall indicator, that is, average vehicle journey time across all the routes, vehicle flow weights for each route and peak hour are used:
Total journey time = total journey time for route 1 x flow weight for route 1 + total journey time for route 2 x flow weight for route 2 + etc…
Total distance travelled = length of route 1 x flow weight for route 1 + length of route 2 x flow weight for route 2 + etc…
Average journey time across all routes = total journey time/total distance travelled
Authorities in the ten largest urban areas in England are already working with a version of this indicator that uses person flows rather than vehicle flows for weighting purposes, to produce person journey times. Since those authorities who produce this version of the indicator are already familiar with it, the formula is not reproduced here.
In cases where authorities use a simpler version of the indicator, looking at un-weighted vehicle journey times across all A roads for which journey time data are robust, the indicator will be calculated centrally by DfT.

40 National Indicators for Local Authorities and Local Authority Partnerships: Handbook of Definitions
NI 167: Congestion – average journey time per mile during the morning peak (continued)
Worked example
The methodology for variant 1 of the indicator has previously been provided to the areas using it.
An example of variant 2 of the indicator is shown on a separate spreadsheet.
DfT will produce variant 3.
Good performance
Good performance is determined by looking at change over time for each authority, rather than by comparing authorities with one other. Good performance is where the impact on journey times of an increase in traffic is minimised, and where the impact of a planned improvement has a demonstrably positive impact on journey times. In cases where traffic does not increase, or where it increases by a small amount, decreases in journey time would represent good performance.
Collection interval
Annual, on an academic year basis (September to August)
Data Source Journey time data are collected centrally for DfT by an independent contractor, through GPS devices in around 50,000 vehicles which record speed and location. These are then collated, digitally mapped and matched to the road network. Traffic flows, used for weighting, to be collected once by local authorities for weighting routes within the indicator, as described under definition.
Return Format Number, average journey time per mile, minutes and seconds
Decimal Places Minutes and seconds
Reporting organisation
Transport for London; metropolitan district councils; county councils; and unitary authorities

Annex 4: Local Economy and Environmental Sustainability 41
NI 167: Congestion – average journey time per mile during the morning peak (continued)
Spatial level Transport for London; metropolitan district councils; county councils; and unitary authorities. For metropolitan district councils the spatial level is the former metropolitan county
Further Guidance
To assist authorities, DfT will make available database queries and/or spreadsheets for local authorities to implement within their own systems; in order to calculate journey times.
The majority of local authorities will be able to report against this indicator. Journey time data will be processed and provided by DfT to around 75% of top/single tier local authorities, based on the current work programme’ rolling out the data to authorities.
This includes:
• 39authoritieswhowillreportingroupsinthesixmetropolitanareas,Bristol,Nottingham and Leicester. These are already monitoring the indicator using methodology (1) as part of the PSA urban congestion target.
• asecondtrancheofaround15authorities,whohavealreadyreceivedprocessed journey time data. These authorities were identified in the Local Transport Planning Guidance as the next largest urban areas in England.
• athirdtrancheofaround35toptierauthorities,whichhaveaskedforjourneytime data for local purposes to assist them with managing their road network, who will shortly be receiving processed journey time data.
• JourneytimedataforLondonhasalreadybeenmadeavailabletoTransportforLondon.
Together, these authorities constitute the set of authorities where traffic and congestion are most likely to be a problem. This is the approximate extent of the authorities for which the Department for Transport anticipates that there will be sufficient data for the indicator to be reported in 2008/09.
Variants 1 and 2 of this indicator could, in theory, produce perverse incentives if an authority concentrated efforts on the nominated routes, achieving success in terms of the indicator but making conditions elsewhere worse. In practice other evidence would be available (including variant 3 of the congestion indicator), which could guard against this happening.
Similarly, like any other indicator, progress against this indicator has to be balanced against other local authority priorities, such as provision of public transport and road safety.
12
1 Other local authorities that are partners in joint local transport plans with Bristol, Leicester and Nottingham City Councils may also report this as a joint indicator at their discretion.
2 Outside metropolitan areas information may also be collected following Local Transport Plan geography if partner councils agree to this and subject to agreement with DfT about data and reporting continuity and robustness.

42 National Indicators for Local Authorities and Local Authority Partnerships: Handbook of Definitions
NI 168: Principal roads where maintenance should be considered
Is data provided by the LA or a local partner?
Y Is this an existing indicator? Y
Rationale Provides an indication of the proportion of principal road carriageway where maintenance should be considered. This is a significant indicator of the state of the highways asset.
Definition This indicator is an updated version of the former Best Value Performance Indicator (BVPI) 223 (formerly BVPI 96). The indicator measures the percentage of the local authority’s A-road and principal (that is, local authority owned) M-road carriageways where maintenance should be considered.
The performance indicator is derived from a survey of the surface condition of the local authority’s classified carriageway network, using survey vehicles that are accredited as conforming to the SCANNER (Surface Condition Assessment for the National Network of Roads) specification and processing software that is accredited as conforming to the UKPMS (UK Pavement Management System) standards.
Results are reported for 100% of the network surveyed in both directions. For any given length of road, data from either the current financial year or the previous financial year may be used.
All road surface types should be included (including principal motorways). Authorities should aim to cover the required network lengths. Where it is not physically possible to survey all parts of the network, grossed-up figures from shorter surveys (at least 90% of the total requirement) will be permitted.
Formula The indicator is the length of carriageway identified as having a condition indicator greater than, or equal to 100 as a percentage of the total length surveyed.
100*y
x
where:
x = length of carriageway surveyed identified as having a condition indicator greater than or equal to 100;
y = total length of principal road carriageway surveyed.
Results are calculated automatically by the UKPMS software.

Annex 4: Local Economy and Environmental Sustainability 43
NI 168: Principal roads where maintenance should be considered (continued)
Worked example
Results are calculated automatically by the UKPMS software
Good performance
Good performance is typified by a low percentage. A reduction in levels represents improvement.
In 2006/07 a value of less than 6% represented a top quartile position, with values of 11% or more being in the bottom quartile.
Collection interval
Annual survey, taken at any point in the financial year
Data Source Each highway authority reports on the network for which it is responsible. So all returns exclude trunk roads. Returns from London Boroughs also exclude Transport for London roads and the Transport for London return relates to TfL roads only.
Return Format Percentage Decimal Places Zero
Spatial level Single tier and county councils, Transport for London
Reporting organisation
Highway Authorities
Further Guidance
The specification of survey requirements, procurement arrangements and accreditation processes to be followed are given in the SCANNER and UKPMS specifications which are published by the UK Roads Board and are available from: www.ukroadsliaisongroup.org or www.ukpms.com.

44 National Indicators for Local Authorities and Local Authority Partnerships: Handbook of Definitions
NI 169: Non-principal classified roads where maintenance should be considered
Is data provided by the LA or a local partner?
Y Is this an existing indicator? Y
Rationale Provides an indication of the proportion of B and C-class road carriageways where maintenance should be considered. This is a significant indicator of the state of the highways asset.
Definition This indicator is an updated version of the former Best Value Performance Indicator (BVPI) 224a (formerly BVPI 97a). The indicator measures the percentage of the local authority’s B-road and C-road carriageways where maintenance should be considered.
The performance indicator is derived from a survey of the surface condition of the local authority’s classified carriageway network, using survey vehicles that are accredited as conforming to the SCANNER (Surface Condition Assessment for the National Network of Roads) specification and processing software that is accredited as conforming to the UKPMS (UK Pavement Management System) standards.
Results reported are a combination of (a) 100% of the B-class network surveyed in both directions; and (b) 100% of the C-class network surveyed in one direction. For any given length of road, data from either the current financial year or the previous financial year may be used.
Authorities should aim to cover the required network lengths; where it is not physically possible to survey all parts of the network, grossed-up figures from shorter surveys (at least 90% of the total B-road requirement and 80% of the C-road requirement) will be permitted.
Formula The indicator is the length of classified non-principal carriageway identified as having a condition indicator greater than or equal to 100, as a percentage of the total length surveyed.
100*y
x
where:
x = length of non-principal classified carriageway surveyed identified as having a condition indicator greater than or equal to 100;
y = total length of non-principal classified carriageway surveyed.
Results are calculated automatically by the UKPMS software.

Annex 4: Local Economy and Environmental Sustainability 45
NI 169: Non-principal classified roads where maintenance should be considered (continued)
Worked example Results are calculated automatically by the UKPMS software
Good performance
Good performance is typified by a low percentage. A reduction in levels represents improvement.
In 2006/07 a value of less than 10% represented a top quartile position, with values of 16% or more being in the bottom quartile.
Collection interval
Annual survey, taken at any point in the financial year
Data Source Each highway authority reports on the network for which it is responsible.
Return Format Percentage Decimal Places Zero
Reporting organisation
Highway authorities
Spatial level Single tier and county councils
Further Guidance The specification of survey requirements, procurement arrangements and accreditation processes to be followed are given in the SCANNER and UKPMS specifications which are published by the UK Roads Board and are available from www.ukroadsliaisongroup.org or www.ukpms.com.

46 National Indicators for Local Authorities and Local Authority Partnerships: Handbook of Definitions
NI 170: Previously developed land that has been vacant or derelict for more than 5 years
Is data provided by the LA or a local partner?
Y Is this an existing indicator? N
Rationale To gauge the success of local authorities in facilitating the re-use of brown field land as a contribution to regeneration and economic growth.
Definition This indicator measures the proportion of the area of developed land that is vacant or derelict for more than 5 years.
The total area of developed land is the area recorded for the relevant local authority for 2001 in the urban land figures published in the Urban Settlements report by DCLG.
The National Land Use Database of Previously-Developed Land (NLUD-PDL) contains a typology of previously developed land covering a number of different categories including vacant and derelict land:
‘Previously developed land which is now vacant is land that could be developed without treatment. Treatment includes any of the following: demolition, clearing of fixed structures or foundations and levelling. Land previously used for mineral extraction or waste disposal which has been or is being restored for agriculture, forestry, woodland or other open countryside use is excluded.
“Vacant buildings” are buildings that have been unoccupied for one year or more, that are structurally sound and in a reasonable state of repair (i.e. capable of being occupied in their present state). Includes buildings that have been declared redundant or where re-letting for their former use is not expected. Includes single residential dwellings where they could reasonably be developed or converted into 10 or more dwellings.
“Derelict land and buildings” is land so damaged by previous industrial or other development that it is incapable of beneficial use without treatment. Treatment includes any of the following: demolition, clearing of fixed structures or foundations and levelling. Includes abandoned and unoccupied buildings (including former single residential dwellings) in an advanced state of disrepair i.e. with unsound roof(s).
It excludes land damaged by development which has been or is being restored for agriculture, forestry, woodland or other open countryside use. It also excludes land damaged by a previous development where the remains of any structure or activity have blended into the landscape in the process of time (to the extent that it can reasonably be considered as part of the natural surroundings), and where there is a clear reason that could outweigh the re-use of the site – such as its contribution to nature conservation – or it has subsequently been put to an amenity use and cannot be regarded as requiring redevelopment.
The information needed to make the calculation is included in the NLUD-PDL reflecting information collected annually based on site returns made by local authorities. The most recent data is for 2006.
All of the information is available to the local authority.

Annex 4: Local Economy and Environmental Sustainability 47
NI 170: Previously developed land that has been vacant or derelict for more than 5 years (continued)
Formula The proportion of the area of developed land that is vacant or derelict is calculated as follows:
100*d
cba
where:
a =the number of hectares of previously developed land which have been vacant for more than 5 years as recorded on the NLUD database;
b = the number of hectares of buildings that have been vacant for more than 5 years as recorded on the NLUD database;
c = the number of hectares of land and buildings which have been derelict for more than 5 years as recorded on the NLUD database;
d = the area in hectares of developed land within the area of the local authority.
Worked example
In 2006 there were 14 hectares (ha) of vacant and derelict land on NLUD-PDL for more than 5 years, 15 ha of vacant buildings on the database for more than 5 years, and 5 ha of derelict land and buildings in NLUD-PDL for more than 5 years. The total hectares of developed land within the area of the local authority is 1,158 ha.
The proportion of developed land represented by vacant and derelict land is therefore:
%94.21158
51514
Good performance
A low and reducing percentage, based on baseline 2006
Collection interval
Annual Data Source
Return Format Percentage Decimal Places
Two
Reporting organisation
CLG, using data provided by English Partnerships
Spatial level Single tier and district council
Further Guidance
CLG statistical release “Previously developed land that may be available for redevelopment: England 2006”
National Land Use Database of Previously-Developed Land

48 National Indicators for Local Authorities and Local Authority Partnerships: Handbook of Definitions
NI 171: New business registration rate
Is data provided by the LA or a local partner?
N Is this an existing indicator? N
Rationale To measure the business start-up rate for each local area. There are clear benefits to local economies of having vibrant start-up markets. It creates competitive pressure and drives up business performances as well as the provision of variety of goods and services.
Definition The proportion of business registrations per 10,000 resident population aged 16 and above.
Business registrations are a proxy measure for business start ups. The actual measure is new businesses registering for VAT and PAYE and some smaller businesses reaching the VAT threshold or running a PAYE scheme for the first time.
These figures do not, however give the complete picture of start-up and closure activity in the economy. 2.1 million of the estimated 4.3 million enterprises in the UK were registered for either VAT or PAYE. It is not possible to produce local area estimates for this wider business population.
The population denominator is the resident population aged 16 and above, using the mid-year population estimates for the year to which the registrations relate.
Formula
Y
X*10,000
Where:
X = the number of new business registrations.
Y = the resident population aged 16 and above.
Worked example
Number of business registrations for the year = 6,874
Resident population aged 16 and over = 3 million
(6,874/3,000,000) * 10,000 = 22.9
(hypothetical data)
Good performance
Good performance is typified by a higher number.
Collection interval
Calendar Year Data Source BERR on ONS Websites
Return Format
Number (rate per 10,000)
Decimal Places One
Reporting organisation
Office for National Statistics
Spatial level Single tier and district council

Annex 4: Local Economy and Environmental Sustainability 49
NI 171: New business registration rate (continued)
Further Guidance
This is a new series aimed at obtaining the best estimates of new business formations. It will replace, by 2009, the current VAT registrations and de-registrations publication currently available on the BERR website. The new series produced by the Office for National Statistics, will measure business births in a different way to VAT registrations and as a result will be extended to include businesses registered for PAYE. The new measure conforms to a European Definition and excludes businesses registering due to restructuring of existing businesses and re-activations of dormant units from the count of new business formations. The new series will not be revised in the same way as the current VAT registration series. The first publication of the new series, due in October 2008 will contain preliminary estimates of the number of business registrations occurring in 2007, which may be revised in 2009.
Current VAT registrations statistics: http://stats.berr.gov.uk/ed/vat/
Background on business demography statistics: http://www.oecd.org/std/industry-services/businessdemographymanual

50 National Indicators for Local Authorities and Local Authority Partnerships: Handbook of Definitions
NI 172: Percentage of small businesses in an area showing employment growth
Is data provided by either the LA or a local partner?
N Is this an existing indicator? N
Rationale To show the strength of the small business sector by monitoring employment growth within existing small businesses. Existing indicators measure new business formation and survival rates of businesses, but there is no current measure of the performance within surviving businesses. This indicator looks at the proportion of small businesses that have achieved some employment growth within the year. It is a measure of dynamism within firms and not an indicator of the overall change in employment.
Definition Percentage of small registered businesses showing year-on-year employment growth.
This indicator includes those businesses registered for VAT and/or PAYE with fewer than 50 employees (around 98% of all VAT registered enterprises). It measures the proportion of those businesses showing year on year employment growth, where employment is measured as the number of employees (full and part-time) plus the number of self-employed people that run the business.
Around 2.1 million of the estimated 4.3 million enterprises in the UK were registered for either VAT or PAYE. It is not possible to produce local area estimates for this wider business population.
Formula
Y
X*100
Please Note: The dataset will only include businesses that are on the register in both calculating years and have fewer than 50 employees in the first year. If this is true the following calculation follows:
Where:
X = Total number of registered businesses that reported higher employment numbers in year 2 than in year 1
Y = Total number of registered businesses in year 2 that were also registered in year 1

Annex 4: Local Economy and Environmental Sustainability 51
NI 172: Percentage of small businesses in an area showing employment growth (continued)
Worked example
If the total number of VAT registered businesses in 2005 = 13,873
And 962 of those businesses reported higher employment numbers in 2006 than in 2005
Then the proportion of VAT registered businesses showing growth = 962/13,873 = 6.9%
(hypothetical data)
Good performance
Good performance is typified by a higher percentage.
Collection interval
Financial Year Data Source
Inter Departmental Business Register – available from ONS at local authority level
Return Format
Percentage Decimal Places
One
Reporting organisation
Office for National Statistics
Spatial level Single tier and district council

52 National Indicators for Local Authorities and Local Authority Partnerships: Handbook of Definitions
NI 172: Percentage of small businesses in an area showing employment growth (continued)
Further Guidance
This is a new indicator that will require access to the Inter Departmental Business Register (IDBR). Because of the complications around accessing the IDBR, this data series will be calculated by central government on behalf of all local authorities.
More information on the IDBR:
http://www.statistics.gov.uk/idbr/idbr.asp
If for example we were calculating the growth from 2005-2006 we would need to exclude from the calculation all businesses newly registered in 2006 and all businesses registered in 2005 no longer registered in 2006. The result of the calculation would then be an indicator of employment growth within existing businesses.
The numerator and denominator would include those businesses whose employment grows beyond the 50 employment band between the first and second year, but the calculation would exclude those which had employment in the first year greater than 50, that subsequently fell to fewer than 50.
Businesses with no reported employment on the IDBR will have employment figures imputed from turnover. Measures that look at percentage increases/decreases in employment or turnover will be influenced by imputed figures. As we are not looking at absolute values but at whether there has been an increase or decrease, imputation should be less of a problem. We would expect a business with no employment information to have similar imputed employment figures for both years if the reported turnover figures were similar.

Annex 4: Local Economy and Environmental Sustainability 53
NI 173: Flows on to incapacity benefits from employment
Is data provided by the LA or a local partner?
N Is this an existing indicator? N
Rationale The cross-government strategy on Health, Work and Well-being, led in England by DWP, DH and HSE, seeks to improve the health of working age people and ensure that people with health conditions or disabilities are able to enter, remain in or quickly return to work. The strategy is central to the Government’s aspirations of full employment and improved health and well-being for all. We know that work is generally good for people’s health and long-term well-being.
The Strategy is a recognition that if we are to achieve our aspiration, we need to do more than simply support benefit recipients into employment – we need to help them stay in and succeed in work and to prevent people from losing their jobs and needing to claim benefits in the first place. With the challenges that an ageing population presents it will also be important that workers remain healthy to enable them to work to an older age.
Although much work is happening at a national level, we are very conscious that the Strategy will not be successful without the involvement of key players at a local level.
Key partners such as LAs, Jobcentre Plus, HSE, NHS trusts, employers and the Voluntary Sector working together locally have the potential to bring about marked improvement in this area. They can, for example, focus on ensuring that workplaces are healthier and safer; the implementation of better sickness absence management procedures; earlier/improved availability of appropriate health interventions; and improved availability of workplace adaptations and return to work support for workers.
Local authorities can provide a stimulus for joint working on this agenda at a local level, bringing partners together and focusing their attention.
This indicator helps monitor the impact of such activity to reduce the numbers of people leaving work and moving on to incapacity benefits as a result of health conditions and disabilities.

54 National Indicators for Local Authorities and Local Authority Partnerships: Handbook of Definitions
NI 173: Flows on to incapacity benefits from employment (continued)
Definition This Indicator measures the proportion of the working population living in a local authority who move directly from employment, including those in receipt of employers sick pay or SSP, to incapacity benefits (IB).
The number of those claiming incapacity benefits used for this indicator refers to those:
• claimingIncapacityBenefit,SevereDisablementAllowanceorIncomeSupportpaid on the grounds of ill health or incapacity (from 2008 these benefits will be replaced for new claimants with Employment and Support Allowance);
• whowereemployedimmediatelypriortoclaimingincapacitybenefits;• andlivinginthelocalauthorityareaatthetimeoftheirclaim.IB data will be sourced from the DWP wherein data for the number of new IB claimants is available quarterly.
The number in employment – including those in full or part-time employment and the self-employed – will be taken from the Annual Population Survey (APS). APS datasets are produced quarterly with each dataset containing 12 months of data.
APS data is published four times a year for the 12 months up to and including the following months: Mar, June, Sept, and Dec. IB data is available for the following quarters (Dec-Feb, Mar-May, Jun-Aug, Sept-Nov). The indicator should be calculated four times a year when new IB data becomes available.
The IB data for the latest quarter should be added to that for the previous three quarters in order to produce a twelve month IB total. This should be combined with the most recent APS twelve month data. The twelve months that the APS data covers will be two months earlier than that covered by the IB data.
For instance: around March 2008 IB data for the previous three months (Dec-Feb) becomes available. This should be combined with the preceding three quarters (Mar-May, Jun-Aug, Sept-Oct) to produce IB data for the twelve months Mar 07 to Feb 08. The most recent APS data available will be for the period Jan 07-Dec07.
The correct combination of twelve month periods of APS and IB data each quarter are as follows.
IB quarters APS
Dec – Feb (plus preceding 3 quarters) combines with Jan – Dec
Mar – May (plus preceding 3 quarters) combines with Apr – Mar
Jun – Aug (plus preceding 3 quarters) combines with Jul – June
Sept – Nov (plus preceding 3 quarters) combines with Oct – Sept

Annex 4: Local Economy and Environmental Sustainability 55
NI 173: Flows on to incapacity benefits from employment (continued)
Formula100*
y
x
Where:
x = Number of IB claimants who moved directly from employment to incapacity benefits during the latest four quarters.
y = Number of people in employment who live in the local authority during the corresponding four quarters, according to the APS.
Worked example
400 *100
68000
= 0.6%
Good performance
The lower the rate, the better the performance. Comparing individual LA rate with regional and national rates is an indicator of relative performance.
Collection interval
Collected quarterly (used to produce annual totals – see guidance above)
Data Source IB flow data available from DWP 5% Terminations database; ONS Annual Population Survey available from “NOMIS” via the internet
Return Format Percentage Decimal Places One
Reporting organisation
DWP for IB data; ONS for Annual Population Survey employment data
Spatial level Single tier and district council
Further Guidance

56 National Indicators for Local Authorities and Local Authority Partnerships: Handbook of Definitions
NI 174: Skills gaps in the current workforce reported by employers
Is data provided by the LA or a local partner?
N Is this an existing indicator? Y
Rationale This indicator helps understand whether employer skills needs are being met, and is directly related to economic development in which local authorities have an important role.
Definition Skills gaps: skills gaps exist where employers report having employees who are not fully proficient at their job.
The source of the data is the National Employer Skills Survey (NESS) commissioned by the Learning and Skills Council (LSC), Department for Innovation, University and Skills (DIUS) and Sector Skills Development Agency (SSDA). NESS is a large-scale, robust and representative survey of 79,000 employers across England (in 2007). Surveys in the series were undertaken in 2003, 2004, and 2005 and are expected to continue every two years. Data from the 2007 study will be available from April 2008. Data relates to the workforce in the establishment at the time of survey.
The LSC currently communicates findings to local authorities via a number of routes, including the Regional Director’s strategic briefings and the Regional Strategic analysis document. There are plans for the LSC to share NESS data with each local authority directly through local and multi area agreements and through representation at local strategic partnership meetings.
Formula The proportion of establishments reporting any skills gaps in the current workforce is calculated as follows:
100*y
x
Where:
x = the number of employers who report having any skills gaps in their existing workforce;
y = the total number of employers.
Worked example
4,000 employers report having any skills gap out of a total of 80,000 employers. The proportion of employers with skills gaps is therefore:
%5100*80000
4000
Good performance
Typified by lower numbers

Annex 4: Local Economy and Environmental Sustainability 57
NI 174: Skills gaps in the current workforce reported by employers (continued)
Collection interval
Data will be collected by the two-yearly NESS survey. Data from the 2007 study will be available from April 2008. Data from the 2009 study will be available from April 2010 etc…
Data Source LSC’s National Employers Skills Survey (NESS)
Return Format
Percentage Decimal Places
Zero
Reporting organisation
Learning and Skills Council
Spatial level Regional-LSC level
Further Guidance
Details of NESS can be found at http://research.lsc.gov.uk/LSC+Research/published/ness/

58 National Indicators for Local Authorities and Local Authority Partnerships: Handbook of Definitions
NI 175: Access to services and facilities by public transport, walking and cycling
Is data provided by the LA or a local partner?
Y Is this an existing indicator? Y
Rationale This indicator monitors the fostering of social inclusion through access to core services and facilities via non-private modes of transport, which may include, but is not limited to: public transport; demand responsive transport; walking; and cycling. It is a key social inclusion and quality of life outcome. The indicator cuts across a number of service areas and can assist how they are planned and delivered.
Definition This indicator measures access to selected core services and facilities by individuals via non-private modes of transport, which may include, but is not limited to: public transport, demand responsive transport, walking and cycling.
• Coreservices: – Healthcare – Hospitals and GP surgeries; – Education – primary, secondary and higher education sites; – Food shops; and – Employment sites. Non private modes of transport would include:
• timetabledbusservices;• Lightrail&tramservices(BlackpoolTrams;ManchesterMetrolink;Midland
Metro; Nottingham Express Transit; Sheffield Supertram and Tyne & Wear Metro (Croydon Tramlink & Docklands Light Railway reported by TfL);
• Demandresponsive(dial-a-ride)transport–flexible,demandledservicewithno registered timetable;
• Walking;and• Cycling.For all areas (except in London and the Isles of Scilly), the indicator should follow the definition used for indicator number LTP1 in the areas final second local transport plan, unless (exceptionally) a revised definition is specifically agreed with the Department for Transport. LTP1 guidance can be found at: http://www.dft.gov.uk/pgr/regional/ltp/guidance/fltp/fullguidanceonlocaltransport3657
Transport for London is developing an NI definition within Greater London, which will be finalised with DfT In 2008. DfT data will be available to provide baseline Information. DfT will inform GO London and Boroughs individually when this definition has been agreed.
The Department for Transport will finalise an indicator definition for the Isles of Scilly, in discussion with the council.
In metropolitan areas and other authorities which are part of a joint local transport plan, the indicator may be reported at local transport plan or authority level. In either case the indicators should follow the common definition approved in the relevant joint local transport plan.

Annex 4: Local Economy and Environmental Sustainability 59
NI 175: Access to services and facilities by public transport, walking and cycling (continued)
Formula The formula required for reporting this indicator will be different for each authority and is dependent on the definition of their indicator, as described above.
Worked example
n/a – see formula Good performance Measured by improvement against chosen measure. The level of improvement needed to demonstrate good performance will depend on an individual authority’s indicator.
Collection interval
Annual (financial year) Data Source Local authority. Where a core indicator is used this will be derived from information published by DfT. http://www.dft.gov.uk/pgr/regional/ltp/accessibility/developing/indicators/
Return Format Usually % (but depends on indicator definition)
Decimal Places Usually one decimal place (but depends on indicator definition)
Reporting organisation
Transport for London, metropolitan borough councils, county councils and unitary authorities
Spatial level Single tier (including London borough and metropolitan borough) and county council.
Within each PTA area, information may be returned at a PTA wide level, or on request and subject to DfT agreement at other supra-district level provided the whole of the PTA area is covered.
Outside PTA areas, information may also be collected following Local Transport Plan geography if partner councils agree to this and subject to agreement with DfT about data and reporting continuity and robustness.
The NI definition being developed by Transport for London will be returned for areas within Greater London. Should a London Borough wish to set a target for this NI, it may do so in consultation with both DfT and TfL.

60 National Indicators for Local Authorities and Local Authority Partnerships: Handbook of Definitions
NI 175: Access to services and facilities by public transport, walking and cycling (continued)
Further Guidance
Further information is contained in the following Department for Transport guidance:
• ‘TechnicalGuidanceonAccessibilityPlanninginLocalTransportPlans’December 2004
http://www.dft.gov.uk/pgr/regional/ltp/guidance/fltp/fullguidanceonlocaltransport3657
• ‘Guidance on Accessibility Planning in Local Transport Plans’ December 2004
http://www.dft.gov.uk/pgr/regional/ltp/accessibility/guidance/gap/accessibilityplanningguidanc3633
• 2005 Core Accessibility Indicators Technical Report http://www.dft.gov.uk/pgr/statistics/datatablespublications/ltp/
coreaccessindicators2005 ‘Full Guidance on Local Transport Plans’ second edition December 2004. http://www.dft.gov.uk/pgr/regional/ltp/guidance/fltp/
fullguidanceonlocaltransport3657

Annex 4: Local Economy and Environmental Sustainability 61
NI 176: Working age people with access to employment by public transport (and other specified modes)
Is data provided by the LA or a local partner?
N Is this an existing indicator? Y
Rationale Information on the accessibility of sites of employment to population of working age by public transport, demand responsive transport, walking and cycling to enable local authorities to direct interventions (transport and planning measures related to both economic and residential sites) to encourage economic growth and reduce social exclusion.
Definition This indicator measures the percentage of people of working age (aged 16 to 74 years) living within the catchment area of a location with more than 500 jobs by public transport, demand responsive transport and/or walking.
Public Transport would be: timetabled bus; light rail; and tram services.
Catchment area – calculated by DfT as part of the Core Accessibility Indicators and is based on the sensitivity of the population to travel time for employment (i.e. the further away the employment location, the less likely an individual would be to travel to it). Separate catchment areas are calculated for public transport/ walking and cycling. The overall catchment area is then calculated by weighting the two together using National Travel Survey figures for modal split.
Further details can be found in the 2005 Core Accessibility Indicators technical report (http://www.dft.gov.uk/pgr/statistics/datatablespublications/ltp/coreaccessindicators2005).
Other specified modes (walking and cycling) – journey by timetabled bus, light rail and tram services includes time spent walking to reach destination and wholly walking or cycling journeys where these are quicker.
Employment opportunities – locations (Lower Super Output Areas) with 500 or more jobs as defined in 2001 census.
Working age – 16-74 age range, in line with the Census definition of economically active age.
DfT will calculate and produce the return for this indicator annually. Authorities will not be required to undertake any calculations themselves.
In addition, return data for this indicator can be made available at Lower Super Output Area, allowing authorities to analyse access to employment within different localities. The return for Greater London will initially be provided by DfT. An NI definition within Greater London is being developed by Transport for London and will be finalised with DfT In 2008. DfT will continue to provide baseline/supporting data.
Formula Authorities will not be required to undertake any calculations themselves.
As a basic calculation for each super output area the catchment area by a given mode of transport (public/ demand responsive transport, walking/ cycling) for each Census Output Area (COA) is calculated as:
C = P*λt

62 National Indicators for Local Authorities and Local Authority Partnerships: Handbook of Definitions
NI 176: Working age people with access to employment by public transport (and other specified modes) (continued)
Formula (continued)
Where:
C is the number of people aged 16-74 within the catchment area for the COA.
P is the total number of people aged 16-74 living in the catchment area for the COA.
λ is the deterrence parameter representing the sensitivity of accessibility to employment is to travel time (i.e. the further away the employment location, the less likely an individual would be to travel to it)
It is the travel time from the centroid of the COA to the nearest LSOA with 500+ jobs, by a given mode of transport (public/ demand responsive transport, walking/cycling).
The two catchment areas are then weighted together using the National Travel Survey figures for modal split (i.e. the proportion of journeys made by public transport against the proportion made by walking/ cycling), to give an overall catchment area for the COA.
The catchment areas for each Local Authority are calculated by adding together the number of people aged 16-74 in each COA within the Authority, divided by the total number of people aged 16-74 with the Authority as a whole.
Authorities will not be required to undertake any calculations themselves.
For further details, please see page 43 of the 2005 Core Accessibility Indicators technical report: (http://www.dft.gov.uk/pgr/statistics/datatablespublications/ltp/coreaccessindicators2005 ).
Worked example
N/A – see formula Good performance
Good performance is an increase in the proportion of those of working age (aged 16-74) within the catchment area of a location (at LSOA level) with more than 500 jobs by public transport and/or walking or cycling.
Good performance will be achieved by reducing the journey time to employment locations by public/demand responsive transport, walking and cycling.
Collection interval
Annual. (Calendar Year.)
Data sets available for information in the spring of the following year.
Data Source Detailed in the 2005 Core Accessibility Indicators technical report (http://www.dft.gov.uk/pgr/statistics/datatablespublications/ltp/coreaccessindicators2005)
Excel spreadsheet produced nationally by DfT.

Annex 4: Local Economy and Environmental Sustainability 63
NI 176: Working age people with access to employment by public transport (and other specified modes) (continued)
Return Format
Percentage Decimal Places
Zero
Reporting organisation
DfT via information received from Local transport authorities
DfT will calculate this indicator annually. Authorities will not be required to undertake any calculations themselves. In metropolitan areas and other authorities which are part of a joint Local Transport Plan, the indicator may be reported at Local Transport Plan level, or at authority level.
DfT will supply and report the data to support this NI when Transport for London have finalised the Greater London Indicator London Boroughs may then wish to consider setting a target in consultation with TfL and DfT.
Spatial level Data will be calculated for all county councils, unitary authorities, metropolitan districts (within PTE areas) & London boroughs by DfT.
In addition, the data for this indicator will be made available at Lower Super Output Area, allowing authorities to analyse access to employment within different localities.
Further Guidance
Further information is contained in the following Department for Transport guidance:
• ‘TechnicalGuidanceonAccessibilityPlanninginLocalTransportPlans’December 2004
http://www.dft.gov.uk/pgr/regional/ltp/guidance/fltp/fullguidanceonlocaltransport3657
• ‘GuidanceonAccessibilityPlanninginLocalTransportPlans’December2004 http://www.dft.gov.uk/pgr/regional/ltp/accessibility/guidance/gap/
accessibilityplanningguidanc3633• 2005CoreAccessibilityIndicatorstechnicalreport http://www.dft.gov.uk/pgr/statistics/datatablespublications/ltp/
coreaccessindicators2005 ‘Full Guidance on Local Transport Plans’ second edition December 2004.• http://www.dft.gov.uk/pgr/regional/ltp/guidance/fltp/
fullguidanceonlocaltransport3657

64 National Indicators for Local Authorities and Local Authority Partnerships: Handbook of Definitions
NI 177: Local bus and light rail passenger journeys originating in the authority area
Is data provided by the LA or a local partner?
Y Is this an existing indicator? Y
Rationale Bus patronage is a key outcome of the partnerships between local authorities and bus operators, which together play an important role in delivering better local transport services and are supported by approximately £2.5bn of public funding per year.
Bus patronage can also be a key marker of the level of accessibility to services and congestion. Local authorities can make major contributions to improving bus patronage through tendered services, the management of their road networks and giving priority to bus passengers.
The change to include light rail (but not heavy rail) will align this indicator with the national PSA target to increase bus and light rail patronage.
Definition This indicator measures the total number of local bus and light rail passenger journeys originating in the authority area in a given year.
Local bus services are defined for the purposes of this indicator as those using one or more public service vehicles for the carriage of passengers by road at separate fares where the stopping places, or journey length, are less than 15 miles (24 kilometres) apart.
Light rail is defined as: Manchester Metrolink, South Yorkshire Supertram, Tyne & Wear Metro, Docklands Light Railway, Midland Metro, Croydon Tramlink, Nottingham Express Transit and the Blackpool tram.
This indicator is an updated version of the former Best Value Performance Indicator 102: (BVPI 102 – total local bus passenger journeys originating in the authority area in a year). There have been no methodological changes from last year, apart from the inclusion of light rail passengers.
Local Public Transport – All passengers travelling on registered local bus services and light rail services should be counted. This includes all travelling on school bus services available to the general public, and passengers travelling on flexibly routed bus services other than Dial-a-Ride services.
Journeys – passengers boarding buses or trams within the authority, regardless of whether they alight in the authority or a neighbouring authority. To avoid double-counting with other authorities, do not include bus or light rail passengers who boarded the vehicle outside your authority.
N.B. Local service is defined in section 2 of the Transport Act 1985 or the Greater London Authority Act 1999.
Formula Count of local bus and light rail journeys originating in the authority area
Worked example
Simple count (e.g. 1,589) of bus journeys originating in the authority area
Good performance
Good performance is typified by a high and/or increasing number
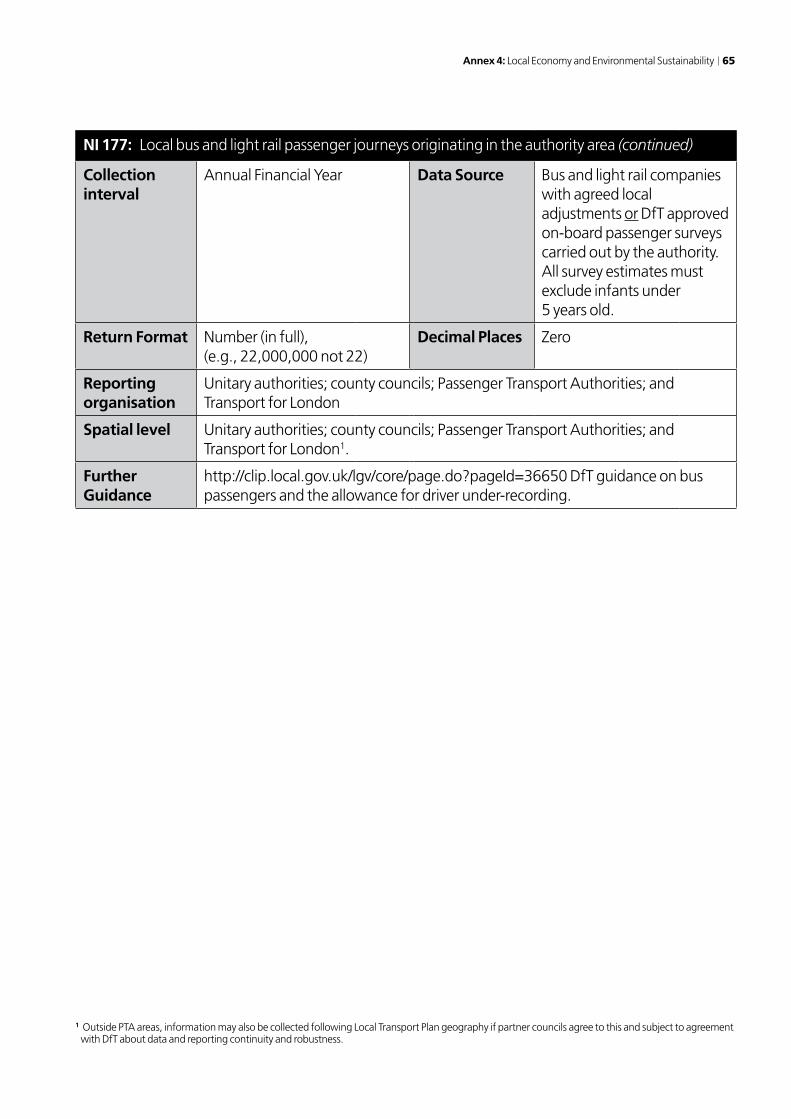
Annex 4: Local Economy and Environmental Sustainability 65
NI 177: Local bus and light rail passenger journeys originating in the authority area (continued)
Collection interval
Annual Financial Year Data Source Bus and light rail companies with agreed local adjustments or DfT approved on-board passenger surveys carried out by the authority. All survey estimates must exclude infants under 5 years old.
Return Format Number (in full), (e.g., 22,000,000 not 22)
Decimal Places Zero
Reporting organisation
Unitary authorities; county councils; Passenger Transport Authorities; and Transport for London
Spatial level Unitary authorities; county councils; Passenger Transport Authorities; and Transport for London1.
Further Guidance
http://clip.local.gov.uk/lgv/core/page.do?pageId=36650 DfT guidance on bus passengers and the allowance for driver under-recording.
1 Outside PTA areas, information may also be collected following Local Transport Plan geography if partner councils agree to this and subject to agreement with DfT about data and reporting continuity and robustness.

66 National Indicators for Local Authorities and Local Authority Partnerships: Handbook of Definitions
NI 178: Bus services running on time
Is data provided by the LA or a local partner?
Y Is this an existing indicator? Y
Rationale Bus punctuality is a key outcome of the partnerships between local authorities and bus operators, which together, play an important role in delivering better local transport services and are supported by approximately £2.5bn of public funding per year.
Bus punctuality is also a key marker of the level of congestion. Local authorities can make major contributions to improving bus punctuality by the management of their road networks and giving priority to bus passengers. Improved bus punctuality not only benefits bus passengers but also can help attract more travellers to buses and hence reduce road congestion.
Definition Bus punctuality – defined as keeping public service buses to their scheduled bus departure times. This indicator is measured in two different ways: the percentage of non-frequent buses on time and the average excess waiting time for frequent services.
Scheduled services – those services timetabled by bus companies (both commercial and those supported by local authorities).
Non-frequent services (fewer than 6 buses per hour) – measured by whether the bus departs within its “on-time” window of 1 minute 0 seconds early to 5 minutes 59 seconds late. Buses that fail to run should be treated as “late” and not ignored in the calculations.
Frequent services (6 or more buses per hour) – measured by the excess waiting time experienced by passengers over and above what might be expected with a service that was always on time.
Local transport authorities have already been collecting and reporting this information for their Local Transport Plans (mandatory indicator LTP5). The information, required for LTP5, related to non-timing points for non-frequent services should not be returned or used.
Formula The indicator is reported as two parts:
(1) The proportion of non-frequent scheduled services on time, given by: (0.5) x (% of buses starting their route on time) (a)
+ (0.5) x (% of buses on time at intermediate timing points) (a)
(a) Defined as between 1.00 minute early and 5.59 minutes late (2) For frequent services (not applicable to all areas), the excess waiting time is the
total of the difference between the average observed and scheduled waiting times (in minutes). An example of calculation is shown at http://clip.local.gov.uk/lgv/aio/36711.

Annex 4: Local Economy and Environmental Sustainability 67
NI 178: Bus services running on time (continued)
Worked example
See guidance below Good performance
An increase in levels of punctuality of bus services in the reporting area. In other words, an increase in the percentage of non-frequent services on time and a reduction in the excess waiting time for frequent services.
Attainment of levels of punctuality included in the Traffic Commissioners standards and standards for Local Transport Plan targets.
Collection interval
Annual (Financial Year) Data Source
Bus Company data (including electronic information) with local authority spot surveys. Or PTE/local authority electronic monitoring subject to DfT approval.
In London, TfL service monitoring will be used. In all cases data should relate to weekdays during term time and mainly in peak hours, i.e. between 8am and 10:30am and between 3pm and 5:30pm.
Return Format Percentage of non-frequent services on time.
Excess waiting time of frequent services (number of minutes).
Decimal Places
For non frequent services: percentage to nearest whole number (e.g. 93%).
For frequent services: minutes with two decimal places (e.g. 1.74 minutes).
Reporting organisation
Unitary authorities; county councils; Passenger Transport Authorities; and Transport for London.
Spatial level Unitary authorities; county councils; Passenger Transport Authorities; and Transport for London1.
1 Within each PTA area, information may be collected at metropolitan district or supra-district level provided the whole of the PTA area is covered, on request from a PTA and subject to agreement with DfT about data and reporting continuity and robustness. Outside PTA areas, information may also be collected following Local Transport Plan geography if partner councils agree to this and subject to agreement with DfT about data and reporting continuity and robustness.
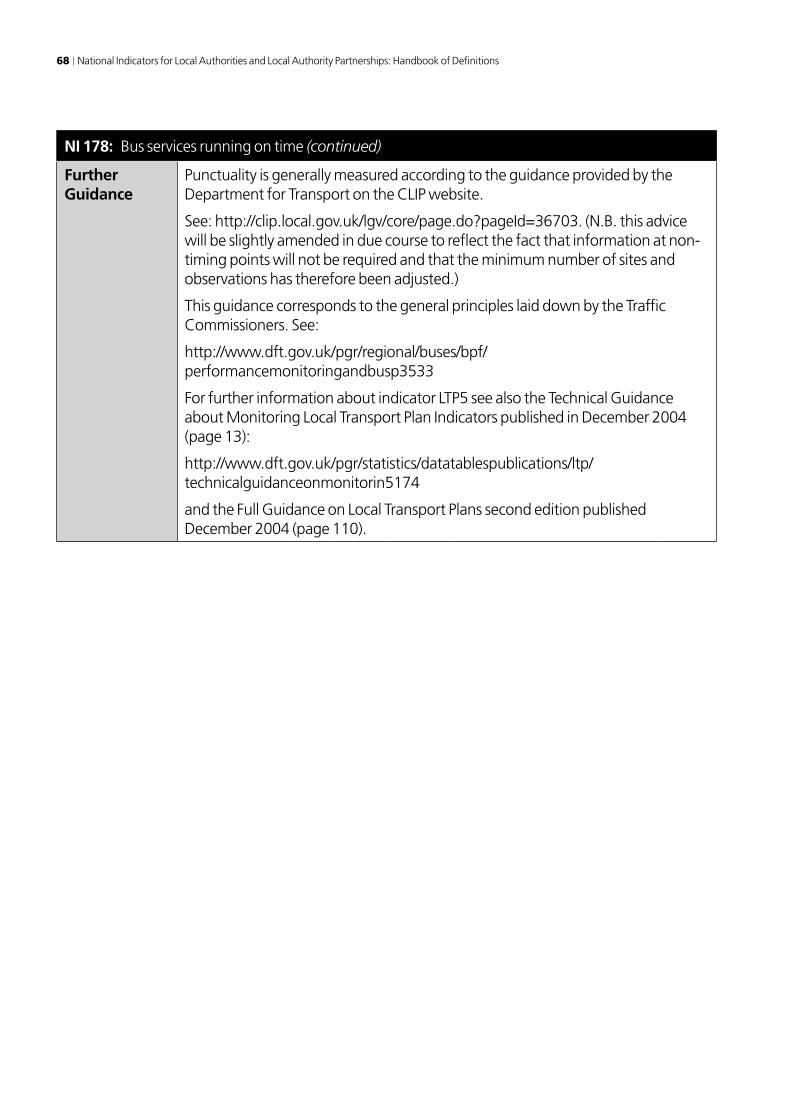
68 National Indicators for Local Authorities and Local Authority Partnerships: Handbook of Definitions
NI 178: Bus services running on time (continued)
Further Guidance
Punctuality is generally measured according to the guidance provided by the Department for Transport on the CLIP website.
See: http://clip.local.gov.uk/lgv/core/page.do?pageId=36703. (N.B. this advice will be slightly amended in due course to reflect the fact that information at non-timing points will not be required and that the minimum number of sites and observations has therefore been adjusted.)
This guidance corresponds to the general principles laid down by the Traffic Commissioners. See:
http://www.dft.gov.uk/pgr/regional/buses/bpf/performancemonitoringandbusp3533
For further information about indicator LTP5 see also the Technical Guidance about Monitoring Local Transport Plan Indicators published in December 2004 (page 13):
http://www.dft.gov.uk/pgr/statistics/datatablespublications/ltp/technicalguidanceonmonitorin5174
and the Full Guidance on Local Transport Plans second edition published December 2004 (page 110).

Annex 4: Local Economy and Environmental Sustainability 69
NI 179: Value for money – total net value of ongoing cash-releasing value for money gains that have impacted since the start of the 2008-09 financial year
Is data provided by the LA or a local partner?
Y Is this an existing indicator? Y
Rationale All parts of the public sector need to continue to seek and implement ways to deliver higher quality public services with the resources that are available. This means enhancing value for money and the whole public sector has been set a target of achieving at least 3% per annum value for money gains during the 2007 Comprehensive Spending Review period, all of which should be cash-releasing, i.e. free up resources that can be redeployed elsewhere.
The response to pressure on available resources should be to seek greater value for money, rather than to simply reduce the effectiveness of public services. Therefore, this indicator records the value of ongoing net cash-releasing value for money gains achieved by councils. This is same as the figure for total cumulative cashable efficiency gains that until now has been reported through the Annual Efficiency Statement (which is being rescinded).
Definition The total net value of ongoing cash-releasing value for money gains that have impacted since the start of the 2008-09 Financial Year.
Net: Value for money gains should be reported net of any additional investment and ongoing costs incurred for their implementation (this excludes any staff costs incurred in implementing the gains if those costs would have been incurred in any event).
Ongoing: Value for money gains must persist for at least two full financial years after the year they first accrue (the value of any gains reported through this indicator that are not sustained for this period of time must be deleted at the earliest opportunity).
Cash-releasing: Value for money gains that release resources which can be redeployed according to local priorities.
Value for money gains: Improved relationship between inputs and outputs for the delivery of a service, but without any deterioration of the overall effectiveness of that service (a service can be any activity undertaken by the council).
Impacted: The moment that the financial benefit of the action is felt (thus gains arising from actions taken before the start of the 2008-09 financial year or the remaining part year effects of gains that first impacted during 2007-08 may also be included where they meet this qualification).
In addition, councils may also count the value of any cash-releasing gains achieved before 2008-09 where they are both ongoing and in excess of the council’s 7.5% efficiency target for the 2004 Spending Review period.
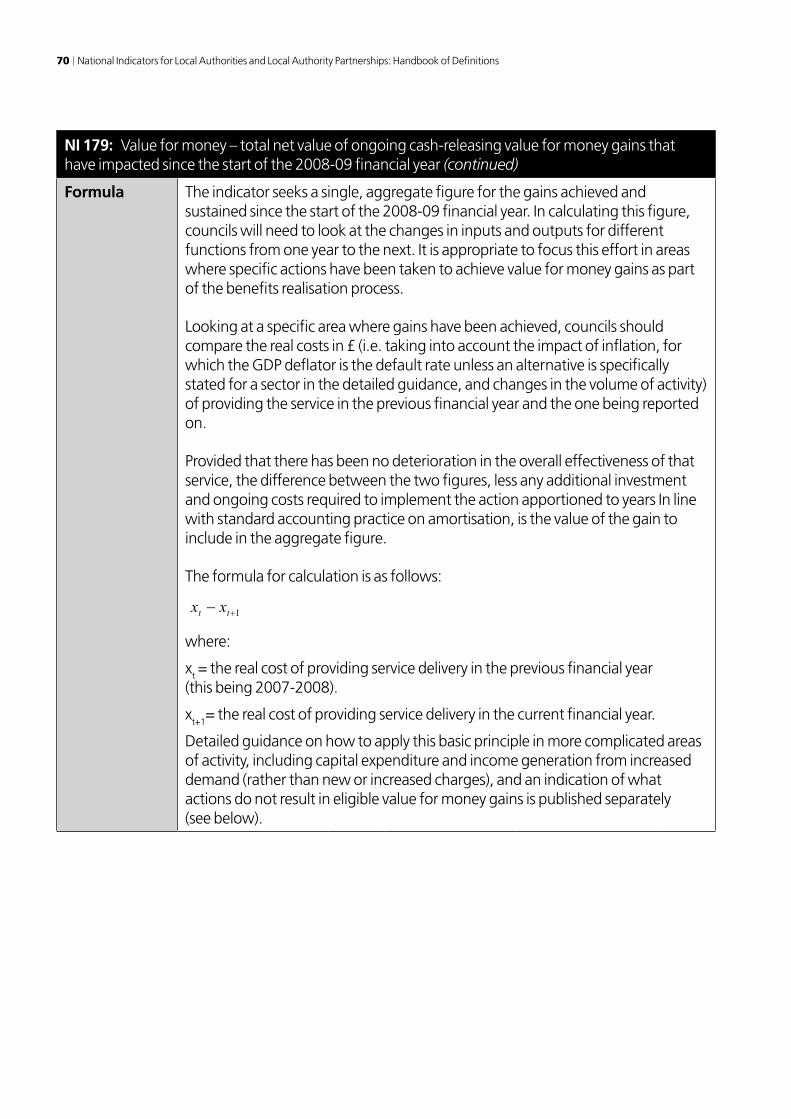
70 National Indicators for Local Authorities and Local Authority Partnerships: Handbook of Definitions
NI 179: Value for money – total net value of ongoing cash-releasing value for money gains that have impacted since the start of the 2008-09 financial year (continued)
Formula The indicator seeks a single, aggregate figure for the gains achieved and sustained since the start of the 2008-09 financial year. In calculating this figure, councils will need to look at the changes in inputs and outputs for different functions from one year to the next. It is appropriate to focus this effort in areas where specific actions have been taken to achieve value for money gains as part of the benefits realisation process.
Looking at a specific area where gains have been achieved, councils should compare the real costs in £ (i.e. taking into account the impact of inflation, for which the GDP deflator is the default rate unless an alternative is specifically stated for a sector in the detailed guidance, and changes in the volume of activity) of providing the service in the previous financial year and the one being reported on.
Provided that there has been no deterioration in the overall effectiveness of that service, the difference between the two figures, less any additional investment and ongoing costs required to implement the action apportioned to years In line with standard accounting practice on amortisation, is the value of the gain to include in the aggregate figure.
The formula for calculation is as follows:
1tt xx
where:
xt = the real cost of providing service delivery in the previous financial year (this being 2007-2008).
xt+1= the real cost of providing service delivery in the current financial year.
Detailed guidance on how to apply this basic principle in more complicated areas of activity, including capital expenditure and income generation from increased demand (rather than new or increased charges), and an indication of what actions do not result in eligible value for money gains is published separately (see below).

Annex 4: Local Economy and Environmental Sustainability 71
NI 179: Value for money – total net value of ongoing cash-releasing value for money gains that have impacted since the start of the 2008-09 financial year (continued)
Worked example
In Year 1, Council A spends £100,000 on providing service X.
In Year 2, it spends £90,000 to provide the service, with no deterioration in its overall effectiveness and taking account of inflation.
The value for money gain contributing to the aggregate total is therefore:
£100,000 – £90,000 = £10,000
Good performance
Good performance is typified by higher numbers.
However, the indicator will not provide evidence on absolute value for money against which different councils can be judged. The scope for gains will be different in each area, and the ability to report higher numbers may be limited in any organisation that is genuinely delivering excellent value for money.
Collection interval
Biannual:
July – (from July 2009) – Actual gains achieved since 1 April 2008 up to the end of the previous financial year.
October – (from October 2008) – Forecast cumulative position at end of current financial year.
Data Source Local authorities.
Return Format Number (£ Thousands) Decimal Places Rounded to nearest thousand
Reporting organisation
Local authorities (liaising as appropriate with any partners with which they have jointly undertaken actions to improve value for money, to allocate the value of the value for money gains accordingly and avoid double counting against the whole public sector target).
Spatial level Single tier, district and county council
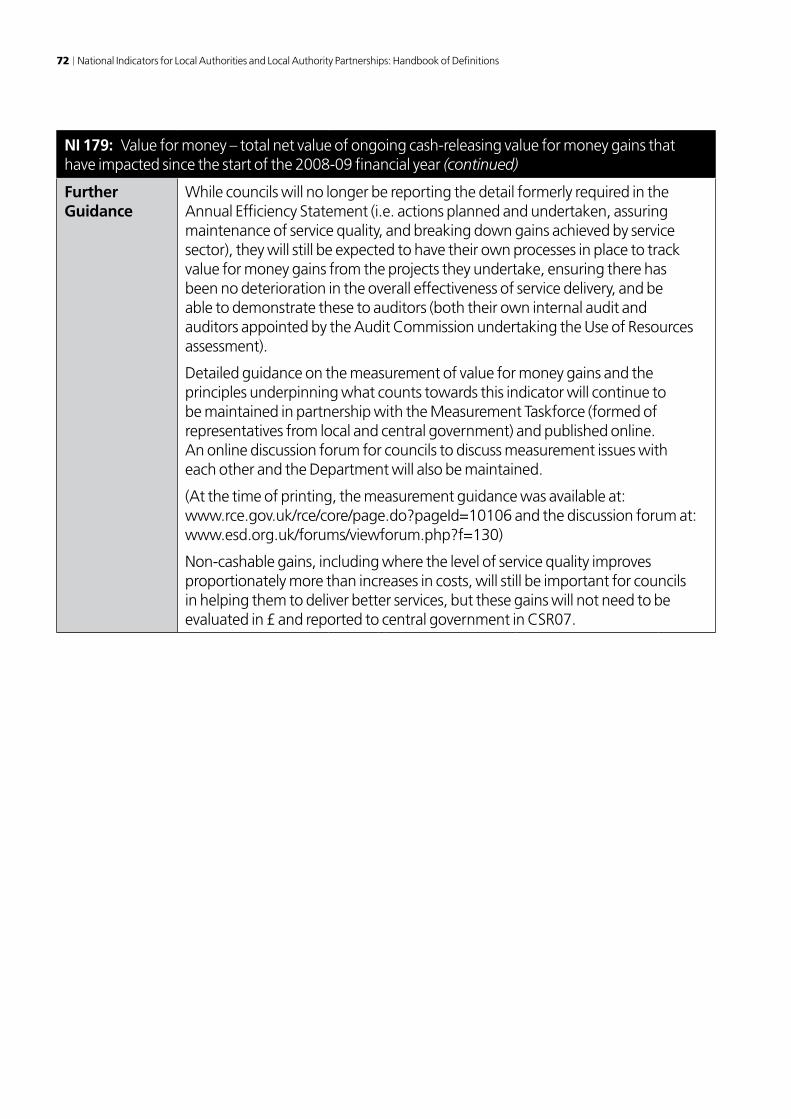
72 National Indicators for Local Authorities and Local Authority Partnerships: Handbook of Definitions
NI 179: Value for money – total net value of ongoing cash-releasing value for money gains that have impacted since the start of the 2008-09 financial year (continued)
Further Guidance
While councils will no longer be reporting the detail formerly required in the Annual Efficiency Statement (i.e. actions planned and undertaken, assuring maintenance of service quality, and breaking down gains achieved by service sector), they will still be expected to have their own processes in place to track value for money gains from the projects they undertake, ensuring there has been no deterioration in the overall effectiveness of service delivery, and be able to demonstrate these to auditors (both their own internal audit and auditors appointed by the Audit Commission undertaking the Use of Resources assessment).
Detailed guidance on the measurement of value for money gains and the principles underpinning what counts towards this indicator will continue to be maintained in partnership with the Measurement Taskforce (formed of representatives from local and central government) and published online. An online discussion forum for councils to discuss measurement issues with each other and the Department will also be maintained.
(At the time of printing, the measurement guidance was available at: www.rce.gov.uk/rce/core/page.do?pageId=10106 and the discussion forum at: www.esd.org.uk/forums/viewforum.php?f=130)
Non-cashable gains, including where the level of service quality improves proportionately more than increases in costs, will still be important for councils in helping them to deliver better services, but these gains will not need to be evaluated in £ and reported to central government in CSR07.

Annex 4: Local Economy and Environmental Sustainability 73
NI 180: The number of changes of circumstances which affect customers’ HB/CTB entitlement within the year.
Is data provided by the LA or a local partner?
Y Is this an existing indicator? N
Rationale To ensure that customers receive the correct amount of Housing Benefit/Council Tax Benefit. This will contribute to reducing both child and pensioner poverty and will reduce fraud and error, thereby saving taxpayers’ money. The total cost of HB/CTB is £19bn of which we estimate that 1.4% is underpaid and 5.5% is overpaid. The majority of both underpayment and overpayment is a result of customers undergoing changes in their circumstances during the life of the claim. In order to ensure that benefit remains correct, local authorities need to ensure they are informed of all these changes.
Definition The number of changes of circumstances which affect customers’ HB/CTB benefit entitlement that are identified and processed by the local authority in a year.
Changes include those that result in an increase in benefit, which would have resulted in an underpayment if left unactioned, and those that result in a decrease in benefit, which would lead to an overpayment if left unactioned. The latter includes a termination of benefit entitlement.
The volume of changes that are generated by the customers within each LA will depend on the number of customers that make up each LA’s benefit caseload and on their characteristics.
To allow LAs to benchmark themselves against each other, the volume of changes will be measured per thousand caseload and LAs will be apportioned into groupings where all the LAs within each group would be expected to generate roughly the same volume of changes per thousand caseload.
N.B. The indicator only covers claims that are already in payment and includes neither the number of unsuccessful benefit claims, nor does it attempt to capture new claims made following take up activity.
Formula Numerator:
(Total number of changes identified leading to an increases in benefit entitlement amount)
+
(Total number of changes identified leading to a decrease in claimantís benefit entitlement amount)
+
(Total number of terminations of claimantís benefit entitlement)
Denominator: Number of claimants within caseload divided by 1000.

74 National Indicators for Local Authorities and Local Authority Partnerships: Handbook of Definitions
NI 180: The number of changes of circumstances which affect customers’ HB/CTB benefit entitlement within the year. (continued)
Worked example
LA1 identifies 1572 changes in circumstances in a year.
LA1 has a caseload of 2470 claimants.
LA1’s performance will be recorded as:
1572/2.47 = 636.4
LA1 is part of LA group “D” and can compare its performance against the other LAs in group “D”.
Good performance High numbers represents good performance.
Collection interval
Monthly (according to a schedule fixed by DWP).
Data Source Data is collected by a scan of the local authorities benefit systems, which they then submit to DWP. The scan is already being collected for other purposes but will be used to measure this indicator in addition to its other uses.
Return Format Number Decimal Places One
Reporting organisation
DWP
Spatial level Unitary authority and district council
Further Guidance
Further guidance can be found in the circular HB/CTB A4/2008 on http://www.dwp.gov.uk/hbctb/2008/a4-2008.pdf and on the DWP website.

Annex 4: Local Economy and Environmental Sustainability 75
NI 181: Time taken to process Housing Benefit/Council Tax Benefit new claims and change events
Is data provided by the LA or a local partner?
Y Is this an existing indicator? N
Rationale HB/CTB of £19bn is paid to over 5 million low income households. Delays in the administration of these benefits can impact on some of the most vulnerable people in our society by:
• Leadingtorentarrearsandevictions• PreventingaccesstohousingbecauselandlordsarereluctanttorenttoHB
customers• Actingasadeterrenttopeoplemovingoffbenefitsintoworkbecauseofthe
disruption to their claim
If HB/CTB customers receive a prompt service from their local authority there are positive outcomes across a range of agendas specifically reducing the number of people living in poverty, reducing homelessness and supporting people into work. An indicator similar to this has helped to deliver significant improvements in recent years, but many customers still have to wait longer than five weeks for their claims to be decided.
This indicator is designed to ensure that local authorities deal promptly with both new claims to HB and CTB and changes of circumstances reported by customers receiving those benefits. The indicator supports DWP’s DSO 6 and is complemented by the Right Benefit indicator (165) which is designed to ensure that the benefit in payment is correct.
Definition The average time taken in calendar days to process all new claims and change events in Housing Benefit and Council Tax Benefit
New Claims: Any new claim to HB/CTB
Change Event: Notification of a change of circumstances which requires a decision to be made by the local authority but excluding automatic up-rating and annual council tax increases.
Time taken to process: The time elapsed between receipt of claim or notification of change event and a decision being recorded
Decision: As defined in HB and CTB regulations
Date of receipt: Date that notification of the claim or change event was received by the authority. Either from the customer, Jobcentre Plus or The Pensions Service or other third party.

76 National Indicators for Local Authorities and Local Authority Partnerships: Handbook of Definitions
NI 181: Time taken to process Housing Benefit/Council Tax Benefit new claims and change events (continued)
Formula
zy
xn
Where:
Σ xn = The total number of calendar days taken to process new claims and change events.
y = The number of new claims in the reporting period.
z = Number of change events in the reporting period.
Worked example
An authority processes 1,000 new claims and 2,000 changes in a quarter and these take 48,000 calendar days in total to process.
0.162000000,1
000,48days
Good performance
Good performance is typified by a lower average number of calendar days taken to process new claims and change events
Collection interval
Monthly Data Source Existing HB data extract returned to DWP by authorities on a monthly basis. The score is calculated by DWP.
Return Format Average number of calendar days
Decimal Places One
Reporting organisation
DWP
Spatial level Single tier and district council
Further Guidance
HB/CTB Performance Standards Guide
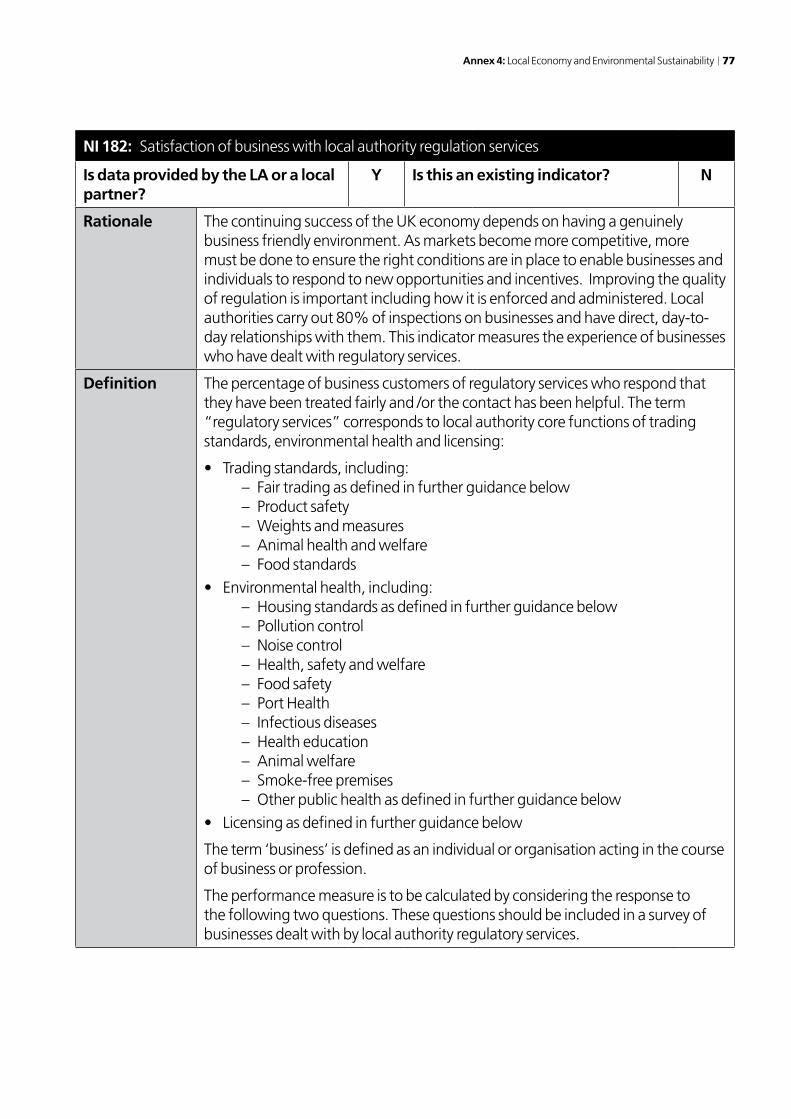
Annex 4: Local Economy and Environmental Sustainability 77
NI 182: Satisfaction of business with local authority regulation services
Is data provided by the LA or a local partner?
Y Is this an existing indicator? N
Rationale The continuing success of the UK economy depends on having a genuinely business friendly environment. As markets become more competitive, more must be done to ensure the right conditions are in place to enable businesses and individuals to respond to new opportunities and incentives. Improving the quality of regulation is important including how it is enforced and administered. Local authorities carry out 80% of inspections on businesses and have direct, day-to-day relationships with them. This indicator measures the experience of businesses who have dealt with regulatory services.
Definition The percentage of business customers of regulatory services who respond that they have been treated fairly and /or the contact has been helpful. The term “regulatory services” corresponds to local authority core functions of trading standards, environmental health and licensing:
• Tradingstandards,including:– Fair trading as defined in further guidance below– Product safety– Weights and measures– Animal health and welfare– Food standards
• Environmentalhealth,including:– Housing standards as defined in further guidance below– Pollution control– Noise control– Health, safety and welfare– Food safety– Port Health– Infectious diseases– Health education– Animal welfare– Smoke-free premises– Other public health as defined in further guidance below
• Licensingasdefinedinfurtherguidancebelow
The term ‘business’ is defined as an individual or organisation acting in the course of business or profession.
The performance measure is to be calculated by considering the response to the following two questions. These questions should be included in a survey of businesses dealt with by local authority regulatory services.

78 National Indicators for Local Authorities and Local Authority Partnerships: Handbook of Definitions
NI 182: Satisfaction of business with local authority regulation services (continued)
Definition (continued)
“Please indicate whether you agree or disagree with each of the following statements about your last contact with <regulatory services> <trading standards> <environmental health> <licensing>:
I felt my business was treated fairly.
Strongly agree. Agree. Neither agree nor disagree. Disagree. Strongly disagree. Not applicable.
I felt the contact was helpful.
Strongly agree. Agree. Neither agree nor disagree. Disagree. Strongly disagree. Not applicable.”
Each question has six response categories. These are: ‘strongly agree’, ‘agree’, ‘neither agree nor disagree’, ‘disagree’, ‘strongly disagree’ and ‘not applicable’.
The response categories are weighted. These are: a factor of 3 for ‘strongly agree’, a factor of 2 for ‘agree’, a factor of 1 for ‘neither agree nor disagree’ and a factor of 0 for ‘disagree’, ‘strongly disagree’ and ‘not applicable’.

Annex 4: Local Economy and Environmental Sustainability 79
NI 182: Satisfaction of business with local authority regulation services (continued)
Survey One return is required covering the functions of trading standards, environmental health or licensing that are relevant to the local authority rather than separate returns for each service or function.
Local authorities are free to add further questions in the survey that may reflect their specific needs and interests and enable them to analyse, for example, why a business has given the answer that it has. However, in order to ensure consistency, the required questions should be the first ones asked in the questionnaire. This helps to prevent the responses to the national question being affected by preceding questions which may be different for each local authority.
For those businesses whose details are held by the local authority on its database, it is recommended that the survey should be postal and undertaken on a monthly basis. Questionnaires should be sent to a sample of those businesses at the end of the month in which an officer representing regulatory services visited the premises or dealt with the business. The questionnaire can be sent with other correspondence, for example a follow-up letter or further information.
This means the interaction is fresh in the mind of the business. It means that any differences in approach to compliance and enforcement do not distort the returns, for example a campaign that results in a larger number of prosecutions affecting returns in a particular month. It also enables local authorities to monitor the returns throughout the year and address any issues arising.
Where local authorities use different survey methods, for example web-based surveys, or carry out their surveys at different frequencies, the annual return should explain this.
The survey should be sent to the person in charge of the premises visited, for example the manager of a store rather than its head office. An individual business or business premise should be sent a questionnaire no more than once a year by the local authority.
The sample should encompass a range of interactions and engagement between the officer and business that includes inspections and audits; verification and surveillance; sampling; test purchasing; advice and education; information gathering. It should not include signposting activity by the local authority, for example businesses that have been referred elsewhere for guidance or who have been sent generic material unless this is part of a visit or inspection by an officer.
The survey should be statistically sound and based on a stratified probability sample with the same sampling fraction in the two strata. This means that the sample is divided into two groups, or strata, with questionnaires being sent to the same proportion of businesses in each group. The two strata are:
Strata 1 Businesses where there is recorded non-compliance
Strata 2 Businesses where there is no recorded non-compliance
(For brevity in the document, strata 1 will be referred to as “Non-compliant” and strata 2 as “Compliant”).
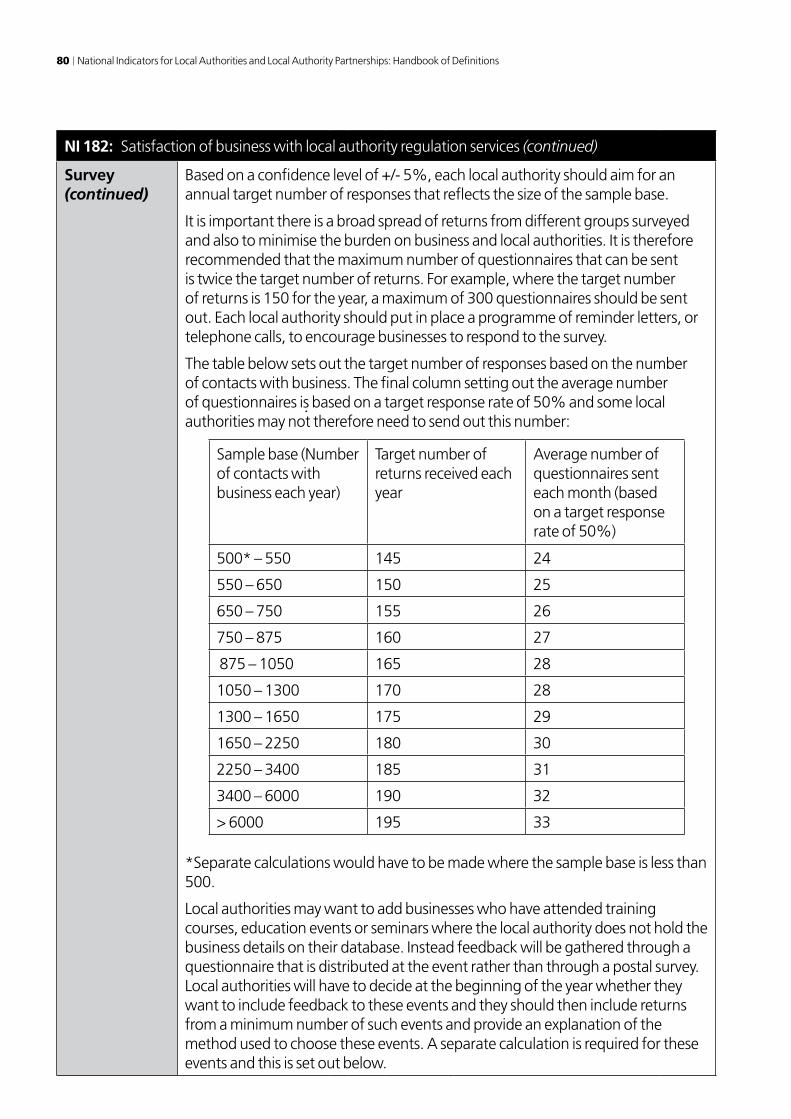
80 National Indicators for Local Authorities and Local Authority Partnerships: Handbook of Definitions
NI 182: Satisfaction of business with local authority regulation services (continued)
Survey (continued)
Based on a confidence level of +/- 5%, each local authority should aim for an annual target number of responses that reflects the size of the sample base.
It is important there is a broad spread of returns from different groups surveyed and also to minimise the burden on business and local authorities. It is therefore recommended that the maximum number of questionnaires that can be sent is twice the target number of returns. For example, where the target number of returns is 150 for the year, a maximum of 300 questionnaires should be sent out. Each local authority should put in place a programme of reminder letters, or telephone calls, to encourage businesses to respond to the survey.
The table below sets out the target number of responses based on the number of contacts with business. The final column setting out the average number of questionnaires is based on a target response rate of 50% and some local authorities may not therefore need to send out this number:
Sample base (Number of contacts with business each year)
Target number of returns received each year
Average number of questionnaires sent each month (based on a target response rate of 50%)
500* – 550 145 24
550 – 650 150 25
650 – 750 155 26
750 – 875 160 27
875 – 1050 165 28
1050 – 1300 170 28
1300 – 1650 175 29
1650 – 2250 180 30
2250 – 3400 185 31
3400 – 6000 190 32
> 6000 195 33
*Separate calculations would have to be made where the sample base is less than 500.
Local authorities may want to add businesses who have attended training courses, education events or seminars where the local authority does not hold the business details on their database. Instead feedback will be gathered through a questionnaire that is distributed at the event rather than through a postal survey. Local authorities will have to decide at the beginning of the year whether they want to include feedback to these events and they should then include returns from a minimum number of such events and provide an explanation of the method used to choose these events. A separate calculation is required for these events and this is set out below.

Annex 4: Local Economy and Environmental Sustainability 81
NI 182: Satisfaction of business with local authority regulation services (continued)
Formula For the postal survey, for each of the 4 combinations of the 2 questions and the 2 strata the following formula is calculated for surveys returned during the reporting year.
Standardised Score for each of the 4 combinations = Y
X*100
The 4 scores are designated below as Score 1 to Score 4.
Where for each combination:
X = weighted total number of respondents who strongly agree, agree or neither agree nor disagree. (Weights are “strongly agree” = 3, “agree” = 2, and “neither agree nor disagree” = 1. Other categories have a weight of zero.)
Y = the highest weighted score that can be achieved – ie the total number of respondents for whom the question was applicable multiplied by the weight for “strongly agree” which is 3. The denominator Y is defined so that the standardised score only takes values in the range 0% to 100%.
Score 1Non-compliant
Q1 “Fair”
Score 2Non-compliantQ2 “Helpful”
Score 3CompliantQ1 “Fair”
Score 4Compliant
Q2 “Helpful”
The overall standardised score equals the arithmetic mean of the 4 scores.
Standardised score = (score 1 + score 2 + score 3 + score 4)/4
The overall standardised score is rounded to the nearest whole number.

82 National Indicators for Local Authorities and Local Authority Partnerships: Handbook of Definitions
NI 182: Satisfaction of business with local authority regulation services (continued)
Worked example
Over the reporting year, 125 businesses responded to the survey, 50 in strata 1(Non-compliant) and 75 in strata 2 (Compliant). The results were as follows:
Calculation of the score for question 1 and strata 1 combination:
Strongly agree 4Agree 9Neither agree nor 18disagreeDisagree 11Strongly disagree 3Not applicable 5
The score would therefore be calculated:
Score 1 = Y
X *100
X = (4 *3)+(9*2)+(18*1)
(Where the number of respondents replying “strongly agree” is 4 and the weight for “strongly agree” is 3 etc.)
X = 48
Y = (50-5)*3 = 135
(Where the number of non-compliant businesses is 50, the number of non-compliant businesses answering “not applicable” is 5, and 3 is the maximum weight that can be applied to a respondent’s answer.)
Score 1 = (48/135) *100Score 1 = 0.356 * 100Score 1 = 35.6%
Good performance
Good performance is typified by a higher percentage standardised score.

Annex 4: Local Economy and Environmental Sustainability 83
NI 182: Satisfaction of business with local authority regulation services (continued)
Worked example (continued)
Suppose similar calculations for the other 3 scores give 64.7%, 42.2% and 66.7%
Standardised score = (35.6+42.2+64.7+66.7)/4 = 52.2 = 52% when rounded
Calculation VariantIf Local Authorities take the option of surveying the helpfulness of their training courses, education events or seminars then the score for these will be combined within Score 2 and/or Score 4.
The score for the training courses will be calculated in the same way as above.
If the score for the helpfulness of their training courses, education events or seminars for non-compliant businesses is calculated as 61.5% then the combined Score 2 would be (42.2%+61.5%)/2 = 51.9%.
Suppose a similar calculation for the combined Score 4 gives 71.6%
Good performance
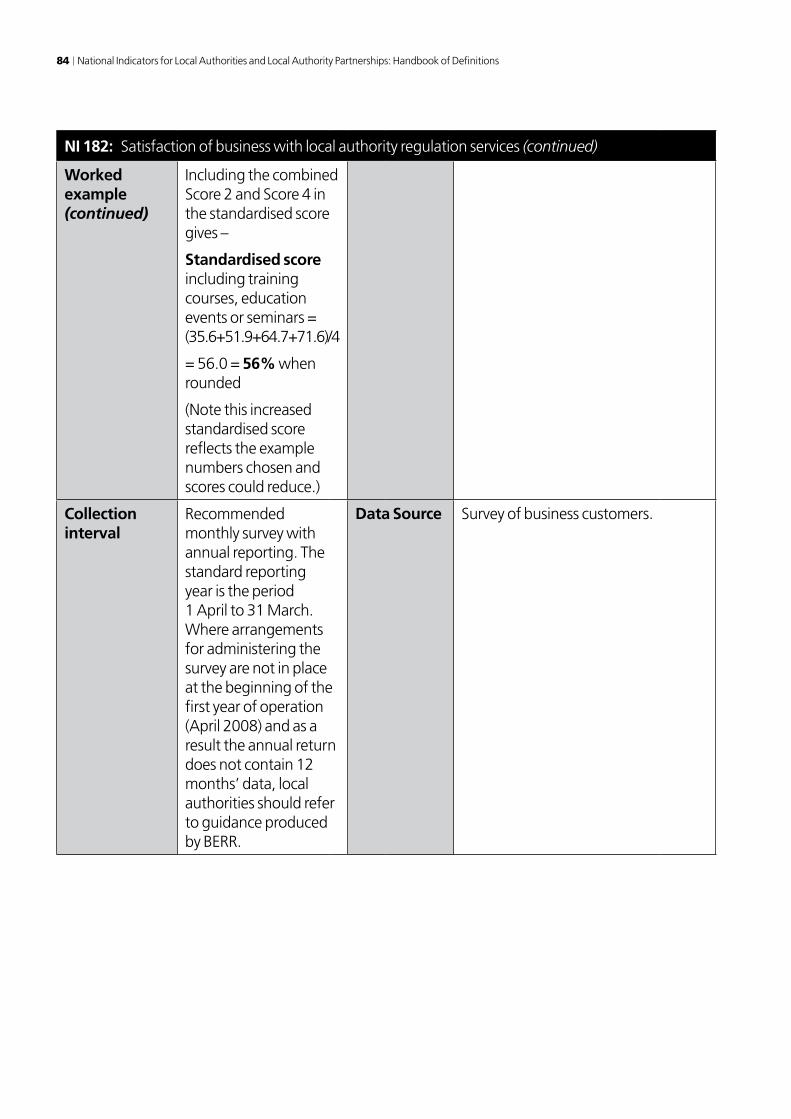
84 National Indicators for Local Authorities and Local Authority Partnerships: Handbook of Definitions
NI 182: Satisfaction of business with local authority regulation services (continued)
Worked example (continued)
Including the combined Score 2 and Score 4 in the standardised score gives –
Standardised score including training courses, education events or seminars = (35.6+51.9+64.7+71.6)/4
= 56.0 = 56% when rounded
(Note this increased standardised score reflects the example numbers chosen and scores could reduce.)
Collection interval
Recommended monthly survey with annual reporting. The standard reporting year is the period 1 April to 31 March. Where arrangements for administering the survey are not in place at the beginning of the first year of operation (April 2008) and as a result the annual return does not contain 12 months’ data, local authorities should refer to guidance produced by BERR.
Data Source Survey of business customers.

Annex 4: Local Economy and Environmental Sustainability 85
NI 182: Satisfaction of business with local authority regulation services (continued)
Return Format Percentage (NI 182)
Additional required data:
• Functionscoveredby the survey, ie trading standards, environmental health, licensing (NI 182a)
• Numberofquestionnaires sent in each strata (NI 182 bi & NI 182bii)
• Numberofreturnsineach strata (NI 182 ci & NI 182cii)
• Anyvariationsfromthe recommended survey methodology, including postal, frequency & training courses (NI 182d)
Decimal Places
Zero
Reporting organisation
Local Authority
Spatial level Metropolitan Authorities, London Boroughs, Unitary Authorities, County Councils, Council of the Isles of Scilly, District Councils, Common Council of the City of London.

86 National Indicators for Local Authorities and Local Authority Partnerships: Handbook of Definitions
NI 182: Satisfaction of business with local authority regulation services (continued)
Further Guidance
1. Local authorities should use the LACORS’ definition of “fair trading”. Currently this includes: trade descriptions; environmental packaging/labelling; consumer advice/education; sale and supply of goods; credit; pricing; property; travel; distance selling; unfair contract terms; hallmarking; Olympics (branding/ labelling issues); intellectual property; video recording; scams; doorstep crime; e-commerce; TV/telecoms; unsolicited goods & services; mock auctions; underage sales.
Specifically, this definition does not include product safety; food safety; animal health; metrology or petroleum/explosives.
2. Housing standards includes private sector landlords.
3. Licensing includes alcohol and gambling, petroleum and explosives, private hire vehicles and taxis.
4. Other public health includes pest control and nuisance.
5. Technical guidance on local authority surveys can be found at –
“Best Value and Audit Commission Performance Indicators for 2000/2001 Volume I – User Satisfaction Performance Indicators: Guidance on Methods of Data Collection” (DETR, April 2000) –
http://www.communities.gov.uk/documents/localgovernment/doc/145998.doc
http://www.communities.gov.uk/localgovernment/localregional/servicedelivery/usersatisfaction/
Page 34 of the DETR (2000) Best Value and Audit Commission Performance Indicators for 2000/2001 Volume I – User Satisfaction Performance Indicators: Guidance on Methods of Data Collection includes the paragraph below which explains how stratified sampling can be applied to this survey.
For a sample of businesses who have dealt with a regulatory service please replace PAF or electoral register for ‘list/register/database of businesses who have dealt with a regulatory service’.

Annex 4: Local Economy and Environmental Sustainability 87
NI 182: Satisfaction of business with local authority regulation services (continued)
Further Guidance (continued)
The characteristics known by which the Local Authority will want to stratify will be:
Strata 1 Businesses where there is recorded non-compliance
Strata 2 Businesses where there is no recorded non-compliance
Stratified sampling: stratification can be done when the researcher knows before hand some of the characteristics of the people (or households) in the sampling frame. For example, from the PAF (post code address file) the researcher would know the ward within which the household is, also from the electoral register the researcher would know the street or ward where the person lives, in some cases, even the gender if the electoral register has been kept adequately. When such characteristics are known before drawing the sample they can be used to structure the sampling frame list. This would reduce the sampling variation, producing a sample that is more likely to reflect the total population.
For example, an authority wants to carry out a face to face survey using the PAF. Using the previous example, the PAF list would have the 100,000 addresses, these could then be organised by ward, then the same systematic sample fraction can be used (1/50) which would ensure that the sample of 2,000 will end up with some households from each of the wards (unless any of the wards have less than 50 addresses in them). Thus enhancing the possibility of making the resulting sample more representative of the local authority and giving the researcher more control over the representativeness of the sample. (See appendix 4 for an example of a stratified sample)
6. Other support material, including a spreadsheet setting out the calculation in full, is available on: http://bre.berr.gov.uk/regulation/reform/local/

88 National Indicators for Local Authorities and Local Authority Partnerships: Handbook of Definitions
NI 183: Impact of local authority trading standards services on the fair trading environment
Is data provided by the LA or a local partner?
Y Is this an existing indicator? N
Rationale The indicator measures outcomes of activities carried out by local authorities in order to create /maintain a fair trading environment for business and consumers. Activities include enforcement action to remedy unfair trading practices and education and awareness-raising through provision of advice and assistance to consumers and business, by local authorities (Trading Standards Services).
This action by local authorities contributes to the national objectives of creating the right conditions for business to succeed. For example, targeting problem traders increases confidence in markets and provides a level playing field for business to compete fairly. Increasing consumer confidence and knowledge empowers consumers as citizens and encourages business to innovate.
The measure underpins an intelligence-led approach, including through the implementation of the National Intelligence Model in Trading Standards Services. Measurement will allow a strategic assessment of how well markets are working for consumers and fair trading business and where more needs to be done.
Definition In essence, the performance indicator measures the number of significant issues that a Local Authority Trading Standards Service is called upon to deal with; less the number that it is actually able to deal with; scaled against a measure of the extent of trading activity within the Local Authority area.
This can be further defined as:
“The number of primary complaints of unfair trading practices recorded by Consumer Direct (CD) against businesses in each Local Authority (this includes notifications and referrals), where no judicial disposal or onward formal referral is achieved. For the purpose of this indicator unfair trading practices constitute any complaint recorded by CD. This Is then scaled against the number of businesses registered for VAT or PAYE in the area”
Key Terms:
Reporting yearThe reporting period is the financial year (1 April – 31 March).
Primary Complaints of Unfair trading practices
Primary Complaints (i.e. first contact) of unfair trading practices are categorised and recorded nationally on the CD database. For the purposes of this measure, it is not relevant whether the complaint is considered justified or unjustified.
A ‘category x’ trader is defined as a trader in a Local Authority’s area whom, via CD, generates at least the national threshold number of complaints per business in the reporting year.
The national threshold will be specified in guidance produced by OFT.
Where a trader operates from a single business premises under multiple trading names, that counts as one business and the number of complaints about that business are aggregated for the different trading names.

Annex 4: Local Economy and Environmental Sustainability 89
NI 183: Impact of local authority trading standards services on the fair trading environment (continued)
Definition (continued)
Primary/Home Authority referrals to and from the Local Authority
A ‘category RIN’ trader is defined as a trader operating within a Local Authority, that has generated at least the threshold number of complaints within the reporting year and has therefore become a category x trader, and is then received – under formal agreement and via a formal referral process – by a Primary/Home Authority1 to be dealt with. For the purpose of the indicator ‘category RIN’traders will count as part of the total of the receiving authority’s number performance measure.
A ‘category ROUT ‘ trader is defined as a trader operating in a Local Authority, that generates at least the threshold number of complaints within the reporting year, but is formally referred to a Primary/Home Authority – under formal agreement and via a formal referral process – to be dealt with. For the purpose of the indicator a category ROUT , which has been formally referred to another authority will be deducted from the annual count of an authority.
The performance indicator will assess the extent of incoming issues requiring attention by combining the ‘category x’ businesses with the ‘category RIN’ businesses. ‘category ROUT ‘ businesses will be removed from the referring authority’s total as they will count in the receiving authority’s count.
A formal referral will be defined in guidance, but would exclude simple requests for information, referrals for information only and referrals where no action is required.
The formal referral must relate to a business that has reached the threshold number of complaints, but does not necessarily have to relate to a single issue complained about.
The date of the formal referral must be within the reporting year and, once recorded, the number of complaints/referrals about that business starts again from zero. Thus it is possible for the same business to reach the threshold number of complaints more than once in a year if formal referral is achieved and complaints/referrals continue to come in. However, it is equally the case that further formal referrals may be achieved – perhaps through escalating to the next stage.
The list of relevant authorities that can make referrals will be defined in guidance, but would include other Local Authority Trading Standards Services.
1 A Primary/Home Authority is a nominated authority that deals with businesses – often large multi site operations, whose head office is located within the Primary Authority – that operates across council boundaries. The aim of the Primary Authority Principle is to guide other local authorities in their interaction with the business, improving overall consistency.

90 National Indicators for Local Authorities and Local Authority Partnerships: Handbook of Definitions
NI 183: Impact of local authority trading standards services on the fair trading environment (continued)
Definition (continued)
Judicial Disposal
A judicial disposal is achieved either where the business voluntarily agrees to a course of action, which is formally recorded, or where formal enforcement action is taken.
The judicial disposal must relate to the business that reaches the threshold number of complaints but does not necessarily have to relate to the issue complained about or referred.
For the purposes of this template, a business that is subject to judicial disposal will be termed a ‘category J’ business.
Judicial disposal will be defined in guidance but will include: Prosecution, Simple or Conditional Caution, Voluntary Undertaking under Enterprise Act 2002, Injunction, Penalty Notice, action under Part 2 of the Regulatory Enforcement and Sanctions Act 2008, a notice under the General Product Safety Regulations, formal notice under Weights and Measures Act 1985 or Food Safety Act 1990, seizure and forfeiture/voluntary surrender.
The date of the judicial disposal must be within the reporting year and, once recorded, the number of complaints/referrals about that business starts again from zero. Thus it is possible for the same business to trigger the measure more than once in a year if judicial disposal is achieved and complaints/referrals continue to come in. It is equally the case that further judicial disposals may be achieved – perhaps through escalating to the next stage.
Issues that have received the Authority’s attention
The performance indicator will assess the number of business where incoming issues requiring attention have been dealt with by combining the ‘category J’ businesses with the ‘category ROUT’ businesses.
Businesses
The number of VAT or PAYE registered business close to the start of the reporting year. This figure is derived by ONS from the Interdepartmental Business Register (IDBR).
For the purposes of this template, a VAT or PAYE registered business will be termed a ‘category B’ business. (NOTE: It is not necessarily the case that the business being complained about or referred is VAT or PAYE registered, this factor is merely to give scalability to the extent of trading activity in the local authority area).
Formula The performance measure will be calculated by:
((X+ RIN) – (J+ ROUT)) x 100
B

Annex 4: Local Economy and Environmental Sustainability 91
NI 183: Impact of local authority trading standards services on the fair trading environment (continued)
Worked example
Local authority ‘A’ has 6,100 VAT or PAYE registered businesses within it (B).
During the year 2006/07, 227 traders reach the set threshold number of complaints in local authority A – based on complaint referrals from CD.
Of the 227 ‘category x’ traders, local authority A was able to undertake judicial disposal against 12 (J).
A further 20 cases were formally referred to other authorities (ROUT) and 6 were received as referrals from other authorities (RIN).
Therefore, for the year 2006/07 201 traders within local authority A are ‘category x’ traders where judicial disposal or formal referral on to the Primary/Home Authority has not been achieved (X+ RIN.) – (J+ ROUT).
For scalability this number is divided by the number of VAT or PAYE registered businesses in local authority A (B) to provide a figure of 3.29%.
Good performance
The percentage result gives an indication of the impact of TSS on the local fair trading environment. An increase in the percentage indicates diminishing performance, a decrease in the percentage indicates improved performance2.
2 In order to take into account any increase in public awareness of the CD service – that may potentially lead to future increases in the number of category x businesses – but which does not reflect local performance, it is proposed that results should be considered relative to the regional averages. This is due to the fact that CD is promoted and managed on a regional basis.
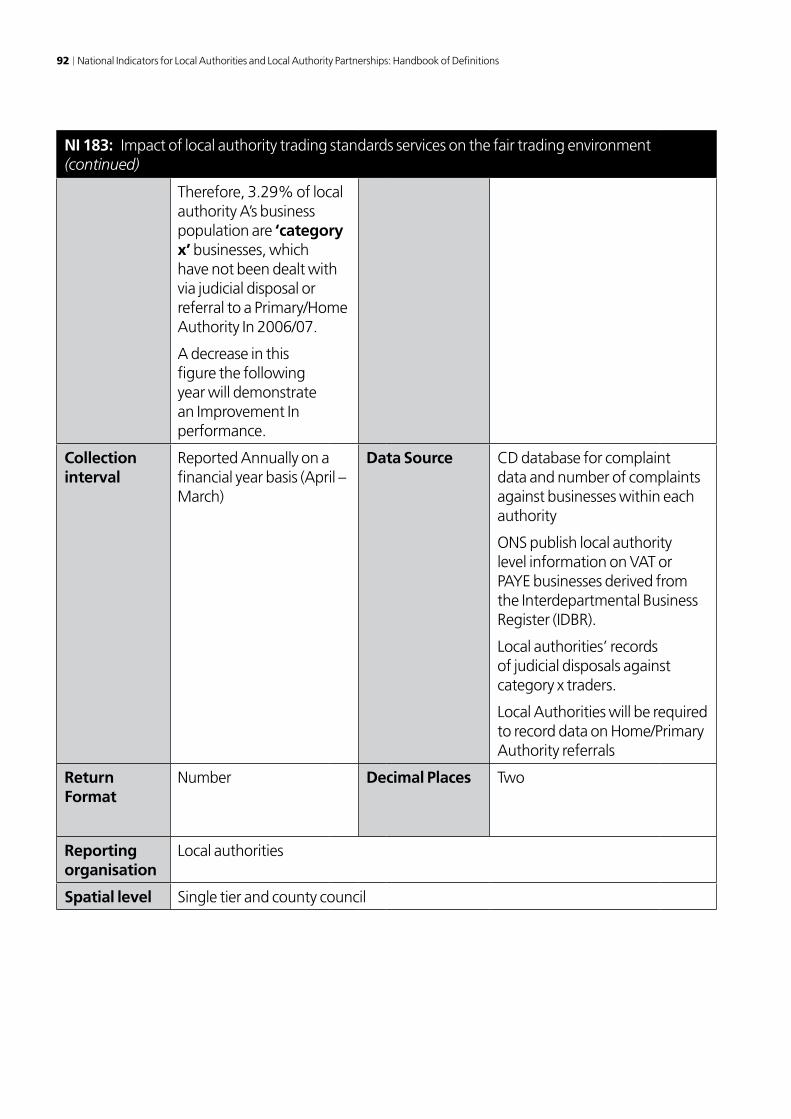
92 National Indicators for Local Authorities and Local Authority Partnerships: Handbook of Definitions
NI 183: Impact of local authority trading standards services on the fair trading environment (continued)
Therefore, 3.29% of local authority A’s business population are ‘category x’ businesses, which have not been dealt with via judicial disposal or referral to a Primary/Home Authority In 2006/07.
A decrease in this figure the following year will demonstrate an Improvement In performance.
Collection interval
Reported Annually on a financial year basis (April – March)
Data Source CD database for complaint data and number of complaints against businesses within each authority
ONS publish local authority level information on VAT or PAYE businesses derived from the Interdepartmental Business Register (IDBR).
Local authorities’ records of judicial disposals against category x traders.
Local Authorities will be required to record data on Home/Primary Authority referrals
Return Format
Number Decimal Places Two
Reporting organisation
Local authorities
Spatial level Single tier and county council

Annex 4: Local Economy and Environmental Sustainability 93
NI 183: Impact of local authority trading standards services on the fair trading environment (continued)
Further Guidance
Local authorities will obtain data from Consumer Direct Database. This will provide totals of category x traders for each authority. Further guidance on this will be produced by 1st April 2008.
VAT/PAYE registered businesses is a new measure of business demographics that will require access to the Inter Departmental Business Register (IDBR). Because of the complications around accessing the IDBR, this data will be drawn by central government on behalf of all local authorities. This will be provided to local authorities to enable them to perform the calculation.
More information on the IDBR:
http://www.statistics.gov.uk/idbr/idbr.asp
TSS will be required to keep a record of judicial disposals relating to category x traders (judicial disposal information is already required to be recorded).
TSS will be required to record the number of Primary/Home Authority referrals (RIN and Rout) relating to category X businesses. Guidance on this will be produced by OFT – in consultation with LBRO – by 1st April 2008.
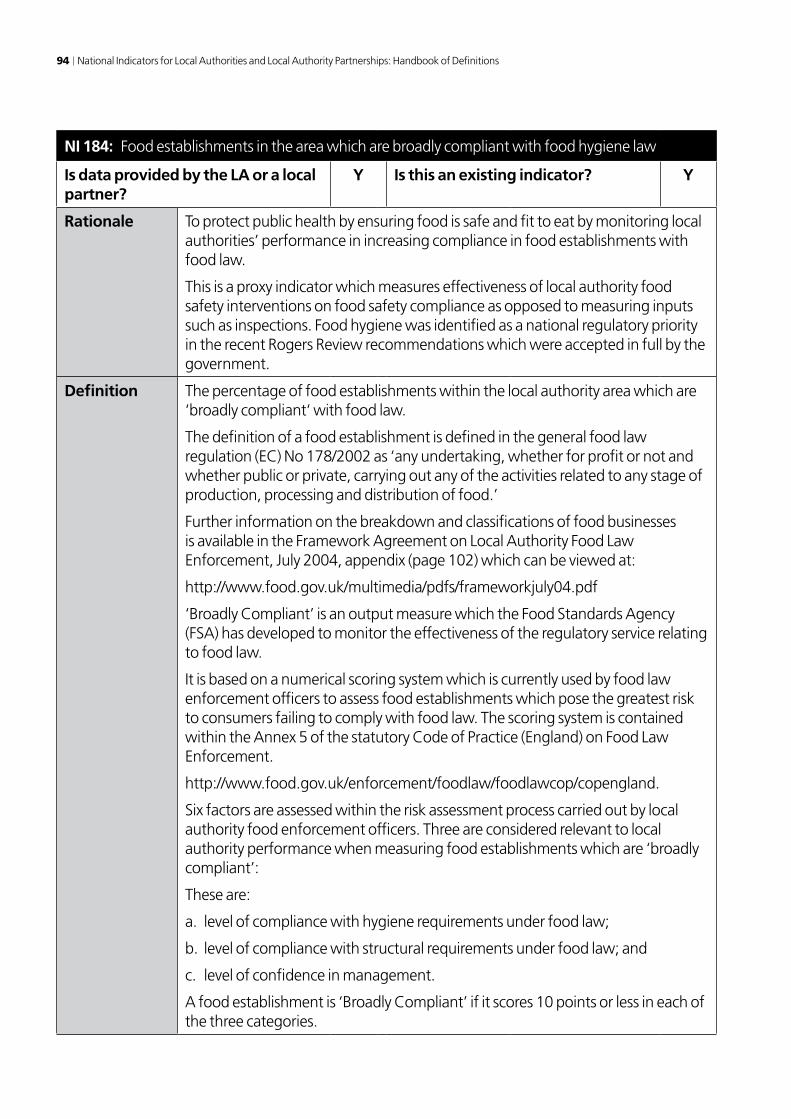
94 National Indicators for Local Authorities and Local Authority Partnerships: Handbook of Definitions
NI 184: Food establishments in the area which are broadly compliant with food hygiene law
Is data provided by the LA or a local partner?
Y Is this an existing indicator? Y
Rationale To protect public health by ensuring food is safe and fit to eat by monitoring local authorities’ performance in increasing compliance in food establishments with food law.
This is a proxy indicator which measures effectiveness of local authority food safety interventions on food safety compliance as opposed to measuring inputs such as inspections. Food hygiene was identified as a national regulatory priority in the recent Rogers Review recommendations which were accepted in full by the government.
Definition The percentage of food establishments within the local authority area which are ‘broadly compliant‘ with food law.
The definition of a food establishment is defined in the general food law regulation (EC) No 178/2002 as ‘any undertaking, whether for profit or not and whether public or private, carrying out any of the activities related to any stage of production, processing and distribution of food.’
Further information on the breakdown and classifications of food businesses is available in the Framework Agreement on Local Authority Food Law Enforcement, July 2004, appendix (page 102) which can be viewed at:
http://www.food.gov.uk/multimedia/pdfs/frameworkjuly04.pdf
‘Broadly Compliant’ is an output measure which the Food Standards Agency (FSA) has developed to monitor the effectiveness of the regulatory service relating to food law.
It is based on a numerical scoring system which is currently used by food law enforcement officers to assess food establishments which pose the greatest risk to consumers failing to comply with food law. The scoring system is contained within the Annex 5 of the statutory Code of Practice (England) on Food Law Enforcement.
http://www.food.gov.uk/enforcement/foodlaw/foodlawcop/copengland.
Six factors are assessed within the risk assessment process carried out by local authority food enforcement officers. Three are considered relevant to local authority performance when measuring food establishments which are ‘broadly compliant’:
These are:
a. level of compliance with hygiene requirements under food law;
b. level of compliance with structural requirements under food law; and
c. level of confidence in management.
A food establishment is ‘Broadly Compliant’ if it scores 10 points or less in each of the three categories.

Annex 4: Local Economy and Environmental Sustainability 95
NI 184: Food establishments in the area which are broadly compliant with food hygiene law (continued)
Formula The numerator, X, is the number of food establishments within the local authority area deemed to be ‘Broadly Compliant’.
The denominator, Y, is the total number of food establishments
NB. for both the numerator and denominator, the total number of food establishments refers to the total number of food establishments for which the Authority is responsible, not just those which received an intervention in the year.
Calculate the percentage which are broadly compliant:
100*y
x
Worked example
If the total number of food establishments, X =800, and
the total number of food establishments found to be ‘broadly compliant’, Y = 600, then
(X/Y)*100=
(600/800)*100 =75%
of premises are broadly compliant.
Good performance
Good performance will be demonstrated by higher percentages of food establishments deemed to be “Broadly Compliant”.
Collection interval
Annual (financial year) Data Source LA data transferred electronically to the Food Standards Agency database
Return Format Number (number of food establishments and number of and broadly compliant establishments)
Decimal Places None
Reporting organisation
The Food Standards Agency will calculate the indicator values based on LA returns, and provide to the data interchange hub.
Spatial level Single tier and district councils
Further Guidance
• Annex5,FoodLaw,CodeofPractice
• TheFrameworkAgreementonLocalAuthorityFoodLawenforcement.
Both documents are available on the FSA website at http://www.food.gov.uk/enforcement/foodlaw/

96 National Indicators for Local Authorities and Local Authority Partnerships: Handbook of Definitions
NI 185: CO2 reduction from local authority operations
Is data provided by the LA or a local partner?
Y Is this an existing indicator? N
Rationale Action by local authorities is likely to be critical to the achievement of Government’s climate change objectives. The public sector is in a key position to lead on CO2 emissions reduction by setting a behavioural and strategic example to the private sector and the communities they serve. The manner in which the local authority delivers its functions can achieve CO2 emissions reductions.
The aim of this indicator is to measure the progress of local authorities to reduce CO2 emissions from the relevant buildings and transport used to deliver its functions and to encourage them to demonstrate leadership on tackling climate change.
Measurement against this indicator will require each LA to calculate their CO2 emissions from analysis of the energy and fuel use in their relevant buildings and transport, including where these services have been outsourced. The Carbon Trust currently provides support to LAs to guide them through the process of calculating carbon footprints and to help them develop carbon reduction plans.
Definition Percentage CO2 reduction from LA operations:
The indicator being assessed will be a year on year measured reduction of CO2 emissions. First year data to be reported in 2009, will be for Jan-Dec 2008.
CO2 emissions: is the total amount of direct and indirect CO2 emitted as a result of LA operations.
• Directemissionsareemissionsfromsourcesthatareownedorcontrolledbythe local authority e.g. emissions from the combustion in owned or controlled boilers and vehicles.
• Indirectemissionsareemissionsthatareaconsequenceoftheactivitiesofthelocal authority, but occur at sources owned or controlled by another entity e.g. emissions from consumption of purchased electricity or heat, transport-related activities in vehicles not owned or controlled by the local authority and outsourced activities.
LA Operations: The delivery of the relevant functions of a Local Authority which result (either directly or indirectly) in the emissions of CO2 into the atmosphere. Functions of an authority covers all their own operations and outsourced services. Even if the services are being provided by an external body (e.g. a private company) they remain the function of the authority. This is to include schools, but exclude social housing.

Annex 4: Local Economy and Environmental Sustainability 97
NI 185: CO2 reduction from local authority operations (continued)
Formula The indicator is proportion of CO2 reduction measured against emissions from the previous year, calculated as follows:
100*⎟⎟⎠
⎞⎜⎜⎝
⎛ −
yxy
where:
x = amount of CO2 emission in the current year
y = amount of CO2 emission in the previous year
Return a percentage reduction figure (to 1 decimal place) for the last reported year compared to the previous year.
Worked example
Take January to December 2008 calculated emissions of 52 tonnes CO2. January 2009 to December 2009 emissions totalled 50 tonnes CO2. Therefore the percentage of CO2 reduction from LA operations to be reported for 2009 =
%8.3100*52
5052=⎟
⎠
⎞⎜⎝
⎛ −
Good performance
Year on year % reduction
Collection interval
Annual – calendar year from Jan-Dec 2008
Data Source Data to be provided by Local Authority using spreadsheet tool (published on the Defra website)
Return Format Annual % CO2 rreduction figure and total tonnage as calculated using agreed spreadsheet methodology
Decimal Places One
Reporting organisation
Local authority to report direct to Defra, using the Excel spreadsheet tool.
Spatial level Single tier, district and county council
Further Guidance
Carbon Trust offers advice to Local Authorities on managing their own operations. http://www.carbontrust.co.uk/default.ct.
The analysis to support this indicator, the proposed spreadsheet tool and an FAQ can be found at:
http://www.defra.gov.uk/environment/climatechange/uk/publicsector/localauth/index.htm

98 National Indicators for Local Authorities and Local Authority Partnerships: Handbook of Definitions
NI 186: Per capita reduction in CO2 emissions in the LA area
Is data provided by the LA or a local partner?
N Is this an existing indicator? N
Rationale Action by local authorities is likely to be critical to the achievement of Government’s climate change objectives. Local authorities are uniquely placed to provide vision and leadership to local communities by raising awareness and to influence behaviours. In addition, through their powers and responsibilities (housing, planning, local transport and powers to promote well-being) and by working with their Local Strategic Partnership they can have significant influence over emissions in their local areas.
In the Climate Change Programme 2006, the Government stated its commitment to ensure the local Government framework will include an appropriate focus on action on climate change, sufficient to incentivise more authorities to reach the levels of the best. The Government also committed to give greater flexibility to deliver on national priorities in the most cost effective way for that locality.
The proposed indicator will rely on centrally produced statistics to measure end user CO2 emissions in the Local Area from:
• BusinessandPublicSector,• Domestichousing,and• RoadtransportThis data is already captured and analysed to produce area by area carbon emissions per capita. Analysis carried out by AEA Energy and Environment has confirmed that the data available for the construction of this local area Climate Change Indicator are sufficiently robust with relatively low levels of uncertainty.
The percentage reduction in CO2 per capita in each LA will be reported annually. The statistics for 2005, the most recent data available, will be used as the baseline.
UK Government statisticians currently classify the data as experimental statistics. However, Defra is developing a work programme to obtain classification of the data as a full National Statistic from November 2008. The National Statistics published in 2008 will comprise of the 2006 data which will be compared to the 2005 baseline year.

Annex 4: Local Economy and Environmental Sustainability 99
NI 186: Per capita reduction in CO2 emissions in the LA area (continued)
Definition Percentage reduction of the per capita CO2 emissions in the Local Authority Area: The indicator being assessed will comprise of an annual amount of end user CO2 emissions across an agreed set of sectors (housing, road transport and business) measured as a percentage reduction (or increase) of the per capita CO2 emission from the 2005 baseline year.
End user: calculations allocate emissions from fuel producers to fuel users. The end user calculation therefore allows estimates to be made of emissions for a consumer of fuel, which also include the emissions from producing the fuel the consumer has used.
Domestic Housing: All housing in the local authority area, including Arms Length Management Organisation (ALMOs), privately owned and leased housing
Business: Industry and commercial emissions, including public sector, but not those included in the EU Emissions trading scheme
Road Traffic: All road traffic, (but excluding motorways)
Formula The indicator measures the percentage reduction in per capita CO2 emissions, as follows:
100*
t
ttt
nt
ntntnt
t
ttt
pop
rbh
pop
rbh
pop
rbh
where:
h = tonnes CO2 from domestic housing, calculated from BERR electricity and gas consumption data;
b = tonnes CO2 from business and industry, calculated from BERR electricity and gas consumption data and those fuel usage statistics reported by larger organisations;
r = tonnes CO2 from road transport calculated using detailed specific transport census data (annual average daily flows) published by DfT;
pop = LA population (thousands) calculated using the ONS mid year population projection (from the same year as the CO2 data).
t = baseline year (2005);
t+n = latest year of data

100 National Indicators for Local Authorities and Local Authority Partnerships: Handbook of Definitions
NI 186: Per capita reduction in CO2 emissions in the LA area (continued)
Worked example
2005 emissions for Low Carbon CityBusiness = 90 k.t CO2
Housing = 91k.t CO2
Transport = 124 k.t CO2
LA Population = 31 (thousands)Total emissions (tonnes) per capita = 9.8
2006 emissions for Low Carbon CityBusiness = 89 k.t CO2
Housing = 85 k.t CO2
Transport = 115 k.t CO2
Population = 32 (thousands)
Total emissions (tonnes) per capita = 9.0
100*
311249190
32
1158589
31
1249190
= 8.2% per capita reduction in CO2 emissions in the Local Authority Area in 2006
Good performance
Good performance is typified by an increasing year on year percentage reduction in CO2 per capita. (i.e. if it is compared to the same baseline, then as well as seeing a decrease, the size of the decrease should get bigger each year)
Collection interval
Statistics are produced annually by Defra Data Source Defra publication of local CO2 emissions every Autumn. http://www.defra.gov.uk/environment/statistics/globatmos/galocalghg.htm
Return Format Spreadsheet produced to include total end user CO2 emission (tonnes) per Local Authority presented by sector with the overall percentage reduction of CO2 per capita compared with 2005 baseline.
Decimal Places
One
Reporting organisation
Defra

Annex 4: Local Economy and Environmental Sustainability 101
NI 186: Per capita reduction in CO2 emissions in the LA area (continued)
Spatial level Single tier, district and county council
Further Guidance
The 2005 data is available on the Defra website at: http://www.defra.gov.uk/environment/statistics/globatmos/galocalghg.htm
The analysis to support this indicator, projections for savings from 2005 to 2010, and an FAQ on the dataset can be found at: http://www.defra.gov.uk/environment/localgovindicators/cc-indicators.htm
Projections of potential local area reductions (by 2010), compared to 2005 base year, which have been produced by AEA Technology reduction compared to 2005 are also published on the Defra website.
The Government is continually working to improve the time taken to carry out the full disagreggation of CO2 statistics to local authority area level. The 2006 data is expected to be published by the end of the summer 2008 at least 2 months earlier than the 2005 data. We will continue to improve the timeliness of the production of the data with the aim of making further improvements over the course of the next 3 years.

102 National Indicators for Local Authorities and Local Authority Partnerships: Handbook of Definitions
NI 187: Tackling fuel poverty – % of people receiving income based benefits living in homes with a low energy efficiency rating
Is data provided by the LA or a local partner?
Y Is this an existing indicator? N
Rationale To measure progress in tackling fuel poverty through the improved energy efficiency of households inhabited by people claiming income based benefits.
Definition The indicator measures the proportion of households on income related benefits for whom an energy assessment of their housing has been carried out, living in homes with
(i) Low energy efficiency (ii) High energy efficiencyThe energy efficiency of a house can be measured using the Standard Assessment Procedure (SAP). The procedure calculates a number between 1 and 100, low numbers generally indicate a house that has low levels of insulation and an inefficient heating system whereas numbers closer to 100 indicate a very energy efficient house. SAP is the Government’s recommended system for energy rating of dwellings.
SAP is being used as a proxy for fuel poverty in households of people claiming income based benefits, given the link between income poverty and fuel poverty.
Low energy efficiency
A SAP rating of less than 35
High energy efficiency
A SAP rating of 65 or more.
Fuel poverty is the requirement to spend more than 10% of household income to maintain an adequate level or warmth and includes non-heating fuel use.
Adequate level of warmth follows World Health Organisation (WHO) guidelines of 21˚C in main living areas and 18˚C in other areas. A full definition of fuel poverty is available in the Fuel Poverty Strategy (http://www.berr.gov.uk/files/file16495.pdf).
Income based benefits – the sub-population claiming income related benefits includes all people claiming at least one of the following; Income Support, Council Tax Benefit, Housing Benefit, Income based Job Seekers Allowance, Pension Credit or Tax Credits (with an income below a certain threshold). Include all households which include someone claiming one of the above.
Housing – all households in both private and social sectors.
The survey is based on an annual, random sample SAP survey of households inhabited by people claiming income based benefits. Further guidance on conducting the survey is available at: www.defra.gov.uk/environment/localgovindicators/index.htm

Annex 4: Local Economy and Environmental Sustainability 103
NI 187: Tackling fuel poverty – % of people receiving income based benefits living in homes with a low energy efficiency rating (continued)
Formula100*
y
x
Where:
x = number of households assessed who meet the standard (e.g., a SAP rating of below 35);
y = number of households on income related benefits for whom a SAP assessment has been carried out.
Also to measure the proportion of households on income related benefit for whom an energy assessment of their home has been carried out, and whose SAP rating meets the standard of 65 or above.
100*y
x
Where:
x = number of households assessed who meet the standard (a SAP rating of 65 or above).
y = number of households on income related benefits for whom a SAP assessment has been carried out.

104 National Indicators for Local Authorities and Local Authority Partnerships: Handbook of Definitions
NI 187: Tackling fuel poverty – % of people receiving income based benefits living in homes with a low energy efficiency rating (continued)
Worked example
Of 1,500 households sampled, 500 reported in receipt of income benefits.
Of those, 100 also reported a SAP rating of below 35, and 50 reported a SAP rating of 65 or above.
Therefore the proportion of households in receipt of income benefits and a low energy efficiency =
%20100*500
100
And the proportion of households in receipt of income benefits and a high energy efficiency =
%10100*50050
=⎟⎠
⎞⎜⎝
⎛
Good performance
Good performance is shown over time by a reduction in the proportion of households with a SAP below 35 and an increase in the proportion of households with a SAP of 65 or greater.
Collection interval
Annual (Financial year).
Done as a desktop exercise following completion of all surveys as part of a desk top exercise at the LA.
Data Source Local House Condition Survey and telephone/postal SAP survey results targeted at households in receipt of income related benefits.
Return Format Percentage Decimal Places Zero
Reporting organisation
Local authority
Spatial level Single tier and district council
Further Guidance
Further guidance for this indicator is available at: www.defra.gov.uk/environment/localgovindicators/index.htm.
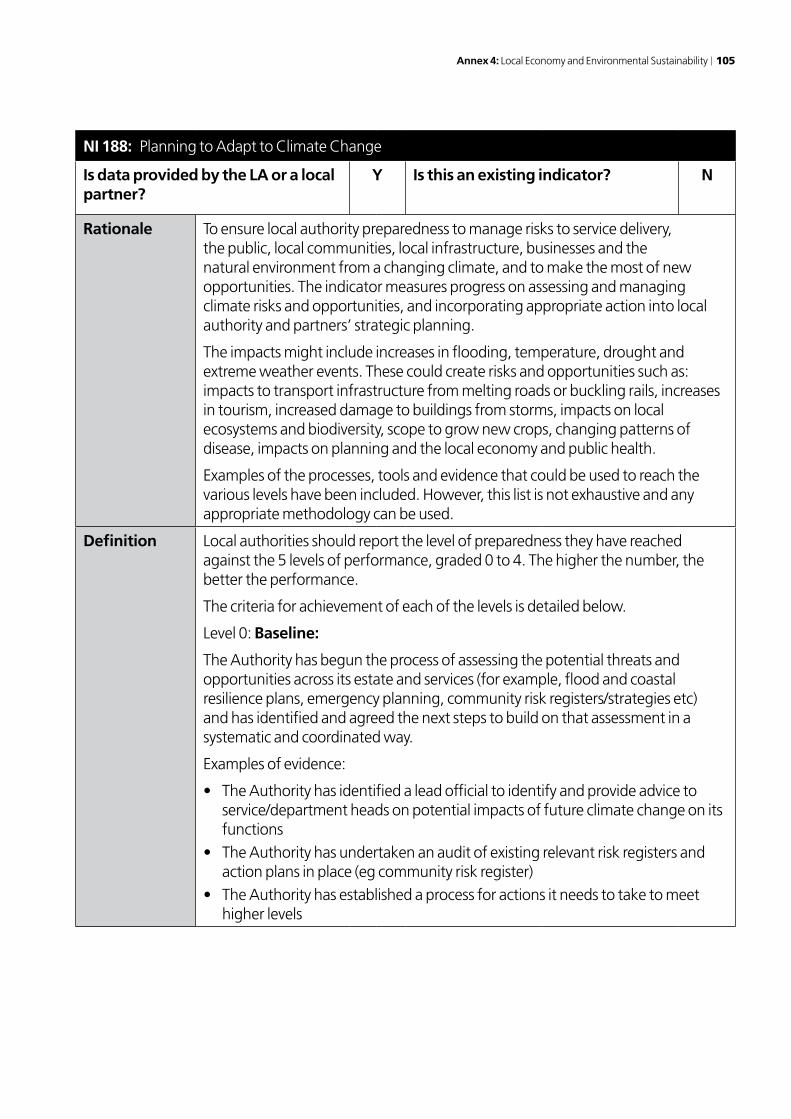
Annex 4: Local Economy and Environmental Sustainability 105
NI 188: Planning to Adapt to Climate Change
Is data provided by the LA or a local partner?
Y Is this an existing indicator? N
Rationale To ensure local authority preparedness to manage risks to service delivery, the public, local communities, local infrastructure, businesses and the natural environment from a changing climate, and to make the most of new opportunities. The indicator measures progress on assessing and managing climate risks and opportunities, and incorporating appropriate action into local authority and partners’ strategic planning.
The impacts might include increases in flooding, temperature, drought and extreme weather events. These could create risks and opportunities such as: impacts to transport infrastructure from melting roads or buckling rails, increases in tourism, increased damage to buildings from storms, impacts on local ecosystems and biodiversity, scope to grow new crops, changing patterns of disease, impacts on planning and the local economy and public health.
Examples of the processes, tools and evidence that could be used to reach the various levels have been included. However, this list is not exhaustive and any appropriate methodology can be used.
Definition Local authorities should report the level of preparedness they have reached against the 5 levels of performance, graded 0 to 4. The higher the number, the better the performance.
The criteria for achievement of each of the levels is detailed below.
Level 0: Baseline:
The Authority has begun the process of assessing the potential threats and opportunities across its estate and services (for example, flood and coastal resilience plans, emergency planning, community risk registers/strategies etc) and has identified and agreed the next steps to build on that assessment in a systematic and coordinated way.
Examples of evidence:
• TheAuthorityhasidentifiedaleadofficialtoidentifyandprovideadvicetoservice/department heads on potential impacts of future climate change on its functions
• TheAuthorityhasundertakenanauditofexistingrelevantriskregistersandaction plans in place (eg community risk register)
• TheAuthorityhasestablishedaprocessforactionsitneedstotaketomeethigher levels

106 National Indicators for Local Authorities and Local Authority Partnerships: Handbook of Definitions
NI 188: Planning to Adapt to Climate Change (continued)
Definition (continued)
Level 1: Public commitment and prioritised risk-based assessment: The Authority has made a public commitment to identify and manage climate related risk. It has undertaken a local risk-based assessment of significant vulnerabilities and opportunities to weather and climate, both now and in the future. It can demonstrate a sound understanding of those not yet addressed in existing strategies and actions (e.g. in land use planning documents, service delivery plans, flood and coastal resilience plans, emergency planning, community risk registers/strategies etc ). It has communicated these potential vulnerabilities and opportunities to department/service heads and other local partners and has set out the next steps in addressing them.
Examples of evidence: • Theauthorityandpartnershavemadeapubliccommitmenttomanage
climate risks e.g. signed up to the Nottingham Declaration or an equivalent• ALocalClimateImpactsProfileorequivalentprocessisongoing• InitialassessmentproducedusingtheUKCIPscenarios• Department/serviceheadsfacingsignificantvulnerabilitiesandopportunities
have an understanding of the issues, with evidence of actions already in place to address these
• Evidenceofworkinginpartnershipandpoolingofresourcesandexpertiseacross sectors, areas and council tiers where applicable
Level 2: Comprehensive risk-based assessment and prioritised action in some areas: The Authority has undertaken a comprehensive risk based assessment of vulnerabilities to weather and climate, both now and in the future, and has identified priority risks for its services. It has identified the most effective adaptive responses and has started incorporating these in council strategies, plans, partnerships and operations (such as planning, flood management, economic development, social care, services for children, transport etc). It has begun implementing appropriate adaptive responses in some priority areas. In its role as a community leader the council has started working with its LSP encouraging identification of major weather and climate vulnerabilities and opportunities that affect the delivery of the LSP’s objectives.
Examples of evidence: • Comprehensiveriskassessmentproduced(forexampleusingtheUKCIPmethod)• NottinghamDeclarationaccreditation• CouncilMembersanddepartmentandserviceheadshaveadetailed
understanding of weather and climate risk in all vulnerable areas identified in risk assessment and actions taken in priority areas.
• DocumentslikeLocalDevelopmentFrameworksincludeclimatechangeadaptation• Localadaptationpartnershipestablished• LSPpartnersareawareofactionsbeingtakenbythecouncil,feelengagedin
the process and confirm they have started to identify weather and climate risk that affect the delivery of their own objectives.

Annex 4: Local Economy and Environmental Sustainability 107
NI 188: Planning to Adapt to Climate Change (continued)
Definition (continued)
Level 3: Comprehensive action plan and prioritised action in all priority areas:
The Authority has embedded climate impacts and risks across council decision making. It has developed a comprehensive adaptation action plan to deliver the necessary steps to achieve the existing objectives set out in council strategies, plans, investment decisions and partnership arrangements in light of projected climate change and is implementing appropriate adaptive responses in all priority areas. This includes leadership and support for LSPs in taking a risk based approach to managing major weather and climate vulnerabilities/opportunities across the wider local authority area.
Examples of evidence
• Actionplandevelopedandpublished• NottinghamDeclarationaccreditationatahigherlevel• Detailedunderstandingofriskandactiontakentoembedrelevantadaptation
response in council strategies, plans, partnerships and operations by all department/service heads where weather and climate risks have been identified.
• Initialcostanalysisundertakenandpotentialsourcesoffundingidentifiedformajor vulnerabilities
• LSPsfeelfullyengagedandactionplanincludescommitmentfromauthorityand LSP
• Poolingofskills,knowledgeandresourceacrossLSP• Consultedwithauthoritiesresponsibleforclimatechangemanagementand
others who can provide advice on good practice e.g. Environment Agency, Natural England, Defra.
Level 4: Implementation, monitoring and continuous review: The Authority and LSP are implementing the comprehensive adaptation action plan across the local authority area, and there is a robust process for regular and continual monitoring and review to ensure progress with each measure and updating of objectives. The Authority and LSP are taking appropriate adaptive responses.
Examples of evidence:
• Clearandrobustcontinuousmonitoringandreviewsysteminplace• Outputsfromthereviewandmonitoringprocessareploughedbackintothe
action plan and other relevant council and LSP strategies
Formula N/A
Worked example
LA rates performance against the 5 levels of performance
Good performance Year on year improvement
Collection interval
Annual (Apr – Mar) Data Source Local authority assessment against the criteria

108 National Indicators for Local Authorities and Local Authority Partnerships: Handbook of Definitions
NI 188: Planning to Adapt to Climate Change (continued)
Return Format Number (0-4) Decimal Places Zero
Reporting organisation
Local authority.
Spatial level Single tier, county council and district
Further Guidance
Good quality performance can be typified by assessments and plans which seek to include local authority strategic partners throughout the stages.
Sources of guidance, tools and resources which can assist with undertaking the assessments required for levels 0-4 are outlined below. Each contains several useful processes and tools which can be used to achieve each of the stages. However, any appropriate methodology can be used to achieve the stages of this indicator.
Guidance on how to undertake climate risk assessments and action plan processes is available in the Nottingham Declaration Action Pack. The pack uses an overall 5 step process as a guide to developing an adaptation action plan. Much of this guidance will relate directly to the tasks in levels 0-4 of the indicator www.nottinghamdeclaration.org.uk
In addition to the information provided here, other resources are available to support local authority work in this area:
The UK Climate Impacts Programme (UKCIP) www.ukcip.org.uk has a range of tools and resources that will assist in achieving the level 0-4 tasks.
The production of a Local Climate Impacts Profile (LCLIP) could assist with defining the local climate vulnerabilities and risks and increasing awareness amongst officers and members.
Local Authorities should seek additional guidance from statutory authorities, such as the Environment Agency and Natural England, on issues such as flooding, water resources, coastal management, waste, biodiversity, landscape and the natural environment.

Annex 4: Local Economy and Environmental Sustainability 109
NI 189: Flood and coastal erosion risk management
Is data provided by the LA or a local partner?
N Is this an existing indicator? N
Rationale To record the progress of local authorities in delivering agreed actions to implement long term flood and coastal erosion risk management (FCERM) plans.
Definition Percentage of agreed actions to implement long term flood and coastal erosion risk management plans that are being undertaken satisfactorily
Long term flood and coastal erosion risk management plans: Shoreline Management Plans (SMPs) and Catchment Flood Management Plans (CFMPs).
Agreed actions: those activities identified in the CFMP/SMP Action Plan signed off by the Environment Agency’s Regional Director that are attributed to the relevant Local Authority.
Are being undertaken satisfactorily: The Environment Agency will record progress against all actions within CFMPs and second round SMPs (or generic actions in advance of these being available) – the actions will be attributed to relevant local authorities and a report produced on an annual basis identifying those actions attributed to a particular local authority that are being undertaken satisfactorily.
Formula (X/Y)*100 where:
X = number of actions by local authority that are being undertaken satisfactorily
Y = total number of agreed actions attributed to the local authority for the time period
Worked example
Local authority A is satisfactorily undertaking 4 out of 5 agreed actions due within a year. Indicator value is 80%.
Good performance
Good performance will be signified by a higher percentage of actions undertaken satisfactorily
Collection interval
Progress reported each summer for progress over the previous financial year
Data Source Data will be provided by the Environment Agency in accordance with their supervisory duty relating to flooding and/or ‘strategic overview’ for FCERM at the coast
Return Format Percentage Decimal Places Zero
Reporting organisation
Environment Agency
Spatial level Single tier, district and county councils

110 National Indicators for Local Authorities and Local Authority Partnerships: Handbook of Definitions
NI 189: Flood and coastal erosion risk management (continued)
Further Guidance
Defra and EA provide guidance on the preparation of SMPs and CFMPs. These provide a large-scale assessment of the risks for lengths of shoreline and river catchments and present a long term policy framework to reduce these risks to people and the developed, historic and natural environment in a sustainable manner. CFMPs and SMPs are high level documents that form an important element of the strategy for flood and coastal erosion risk management.
EA will be able to provide detailed information on the monitoring of actions and further information is available from http://www.defra.gov.uk/environ/fcd/policy/smp.htm and http://www.environment-agency.gov.uk/subjects/flood/1217883/1217968/907676/
The EA are currently developing CFMPs and coastal groups are leading the development of second generation SMPs, each with associated actions plans. The CFMPs should be completed by the end of 2008, at which point action plans will be available. Local authorities will have had opportunities to engage in their development, and gain a sound understanding of key actions in advance of this, well before the start of reporting.
The second generation of SMPs (and associated action plans) will not be completed until March 2010 and some areas will not have bespoke action plans in place until then. In the interim and where this is the case the EA will work with coastal groups to develop a list of generic actions (and timescales for their delivery) applicable to all coastal areas against which performance will be measured.

Annex 4: Local Economy and Environmental Sustainability 111
NI 190: Achievement in meeting standards for the control system for animal health. For introduction in 2009/10
Rationale It is intended that an indicator measuring the degree to which a local authority is meeting the standards of performance agreed in the Animal Health and Welfare Framework Agreement will be introduced from 2009/10. The Framework Agreement is currently being reviewed and the proposed indicator will reflect the outcome of this review.
Background and update on indicator development
The Rogers Review (2007) recommended that animal health should be a national enforcement priority because the extent of potential harm is high, e.g. foot and mouth disease in 2001, where estimates of the overall economic cost were around £8.5bn. The Eves Review of the Animal Health & Welfare Delivery Landscape (June 2006) recommended that local authorities should work more closely with Animal Health, other local authorities and other delivery bodies, and should work to improve delivery standards to the level of the better performers.
The Framework Agreement is an agreement between local authorities, Defra and the Welsh Assembly Government for the delivery of services in animal health and welfare. It sets out the principles of how the service is to be delivered. It has benchmarks for service standards and can lay down criteria to be met. It seeks to improve the delivery of animal health and welfare services by facilitating prioritisation of enforcement activities and the development of successful local service delivery plans. The current review is being undertaken jointly by Animal Health and the Local Authorities Coordinators of Regulatory Services (LACORS), with representatives of local authorities and will reflect the outcome of the Eves Review consultation. Participation in the framework agreement is voluntary.
Expected collection arrangements and spatial level
It is expected that this indicator will be reported at single tier and county council level.
Timetable for development
The indicator will be developed alongside the review of the Framework Agreement to ensure it reflects the requirements of the new Agreement. Defra, Animal Health and LACORS will keep local authorities informed.
ConsultationConsultation on the Framework Agreement and the indicator definition will be carried out by Defra around early June 2008, and responses considered in September.
PilotDefra will aim to commence a pilot in October in a small number of selected local authorities. LACORS will provide assistance to identify appropriate local authorities, and It Is hoped that there will also be some GO involvement.
Whilst Welsh authorities are not directly involved in the implementation of NI190, they are party to the framework agreement and have asked to participate in the pilot too.
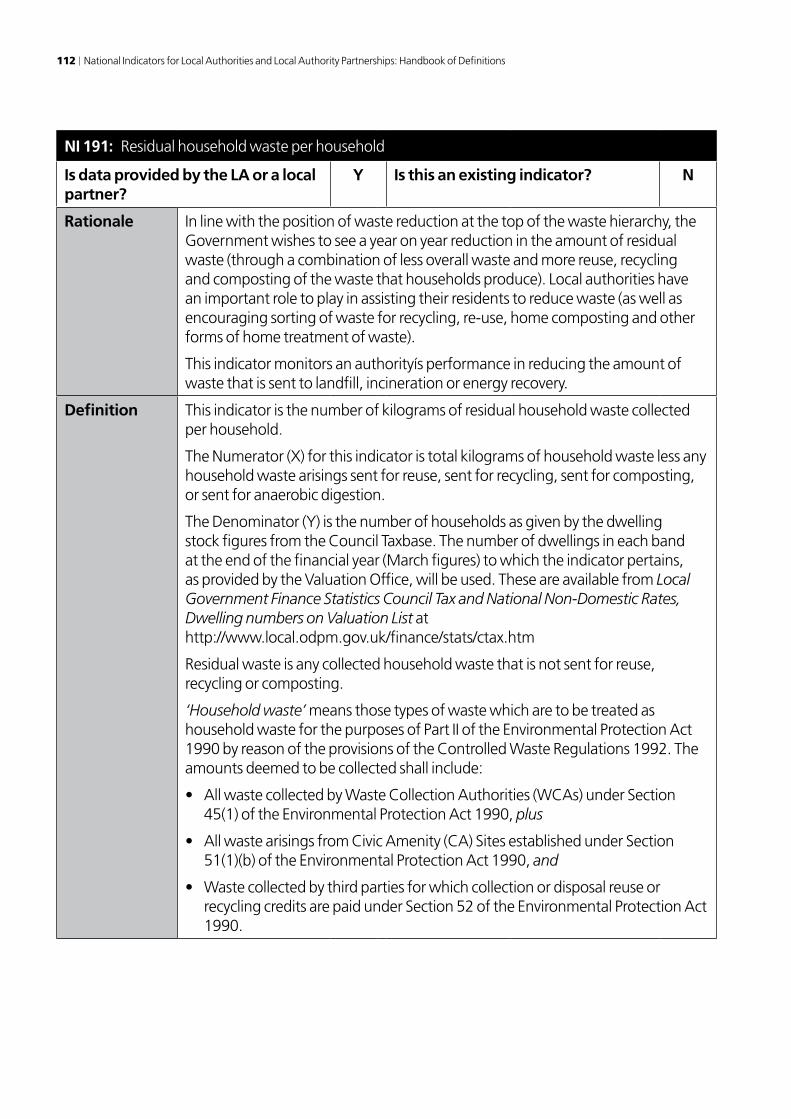
112 National Indicators for Local Authorities and Local Authority Partnerships: Handbook of Definitions
NI 191: Residual household waste per household
Is data provided by the LA or a local partner?
Y Is this an existing indicator? N
Rationale In line with the position of waste reduction at the top of the waste hierarchy, the Government wishes to see a year on year reduction in the amount of residual waste (through a combination of less overall waste and more reuse, recycling and composting of the waste that households produce). Local authorities have an important role to play in assisting their residents to reduce waste (as well as encouraging sorting of waste for recycling, re-use, home composting and other forms of home treatment of waste).
This indicator monitors an authorityís performance in reducing the amount of waste that is sent to landfill, incineration or energy recovery.
Definition This indicator is the number of kilograms of residual household waste collected per household.
The Numerator (X) for this indicator is total kilograms of household waste less any household waste arisings sent for reuse, sent for recycling, sent for composting, or sent for anaerobic digestion.
The Denominator (Y) is the number of households as given by the dwelling stock figures from the Council Taxbase. The number of dwellings in each band at the end of the financial year (March figures) to which the indicator pertains, as provided by the Valuation Office, will be used. These are available from Local Government Finance Statistics Council Tax and National Non-Domestic Rates, Dwelling numbers on Valuation List at http://www.local.odpm.gov.uk/finance/stats/ctax.htm
Residual waste is any collected household waste that is not sent for reuse, recycling or composting.
‘Household waste’ means those types of waste which are to be treated as household waste for the purposes of Part II of the Environmental Protection Act 1990 by reason of the provisions of the Controlled Waste Regulations 1992. The amounts deemed to be collected shall include:
• AllwastecollectedbyWasteCollectionAuthorities(WCAs)underSection45(1) of the Environmental Protection Act 1990, plus
• AllwastearisingsfromCivicAmenity(CA)SitesestablishedunderSection51(1)(b) of the Environmental Protection Act 1990, and
• Wastecollectedbythirdpartiesforwhichcollectionordisposalreuseorrecycling credits are paid under Section 52 of the Environmental Protection Act 1990.
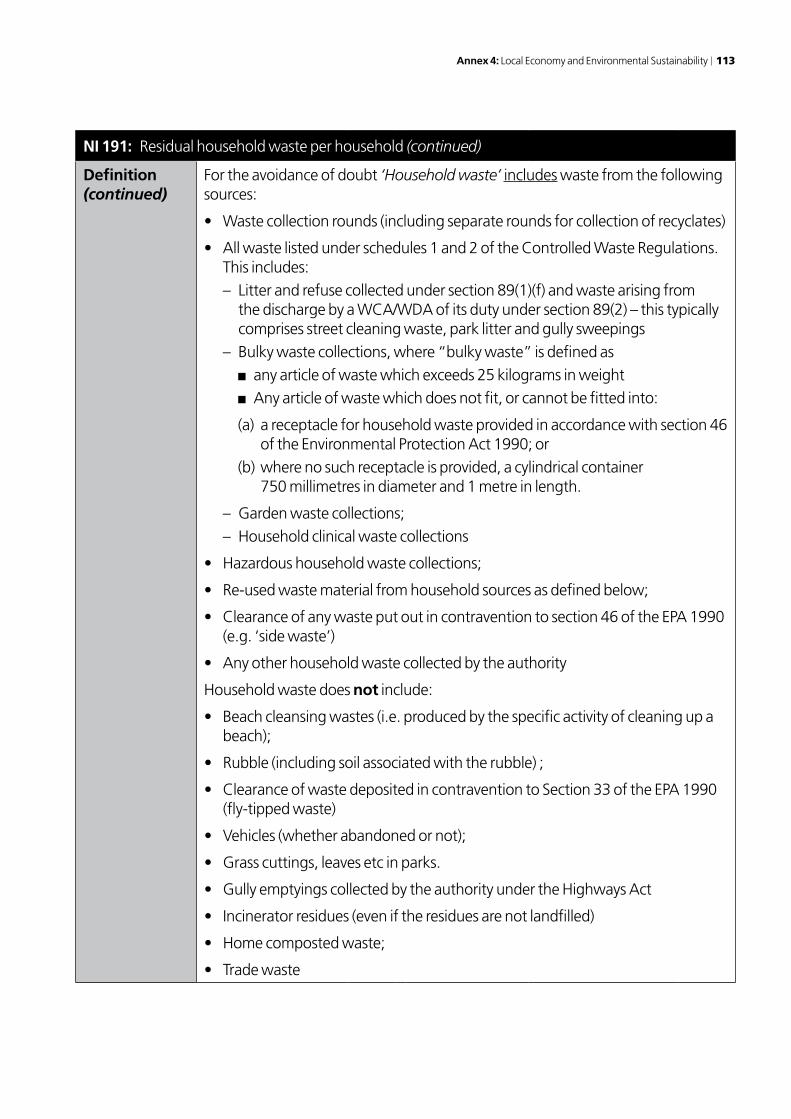
Annex 4: Local Economy and Environmental Sustainability 113
NI 191: Residual household waste per household (continued)
Definition (continued)
For the avoidance of doubt ‘Household waste’ includes waste from the following sources:
• Wastecollectionrounds(includingseparateroundsforcollectionofrecyclates)
• Allwastelistedunderschedules1and2oftheControlledWasteRegulations.This includes:– Litter and refuse collected under section 89(1)(f) and waste arising from
the discharge by a WCA/WDA of its duty under section 89(2) – this typically comprises street cleaning waste, park litter and gully sweepings
– Bulky waste collections, where “bulky waste” is defined as■ any article of waste which exceeds 25 kilograms in weight■ Any article of waste which does not fit, or cannot be fitted into:
(a) a receptacle for household waste provided in accordance with section 46 of the Environmental Protection Act 1990; or
(b) where no such receptacle is provided, a cylindrical container 750 millimetres in diameter and 1 metre in length.
– Garden waste collections;– Household clinical waste collections
• Hazardoushouseholdwastecollections;
• Re-usedwastematerialfromhouseholdsourcesasdefinedbelow;
• Clearanceofanywasteputoutincontraventiontosection46oftheEPA1990(e.g. ‘side waste’)
• Anyotherhouseholdwastecollectedbytheauthority
Household waste does not include:
• Beachcleansingwastes(i.e.producedbythespecificactivityofcleaningupabeach);
• Rubble(includingsoilassociatedwiththerubble);
• ClearanceofwastedepositedincontraventiontoSection33oftheEPA1990(fly-tipped waste)
• Vehicles(whetherabandonedornot);
• Grasscuttings,leavesetcinparks.
• GullyemptyingscollectedbytheauthorityundertheHighwaysAct
• Incineratorresidues(eveniftheresiduesarenotlandfilled)
• Homecompostedwaste;
• Tradewaste

114 National Indicators for Local Authorities and Local Authority Partnerships: Handbook of Definitions
NI 191: Residual household waste per household (continued)
Definition (continued)
Tyres should only be counted if they are ‘household waste’, i.e. they are collected from a house or Civic Amenity Sites or taken directly from the vehicle. If in doubt, they should not be included.
‘Civic Amenity Site’ means places provided by the WDA at which persons resident in the area may deposit their ‘household waste’ (services provided under Section 51(1)(b) of the Environmental Protection Act or under the Refuse Disposal (Amenity) Act). Please note that materials collected at Civic Amenity Sites are only to be counted by disposal authorities except in the case of those London Boroughs and Metropolitan Districts which are not disposal authorities but which provide civic amenity sites under the Refuse Disposal (Amenity) Act.
Where an authority does not separate waste they collect into household and commercial, figures must be based on a documented survey/study to ascertain the proportionate content of the waste. It is advisable to agree the sampling methodology with an external auditor in advance to ensure agreement on the adequacy of sampling.
The numerator will not include any household waste arisings sent for reuse, sent for recycling, sent for composting as defined below.
‘Recycling’ means the reprocessing in a production process of the waste materials for the original purpose, or for other purposes, but excluding energy recovery.
This includes material collected for recycling by waste collection authorities (e.g. from kerbside collection, bring sites or street recycling bins), waste disposal authorities (e.g. from civic amenity sites), and by third party private/voluntary collections sent for recycling on behalf of the WCA/WDA.
It excludes material collected for recycling which is subsequently rejected to disposal whilst under the possession or control of the WCA/WDA. Rejects may occur at collection, during sorting (e.g. at a Material Recycling Facility) or at the gate of the reprocessor. All recycling rejects should be excluded from the numerator.
Contamination Rates at MRFs: Where a MRF is used by a number of authorities to calculate the amount of waste sent for recycling, authorities may use the plant’s overall contamination rate if there is no more accurate information on the individual authority’s waste stream.
Recycling can include material within the residual waste stream that is subsequently separated out and sent for recycling. For example, recyclate taken from residual waste sorted at transfer stations or Material Recycling Facilities (MRFs), recycling outputs from Mechanical Biological Treatment (MBT).
In order to be included in the numerator the waste must be delivered to, and accepted by, a company, individual or organisation which will reprocess waste that is an acceptable form for inclusion in a recycling process. This includes waste that is exported for recycling (compliant with rules on the transfrontier shipment of waste).
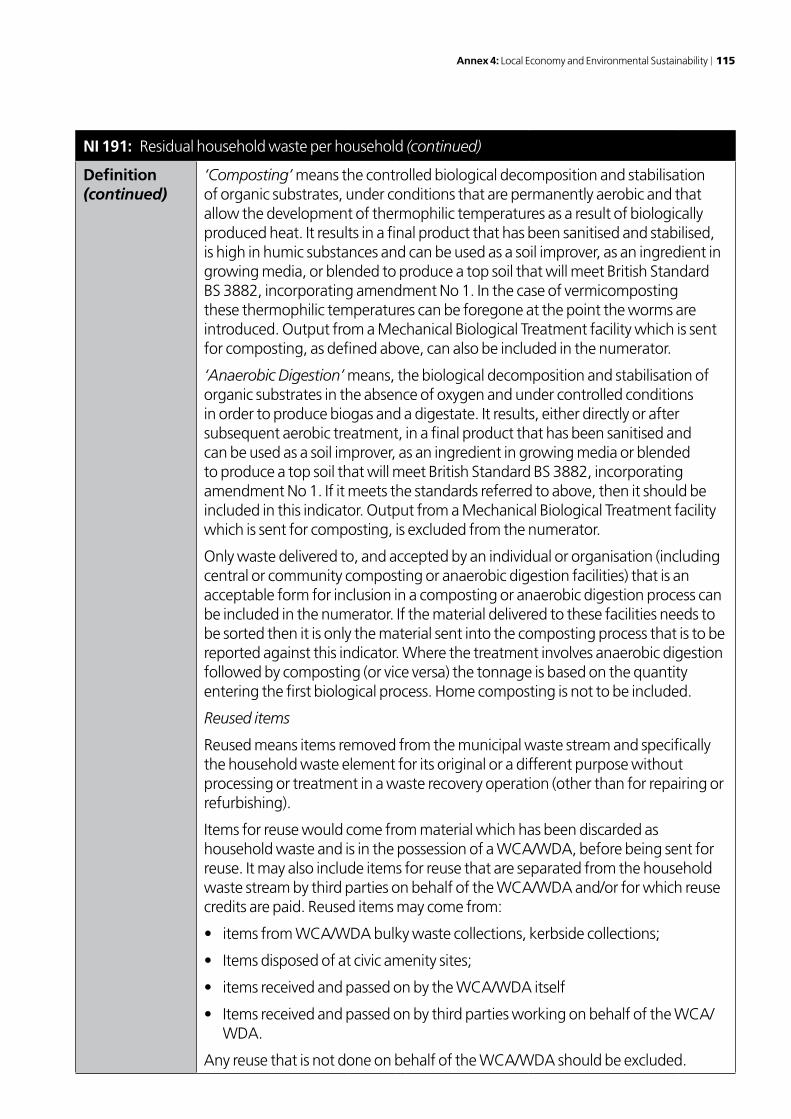
Annex 4: Local Economy and Environmental Sustainability 115
NI 191: Residual household waste per household (continued)
Definition (continued)
‘Composting’ means the controlled biological decomposition and stabilisation of organic substrates, under conditions that are permanently aerobic and that allow the development of thermophilic temperatures as a result of biologically produced heat. It results in a final product that has been sanitised and stabilised, is high in humic substances and can be used as a soil improver, as an ingredient in growing media, or blended to produce a top soil that will meet British Standard BS 3882, incorporating amendment No 1. In the case of vermicomposting these thermophilic temperatures can be foregone at the point the worms are introduced. Output from a Mechanical Biological Treatment facility which is sent for composting, as defined above, can also be included in the numerator.
‘Anaerobic Digestion’ means, the biological decomposition and stabilisation of organic substrates in the absence of oxygen and under controlled conditions in order to produce biogas and a digestate. It results, either directly or after subsequent aerobic treatment, in a final product that has been sanitised and can be used as a soil improver, as an ingredient in growing media or blended to produce a top soil that will meet British Standard BS 3882, incorporating amendment No 1. If it meets the standards referred to above, then it should be included in this indicator. Output from a Mechanical Biological Treatment facility which is sent for composting, is excluded from the numerator.
Only waste delivered to, and accepted by an individual or organisation (including central or community composting or anaerobic digestion facilities) that is an acceptable form for inclusion in a composting or anaerobic digestion process can be included in the numerator. If the material delivered to these facilities needs to be sorted then it is only the material sent into the composting process that is to be reported against this indicator. Where the treatment involves anaerobic digestion followed by composting (or vice versa) the tonnage is based on the quantity entering the first biological process. Home composting is not to be included.
Reused items
Reused means items removed from the municipal waste stream and specifically the household waste element for its original or a different purpose without processing or treatment in a waste recovery operation (other than for repairing or refurbishing).
Items for reuse would come from material which has been discarded as household waste and is in the possession of a WCA/WDA, before being sent for reuse. It may also include items for reuse that are separated from the household waste stream by third parties on behalf of the WCA/WDA and/or for which reuse credits are paid. Reused items may come from:
• itemsfromWCA/WDAbulkywastecollections,kerbsidecollections;
• Itemsdisposedofatcivicamenitysites;
• itemsreceivedandpassedonbytheWCA/WDAitself
• ItemsreceivedandpassedonbythirdpartiesworkingonbehalfoftheWCA/WDA.
Any reuse that is not done on behalf of the WCA/WDA should be excluded.

116 National Indicators for Local Authorities and Local Authority Partnerships: Handbook of Definitions
NI 191: Residual household waste per household (continued)
Definition (continued)
Where weighted tonnages of reused items are not available, the Furniture Reuse Network’s set of average weights should be used (see link below):
Where relevant waste is collected in one year and recycled/composted in the next because there is a delay due to the need for further processing, e.g. refrigerators and freezers, count the collection and recycling/composting when they occur, even if they are different years.
Any household waste (regardless of the process it has been subject to) that is used for daily landfill cover or roads on landfill sites does not count as recycling/ reuse or composting.
Formula Data will be acquired using local authorities WasteDataFlow returns.
a) For Waste Collection Authorities (WCAs), number of kilograms of household waste collected per household is calculated as:
((X/Y) * 1,000), where
X = Total tonnage of household waste collected by the WCA (or by third parties on behalf of the WCA)
minus the tonnage of household waste collected by the WCA (or by third parties on behalf of the WCA) sent for reuse, recycling, composting or anaerobic digestion
Y = Number of households (as given by the dwelling stock figures from the Council Taxbase. The figures relating to the end of the financial year to which the indicator pertains, as provided by the Valuation Office, will be used)
b) For Waste Disposal Authorities (WDAs), number of kilograms of household waste collected per head is calculated as:
((X/Y) * 1,000), where:
X = Total tonnage of household waste collected at Civic Amenity Sites by the WDA (or by third parties on behalf of the WDA) plus total tonnage of household waste collected by constituent WCAs (or by third parties on behalf of the WCA) as given by the denominator of NI192 for WDAs
minus the tonnage of household waste collected by the WDA (or by third parties on behalf of the WDA) which is sent for reuse, recycling, composting or anaerobic digestion plus tonnage of household waste which is sent for recycling, composting or anaerobic digestion by the constituent WCAs (or by third parties on behalf of the WCAs).
Y = Number of households (as given by the dwelling stock figures from the Council Taxbase. The figures relating to the end of the financial year to which the indicator pertains, as provided by the Valuation Office, will be used).

Annex 4: Local Economy and Environmental Sustainability 117
NI 191: Residual household waste per household (continued)
Formula (continued)
c) For Unitary Authorities, number of kilograms of household waste collected is calculated as:
((X/Y) * 1,000), where:
X = Total tonnage of household waste arisings collected by the authority, as given by the denominator of NI 192.
minus the tonnage of household waste collected by the authority which is sent for reuse, recycling, composting or anaerobic digestion, as given by the numerator of NI 192.
Y = Number of households (as given by the dwelling stock figures from the Council Taxbase. The figures relating to the end of the financial year to which the indicator pertains, as provided by the Valuation Office, will be used).
Worked Example
(This example is applicable to all reporting organisations)
Total household waste = 100,000 tonnes
Total household waste sent for reuse, recycling or composting = 40,000 tonnes
Number of households = 90,100
X= 100,000 tonnes -40,000 tonnes
Y=90,100 households
X/Y = (60,000 tonnes/90,100 households)
Multiply by 1,000
NI 191 = 666 kg/household
The methodology employed by WasteDataFlow to calculate the PIs can be downloaded from the WasteDataFlow website (see link below).
Good performance
Good performance is typified by a lower figure per household
Collection interval
Financial year Data Source WasteDataFlow
Return Format Kg per household Decimal Places Zero

118 National Indicators for Local Authorities and Local Authority Partnerships: Handbook of Definitions
NI 191: Residual household waste per household (continued)
Reporting organisation
All data are reported by Defra based on information provided by local authorities to WasteDataFlow.
Spatial level The indicator is reported for the following types of authority:
Waste Collection Authorities: includes 238 district-shire authorities, 21 London boroughs, and 14 metropolitan authorities in Manchester/Merseyside area)
Waste Disposal Authorities: includes 34 county councils, 6 Joint Waste Disposal Authorities).
Waste Collection and Disposal Authorities: includes 47 English Unitary authorities (including the Council of the Isles of Scilly), 11 London boroughs, Common Council of the City of London and 22 metropolitan authorities).
Further Guidance
http://www.wastedataflow.org/htm/datasets.aspx
This indicator is similar to the previous BV indicator on total household waste per head (BV 84). There are, however, two key differences:
Firstly, NI 191 only measures household waste that is not re-used, recycled or composted. This waste is sometimes referred to as residual or black bag waste. Defra will still publish data on total household waste arisings in the annual Municipal Waste Data statistics.
Secondly, NI 191 is measured against households and not population. Again, Defra will still publish both sets of figures in the annual Municipal Waste Management Data).
Waste Strategy 2007 set a new national target to reduce the amount of household waste not re-used, recycled or composted by 29% to 15.8 million tonnes in 2010 with an aspiration to reduce it by 45% in 2020. Each authority should play its part in achieving these targets.
This indicator is on the household waste stream, which is an element within the municipal waste stream. In 2006/07, household waste comprised 89% of England’s municipal waste. The non-household element of Municipal waste includes any other wastes collected by waste collection authorities (or their agents) such as municipal parks and gardens waste, beach cleansing waste, commercial or industrial waste and waste resulting from the clearance of materials deposited in contravention to Section 33 of the EPA 1990.

Annex 4: Local Economy and Environmental Sustainability 119
NI 192: Percentage of household waste sent for reuse, recycling and composting
Is data provided by the LA or a local partner?
Y Is this an existing indicator? Y
Rationale The indicator measures percentage of household waste arisings which have been sent by the Authority for reuse, recycling, composting or anaerobic digestion. This is a key measure of local authorities’ progress in moving management of household waste up the hierarchy, consistent with the Government’s national strategy for waste management. The Government expects local authorities to maximise the percentage of waste reused, recycled and composted.
Definition The percentage of household waste arisings which have been sent by the authority for reuse, recycling, composting or anaerobic digestion.
This was previously collected as BVPI 82a and 82b in 2007/08.
The numerator is the total tonnage of household waste collected which is sent for reuse, recycling, composting or anaerobic digestion.
The denominator is the total tonnage of household waste collected.
‘Household waste’ means those types of waste which are to be treated as household waste for the purposes of Part II of the Environmental Protection Act 1990 by reason of the provisions of the Controlled Waste Regulations 1992. The amounts deemed to be collected shall include:
• AllwastecollectedbyWasteCollectionAuthorities(WCAs)underSection45(1) of the Environmental Protection Act 1990, plus
• AllwastearisingsfromCivicAmenity(CA)SitesestablishedunderSection51(1)(b) of the Environmental Protection Act 1990, and
• Wastecollectedbythirdpartiesforwhichcollectionordisposalreuseorrecycling credits are paid under Section 52 of the Environmental Protection Act 1990.
For the avoidance of doubt ‘Household waste’ includes waste from the following sources:
• Wastecollectionrounds(includingseparateroundsforcollectionofrecyclates)• Allwastelistedunderschedules1and2oftheControlledWasteRegulations.
This includes: – Litter and refuse collected under section 89(1)(f) and waste arising from
the discharge by a WCA/WDA of its duty under section 89(2) – this typically comprises street cleaning waste, park litter and gully sweepings
– Bulky waste collections, where “bulky waste” is defined as • anyarticleofwastewhichexceeds25kilogramsinweight • Anyarticleofwastewhichdoesnotfit,orcannotbefittedinto:
(a) a receptacle for household waste provided in accordance with section 46 of the Environmental Protection Act 1990; or
(b) where no such receptacle is provided, a cylindrical container 750 millimetres in diameter and 1 metre in length.

120 National Indicators for Local Authorities and Local Authority Partnerships: Handbook of Definitions
NI 192: Percentage of household waste sent for reuse, recycling and composting (continued)
Definition (continued)
– Garden waste collections;
– Household clinical waste collections.
• Hazardoushouseholdwastecollections;• Re-usedwastematerialfromhouseholdsourcesasdefinedbelow;• Clearanceofanywasteputoutincontraventiontosection46oftheEPA1990
(e.g. ‘side waste’)• AnyotherhouseholdwastecollectedbytheauthorityHousehold waste does not include:
• Beachcleansingwastes(i.e.producedbythespecificactivityofcleaningupabeach)
• Rubble(includingsoilassociatedwiththerubble)• ClearanceofwastedepositedincontraventiontoSection33oftheEPA1990
(fly-tipped waste)• Vehicles(whetherabandonedornot)• Grasscuttings,leavesetcinparks• GullyemptyingscollectedbytheauthorityundertheHighwaysAct• Incineratorresidues(eveniftheresiduesarenotlandfilled)• Homecompostedwaste• TradewasteTyres should only be counted if they are ‘household waste’, i.e. they are collected from a house or Civic Amenity Sites or taken directly from the vehicle. If in doubt, they should not be included.
‘Civic Amenity Site’ means places provided by the WDA at which persons resident in the area may deposit their ‘household waste’ (services provided under Section 51(1)(b) of the Environmental Protection Act or under the Refuse Disposal (Amenity) Act). Please note that materials collected at Civic Amenity Sites are only to be counted by disposal authorities except in the case of those London Boroughs and Metropolitan Districts which are not disposal authorities but which provide civic amenity sites under the Refuse Disposal (Amenity) Act.
Where an authority does not separate waste they collect into household and commercial, figures must be based on a documented survey/study to ascertain the proportionate content of the waste. It is advisable to agree the sampling methodology with an external auditor in advance to ensure agreement on the adequacy of sampling.
‘Recycling’ means the reprocessing in a production process of the waste materials for the original purpose, or for other purposes, but excluding energy recovery.
This includes material collected for recycling by waste collection authorities (e.g. from kerbside collection, bring sites or street recycling bins), waste disposal authorities (e.g. from civic amenity sites), and by third party private/voluntary collections sent for recycling on behalf of the WCA/WDA.

Annex 4: Local Economy and Environmental Sustainability 121
NI 192: Percentage of household waste sent for reuse, recycling and composting (continued)
Definition (continued)
It excludes material collected for recycling which is subsequently rejected to disposal whilst under the possession or control of the WCA/WDA. Rejects may occur at collection, during sorting (e.g. at a Material Recycling Facility) or at the gate of the reprocessor. All recycling rejects should be excluded from the numerator.
Contamination Rates at MRFs: Where a MRF is used by a number of authorities to calculate the amount of waste sent for recycling, authorities may use the plant’s overall contamination rate if there is no more accurate information on the individual authority’s waste stream.
Recycling can include material within the residual waste stream that is subsequently separated out and sent for recycling. For example, recyclate taken from residual waste sorted at transfer stations or Material Recycling Facilities (MRFs), recycling outputs from Mechanical Biological Treatment (MBT).
In order to be included in the numerator the waste must be delivered to, and accepted by, a company, individual or organisation which will reprocess waste that is in an acceptable form for inclusion in a recycling process. This includes waste that is exported for recycling (compliant with rules on the transfrontier shipment of waste).
‘Composting’ means the controlled biological decomposition and stabilisation of organic substrates, under conditions that are permanently aerobic and that allow the development of thermophilic temperatures as a result of biologically produced heat. It results in a final product that has been sanitised and stabilised, is high in humic substances and can be used as a soil improver, as an ingredient in growing media, or blended to produce a top soil that will meet British Standard BS 3882, incorporating amendment No 1. In the case of vermicomposting these thermophilic temperatures can be foregone at the point the worms are introduced. Output from a Mechanical Biological Treatment facility which is sent for composting, as defined above, can also be included in the numerator.
‘Anaerobic Digestion’ means, the biological decomposition and stabilisation of organic substrates in the absence of oxygen and under controlled conditions in order to produce biogas and a digestate. It results, either directly or after subsequent aerobic treatment, in a final product that has been sanitised and can be used as a soil improver, as an ingredient in growing media or blended to produce a top soil that will meet British Standard BS 3882, incorporating amendment No 1. If it meets the standards referred to above, then it should be included in this indicator.

122 National Indicators for Local Authorities and Local Authority Partnerships: Handbook of Definitions
NI 192: Percentage of household waste sent for reuse, recycling and composting (continued)
Definition (continued)
Only waste delivered to, and accepted by an individual or organisation (including central or community composting or anaerobic digestion facilities) that is in an acceptable form for inclusion in a composting or anaerobic digestion process can be included in the numerator. If the material delivered to these facilities needs to be sorted then it is only the material sent into the composting process that is to be reported against this indicator. Where the treatment involves anaerobic digestion followed by composting (or vice versa) the tonnage is based on the quantity entering the first biological process. Home composting is not to be included.
‘Reused items’ means items removed from the municipal waste stream and specifically the household waste element for its original or a different purpose without processing or treatment in a waste recovery operation (other than for repairing or refurbishing).
Items for reuse would come from material which has been discarded as household waste and is in the possession of a WCA/WDA, before being sent for reuse. It may also include items for reuse that are separated from the household waste stream by third parties on behalf of the WCA/WDA and/or for which reuse credits are paid. Reused items may come from:
• itemsfromWCA/WDAbulkywastecollections,kerbsidecollections;• Itemsdisposedofatcivicamenitysites;• itemsreceivedandpassedonbytheWCA/WDAitself• ItemsreceivedandpassedonbythirdpartiesworkingonbehalfoftheWCA/
WDA.
Any reuse that is not done on behalf of the WCA/WDA should be excluded.
Where weighted tonnages of reused items are not available, the Furniture Reuse Network’s set of average weights should be used (see link below):
Where relevant waste is collected in one year and recycled/composted in the next because there is a delay due to the need for further processing, e.g. refrigerators and freezers, count the collection and recycling/composting when they occur, even if they are different years.
Any household waste (regardless of the process it has been subject to) that is used for daily landfill cover or roads on landfill sites does not count as recycling/ reuse or composting.
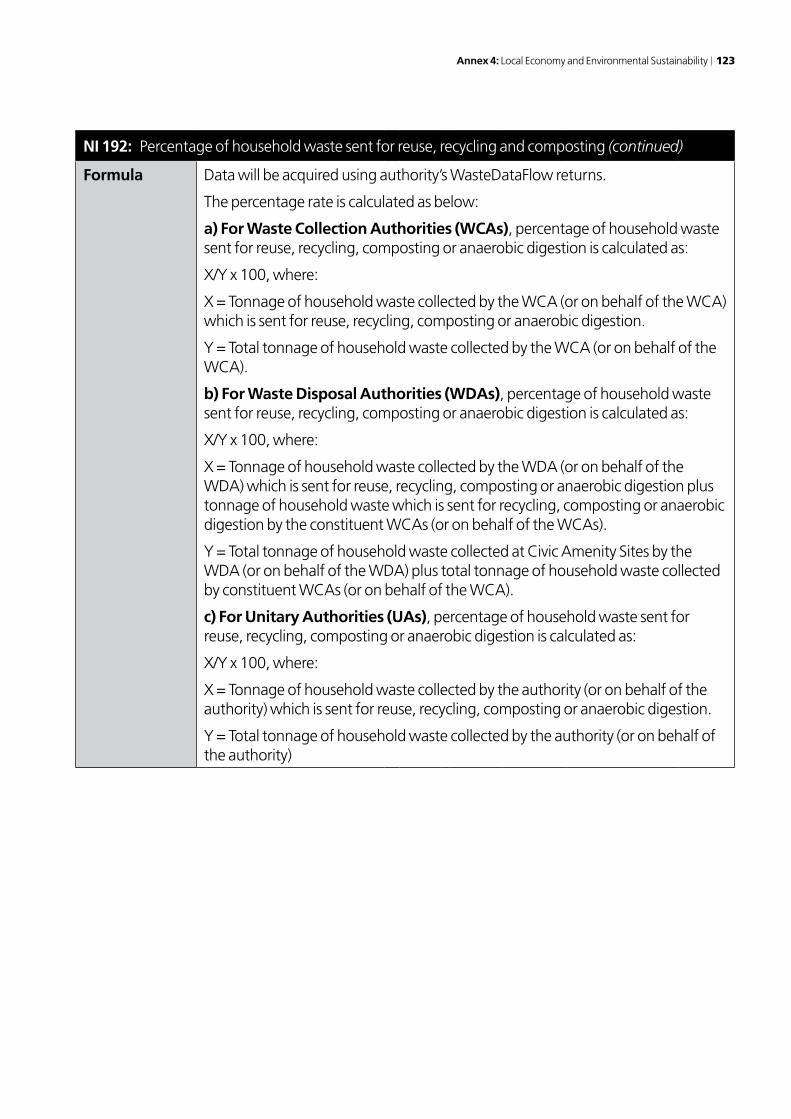
Annex 4: Local Economy and Environmental Sustainability 123
NI 192: Percentage of household waste sent for reuse, recycling and composting (continued)
Formula Data will be acquired using authority’s WasteDataFlow returns.
The percentage rate is calculated as below:
a) For Waste Collection Authorities (WCAs), percentage of household waste sent for reuse, recycling, composting or anaerobic digestion is calculated as:
X/Y x 100, where:
X = Tonnage of household waste collected by the WCA (or on behalf of the WCA) which is sent for reuse, recycling, composting or anaerobic digestion.
Y = Total tonnage of household waste collected by the WCA (or on behalf of the WCA).
b) For Waste Disposal Authorities (WDAs), percentage of household waste sent for reuse, recycling, composting or anaerobic digestion is calculated as:
X/Y x 100, where:
X = Tonnage of household waste collected by the WDA (or on behalf of the WDA) which is sent for reuse, recycling, composting or anaerobic digestion plus tonnage of household waste which is sent for recycling, composting or anaerobic digestion by the constituent WCAs (or on behalf of the WCAs).
Y = Total tonnage of household waste collected at Civic Amenity Sites by the WDA (or on behalf of the WDA) plus total tonnage of household waste collected by constituent WCAs (or on behalf of the WCA).
c) For Unitary Authorities (UAs), percentage of household waste sent for reuse, recycling, composting or anaerobic digestion is calculated as:
X/Y x 100, where:
X = Tonnage of household waste collected by the authority (or on behalf of the authority) which is sent for reuse, recycling, composting or anaerobic digestion.
Y = Total tonnage of household waste collected by the authority (or on behalf of the authority)

124 National Indicators for Local Authorities and Local Authority Partnerships: Handbook of Definitions
NI 192: Percentage of household waste sent for reuse, recycling and composting (continued)
Worked Example
(This example is applicable to all reporting organisations)
Household waste collected directly for recycling = 30,000 tonnes
Household waste rejected for recycling = 500 tonnes
Household waste sent for reuse = 300 tonnes
Household waste sent for composting = 8,000 tonnes
Recyclate sorted from residual waste MRF = 2,200 tonnes
Total household waste = 100,000 tonnes
X = (30,000 – 500 +300 + 8,000 + 2,200) = 40,000 tonnes
Y = 100,000 tonnes
X/Yx100 = (40,000 /100,000) x 100
NI 192 = 40.00%
The methodology employed by WasteDataFlow to calculate the PIs can be downloaded from the WasteDataFlow website (see link below).
Good performance
Good performance is typified by a higher percentage

Annex 4: Local Economy and Environmental Sustainability 125
NI 192: Percentage of household waste sent for reuse, recycling and composting (continued)
Collection interval
Financial year Data Source WasteDataFlow
Return Format Percentage Decimal Places Two
Reporting organisation
All data are reported by Defra based on information provided by local authorities to WasteDataFlow.
Spatial level The indicator is reported for the following types of authority:
Waste Collection Authorities: includes 238 district-shire authorities, 21 London boroughs, and 14 Metropolitan Authorities in Manchester/Merseyside area).
Waste Disposal Authorities: includes 34 county councils, 6 Joint Waste Disposal Authorities).
Waste Collection and Disposal Authorities: includes 47 English unitary authorities (including the Council of the Isles of Scilly), 11 London boroughs, Common Council of the City of London, 22 Metropolitan Authorities)
Further Guidance
http://www.wastedataflow.org/htm/datasets.aspx
http://www.frn.org.uk/statistics.asp
This indicator combines the two previous BV indicators on household waste recycled (BV 82a) and composted (BV 82b). It also now includes reuse tonnages which fall within the scope outlined above.
Waste Strategy 2007 set national targets for the reuse, recycling and composting of household waste of at least 40% by 2010, 45% by 2015 and 50% by 2020. Each waste authority should play its part in achieving these targets.
This indicator is on the household waste stream, which is an element within the municipal waste stream. In 2006/07, household waste comprised 89% of England’s municipal waste. The non-household element of Municipal waste includes any other wastes collected by waste collection authorities (or their agents) such as municipal parks and gardens waste, beach cleansing waste, commercial or industrial waste and waste resulting from the clearance of materials deposited in contravention to Section 33 of the EPA 1990.

126 National Indicators for Local Authorities and Local Authority Partnerships: Handbook of Definitions
NI 193: Percentage of municipal waste land filled
Is data provided by the LA or a local partner?
Y Is this an existing indicator? N
Rationale To measure the proportion of municipal waste landfilled. The Government’s strategy on waste is to move waste management up the waste hierarchy and divert an increasing proportion of waste away from landfill.
Definition The percentage of municipal waste which is sent to landfill.
Denominator (Y):
The scope of municipal waste is the same as the European Union Landfill Directive and Landfill Allowances Trading Scheme (LATS).
Defra’s view is that the definition of municipal waste in the Landfill Directive and LATS encompasses all waste in the possession or under the control of a waste disposal authority or a waste collection authority, or agents acting on their behalf.
Numerator (X):
Municipal waste to landfill includes residual waste sent directly to landfill and that which was collected for other management routes (e.g. recycling, composting, reuse, Mechanical Biological Treatment) but subsequently sent to landfill.
Formula Data will be acquired using local authorities WasteDataFlow returns.
The percentage rate is calculated as below:
a) For Waste Disposal Authorities (WDAs), percentage of municipal waste arisings which have been landfilled is calculated as:
X/Y x 100, where:
X = Tonnage of municipal waste collected by the WDA (or on behalf of the WDA) which is landfilled plus waste collected for recycling/composting/reuse which was rejected to landfill plus residual waste sent for other waste management processes (e.g. MBT) that was subsequently sent to landfill.
Y = Total tonnage of municipal waste collected at Civic Amenity Sites by the WDA (or on behalf of the WDA) plus total tonnage of municipal waste collected by constituent WCAs (or on behalf of the WCA).
b) For Unitary Authorities (UAs), percentage of municipal waste arisings which have been landfilled is calculated as:
X/Y x 100, where:
X = Tonnage of municipal waste collected by the authority (or on behalf of the authority) which is landfilled plus waste collected for recycling/composting/reuse which was rejected to landfill plus residual waste sent for other waste management processes (e.g. MBT) that was subsequently sent to landfill.
Y = Total tonnage of municipal waste collected by the authority (or on behalf of the authority).
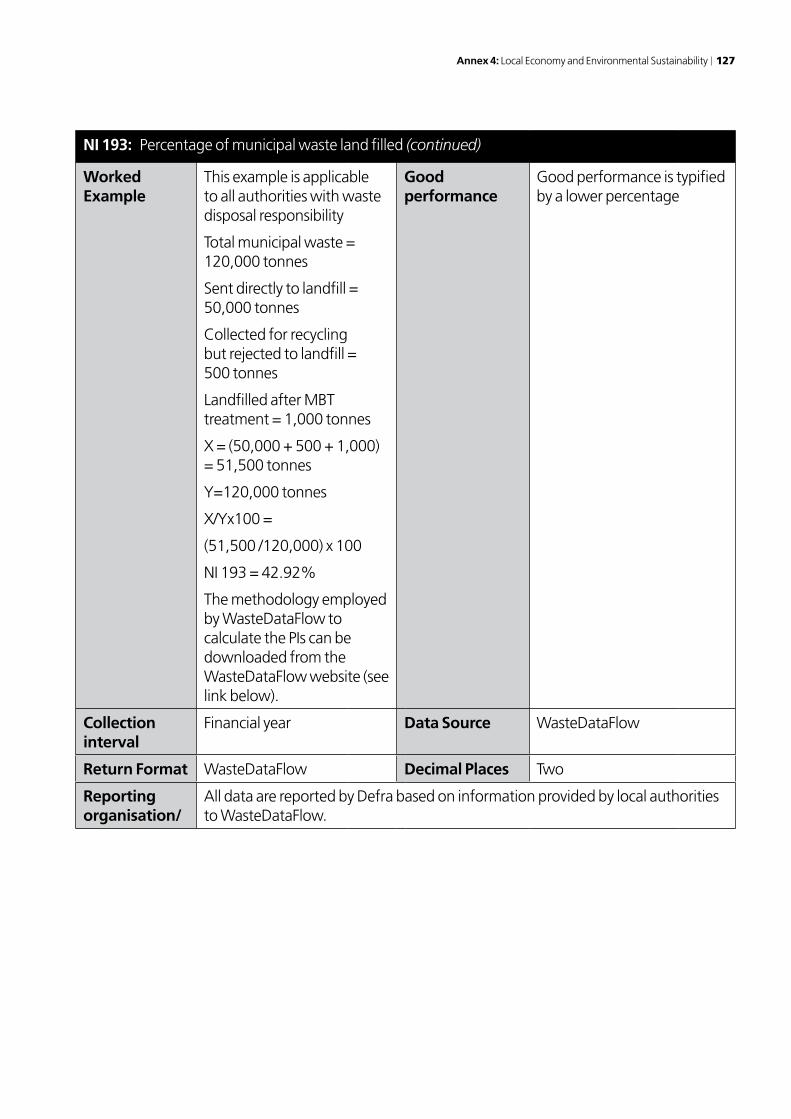
Annex 4: Local Economy and Environmental Sustainability 127
NI 193: Percentage of municipal waste land filled (continued)
Worked Example
This example is applicable to all authorities with waste disposal responsibility
Total municipal waste = 120,000 tonnes
Sent directly to landfill = 50,000 tonnes
Collected for recycling but rejected to landfill = 500 tonnes
Landfilled after MBT treatment = 1,000 tonnes
X = (50,000 + 500 + 1,000) = 51,500 tonnes
Y=120,000 tonnes
X/Yx100 =
(51,500 /120,000) x 100
NI 193 = 42.92%
The methodology employed by WasteDataFlow to calculate the PIs can be downloaded from the WasteDataFlow website (see link below).
Good performance
Good performance is typified by a lower percentage
Collection interval
Financial year Data Source WasteDataFlow
Return Format WasteDataFlow Decimal Places Two
Reporting organisation/
All data are reported by Defra based on information provided by local authorities to WasteDataFlow.
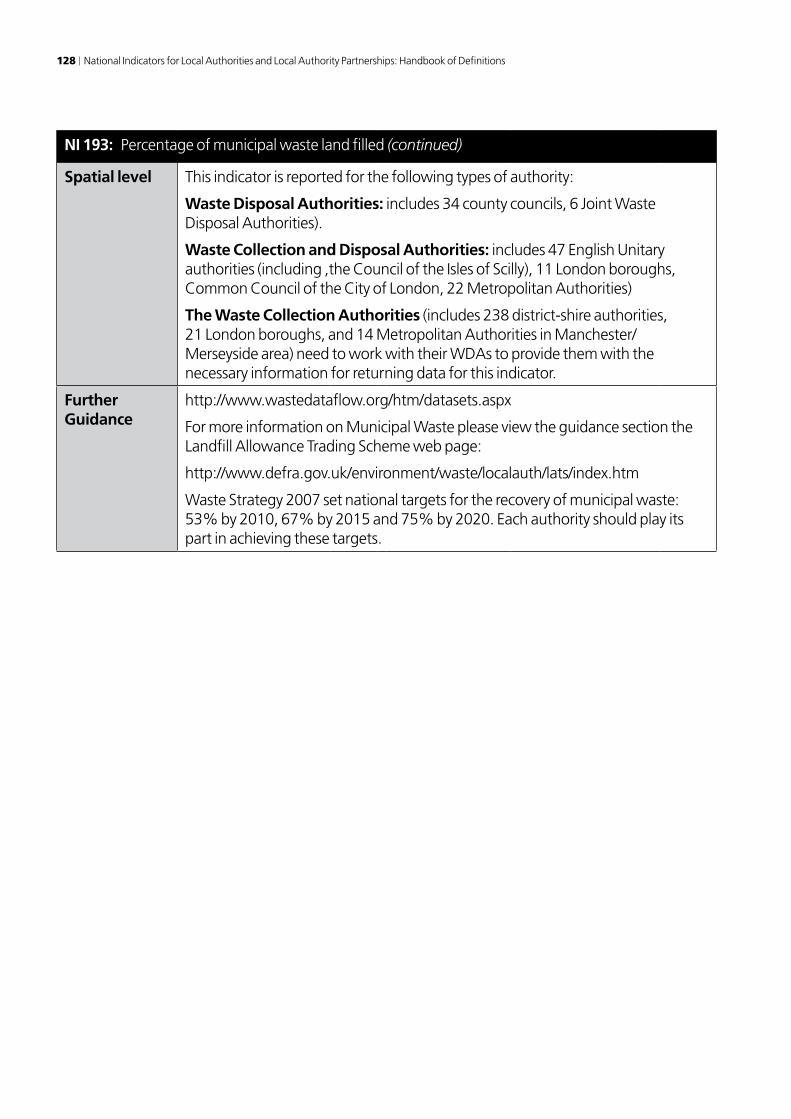
128 National Indicators for Local Authorities and Local Authority Partnerships: Handbook of Definitions
NI 193: Percentage of municipal waste land filled (continued)
Spatial level This indicator is reported for the following types of authority:
Waste Disposal Authorities: includes 34 county councils, 6 Joint Waste Disposal Authorities).
Waste Collection and Disposal Authorities: includes 47 English Unitary authorities (including ,the Council of the Isles of Scilly), 11 London boroughs, Common Council of the City of London, 22 Metropolitan Authorities)
The Waste Collection Authorities (includes 238 district-shire authorities, 21 London boroughs, and 14 Metropolitan Authorities in Manchester/Merseyside area) need to work with their WDAs to provide them with the necessary information for returning data for this indicator.
Further Guidance
http://www.wastedataflow.org/htm/datasets.aspx
For more information on Municipal Waste please view the guidance section the Landfill Allowance Trading Scheme web page:
http://www.defra.gov.uk/environment/waste/localauth/lats/index.htm
Waste Strategy 2007 set national targets for the recovery of municipal waste: 53% by 2010, 67% by 2015 and 75% by 2020. Each authority should play its part in achieving these targets.

Annex 4: Local Economy and Environmental Sustainability 129
NI 194: Air quality – % reduction in NOx and primary PM10 emissions through local authority’s estate and operations
Is data provided by the LA or a local partner?
Y Is this an existing indicator? N
Rationale The aim of this indicator is to identify authorities that are proactive in minimising air pollution emissions from their estate and operations.
Local authorities have experience of managing air pollution under Part IV of the Environment Act 1995 in particular areas where air quality objectives are being, or are likely to be, exceeded. However, PM10 and NOx are two of the more prevalent pollutants, and the Government needs to do more to tackle these. As with NI185, which targets CO2 emissions from local authority operations, NI194 will enable local authorities to lead by example. It will also encourage them to tackle PM10 and NOx at the point of emission in order to improve air quality across their entire area, not just in air quality hotspots (or air quality management areas). The manner in which a local authority delivers its powers and duties can achieve PM10 and NOx reductions. Co-benefits, as well as trade-offs, for both this indicator and NI185 can be realised by local authorities through the use of the associated emissions tool.
Measurement against this indicator will require each local authority to calculate their PM10 and NOx emissions from analysis of the energy and fuel use in their relevant buildings and transport, including where these services have been outsourced. The tool to be used to calculate these emissions is available at: www.defra.gov.uk/environment/airquality/local/indicator.htm
Definition The indicator being assessed will be a year on year measured reduction of primary PM10 and NOx emission from local authority estate and operations. First year data to be reported in 2009, will be for Jan-Dec 2008.
• ‘Emission’:TotalamountofdirectandindirectprimaryPM10, and total amount of direct and indirect NOx, emitted from local authority estate and operations.
• ‘Directemissions’:Emissionsfromsourcesthatareownedorcontrolledbythelocal authority e.g. emissions from the combustion in owned or controlled boilers and vehicles.
• ‘Indirectemissions’:Emissionsthatareaconsequenceoftheactivitiesofthelocal authority, but occur at sources owned or controlled by another entity e.g. emissions from consumption of purchased electricity or heat, transport-related activities in vehicles not owned or controlled by the local authority and outsourced activities.
• ‘Estate‘–buildingsandstructuresusedbythelocalauthoritytocarryoutitspowers and duties and which result in direct and indirect emissions of primary PM10 and NOx into the atmosphere, including: council offices, libraries, community halls, streetlights and schools. Social housing is not included.
• ‘Operations’–Thedeliveryofpowersanddutiesofalocalauthoritywhichresult (either directly or indirectly) in the emission of primary PM10 and NOx into the atmosphere.

130 National Indicators for Local Authorities and Local Authority Partnerships: Handbook of Definitions
NI 194: Air quality – % reduction in NOx and primary PM10 emissions through local authority’s estate and operations (continued)
Definition (continued)
• ‘NOx’ – oxides of nitrogen – the sum of nitric oxide and nitrogen dioxide.• ‘PM10’ – airborne particulate matter passing through a sampling inlet with a
50% efficiency cut-off at 10 micrometers aerodynamic diameter and which transmits particles below this size.
• ‘PrimaryPM10’ – PM10 emitted directly into the environment. • ‘Emissionfactor’–therateofreleaseofpollutantsfromaspecificactivity,
typically expressed as a mass of pollutant emitted per unit time. • ‘Fuelmix’–thecombinationofdifferenttypesoffuelusedbyasourcee.g.
diesel, coal, gas etc.
Formula The indicator is the year on year percentage reductions of primary PM10 and NOx, calculated as follows:
1) Emissions of NOx
• Emissionfactorxdistancexno.ofvehicles(foreachvehicletype)=tonnesNOx
• Averageemissionfactorxfuelmixxenergyuse=tonnesNOx
This indicator will require local authorities to calculate emissions of NOx from their estates and operations. Defra has developed an easy-to-use tool for calculating emissions of NOx for the purpose of this indicator (see web link above). The tool is a user friendly spreadsheet into which authorities will input data to calculate emissions of NOx. Default options are available where detailed information is missing for any of the emission sources.
For vehicle emissions, additional information on distance travelled, number and type of vehicle and fuel mix will be input into the emissions tool.
2) Percentage reduction in NOx emissions:
100*x
yx
where:
x = is tonnes of NOx emitted in the local authority estate & operations in the previous year;
y = is tonnes of NOx emitted through local authority estate & operations in the current year.

Annex 4: Local Economy and Environmental Sustainability 131
NI 194: Air quality – % reduction in NOx and primary PM10 emissions through local authority’s estate and operations (continued)
Formula (continued)
3) Emissions of PM10
• Emissionfactorxdistancexno.ofvehicles(foreachvehicletype)=tonnesPM10
• Averageemissionfactorxfuelmixxenergyuse=tonnesPM10 This indicator will require local authorities to calculate emissions of PM10 from their estates and operations. Defra has developed an easy-to-use tool for calculating emissions of PM10 for the purpose of this indicator (see web link above). The tool is a user friendly spreadsheet into which authorities will input data to calculate emissions of PM10. Default options are available where detailed information is missing for any of the emission sources.
For vehicle emissions, additional information on distance travelled, number and type of vehicle and fuel mix will be input into the emissions tool.
4) Percentage reduction in PM10 emissions:
100*x
yx
where:
x = is tonnes of PM10 emitted in the local authority estate & operations in the previous year;
y = is tonnes of PM10 emitted through local authority estate & operations in the current year.

132 National Indicators for Local Authorities and Local Authority Partnerships: Handbook of Definitions
NI 194: Air quality – % reduction in NOx and primary PM10 emissions through local authority’s estate and operations (continued)
Worked example
Calculation method is exactly the same for PM10 and NOx. An example is given for NOx.NOx emissions 2008 Local authority estate = 42.5 tonnes; Local authority vehicles = 57.5 tonnes;Total 2008 emissions = 100.0 tonnes.NOx emissions 2009Local authority estate = 40.0 tonnes; Local authority vehicles = 55.0 tonnes;Total 2010 emissions = 95.0 % reduction for year =
%0.5100*100
95100
Good performance
Year on year % reductions
Collection interval
Annual – calendar year from Jan-Dec.
Data Source Data to be provided by Local Authority using spreadsheet tool (published on the Defra website)
Return Format Annual % primary PM10 reduction; annual % NOx reduction; total primary PM10 tonnes; and total NOx tonnes.
All 4 are calculated using agreed spreadsheet methodology.
Decimal Places One
Reporting organisation
Local authority to report direct to Defra, using the excel spreadsheet tool.
Spatial level Single tier, district and county council
Further Guidance
Emissions tool for this indicator – www.defra.gov.uk/environment/airquality/local/indicator.htm
Further guidance will be included in the update of the Local Air Quality Management Technical Guidance (LAQM.TG(08)), available later in 2008.

Annex 4: Local Economy and Environmental Sustainability 133
NI 195: Improved street and environmental cleanliness (levels of litter, detritus, graffiti and fly posting)
Is data provided by the LA or a local partner?
Y Is this an existing indicator? Y
Rationale The percentage of relevant land and highways that is assessed as having deposits of litter, detritus, graffiti and fly-posting that fall below an acceptable level.
Reducing unacceptable levels of litter, detritus, fly-posting and graffiti forms a key part of Government’s ‘Cleaner Safer Greener Communities’. Through the improved management information delivered to authorities by the indicator, they should aim to reduce the score year-on-year.
Definition This indicator was previously collected as BVPI 199 in 2007/08 and has remained unchanged.
The indicator is reported as four parts, one for each element of environmental and street cleanliness: NI195 (a) Litter, (b) Detritus, (c) Graffiti, (d) Fly-posting.
A definition of each of the elements is provided below:
Litter
There is no statutory definition of litter. The Environmental Protection Act 1990 (s.87) states that litter is ‘anything that is dropped, thrown, left or deposited that causes defacement, in a public place’. This accords with the popular interpretation that ‘litter is waste in the wrong place’.
However, local authority cleansing officers and their contractors have developed a common understanding of the term and the definition used for NI 195 (and for the LEQSE) is based on this industry norm.
Litter includes mainly synthetic materials, often associated with smoking, eating and drinking, that are improperly discarded and left by members of the public; or are spilt during waste management operations.
Grade A is given where there is no litter or refuse; grade B is given where a transect is predominantly free of litter and refuse except for some small items; grade C is given where there is a widespread distribution of litter and refuse, with minor accumulations; and grade D where a transect is heavily littered, with significant accumulations.
Three Intermediate Grades will also be used. These are:
B +, between Grade A and Grade B;
B – , between Grade B and Grade C; and
C –, between Grade C and Grade D

134 National Indicators for Local Authorities and Local Authority Partnerships: Handbook of Definitions
NI 195: Improved street and environmental cleanliness (levels of litter, detritus, graffiti and fly posting) (continued)
Definition (continued)
Detritus
There is no statutory definition of detritus, however, local authority cleansing officers and their contractors have developed a common understanding of the term and the definition used for the NI 195 (and for the LEQSE) is based on this industry norm.
Detritus comprises dust, mud, soil, grit, gravel, stones, rotted leaf and vegetable residues, and fragments of twigs, glass, plastic and other finely divided materials. Detritus includes leaf and blossom falls when they have substantially lost their structure and have become mushy or fragmented.
Grade A is given where there is no detritus present on a transect; grade B is given where a transect is predominantly free of detritus except for some light scattering; grade C is given where there is a widespread distribution of detritus with minor accumulations; and grade D where a transect is extensively covered with detritus with significant accumulations.
Three Intermediate Grades will also be used. These are:
B +, between Grade A and Grade B;
B – , between Grade B and Grade C; and
C –, between Grade C and Grade D
GraffitiGraffiti is defined as any informal or illegal marks, drawings or paintings that have been deliberately made by a person or persons on any physical element comprising the outdoor environment, with a view to communicating some message or symbol etc. to others.
Graffiti should be recorded if it is visible from relevant land and highways (in other words, from the survey transect), on the surface of any building, wall, fence or other structure or erection, where that surface is readily visible from a place on that land or highway to which the public have access.
Grade A is given when the local environment is completely free of graffiti; grade B is given when some graffiti is present, but it is minor in extent, and many people passing through the local environment would not notice it; grade C is given when graffiti is present to the extent that it would be clearly visible to people passing through the local environment, and visible at a distance from at least one end of the 50m transect; and grade D is given when graffiti is extensive over a large part of the 50m transect and is likely to be clearly visible and obtrusive to people passing through the local environment, and visible from any point on the transect.
Three Intermediate Grades will also be used. These are:
B +, between Grade A and Grade B;
B – , between Grade B and Grade C; and
C –, between Grade C and Grade D.
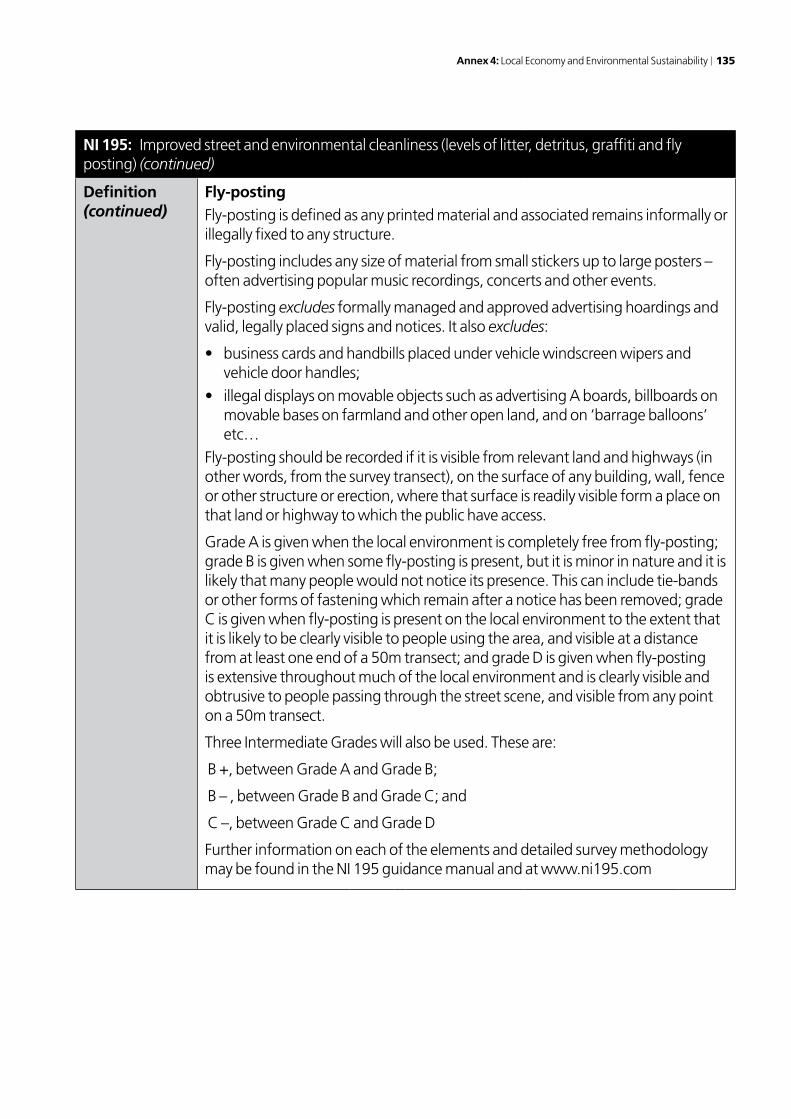
Annex 4: Local Economy and Environmental Sustainability 135
NI 195: Improved street and environmental cleanliness (levels of litter, detritus, graffiti and fly posting) (continued)
Definition (continued)
Fly-postingFly-posting is defined as any printed material and associated remains informally or illegally fixed to any structure.
Fly-posting includes any size of material from small stickers up to large posters – often advertising popular music recordings, concerts and other events.
Fly-posting excludes formally managed and approved advertising hoardings and valid, legally placed signs and notices. It also excludes:
• businesscardsandhandbillsplacedundervehiclewindscreenwipersandvehicle door handles;
• illegaldisplaysonmovableobjectssuchasadvertisingAboards,billboardsonmovable bases on farmland and other open land, and on ‘barrage balloons’ etc…
Fly-posting should be recorded if it is visible from relevant land and highways (in other words, from the survey transect), on the surface of any building, wall, fence or other structure or erection, where that surface is readily visible form a place on that land or highway to which the public have access.
Grade A is given when the local environment is completely free from fly-posting; grade B is given when some fly-posting is present, but it is minor in nature and it is likely that many people would not notice its presence. This can include tie-bands or other forms of fastening which remain after a notice has been removed; grade C is given when fly-posting is present on the local environment to the extent that it is likely to be clearly visible to people using the area, and visible at a distance from at least one end of a 50m transect; and grade D is given when fly-posting is extensive throughout much of the local environment and is clearly visible and obtrusive to people passing through the street scene, and visible from any point on a 50m transect.
Three Intermediate Grades will also be used. These are:
B +, between Grade A and Grade B;
B – , between Grade B and Grade C; and
C –, between Grade C and Grade D
Further information on each of the elements and detailed survey methodology may be found in the NI 195 guidance manual and at www.ni195.com

136 National Indicators for Local Authorities and Local Authority Partnerships: Handbook of Definitions
NI 195: Improved street and environmental cleanliness (levels of litter, detritus, graffiti and fly posting) (continued)
Formula Once all sites have been surveyed, the formula to be used for each of the four elements of the indicator (litter, detritus, graffiti and fly-posting) is:
100*2
⎟⎟⎟⎟
⎠
⎞
⎜⎜⎜⎜
⎝
⎛⎟⎠
⎞⎜⎝
⎛+
Ts
TbT
where:
T = number of sites graded C, C –, or D for each individual element (litter, detritus, graffiti and fly-posting);
Tb = number of sites graded at B- for each individual element (litter, detritus, graffiti and fly-posting) (this grade counts as half);
Ts = total number of sites surveyed for the relevant element (litter, detritus, graffiti and fly-posting) (900 minimum with the exception of the detritus indicator which may be less than 900 where sites are not suitable for detritus grading).
Worked example
For example, where 30 sites have been graded either C, C –, or D and 90 sites have been graded B-, the calculation would give:
100*900
29030
⎟⎟⎟⎟
⎠
⎞
⎜⎜⎜⎜
⎝
⎛⎟⎠
⎞⎜⎝
⎛+
= 8%
NB – This calculation will automatically be given using the standard spreadsheet available to download from www.ni195.com
Good performance
The lower the percentage score the better the standard of cleanliness
Collection interval
Annually (1st April – 31st March)
Based on surveys carried out over three four month periods:
April – July; August – November; December – March.
Data Source (if external)
Local Authorities using the NI195 Spreadsheet

Annex 4: Local Economy and Environmental Sustainability 137
NI 195: Improved street and environmental cleanliness (levels of litter, detritus, graffiti and fly posting) (continued)
Return Format Percentage (4 separate values).
Decimal Places Zero
Reporting organisation
Defra
Spatial level Single tier and district councils
Further Guidance
Further advice on survey planning, illustrative photographs and a spreadsheet for reporting are available at www.NI195.com

138 National Indicators for Local Authorities and Local Authority Partnerships: Handbook of Definitions
NI 196: Improved street and environmental cleanliness – fly tipping
Is data provided by the LA or a local partner?
Y Is this an existing indicator? Y
Rationale Reducing the incidents of illegally dumped waste or ‘fly-tipping’ forms a key part of Government’s Cleaner Safer Greener Communities work and its Waste Strategy for England which was published in May 2007.
Through the management information collected through the Flycapture database, local authorities should aim to reduce the total number of fly-tipping incidents year on year. The data collected is also a key evidence base for formulation of national policy.
There are direct links to Community and Local Government’s priority 5 – transforming the environment, and to priority 4 – safer communities because of the links between local environmental quality and people’s perceptions of personal safety.
Defra has been developing a strategy to help deal with the problem of fly-tipping which has five strands:
• ensuringbetterprevention,detectionandenforcementofflytippingandother forms of illegal waste dumping. The Government is of the firm belief that more effort spent on these aspects will mean less needs to be spent on clear-up and will result in cost savings;
• makingexistinglegislationmoreusableandeffective;• extendingtherangeofpowersavailableinthetoolkitsothattheAgencyand
local authorities can be more flexible when dealing with fly tipping;• improvingthedataandknowledgebasesothatexistingresourcescanbe
better targeted; and • ensuringtheEnvironmentAgencyandlocalauthoritiescandotheirjobas
effectively as possible and ensuring that waste producers take responsibility for having their waste legally managed.
Definition The indicator measures a local authority’s performance based on a combination of calculating its year on year change in total incidents of fly-tipping dealt with, compared with its year on year change in enforcement actions taken against fly-tipping.
Good performance is indicated by a decrease in incident numbers in and an increase in enforcement action. A better score will be achieved if incident numbers only are reduced as opposed to enforcement numbers only are increased
Enforcement actions consist of investigations, warning letters, statutory notice, fixed penalty notice, duty of care inspection, stop and search, formal caution and prosecution.

Annex 4: Local Economy and Environmental Sustainability 139
NI 196: Improved street and environmental cleanliness – fly tipping (continued)
Definition (continued)
Fly-tipping
It is an offence to illegally dispose of waste. This is colloquially known as fly-tipping. Section 33 of the Environmental Protection Act 1990 (EPA 1990) sets out the offence. It is an offence to:
• Depositcontrolledwaste,orknowinglycauseorknowinglypermitcontrolledwaste to be deposited without a waste management licence;
• Treat,keepordisposeofcontrolledwaste,orknowinglycauseorknowinglypermit controlled waste to be treated, kept or disposed of except under or in accordance with a waste management licence; or
• Treat,keepordisposeofcontrolledwasteinamannerlikelytocausepollutionof the environment or harm to human health
As fly-tipping may involve a number of factors, including intent, it is down to a local authority to decide whether a deposit of waste is a fly-tip. Defra has produced guidance (http://www.environment-agency.gov.uk/commondata/acrobat/flycapture_guidance_678476.pdf) for local authorities to ensure that data reported is as consistent as possible.
Flycapture is a record of fly-tipping incidents and therefore incidents of waste placed out for collection outside of the timeframe set by the local authority should not be recorded.
ASB Act 2003 & Flycapture
The Anti-Social Behaviour Act 2003 requires waste collection authorities and the Environment Agency (the Agency) to submit data to Government on the types and quantities of fly-tipping incidents they deal with. Defra has worked with the Environment Agency and the Local Government Association to develop a web-based system called Flycapture that enables local authorities and the Agency to comply with the requirements under the ASB Act. Flycapture went live from April 2004.
This indicator uses Flycapture as a measurement of baseline data for fly-tipping. The categories and fields used in the Flycapture system have been specifically designed to suit the problem of fly-tipping and properly highlight steps taken to deal with it.

140 National Indicators for Local Authorities and Local Authority Partnerships: Handbook of Definitions
NI 196: Improved street and environmental cleanliness – fly tipping (continued)
Formula The indicator measures a local authority’s performance based on a combination of calculating its year on year change in total incidents of fly-tipping dealt with, compared with its year on year change in enforcement actions taken against fly-tipping.
A weighting is applied to each type of incident and enforcement action in order to recognise the differing effort involved in clearing larger fly-tips and the deterrent effect of enforcement. For example, ‘significant multiple loads’ are weighted greater than ‘single items’; while for incidents ‘prosecution’ are weighted higher than ‘warning letters’.
The table below illustrates the marking awarded to the various combinations:
Number of Enforcement Action
Number of Incidents
of Fly Tipping
Increasing actions
Same level of actions
Decreasing actions
DecreaseGrading 1
Very EffectiveGrading 2 Effective
Grading 2 Effective
SameGrading 3
Not EffectiveGrading 3
Not EffectiveGrading 3
Not Effective
IncreaseGrading 3
Not EffectiveGrading 3
Not EffectiveGrading 4
Poor
The table illustrates the effectiveness of an authority in reducing the total numbers of incidents over the year but also highlights enforcement action taken to prosecute and prevent incidents in future. It is important for authorities to focus on this type of pro-active prevention rather than only clear incidents. (NB. The positive effect of other pro-active measures, such as education and awareness-raising, should contribute and feed through to a reduction in incident numbers over time)
Performance will be measured on baseline data gathered from the previous year so will be specifically matched to a local authorities’ problem. It is considered more effective to reduce the total number of incidents of fly-tipping rather than just increase actions taken on screen 2. Each type of incident and each type of enforcement action is given a weighting which will influence the final marking.
There is a standard variable of 5% built in to the score calculation. This means that increases or decreases of up to 5% in incident numbers and enforcement actions will be classed as ‘the same’.
The scores will be reported in the format above, although the data contributing to the score i.e. numbers of incidents and enforcement actions are available and are publicly reported at a high level by Defra every year. Data at a greater level of detail are regularly supplied to Parliament and the media.

Annex 4: Local Economy and Environmental Sustainability 141
NI 196: Improved street and environmental cleanliness – fly tipping (continued)
Formula (continued)
Flycapture returns are due monthly on the 17th of the following month. There is a final cut-off date of the 25th of the month, after which data will not usually be accepted. Returns can be submitted via the web-based screens or via an attachment to an email.
Defra will work with the Flycapture coordinator to carry out an annual sample survey of data collection and reporting for Flycapture. 5% (18) of all English waste collection authorities registered for Flycapture will be surveyed to ensure that authorities are not submitting unreliable data returns and that information is being collected correctly.
Worked example
N/A Good performance
Good performance is indicated by a decrease in incident numbers in and an increase in enforcement action. A better score will be achieved if incident numbers only are reduced as opposed to enforcement numbers only are increased.
Collection interval
LA’s report on a monthly basis to Flycapture – analysis is completed on a financial year.
Data Source Flycapture Database
Return Format Very Effective/ Effective/ Not Effective/Poor
Decimal Places N/A.
Reporting organisation
Environment Agency, on an annual basis using data submitted by local authorities to the flycapture database.
Spatial level Waste Collection Authorities (Metropolitan Authorities, London boroughs, unitary authorities, district councils).
Further Guidance
Detailed guidance on completing Flycapture returns can be found at: http://www.environment-agency.gov.uk/subjects/waste/306772/596853/ 596936/?version=1&lang=_e
The Flycapture database can be accessed at: (Login Required) https://www.environment-agency.gov.uk/apps/flycapture/
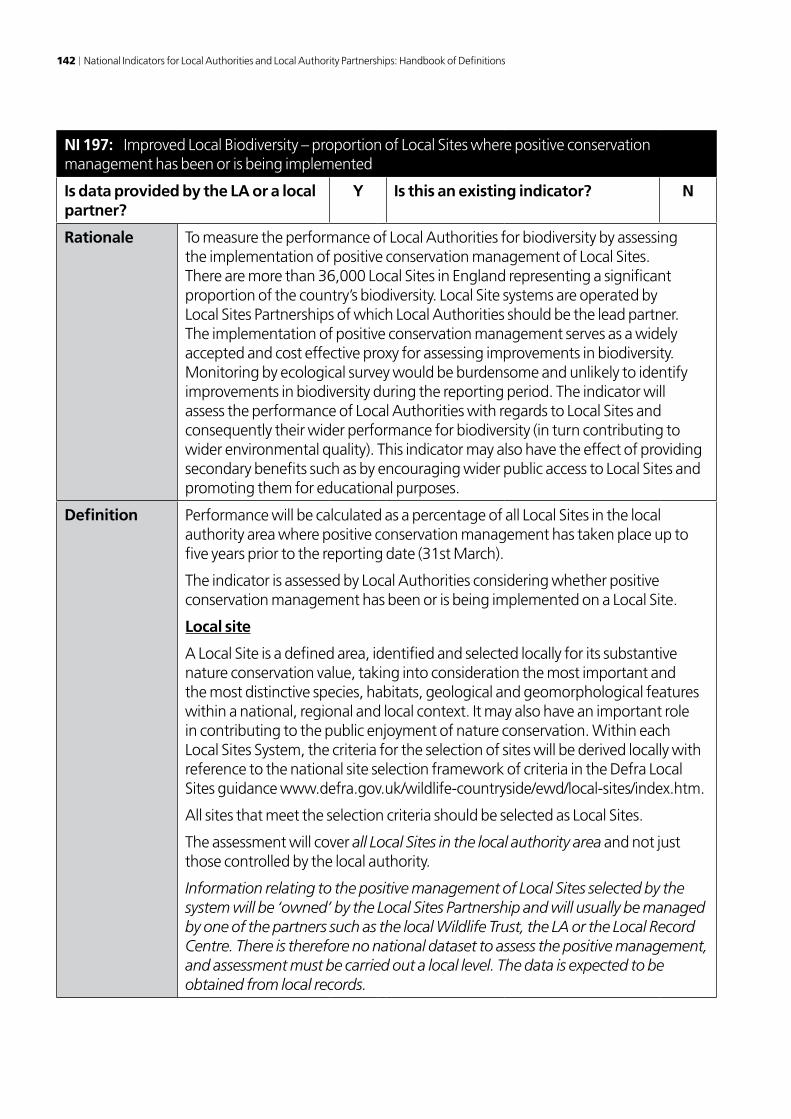
142 National Indicators for Local Authorities and Local Authority Partnerships: Handbook of Definitions
NI 197: Improved Local Biodiversity – proportion of Local Sites where positive conservation management has been or is being implemented
Is data provided by the LA or a local partner?
Y Is this an existing indicator? N
Rationale To measure the performance of Local Authorities for biodiversity by assessing the implementation of positive conservation management of Local Sites. There are more than 36,000 Local Sites in England representing a significant proportion of the country’s biodiversity. Local Site systems are operated by Local Sites Partnerships of which Local Authorities should be the lead partner. The implementation of positive conservation management serves as a widely accepted and cost effective proxy for assessing improvements in biodiversity. Monitoring by ecological survey would be burdensome and unlikely to identify improvements in biodiversity during the reporting period. The indicator will assess the performance of Local Authorities with regards to Local Sites and consequently their wider performance for biodiversity (in turn contributing to wider environmental quality). This indicator may also have the effect of providing secondary benefits such as by encouraging wider public access to Local Sites and promoting them for educational purposes.
Definition Performance will be calculated as a percentage of all Local Sites in the local authority area where positive conservation management has taken place up to five years prior to the reporting date (31st March).
The indicator is assessed by Local Authorities considering whether positive conservation management has been or is being implemented on a Local Site.
Local site
A Local Site is a defined area, identified and selected locally for its substantive nature conservation value, taking into consideration the most important and the most distinctive species, habitats, geological and geomorphological features within a national, regional and local context. It may also have an important role in contributing to the public enjoyment of nature conservation. Within each Local Sites System, the criteria for the selection of sites will be derived locally with reference to the national site selection framework of criteria in the Defra Local Sites guidance www.defra.gov.uk/wildlife-countryside/ewd/local-sites/index.htm.
All sites that meet the selection criteria should be selected as Local Sites.
The assessment will cover all Local Sites in the local authority area and not just those controlled by the local authority.
Information relating to the positive management of Local Sites selected by the system will be ‘owned’ by the Local Sites Partnership and will usually be managed by one of the partners such as the local Wildlife Trust, the LA or the Local Record Centre. There is therefore no national dataset to assess the positive management, and assessment must be carried out a local level. The data is expected to be obtained from local records.

Annex 4: Local Economy and Environmental Sustainability 143
NI 197: Improved Local Biodiversity – proportion of Local Sites where positive conservation management has been or is being implemented (continued)
Definition (continued)
Positive conservation management is management that contributes to maintaining or enhancing the features of interest for which a site has been selected. To show that positive conservation management has been or is being implemented on a Local Site, there must be documented evidence of appropriate management activities. The Local Sites Partnership will verify the evidence. The nature of the management activity appropriate to interest features of a site will commonly be defined within one, or more of the following:
• sitemanagementplan• managementschemes–agri-environmentorconservationmanagement
agreement or scheme• relevantBiodiversityActionPlan(includinghabitatactionplan,speciesaction
plan or local biodiversity action plan). Where a site is designated primarily for its geological features, the recommended management activity may be defined within a Geodiversity action plan
• managementguidanceandadvice
A five year period is appropriate as many sites do not require annual management and the Local Sites guidance recommends monitoring on a 5-10 year rolling programme.
Formula The indicator will be a simple percentage calculated as follows:
X/Y x 100
X is the number of sites in the Local Authority area where positive conservation management has been or is being implemented during the last five years.
Y is the total number of sites in the Local Authority area at the time of reporting.
Worked example
Total Number of sites in the Local Authority area = 446
Number of sites under positive management = 221
221/446 x 100 = 50%
Good performance
Good performance is indicated by an increase in the percentage of sites under positive conservation management year on year.
Collection interval
Annual.
Position reported as at 31st March each year.
Data Source (if external)
Local Sites Partnership
Return Format Percentage Decimal Places Zero
Reporting organisation
Local authority

144 National Indicators for Local Authorities and Local Authority Partnerships: Handbook of Definitions
NI 197: Improved Local Biodiversity – proportion of Local Sites where active conservation management is being achieved (continued)
Spatial level Single tier, district and county councils
Further Guidance
A Local Sites Partnership provides a framework for establishing and administering a Local Sites system. Local Authorities (LAs) should provide leadership in establishing and maintaining these partnerships and systems. Local Sites Partnerships are expected to support LAs in obtaining the evidence to report on the indicator.
The Local Sites Partnership will verify the evidence showing the site is under positive conservation management. Where LAs have limited involvement in the partnerships Natural England will assist in verifying the data in the short term. Where there is any doubt or insufficient evidence the site should not score. LAs are expected to report evidence from the last five years by 31 March of the reporting year i.e. for reporting 31 March 09 evidence collected between April 04 and March 09 may be used.
Further detailed guidance including a checklist of activities which would qualify as positive conservation management is available at:
www.defra.gov.uk/environment/localgovindicators/index.htm.
National guidance on Local Sites can be found in Defra guidance published in 2006, available at www.defra.gov.uk/wildlife-countryside/ewd/local-sites/index.htm which provides common minimum standards to which all Local Sites systems should operate. Local sites are also known as, amongst others, Wildlife Sites, County Wildlife Sites and Sites of Importance for Nature Conservation (SINCs).

Annex 4: Local Economy and Environmental Sustainability 145
NI 198: Children travelling to school – mode of transport usually used
Is data provided by the LA or local partner?
Y Is this an existing indicator? Y
Rationale Provides information to help local authorities monitor and manage road traffic associated with the school run with a view to reducing the proportion of children travelling by car and increasing the proportion walking, cycling or using public transport. There is already evidence that children who walk or cycle to school are fitter and more ready to learn when they arrive at school and this indicator will further enable local authorities and central government to identify the extent of the correlation between the way children travel to school and levels of obesity, their health, fitness and level of academic attainment.
Definition The indicator measures the proportion of school aged children in full time education travelling to school by the mode of travel that they usually use.
Mode of transport is defined as six modes: cars (including vans and taxis, even if a taxi is carrying more than one child), car share, public transport, walking, cycling, and other.
County Councils, Single tier Authorities and Passenger Transport Authorities in England already calculate mode share of travel to school to enable them to set a target for Local Transport Plan Mandatory Indicator number LTP4 and detailed guidance on the methodology and definition of modes of travel is contained in DfT’s Updated guidance on the LTP Mandatory Indicator on Mode Share of Journeys to School (LTP4) August 2006. The same methodology should be used to collect data, calculate mode share and set targets for the LAA Mode Share of Travel to School Indicator, except that, for the purpose of reporting against the LAA Indicator, local authorities are asked to calculate mode shares separately for children aged 5-10 years and children aged 11-16 years. This is because the proportion of children travelling by each mode varies considerably between the two age groups and it is therefore helpful to both local authorities and central government to receive separate information.
London authorities will use data collected from schools with school travel plans, through the School Census. Data is collected and submitted using the iTRACE system.
If a local authority chooses to set a target for this indicator, the target will be based on the overall proportion of children travelling to school by car (including vans and taxis) for one overall age group: age 5-16 years. No targets will be required for other modes of travel or for separate age groups.

146 National Indicators for Local Authorities and Local Authority Partnerships: Handbook of Definitions
NI 198: Children travelling to school – mode of transport usually used (continued)
Formula The indicator is reported as twelve separate parts, according to six modes of transport (cars including vans and taxis, car share, public transport, walking, cycling, and other) each within two age groupings (children aged 5-10 years and children aged 11-16 years).
Within each age group, the shares for each of the six modes of transport are calculated as follows:
1006
1nn
n
x
x
nx = number of children responding (aged 5-10 years, or 11-16 years) travelling by a single mode of transport. For example, x is the number of children travelling by car (including vans and taxis).
6
1nnx
= total number of children (aged 5-10 years, or 11-16 years) travelling by all modes of transport.
Worked example
Of 1,000 children aged 5-10 years travelling to school, 165 children travel to school by car (including vans and taxis). The proportion travelling by car is therefore 16.5%.
Good performance
Good performance is typified by achieving a reduction in the percentage of children aged 5-16 years who travel to school by car.
Collection interval
Annual. London authorities collect and submit data from schools with school travel plans through the iTRACE system three times a year.
Data Source Collection of mode of travel to school data via the School Census route is mandatory at pupil level for all schools with an ‘approved school travel plan’.
(An ‘approved school travel plan’ Is one that has met the DfT/ DCSF national minimum standard for school travel plans as set out in the School Travel Plan Quality Assurance – Advice Note September 2007. School travel plans are required to meet this standard in order to be approved for allocation of a Devolved Formula Capital (DFC) grant by DCSF.
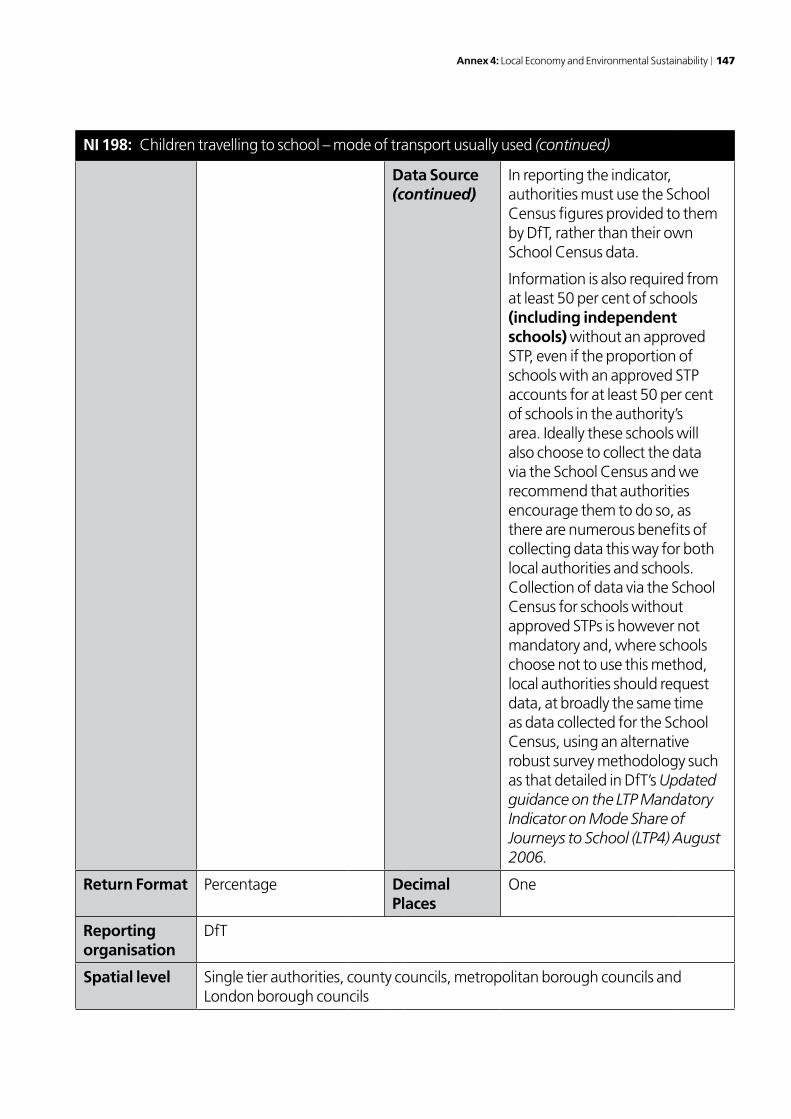
Annex 4: Local Economy and Environmental Sustainability 147
NI 198: Children travelling to school – mode of transport usually used (continued)
Data Source (continued)
In reporting the indicator, authorities must use the School Census figures provided to them by DfT, rather than their own School Census data.
Information is also required from at least 50 per cent of schools (including independent schools) without an approved STP, even if the proportion of schools with an approved STP accounts for at least 50 per cent of schools in the authority’s area. Ideally these schools will also choose to collect the data via the School Census and we recommend that authorities encourage them to do so, as there are numerous benefits of collecting data this way for both local authorities and schools. Collection of data via the School Census for schools without approved STPs is however not mandatory and, where schools choose not to use this method, local authorities should request data, at broadly the same time as data collected for the School Census, using an alternative robust survey methodology such as that detailed in DfT’s Updated guidance on the LTP Mandatory Indicator on Mode Share of Journeys to School (LTP4) August 2006.
Return Format Percentage Decimal Places
One
Reporting organisation
DfT
Spatial level Single tier authorities, county councils, metropolitan borough councils and London borough councils

148 National Indicators for Local Authorities and Local Authority Partnerships: Handbook of Definitions
NI 198: Children travelling to school – mode of transport usually used (continued)
Further Guidance
Guidance is contained in DfT’s Updated guidance on the LTP Mandatory Indicator on Mode Share of Journeys to School (LTP4) August 2006, which is available on the DfT’s website at: http://www.dft.gov.uk/pgr/statistics/datatablespublications/ltp/technicalguidanceonmonitorin5174?page=6#a1005Guidance on data collection via the School Census is contained in School Census: guidance and preparation for 2008 is available on DCSF’s Teachernet website at: http://www.teachernet.gov.uk/management/ims/datacollections/sc2008