Embed Size (px)
Citation preview

NATIONAL ICT SURVEY
REPORT
June 2011

i
TABLE OF CONTENTS
LIST OF TABLES ............................................................................................................................. iii
LIST OF FIGURES ............................................................................................................................ iv
ACRONYMS/ABBREVIATIONS ...................................................................................................... v
ACKNOWLEDGEMENT ................................................................................................................. vi
EXECUTIVE SUMMARY ................................................................................................................ vii
CHAPTER 1: INTRODUCTION ................................................................................................. 1
1.0 Background ...................................................................................................................... 1
1.1 The National ICT Study .................................................................................................... 1
1.3 Justification ....................................................................................................................... 2
CHAPTER 2: SURVEY ORGANIZATION AND METHODOLOGY ............................................ 3
2.1 Survey organization ......................................................................................................... 3
2.2 Sample design and weighting .......................................................................................... 3 2.2.1 The Sample Frame .......................................................................................................... 3 2.2.2 Survey domains ............................................................................................................... 4 2.2.3 Estimation of Sample Size .............................................................................................. 4 2.2.4 Stratification .................................................................................................................... 4 2.2.5 Selection of the Clusters for the Survey ........................................................................ 5 2.2.6 Selection of the Households ........................................................................................... 5 2.2.7 Weighting the Sample Data ........................................................................................... 5 2.2.8 Estimation of the Population Parameters ...................................................................... 6 2.2.9 Allocation of the sample to domains ............................................................................. 6
2.3 Selection of Household Businesses ................................................................................... 7
2.4 Training and Data Collection ........................................................................................... 7 2.4.1 Training ........................................................................................................................... 7 2.4.2 Data collection ................................................................................................................ 7 2.4.3 Response rates ................................................................................................................. 7
2.5 Data Processing ................................................................................................................ 8
CHAPTER 3: HOUSEHOLD CHARACTERISTICS ...................................................................... 9
3.1 Household Characteristics ............................................................................................... 9
3.2 Population by Age and Sex ............................................................................................... 9
3.3 Household Composition ................................................................................................... 9
3.4 Percentage Distribution by Level of Education Reached ................................................. 9
3.5 Household Size ............................................................................................................... 12
3.6 Household headship ....................................................................................................... 13
3.7 Distribution of the Level of Literacy .............................................................................. 13
3.8 Employment .................................................................................................................... 14
3.9 Persons with Disabilities ................................................................................................ 16 10.9 ..............................................................................................................................................17

ii
3.10 Source of electricity .................................................................................................... 17
CHAPTER 4: ACCESS, USAGE AND OWNERSHIP OF ICT FACILITIES BY HOUSEHOLDS AND INDIVIDUALS 20
4.1 Introduction .................................................................................................................... 20
4.2 Access.............................................................................................................................. 20
4.3 Distance Travelled to Access ICT Facilities .................................................................... 23
4.4 Use of Computers ........................................................................................................... 25
4.5 Use of Internet ................................................................................................................ 27
4.6 Ownership ...................................................................................................................... 36
4.7 Postal Services ................................................................................................................. 38
4.8 Letters Sent...................................................................................................................... 40
4.9 Letters received ............................................................................................................... 41
CHAPTER 5: HOUSEHOLD CONSUMPTION OF SERVICES ................................................. 42
5.0 Introduction .................................................................................................................... 42
5.1 Proportions in consumption of services ........................................................................ 43
5.2 Frequency of Consumption ............................................................................................ 43
5.3 Average Consumption of Services ................................................................................. 44
CHAPTER 6: CONCLUSION ......................................................................................................... 46

iii
LIST OF TABLES
Table 2.1: Results of Household Interviews ...................................................................................... 8 Table 3.1: Percentage Distribution of Surveyed Population by Sex, Province, Age and Level of Education ............................................................................................................................................10 Table 3.2: Percentage Distribution of the level of education reached ..........................................11 Table 3.3: Percentage Distribution of Household Headship and Household Composition ........12 Table 3.4: Percentage Distribution of the level of Literacy (15+) ................................................14 Table 3.5: Percentage Distribution of the Employment status (15+) ...........................................15 Table 3. 6: Percentage Distribution Disability (2+) .......................................................................17 Table 3.7: Percentage Distribution of Source of Electricity by Province, Sex, Age and Level of Education ............................................................................................................................................18 Table 4.1: Percentage Distribution of Population with Access to ICT Equipment (3+) ..............22 Table 4.2: Average distance travelled to Access Telephone, Internet, Television and Postal Services by Province, Sex, Age and Level of Education (3+) .........................................................24 Table 4.3: Percentage Distribution of Population Who use computer in the last 12 months by place of Access (3+) ..........................................................................................................................26 Table 4.4: Percentage Distribution of Population with internet activities in the last 6 months by frequency of use (3+) .......................................................................................................................28 Table 4.5: Percentage Distribution of Population with Access to Internet in the last 12 months by place of Use (3+) ..........................................................................................................................30 Table 4.6: Percentage Distribution of Population with Access to Internet use by Purpose of Use (3+) ....................................................................................................................................................32 Table 4.7: Percentage Distribution of Population with Access to Internet use by internet activities in last 6 months (3+) ........................................................................................................33 Table 4.8: Mean Number of Times, mean Amount spend and length of mobile in the last seven days (3+) ............................................................................................................................................35 Table 4.9: Percentage Distribution of Population Who own basic household equipment (3+) 37 Table 4.10: Percentage Distribution of Population Who own internet connectivity and average spend on internet by type of connectivity (3+) ..............................................................................38 Table 4.12: Proportion of Letters send Abroad by Province, Sex, Age and Level of Education (3+) ....................................................................................................................................................40 Table 4.13: Percentage Distribution of Letters Received per year by Province, Sex, Age and Level of Education (3+) ....................................................................................................................41 Table 5.1: Percentage Distribution of Consumption of Services in the last 12 months by Province, Sex, Age and Level of Education ......................................................................................42 Table 5.2: Average Duration (in Months) for consumption of Services in the last 12 months by Province, Sex, Age and Level of Education ......................................................................................44 Table 5.3: Average Consumption (in Kshs.) for for consumption of Services in the last 12 months by Province, Sex, Age and Level of Education ...................................................................45

iv
LIST OF FIGURES
Figure 4.1: Proportion of Population with Access to Some Selected ICT Equipments (3+) ........21 Figure 4.2: Access of ICT Equipments by Sex .................................................................................23 Figure 4.3: Access to ICT Equipment by Education Level (Age 3+) ..............................................23 Figure 4.4: Use of computer in the last 12 months ........................................................................27 Figure 4.5: Use of Internet by Age in the Six Months Preceding the Survey ...............................29 Figure 4.6: Percentage Distribution of Population with Access to Internet by Purpose of Use ..31

v
ACRONYMS/ABBREVIATIONS BPO Business Process Outsourcing
CCK Communications Commission of Kenya
CSPRO Census and Survey Processing System
DVD Digital Video Disc
DNS Domain Name System
DK Don’t Know
EAC East African Community
EPSEM Equal Probability Selection Method
GDP Gross Domestics Product
GoK Government of Kenya
ICT Information and Communication Technology
IP Internet Protocol
ISPs Internet Service Providers
ITU International Telecommunications Union
KBC Kenya Broadcasting Corporation
KDHS Kenya Demographic and Health Survey
KNBS Kenya National Bureau of Statistics
KP&TC Kenya Posts and Telecommunications Corporation
KShs Kenya Shillings
LAN Local Area Network
MDGs Millennium Development Goals
MTP Medium Term Plan
NASSEP National Sample Survey and Evaluation Programme
NS Not Stated
PC Personal Computer
PCK Postal Corporation of Kenya
PEV Post Election Violence
PPS Probability Proportional to Size
RAs Research Assistants
SPSS Statistical Package for Social Sciences
TKL Telkom Kenya Limited
TV Television
VSAT Very Small Aperture Terminal
WSIS World Summit on the Information Society

vi
ACKNOWLEDGEMENT
This report presents results of the national ICT Survey conducted by the Kenya National Bureau
of Statistics [KNBS] in liaison with the Communications Commission of Kenya [CCK]. The survey
was carried out over a period of thirty days.
The ICT Survey was designed to capture data that would be used to update statistics on ICTs
such as computers, telephones – both fixed line and mobile – television and radio, with regard
to among others, access, ownership, usage and cost.
The Bureau wishes to thank the Communications Commission of Kenya, for the financial
support extended during the survey. KNBS is grateful to Matano M. Ndaro – Director CTMA,
Susan Mochache – Assistant Director -USOF, Paul Kiage, Veronicah Kimani and Godfrey
Muhatia, for the support they lent this study.
Special thanks go to the data collection team, the supervisors as well as the research assistants.
Last but not least, I sincerely thank the KNBS team who wrote this report, led by the Director
ICT - Cleophas Kiio, Samuel Kipruto, Patrick Mwaniki, Benjamin Muchiri, Samuel Njuru, Silas
Mulwa, Rogers Mumo and Katunge Kiilu.
A.K.M. Kilele, MBS
Director General
Kenya National Bureau of Statistics

vii
EXECUTIVE SUMMARY
Household Characteristics
In researching ICT penetration rates of a country, it is necessary to look at the target
population demographic characteristics that facilitate use, access and ownership of the ICT
facilities and equipments. As such, the ICT survey sought information on the general
characteristics of the sampled population, including composition by age and sex, household
size, education, employment, literacy, disability and source of electricity to households.
Employment and household size in many cases determine the household disposable income
which in turn determines whether individuals in households can afford radios, TVs, computers,
the internet and other ICTs equipments and facilities. Education contributes to the
development of human capacity building for effective use of the ICT facilities, especially the
internet. For the development and maintenance of ICT infrastructure it is important to have
other infrastructure like electricity, water, road, rail, and air transport systems in place. In
particular, electricity is a key driver of ICTs and therefore the survey sought to establish to what
extent it affects penetration rates of ICT in the country. Other characteristics like age, sex and
disability are important in informing if certain sections of the society are disadvantaged and
therefore putting the necessary policies in place to alleviate any social inequalities.
Access, Usage and ownership of ICT Facilities by Households and individuals
For many years, ICT has been at the centre stage of economic development, notably through
rapid technological advancement, facilitating speedy access of ideas and experiences, and
prompt exchange of information. In today’s world, access, usage and ownership of ICT are
fundamental in linking communities, facilitating businesses and empowering communities
socially and economically. Enhancement of access to information and communications services
in rural, remote and underserved areas is therefore crucial to accelerating development.
The results of the survey show that in most cases there is correlation between access and
usage on one hand and sex, education, and age on the other. Among the salient features of the
findings is that use and access of ICT equipments and facilities was more widespread among
the youth (20 – 34 years).

1
CHAPTER 1: INTRODUCTION
1.0 Background
For many years, the world has utilized the benefits of ICT leading to increased productivity in the
manufacturing and service sector. However, the last decade has witnessed an explosion in the
advancement of ICT technology. The benefits associated with the use of modern technology have
given ICT prominence in the eyes of the public and decision makers. Through the use of modern
technology, communication has become more reliable, faster and affordable. It is now possible to
transmit data more effectively and at minimal costs. Similarly, the manufacturing sector has been
able to achieve higher outputs through the use of automated production lines.
In order to maximize and harness the benefits of these technologies, it is imperative to regularly
take stock of the country’s level of development and utilization of the ICTs. In most instances, the
supply side data can be availed through use of administrative records from providers and the
regulatory authorities. However, the demand side statistics can only be sourced through user-
targeted studies with specific objectives. Currently, the country does not have comprehensive
data on the developments in the ICT sector, particularly at the household level. This calls for
development of appropriate sector indicators for both academic and commercial purposes.
1.1 The National ICT Study
In an effort to address the ICT data challenges, the Communications Commission of Kenya (CCK)
partnered with Kenya National Bureau of Statistics (KNBS) to undertake a comprehensive National
ICT Survey. This was planned and executed during the months of May and June 2010. The main
objective of the study was to establish the ICT access and usage levels at the household and
individual in the country, The findings of the survey will serve to inform formulation of progressive
ICT access programmes, projects and strategies in addition to providing input into the ICT Access
Gaps study.
1.2 Objectives
The main objective of the study was to collect, collate and analyse data relating to ICT access and
usage by various categorizations in Kenya. The survey captured data and information on critical
ICT indicators as defined by international bodies such as the International Telecommunications
Union (ITU). These indicators focused on household and individuals; and the data was be
disaggregated by age, gender, administrative regions, rural and urban locations. The specific
objectives of the study were to;
Obtain social economic information with a view of understanding usage patterns of ICT services;
(a) Obtain social economic information with a view of understanding usage patterns of ICT
services;
(b) Collect, collate and analyze ICT statistics in line with ICT indicators;
2
(c) Evaluate the factors that will have the greatest impact in ensuring access and usage of
ICTs and;
(d) Develop a database on access and usage of ICT in Kenya.
1.3 Justification
The country’s economic blue print, the Vision 2030, has identified ICT as a key enabler to the
attainment of the goals and aspirations of the Vision. The thrust of the Vision in the ICT Sector is
therefore to convert Kenya into a truly knowledge and information economy by enabling access to
quality, affordable and reliable ICT services in the country. An integral step in achieving this
objective is to establish the ICT access levels in the country, determine ICT access gaps that need
to be served and evaluate barriers to ICT access such as costs, literacy levels and technological
barriers. In furtherance of this objective, the Commission has committed, in its 2008-2013
Strategic Plan to undertake a comprehensive household survey to accurately establish the ICTs
penetration levels in the country. It is estimated that the outcome of this study will inform the
development strategies to accelerate access to ICT services in the country that will lay the
foundation for harnessing the true potential of the ICT sector in Kenya. In particular, the study will
identify the ICT access gaps in the country with a view to develop targeted policy interventions to
accelerate ICT access in the country.
Furthermore, the effective roll-out of ICT services in the country is predicated upon reliable and
accurate ICT data and information including ICT access demographics, and establishment of access
costs. This study therefore provides the basis for ICT household data that can formally be
employed in monitoring the sector’s development towards achieving the Vision 2030.

3
CHAPTER 2: SURVEY ORGANIZATION AND METHODOLOGY
2.1 Survey organization
The Kenya National Bureau of Statistics served as the implementing agency on behalf of
Communication Commission of Kenya (CCK) and as such played a primary role in the planning,
survey execution and analysis, and report preparation. As the implementing agency, the Bureau
undertook the responsibilities for operational matters; including planning and conducting
fieldwork and processing of collected data. The Bureau also organized for the writing of the basic
report. The day-to-day technical operations of the survey including identification and training of
field and data processing staff, and the supervision of the office and field operations were fully
undertaken under the supervision of KNBS.
To undertake the Survey, different categories of personnel were identified and trained. These
included Lead Coordinator, Regional Coordinators, Supervisors and Research Assistants (RAs). The
Identification criteria used for the selection of RA’s was based on their academic qualifications.
The minimum qualification was a diploma in any academic field. In order to execute the survey,
KNBS segmented the country into five operational regions with Seventeen field teams constituted
based on the regions and local language preference.
Each team comprised of four research assistants, one supervisor and a driver. The Field
Supervisors were responsible for at least one team. The teams were assigned to operate in areas
where their local languages are spoken. The supervisors were answerable to the Project Team
Leader (The Lead Co-Coordinator) through designated Regional Coordinators.
2.2 Sample design and weighting
2.2.1 The Sample Frame
The National Sample Survey and Evaluation Programme (NASSEP IV) maintained by the Bureau
was used as the sampling frame. The frame has 1,800 clusters spread all over the country, and
covers all socio-economic classes and hence able to get a suitable and representative sample of
the population.

4
2.2.2 Survey domains
The survey was distributed into four domains, namely:
1. National,
2. Major Urban areas,
3. Other Urban areas, and
4. Rural areas.
The major urban towns included Nairobi, Thika, Mombasa, Kisumu, Nakuru and Eldoret. All other
areas defined as urban by KNBS but fall outside the major municipalities above were categorized
as ‘other urban areas’. The rural domain was further sub-divided into their respective provinces,
excluding Nairobi which is purely urban.
2.2.3 Estimation of Sample Size
Among the indicators of this study include the percentage of the population that uses the internet
services, e-mail services, computers, mobile phones and fax machines. One device that is
commonly used by both the urban and rural population is the mobile phone and on that basis, it
was used to calculate the sample size.
The sample size was estimated using the formula
2
2
e
pqdzn
……………………………………….………… (1)
where,
n = the desired sample size, z = the critical value or the confidence coefficient or simply called abscissa of the
normal distribution curve and cuts off an area of 0.05 at the tails p = the prevalence rate for use of mobile phones,
q p1
d = the design effect and e = the allowed margin of error
In calculation of sample size, there is need to adjust for possible non-response and the design
effect. This is necessitated by the fact that under simple random sampling, the standard error of
the estimates will be lower than the standard error in the case of the two-stage cluster sample
design, which the NASSEP frame uses. Accordingly, a 10% adjustment was done after the sample
size calculation to cater for the possible non-response.
2.2.4 Stratification
For the ‘rural’ component, the districts that display identical socio-cultural and economic
conditions have been pooled together to create strata from which a representative set of districts
is selected to represent the group of such districts. A total of 42 such stratifications were done
and one district in each categorization was selected.
5
The major urban areas of the country namely Nairobi, Mombasa, Kisumu, Nakuru, Eldoret and
Thika were all sub-stratified into five sub-strata based on perceived levels of income into the:
1. Upper income
2. Lower Upper
3. Middle
4. Lower Middle and
5. Lower.
In this survey, all the six ‘major urban’ are included while just a few of the ‘other urban areas’ are
selected depending on their population (household) distribution.
2.2.5 Selection of the Clusters for the Survey
The selection of the sample clusters was done systematically using the Equal Probability Selection
method (EPSEM). Since NASSEP IV was developed using Probability Proportional to Size (PPS)
method, the resulting sample retains its properties. The selection was done independently within
the districts and the urban /rural sub-stratum.
2.2.6 Selection of the Households
From each selected cluster, an equal number of 15 households were selected systematically, with
a random start. The systematic sampling method was adopted as it enables the distribution of the
sample across the cluster evenly and yields good estimates for the population parameters.
Selection of the households was done at the office and assigned to the Research Assistants, with
strictly no allowance for replacement of non-responding households.
2.2.7 Weighting the Sample Data
The resulting sample would not be self weighting owing to the unproportional allocation of the
sample into the domains. Weights were developed to account for the selection probabilities. The
weights were developed using the design weights of the clusters, the response levels and the
number of clusters in the survey.
6
In the computation process, adjustment was done for cluster and household non-response. The
generation of the cluster weights is the product of sample cluster design weight, household and
cluster response adjustment factors. The mathematical formulation is given as follows:
hh
hihi
c
C
l
S
hihixxDW …………………………..…………………… (2)
where,
hiW = Overall cluster weight for the i-th cluster in the h-th stratum
hiD = Sample cluster design weight obtained from cluster selection probabilities for the i-
th cluster in the h-th stratum
Shi = Number of listed households in the i-th cluster in the h-th stratum
lhi = Number of responding households in i-th cluster in the h-th stratum
Ch = Number of operating clusters in h-th stratum
hc = Number of selected clusters in the h-th stratum
The weights were applied to each individual item to obtain estimates on any given variable in a
specified domain or category.
2.2.8 Estimation of the Population Parameters
The estimates for the population indicators may be proportions, ratios (means) or totals. The
estimation process involved multiplication of the weighting factor with the sample value and
summing up the products.
The population estimates included totals and ratios. In the estimation of totals, sample weights
were applied to obtain national and domain totals using the result:
hijhiYWY …………….………………………………………………... (3)
where,
Y = estimate of the total of the variable Y;
Whi = weight of the i-th cluster in the h-th domain.
Yhij = observed value of the variable Y in the h-th domain in the i-th
cluster on the j-th individual or household
For a ratio estimate, the estimates for Y and X were weighted before the estimation of the ratio
using the result:
X
YR
2.2.9 Allocation of the sample to domains
The distribution of the number of households in the survey to the clusters was determined using
the sampling fraction within the clusters. The mean size of the clusters in NASSEP IV is 100
households. A 10% sample of the households in each cluster was considered sufficient. However,
cluster sizes were not uniform with the average size being 100 households. Some clusters had
sizes falling below 100 while others exceeded the mean size of 100 households. To avoid the
complications that would arise by strictly adhering to 10% of the cluster, a uniform number of 15
households from each cluster was selected.
7
Due to the large differences in household composition in the domains, a proportional allocation
would have resulted into small un-reliable sample in ‘other urban’ domain. An alternative power
allocation method was used to allocate the sample of 8,295 into the strata. Further, a square root
allocation was used to allocate the sample of 6,075 of rural domain into their respective sub-
domains (provinces). The allocation of the sample of ‘major urban’ and ‘other urban’ domains was
done proportionately to their total number of households.
2.3 Selection of Household Businesses
During the survey, the sampled households were asked about business ownership by household
members.. The business module of the questionnaire was then administered to all household
members who reported to own/operate a business.
2.4 Training and Data Collection
2.4.1 Training
The training for fieldwork personnel took 6 days. This covered the contents of the questionnaire
as well as survey concepts, logistics and other related issues. The survey personnel were also
taken through the standard survey methodology and data collection procedures which included
among others; how to interview and record different types of responses, applying skip patterns
and cancelling wrong answers. A total of seven trainers facilitated the training.
2.4.2 Data collection
To aid in identification and access to the household, letters of introduction and identification
badges were provided to the RAs. This was in addition to facilitating the team with a village elder
recognised by the community. Prior to visiting the clusters, teams also went for courtesy calls to
the nearest provincial administration offices.
Data collection took 30 days from 30th May and 20th June 2010. Research Assistants visited
sampled households to administer the questionnaires. It took the RAs approximately 40-50
minutes to administer the questionnaire depending on the size of the household. Most of the
teams managed to collect the data within the stipulated timeframe except teams from Upper
Eastern, Nairobi and Nyanza Provinces where data collection was completed a week later owing
to various challenges that were encountered.
2.4.3 Response rates
Owing to the some logistical challenges the following clusters were partially or not covered at all:
One cluster in Tana River due to floods.
Two clusters in Molo where households shifted to safer areas after the Post Election
Violence (PEV). As a result, fewer than the expected households were covered.
One cluster in Koibatek was covered halfway due to relocation of households to pave
way for a large plantation.
8
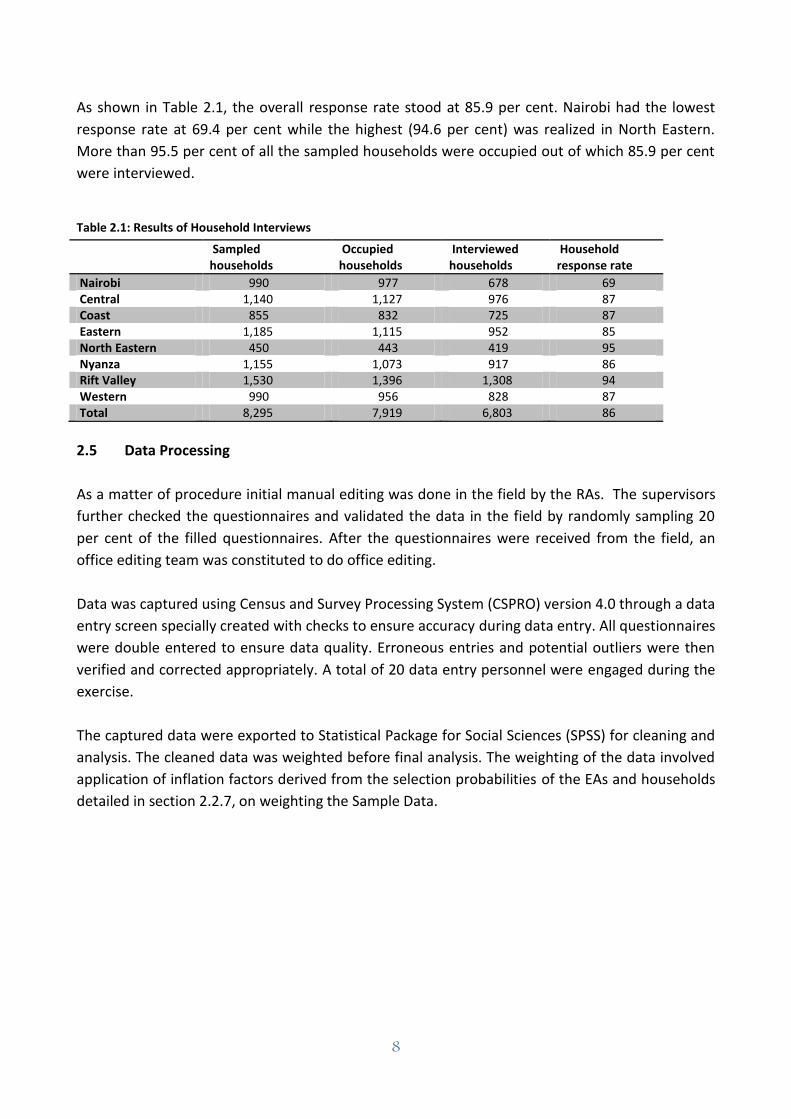
As shown in Table 2.1, the overall response rate stood at 85.9 per cent. Nairobi had the lowest
response rate at 69.4 per cent while the highest (94.6 per cent) was realized in North Eastern.
More than 95.5 per cent of all the sampled households were occupied out of which 85.9 per cent
were interviewed.
Table 2.1: Results of Household Interviews
Sampled households
Occupied households
Interviewed households
Household response rate
Nairobi 990 977 678 69 Central 1,140 1,127 976 87 Coast 855 832 725 87 Eastern 1,185 1,115 952 85 North Eastern 450 443 419 95 Nyanza 1,155 1,073 917 86 Rift Valley 1,530 1,396 1,308 94 Western 990 956 828 87 Total 8,295 7,919 6,803 86
2.5 Data Processing
As a matter of procedure initial manual editing was done in the field by the RAs. The supervisors
further checked the questionnaires and validated the data in the field by randomly sampling 20
per cent of the filled questionnaires. After the questionnaires were received from the field, an
office editing team was constituted to do office editing.
Data was captured using Census and Survey Processing System (CSPRO) version 4.0 through a data
entry screen specially created with checks to ensure accuracy during data entry. All questionnaires
were double entered to ensure data quality. Erroneous entries and potential outliers were then
verified and corrected appropriately. A total of 20 data entry personnel were engaged during the
exercise.
The captured data were exported to Statistical Package for Social Sciences (SPSS) for cleaning and
analysis. The cleaned data was weighted before final analysis. The weighting of the data involved
application of inflation factors derived from the selection probabilities of the EAs and households
detailed in section 2.2.7, on weighting the Sample Data.

9
CHAPTER 3: HOUSEHOLD CHARACTERISTICS
3.1 Household Characteristics
This chapter describes the general characteristics of the sampled population, including
composition by age and sex, household size, education, employment, literacy, disability, and
source of electricity to households. The survey further sought to establish household headship
and the industry in which the household members worked. The ICT survey adopted the definition
of Household used in the 2008/09 Kenya Demographic and Health Survey (KDHS). In the KDHS, a
household was defined as a person or a group of persons, related or unrelated, who live together
and who share a common source of food. The study was designed to consider only usual members
of the household.
3.2 Population by Age and Sex
Details on composition of the sampled population are presented in Table 3.1. A striking aspect of
the sampled population is that the share of male for the ages 0 – 19 and 50+ years is slightly
higher than that of their female counterpart. The situation reverses for the ages 20 to 49 years
where the female share is slightly higher than that of male. The population distribution by sex and
age corresponds to a typical population pyramid save for a slight distortion resulting from a lower
share of age 0-4 compared to 5-9.
3.3 Household Composition
Table 3.1 further shows the percentage distribution of the population by age, sex, province and
level of education. Overall, there were as many female as male in the sampled population. About
21 per cent of the sample was from Rift Valley which was the highest, followed by Eastern with
about 16 per cent while Nairobi contributed the smallest share of 7 per cent.
3.4 Percentage Distribution by Level of Education Reached
Education contributes to the development of human capacity building and therefore key in the
effective use of ICT. The fundamental purpose of education is to gain knowledge, instil
appropriate conduct and acquire technical proficiency. It was therefore imperative for the survey
to collect basic information on education status of the population under study.
In addition to information on education supplied in Table 3.1, percentage distribution of the level
of education reached by province and by sex is presented on Table 3.2. Nationally, one in every
three persons had attained education beyond secondary school.

10
Table 3.1: Percentage Distribution of Surveyed Population by Sex, Province, Age and Level of Education
Sex Total
Male Female Province Nairobi 49.4 50.6 3,299,618 Central 49.3 50.7 4,324,897 Coast 48.9 51.1 3,546,840 Eastern 50.5 49.5 4,257,177 North Eastern 53.7 46.3 1,341,656 Nyanza 48.7 51.3 4,951,894 Rift Valley 49.7 50.3 10,971,877 Western 49.1 50.9 4,244,907 Place of Residence Rural 50.0 50.0 26,257,987 Urban 48.7 51.3 10,680,878 Age 0 - 4 yrs 51.1 48.9 4,214,323 5 - 9 yrs 48.5 51.5 5,139,627 10 - 14 yrs 54.0 46.0 5,058,472 15 - 19 yrs 51.9 48.1 3,922,314 20 - 24 yrs 45.8 54.2 3,481,259 25 - 29 yrs 41.0 59.0 2,972,159 30 - 34 yrs 50.5 49.5 2,674,732 35 - 39 yrs 47.9 52.1 2,078,368 40 - 44 yrs 51.4 48.6 1,522,959 45 - 49 yrs 47.2 52.8 1,428,640 50 - 54 yrs 57.2 42.8 1,158,931 55 - 59 yrs 49.7 50.3 799,906 60 - 64 yrs 50.7 49.3 731,303 65 - 69 yrs 47.3 52.7 491,664 70+ yrs 49.7 50.3 1,264,207 Level of Education Pre Primary 49.2 50.8 1,438,721 Primary 50.0 50.0 18,854,736 Secondary 53.0 47.0 6,274,394 Higher 56.4 43.6 1,718,180 None 45.1 54.9 8,408,775 Less than 3 yrs 34.1 65.9 178,166 Non Standard 62.3 37.7 42,817 DK 56.9 43.1 23,075 Total 49.6 50.4 36,938,865
11
Table 3.2: Percentage Distribution of the level of education reached
Level of Education Total None Less
than 3 yrs
Pre Primary
Primary Secondary Higher Non Standard DK
Province Nairobi 8.6 1.3 6.2 40.8 26.3 16.7 0.1 0.0 3,299,618 Central 12.2 0.3 3.3 53.7 25.0 5.3 0.1 0.1 4,324,897 Coast 25.4 0.1 4.8 58.6 8.6 2.1 0.4 0.1 3,546,840 Eastern 28.2 0.2 3.6 51.1 14.6 2.1 0.1 0.1 4,257,177 North Eastern 56.8 0.0 4.0 30.4 7.4 1.1 0.3 0.0 1,341,656 Nyanza 19.9 0.5 3.4 54.2 16.5 5.1 0.2 0.1 4,951,894 Rift Valley 23.7 0.7 4.4 51.9 15.7 3.6 0.0 0.1 10,971,877 Western 27.1 0.2 1.6 50.5 18.0 2.6 0.1 0.0 4,244,907 Place of Residence Rural 19.4 0.2 2.4 37.6 9.7 1.8 0.1 0.1 26,257,987 Urban 3.4 0.3 1.5 13.5 7.3 2.9 0.0 0.0 10,680,878 Sex Male 20.7 0.3 3.9 51.5 18.1 5.3 0.1 0.1 18,323,456 Female 24.8 0.6 3.9 50.6 15.8 4.0 0.1 0.1 18,615,409 Age 0 - 4 yrs 45.4 4.2 14.5 26.1 9.8 0.0 0.0 0.0 4,214,323 5 - 9 yrs 40.4 0.0 13.2 46.2 0.3 0.0 0.0 0.0 5,139,627 10 - 14 yrs 10.2 0.0 0.6 86.4 2.7 0.0 0.0 0.0 5,058,472 15 - 19 yrs 8.0 0.0 0.6 58.4 32.9 0.0 0.1 0.0 3,922,314 20 - 24 yrs 9.6 0.0 0.3 49.0 30.6 10.2 0.3 0.0 3,481,259 25 - 29 yrs 9.3 0.0 0.4 52.0 25.4 12.6 0.2 0.0 2,972,159 30 - 34 yrs 12.5 0.0 0.2 47.2 28.4 11.5 0.1 0.0 2,674,732 35 - 39 yrs 10.6 0.0 0.4 51.7 27.3 9.8 0.1 0.1 2,078,368 40 - 44 yrs 16.0 0.0 0.4 47.6 24.5 11.4 0.2 0.1 1,522,959 45 - 49 yrs 15.8 0.0 0.6 52.5 23.3 7.7 0.2 0.0 1,428,640 50 - 54 yrs 28.9 0.0 0.5 41.6 22.1 6.7 0.1 0.1 1,158,931 55 - 59 yrs 33.8 0.0 0.3 42.6 17.3 5.1 0.3 0.6 799,906 60 - 64 yrs 46.4 0.0 0.4 39.0 8.5 5.2 0.1 0.4 731,303 65 - 69 yrs 43.1 0.0 0.6 42.5 10.6 3.2 0.1 0.0 491,664 70+ yrs 63.2 0.0 2.5 27.0 4.7 1.8 0.2 0.6 1,264,207 Total 22.8 0.5 3.9 51.0 17.0 4.7 0.1 0.1 36,938,865
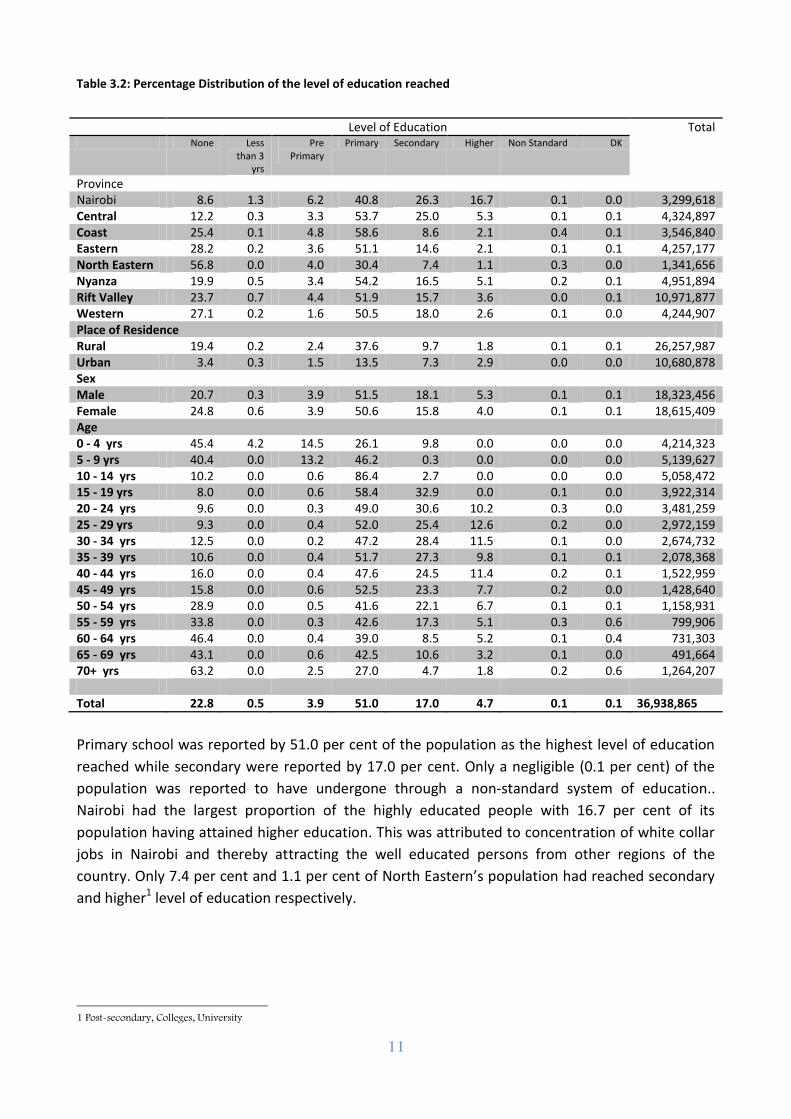
Primary school was reported by 51.0 per cent of the population as the highest level of education
reached while secondary were reported by 17.0 per cent. Only a negligible (0.1 per cent) of the
population was reported to have undergone through a non-standard system of education..
Nairobi had the largest proportion of the highly educated people with 16.7 per cent of its
population having attained higher education. This was attributed to concentration of white collar
jobs in Nairobi and thereby attracting the well educated persons from other regions of the
country. Only 7.4 per cent and 1.1 per cent of North Eastern’s population had reached secondary
and higher1 level of education respectively.
1 Post-secondary, Colleges, University
12
3.5 Household Size
Household characteristics are important in analysis as they are a pointer of the social and
economic well-being of the members of the household. In many cases, large household size may
lead to constrained financial resources and therefore lack of basic necessities. Information on the
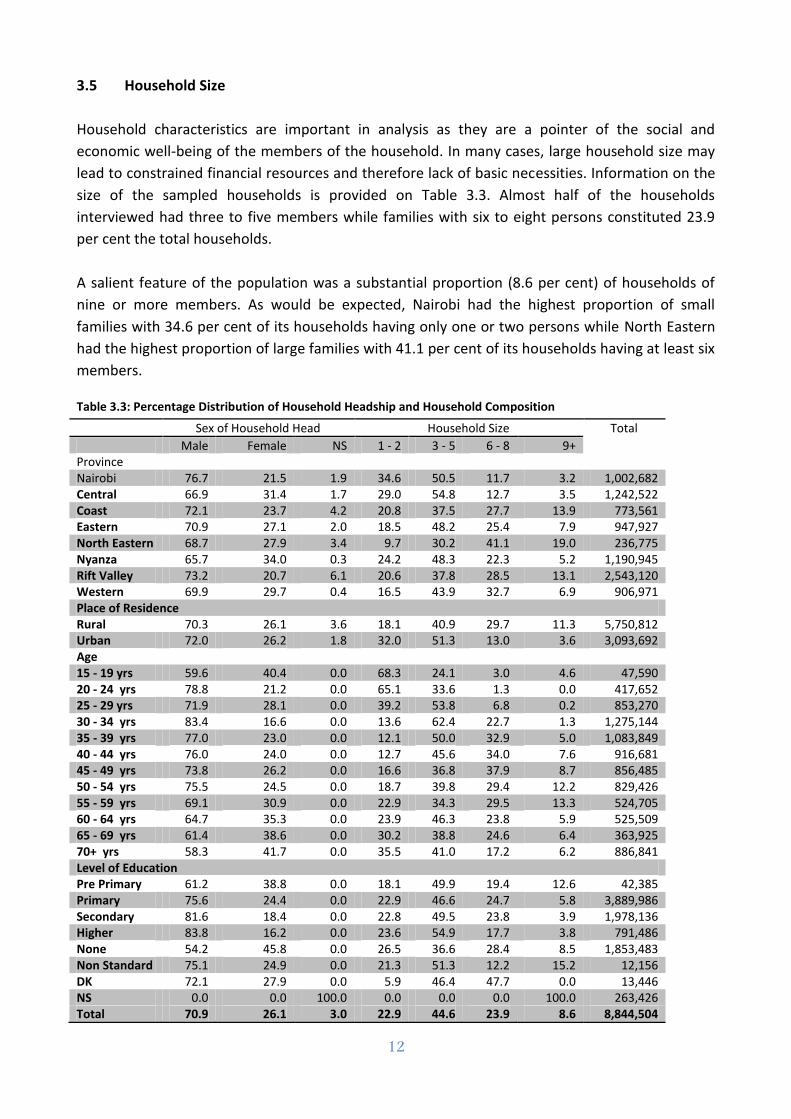
size of the sampled households is provided on Table 3.3. Almost half of the households
interviewed had three to five members while families with six to eight persons constituted 23.9
per cent the total households.
A salient feature of the population was a substantial proportion (8.6 per cent) of households of
nine or more members. As would be expected, Nairobi had the highest proportion of small
families with 34.6 per cent of its households having only one or two persons while North Eastern
had the highest proportion of large families with 41.1 per cent of its households having at least six
members.
Table 3.3: Percentage Distribution of Household Headship and Household Composition
Sex of Household Head Household Size Total
Male Female NS 1 - 2 3 - 5 6 - 8 9+ Province Nairobi 76.7 21.5 1.9 34.6 50.5 11.7 3.2 1,002,682 Central 66.9 31.4 1.7 29.0 54.8 12.7 3.5 1,242,522 Coast 72.1 23.7 4.2 20.8 37.5 27.7 13.9 773,561 Eastern 70.9 27.1 2.0 18.5 48.2 25.4 7.9 947,927 North Eastern 68.7 27.9 3.4 9.7 30.2 41.1 19.0 236,775 Nyanza 65.7 34.0 0.3 24.2 48.3 22.3 5.2 1,190,945 Rift Valley 73.2 20.7 6.1 20.6 37.8 28.5 13.1 2,543,120 Western 69.9 29.7 0.4 16.5 43.9 32.7 6.9 906,971 Place of Residence Rural 70.3 26.1 3.6 18.1 40.9 29.7 11.3 5,750,812 Urban 72.0 26.2 1.8 32.0 51.3 13.0 3.6 3,093,692 Age 15 - 19 yrs 59.6 40.4 0.0 68.3 24.1 3.0 4.6 47,590 20 - 24 yrs 78.8 21.2 0.0 65.1 33.6 1.3 0.0 417,652 25 - 29 yrs 71.9 28.1 0.0 39.2 53.8 6.8 0.2 853,270 30 - 34 yrs 83.4 16.6 0.0 13.6 62.4 22.7 1.3 1,275,144 35 - 39 yrs 77.0 23.0 0.0 12.1 50.0 32.9 5.0 1,083,849 40 - 44 yrs 76.0 24.0 0.0 12.7 45.6 34.0 7.6 916,681 45 - 49 yrs 73.8 26.2 0.0 16.6 36.8 37.9 8.7 856,485 50 - 54 yrs 75.5 24.5 0.0 18.7 39.8 29.4 12.2 829,426 55 - 59 yrs 69.1 30.9 0.0 22.9 34.3 29.5 13.3 524,705 60 - 64 yrs 64.7 35.3 0.0 23.9 46.3 23.8 5.9 525,509 65 - 69 yrs 61.4 38.6 0.0 30.2 38.8 24.6 6.4 363,925 70+ yrs 58.3 41.7 0.0 35.5 41.0 17.2 6.2 886,841 Level of Education Pre Primary 61.2 38.8 0.0 18.1 49.9 19.4 12.6 42,385 Primary 75.6 24.4 0.0 22.9 46.6 24.7 5.8 3,889,986 Secondary 81.6 18.4 0.0 22.8 49.5 23.8 3.9 1,978,136 Higher 83.8 16.2 0.0 23.6 54.9 17.7 3.8 791,486 None 54.2 45.8 0.0 26.5 36.6 28.4 8.5 1,853,483 Non Standard 75.1 24.9 0.0 21.3 51.3 12.2 15.2 12,156 DK 72.1 27.9 0.0 5.9 46.4 47.7 0.0 13,446 NS 0.0 0.0 100.0 0.0 0.0 0.0 100.0 263,426 Total 70.9 26.1 3.0 22.9 44.6 23.9 8.6 8,844,504
13
3.6 Household headship
Information on household headship and composition is detailed in Table 3.3. On average 26.1 per
cent and 70.9 per cent of the households were headed by female and male respectively while an
insignificant number of households did not state their headship. There were notable differences
across provinces, with Nyanza having the largest proportion of households headed by female at
34.0 per cent while Rift Valley had the smallest proportion of 20.7 per cent.
3.7 Distribution of the Level of Literacy
Table 3.4 shows percentage distribution of literacy for persons aged 15 years and above. Nairobi
had the highest level of literacy with 97.4 per cent of its population being literate. Second was
Central province which reported 91.0 per cent while Nyanza was third with a proportion of 86.8
per cent. North Eastern province had the least percentage of literate population at 39.8 per cent.
A comparison between urban and rural reveal a notable disparity in literacy levels, whereas 94.7
per cent of urban population reported being literate, rural’s literacy level was 81.1 percent; 13.6
percentage points lower.

14
Table 3.4: Percentage Distribution of the level of Literacy (15+)
Literacy Total
Yes No DK
Province
Nairobi 97.4 2.4 0.2 2,216,758
Central 91.0 8.4 0.6 2,885,008
Coast 79.8 19.8 0.4 2,079,732
Eastern 83.1 16.4 0.5 2,582,866
North Eastern 39.8 57.4 2.8 662,823
Nyanza 86.8 13.0 0.2 2,694,410
Rift Valley 85.3 14.2 0.5 6,186,683
Western 85.2 14.5 0.3 2,280,834
Place of Residence
Rural 81.1 18.4 0.5 14,885,995
Urban 94.7 4.9 0.4 6,703,119
Sex
Male 89.7 10.0 0.3 10,487,703
Female 81.2 18.2 0.6 11,101,410
Age
15 - 19 yrs 95.7 4.0 0.3 2,984,985
20 - 24 yrs 93.3 6.1 0.6 3,481,259
25 - 29 yrs 94.3 5.5 0.2 2,972,159
30 - 34 yrs 93.0 6.8 0.2 2,674,732
35 - 39 yrs 92.3 7.6 0.2 2,078,368
40 - 44 yrs 87.0 12.5 0.5 1,522,959
45 - 49 yrs 86.9 12.8 0.4 1,428,640
50 - 54 yrs 73.8 25.8 0.3 1,158,931
55 - 59 yrs 69.5 29.9 0.6 799,906
60 - 64 yrs 56.1 42.6 1.3 731,303
65 - 69 yrs 56.5 43.1 0.5 491,664
70+ yrs 34.8 63.2 1.9 1,264,207
Level of Education
Pre Primary 93.8 0.0 6.2 116,356
Primary 99.8 0.0 0.2 10,343,485
Secondary 99.8 0.0 0.2 5,549,437
Higher 100.0 0.0 0.0 1,717,191
None 17.6 80.8 1.6 3,798,906
Non Standard 100.0 0.0 0.0 40,662
DK 100.0 0.0 0.0 23,075
Total 85.3 14.2 0.5 21,589,113
3.8 Employment
Details on employment status by age and education level are presented on Table 3.5. One in every
five people was employed while another one in every four people indicated as being self-
employed. Fulltime students, retired, and incapacitated constituted 11.8, 2.1 and 1.0 percents

15
respectively. Apparently the survey reveals a high level of unemployment as one person in every
four reported to be unemployed.
Majority of persons with pre-primary, primary and non-standard education were either
unemployed or self employed. As expected, persons with higher level of education had the
highest proportion of employed at 46.0 per cent. Of those who had reached higher level of
education 14.5 per cent were fulltime students, 14.4 per cent were self-employed while
unemployed constituted 20.1 per cent.
Table 3.5: Percentage Distribution of the Employment status (15+)
Employed Unemployed Self
Employed Fulltime student
Incapacitated Retired Other Missing Total
Province Nairobi 37.5 32.0 18.1 9.3 0.0 1.4 1.7 0.0 2,216,758 Central 23.6 17.4 42.4 10.4 2.9 2.3 0.9 0.0 2,885,008 Coast 18.0 48.3 20.1 8.8 0.2 2.4 2.1 0.1 2,079,732 Eastern 19.0 30.6 34.2 12.5 0.3 2.2 1.1 0.0 2,582,866 North Eastern 9.2 61.9 14.5 8.5 1.1 1.2 3.7 0.0 662,823 Nyanza 15.5 21.2 37.0 15.7 2.0 2.7 5.9 0.0 2,694,410 Rift Valley 20.1 43.1 16.7 10.9 0.4 1.8 6.9 0.0 6,186,683 Western 13.8 21.4 42.5 16.8 1.1 2.9 1.6 0.0 2,280,834 Place of Residence Rural 15.6 34.2 29.4 13.1 1.1 2.5 4.2 0.0 14,885,995 Urban 31.2 30.8 24.5 8.9 0.7 1.5 2.5 0.0 6,703,119 Sex Male 29.0 24.5 27.1 13.3 0.6 2.5 2.9 0.0 10,487,703 Female 12.4 41.3 28.5 10.4 1.3 1.8 4.3 0.0 11,101,410 Age 15 - 19 yrs 4.6 31.7 3.1 58.3 0.3 0.0 2.0 0.0 2,984,985 20 - 24 yrs 16.3 46.7 14.2 17.9 0.3 0.1 4.4 0.0 3,481,259 25 - 29 yrs 29.2 39.5 25.0 3.2 0.3 0.0 2.8 0.0 2,972,159 30 - 34 yrs 31.7 28.7 31.6 0.9 0.3 0.0 6.8 0.0 2,674,732 35 - 39 yrs 29.3 28.0 40.0 0.1 0.2 0.2 2.2 0.0 2,078,368 40 - 44 yrs 29.3 26.3 39.4 0.4 0.1 0.5 4.1 0.0 1,522,959 45 - 49 yrs 25.8 23.8 45.4 0.0 0.2 0.8 3.9 0.1 1,428,640 50 - 54 yrs 26.8 24.1 43.2 0.2 0.3 2.0 3.3 0.0 1,158,931 55 - 59 yrs 12.9 28.6 45.9 0.3 1.4 6.6 4.3 0.0 799,906 60 - 64 yrs 7.9 31.1 42.1 0.0 1.7 14.7 2.5 0.0 731,303 65 - 69 yrs 4.3 28.2 45.3 0.0 2.3 17.5 2.5 0.0 491,664 70+ yrs 6.2 34.4 28.7 4.4 9.8 13.3 3.1 0.0 1,264,207 Level of Education Pre Primary 6.3 25.0 38.0 22.5 1.5 3.1 3.7 0.0 116,356 Primary 19.4 33.8 30.8 10.7 0.5 1.6 3.2 0.0 10,343,485 Secondary 21.6 28.0 25.6 18.7 0.2 1.3 4.5 0.0 5,549,437 Higher 46.0 20.1 14.4 14.5 0.3 3.3 1.5 0.0 1,717,191 None 10.5 44.9 29.0 3.1 3.6 4.4 4.4 0.1 3,798,906 Non Standard 32.2 31.2 15.1 20.0 0.0 1.5 0.0 0.0 40,662 DK 15.6 23.4 38.8 0.0 0.0 0.0 22.2 0.0 23,075 Total 20.5 33.1 27.9 11.8 1.0 2.1 3.6 0.0 21,589,113

16
3.9 Persons with Disabilities
The World Health Organization defines disabilities as “an umbrella term, covering impairments,
activity limitations, and participation restrictions. An impairment is a problem in body function or
structure; an activity limitation is a difficulty encountered by an individual in executing a task or
action; while a participation restriction is a problem experienced by an individual in involvement
in life situations”.
Table 3.6 presents details on distribution of persons with disabilities. Nairobi reported 3.9 per
cent of its population as having disabilities which was the highest in the country. Nyanza province
was ranked second with 3.6 per cent of its population having different disabilities while Coast was
third with 2.3 per cent of their populations reported as having disabilities. Rift Valley reported the
least disability prevalence in the country at 1.6 per cent. About 2 in every 5 persons with disability
linked their conditions to physical impairments while 1 in every 4 reported having visual
disabilities. Other types of disabilities were reported by 35.1 per cent of those with impairments.
The data shows disability prevalence rising with age; with 7.6 per cent of persons of 70 years and
above reporting at least one type of disability compared to 2.3 per cent of total population having
disabilities. Male reported a proportion of 2.4 per cent of disability which is slightly higher than
2.2 per cent for female.

17
Table 3. 6: Percentage Distribution Disability (2+)
Having Disability
Population with Disability Total
Physical Visual Hearing Other Province Nairobi 3.9 45.7 28.1 2.1 44.1 3,024,059 Central 2.0 55.2 28.4 11.1 31.3 4,111,046 Coast 2.3 27.0 22.1 19.3 41.3 3,293,639 Eastern 1.8 26.6 18.0 23.3 40.0 4,017,958 North Eastern 2.2 47.6 24.7 14.0 15.1 1,228,945 Nyanza 3.6 39.1 25.8 19.6 24.8 4,629,954 Rift Valley 1.6 39.6 22.8 7.2 44.4 10,217,921 Western 2.2 39.5 20.6 28.0 25.2 4,045,792 Place of Residence Rural 2.2 42.4 26.4 18.2 26.7 24,730,955 Urban 2.5 34.2 19.0 6.7 53.6 9,838,358 Sex Male 2.4 36.2 24.6 14.8 36.6 17,082,230 Female 2.2 43.9 23.5 14.4 33.4 17,487,083 Age 0 - 4 yrs 1.0 27.3 37.4 0.0 42.1 1,844,771 5 - 9 yrs 1.3 32.7 20.2 25.4 28.1 5,139,627 10 - 14 yrs 1.7 26.4 19.3 21.6 44.2 5,058,472 15 - 19 yrs 1.8 20.8 17.7 26.3 44.3 3,922,314 20 - 24 yrs 2.3 46.7 25.9 8.6 44.7 3,481,259 25 - 29 yrs 2.6 48.1 26.6 11.2 43.7 2,972,159 30 - 34 yrs 2.7 35.7 7.5 13.7 50.2 2,674,732 35 - 39 yrs 2.6 30.7 7.8 3.0 60.7 2,078,368 40 - 44 yrs 2.1 44.2 41.2 4.9 22.6 1,522,959 45 - 49 yrs 2.0 40.7 22.3 19.4 30.4 1,428,640 50 - 54 yrs 2.1 60.7 30.9 5.8 6.2 1,158,931 55 - 59 yrs 3.4 74.5 24.6 6.0 17.8 799,906 60 - 64 yrs 5.0 47.0 37.0 10.0 17.2 731,303 65 - 69 yrs 4.6 46.8 36.8 19.6 18.8 491,664 70+ yrs 7.6 48.3 36.6 17.3
10.9 1,264,207
Level of Education Pre Primary 1.4 49.3 26.3 0.0 30.9 1,307,291 Primary 2.0 39.7 25.4 16.7 32.7 17,819,366 Secondary 1.7 31.4 21.5 9.5 54.0 5,863,398 Higher 1.9 47.4 15.3 0.0 37.4 1,718,180 None 3.8 41.6 24.3 16.4 31.4 7,795,186 Non Standard 0.0 . . . . 42,817 DK 0.0 . . . . 23,075 Total 2.3 39.9 24.1 14.6 35.1 34,569,313
3.10 Source of electricity
For the development and maintenance of ICT infrastructure it is important to have other
infrastructure like electricity, water, road, rail, and air transport systems in place. In particular
electricity is viewed as a key driver of the ICTs and therefore the survey sought to establish to
what extent it affects penetration of ICT in the country.
Information on distribution of the source of electricity by province, Sex, Age and Level of
education is presented in Table 3.7. Connection through the grid was the main source of

18
electricity with 25.7 per cent of households connected to it while 15.3 per cent of the homes were
connected to other types of electricity sources. A slightly higher proportion of male headed
households were connected to electricity compared to their female counterparts. A look at the
table suggests that connection to electricity is highest at age group 30-34 years. Slightly less than
half of the households surveyed reported as not being connected to any type of electricity supply.
Table 3.7: Percentage Distribution of Source of Electricity by Province, Sex, Age and Level of Education
Main source of Electricity for the household Total
Grid Generator Sola Wind Other None Province Nairobi 92.8 1.3 0.0 0.0 3.9 2.0 1,002,682 Central 36.9 0.7 4.8 0.0 34.9 22.7 1,242,522 Coast 26.7 0.6 1.4 0.0 0.1 71.2 773,561 Eastern 17.7 0.5 7.4 0.0 14.7 59.7 947,927 North Eastern
16.8 0.9 2.1 0.0 0.0 80.3 236,775
Nyanza 15.2 2.2 3.7 0.1 15.3 63.5 1,190,945 Rift Valley 29.1 1.0 4.9 0.1 17.4 47.4 2,543,120 Western 11.2 0.6 1.7 0.2 3.0 83.4 906,971 Place of Residence Rural 12.6 1.0 5.2 0.1 16.9 64.2 5,750,812 Urban 57.7 0.9 1.4 0.0 11.4 28.6 3,093,692 Sex Male 25.2 1.2 4.6 0.1 14.3 54.6 2,312,118 Female 24.3 0.5 3.0 0.1 16.7 55.3 263,426 NS 48.1 0.0 2.7 0.0 25.3 23.8 47,590 Age 15 - 19 yrs 27.6 0.0 2.7 0.0 15.2 54.5 417,652 20 - 24 yrs 39.2 0.4 3.5 0.0 19.1 37.8 853,270 25 - 29 yrs 37.6 0.6 1.3 0.0 16.6 43.9 1,275,144 30 - 34 yrs 41.7 1.0 3.6 0.0 11.7 41.9 1,083,849 35 - 39 yrs 20.0 0.9 4.2 0.0 15.2 59.8 916,681 40 - 44 yrs 23.2 1.0 5.3 0.2 11.7 58.6 856,485 45 - 49 yrs 31.3 1.2 2.3 0.2 14.6 50.5 829,426 50 - 54 yrs 21.0 1.3 6.8 0.0 17.3 53.6 524,705 55 - 59 yrs 17.1 0.9 4.5 0.0 14.2 63.3 525,509 60 - 64 yrs 15.0 0.9 4.1 0.3 17.1 62.6 363,925 65 - 69 yrs 12.4 3.2 4.8 0.0 13.1 66.4 886,841 70+ yrs 9.1 0.7 4.9 0.0 17.6 67.7 42,385 Level of Education Pre Primary 8.4 0.0 8.5 0.0 6.4 76.7 42,385 Primary 19.6 1.0 4.3 0.1 17.4 57.7 3,889,986 Secondary 40.3 1.1 5.6 0.1 12.7 40.2 1,978,136 Higher 63.0 2.3 5.1 0.0 6.1 23.5 791,486 None 9.0 0.6 1.9 0.0 15.2 73.3 1,853,483 Non standard 56.0 0.0 28.5 0.0 0.0 15.5 12,156 DK 10.7 0.0 0.0 0.0 65.6 23.7 13,446 NS 47.8 0.0 2.7 0.0 25.3 24.2 263,426 Total 25.7 1.0 4.1 0.1 15.3 53.8 8,844,504
Nairobi province had the highest connections to grid with 92.8 per cent of homes connected while
Western had the least connections with only 11.2 households connected. Only 12.6 per cent of
rural households reported being connected to the grid while 57.7 per cent of urban households
had their premises connected through grid. A wide disparity was observed between urban and
rural households not connected to any form of electricity. Whereas 2 in every 3 urban homes

19
were connected to one form of electricity source, only 1 in every 3 rural homes was connected.

20
CHAPTER 4: ACCESS, USAGE AND OWNERSHIP OF ICT FACILITIES BY HOUSEHOLDS AND INDIVIDUALS
4.1 Introduction
This chapter discusses the survey findings on access, usage and ownership of radios, televisions,
computers, mobile phones, fixed line telephones, and internet facilities. Globally, the Information
and Communication Technologies (ICT) sector has been identified as pivotal in raising labour
productivity and enhancing a country’s competitiveness.
Computers and other ICT gadgets have become part of the households today and are no longer
perceived as luxury. Households without the ICT facilities have resorted to seeking the ICT service
from such places like a nearby cyber cafés and friends’ houses. In general, household ownership
of personal computers and mobile phones and internet access are closely linked and dependent
on household incomes. Convergence of technologies in the ICT sector has also made it easier for
access of ICT services like the internet.
Access, usage and ownership of ICT are key in linking communities, facilitating businesses and
empowering communities socially and economically. It is therefore imperative that every effort is
made to bridge the digital divide between those who have information and those who need the
information. Enhancement of access to information and communications services in rural, remote
and underserved areas is key to accelerating development.
The results of the survey show that in most cases there is correlation between access and usage
on one hand and sex, education, and age on the other. Among the notable features is that use of
ICT was more widespread among the younger people (20 – 34years).
4.2 Access
Broadly, access to ICT can be looked at as possession or availability (e.g., through home, office,
school or public location) of ICT equipment; the ability to pay for ICT products and services and
the skills to use ICT effectively. The survey results point to a wide gap between the access of the
newer technologies such as the Internet and that for traditional technologies such as telephony
and radio.

21
Figure 4.1: Proportion of Population with Access to Some Selected ICT Equipments (3+)
0.0
10.0
20.0
30.0
40.0
50.0
60.0
70.0
80.0
90.0
100.0
0 - 4 5 - 9 10 -14
15 -19
20 -24
25 -29
30 -34
35 -39
40 -44
45 -49
50 -54
55 -59
60 -64
65 -69
70+
Age
Radio
Television
Mobile Phone
Computer
Internet
In general, access to ICT facilities seems to increase with age and peaks at the ages between 20 to
39 years then declines as age advances (Figure 4.1). Table 4.1 presents distribution of population
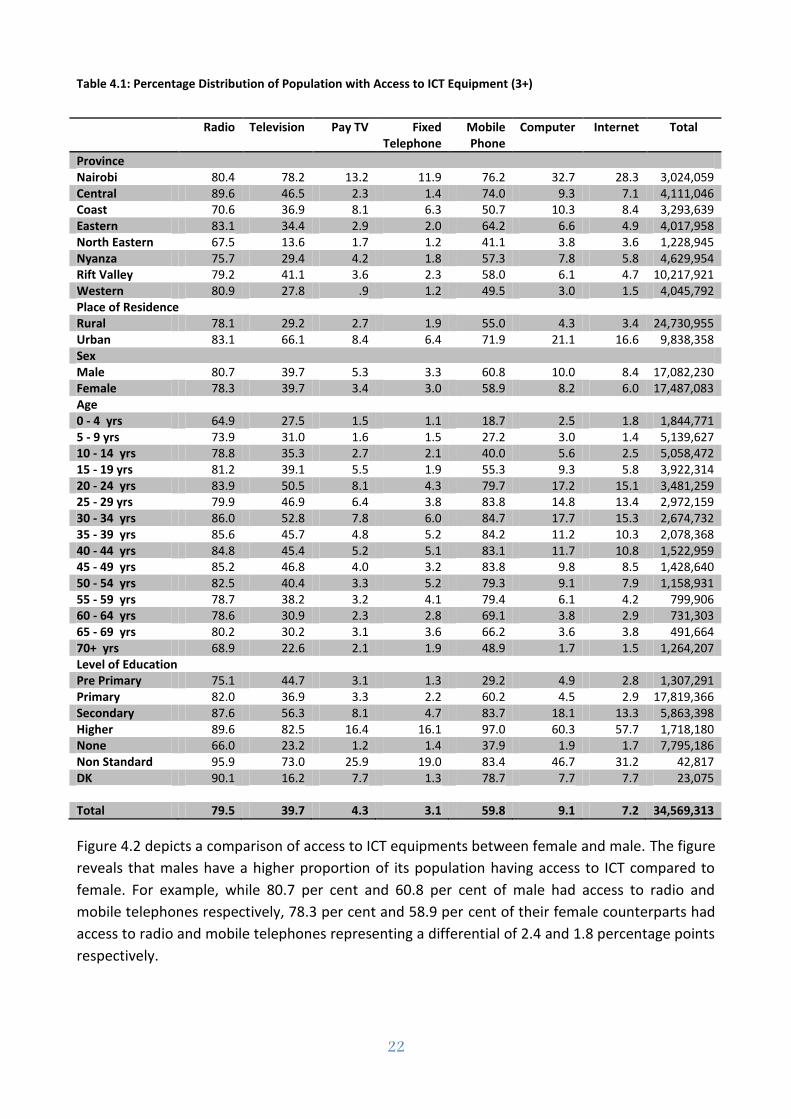
with access to ICT facilities. The survey results indicate that radio had the widest reach at 79.5 per
cent of the population reported having access to a radio terminal. Penetration of mobile
telephone was second with 59.8 per cent of the population connected while in the third place was
television where for every five people; two had access to this type of facility.
Penetration of other facilities was apparently marginal with computers, internet, pay TV, and fixed
line only having proportions of 9.1, 7.2, 4.3 and 3.1 percent respectively. Age groups 30 – 34 led in
access to all the ICT equipments except for the pay TV where those aged 20 – 24 took the lead.
There was a notable inequality in access to ICT facilities between the rural and urban population.
For instance, 66.1 and 21.1 per cent of urban population reported access to TV and computers
compared to 29.2 and 4.3 per cent of their rural counterparts.
22
Table 4.1: Percentage Distribution of Population with Access to ICT Equipment (3+)
Radio Television Pay TV Fixed Telephone
Mobile Phone
Computer Internet Total
Province Nairobi 80.4 78.2 13.2 11.9 76.2 32.7 28.3 3,024,059 Central 89.6 46.5 2.3 1.4 74.0 9.3 7.1 4,111,046 Coast 70.6 36.9 8.1 6.3 50.7 10.3 8.4 3,293,639 Eastern 83.1 34.4 2.9 2.0 64.2 6.6 4.9 4,017,958 North Eastern 67.5 13.6 1.7 1.2 41.1 3.8 3.6 1,228,945 Nyanza 75.7 29.4 4.2 1.8 57.3 7.8 5.8 4,629,954 Rift Valley 79.2 41.1 3.6 2.3 58.0 6.1 4.7 10,217,921 Western 80.9 27.8 .9 1.2 49.5 3.0 1.5 4,045,792 Place of Residence Rural 78.1 29.2 2.7 1.9 55.0 4.3 3.4 24,730,955 Urban 83.1 66.1 8.4 6.4 71.9 21.1 16.6 9,838,358 Sex Male 80.7 39.7 5.3 3.3 60.8 10.0 8.4 17,082,230 Female 78.3 39.7 3.4 3.0 58.9 8.2 6.0 17,487,083 Age 0 - 4 yrs 64.9 27.5 1.5 1.1 18.7 2.5 1.8 1,844,771 5 - 9 yrs 73.9 31.0 1.6 1.5 27.2 3.0 1.4 5,139,627 10 - 14 yrs 78.8 35.3 2.7 2.1 40.0 5.6 2.5 5,058,472 15 - 19 yrs 81.2 39.1 5.5 1.9 55.3 9.3 5.8 3,922,314 20 - 24 yrs 83.9 50.5 8.1 4.3 79.7 17.2 15.1 3,481,259 25 - 29 yrs 79.9 46.9 6.4 3.8 83.8 14.8 13.4 2,972,159 30 - 34 yrs 86.0 52.8 7.8 6.0 84.7 17.7 15.3 2,674,732 35 - 39 yrs 85.6 45.7 4.8 5.2 84.2 11.2 10.3 2,078,368 40 - 44 yrs 84.8 45.4 5.2 5.1 83.1 11.7 10.8 1,522,959 45 - 49 yrs 85.2 46.8 4.0 3.2 83.8 9.8 8.5 1,428,640 50 - 54 yrs 82.5 40.4 3.3 5.2 79.3 9.1 7.9 1,158,931 55 - 59 yrs 78.7 38.2 3.2 4.1 79.4 6.1 4.2 799,906 60 - 64 yrs 78.6 30.9 2.3 2.8 69.1 3.8 2.9 731,303 65 - 69 yrs 80.2 30.2 3.1 3.6 66.2 3.6 3.8 491,664 70+ yrs 68.9 22.6 2.1 1.9 48.9 1.7 1.5 1,264,207 Level of Education Pre Primary 75.1 44.7 3.1 1.3 29.2 4.9 2.8 1,307,291 Primary 82.0 36.9 3.3 2.2 60.2 4.5 2.9 17,819,366 Secondary 87.6 56.3 8.1 4.7 83.7 18.1 13.3 5,863,398 Higher 89.6 82.5 16.4 16.1 97.0 60.3 57.7 1,718,180 None 66.0 23.2 1.2 1.4 37.9 1.9 1.7 7,795,186 Non Standard 95.9 73.0 25.9 19.0 83.4 46.7 31.2 42,817 DK 90.1 16.2 7.7 1.3 78.7 7.7 7.7 23,075 Total 79.5 39.7 4.3 3.1 59.8 9.1 7.2 34,569,313
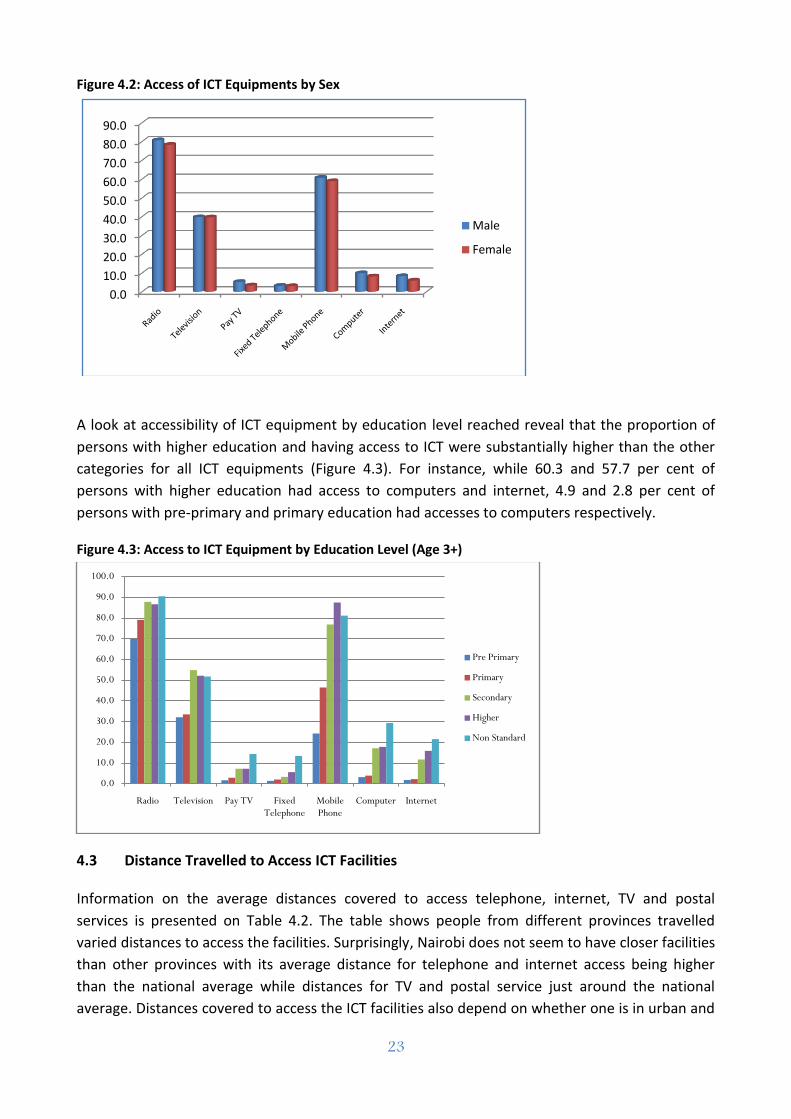
Figure 4.2 depicts a comparison of access to ICT equipments between female and male. The figure
reveals that males have a higher proportion of its population having access to ICT compared to
female. For example, while 80.7 per cent and 60.8 per cent of male had access to radio and
mobile telephones respectively, 78.3 per cent and 58.9 per cent of their female counterparts had
access to radio and mobile telephones representing a differential of 2.4 and 1.8 percentage points
respectively.
23
Figure 4.2: Access of ICT Equipments by Sex
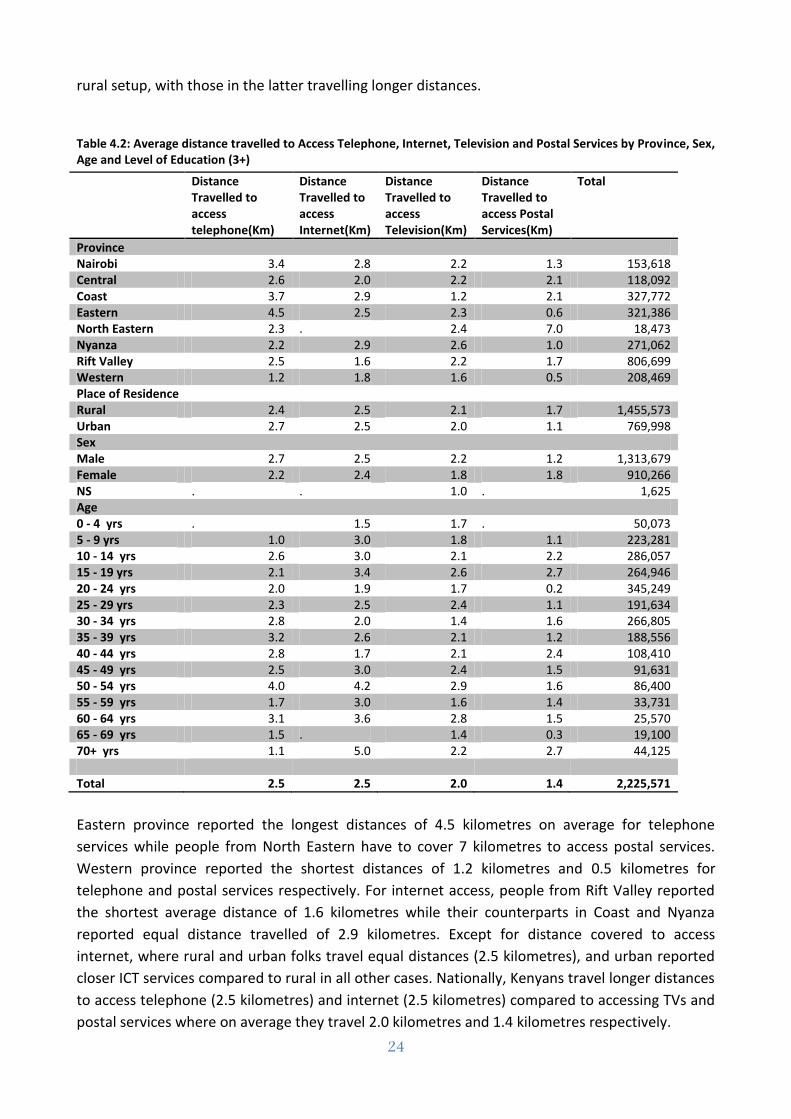
A look at accessibility of ICT equipment by education level reached reveal that the proportion of
persons with higher education and having access to ICT were substantially higher than the other
categories for all ICT equipments (Figure 4.3). For instance, while 60.3 and 57.7 per cent of
persons with higher education had access to computers and internet, 4.9 and 2.8 per cent of
persons with pre-primary and primary education had accesses to computers respectively.
Figure 4.3: Access to ICT Equipment by Education Level (Age 3+)
4.3 Distance Travelled to Access ICT Facilities
Information on the average distances covered to access telephone, internet, TV and postal
services is presented on Table 4.2. The table shows people from different provinces travelled
varied distances to access the facilities. Surprisingly, Nairobi does not seem to have closer facilities
than other provinces with its average distance for telephone and internet access being higher
than the national average while distances for TV and postal service just around the national
average. Distances covered to access the ICT facilities also depend on whether one is in urban and
0.0
10.0
20.0
30.0
40.0
50.0
60.0
70.0
80.0
90.0
Male
Female
0.0
10.0
20.0
30.0
40.0
50.0
60.0
70.0
80.0
90.0
100.0
Radio Television Pay TV Fixed Telephone
Mobile Phone
Computer Internet
Pre Primary
Primary
Secondary
Higher
Non Standard
24
rural setup, with those in the latter travelling longer distances.
Table 4.2: Average distance travelled to Access Telephone, Internet, Television and Postal Services by Province, Sex, Age and Level of Education (3+)
Distance Travelled to access telephone(Km)
Distance Travelled to access Internet(Km)
Distance Travelled to access Television(Km)
Distance Travelled to access Postal Services(Km)
Total
Province Nairobi 3.4 2.8 2.2 1.3 153,618 Central 2.6 2.0 2.2 2.1 118,092 Coast 3.7 2.9 1.2 2.1 327,772 Eastern 4.5 2.5 2.3 0.6 321,386 North Eastern 2.3 . 2.4 7.0 18,473 Nyanza 2.2 2.9 2.6 1.0 271,062 Rift Valley 2.5 1.6 2.2 1.7 806,699 Western 1.2 1.8 1.6 0.5 208,469 Place of Residence Rural 2.4 2.5 2.1 1.7 1,455,573 Urban 2.7 2.5 2.0 1.1 769,998 Sex Male 2.7 2.5 2.2 1.2 1,313,679 Female 2.2 2.4 1.8 1.8 910,266 NS . . 1.0 . 1,625 Age 0 - 4 yrs . 1.5 1.7 . 50,073 5 - 9 yrs 1.0 3.0 1.8 1.1 223,281 10 - 14 yrs 2.6 3.0 2.1 2.2 286,057 15 - 19 yrs 2.1 3.4 2.6 2.7 264,946 20 - 24 yrs 2.0 1.9 1.7 0.2 345,249 25 - 29 yrs 2.3 2.5 2.4 1.1 191,634 30 - 34 yrs 2.8 2.0 1.4 1.6 266,805 35 - 39 yrs 3.2 2.6 2.1 1.2 188,556 40 - 44 yrs 2.8 1.7 2.1 2.4 108,410 45 - 49 yrs 2.5 3.0 2.4 1.5 91,631 50 - 54 yrs 4.0 4.2 2.9 1.6 86,400 55 - 59 yrs 1.7 3.0 1.6 1.4 33,731 60 - 64 yrs 3.1 3.6 2.8 1.5 25,570 65 - 69 yrs 1.5 . 1.4 0.3 19,100 70+ yrs 1.1 5.0 2.2 2.7 44,125 Total 2.5 2.5 2.0 1.4 2,225,571
Eastern province reported the longest distances of 4.5 kilometres on average for telephone
services while people from North Eastern have to cover 7 kilometres to access postal services.
Western province reported the shortest distances of 1.2 kilometres and 0.5 kilometres for
telephone and postal services respectively. For internet access, people from Rift Valley reported
the shortest average distance of 1.6 kilometres while their counterparts in Coast and Nyanza
reported equal distance travelled of 2.9 kilometres. Except for distance covered to access
internet, where rural and urban folks travel equal distances (2.5 kilometres), and urban reported
closer ICT services compared to rural in all other cases. Nationally, Kenyans travel longer distances
to access telephone (2.5 kilometres) and internet (2.5 kilometres) compared to accessing TVs and
postal services where on average they travel 2.0 kilometres and 1.4 kilometres respectively.
25
4.4 Use of Computers
Details on distribution of usage of computers during the 12 months period prior to the survey are
given in Table 4.3. The table shows that only 8.4 per cent of the population used computers during
the reference period. The use of computers increase with age but peaks at 20-24 years then
gradually decline. Slightly less than a third of the persons who had used computers during the
reference period reported to have accessed them at the cyber cafes while somewhat less than a
quarter had accessed at their homes. Those who reported to have used computers at offices/work
place and educational centres accounted for 20.6 and 15.0 per cent respectively. The number of
persons who reported to have used computers from community centre and friend’s house
accounted for 2.1 and 1.7 percents respectively. For urban population, one in every five persons
reported having used a computer within 12 months preceding the survey while for rural, only one
in every twenty five persons reported use of computers within the same period.

26
Table 4.3: Percentage Distribution of Population Who use computer in the last 12 months by place of Access (3+)
Use of Computers
Total Place of Computer use in last 12 Months Total
Own House
Friends House
Office/Work Place
Office/Work Place
Cybercafe Community Centre
Educational centre
Mobile Phone Other
Province Nairobi 31.2 3,024,059 35.7 3.1 27.5 27.5 29.9 1.6 15.6 9.5 1.2 942,241 Central 10.0 4,111,046 20.8 1.1 20.2 20.2 23.9 1.1 17.1 4.3 .4 412,525 Coast 5.4 3,293,639 9.4 1.9 9.3 9.3 19.3 .1 7.8 2.4 .2 177,632 Eastern 6.3 4,017,958 6.4 1.1 10.4 10.4 19.6 .0 11.9 .3 2.2 254,141 North Eastern 3.4 1,228,945 .0 .0 6.1 6.1 37.2 .0 14.5 9.2 .0 41,215 Nyanza 7.4 4,629,954 25.1 .3 20.0 20.0 37.3 3.3 17.0 9.8 .0 342,236 Rift Valley 6.0 10,217,921 19.4 1.3 20.0 20.0 32.1 2.3 15.8 2.5 .5 615,871 Western 2.7 4,045,792 7.1 1.0 16.1 16.1 17.5 14.6 9.9 .0 .0 108,052 Place of Residence Rural 3.7 24,730,955 16.1 1.1 15.4 15.4 25.0 .9 15.6 3.8 .2 917,465 Urban 20.1 9,838,358 26.3 2.0 23.1 23.1 30.1 2.7 14.7 6.6 1.0 1,976,448 Sex Male 9.5 17,082,230 24.4 2.2 24.0 24.0 28.7 2.3 13.3 6.5 .7 1,622,442 Female 7.3 17,487,083 21.4 1.2 16.4 16.4 28.2 1.8 17.1 4.7 .7 1,271,471 Age 0 - 4 yrs .7 1,844,771 4.8 .0 .0 .0 .0 14.5 12.8 .0 .0 13,651 5 - 9 yrs 1.8 5,139,627 32.2 .0 .0 .0 1.8 2.2 23.3 .5 .0 90,277 10 - 14 yrs 4.3 5,058,472 30.1 1.1 .0 .0 3.9 3.8 21.6 1.2 .0 216,390 15 - 19 yrs 9.4 3,922,314 14.6 1.3 1.8 1.8 16.2 1.9 36.7 2.7 1.0 368,554 20 - 24 yrs 18.2 3,481,259 14.3 2.1 6.8 6.8 30.7 2.8 23.9 6.3 1.8 634,537 25 - 29 yrs 13.7 2,972,159 23.4 3.1 24.3 24.3 45.0 2.1 11.7 5.0 .6 407,677 30 - 34 yrs 16.5 2,674,732 24.7 2.0 41.5 41.5 41.1 .5 2.3 7.9 .7 441,502 35 - 39 yrs 11.5 2,078,368 33.0 2.9 36.2 36.2 32.8 2.3 2.0 7.4 .0 238,407 40 - 44 yrs 11.4 1,522,959 22.1 .6 40.9 40.9 33.8 2.9 4.3 9.6 .0 173,275 45 - 49 yrs 8.7 1,428,640 35.7 .1 34.5 34.5 23.3 2.1 3.9 7.7 .0 124,353 50 - 54 yrs 8.8 1,158,931 31.3 .0 50.1 50.1 16.9 .5 1.1 7.6 1.1 102,364 55 - 59 yrs 4.7 799,906 39.4 .0 26.4 26.4 13.5 .0 2.2 4.9 .0 37,819 60 - 64 yrs 3.0 731,303 47.7 .0 8.3 8.3 21.6 .0 .0 12.2 .0 21,968 65 - 69 yrs 2.3 491,664 27.8 .0 13.0 13.0 12.3 .0 .0 1.3 .0 11,065 70+ yrs 1.0 1,264,207 13.3 .0 4.1 4.1 .9 .0 5.4 5.4 .0 12,074 Level of Education Pre Primary 2.7 1,307,291 14.9 6.0 6.0 6.0 6.0 6.0 22.0 7.3 .0 35,324 Primary 3.8 17,819,366 19.6 1.7 6.5 6.5 10.3 1.5 14.0 1.8 .0 674,725 Secondary 17.1 5,863,398 16.5 1.7 16.8 16.8 31.3 1.9 17.7 4.2 1.6 1,005,225 Higher 63.0 1,718,180 32.4 1.8 34.3 34.3 38.0 2.3 13.0 9.4 .5 1,081,657 None 1.1 7,795,186 7.2 .0 8.4 8.4 28.7 5.4 12.7 3.5 .0 84,625 Non Standard 28.2 42,817 61.5 .0 30.7 30.7 10.7 .0 30.7 30.7 .0 12,054 DK 1.3 23,075 .0 .0 .0 .0 .0 .0 .0 .0 .0 302 Total 8.4 34,569,313 23.1 1.7 20.6 20.6 28.5 2.1 15.0 5.7 .7 2,893,913
27
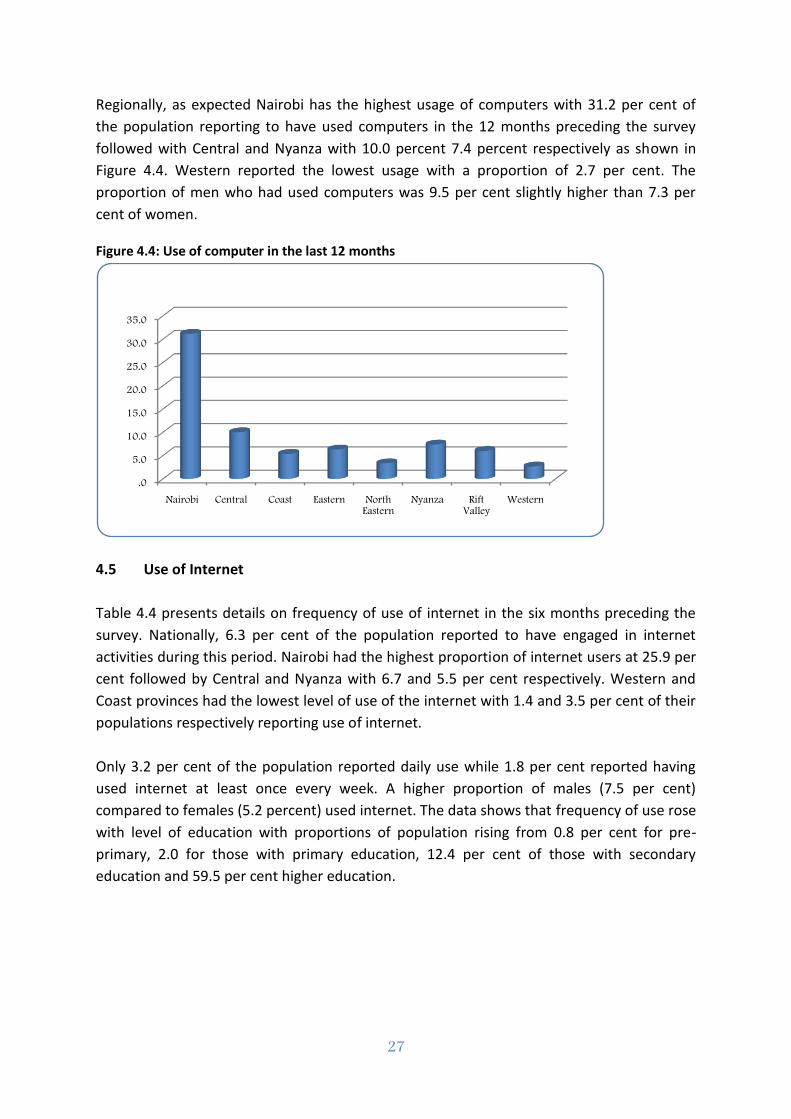
Regionally, as expected Nairobi has the highest usage of computers with 31.2 per cent of
the population reporting to have used computers in the 12 months preceding the survey
followed with Central and Nyanza with 10.0 percent 7.4 percent respectively as shown in
Figure 4.4. Western reported the lowest usage with a proportion of 2.7 per cent. The
proportion of men who had used computers was 9.5 per cent slightly higher than 7.3 per
cent of women.
Figure 4.4: Use of computer in the last 12 months
4.5 Use of Internet
Table 4.4 presents details on frequency of use of internet in the six months preceding the
survey. Nationally, 6.3 per cent of the population reported to have engaged in internet
activities during this period. Nairobi had the highest proportion of internet users at 25.9 per
cent followed by Central and Nyanza with 6.7 and 5.5 per cent respectively. Western and
Coast provinces had the lowest level of use of the internet with 1.4 and 3.5 per cent of their
populations respectively reporting use of internet.
Only 3.2 per cent of the population reported daily use while 1.8 per cent reported having
used internet at least once every week. A higher proportion of males (7.5 per cent)
compared to females (5.2 percent) used internet. The data shows that frequency of use rose
with level of education with proportions of population rising from 0.8 per cent for pre-
primary, 2.0 for those with primary education, 12.4 per cent of those with secondary
education and 59.5 per cent higher education.
.0
5.0
10.0
15.0
20.0
25.0
30.0
35.0
Nairobi Central Coast Eastern North Eastern
Nyanza Rift Valley
Western

28
Table 4.4: Percentage Distribution of Population with internet activities in the last 6 months by frequency of use (3+)
Engage in internet
activities in last 6 months
At least once a
day
At least
once a week
At least once a month
Once every 3 months
Once every 6 months
Once every year
Total
Province Nairobi 25.9 16.9 6.2 1.4 .0 .4 .3 3,024,059 Central 6.7 3.4 2.1 .6 .1 .0 .1 4,111,046 Coast 3.5 1.4 1.4 .4 .2 .0 .0 3,293,639 Eastern 4.2 .2 1.7 .6 .5 .5 .4 4,017,958 North Eastern 3.7 1.1 1.3 1.1 .1 .0 .0 1,228,945 Nyanza 5.5 3.6 1.3 .3 .1 .1 .1 4,629,954 Rift Valley 4.8 1.7 1.3 1.4 .0 .0 .2 10,217,921 Western 1.4 .8 .4 .0 .0 .0 .0 4,045,792 Place of Residence Rural 2.7 .9 .8 .7 .1 .0 .0 24,730,955 Urban 15.5 8.8 4.1 1.1 .3 .3 .5 9,838,358 Sex Male 7.5 3.9 2.0 1.0 .2 .2 .1 17,082,230 Female 5.2 2.4 1.6 .6 .1 .0 .2 17,487,083 Age 0 - 4 yrs .2 .1 .2 .0 .0 .0 .0 1,844,771 5 - 9 yrs .3 .2 .1 .0 .0 .0 .0 5,139,627 10 - 14 yrs .9 .4 .4 .1 .0 .0 .0 5,058,472 15 - 19 yrs 4.6 1.6 1.8 .3 .2 .3 .3 3,922,314 20 - 24 yrs 14.9 6.6 4.4 2.6 .2 .4 .2 3,481,259 25 - 29 yrs 13.2 6.8 3.9 1.3 .3 .2 .2 2,972,159 30 - 34 yrs 15.4 8.8 2.2 3.6 .3 .0 .0 2,674,732 35 - 39 yrs 10.6 6.1 2.3 .7 .0 .1 1.1 2,078,368 40 - 44 yrs 10.6 5.7 2.7 .5 .1 .5 .7 1,522,959 45 - 49 yrs 7.0 3.9 2.0 .4 .4 .0 .0 1,428,640 50 - 54 yrs 7.1 2.6 3.8 .6 .0 .0 .0 1,158,931 55 - 59 yrs 3.3 2.3 .4 .2 .0 .0 .1 799,906 60 - 64 yrs 2.3 1.0 1.1 .2 .1 .0 .0 731,303 65 - 69 yrs 2.2 .8 1.2 .2 .0 .0 .1 491,664 70+ yrs .4 .1 .2 .1 .0 .0 .0 1,264,207 Level of Education Pre Primary .8 .4 .4 .0 .0 .0 .0 1,307,291 Primary 2.0 .7 .6 .4 .0 .1 .0 17,819,366 Secondary 12.4 4.6 3.9 2.3 .4 .3 .6 5,863,398 Higher 59.5 38.5 14.1 3.2 .5 .5 1.2 1,718,180 None .8 .2 .4 .2 .0 .0 .0 7,795,186 Non Standard 28.6 28.6 .0 .0 .0 .0 .0 42,817 DK 1.3 1.3 .0 .0 .0 .0 .0 23,075 Total 6.3 3.2 1.8 .8 .1 .1 .2 34,569,313
Figure 4.5 shows the proportion of population that used internet in the six months
preceding the survey by various age cohorts. The figure indicates that use of internet rises
with age but peaks at around the ages 20 to 34 but then declines with increase in age.
Specifically, those aged 30-34 years had the highest proportion of internet users with 15.4
per cent reporting having used it during the six months. Age group 20-24 was second with
14.9 per cent having engaged in internet activities while 25-29 years was third with 13.2 per

29
cent.
Figure 4.5: Use of Internet by Age in the Six Months Preceding the Survey
Details on place of internet access for the users during twelve months prior to the survey
are presented in Table 4.5. Cybercafés were the most popular place with 52.7 per cent of
users indicating to have accessed internet services there. Mobile phone, work place and
own house were the other reliable sources with 33.9, 27.7 and 24.1 per cent of users
accessing internet through them respectively.
A look at Table 4.5 reveals age is a factor in determining one’s main source of internet
services. Persons aged 14 years and below appear to have access to internet mainly from
their homes while those aged 15 to 39 years reported cybercafés as their preferred place of
internet access. Between ages 40 to 54 years, most persons access internet at their work
place while for those aged 55 years and above mainly access internet at their homes.
Although mobile phone was the second mostly used form of access to internet, none of the
age groups reported it as the mode of access.
0.0
2.0
4.0
6.0
8.0
10.0
12.0
14.0
16.0
18.0
0 - 4 5 - 9 10 -14
15 -19
20 -24
25 -29
30 -34
35 -39
40 -44
45 -49
50 -54
55 -59
60 -64
65 -69
70+
Prop
ortio
n
Age Group

30
Table 4.5: Percentage Distribution of Population with Access to Internet in the last 12 months by place of Use (3+)
Own House
Friends House
Office/Work Place
Cybercafe
Community
Centre
Educational
centre
Mobile Phone
Other Total
Province Nairobi 37.1 3.7 33.6 44.4 .0 10.7 27.8 .6 781,911 Central 28.2 3.1 32.3 47.1 .0 9.6 27.2 1.4 274,776 Coast 19.7 9.2 13.2 54.8 .0 3.9 26.1 .0 113,971 Eastern 4.7 1.7 15.8 64.4 .3 18.3 34.8 6.2 167,109 North Eastern .0 .0 3.0 55.4 .0 15.9 65.4 .0 45,498 Nyanza 22.8 3.6 32.3 63.6 4.2 16.2 29.3 .9 255,621 Rift Valley 12.5 2.0 23.5 57.5 1.9 17.3 49.0 .0 491,733 Western 15.2 .0 24.1 64.9 .0 7.1 26.2 .0 56,305 Place of Residence Rural 15.3 3.1 20.5 51.1 1.6 15.2 43.3 2.1 658,632 Urban 27.8 3.3 30.8 53.4 .7 12.0 29.8 .5 1,528,292 Sex Male 22.4 3.8 31.5 52.3 1.4 11.6 36.7 1.3 1,279,043 Female 26.5 2.3 22.3 53.3 .3 14.7 29.9 .5 907,881 Age 0 - 4 yrs 20.4 .0 .0 .0 .0 .0 .0 .0 3,180 5 - 9 yrs 49.8 .0 .0 .0 .0 13.5 25.6 17.1 13,327 10 - 14 yrs 45.5 4.3 .0 10.1 .0 37.2 22.2 .0 43,038 15 - 19 yrs 15.5 6.5 .0 53.4 .0 32.5 30.8 .0 181,666 20 - 24 yrs 20.2 3.3 7.8 57.2 2.0 25.2 46.4 1.4 518,934 25 - 29 yrs 24.4 5.1 25.5 57.5 1.3 12.4 34.7 .3 393,249 30 - 34 yrs 17.0 1.6 46.6 65.7 .0 3.8 40.2 .3 410,645 35 - 39 yrs 29.4 2.9 39.6 51.2 .8 .0 17.6 .8 221,060 40 - 44 yrs 30.2 1.0 46.9 43.9 .0 2.5 21.8 3.3 160,813 45 - 49 yrs 42.9 .2 46.9 32.8 .7 4.4 24.5 .0 99,618 50 - 54 yrs 22.0 3.3 60.9 33.1 4.0 2.3 22.7 .0 82,131 55 - 59 yrs 45.7 .0 34.1 35.1 .0 .0 14.5 .0 26,543 60 - 64 yrs 42.2 .0 13.8 26.0 .0 .0 28.1 5.2 17,126 65 - 69 yrs 36.7 13.8 22.3 12.6 .0 .0 31.3 8.2 10,764 70+ yrs 62.2 .0 6.0 18.2 .0 .0 17.5 .0 4,830 Level of Education Pre Primary 16.9 21.1 .0 21.1 .0 38.9 34.5 .0 10,133 Primary 21.3 4.0 14.5 38.4 .1 11.8 36.0 .9 352,999 Secondary 16.8 3.2 20.5 60.7 .4 11.7 40.5 1.2 728,612 Higher 30.4 2.8 38.5 51.6 1.7 14.0 29.9 .8 1,022,952 None 14.2 2.0 13.4 59.7 .8 8.4 8.6 .0 59,698 Non Standard 60.6 .0 30.3 84.9 .0 30.3 30.3 .0 12,229 DK 100.0 .0 .0 .0 .0 .0 .0 .0 302 Total 24.1 3.2 27.7 52.7 1.0 12.9 33.9 1.0 2,186,924
Figure 4.6 depicts how proportions of the population with access to internet vary with rise
in age. The figure shows that while proportion of internet users for private purposes
increase with rise in age, proportion of users for entertainment motives declines. Use of
internet for work related activities rise with age and peaks at 45-49 years then gradually
declines as age advances. Users of internet for own business shows similar patterns but
peaks at the age 60-64 years.

31
Figure 4.6: Percentage Distribution of Population with Access to Internet by Purpose of Use
0.0
10.0
20.0
30.0
40.0
50.0
60.0
70.0
80.0
90.0
100.0
0 - 4 5 - 9 10 - 14 15 - 19 20 - 24 25 - 29 30 - 34 35 - 39 40 - 44 45 - 49 50 - 54 55 - 59 60 - 64 65 - 69 70+
Proportion
Private Use
Own Business
Work
Entertainment
Details on distribution of population with access to internet by purpose of use in the last 6
months are presented in Table 4.6. Two out of three internet users indicated private use as
one of their purposes while entertainment and work related activities were affirmed as
other key uses by 27.8 per cent of the internet clientele. Entertainment was mainly
associated with those aged 3 to 24 years while use of internet for work was prevalent for
ages 30 to 54 years.

32
Table 4.6: Percentage Distribution of Population with Access to Internet use by Purpose of Use (3+)
Private Use
Own Business
Work Entertainment Health Other Total
Province Nairobi 72.8 16.1 34.2 38.2 3.1 12.5 781,911 Central 59.6 15.3 26.0 44.5 7.2 10.2 274,776 Coast 69.7 11.7 22.4 42.6 4.2 5.9 113,971 Eastern 67.0 .7 15.5 38.1 4.5 14.8 167,109 North Eastern 42.0 4.4 5.6 60.7 .0 6.6 45,498 Nyanza 68.5 4.7 33.9 55.1 3.1 7.8 255,621 Rift Valley 73.1 7.6 23.5 31.4 2.2 6.6 491,733 Western 58.8 22.8 23.6 37.3 2.3 5.5 56,305 Place of Residence Rural 65.8 7.1 19.5 38.9 2.8 8.8 658,632 Urban 70.5 13.1 31.4 40.6 3.8 10.3 1,528,292 Sex Male 68.9 12.6 31.2 41.9 3.4 9.9 1,279,043 Female 69.4 9.5 23.0 37.6 3.6 9.7 907,881 Age 0 - 4 yrs 20.4 .0 .0 78.7 .0 .0 3,180 5 - 9 yrs 22.2 .0 .0 78.2 .0 12.2 13,327 10 - 14 yrs 39.6 2.1 .0 55.4 .0 13.5 43,038 15 - 19 yrs 63.0 .2 2.4 58.4 3.5 20.6 181,666 20 - 24 yrs 64.0 6.3 8.7 60.8 3.2 13.0 518,934 25 - 29 yrs 68.6 11.0 29.0 45.6 4.7 13.5 393,249 30 - 34 yrs 85.4 15.4 41.9 28.9 2.1 4.7 410,645 35 - 39 yrs 71.8 18.9 42.3 21.7 .7 4.7 221,060 40 - 44 yrs 64.4 17.7 48.1 17.6 4.0 5.4 160,813 45 - 49 yrs 70.1 13.8 49.2 24.7 13.5 .6 99,618 50 - 54 yrs 57.0 15.1 47.5 14.6 3.4 7.4 82,131 55 - 59 yrs 61.2 16.6 36.6 12.6 2.1 7.7 26,543 60 - 64 yrs 87.9 23.7 16.6 18.8 3.5 5.2 17,126 65 - 69 yrs 82.3 11.3 8.4 .0 6.8 8.2 10,764 70+ yrs 86.3 3.8 9.8 10.5 3.8 29.7 4,830 Level of Education Pre Primary 73.4 21.1 .0 54.4 .0 1.9 10,133 Primary 50.2 9.1 15.2 43.5 .7 7.9 352,999 Secondary 72.8 14.2 17.5 40.1 2.6 8.2 728,612 Higher 73.7 9.9 40.9 39.3 5.1 11.2 1,022,952 None 66.9 6.7 11.2 24.6 3.8 8.7 59,698 Non Standard 10.6 30.3 15.1 71.1 .0 59.1 12,229 DK 100.0 100.0 100.0 100.0 100.0 .0 302 Total 69.1 11.3 27.8 40.1 3.5 9.8 2,186,924
Details on internet activities that the users engaged in are presented in Table 4.7. Close to
three out of five users used internet for communication while one out of five users engaged
in research activities. The data suggests that Kenyans are yet to take full advantage of
transacting business on the internet; for example only 2.1 per cent of the users reported
having engaged in internet banking. In addition, only 4.4 per cent of users engaged in
purchasing or ordering goods and services though 12.1 per cent looked for information
about goods and services from the internet.
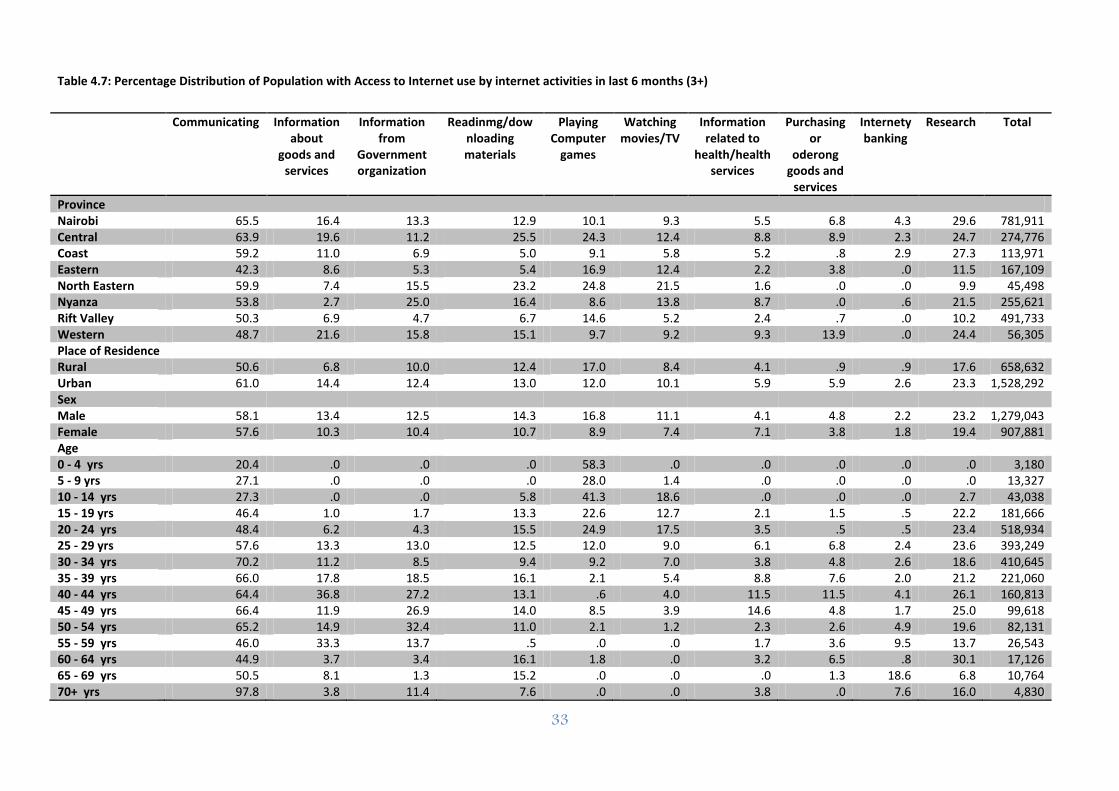
33
Table 4.7: Percentage Distribution of Population with Access to Internet use by internet activities in last 6 months (3+)
Communicating Information
about goods and
services
Information from
Government organization
Readinmg/downloading materials
Playing Computer
games
Watching movies/TV
Information related to
health/health services
Purchasing or
oderong goods and
services
Internety banking
Research Total
Province Nairobi 65.5 16.4 13.3 12.9 10.1 9.3 5.5 6.8 4.3 29.6 781,911 Central 63.9 19.6 11.2 25.5 24.3 12.4 8.8 8.9 2.3 24.7 274,776 Coast 59.2 11.0 6.9 5.0 9.1 5.8 5.2 .8 2.9 27.3 113,971 Eastern 42.3 8.6 5.3 5.4 16.9 12.4 2.2 3.8 .0 11.5 167,109 North Eastern 59.9 7.4 15.5 23.2 24.8 21.5 1.6 .0 .0 9.9 45,498 Nyanza 53.8 2.7 25.0 16.4 8.6 13.8 8.7 .0 .6 21.5 255,621 Rift Valley 50.3 6.9 4.7 6.7 14.6 5.2 2.4 .7 .0 10.2 491,733 Western 48.7 21.6 15.8 15.1 9.7 9.2 9.3 13.9 .0 24.4 56,305 Place of Residence Rural 50.6 6.8 10.0 12.4 17.0 8.4 4.1 .9 .9 17.6 658,632 Urban 61.0 14.4 12.4 13.0 12.0 10.1 5.9 5.9 2.6 23.3 1,528,292 Sex Male 58.1 13.4 12.5 14.3 16.8 11.1 4.1 4.8 2.2 23.2 1,279,043 Female 57.6 10.3 10.4 10.7 8.9 7.4 7.1 3.8 1.8 19.4 907,881 Age 0 - 4 yrs 20.4 .0 .0 .0 58.3 .0 .0 .0 .0 .0 3,180 5 - 9 yrs 27.1 .0 .0 .0 28.0 1.4 .0 .0 .0 .0 13,327 10 - 14 yrs 27.3 .0 .0 5.8 41.3 18.6 .0 .0 .0 2.7 43,038 15 - 19 yrs 46.4 1.0 1.7 13.3 22.6 12.7 2.1 1.5 .5 22.2 181,666 20 - 24 yrs 48.4 6.2 4.3 15.5 24.9 17.5 3.5 .5 .5 23.4 518,934 25 - 29 yrs 57.6 13.3 13.0 12.5 12.0 9.0 6.1 6.8 2.4 23.6 393,249 30 - 34 yrs 70.2 11.2 8.5 9.4 9.2 7.0 3.8 4.8 2.6 18.6 410,645 35 - 39 yrs 66.0 17.8 18.5 16.1 2.1 5.4 8.8 7.6 2.0 21.2 221,060 40 - 44 yrs 64.4 36.8 27.2 13.1 .6 4.0 11.5 11.5 4.1 26.1 160,813 45 - 49 yrs 66.4 11.9 26.9 14.0 8.5 3.9 14.6 4.8 1.7 25.0 99,618 50 - 54 yrs 65.2 14.9 32.4 11.0 2.1 1.2 2.3 2.6 4.9 19.6 82,131 55 - 59 yrs 46.0 33.3 13.7 .5 .0 .0 1.7 3.6 9.5 13.7 26,543 60 - 64 yrs 44.9 3.7 3.4 16.1 1.8 .0 3.2 6.5 .8 30.1 17,126 65 - 69 yrs 50.5 8.1 1.3 15.2 .0 .0 .0 1.3 18.6 6.8 10,764 70+ yrs 97.8 3.8 11.4 7.6 .0 .0 3.8 .0 7.6 16.0 4,830

34
Level of Education Pre Primary 22.9 .0 .0 1.9 57.2 21.1 .0 .0 .0 21.1 10,133 Primary 42.2 7.6 6.8 8.7 24.3 7.7 3.0 1.9 1.2 15.0 352,999 Secondary 65.2 12.6 8.2 13.8 16.1 10.2 2.7 7.2 .8 16.4 728,612 Higher 58.9 14.1 15.8 13.6 7.9 10.0 8.5 3.7 3.2 28.4 1,022,952 None 50.5 4.3 13.4 9.7 8.4 3.4 .2 .0 3.3 8.9 59,698 Non Standard 56.0 .0 15.1 30.3 .0 15.1 .0 .0 .0 15.1 12,229 DK .0 .0 .0 .0 .0 .0 .0 .0 .0 .0 302 Total 57.9 12.1 11.6 12.8 13.5 9.6 5.4 4.4 2.1 21.6 2,186,924

35
Table 4.8 presents details of calls made during the seven days before the survey. On average
mobile users made 21 calls during the last seven days prior to the date of interview which lasted
a total of 54.9 minutes and cost about Kenya Shilling 4 per minute. Regionally, people from
Nairobi led in terms of the frequency with each person using a mobile having made 34 calls.
People in urban reported more usage of mobile phone compared to their counterparts in the
rural areas. The data shows that on average people in rural made 15 calls in the seven days while
those in urban made 30 calls. The calls in the urban lasted longer (2.9 minutes) compared to
rural which on average lasted for 2.2 minutes.
Table 4.8: Mean Number of Times, mean Amount spend and length of mobile in the last seven days (3+)
Use of Mobile Phone in last 12
months
Number of Times
length of use (Mins)
Cost (Kshs.) Total
Province Nairobi 73.0 33.6 109.4 366.9 3,024,059 Central 65.8 22.5 29.9 213.3 4,111,046 Coast 40.5 28.6 59.7 274.3 3,293,639 Eastern 62.4 13.9 35.2 123.3 4,017,958 North Eastern 30.7 22.3 68.2 334.6 1,228,945 Nyanza 50.3 22.6 52.8 267.8 4,629,954 Rift Valley 49.4 17.0 55.6 180.0 10,217,921 Western 40.7 14.5 38.0 187.9 4,045,792 Place of Residence Rural 46.7 15.3 33.7 152.6 24,730,955 Urban 67.1 30.3 87.6 336.6 9,838,358 Sex Male 53.6 24.5 67.1 272.3 17,082,230 Female 51.4 17.5 42.0 173.8 17,487,083 Age 0 - 4 yrs 9.2 2.3 273.1 29.9 1,844,771 5 - 9 yrs 13.7 1.0 1.8 4.0 5,139,627 10 - 14 yrs 24.4 2.2 5.4 13.8 5,058,472 15 - 19 yrs 44.3 9.5 20.0 77.5 3,922,314 20 - 24 yrs 75.7 20.5 51.3 172.3 3,481,259 25 - 29 yrs 80.5 25.7 55.1 255.0 2,972,159 30 - 34 yrs 83.5 30.1 65.7 330.9 2,674,732 35 - 39 yrs 83.1 26.3 67.0 298.4 2,078,368 40 - 44 yrs 80.9 28.1 63.8 313.2 1,522,959 45 - 49 yrs 82.9 26.5 68.9 296.4 1,428,640 50 - 54 yrs 78.0 27.3 76.5 305.0 1,158,931 55 - 59 yrs 77.0 22.6 72.0 247.9 799,906 60 - 64 yrs 67.6 21.7 65.9 260.1 731,303 65 - 69 yrs 64.6 15.1 47.4 192.2 491,664 70+ yrs 45.2 10.2 28.1 157.0 1,264,207 Level of Education Pre Primary 18.6 8.2 16.3 73.9 1,307,291 Primary 51.7 16.1 38.8 173.7 17,819,366 Secondary 78.1 25.7 59.4 249.0 5,863,398 Higher 95.8 47.9 124.9 554.9 1,718,180 None 31.2 11.3 60.3 123.1 7,795,186 Non Standard 73.9 101.2 13.7 147.4 42,817 DK 47.5 11.7 22.8 146.7 23,075 Total 52.5 21.0 54.9 223.7 34,569,313

36
4.6 Ownership
Table 4.9 presents information on ownership of basic household ICT equipments and internet
connectivity in the country. Ownership and internet connectivity varied with age and region.
Nationally, mobile phone ownership was reported by the highest percentage of the population
at 33.0 per cent while ownership of radio and television had 23.4 and 10.6 per cent respectively.
Internet connectivity and ownership of computers was reported by substantially small
proportions of 2.4 and 1.8 per cent of population respectively.
As expected, ownership of these facilities had a relationship with the level of one’s education,
with proportions of those with higher level of education being bigger than all other categories
for all the equipments and internet connectivity. There was a notable disparity on ownership
between male and female; with 33.9 per cent of male owning radios compared to 13.1 per cent
for female. Likewise 15.2 per cent of male owned TVs against 6.1 per cent of the female
counterparts. However, ownership of mobile phones stood at 35.7 and 30.1 per cent for males
and females respectively.
Across the regions, Nairobi led in ownership of all the equipments followed by Central in all
cases while Rift Valley was third in most of the items. North Eastern was last in all instances
except for internet connectivity where Eastern was the last. North Eastern had higher internet
connectivity than Coast, Eastern and Western provinces despite having lower proportion of
computer ownership. This is attributable to convergence of the technologies where many of the
internet users in North Eastern connect through their mobile phones (as reported on table 4.5
compared with their counterparts in the other provinces). Along the different age groups,
ownership of radio and TV was highest for the ages 50 to 54 while ownership of mobile phones,
computers and internet connectivity was highest for ages 30 to 34.

37
Table 4.9: Percentage Distribution of Population Who own basic household equipment (3+)
Radio Television Mobile Phone
Computer Internet Connectivity
Total
Province Nairobi 31.2 27.3 58.7 8.9 10.5 3,024,059 Central 30.3 14.1 43.7 1.8 2.4 4,111,046 Coast 19.3 8.3 27.9 .9 .9 3,293,639 Eastern 21.8 7.4 31.4 .3 .6 4,017,958 North Eastern 14.9 2.5 19.3 .2 2.2 1,228,945 Nyanza 21.3 7.1 26.4 1.5 2.0 4,629,954 Rift Valley 23.5 10.6 31.2 1.5 2.2 10,217,921 Western 20.0 6.2 24.5 .4 .4 4,045,792 Place of Residence Rural 20.9 6.1 25.8 .7 1.2 24,730,955 Urban 29.5 22.0 51.0 4.6 5.4 9,838,358 Sex Male 33.9 15.2 35.7 2.4 3.2 17,082,230 Female 13.1 6.1 30.2 1.2 1.6 17,487,083 Age 0 - 4 yrs 2.2 1.0 .6 .3 .2 1,844,771 5 - 9 yrs 1.8 .7 .8 .2 .1 5,139,627 10 - 14 yrs 1.9 .5 2.2 .1 .2 5,058,472 15 - 19 yrs 6.9 2.2 13.8 .4 .9 3,922,314 20 - 24 yrs 18.9 7.8 52.0 2.5 5.5 3,481,259 25 - 29 yrs 32.0 16.0 63.1 2.5 5.1 2,972,159 30 - 34 yrs 46.3 26.6 67.8 4.8 6.6 2,674,732 35 - 39 yrs 45.5 21.3 64.9 3.8 3.0 2,078,368 40 - 44 yrs 53.4 25.5 63.5 4.2 4.9 1,522,959 45 - 49 yrs 50.8 25.6 65.2 4.0 3.6 1,428,640 50 - 54 yrs 58.2 27.0 57.6 4.1 3.3 1,158,931 55 - 59 yrs 52.5 21.7 57.2 2.5 2.0 799,906 60 - 64 yrs 51.8 17.6 44.3 2.0 1.5 731,303 65 - 69 yrs 52.2 15.9 41.7 1.8 1.4 491,664 70+ yrs 41.1 12.2 22.7 .8 .5 1,264,207 Level of Education Pre Primary 6.1 4.0 4.3 1.2 .6 1,307,291 Primary 22.1 8.1 29.1 .5 .8 17,819,366 Secondary 35.1 20.4 60.5 2.3 4.5 5,863,398 Higher 51.6 42.2 89.3 20.4 22.9 1,718,180 None 14.0 3.1 13.4 .2 .2 7,795,186 Non Standard 41.6 25.3 51.6 15.6 21.2 42,817 DK 55.9 10.2 52.1 2.3 1.3 23,075 Total 23.4 10.6 33.0 1.8 2.4 34,569,313
Table 4.10 presents details on internet connectivity and average expenditure on the same. The
highest proportion 4.7 percent, used fixed line type of connectivity while the mean cost per
month spent on internet was KShs. 917.5
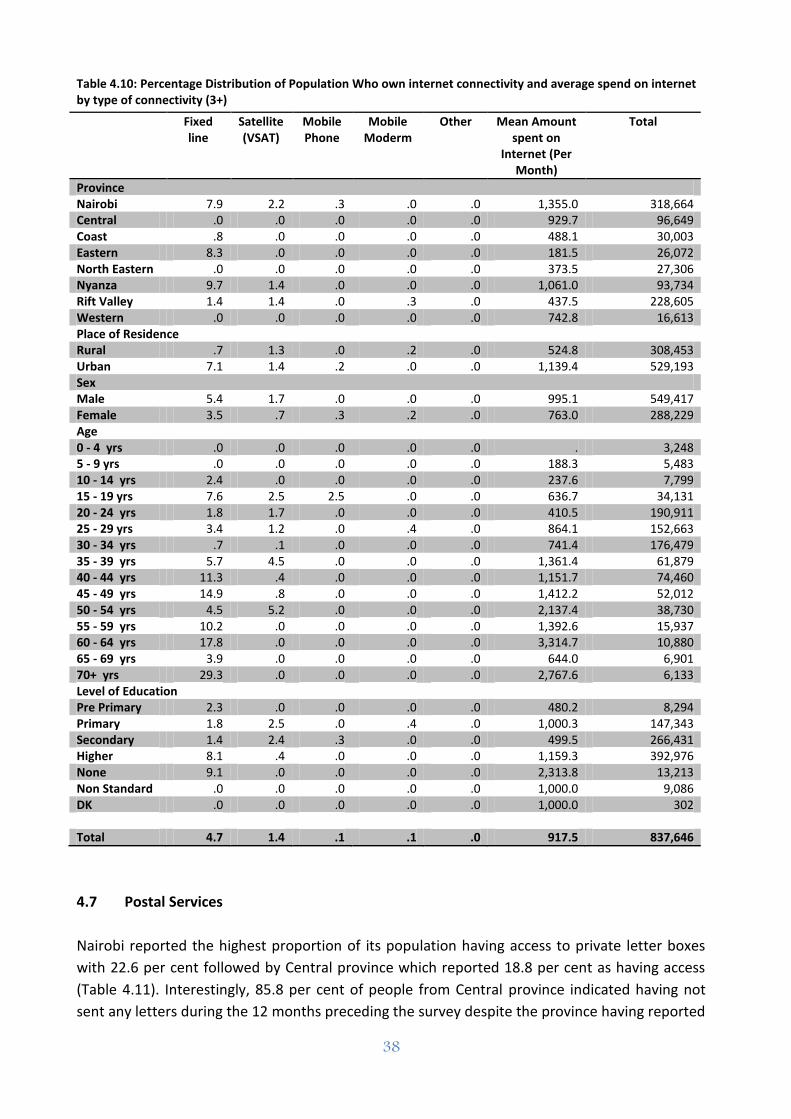
38
Table 4.10: Percentage Distribution of Population Who own internet connectivity and average spend on internet by type of connectivity (3+)
Fixed line
Satellite(VSAT)
Mobile Phone
Mobile Moderm
Other Mean Amount spent on
Internet (Per Month)
Total
Province Nairobi 7.9 2.2 .3 .0 .0 1,355.0 318,664 Central .0 .0 .0 .0 .0 929.7 96,649 Coast .8 .0 .0 .0 .0 488.1 30,003 Eastern 8.3 .0 .0 .0 .0 181.5 26,072 North Eastern .0 .0 .0 .0 .0 373.5 27,306 Nyanza 9.7 1.4 .0 .0 .0 1,061.0 93,734 Rift Valley 1.4 1.4 .0 .3 .0 437.5 228,605 Western .0 .0 .0 .0 .0 742.8 16,613 Place of Residence Rural .7 1.3 .0 .2 .0 524.8 308,453 Urban 7.1 1.4 .2 .0 .0 1,139.4 529,193 Sex Male 5.4 1.7 .0 .0 .0 995.1 549,417 Female 3.5 .7 .3 .2 .0 763.0 288,229 Age 0 - 4 yrs .0 .0 .0 .0 .0 . 3,248 5 - 9 yrs .0 .0 .0 .0 .0 188.3 5,483 10 - 14 yrs 2.4 .0 .0 .0 .0 237.6 7,799 15 - 19 yrs 7.6 2.5 2.5 .0 .0 636.7 34,131 20 - 24 yrs 1.8 1.7 .0 .0 .0 410.5 190,911 25 - 29 yrs 3.4 1.2 .0 .4 .0 864.1 152,663 30 - 34 yrs .7 .1 .0 .0 .0 741.4 176,479 35 - 39 yrs 5.7 4.5 .0 .0 .0 1,361.4 61,879 40 - 44 yrs 11.3 .4 .0 .0 .0 1,151.7 74,460 45 - 49 yrs 14.9 .8 .0 .0 .0 1,412.2 52,012 50 - 54 yrs 4.5 5.2 .0 .0 .0 2,137.4 38,730 55 - 59 yrs 10.2 .0 .0 .0 .0 1,392.6 15,937 60 - 64 yrs 17.8 .0 .0 .0 .0 3,314.7 10,880 65 - 69 yrs 3.9 .0 .0 .0 .0 644.0 6,901 70+ yrs 29.3 .0 .0 .0 .0 2,767.6 6,133 Level of Education Pre Primary 2.3 .0 .0 .0 .0 480.2 8,294 Primary 1.8 2.5 .0 .4 .0 1,000.3 147,343 Secondary 1.4 2.4 .3 .0 .0 499.5 266,431 Higher 8.1 .4 .0 .0 .0 1,159.3 392,976 None 9.1 .0 .0 .0 .0 2,313.8 13,213 Non Standard .0 .0 .0 .0 .0 1,000.0 9,086 DK .0 .0 .0 .0 .0 1,000.0 302 Total 4.7 1.4 .1 .1 .0 917.5 837,646
4.7 Postal Services
Nairobi reported the highest proportion of its population having access to private letter boxes
with 22.6 per cent followed by Central province which reported 18.8 per cent as having access
(Table 4.11). Interestingly, 85.8 per cent of people from Central province indicated having not
sent any letters during the 12 months preceding the survey despite the province having reported

39
the second highest proportion of population with access to private letter boxes. North Eastern
had the highest proportion of persons who sent letters with 42.0 per cent indicating having sent
between 1 to 10 letters annually. In all the provinces, only a small percentage of population send
more than ten letters per year. Nationally, the proportion of male with access to private letter
boxes is slightly higher than that of female. Table 4.11: Access to Private Letter Box and Number of Letters send per year by Province, Sex, Age and Level of Education (3+)
Access to
Private letter Box
Total Number of Letters send per year: Total
0 1 - 10 11 - 20 More than 20
Missing
Province Nairobi 22.6 3,024,059 51.3 32.4 3.8 3.0 9.6 683,440 Central 18.8 4,111,046 85.8 9.7 1.2 1.1 2.2 771,980 Coast 5.8 3,293,639 48.6 29.4 4.8 2.5 14.8 191,059 Eastern 2.1 4,017,958 36.1 31.4 .4 1.0 31.0 86,021 North Eastern 7.7 1,228,945 45.5 42.0 2.0 .0 10.5 94,115 Nyanza 9.2 4,629,954 68.5 21.2 2.3 2.7 5.2 428,066 Rift Valley 5.0 10,217,921 52.5 28.7 6.2 .5 12.1 512,309 Western 7.4 4,045,792 71.9 23.3 4.4 .0 .4 297,603 Place of Residence Rural 6.0 24,730,955 69.2 18.5 2.9 1.2 8.3 1,493,246 Urban 16.0 9,838,358 58.7 28.6 3.8 2.0 6.9 1,571,347 Sex Male 9.0 17,082,230 59.2 27.7 4.8 1.9 6.5 1,542,620 Female 8.7 17,487,083 68.5 19.7 1.8 1.3 8.7 1,521,973 Age 0 - 4 yrs 4.5 1,844,771 75.2 .8 .0 .0 24.0 83,902 5 - 9 yrs 5.7 5,139,627 82.5 4.5 .0 .0 12.9 292,765 10 - 14 yrs 4.9 5,058,472 91.3 4.7 .3 .0 3.6 247,530 15 - 19 yrs 7.0 3,922,314 77.5 13.1 .6 .3 8.6 274,831 20 - 24 yrs 10.1 3,481,259 54.0 30.7 3.1 .8 11.4 353,324 25 - 29 yrs 10.1 2,972,159 62.7 24.8 2.5 1.3 8.6 299,516 30 - 34 yrs 11.8 2,674,732 46.5 35.5 10.6 3.2 4.2 315,224 35 - 39 yrs 13.7 2,078,368 54.0 33.7 4.4 3.2 4.7 284,304 40 - 44 yrs 12.0 1,522,959 57.9 33.0 4.1 2.3 2.7 182,628 45 - 49 yrs 14.4 1,428,640 47.2 33.8 4.7 2.8 11.5 205,535 50 - 54 yrs 13.9 1,158,931 58.3 32.8 3.8 3.4 1.7 161,644 55 - 59 yrs 11.6 799,906 56.7 32.3 4.7 1.7 4.5 92,430 60 - 64 yrs 12.6 731,303 63.5 28.2 3.8 1.8 2.7 92,027 65 - 69 yrs 13.6 491,664 55.1 35.0 2.4 3.8 3.7 66,939 70+ yrs 8.9 1,264,207 79.6 11.1 1.4 .4 7.5 111,992 Level of Education Pre Primary 7.2 1,307,291 82.2 .0 .0 .0 17.8 94,120 Primary 7.1 17,819,366 74.5 17.5 1.5 .7 5.8 1,263,032 Secondary 13.6 5,863,398 59.1 28.1 5.8 1.5 5.5 796,438 Higher 33.0 1,718,180 43.1 42.1 5.7 4.9 4.2 566,679 None 4.3 7,795,186 64.3 12.5 1.2 .1 21.8 335,703 Non Standard 8.7 42,817 69.5 .0 .0 .0 30.5 3,731 DK 21.2 23,075 89.3 10.7 .0 .0 .0 4,888 Total 8.9 34,569,313 63.8 23.7 3.3 1.6 7.6 3,064,593

40
4.8 Letters Sent
Details on destinations of letters sent are presented in Table 4.12. On the whole, only 5 per cent
of the population sent letters in the 12 months prior to the survey. Only 3.2 per cent of rural
population compared to 8.7 per cent of urban population sent letters. At least 1 in every 20
people from urban reported having sent a letter while 1 in 29 people from rural had sent at least
one letter.
Table 4.12: Proportion of Letters send Abroad by Province, Sex, Age and Level of Education (3+)
Locally Elsewhere in Kenya
Overseas Total
Province Nairobi 4.2 3.3 1.5 3,024,059 Central 3.0 1.4 .2 4,111,046 Coast 2.4 .7 .4 3,293,639 Eastern 3.6 3.2 .2 4,017,958 North Eastern 3.3 1.4 .1 1,228,945 Nyanza 3.3 2.8 .3 4,629,954 Rift Valley 1.2 1.7 .4 10,217,921 Western 1.8 .5 .1 4,045,792 Place of Residence Rural 1.7 1.3 .2 24,730,955 Urban 4.6 3.4 .7 9,838,358 Sex Male 3.0 2.4 .5 17,082,230 Female 2.0 1.3 .2 17,487,083 Age 0 - 4 yrs .0 .0 .0 1,844,771 5 - 9 yrs .1 .1 .0 5,139,627 10 - 14 yrs .5 .3 .0 5,058,472 15 - 19 yrs 1.5 1.4 .1 3,922,314 20 - 24 yrs 4.2 3.4 .5 3,481,259 25 - 29 yrs 3.3 2.3 .4 2,972,159 30 - 34 yrs 4.1 3.4 1.5 2,674,732 35 - 39 yrs 5.7 4.2 .8 2,078,368 40 - 44 yrs 4.6 4.1 .3 1,522,959 45 - 49 yrs 5.5 2.9 .6 1,428,640 50 - 54 yrs 5.6 4.0 .7 1,158,931 55 - 59 yrs 3.8 2.1 .6 799,906 60 - 64 yrs 2.4 2.6 1.1 731,303 65 - 69 yrs 5.7 2.4 .4 491,664 70+ yrs 1.6 1.2 .3 1,264,207 Level of Education Pre Primary .1 .6 .1 1,307,291 Primary 1.7 1.3 .1 17,819,366 Secondary 4.7 3.4 .6 5,863,398 Higher 13.3 9.1 3.8 1,718,180 None .7 .8 .1 7,795,186 Non Standard 1.8 2.4 .0 42,817 DK 1.3 .0 .0 23,075 Total 2.5 1.9 .4 34,569,313

41
4.9 Letters received
Three in every four persons across all ages reported not receiving any letter annually. Many of
those who reported to have received between 1 to 10 letters were mainly aged between 20 to
69 years while those who receive more than twenty letters were mainly between 30 and 69
years old. The table also discloses that the level of education was a factor in mailing with 43.6
per cent of persons with higher education having received the highest number of letters
followed by those with secondary education with a proportion of 15.3 per cent.
Table 4.13: Percentage Distribution of Letters Received per year by Province, Sex, Age and Level of Education (3+)
Letters received per year Total
0 1 - 10 11 - 20 More than 20 Missing Province Nairobi 74.1 11.1 3.0 2.7 9.2 3,024,059 Central 80.7 8.0 2.1 1.9 7.2 4,111,046 Coast 54.3 4.8 1.0 .8 39.1 3,293,639 Eastern 82.8 7.2 .6 .2 9.3 4,017,958 North Eastern 84.7 5.1 .4 .4 9.4 1,228,945 Nyanza 79.4 8.2 .8 .4 11.2 4,629,954 Rift Valley 74.3 4.9 1.5 .5 18.8 10,217,921 Western 89.4 4.3 .6 .1 5.7 4,045,792 Place of Residence Rural 80.6 4.7 .9 .4 13.5 24,730,955 Urban 67.8 10.7 2.4 1.9 17.2 9,838,358 Sex Male 76.0 7.7 1.6 .8 13.9 17,082,230 Female 77.9 5.2 1.0 .7 15.2 17,487,083 Age 0 - 4 yrs 76.7 .1 .0 .0 23.2 1,844,771 5 - 9 yrs 79.8 .4 .0 .0 19.9 5,139,627 10 - 14 yrs 82.2 1.2 .0 .0 16.5 5,058,472 15 - 19 yrs 81.4 4.1 .1 .2 14.2 3,922,314 20 - 24 yrs 75.9 9.9 .8 .5 13.0 3,481,259 25 - 29 yrs 77.5 8.0 1.4 .7 12.3 2,972,159 30 - 34 yrs 73.8 10.3 2.5 1.8 11.5 2,674,732 35 - 39 yrs 70.6 12.5 2.4 2.0 12.5 2,078,368 40 - 44 yrs 70.9 13.9 2.9 2.0 10.3 1,522,959 45 - 49 yrs 64.8 13.6 8.3 1.6 11.7 1,428,640 50 - 54 yrs 71.2 12.9 2.6 3.2 10.1 1,158,931 55 - 59 yrs 75.8 11.9 3.2 1.1 8.1 799,906 60 - 64 yrs 76.3 9.1 3.4 1.1 10.1 731,303 65 - 69 yrs 73.0 13.2 1.2 3.5 9.1 491,664 70+ yrs 78.8 6.2 1.1 .7 13.2 1,264,207 Level of Education Pre Primary 76.3 1.1 .2 .0 22.4 1,307,291 Primary 79.6 4.5 1.0 .5 14.4 17,819,366 Secondary 70.8 11.7 2.3 1.3 13.9 5,863,398 Higher 47.1 31.0 7.0 5.6 9.3 1,718,180 None 82.4 2.2 .2 .1 15.1 7,795,186 Non Standard 41.7 9.8 10.4 .0 38.1 42,817 DK 72.5 6.7 .0 .0 20.8 23,075 Total 76.9 6.4 1.3 .8 14.5 34,569,313

42
CHAPTER 5: HOUSEHOLD CONSUMPTION OF SERVICES
5.0 Introduction
The consumption patterns of households determine the relative importance (weight) of
household monetary expenditure attached to each category of goods and services. Table 5.1
shows the percentage distribution of consumption of services in the last 12 months by province,
urban/rural dimension, sex, age and level of education in multiple response scenarios.
Table 5.1: Percentage Distribution of Consumption of Services in the last 12 months by Province, Sex, Age and Level of Education
Household Consumption of the following Services
Health Education Entertainment Transportation Communication Other services
Total
Province Nairobi 71.5 52.8 41.8 84.5 74.0 11.5 1,002,682 Central 72.8 56.4 42.5 79.7 82.8 19.6 1,242,522 Coast 81.3 65.5 29.3 64.3 60.0 .4 773,561 Eastern 82.1 69.2 27.5 82.0 68.9 5.3 947,927 North Eastern 71.7 53.5 12.3 60.2 49.0 5.7 236,775 Nyanza 83.3 68.3 31.1 68.8 67.6 12.7 1,190,945 Rift Valley 79.6 67.3 20.5 79.5 78.5 2.4 2,543,120 Western 87.4 74.6 11.7 69.1 73.4 .1 906,971 Place of Residence Rural 81.3 68.3 20.1 73.6 70.6 6.7 5,750,812 Urban 75.5 57.9 42.3 80.5 77.9 8.2 3,093,692 Sex Male 79.5 67.5 29.6 77.6 75.7 8.0 6,268,960 female 77.6 59.2 24.4 69.8 64.5 5.3 2,312,118 NS 88.5 44.6 16.7 94.5 89.0 6.4 263,426 Age 15 - 19 yrs 60.2 48.8 44.3 75.9 57.0 14.4 47,590 20 - 24 yrs 63.6 29.5 38.3 76.8 80.1 3.3 417,652 25 - 29 yrs 74.8 42.8 35.2 75.1 79.2 5.3 853,270 30 - 34 yrs 83.8 70.1 33.2 81.3 79.4 7.2 1,275,144 35 - 39 yrs 80.2 79.8 27.3 76.3 73.0 6.7 1,083,849 40 - 44 yrs 81.7 76.9 30.6 76.4 76.5 10.4 916,681 45 - 49 yrs 81.3 79.2 29.1 80.9 79.0 8.3 856,485 50 - 54 yrs 77.2 72.2 29.1 78.5 70.8 6.1 829,426 55 - 59 yrs 76.6 70.3 23.4 72.7 72.2 10.4 524,705 60 - 64 yrs 76.0 57.9 21.4 69.1 68.3 7.4 525,509 65 - 69 yrs 80.5 60.9 20.1 71.0 65.0 7.3 363,925 70+ yrs 81.9 51.4 15.4 63.8 51.4 6.2 886,841 Level of Education Pre Primary 83.5 68.2 26.0 88.5 78.2 1.6 42,385 Primary 77.7 66.4 24.4 73.6 74.7 5.8 3,889,986 Secondary 80.0 66.8 36.8 83.8 82.1 12.0 1,978,136 Higher 81.5 69.0 61.4 90.5 86.3 11.4 791,486 None 79.5 59.8 12.6 64.1 52.5 3.5 1,853,483 Non Standard 92.9 42.7 71.5 60.9 82.3 15.2 12,156 DK 54.5 75.5 21.5 56.0 59.5 13.8 13,446 NS 88.5 44.6 16.7 94.5 89.0 6.4 263,426 Total 79.3 64.7 27.8 76.0 73.2 7.2 8,844,504
43
5.1 Proportions in consumption of services
Central province recorded the highest percentage of consumption of communication services
(82.8 per cent), while North Eastern recorded the lowest (49.0 per cent). Male headed
household consumed relatively higher proportion of communication (75.7 per cent) compared
to female headed households with 64.5 per cent. Analysis by age group reveals that the
consumption is more widespread in the 20-24 age bracket at 80.1 per cent. The survey also
reveals that the consumption of communication services is positively correlated with the level of
education attained and also tends to be positively skewed towards the urban areas.
Only 27.8 per cent of respondents indicated they consumed entertainment services during the
reference period. This could be attributed to the fact that entertainment is considered a luxury.
5.2 Frequency of Consumption
The trend observed in proportion of consumption of communication services was replicated in
the pattern of the frequency of usage during the 12 months reference period (Table 5.2).
Nationally, this stood at 8.8 months.

44
Table 5.2: Average Duration (in Months) for consumption of Services in the last 12 months by Province, Sex, Age and Level of Education
Household Consumption of the following Services
Health Education Entertainment Transportation Communication Other services
Total
Province Nairobi 3.8 6.2 5.1 10.2 9.8 1.6 1,002,682 Central 3.3 6.5 3.8 8.3 10.1 3.3 1,242,522 Coast 2.9 7.2 2.5 6.1 7.7 .0 773,561 Eastern 3.2 6.3 2.3 7.1 7.6 .2 947,927 North Eastern 3.6 5.7 2.2 4.3 6.7 1.2 236,775 Nyanza 4.6 6.9 4.2 7.7 8.6 .4 1,190,945 Rift Valley 3.5 6.0 2.6 7.7 9.8 .5 2,543,120 Western 3.0 6.4 .8 4.1 6.4 .1 906,971 Place of Residence Rural 3.6 6.5 2.3 6.8 8.3 .8 5,750,812 Urban 3.4 6.1 4.5 8.6 9.8 1.1 3,093,692 Sex Male 3.5 6.6 3.2 7.6 9.1 1.0 6,268,960 female 3.3 5.9 2.6 6.7 7.9 .6 2,312,118 NS 4.6 7.0 3.3 7.6 10.8 1.0 263,426 Age 15 - 19 yrs 2.9 5.1 3.6 7.6 7.1 1.5 47,590 20 - 24 yrs 2.8 3.2 4.2 7.2 9.5 .6 417,652 25 - 29 yrs 2.9 4.7 3.8 8.6 9.6 .4 853,270 30 - 34 yrs 3.8 6.7 3.8 8.1 9.9 .9 1,275,144 35 - 39 yrs 3.5 7.2 2.9 7.5 8.8 .8 1,083,849 40 - 44 yrs 3.4 7.3 3.3 7.2 8.8 1.2 916,681 45 - 49 yrs 3.3 7.2 2.9 7.9 9.1 1.0 856,485 50 - 54 yrs 3.3 7.2 3.0 7.8 8.5 .9 829,426 55 - 59 yrs 3.4 6.3 2.2 6.4 8.1 1.0 524,705 60 - 64 yrs 3.3 5.8 2.3 6.7 8.1 1.0 525,509 65 - 69 yrs 4.4 6.1 2.4 6.9 8.4 .9 363,925 70+ yrs 4.1 5.3 2.0 5.6 6.6 .9 886,841 Level of Education Pre Primary 3.8 6.8 3.6 8.5 9.7 .5 42,385 Primary 3.3 6.4 2.5 7.1 8.9 .7 3,889,986 Secondary 3.5 6.5 3.5 7.9 9.5 1.4 1,978,136 Higher 4.2 6.8 6.7 10.0 10.3 1.9 791,486 None 3.6 6.0 1.7 6.1 6.8 .3 1,853,483 Non Standard 2.6 5.6 7.1 7.7 9.5 2.3 12,156 DK 2.6 7.8 3.5 6.6 7.7 .2 13,446 NS 4.6 7.0 3.3 7.6 10.8 1.0 263,426 Total 3.5 6.4 3.0 7.4 8.8 .9 8,844,504
5.3 Average Consumption of Services
For the five major categories of services (health, education, entertainment, transport and
communication), the average consumption of services was highest in health which stood at KSh
1,568.5 per household in 12 months. The highest average household expenditure on
communication was reported in Nyanza (KSh 1,160.6) while the least (KSh 598.1) was reported in
Nairobi province as shown in Table 5.3. The average consumption of communication services in
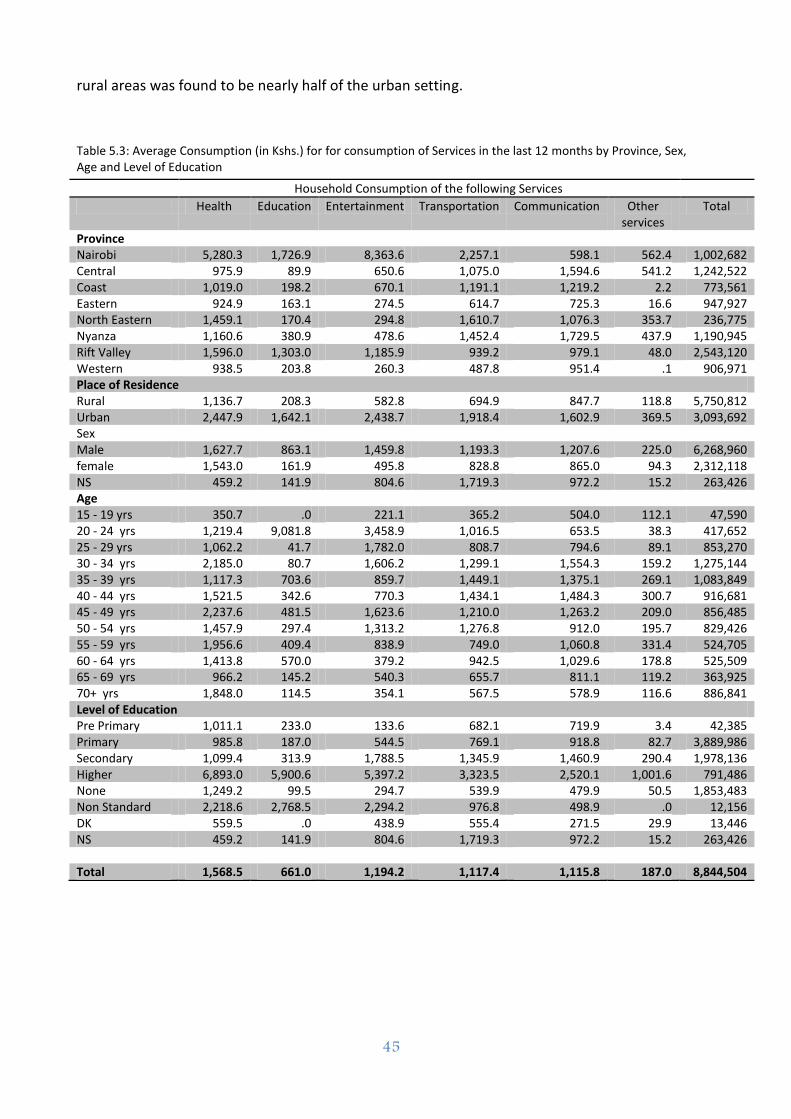
45
rural areas was found to be nearly half of the urban setting.
Table 5.3: Average Consumption (in Kshs.) for for consumption of Services in the last 12 months by Province, Sex, Age and Level of Education
Household Consumption of the following Services
Health Education Entertainment Transportation Communication Other services
Total
Province Nairobi 5,280.3 1,726.9 8,363.6 2,257.1 598.1 562.4 1,002,682 Central 975.9 89.9 650.6 1,075.0 1,594.6 541.2 1,242,522 Coast 1,019.0 198.2 670.1 1,191.1 1,219.2 2.2 773,561 Eastern 924.9 163.1 274.5 614.7 725.3 16.6 947,927 North Eastern 1,459.1 170.4 294.8 1,610.7 1,076.3 353.7 236,775 Nyanza 1,160.6 380.9 478.6 1,452.4 1,729.5 437.9 1,190,945 Rift Valley 1,596.0 1,303.0 1,185.9 939.2 979.1 48.0 2,543,120 Western 938.5 203.8 260.3 487.8 951.4 .1 906,971 Place of Residence Rural 1,136.7 208.3 582.8 694.9 847.7 118.8 5,750,812 Urban 2,447.9 1,642.1 2,438.7 1,918.4 1,602.9 369.5 3,093,692 Sex Male 1,627.7 863.1 1,459.8 1,193.3 1,207.6 225.0 6,268,960 female 1,543.0 161.9 495.8 828.8 865.0 94.3 2,312,118 NS 459.2 141.9 804.6 1,719.3 972.2 15.2 263,426 Age 15 - 19 yrs 350.7 .0 221.1 365.2 504.0 112.1 47,590 20 - 24 yrs 1,219.4 9,081.8 3,458.9 1,016.5 653.5 38.3 417,652 25 - 29 yrs 1,062.2 41.7 1,782.0 808.7 794.6 89.1 853,270 30 - 34 yrs 2,185.0 80.7 1,606.2 1,299.1 1,554.3 159.2 1,275,144 35 - 39 yrs 1,117.3 703.6 859.7 1,449.1 1,375.1 269.1 1,083,849 40 - 44 yrs 1,521.5 342.6 770.3 1,434.1 1,484.3 300.7 916,681 45 - 49 yrs 2,237.6 481.5 1,623.6 1,210.0 1,263.2 209.0 856,485 50 - 54 yrs 1,457.9 297.4 1,313.2 1,276.8 912.0 195.7 829,426 55 - 59 yrs 1,956.6 409.4 838.9 749.0 1,060.8 331.4 524,705 60 - 64 yrs 1,413.8 570.0 379.2 942.5 1,029.6 178.8 525,509 65 - 69 yrs 966.2 145.2 540.3 655.7 811.1 119.2 363,925 70+ yrs 1,848.0 114.5 354.1 567.5 578.9 116.6 886,841 Level of Education Pre Primary 1,011.1 233.0 133.6 682.1 719.9 3.4 42,385 Primary 985.8 187.0 544.5 769.1 918.8 82.7 3,889,986 Secondary 1,099.4 313.9 1,788.5 1,345.9 1,460.9 290.4 1,978,136 Higher 6,893.0 5,900.6 5,397.2 3,323.5 2,520.1 1,001.6 791,486 None 1,249.2 99.5 294.7 539.9 479.9 50.5 1,853,483 Non Standard 2,218.6 2,768.5 2,294.2 976.8 498.9 .0 12,156 DK 559.5 .0 438.9 555.4 271.5 29.9 13,446 NS 459.2 141.9 804.6 1,719.3 972.2 15.2 263,426 Total 1,568.5 661.0 1,194.2 1,117.4 1,115.8 187.0 8,844,504

46
CHAPTER 6: CONCLUSION
The survey results reveal that radio is an indispensible tool for delivering development
information with about 80 per cent of the households having access to radio as a means of
communication. Television sets are not as common in Kenya with 60 per cent of the respondents
indicating having access to TV. This low access level could be attributed to lack of electricity
connections in households which nationally stood at 42.1 percent.
The access and usage of computers and internet in Kenya was estimated at 8.4 per cent and 6.3
per cent, respectively. These low levels of penetration may be associated with a number of
factors, among them high cost of computers, poverty levels and lack of electricity connections in
the households. These factors are reflected in the trends of access points, where the highest
proportion (28.5 per cent) accessed computers through cyber cafes.
Investments and policy objectives in ICT sector have enhanced mobile and internet access across
the country. The study shows that about 60 per cent of the respondents have access to mobile
phones. However, only 32.9 per cent of the population owns the facility. Ownership of mobiles
was found to vary substantially by age groups of the respondent.
Postal service is the oldest mode of communication that is widely spread across the country.
Current, 8.9 per cent of the respondents have access to private letter boxes. However, 63.8 per
cent of the respondent with access to private letter boxes indicated that they sent no letter.
Similarly, 76.9 per cent of the population indicated that they had not received any letter within
one month prior to the survey.