Embed Size (px)
Citation preview

NATIONAL HURRICANE CENTER FORECAST VERIFICATION REPORT
2020 HURRICANE SEASON
John P. Cangialosi National Hurricane Center
13 June 2021
SATELLITE IMAGES OF THE UNPRECEDENTED 30 TROPICAL STORMS AND HURRICANES DURING THE 2020 ATLANTIC
HURRICANE SEASON.
ABSTRACT
There were 597 official tropical cyclone forecasts issued during the 2020 Atlantic hurricane season, which is well above the long-term average number of forecasts and the second most during the last 30 years. The mean NHC official track forecast errors in the Atlantic basin were close to their 5-yr means. No records for track accuracy were set in 2020. Track forecast skill and error have generally changed little during the past few years, but there has been a notable increase in
2020 Hurricane Season 2
track skill and decrease in error over the long term. The official track forecasts were slightly outperformed by the consensus models at some time periods. There was no clear winner among the individual models with GFSI, AEMI, CTCI, HMNI, and EMXI all being competeive with one another. HWFI, CMCI, EGRI, and NVGI performed less well. The Government Performance and Results Act of 1993 (GPRA) track goal was missed.
Mean official intensity errors for the Atlantic basin in 2020 were a little higher than the 5-yr means for the short lead times, but the errors were well below the means from 72 to 120 h. Decay-SHIFOR errors in 2020 followed a similar pattern to the official forecasts. The official forecasts were quite skillful and beat all of the models at 12 h, 72 h, and 96 h. No records for intensity accuracy were set in 2020. Among the guidance, IVCN and HCCA were the best performers. HWFI and CTCI were also quite skillful and were the best individual models. LGEM, DSHP, and HMNI were fair performers, and GFSI was competitive with those models for some of the forecast times. EMXI was less skillful. The GPRA intensity goal was just missed.
There were 256 official tropical cyclone forecasts issued in the eastern North Pacific basin in 2020, although only 29 of these verified at 120 h. This level of activity was well below average and the lowest number of forecasts since 2010. The mean NHC official track forecast errors in the east Pacific basin were a little higher than the previous 5-yr means at all forecast times. No records for track accuracy were set in 2020. The official track forecasts were very skillful, but they were outperformed by HCCA and TVCE at some time periods. There was no clear best individual model in this basin either, as EMXI, GFSI, HMNI, and EGRI all had similar skill levels. HWFI and CMCI were fair performers, but they were not competitive with the best models. NVGI lagged behind.
For intensity, the official forecast errors in the eastern North Pacific basin were notably lower than the 5-yr means for the short lead times, but slightly higher than the means for the longer lead times. Decay-SHIFOR errors were lower than their 5-yr means at all times, especially the longer lead times. Records for intensity accuracy were set from 12 to 48 h in 2020. The official forecasts were close to the consensus models and were skillful through 96 h, but the official forecasts and all of the models did not have any skill at 120 h. HWFI was the best individual model, and it had the highest skill of all of the guidance at 96 h.
An evaluation of track performance during the 2018-20 period in the Atlantic basin indicates that HCCA and TVCA were the best models, and EMXI was close behind. The official track forecasts for the 3-yr sample had skill that was quite close to the best aids throughout the forecast period. For intensity in the Atlantic basin, the official forecasts performed quite well and had skill that was comparable to the best guidance, the consensus models. HWFI and LGEM were the best individual models.
A three-year evaluation from 2018-20 in the eastern North Pacific indicates that the official track forecasts were very skillful, and they had skill levels close to the consensus models. Regarding intensity, the official forecasts during the 3-yr sample performed as good as or better than the consensus models in that basin.
Quantitative probabilistic forecasts of tropical cyclogenesis are expressed in 48 and 120 h time frames in 10% increments and in terms of categories (“low”, “medium”, or “high”). In the Atlantic basin, results from 2020 indicate that a low bias (under-forecast) existed at most probabilities for

2020 Hurricane Season 3
both the 48- and 120-h forecasts. In the eastern North Pacific basin, the 48-h and 120-h probabilistic forecasts were generally well calibrated.

2020 Hurricane Season 4
TABLE OF CONTENTS
1. Introduction 5
2. Atlantic Basin 8
a. 2020 season overview – Track 8 b. 2020 season overview – Intensity 10 c. Verifications for individual storms 11
3. Eastern North Pacific Basin 11
a. 2020 season overview – Track 11 b. 2020 season overview – Intensity 12 c. Verifications for individual storms 13
4. Genesis Forecasts 13
5. Looking Ahead to 2021 14
a. Track Forecast Cone Sizes 14 b. Consensus Models 14
6. References 15
List of Tables 16
List of Figures 50

2020 Hurricane Season 5
1. Introduction
For all operationally designated tropical or subtropical cyclones, or systems that could become tropical or subtropical cyclones and affect land within the next 48 h in the Atlantic and eastern North Pacific basins, the National Hurricane Center (NHC) issues an official forecast of the cyclone’s center location and maximum 1-min surface wind speed. Forecasts are issued every 6 h, and contain projections valid 12, 24, 36, 48, 60, 72, 96, and 120 h after the forecast’s nominal initial time (0000, 0600, 1200, or 1800 UTC)1. At the conclusion of the season, forecasts are evaluated by comparing the projected positions and intensities to the corresponding post-storm derived “best track” positions and intensities for each cyclone. A forecast is included in the verification only if the system is classified in the final best track as a tropical (or subtropical2) cyclone at both the forecast’s initial time and at the projection’s valid time. All other stages of development (e.g., tropical wave, [remnant] low, extratropical) are excluded3. For verification purposes, forecasts associated with special advisories do not supersede the original forecast issued for that synoptic time; rather, the original forecast is retained4. All verifications in this report include the depression stage.
It is important to distinguish between forecast error and forecast skill. Track forecast error, for example, is defined as the great-circle distance between a cyclone’s forecast position and the best track position at the forecast verification time. Skill, on the other hand, represents a normalization of this forecast error against some standard or baseline. Expressed as a percentage improvement over the baseline, the skill of a forecast sf is given by
sf (%) = 100 * (eb – ef) / eb
where eb is the error of the baseline model and ef is the error of the forecast being evaluated. It is seen that skill is positive when the forecast error is smaller than the error from the baseline.
To assess the degree of skill in a set of track forecasts, the track forecast error can be compared with the error from CLIPER5, a climatology and persistence model that contains no information about the current state of the atmosphere (Neumann 1972, Aberson 1998)5. Errors from the CLIPER5 model are taken to represent a “no-skill” level of accuracy that is used as the baseline (eb) for evaluating other forecasts6. If CLIPER5 errors are unusually low during a given season, for example, it indicates that the year’s storms were inherently “easier” to forecast than normal or otherwise unusually well behaved. The current version of CLIPER5 is based on developmental data from 1931-2004 for the Atlantic and from 1949-2004 for the eastern Pacific.
1 The nominal initial time represents the beginning of the forecast process. The actual advisory package is not released until 3 h after the nominal initial time, i.e., at 0300, 0900, 1500, and 2100 UTC. 2 For the remainder of this report, the term “tropical cyclone” shall be understood to also include subtropical cyclones. 3 Possible classifications in the best track are: Tropical Depression, Tropical Storm, Hurricane, Subtropical Depression, Subtropical Storm, Extratropical, Disturbance, Wave, and Low. 4 Special advisories are issued whenever an unexpected significant change has occurred or when watches or warnings are to be issued between regularly scheduled advisories. The treatment of special advisories in forecast databases changed in 2005 to the current practice of retaining and verifying the original advisory forecast. 5 CLIPER5 and SHIFOR5 are 5-day versions of the original 3-day CLIPER and SHIFOR models. 6 To be sure, some “skill”, or expertise, is required to properly initialize the CLIPER model.
2020 Hurricane Season 6
Particularly useful skill standards are those that do not require operational products or inputs, and can therefore be easily applied retrospectively to historical data. CLIPER5 satisfies this condition, since it can be run using persistence predictors (e.g., the storm’s current motion) that are based on either operational or best track inputs. The best-track version of CLIPER5, which yields substantially lower errors than its operational counterpart, is generally used to analyze lengthy historical records for which operational inputs are unavailable. It is more instructive (and fairer) to evaluate operational forecasts against operational skill benchmarks, and therefore the operational versions are used for the verifications discussed below.7
Forecast intensity error is defined as the absolute value of the difference between the forecast and best track intensity at the forecast verifying time. Skill in a set of intensity forecasts is assessed using Decay-SHIFOR5 (DSHIFOR5) as the baseline. The DSHIFOR5 forecast is obtained by initially running SHIFOR5, the climatology and persistence model for intensity that is analogous to the CLIPER5 model for track (Jarvinen and Neumann 1979, Knaff et al. 2003). The output from SHIFOR5 is then adjusted for land interaction by applying the decay rate of DeMaria et al. (2006). The application of the decay component requires a forecast track, which here is given by CLIPER5. The use of DSHIFOR5 as the intensity skill benchmark was introduced in 2006. On average, DSHIFOR5 errors are about 5-15% lower than SHIFOR5 in the Atlantic basin from 12-72 h, and about the same as SHIFOR5 at 96 and 120 h.
It has been argued that CLIPER5 and DSHIFOR5 should not be used for skill benchmarks, primarily on the grounds that they were not good measures of forecast difficulty. Particularly in the context of evaluating forecaster performance, it was recommended that a model consensus (see discussion below) be used as the baseline. However, an unpublished study by NHC has shown that on the seasonal time scales at least, CLIPER5 and DSHIFOR5 are indeed good predictors of official forecast error. For the period 1990-2009 CLIPER5 errors explained 67% of the variance in annual-average NHC official track forecast errors at 24 h. At 72 h the explained variance was 40% and at 120 h the explained variance was 23%. For intensity the relationship was even stronger: DSHIFOR5 explained between 50 and 69% of the variance in annual-average NHC official errors at all time periods. Given this, CLIPER5 and DSHIFOR5 appear to remain suitable, if imperfect, baselines for skill, in the context of examining forecast performance over the course of a season (or longer). However, they’re probably less useful for interpreting forecast performance with smaller samples (e.g., for a single storm).
The trajectory-CLIPER (TCLP) model is an alternative to the CLIPER and SHIFOR models for providing baseline track and intensity forecasts (DeMaria, personal communication). The input to TCLP [Julian Day, initial latitude, longitude, maximum wind, and the time tendencies of position and intensity] is the same as for CLIPER/SHIFOR, but rather than using linear regression to predict the future latitude, longitude and maximum wind, a trajectory approach is used. For track, a monthly climatology of observed storm motion vectors was developed from a 1982-2011 sample. The TCLP storm track is determined from a trajectory of the climatological motion vectors starting at the initial date and position of the storm. The climatological motion vector is modified
7 On very rare occasions, operational CLIPER or SHIFOR runs are missing from forecast databases. To ensure a completely homogeneous verification, post-season retrospective runs of the skill benchmarks are made using operational inputs. Furthermore, if a forecaster makes multiple estimates of the storm’s initial motion, location, etc., over the course of a forecast cycle, then these retrospective skill benchmarks may differ slightly from the operational CLIPER/SHIFOR runs that appear in the forecast database.

2020 Hurricane Season 7
by the current storm motion vector, where the influence of the current motion vector decreases with time during the forecast. A similar approach is taken for intensity, except that the intensity tendency is estimated from the logistic growth equation model (LGEM) with climatological input. Similar to track, the climatological intensity tendency is modified by the observed tendency, where the influence decreases with forecast time. The track used for the TCLP intensity forecast is the TCLP track forecast. When the storm track crosses land, the intensity is decreased at a climatological decay rate. A comparison of a 10-yr sample of TCLP errors with those from CLIPER5 and DSHIFOR5 shows that the average track and intensity errors of the two baselines are within 10% of each other at all forecast times out to five days for the Atlantic and eastern North Pacific. One advantage of TCLP over CLIPER5/DSHIFOR5 is that TCLP can be run to any desired forecast time.
NHC also issues forecasts of the size of tropical cyclones; these “wind radii” forecasts are estimates of the maximum extent of winds of various thresholds (34, 50, and 64 kt) expected in each of four quadrants surrounding the cyclone. Unfortunately, there is insufficient surface wind information to allow the forecaster to accurately analyze the size of a tropical cyclone’s wind field. As a result, post-storm best track wind radii are likely to have errors so large as to render a verification of official radii forecasts unreliable and potentially misleading; consequently, no verifications of NHC wind radii are included in this report. In time, as our ability to measure the surface wind field in tropical cyclones improves, it may be possible to perform a meaningful verification of NHC wind radii forecasts (Cangialosi and Landsea 2016).
Numerous objective forecast aids (guidance models) are available to help the NHC in the preparation of official track and intensity forecasts. Guidance models are characterized as either early or late, depending on whether or not they are available to the forecaster during the forecast cycle. For example, consider the 1200 UTC (12Z) forecast cycle, which begins with the 12Z synoptic time and ends with the release of an official forecast at 15Z. The 12Z run of the National Weather Service/Global Forecast System (GFS) model is not complete and available to the forecaster until about 16Z, or about an hour after the NHC forecast is released. Consequently, the 12Z GFS would be considered a late model since it could not be used to prepare the 12Z official forecast. This report focuses on the verification of early models.
Multi-layer dynamical models are generally, if not always, late models. Fortunately, a technique exists to take the most recent available run of a late model and adjust its forecast to apply to the current synoptic time and initial conditions. In the example above, forecast data for hours 6-126 from the previous (06Z) run of the GFS would be smoothed and then adjusted, or shifted, such that the 6-h forecast (valid at 12Z) would match the observed 12Z position and intensity of the tropical cyclone. The adjustment process creates an “early” version of the GFS model for the 12Z forecast cycle that is based on the most current available guidance. The adjusted versions of the late models are known, mostly for historical reasons, as interpolated models8. The adjustment algorithm is invoked as long as the most recent available late model is not more than 12 h old, e.g., a 00Z late model could be used to form an interpolated model for
8 When the technique to create an early model from a late model was first developed, forecast output from the late models was available only at 12 h (or longer) intervals. In order to shift the late model’s forecasts forward by 6 hours, it was necessary to first interpolate between the 12 h forecast values of the late model – hence the designation “interpolated”.

2020 Hurricane Season 8
the subsequent 06Z or 12Z forecast cycles, but not for the subsequent 18Z cycle. Verification procedures here make no distinction between 6 and 12 h interpolated models.9
A list of models is given in Table 1. In addition to their timeliness, models are characterized by their complexity or structure; this information is contained in the table for reference. Briefly, dynamical models forecast by solving the physical equations governing motions in the atmosphere. Dynamical models may treat the atmosphere either as a single layer (two-dimensional) or as having multiple layers (three-dimensional), and their domains may cover the entire globe or be limited to specific regions. The interpolated versions of dynamical model track and intensity forecasts are also sometimes referred to as dynamical models. Statistical models, in contrast, do not consider the characteristics of the current atmosphere explicitly but instead are based on historical relationships between storm behavior and various other parameters. Statistical-dynamical models are statistical in structure but use forecast parameters from dynamical models as predictors. Consensus models are not true forecast models per se, but are merely combinations of results from other models. One way to form a consensus is to simply average the results from a collection (or “ensemble”) of models, but other, more complex techniques can also be used. The HCCA model, for example, combines its individual components on the basis of past performance and attempts to correct for biases in those components (Simon et al. 2018). A consensus model that considers past error characteristics can be described as a “weighted” or “corrected” consensus. Additional information about the guidance models used at the NHC can be found at http://www.nhc.noaa.gov/modelsummary.shtml.
The verifications described in this report are for all tropical cyclones in the Atlantic and eastern North Pacific basins. These statistics are based on forecast and best track data sets taken from the Automated Tropical Cyclone Forecast (ATCF) System10 on 27 May 2021 for the Atlantic basin, and on 26 April 2021 for the eastern North Pacific basin. Verifications for the Atlantic and eastern North Pacific basins are given in Sections 2 and 3 below, respectively. Section 4 discusses NHC’s probabilistic genesis forecasts. Section 5 summarizes the key findings of the 2020 verification and previews anticipated changes for 2021.
2. Atlantic Basin
a. 2020 season overview – Track
Figure 1 and Table 2 present the results of the NHC official track forecast verification for the 2020 season, along with results averaged for the previous 5-yr period, 2015-2019. In 2020, the NHC issued 597 Atlantic basin tropical cyclone forecasts11, a number nearly double the long term mean (322) and the second-most forecasts during the last 30 years, behind only 2005 (Fig. 2). Mean track errors ranged from 24 n mi at 12 h to 190 n mi at 120 h. The mean official track forecast errors in 2020 were similar to the previous 5-yr means from 12 to 96 h, but about 10%
9 The UKM and EMX models are only available through 120 h twice a day (at 0000 and 1200 UTC). Consequently, roughly half the interpolated forecasts from these models are 12 h old. 10 In ATCF lingo, these are known as the “a decks” and “b decks”, respectively. 11 This count does not include forecasts issued for systems later classified to have been something other than a tropical cyclone at the forecast time.
2020 Hurricane Season 9
larger than the mean at 120 h. The CLIPER errors for 2020 were close to their 5-yr means for the shorter lead times, but notably smaller than their long-term means from 72 to 120 h. No records for track accuracy were set in 2020. The official track forecast vector biases were small through 96 h, but a notable southward bias (i.e., the official forecast tended to fall to the south of the verifying position) existed at 120 h. Track forecast skill ranged from 48% at 12 h to 69% at 48 and 60 h (Table 2). The track errors in 2020 decreased from the 2019 values at 24 and 48 h, but increased from 72 to 120 h.
Over the past 30 years, the 24−72-h track forecast errors have been reduced by 70 to 75% (Fig. 3a). Track forecast error reductions of about 60% have occurred over the past 15 to 20 years for the 96- and 120-h forecast periods. An evaluation of track skill indicates that there has been a gradual increase in skill over the long term (Fig. 3b). Although the long-term trends are quite well established, the track error and skill levels have levelled off during the past several years. Figure 4 indicates that on average the NHC track errors decrease as the initial intensity of a cyclone increases, and that relationship holds true through the 120-h forecast period.
Note that the mean official error in Figure 1 is not precisely zero at 0 h (the analysis time). This non-zero difference between the operational analysis of storm location and best track location, however, is not properly interpreted as “analysis error”. The best track is a subjectively smoothed representation of the storm history over its lifetime, in which the short-term variations in position or intensity that cannot be resolved in a 6-hourly time series are deliberately removed. Thus the location of a strong hurricane with a well-defined eye might be known with great accuracy at 1200 UTC, but the best track may indicate a location elsewhere by 5-10 miles or more if the precise location of the cyclone at 1200 UTC was unrepresentative. Operational analyses tend to follow the observed position of the storm more closely than the best track analyses, since it is more difficult to determine unrepresentative behavior in real time. Consequently, the t=0 “errors” shown in Figure 1 contain both true analysis error and representativeness error.
Table 3a presents a homogeneous12 verification for the official forecast along with a selection of early models for 2020. In order to maximize the sample size, a guidance model had to be available at least two-thirds of the time at both 48 and 120 h to be included in this comparison. The performance of the official forecast and the early track models in terms of skill are presented in Figure 5. The figure shows that the official forecasts were highly skillful, and near the best models throughout the forecast period. The best models were the consensus aids FSSE, HCCA, and TVCA, which had slightly lower errors than the official forecasts at some time periods. Among the individual models, there was no clear best performer. GFSI was the best model from 36 to 72 h, but CTCI and HMNI had the highest skill values at 96 and 120 h. AEMI and EMXI were competitive with the best models as well. HWFI, CMCI, and EGRI performed less well, and NVGI lagged behind.
An evaluation over the three years 2018-20 (Fig. 6) indicates that HCCA and TVCA were the best models, and the official forecasts had about the same skill levels as those models throughout the forecast period. EMXI was the best individual model, but it had less skill than the
12 Verifications comparing different forecast models are referred to as homogeneous if each model is verified over an identical set of forecast cycles. Only homogeneous model comparisons are presented in this report.

2020 Hurricane Season 10
official forecasts and the consensus aids. EGRI, GFSI, AEMI, and HWFI were fair performers and had skill levels about 10-15% lower than the best performing models and official forecasts.
Vector biases of the guidance models for 2020 are given in Table 3b. The table shows that the official forecast had similar biases to the consensus aids, which all had a south or southeast bias at 120 h. GFSI and EGRI had large south and southeast biases at 120 h, respectively. Figure 7 shows a homogenous comparison of the 120-h biases of the official forecasts, GFSI, EXMI, and EGRI from 2018-20 in the Atlantic basin. It can be seen that mean biases (denoted by the red X) were generally south or southeast in the models and NHC forecasts. EGRI had the largest biases for this sample.
A separate homogeneous verification of the primary consensus models for 2020 is shown in Figure 8. The figure shows that HCCA was the most skillful model overall, but TVCA, TVDG, TVCX, FSSE, and GFEX had only slightly less skill. In constrast, AEMI was notably less skillful than the remainder of the guidance shown.
Atlantic basin 48-h official track error, evaluated for all tropical cyclones, is a forecast measure tracked under the Government Performance and Results Act of 1993 (GPRA). In 2020, the GPRA goal was 59 n mi and the verification for this measure was 64.5 n mi.
b. 2020 season overview – Intensity
Figure 9 and Table 4 present the results of the NHC official intensity forecast verification for the 2020 season, along with results averaged for the preceding 5-yr period. Mean forecast errors in 2020 ranged from 6 kt at 12 h to 13 kt at 120 h. These errors were a little above the 5-yr means from 12 h to 48 h, but about 15 to 20% lower than the 5-yr means from 72 to 120 h. No records for accuracy were set in 2020. The official forecasts had a slight high bias from 12 to 96 h, but a more notable low bias existed at 120 h. The Decay-SHIFOR5 errors had a similar pattern to the official forecast errors, with the errors being a little higher than their means in the short term, but more notably lower than their mean at the longer lead times. Figure 10 indicates that the NHC official errors at 24 and 48 h increased from 2019, but the 72 to 120 h errors decreased significantly. Over the long-term, despite year-to-year variability, there has been a notable decrease in error that began around 2010. It appears that the intensity predictions are gradually improving as the forecasts are generally more skillful in the past 10 years than they were in the 1990s and the first decade of the 2000s (Cangialosi et. al 2020).
Table 5a presents a homogeneous verification for the official forecasts and the primary early intensity models for 2020. Intensity biases are given in Table 5b, and forecast skill is presented in Figure 11. The official forecasts were quite skillful, and they beat all of the models at 12 h, 72 h, and 96 h. The consensus models IVCN and HCCA were the best aids, and they outperformed the official forecasts at some of the time periods. FSSE had similar skill to IVCN and HCCA for the short lead times, but it trailed off after 60 h. Among the individual models, HWFI was the best model at most time periods, but CTCI was also a strong performer. HMNI, DSHP, and LGEM were less skillful, but still fair performers. GFSI was competitive with the fair- performing models after 36 h while EMXI generally lagged behind. An inspection of the intensity biases (Table 5b) indicates that all of the models had small biases, except for GFSI and EMXI, which had large low biases at the longer lead times.

2020 Hurricane Season 11
An evaluation over the three years 2018-20 (Fig. 12) indicates that the official forecasts have been consistently performing quite well, and had skill values close to the best aids IVCN and HCCA. For this sample, HWFI was the best individual model from 12 to 60 h, DSHP was best at 72 h, and LGEM had the most skill from 72 to 120 h. GFSI was competitive with the standard intensity models, but EMXI had slightly less skill.
The 48-h official intensity error, evaluated for all tropical cyclones, is another GPRA measure for the NHC. In 2020, the GPRA goal was 11 kt and the verification for this measure was 11.6 kt.
c. Verifications for individual storms
Forecast verifications for individual storms are given in Table 6. Of note are the large track errors for Hurricane Paulette at the longer forecast lead times. The poor track forecasts were associated with a slow bias during Paulette’s recurvature near Bermuda and its quick northeast motion until extratropical transition occurred. Conversely, the official track forecast errors were quite low for some of the tropical cyclones near the U.S., including Laura and Cristobal. Figure 13 shows an illustration of the official track errors stratified by storm.
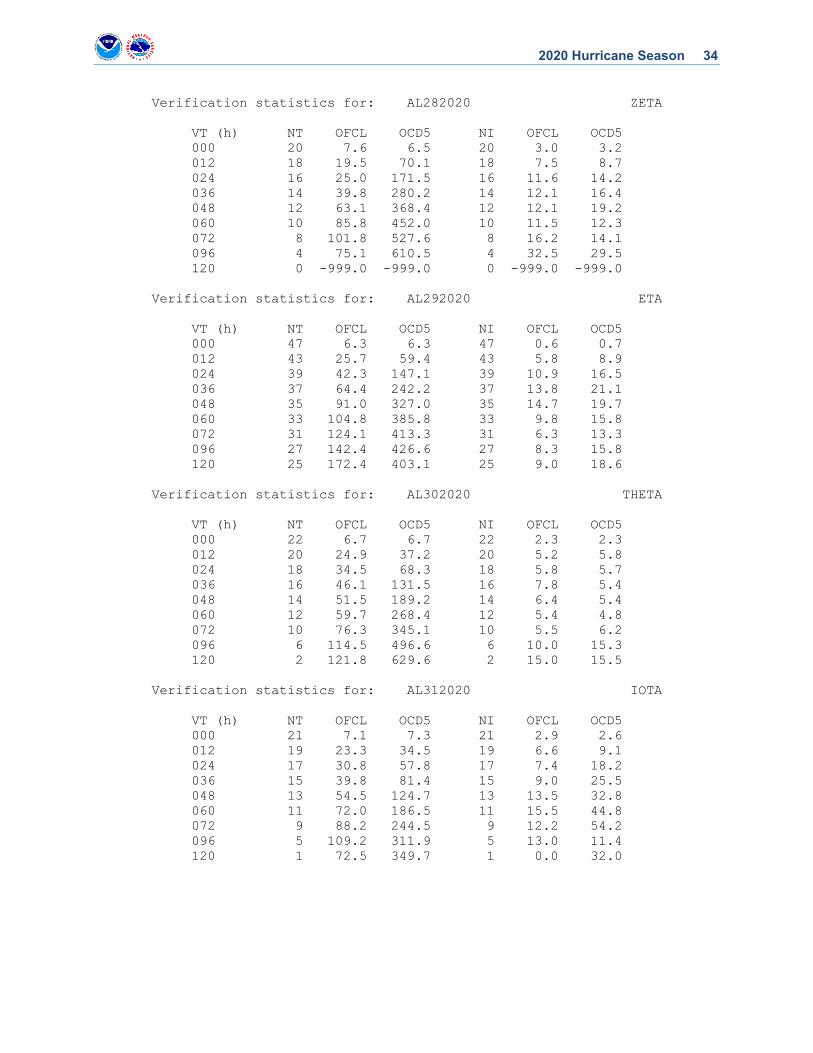
With regards to intensity, Hurricane Zeta was one of the more challenging cyclones to predict in 2020. The official intensity forecast errors were notably higher than the 5-yr averages at most forecast times, and Decay-SHIFOR errors were quite high as well, indicating the storm was challenging to forecast. In particular, Zeta’s rapid intensification over the Gulf of Mexico was not forecast by NHC or any of the models even as the intensification was beginning. Figure 14 shows an illustration of the official intensity errors stratified by storm. Additional discussion on forecast performance for individual storms can be found in NHC Tropical Cyclone Reports available at http://www.nhc.noaa.gov/data/tcr/index.php?season=2020&basin=atl
3. Eastern North Pacific Basin
a. 2020 season overview – Track
The NHC track forecast verification for the 2020 season in the eastern North Pacific, along with results averaged for the previous 5-yr period is presented in Figure 15 and Table 7. There were 256 forecasts issued for the eastern Pacific basin in 2020, which was the lowest number of forecasts in this basin since 2010, and well below the long-term mean of 328 (Fig. 16). Since most of the tropical cyclones in the basin were short-lived, only 29 forecasts verified at 120 h. Mean track errors ranged from 24 n mi at 12 h to 148 n mi at 120 h. These errors were a little higher than the 5-yr means, and about 20% higher than the mean at 120 h. The CLIPER errors were also higher than their 5-yr means, indicating that the track of the season’s storms were more challenging to predict than normal. No records for accuracy were set for track in this basin in 2020. The official track forecast vector biases were small through 96 h, but a more notable south to southeast bias existed at 96 and 120 h.
Figure 17 shows recent trends in track forecast accuracy and skill for the eastern North Pacific. Track errors have been dramatically reduced by about 70% for the 24- to 72-h forecasts

2020 Hurricane Season 12
since 1990, however, there has been little change in the errors during the past five years or so. At the 96- and 120-h forecast times, errors have dropped by about 60% since 2001, but like the short lead times, the error trends have been relatively flat during the past few years. Forecast skill in 2020 was higher than the 2019 values at all forecast times, but like track error there appears to be little trend in track skill values during the past several years.
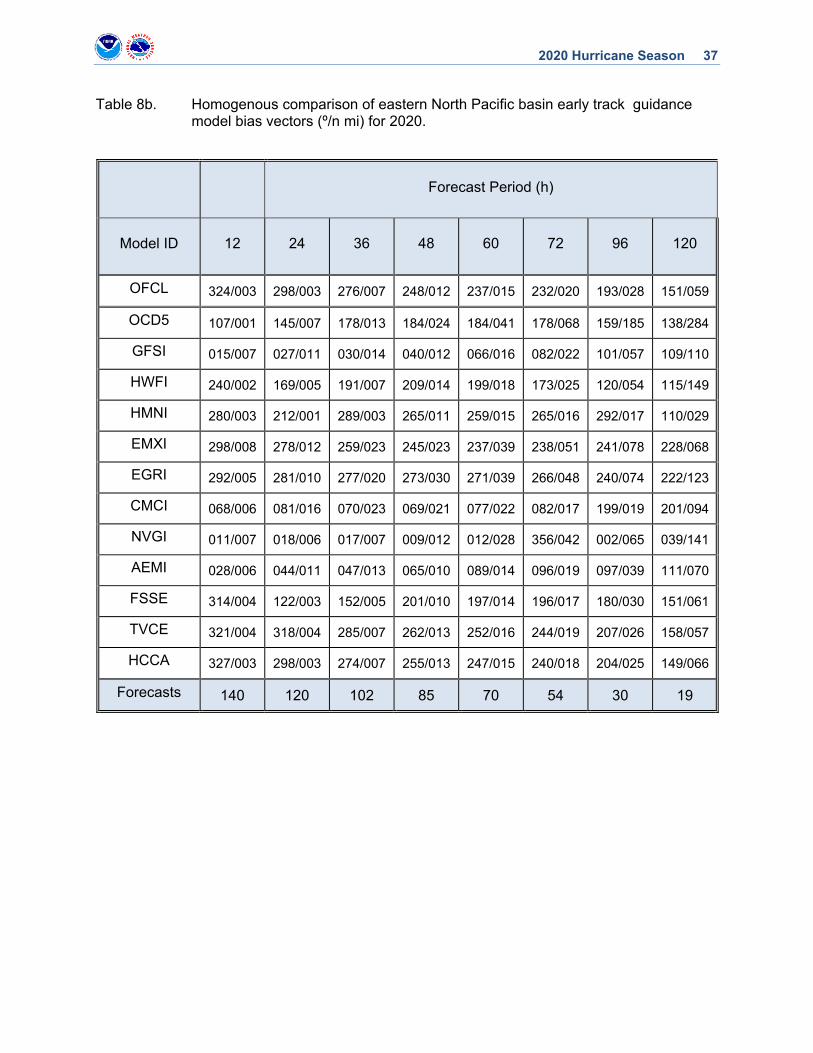
Table 8a presents a homogeneous verification for the official forecast and the early track models for 2020, with vector biases of the guidance models given in Table 8b. Skill comparisons of selected models are shown in Fig. 18. The official forecasts were very skillful and near the best models, the consensus aids. HCCA was the best aid overall, and it beat the official forecasts from 12 to 72 h. TVCE was the next best model, also beating the official forecasts from 12 to 36 h. FSSE was competitive with TVCE and HCCA but it had lower skill than both of those consensus aids at all forecast times. It was quite mixed bag concerning which individual model outperformed another. HMNI and EGRI were the best aids at 12 and 24 h, EMXI was best from 36-60 h and at 120 h, and GFSI was best at 72 and 96 h. HWFI and CMCI were less skillful and NVGI was not competitive. The official forecasts had smaller track biases than most of the models at 96 and 120 h in 2020. Among the models, EGRI and EMXI had a significant southwest bias at 96 and 120 h, and GFSI had a large east-southeast bias at the same forecast time periods
An evaluation of the three years 2018-20 (Fig. 19) indicates that the official forecasts were very skillful, and they were near the performance of the consensus models. HCCA slightly bested the official forecasts in the short term, but it had about the same amount of skill as the official forecast for the longer lead times. Regarding the individual models, EMXI was the best performer from 12 to 72 h, but AEMI had about equal skill from 72 to 120 h. GFSI and HWFI were next best, but EGRI and CMCI performed less well. It should be noted that the dip in skill at 60 h is due to the small sample, which NHC only began in 2020.
A separate verification of the primary consensus aids is given in Figure 20. The skill of the consensus models was tightly clustered, but HCCA, TVCX, and TVDG were the best aids in the short term and GFEX was best at the longer range forecast times. AEMI was less skillful (about 10% lower skill) than the highest performers.
b. 2020 season overview – Intensity
Figure 21 and Table 9 present the results of the NHC eastern North Pacific intensity forecast verification for the 2020 season, along with results averaged for the preceding 5-yr period. Mean forecast errors were 5 kt at 12 h and increased to 18 kt at 96 h. The errors were up to 35% lower than the 5-yr means from 12 to 48 h, but slightly higher than the 5-yr means at 72 and 96 h. The Decay-SHIFOR forecast errors were lower than their 5-yr means at all times, especially at 120 h where the 2020 errors were 38% smaller than normal. Records for accuracy were set from 12 to 48 h in 2020. A review of error and skill trends (Fig. 22) indicates that although there is considerable year-to-year variability in intensity errors, there has been a decrease in error over the past couple of decades at most forecast times, which has accelerated some during the past few years. Forecast skill has changed little during the last several years, however. Intensity forecast biases were slightly high (over-forecast) from 12 to 72 h, and low (under-forecast) at 120 h.

2020 Hurricane Season 13
Figure 23 and Table 10a present a homogeneous verification for the primary early intensity models for 2020. Forecast biases are given in Table 10b. The official forecasts were quite skillful and near the best models from 12 to 36 h, but the skill decreased significantly beyond that and there was little to no skill at 96 and 120 h. In fact, a similar trend is noted in all of the guidance with no model having skill at 120 h. This appears to be partly, if not mostly, associated with the low long lead-time Decay-SHIFOR errors. Among the individual models, HWFI was the best performer, and it even beat the official forecasts and the consensus models at 72 and 96 h. HMNI was a fairly good performer as well, especially for the short lead times. DSHP and LGEM were not as good as the purely dynamical models, and their skill fell sharply beyond 36 h. GFSI had a marginal amount of skill from 12 to 72 h and EMXI was generally not skillful. HWFI and HMNI had a slight low bias while DSHP, HCCA, and the official forecasts had a high bias, especially for the short lead times. An evaluation over the three years 2018-20 (Fig. 24) indicates a very different result than the 2020 sample alone. The official forecasts were skillful at all times and outperformed all of the guidance at 12 and 120 h, and they were competitive with the best aids HCCA and IVCN at the other forecast times. HWFI was the next best model, followed by HMNI and then DSHP and LGEM. GFSI had little skill while EMXI was generally not skillful.
c. Verifications for individual storms
Forecast verifications for individual storms are given for reference in Table 11. Additional discussion on forecast performance for individual storms can be found in NHC Tropical Cyclone Reports available at http://www.nhc.noaa.gov/data/tcr/index.php?season=2020&basin=epac.
4. Genesis Forecasts
The NHC routinely issues Tropical Weather Outlooks (TWOs) for both the Atlantic and eastern North Pacific basins. The TWOs are text products that discuss areas of disturbed weather and their potential for tropical cyclone development. Beginning in 2007, forecasters subjectively assigned a probability of genesis (0 to 100%, in 10% increments) to each area of disturbed weather described in the TWO, where the assigned probabilities represented the forecaster’s determination of the chance of tropical cyclone formation during the 48-h period following the nominal TWO issuance time. NHC added probabilistic tropical cyclone forecasts through 120 h beginning in 2013. Verification is based on NHC best-track data, with the time of genesis defined to be the first tropical cyclone point appearing in the best track.
Verifications of the 48-h outlook for the Atlantic and eastern North Pacific basins for 2020 are given in Table 12 and illustrated in Figure 25. In the Atlantic basin, a total of 1081 genesis forecasts were made. These 48-h forecasts exhibited a slight low bias at most probabilities. In the eastern Pacific, a total of 884 genesis forecasts were made. The forecasts in this basin were generally well calibrated.

2020 Hurricane Season 14
Verifications of the 120-h outlook for the Atlantic and eastern North Pacific basins for 2020 are given in Table 13 and illustrated in Figure 26. In the Atlantic basin, the 120-h forecasts, like the short-range forecasts, also had a low bias at most probabilities. In the eastern North Pacific, the genesis forecasts were generally reliable and well calibrated, except for a slight low bias between the 40 and 70% probabilities. The diagrams also show the refinement distribution, which indicates how often the forecasts deviated from (a perceived) climatology. Sharp peaks at climatology indicate low forecaster confidence, while maxima at the extremes indicate high confidence; the refinement distributions shown here suggest an intermediate level of forecaster confidence.
5. Looking Ahead to 2021
a. Track Forecast Cone Sizes
The National Hurricane Center track forecast cone depicts the probable track of the center of a tropical cyclone, and is formed by enclosing the area swept out by a set of circles along the forecast track (at 12, 24, 36 h, etc.). The size of each circle is set so that two-thirds of historical official forecast errors over the most-recent 5-yr sample fall within the circle. The circle radii defining the cones in 2021 for the Atlantic and eastern North Pacific basins (based on error distributions for 2016-20) are given in Table 14. In the Atlantic basin, the cone circles will be largely unchanged from last year. In the eastern Pacific basin, the cone circles will be slightly smaller from 24-96 h, and unchanged at the other forecast times. It should be noted that 60-h cone circles are now included, since NHC will continue making operational forecasts at that forecast time, and are based on interpolation of the 48- and 72-h cone sizes.
b. Consensus Models
In 2008, NHC changed the nomenclature for many of its consensus models. The new system defines a set of consensus model identifiers that remain fixed from year to year. The specific members of these consensus models, however, will be determined at the beginning of each season and may vary from year to year.
Some consensus models require all of their member models to be available in order to compute the consensus (e.g.,GFEX, ICON), while others are less restrictive, requiring only two or more members to be present (e.g., TVCA, IVCN). The terms “fixed” and “variable” can be used to describe these two approaches, respectively. In a variable consensus model, it is often the case that the 120-h forecast is based on a different set of members than the 12-h forecast. While this approach greatly increases availability, it does pose consistency issues for the forecaster.
The consensus model composition for 2021 is given in Table 15. The consensus models are unchanged from their compositions in 2020.

2020 Hurricane Season 15
Acknowledgments
The author gratefully acknowledges Michael Brennan and members of the Technology and Science Branch of NHC, managers of the NHC forecast databases.
6. References Aberson, S. D., 1998: Five-day tropical cyclone track forecasts in the North Atlantic basin. Wea.
Forecasting, 13, 1005-1015.
Cangialosi. J.P., and C.W. Landsea, 2016: An examination of model and official National Hurricane Center tropical cyclone size forecasts. Wea. And Forecasting, 31, 1293-1300.
Cangialosi, J.P., E. Blake, M. DeMaria, A. Penny, A. Latto, and E. Rappaport, 2020: Recent f progress in tropical cyclone intensity forecasting at the National Hurricane Center. Wea. A Forecasting, 35, 1913-1922.
DeMaria, M., J. A. Knaff, and J. Kaplan, 2006: On the decay of tropical cyclone winds crossing narrow landmasses, J. Appl. Meteor., 45, 491-499.
Jarvinen, B. R., and C. J. Neumann, 1979: Statistical forecasts of tropical cyclone intensity for the North Atlantic basin. NOAA Tech. Memo. NWS NHC-10, 22 pp.
Knaff, J.A., M. DeMaria, B. Sampson, and J.M. Gross, 2003: Statistical, five-day tropical cyclone intensity forecasts derived from climatology and persistence. Wea. Forecasting, 18, 80-92.
Neumann, C. B., 1972: An alternate to the HURRAN (hurricane analog) tropical cyclone forecast system. NOAA Tech. Memo. NWS SR-62, 24 pp.
Simon, A., A. B. Penny, M. DeMaria, J. L. Franklin, R. J. Pasch, E. N. Rappaport, and D. A. Zelinsky, 2018. A description of the real-time HFIP Corrected Consensus Approach (HCCA) for tropical cyclone track and intensity guidance, Wea. Forecasting, 33(1), 37-57.

2020 Hurricane Season 16
List of Tables
1. National Hurricane Center forecasts and models.
2. Homogenous comparison of official and CLIPER5 track forecast errors in the Atlantic basin for the 2020 season for all tropical cyclones.
3. (a) Homogenous comparison of Atlantic basin early track guidance model errors (n mi) for 2020. (b) Homogenous comparison of Atlantic basin early track guidance model bias vectors (º/n mi) for 2020.
4. Homogenous comparison of official and Decay-SHIFOR5 intensity forecast errors in the Atlantic basin for the 2020 season for all tropical cyclones.
5. (a) Homogenous comparison of Atlantic basin early intensity guidance model errors (kt) for 2020. (b) Homogenous comparison of a selected subset of Atlantic basin early intensity guidance model errors (kt) for 2020. (c) Homogenous comparison of a selected subset of Atlantic basin early intensity guidance model biases (kt) for 2020.
6. Official Atlantic track and intensity forecast verifications (OFCL) for 2020 by storm.
7. Homogenous comparison of official and CLIPER5 track forecast errors in the eastern North Pacific basin for the 2020 season for all tropical cyclones.
8. (a) Homogenous comparison of eastern North Pacific basin early track guidance model errors (n mi) for 2020. (b) Homogenous comparison of eastern North Pacific basin early track guidance model bias vectors (º/n mi) for 2020.
9. Homogenous comparison of official and Decay-SHIFOR5 intensity forecast errors in the eastern North Pacific basin for the 2020 season for all tropical cyclones.
10. (a) Homogenous comparison of eastern North Pacific basin early intensity guidance model errors (kt) for 2020. (b) Homogenous comparison of eastern North Pacific basin early intensity guidance model biases (kt) for 2020.
11. Official eastern North Pacific track and intensity forecast verifications (OFCL) for 2020 by storm.
12. Verification of 48-h probabilistic genesis forecasts for (a) the Atlantic and (b) eastern North Pacific basins for 2020.
13. Verification of 120-h probabilistic genesis forecasts for (a) the Atlantic and (b) eastern North Pacific basins for 2020.
14. NHC forecast cone circle radii (n mi) for 2021. Change from 2020 values in n mi and percent are given in parentheses.
15. Composition of NHC consensus models for 2021. It is intended that TCOA/TVCA would be the primary consensus aids for the Atlantic basin and TCOE/TVCE would be primary for the eastern Pacific.

2020 Hurricane Season 17
Table 1. National Hurricane Center forecasts and models.
ID Name/Description Type Timeliness
(E/L)
Parameters forecast
OFCL Official NHC forecast Trk, Int
HWRF Hurricane Weather and
Research Forecasting Model Multi-layer regional
dynamical L Trk, Int
HMON Hurricanes in a Multi-scale
Ocean-coupled Non-hydrostatic model
Multi-layer regional dynamical
L Trk, Int
GFSO NWS/Global Forecast System
(formerly Aviation) Multi-layer global
dynamical L Trk, Int
AEMN GFS ensemble mean Consensus L Trk, Int
UKM United Kingdom Met Office model, automated tracker
Multi-layer global dynamical
L Trk, Int
EGRR United Kingdom Met Office
model with subjective quality control applied to the tracker
Multi-layer global dynamical
L Trk, Int
UEMN UKMET ensemble mean Consensus L Trk, Int
NVGM Navy Global Environmental
Model Multi-layer global
dynamical L Trk, Int
CMC Environment Canada global
model Multi-level global
dynamical L Trk, Int
NAM NWS/NAM Multi-level regional
dynamical L Trk, Int
CTX COAMPS-TC using GFS initial
and boundary conditions Multi-layer regional
dynamical L Trk, Int
EMX ECMWF global model Multi-layer global
dynamical L Trk, Int
EEMN ECMWF ensemble mean Consensus L Trk

2020 Hurricane Season 18
ID Name/Description Type Timeliness
(E/L)
Parameters forecast
TABS Beta and advection model
(shallow layer) Single-layer trajectory E Trk
TABM Beta and advection model
(medium layer) Single-layer trajectory E Trk
TABD Beta and advection model
(deep layer) Single-layer trajectory E Trk
CLP5 CLIPER5 (Climatology and
Persistence model) Statistical (baseline) E Trk
SHF5 SHIFOR5 (Climatology and
Persistence model) Statistical (baseline) E Int
DSF5 DSHIFOR5 (Climatology and
Persistence model) Statistical (baseline) E Int
OCD5 CLP5 (track) and DSF5
(intensity) models merged Statistical (baseline) E Trk, Int
TCLP Trajectory-CLIPER model Statistical (baseline) E Trk, Int
SHIP Statistical Hurricane Intensity Prediction Scheme (SHIPS)
Statistical-dynamical E Int
DSHP SHIPS with inland decay Statistical-dynamical E Int
OFCI Previous cycle OFCL, adjusted Interpolated E Trk, Int
HWFI Previous cycle HWRF, adjusted Interpolated-dynamical E Trk, Int
HMNI Previous cycle HMON, adjusted Interpolated-dynamical E Trk, Int
CTCI Previous cycle CTCX, adjusted Interpolated-dynamical E Trk, Int
GFSI Previous cycle GFS, adjusted Interpolated-dynamical E Trk, Int
UKMI Previous cycle UKM, adjusted Interpolated-dynamical E Trk, Int

2020 Hurricane Season 19
ID Name/Description Type Timeliness
(E/L)
Parameters forecast
EGRI Previous cycle EGRR, adjusted Interpolated-dynamical E Trk, Int
NVGI Previous cycle NVGM, adjusted Interpolated-dynamical E Trk, Int
EMXI Previous cycle EMX, adjusted Interpolated-dynamical E Trk, Int
CMCI Previous cycle CMC, adjusted Interpolated-dynamical E Trk, Int
AEMI Previous cycle AEMN, adjusted Consensus E Trk, Int
UEMI Previous cycle UEMN, adjusted Consensus E Trk, Int
FSSE FSU Super-ensemble Corrected consensus E Trk, Int
GFEX Average of GFSI and EMXI Consensus E Trk
TVCN Average of at least two of GFSI
EGRI HWFI EMXI CTCI Consensus E Trk
TVCA Average of at least two of GFSI
EGRI HWFI EMXI CTCI Consensus E Trk
TVCE Average of at least two of GFSI
EGRI HWFI EMXI CTCI Consensus E Trk
TVCX EMXI and average of at least
two of GFSI EGRI HWFI EMXI CTCI
Consensus E Trk
TVCC Version of TVCN corrected for
model biases Corrected consensus E Trk
TVDG GFSI (double weight) EMXI
(double weight) EGRI (double weight) CTCI HWFI
Corrected consensus E Trk
HCCA
Weighted average of AEMI, GFSI, CTCI, DSHP, EGRI, EMNI, EMXI,HWFI, HMNI
LGEM
Corrected consensus E Trk, Int

2020 Hurricane Season 20
ID Name/Description Type Timeliness
(E/L)
Parameters forecast
ICON Average of DSHP, LGEM,
CTCI, HMNI and HWFI Consensus E Int
IVDR CTCI (double weight) HWFI
(double weight) HMNI (double weight) GFSI DSHP LGEM
Consensus E Int
IVCN Average of at least two of
DSHP LGEM HWFI HMNI CTCI Consensus E Int

2020 Hurricane Season 21
Table 2. Homogenous comparison of official and CLIPER5 track forecast errors in the Atlantic basin in 2020 for all tropical cyclones. Averages for the previous 5-yr period are shown for comparison.
Forecast Period (h)
12 24 36 48 60 72 96 120
2020 mean OFCL error (n mi)
23.6 35.6 49.7 64.5 79.8 98.0 133.0 189.6
2020 mean CLIPER5 error
(n mi) 45.6 97.9 155.7 208.2 257.0 300.0 366.0 435.0
2020 mean OFCL skill relative to CLIPER5 (%)
48.2 63.6 68.1 69.0 68.9 67.3 63.7 56.4
2020 mean OFCL bias vector (°/n mi)
354/003 319/004 300/006 305/008 304/010 315/010 177/008 172/048
2020 number of cases
535 474 419 369 319 275 192 131
2015-2019 mean OFCL error (n mi)
24.2 37.1 49.8 65.3 96.5 133.2 171.6
2015-2019 mean CLIPER5 error
(n mi) 44.8 96.4 156.9 218.4 331.3 431.5 511.9
2015-2019 mean OFCL skill relative to CLIPER5 (%)
46.0 61.5 68.3 70.1 70.9 69.1 66.5
2015-2019 mean OFCL bias vector
(°/n mi) 356/002 315/003 301/004 301/004 266/002 266/007 263/030
2015-2019 number of cases
1437 1288 1145 1010 0 776 602 474
2020 OFCL error relative to 2015-2019 mean (%)
-2.5 -4.0 -0.2 -1.2 1.6 -0.2 10.5
2020 CLIPER5 error relative to
2015-2019 mean (%)
1.8 1.6 -0.8 -4.7 -9.4 -15.2 -15.0

2020 Hurricane Season 22
Table 3a. Homogenous comparison of Atlantic basin early track guidance model errors (n mi) for 2020. Errors smaller than the NHC official forecast are shown in bold-face.
Model ID Forecast Period (h)
12 24 36 48 60 72 96 120
OFCL 21.0 32.2 46.9 60.7 78.3 96.8 141.2 217.2
OCD5 44.0 101.1 165.4 220.8 269.7 310.4 357.3 404.2
GFSI 22.1 37.2 50.3 65.3 84.3 107.4 172.6 281.6
HMNI 24.4 38.2 54.2 71.8 93.9 124.1 177.1 245.9
HWFI 25.1 41.4 57.6 76.4 98.2 122.7 172.4 275.3
EGRI 25.1 41.8 59.9 77.5 100.7 129.0 200.5 300.2
EMXI 22.6 36.4 53.1 70.4 90.4 111.1 164.8 262.7
CMCI 26.8 44.1 61.6 77.4 95.9 117.5 166.3 250.9
NVGI 28.4 47.3 68.6 88.5 112.6 131.8 186.2 262.3
CTCI 22.5 36.0 51.5 68.0 86.9 110.6 163.1 242.0
AEMI 22.6 37.3 53.5 69.5 89.0 113.5 167.9 259.7
HCCA 20.0 30.2 42.5 57.6 76.8 99.5 141.1 215.7
TVCA 20.4 31.2 45.0 59.7 76.3 96.4 140.4 224.0
FSSE 21.1 32.3 47.5 62.3 80.2 101.2 143.2 213.6
Forecasts 310 280 246 210 171 143 89 52

2020 Hurricane Season 23
Table 3b. Homogenous comparison of Atlantic basin early track guidance model bias vectors (º/n mi) for 2020.
Forecast Period (h)
Model ID 12 24 36 48 60 72 96 120
OFCL 296/001 249/004 243/007 245/010 225/013 211/016 191/040 167/087
OCD5 162/004 157/015 149/026 126/046 116/081 119/114 120/186 127/265
GFSI 312/002 256/003 237/004 229/007 198/015 191/021 175/047 169/117
HMNI 359/005 353/008 337/009 322/009 285/007 264/013 214/012 126/042
HWFI 355/006 330/009 304/013 295/018 276/024 263/035 239/041 201/068
EGRI 199/005 190/009 188/015 191/020 181/025 171/036 159/076 136/168
EMXI 249/004 233/011 233/017 234/025 229/025 224/037 213/057 191/086
CMCI 266/005 263/010 272/013 269/013 229/008 179/015 125/051 118/108
NVGI 257/001 104/003 111/005 115/011 114/022 118/031 137/061 122/122
CTCI 033/004 046/007 045/008 048/008 109/009 125/013 137/032 128/087
AEMI 240/003 229/008 233/012 235/015 221/018 210/021 171/042 144/104
HCCA 217/002 215/005 228/009 242/01 241/020 239/024 215/034 170/056
TVCA 295/002 245/004 238/007 238/011 218/037 218/017 210/023 188/045
FSSE 316/001 266/002 261/004 276/008 279/009 280/008 175/012 133/054
Forecasts 310 280 246 210 171 143 89 52

2020 Hurricane Season 24
Table 4. Homogenous comparison of official and Decay-SHIFOR5 intensity forecast errors in the Atlantic basin for the 2020 season for all tropical cyclones. Averages for the previous 5-yr period are shown for comparison.
Forecast Period (h)
12 24 36 48 60 72 96 120
2020 mean OFCL error (kt) 5.6 8.6 10.1 11.6 11.5 10.9 11.9 13.1
2020 mean Decay-SHIFOR5 error (kt) 7.3 11.2 14.8 17.0 17.5 18.7 21.1 19.7
2020 mean OFCL skill relative to Decay-
SHIFOR5 (%) 23.3 23.2 31.8 31.8 34.3 41.7 43.6 33.5
2020 OFCL bias (kt) 0.5 0.4 0.6 0.8 1.5 2.2 0.7 -3.2
2020 number of cases 535 474 419 369 319 275 192 131
2015-19 mean OFCL error (kt) 5.2 7.7 9.5 10.7 13.0 14.4 15.5
2015-19 mean Decay-SHIFOR5 error (kt) 6.9 10.8 14.1 17.0 20.6 22.5 24.6
2015-19 mean OFCL skill relative to Decay-
SHIFOR5 (%) 24.6 28.7 32.6 37.1 36.9 36.0 37.0
2015-19 OFCL bias (kt) -0.6 -0.9 -1.3 -1.7 -1.6 -1.8 -3.2
2015-19 number of cases 1437 1288 1145 1010 0 776 602 474
2020 OFCL error relative to 2015-19 mean (%) 7.7 11.7 6.3 8.4 -16.2 -17.4 -15.5
2020 Decay-SHIFOR5 error relative to 2015-19
mean (%) 5.8 3.7 5.0 0.0 -9.2 -6.2 -19.9

2020 Hurricane Season 25
Table 5a. Homogenous comparison of selected Atlantic basin early intensity guidance model errors (kt) for 2020. Errors smaller than the NHC official forecast are shown in boldface.
Model ID Forecast Period (h)
12 24 36 48 60 72 96 120
OFCL 6.3 9.2 10.7 11.7 12.0 10.6 12.5 14.7
OCD5 8.2 12.2 15.6 17.2 17.7 18.2 20.1 17.9
HWFI 7.2 9.6 10.8 11.7 13.0 13.9 14.0 13.2
HMNI 7.9 11.5 13.2 14.1 14.7 14.5 16.0 16.1
CTCI 7.4 10.1 11.3 11.7 13.4 15.5 15.4 16.9
DSHP 7.3 9.7 11.9 13.8 14.6 13.9 18.3 19.8
LGEM 7.3 10.2 12.7 14.3 14.2 13.9 17.1 19.0
IVCN 6.7 9.0 10.3 10.8 11.4 11.0 12.8 13.2
FSSE 6.7 8.8 10.4 11.0 11.8 12.6 17.9 20.1
HCCA 6.6 9.1 10.5 10.8 11.5 11.1 12.7 11.4
GFSI 8.5 11.6 13.2 13.3 14.5 14.7 16.2 18.1
EMXI 8.8 12.4 13.8 14.8 15.9 16.5 18.0 22.7
NNIC 6.9 8.9 10.0 11.0 12.8 12.3 14.9 16.2
Forecasts 361 321 279 236 197 167 108 69

2020 Hurricane Season 26
Table 5b. Homogenous comparison of selected Atlantic basin early intensity guidance model biases (kt) for 2020. Biases smaller than the NHC official forecast are shown in boldface.
Forecast Period (h)
Model ID 12 24 36 48 60 72 96 120
OFCL 1.2 1.2 1.6 1.6 2.0 2.4 1.4 -4.4
OCD5 -0.6 -1.8 -2.7 -3.7 -3.9 -4.3 -7.5 -10.2
HWFI -1.8 -2.4 -2.2 -1.7 -0.6 0.5 -0.9 -5.2
HMNI 0.0 -1.4 -2.1 -2.1 -0.6 0.7 0.3 -5.7
CTCI -1.0 -2.2 -2.0 -1.1 -0.6 -1.1 -2.0 -4.4
DSHP -1.0 -2.0 -2.1 -2.4 -2.6 -2.6 -4.9 -8.5
LGEM -1.3 -3.0 -3.4 -3.9 -3.8 -3.8 -5.7 -9.7
IVCN -0.7 -1.9 -2.1 -2.0 -1.3 -1.0 -2.4 -6.7
FSSE 0.2 0.4 1.1 2.0 3.1 4.4 3.9 -2.2
HCCA -0.6 -1.3 -1.1 0.5 1.8 2.7 2.6 0.0
GFSI -0.8 -2.3 -3.7 -4.7 -5.2 -5.3 -7.2 -13.5
EMXI -1.6 -3.0 -4.6 -7.1 -10.0 -11.6 -15.2 -19.5
NNIC 0.8 1.2 1.4 2.1 3.7 3.0 -1.2 2.2
Forecasts 361 321 279 236 197 167 108 69

2020 Hurricane Season 27
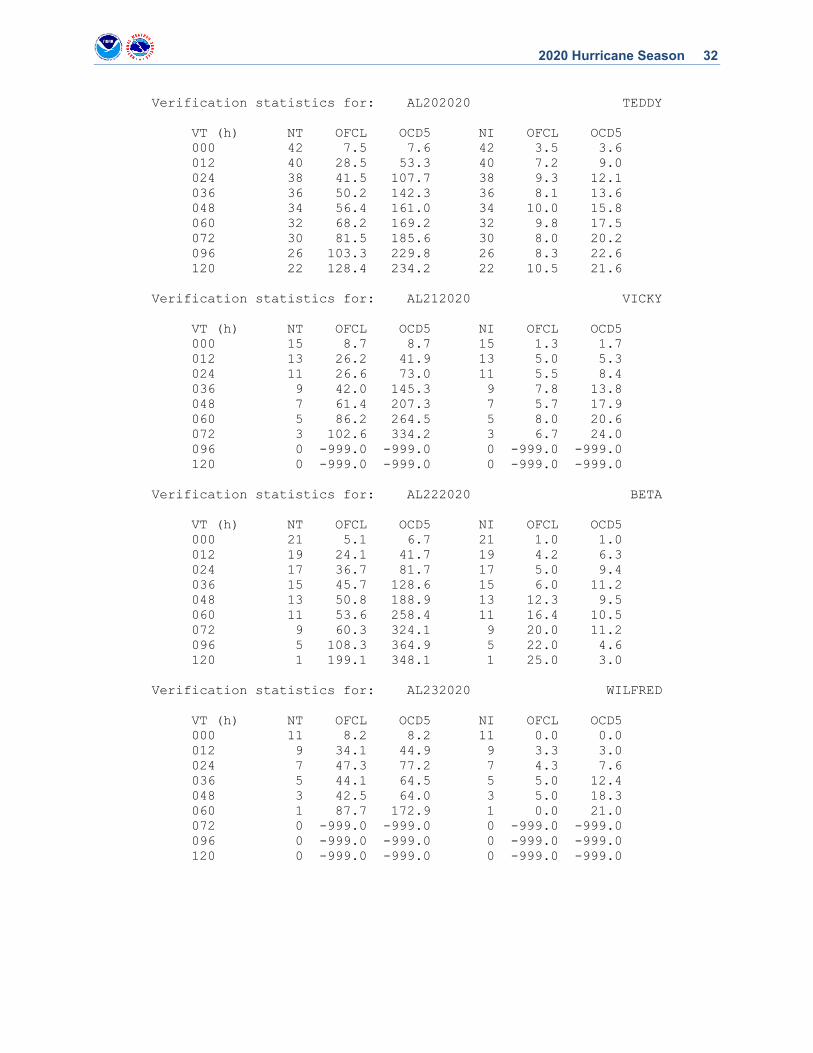
Table 6. Official Atlantic track and intensity forecast verifications (OFCL) for 2020 by storm. CLIPER5 (CLP5) and SHIFOR5 (SHF5) forecast errors are given for comparison and indicated collectively as OCD5. The number of track and intensity forecasts are given by NT and NI, respectively. Units for track and intensity errors are n mi and kt, respectively.
Verification statistics for: AL012020 ARTHUR
VT (h) NT OFCL OCD5 NI OFCL OCD5 000 11 5.5 5.9 11 0.9 1.8 012 9 17.4 51.3 9 1.1 5.4 024 7 24.6 95.8 7 3.6 10.1 036 5 17.4 107.6 5 0.0 13.6 048 3 17.6 71.9 3 1.7 17.7 060 1 46.8 57.1 1 0.0 20.0 072 0 -999.0 -999.0 0 -999.0 -999.0 096 0 -999.0 -999.0 0 -999.0 -999.0 120 0 -999.0 -999.0 0 -999.0 -999.0
Verification statistics for: AL022020 BERTHA
VT (h) NT OFCL OCD5 NI OFCL OCD5 000 4 18.6 29.8 4 0.0 2.5 012 2 34.4 86.5 2 2.5 6.5 024 0 -999.0 -999.0 0 -999.0 -999.0 036 0 -999.0 -999.0 0 -999.0 -999.0 048 0 -999.0 -999.0 0 -999.0 -999.0 060 0 -999.0 -999.0 0 -999.0 -999.0 072 0 -999.0 -999.0 0 -999.0 -999.0 096 0 -999.0 -999.0 0 -999.0 -999.0 120 0 -999.0 -999.0 0 -999.0 -999.0
Verification statistics for: AL032020 CRISTOBAL
VT (h) NT OFCL OCD5 NI OFCL OCD5 000 28 8.6 9.1 28 2.1 2.1 012 28 19.5 48.4 28 4.5 5.7 024 28 30.7 113.3 28 5.5 8.6 036 27 44.7 181.1 27 4.8 10.4 048 25 57.4 234.0 25 4.6 10.6 060 23 65.6 282.0 23 5.0 8.9 072 21 70.9 325.5 21 6.7 7.3 096 17 102.0 372.6 17 5.6 9.5 120 13 145.2 387.1 13 8.8 13.9

2020 Hurricane Season 28
Verification statistics for: AL042020 DOLLY
VT (h) NT OFCL OCD5 NI OFCL OCD5 000 6 1.5 1.5 6 2.5 2.5 012 4 21.5 35.7 4 5.0 5.5 024 2 28.7 66.5 2 7.5 4.5 036 0 -999.0 -999.0 0 -999.0 -999.0 048 0 -999.0 -999.0 0 -999.0 -999.0 060 0 -999.0 -999.0 0 -999.0 -999.0 072 0 -999.0 -999.0 0 -999.0 -999.0 096 0 -999.0 -999.0 0 -999.0 -999.0 120 0 -999.0 -999.0 0 -999.0 -999.0
Verification statistics for: AL052020 EDOUARD
VT (h) NT OFCL OCD5 NI OFCL OCD5 000 10 1.1 1.1 10 0.0 0.0 012 8 29.5 78.1 8 2.5 2.2 024 6 44.9 213.1 6 3.3 3.5 036 4 63.6 348.5 4 2.5 1.8 048 2 85.1 455.5 2 5.0 1.0 060 0 -999.0 -999.0 0 -999.0 -999.0 072 0 -999.0 -999.0 0 -999.0 -999.0 096 0 -999.0 -999.0 0 -999.0 -999.0 120 0 -999.0 -999.0 0 -999.0 -999.0
Verification statistics for: AL062020 FAY
VT (h) NT OFCL OCD5 NI OFCL OCD5 000 6 2.0 2.0 6 0.8 0.8 012 4 12.8 39.9 4 5.0 5.8 024 2 13.9 110.2 2 7.5 11.5 036 0 -999.0 -999.0 0 -999.0 -999.0 048 0 -999.0 -999.0 0 -999.0 -999.0 060 0 -999.0 -999.0 0 -999.0 -999.0 072 0 -999.0 -999.0 0 -999.0 -999.0 096 0 -999.0 -999.0 0 -999.0 -999.0 120 0 -999.0 -999.0 0 -999.0 -999.0
Verification statistics for: AL072020 GONZALO
VT (h) NT OFCL OCD5 NI OFCL OCD5 000 17 5.5 6.3 17 0.3 0.6 012 15 26.9 36.7 15 7.0 6.7 024 13 49.2 68.3 13 15.8 12.8 036 11 64.1 109.9 11 22.7 20.1 048 9 70.0 138.9 9 24.4 22.9 060 7 79.6 179.3 7 24.3 22.6 072 5 85.4 233.1 5 23.0 17.8 096 1 96.8 422.8 1 20.0 14.0 120 0 -999.0 -999.0 0 -999.0 -999.0

2020 Hurricane Season 29
Verification statistics for: AL082020 HANNA
VT (h) NT OFCL OCD5 NI OFCL OCD5 000 16 9.2 8.3 16 3.1 3.4 012 14 20.9 29.4 14 5.4 5.4 024 12 21.1 61.1 12 8.8 10.1 036 10 31.4 110.2 10 13.5 13.3 048 8 50.3 192.8 8 19.4 13.2 060 6 67.4 295.2 6 21.7 17.0 072 4 105.7 399.9 4 17.5 21.5 096 0 -999.0 -999.0 0 -999.0 -999.0 120 0 -999.0 -999.0 0 -999.0 -999.0
Verification statistics for: AL092020 ISAIAS
VT (h) NT OFCL OCD5 NI OFCL OCD5 000 24 3.8 3.8 24 2.1 2.3 012 22 22.1 44.0 22 7.5 9.0 024 20 36.0 91.4 20 11.0 12.9 036 18 54.7 125.8 18 11.4 16.1 048 16 73.4 157.3 16 11.2 16.5 060 14 82.2 179.6 14 7.9 13.4 072 12 97.7 183.2 12 7.1 12.4 096 8 124.0 242.4 8 3.8 16.5 120 4 183.1 405.5 4 8.8 13.0
Verification statistics for: AL102020 TEN
VT (h) NT OFCL OCD5 NI OFCL OCD5 000 5 11.6 11.6 5 0.0 0.0 012 3 20.9 43.6 3 3.3 4.3 024 1 32.1 123.0 1 5.0 8.0 036 0 -999.0 -999.0 0 -999.0 -999.0 048 0 -999.0 -999.0 0 -999.0 -999.0 060 0 -999.0 -999.0 0 -999.0 -999.0 072 0 -999.0 -999.0 0 -999.0 -999.0 096 0 -999.0 -999.0 0 -999.0 -999.0 120 0 -999.0 -999.0 0 -999.0 -999.0
Verification statistics for: AL112020 JOSEPHINE
VT (h) NT OFCL OCD5 NI OFCL OCD5 000 20 8.7 8.7 20 1.5 1.5 012 18 29.4 36.5 18 4.4 6.9 024 16 33.8 56.7 16 5.9 8.4 036 14 41.2 83.2 14 7.1 9.4 048 12 43.5 94.9 12 9.2 12.2 060 10 65.3 128.6 10 11.0 17.2 072 8 78.0 148.8 8 8.8 17.4 096 4 93.0 110.7 4 7.5 26.5 120 0 -999.0 -999.0 0 -999.0 -999.0

2020 Hurricane Season 30
Verification statistics for: AL122020 KYLE
VT (h) NT OFCL OCD5 NI OFCL OCD5 000 5 2.5 2.5 5 2.0 4.0 012 3 27.8 41.4 3 3.3 4.7 024 1 45.9 107.9 1 5.0 9.0 036 0 -999.0 -999.0 0 -999.0 -999.0 048 0 -999.0 -999.0 0 -999.0 -999.0 060 0 -999.0 -999.0 0 -999.0 -999.0 072 0 -999.0 -999.0 0 -999.0 -999.0 096 0 -999.0 -999.0 0 -999.0 -999.0 120 0 -999.0 -999.0 0 -999.0 -999.0
Verification statistics for: AL132020 LAURA
VT (h) NT OFCL OCD5 NI OFCL OCD5 000 37 10.4 10.7 37 1.1 1.2 012 35 26.3 46.5 35 4.1 7.6 024 33 39.5 89.8 33 7.3 12.0 036 31 56.1 151.5 31 8.2 14.9 048 29 69.4 238.6 29 8.6 18.1 060 27 79.3 314.1 27 10.6 21.4 072 25 91.1 378.2 25 10.4 26.8 096 21 120.3 549.2 21 13.6 36.9 120 17 182.3 735.0 17 21.2 29.8
Verification statistics for: AL142020 MARCO
VT (h) NT OFCL OCD5 NI OFCL OCD5 000 16 5.7 5.7 16 1.2 1.2 012 14 30.3 39.7 14 7.1 8.4 024 12 54.1 74.7 12 13.3 13.9 036 10 84.1 125.7 10 15.0 21.2 048 8 129.0 193.8 8 15.0 26.5 060 6 184.0 271.3 6 13.3 25.0 072 4 225.2 361.7 4 21.2 17.0 096 0 -999.0 -999.0 0 -999.0 -999.0 120 0 -999.0 -999.0 0 -999.0 -999.0
Verification statistics for: AL152020 OMAR
VT (h) NT OFCL OCD5 NI OFCL OCD5 000 20 4.4 4.4 20 1.2 1.5 012 18 19.2 44.1 18 1.4 3.5 024 16 32.5 103.6 16 3.8 7.4 036 14 49.3 175.5 14 3.2 14.4 048 12 72.4 253.6 12 5.0 21.7 060 10 86.1 313.6 10 4.5 28.2 072 8 121.4 383.0 8 5.0 33.2 096 4 249.0 381.8 4 3.8 35.8 120 0 -999.0 -999.0 0 -999.0 -999.0

2020 Hurricane Season 31
Verification statistics for: AL162020 NANA
VT (h) NT OFCL OCD5 NI OFCL OCD5 000 10 1.4 3.2 10 2.0 2.0 012 8 24.8 25.6 8 5.6 6.8 024 6 45.6 65.4 6 7.5 5.0 036 4 67.4 134.7 4 10.0 7.5 048 2 104.1 231.0 2 17.5 16.0 060 0 -999.0 -999.0 0 -999.0 -999.0 072 0 -999.0 -999.0 0 -999.0 -999.0 096 0 -999.0 -999.0 0 -999.0 -999.0 120 0 -999.0 -999.0 0 -999.0 -999.0
Verification statistics for: AL172020 PAULETTE
VT (h) NT OFCL OCD5 NI OFCL OCD5 000 40 6.7 6.7 40 0.6 0.6 012 36 18.0 42.5 36 4.3 4.1 024 34 33.7 100.5 34 6.9 6.0 036 32 49.8 167.1 32 7.8 8.3 048 30 68.7 212.2 30 7.7 9.3 060 28 95.4 248.5 28 7.3 9.4 072 26 132.7 270.9 26 8.3 10.7 096 22 212.4 327.3 22 12.5 11.4 120 21 277.4 536.5 21 15.5 15.9
Verification statistics for: AL182020 RENE
VT (h) NT OFCL OCD5 NI OFCL OCD5 000 30 8.0 7.9 30 1.3 1.3 012 28 15.3 26.4 28 3.9 4.5 024 26 26.6 62.3 26 9.6 6.9 036 24 37.0 93.9 24 16.5 11.7 048 22 52.8 119.2 22 23.4 15.1 060 20 77.5 135.5 20 28.5 18.5 072 18 105.6 139.6 18 29.4 21.8 096 14 145.3 170.8 14 27.1 30.3 120 10 237.1 253.5 10 24.5 27.2
Verification statistics for: AL192020 SALLY
VT (h) NT OFCL OCD5 NI OFCL OCD5 000 23 8.1 8.1 23 2.4 2.6 012 21 20.9 30.8 21 8.1 10.9 024 19 36.3 60.7 19 7.6 11.2 036 17 51.1 97.2 17 7.4 16.6 048 15 64.8 134.5 15 9.7 25.5 060 13 73.2 167.8 13 15.0 28.6 072 11 87.8 211.2 11 16.4 32.6 096 7 105.9 262.1 7 16.4 35.6 120 3 212.8 395.8 3 16.7 14.3
2020 Hurricane Season 32
Verification statistics for: AL202020 TEDDY
VT (h) NT OFCL OCD5 NI OFCL OCD5 000 42 7.5 7.6 42 3.5 3.6 012 40 28.5 53.3 40 7.2 9.0 024 38 41.5 107.7 38 9.3 12.1 036 36 50.2 142.3 36 8.1 13.6 048 34 56.4 161.0 34 10.0 15.8 060 32 68.2 169.2 32 9.8 17.5 072 30 81.5 185.6 30 8.0 20.2 096 26 103.3 229.8 26 8.3 22.6 120 22 128.4 234.2 22 10.5 21.6
Verification statistics for: AL212020 VICKY
VT (h) NT OFCL OCD5 NI OFCL OCD5 000 15 8.7 8.7 15 1.3 1.7 012 13 26.2 41.9 13 5.0 5.3 024 11 26.6 73.0 11 5.5 8.4 036 9 42.0 145.3 9 7.8 13.8 048 7 61.4 207.3 7 5.7 17.9 060 5 86.2 264.5 5 8.0 20.6 072 3 102.6 334.2 3 6.7 24.0 096 0 -999.0 -999.0 0 -999.0 -999.0 120 0 -999.0 -999.0 0 -999.0 -999.0
Verification statistics for: AL222020 BETA
VT (h) NT OFCL OCD5 NI OFCL OCD5 000 21 5.1 6.7 21 1.0 1.0 012 19 24.1 41.7 19 4.2 6.3 024 17 36.7 81.7 17 5.0 9.4 036 15 45.7 128.6 15 6.0 11.2 048 13 50.8 188.9 13 12.3 9.5 060 11 53.6 258.4 11 16.4 10.5 072 9 60.3 324.1 9 20.0 11.2 096 5 108.3 364.9 5 22.0 4.6 120 1 199.1 348.1 1 25.0 3.0
Verification statistics for: AL232020 WILFRED
VT (h) NT OFCL OCD5 NI OFCL OCD5 000 11 8.2 8.2 11 0.0 0.0 012 9 34.1 44.9 9 3.3 3.0 024 7 47.3 77.2 7 4.3 7.6 036 5 44.1 64.5 5 5.0 12.4 048 3 42.5 64.0 3 5.0 18.3 060 1 87.7 172.9 1 0.0 21.0 072 0 -999.0 -999.0 0 -999.0 -999.0 096 0 -999.0 -999.0 0 -999.0 -999.0 120 0 -999.0 -999.0 0 -999.0 -999.0

2020 Hurricane Season 33
Verification statistics for: AL242020 ALPHA
VT (h) NT OFCL OCD5 NI OFCL OCD5 000 3 4.0 4.0 3 3.3 3.3 012 1 54.2 31.9 1 0.0 1.0 024 0 -999.0 -999.0 0 -999.0 -999.0 036 0 -999.0 -999.0 0 -999.0 -999.0 048 0 -999.0 -999.0 0 -999.0 -999.0 060 0 -999.0 -999.0 0 -999.0 -999.0 072 0 -999.0 -999.0 0 -999.0 -999.0 096 0 -999.0 -999.0 0 -999.0 -999.0 120 0 -999.0 -999.0 0 -999.0 -999.0
Verification statistics for: AL252020 GAMMA
VT (h) NT OFCL OCD5 NI OFCL OCD5 000 15 3.3 3.3 15 1.3 1.3 012 15 25.5 42.0 15 5.3 9.3 024 13 45.7 94.2 13 9.2 14.6 036 11 64.1 144.7 11 10.5 18.3 048 9 79.1 164.0 9 11.7 18.0 060 7 86.1 154.9 7 12.9 13.6 072 5 96.1 140.2 5 16.0 10.0 096 1 124.3 266.4 1 20.0 20.0 120 0 -999.0 -999.0 0 -999.0 -999.0
Verification statistics for: AL262020 DELTA
VT (h) NT OFCL OCD5 NI OFCL OCD5 000 24 7.2 7.5 24 2.9 2.7 012 22 21.3 45.8 22 11.8 14.7 024 20 32.4 113.5 20 16.8 21.8 036 18 49.2 188.8 18 19.4 28.3 048 16 66.3 261.0 16 17.5 29.7 060 14 89.5 322.1 14 10.4 26.6 072 12 114.9 393.5 12 8.3 29.4 096 8 150.6 495.8 8 18.8 36.4 120 4 170.8 534.0 4 3.8 20.8
Verification statistics for: AL272020 EPSILON
VT (h) NT OFCL OCD5 NI OFCL OCD5 000 28 9.1 9.3 28 1.4 1.6 012 26 26.7 69.6 26 7.1 7.5 024 24 30.8 135.2 24 9.8 11.5 036 22 38.5 208.4 22 11.8 14.6 048 20 41.6 253.8 20 12.5 15.2 060 18 48.9 314.8 18 10.8 15.1 072 16 61.6 380.6 16 6.2 13.1 096 12 120.2 510.2 12 4.2 14.1 120 8 245.4 440.7 8 5.6 10.6
2020 Hurricane Season 34
Verification statistics for: AL282020 ZETA
VT (h) NT OFCL OCD5 NI OFCL OCD5 000 20 7.6 6.5 20 3.0 3.2 012 18 19.5 70.1 18 7.5 8.7 024 16 25.0 171.5 16 11.6 14.2 036 14 39.8 280.2 14 12.1 16.4 048 12 63.1 368.4 12 12.1 19.2 060 10 85.8 452.0 10 11.5 12.3 072 8 101.8 527.6 8 16.2 14.1 096 4 75.1 610.5 4 32.5 29.5 120 0 -999.0 -999.0 0 -999.0 -999.0
Verification statistics for: AL292020 ETA
VT (h) NT OFCL OCD5 NI OFCL OCD5 000 47 6.3 6.3 47 0.6 0.7 012 43 25.7 59.4 43 5.8 8.9 024 39 42.3 147.1 39 10.9 16.5 036 37 64.4 242.2 37 13.8 21.1 048 35 91.0 327.0 35 14.7 19.7 060 33 104.8 385.8 33 9.8 15.8 072 31 124.1 413.3 31 6.3 13.3 096 27 142.4 426.6 27 8.3 15.8 120 25 172.4 403.1 25 9.0 18.6
Verification statistics for: AL302020 THETA
VT (h) NT OFCL OCD5 NI OFCL OCD5 000 22 6.7 6.7 22 2.3 2.3 012 20 24.9 37.2 20 5.2 5.8 024 18 34.5 68.3 18 5.8 5.7 036 16 46.1 131.5 16 7.8 5.4 048 14 51.5 189.2 14 6.4 5.4 060 12 59.7 268.4 12 5.4 4.8 072 10 76.3 345.1 10 5.5 6.2 096 6 114.5 496.6 6 10.0 15.3 120 2 121.8 629.6 2 15.0 15.5
Verification statistics for: AL312020 IOTA
VT (h) NT OFCL OCD5 NI OFCL OCD5 000 21 7.1 7.3 21 2.9 2.6 012 19 23.3 34.5 19 6.6 9.1 024 17 30.8 57.8 17 7.4 18.2 036 15 39.8 81.4 15 9.0 25.5 048 13 54.5 124.7 13 13.5 32.8 060 11 72.0 186.5 11 15.5 44.8 072 9 88.2 244.5 9 12.2 54.2 096 5 109.2 311.9 5 13.0 11.4 120 1 72.5 349.7 1 0.0 32.0

2020 Hurricane Season 35
Table 7. Homogenous comparison of official and CLIPER5 track forecast errors in the eastern North Pacific basin in 2020 for all tropical cyclones. Averages for the previous 5-yr period are shown for comparison.
Forecast Period (h)
12 24 36 48 60 72 96 120
2020 mean OFCL error (n mi)
23.9 35.6 46.2 57.5 68.2 81.7 110.9 148.2
2020 mean CLIPER5 error
(n mi) 38.4 75.8 116.3 161.7 202.3 244.4 325.0 401.7
2020 mean OFCL skill relative to CLIPER5 (%)
37.8 53.0 60.3 64.4 66.3 66.6 65.9 63.0
2020 mean OFCL bias vector (°/n mi)
090/001 097/003 226/002 211/007 204/011 202/019 171/034 156/054
2020 number of cases
217 178 149 125 103 83 49 29
2015-2019 mean OFCL error (n mi)
21.8 34.0 44.9 55.3 77.1 99.1 123.2
2015-2019 mean CLIPER5 error (n
mi) 34.3 69.8 108.7 146.7 215.9 268.7 328.2
2015-2019 mean OFCL skill relative to CLIPER5 (%)
36.4 51.3 58.7 62.3 64.3 71.3 69.8
2015-2019 mean OFCL bias vector
(°/n mi) 339/002 351/003 002/003 009/005 258/008 027/009 038/013
2015-2019 number of cases
1639 1463 1301 1156 0 913 714 553
2020 OFCL error relative to 2015-2019 mean (%)
9.6 4.7 2.9 4.0 6.0 11.9 20.3
2020 CLIPER5 error relative to
2015-2019 mean (%)
12.0 8.6 7.0 10.2 13.2 -9.0 -1.0

2020 Hurricane Season 36
Table 8a. Homogenous comparison of eastern North Pacific basin early track guidance model errors (n mi) for 2020. Errors smaller than the NHC official forecast are shown in boldface.
Model ID Forecast Period (h)
12 24 36 48 60 72 96 120
OFCL 23.2 35.2 47.1 60.6 72.1 82.9 111.6 138.0
OCD5 35.2 71.6 111.2 150.8 183.5 215.3 265.6 326.6
GFSI 25.7 41.2 55.3 71.3 79.5 86.9 114.8 183.9
HWFI 26.4 43.0 59.5 80.3 96.0 108.8 161.6 237.8
HMNI 24.0 38.9 51.9 69.2 87.3 103.0 147.3 203.4
EMXI 25.5 39.8 52.2 63.9 76.7 91.6 136.6 137.1
EGRI 23.4 38.5 56.5 75.8 93.9 108.0 129.3 183.4
CMCI 25.9 42.9 58.3 72.6 88.7 104.1 136.6 199.3
NVGI 29.6 47.3 65.4 83.4 101.5 121.9 141.9 210.8
AEMI 25.9 40.9 54.4 68.1 75.3 85.4 116.6 177.9
FSSE 23.3 35.8 49.6 62.2 73.8 83.5 116.4 139.3
TVCE 22.3 34.4 46.3 61.5 74.8 86.2 116.3 145.9
HCCA 22.6 34.1 45.7 59.3 69.4 78.9 114.6 145.3
Forecasts 140 120 102 85 70 54 30 19
2020 Hurricane Season 37
Table 8b. Homogenous comparison of eastern North Pacific basin early track guidance model bias vectors (º/n mi) for 2020.
Forecast Period (h)
Model ID 12 24 36 48 60 72 96 120
OFCL 324/003 298/003 276/007 248/012 237/015 232/020 193/028 151/059
OCD5 107/001 145/007 178/013 184/024 184/041 178/068 159/185 138/284
GFSI 015/007 027/011 030/014 040/012 066/016 082/022 101/057 109/110
HWFI 240/002 169/005 191/007 209/014 199/018 173/025 120/054 115/149
HMNI 280/003 212/001 289/003 265/011 259/015 265/016 292/017 110/029
EMXI 298/008 278/012 259/023 245/023 237/039 238/051 241/078 228/068
EGRI 292/005 281/010 277/020 273/030 271/039 266/048 240/074 222/123
CMCI 068/006 081/016 070/023 069/021 077/022 082/017 199/019 201/094
NVGI 011/007 018/006 017/007 009/012 012/028 356/042 002/065 039/141
AEMI 028/006 044/011 047/013 065/010 089/014 096/019 097/039 111/070
FSSE 314/004 122/003 152/005 201/010 197/014 196/017 180/030 151/061
TVCE 321/004 318/004 285/007 262/013 252/016 244/019 207/026 158/057
HCCA 327/003 298/003 274/007 255/013 247/015 240/018 204/025 149/066
Forecasts 140 120 102 85 70 54 30 19

2020 Hurricane Season 38
Table 9. Homogenous comparison of official and Decay-SHIFOR5 intensity forecast errors in the eastern North Pacific basin for the 2020 season for all tropical cyclones. Averages for the previous 5-yr period are shown for comparison.
Forecast Period (h)
12 24 36 48 60 72 96 120
2020 mean OFCL error (kt) 5.0 6.6 7.9 11.0 13.8 17.2 17.9 16.0
2020 mean Decay-SHIFOR5 error (kt) 6.0 9.7 12.6 15.7 18.5 19.3 18.6 14.0
2020 mean OFCL skill relative to Decay-
SHIFOR5 (%) 16.7 32.0 37.3 29.9 25.4 10.9 3.8 -14.3
2020 OFCL bias (kt) 1.3 2.2 3.6 4.3 4.5 3.7 -0.9 -7.1
2020 number of cases 217 178 149 125 103 83 49 29
2015-19 mean OFCL error (kt) 6.0 9.9 12.1 13.5 15.4 15.6 16.4
2015-19 mean Decay-SHIFOR5 error (kt) 7.8 13.1 16.6 18.9 21.4 22.6 22.4
2015-19 mean OFCL skill relative to Decay-
SHIFOR5 (%) 23.1 24.4 27.1 28.6 28.0 31.0 26.8
2015-19 OFCL bias (kt) -0.5 -0.9 -1.5 -2.0 3.0 -1.8 -2.0
2015-19 number of cases 1639 1463 1301 1156 0 913 714 553
2020 OFCL error relative to 2015-19
mean (%) -16.7 -33.3 -34.7 -18.5 11.7 14.7 -2.4
2020 Decay-SHIFOR5 error relative to 2015-
19 mean (%) -23.1 -26.0 -24.1 -16.9 -9.8 -17.7 -37.5

2020 Hurricane Season 39
Table 10a. Homogenous comparison of eastern North Pacific basin early intensity guidance model errors (kt) for 2020. Errors smaller than the NHC official forecast are shown in boldface.
Model ID Forecast Period (h)
12 24 36 48 60 72 96 120
OFCL 5.5 7.3 8.9 12.0 14.6 17.0 16.9 13.9
OCD5 6.6 10.9 13.8 16.3 17.5 17.2 16.9 11.3
HWFI 5.9 7.9 9.4 10.5 12.2 13.2 13.7 17.9
HMNI 6.0 7.9 8.9 9.9 11.5 13.9 14.9 12.5
DSHP 5.8 8.4 10.5 13.5 16.4 19.1 21.5 19.7
LGEM 5.8 8.5 10.9 13.3 15.8 17.1 20.4 18.9
IVCN 5.2 7.3 9.0 11.0 12.9 15.1 17.1 16.7
HCCA 5.6 7.9 9.5 10.8 12.6 14.4 15.9 15.4
FSSE 5.7 7.8 9.2 11.3 14.0 16.5 16.8 16.1
GFSI 6.2 9.9 12.7 14.8 16.3 17.0 20.1 18.1
EMXI 7.4 12.4 16.0 18.8 19.5 18.8 16.6 12.2
NNIC 5.7 7.8 9.0 9.3 11.7 12.8 16.6 16.1
Forecasts 159 132 114 95 80 64 36 23

2020 Hurricane Season 40
Table 10b. Homogenous comparison of eastern North Pacific basin early intensity guidance model biases (kt) for 2020. Biases smaller than the NHC official forecast are shown in boldface.
Forecast Period (h)
Model ID 12 24 36 48 60 72 96 120
OFCL 2.1 3.1 4.2 5.4 5.8 5.0 -1.7 -6.5
OCD5 0.8 0.3 -1.4 -2.5 -1.4 -1.5 -5.3 -1.6
HWFI -2.5 -3.6 -3.8 -3.7 -3.0 -2.2 -5.4 -7.2
HMNI 1.2 -0.4 -2.7 -4.0 -4.3 -3.9 -10.7 -7.5
DSHP 0.9 1.8 2.4 4.6 6.6 7.6 1.5 -4.8
LGEM 0.4 -1.0 -2.2 -1.5 -0.4 0.2 -6.6 -12.0
IVCN 0.4 -0.3 -0.7 0.1 1.3 2.0 -5.0 -7.6
HCCA 2.1 3.1 3.2 3.8 3.7 3.4 -3.7 -6.8
FSSE 2.4 3.5 3.9 5.2 6.3 7.8 3.8 2.8
GFSI -0.4 -1.7 -2.5 -1.9 -0.8 1.0 2.5 -9.9
EMXI -2.4 -4.8 -7.3 -9.3 -9.7 -9.6 -12.0 -9.2
NNIC 1.2 1.8 2.3 2.9 3.0 1.6 -6.2 -7.0
Forecasts 159 132 114 95 80 64 36 23

2020 Hurricane Season 41
Table 11. Official eastern North Pacific track and intensity forecast verifications (OFCL) for
2020 by storm. CLIPER5 (CLP5) and SHIFOR5 (SHF5) forecast errors are given for comparison and indicated collectively as OCD5. The number of track and intensity forecasts are given by NT and NI, respectively. Units for track and intensity errors are n mi and kt, respectively.
Verification statistics for: EP012020 ONE
VT (h) NT OFCL OCD5 NI OFCL OCD5 000 4 3.3 3.3 4 0.0 0.0 012 2 21.3 19.9 2 0.0 1.5 024 0 -999.0 -999.0 0 -999.0 -999.0 036 0 -999.0 -999.0 0 -999.0 -999.0 048 0 -999.0 -999.0 0 -999.0 -999.0 060 0 -999.0 -999.0 0 -999.0 -999.0 072 0 -999.0 -999.0 0 -999.0 -999.0 096 0 -999.0 -999.0 0 -999.0 -999.0 120 0 -999.0 -999.0 0 -999.0 -999.0
Verification statistics for: EP022020 AMANDA
VT (h) NT OFCL OCD5 NI OFCL OCD5 000 4 9.2 10.6 4 2.5 2.5 012 2 17.8 41.9 2 5.0 5.0 024 0 -999.0 -999.0 0 -999.0 -999.0 036 0 -999.0 -999.0 0 -999.0 -999.0 048 0 -999.0 -999.0 0 -999.0 -999.0 060 0 -999.0 -999.0 0 -999.0 -999.0 072 0 -999.0 -999.0 0 -999.0 -999.0 096 0 -999.0 -999.0 0 -999.0 -999.0 120 0 -999.0 -999.0 0 -999.0 -999.0
Verification statistics for: EP032020 BORIS
VT (h) NT OFCL OCD5 NI OFCL OCD5 000 12 8.2 8.2 12 0.4 0.8 012 12 24.1 38.3 12 2.1 3.9 024 10 38.3 64.3 10 3.5 6.0 036 8 51.1 97.8 8 5.0 10.4 048 6 50.5 119.8 6 5.8 11.2 060 4 52.7 150.3 4 3.8 23.5 072 2 74.9 161.9 2 0.0 27.5 096 0 -999.0 -999.0 0 -999.0 -999.0 120 0 -999.0 -999.0 0 -999.0 -999.0
Verification statistics for: EP042020 FOUR
VT (h) NT OFCL OCD5 NI OFCL OCD5 000 3 5.7 5.9 3 1.7 1.7 012 1 29.3 41.0 1 5.0 5.0 024 0 -999.0 -999.0 0 -999.0 -999.0 036 0 -999.0 -999.0 0 -999.0 -999.0 048 0 -999.0 -999.0 0 -999.0 -999.0 060 0 -999.0 -999.0 0 -999.0 -999.0 072 0 -999.0 -999.0 0 -999.0 -999.0

2020 Hurricane Season 42
096 0 -999.0 -999.0 0 -999.0 -999.0 120 0 -999.0 -999.0 0 -999.0 -999.0
Verification statistics for: EP052020 CRISTINA
VT (h) NT OFCL OCD5 NI OFCL OCD5 000 24 11.2 11.5 24 2.9 2.9 012 22 21.8 35.3 22 5.9 4.7 024 20 29.5 69.0 20 8.0 6.2 036 18 37.7 105.4 18 11.1 7.9 048 16 50.0 144.7 16 15.3 9.3 060 14 62.0 176.6 14 18.2 7.7 072 12 64.4 193.5 12 19.6 8.0 096 8 74.5 211.3 8 20.6 10.0 120 4 48.8 284.2 4 23.8 16.8
Verification statistics for: EP062020 SIX
VT (h) NT OFCL OCD5 NI OFCL OCD5 000 4 7.8 7.8 4 0.0 0.0 012 2 50.3 44.4 2 10.0 6.5 024 0 -999.0 -999.0 0 -999.0 -999.0 036 0 -999.0 -999.0 0 -999.0 -999.0 048 0 -999.0 -999.0 0 -999.0 -999.0 060 0 -999.0 -999.0 0 -999.0 -999.0 072 0 -999.0 -999.0 0 -999.0 -999.0 096 0 -999.0 -999.0 0 -999.0 -999.0 120 0 -999.0 -999.0 0 -999.0 -999.0
Verification statistics for: EP072020 SEVEN
VT (h) NT OFCL OCD5 NI OFCL OCD5 000 4 3.5 6.7 4 3.8 3.8 012 2 18.8 32.6 2 5.0 4.0 024 0 -999.0 -999.0 0 -999.0 -999.0 036 0 -999.0 -999.0 0 -999.0 -999.0 048 0 -999.0 -999.0 0 -999.0 -999.0 060 0 -999.0 -999.0 0 -999.0 -999.0 072 0 -999.0 -999.0 0 -999.0 -999.0 096 0 -999.0 -999.0 0 -999.0 -999.0 120 0 -999.0 -999.0 0 -999.0 -999.0
Verification statistics for: EP082020 DOUGLAS
VT (h) NT OFCL OCD5 NI OFCL OCD5 000 16 2.9 2.9 16 0.9 0.9 012 16 20.8 34.4 16 7.5 9.8 024 16 35.3 84.3 16 8.4 15.9 036 16 47.8 142.9 16 8.1 19.0 048 16 58.8 200.4 16 12.2 24.3 060 16 73.2 260.9 16 18.8 27.5 072 16 90.2 320.3 16 23.1 28.2 096 16 138.8 433.4 16 21.2 22.4 120 14 192.8 565.8 14 20.4 14.5
Verification statistics for: EP092020 ELIDA

2020 Hurricane Season 43
VT (h) NT OFCL OCD5 NI OFCL OCD5 000 16 6.7 6.7 16 1.2 1.2 012 14 19.7 21.9 14 6.4 8.1 024 12 39.3 48.1 12 7.1 13.0 036 10 61.1 82.3 10 5.0 16.5 048 8 92.4 122.7 8 5.6 18.5 060 6 119.7 172.1 6 10.0 19.5 072 4 140.0 227.8 4 11.2 12.5 096 0 -999.0 -999.0 0 -999.0 -999.0 120 0 -999.0 -999.0 0 -999.0 -999.0
Verification statistics for: EP102020 TEN
VT (h) NT OFCL OCD5 NI OFCL OCD5 000 13 5.8 5.8 13 0.0 0.0 012 11 18.2 35.6 11 0.9 4.3 024 9 21.3 83.9 9 1.7 6.7 036 7 26.8 139.6 7 2.1 10.1 048 5 32.6 214.2 5 3.0 12.8 060 3 38.5 277.2 3 1.7 23.3 072 1 50.7 334.6 1 5.0 27.0 096 0 -999.0 -999.0 0 -999.0 -999.0 120 0 -999.0 -999.0 0 -999.0 -999.0
Verification statistics for: EP112020 FAUSTO
VT (h) NT OFCL OCD5 NI OFCL OCD5 000 6 17.2 18.3 6 0.8 0.8 012 4 23.6 91.8 4 5.0 5.8 024 2 27.1 180.9 2 5.0 7.5 036 0 -999.0 -999.0 0 -999.0 -999.0 048 0 -999.0 -999.0 0 -999.0 -999.0 060 0 -999.0 -999.0 0 -999.0 -999.0 072 0 -999.0 -999.0 0 -999.0 -999.0 096 0 -999.0 -999.0 0 -999.0 -999.0 120 0 -999.0 -999.0 0 -999.0 -999.0
Verification statistics for: EP122020 GENEVIEVE
VT (h) NT OFCL OCD5 NI OFCL OCD5 000 21 6.8 10.0 21 1.4 1.4 012 19 24.4 46.7 19 9.2 9.9 024 17 41.2 100.3 17 15.9 14.0 036 15 59.2 148.9 15 22.3 16.6 048 13 74.9 188.3 13 27.7 16.9 060 11 82.2 225.0 11 27.7 17.9 072 9 94.1 282.2 9 28.9 15.8 096 5 131.1 371.6 5 23.0 19.4 120 1 183.2 402.9 1 20.0 26.0
Verification statistics for: EP132020 HERNAN
VT (h) NT OFCL OCD5 NI OFCL OCD5 000 10 9.3 9.6 10 1.0 1.0 012 8 44.7 58.6 8 4.4 3.4 024 6 57.1 91.3 6 3.3 9.7

2020 Hurricane Season 44
036 4 87.0 138.9 4 1.2 13.2 048 2 102.2 189.2 2 0.0 13.0 060 0 -999.0 -999.0 0 -999.0 -999.0 072 0 -999.0 -999.0 0 -999.0 -999.0 096 0 -999.0 -999.0 0 -999.0 -999.0 120 0 -999.0 -999.0 0 -999.0 -999.0
Verification statistics for: EP142020 ISELLE
VT (h) NT OFCL OCD5 NI OFCL OCD5 000 17 9.3 9.3 17 0.0 0.0 012 15 24.1 25.4 15 3.3 3.1 024 13 39.1 51.9 13 4.6 6.0 036 11 51.8 79.6 11 4.5 9.8 048 9 55.8 127.6 9 4.4 13.7 060 7 57.3 187.5 7 4.3 19.7 072 5 68.8 261.0 5 6.0 22.0 096 1 89.8 564.3 1 0.0 26.0 120 0 -999.0 -999.0 0 -999.0 -999.0
Verification statistics for: EP152020 JULIO
VT (h) NT OFCL OCD5 NI OFCL OCD5 000 6 19.5 19.5 6 1.7 1.7 012 4 68.3 90.0 4 7.5 7.2 024 2 122.5 159.2 2 7.5 12.5 036 0 -999.0 -999.0 0 -999.0 -999.0 048 0 -999.0 -999.0 0 -999.0 -999.0 060 0 -999.0 -999.0 0 -999.0 -999.0 072 0 -999.0 -999.0 0 -999.0 -999.0 096 0 -999.0 -999.0 0 -999.0 -999.0 120 0 -999.0 -999.0 0 -999.0 -999.0
Verification statistics for: EP162020 KARINA
VT (h) NT OFCL OCD5 NI OFCL OCD5 000 15 11.8 11.8 15 0.7 0.7 012 13 31.4 43.8 13 4.2 5.1 024 11 38.8 79.2 11 4.5 7.5 036 9 37.3 120.4 9 5.0 4.6 048 7 35.9 127.6 7 4.3 5.4 060 5 53.1 108.5 5 2.0 5.0 072 3 77.5 103.9 3 11.7 7.0 096 0 -999.0 -999.0 0 -999.0 -999.0 120 0 -999.0 -999.0 0 -999.0 -999.0
Verification statistics for: EP172020 LOWELL
VT (h) NT OFCL OCD5 NI OFCL OCD5 000 20 11.9 11.9 20 1.0 1.0 012 18 18.8 26.7 18 3.6 4.4 024 16 31.0 50.4 16 4.4 5.6 036 14 41.6 75.6 14 5.0 4.0 048 12 54.0 111.0 12 10.4 4.4

2020 Hurricane Season 45
060 10 70.2 144.3 10 14.5 4.3 072 8 95.2 188.8 8 18.8 5.8 096 4 132.7 323.6 4 18.8 6.5 120 0 -999.0 -999.0 0 -999.0 -999.0
Verification statistics for: EP182020 MARIE
VT (h) NT OFCL OCD5 NI OFCL OCD5 000 30 8.3 8.7 30 2.0 2.2 012 28 14.8 32.0 28 3.9 6.2 024 26 23.5 70.0 26 4.2 11.2 036 24 32.0 115.4 24 4.0 16.4 048 22 38.6 154.5 22 6.1 20.1 060 20 47.5 177.1 20 7.8 23.1 072 18 60.2 194.0 18 10.0 24.7 096 14 92.7 224.6 14 11.4 21.0 120 10 122.8 218.9 10 6.5 11.1
Verification statistics for: EP192020 NORBERT
VT (h) NT OFCL OCD5 NI OFCL OCD5 000 14 8.5 8.5 14 3.6 3.6 012 12 34.5 55.2 12 7.1 8.6 024 10 56.3 116.6 10 11.0 13.8 036 9 76.0 185.4 9 13.3 21.9 048 9 89.8 258.3 9 16.1 27.6 060 7 102.7 344.6 7 20.0 30.7 072 5 107.4 421.5 5 23.0 32.0 096 1 44.6 441.0 1 20.0 31.0 120 0 -999.0 -999.0 0 -999.0 -999.0
Verification statistics for: EP202020 ODALYS
VT (h) NT OFCL OCD5 NI OFCL OCD5 000 8 6.8 7.5 8 1.9 1.9 012 6 24.4 53.0 6 5.0 5.3 024 4 25.6 80.2 4 5.0 7.5 036 2 10.8 110.5 2 7.5 4.0 048 0 -999.0 -999.0 0 -999.0 -999.0 060 0 -999.0 -999.0 0 -999.0 -999.0 072 0 -999.0 -999.0 0 -999.0 -999.0 096 0 -999.0 -999.0 0 -999.0 -999.0 120 0 -999.0 -999.0 0 -999.0 -999.0
Verification statistics for: EP212020 POLO
VT (h) NT OFCL OCD5 NI OFCL OCD5 000 8 3.8 3.8 8 1.2 1.2 012 6 16.4 23.9 6 3.3 6.2 024 4 23.6 49.2 4 3.8 8.2 036 2 18.9 50.8 2 2.5 1.5 048 0 -999.0 -999.0 0 -999.0 -999.0 060 0 -999.0 -999.0 0 -999.0 -999.0 072 0 -999.0 -999.0 0 -999.0 -999.0 096 0 -999.0 -999.0 0 -999.0 -999.0 120 0 -999.0 -999.0 0 -999.0 -999.0

2020 Hurricane Season 46
Table 12a. Verification of 48-h probabilistic genesis forecasts for the Atlantic basin in 2020.
Atlantic Basin Genesis Forecast Reliability Table
Forecast Likelihood (%)
Verifying Genesis Occurrence Rate (%)
Number of Forecasts
0 2 563
10 17 180
20 24 116
30 43 49
40 60 48
50 72 25
60 81 26
70 97 31
80 90 29
90 100 14
100 - 0
Table 12b. Verification of 48-h probabilistic genesis forecasts for the eastern North Pacific basin in 2020.
Eastern North Pacific Basin Genesis Forecast Reliability Table
Forecast Likelihood (%)
Verifying Genesis Occurrence Rate (%)
Number of Forecasts
0 3 488
10 13 95
20 19 84
30 30 40
40 60 40
50 53 43
60 71 31
70 60 35
80 67 21
90 100 7
100 - 0
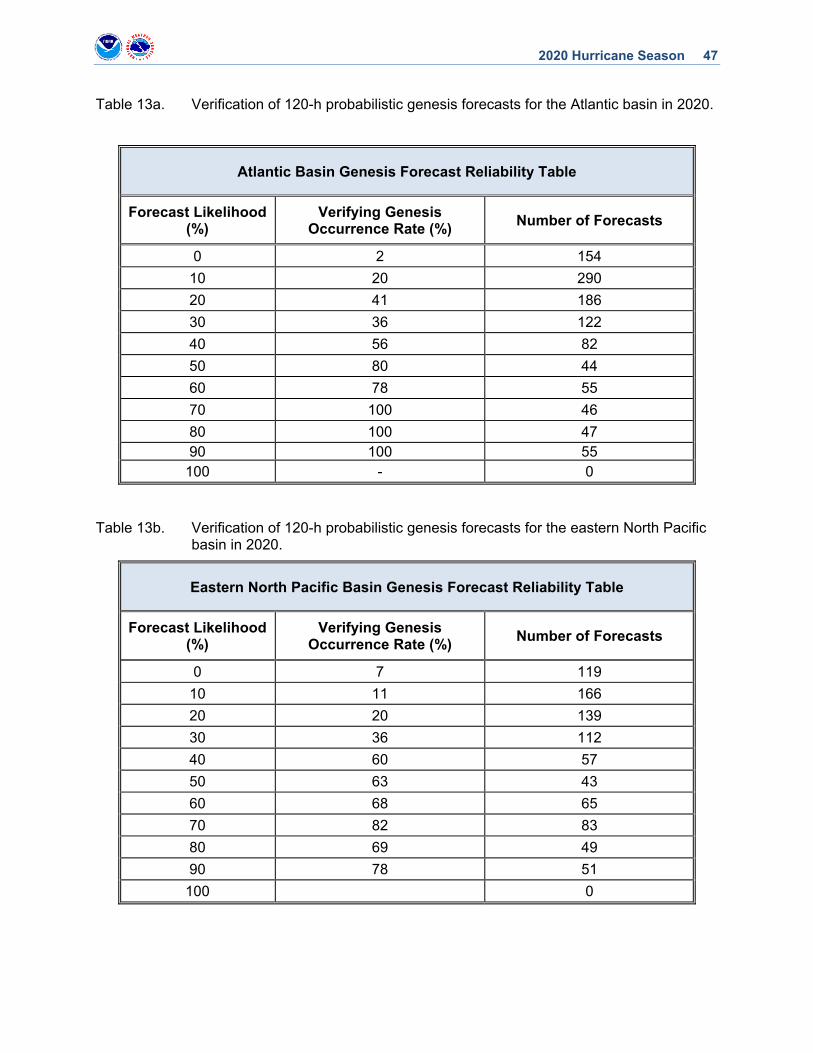
2020 Hurricane Season 47
Table 13a. Verification of 120-h probabilistic genesis forecasts for the Atlantic basin in 2020.
Atlantic Basin Genesis Forecast Reliability Table
Forecast Likelihood (%)
Verifying Genesis Occurrence Rate (%)
Number of Forecasts
0 2 154
10 20 290
20 41 186
30 36 122
40 56 82
50 80 44
60 78 55
70 100 46
80 100 47 90 100 55
100 - 0
Table 13b. Verification of 120-h probabilistic genesis forecasts for the eastern North Pacific basin in 2020.
Eastern North Pacific Basin Genesis Forecast Reliability Table
Forecast Likelihood (%)
Verifying Genesis Occurrence Rate (%)
Number of Forecasts
0 7 119
10 11 166
20 20 139
30 36 112
40 60 57
50 63 43
60 68 65
70 82 83
80 69 49
90 78 51
100 0

2020 Hurricane Season 48
Table 14. NHC forecast cone circle radii (n mi) for 2021. Change from 2020 values expressed in n mi and percent are given in parentheses.
Track Forecast Cone Two-Thirds Probability Circles (n mi)
Forecast Period (h)
Atlantic Basin Eastern North Pacific Basin
3 16 (0: 0%) 16 (0: 0%)
12 27 (1: 4%) 25 (0: 0%)
24 40 (-1: -3%) 37 (-1: -3%)
36 55 (0: 0%) 51 (-1: -2%)
48 69 (0: 0%) 64 (-1: -2%)
60 86 (interpolated) 77 (interpolated)
72 102 (-1: -1%) 89 (-2: -2%)
96 148 (-3: -2%) 114 (-1: -1%)
120 200 (4: 2%) 138 (0: 0%)

2020 Hurricane Season 49
Table 15. Composition of NHC consensus models for 2021. It is intended that TVCA would be the primary consensus aids for the Atlantic basin and TVCE would be primary for the eastern Pacific.
NHC Consensus Model Definitions For 2021
Model ID Parameter Type Members
GFEX Track Fixed GFSI EMXI
ICON Intensity Fixed DSHP LGEM HWFI CTCI HMNI
TVCA** Track Variable GFSI EGRI HWFI EMXI CTCI
TVCE Track Variable GFSI EGRI HWFI EMXI CTCI HMNI EMNI
TVDG Track Variable GFSI (double weight) EMXI (double weight)
EGRI (double weight) CTCI HWFI
TVCX Track Variable EMXI (double weight) GFSI EGRI HWFI
IVCN Intensity Variable DSHP LGEM HWFI CTCI HMNI
IVDR Intensity Variable CTCI (double weight) HWFI (double weight) HMNI (double weight) GFSI DSHP LGEM
** TVCN will continue to be computed and will have the same composition as TVCA. GPCE circles will continue to be based on TVCN.

2020 Hurricane Season 50
LIST OF FIGURES
1. NHC official and CLIPER5 (OCD5) Atlantic basin average track errors for 2020 (solid lines) and 2015-2019 (dashed lines).
2. Number of NHC official forecasts for the Atlantic basin from 1990-2020.
3. Recent trends in NHC official track forecast error (top) and skill (bottom) for the Atlantic basin.
4. 2016-20 NHC official track forecast error binned by initial intensity for the Atlantic basin.
5. Homogenous comparison for selected Atlantic basin early track guidance models for 2020. This verification includes only those models that were available at least 2/3 of the time (see text).
6. Homogenous comparison of the primary Atlantic basin track consensus models for 2018-2020.
7. Homogenous comparison of OFCL, GFSI, EMXI, EGRI model track biases (n mi) at verifying 120-h forecasts for the Atlantic basin during the 2018-20 period. The red ‘X’ depicts the mean bias for each model.
8. Homogenous comparison of the primary Atlantic basin track consensus models for 2020.
9. NHC official and Decay-SHIFOR5 (OCD5) Atlantic basin average intensity errors for 2020 (solid lines) and 2015-2019 (dashed lines).
10. Recent trends in NHC official intensity forecast error (top) and skill (bottom) for the Atlantic basin.
11. Homogenous comparison for selected Atlantic basin early intensity guidance models for 2020. This verification includes only those models that were available at least 2/3 of the time (see text).
12. Homogenous comparison for selected Atlantic basin early intensity guidance models for 2018-20.
13. 2020 NHC official track forecasts errors by tropical cyclone.
14. 2020 NHC official intensity forecasts errors by tropical cyclone.
15. NHC official and CLIPER5 (OCD5) eastern North Pacific basin average track errors for 2020 (solid lines) and 2015-2019 (dashed lines).
16. Number of forecasts for the eastern North Pacific basin from 1990-2020.
17. Recent trends in NHC official track forecast error (top) and skill (bottom) for the eastern North Pacific basin.
18. Homogenous comparison for selected eastern North Pacific early track models for 2020. This verification includes only those models that were available at least 2/3 of the time (see text).
19. Homogenous comparison of the primary eastern North Pacific basin track consensus models for 2018-2020.
20. Homogenous comparison of the primary eastern North Pacific basin track consensus models for 2020.

2020 Hurricane Season 51
21. NHC official and Decay-SHIFOR5 (OCD5) eastern North Pacific basin average intensity errors for 2020 (solid lines) and 2015-2019 (dashed lines).
22. Recent trends in NHC official intensity forecast error (top) and skill (bottom) for the eastern North Pacific basin.
23. Homogenous comparison for selected eastern North Pacific basin early intensity guidance models for 2020. This verification includes only those models that were available at least 2/3 of the time (see text).
24. Homogenous comparison for selected eastern North Pacific basin early intensity guidance models for 2018-20.
25. Reliability diagram for Atlantic (top) and eastern North Pacific (bottom) probabilistic tropical cyclogenesis 48-h forecasts for 2020. The solid lines indicate the relationship between the forecasts and verifying genesis percentages, with perfect reliability indicated by the thin diagonal black line. The dashed lines indicate how the forecasts were distributed among the possible forecast values.
26. As described for Fig. 25, but for 120-h forecasts.

2020 Hurricane Season 52
Figure 1. NHC official and CLIPER5 (OCD5) Atlantic basin average track errors for 2020 (solid lines) and 2015-2019 (dashed lines).
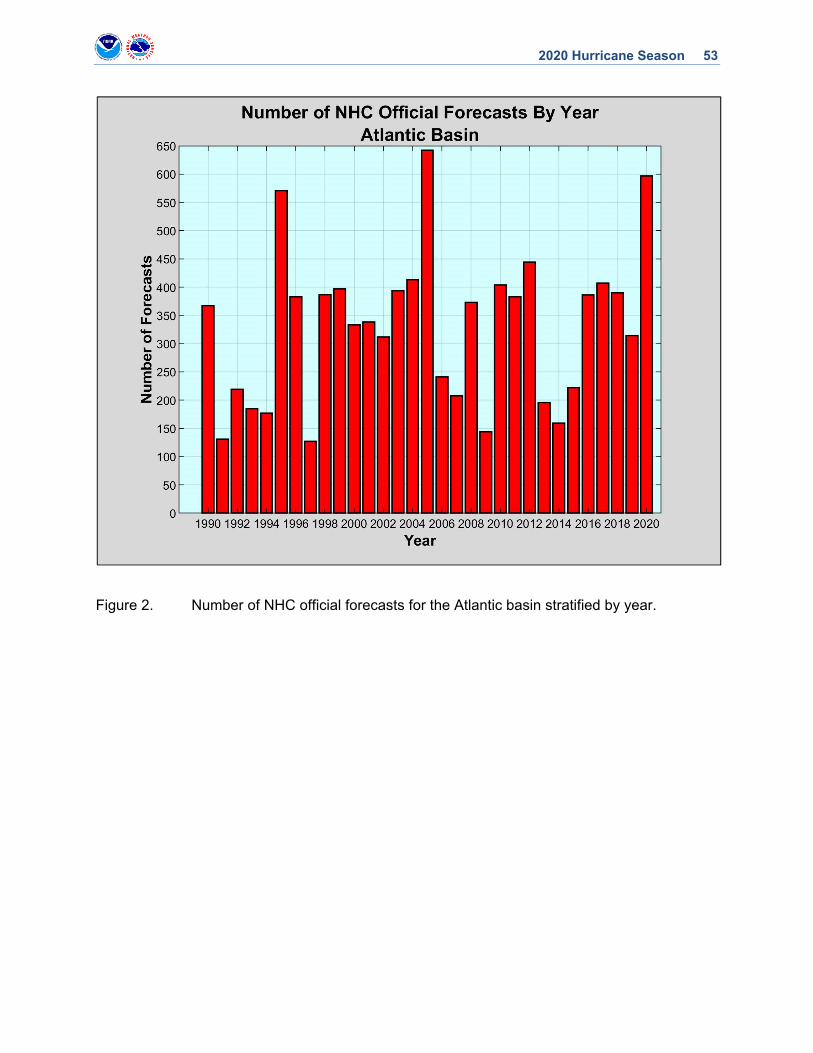
2020 Hurricane Season 53
Figure 2. Number of NHC official forecasts for the Atlantic basin stratified by year.

2020 Hurricane Season 54
Figure 3. Recent trends in NHC official track forecast error (top) and skill (bottom) for the
Atlantic basin.

2020 Hurricane Season 55
Figure 4. 2016-20 NHC official track forecast error binned by initial intensity for the Atlantic basin.

2020 Hurricane Season 56
Figure 5. Homogenous comparison for selected Atlantic basin early track models for 2020. This verification includes only those models that were available at least 2/3 of the time (see text).

2020 Hurricane Season 57
Figure 6. Homogenous comparison for selected Atlantic basin early track models for 2018-2020.
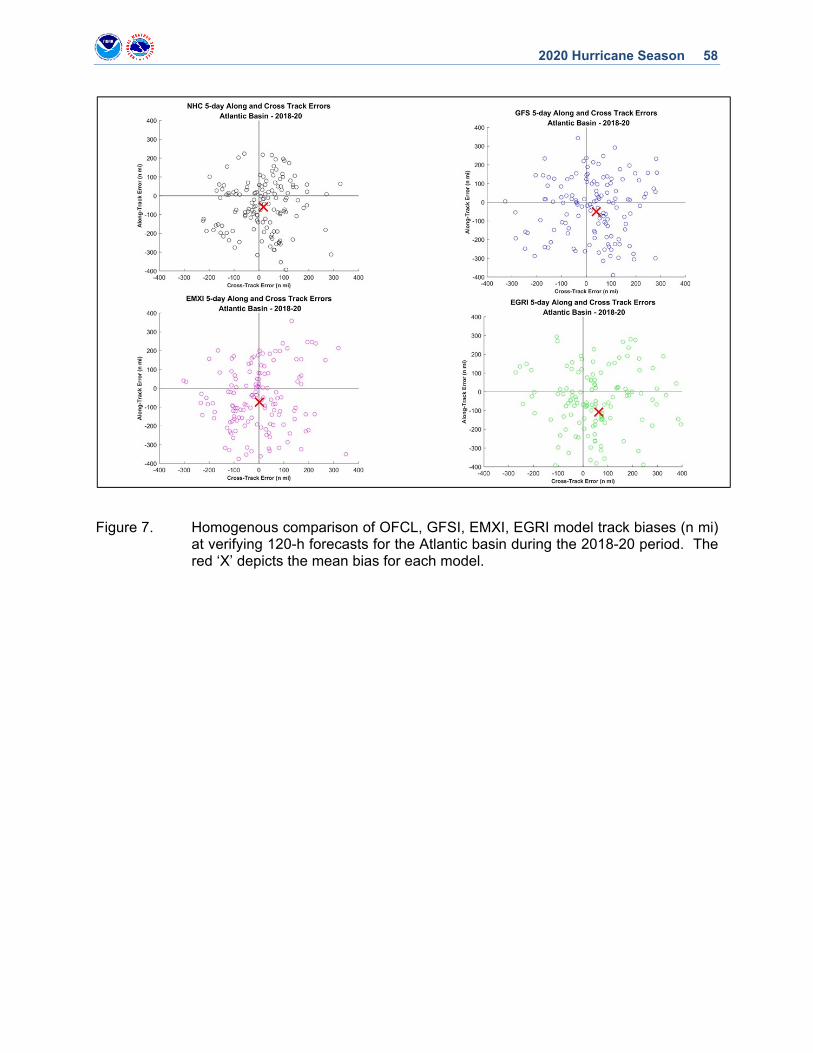
2020 Hurricane Season 58
Figure 7. Homogenous comparison of OFCL, GFSI, EMXI, EGRI model track biases (n mi) at verifying 120-h forecasts for the Atlantic basin during the 2018-20 period. The red ‘X’ depicts the mean bias for each model.

2020 Hurricane Season 59
Figure 8. Homogenous comparison of the primary Atlantic basin track consensus models for 2020.

2020 Hurricane Season 60
Figure 9. NHC official and Decay-SHIFOR5 (OCD5) Atlantic basin average intensity errors for 2020 (solid lines) and 2015-2019 (dashed lines).

2020 Hurricane Season 61
Figure 10. Recent trends in NHC official intensity forecast error (top) and skill (bottom) for the
Atlantic basin.

2020 Hurricane Season 62
Figure 11. Homogenous comparison for selected Atlantic basin early intensity guidance models for 2020.

2020 Hurricane Season 63
Figure 12. Homogenous comparison for selected Atlantic basin early intensity guidance models for 2018-2020.

2020 Hurricane Season 64
Figure 13. 2020 NHC official track errors by tropical cyclone at 24, 72, and 120 h.

2020 Hurricane Season 65
Figure 14. 2020 NHC official intensity errors by tropical cyclone at 24, 72, and 120 h.

2020 Hurricane Season 66
Figure 15. NHC official and CLIPER5 (OCD5) eastern North Pacific basin average track errors for 2020 (solid lines) and 2015-2019 (dashed lines).

2020 Hurricane Season 67
Figure 16. Number of NHC official forecasts for the eastern North Pacific basin stratified by year.

2020 Hurricane Season 68
Figure 17. Recent trends in NHC official track forecast error (top) and skill (bottom) for the
eastern North Pacific basin.

2020 Hurricane Season 69
Figure 18. Homogenous comparison for selected eastern North Pacific early track models for 2020. This verification includes only those models that were available at least 2/3 of the time (see text).

2020 Hurricane Season 70
Figure 19. Homogenous comparison for selected eastern North Pacific basin early track models for 2018-2020.
2018-20 East Pacific Track Forecast Skill

2020 Hurricane Season 71
Figure 20. Homogenous comparison of the primary eastern North Pacific basin track consensus models for 2020.
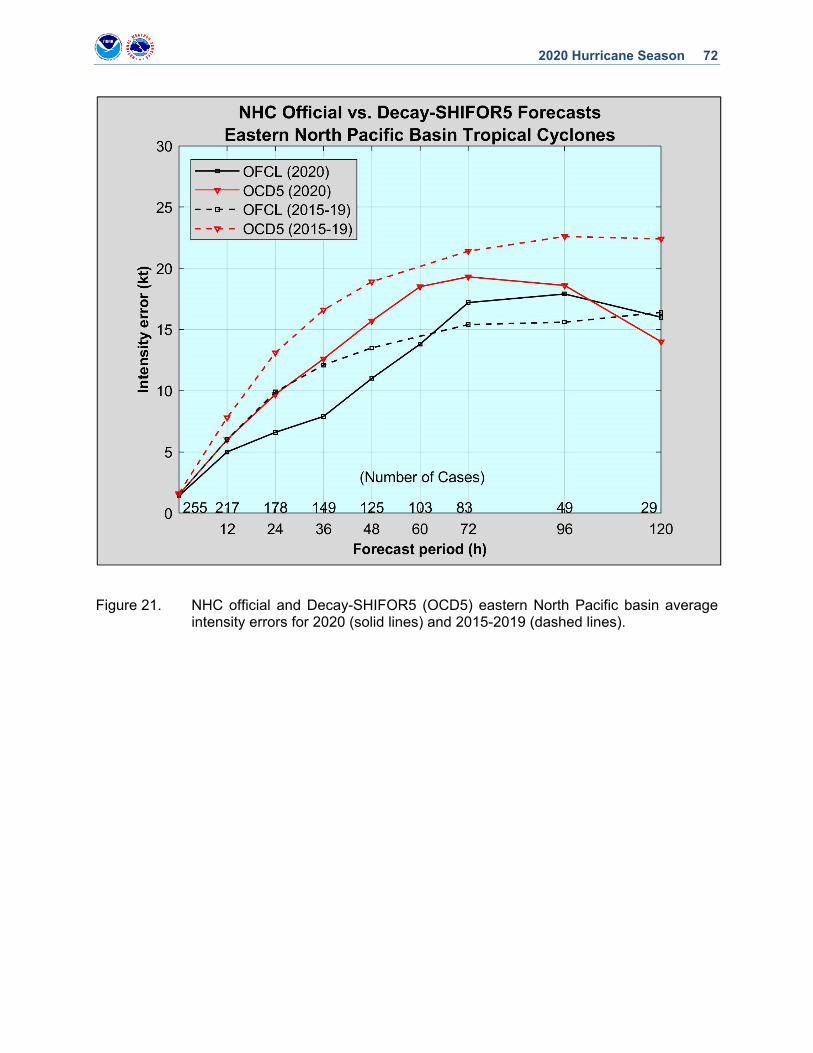
2020 Hurricane Season 72
Figure 21. NHC official and Decay-SHIFOR5 (OCD5) eastern North Pacific basin average intensity errors for 2020 (solid lines) and 2015-2019 (dashed lines).
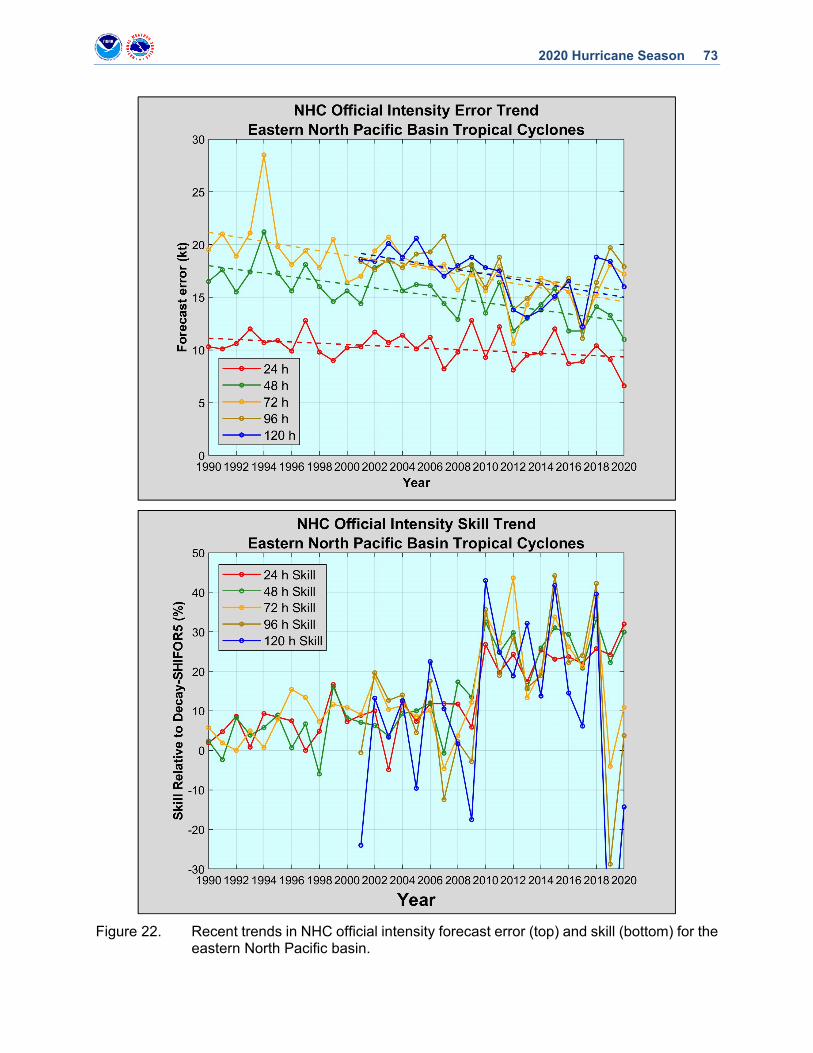
2020 Hurricane Season 73
Figure 22. Recent trends in NHC official intensity forecast error (top) and skill (bottom) for the
eastern North Pacific basin.

2020 Hurricane Season 74
Figure 23. Homogenous comparison for selected eastern North Pacific basin early intensity guidance models for 2020.

2020 Hurricane Season 75
Figure 24. Homogenous comparison for selected eastern North Pacific basin early intensity guidance models for 2018-2020.
2018-20 East Pacific Intensity Forecast Skill

2020 Hurricane Season 76
Figure 25. Reliability diagram for Atlantic (top) and eastern North Pacific (bottom) probabilistic tropical cyclogenesis 48-h forecasts for 2020. The solid lines indicate the relationship between the forecasts and verifying genesis percentages, with perfect reliability indicated by the thin diagonal black line. The dashed lines indicate how the forecasts were distributed among the possible forecast values.

2020 Hurricane Season 77
Figure 26. As described for Fig. 25, except for 120-h forecasts.