Embed Size (px)
Citation preview
National HeartFailureAudit
National Heart Failure Audit Report for the audit period ending March 2010
This third report for the National Heart Failure Audit presents key findings and recommendations from the audit which was launched in July 2007. The data included in this report was submitted between April 2009 and March 2010. Aimed at healthcare professionals, managers and clinical governance leads, the report describes progress to date, clinical findings and patient outcomes, and implementation issues.
Electronic copies of this report can be found at: www.ic.nhs.uk. If you have any queries or comments on this publication, please contact The Information Centre for health and social care 0845 300 6016 or email: [email protected] quoting document reference IC17110110. For further information about this report, email: [email protected].
For further information about this report, email: [email protected] or contact: Clinical Audit Support Unit (CASU) The Information Centre for health and social care 1 Trevelyan Square Boar Lane Leeds LS1 6AE
The Healthcare Quality Improvement Partnership (HQIP) promotes quality in healthcare. HQIP holds commissioning and funding responsibility for the National Heart Failure Audit and other national clinical audits.
The NHS Information Centre for Health and Social Care (The NHS IC) is England’s central, authoritative source of essential data and statistical information for frontline decision makers in health and social care. The NHS IC managed the publication of the 2009/10 annual report.
Prepared in partnership with:
The British Society for Heart Failure (BSH) is a national organisation of health care professionals dedicated to improving heart failure outcomes in the UK. The BSH was responsible for providing clinical leadership and strategic direction to the 2009/10 annual report.
Report for the audit period between April 2009 and March 2010
Copyright © 2010, The NHS Information Centre, National Heart Failure Audit 2010. All rights reserved.
National HeartFailureAudit

Copyright © 2010, The NHS Information Centre, National Heart Failure Audit 2010. All rights reserved.
Contents
Copyright © 2010, The NHS Information Centre, National Heart Failure Audit 2010. All rights reserved.
Acknowledgments 6Foreword 71. Executive summary 82. Introduction to the National Heart Failure Audit 102.1 Background to heart failure 102.2 Patient outcomes 102.3 Impact on services 102.4 Quality of care 102.5 Variation in practice and impact on patient outcomes 112.6 Improving quality: Indicators for quality improvement 112.7 The Audit 112.8 Organisation of the Audit 122.9 The British Society for Heart Failure 123. Findings 133.1 Participation 133.2 Patient demographics: Age and gender 153.3 Aetiology of Heart Failure 163.4 Variation in access to key treatment and specialist staff 163.5 Access to specialist follow up services 163.6 Treatment on Discharge 183.7 Patient outcomes 194. Implementation issues 205. Conclusion 216. Recommendations 22References 23Appendix 1: Participating and non participating NHS Trusts 2009-10 24Appendix 2: Returned Analysis 28Appendix 3: Kaplan Meier Mortality Analyses 33
6 Copyright © 2010, The NHS Information Centre, National Heart Failure Audit 2010. All rights reserved.
The National Heart Failure Audit is managed by The NHS Information Centre for health and social care (The IC) and has been developed in partnership with the British Society for Heart Failure. It has been commissioned by the Healthcare Quality Improvement Partnership (HQIP)
We would like to acknowledge the important contribution of NHS Improvement and by all NHS Trusts, Heath Boards and the individual clinicians, nurses and audit teams who are participating in the audit.
The National Heart Failure Audit would like to thank the Postgraduate Medical Institute of the University of Hull for their analytical contribution to this report and all members of the project team involved.
Acknowledgements

7Copyright © 2010, The NHS Information Centre, National Heart Failure Audit 2010. All rights reserved.
Foreword
There is good evidence that optimal care improves survival and quality of life for the many patients that suffer from heart failure. It is also clear that recent developments in the treatment of this long term condition reduce admissions to hospital and increasingly allow those affected to be monitored and cared for at home.
While this report concentrates on the hospital aspects of care, it is vital that there is close collaboration between primary and secondary care if the improved outlook for heart failure patients is to be realised.
The analysis presented here reinforces the value of clinical data and its importance in delivering the ambitions set out in the White Paper ‘Liberating the NHS’. Engagement of clinicians in garnering this information is central to sustaining such service improvement and is to be commended.
James Beattie Consultant Cardiologist National Clinical Lead, NHS Improvement
David Walker Consultant Cardiologist National Clinical Lead, NHS Improvement
8 Copyright © 2010, The NHS Information Centre, National Heart Failure Audit 2010. All rights reserved.
The National Service Framework for Coronary Heart Disease (NSF for CHD) sets national standards of care relating to CHD, including providing better care for people with heart failure. The National Institute of Clinical Excellence (NICE) has issued guidelines on the management of heart failure in primary and secondary care. Both play an important role in improving health standards and ensuring high quality care is available and accessible to all who need it.
1.1 Heart failure
Heart failure affects at least one in every 100 people in the UK, increasing steeply with age to about 7 per cent in men and women over 75 years. The number of patients with heart failure is set to rise in the next twenty years, due to the combined effects of improved survival in patients who develop cardiovascular disease, such as heart attacks, and an ageing population.
Heart failure is one of the commonest reasons for emergency medical admissions (about 5 per cent), readmissions and hospital bed-days occupancy. Survival rates for heart failure in epidemiological studies are worse than for breast and prostate cancer, with annual mortality ranging from 10 per cent to 50 per cent depending on severity . Annual mortality in hospitalised patients from our last audit confirmed that the prognosis remains poor at 30% at one year. In addition, patients with heart failure have a poor quality of life, with over a third experiencing severe and prolonged depressive illness.
There is good evidence that appropriate diagnosis, treatment and ongoing support can improve quality of life, help reduce morbidity and mortality and reduce hospital admission. Evidence suggests that progress in meeting the NSF standards and implementing evidence based clinical guidance has, until recently, been slow. Whilst substantial progress has been made over the last two years, there is variation across the country and between different groups of patients in relation to the confirmation of diagnosis and access to evidence based treatment and heart failure specialist staff.
1.2 National Heart Failure audit
The National Heart Failure audit is run jointly by The NHS Information Centre and the British Society for Heart Failure, and is funded by the Healthcare Quality Improvement Partnership (HQIP). The audit focuses on the care and treatment of all patients with an unscheduled admission to hospital with heart failure. The main purposes of the audit are to measure the quality of care and clinical outcomes, enabling comparisons between Trusts or Health Boards and bring about improvement where necessary.
The national audit consists of 36 core data items that reflect national guidance on the care and treatment of patients with heart failure. The heart failure database provides users with immediate feedback on data quality.
This report summarises key findings from the second 12 months of the national roll out of the audit between April 2009 and March 2010.
1.3 Summary of key findings and main recommendations
As of June 2010.
• The prognosis of heart failure remains poor, even for patients aged under 75 years, despite current therapy. There is substantial scientific evidence that more might be done.
• Within the year of admission for heart failure, 32 per cent of patients died
• Mortality is significantly better for those who have access to specialist care i.e. those seen by cardiologists or specialist heart failure services (23 per cent)
• Patients with heart failure enrolled in the audit were mostly admitted under either cardiology (46 per cent) or general medicine (42 per cent)
1. Executive Summary
9Copyright © 2010, The NHS Information Centre, National Heart Failure Audit 2010. All rights reserved.
• Patients admitted to cardiology wards were almost half as likely to die (6 per cent) in hospital as those admitted to other wards (12 per cent).
• Echocardiography, a key investigation for heart failure, was performed in 79 per cent of cases.
• Specialist services (inpatient and out-patient) are associated with better prescribing and better outcomes
• Beta-blockers are underused
• Although many patients were not receiving target doses of therapy at hospital discharge, it is possible that these were achieved subsequent to discharge. This requires more follow-up data.
• Many patients with heart failure are elderly and with multiple co-morbidities. The impact of existing conventional therapies may be limited in such patients.
• Prognosis of heart failure due to valve disease and in those with left ventricular ejection fraction (LVEF) greater than 40 per cent requiring admission to hospital is as poor as that of patients with LVEF less than 40 per cent.
• On average, patients with a home address in the most deprived quintile are admitted for heart failure 5 years earlier than those in the most affluent
• 133 out of 155 (86 per cent) Trusts and Health Boards had registered with the audit. Of the Trusts and Health Boards registered 122, (92 per cent) submitted data for the period April 2009-March 2010, totalling 21294 patients for the year
• Nationally the audit represents approximately 42 per cent of all patients discharged from hospital with a primary discharge diagnosis of heart failure and is a vast improvement in case ascertainment from the 6190 patients in the 2008/09 audit
• Data completeness for core fields achieved similar high rates as in 2008/09
Recommendations
• All secondary care service providers should streamline the heart failure care pathway to ensure all patients, regardless of admission ward, have access to recommended medication in line with NICE guidelines and that treatment is managed by specialist staff.
• All secondary care Trusts in England and Health Boards Wales treating patients with heart failure should participate in the audit.
• All participating Trusts and Health Boards should continue to submit at least 20 cases per month (or the maximum numbers if that is less than 20). As a move towards fuller participation, all secondary care Trusts and Health Boards should be encouraged to submit every patient discharged with a primary diagnosis of heart failure.
• Strategic Health Authorities should recommend the inclusion of heart failure related Indicators for Quality Improvement in quality accounts.
• Commissioners should use evidence of participation in the National Heart Failure Audit within the effective commissioning process to ensure that all patients with a confirmed diagnosis of heart failure have access to evidence based treatment as recommended by NICE.
• Consideration should be given to collecting survival (and if possible re-hospitalisation) data for future years. A median follow-up of just 133 days from discharge (partly explained by the high mortality) is inadequate to describe the full impact of heart failure on survival.
10 Copyright © 2010, The NHS Information Centre, National Heart Failure Audit 2010. All rights reserved.
2. Introduction to the National Heart Failure Audit
2.1 Background to heart failure
Heart failure is a complex syndrome that can result from any structural or functional cardiac disorder that impairs the ability of the heart to function as a pump to support the circulation in the normal physiological range. The syndrome of heart failure is characterised by symptoms such as breathlessness and fatigue, and signs such as fluid retention.
Heart failure occurs in around 1 per cent of the adult population rising to 7 per cent in those aged over 75 years and 15 per cent for those aged 85 and over (1). Most cases of heart failure are due to coronary heart disease (approximately 70 per cent) and most cases have or have had hypertension. Atrial fibrillation and renal dysfunction are common precipitating factors and complications of heart failure. Although there has been an overall decline in mortality from coronary heart disease, the number of patients with heart failure is increasing (2). This is due to an ageing population combined with improved survival rates in patients who have developed other cardiovascular diseases, especially those surviving a heart attack but with left ventricular dysfunction. The majority of patients admitted to hospital are over 60 and fall within two age groups: 60-74 (24.6 per cent) and over 75 (68.3 per cent).
In 2001, over 11,000 deaths due to heart failure were officially recorded in the UK. The number of deaths directly attributed to heart failure however underestimates the actual number of deaths it contributes to, which may be in excess of 100,000 per year. Guidance given on death certificates, that heart failure is not a cause but a mode of death, discourages doctors from recording heart failure as the underlying cause of death. This means that other causes of death, such as coronary heart disease, are more commonly recorded. More than 80 per cent of patients who die in the weeks, months and years after a heart attack will first develop heart failure (3).
2.2 Patient outcomes
Survival rates in epidemiological series are worse than for breast and prostate cancer, with annual mortality ranging from 10 per cent to 50 per cent depending on severity, and a high risk of sudden death. Newly diagnosed patients have a 40 per cent risk of dying within a year of diagnosis (4). Last year’s audit report underlined the continuing poor outcomes showing a one year mortality following hospitalisation for heart failure of 30 per cent.
Patients with heart failure experience a poor quality of life, with over a third experiencing severe and prolonged depressive illness (5).
2.3 Impact on services
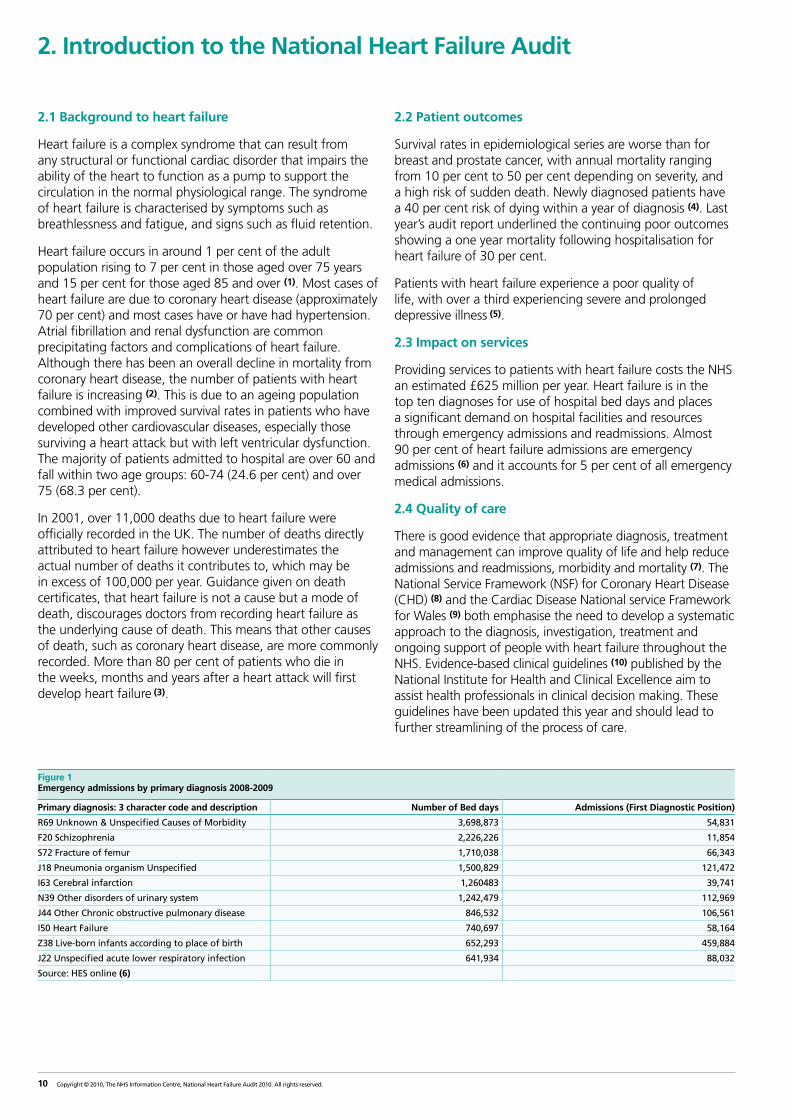
Providing services to patients with heart failure costs the NHS an estimated £625 million per year. Heart failure is in the top ten diagnoses for use of hospital bed days and places a significant demand on hospital facilities and resources through emergency admissions and readmissions. Almost 90 per cent of heart failure admissions are emergency admissions (6) and it accounts for 5 per cent of all emergency medical admissions.
2.4 Quality of care
There is good evidence that appropriate diagnosis, treatment and management can improve quality of life and help reduce admissions and readmissions, morbidity and mortality (7). The National Service Framework (NSF) for Coronary Heart Disease (CHD) (8) and the Cardiac Disease National service Framework for Wales (9) both emphasise the need to develop a systematic approach to the diagnosis, investigation, treatment and ongoing support of people with heart failure throughout the NHS. Evidence-based clinical guidelines (10) published by the National Institute for Health and Clinical Excellence aim to assist health professionals in clinical decision making. These guidelines have been updated this year and should lead to further streamlining of the process of care.
Figure 1 Emergency admissions by primary diagnosis 2008-2009
Primary diagnosis: 3 character code and description Number of Bed days Admissions (First Diagnostic Position)
R69 Unknown & Unspecified Causes of Morbidity 3,698,873 54,831
F20 Schizophrenia 2,226,226 11,854
S72 Fracture of femur 1,710,038 66,343
J18 Pneumonia organism Unspecified 1,500,829 121,472
I63 Cerebral infarction 1,260483 39,741
N39 Other disorders of urinary system 1,242,479 112,969
J44 Other Chronic obstructive pulmonary disease 846,532 106,561
I50 Heart Failure 740,697 58,164
Z38 Live-born infants according to place of birth 652,293 459,884
J22 Unspecified acute lower respiratory infection 641,934 88,032
Source: HES online (6)
11Copyright © 2010, The NHS Information Centre, National Heart Failure Audit 2010. All rights reserved.
2.5 Variation in practice and impact on patient outcomes
In a 2005 national review of CHD services, the Healthcare Commission found that despite significant progress in implementing the NSF, progress in meeting the heart failure standards had been slow (11) . In response, two further pieces of work were commissioned to provide an in-depth picture of the quality of heart failure services across the country.
A subsequent review of heart failure services (2007) (12) showed that substantial progress had been made in the two years after the NSF review. However, there was still variation across the country in relation to the confirmation of diagnosis, access to evidence based treatment and heart failure specialist staff. This variability appeared to have an impact on patient outcomes. Data pooled for the years 2002/2003 and 2004/2005 demonstrated wide variation in the level of observed re-admission and mortality across PCTs in England when compared with expected levels.
The second piece of work (13) focused on the inpatient admission routes and access to diagnostics and key treatments. The results indicated that many patients admitted to hospitals in England, Wales and Northern Ireland are not managed fully in accordance with national & international evidence-based guidelines. Only a minority of patients with heart failure were seen, or followed up, by a specialist service. Whilst most Trusts and Health Boards (87 per cent) have a lead consultant for the care of patients with heart failure, only 22 per cent of patients admitted to hospital with heart failure were referred to specialists or a general cardiologist.
Data from last year’s audit shows that there is still much to be done. The key finding that patients admitted to cardiology wards have a 20 per cent lower mortality rate (after adjusting for known confounders) than those admitted to general medicine underlines the need to develop specialist in-patient services for heart failure patients.
2.6 Improving quality: Indicators for quality improvement
The Department of Health and The NHS Information Centre have identified an initial, but evolving, set of indicators to describe the quality of a broad range of services – the Indicators for Quality Improvement (14). The indicators have been developed in partnership with professionals across the NHS and the first set of indicators for Heart Failure include the following:
1. The Trust has registered with the National Heart Failure Audit
2. The Trust submitted 10 or more cases per month between April 2008 and March 2009. This was increased to 20 (or the maximum number if less than 20) from July 2009.
From 2010, healthcare providers will be required to publish ‘quality accounts’ just as they publish financial accounts. These will be reports to the public about the quality of services they provide and will look at safety, experience and outcomes. The content of Quality Accounts is still to be confirmed but it is likely that some indicators will be compulsory at either a national or SHA level.
2.7 The Audit
The National Heart Failure Audit aims to provide national comparative data to help clinicians and managers improve the quality and outcomes of their services. Findings can be used to assess achievement against NSF goals and milestones and NICE guidelines for heart failure on an ongoing basis. Information can also be used to inform patients about the quality of local care and to support patient choice.
12 Copyright © 2010, The NHS Information Centre, National Heart Failure Audit 2010. All rights reserved.
The Heart Failure Audit: secondary care
The provision of comprehensive and high quality services for patients with heart failure is complex. A multidisciplinary approach is advocated often involving healthcare professionals from both primary and secondary care as well as involving social care services. It requires good coordination at all stages of the patient pathway. Such complexity poses a number of challenges and an audit that encompasses all organisations would be extremely large and potentially unwieldy, and would be difficult to evaluate. This being the case, The IC and the BSH have chosen to focus initially on auditing inpatient care within secondary care.
The Heart Failure Audit: key objectives
The first objective of the audit is to identify the proportion of in-patients with a primary diagnosis of heart failure that have quality of care recorded. The audit captures data on a representative sample of patients with a death or discharge code for heart failure in the primary position. The primary position is the main condition treated or investigated during the episode of care. The following ICD-10 codes are used:
I50.0 Congestive heart failure I50.1 Left ventricular failure I50.9 Heart failure, unspecified I11.0 Hypertensive heart disease with (congestive) heart failure I42.0 Dilated cardiomyopathy I25.5 Ischaemic cardiomyopathy I42.9 Cardiomyopathy, unspecified.
A second objective is to describe current clinical practices in heart failure diagnosis, care and treatment, and to explain variation in practice using data on patient characteristics and healthcare provider identity.
A third objective is to assess outcome. Initially, this will focus on length of hospital stay and mortality but in future years will include readmission rates.
2.8 Organisation of the Audit
The National Heart Failure Audit is project managed by The Information Centre for Health and Social Care with specialist clinical knowledge provided by the British Society for Heart Failure. The audit was initially commissioned by the Healthcare Commission for two years (2006-2008) and has since been renewed for a further four years until March 2012. The first full year of audit using agreed criteria was 2008-2009 and has recently been published in detail. Commissioning arrangements transferred to the Healthcare Quality Improvement Partnership in April 2008. Information about the role of the NHS information centre and the IT infrastructure is available in previous National Heart Failure Audit reports. These are all available via the following link: http://www.ic.nhs.uk/services/national-clinical-audit-support-programme-ncasp/audit-reports/heart-disease .
2.9 The British Society for Heart Failure
The British Society for Heart Failure (BSH) is a national organisation of health care professionals dedicated to improving heart failure outcomes in the UK. It is a charitable organisation and functions as an affiliated group of the British Cardiovascular Society. As part of the BSH strategy to improve patient care in heart failure, several of its board members have worked with The IC to design a national audit dataset for heart failure. The BSH project steering group have collaborated with The IC during the development and design of the heart failure dataset and database and the pilot phase and roll out phases of the audit providing clinical input and direction.
13Copyright © 2010, The NHS Information Centre, National Heart Failure Audit 2010. All rights reserved.
3. Findings
3.1 Participation
The Heart Failure Audit was used as a clinical indicator by the Care Quality Commission for 2009-10. Trusts were expected to have registered in the audit and to continually submit data.
Number of Trusts
There are 149 NHS Trusts in England and 6 out of the 7 Health Boards in Wales that discharge adult patients with a heart failure code in the HES primary diagnosis position. As of March 2009, 133 eligible organisations (86 per cent) had registered with the audit. Many Trusts and Health Boards have more than one hospital submitting data to the audit and as a consequence, 185 individual hospitals participated.
There is a wide variation in the number of records submitted by each Trust or Health Board per month. Only 84 (63 per cent) are submitting more than 10 records per month on a regular basis. However this is a substantial improvement from the 25 per cent reported in the Heart Failure Annual Report 2008-09.
A list of registered and non-registered Trusts, Health Boards and numbers of submitted records is provided in Appendix 1.
Number of patients
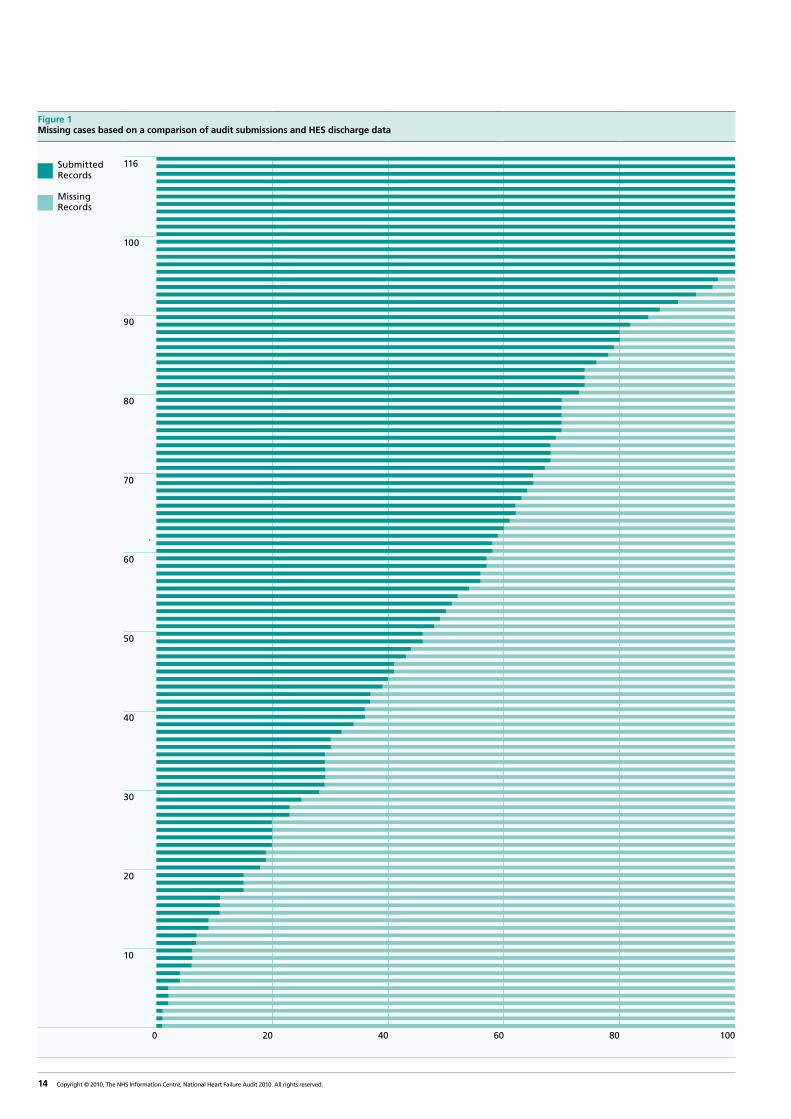
Between 2009-2010, hospitals submitted admission data on 21294 patients for the period April 1st 2009 to March 31st 2010. There were 4236 readmissions recorded in the database. The number of records submitted increased from 6170 admissions and 710 readmissions in 2008 – 2009,
Nationally, the number of cases submitted to the audit represents approximately 42 per cent of patients discharged from hospital with a diagnosis of heart failure in the primary position ii.
Figure 1 shows the estimated proportion of missing cases. This is an improvement from last year when the number of cases submitted to the audit represented 11% of patients discharged with a diagnosis of heart failure iii.
i Powys Health Board patients are admitted to English NHS Hospitals in Hereford and Shrewsburyii Based on HES Data 2008-2009iii Based on HES Data 2008-2009
14 Copyright © 2010, The NHS Information Centre, National Heart Failure Audit 2010. All rights reserved.
Figure 1 Missing cases based on a comparison of audit submissions and HES discharge data
Submitted Records
Missing
Records
116
100
90
80
70
60
50
40
30
20
10
0 20 40 60 80 100
15Copyright © 2010, The NHS Information Centre, National Heart Failure Audit 2010. All rights reserved.
Figure 2 Percentage Data completeness
Unknown Data Known Data
Percentage Known
100%
90%
80%
70%
60%
50%
40%
30%
20%
10%
NHS Number Postcode ACE Betablocker
Field
8.21
91.79
0.08
99.92
3.21 3.21
99.79 99.79
Data completeness
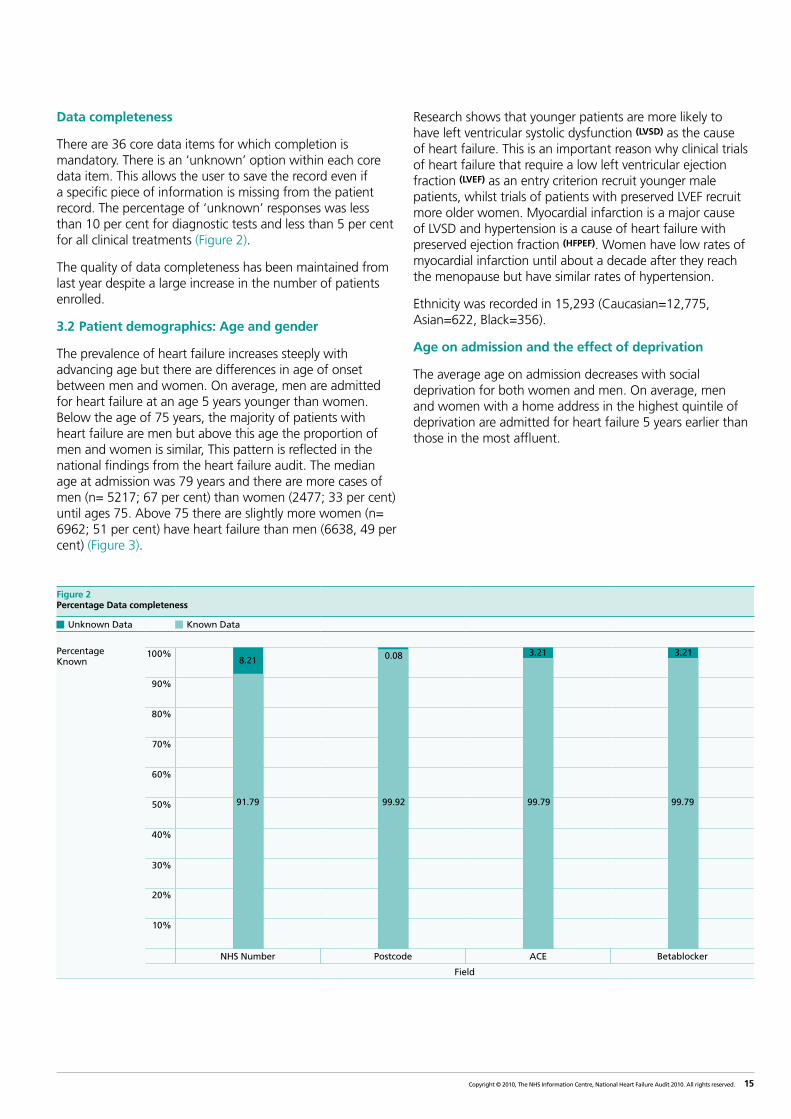
There are 36 core data items for which completion is mandatory. There is an ‘unknown’ option within each core data item. This allows the user to save the record even if a specific piece of information is missing from the patient record. The percentage of ‘unknown’ responses was less than 10 per cent for diagnostic tests and less than 5 per cent for all clinical treatments (Figure 2).
The quality of data completeness has been maintained from last year despite a large increase in the number of patients enrolled.
3.2 Patient demographics: Age and gender
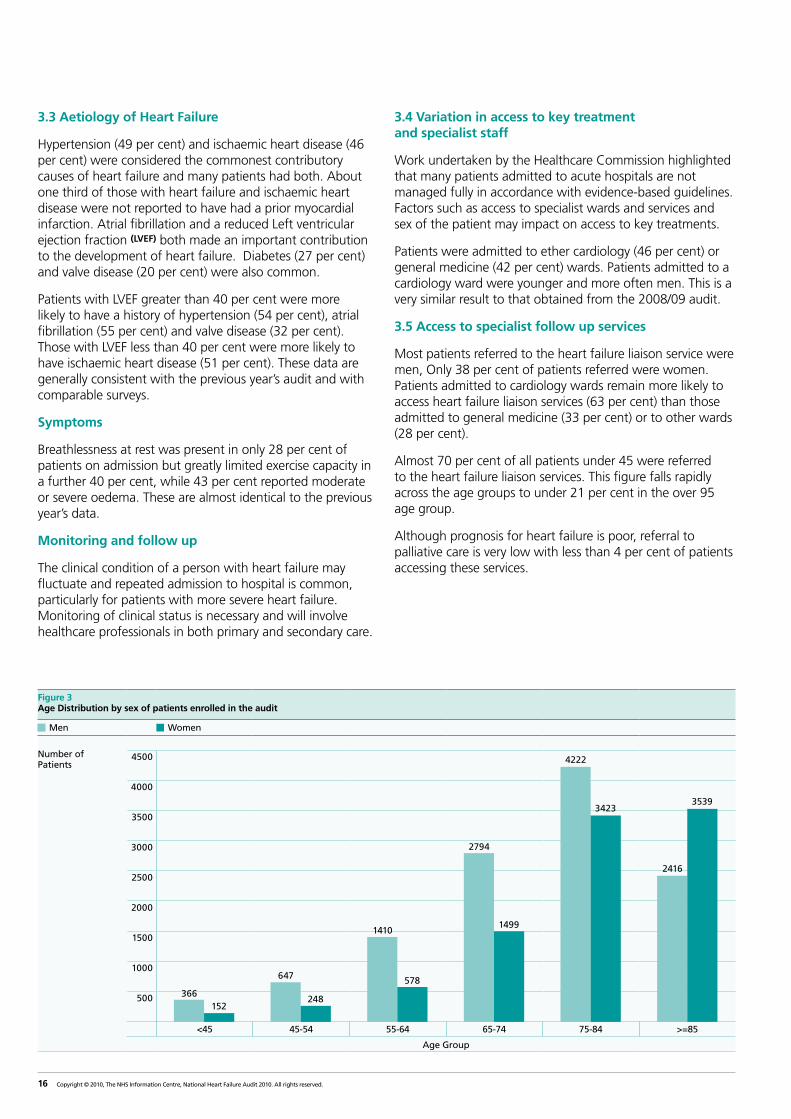
The prevalence of heart failure increases steeply with advancing age but there are differences in age of onset between men and women. On average, men are admitted for heart failure at an age 5 years younger than women. Below the age of 75 years, the majority of patients with heart failure are men but above this age the proportion of men and women is similar, This pattern is reflected in the national findings from the heart failure audit. The median age at admission was 79 years and there are more cases of men (n= 5217; 67 per cent) than women (2477; 33 per cent) until ages 75. Above 75 there are slightly more women (n= 6962; 51 per cent) have heart failure than men (6638, 49 per cent) (Figure 3).
Research shows that younger patients are more likely to have left ventricular systolic dysfunction (LVSD) as the cause of heart failure. This is an important reason why clinical trials of heart failure that require a low left ventricular ejection fraction (LVEF) as an entry criterion recruit younger male patients, whilst trials of patients with preserved LVEF recruit more older women. Myocardial infarction is a major cause of LVSD and hypertension is a cause of heart failure with preserved ejection fraction (HFPEF). Women have low rates of myocardial infarction until about a decade after they reach the menopause but have similar rates of hypertension.
Ethnicity was recorded in 15,293 (Caucasian=12,775, Asian=622, Black=356).
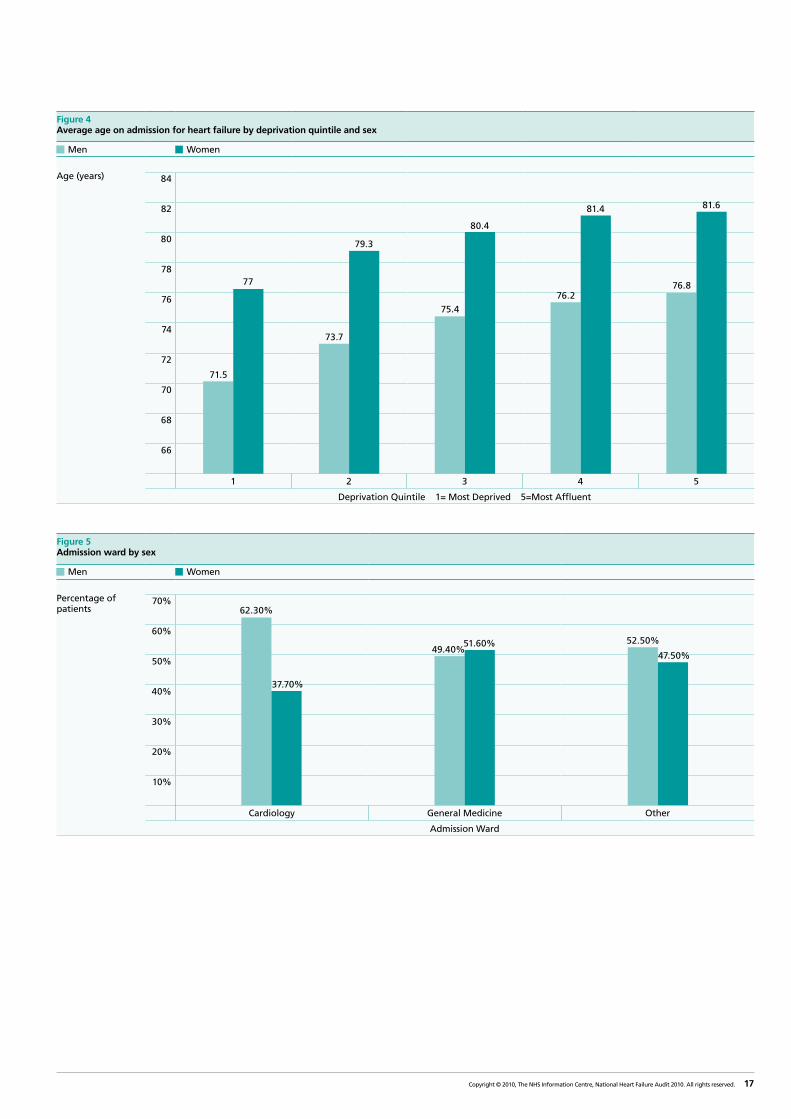
Age on admission and the effect of deprivation
The average age on admission decreases with social deprivation for both women and men. On average, men and women with a home address in the highest quintile of deprivation are admitted for heart failure 5 years earlier than those in the most affluent.
16 Copyright © 2010, The NHS Information Centre, National Heart Failure Audit 2010. All rights reserved.
3.3 Aetiology of Heart Failure
Hypertension (49 per cent) and ischaemic heart disease (46 per cent) were considered the commonest contributory causes of heart failure and many patients had both. About one third of those with heart failure and ischaemic heart disease were not reported to have had a prior myocardial infarction. Atrial fibrillation and a reduced Left ventricular ejection fraction (LVEF) both made an important contribution to the development of heart failure. Diabetes (27 per cent) and valve disease (20 per cent) were also common.
Patients with LVEF greater than 40 per cent were more likely to have a history of hypertension (54 per cent), atrial fibrillation (55 per cent) and valve disease (32 per cent). Those with LVEF less than 40 per cent were more likely to have ischaemic heart disease (51 per cent). These data are generally consistent with the previous year’s audit and with comparable surveys.
Symptoms
Breathlessness at rest was present in only 28 per cent of patients on admission but greatly limited exercise capacity in a further 40 per cent, while 43 per cent reported moderate or severe oedema. These are almost identical to the previous year’s data.
Monitoring and follow up
The clinical condition of a person with heart failure may fluctuate and repeated admission to hospital is common, particularly for patients with more severe heart failure. Monitoring of clinical status is necessary and will involve healthcare professionals in both primary and secondary care.
3.4 Variation in access to key treatment and specialist staff
Work undertaken by the Healthcare Commission highlighted that many patients admitted to acute hospitals are not managed fully in accordance with evidence-based guidelines. Factors such as access to specialist wards and services and sex of the patient may impact on access to key treatments.
Patients were admitted to ether cardiology (46 per cent) or general medicine (42 per cent) wards. Patients admitted to a cardiology ward were younger and more often men. This is a very similar result to that obtained from the 2008/09 audit.
3.5 Access to specialist follow up services
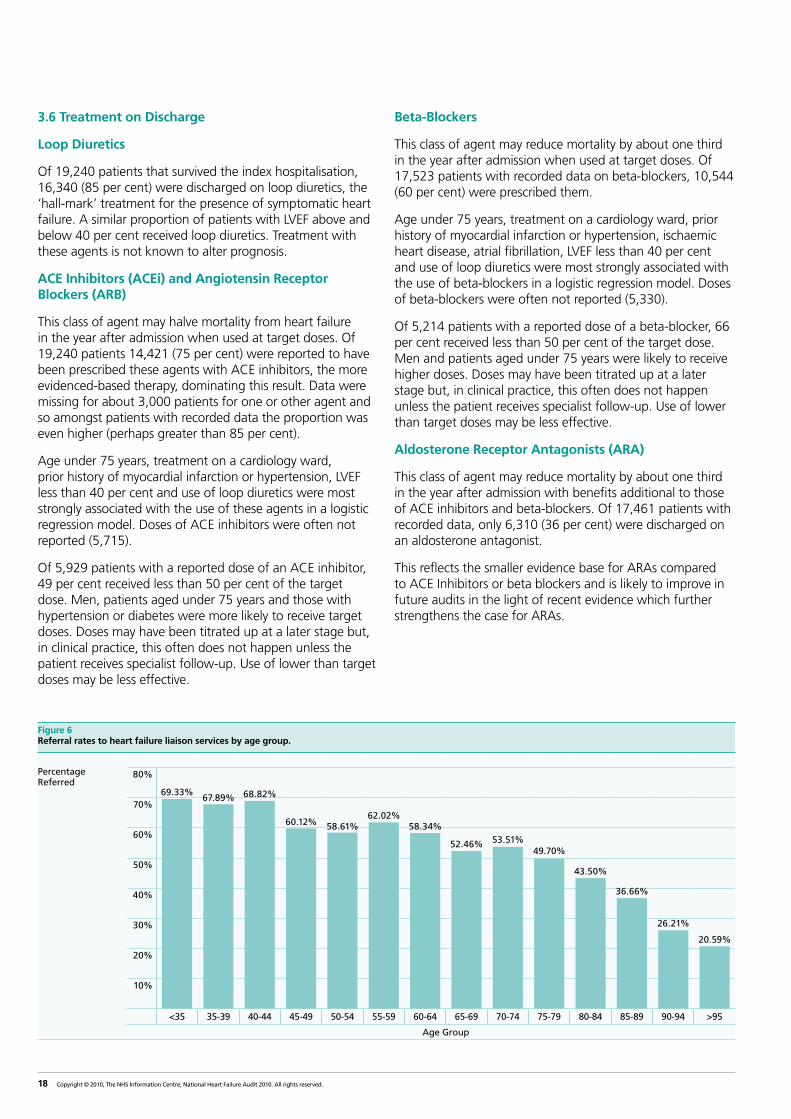
Most patients referred to the heart failure liaison service were men, Only 38 per cent of patients referred were women. Patients admitted to cardiology wards remain more likely to access heart failure liaison services (63 per cent) than those admitted to general medicine (33 per cent) or to other wards (28 per cent).
Almost 70 per cent of all patients under 45 were referred to the heart failure liaison services. This figure falls rapidly across the age groups to under 21 per cent in the over 95 age group.
Although prognosis for heart failure is poor, referral to palliative care is very low with less than 4 per cent of patients accessing these services.
Figure 3 Age Distribution by sex of patients enrolled in the audit
Men Women
Number of Patients
4500
4000
3500
3000
2500
2000
1500
1000
500
<45 45-54 55-64 65-74 75-84 >=85
Age Group
366152
647
248
1410
578
2794
1499
4222
3423
2416
3539
17Copyright © 2010, The NHS Information Centre, National Heart Failure Audit 2010. All rights reserved.
Figure 4 Average age on admission for heart failure by deprivation quintile and sex
Men Women
Age (years) 84
82
80
78
76
74
72
70
68
66
1 2 3 4 5
Deprivation Quintile 1= Most Deprived 5=Most Affluent
76.8
81.6
76.2
81.4
75.4
80.4
73.7
79.3
71.5
77
Figure 5 Admission ward by sex
Men Women
Percentage of patients
70%
60%
50%
40%
30%
20%
10%
Cardiology General Medicine Other
Admission Ward
62.30%
37.70%
49.40%51.60% 52.50%
47.50%
18 Copyright © 2010, The NHS Information Centre, National Heart Failure Audit 2010. All rights reserved.
3.6 Treatment on Discharge
Loop Diuretics
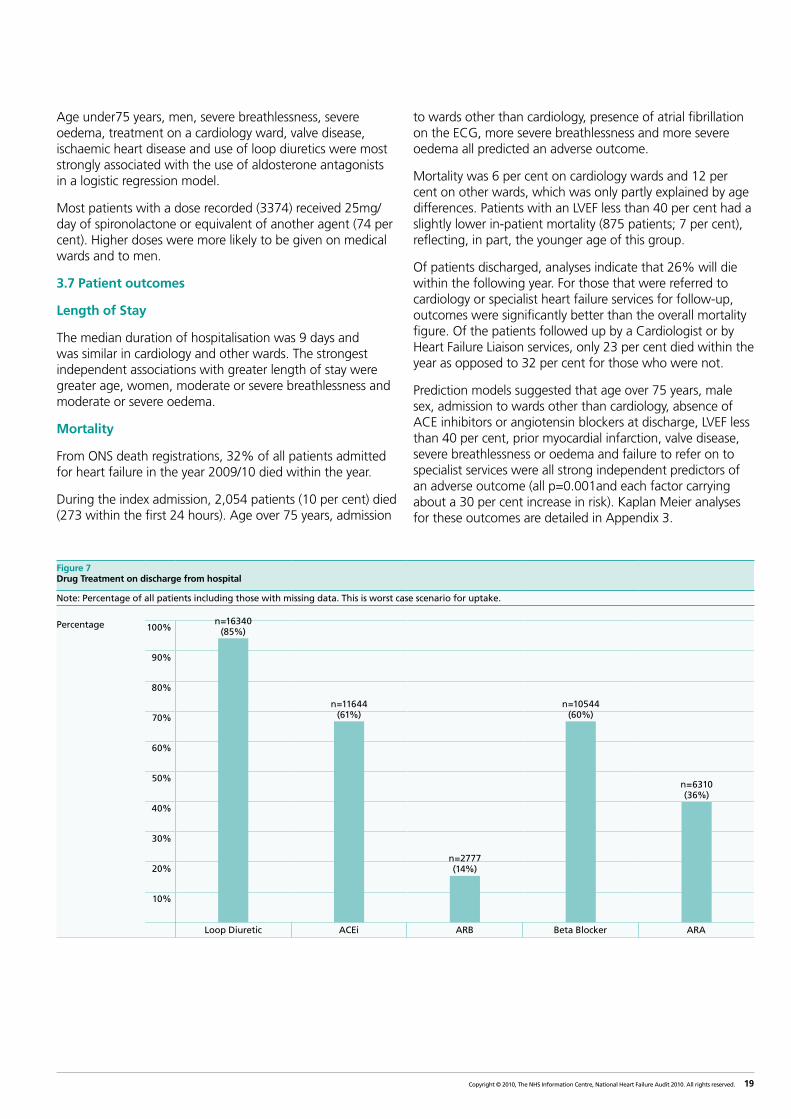
Of 19,240 patients that survived the index hospitalisation, 16,340 (85 per cent) were discharged on loop diuretics, the ‘hall-mark’ treatment for the presence of symptomatic heart failure. A similar proportion of patients with LVEF above and below 40 per cent received loop diuretics. Treatment with these agents is not known to alter prognosis.
ACE Inhibitors (ACEi) and Angiotensin Receptor Blockers (ARB)
This class of agent may halve mortality from heart failure in the year after admission when used at target doses. Of 19,240 patients 14,421 (75 per cent) were reported to have been prescribed these agents with ACE inhibitors, the more evidenced-based therapy, dominating this result. Data were missing for about 3,000 patients for one or other agent and so amongst patients with recorded data the proportion was even higher (perhaps greater than 85 per cent).
Age under 75 years, treatment on a cardiology ward, prior history of myocardial infarction or hypertension, LVEF less than 40 per cent and use of loop diuretics were most strongly associated with the use of these agents in a logistic regression model. Doses of ACE inhibitors were often not reported (5,715).
Of 5,929 patients with a reported dose of an ACE inhibitor, 49 per cent received less than 50 per cent of the target dose. Men, patients aged under 75 years and those with hypertension or diabetes were more likely to receive target doses. Doses may have been titrated up at a later stage but, in clinical practice, this often does not happen unless the patient receives specialist follow-up. Use of lower than target doses may be less effective.
Beta-Blockers
This class of agent may reduce mortality by about one third in the year after admission when used at target doses. Of 17,523 patients with recorded data on beta-blockers, 10,544 (60 per cent) were prescribed them.
Age under 75 years, treatment on a cardiology ward, prior history of myocardial infarction or hypertension, ischaemic heart disease, atrial fibrillation, LVEF less than 40 per cent and use of loop diuretics were most strongly associated with the use of beta-blockers in a logistic regression model. Doses of beta-blockers were often not reported (5,330).
Of 5,214 patients with a reported dose of a beta-blocker, 66 per cent received less than 50 per cent of the target dose. Men and patients aged under 75 years were likely to receive higher doses. Doses may have been titrated up at a later stage but, in clinical practice, this often does not happen unless the patient receives specialist follow-up. Use of lower than target doses may be less effective.
Aldosterone Receptor Antagonists (ARA)
This class of agent may reduce mortality by about one third in the year after admission with benefits additional to those of ACE inhibitors and beta-blockers. Of 17,461 patients with recorded data, only 6,310 (36 per cent) were discharged on an aldosterone antagonist.
This reflects the smaller evidence base for ARAs compared to ACE Inhibitors or beta blockers and is likely to improve in future audits in the light of recent evidence which further strengthens the case for ARAs.
Figure 6 Referral rates to heart failure liaison services by age group.
Percentage Referred
80%
70%
60%
50%
40%
30%
20%
10%
<35 35-39 40-44 45-49 50-54 55-59 60-64 65-69 70-74 75-79 80-84 85-89 90-94 >95
Age Group
69.33%
20.59%
26.21%
36.66%
43.50%
49.70%53.51%52.46%
58.34%62.02%
58.61%60.12%
68.82%67.89%
19Copyright © 2010, The NHS Information Centre, National Heart Failure Audit 2010. All rights reserved.
Figure 7 Drug Treatment on discharge from hospital
Note: Percentage of all patients including those with missing data. This is worst case scenario for uptake.
Percentage 100%
90%
80%
70%
60%
50%
40%
30%
20%
10%
Loop Diuretic ACEi ARB Beta Blocker ARA
n=6310 (36%)
n=10544 (60%)
n=2777 (14%)
n=11644 (61%)
n=16340 (85%)
Age under75 years, men, severe breathlessness, severe oedema, treatment on a cardiology ward, valve disease, ischaemic heart disease and use of loop diuretics were most strongly associated with the use of aldosterone antagonists in a logistic regression model.
Most patients with a dose recorded (3374) received 25mg/day of spironolactone or equivalent of another agent (74 per cent). Higher doses were more likely to be given on medical wards and to men.
3.7 Patient outcomes
Length of Stay
The median duration of hospitalisation was 9 days and was similar in cardiology and other wards. The strongest independent associations with greater length of stay were greater age, women, moderate or severe breathlessness and moderate or severe oedema.
Mortality
From ONS death registrations, 32% of all patients admitted for heart failure in the year 2009/10 died within the year.
During the index admission, 2,054 patients (10 per cent) died (273 within the first 24 hours). Age over 75 years, admission
to wards other than cardiology, presence of atrial fibrillation on the ECG, more severe breathlessness and more severe oedema all predicted an adverse outcome.
Mortality was 6 per cent on cardiology wards and 12 per cent on other wards, which was only partly explained by age differences. Patients with an LVEF less than 40 per cent had a slightly lower in-patient mortality (875 patients; 7 per cent), reflecting, in part, the younger age of this group.
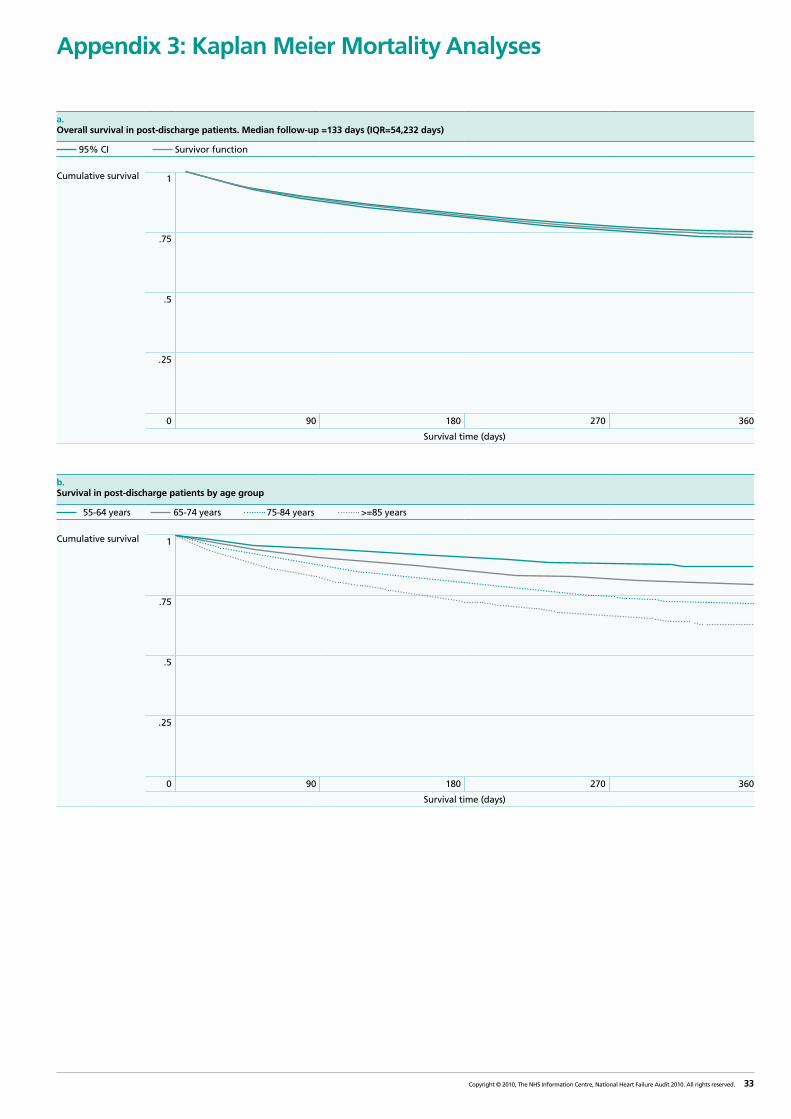
Of patients discharged, analyses indicate that 26% will die within the following year. For those that were referred to cardiology or specialist heart failure services for follow-up, outcomes were significantly better than the overall mortality figure. Of the patients followed up by a Cardiologist or by Heart Failure Liaison services, only 23 per cent died within the year as opposed to 32 per cent for those who were not.
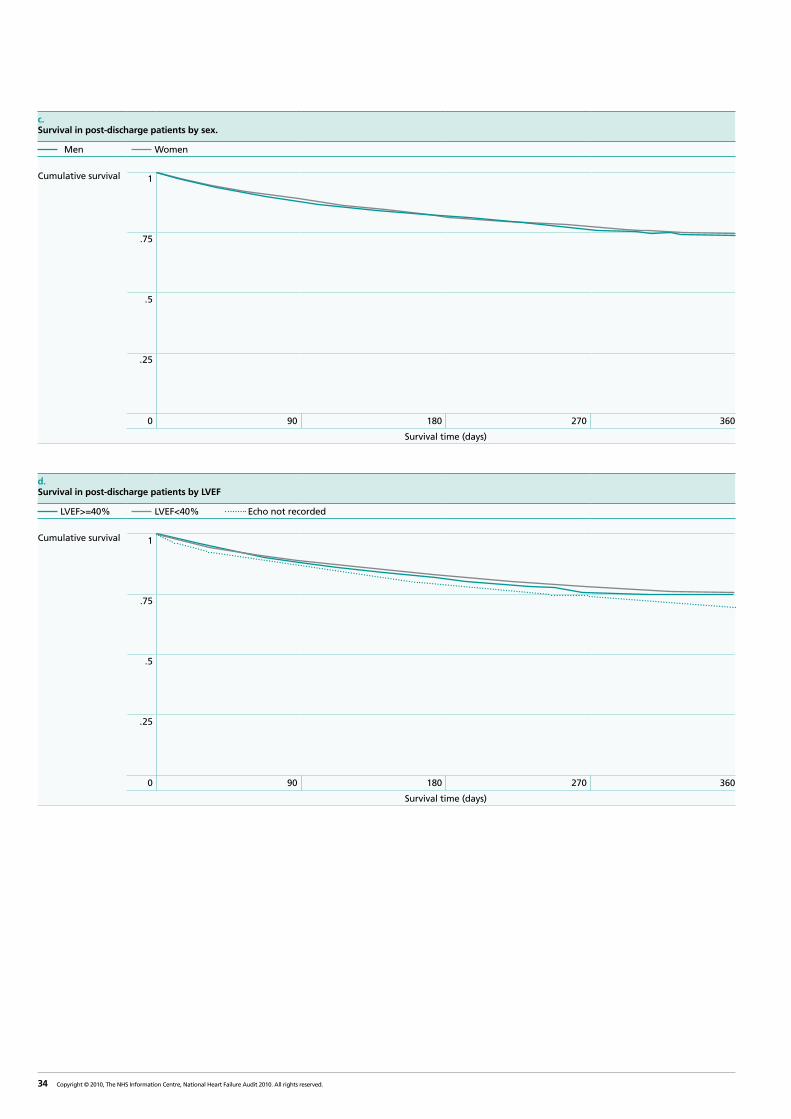
Prediction models suggested that age over 75 years, male sex, admission to wards other than cardiology, absence of ACE inhibitors or angiotensin blockers at discharge, LVEF less than 40 per cent, prior myocardial infarction, valve disease, severe breathlessness or oedema and failure to refer on to specialist services were all strong independent predictors of an adverse outcome (all p=0.001and each factor carrying about a 30 per cent increase in risk). Kaplan Meier analyses for these outcomes are detailed in Appendix 3.
20 Copyright © 2010, The NHS Information Centre, National Heart Failure Audit 2010. All rights reserved.
The audit has grown both in terms of the number of participating hospitals and the number of patients per hospital being reported. Despite the increase in numbers data completeness of core fields is excellent. Completeness of data for non-core fields, however, is poor.
Local restructuring within the NHS and changes in key clinical, nursing and support staff within the audit have lead to difficulties in maintaining communications from the audit project team with all participating organisations. An exercise by the project support staff in The IC Clinical Audit Support Unit has placed considerable effort into continually updating the contacts for each organisation. Any changes to key audit staff should be notified to the CASU helpdesk (Tel. 0845 3006016 or email: [email protected]).
Organisation support
It is likely that the heart failure audit, will feature in a wider, strategic role of health policy. The government white paper Equity and excellence: Liberating the NHS published in July 2010 states that “...outcome measures, patient experience surveys and national clinical audit are not used widely enough. We [the government] will expand their validity, collection and use. The Department [of Health] will extend national clinical audit to support clinicians across a much wider range of treatments and conditions.” (15)
It should be born in mind that any resulting increase in the numbers of patients and volume of data collected for the audit will increase the workload of administrative, clinical & nursing staff in each participating organisation unless there are improvements in the efficiency of data recording.
IT issues
As highlighted in last year’s report, the complex pathway means that users need a flexible system. The heart failure database is based on Lotus Notes and hospitals are provided with one licence which is restricted to a single computer. If audit responsibilities are divided across directorates and roles then additional licences or a more flexible web-based system will be required.
Many of the best performing organisations have developed IT solutions to perform the majority of the data loading. This is strongly encouraged.
Accuracy of Coding
Reassuringly, health professionals participating in the survey confirmed the coded diagnosis of heart failure in 84 per cent of cases and refuted it in only 9 per cent (no response in 6 per cent). Accordingly, when a diagnosis of heart failure is coded in the first position it seems fairly accurate. The number of missed diagnosis however cannot be ascertained by our survey methodology and may be substantial. The number of patients with heart failure coded in positions other than first may exceed 300,000 per year. These patients have similar characteristics and outcome to patients coded in the first position. This large additional pool of patients with heart failure must be kept in mind.
4. Implementation issues
21Copyright © 2010, The NHS Information Centre, National Heart Failure Audit 2010. All rights reserved.
Quality information remains at the core of improving services. The National Heart Failure Audit is now providing consistent, credible and important information about the quality of care and patient outcomes on a representative sample of 43 per cent of deaths and discharges coded for heart failure in England and Wales. There have been huge positive steps over the last year. A major factor is that a greater number of Trusts and Health Boards have registered with the audit and of these many more are reporting the requisite amount of patients. With the much higher participation rates from last year, we can now be confident that we are seeing a representative spectrum of care-patterns and outcomes for heart failure and are not likely to be representing the results of just a few selected patients or high quality centres
The audit demonstrates some positive steps towards improving access to a gold standard diagnostic test such as echocardiography although the access to B-type Natriuretic Peptide (BNP) testing, as recommended by NICE, is still disappointing. A confirmed diagnosis is the key to accessing the right treatment.
This year’s audit finding confirms the improvement suggested last year in the use of key treatments such as ACE inhibitors and beta blockers since the Healthcare Commission survey work in 2005-2006 (16).
The audit shows however that not all those with a confirmed diagnosis are provided with the full range of optimal treatments to manage their symptoms and improve their quality of life. Patients admitted to general medicine wards are less likely to access the recommended NICE treatments than those admitted to cardiology wards.
Research has shown that effective care for patients with heart failure can reduce mortality. This and last year’s audits are consistent in showing high mortality for patients
hospitalised with heart failure, with 32 per cent dying within the year. Outcomes are substantially better if the patient accesses specialist care. Mortality at one year in those followed up by cardiologists or by specialist heart failure services is only 23 per cent. The factors influencing mortality rates need to be confirmed but the process of specialist management, tailoring therapy to the patients needs may be key, rather than simply access to drugs. This will need to be explored further and addressed in future versions of the audit tool.
Access to palliative care is very low. NICE highlighted the considerable unmet palliative care needs of patients with heart failure in 2003. The hospice movement has made a great impact in opening access to people with all forms of terminal care.
All stakeholders, including the public, have a right to expect open reporting. More important is the expectation that audit will make a difference. Whilst there has been significant improvement in developing heart failure services, inequity of access first identified by the Healthcare Commission in 2005 continues. All stakeholders have a responsibility to ensure findings are used to drive improvement and make a positive difference to the experience of patients living with heart failure. There is a definite need for a more integrated approach to using audit findings to support local improvement.
These data provide a powerful incentive to reorganise heart failure care in the UK. We need to deliver the same streamlined specialist care that we do for the treatment of heart attacks to this group of patients who have a far greater morbidity and mortality.
5. Conclusion
22 Copyright © 2010, The NHS Information Centre, National Heart Failure Audit 2010. All rights reserved.
6. Recommendations
Since the launch of the national heart failure audit, most (85 per cent) of NHS Trusts and Heath Boards have registered with the audit. Organisations such as Cardiac Networks, The Heart Improvement Programme, 1000 Lives Plus and The Care Quality Commission also have a remit to support and promote improvement in the quality of heart failure services.
The British Society for Heart Failure has identified a number of key areas for attention. These fall into two categories: improving data completeness and improving the quality of patient care.
Recommendations for improving data completeness
• All secondary care Trusts and Health Boards treating patients with heart failure should participate in the audit.
• Ideally, all units should be encouraged to submit every patient discharged with a primary diagnosis of heart failure. As a move towards full participation, all secondary care Trusts and Health Boards should continue to submit at least 20 (or if less than 20, the maximum number) of patients discharged with a diagnosis of heart failure in the primary position.
• Strategic Health Authorities should recommend the inclusion of heart failure related Indicators for Quality Improvement in quality accounts.
• The NHS Information Centre should ensure the audit process is clearly defined for both clinical and non-clinical roles and to move towards a more flexible web-based system.
Recommendations for improving the quality of care and patient outcomes
• All secondary care service providers should streamline the heart failure care pathway to ensure all patients, regardless of admission ward, have access to recommended medication in line with NICE guidelines and that treatment is managed by specialist staff.
• Commissioners should use evidence of participation in the National Heart Failure Audit within the effective commissioning process to ensure that all patients with a confirmed diagnosis of heart failure have access to evidence based treatment as recommended by NICE.
• Consideration should be given to collecting survival (and if possible re-hospitalisation) data for future years. A median follow-up of just 133 days from discharge (partly explained by the high mortality) is inadequate to describe the full impact of heart failure on survival.
• The NHS Information Centre, in discussion with partner organisations including the Heart Improvement Programme and Cardiac Networks, to identify ways of supporting implementation of the audit through training and information sessions and using audit findings to support the local improvements of heart failure services.
23Copyright © 2010, The NHS Information Centre, National Heart Failure Audit 2010. All rights reserved.
1. British Heart Foundation (2007) http://www.heartstats.org/homepage.asp
2. Stewart S, Macintyre K, Capewell S, McMurray, J. Heart failure and the ageing population: an increasing burden in the 21st century. Heart,2003;89:49–53
3. Torabi A, Cleland JGF, Khan NK, et al. The timing of development and subsequent clinical course of heart failure after a myocardial infarction. European Heart Journal 2008;29:859-870
4. Cowie M, Woods D, Coats A, Thomson S, Suresh V, Poole-Wislon P, Sutton G. Survival of patients with a new diagnosis of heart failure: a population based study. Heart, 2000; 83; 505–10
5. Jiang, W. Alexander, J. et al. Relationship of Depression to Increased Risk of Mortality and Rehospitalization in Patients with Congestive Heart Failure. Archives of Internal Medicine (2001), Vol 161; Part 15, pages 1849-1856
6. Hospital Episode Statistics 2008–2009 http://www.hesonline.nhs.uk
7. NHS Modernisation Agency (2004), Coronary Heart Disease Collaborative: Heart Failure Workstream Progress Report; Brown A, Cleland J G F (1998) Influence of pattern of concomitant disease on patterns of hospitalisation in patients with heart failure discharged from Scottish hospitals in 1995. European Heart Journal 1998; Reitsma J B, Mosterd A, De Craen A J M, et al (1996), Increase in hospital admission rates for heart failure in the Netherlands, 1980–1993. Heart, 1996; Krumholz H M, Parent E M, Tu N, et al.(1997) Re-admission after hospitalization for congestive heart failure among medicare beneficiaries. Arch Intern Med, 1997. Croft J B, Giles W H, Pollard R A, Casper M L, Anda R F, Livengood J R (1997), National trends in the initial hospitalisation for heart failure. J Am Geriatrics Society, 1997;
8. Department of Health (2000) National Service Framework for Coronary Heart Disease: Chapter 6 – Heart Failure. London: Department of Health.
9. Welsh Assembly Government, 2009, The Cardiac Disease National Service Framework for Wales. Cardiff, WAG.
10. NICE 2010 guideline: CG108 Chronic heart failure http://guidance.nice.org.uk/CG108/NICEGuidance/pdf/English
11. Healthcare Commission (2005). Getting to the heart of it. Coronary Heart Disease in England: A review of progress towards the national standards.
12. Healthcare Commission (2007). Pushing the boundaries. Improving services for people with heart failure.
13. Nicol ED, Fittall B, Roughton M, Cleland JG, Dargie H, Cowie MR (2008) NHS Heart Failure Survey – a survey of acute heart failure admissions in England, Wales and Northern Ireland. Heart. 2008 Feb;94(2):172-7. Epub 2007 Nov 14.
14. http://www.ic.nhs.uk/services/measuring-for-qualityimprovement
15. Equity and excellence: Liberating the NHS (2010) http://www.dh.gov.uk/en/Publicationsandstatistics/Publications/PublicationsPolicyAndGuidance/DH_117353
16. The NHS Information centre for Health and Social care (2009). National Heart Failure Audit 2008/09 http://www.ic.nhs.uk/webfiles/Services/NCASP/audits%20and%20reports/NHS_National_Heart_Failure_Audit_09_INTERACTIVE.pdf
References
24 Copyright © 2010, The NHS Information Centre, National Heart Failure Audit 2010. All rights reserved.
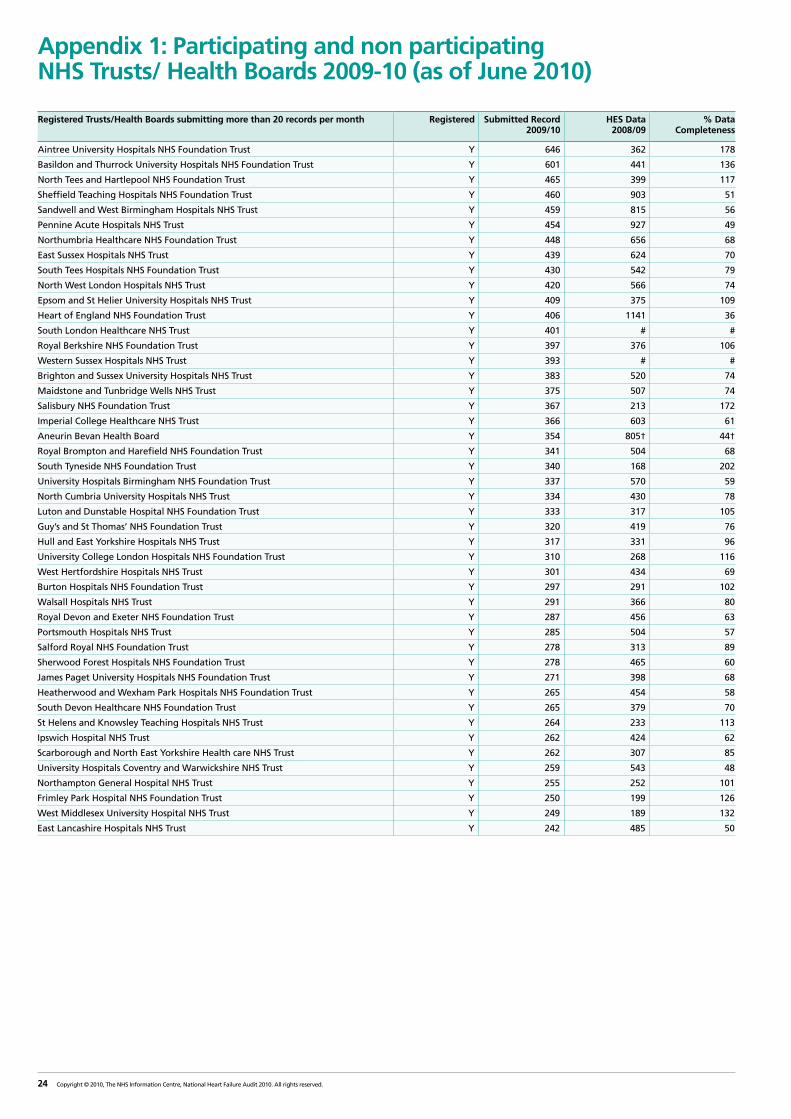
Appendix 1: Participating and non participating NHS Trusts/ Health Boards 2009-10 (as of June 2010)
Registered Trusts/Health Boards submitting more than 20 records per month Registered Submitted Record 2009/10
HES Data 2008/09
% Data Completeness
Aintree University Hospitals NHS Foundation Trust Y 646 362 178
Basildon and Thurrock University Hospitals NHS Foundation Trust Y 601 441 136
North Tees and Hartlepool NHS Foundation Trust Y 465 399 117
Sheffield Teaching Hospitals NHS Foundation Trust Y 460 903 51
Sandwell and West Birmingham Hospitals NHS Trust Y 459 815 56
Pennine Acute Hospitals NHS Trust Y 454 927 49
Northumbria Healthcare NHS Foundation Trust Y 448 656 68
East Sussex Hospitals NHS Trust Y 439 624 70
South Tees Hospitals NHS Foundation Trust Y 430 542 79
North West London Hospitals NHS Trust Y 420 566 74
Epsom and St Helier University Hospitals NHS Trust Y 409 375 109
Heart of England NHS Foundation Trust Y 406 1141 36
South London Healthcare NHS Trust Y 401 # #
Royal Berkshire NHS Foundation Trust Y 397 376 106
Western Sussex Hospitals NHS Trust Y 393 # #
Brighton and Sussex University Hospitals NHS Trust Y 383 520 74
Maidstone and Tunbridge Wells NHS Trust Y 375 507 74
Salisbury NHS Foundation Trust Y 367 213 172
Imperial College Healthcare NHS Trust Y 366 603 61
Aneurin Bevan Health Board Y 354 805† 44†
Royal Brompton and Harefield NHS Foundation Trust Y 341 504 68
South Tyneside NHS Foundation Trust Y 340 168 202
University Hospitals Birmingham NHS Foundation Trust Y 337 570 59
North Cumbria University Hospitals NHS Trust Y 334 430 78
Luton and Dunstable Hospital NHS Foundation Trust Y 333 317 105
Guy’s and St Thomas’ NHS Foundation Trust Y 320 419 76
Hull and East Yorkshire Hospitals NHS Trust Y 317 331 96
University College London Hospitals NHS Foundation Trust Y 310 268 116
West Hertfordshire Hospitals NHS Trust Y 301 434 69
Burton Hospitals NHS Foundation Trust Y 297 291 102
Walsall Hospitals NHS Trust Y 291 366 80
Royal Devon and Exeter NHS Foundation Trust Y 287 456 63
Portsmouth Hospitals NHS Trust Y 285 504 57
Salford Royal NHS Foundation Trust Y 278 313 89
Sherwood Forest Hospitals NHS Foundation Trust Y 278 465 60
James Paget University Hospitals NHS Foundation Trust Y 271 398 68
Heatherwood and Wexham Park Hospitals NHS Foundation Trust Y 265 454 58
South Devon Healthcare NHS Foundation Trust Y 265 379 70
St Helens and Knowsley Teaching Hospitals NHS Trust Y 264 233 113
Ipswich Hospital NHS Trust Y 262 424 62
Scarborough and North East Yorkshire Health care NHS Trust Y 262 307 85
University Hospitals Coventry and Warwickshire NHS Trust Y 259 543 48
Northampton General Hospital NHS Trust Y 255 252 101
Frimley Park Hospital NHS Foundation Trust Y 250 199 126
West Middlesex University Hospital NHS Trust Y 249 189 132
East Lancashire Hospitals NHS Trust Y 242 485 50
25Copyright © 2010, The NHS Information Centre, National Heart Failure Audit 2010. All rights reserved.
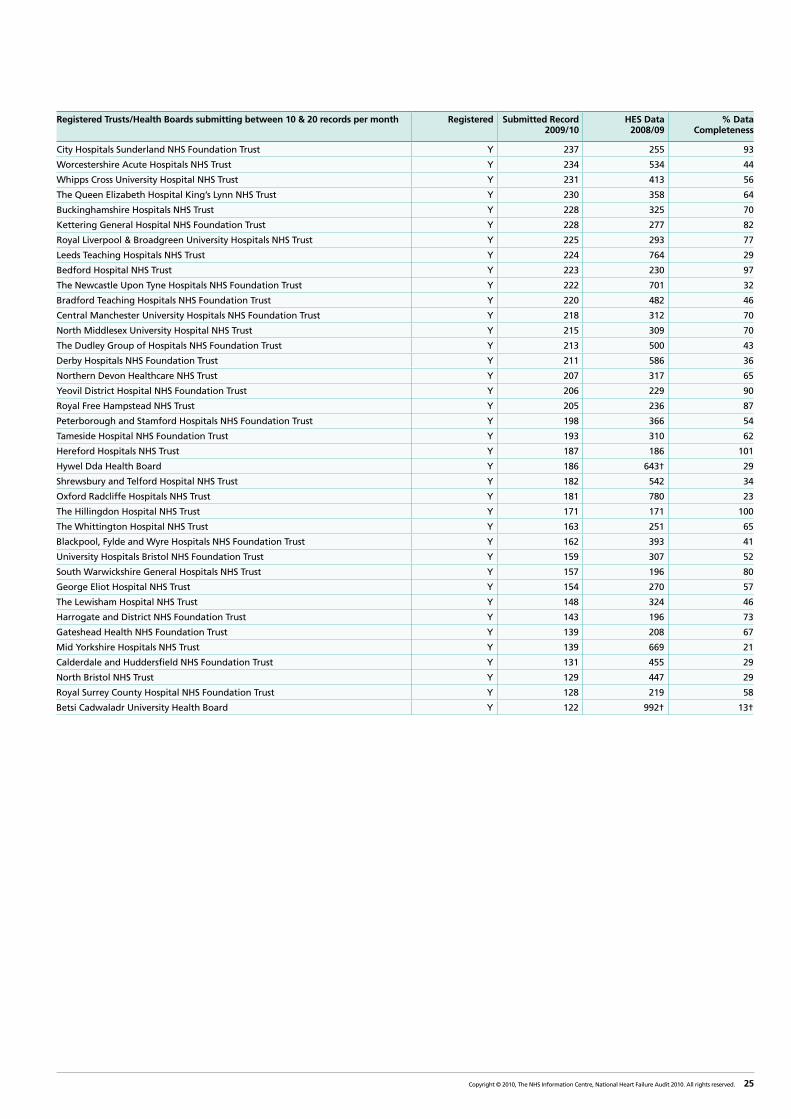
Registered Trusts/Health Boards submitting between 10 & 20 records per month Registered Submitted Record 2009/10
HES Data 2008/09
% Data Completeness
City Hospitals Sunderland NHS Foundation Trust Y 237 255 93
Worcestershire Acute Hospitals NHS Trust Y 234 534 44
Whipps Cross University Hospital NHS Trust Y 231 413 56
The Queen Elizabeth Hospital King’s Lynn NHS Trust Y 230 358 64
Buckinghamshire Hospitals NHS Trust Y 228 325 70
Kettering General Hospital NHS Foundation Trust Y 228 277 82
Royal Liverpool & Broadgreen University Hospitals NHS Trust Y 225 293 77
Leeds Teaching Hospitals NHS Trust Y 224 764 29
Bedford Hospital NHS Trust Y 223 230 97
The Newcastle Upon Tyne Hospitals NHS Foundation Trust Y 222 701 32
Bradford Teaching Hospitals NHS Foundation Trust Y 220 482 46
Central Manchester University Hospitals NHS Foundation Trust Y 218 312 70
North Middlesex University Hospital NHS Trust Y 215 309 70
The Dudley Group of Hospitals NHS Foundation Trust Y 213 500 43
Derby Hospitals NHS Foundation Trust Y 211 586 36
Northern Devon Healthcare NHS Trust Y 207 317 65
Yeovil District Hospital NHS Foundation Trust Y 206 229 90
Royal Free Hampstead NHS Trust Y 205 236 87
Peterborough and Stamford Hospitals NHS Foundation Trust Y 198 366 54
Tameside Hospital NHS Foundation Trust Y 193 310 62
Hereford Hospitals NHS Trust Y 187 186 101
Hywel Dda Health Board Y 186 643† 29
Shrewsbury and Telford Hospital NHS Trust Y 182 542 34
Oxford Radcliffe Hospitals NHS Trust Y 181 780 23
The Hillingdon Hospital NHS Trust Y 171 171 100
The Whittington Hospital NHS Trust Y 163 251 65
Blackpool, Fylde and Wyre Hospitals NHS Foundation Trust Y 162 393 41
University Hospitals Bristol NHS Foundation Trust Y 159 307 52
South Warwickshire General Hospitals NHS Trust Y 157 196 80
George Eliot Hospital NHS Trust Y 154 270 57
The Lewisham Hospital NHS Trust Y 148 324 46
Harrogate and District NHS Foundation Trust Y 143 196 73
Gateshead Health NHS Foundation Trust Y 139 208 67
Mid Yorkshire Hospitals NHS Trust Y 139 669 21
Calderdale and Huddersfield NHS Foundation Trust Y 131 455 29
North Bristol NHS Trust Y 129 447 29
Royal Surrey County Hospital NHS Foundation Trust Y 128 219 58
Betsi Cadwaladr University Health Board Y 122 992† 13†
26 Copyright © 2010, The NHS Information Centre, National Heart Failure Audit 2010. All rights reserved.
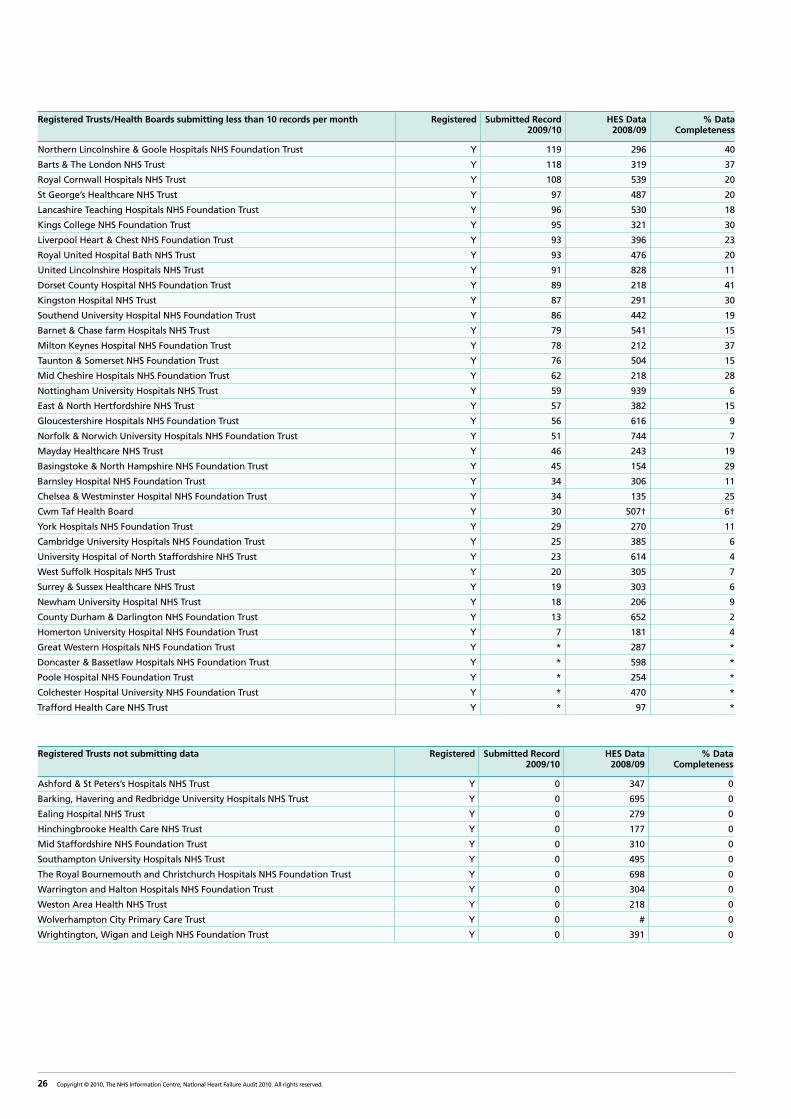
Registered Trusts/Health Boards submitting less than 10 records per month Registered Submitted Record 2009/10
HES Data 2008/09
% Data Completeness
Northern Lincolnshire & Goole Hospitals NHS Foundation Trust Y 119 296 40
Barts & The London NHS Trust Y 118 319 37
Royal Cornwall Hospitals NHS Trust Y 108 539 20
St George’s Healthcare NHS Trust Y 97 487 20
Lancashire Teaching Hospitals NHS Foundation Trust Y 96 530 18
Kings College NHS Foundation Trust Y 95 321 30
Liverpool Heart & Chest NHS Foundation Trust Y 93 396 23
Royal United Hospital Bath NHS Trust Y 93 476 20
United Lincolnshire Hospitals NHS Trust Y 91 828 11
Dorset County Hospital NHS Foundation Trust Y 89 218 41
Kingston Hospital NHS Trust Y 87 291 30
Southend University Hospital NHS Foundation Trust Y 86 442 19
Barnet & Chase farm Hospitals NHS Trust Y 79 541 15
Milton Keynes Hospital NHS Foundation Trust Y 78 212 37
Taunton & Somerset NHS Foundation Trust Y 76 504 15
Mid Cheshire Hospitals NHS Foundation Trust Y 62 218 28
Nottingham University Hospitals NHS Trust Y 59 939 6
East & North Hertfordshire NHS Trust Y 57 382 15
Gloucestershire Hospitals NHS Foundation Trust Y 56 616 9
Norfolk & Norwich University Hospitals NHS Foundation Trust Y 51 744 7
Mayday Healthcare NHS Trust Y 46 243 19
Basingstoke & North Hampshire NHS Foundation Trust Y 45 154 29
Barnsley Hospital NHS Foundation Trust Y 34 306 11
Chelsea & Westminster Hospital NHS Foundation Trust Y 34 135 25
Cwm Taf Health Board Y 30 507† 6†
York Hospitals NHS Foundation Trust Y 29 270 11
Cambridge University Hospitals NHS Foundation Trust Y 25 385 6
University Hospital of North Staffordshire NHS Trust Y 23 614 4
West Suffolk Hospitals NHS Trust Y 20 305 7
Surrey & Sussex Healthcare NHS Trust Y 19 303 6
Newham University Hospital NHS Trust Y 18 206 9
County Durham & Darlington NHS Foundation Trust Y 13 652 2
Homerton University Hospital NHS Foundation Trust Y 7 181 4
Great Western Hospitals NHS Foundation Trust Y * 287 *
Doncaster & Bassetlaw Hospitals NHS Foundation Trust Y * 598 *
Poole Hospital NHS Foundation Trust Y * 254 *
Colchester Hospital University NHS Foundation Trust Y * 470 *
Trafford Health Care NHS Trust Y * 97 *
Registered Trusts not submitting data Registered Submitted Record 2009/10
HES Data 2008/09
% Data Completeness
Ashford & St Peters’s Hospitals NHS Trust Y 0 347 0
Barking, Havering and Redbridge University Hospitals NHS Trust Y 0 695 0
Ealing Hospital NHS Trust Y 0 279 0
Hinchingbrooke Health Care NHS Trust Y 0 177 0
Mid Staffordshire NHS Foundation Trust Y 0 310 0
Southampton University Hospitals NHS Trust Y 0 495 0
The Royal Bournemouth and Christchurch Hospitals NHS Foundation Trust Y 0 698 0
Warrington and Halton Hospitals NHS Foundation Trust Y 0 304 0
Weston Area Health NHS Trust Y 0 218 0
Wolverhampton City Primary Care Trust Y 0 # 0
Wrightington, Wigan and Leigh NHS Foundation Trust Y 0 391 0
27Copyright © 2010, The NHS Information Centre, National Heart Failure Audit 2010. All rights reserved.
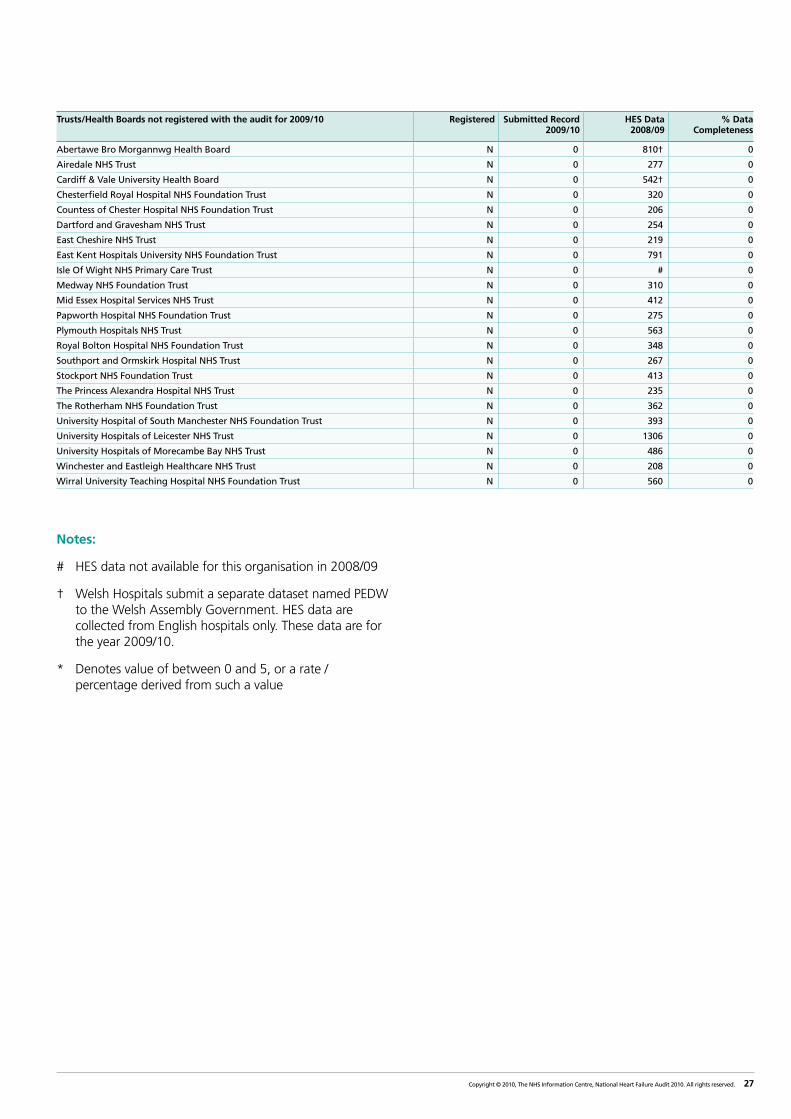
Trusts/Health Boards not registered with the audit for 2009/10 Registered Submitted Record 2009/10
HES Data 2008/09
% Data Completeness
Abertawe Bro Morgannwg Health Board N 0 810† 0
Airedale NHS Trust N 0 277 0
Cardiff & Vale University Health Board N 0 542† 0
Chesterfield Royal Hospital NHS Foundation Trust N 0 320 0
Countess of Chester Hospital NHS Foundation Trust N 0 206 0
Dartford and Gravesham NHS Trust N 0 254 0
East Cheshire NHS Trust N 0 219 0
East Kent Hospitals University NHS Foundation Trust N 0 791 0
Isle Of Wight NHS Primary Care Trust N 0 # 0
Medway NHS Foundation Trust N 0 310 0
Mid Essex Hospital Services NHS Trust N 0 412 0
Papworth Hospital NHS Foundation Trust N 0 275 0
Plymouth Hospitals NHS Trust N 0 563 0
Royal Bolton Hospital NHS Foundation Trust N 0 348 0
Southport and Ormskirk Hospital NHS Trust N 0 267 0
Stockport NHS Foundation Trust N 0 413 0
The Princess Alexandra Hospital NHS Trust N 0 235 0
The Rotherham NHS Foundation Trust N 0 362 0
University Hospital of South Manchester NHS Foundation Trust N 0 393 0
University Hospitals of Leicester NHS Trust N 0 1306 0
University Hospitals of Morecambe Bay NHS Trust N 0 486 0
Winchester and Eastleigh Healthcare NHS Trust N 0 208 0
Wirral University Teaching Hospital NHS Foundation Trust N 0 560 0
Notes:
# HES data not available for this organisation in 2008/09
† Welsh Hospitals submit a separate dataset named PEDW to the Welsh Assembly Government. HES data are collected from English hospitals only. These data are for the year 2009/10.
* Denotes value of between 0 and 5, or a rate / percentage derived from such a value
28 Copyright © 2010, The NHS Information Centre, National Heart Failure Audit 2010. All rights reserved.
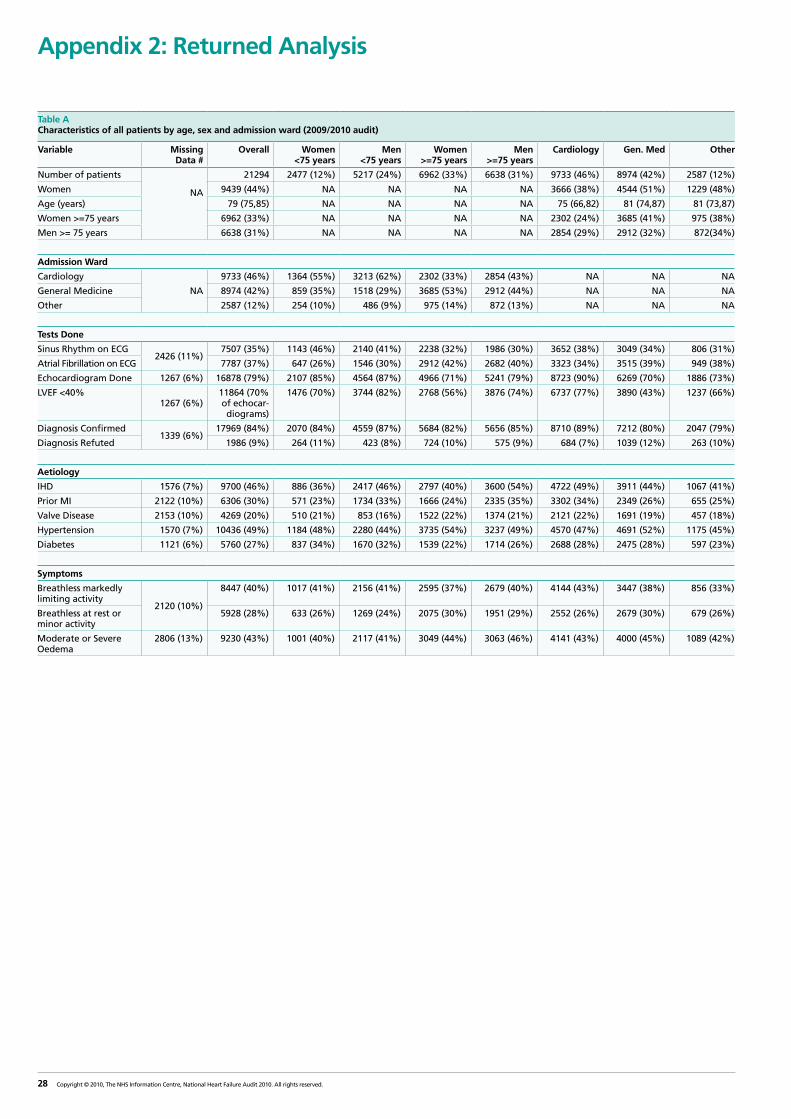
Table A Characteristics of all patients by age, sex and admission ward (2009/2010 audit)
Variable Missing Data #
Overall Women <75 years
Men <75 years
Women >=75 years
Men >=75 years
Cardiology Gen. Med Other
Number of patients
NA
21294 2477 (12%) 5217 (24%) 6962 (33%) 6638 (31%) 9733 (46%) 8974 (42%) 2587 (12%)
Women 9439 (44%) NA NA NA NA 3666 (38%) 4544 (51%) 1229 (48%)
Age (years) 79 (75,85) NA NA NA NA 75 (66,82) 81 (74,87) 81 (73,87)
Women >=75 years 6962 (33%) NA NA NA NA 2302 (24%) 3685 (41%) 975 (38%)
Men >= 75 years 6638 (31%) NA NA NA NA 2854 (29%) 2912 (32%) 872(34%)
Admission Ward
Cardiology
NA
9733 (46%) 1364 (55%) 3213 (62%) 2302 (33%) 2854 (43%) NA NA NA
General Medicine 8974 (42%) 859 (35%) 1518 (29%) 3685 (53%) 2912 (44%) NA NA NA
Other 2587 (12%) 254 (10%) 486 (9%) 975 (14%) 872 (13%) NA NA NA
Tests Done
Sinus Rhythm on ECG2426 (11%)
7507 (35%) 1143 (46%) 2140 (41%) 2238 (32%) 1986 (30%) 3652 (38%) 3049 (34%) 806 (31%)
Atrial Fibrillation on ECG 7787 (37%) 647 (26%) 1546 (30%) 2912 (42%) 2682 (40%) 3323 (34%) 3515 (39%) 949 (38%)
Echocardiogram Done 1267 (6%) 16878 (79%) 2107 (85%) 4564 (87%) 4966 (71%) 5241 (79%) 8723 (90%) 6269 (70%) 1886 (73%)
LVEF <40%1267 (6%)
11864 (70% of echocar-diograms)
1476 (70%) 3744 (82%) 2768 (56%) 3876 (74%) 6737 (77%) 3890 (43%) 1237 (66%)
Diagnosis Confirmed1339 (6%)
17969 (84%) 2070 (84%) 4559 (87%) 5684 (82%) 5656 (85%) 8710 (89%) 7212 (80%) 2047 (79%)
Diagnosis Refuted 1986 (9%) 264 (11%) 423 (8%) 724 (10%) 575 (9%) 684 (7%) 1039 (12%) 263 (10%)
Aetiology
IHD 1576 (7%) 9700 (46%) 886 (36%) 2417 (46%) 2797 (40%) 3600 (54%) 4722 (49%) 3911 (44%) 1067 (41%)
Prior MI 2122 (10%) 6306 (30%) 571 (23%) 1734 (33%) 1666 (24%) 2335 (35%) 3302 (34%) 2349 (26%) 655 (25%)
Valve Disease 2153 (10%) 4269 (20%) 510 (21%) 853 (16%) 1522 (22%) 1374 (21%) 2121 (22%) 1691 (19%) 457 (18%)
Hypertension 1570 (7%) 10436 (49%) 1184 (48%) 2280 (44%) 3735 (54%) 3237 (49%) 4570 (47%) 4691 (52%) 1175 (45%)
Diabetes 1121 (6%) 5760 (27%) 837 (34%) 1670 (32%) 1539 (22%) 1714 (26%) 2688 (28%) 2475 (28%) 597 (23%)
Symptoms
Breathless markedly limiting activity
2120 (10%)
8447 (40%) 1017 (41%) 2156 (41%) 2595 (37%) 2679 (40%) 4144 (43%) 3447 (38%) 856 (33%)
Breathless at rest or minor activity
5928 (28%) 633 (26%) 1269 (24%) 2075 (30%) 1951 (29%) 2552 (26%) 2679 (30%) 679 (26%)
Moderate or Severe Oedema
2806 (13%) 9230 (43%) 1001 (40%) 2117 (41%) 3049 (44%) 3063 (46%) 4141 (43%) 4000 (45%) 1089 (42%)
Appendix 2: Returned Analysis
29Copyright © 2010, The NHS Information Centre, National Heart Failure Audit 2010. All rights reserved.
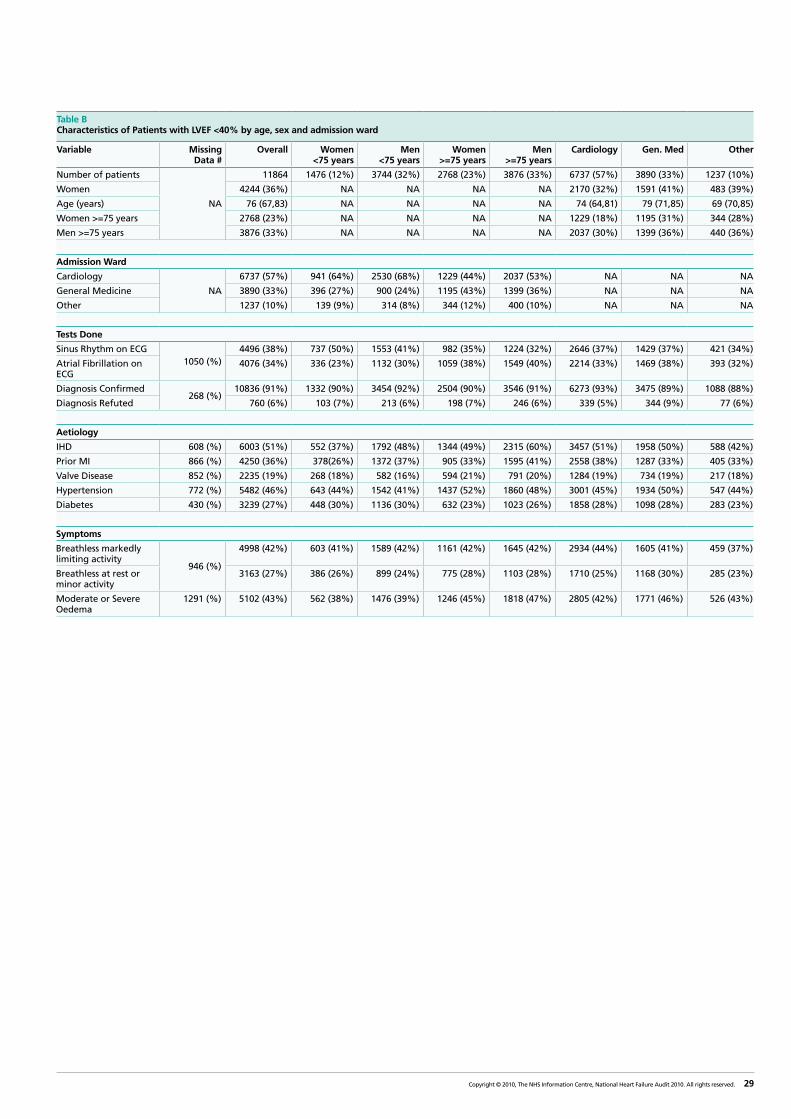
Table B Characteristics of Patients with LVEF <40% by age, sex and admission ward
Variable Missing Data #
Overall Women <75 years
Men <75 years
Women >=75 years
Men >=75 years
Cardiology Gen. Med Other
Number of patients
NA
11864 1476 (12%) 3744 (32%) 2768 (23%) 3876 (33%) 6737 (57%) 3890 (33%) 1237 (10%)
Women 4244 (36%) NA NA NA NA 2170 (32%) 1591 (41%) 483 (39%)
Age (years) 76 (67,83) NA NA NA NA 74 (64,81) 79 (71,85) 69 (70,85)
Women >=75 years 2768 (23%) NA NA NA NA 1229 (18%) 1195 (31%) 344 (28%)
Men >=75 years 3876 (33%) NA NA NA NA 2037 (30%) 1399 (36%) 440 (36%)
Admission Ward
Cardiology
NA
6737 (57%) 941 (64%) 2530 (68%) 1229 (44%) 2037 (53%) NA NA NA
General Medicine 3890 (33%) 396 (27%) 900 (24%) 1195 (43%) 1399 (36%) NA NA NA
Other 1237 (10%) 139 (9%) 314 (8%) 344 (12%) 400 (10%) NA NA NA
Tests Done
Sinus Rhythm on ECG1050 (%)
4496 (38%) 737 (50%) 1553 (41%) 982 (35%) 1224 (32%) 2646 (37%) 1429 (37%) 421 (34%)
Atrial Fibrillation on ECG
4076 (34%) 336 (23%) 1132 (30%) 1059 (38%) 1549 (40%) 2214 (33%) 1469 (38%) 393 (32%)
Diagnosis Confirmed268 (%)
10836 (91%) 1332 (90%) 3454 (92%) 2504 (90%) 3546 (91%) 6273 (93%) 3475 (89%) 1088 (88%)
Diagnosis Refuted 760 (6%) 103 (7%) 213 (6%) 198 (7%) 246 (6%) 339 (5%) 344 (9%) 77 (6%)
Aetiology
IHD 608 (%) 6003 (51%) 552 (37%) 1792 (48%) 1344 (49%) 2315 (60%) 3457 (51%) 1958 (50%) 588 (42%)
Prior MI 866 (%) 4250 (36%) 378(26%) 1372 (37%) 905 (33%) 1595 (41%) 2558 (38%) 1287 (33%) 405 (33%)
Valve Disease 852 (%) 2235 (19%) 268 (18%) 582 (16%) 594 (21%) 791 (20%) 1284 (19%) 734 (19%) 217 (18%)
Hypertension 772 (%) 5482 (46%) 643 (44%) 1542 (41%) 1437 (52%) 1860 (48%) 3001 (45%) 1934 (50%) 547 (44%)
Diabetes 430 (%) 3239 (27%) 448 (30%) 1136 (30%) 632 (23%) 1023 (26%) 1858 (28%) 1098 (28%) 283 (23%)
Symptoms
Breathless markedly limiting activity
946 (%)
4998 (42%) 603 (41%) 1589 (42%) 1161 (42%) 1645 (42%) 2934 (44%) 1605 (41%) 459 (37%)
Breathless at rest or minor activity
3163 (27%) 386 (26%) 899 (24%) 775 (28%) 1103 (28%) 1710 (25%) 1168 (30%) 285 (23%)
Moderate or Severe Oedema
1291 (%) 5102 (43%) 562 (38%) 1476 (39%) 1246 (45%) 1818 (47%) 2805 (42%) 1771 (46%) 526 (43%)
30 Copyright © 2010, The NHS Information Centre, National Heart Failure Audit 2010. All rights reserved.
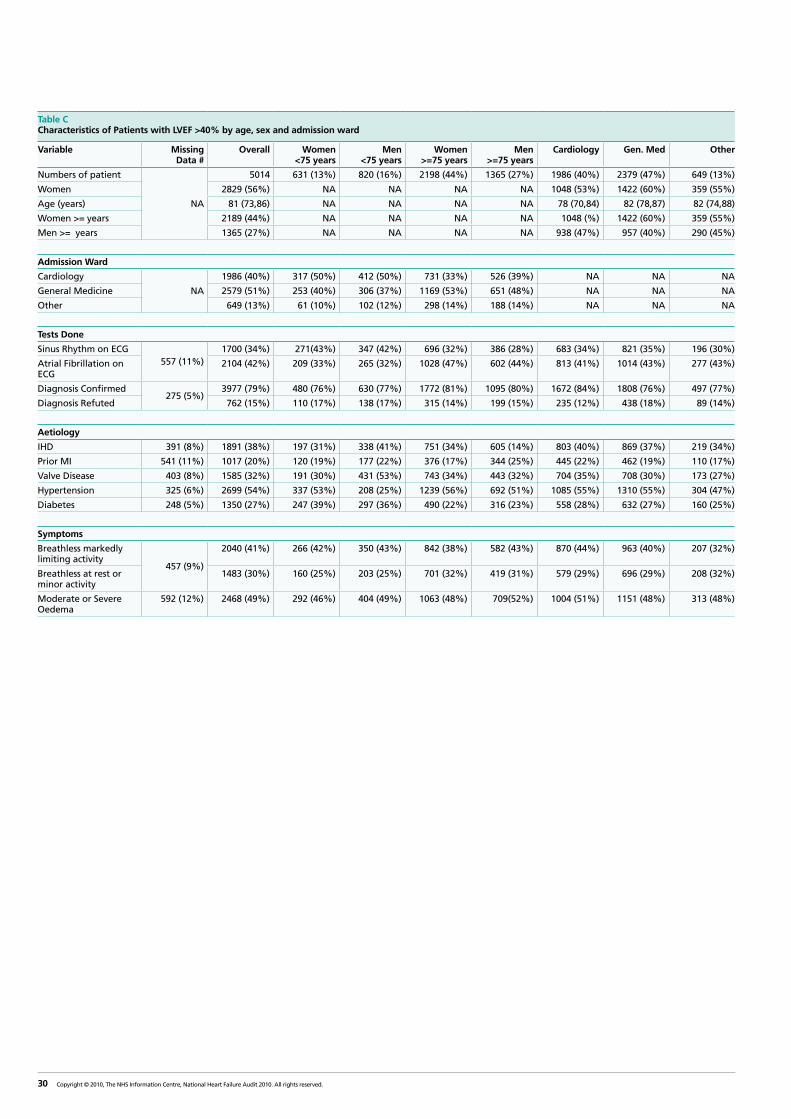
Table C Characteristics of Patients with LVEF >40% by age, sex and admission ward
Variable Missing Data #
Overall Women <75 years
Men <75 years
Women >=75 years
Men >=75 years
Cardiology Gen. Med Other
Numbers of patient
NA
5014 631 (13%) 820 (16%) 2198 (44%) 1365 (27%) 1986 (40%) 2379 (47%) 649 (13%)
Women 2829 (56%) NA NA NA NA 1048 (53%) 1422 (60%) 359 (55%)
Age (years) 81 (73,86) NA NA NA NA 78 (70,84) 82 (78,87) 82 (74,88)
Women >= years 2189 (44%) NA NA NA NA 1048 (%) 1422 (60%) 359 (55%)
Men >= years 1365 (27%) NA NA NA NA 938 (47%) 957 (40%) 290 (45%)
Admission Ward
Cardiology
NA
1986 (40%) 317 (50%) 412 (50%) 731 (33%) 526 (39%) NA NA NA
General Medicine 2579 (51%) 253 (40%) 306 (37%) 1169 (53%) 651 (48%) NA NA NA
Other 649 (13%) 61 (10%) 102 (12%) 298 (14%) 188 (14%) NA NA NA
Tests Done
Sinus Rhythm on ECG557 (11%)
1700 (34%) 271(43%) 347 (42%) 696 (32%) 386 (28%) 683 (34%) 821 (35%) 196 (30%)
Atrial Fibrillation on ECG
2104 (42%) 209 (33%) 265 (32%) 1028 (47%) 602 (44%) 813 (41%) 1014 (43%) 277 (43%)
Diagnosis Confirmed275 (5%)
3977 (79%) 480 (76%) 630 (77%) 1772 (81%) 1095 (80%) 1672 (84%) 1808 (76%) 497 (77%)
Diagnosis Refuted 762 (15%) 110 (17%) 138 (17%) 315 (14%) 199 (15%) 235 (12%) 438 (18%) 89 (14%)
Aetiology
IHD 391 (8%) 1891 (38%) 197 (31%) 338 (41%) 751 (34%) 605 (14%) 803 (40%) 869 (37%) 219 (34%)
Prior MI 541 (11%) 1017 (20%) 120 (19%) 177 (22%) 376 (17%) 344 (25%) 445 (22%) 462 (19%) 110 (17%)
Valve Disease 403 (8%) 1585 (32%) 191 (30%) 431 (53%) 743 (34%) 443 (32%) 704 (35%) 708 (30%) 173 (27%)
Hypertension 325 (6%) 2699 (54%) 337 (53%) 208 (25%) 1239 (56%) 692 (51%) 1085 (55%) 1310 (55%) 304 (47%)
Diabetes 248 (5%) 1350 (27%) 247 (39%) 297 (36%) 490 (22%) 316 (23%) 558 (28%) 632 (27%) 160 (25%)
Symptoms
Breathless markedly limiting activity
457 (9%)
2040 (41%) 266 (42%) 350 (43%) 842 (38%) 582 (43%) 870 (44%) 963 (40%) 207 (32%)
Breathless at rest or minor activity
1483 (30%) 160 (25%) 203 (25%) 701 (32%) 419 (31%) 579 (29%) 696 (29%) 208 (32%)
Moderate or Severe Oedema
592 (12%) 2468 (49%) 292 (46%) 404 (49%) 1063 (48%) 709(52%) 1004 (51%) 1151 (48%) 313 (48%)
31Copyright © 2010, The NHS Information Centre, National Heart Failure Audit 2010. All rights reserved.
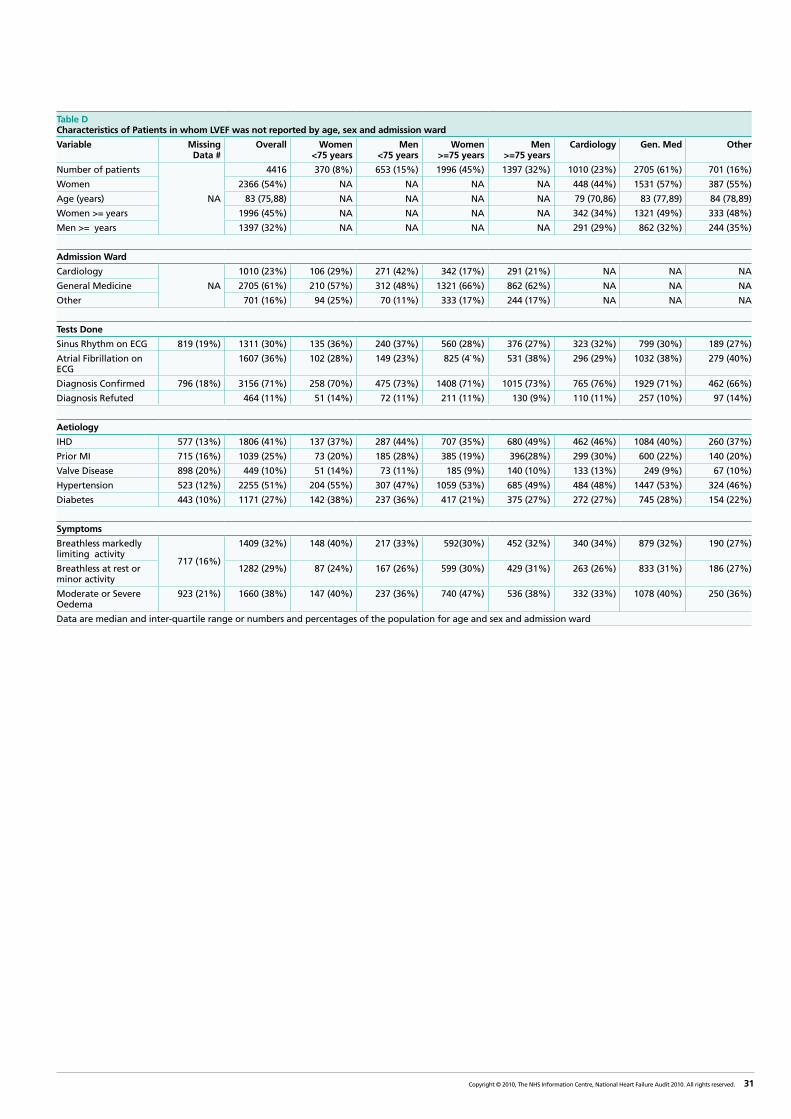
Table D Characteristics of Patients in whom LVEF was not reported by age, sex and admission ward
Variable Missing Data #
Overall Women <75 years
Men <75 years
Women >=75 years
Men >=75 years
Cardiology Gen. Med Other
Number of patients
NA
4416 370 (8%) 653 (15%) 1996 (45%) 1397 (32%) 1010 (23%) 2705 (61%) 701 (16%)
Women 2366 (54%) NA NA NA NA 448 (44%) 1531 (57%) 387 (55%)
Age (years) 83 (75,88) NA NA NA NA 79 (70,86) 83 (77,89) 84 (78,89)
Women >= years 1996 (45%) NA NA NA NA 342 (34%) 1321 (49%) 333 (48%)
Men >= years 1397 (32%) NA NA NA NA 291 (29%) 862 (32%) 244 (35%)
Admission Ward
Cardiology
NA
1010 (23%) 106 (29%) 271 (42%) 342 (17%) 291 (21%) NA NA NA
General Medicine 2705 (61%) 210 (57%) 312 (48%) 1321 (66%) 862 (62%) NA NA NA
Other 701 (16%) 94 (25%) 70 (11%) 333 (17%) 244 (17%) NA NA NA
Tests Done
Sinus Rhythm on ECG 819 (19%) 1311 (30%) 135 (36%) 240 (37%) 560 (28%) 376 (27%) 323 (32%) 799 (30%) 189 (27%)
Atrial Fibrillation on ECG
1607 (36%) 102 (28%) 149 (23%) 825 (4`%) 531 (38%) 296 (29%) 1032 (38%) 279 (40%)
Diagnosis Confirmed 796 (18%) 3156 (71%) 258 (70%) 475 (73%) 1408 (71%) 1015 (73%) 765 (76%) 1929 (71%) 462 (66%)
Diagnosis Refuted 464 (11%) 51 (14%) 72 (11%) 211 (11%) 130 (9%) 110 (11%) 257 (10%) 97 (14%)
Aetiology
IHD 577 (13%) 1806 (41%) 137 (37%) 287 (44%) 707 (35%) 680 (49%) 462 (46%) 1084 (40%) 260 (37%)
Prior MI 715 (16%) 1039 (25%) 73 (20%) 185 (28%) 385 (19%) 396(28%) 299 (30%) 600 (22%) 140 (20%)
Valve Disease 898 (20%) 449 (10%) 51 (14%) 73 (11%) 185 (9%) 140 (10%) 133 (13%) 249 (9%) 67 (10%)
Hypertension 523 (12%) 2255 (51%) 204 (55%) 307 (47%) 1059 (53%) 685 (49%) 484 (48%) 1447 (53%) 324 (46%)
Diabetes 443 (10%) 1171 (27%) 142 (38%) 237 (36%) 417 (21%) 375 (27%) 272 (27%) 745 (28%) 154 (22%)
Symptoms
Breathless markedly limiting activity
717 (16%)
1409 (32%) 148 (40%) 217 (33%) 592(30%) 452 (32%) 340 (34%) 879 (32%) 190 (27%)
Breathless at rest or minor activity
1282 (29%) 87 (24%) 167 (26%) 599 (30%) 429 (31%) 263 (26%) 833 (31%) 186 (27%)
Moderate or Severe Oedema
923 (21%) 1660 (38%) 147 (40%) 237 (36%) 740 (47%) 536 (38%) 332 (33%) 1078 (40%) 250 (36%)
Data are median and inter-quartile range or numbers and percentages of the population for age and sex and admission ward
32 Copyright © 2010, The NHS Information Centre, National Heart Failure Audit 2010. All rights reserved.
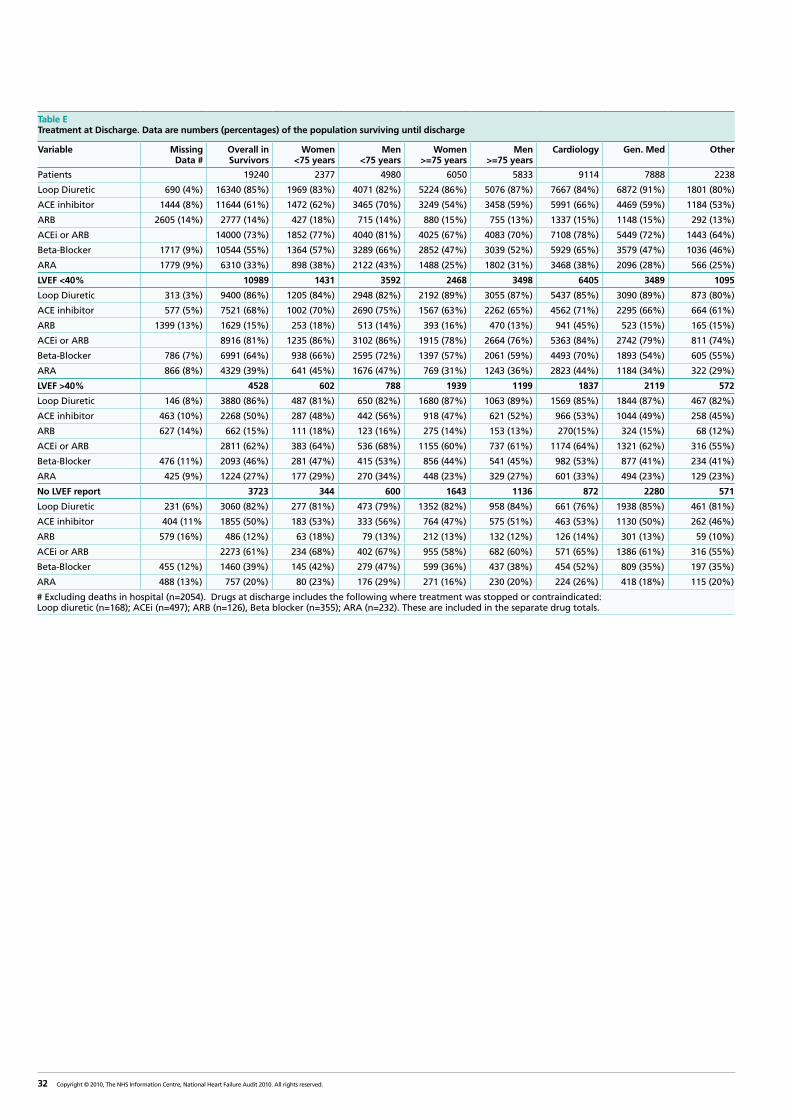
Table ETreatment at Discharge. Data are numbers (percentages) of the population surviving until discharge
Variable Missing Data #
Overall in Survivors
Women <75 years
Men <75 years
Women >=75 years
Men >=75 years
Cardiology Gen. Med Other
Patients 19240 2377 4980 6050 5833 9114 7888 2238
Loop Diuretic 690 (4%) 16340 (85%) 1969 (83%) 4071 (82%) 5224 (86%) 5076 (87%) 7667 (84%) 6872 (91%) 1801 (80%)
ACE inhibitor 1444 (8%) 11644 (61%) 1472 (62%) 3465 (70%) 3249 (54%) 3458 (59%) 5991 (66%) 4469 (59%) 1184 (53%)
ARB 2605 (14%) 2777 (14%) 427 (18%) 715 (14%) 880 (15%) 755 (13%) 1337 (15%) 1148 (15%) 292 (13%)
ACEi or ARB 14000 (73%) 1852 (77%) 4040 (81%) 4025 (67%) 4083 (70%) 7108 (78%) 5449 (72%) 1443 (64%)
Beta-Blocker 1717 (9%) 10544 (55%) 1364 (57%) 3289 (66%) 2852 (47%) 3039 (52%) 5929 (65%) 3579 (47%) 1036 (46%)
ARA 1779 (9%) 6310 (33%) 898 (38%) 2122 (43%) 1488 (25%) 1802 (31%) 3468 (38%) 2096 (28%) 566 (25%)
LVEF <40% 10989 1431 3592 2468 3498 6405 3489 1095
Loop Diuretic 313 (3%) 9400 (86%) 1205 (84%) 2948 (82%) 2192 (89%) 3055 (87%) 5437 (85%) 3090 (89%) 873 (80%)
ACE inhibitor 577 (5%) 7521 (68%) 1002 (70%) 2690 (75%) 1567 (63%) 2262 (65%) 4562 (71%) 2295 (66%) 664 (61%)
ARB 1399 (13%) 1629 (15%) 253 (18%) 513 (14%) 393 (16%) 470 (13%) 941 (45%) 523 (15%) 165 (15%)
ACEi or ARB 8916 (81%) 1235 (86%) 3102 (86%) 1915 (78%) 2664 (76%) 5363 (84%) 2742 (79%) 811 (74%)
Beta-Blocker 786 (7%) 6991 (64%) 938 (66%) 2595 (72%) 1397 (57%) 2061 (59%) 4493 (70%) 1893 (54%) 605 (55%)
ARA 866 (8%) 4329 (39%) 641 (45%) 1676 (47%) 769 (31%) 1243 (36%) 2823 (44%) 1184 (34%) 322 (29%)
LVEF >40% 4528 602 788 1939 1199 1837 2119 572
Loop Diuretic 146 (8%) 3880 (86%) 487 (81%) 650 (82%) 1680 (87%) 1063 (89%) 1569 (85%) 1844 (87%) 467 (82%)
ACE inhibitor 463 (10%) 2268 (50%) 287 (48%) 442 (56%) 918 (47%) 621 (52%) 966 (53%) 1044 (49%) 258 (45%)
ARB 627 (14%) 662 (15%) 111 (18%) 123 (16%) 275 (14%) 153 (13%) 270(15%) 324 (15%) 68 (12%)
ACEi or ARB 2811 (62%) 383 (64%) 536 (68%) 1155 (60%) 737 (61%) 1174 (64%) 1321 (62%) 316 (55%)
Beta-Blocker 476 (11%) 2093 (46%) 281 (47%) 415 (53%) 856 (44%) 541 (45%) 982 (53%) 877 (41%) 234 (41%)
ARA 425 (9%) 1224 (27%) 177 (29%) 270 (34%) 448 (23%) 329 (27%) 601 (33%) 494 (23%) 129 (23%)
No LVEF report 3723 344 600 1643 1136 872 2280 571
Loop Diuretic 231 (6%) 3060 (82%) 277 (81%) 473 (79%) 1352 (82%) 958 (84%) 661 (76%) 1938 (85%) 461 (81%)
ACE inhibitor 404 (11% 1855 (50%) 183 (53%) 333 (56%) 764 (47%) 575 (51%) 463 (53%) 1130 (50%) 262 (46%)
ARB 579 (16%) 486 (12%) 63 (18%) 79 (13%) 212 (13%) 132 (12%) 126 (14%) 301 (13%) 59 (10%)
ACEi or ARB 2273 (61%) 234 (68%) 402 (67%) 955 (58%) 682 (60%) 571 (65%) 1386 (61%) 316 (55%)
Beta-Blocker 455 (12%) 1460 (39%) 145 (42%) 279 (47%) 599 (36%) 437 (38%) 454 (52%) 809 (35%) 197 (35%)
ARA 488 (13%) 757 (20%) 80 (23%) 176 (29%) 271 (16%) 230 (20%) 224 (26%) 418 (18%) 115 (20%)
# Excluding deaths in hospital (n=2054). Drugs at discharge includes the following where treatment was stopped or contraindicated: Loop diuretic (n=168); ACEi (n=497); ARB (n=126), Beta blocker (n=355); ARA (n=232). These are included in the separate drug totals.
33Copyright © 2010, The NHS Information Centre, National Heart Failure Audit 2010. All rights reserved.
Appendix 3: Kaplan Meier Mortality Analyses
a. Overall survival in post-discharge patients. Median follow-up =133 days (IQR=54,232 days)
95% CI Survivor function
Cumulative survival 1
.75
.5
.25
0 90 180 270 360
Survival time (days)
b. Survival in post-discharge patients by age group
55-64 years 65-74 years 75-84 years >=85 years
Cumulative survival 1
.75
.5
.25
0 90 180 270 360
Survival time (days)
34 Copyright © 2010, The NHS Information Centre, National Heart Failure Audit 2010. All rights reserved.
c. Survival in post-discharge patients by sex.
Men Women
Cumulative survival 1
.75
.5
.25
0 90 180 270 360
Survival time (days)
d. Survival in post-discharge patients by LVEF
LVEF>=40% LVEF<40% Echo not recorded
Cumulative survival 1
.75
.5
.25
0 90 180 270 360
Survival time (days)
35Copyright © 2010, The NHS Information Centre, National Heart Failure Audit 2010. All rights reserved.
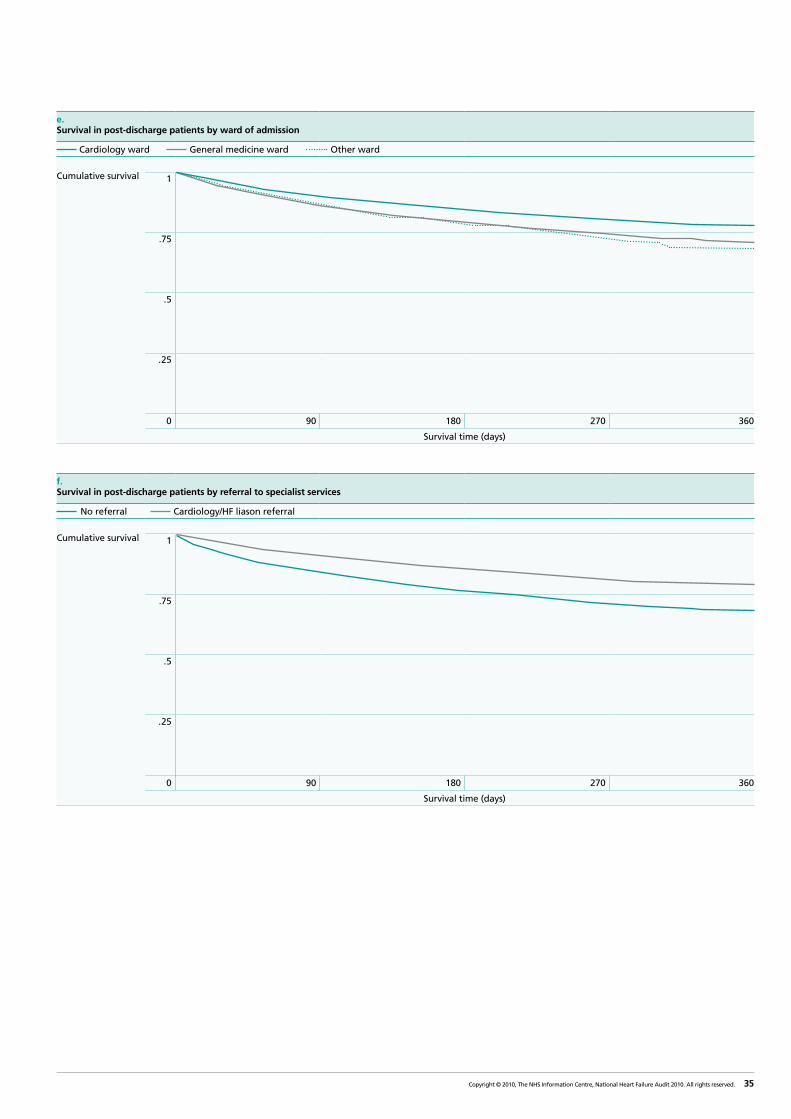
e. Survival in post-discharge patients by ward of admission
Cardiology ward General medicine ward Other ward
Cumulative survival 1
.75
.5
.25
0 90 180 270 360
Survival time (days)
f. Survival in post-discharge patients by referral to specialist services
No referral Cardiology/HF liason referral
Cumulative survival 1
.75
.5
.25
0 90 180 270 360
Survival time (days)
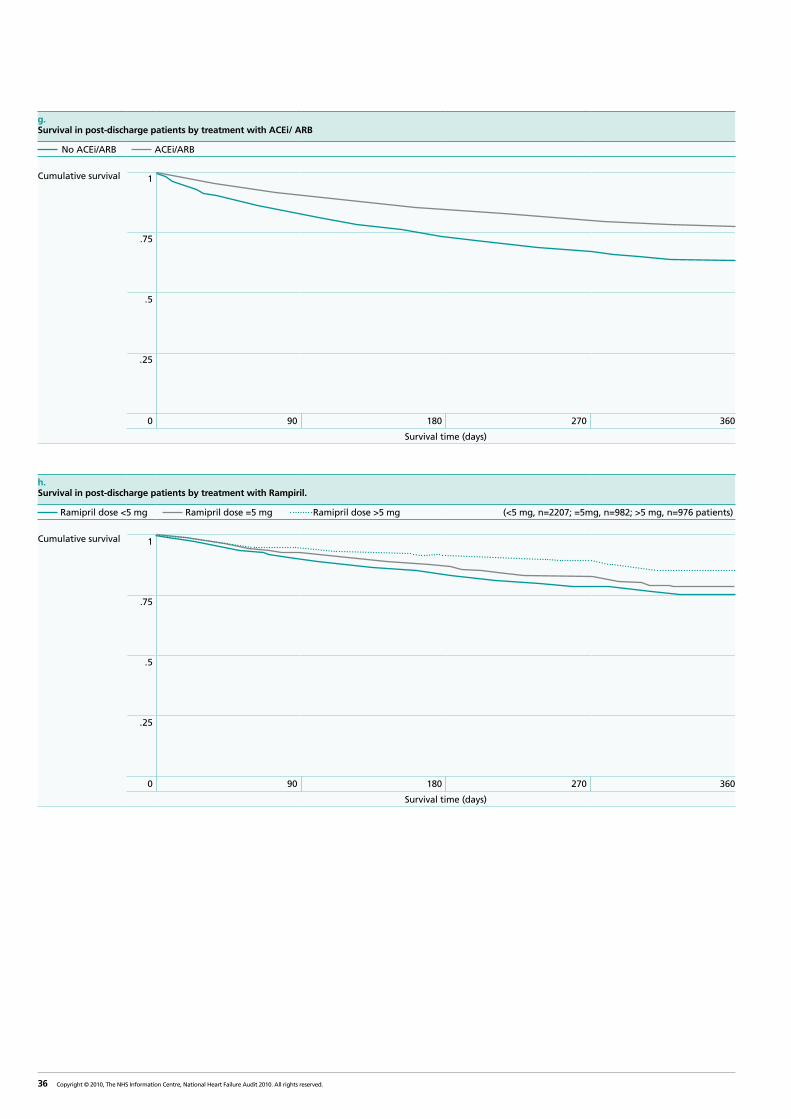
36 Copyright © 2010, The NHS Information Centre, National Heart Failure Audit 2010. All rights reserved.
g. Survival in post-discharge patients by treatment with ACEi/ ARB
No ACEi/ARB ACEi/ARB
Cumulative survival 1
.75
.5
.25
0 90 180 270 360
Survival time (days)
h. Survival in post-discharge patients by treatment with Rampiril.
Ramipril dose <5 mg Ramipril dose =5 mg Ramipril dose >5 mg (<5 mg, n=2207; =5mg, n=982; >5 mg, n=976 patients)
Cumulative survival 1
.75
.5
.25
0 90 180 270 360
Survival time (days)
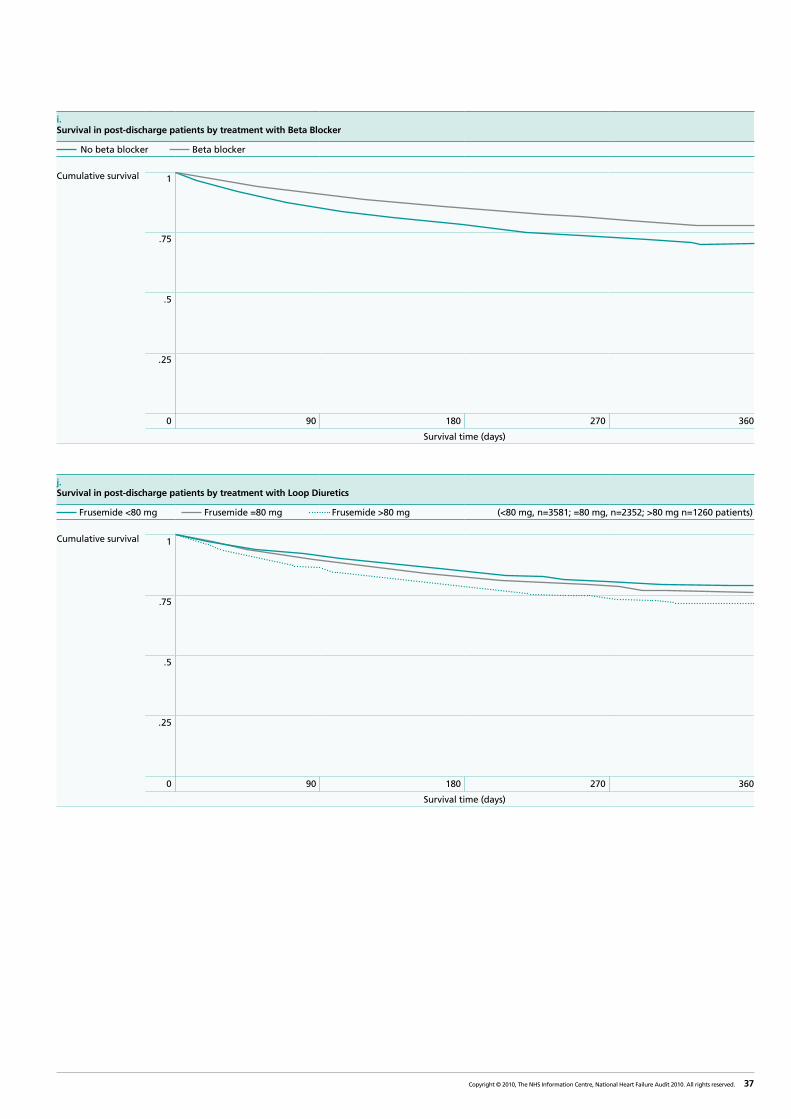
37Copyright © 2010, The NHS Information Centre, National Heart Failure Audit 2010. All rights reserved.
i. Survival in post-discharge patients by treatment with Beta Blocker
No beta blocker Beta blocker
Cumulative survival 1
.75
.5
.25
0 90 180 270 360
Survival time (days)
j. Survival in post-discharge patients by treatment with Loop Diuretics
Frusemide <80 mg Frusemide =80 mg Frusemide >80 mg (<80 mg, n=3581; =80 mg, n=2352; >80 mg n=1260 patients)
Cumulative survival 1
.75
.5
.25
0 90 180 270 360
Survival time (days)
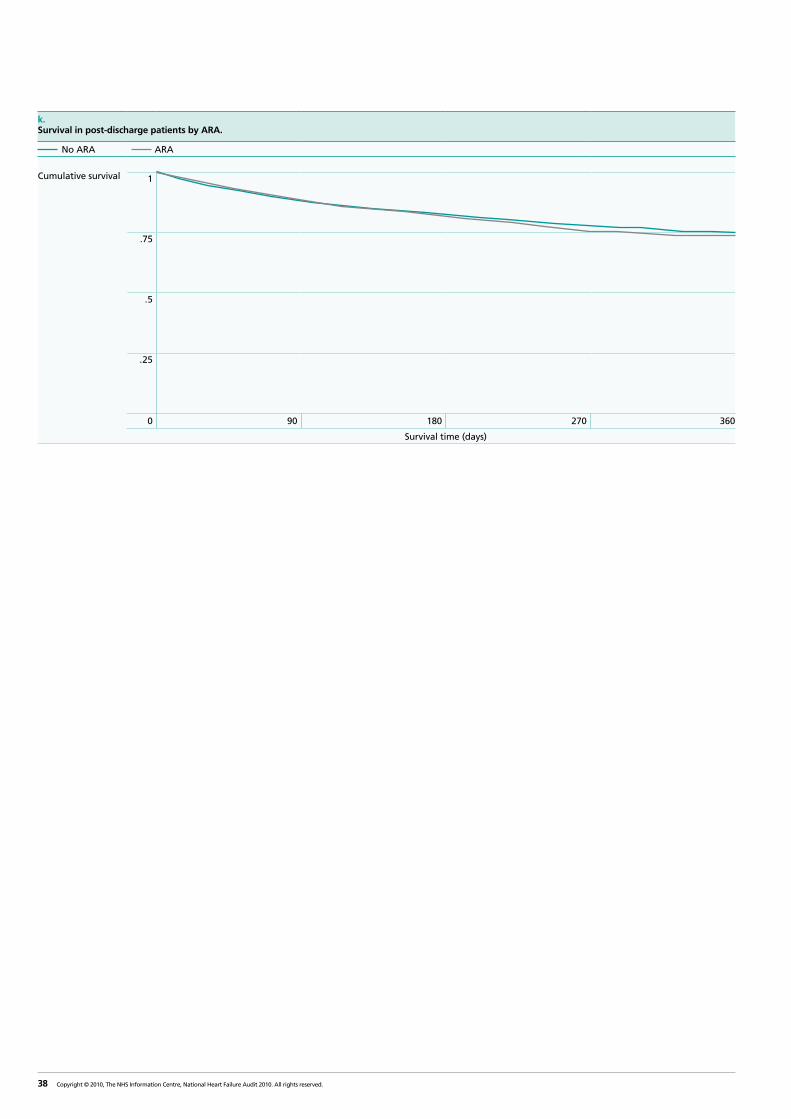
38 Copyright © 2010, The NHS Information Centre, National Heart Failure Audit 2010. All rights reserved.
k. Survival in post-discharge patients by ARA.
No ARA ARA
Cumulative survival 1
.75
.5
.25
0 90 180 270 360
Survival time (days)

The Information Centre for health and social care (The IC) is working to make information more relevant and accessible to the public, regulators, health and social care professionals and policy makers, leading to improvements in knowledge and efficiency.
The IC is a special NHS health authority that collects, analyses and distributes data to reduce the burden on frontline staff, releasing more time for direct care.
This work remains the sole and exclusive property of The IC and may only be reproduced where there is explicit reference to the ownership of The IC. This work may be re-used by NHS and government organisations without permission. Commercial re-use of this work must be granted by The IC.
Copyright © 2010. The Information Centre, National Heart Failure Audit. All rights reserved.
Ref: IC17110110
Need to know more?T. 0845 300 6016 E. [email protected] www.ic.nhs.uk
The NHS Information Centre for health and social care 1 Trevelyan Square Boar Lane Leeds LS1 6AE


![Heart failure: A national health priority · 2017-10-27 · National Heart Failure Audit 2013/14 Annual Report [online] 2014. Last accessed: November 2015 This programme has been](https://img.pdfslide.us/doc/110x75/5f6d858cdb4004581d7a5359/heart-failure-a-national-health-priority-2017-10-27-national-heart-failure-audit.jpg)