Embed Size (px)
Citation preview

Federal Ministry of Health
National Health Adaptation Plan to Climate Change
(2018-2020)
January, 2018
Addis Ababa, Ethiopia
National Health Adaptation to Climate Change
Page | i
Acknowledgement
The FMOH expresses its gratitude to WHO/DFID in initiating this project, providing close technical
support by recruiting technical assistant and providing financial assistance in developing this H-NAP
and the preceding National Framework and Health Vulnerability and Adaptation Assessment report
which were inputs to develop the H-NAP. FMOH also expresses its deep gratitude goes to health
leadership including respective regional health bureau heads and deputy heads for their valuable
comment on the draft of this H-NAP. FMOH also acknowledge the contribution of regional health
bureau experts in further developing this H-NAP by discussing its draft and forwarding constructive
comments. Finally, we express our appreciation to the following national climate change and health
technical working group members and their affiliated organizations for their frequent discussions and
comments in developing this H-NAP.
Abate Benti FMOH
Aychew Agegnehu FMOLSA
Balew Yibel FMOWIE
Alem Mekonen PHE-Ethiopia
Dagnew Tadess FMOH
Dr. Kebede Etana FMOH
Elzabeth Debebe FMOH
Fikadu Sahle FMOUDHC
Tolessa Benti FMOANR
Goitom G/medhin WHO/FMOH
Hamsalegenet W/senbet FMOEFCC
Adino Eyassu FMOI
Zelalem Kebede FMOYS
Osman Yeha WHO/FMOWIE
Samson Wakuma AAU
Waltaji Terfa WHO
Yared Tadesse FMOH
Misganaw Tewachew FMOH
Abireham Misganaw FMOH
Dr. Zufan Abera FMOH

National Health Adaptation to Climate Change
Page | ii
Acronyms
AWD Acute Watery Diarrhoea
BPR Business Process Re-engineering
CLTSH Community Led Total Sanitation and Hygiene
CRGE Climate Resilient Green Economy
CSA Central Statistics Agency
COP21 21st Conference of Parties
CRWSP Climate Resilient Water Safety Plan
DHS Demographic and Health Survey
DRMC Disaster Risk Management Commission
EIA Environmental Impact Assessment
EMIS Ethiopia Malaria Indicators Survey
FBD Finance and Procurement Directorate
FDRE Federal Democratic Republic Ethiopia
FEPA Federal Environmental Protection Authority
EPHI Ethiopian Public Health Institute
ESPA+ Ethiopian Service Provision Assessment plus Census
FMOH Federal Ministry of Health
GCMS Gas Chromatography Mass Spectrometry GHGs Green House Gases
GoE Government of Ethiopia
HAPCO HIV/AIDS Prevention and Control Office
HCs Health Centers
HDAs Health Development Armies
HEP Health Extension Programme
HEPHSD Health Extension and Primary Health Service Directorate
HHs Households
HIA Health Insurance Agency
HID Health Infrastructure Directorate
HMIS Health Management Information System
H-NAP Health component of National Adaptation Plan
HPs Health Posts
HRD Human Resource Directorate
HSTP Health Sector Transformation Plan
ICSU International Council for Science
IDSR Integrated Disease Surveillance and Response
ISSC International Social Science Council
IPCC Inter-Governments Panel of Convention on Climate
LLIN Long Lasting Impregnated Net
MoANR Ministry of Agriculture and Natural Resources
MCHD Mother and Child Health Directorate
MDG Millennium Development Goals
MOE Ministry of Education
MoEFCC Ministry of Environment, Forest and Climate Change
MoST Ministry of Science and Technology
MoT Ministry of Transport
Federal Ministry of Health
Page | iii
MoWIE Ministry of Water, Irrigation and Electricity
MoUDH Ministry of Urban Development and Housing
MoYS Ministry of Youth and Sport
MSD Medical Service Directorate
MTOT Master Training of Trainers
NA Not Available
NAPA National Adaptation Programme of Action
NBBS Nation Blood Bank Service
NMA National Metrology Agency
NPC National Planning Commission
PHEM Public Health Emergency Management
PSNP Productive Safety Net Programme
OGCA Office of Government Communication Affairs
RHBs Regional Health Bureaus
SDG Sustainable Development Goals
SLCPs Short-Lived Climate Pollutants
SNNP South Nation, Nationalities and People
SSD Special Service Directorate
TOT Training of Trainers
UN United Nations
UNFCCC United Nations Framework Convention on Climate Change
UNICEF United Nations Children Fund
WaSH Water, Sanitation and Hygiene
WHO World Health Organization
National Health Adaptation Plan to Climate Change
Page | iv
Definitions
A1B: a scenario defined by IPCC 3rd that assume future world economic growth will very rapid,
global population that peaks in mid-century and declines thereafter, and the energy system is
balanced and not relying too heavily on one particular energy source, on the assumption that similar
improvement rates apply to all energy supply and end-use technologies
Adaptation: adjustments in human and natural systems in response to actual or expected climatic
variation, with a view to moderating harm or exploiting beneficial opportunities
Building codes: series of ordinances enacted by a state or local governmental entity
by establishing minimum requirements that must be met in the construction and maintenance of
buildings.
Climate Change: changes in climate characteristics, including temperature, humidity, rainfall, wind,
and severe weather events over long term periods
Climate Sensitive Diseases: diseases which fluctuates with climate variability
Gas chromatography mass spectrometry (GCMS): is an analytical method that combines the
features of gas-chromatography and mass spectrometry to identify different substances within a test
sample. GCMs estimates of mean annual precipitation and temperature and the standard deviation of
annual precipitation are compared against observed estimates.
Faeco-Oral Transmission: is a route of transmission of a disease, when pathogens in fecal particles
passing from one host are introduced into the oral cavity of another host.
Global Warming: the overall warming of the planet, based on average temperature over the entire
surface of the Earth
Heat Stress: When the body is unable to cool itself by sweating, several heat-induced illnesses such
as heat cramps, heat exhaustion and the more severe heat stroke can occur
Heat Stroke: is the most serious disorder associated with heat stress. It occurs when the body's
temperature regulation fails and body temperature rises to critical levels. It is a medical emergency
that can lead to death
Malnutrition: refers to deficiencies of energy and/or nutrients which includes stunting (low height for age),
wasting (low weight for height), underweight (low weight for age) and micronutrient deficiencies or insufficiencies (a lack of important vitamins and minerals).
Mitigation: efforts to reduce/prevent emission of greenhouse gases (GHGs) or to enhance their
removal from the atmosphere by sinks
Population Pressure: the sum of the factors (as increase in numbers or excessive food consumption)
within a population that reduce the ability of an environment to support the population and that
therefore tend to result in migration and expansion of range or in extinction or decline of the
population
Federal Ministry of Health
Page | v
Resilience: the ability of a social or ecological system to absorb disturbances while retaining the
same basic structure and ways of functioning, the capacity for self-organization, and the capacity to
adapt to stress and change
Stunting: is the impaired growth and development that children experience from poor nutrition,
repeated infection, and inadequate psychosocial stimulation. Children are defined as stunted if their
height-for-age is more than two standard deviations below the WHO Child Growth Standards
median.
Vulnerability: the degree to which a system is susceptible to, and unable to cope with, adverse
effects of climate change, including climate variability and extreme weather
Weather: the fluctuation of temperature, humidity and wind within short period of time

National Health Adaptation Plan to Climate Change
Page | vi
Preface
Climate variability and change is being visible all over the world. The adverse effects of climate
change are all round and top issues globally. If we are not in a position to tackle climate change and
its effect in integrated and cooperative manner, it might ruin the social, economic and political
achievements we gained so far. Climate Resilient Green Economy (CRGE) and other studies revealed
that health sector is one of the top three vulnerable sectors to climate change adverse effects. We also
observed its effects on human health in 2015/2016 while we are responding to El-Ñino posed drought
in our country, Ethiopia. Thus, FMOH developed this Health National Adaptation Plan by
establishing National Technical Working Group from various directorates and agencies of the
ministry, relevant ministries and development partners.
FMOH will implement this Health National Adaptation Plan by mainstreaming to its various
programmes and by strengthening its partnership with relevant line ministries and development
partners. This Health National Adaptation Plan will be implemented with full participation of
communities at grass root level through health extension program using health professionals, health
extension workers and health development armies.
The implementation of this health national adaptation plan will be supported and monitored by
leadership at all levels so that it will be successful in building resilient health sector. So, let’s start to
health adaptation to climate change according to this Health National Adaptation Plan.
Kebede Worku (MD, MPH)
State Minister of Health
Federal Democratic Republic of Ethiopia

Federal Ministry of Health
Page | vii
Table of Content
Content Page
Acknowledgement ................................................................................................................................................. i
Acronyms .............................................................................................................................................................. ii
Definitions............................................................................................................................................................ iv
Preface ................................................................................................................................................................. vi
Executive Summary .............................................................................................................................................. x
1 Background ................................................................................................................................................. 11
2. Introduction ................................................................................................................................................. 12
3 Situational Analysis .................................................................................................................................... 13
3.1 Climate ................................................................................................................................................ 13
3.2 Socio-Economic Situation................................................................................................................... 17
3.2.1 Population pressure ..................................................................................................................... 17
3.2.2 Education .................................................................................................................................... 18
3.2.3 Economy ..................................................................................................................................... 18
3.3 Disasters related to climate change ..................................................................................................... 19
3.4 Health Impacts of Climate Change ..................................................................................................... 22
3.4.1 Malnutrition ................................................................................................................................ 22
3.4.2 Climate sensitive Diseases .......................................................................................................... 22
3.4.3 Respiratory Tract Infections ........................................................................................................ 25
3.4.4 Heat stress ................................................................................................................................... 25
3.5 Physical Infrastructures ....................................................................................................................... 26
3.5.1 Sanitation Facilities ..................................................................................................................... 26
3.5.2 Health Facilities .......................................................................................................................... 26
3.6 Institutional Setup ............................................................................................................................... 28
3.7 Human Resource Development .......................................................................................................... 29
3.8 Enabling Policies, Strategies and Programmes ................................................................................... 30
3.9 Climate Change’s Impact to the Health Sector and Vice Versa ......................................................... 31
3.10 Vulnerable to Health impacts of Climate Change............................................................................... 32
4 Goal ............................................................................................................................................................. 33
National Health Adaptation Plan to Climate Change
Page | viii
5 Strategic Objectives .................................................................................................................................... 33
6 Strategic Approaches .................................................................................................................................. 33
6.1 Mainstreaming climate change adaptation to Health Programmes ..................................................... 33
6.2 Community Mobilization .................................................................................................................... 35
6.3 Strengthening partnership ................................................................................................................... 35
6.4 Strengthening the existing health system ............................................................................................ 36
7 Key Intervention Areas ............................................................................................................................... 37
7.1 Strengthening and Expanding Health Infrastructure ........................................................................... 37
7.2 Strengthening existing Integrated Disease Surveillance and Response .............................................. 38
7.3 Promoting climate resilient Sanitation facilities ................................................................................. 38
7.4 Promoting climate resilient water safety plan ..................................................................................... 38
7.5 Promoting Family planning ................................................................................................................ 39
7.6 Revising building codes of health facilities ........................................................................................ 39
7.7 Promoting climate change mitigation initiatives ................................................................................. 39
7.8 Promoting community health insurance scheme ................................................................................. 40
7.9 Advocating and creating awareness on climate change and health .................................................... 40
7.10 Encouraging operational research on health and climate change ....................................................... 41
8 Targets......................................................................................................................................................... 42
9 Budget ......................................................................................................................................................... 43
10 Resources mobilization ........................................................................................................................... 44
11 Monitoring and Evaluation ..................................................................................................................... 44
11.1 Indicators............................................................................................................................................. 46
26. Prevalence and risk factors of malaria in Ethiopia, Ayele et al, 2012, and retrieved from
https://malariajournal.biomedcentral.com/articles/10.1186/1475-2875-11-195 ............................................ 50
List of Tables
Table 1: Distribution of public health facilities, by region, ESPA+, 2015 ......................................................... 27
Table 2: Public health facilities accessed electricity and improved water sources by region, ESPA+, 2014 ..... 27
Table 3: waste management condition in Sample visited health facilities, ESPA+, 2015 .................................. 28
Table 4: proportion of critical health professionals to population by Region, FMOH, 2017 ............................ 30
Table 5: Activities to be mainstreamed to FMOH Programmes ......................................................................... 34
Table 6: Partners and Tasks to be implemented together with partners............................................................. 35
Table 7: Targets to be achieved in the implementation period ........................................................................... 42
Federal Ministry of Health
Page | ix
List of Figures
Figure 1: Daily Mean Temperature for the year (0c) ........................................................................................... 14
Figure 2: Composite of (Average of 19 GCMs) change in temperature (0c) relative to 1961-1990 normal A1B
emission scenarios .............................................................................................................................................. 15
Figure 3: Mean Annual Temperature Figure 4: Days of Warm Spell ('Heat Waves') ................................ 15
Figure 5: Cumulative Mean Annual Rainfall (mm) ............................................................................................ 16
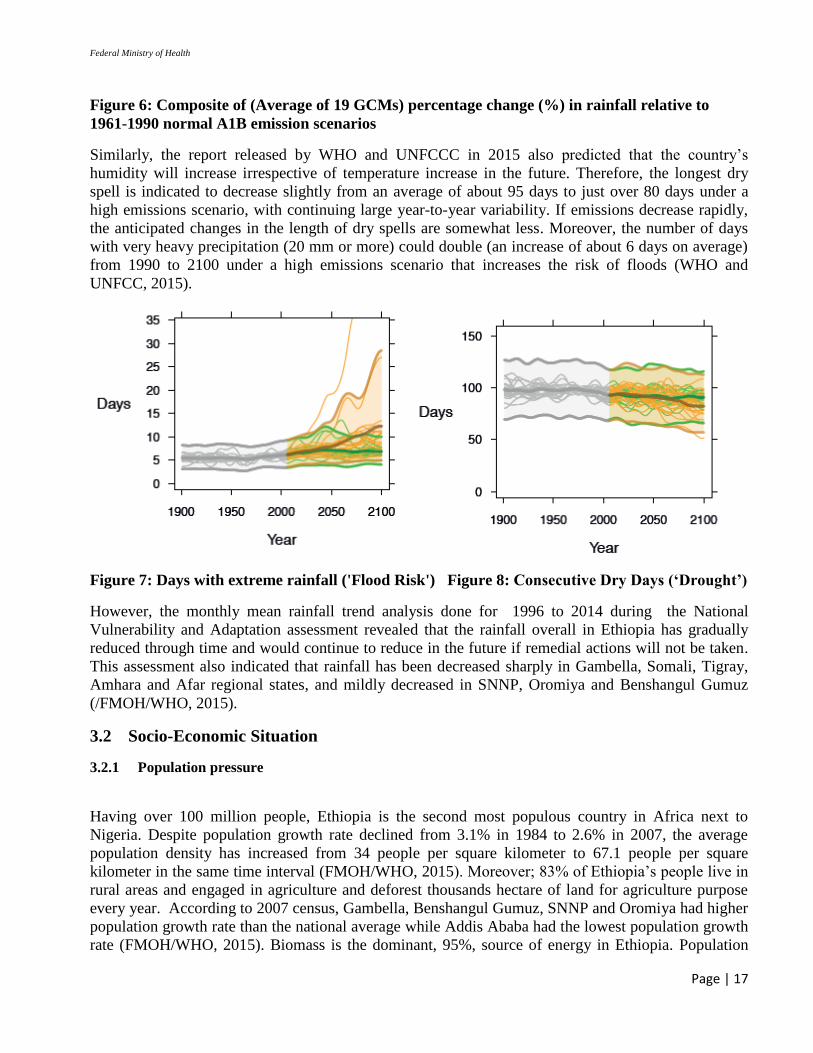
Figure 6: Composite of (Average of 19 GCMs) percentage change (%) in rainfall relative to 1961-1990 normal
A1B emission scenarios ...................................................................................................................................... 17
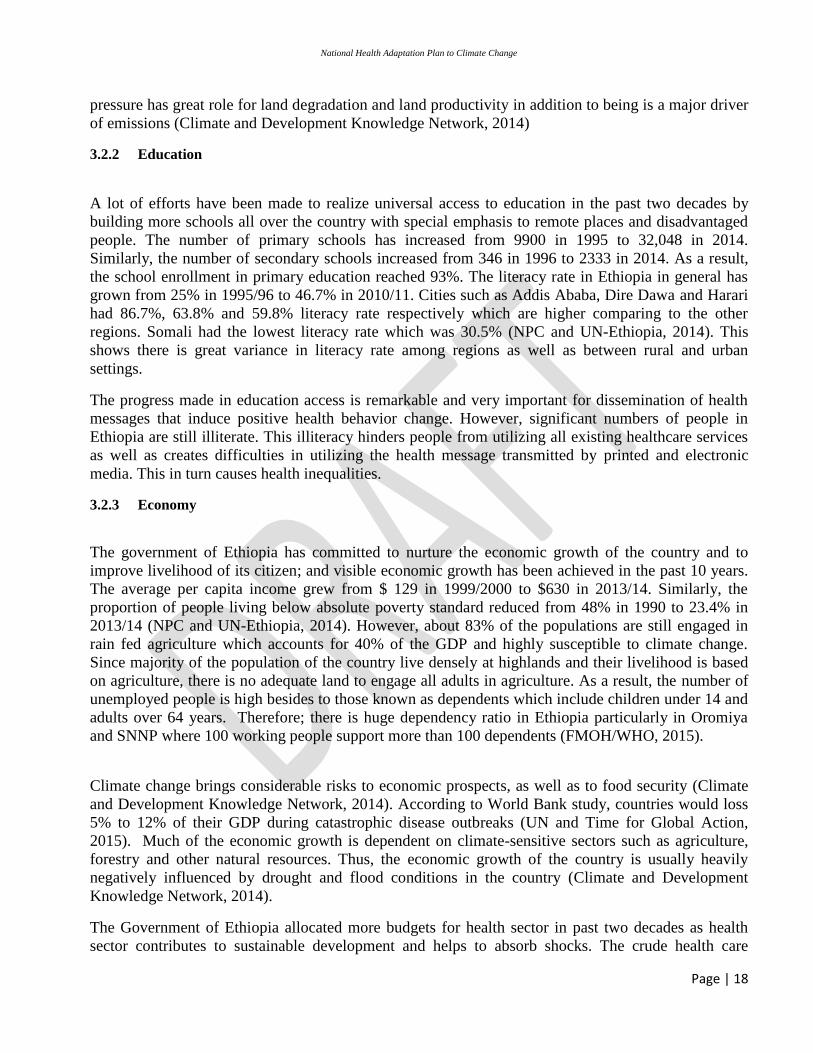
Figure 7: Days with extreme rainfall ('Flood Risk') Figure 8: Consecutive Dry Days (‘Drought’) ........ 17
Figure 9: Flood affected woredas 1973-2007, DRMC Risk Baseline report 2008 ............................................. 20
Figure 10: Drought hazard frequency 1975-2007(Source: DRMC Risk Baseline Report, 2008) ...................... 21
Figure 11: Trends in nutritional status of children (%), CSA, 2014 ................................................................... 22
Figure 12: Integrating the HNAP within the overall NAP Process..................................................................... 29
Figure 13: Logic model of H-NAP implementation and expected results .......................................................... 45
List of Annex
Annex 1: Key Intervention Areas with detail Activity, Target, Time frame and Indicative Budget…... ........... 47
Annex 2: References ........................................................................................................................................... 49
National Health Adaptation to Climate Change
Page | x
Executive Summary
Climate Change is global issue as its effects are catastrophic and all rounds. It affects agriculture, water
sources, transportation and communication, health, life style, etc. Developing countries including
Ethiopia are more vulnerable to climate change affects as they have less capacity to adapt climate change.
Several parts of Ethiopia like south and east Tigray, East Amhara, East Oromiya, Somali and Afar
frequently affected by recurring drought. Similarly, people living aside Lake Tana, Awash River, Baro
River, lower part of Omo River hit by over flow flooding. Moreover, several climate diseases were
occurred and aggravated in the country. Malaria which is climate sensitive disease is expanding to high
lands as high lands temperature gets warm with climate change and being favourable to mosquitoes
breeding. Diahrroea outbrake especially Acute Watery Diarrhoea become frequent following drought and
flood occurrence. Dengue fever cases were reported for the first time in 2014 in Afar, Somali, Harar and
Dire Dawa. Similarly, Yellow fever was also reported in South Omo after 60 years.
The development in Ethiopia brings changes in infrastructure accessibility and peoples thinking. The
accessibility to improved water source, sanitation facilities, health facilities, schools, etc increased. As a
result, the economic and health condition of the country improved. The life expectancy increased as well
as the child mortality rate sharply reduced. However, climate change is a great challenge and may ruin all
the achievements gained unless great and integrated efforts were made to mitigate and adapt climate
change. The Government of Ethiopia launched Climate Resilient Green Economy to avert the threat
posed by climate change and to build sustainable economy. This CRGE acknowledges the health sector is
one of the three most vulnerable sectors together with water and agriculture sectors. Thus, this Health
component of National Adaptation Plan developed.
The overall goal of this health national adaptation plan is to contribute to the main goal of HSTP with
focus on to make sure the health system is climate resilient. It has 4 strategic objectives. And these are
build the capacity of health system for realization of climate resilient health system; enhance the
resilience of health system in provision of universal health coverage; enhance early warning and
surveillance in the context of health emergency risk management; and create enabling environment for
health adaptation to climate change implementation. To implement this HNAP, 6 strategic approaches are
drawn. These are mainstreaming climate change adaptation to health programmes, strengthening
partnership, strengthening existing health delivery system and community mobilization.
The key intervention areas selected to implement HNAP are strengthening and expanding health
infrastructure, strengthening existing Integrated Disease Surveillance and Response, promoting climate
resilient sanitation facilities, promoting climate resilient water safety plan, promoting family planning,
revising building codes of health facilities, Promoting climate change mitigation initiatives, promoting
community health insurance scheme, advocating and creating awareness on climate change and health as
well as encouraging operational research on health and climate change.
This HNAP is drawn to be implemented in 2018 to 2020. Since most HNAP activities will be
mainstreamed to existing initiatives, projects and programmes, the additional budget required is minimal.
Federal Ministry of Health and Regional Health Bureaus will cover 809, 623, 200.00 Birr (47.5 %) of the
total required budget 1, 704, 796, 316.00 Birr.
National Health Adaptation to Climate Change
Page | 11
1 Background
Ethiopia is found in the horn of Africa; and it is the second most populated country in Africa. The
country has nine administrative regions and two city administrations. According World Population
Review, Ethiopia population is estimated to be 104.96 million in 2017. Eighty three percent of the
population live in rural setting and engaged in small-scale rain-fed agriculture while the rest 17% of
the population live in urban areas in a lifestyle which is comparatively less sensitive to climate change.
(CSA, 2007)
The geographical set up of the country is full of up and down with the highest altitude at Ras Dashen
which is 4,533 meters above sea level and with lowest altitude at Dalol depression which is 125 meters
below sea level. The main rainy season is from June to September for major parts of the country.
There is also another rainy season but a light one from February to April for southern part of the
country usually found in Oromiya and SNNP. In Ethiopia, high lands receive more rainfall than
lowlands and arid areas, and support their life through agricultural livelihoods and with dense
population whereas low lands receive minimal rainfall, and people generally support themselves by
raising livestock.
The share of electric grid as means of energy source is only 5% and over 95% of the domestic energy
needs are met from bio-fuels thereby contributing to deforestation, loss of soil nutrients and organic
matter (Aklilu, 2003).Though Ethiopia GHGs emission is insignificant comparing to developed
countries, the main GHGs emitting sectors in Ethiopia are agriculture and forest which contributes to
87% of the total GHGs emission of the country. Moreover, Energy, Transportation, Industry and
buildings contributed equally 3%. However, the main GHG produced in Ethiopia is methane instead of
CO2; and this methane is produced from cattle droppings, decaying organic matters including fallen
down trees and landfill. Methane is known to exist long time as comparing to CO2 (CRGE, 2011).
Recurrent drought and flood are common in Ethiopia. Places where frequently hit by floods are East
Shoa and Afar aside to Awash River, South Omo near to Omo River, Gambella near to Baro River and
Fogera vicinage to Lake Tanna. Similarly, East Amhara, South and East Tigray, Afar, Somali, East
Harargie, West Harargie and Borona of Oromiya are places which are frequently hit by drought. Both
flood and drought are known to cause malnutrition, social disorder and outbreaks of some diseases
such as diarrhea, malaria, Upper Respiratory Tract Infections, meningitis, skin infection, etc.

National Health Adaptation Plan to Climate Change
Page | 12
2. Introduction
The mean global temperature has been increasing due to anthropogenic activities which produced
excess Green House Gases (GHGs). The primary gases which are responsible for greenhouse effect
are Carbon dioxide (CO2), Methane (CH4), Nitrous Oxide (N2O), Hydro-fluorocarbons (HFCs), Per
fluorocarbons (PFCs), Sulphur-hexafluoride (SF6), Nitrogen Trifluoride (NF3) and Water Vapour (
Fact Sheet, Michigan University, 2011). The ever increasing mean global temperature brings climate
change which includes change of ambient temperature, rainfall, wind, etc. Climate change has been
observed since the industry revolution due to human activities and the utilization of fossil fuel as a
source of energy. But, less attention paid to the climate change as there were several assumptions like
nature will balance itself and nothing will happen though greenhouse gases are being increased. Later
on, the ever increasing GHGs concentration in the atmosphere resulted in global warming which in
turn caused climate change and its consequences. Although the impact of climate change is mediated
by ecological, human, social wellbeing and many other factors, the recurring drought and flooding,
the emergence of new diseases and re-emergence of already eliminated diseases, and the aggravation
of existing vector borne, water borne and respiratory infections are among the impacts of climate
change. WHO study shows that 140,000 excess deaths/year and 5 million disability-adjusted life-years
(DALY) since 1970. It also predicted that health impairment annual cost would be $1.5-4 billion by
2030 due to Climate Change. This will incur substantial burden on health services.
Currently, climate change gets high attention globally as its effect challenges both developed and
developing countries though the level of vulnerability differs as the capacity to cope with the effects of
climate change varies from country to country. The emission of GHGs harms not only the emitters but
also non-emitters as there is no boundary for gases movement. Though developed countries emit
excessive GHGs as they use comparatively more fossil fuel, its adverse effects is much more to
developing countries due to their low capacity to cope with. Parties participated at COP21 which held
in Paris discussed health related issues and acknowledged that climate change is a common concern of
humankind, Parties should, when taking action to address climate change, respect, promote and
consider their respective obligations on human rights and the right to health. Furthermore; the adoption
of the Paris agreement on its article 109 recognizes the social, economic and environmental value of
voluntary mitigation actions and their co-benefits for adaptation, health and sustainable development
(UNFCCC, 2015). Moreover, United Nations drew 17 Sustainable Development Goals to be attained
till 2030; and are linked with environmental and social determinants of health (WHO, 2016).
Especially end hunger (Goals 2), Ensure healthy life and well-being (Goal3), Ensure availability and
sustainability of water and sanitation facilities (Goal 6), Ensure access to affordable, reliable,
sustainable and modern energy (Goal 7) and Take urgent action to combat climate change and its
impacts (Goal 13) will contribute a lot to healthy life and climate change mitigation and/or adaptation.
.
Ethiopia has drawn the Climate Resilient Green Economy strategy (CRGE) in 2011 aiming at having a
sustainable and environment friendly economy through improving traits of livestock, undertaking
afforestation and re-afforestation, building and using renewable energy, and making industries energy
efficient. CRGE and other studies have identified the health sector as one of the most vulnerable
sectors to climate change since the disease burden will increase if mitigation of climate change fails.
Thus, developing a health adaptation plan is critical to implement convenient adaptation options in the
health sector.
Federal Ministry of Health
Page | 13
The Federal Ministry of Health of Ethiopia (FMOH) has established technical working group which
work on developing documents that enable the health sector to adapt climate change’s adverse effects.
So far, a document of national framework of building climate resilient health sector has already been
developed as well as the health vulnerability and adaptation assessment report is produced. Based on
these two documents and World Health Organization (WHO) health adaptation guideline, this
National Health Adaptation Plan to Climate Change is developed.
3 Situational Analysis
Ethiopia like other African countries has its urgent need to adapt to climate change stems from its
sensitivity and vulnerability to climate change, together with low levels of capacity to adapt. Health
vulnerability and adaptation assessment has been conducted by reviewing the available documents for
each regional states and city administrations in particular and as a nation in general. A lot of factors
have been considered and data were compared to set health vulnerability index for each regional state
and city administration. The health vulnerability and adaptation assessment findings revealed that
temperature has increased and rainfall has decreased over time in general while access to health
service, sanitation and improved water sources is improved though great variance amongst regions. As
a result, those emerging regions (Somali, Afar, Gambella, and Benshal Gumuz,) are relatively more
vulnerable to climate change posed health outcomes while these cities (Addis Ababa, Dire Dawa and
Harar) are relatively less vulnerable (FMOH/WHO, 2015). The situational analysis made based on the
national health vulnerability and adaptation assessment findings, the country profile prepared and
issued by WHO and UNFCCC in 2015 and other documents summarized as follows:
3.1 Climate
Climate is a composition of temperature, rainfall, wind, humidity, etc. Climate change is a change of
these variables over long period of time usually over 30 years or more. The climate of Ethiopia like
other countries’ climate is being changing. The primary gases responsible for greenhouse effects are
CO2, CH4, N2O, HFCs, PFCs, SF6, NF3 and Water Vapour. These GHGs retain the heat radiation
reflected back from the earth which in return makes the earth warmer. The surface temperature of
Ethiopia has increased by 1.30C only from 1960 to 2006, and is predicted to increase 1.1 to 3.10C by
2060 (The Global Water Initiative, 2010). Depending on the limited Emissions data available for
Ethiopia between 1990 and 1994, the agriculture sector was the largest contributor of carbon emissions
(WHO and UNFCCC, 2015). Both agriculture and forest sectors attribute 87% of the country GHGs
emission (CRGE, 2011).
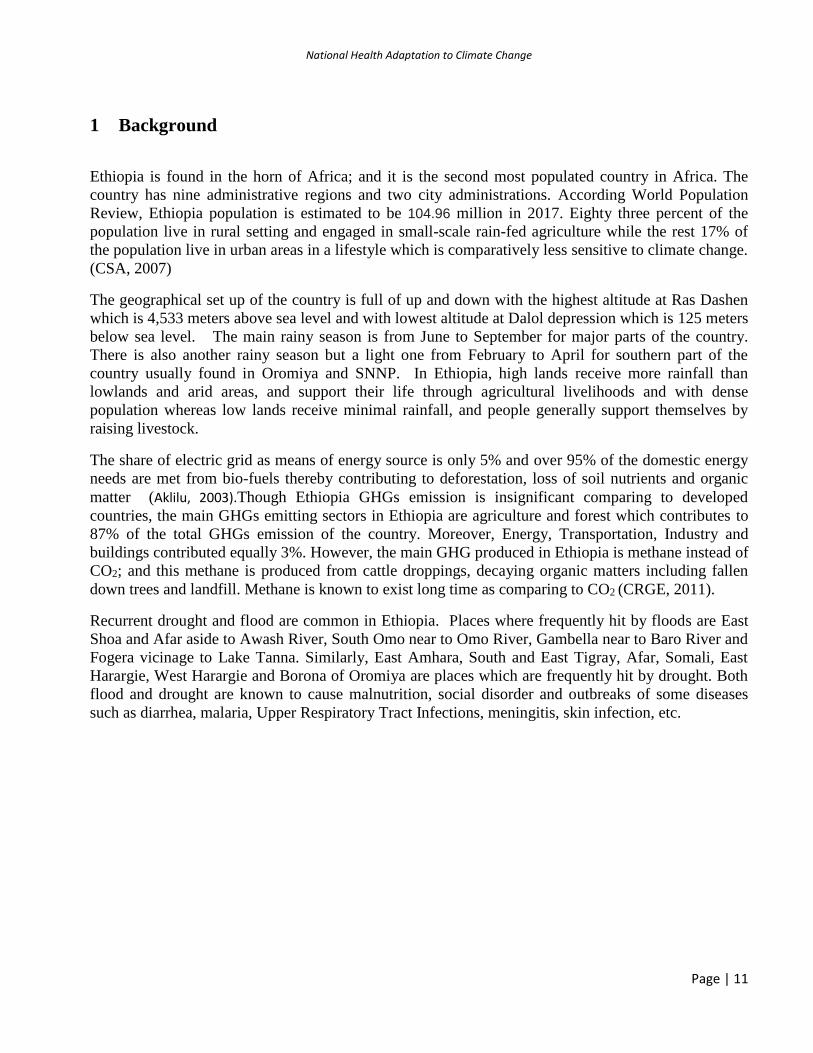
Since the topography of the country is so ragged, from highlands which are mostly located at central
part of the country to lowlands mostly located to eastern and western parts of the country, the mean
daily temperature varies from place to place in Ethiopia. The map below shows the daily mean
temperature of different parts of the country.
National Health Adaptation Plan to Climate Change
Page | 14
Figure 1: Daily Mean Temperature for the year (0c)
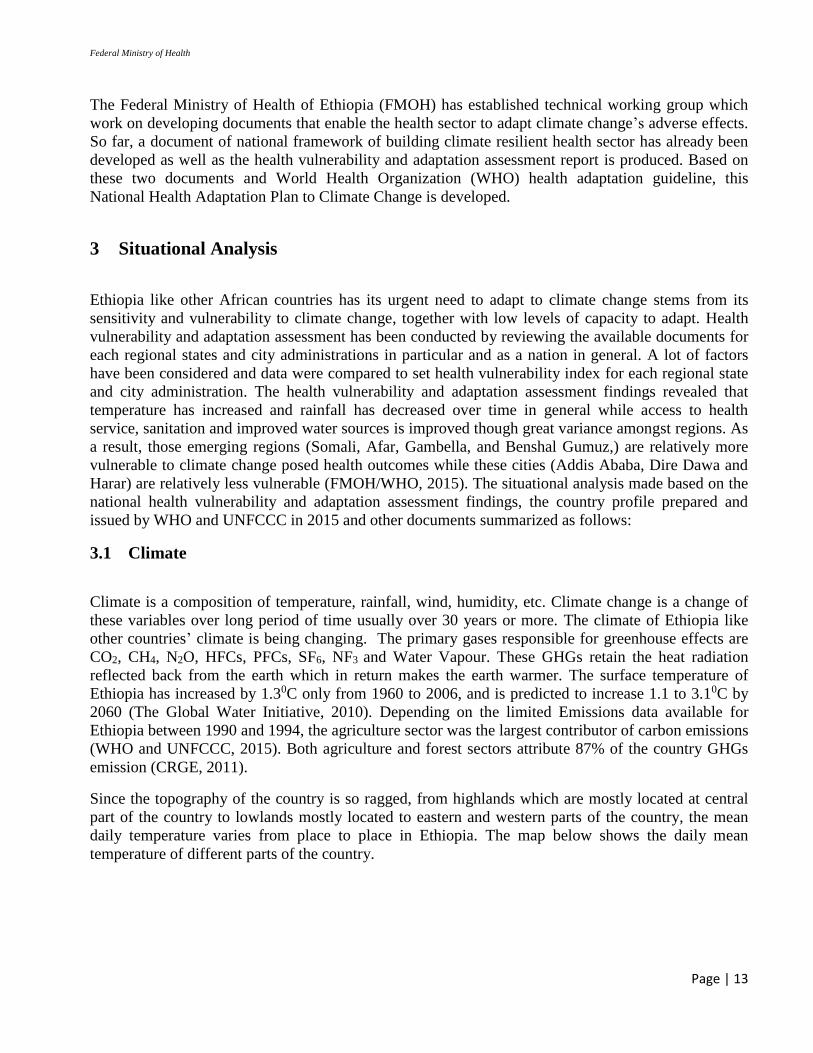
Several projection studies show that temperature will gradually increase all over the country following
global warming unless GHGs emission is halted. For the IPCC mid-range (A1B) emission scenario,
the mean annual temperature will increase in the range of 0.9 -1.1 °C by 2030, in the range of 1.7 - 2.1
°C by 2050 and in the range of 2.7-3.4 °C by 2080 over Ethiopia (Figure 2) compared to the 1961-
1990 normal if continued as it is and no policy intervention (NMA, 2007).

Federal Ministry of Health
Page | 15
Figure 2: Composite of (Average of 19 GCMs) change in temperature (0c) relative to 1961-1990
normal A1B emission scenarios
A country profile issued by WHO and UNFCCC in 2015 also projected the mean annual temperature
of Ethiopia to rise by about 4.8°C on average from 1990 to 2100; and the number of days of warm
spell ('heat wave') is projected to increase from about 10 days in 1990 to about 250 days on average in
2100 under a high emissions scenario. If emissions decrease rapidly, the temperature rise is limited to
about 1.3°C, and the days of warm spell, in 2100, are limited to about 85 on average (WHO and
UNFCC, 2015). For detail, see the figures below:
Figure 3: Mean Annual Temperature Figure 4: Days of Warm Spell ('Heat Waves')
Similarly, the vulnerability and adaptation assessment report done in 2015 revealed that the mean of
minimum and maximum temperatures for all regions except Afar has increased and also expected to
increase in the future (FMOH/WHO, 2015). Even the minimal increase in temperature and days of
warm spell has great effect on productivity, health and wellbeing of human being. This indicated that
it will be very difficult to live and work at very low lands of the country in the future which are
already hot unless actions are taken to reduce carbon emission and to increase forest coverage
globally.
There are two rain seasons in Ethiopia namely ‘kiremt’ and ‘Belg’. ‘Kiremt’ is the main rainy season
which lapses from June to September and covers almost all over the country while ‘Belg’ lapses from
March to May and covers only some parts of the country mainly parts of Oromiya and SNNP. The
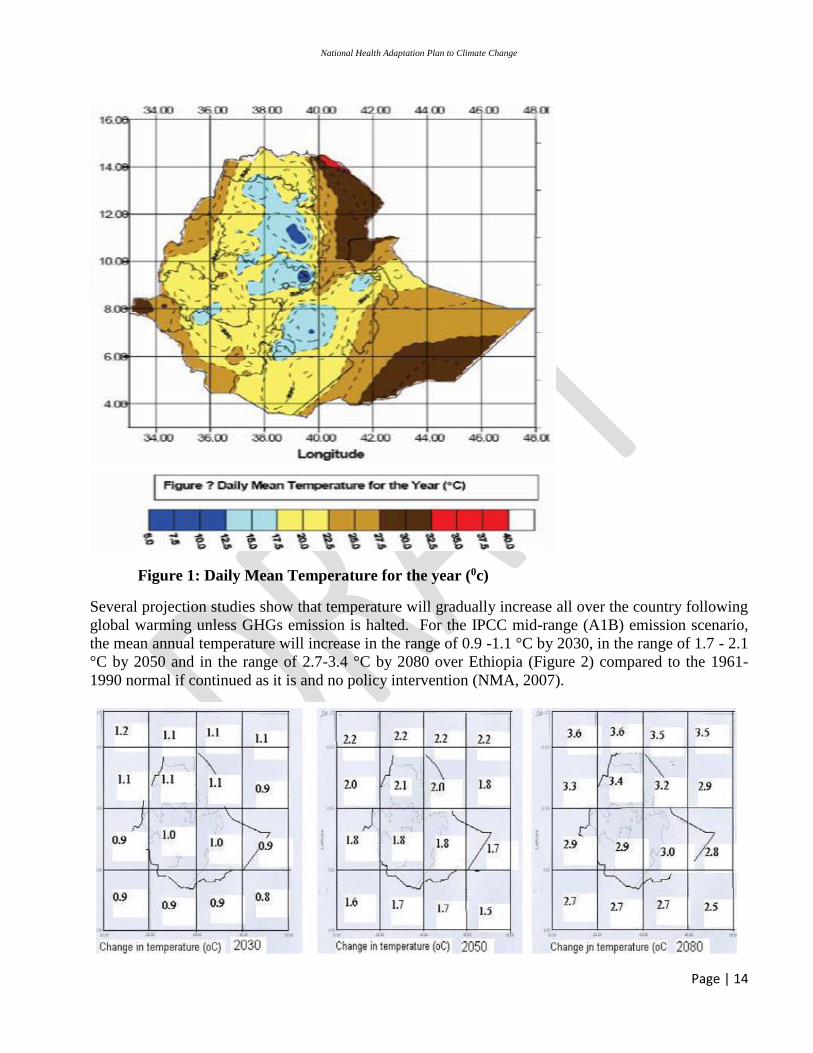
mean annual rainfall varied across the country. In general, highlands get more rainfall comparing to
lowlands or Kolla. Thus, the highlanders usually engaged in agriculture livelihood while lowlanders
engaged in animal rearing. The following map shows the condition of rainfall in different places of
the country based on annual mean rainfall.
National Health Adaptation Plan to Climate Change
Page | 16
Figure 5: Cumulative Mean Annual Rainfall (mm)
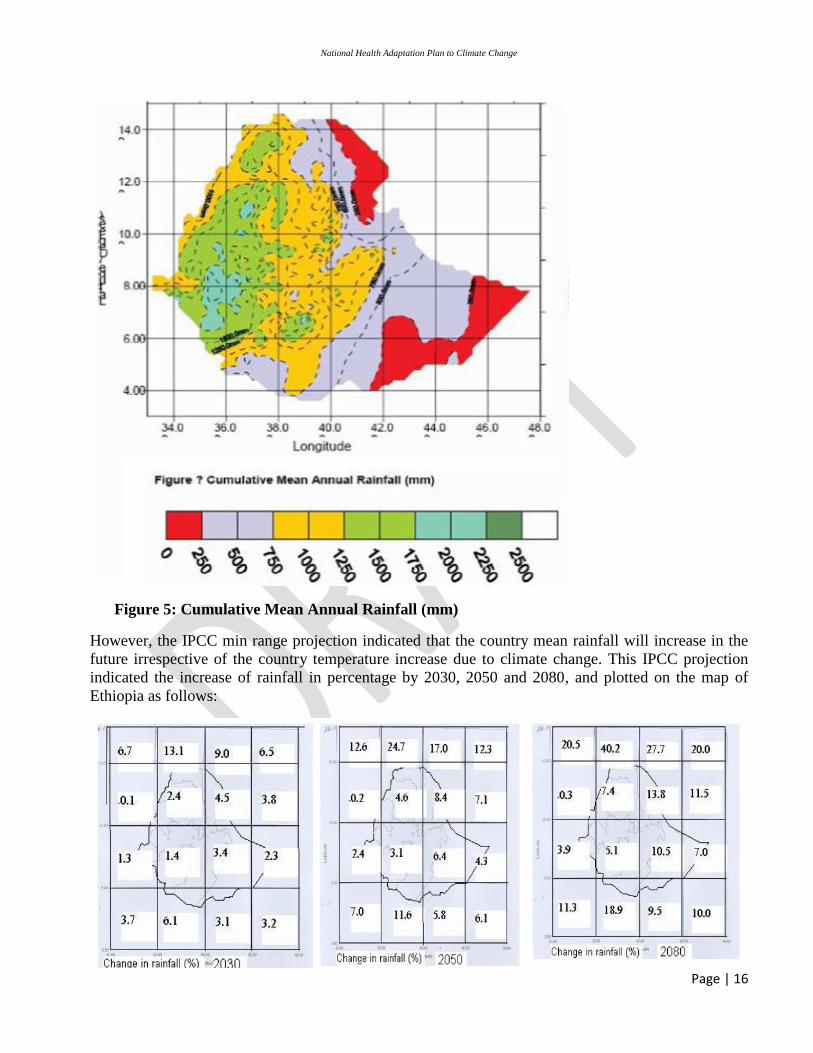
However, the IPCC min range projection indicated that the country mean rainfall will increase in the
future irrespective of the country temperature increase due to climate change. This IPCC projection
indicated the increase of rainfall in percentage by 2030, 2050 and 2080, and plotted on the map of
Ethiopia as follows:
Federal Ministry of Health
Page | 17
Figure 6: Composite of (Average of 19 GCMs) percentage change (%) in rainfall relative to
1961-1990 normal A1B emission scenarios
Similarly, the report released by WHO and UNFCCC in 2015 also predicted that the country’s
humidity will increase irrespective of temperature increase in the future. Therefore, the longest dry
spell is indicated to decrease slightly from an average of about 95 days to just over 80 days under a
high emissions scenario, with continuing large year-to-year variability. If emissions decrease rapidly,
the anticipated changes in the length of dry spells are somewhat less. Moreover, the number of days
with very heavy precipitation (20 mm or more) could double (an increase of about 6 days on average)
from 1990 to 2100 under a high emissions scenario that increases the risk of floods (WHO and
UNFCC, 2015).
Figure 7: Days with extreme rainfall ('Flood Risk') Figure 8: Consecutive Dry Days (‘Drought’)
However, the monthly mean rainfall trend analysis done for 1996 to 2014 during the National
Vulnerability and Adaptation assessment revealed that the rainfall overall in Ethiopia has gradually
reduced through time and would continue to reduce in the future if remedial actions will not be taken.
This assessment also indicated that rainfall has been decreased sharply in Gambella, Somali, Tigray,
Amhara and Afar regional states, and mildly decreased in SNNP, Oromiya and Benshangul Gumuz
(/FMOH/WHO, 2015).
3.2 Socio-Economic Situation
3.2.1 Population pressure
Having over 100 million people, Ethiopia is the second most populous country in Africa next to
Nigeria. Despite population growth rate declined from 3.1% in 1984 to 2.6% in 2007, the average
population density has increased from 34 people per square kilometer to 67.1 people per square
kilometer in the same time interval (FMOH/WHO, 2015). Moreover; 83% of Ethiopia’s people live in
rural areas and engaged in agriculture and deforest thousands hectare of land for agriculture purpose
every year. According to 2007 census, Gambella, Benshangul Gumuz, SNNP and Oromiya had higher
population growth rate than the national average while Addis Ababa had the lowest population growth
rate (FMOH/WHO, 2015). Biomass is the dominant, 95%, source of energy in Ethiopia. Population
National Health Adaptation Plan to Climate Change
Page | 18
pressure has great role for land degradation and land productivity in addition to being is a major driver
of emissions (Climate and Development Knowledge Network, 2014)
3.2.2 Education
A lot of efforts have been made to realize universal access to education in the past two decades by
building more schools all over the country with special emphasis to remote places and disadvantaged
people. The number of primary schools has increased from 9900 in 1995 to 32,048 in 2014.
Similarly, the number of secondary schools increased from 346 in 1996 to 2333 in 2014. As a result,
the school enrollment in primary education reached 93%. The literacy rate in Ethiopia in general has
grown from 25% in 1995/96 to 46.7% in 2010/11. Cities such as Addis Ababa, Dire Dawa and Harari
had 86.7%, 63.8% and 59.8% literacy rate respectively which are higher comparing to the other
regions. Somali had the lowest literacy rate which was 30.5% (NPC and UN-Ethiopia, 2014). This
shows there is great variance in literacy rate among regions as well as between rural and urban
settings.
The progress made in education access is remarkable and very important for dissemination of health
messages that induce positive health behavior change. However, significant numbers of people in
Ethiopia are still illiterate. This illiteracy hinders people from utilizing all existing healthcare services
as well as creates difficulties in utilizing the health message transmitted by printed and electronic
media. This in turn causes health inequalities.
3.2.3 Economy
The government of Ethiopia has committed to nurture the economic growth of the country and to
improve livelihood of its citizen; and visible economic growth has been achieved in the past 10 years.
The average per capita income grew from $ 129 in 1999/2000 to $630 in 2013/14. Similarly, the
proportion of people living below absolute poverty standard reduced from 48% in 1990 to 23.4% in
2013/14 (NPC and UN-Ethiopia, 2014). However, about 83% of the populations are still engaged in
rain fed agriculture which accounts for 40% of the GDP and highly susceptible to climate change.
Since majority of the population of the country live densely at highlands and their livelihood is based
on agriculture, there is no adequate land to engage all adults in agriculture. As a result, the number of
unemployed people is high besides to those known as dependents which include children under 14 and
adults over 64 years. Therefore; there is huge dependency ratio in Ethiopia particularly in Oromiya
and SNNP where 100 working people support more than 100 dependents (FMOH/WHO, 2015).
Climate change brings considerable risks to economic prospects, as well as to food security (Climate
and Development Knowledge Network, 2014). According to World Bank study, countries would loss
5% to 12% of their GDP during catastrophic disease outbreaks (UN and Time for Global Action,
2015). Much of the economic growth is dependent on climate-sensitive sectors such as agriculture,
forestry and other natural resources. Thus, the economic growth of the country is usually heavily
negatively influenced by drought and flood conditions in the country (Climate and Development
Knowledge Network, 2014).
The Government of Ethiopia allocated more budgets for health sector in past two decades as health
sector contributes to sustainable development and helps to absorb shocks. The crude health care
Federal Ministry of Health
Page | 19
budget allocated by government gradually increased in the past years. This fifth round of NHA
revealed that there has been a tremendous increment in health spending both in nominal and per capita
terms. Nominally, NHE increased from Birr 11.1 billion in 2007/08 to over Birr 26.5 billion in
2010/11. Per capita National Health Expenditure increased modestly, from US$16.09 per capita in
2007/08 to US$20.77 in 2010/11. This figure is far below the HSDP-IV per capita spending target of
US$32 and WHO recommended US$34 per capita (FMOH, 2014).
Similarly, the proportion of health budget to total national budget was 11.1% in 2014/15 (FMOH,
2016b) and the country failed to meet Abuja Declaration target that persuades countries to allocate
15% of the government budget. Thus, health is still underfinanced and there is strong need for making
more resources available to the sector to improve health service delivery and ultimately the health
status of the population.
.
3.3 Disasters related to climate change
Climate-related hazards and disasters are among the biggest threats to human health at present (ISCU
and ISSC, 2015). Extreme weather events are also leading to breakdown of infrastructure networks
and critical services such as electricity, water supply, and health and emergency services (IPCC 5th,
WG III, 2015). Natural disasters like flood, drought, and heat stress are being aggravated by climate
change.
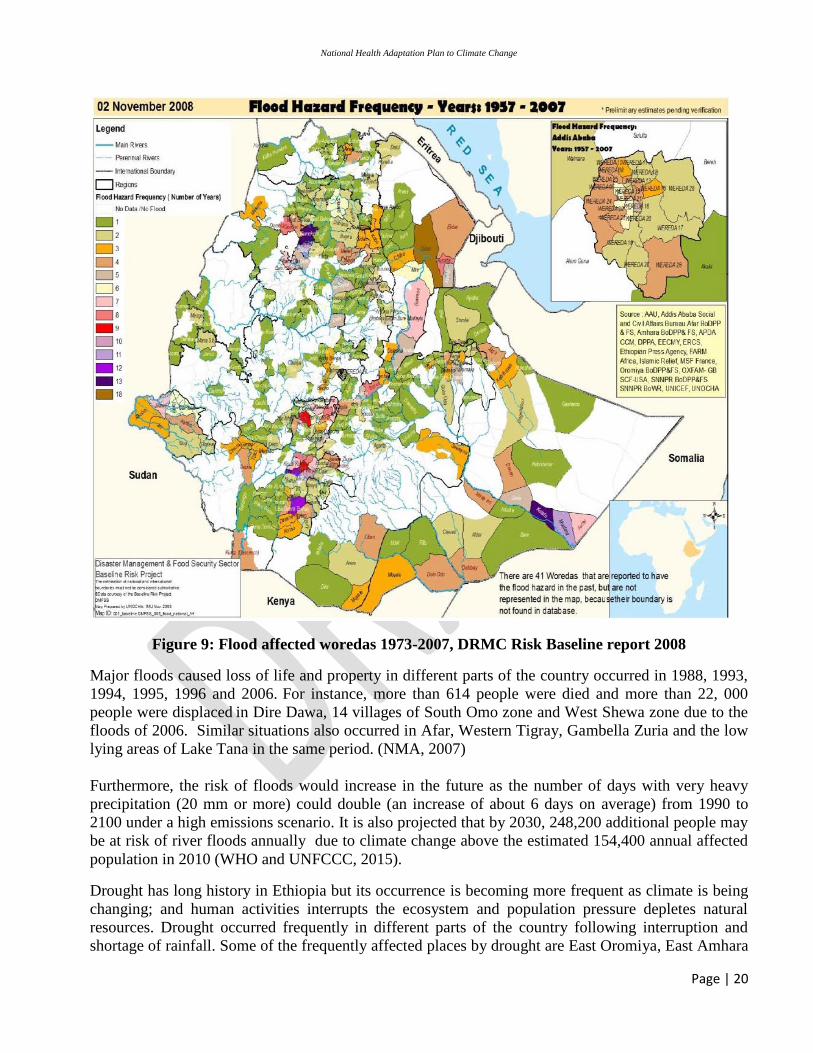
The flood disaster occurred in various places of Ethiopia as splash flooding and inland flooding with
various intensity and scale in different occasions. Among places were frequently hit by splash flooding
are places vicinage to lake Tana, places of Afar and Shoa at lower course of Awash River, places of
South Omo along sides of the lower course of Omo river, Gambella aside to Baro River and places
along sides of Wabi Shebelle at its lower course. The DRMC registered the flooding disaster
occurred all over the country from 1957 to 2007. Here below, a map indicated woredas hit by flood
and the frequency of flooding.
National Health Adaptation Plan to Climate Change
Page | 20
Figure 9: Flood affected woredas 1973-2007, DRMC Risk Baseline report 2008
Major floods caused loss of life and property in different parts of the country occurred in 1988, 1993,
1994, 1995, 1996 and 2006. For instance, more than 614 people were died and more than 22, 000
people were displaced in Dire Dawa, 14 villages of South Omo zone and West Shewa zone due to the
floods of 2006. Similar situations also occurred in Afar, Western Tigray, Gambella Zuria and the low
lying areas of Lake Tana in the same period. (NMA, 2007)
Furthermore, the risk of floods would increase in the future as the number of days with very heavy
precipitation (20 mm or more) could double (an increase of about 6 days on average) from 1990 to
2100 under a high emissions scenario. It is also projected that by 2030, 248,200 additional people may
be at risk of river floods annually due to climate change above the estimated 154,400 annual affected
population in 2010 (WHO and UNFCCC, 2015).
Drought has long history in Ethiopia but its occurrence is becoming more frequent as climate is being
changing; and human activities interrupts the ecosystem and population pressure depletes natural
resources. Drought occurred frequently in different parts of the country following interruption and
shortage of rainfall. Some of the frequently affected places by drought are East Oromiya, East Amhara
Federal Ministry of Health
Page | 21
and East and south Tigray, and major parts of Afar and Somali Regional States. The impacts of past
droughts such as that of the 1972/73, 1984 and 2002/03 are still fresh in the memories of many
Ethiopians. Since 1980s more than 57 million people have been affected by droughts. Still around 10
million people live in areas at high risk of droughts; and these events are expected to become more
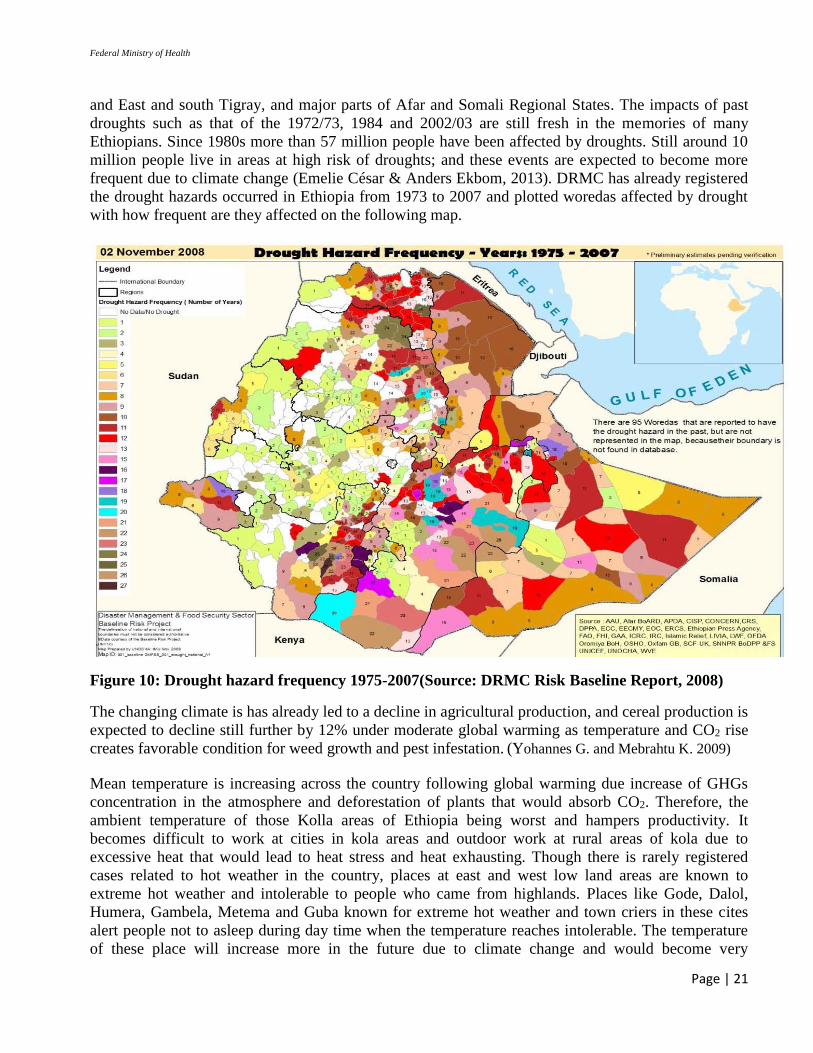
frequent due to climate change (Emelie César & Anders Ekbom, 2013). DRMC has already registered
the drought hazards occurred in Ethiopia from 1973 to 2007 and plotted woredas affected by drought
with how frequent are they affected on the following map.
Figure 10: Drought hazard frequency 1975-2007(Source: DRMC Risk Baseline Report, 2008)
The changing climate is has already led to a decline in agricultural production, and cereal production is
expected to decline still further by 12% under moderate global warming as temperature and CO2 rise
creates favorable condition for weed growth and pest infestation. (Yohannes G. and Mebrahtu K. 2009)
Mean temperature is increasing across the country following global warming due increase of GHGs
concentration in the atmosphere and deforestation of plants that would absorb CO2. Therefore, the
ambient temperature of those Kolla areas of Ethiopia being worst and hampers productivity. It
becomes difficult to work at cities in kola areas and outdoor work at rural areas of kola due to
excessive heat that would lead to heat stress and heat exhausting. Though there is rarely registered
cases related to hot weather in the country, places at east and west low land areas are known to
extreme hot weather and intolerable to people who came from highlands. Places like Gode, Dalol,
Humera, Gambela, Metema and Guba known for extreme hot weather and town criers in these cites
alert people not to asleep during day time when the temperature reaches intolerable. The temperature
of these place will increase more in the future due to climate change and would become very
National Health Adaptation Plan to Climate Change
Page | 22
dangerous to work and live in unless our adaptation mechanism become strong or the global warming
averted by global mitigation efforts.
3.4 Health Impacts of Climate Change
3.4.1 Malnutrition
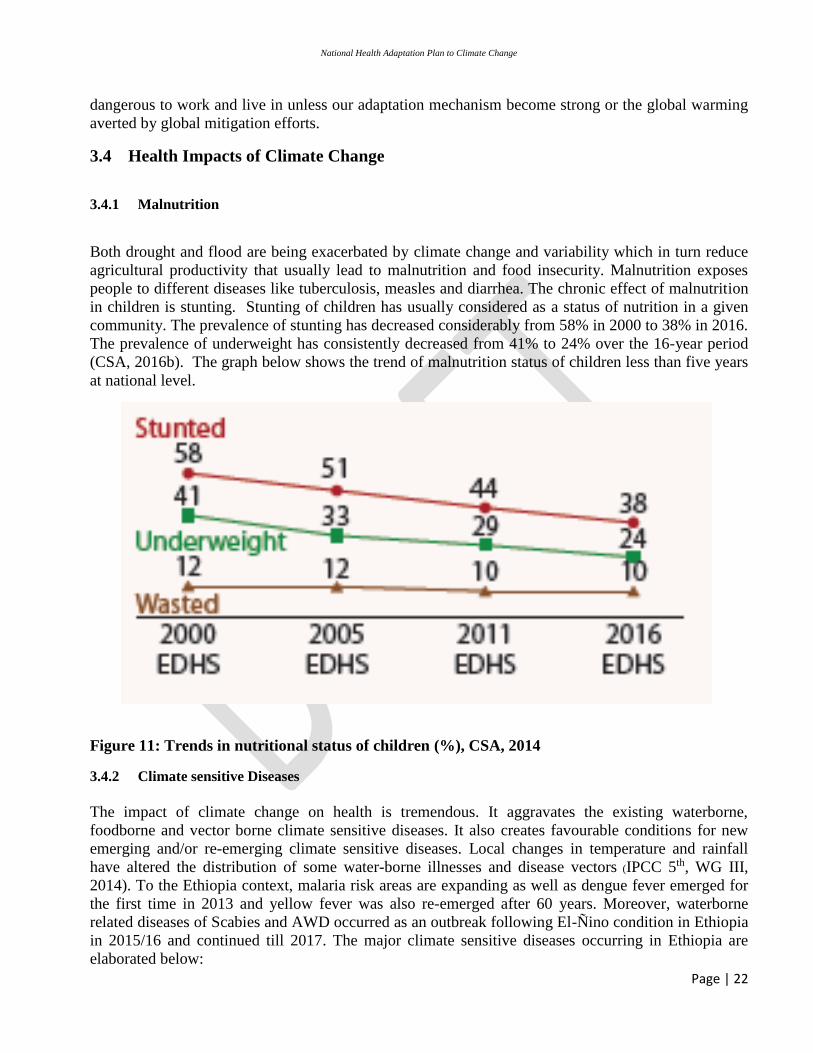
Both drought and flood are being exacerbated by climate change and variability which in turn reduce
agricultural productivity that usually lead to malnutrition and food insecurity. Malnutrition exposes
people to different diseases like tuberculosis, measles and diarrhea. The chronic effect of malnutrition
in children is stunting. Stunting of children has usually considered as a status of nutrition in a given
community. The prevalence of stunting has decreased considerably from 58% in 2000 to 38% in 2016.
The prevalence of underweight has consistently decreased from 41% to 24% over the 16-year period
(CSA, 2016b). The graph below shows the trend of malnutrition status of children less than five years
at national level.
Figure 11: Trends in nutritional status of children (%), CSA, 2014
3.4.2 Climate sensitive Diseases
The impact of climate change on health is tremendous. It aggravates the existing waterborne,
foodborne and vector borne climate sensitive diseases. It also creates favourable conditions for new
emerging and/or re-emerging climate sensitive diseases. Local changes in temperature and rainfall
have altered the distribution of some water-borne illnesses and disease vectors (IPCC 5th, WG III,
2014). To the Ethiopia context, malaria risk areas are expanding as well as dengue fever emerged for
the first time in 2013 and yellow fever was also re-emerged after 60 years. Moreover, waterborne
related diseases of Scabies and AWD occurred as an outbreak following El-Ñino condition in Ethiopia
in 2015/16 and continued till 2017. The major climate sensitive diseases occurring in Ethiopia are
elaborated below:
Federal Ministry of Health
Page | 23
3.4.2.1 Vector Borne Diseases
There are several vector borne diseases that are highly sensitive to climate change in reputation of the
vectors as well as parasites which are harbored in the vectors. Malaria is one of the climate sensitive
vector borne diseases and the prominent disease in Ethiopia. Four to Five million people infected with
and over ten thousand people die of malaria every year (Ayele et al, 2012 and WHO, 2015).
According to a special analysis made during the health vulnerability and adaptation assessment in
2015 by FMOH and WHO, the malaria risk area of Ethiopia would increase over 75% as the high land
night time temperature increased and expected to push the maximum threshold elevation of malaria
transmission (FMOH/WHO, 2015). Therefore, the malaria-prone areas are being wider as global
warming changes the environment and creating favorable condition to mosquitoes breeding. As a
result, malaria is being spread to highlands like Addis Ababa which were not known for malaria
before. Hence, the increasing temperature and interrupted rainfall in Ethiopia creates favorable
condition for rapid reproduction of mosquitoes which in turn increases its density and the probability
to be bitten by mosquitoes.
Both temperature and humidity affect the survivability and density of mosquitoes’ population.
Similarly, malarial protozoa incubation period will be shorter as the temperature increases to certain
limits. These conditions of increasing mosquitoes density and shorten malarial protozoa incubation
period increases malaria transmission rate to some extent. Therefore, there is high risk of malaria
epidemic in Ethiopia and may be worsen in the future as exposure to mosquito bite in person-month is
projected to increase more than 100% in Ethiopia later in this century which in turn could dramatically
increase the burden of those suffering with malaria (WHO, 2008). By 2070, almost 130 million people
are projected to be at risk of malaria assuming a high emissions scenario. Population growth can also
cause increases in the population at risk in areas where malaria presence is static in the future (WHO
and UNFCCC, 2015).
To tackle malaria epidemic, several interventions are being carried out in integrated manner. These
include clearing mosquitoes breeding sites; providing mosquito bed nets to households in malarious
areas; and treating malaria using effective diagnostic tools and treatment. As per ESPA+ assessment,
over 77% of the health posts and 90% of the other health facilities offer malaria treatment service
(EPHI/FMOH, 2015). So far over 65 million bed nets distributed to malaria areas; and 6 million
households in malaria areas sprayed with indoor residual insecticides annually (FMOH, 2016). The
newly introduced intervention, using bed net as barrier to mosquito bite, has gotten great acceptance
by communities living in malaria areas. According to Ethiopia Malaria Indicators Survey (EMIS) of
2011 the percentage of children U5 who had slept under a mosquito net the night preceding the survey
was 60.2% in 2007, increasing to 64.5% in 2011 (FMOH, 2012). But, this figure declined to 45.3% in
2015 survey. The EMIS of 2015 report also revealed that the availability of at least one LLIN was
64% which exceeded to 2011 LLIN availability (54%) but slightly lower comparing to 2005 (69%)
(EPHI/FMOH, 2011). However ever, FMOH has launched Malaria Elimination initiative in 239
woredas of 6 regions where low transmission of malaria exist. This Malaria Elimination Initiative has
a road map how to move from controlling to elimination malaria. So far, Reorientation provided at all
levels starting from regional level to health extension workers at grass root level.

National Health Adaptation Plan to Climate Change
Page | 24
Dengue Fever is another highly climate sensitive disease and expanded to all over the world recently
due to the vector of this disease, Aedes Egypt, found at altitude as high as 1700 meter above sea level
beyond its previous favorable altitude that was below 1000 meter above sea level. Higher ambient
temperatures favor rapid development of the vector, increase the frequency of blood meals, and reduce
the extrinsic incubation period (EIP). As it was reported by WHO, mosquito-borne dengue is now
found in 100 countries worldwide putting more than 2.5 billion people or 40% of the world population
at risk of contracting the disease. The desk review done by Esther and her colleagues shows that the
Comoros, Ethiopia, Kenya, the Seychelles, Somalia, Tanzania, Mauritius and Mozambique were
considered endemic for dengue from 1975 to 1996 (Esther et. al, 2010). Consequently; a total of 6,192
dengue fever cases were reported from Gode of Somali region, Hadar of Afar region and Dire- Dawa
city administration till May, 2014 which was never and ever reported before (WHO –Ethiopia, 2014).
Yellow Fever is also climate sensitive disease and transmitted by a mosquito of the same species
responsible for Dengue Fever. WHO has classified it as one of the immediately reportable disease; and
passengers from countries known for yellow fever ought to take Yellow Fever vaccine while they
travel from country to country aiming to control the disease. However, Yellow Fever reoccurred as an
outbreak in South Omo in 2013 after 60 years and 159 cases were reported till January, 2014.
3.4.2.2 Waterborne Diseases
Though accessibility to improved water sources is growing in all regions of Ethiopia and reached 57%
at national level, still significant numbers of people use water from unprotected sources. Furthermore,
the water availability and sustainability of water sources is being affected by climate change due to
high evaporation and less percolation to ground (ISCU and ISSC, 2015). Water is also contaminated
during the fetching process, transportation and utilization in Ethiopia in addition to significant number
of the available improved water sources were contaminated by flooding due to poor construction
design. A national water quality survey conducted in 2010 generated strong evidence that one-third of
the improved wells and springs used for domestic purposes were found contaminated with faecal
matter (WHO and UNICEF, 2010). The magnitude and rate of contamination of these springs and
wells would be higher if the survey were undertaken in rainy season or after wards.
In Ethiopia, there are several water borne diseases which are highly influenced by climate variability
and change in Ethiopia. Diarrhoea is one of the water borne diseases which is highly affected by
climate variability and change. Diarrhea outbreaks are usually occurred during rainy season since
unprotected water source overwhelmed by flooding or water pipes cross contaminated by runoff water.
The flood events in Gambella and Dire Dawa of 2006 were accompanied with diarrhea outbreak. The
health vulnerability and adaptation assessment done in 2015 by FMOH/WHO indicated that the
association between diarrhea and rainfall increased as the rainfall increase in Amhara, Oromiya,
Somali, Addis Ababa and SNNP. Therefore, the emergence of acute watery diarrhea during rainy
season in Ethiopia could be partly explained by damage to the integrity of water sources and being
contaminated by runoff water which carry human faeces and other contaminants. Having poorly
constructed WaSH facilities, diarrhea is common and predominant particularly during rainy or wet
seasons. Thus, diarrhea was reported after floods increased in emerging regions namely Somali,
Gambella and Benshangul Gumuz in 2011 (FMOH/WHO, 2015).
The rising temperature exacerbates the existing water scarcity in Ethiopia by increasing evaporation
and early drying rivers and other water bodies. The 2015/16 El-Ñino posed drought occurred in major

Federal Ministry of Health
Page | 25
parts of Ethiopia was expressed by water scarcity for human being and animals. As a result, people in
the drought affected areas were suffered by scabies and/or Acute watery diarhoea (AWD) which were
related to poor personal hygiene and using unsafe water for domestic use. People could not get
adequate water to wash their body regularly due to drought there; and forced to use unsafe water for
domestic use including for drinking.
As temperature rises the prevalence of diarrhoea would increase to a certain limit. Though the total
proportion of diarrhoea is expected to decline gradually in Ethiopia due to the efforts being made in
improving WaSH facilities, the diarrhea proportion attributed to climate change would increase
gradually. The country profile for Ethiopia which was released by WHO and UNFCCC in 2015
revealed that diarrhoeal deaths attributable to climate change in children under 15 years old is
projected to be about 9.6% of the over 42,000 diarrhoeal deaths projected by 2050 under a high
emissions scenario. Although diarrhoeal deaths are projected to decline to about 15,500 towards 2070
the proportion of deaths attributable to climate change is projected to rise to approximately 14.1%.
(WHO and UNFCCC, 2015)
3.4.3 Respiratory Tract Infections
According to FMoWIE assessment, nearly 89% of the country households entirely use biomass fuels
such as fire wood, dung, charcoal and agriculture residue as source of energy for cooking, lighting and
heating. These biomass fuels are relatively unclean fuel and produce tremendous fine and respirable
particulate matters and toxic gases during combustion. These particulate matter and toxic gasses cause
indoor air pollution and are highly associated with respiratory impairment like bronchitis, influenza,
pneumonia, asthma, lung cancer and chronic obstructive pulmonary diseases (WHO, 2014). Thus,
child pneumonia and other respiratory diseases are on the top ten of diseases of morbidity in Ethiopia.
The ambient air pollution is also becoming a serious problem in cities and big towns of Ethiopia due
ever increasing air pollution from unclean fuel combustion by transport vehicles, industries and
manufacturing enterprises, waste disposal sites and households. Indoor air pollution contributes up to
12% to ambient air pollution (WHO, 2014). In Ethiopia, it is projected that a reduction in Short-Lived
Climate Pollutants (SLCPs) could prevent 24,800 premature deaths per year from outdoor air pollution
(PM2.5 and ozone), from 2030 onwards. Moreover, 63% percent of an estimated 36,800 child deaths
due to acute lower respiratory infections in Ethiopia is attributable to household air pollution (WHO
and UNFCCC, 2015).
3.4.4 Heat stress
There are well recognized discomfort caused by heat stress in dry season in East and South-West
Ethiopia. Thus, local administrators and town criers warn dwellers not to sleep day time, and to take
other cautions. There have been deaths due to heat stroke in these areas though they were not well
documented. Due to global warming, lowlands such as Gambella, Guba, Humera, Dalol and Gode
are being over heated. There is likelihood of disease and death due to more intense heat waves on the
above mentioned place and in cities located in hot areas (IPCC 5th WRGIII, 2014). Children and elders
are the most affected during heat stress and heat waves. The heat-related deaths in the elderly (65+
years) in Ethiopia is projected to increase to over 65 deaths per 100,000 by 2080 compared to the
estimated baseline of under 3 deaths per 100,000 annually between 1961 and 1990 under a high

National Health Adaptation Plan to Climate Change
Page | 26
emissions scenario. A rapid reduction in emissions could limit heat-related deaths in the elderly to just
under 12 deaths per 100,000 towards 2080 (WHO and UNFCCC, 2015).
3.5 Physical Infrastructures
3.5.1 Sanitation Facilities
Latrines are the most important sanitation facilities which prevent faeco-oral transmission of
communicable diseases being a barrier on the transmission route. Demographic and Health Survey
(DHS) of 2016 reported that 61% of the rural communities and 93% of the urban communities had
access to any form of latrine which shows improvement in coverage especially in rural areas (CSA,
2016). However, the access to improved latrine is still low which is 28% (WHO and UNICEF, 2015)
and far below millennium development goal as the target was to reduce the sanitation inaccessibility
by half in 2015. The unimproved latrines are vulnerable to flooding since they have poor
superstructure and less mounted wall that may not protect the latrine from filling by rain water and
runoff water respectively. Thus, majority of the existing latrines are not climate resilient and used to
collapse by runoff water during rainy season.
Furthermore, people practicing open defecation declined from 68% in 2005 to 32% in 2011(WHO and
UNICEF, 2015). This shows that a remarkable change in open defecation practice has achieved but it
is still being practiced by significant number of people despite all efforts being made to make
communities open defecation free through Community Led Total Sanitation and Hygiene (CLTSH)
and other approaches.
3.5.2 Health Facilities
As building up the health sector creates resilience to shocks (ICSU and ISSC, 2015), improving the
health service delivery is important to bring sustainable development. Thus, the Government of
Ethiopia (GoE) has exerted tremendous efforts to improve the health coverage of the country in last 20
years. As a result, access to basic health care (Access to health center) reached 96.1% by constructing
new health centers and upgrading previous health posts and clinics to health centers (FMOH, 2017).
Moreover, minimum one health post built at each rural kebelle to provide basic health service at
nearby and private health facilities are booming at urban areas. Similarly, GoE is building new
additional hospitals to increase access to hospital health service. Thus, approximately one hospital is
serving to about 300, 000 population which is great improvement comparing to one hospital was
serving to 490, 000 population in 2008 though hospital service access is still need further improvement
(FMOH/WHO, 2015). Here below the distribution of public health facilities by region.

Federal Ministry of Health
Page | 27
Table 1: Distribution of public health facilities, by region, ESPA+, 2015
Facility type Region
Total
Tig
ray
Afa
r
Am
hara
Oro
mia
Som
ali
Ben
. G
um
uz
SN
NP
Gam
bel
la
Hara
ri
Ad
dis
Ab
ab
a
Dir
e D
aw
a
Referral Hospital 1 1 5 7 1 0 5 1 1 13 1 36
General Hospital 14 3 4 31 8 2 10 0 1 0 0 73
Primary Hospital 16 2 64 63 1 4 13 2 0 0 1 166
Health Center 213 78 849 1,317 165 40 731 32 8 97 15 3,545
Total 244 84 922 1,418 175 46 759 35 10 110 17 3,820
Nevertheless, Health facilities ought to have continuous water and power supplies, sanitation facilities,
transportation access, electric supply and means of communication to operate properly, and to provide
health care to the standards. According to Ethiopia Service Provision Assessment plus Census (ESPA+) of
2014, majority, 95.3%, of all facilities of Ethiopia have functional latrines for clients as well as for the
staff. Similarly, this assessment report indicated that two-third of all health facilities had access to
improved water sources; and majority of the health facilities had access to road and telephone. However,
there was variance among regions in accessing the above services. Here below a Table that shows health
facilities’ access to electricity and improved water source by region.
Table 2: Public health facilities accessed electricity and improved water sources by region,
ESPA+, 2014
Region Access to regular electricity in % Access to improved water sources in %
Health posts Health Centers and
Hospitals
Health posts Health Centers and
Hospitals
Tigray 44 64 40 86
Afar 50 70 55 45
Amhara 54 45 63 79
Oromia 18 49 39 74
Somali 15 78 40 48
Benishangul Gumuz 10 47 52 76
SNNP 24 50 39 72
Gambella 15 68 67 77
Harari 24 63 52 94
Addis Ababa 60 97
Dire Dawa 42 82 65 96
National Health Adaptation Plan to Climate Change
Page | 28
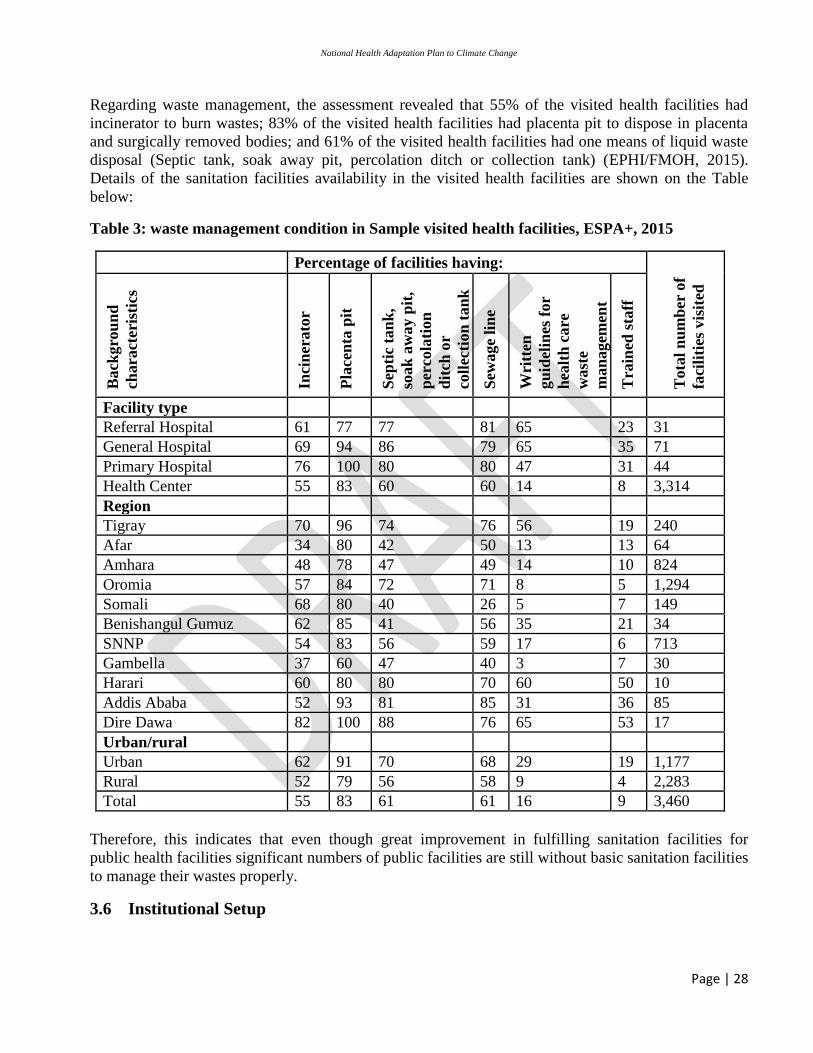
Regarding waste management, the assessment revealed that 55% of the visited health facilities had
incinerator to burn wastes; 83% of the visited health facilities had placenta pit to dispose in placenta
and surgically removed bodies; and 61% of the visited health facilities had one means of liquid waste
disposal (Septic tank, soak away pit, percolation ditch or collection tank) (EPHI/FMOH, 2015).
Details of the sanitation facilities availability in the visited health facilities are shown on the Table
below:
Table 3: waste management condition in Sample visited health facilities, ESPA+, 2015
Percentage of facilities having:
Tota
l n
um
ber
of
faci
liti
es v
isit
ed
Back
gro
un
d
chara
cter
isti
cs
Inci
ner
ato
r
Pla
cen
ta p
it
Sep
tic
tan
k,
soak
aw
ay p
it,
per
cola
tion
dit
ch o
r
coll
ecti
on
tan
k
Sew
age
lin
e
Wri
tten
gu
idel
ines
for
hea
lth
care
wast
e
man
agem
ent
Tra
ined
sta
ff
Facility type
Referral Hospital 61 77 77 81 65 23 31
General Hospital 69 94 86 79 65 35 71
Primary Hospital 76 100 80 80 47 31 44
Health Center 55 83 60 60 14 8 3,314
Region
Tigray 70 96 74 76 56 19 240
Afar 34 80 42 50 13 13 64
Amhara 48 78 47 49 14 10 824
Oromia 57 84 72 71 8 5 1,294
Somali 68 80 40 26 5 7 149
Benishangul Gumuz 62 85 41 56 35 21 34
SNNP 54 83 56 59 17 6 713
Gambella 37 60 47 40 3 7 30
Harari 60 80 80 70 60 50 10
Addis Ababa 52 93 81 85 31 36 85
Dire Dawa 82 100 88 76 65 53 17
Urban/rural
Urban 62 91 70 68 29 19 1,177
Rural 52 79 56 58 9 4 2,283
Total 55 83 61 61 16 9 3,460
Therefore, this indicates that even though great improvement in fulfilling sanitation facilities for
public health facilities significant numbers of public facilities are still without basic sanitation facilities
to manage their wastes properly.
3.6 Institutional Setup
Federal Ministry of Health
Page | 29
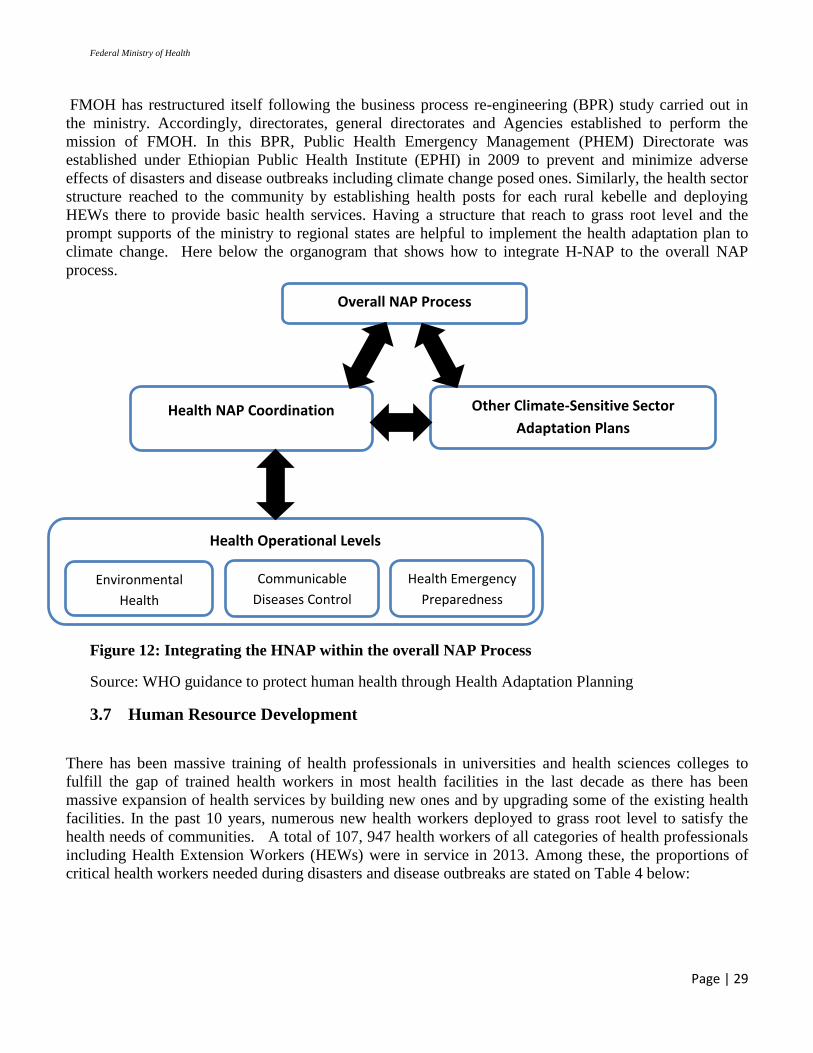
FMOH has restructured itself following the business process re-engineering (BPR) study carried out in
the ministry. Accordingly, directorates, general directorates and Agencies established to perform the
mission of FMOH. In this BPR, Public Health Emergency Management (PHEM) Directorate was
established under Ethiopian Public Health Institute (EPHI) in 2009 to prevent and minimize adverse
effects of disasters and disease outbreaks including climate change posed ones. Similarly, the health sector
structure reached to the community by establishing health posts for each rural kebelle and deploying
HEWs there to provide basic health services. Having a structure that reach to grass root level and the
prompt supports of the ministry to regional states are helpful to implement the health adaptation plan to
climate change. Here below the organogram that shows how to integrate H-NAP to the overall NAP
process.
Figure 12: Integrating the HNAP within the overall NAP Process
Source: WHO guidance to protect human health through Health Adaptation Planning
3.7 Human Resource Development
There has been massive training of health professionals in universities and health sciences colleges to
fulfill the gap of trained health workers in most health facilities in the last decade as there has been
massive expansion of health services by building new ones and by upgrading some of the existing health
facilities. In the past 10 years, numerous new health workers deployed to grass root level to satisfy the
health needs of communities. A total of 107, 947 health workers of all categories of health professionals
including Health Extension Workers (HEWs) were in service in 2013. Among these, the proportions of
critical health workers needed during disasters and disease outbreaks are stated on Table 4 below:
Other Climate-Sensitive Sector
Adaptation Plans Health NAP Coordination
Health Operational Levels
Environmental
Health
Overall NAP Process
Communicable
Diseases Control
Health Emergency
Preparedness

National Health Adaptation Plan to Climate Change
Page | 30
Table 4: proportion of critical health professionals to population by Region, FMOH, 2017
Region Population Physician Health
Officers Nurses
Env’tal
Health HEW*
Addis Ababa 3,433,999 1: 6,841 1: 2,862 1: 888 1: 25,250 1:2,476
Afar 1,812,002 1: 11,117 1: 16,624 1: 1,434 1: 100,667 1:2,117
Amhara 21,134,988 1: 34,422 1: 17,972 1: 26,093 1: 52,575 1:2,583
Ben-Gum 1,066,001 1: 17,767 1: 5,076 1: 1,225 1: 33,313 1:946
Dire Dawa 466,000 1: 8,175 1: 7,281 1: 1,102 1: 12,944 1:5,321
Gambella 435,999 1: 19,818 1: 4,000 1: 553 1: 48,444 1:1,757
Harari 246,000 1: 3,968 1: 9,462 1: 911 1: 82,000 1:5,641
Oromia 35,467,815 1: 37,061 1: 11,617 1: 2,661 1: 30,160 1:2,262
SNNP 19,170,007 1: 31,019 1: 10,911 1: 2,157 1: 35,304 1:2,054
Somali 5,748,998 1: 31,415 1:26,372 1: 3,252 1: 718,625 1:5,688
Tigray 5,247,005 1: 27,762 1: 10,819 1: 1,372 1: 32,794 1:2,965
National** 94,228,814 1: 21,936 1: 9,959 1: 2,420 1: 35,260 1:2,460
*2013 data; **Includes Health Professionals in the Federal institutions;
Source: Health and health related indicators, 2017
3.8 Enabling Policies, Strategies and Programmes
There are many enabling factors including policies and strategies that aid in adaption to climate
change in the health sector. Among these, the Constitution, the Health Policy, the Climate Resilient
Green Economy Strategy, Health Extension Programme, and National Sanitation and Hygiene
Strategic Action Plan are vital. The Constitution under its articles of 40, 90 and 92 stated that all
citizens shall have a right to live in a clean and healthy environment. The constitution also clearly
noted as well that development programmes and projects shall not damage or destroy environment.
Similarly, the health policy under its “general strategies” promotes “inter-sectorial collaboration”
including accelerating the provision of safe and adequate water for urban and rural populations,
Federal Ministry of Health
Page | 31
developing safe disposal of human, household and agricultural wastes as well as encouragement of
recycling, and developing measures to improve the quality of housing and work enterprises for health
(Transitional Government of Ethiopia, 1993). The national sanitation and hygiene strategic action plan
was also adopted by FMOH in 2011 with the purpose to improve the health and living conditions of
the people of the country by ensuring accessibility to improved sanitation and hygiene facilities as
well as management of drinking water at household level.
To prevent and control of Acute Watery Diarrhoea (AWD), a strategy drawn in 2014 with the view of
AWD affects economy and tourism industry severely. This strategy also emphasizes that
comprehensive promotional and preventive approaches are important to protect communities from
consequences of AWD. Moreover, this strategy indicated that the importance of implementing a multi-
sector approach to sustain the prevention and control of AWD since AWD and other climate sensitive
diseases have multiple root causes (FDRE, 2014).
The Ethiopian health flagship, HEP, was designed to serve as a bridge to convey primary health
services at community level. The HEP has 16 packages and majority of them deal with disease
prevention and health promotion interventions. The HEP has obtained remarkable achievements such
as increased institutional delivery, increased family planning utilization, increased latrine coverage,
decreased malaria incidence, decreased HIV incidence, etc. Therefore, communities will be aware of
climate change effects on human health as well as communities’ role in adapting climate change
through HEP using HEWs and HDAs.
There are also proclamations and strategies issued by House of Peoples Representatives (HoPR) and
relevant ministries respectively. These provide a ground to implement national health adaptation plan
to climate change. Accordingly, the then Federal Environmental Protection Authority (FEPA) issued
Environmental Impact Assessment proclamation in 2010 which enforces investments to undertake an
Environmental Impact Assessment (EIA) that enhance the identification of hazards that can be
mitigated during the project development. FEPA also issued Environmental Pollution Control
Proclamation in 2010 which enables FEPA to control environmental pollution using legal enforcement
and institutional arrangements (FMOH/WHO, 2015).
Ethiopia has also launched the CRGE initiative in 2011 considering the country’s economic
achievements will be ruined and could not be sustained due to climate change unless interventions
made. This CRGE acknowledges the impacts of climate change to health sector and identified the
health sector as one of the most 3 vulnerable sector to climate change together with agriculture and
water sectors (FMOH/WHO, 2015). And this is the basis for FMOH to initiate this H-NAP which will
be a component of the National Adaptation Plan, and will focus mainly on environmental health,
communicable disease control and health emergency preparedness. Therefore, available strategies and
actions can increase resilience across a range of possible future climates while helping to improve
human health, livelihoods, social and economic well-being, and environmental quality (IPPC 5th, WG
III, 2014).
3.9 Climate Change’s Impact to the Health Sector and Vice Versa
The changing climate is heavily impacting the health sector. Several studies showed that climate
change is aggravating several communicable and non-communicable diseases such as malaria, dengue
fever, yellow fever, diarrhea, meningitis, asthma, heat stroke, heart diseases, lung cancer, etc. Malaria
is expanding from low lands to high lands of Ethiopia which were not known for malaria like Addis
Ababa. Diarrhea prevailed as an outbreak in Ethiopia following drought and flood events occurred

National Health Adaptation Plan to Climate Change
Page | 32
frequently in the past year. Scabies also occurred in large parts of Ethiopia in 2015/16 following El-
Ñino posed drought due to scarcity of water to keep personal hygiene.
Though it is not significant, flooding events occurred in significant places of Ethiopia in the past years
impaired the health service delivery due to destruction of roads, electric and water infrastructure.
However, predictions showed that the rainy days and rain intensity for Ethiopia will increase in the
future. If the rain intensity increases, definitely there will be more flooding events that can destruct
infrastructures including health infrastructures unless otherwise preventive measures taken ahead. The
burden to the health services would also increase as climate change aggravates natural disasters that
would cause social instability, physical damage, morbidity and mortality. Until mid-century, projected
climate change will impact human health mainly by exacerbating health problems that already exist.
Throughout the 21st century, climate change is expected to lead to increases in ill-health in many
regions and especially in developing countries with low income, as compared to a baseline without
climate change (IPCC 5th, WG III, 2015).
On other hand, health facilities use comparatively more energy and water to operate appropriately.
Energy is required in health facilities for heating and cooling in medical care units, for sterilization of
medical utensils and equipment, to run medical instruments and machines, to preserve medicines,
reagents and vaccine in refrigerators, for cooking food, etc. However, significant proportions of the
health facilities in Ethiopia are inaccessible to national electric grid. Consequently, these health
facilities use liquid carbon fuels to run electric generators, and solid carbon fuel for cooking and
boiling in their daily operations. Moreover, some of the wastes collected in health facilities burned in
incinerators which emit GHGs mainly CO2, and trace amounts of N2O, NH4 and S6O (Health Care
without Harm and Practice Green Health). Therefore, the health sector is contributing to Ethiopia’s
GHG emission though it is insignificant comparing to major GHGs contributing sectors, agriculture
and forest.
3.10 Vulnerable to Health impacts of Climate Change
Vulnerability is a function of exposure, sensitivity and adaptive capacity. There is risk of food
insecurity and the breakdown of food systems linked to warming, drought, flooding, and precipitation
variability and extremes particularly to poorer populations in urban and rural settings (IPCC 5th, WG
III, 2014). Because, poor people have little resource that required for food, medical expense,
transportation, energy, etc during disaster. A study showed that children from the poorest 20 per cent
of households are more than twice as likely to be stunted as those from the wealthiest 20 per cent.
Similarly, under-five mortality rates are almost twice as high for children in the poorest households as
for children in the richest (UN and Time for Global Action, 2015).
Rural population are more vulnerable to urban population as they were less accessible to quality health
service and improved sanitation facilities (UN and Time for Global Action, 2015) There is a risk of
loss of rural livelihoods and income due to insufficient access to drinking and irrigation water and
reduced agricultural productivity, particularly for farmers and pastoralists with minimal capital in
semi-arid regions (IPCC 5th, WGIII, 2014). Pastoralist communities are most vulnerable to climate
change posed drought as they need water badly not only for domestic purpose but also for their
livestock. Since majority of Ethiopia’s population live in rural areas and relied on subsistent
agriculture which is fully depend on rain fall, they are more vulnerable to drought than urban dwellers.
The Disaster Risk Management Commission (DRMC) report showed that most of the Productive
Federal Ministry of Health
Page | 33
Safety Net Programme (PSNP) and emergency recipients were residents of Somali and Afar regional
states respectively while PSNP recipients in Addis Ababa were relatively small in number
(FMOH/WHO, 2015).
Women and children are usually the most affected by malnutrition as they have more responsibility to
take care of the family and less capability to get food by themselves respectively. Women often
experience additional duties as labourers and caregivers as a result of extreme weather events and
climate change, as well as from society’s responses to climate change (e.g. male migration). Thus,
they face more psychological and emotional distress, reduced food intake and adverse mental health
outcomes due to displacement, and in some cases, increasing incidences of domestic violence (Climate
and Development Knowledge Network, 2015). Moreover, women put their health at risk while they
use of traditional biomass methods for cooking (ICSU and ISSC, 2015). Air pollution from traditional
biomass usage is a prime cause of premature deaths to children and chronic disease to women (ICSU
and ISSC, 2015).
Children and the elderly are often at higher risk due to narrow mobility, susceptibility to infectious
diseases, reduced caloric intake and social isolation. Young children are more likely to die from or be
severely compromised by diarrheal diseases and floods. Similarly, the elderly face disproportional
physical harm and death from heat stress, droughts and wildfires (Climate and Development
Knowledge Network, 2015).
4 Goal
This health national adaptation plan contributes to main goal of HSTP with the focus on to
make sure the health system is climate resilient.
5 Strategic Objectives
Enhance the early warning and surveillance in the context of health emergency risk
management
Building the capacity of health sector for realization of climate resilient health system
Enhance the resilience of health system in provision universal health coverage
Create enabling environment for health adaption to climate change implementation
6 Strategic Approaches
6.1 Mainstreaming climate change adaptation to Health Programmes
Strengthening the existing interventions is more effective than creating a new structure or function to
tackle climate change driven health consequences. Therefore, mainstreaming climate change
adaptation to relevant activities and duties of the health sector is crucial. For instance, adopting
building codes of health facilities by health sector to resist climate change effects, maximizing climate
information utilization by the health sector for predicting and preventing climate sensitive diseases
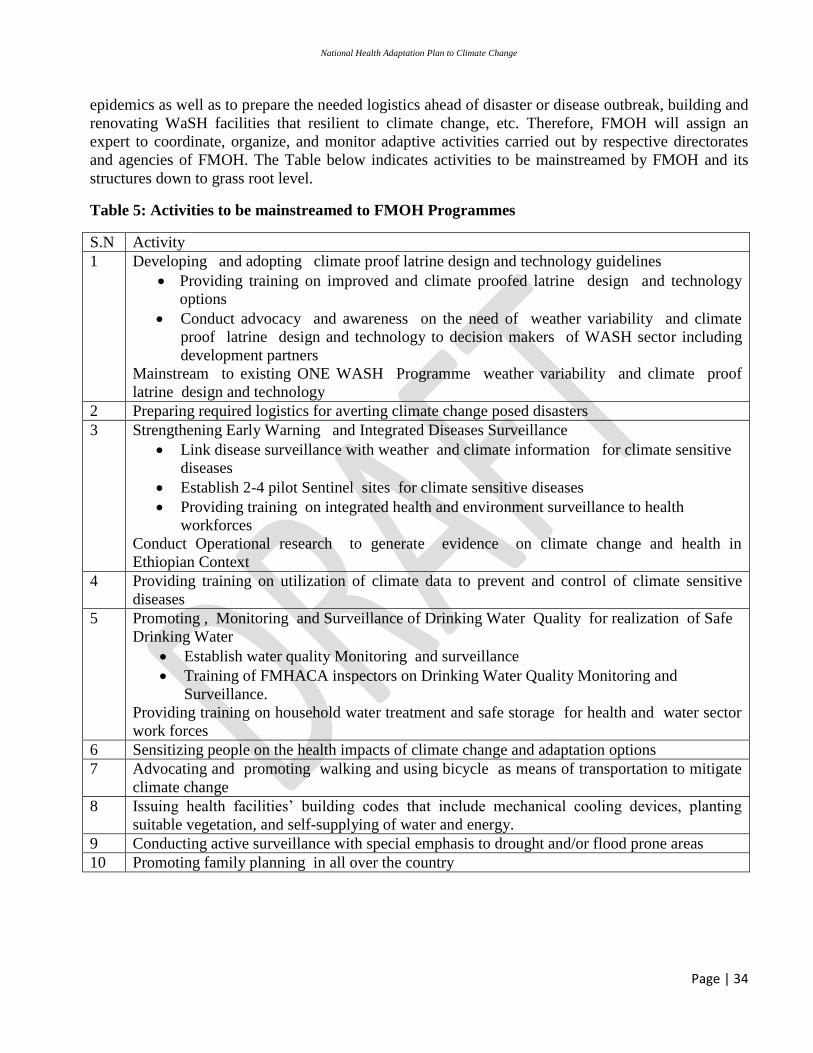
National Health Adaptation Plan to Climate Change
Page | 34
epidemics as well as to prepare the needed logistics ahead of disaster or disease outbreak, building and
renovating WaSH facilities that resilient to climate change, etc. Therefore, FMOH will assign an
expert to coordinate, organize, and monitor adaptive activities carried out by respective directorates
and agencies of FMOH. The Table below indicates activities to be mainstreamed by FMOH and its
structures down to grass root level.
Table 5: Activities to be mainstreamed to FMOH Programmes
S.N Activity
1 Developing and adopting climate proof latrine design and technology guidelines
Providing training on improved and climate proofed latrine design and technology
options
Conduct advocacy and awareness on the need of weather variability and climate
proof latrine design and technology to decision makers of WASH sector including
development partners
Mainstream to existing ONE WASH Programme weather variability and climate proof
latrine design and technology
2 Preparing required logistics for averting climate change posed disasters
3 Strengthening Early Warning and Integrated Diseases Surveillance
Link disease surveillance with weather and climate information for climate sensitive
diseases
Establish 2-4 pilot Sentinel sites for climate sensitive diseases
Providing training on integrated health and environment surveillance to health
workforces
Conduct Operational research to generate evidence on climate change and health in
Ethiopian Context
4 Providing training on utilization of climate data to prevent and control of climate sensitive
diseases
5 Promoting , Monitoring and Surveillance of Drinking Water Quality for realization of Safe
Drinking Water
Establish water quality Monitoring and surveillance
Training of FMHACA inspectors on Drinking Water Quality Monitoring and
Surveillance.
Providing training on household water treatment and safe storage for health and water sector
work forces
6 Sensitizing people on the health impacts of climate change and adaptation options
7 Advocating and promoting walking and using bicycle as means of transportation to mitigate
climate change
8 Issuing health facilities’ building codes that include mechanical cooling devices, planting
suitable vegetation, and self-supplying of water and energy.
9 Conducting active surveillance with special emphasis to drought and/or flood prone areas
10 Promoting family planning in all over the country
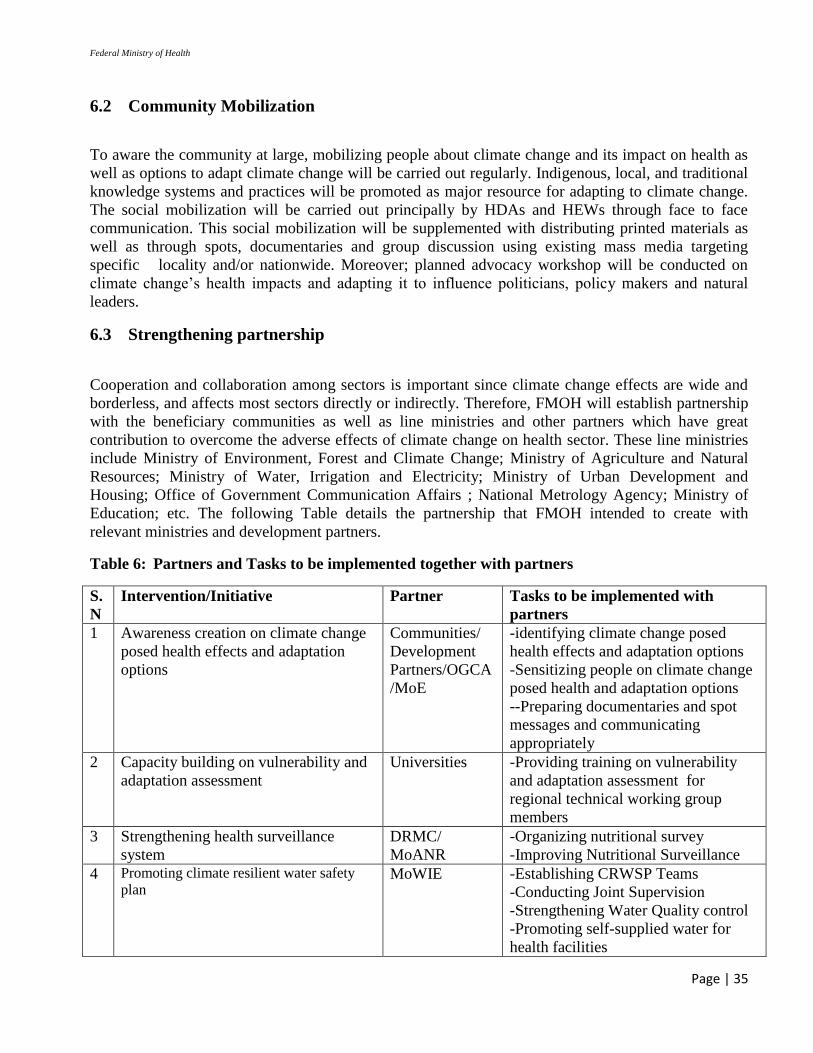
Federal Ministry of Health
Page | 35
6.2 Community Mobilization
To aware the community at large, mobilizing people about climate change and its impact on health as
well as options to adapt climate change will be carried out regularly. Indigenous, local, and traditional
knowledge systems and practices will be promoted as major resource for adapting to climate change.
The social mobilization will be carried out principally by HDAs and HEWs through face to face
communication. This social mobilization will be supplemented with distributing printed materials as
well as through spots, documentaries and group discussion using existing mass media targeting
specific locality and/or nationwide. Moreover; planned advocacy workshop will be conducted on
climate change’s health impacts and adapting it to influence politicians, policy makers and natural
leaders.
6.3 Strengthening partnership
Cooperation and collaboration among sectors is important since climate change effects are wide and
borderless, and affects most sectors directly or indirectly. Therefore, FMOH will establish partnership
with the beneficiary communities as well as line ministries and other partners which have great
contribution to overcome the adverse effects of climate change on health sector. These line ministries
include Ministry of Environment, Forest and Climate Change; Ministry of Agriculture and Natural
Resources; Ministry of Water, Irrigation and Electricity; Ministry of Urban Development and
Housing; Office of Government Communication Affairs ; National Metrology Agency; Ministry of
Education; etc. The following Table details the partnership that FMOH intended to create with
relevant ministries and development partners.
Table 6: Partners and Tasks to be implemented together with partners
S.
N
Intervention/Initiative Partner Tasks to be implemented with
partners
1 Awareness creation on climate change
posed health effects and adaptation
options
Communities/
Development
Partners/OGCA
/MoE
-identifying climate change posed
health effects and adaptation options
-Sensitizing people on climate change
posed health and adaptation options
--Preparing documentaries and spot
messages and communicating
appropriately
2 Capacity building on vulnerability and
adaptation assessment
Universities -Providing training on vulnerability
and adaptation assessment for
regional technical working group
members
3 Strengthening health surveillance
system
DRMC/
MoANR
-Organizing nutritional survey
-Improving Nutritional Surveillance
4 Promoting climate resilient water safety
plan MoWIE -Establishing CRWSP Teams
-Conducting Joint Supervision
-Strengthening Water Quality control
-Promoting self-supplied water for
health facilities
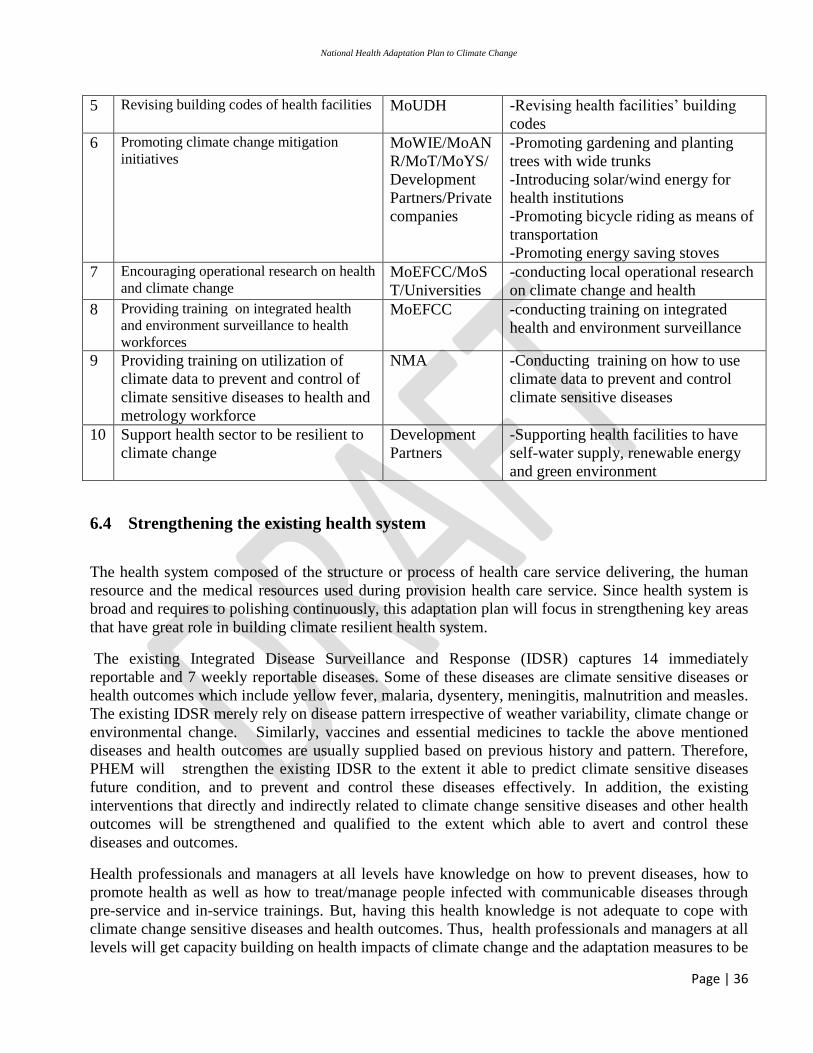
National Health Adaptation Plan to Climate Change
Page | 36
5 Revising building codes of health facilities
MoUDH -Revising health facilities’ building
codes
6 Promoting climate change mitigation
initiatives
MoWIE/MoAN
R/MoT/MoYS/
Development
Partners/Private
companies
-Promoting gardening and planting
trees with wide trunks
-Introducing solar/wind energy for
health institutions
-Promoting bicycle riding as means of
transportation
-Promoting energy saving stoves
7 Encouraging operational research on health
and climate change MoEFCC/MoS
T/Universities
-conducting local operational research
on climate change and health
8 Providing training on integrated health
and environment surveillance to health
workforces
MoEFCC -conducting training on integrated
health and environment surveillance
9 Providing training on utilization of
climate data to prevent and control of
climate sensitive diseases to health and
metrology workforce
NMA -Conducting training on how to use
climate data to prevent and control
climate sensitive diseases
10 Support health sector to be resilient to
climate change
Development
Partners
-Supporting health facilities to have
self-water supply, renewable energy
and green environment
6.4 Strengthening the existing health system
The health system composed of the structure or process of health care service delivering, the human
resource and the medical resources used during provision health care service. Since health system is
broad and requires to polishing continuously, this adaptation plan will focus in strengthening key areas
that have great role in building climate resilient health system.
The existing Integrated Disease Surveillance and Response (IDSR) captures 14 immediately
reportable and 7 weekly reportable diseases. Some of these diseases are climate sensitive diseases or
health outcomes which include yellow fever, malaria, dysentery, meningitis, malnutrition and measles.
The existing IDSR merely rely on disease pattern irrespective of weather variability, climate change or
environmental change. Similarly, vaccines and essential medicines to tackle the above mentioned
diseases and health outcomes are usually supplied based on previous history and pattern. Therefore,
PHEM will strengthen the existing IDSR to the extent it able to predict climate sensitive diseases
future condition, and to prevent and control these diseases effectively. In addition, the existing
interventions that directly and indirectly related to climate change sensitive diseases and other health
outcomes will be strengthened and qualified to the extent which able to avert and control these
diseases and outcomes.
Health professionals and managers at all levels have knowledge on how to prevent diseases, how to
promote health as well as how to treat/manage people infected with communicable diseases through
pre-service and in-service trainings. But, having this health knowledge is not adequate to cope with
climate change sensitive diseases and health outcomes. Thus, health professionals and managers at all
levels will get capacity building on health impacts of climate change and the adaptation measures to be

Federal Ministry of Health
Page | 37
taken depending to the context and with priority to regions or places frequently affected with climate
change posed disasters and climate sensitive diseases. The capacity building on health impacts of
climate change and adaptive measures to health professionals and managers will be carried out by
FMOH in collaboration with Universities and development partners.
Since the health management information system of FMOH reformed 5 years back, significant change
has been observed in the HMIS process like using computer to encode data and generating information
at regular interval. However, There is still late and incomplete reporting at each level which will not
compatible with proactive response required to prevent or minimize adverse effect of climate change
posed health outcomes.
Therefore, the health management information system has to be strengthened in a way that it will be
able to produce timely and quality information for decision making. This includes establishing data
base system and text messaging (SMS) technology which enables data encoders to put data online as
well as the health managers to do data analysis and to use the information for timely decision.
7 Key Intervention Areas
The most effective vulnerability reduction measures for health in the near-term are programs that
implement and improve basic public health measures such as provision of clean water and sanitation,
secure essential health care including vaccination and child health services, increase capacity for
disaster preparedness and response, and alleviate poverty (IPCC 5th , WG III, 2014). The key
interventions are selected based on the vulnerability and adaptation assessment findings, the situational
analysis done and relevant sustainable development goals. These are::
7.1 Strengthening and Expanding Health Infrastructure
Health as a precondition, indicator and outcome of sustainable development and as part of the post-
2015 development agenda, robust efforts are needed to sustain gains made to date and integrate
additional health issues into a broad health and development agenda. This new health agenda also
requires expanding the scope of health efforts to ensure access to services, prevent exclusion and
protect people through the extension of universal health coverage. Experiences also showed that
countries would be more vulnerable if they lack basic health services and the capacity for early
detection, comprehensive reporting and a rapid response system for public health outbreaks. For
countries without these basic health provisions, shocks created by emerging or re-emerging diseases or
other events, such as climate change, can lead to even bigger crises (UN and Time for Global Action,
2015).
Therefore, it is crucial to strengthen the existing health facilities to provide quality and to date health
services as well as to construct more new health facilities where people are less accessible to health
services. The health physical infrastructures themselves need to be climate resilient so that the
health facilities will be ready to provide urgent lifesaving medical care whenever climate posed
disaster occurred and withstand climate shock. This includes having standing walls to prevent inland
floods, having self-supply of water and energy, having natural and man-made ventilation, etc.

National Health Adaptation Plan to Climate Change
Page | 38
7.2 Strengthening existing Integrated Disease Surveillance and Response
Strengthening the capacity for early warning, risk reduction, and management of national and global
health risks is important to reduce disaster related morbidity, mortality and economic loss (ICSU and
ISSC, 2015). Therefore, strengthening the existing Integrated Disease Surveillance and Response
(IDSR) is crucial. Surveillance officers will get capacity building training to on how to use climate
data to predict and prevent climate sensitive diseases transmission. This training also enhances health
institutions’ emergency preparedness and response with emphasis to drought, flood and extreme heat
prone areas since drought, flood and extreme heat could cause some disasters which in turn cause
morbidity, physical injuries, mental disorders, and properties’ damage and life loss directly as well as
induce some disease outbreaks that lead to catastrophic events. Having a strong IDSR, health facilities
will be informed to avail medicines to known climate sensitive diseases in time, to develop and use
effective vaccines for some climate sensitive diseases, and to allocate adequate budget for activities
that prevent and reduce climate change posed diseases and injuries.
Conducting frequent active surveillance of nutrition and climate sensitive diseases based on trends of
previous malnutrition and diseases outbreaks as well as national and global climate predictions is also
crucial. Accordingly, active surveillance of nutrition will be carried out at places frequently hit by
drought such as south and east Tigray, Eastern Amhara, Eastern Oromiya, South Omo, Afar and
Somali. Similarly, active surveillance of malaria following flooding and an interrupted rainfall will be
carried out in places where hit by flood and malaria is a risk respectively.
Diarrhoea is more prevalent in the low lands due to the fact the humidity there favourable to flies
breeding which are usually involved in the transmission of diarrhea in addition to limited availabilities
of WaSH facilities there. Moreover, diarrhea prevalence increases in rainy season in general as water
sources contaminated by run-off water; and pathogens survive relatively long time during rainy
season. Therefore, diarrhea surveillance will be tightened during the rainy season
During drought, people may not get adequate water for domestic purpose especially to keep personal
hygiene. Thus, scabies were prevalent in places where hit by El-Ñino caused drought in 2015/2016.
Therefore, surveillance of water scarcity diseases such as scabies and trachoma will be tightened
during drought events.
7.3 Promoting climate resilient Sanitation facilities
FMOH and its partners will provide practical training on improved and climate proofed sanitation
facility options for selected environment health professionals aiming to replicate the sanitation
facilities at grass root level. Moreover, improved sanitation facilities especially climate resilient
sanitation facilities will be promoted and delivered as an option by FMOH through Health Extension
Programme at all levels. A climate resilient latrine options will also be demonstrated at each region by
respective regional health bureau with technical assistance from FMOH. Similarly, FMOH will
organize experience sharing that encourage waste recycling, waste reuse and waste conversion.
Similar experience sharing will be organized by regional health bureaus in their respective region.
7.4 Promoting climate resilient water safety plan
Federal Ministry of Health
Page | 39
Climate change impacts water availability. Improving water use efficiency and water management has
adaptation benefits. Therefore, preventing water scarcity through water conservation and keeping the
water available safe is vital to overcome climate change impact on water sources. Climate resilient
water safety plan (CRWSP) is an approach to improve both water quality and quantity by identifying
existing and potential hazard throughout the water supply system and undertaking remedial action
based on risk priorities. To keep water safe, involvement and contribution of relevant sectors is
inevitable. The role of health sector in implementing CRWSP is monitoring of water quality at
intervals, and promoting safe storage and water treatment at household level. These roles play great
in ensuring the quality of drinking water in both regular and emergency times. Therefore, FMOH will
monitor water quality of sample water points at interval, and promote household water treatment and
safe storage at national level. Similarly, the health regulatory bodies and HEWs will monitor water
quality of water sources and promote household water treatment and safe storage respectively at grass
root level. Moreover, FMOH in collaboration with regional health bureaus will provide capacity
building in sanitary surveillance which will be accompanied with laboratory based water quality
testing.
7.5 Promoting Family planning
Despite of the environmental rehabilitation including soil conservation and afforestation have been
carried out with full government support in Ethiopia, still there is sever land degradation in major
places. Since majority of the people use bio-mass as a source of energy and expanding of land for
cultivation due to population pressure, tackling environmental degradation strategically helps to
mitigate climate change. Therefore, FMOH will promote family planning services and options of
contraceptives all over the country with special attention at vulnerable places where drought recurred,
severe land degradation and dense population exist using all means like health extension programme
and health development army to curb the population pressure.
7.6 Revising building codes of health facilities
The average annual temperature globally is increasing and causing warming everywhere. Therefore, a
means of cooling is required at hot places where people reside, work and sleep. As a result, FMOH
will work with Ministry of Urban Development and Housing (MoUDH) collaboratively in revising
building codes of health institutions so that health institutions will have appropriate engineering design
to overcome weather extremes that include having better natural ventilation and plants for shading.
This will be applied while constructing new one and renovating existing health facilities. Moreover;
FMOH will also incorporate a structure of self-supplied water source into the plan of health
institutions where no other means of water supply or scarcity of water from common sources during
renovation or building of new health institution.
7.7 Promoting climate change mitigation initiatives
Adaptation can reduce climate change risks and bring immediate benefits. But, even with significant
resource and institutional investment on adaptation, for the most vulnerable there may be residual risks
to food security, access to water, health and human security. There may be limits to adaptation in the
long term. And the only way to reduce these risks is through global action to reduce greenhouse gas
emissions. Reducing emissions also has multiple benefits – less pollution, less damage to ecosystems,

National Health Adaptation Plan to Climate Change
Page | 40
and better health (Climate and Development Knowledge Network, 2014). Therefore, many mitigation
actions have significant health co-benefits (ICSU and ISSC, 2015). Thus, the health sector will play its
role to achieve zero net carbon emission target of the nation.
Health facilities need to have continuous electric power supply as they have to provide health care
service for 24 hours of a day and seven days of a week. Therefore, FMOH in collaboration with
MoWIE will work health facilities to have their own source of renewable energy with priority to
health facilities located in place where no access to the main grid of electricity, and to compensate
energy interruption from common source. Moreover, hospitals which have remarkable inpatients will
generate and use biogas energy from latrines and kitchen wastes for cooking, sterilization, boiling, etc.
Cities that provide infrastructure to encourage walking and cycling could improve the health of their
populations. Reducing urban traffic could also improve cardiovascular health and reduce sleep
disturbances (Climate and Development Knowledge Network, 2014). Therefore, FMOH will promote
and encourages urban dwellers to walk on foot daily and/or to ride a bike since it is helpful practice to
prevent some non-communicable diseases as well as to reduce carbon emission. FMOH will also
promote and encourage households to practice gardening and to plant edible fruits as they have triple
advantages namely a subsistence to household nutrition, providing shading service and absorbing CO2
through HEP and HDA.
7.8 Promoting community health insurance scheme
Ethiopia has launched community based health insurance scheme where all community members get
comprehensive health care with minimum payment of membership. Health Insurance Agency (HIA)
will expand and strengthen the initiation of community based health insurance scheme for the benefit
of the poor and destitute community members through HDAs and civic societies’ structures. Since
drought and flood prone areas being affected severely as climate change speed up the occurrence of
these events and aggravate their consequence, people in these areas being challenged to afford the
health expenses individually. Therefore, drought and flood prone areas will get priority while HIA is
expanding community based health insurance scheme in the country.
7.9 Advocating and creating awareness on climate change and health
FMOH will advocate climate change effects on health sector to political leaders, policy makers and
influential people so that they would play their role in communicating and implementing H-NAP.
FMOH and respective regional health bureaus (RHBs) in collaboration with development partners will
also provide master training of trainers (MTOT) about climate sensitive diseases, climate posed
disasters and adaptation options to whom recruited by regional health bureaus. This training will be
cascaded to grass root level by MTOTs and TOTs. FMOH in collaboration with NMA will also train
surveillance officers, health experts and meteorologists on how to use climate data for diseases
surveillance.
The HEWs and HDAs will provide awareness creation to their community on climate change effects
on health and adaptation options based on short term training they got and reading materials they
collected. This community awareness creation will be supported by messages and discussions
transmitted through mass medias like radio and television.

Federal Ministry of Health
Page | 41
7.10 Encouraging operational research on health and climate change
Since there is little information about the extent of climate change and its impact at micro level,
localized operational research on trend of climate change and its impact is important for accurate
planning and intervention. Therefore, FMOH and regional health bureaus will encourage and support
universities, research institutions and individual researchers to conduct operational research in their
respective regions on the contribution of climate change in aggravating climate sensitive diseases, the
health impacts of climate change and disasters posed by climate change, endogenous coping
mechanisms practiced by communities, etc.
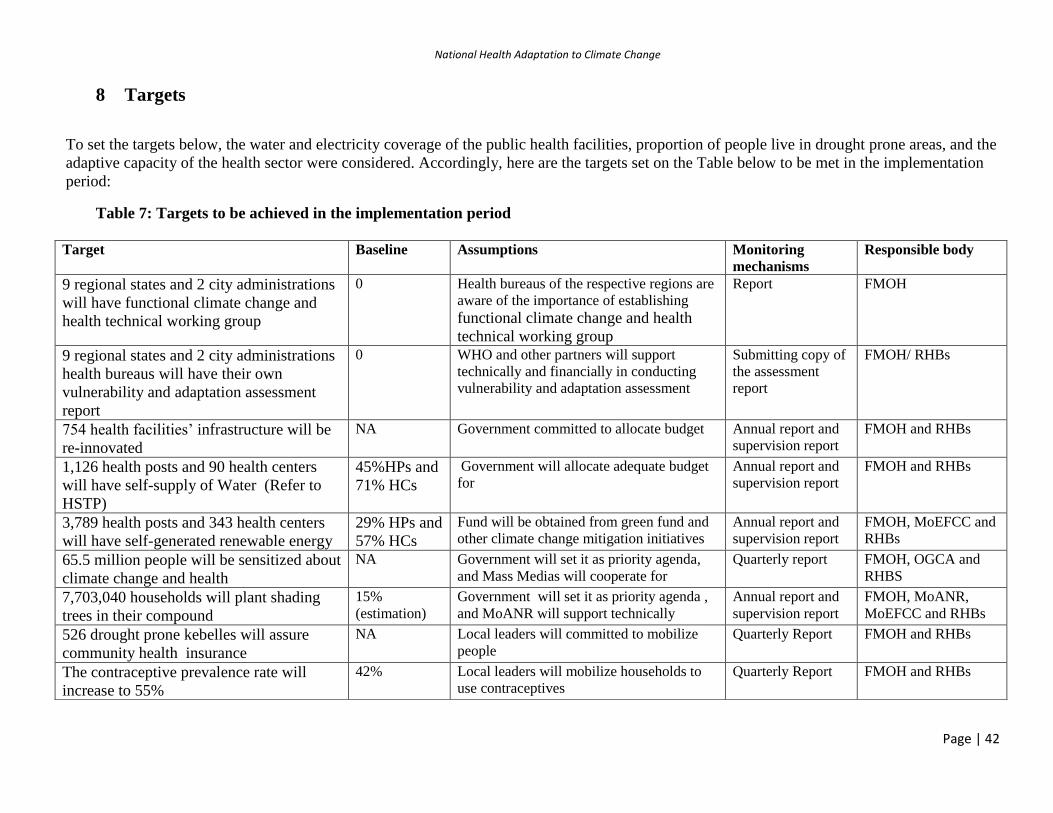
National Health Adaptation to Climate Change
Page | 42
8 Targets
To set the targets below, the water and electricity coverage of the public health facilities, proportion of people live in drought prone areas, and the
adaptive capacity of the health sector were considered. Accordingly, here are the targets set on the Table below to be met in the implementation
period:
Table 7: Targets to be achieved in the implementation period
Target Baseline Assumptions Monitoring
mechanisms
Responsible body
9 regional states and 2 city administrations
will have functional climate change and
health technical working group
0 Health bureaus of the respective regions are
aware of the importance of establishing
functional climate change and health
technical working group
Report FMOH
9 regional states and 2 city administrations
health bureaus will have their own
vulnerability and adaptation assessment
report
0 WHO and other partners will support
technically and financially in conducting
vulnerability and adaptation assessment
Submitting copy of
the assessment
report
FMOH/ RHBs
754 health facilities’ infrastructure will be
re-innovated
NA Government committed to allocate budget Annual report and
supervision report
FMOH and RHBs
1,126 health posts and 90 health centers
will have self-supply of Water (Refer to
HSTP)
45%HPs and
71% HCs
Government will allocate adequate budget
for
Annual report and
supervision report
FMOH and RHBs
3,789 health posts and 343 health centers
will have self-generated renewable energy
29% HPs and
57% HCs
Fund will be obtained from green fund and
other climate change mitigation initiatives
Annual report and
supervision report
FMOH, MoEFCC and
RHBs
65.5 million people will be sensitized about
climate change and health
NA Government will set it as priority agenda,
and Mass Medias will cooperate for
Quarterly report FMOH, OGCA and
RHBS
7,703,040 households will plant shading
trees in their compound
15%
(estimation)
Government will set it as priority agenda ,
and MoANR will support technically
Annual report and
supervision report
FMOH, MoANR,
MoEFCC and RHBs
526 drought prone kebelles will assure
community health insurance
NA Local leaders will committed to mobilize
people
Quarterly Report FMOH and RHBs
The contraceptive prevalence rate will
increase to 55%
42% Local leaders will mobilize households to
use contraceptives
Quarterly Report FMOH and RHBs

National Health Adaptation to Climate Change
Page | 43
9 Budget
The budget stated here below to carry out planned activities that gear to achieving the targets and objectives of national health adaptation
plan in the coming four years is minimal as most of the activities will be mainstreamed to the existing initiatives, projects and programmes;
and no need additional cost. Of the total budget required to carry out the planned activities, 809,623,200.00 (47.5%) will be covered by
FMOH and respective regional health bureaus, and will be invested for social mobilization at grass root level.
Table 6: Budget required in implementation of the planned activities
S.N Milestone Activities
Budget in Birr
Total required
Budget in Birr
Secured Budget
In Birr
Budget Deficiency in
Birr
Potential source of
budget
1 Creating Functional Regional Technical Working
Group
11,880.00 0.00 11,880.00 WHO
2 Regional Vulnerability and Adaptation
Assessment
590,110.00 0.00 590,110.00 WHO
3 Developing regional health adaptation plan 282,830.00 0.00 282,830.00 WHO
4 creating awareness on health effects of climate
change and Adaptation options
663,724,650.00 655,836,000.00 7,888,650.00 WHO, CDC
5 promoting climate resilient sanitation facilities 2,697,280.00 0.00 2,697,280.00 UNICEF, GIZ, USAID,
World Bank
6 Expanding health service accessibility to natural
disaster exposed areas
188,500,000 0 188,500,000.00 UNICEF, GIZ, USAID,
World Bank
7 Promoting household water treatment and safe
storage
2,837,820.00 0.00 2,837,820.00 WHO,UNICEF, Water
Aid, etc
8 Revising and applying climate resilient health
facilities building codes
115,065,000.00 115,065,000.00 FMOH, UNICEF, GIZ,
USAID, World Bank
9 Promoting climate change mitigation initiatives 653,475,400.00 77,030,400.00 576,445,000.00 FMOH, MoEFCC
10 Expanding Community Health Insurance with
priority to drought and flood prone areas
2,073,810.00 0.00 2,073,810.00
CDC, USAID
11 Promoting family planning through HEP and
HDAs
76,756,800.00 76,756,800.00 0.00
FMOH
GRAND TOTAL 1,704,796,316.00 809,623,200.00 895,173,116.00

National Health Adaptation to Climate Change
Page | 44
10 Resources mobilization
Since the national health adaptation plan will be mainstreamed to routine activities of the
ministry, no need to allocate additional resources for most activities indicated in this adaptation
plan. However, there are some funding opportunities like Least Developed Countries Fund,
Special Climate Change Fund, Adaptation Fund and Green Climate Fund for health adaptation
activities which may have budget scarcity. The budget in deficit to implement national health
adaptation to climate change would be generated from Ministry of Environment, Forest and
Climate Change, and Development Partners.
11 Monitoring and Evaluation
According to logics and previous experiences, immediate results and gradual changes are
expected during and after implementing this H-NAP respectively. To obtain the intended
outputs, the planned activities have to be implemented using the required resources such as
human resource, materials, organizational setup, budget, etc. The outputs in turn also expected
to bring intended changes and impacts on community health. Accordingly, the logic model
prepared for the H-NAP is illustrated on Figure 14 below.
Health institutions and the regional health sector will record baseline information on priority
climate sensitive diseases, climate variables (rainfall, temperature, humidity, wind), socio-
economic (poverty, demographics and occupation) and current level of interventions and health
system capacity prior to starting to adapt climate change effects to measure change after the
period of implementation of this H-NAP. The baseline information will be obtained by
reviewing documents and/or conducting survey.

Federal Ministry of Health
Page | 45
Figure 13: Logic model of H-NAP implementation and expected results
Inp
ut
Act
ivit
y
Ou
tpu
t
Ou
tco
me
Imp
act
Creating Functional
Regional Technical Working
Group well existed R-TWG
Regional Vulnerability and
Adaptation AssessmentVulnerability & Adaptation
Assessment Report
Developing Regional Health
Adaptation PlanContextualized H-NAP
creating awareness on
health effects of climate
change and Adaptation
options
People awared of climate
change's Health effect and
adaptation options
promoting climate resil ient
sanitation facil ities
people encouraged to have
climate resil ient Sanitation
Facil ities
Expanding health services
accessiblity to natural
disaster exposed areas people have more access to
health services
Promoting household water
treatment and safe storagehouseholds practiced water
treatment & proper storage
of water
Revising and applying
climate resil ient health
facil ities building codes
the new building codes
applied to builing or
renovating health facil ities
Promoting climate change
mitigation initiatives
people encouraged to
practice mitigation
activities
Expanding Community
Health Insurance with
priority to drough and flood
prone areas
people encouraged to have
health insurance
Promoting family planning
through HEP and HDAs
people inquired to have
contraceptives
clim
ate
chan
ge p
ose
d M
orb
idit
y &
Mo
rtal
ity
Red
uce
d
con
du
sive
en
viro
men
t cr
eate
d t
o
imp
lem
ent
HN
AP
Po
licie
s an
d
Stra
tegi
esB
ud
get
man
ual
s an
d
guid
elin
esTr
ain
ing
Mat
eria
lsTr
ain
ed T
ech
nic
al
Per
son
inci
den
ce a
nd
pre
vale
nce
of
clim
ate
sen
siti
ve
hea
lth
ou
tco
mes
Peo
ple
sat
isfi
ed w
ith
hea
lth
serv
ices
pro
vid
ed

National Health Adaptation Plan to Climate Change
Page | 46
Climate relevant health indicators such as the incidences of climate-sensitive diseases,
prevalence of climate-sensitive diseases, climate induced morbidity and climate induced
mortality will be incorporated within the national health monitoring system. Moreover, health
related indicators such as water supply schemes carrying out water quality monitoring, water
supply schemes operating according to CRWSP, proportion of stunted children, proportion of
rivers regulated regularly for contamination and households with electricity will be advocated to
be incorporated into the adaptation/mitigation monitoring systems of health determining sectors
like water, DRMC, environment, energy, etc.
The data/information required to be reported are adaptation activities performed, morbidity and
mortality due to climate sensitive diseases, and capacity building activities performed. Health
facilities and woreda health offices ought to report to respective higher authorities on monthly
basis while regional health bureaus will report every quarter (3 months) to FMOH. Similarly,
FMOH will share the compiled report to NAPA and WHO as well as to relevant health
programmes to ensure mainstreaming of climate change adaptation.
11.1 Indicators
Process Indicators
Input Proportion of budget utilized
Number of guidelines and manuals distributed
Output Proportion of well existed regional TWGs
Proportions of RHBs which have their own VA assessment Report
Number of households (HHs) aware of climate change and health
% of HHs who encouraged to have improved latrine
% of health facilities applied the new building codes
% of households initiated to practice HH water treatment and Safe storage
Outcome Coverage of HHs with improved latrine
% kebeles with blanket coverage of community insurance
Contraceptive prevalence rate
Number of households who planted trees in their compound
% health facilities with self-generated renewable energy supply
% health facilities with self-water supply
Malaria morbidity rate
Diarrhoea morbidity rate among children under 5 years
Impact Life expectancy at birth
Child mortality rate
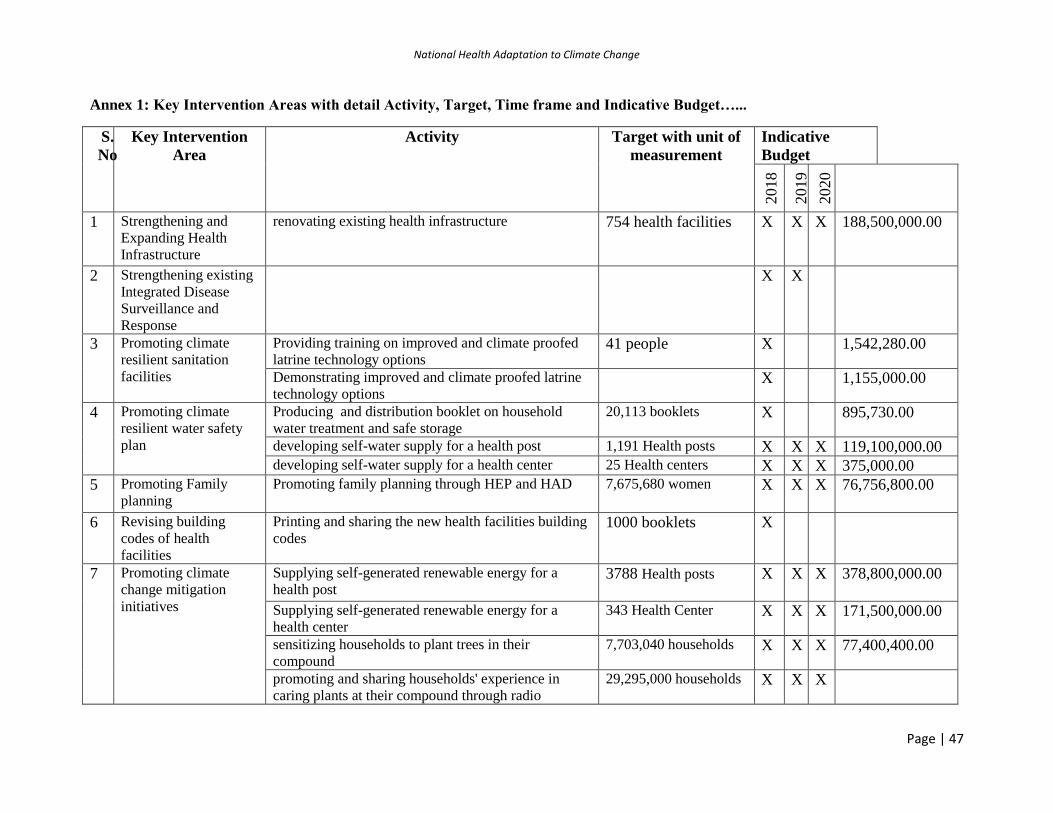
National Health Adaptation to Climate Change
Page | 47
Annex 1: Key Intervention Areas with detail Activity, Target, Time frame and Indicative Budget…...
S.
No
Key Intervention
Area
Activity Target with unit of
measurement
Indicative
Budget
2018
2019
2020
1 Strengthening and
Expanding Health
Infrastructure
renovating existing health infrastructure 754 health facilities X X X 188,500,000.00
2 Strengthening existing
Integrated Disease
Surveillance and
Response
X X
3 Promoting climate
resilient sanitation
facilities
Providing training on improved and climate proofed
latrine technology options 41 people X 1,542,280.00
Demonstrating improved and climate proofed latrine
technology options X 1,155,000.00
4 Promoting climate
resilient water safety
plan
Producing and distribution booklet on household
water treatment and safe storage 20,113 booklets X 895,730.00
developing self-water supply for a health post 1,191 Health posts X X X 119,100,000.00 developing self-water supply for a health center 25 Health centers X X X 375,000.00
5 Promoting Family
planning
Promoting family planning through HEP and HAD 7,675,680 women X X X 76,756,800.00
6 Revising building
codes of health
facilities
Printing and sharing the new health facilities building
codes 1000 booklets X
7 Promoting climate
change mitigation
initiatives
Supplying self-generated renewable energy for a
health post 3788 Health posts X X X 378,800,000.00
Supplying self-generated renewable energy for a
health center
343 Health Center X X X 171,500,000.00
sensitizing households to plant trees in their
compound
7,703,040 households X X X 77,400,400.00
promoting and sharing households' experience in
caring plants at their compound through radio
29,295,000 households X X X

National Health Adaptation Plan to Climate Change
Page | 48
promoting walk on foot and/or riding bike through
television spots
8,695,500 households X X X
promoting walk on foot and/or riding bike experience
through television
8,695,500 households X X X
promoting walk on foot and/or riding bike through
radio spots
29,295,000 households X X X
promoting walk on foot and/or riding bike experience
through radio
29,295,000 households X X X
bike racing among children, youth and elders in towns 600,000 people X X X
8 Promoting community
health insurance
scheme
experience sharing community based insurance
among kebelles leaders frequently hit by natural
disaster
526 people X X X 1,119,066.00
9 Encouraging
operational research on
health and climate
change
Providing TOT training on V and A to University
lecturers
20 people X 243,710.00
Providing training on V and A for regional TWG
members 120 people X 346,400.00
10 Capacitating health
professionals on
climate change and
health
Providing TOT training on climate change and
health 38 people X 319,430.00
Providing training on climate change and health 2920 people X 4,373,200.00 Conducting Advocacy workshop for leaders 93 people X 229,510.00 Sensitizing people on health impacts of climate
change and adaptation options through face to face
communication
65,583,600 people X X X 658,786,510.00
Sensitizing people on health impacts of climate
change and adaptation options through television
spots
8,695,500 people X X X
Sensitizing people on health impacts of climate
change and adaptation options through poster
11,383,200 people X X X
Sensitizing people on health impacts of climate
change and adaptation options through leaflets
13,392,000 people X X X
National Health Adaptation to Climate Change
Page | 49
Annex 2: References
1. Greenhouse Gas Basics, Climate Change and Agriculture Fact Sheet, Michigan University, 2011, and
retrieved from http://msue.anr.msu.edu/uploads/234/62936/Greenhouse_Gas_Basics.pdf 2. Central Statistical Agency Population Projections for Ethiopia 2007-2037, CSA, 2007, and retrieved
from http://www.csa.gov.et/images/general/news/icps2012pro_report.pdf 3. Ethiopia’s Climate-Resilient Green Economy strategy, FDRE, 2011, and retrieved from
http://www.undp.org/content/dam/ethiopia/docs/Ethiopia%20CRGE.pdf
4. Vulnerability and Adaptation Assessment of Health to Climate Change in Ethiopia, FMOH /WHO ,
2015
5. Millennium Development Goals Report-Ethiopia, NPC and UN-Ethiopia, 2014, and retrieved from
http://www.undp.org/content/dam/ethiopia/docs/EthiopiaMDG%202014%20Final%20final.pdf
6. Health and Health Related Indicators, FMOH, 2011 7. Health and Health Related Indicators, FMOH, 2016b and retrieved from
http://www.dktethiopia.org/sites/default/files/PublicationFiles/Health%20and%20Health%20Related%
20Indicator%202008.pdf
8. SITUATION ANALYSIS AND NEEDS ASSESSMENT, FDRE, 2010, and retrieved from
http://www.unep.org/roa/hesa/Portals/66/HESA/Docs/SANA_docs/SANA-Ethiopia.pdf
9. Health Sector Transformation Plan, FMOH, 2016
10. The geographic distribution of dengue fever and the potential influence of global climate
change, Esther et.al, 2010, and retrieved from
http://journal.tropika.net/scielo.php?script=sci_arttext&pid=S2078-86062010005000001
11. Review of Targets for the Sustainable Development Goals: The Science Perspective, ICSU and ISSC,
2015, and retrieved from http://www.icsu.org/publications/reports-and-reviews/review-of-targets-for-
the-sustainable-development-goals-the-science-perspective-2015/SDG-Report.pdf
12. CLIMATE AND HEALTH COUNTRY PROFILE – 2015 ETHIOPIA, WHO and UNFCC, 2015, and
retrieved http://reliefweb.int/sites/reliefweb.int/files/resources/PHE-country-profile-
Ethiopia.pdf
13. Protecting Health from Climate Change, WHO, 2008, and retrieved from
http://www.who.int/world-health-day/toolkit/report_web.pdf
14. Summary for Policymakers, IPCC 5th , WR III, 2014, and retrieved from
https://www.ipcc.ch/pdf/assessment-report/ar5/wg3/ipcc_wg3_ar5_summary-for-
policymakers.pdf
15. The IPCC’s Fifth Assessment Report, What’s in it for Africa? Climate and Development
Knowledge Network, 2014 retrieved from http://cdkn.org/wp-
content/uploads/2014/04/AR5_IPCC_Whats_in_it_for_Africa.pdf
16. HEALTH POLICY OF THE TRANSITIONAL GOVERNMENT OF ETHIOPIA, TGoE, 1993, and retrieved from
http://cnhde.ei.columbia.edu/files/4/1/2004-Oct-Tue-040225.pdf
17. RAPID ASSESSMENT OF DRINKINGWATER QUALITY IN THE FEDERAL DEMOCRATIC REPUBLIC OF
ETHIOPIA COUNTRY REPORT, WHO and UNICEF, 2010, and retrieved from
https://www.wssinfo.org/fileadmin/user_upload/resources/RADWQ_Ethiopia.pdf
18. WHO guidelines for indoor air quality: household fuel combustion, WHO, 2014, and
retrieved from http://apps.who.int/iris/bitstream/10665/141496/1/9789241548885_eng.pdf
19. Assessing climate change vulnerability in East Africa, Global Water Initiative, 2010, and retrieved from http://www.care.or.ke/images/PDF/GWI_CVCA_CS_Sept11.pdf
National Health Adaptation Plan to Climate Change
Page | 50
20. Local innovation in climate-change adaptation by Ethiopian pastoralists, yohannes Gebremichael and
Mebrahtu Kifle, 2009, and retrieved from
http://www.prolinnova.net/~prolin/sites/default/files/documents/thematic_pages/climate_change_
pid/2009/Ethiopia%20pastoral%20climate-change%20adaptation%20FINAL%20_2_.pdf
21. CLIMATE CHANGE NATIONAL ADAPTATION PROGRAMME OF ACTION (NAPA) OF ETHIOPIA, NMA,
2007, and retrieved from https://unfccc.int/resource/docs/napa/eth01.pdf
22. Addressing Climate Change in the Health Care Setting Opportunities for Action, Health Care
without Harm & Practice Green Health, and retrieved from
https://practicegreenhealth.org/pubs/toolkit/reports/ClimateChange.pdf
23. Ethiopia Environmental and Climate Change policy brief, Emelie César Anders Ekbom, 2013, and
retrieved from http://sidaenvironmenthelpdesk.se/wordpress3/wp-
content/uploads/2013/05/Ethiopia-Environmental-and-Climate-Change-policy-20130527.pdf
24. Progress on sanitation and drinking water – 2015 update and MDG assessment, WHO and UNICEF,
2015 and retrieved from
http://files.unicef.org/publications/files/Progress_on_Sanitation_and_Drinking_Water_2015_
Update_.pdf
25. Preventing disease through healthy environments, A global assessment of the burden of disease from environmental risks, WHO, 2016, and retrieved from http://apps.who.int/iris/bitstream/10665/204585/1/9789241565196_eng.pdf
26. Prevalence and risk factors of malaria in Ethiopia, Ayele et al, 2012, and retrieved from
https://malariajournal.biomedcentral.com/articles/10.1186/1475-2875-11-195
27. World Health Statistics, WHO, 2015, and retrieved from
http://apps.who.int/iris/bitstream/10665/170250/1/9789240694439_eng.pdf
28. Ethiopia National Malaria Indicator Survey, EPHI/FMOH, 2015 and retrieved from https://www.ephi.gov.et/images/pictures/download2009/MIS-2015-Final-Report-December-_2016.pdf
29. Demographic and Health Survey-Key Indicators Report, CSA, 2016, and retrieved from http://pdf.usaid.gov/pdf_docs/Pnads027.pdf
30. ETHIOPIA Demographic and Health Survey , CSA, 2016b, and retrieved from https://dhsprogram.com/pubs/pdf/FR328/FR328.pdf
31. ETHIOPIA’S FIFTH NATIONAL HEALTH ACCOUNTS HIGHLIGHT OF MAJOR FINDINGS BRIEFING NOTES, FMOH, 2014 and retrieved from https://www.hfgproject.org/wp-content/uploads/2014/04/Ethiopia-NHA-Findings-Briefing-Notes.pdf
32. RURAL ELECTRIFICATION IN ETHIOPIA: OPPORTUNITIES AND BOTTLENECKS, Aklilu Dalelo, 2003 and retrieved https://www.zef.de/fileadmin/webfiles/renewables/praesentations/Dalelo_rural%20electrification%20ethiopia.pdf
33. Ethiopia Service Provision Assessment plus Census, EPHI/FMOH, 2015