Embed Size (px)
Citation preview
NATIONAL HEALTH ACCOUNTS
1
NATIONAL HEALTH ACCOUNTS
Financial year 2002, 2003 and 2004
REPUBLIC OF THE GAMBIA
DEPARTMENT OF STATE FOR HEALTH & SOCIAL WELFARE THE QUADRANGLE
BANJUL, THE GAMBIA
NOVEMBER 2007
NATIONAL HEALTH ACCOUNTS
2
Table of Contents Page
Table of Contents (i)
List of Tables (ii)
List of Figures (iii)
Abbreviations and Acronyms (iv)
Foreword (v)
Acknowledgements (vi)
Executive Summary (vii)
Chapter 1: Introduction
Chapter 2: Background
Chapter 3: Methods and Sources of Data
Chapter 4: Main NHA Findings
Chapter 5: Recommendations
Chapter 6: Conclusion
Chapter 7: Further Analysis of Current Health Financing System
References [End of each chapter]
Annexes
Matrix I
Matrix II
Matrix III
NATIONAL HEALTH ACCOUNTS
3
List of Tables Page
Table 1: Number of various types of health facilities in The Gambia
Table 2: Distribution of health workers in ECOWAS countries
Table 3.1 Breakdown of the categories
NATIONAL HEALTH ACCOUNTS
4
List of Figures Page
Figure 2.1: ECOWAS Member States
in 2006 (Population in Million)
Figure 2.2: Adult literacy rate and combined enrolment ratios for primary,
Secondary and tertiary schools in ECOWAS
Figure 2.3a: Value added by Type of economic activity – millions of Dalasis
Figure 2.3b: Value added by type of economic activity in 1999/2000
Figure 2.3c: Value added by type of economic activity in 2004/2005
Figure 2.4: Life expectancy at birth among ECOWAS countries in 2004
Figure 2.5: Under-5 mortality rate (per 1000LB) for ECOWAS countries in 2004
Figure 2.6: Adult mortality rate per 1000 among ECOWAS countries
Figure 2.7: Maternal Mortality Ratio per 100 000 live births (in year 200)
Figure 2.8: Stillbirth rate and neonatal mortality rates per 1000 in ECOWAS
Figure 3.1: How NHA Presents Financing Flows and Links to Health
Policy Decisions
Figure 4.1a: Total Health Expenditure by Sources
Figure 4.1b: Per capita total health expenditure for ECOWAS countries (US$)
Figure 4.2a: Health financing by source in The Gambia (year 2002)
Figure 4.2b: Health financing by source in The Gambia (year 2003)
Figure 4.2c: Health financing by source in The Gambia (year 2004)
Figure 4.2d: Per capita government expenditure on health in ECOWAS
Figure 4E: Government Expenditure on health as % of total government
Expenditure
Figure 4F: Private expenditure on health as % of total expenditure on health
in ECOWAS
Figure 4g: Out-of-pocket spending as % of private expenditure on health
in ECOWAS
Figure 4.2I: Private prepaid plans as a % of private expenditure on health
in ECOWAS
Figure 4.2h: External resources for health as a % of total expenditure on
NATIONAL HEALTH ACCOUNTS
5
health
Figure 4.3: Percentage of total health expenditure by financing agents
Appendix Table: General NHA Summary Statistics (2002, 2003, 2004)
NATIONAL HEALTH ACCOUNTS
6
Abbreviations and Acronyms
NHA National Health Accounts
NGO Non-Governmental Organisation
DOSH Department of State for Health & Social Welfare
DOSFEA ` Department of state for finance and Economic Affairs
DOSFA Department of State for Foreign Affairs
DOSI Department of State for Interior
DOSE Department of State for Education
DOSD Department of State for Defence
LGA Local Government Authorty
GBoS Gambia Bureau of Statistics
UNDP United Nation Development Programme
GDP Gross Domestic Product
HDI Human Development Index
WHO World Health Organisation
OOPs Out-of –pocket payments
THE Total Health Expenditure
TGHE Total Government Health Expenditure
TPHE Total Private Health Expenditure
GGHE General Government Health Expenditure
CMH Commission for Macro Economics and Health
CRP Cost Recovery Programme
DRF Drug Revolving Fund
BI Bamako Initiative
FA Fianancing Agent
P Providers
F Functions
FS Financing Sources
NATIONAL HEALTH ACCOUNTS
7
Foreword
National Health Account provides information to guide health policy design especially
the health financing policy. This report is the first to be completed for The Gambia.
Objective of NHA Study in The Gambia
The objectives of The Gambia NHA are:
To trace the sources of health expenditure in The Gambia;
To determine total health expenditure by financing agents and providers;
To examine the distribution of funds by functions e.g. prevention and curative
services; and
To trace the channels of distribution of funds by inputs (line items), e.g. personnel
remunerations, medicines.
The inaugural NHA study was the first step towards The Gambia’s aspiration of
institutionalizing NHA to facilitate DOSH stewardship of the national health system. The
study succeeded in addressing three of its four objectives: (i) to estimate the total health
expenditure from public, private and donor sources; (ii) to determine the total health
expenditure by financing agents; and (iii) to approximate the distribution of funds by
various public health functions. Due to dearth of disaggregated information, it was not
possible to estimate the amounts of funds spent on various health system inputs.
The NHA evidence contained in this document constitutes a strong basis for developing a
comprehensive health financing policy and a health financing strategic plan using the
Sector Wide Approach (Common Basket Funding) and mapping out how the
Government plans to realize the vision of universal coverage of health services and
universal protection from potentially catastrophic and impoverishing health care
expenditures in the long-term. In order to facilitate the monitoring and evaluation of such
policy documents once developed, it is important to institutionalize national health
accounts. The latter will require boosting of the capacities in the Directorate of Planning
and Information.
An attempt was made to analyse the Cost Recovery Program using selected Bamako
Initiative Operated health centres.
It is the strong believe that these information should provide sufficient information for
the reform of the health services management in The Gambia.
Dr. Malick Njie
Secretary of State for Health and Social Welfare
November 2007
NATIONAL HEALTH ACCOUNTS
8
Acknowledgement
The Department of State for Health and Social Welfare wishes to acknowledge the
immense support provided by the World Health Organization ( principal financier), and
the Fight Against Social and Economic Exclusion Project of UNDP for the financing of
the study. Beyond the financial support WHO provided technical support from the
Regional Office in the analysis and report writing.
We wish to thank the various contributors to the data; public, private, NGO and donor
community for their strong cooperation and support.
The Department acknowledges the strong coordination role of the Directorate of Planning
and Information, and supported by the National Health Account Technical Team in the
development of this report.
NATIONAL HEALTH ACCOUNTS
9
Executive Summary
Definition of NHA
National Health Accounts (NHA) is a tool for health sector management and policy
development that measures total public (all relevant sectors), private (including
households, enterprises, NGOs) and donor (rest-of-the-world) health expenditures. It
tracks all expenditure flows from the sources of funds to financing agents, service
providers, public health functions and inputs.
Objective of NHA Study in The Gambia
The objectives of The Gambia NHA are:
To trace the sources of health expenditure inThe Gambia;
To determine total health expenditure by financing agents and providers;
To examine the distribution of funds by functions e.g. prevention and curative
services; and
To trace the channels of distribution of funds by inputs (line items), e.g. personnel
remunerations, medicines.
Dimensions of The Gambia NHA Study
According to the WHO guide to producing NHA [WHO 2003], international experience
in the development and use of health accounts suggests a number of useful dimensions.
a) Financing sources: Institutions or entities that provide funds used in the health
system by financing agents. In The Gambia the financing sources consist of the
Government (DOSFEA), Local Government Area (LGA), parastatals, private
employers, households and donors (rest-of-the-world).
b) Financing agents: Institutions or entities that channel funds provided by financing
sources and use those funds to pay for, or purchase, the activities inside the health
accounts boundary (i.e. all activities whose primary purpose is to promote, restore
or maintain health). In The Gambia the financing agents include: DoSH, DoSE,
DoSD, DoSI, DOSFA, LGA, NAS, NaNA, Parastatals, private insurance,
households, NGOs, and private firms. The sum of the funds channelled through
all the financing agents should be equal to the total amount of money provided by
the financing sources.
c) Providers: Entities that receive money in exchange for or in anticipation of
producing the activities inside the health accounts boundary. Examples of
providers in The Gambia include: Teaching hospital, general hospitals, private
hospitals/clinics, Government Health Centres (Basic Health Services), NGO
health centres, pharmacies, opticians, pharmaceutical companies, administration
of public health, provision of public health services, other (private insurance), all
other providers of health administration, insurance firms, research institutions,
education and training institutions, NGO health related activities, and rest of the
NATIONAL HEALTH ACCOUNTS
10
4world. Ideally, the sum of the funds received by all the providers should be equal
to the total amount of money provided by the financing agents.
d) Functions: Services of curative care, services of rehabilitative care, ancillary
services to medical care, medical goods dispensed to out-patients, prevention and
public health services, health administration and health insurance, and health
related functions. The latter includes: capital formation of health care provider
institutions, maintenance service management, education and training of health
personnel, research and development in health, traditional medicine development,
and provision of overseas treatment.
e) Resource/input costs: The factors or inputs used by providers or financing agents
to produce the goods and services consumed or the activities conducted in the
health system. In The Gambia resource/input cost categories would include:
personnel (remuneration, employers contribution employees insurance, other
conditions); goods and services (travel and subsistence expenses, drugs and
medical supplies, material supplies, transport, utilities, maintenance, property
rental and related charges; education and training (research and development,
nutritional surveillance, water and sanitation, other services and expenses);
subsidies and other current transfers (membership fees and subscription,
government organization, individuals and non profit, public and departmental
enterprise); and development expenditure (furniture and office equipment;
vehicles, operational equipment, machinery).
Beneficiaries: The people who receive those health goods and services or benefit
from those activities (beneficiaries can be categorized in many different ways,
including their age and sex, their socio-economic status, their health status, and
their location).
NHA matrices used to track flow of health expenditures
Each of the NHA tables displays some facet of health expenditure cross-tabulated by two
of the dimensions mentioned below and these include:
a) Health expenditure by financing source and type of financing agent (FS x FA).
This table highlights resource mobilization patterns in the health system. It
addresses the question “where does the money come from” by showing the
financing sources that contribute to each financing agent. It also shows how
prominent a role each source plays in the financing of each financing agent and in
the total spending overall.
b) Health expenditure by the type of financing agent and type of provider (FA x P).
This table describes how funds are distributed across different types of providers,
e.g., what share of total spending goes to referral and district hospitals relative to
hospitals, clinics, health posts, outreach stations.
c) Health expenditure by provider and type of function (P x F). This table shows
how expenditures on different health functions are channelled through the various
types of providers. It provides useful perspective on the contribution of different
NATIONAL HEALTH ACCOUNTS
11
types of providers to the total spending on specific types of services, e.g. public
health programmes vis-à-vis secondary and tertiary curative care.
d) Health expenditure by type of financing agent and type of function (FA x F). This
table shows who finances what types of services in the health system. It can also
highlight the relative emphasis of public and private financing agents with respect
to the various public health functions.
Health expenditure data sources
To determine household expenditure on health for this exercise, two sources were
utilized. In view of the high cost involved in conducting large scale household surveys, it
was decided to largely utilize data from the 2003 Integrated Household Survey (IHS) to
arrive at estimates of household expenditure on health and also to conduct a small scale
household survey in 2006 to address issues of health seeking behaviour which were
largely not covered by the IHS.
For the other health expenditure sources, the lists of organisations (employers, donors,
NGOs, health care providers) were obtained from various registration sources including
the Registrar General’s Department, The Gambia Chamber of Commerce, NGO Affairs
Agency, DoSFA and The Gambia Bureau of Statistics. All identified organisations were
included in the survey.
Except for the house hold survey which was done by GBoS, the rest of the data collection
was done by Account Technicians provided by the Directorate of National Treasury. The
NHA Technical Committee provided the supervision of the data collection.
Main Findings of the NHA Study
The total health expenditure (THE) was approximately D1,185,223,103 in 2002;
D1,395,958,522 in 2003; and D1,682,323,673 in 2004. The THE as a percentage of GDP
in The Gambia was 16.1% in 2002, 13.9% in 2003 and 14.9% in 2004. The per capita
total health expenditure was D895 in 2002, D1026 in 2003 and D1203 in 2004.
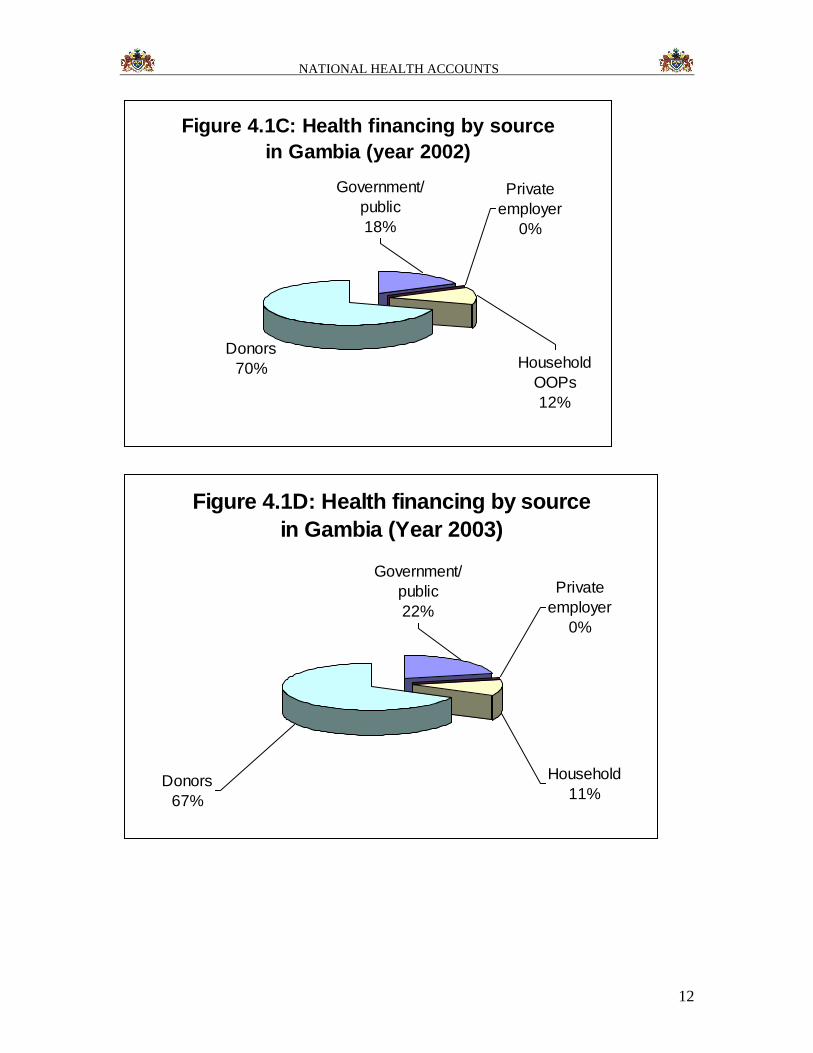
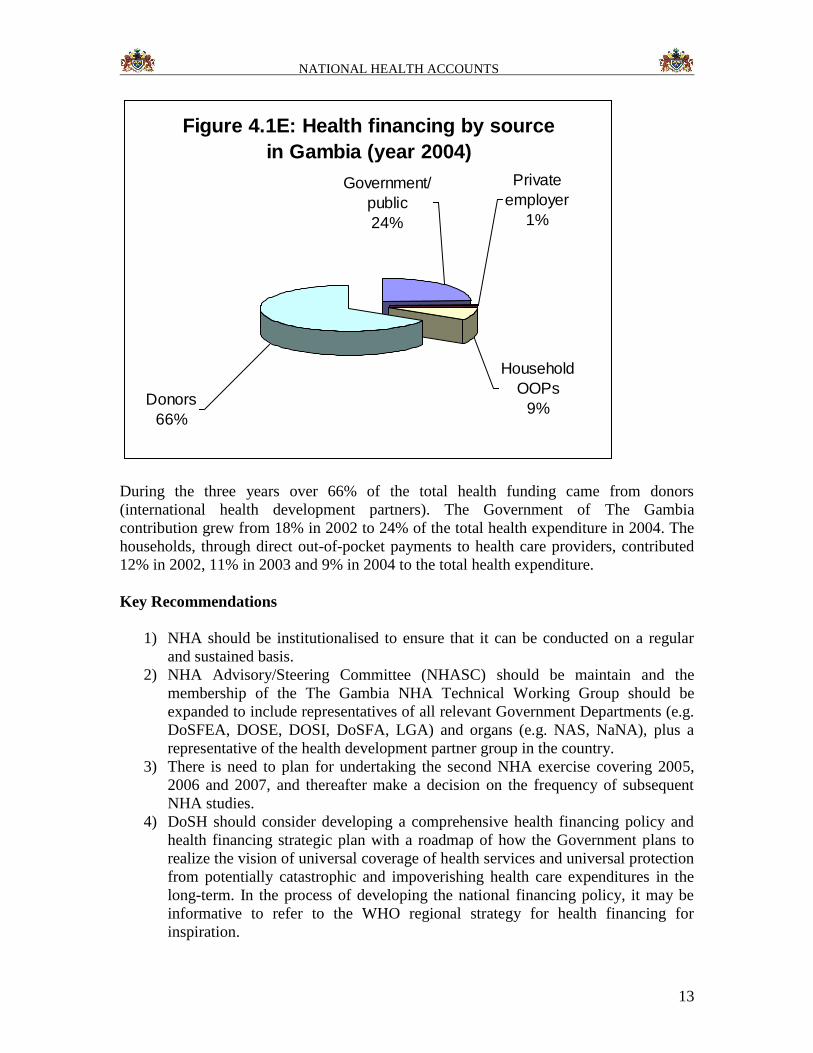
Figures 4.1C, 4.1D and 4.1E show the contribution of government/public, households,
private employers and donors to the total health expenditure in the The Gambia during
years 2002, 2003, and 2004.
NATIONAL HEALTH ACCOUNTS
12
Figure 4.1C: Health financing by source
in Gambia (year 2002)
Donors
70% Household
OOPs
12%
Private
employer
0%
Government/
public
18%
Figure 4.1D: Health financing by source
in Gambia (Year 2003)
Private
employer
0%
Government/
public
22%
Donors
67%
Household
11%
NATIONAL HEALTH ACCOUNTS
13
Figure 4.1E: Health financing by source
in Gambia (year 2004)
Household
OOPs
9%
Private
employer
1%
Government/
public
24%
Donors
66%
During the three years over 66% of the total health funding came from donors
(international health development partners). The Government of The Gambia
contribution grew from 18% in 2002 to 24% of the total health expenditure in 2004. The
households, through direct out-of-pocket payments to health care providers, contributed
12% in 2002, 11% in 2003 and 9% in 2004 to the total health expenditure.
Key Recommendations
1) NHA should be institutionalised to ensure that it can be conducted on a regular
and sustained basis.
2) NHA Advisory/Steering Committee (NHASC) should be maintain and the
membership of the The Gambia NHA Technical Working Group should be
expanded to include representatives of all relevant Government Departments (e.g.
DoSFEA, DOSE, DOSI, DoSFA, LGA) and organs (e.g. NAS, NaNA), plus a
representative of the health development partner group in the country.
3) There is need to plan for undertaking the second NHA exercise covering 2005,
2006 and 2007, and thereafter make a decision on the frequency of subsequent
NHA studies.
4) DoSH should consider developing a comprehensive health financing policy and
health financing strategic plan with a roadmap of how the Government plans to
realize the vision of universal coverage of health services and universal protection
from potentially catastrophic and impoverishing health care expenditures in the
long-term. In the process of developing the national financing policy, it may be
informative to refer to the WHO regional strategy for health financing for
inspiration.
NATIONAL HEALTH ACCOUNTS
14
The following important findings should support the development of the health
Financing policy:
Government current per capita health expenditure is below $35 as
recommended by WHO. The financing policy should advocate for
government increase expenditure on health.
Currently Social Security contribution to health is insignificant. The policy
should therefore advocate for increase Social security contribution to
health expenditure.
The out- of-pocket expenditure as a propotion of total private health
expenditure is over 95%. The health financing policy should advocate for
the development of a national social insurance frame work including
health financing safety nets for the poor.
Donor contribution to the total health expenditure is over 65%. For
effective coordination of this input the health financing policy should
advocate for basket funding system.
Conclusion
This is the first National Health Accounts Study in The Gambia and its findings are
important for better understanding of The Gambia health system financing. The evidence
contained in this report will inform health decision-making, including policy and plan
development. In addition, the results of the study will help government identify better
policy instruments to re-orient the way health- finances are to be distributed in The
Gambia, and will hopefully enable policy makers to better understand the flow of
resources in the health system. Furthermore, the results could be used to negotiate with
multilateral and bilateral agencies for additional funding for the health sector. Lastly, we
hope that the NHA evidence will also be of use to non-governmental and private health
stakeholders.
NATIONAL HEALTH ACCOUNTS
15
Chapter 1: Introduction
1.1 What is National Health Accounts?
The scarcity of resources is increasingly forcing countries in the African Region to take
stock of national health resources, review allocation patterns, review how equitably they
are distributed, assess the efficiency of existing resource use, and evaluate health
financing options [1]. Countries for a long-time have relied on Public Expenditure
Reviews (PER). Unfortunately, PER enables countries to know only the monies invested
into health by the government, and not the total investment made by all the stakeholders,
e.g. all relevant government sectors, households, private firms, and donors. Thus, at best
PER is a partial expenditure analysis. Instead, a number of countries in the Region have
employed the National Health Accounts (NHA) tool to take stock of the national health
resource investment, to support health system governance and decision-making.
National Health Accounts (NHA) is a tool for health sector management and policy
development that measures total public (all relevant sectors), private (including
households, enterprises, NGOs) and donor (rest-of-the-world) health expenditures. NHA
consists of a set of tables presenting various aspects of a nation’s health expenditure. Its
distinguishing features include [2:p.2]:
A rigorous classification of the types and purposes of all expenditures and of all
the actors in the health system;
A complete accounting of all spending for health, regardless of the origin,
destination, or object of the expenditure;
A rigorous approach to collecting, cataloguing, and estimating all those flows of
money related to health expenditure; and
A structure intended for ongoing analysis (as opposed to a one-time study).
In principle, NHA tracks all expenditure flows from the sources of funds to financing
agents, service providers, public health functions and inputs. It seeks to answer questions
such as [2]: Who pays and how much is paid for health services? How are resources
mobilized and managed for the health system? Who provides health goods and services,
and what magnitudes of resources do they use? How are health care funds distributed
across the different services (e.g. prevention, treatment, care, rehabilitation),
interventions and activities that the health system produces? How are the health funds
distributed across the different inputs (e.g. human resources for health, pharmaceuticals
and non-pharmaceutical supplies, equipment, buildings, vehicles, maintenance)? Who
benefits from health care expenditure (e.g. by income groups, age/sex, geographical
regions, diseases or health conditions)?
NHA is an indispensable input in Department of State for Health & Social Welfare
(DOHSW) stewardship of a performing health system. It empowers policy-makers
(decision-makers) to effectively execute the stewardship functions of generation of
financial intelligence, formulating sound strategic policy framework (national health
policy, national strategic health development plan, comprehensive health financing policy
NATIONAL HEALTH ACCOUNTS
16
and plan), monitoring programme implementation, ensuring a fit between policy
objectives and available resources, and ensuring accountability in use of all health sector
resources [3]. According to Berman and Cooper [1:p.vii], “NHA are a powerful tool that
can be used to improve the capacity of decision-makers to identify health sector problems
and opportunities for change and to develop and monitor reform strategies”. NHA can
provide some of the important information need for strengthening health system
performance of its functions of stewardship, health financing, input (or resource) creation
and services provision, and ultimately, the achievement of health system goals of health
improvement (or maintenance), responsiveness to people’s non-medical expectations and
fair financial contributions [3,4].
1.2 Development of The Gambia NHA
The Government of The Gambia faces a situation in which it is expected to finance a
growing double-burden of communicable and non-communicable diseases, rationalize
health service delivery, regulate the quality, improve equity in health care delivery and
meet the growing demand for better health care.
National Health Accounts was designed to provide a comprehensive description of the
flow of resources from the source to the ultimate use. This is the first time that the NHA
tool has been used by the DOHSW in The Gambia.
In November 2005, the DOHSW constituted a NHA Technical Working Group (TWG)
comprising of the DOHSW, The Gambia Bureau of Statistics (GBoS), Office of the
Directorate of Treasury, Local Consultant, and Head Department of Economist
University of The Gambia to undertake a comprehensive NHA study for the years 2002,
2003 and 2004. In addition, the DOHSW constituted a NHA Advisory/Steering
Committee to oversee the work of the TWG. The study was coordinated by the
Directorate of Planning and Information, with the support of WHO and UNDP FASE
Project. The launching of the NHA was done by Permanent Secretary Department of
State for Health and Social Welfare on behalf of the Vice President.
1.3 Objectives of The Gambia's NHA Study
The overall objective of this first NHA study was to establish the total health financing in
The Gambia with a view to gather evidence that would inform policy and strategic plan.
The specific objectives were to:
To trace the sources of health expenditure in The Gambia;
To determine total health expenditure by financing agents and providers;
To examine the distribution of funds by functions e.g. prevention and curative
services; and
To trace the channels of distribution of funds by inputs (line items), e.g. personnel
remunerations, medicines.
NATIONAL HEALTH ACCOUNTS
17
1.4 Organisation of the remaining chapters
This report presents the analysis of the first of The Gambia’s NHA study for the fiscal
years 2002, 2003 and 2004. Chapter two briefly describes the geography, demography,
socio-economic attributes and the health system in The Gambia. Chapter three describes
the NHA methodology, data sources and limitations of the current NHA exercise.
Chapter 4 reports the NHA findings. Chapter 5 presents the recommendations. Chapter 6
concludes the report.
References
1. Berman P, Cooper DM: National health accounts: Software manual. Ver 1.01.
Boston: Harvard School of Public Health; 1996.
2. World Health Organization: Guide to producing national health accounts: with
special applications for low-income and middle-income countries. Geneva; 2003.
3. World Health Organization: The world health report 2000 – health systems:
improving performance. Geneva; 2000.
4. Murray CJL, Frenk J: A framework for assessing the performance of health
systems. Bulletin of the World Health Organization. 2000, 78(6): 717-731.
NATIONAL HEALTH ACCOUNTS
18
CHAPTER 2: BACKGROUND
2.1 Geographic and Demographic overview
The Republic of The Gambia is located on the West Africa coast and extends about 400
km inland, with a population density of 128 persons per square kilometre. The width of
the country varies from 24 to 28 kilometers and has a land area of 10,689 square
kilometres. It is bordered on the North, South and East by the Republic of Senegal and
on the West by the Atlantic Ocean. The country has a tropical climate characterized by
two seasons, rainy season June-October and dry season November-May.
Demographic characteristics
According to the Demographic profile 2003, the population is estimated at 1.36 million
and by the year 2011 it is estimated to reach 1.79 million, with annual growth rate of 2.74
% (The Gambia 2003 Census). About 60% of the population live in the rural area; and
women constitute 51% of the total population. The crude birth rate is 46 per 1000
population while the total fertility rate is 5.4 births per woman. The high fertility level
has resulted in a very youthful population structure. According to the 2003 Census,
nearly 44% of the population is below 15 years and 19% between the ages 15 to 24.
Average life expectancy at birth is 64 years overall.
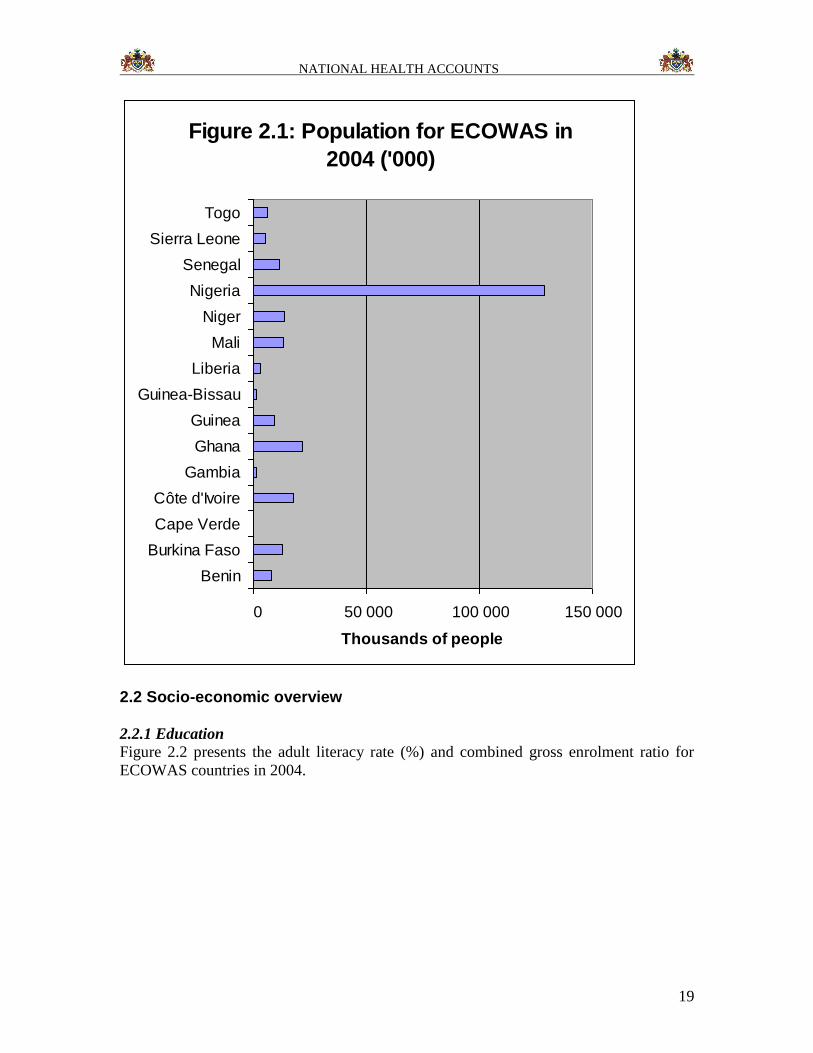
The Gambia is one of the 15 ECOWAS member states. In 2004 the ECOWAS had a total
population of 254.5 million people [WHR2006]. The total population of The Gambia was
1.48 million, i.e. 0.6% of the ECOWAS population (See Figure 2.1). The population aged
60 years and above increased from 5.2% in 1994 to 5.9% in 2004. The Gambia had an
annual population growth rate of 3.2%, which was equal to that of Benin and Togo. The
total fertility rate (TFR) decreased from 5.5 in 1994 to 4.6 in 2004; it was lower than the
average ECOWAS TFR of 5.7. The Gambia’s dependency ratio declined from 84 to 79
per 100 persons; which was lower than the average for ECOWAS of 96 per 100
[WHR2006].
NATIONAL HEALTH ACCOUNTS
19
Figure 2.1: Population for ECOWAS in
2004 ('000)
0 50 000 100 000 150 000
Benin
Burkina Faso
Cape Verde
Côte d'Ivoire
Gambia
Ghana
Guinea
Guinea-Bissau
Liberia
Mali
Niger
Nigeria
Senegal
Sierra Leone
Togo
Thousands of people
2.2 Socio-economic overview
2.2.1 Education
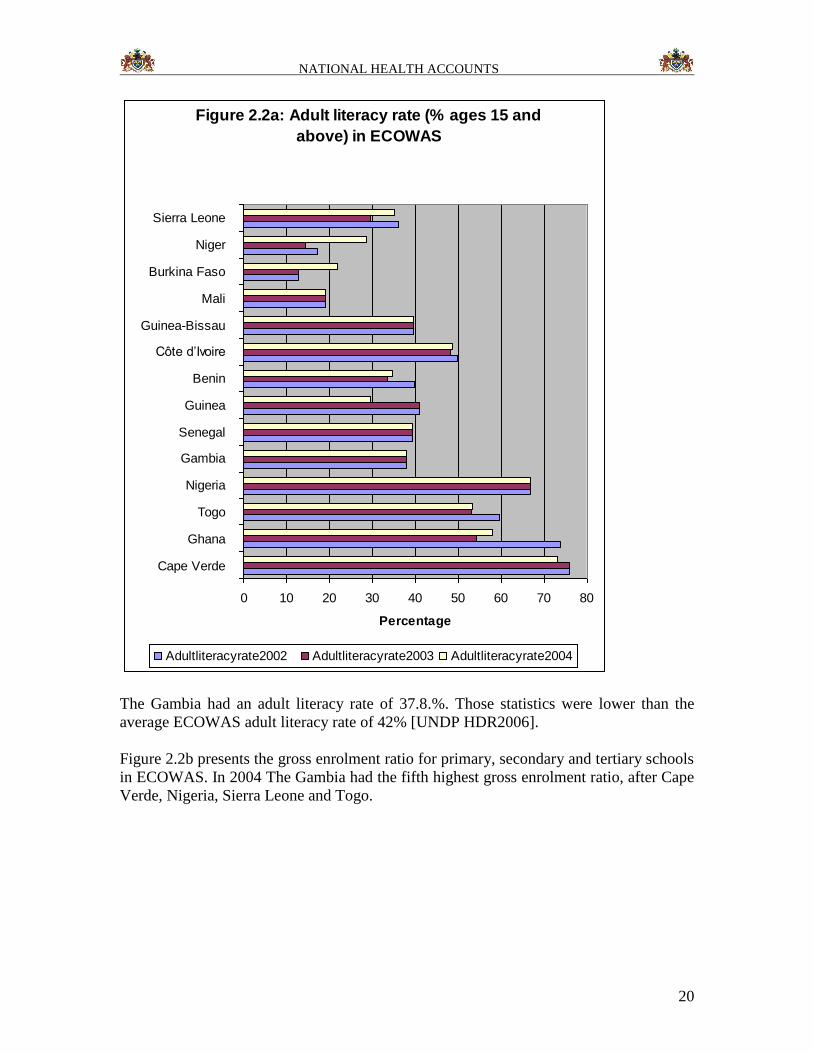
Figure 2.2 presents the adult literacy rate (%) and combined gross enrolment ratio for
ECOWAS countries in 2004.
NATIONAL HEALTH ACCOUNTS
20
Figure 2.2a: Adult literacy rate (% ages 15 and
above) in ECOWAS
0 10 20 30 40 50 60 70 80
Cape Verde
Ghana
Togo
Nigeria
Gambia
Senegal
Guinea
Benin
Côte d’Ivoire
Guinea-Bissau
Mali
Burkina Faso
Niger
Sierra Leone
Percentage
Adultliteracyrate2002 Adultliteracyrate2003 Adultliteracyrate2004
The Gambia had an adult literacy rate of 37.8.%. Those statistics were lower than the
average ECOWAS adult literacy rate of 42% [UNDP HDR2006].
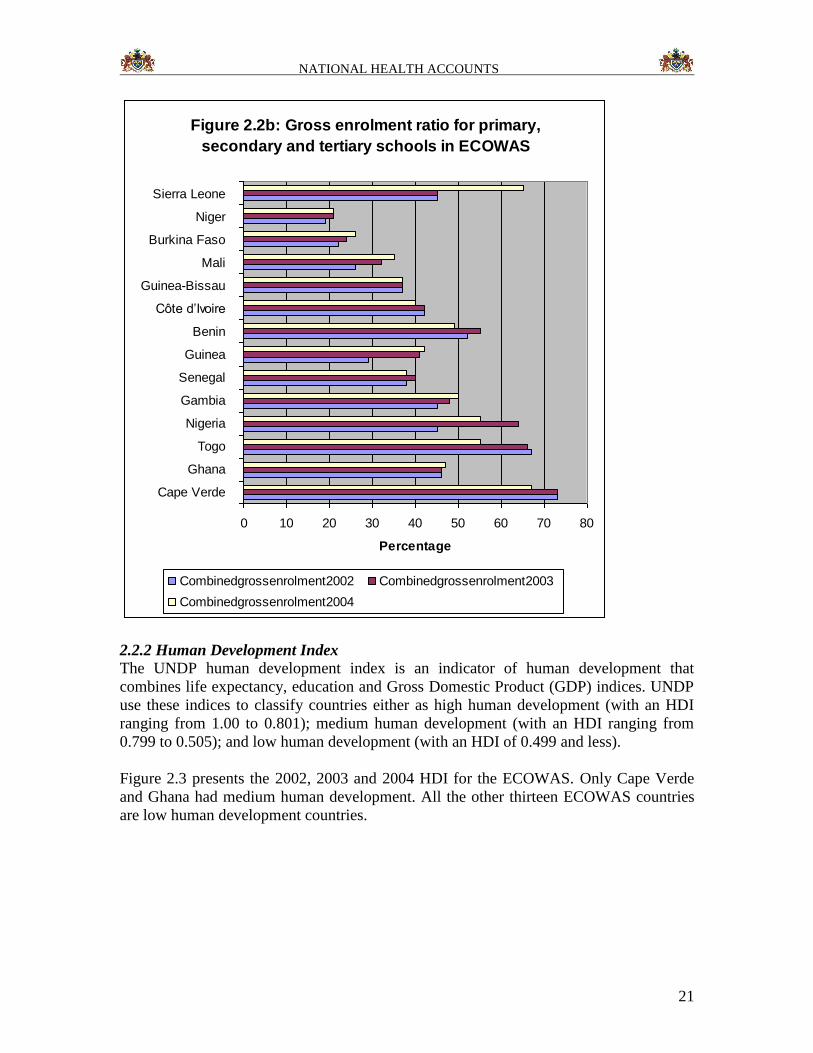
Figure 2.2b presents the gross enrolment ratio for primary, secondary and tertiary schools
in ECOWAS. In 2004 The Gambia had the fifth highest gross enrolment ratio, after Cape
Verde, Nigeria, Sierra Leone and Togo.
NATIONAL HEALTH ACCOUNTS
21
Figure 2.2b: Gross enrolment ratio for primary,
secondary and tertiary schools in ECOWAS
0 10 20 30 40 50 60 70 80
Cape Verde
Ghana
Togo
Nigeria
Gambia
Senegal
Guinea
Benin
Côte d’Ivoire
Guinea-Bissau
Mali
Burkina Faso
Niger
Sierra Leone
Percentage
Combinedgrossenrolment2002 Combinedgrossenrolment2003
Combinedgrossenrolment2004
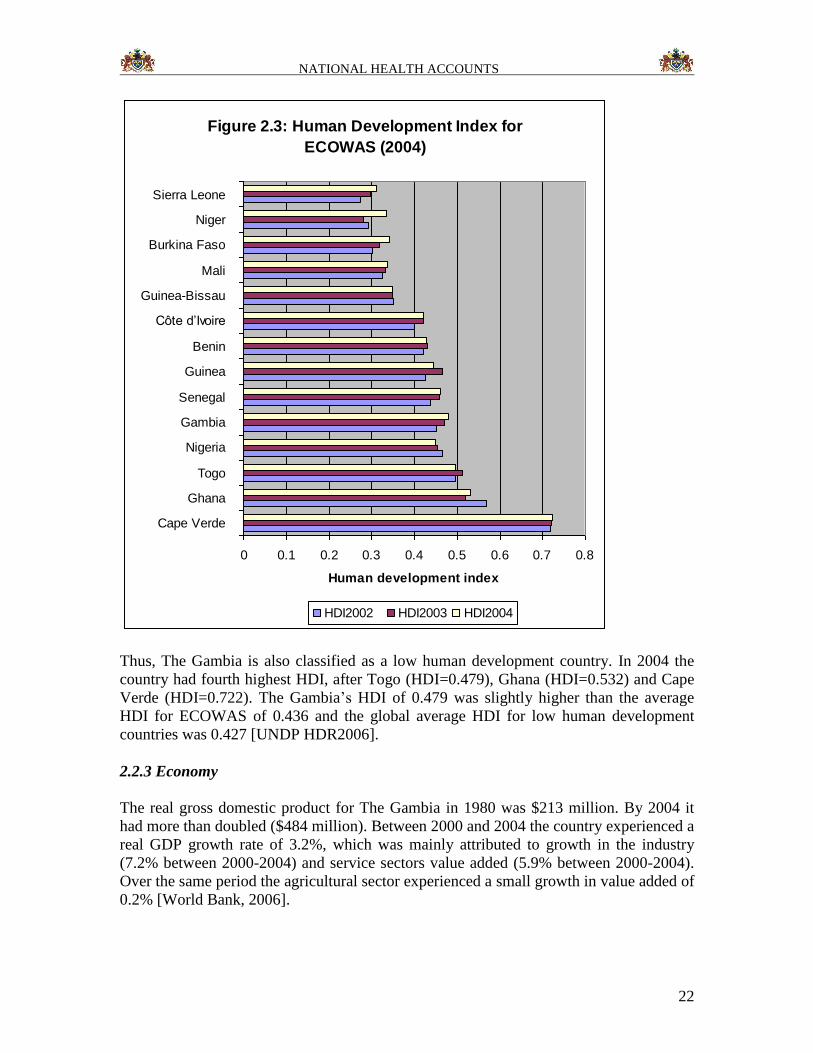
2.2.2 Human Development Index
The UNDP human development index is an indicator of human development that
combines life expectancy, education and Gross Domestic Product (GDP) indices. UNDP
use these indices to classify countries either as high human development (with an HDI
ranging from 1.00 to 0.801); medium human development (with an HDI ranging from
0.799 to 0.505); and low human development (with an HDI of 0.499 and less).
Figure 2.3 presents the 2002, 2003 and 2004 HDI for the ECOWAS. Only Cape Verde
and Ghana had medium human development. All the other thirteen ECOWAS countries
are low human development countries.
NATIONAL HEALTH ACCOUNTS
22
Figure 2.3: Human Development Index for
ECOWAS (2004)
0 0.1 0.2 0.3 0.4 0.5 0.6 0.7 0.8
Cape Verde
Ghana
Togo
Nigeria
Gambia
Senegal
Guinea
Benin
Côte d’Ivoire
Guinea-Bissau
Mali
Burkina Faso
Niger
Sierra Leone
Human development index
HDI2002 HDI2003 HDI2004
Thus, The Gambia is also classified as a low human development country. In 2004 the
country had fourth highest HDI, after Togo (HDI=0.479), Ghana (HDI=0.532) and Cape
Verde (HDI=0.722). The Gambia’s HDI of 0.479 was slightly higher than the average
HDI for ECOWAS of 0.436 and the global average HDI for low human development
countries was 0.427 [UNDP HDR2006].
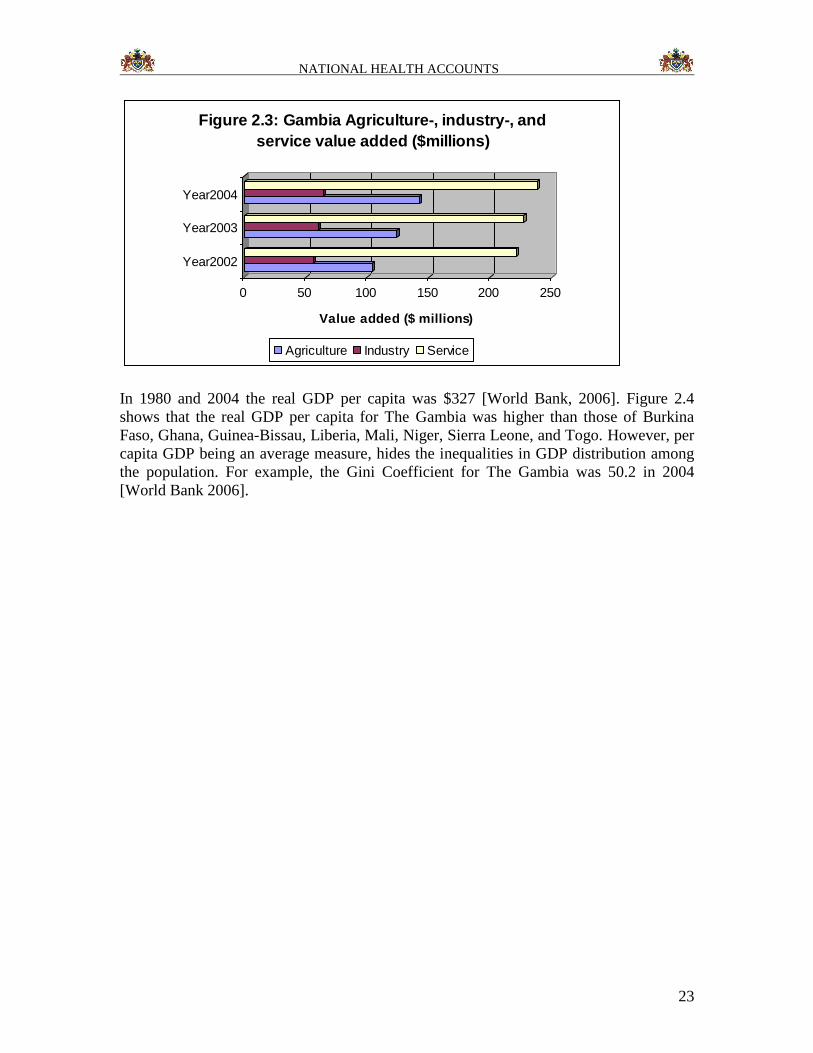
2.2.3 Economy
The real gross domestic product for The Gambia in 1980 was $213 million. By 2004 it
had more than doubled ($484 million). Between 2000 and 2004 the country experienced a
real GDP growth rate of 3.2%, which was mainly attributed to growth in the industry
(7.2% between 2000-2004) and service sectors value added (5.9% between 2000-2004).
Over the same period the agricultural sector experienced a small growth in value added of
0.2% [World Bank, 2006].
NATIONAL HEALTH ACCOUNTS
23
0 50 100 150 200 250
Value added ($ millions)
Year2002
Year2003
Year2004
Figure 2.3: Gambia Agriculture-, industry-, and
service value added ($millions)
Agriculture Industry Service
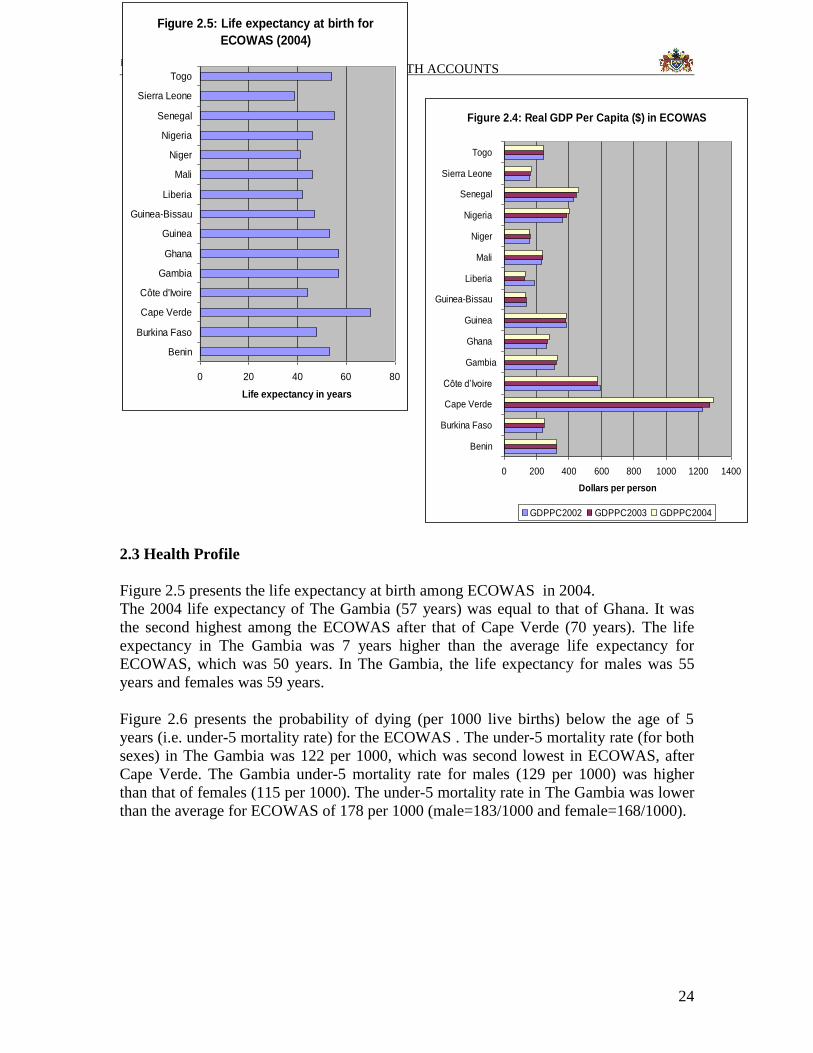
In 1980 and 2004 the real GDP per capita was $327 [World Bank, 2006]. Figure 2.4
shows that the real GDP per capita for The Gambia was higher than those of Burkina
Faso, Ghana, Guinea-Bissau, Liberia, Mali, Niger, Sierra Leone, and Togo. However, per
capita GDP being an average measure, hides the inequalities in GDP distribution among
the population. For example, the Gini Coefficient for The Gambia was 50.2 in 2004
[World Bank 2006].
NATIONAL HEALTH ACCOUNTS
24
Figure 2.4: Real GDP Per Capita ($) in ECOWAS
0 200 400 600 800 1000 1200 1400
Benin
Burkina Faso
Cape Verde
Côte d’Ivoire
Gambia
Ghana
Guinea
Guinea-Bissau
Liberia
Mali
Niger
Nigeria
Senegal
Sierra Leone
Togo
Dollars per person
GDPPC2002 GDPPC2003 GDPPC2004
2.3 Health Profile
Figure 2.5 presents the life expectancy at birth among ECOWAS in 2004. The 2004 life expectancy of The Gambia (57 years) was equal to that of Ghana. It was
the second highest among the ECOWAS after that of Cape Verde (70 years). The life
expectancy in The Gambia was 7 years higher than the average life expectancy for
ECOWAS, which was 50 years. In The Gambia, the life expectancy for males was 55
years and females was 59 years.
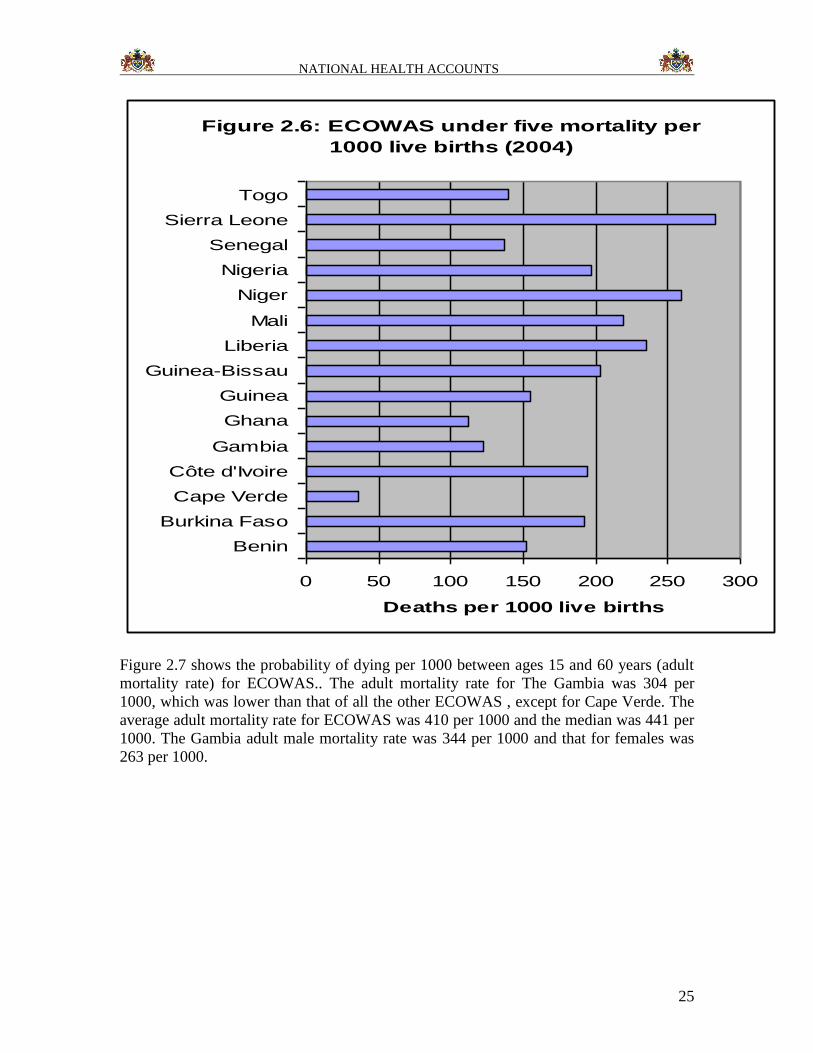
Figure 2.6 presents the probability of dying (per 1000 live births) below the age of 5
years (i.e. under-5 mortality rate) for the ECOWAS . The under-5 mortality rate (for both
sexes) in The Gambia was 122 per 1000, which was second lowest in ECOWAS, after
Cape Verde. The Gambia under-5 mortality rate for males (129 per 1000) was higher
than that of females (115 per 1000). The under-5 mortality rate in The Gambia was lower
than the average for ECOWAS of 178 per 1000 (male=183/1000 and female=168/1000).
Figure 2.5: Life expectancy at birth for
ECOWAS (2004)
0 20 40 60 80
Benin
Burkina Faso
Cape Verde
Côte d'Ivoire
Gambia
Ghana
Guinea
Guinea-Bissau
Liberia
Mali
Niger
Nigeria
Senegal
Sierra Leone
Togo
Life expectancy in years
NATIONAL HEALTH ACCOUNTS
25
Figure 2.6: ECOWAS under five mortality per
1000 live births (2004)
0 50 100 150 200 250 300
Benin
Burkina Faso
Cape Verde
Côte d'Ivoire
Gambia
Ghana
Guinea
Guinea-Bissau
Liberia
Mali
Niger
Nigeria
Senegal
Sierra Leone
Togo
Deaths per 1000 live births
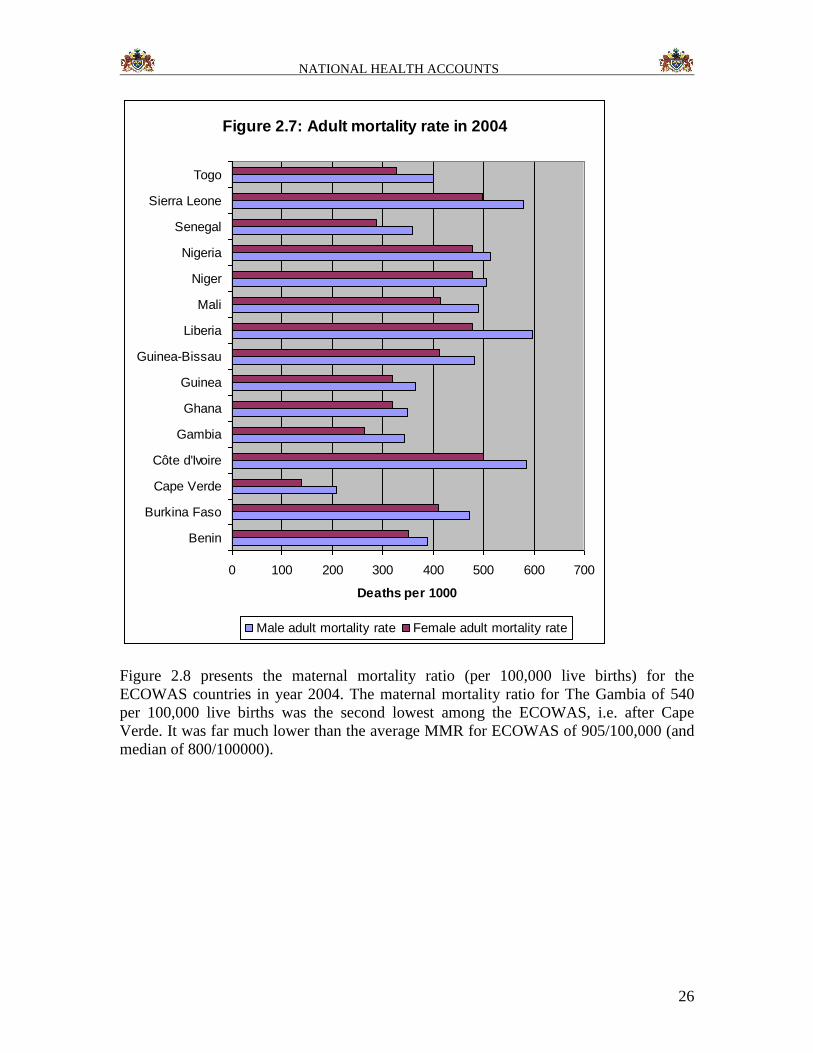
Figure 2.7 shows the probability of dying per 1000 between ages 15 and 60 years (adult
mortality rate) for ECOWAS.. The adult mortality rate for The Gambia was 304 per
1000, which was lower than that of all the other ECOWAS , except for Cape Verde. The
average adult mortality rate for ECOWAS was 410 per 1000 and the median was 441 per
1000. The Gambia adult male mortality rate was 344 per 1000 and that for females was
263 per 1000.
NATIONAL HEALTH ACCOUNTS
26
Figure 2.7: Adult mortality rate in 2004
0 100 200 300 400 500 600 700
Benin
Burkina Faso
Cape Verde
Côte d'Ivoire
Gambia
Ghana
Guinea
Guinea-Bissau
Liberia
Mali
Niger
Nigeria
Senegal
Sierra Leone
Togo
Deaths per 1000
Male adult mortality rate Female adult mortality rate
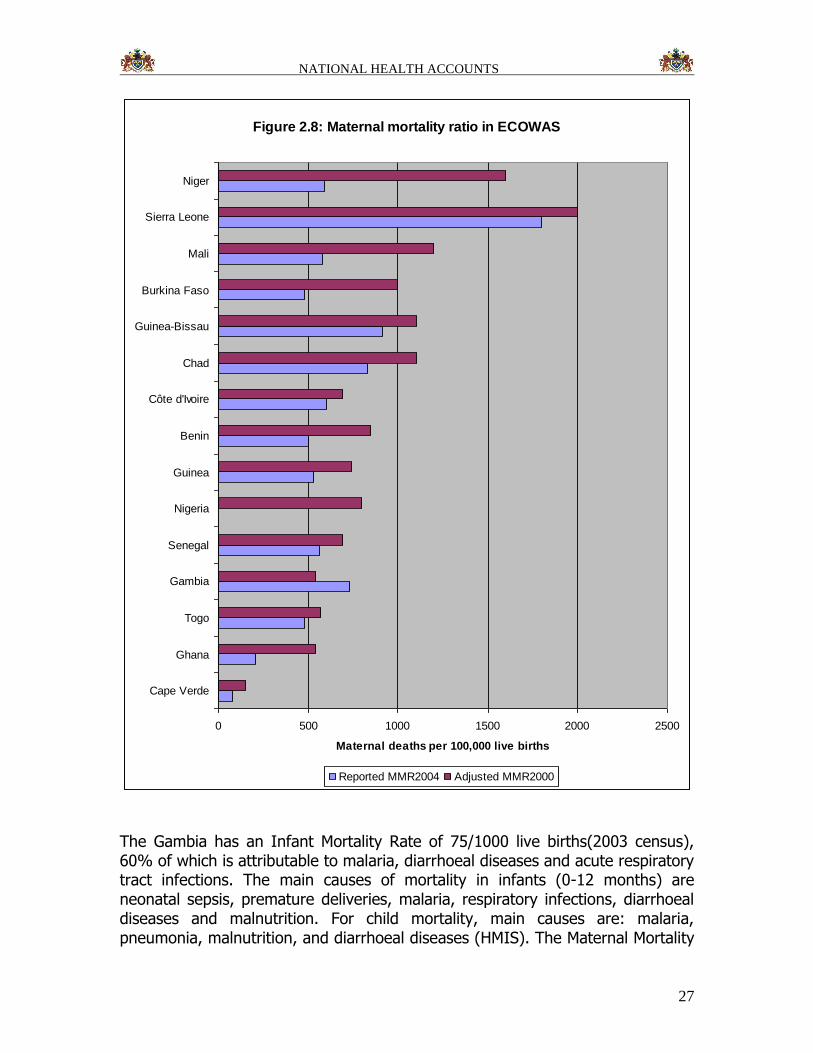
Figure 2.8 presents the maternal mortality ratio (per 100,000 live births) for the
ECOWAS countries in year 2004. The maternal mortality ratio for The Gambia of 540
per 100,000 live births was the second lowest among the ECOWAS, i.e. after Cape
Verde. It was far much lower than the average MMR for ECOWAS of 905/100,000 (and
median of 800/100000).
NATIONAL HEALTH ACCOUNTS
27
Figure 2.8: Maternal mortality ratio in ECOWAS
0 500 1000 1500 2000 2500
Cape Verde
Ghana
Togo
Gambia
Senegal
Nigeria
Guinea
Benin
Côte d'Ivoire
Chad
Guinea-Bissau
Burkina Faso
Mali
Sierra Leone
Niger
Maternal deaths per 100,000 live births
Reported MMR2004 Adjusted MMR2000
The Gambia has an Infant Mortality Rate of 75/1000 live births(2003 census), 60% of which is attributable to malaria, diarrhoeal diseases and acute respiratory tract infections. The main causes of mortality in infants (0-12 months) are neonatal sepsis, premature deliveries, malaria, respiratory infections, diarrhoeal diseases and malnutrition. For child mortality, main causes are: malaria, pneumonia, malnutrition, and diarrhoeal diseases (HMIS). The Maternal Mortality
NATIONAL HEALTH ACCOUNTS
28
Ratio is estimated at 730/100000 live births, the majority of which are due to sepsis,
haemorrhage and eclampsia.
About 40% of total outpatient consultation in 1999 was due to malaria, while diarrhoeal
diseases and acute respiratory tract infections constitute about 25%.
The HIV prevalence rate is 1.1% for HIV1 and 0.6% for HIV2 (sentinel surveillance
2005).
Tuberculosis remains a disease of public health importance in The Gambia. Through
intensified case finding, the proportion of smear positive cases identified has increased
from 56% in 2004 to 66.7% in 2005.
There has been an increase in national coverage for fully immunized children to a present
level of 79.6 % for under 1 year and 84.9% for the under 2 year (2004 EPI cluster
survey).
Malnutrition continues to be a major public health problem in The Gambia. The MICS
2006 indicated 19% stunting, 6.8% wasting and 17% underweight. Diabetes Mellitus is
estimated to affect about 1% of the population while a study found that about 16% of
urban women are obesed compare to only 1% of rural women.
2.4 Health System Overview
A health system includes all activities whose primary purpose is to promote, restore or
maintain individual’s physical, mental and social well-being [11]. Thus, health system
activities include health promotion, disease prevention, treatment, rehabilitation and
nursing/care (including community and home-based care). According to WHO [12], a
health system performs the functions of stewardship (oversight), health financing,
creating resources/inputs (including human resources for health) for producing health,
and delivering (providing) personal and non-personal services with a view to improving
responsiveness to people’s non-medical expectations, ensuring fair financial contribution
to health systems and ultimately improving health status.
2.4.1 Stewardship
The WHO Report 2000 broadly defines stewardship as “the careful and responsible
management of well-being of the population. Health stewardship focuses on the role of
country’s government, through its health ministry, in taking responsibility for the health
and well-being of the population, and guiding the health system as a whole, in order to
achieve its goals. The domains of stewardship include: generating and using
intelligence/evidence; providing vision and direction for the health system through
formulation of strategic policy framework; ensuring tools for implementation: powers,
incentives, and sanctions; building coalitions/building partnerships; ensuring fit between
policy objectives and organizational structure and culture; and ensuring accountability.
NATIONAL HEALTH ACCOUNTS
29
In order to exercise its stewardship role, The Government of the Republic of The Gambia
developed the National Health Policy Framework [2001]; to guide health development of
her population. The National Health Policy focuses on improving access to basic health
care and health system strengthening.
2.4.2 Provision of Health Services
According to the World Health Report 2000, this function of health system refers to
combination of inputs within a production process (e.g. hospital, clinic, public health
programme) that leads to the delivery of personal health services (consumed directly by
the individual, whether preventive, diagnostic, therapeutic or rehabilitative) and non-
personal health services, i.e. actions applied either collectivities (e.g. national vaccination
campaigns, mass health education) or to the non-human components of the environment
(e.g. basic sanitation, water, air-pollution control).
The Republic of The Gambia responds to the aforementioned health situation through an
extensive network of public and private health facilities (hospitals, health centres, clinics,
health posts) and traditional healers in the 6 health regions of the country. Table 1
indicates the number of various types of health facilities existed in the country in 2006.
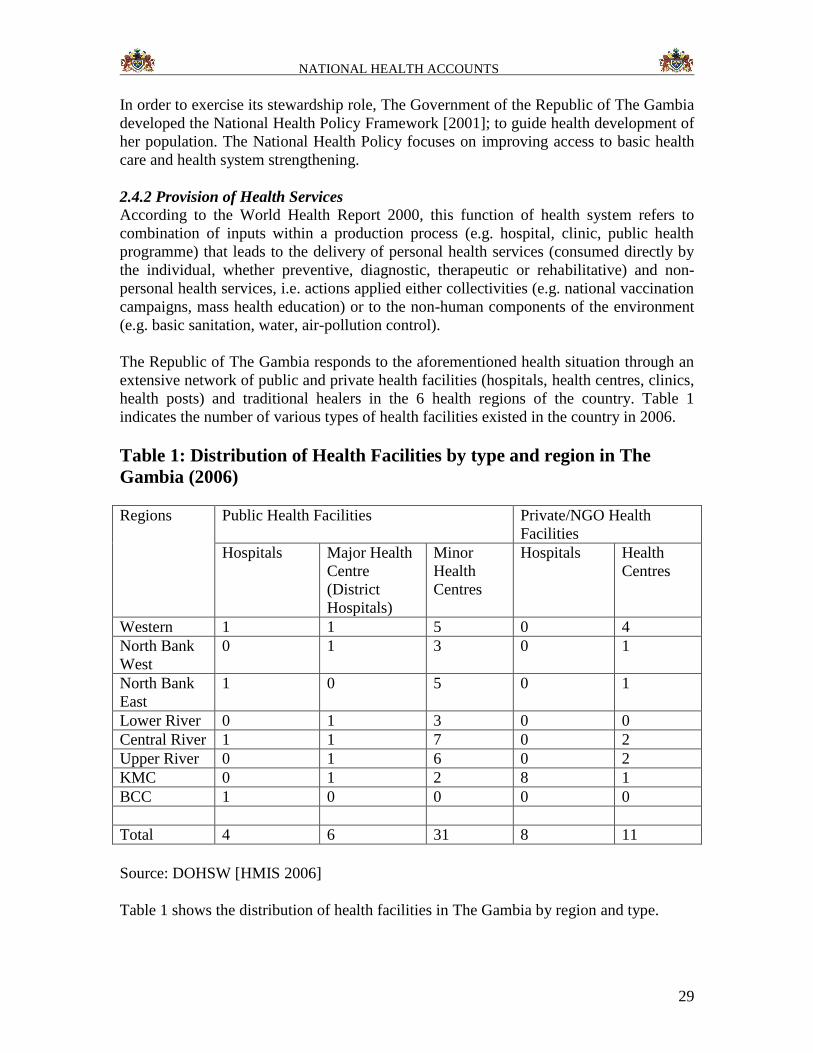
Table 1: Distribution of Health Facilities by type and region in The
Gambia (2006)
Regions Public Health Facilities Private/NGO Health
Facilities
Hospitals Major Health
Centre
(District
Hospitals)
Minor
Health
Centres
Hospitals Health
Centres
Western 1 1 5 0 4
North Bank
West
0 1 3 0 1
North Bank
East
1 0 5 0 1
Lower River 0 1 3 0 0
Central River 1 1 7 0 2
Upper River 0 1 6 0 2
KMC 0 1 2 8 1
BCC 1 0 0 0 0
Total 4 6 31 8 11
Source: DOHSW [HMIS 2006]
Table 1 shows the distribution of health facilities in The Gambia by region and type.
NATIONAL HEALTH ACCOUNTS
30
The Public Health Facilities are government owned. The rest are NGOs, Private sector
and communities owned and managed.
Public sector
Village Health Services (Community Health Posts)
The lowest level for health service provision is the community health post. This provides
the very basic minimum health package to the village. The service providers are the
Village Health Workers with very minimal training and Traditional Birth Attendants with
limited additional training. The village health provider provides treatment for non-
complicated malaria, diarrhoea, minor injuries, worm infestation and stomach pain. He
charges D0.75 for children and D2.00 for adults.
The village health services are complemented by the Reproductive and Child Health
(RCH) monitoring visits from the health centres. The RCH package includes: antenatal
care, child immunization, weight monitoring and limited treatment for sick children.
Minor Health Centre
The minor health centre is the unit for the delivery of basic health services. The national
standard is 15,000 population for a minor health centre. The minor health centre is meant
to provide up to 70 percent of the Basic Health Care Package needs of the population.
The minor health centre coverage for the rural community is not above 65 per cent, for
the Greater Banjul Area it is below 15 percent.
Major Health Centres (District Hospitals)
The major health centres have a bed capacity of about 100. They serve as the referral
health facilities for minor health centres for such services like, obstetric emergencies,
essential surgical services, and further medical care. Major health centres also serve as
blood transfusion points for the area. The national standard is 200,000 population for a
major health centre and coverage is about 100 percent.
General Hospital
The general hospitals are the regional referral points. They have bigger bed capacities of
up to 250 beds and are to provide additional services not available at the regional hospital
level.
Teaching and Specialist Hospital
This is the most advanced referral health facility in The Gambia. Conditions that cannot
be handled at this health facility have to be referred overseas, the nearest being in
Senegal.
NATIONAL HEALTH ACCOUNTS
31
Considerable progress has been made in the areas of: EPI Coverage, expansion of health
facilities and in recruitment of trained health personnel. Success has been registered in
the implementation of the Baby Friendly Community Initiative and the Bamako
Initiative.
Also, relevant policy documents were developed including that of Nutrition, Drug ,
Malaria, Reproductive and Child Health , Human Resource for Health , Maintenance ,
Mental Health , HIV/AIDS , Health Management Information System , National Blood
Transfusion , Information Technology , and others such as Traditional Medicine,
National Health Laboratory, Health Research, are at various stages of development.
Policy environment
There is a pressing need to enhance the delivery of quality health services in order to
reduce the high prevailing morbidity and mortality rates.
The need to review the current health policy has been influenced by the following factors:
To keep in pace with the Decentralization and Local Government Reforms which
emphasizes an integrated management of government services, including health to the
regions. The devolution of authority, responsibility and resources to the regions has to
be directed by the policy.
Proliferation of donor agencies each operating in their own way in the same health
care system. There is therefore urgent need for better co-ordination of donor
activities.
The declining, though still high, incidence of infectious diseases and the emergence
and re-emergence of non-communicable and communicable diseases needs
intensification of efforts in our service delivery packages.
Formulation of other sector policies impacting on the organization and the delivery of
health services.
The disparity in the demand and quality of services at different levels of health care.
Experience from the implementation of certain health projects/programmes like PHC,
BI and DRF to improve financing of health services.
2.4.3 Resource Generation
Health systems include a diverse group of organizations that produce health services
inputs, particularly human resources for health, medicines, physical facilities and
equipment, and knowledge [12]. According to Murray and Frenk [17:p.727], “this set of
organizations encompasses universities and other educational institutions, research
centres, and companies producing specific technologies such as pharmaceutical products,
devices and equipment”.
NATIONAL HEALTH ACCOUNTS
32
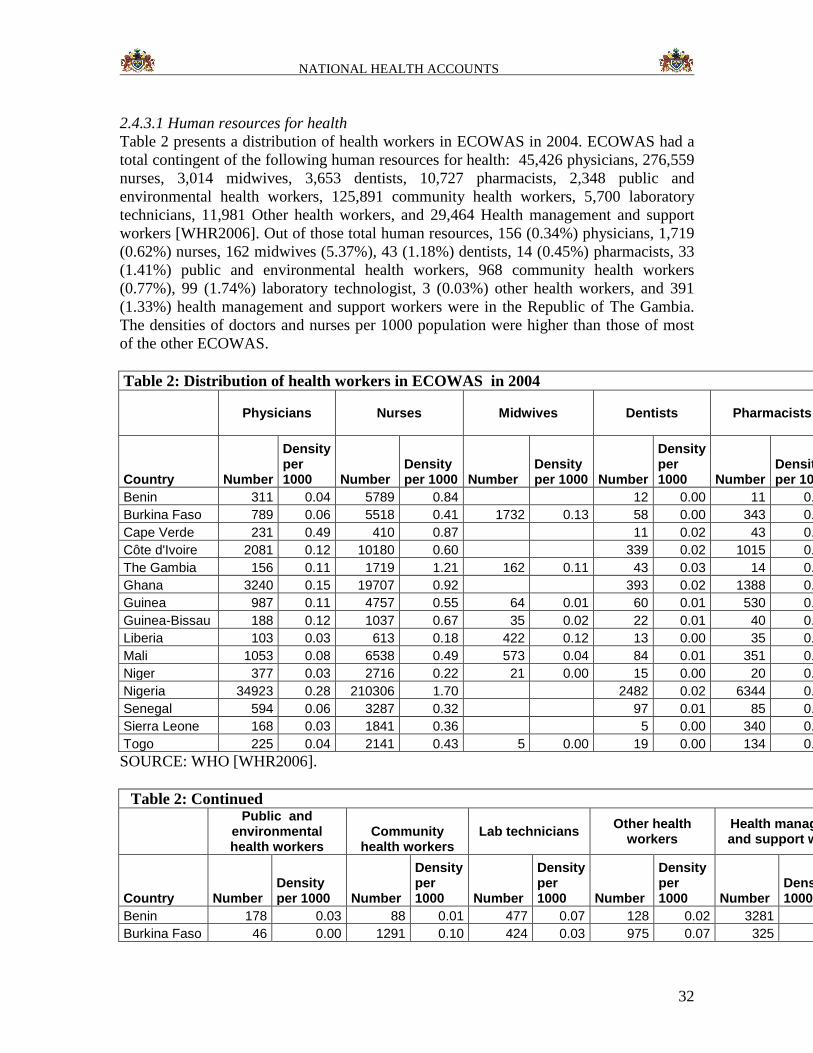
2.4.3.1 Human resources for health
Table 2 presents a distribution of health workers in ECOWAS in 2004. ECOWAS had a
total contingent of the following human resources for health: 45,426 physicians, 276,559
nurses, 3,014 midwives, 3,653 dentists, 10,727 pharmacists, 2,348 public and
environmental health workers, 125,891 community health workers, 5,700 laboratory
technicians, 11,981 Other health workers, and 29,464 Health management and support
workers [WHR2006]. Out of those total human resources, 156 (0.34%) physicians, 1,719
(0.62%) nurses, 162 midwives (5.37%), 43 (1.18%) dentists, 14 (0.45%) pharmacists, 33
(1.41%) public and environmental health workers, 968 community health workers
(0.77%), 99 (1.74%) laboratory technologist, 3 (0.03%) other health workers, and 391
(1.33%) health management and support workers were in the Republic of The Gambia.
The densities of doctors and nurses per 1000 population were higher than those of most
of the other ECOWAS.
Table 2: Distribution of health workers in ECOWAS in 2004
Physicians Nurses Midwives Dentists Pharmacists
Country Number
Density per 1000 Number
Density per 1000 Number
Density per 1000 Number
Density per 1000 Number
Density per 1000
Benin 311 0.04 5789 0.84 12 0.00 11 0.00
Burkina Faso 789 0.06 5518 0.41 1732 0.13 58 0.00 343 0.03
Cape Verde 231 0.49 410 0.87 11 0.02 43 0.09
Côte d'Ivoire 2081 0.12 10180 0.60 339 0.02 1015 0.06
The Gambia 156 0.11 1719 1.21 162 0.11 43 0.03 14 0.00
Ghana 3240 0.15 19707 0.92 393 0.02 1388 0.06
Guinea 987 0.11 4757 0.55 64 0.01 60 0.01 530 0.06
Guinea-Bissau 188 0.12 1037 0.67 35 0.02 22 0.01 40 0.03
Liberia 103 0.03 613 0.18 422 0.12 13 0.00 35 0.01
Mali 1053 0.08 6538 0.49 573 0.04 84 0.01 351 0.03
Niger 377 0.03 2716 0.22 21 0.00 15 0.00 20 0.00
Nigeria 34923 0.28 210306 1.70 2482 0.02 6344 0.05
Senegal 594 0.06 3287 0.32 97 0.01 85 0.01
Sierra Leone 168 0.03 1841 0.36 5 0.00 340 0.07
Togo 225 0.04 2141 0.43 5 0.00 19 0.00 134 0.03
SOURCE: WHO [WHR2006].
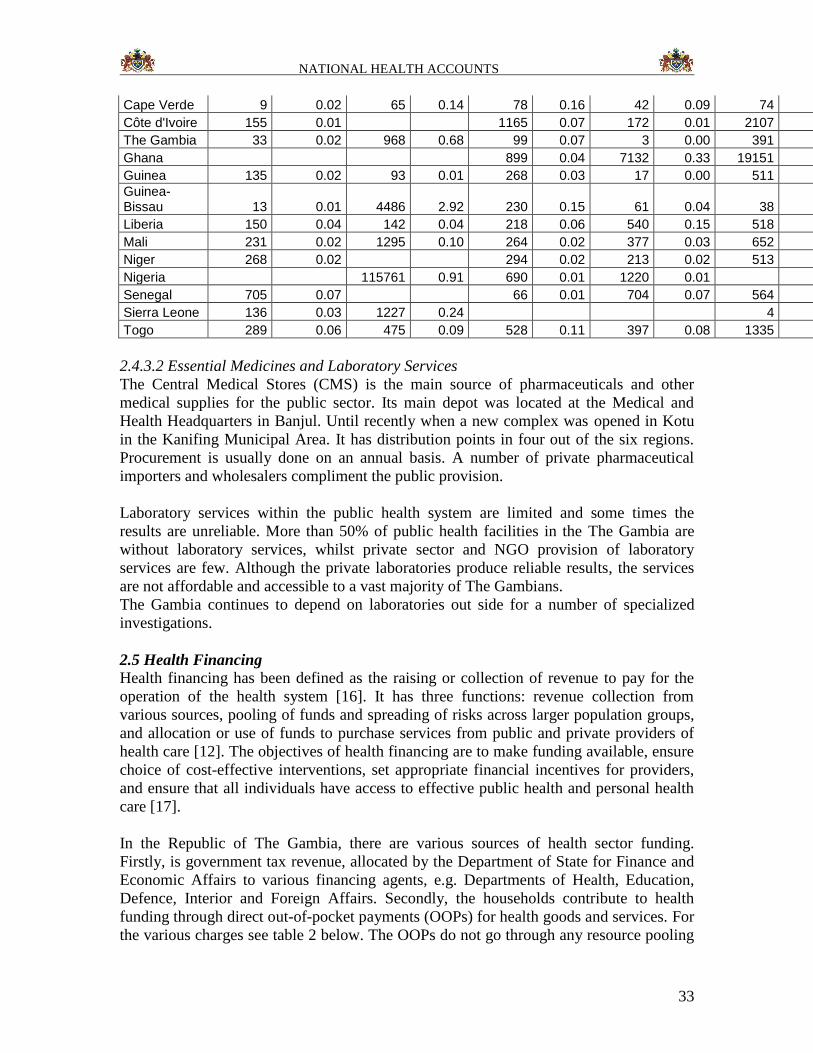
Table 2: Continued
Public and
environmental health workers
Community health workers
Lab technicians Other health
workers Health management and support workers
Country Number Density per 1000 Number
Density per 1000 Number
Density per 1000 Number
Density per 1000 Number
Density per 1000
Benin 178 0.03 88 0.01 477 0.07 128 0.02 3281 0.47
Burkina Faso 46 0.00 1291 0.10 424 0.03 975 0.07 325 0.02
NATIONAL HEALTH ACCOUNTS
33
Cape Verde 9 0.02 65 0.14 78 0.16 42 0.09 74 0.16
Côte d'Ivoire 155 0.01 1165 0.07 172 0.01 2107 0.12
The Gambia 33 0.02 968 0.68 99 0.07 3 0.00 391 0.27
Ghana 899 0.04 7132 0.33 19151 0.90
Guinea 135 0.02 93 0.01 268 0.03 17 0.00 511 0.06
Guinea-Bissau 13 0.01 4486 2.92 230 0.15 61 0.04 38 0.02
Liberia 150 0.04 142 0.04 218 0.06 540 0.15 518 0.15
Mali 231 0.02 1295 0.10 264 0.02 377 0.03 652 0.05
Niger 268 0.02 294 0.02 213 0.02 513 0.04
Nigeria 115761 0.91 690 0.01 1220 0.01
Senegal 705 0.07 66 0.01 704 0.07 564 0.05
Sierra Leone 136 0.03 1227 0.24 4 0.00
Togo 289 0.06 475 0.09 528 0.11 397 0.08 1335 0.27
2.4.3.2 Essential Medicines and Laboratory Services
The Central Medical Stores (CMS) is the main source of pharmaceuticals and other
medical supplies for the public sector. Its main depot was located at the Medical and
Health Headquarters in Banjul. Until recently when a new complex was opened in Kotu
in the Kanifing Municipal Area. It has distribution points in four out of the six regions.
Procurement is usually done on an annual basis. A number of private pharmaceutical
importers and wholesalers compliment the public provision.
Laboratory services within the public health system are limited and some times the
results are unreliable. More than 50% of public health facilities in the The Gambia are
without laboratory services, whilst private sector and NGO provision of laboratory
services are few. Although the private laboratories produce reliable results, the services
are not affordable and accessible to a vast majority of The Gambians.
The Gambia continues to depend on laboratories out side for a number of specialized
investigations.
2.5 Health Financing
Health financing has been defined as the raising or collection of revenue to pay for the
operation of the health system [16]. It has three functions: revenue collection from
various sources, pooling of funds and spreading of risks across larger population groups,
and allocation or use of funds to purchase services from public and private providers of
health care [12]. The objectives of health financing are to make funding available, ensure
choice of cost-effective interventions, set appropriate financial incentives for providers,
and ensure that all individuals have access to effective public health and personal health
care [17].
In the Republic of The Gambia, there are various sources of health sector funding.
Firstly, is government tax revenue, allocated by the Department of State for Finance and
Economic Affairs to various financing agents, e.g. Departments of Health, Education,
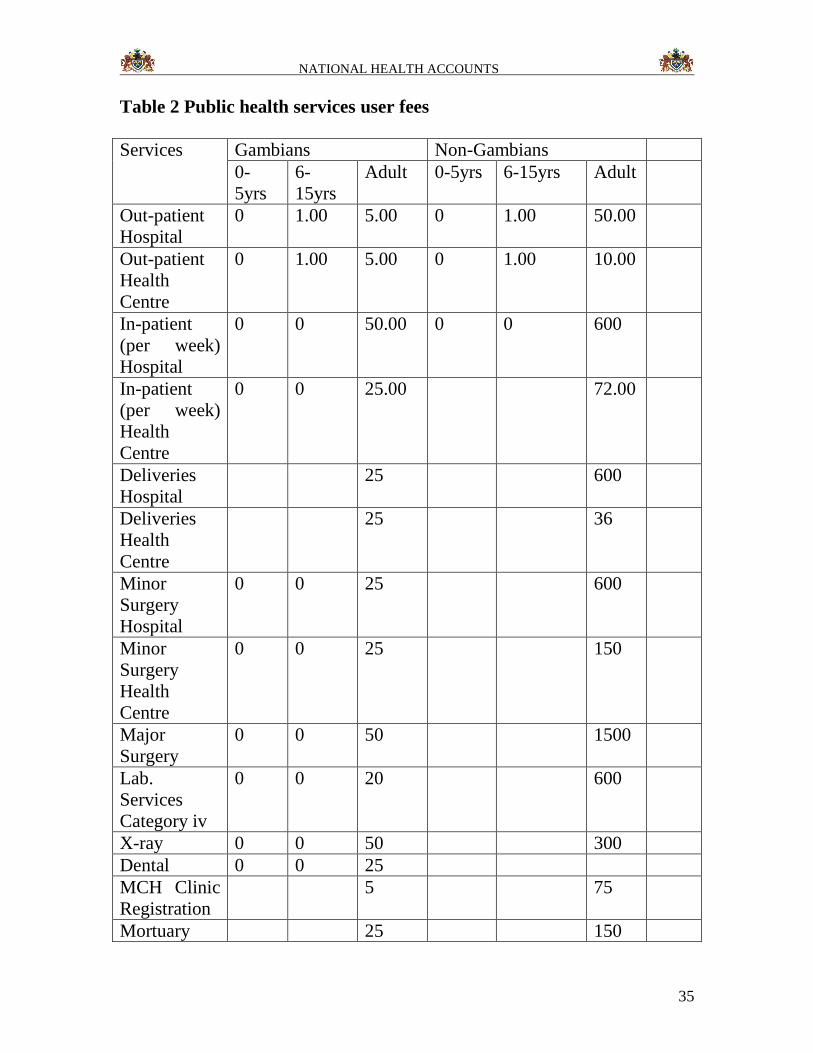
Defence, Interior and Foreign Affairs. Secondly, the households contribute to health
funding through direct out-of-pocket payments (OOPs) for health goods and services. For
the various charges see table 2 below. The OOPs do not go through any resource pooling

NATIONAL HEALTH ACCOUNTS
34
and risk-sharing mechanism. Thirdly, some employers provide medical cover for their
employees, either through self-operated health clinics (e.g. GPA Clinic) or paying
premiums into health insurance schemes. Fourthly, the international donors (e.g. bilateral
and multi-lateral agencies, Global Fund for AIDS, Tuberculosis and Malaria, GAVI) also
contribute to health funding in the country. To a lesser extent the Local Government
Authorities also contribute to health financing. Chapter 4 provides more details regarding
the amounts of money actually spent from the different sources.
NATIONAL HEALTH ACCOUNTS
35
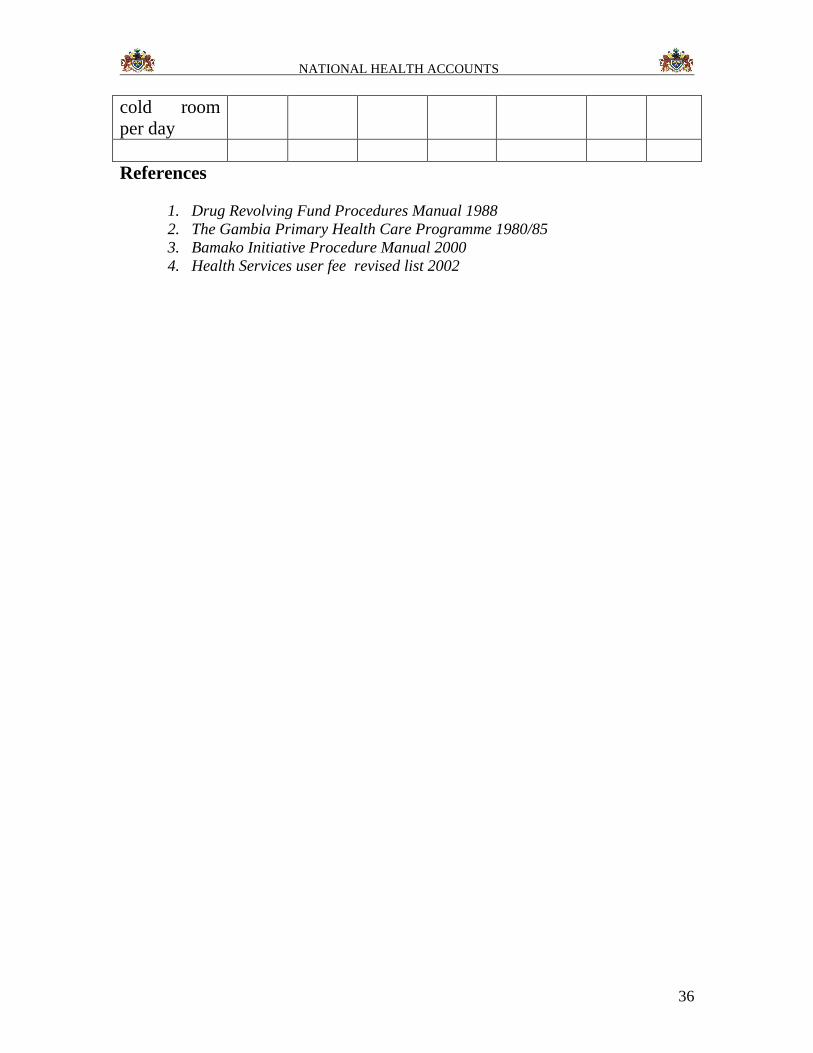
Table 2 Public health services user fees
Services Gambians Non-Gambians
0-
5yrs
6-
15yrs
Adult 0-5yrs 6-15yrs Adult
Out-patient
Hospital
0 1.00 5.00 0 1.00 50.00
Out-patient
Health
Centre
0 1.00 5.00 0 1.00 10.00
In-patient
(per week)
Hospital
0 0 50.00 0 0 600
In-patient
(per week)
Health
Centre
0 0 25.00 72.00
Deliveries
Hospital
25 600
Deliveries
Health
Centre
25 36
Minor
Surgery
Hospital
0 0 25 600
Minor
Surgery
Health
Centre
0 0 25 150
Major
Surgery
0 0 50 1500
Lab.
Services
Category iv
0 0 20 600
X-ray 0 0 50 300
Dental 0 0 25
MCH Clinic
Registration
5 75
Mortuary 25 150
NATIONAL HEALTH ACCOUNTS
36
cold room
per day
References
1. Drug Revolving Fund Procedures Manual 1988
2. The Gambia Primary Health Care Programme 1980/85
3. Bamako Initiative Procedure Manual 2000
4. Health Services user fee revised list 2002
NATIONAL HEALTH ACCOUNTS
37
CHAPTER 3: METHODS AND SOURCES OF DATA
3.1 NHA Conceptual Framework
According to the WHO guide to producing NHA [WHO 2003], international experience
in the development and use of health accounts suggests a number of useful dimensions.
Financing sources: Institutions or entities that provide funds used in the
health system by financing agents. These financing sources consist of the
Government (DOSFEA), Local Government Areas (LGA), parastatals (Public
enterprises), private employers, households and donors (rest-of-the-world).
Financing agents: Institutions or entities that channel funds provided by
financing sources and use those funds to pay for, or purchase, the activities
inside the health accounts boundary (i.e. all activities whose primary purpose
is to promote, restore or maintain health). These financing agents include:
DoSH, DoSE, DoSD, DoSI, DOSFA , NAS, NaNA, Parastatals, private
insurance, households, NGOs, and private firms. The sum of the funds
channelled through all the financing agents should be equal to the total
amount of money provided by the financing sources.
Providers: Entities that receive money in exchange for or in anticipation of
producing the activities inside the health accounts boundary. Examples of
providers include: Teaching hospital, general hospitals, private
hospitals/clinics, Government Health Centres (Basic Health Services), NGO
health centres, pharmacies, opticians, pharmaceutical companies,
administration of public health, provision of public health services, other
(private insurance), all other providers of health administration, insurance
firms, research institutions, education and training institutions, NGO health
related activities, and rest of the world. Ideally, the sum of the funds received
by all the providers should be equal to the total amount of money provided by
the financing agents.
Functions: Services of curative care, services of rehabilitative care, ancillary
services to medical care, medical goods dispensed to out-patients, prevention
and public health services, health administration and health insurance, and
health related functions. The latter includes: capital formation of health care
provider institutions, maintenance service management, education and
training of health personnel, research and development in health, traditional
medicine development, and provision of overseas treatment.
Resource/input costs: The factors or inputs used by providers or financing
agents to produce the goods and services consumed or the activities conducted
in the health system. The resource/input cost categories would include:
personnel (remuneration, employers contribution employees insurance, other
conditions); goods and services (travel and subsistence expenses, drugs and
medical supplies, material supplies, transport, utilities, maintenance, property
rental and related charges; education and training (research and development,
nutritional surveillance, water and sanitation, other services and expenses);
NATIONAL HEALTH ACCOUNTS
38
subsidies and other current transfers (membership fees and subscription,
government organization, individuals and non profit, public and departmental
enterprise); and development expenditure (furniture and office equipment;
vehicles, operational equipment, machinery).
Beneficiaries: The people who receive those health goods and services or
benefit from those activities (beneficiaries can be categorized in many
different ways, including their age and sex, their socio-economic status, their
health status, and their location).
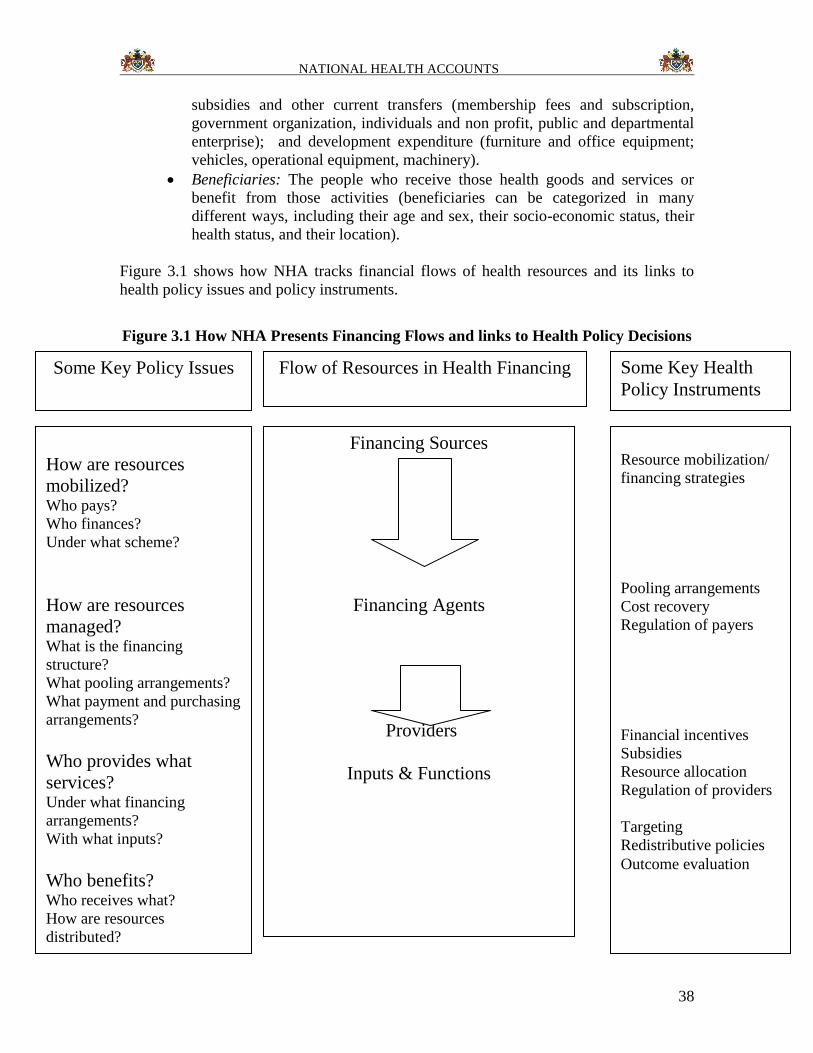
Figure 3.1 shows how NHA tracks financial flows of health resources and its links to
health policy issues and policy instruments.
Figure 3.1 How NHA Presents Financing Flows and links to Health Policy Decisions
Financing Sources
Financing Agents
Providers
Inputs & Functions
How are resources
mobilized? Who pays?
Who finances?
Under what scheme?
How are resources
managed? What is the financing
structure?
What pooling arrangements?
What payment and purchasing
arrangements?
Who provides what
services? Under what financing
arrangements?
With what inputs?
Who benefits? Who receives what?
How are resources
distributed?
Some Key Policy Issues Flow of Resources in Health Financing Some Key Health
Policy Instruments
Resource mobilization/
financing strategies
Pooling arrangements
Cost recovery
Regulation of payers
Financial incentives
Subsidies
Resource allocation
Regulation of providers
Targeting
Redistributive policies
Outcome evaluation
NATIONAL HEALTH ACCOUNTS
39
Each of the NHA tables displays some facet of health expenditure cross-tabulated by two
of the abovementioned dimensions. By convention, the origin of the funds dimension is
shown as columns and the use dimension is shown as rows. Following this convention,
each cell in the table show the amount of resources used for the row “i” of “use” from the
column category “j” of “origin” (“spent by j on I”) as illustrated in Table 3.1 above. The
three critical dimensions for accurate estimation of total health spending include health
financing agents, providers, and functions. The NHA tables that cross-tabulate these
dimensions include:
Health expenditure by financing source and type of financing agent (FS x
FA). This table highlights resource mobilization patterns in the health system.
It addresses the question “where does the money come from” by showing the
financing sources that contribute to each financing agent. It also shows how
prominent a role each source plays in the financing of each financing agent
and in the total spending overall.
Health expenditure by the type of financing agent and type of provider (FA x
P). This table describes how funds are distributed across different types of
providers, e.g., what share of total spending goes to referral and district
hospitals relative to primary/hospitals, clinics, health posts, outreach stations.
Health expenditure by provider and type of function (P x F). This table shows
how expenditures on different health functions are channelled through the
various types of providers. It provides useful perspective on the contribution
of different types of providers to the total spending on specific types of
services, e.g. public health programmes vis-à-vis secondary and tertiary
curative care.
Health expenditure by type of financing agent and type of function (FA x F).
This table shows who finances what types of services in the health system. It
can also highlight the relative emphasis of public and private financing agents
with respect to the various public health functions.
Cost of resources used to produce health goods and services. This table
illustrates the share of national health expenditure contributed by the value of
labour, pharmaceutical supplies, equipment and buildings, etc. This table
provides a basis for the analysis of the efficiency of production and resource
use.
Health expenditure by age and sex of the population. This table highlights the
distribution of health goods and services among age/sex groups in the
population, e.g. children, elderly, women of childbearing age.
Health expenditure by socio-economic status of the population. This table can
be used to answer the question “Does the composition of financing one’s
health care vary with one’s position in society?” Using data from household
income and expenditure surveys to aggregate the population into quintiles,
health accounts may be used to assess how well specific payers target
vulnerable groups and what share of the burden of spending is being borne by
different groups.
NATIONAL HEALTH ACCOUNTS
40
Health expenditure by geographic region (e.g. districts).
In the current study, it was possible to obtain expenditure data disaggregated by financing
sources, agents, providers, and functions and resource costs. (See Annex Tables 3.1a,
3.1b, 3.1c,…,3.1n).
3.2 Field Work Methodology
The Gambia NHA study relied on primary and secondary data. A wide range of data and
information was collated from various government publications and other sources. In
addition, data was collected from the following sources:
Government Departments: DoSFEA, DoSH, DoSE, DoSD, DoSI, DOSFA , LGA;
National AIDS Secretariat (NAS);
NaNA;
Parastatals;
Employers;
Insurance;
Non-Governmental Organisations (NGOs involved in health);
Donors (both bilateral and multilateral); and
Health care providers: Public, Private for-profit/ not-for-profit Facilities.
To facilitate the data collection process a National Health Account sensitization
workshop was held in September 2006. Potential NHA stakeholders were invited to a one
day workshop where they were introduced to NHA, the usefulness of NHA and its
relevance to The Gambia.
3.2.1 Sampling Approaches: Household health expenditure and utilization
survey
To determine household expenditure on health for this exercise, two sources were
utilized. In view of the high cost involved in conducting large scale household surveys, it
was decided to largely utilize data from the 2003 Integrated Household Survey (IHS) to
arrive at estimates of household expenditure on health and also to conduct a small scale
household survey in 2006 to address issues of health seeking behaviour which were
largely not covered by the IHS.
Integrated Household Survey (IHS)
The primary sampling unit for the IHS were enumeration areas (EA) which were drawn
from the 2003 Population and Housing Census demarcated EAs. For this survey 240 EAs
were selected consisting of 4 sub-samples of 60 EAs surveyed at each quarter. A sample
of 4800 households was drawn across all Local Government Areas LGA) with the
probability of selecting a household in an LGA proportional to the size of the LGA, in
terms of population. The sampling was done in two levels: enumeration areas (EAs) and
households. EAs were stratified by rural-urban areas (12 strata + Banjul and Kanifing).
NATIONAL HEALTH ACCOUNTS
41
Training of field workers lasted a week during which both enumerators and supervisors
were trained on how to complete the questionnaires. Since the questionnaires were in
English and not translated to any of the local languages, it was decide to train, first, in
English and later on attempt a translation of all the questions in the three major local
languages (Mandinka, Fula and Wollof). As the majority of Gambians could not
complete the questionnaires in English the translation exercise was aimed at ensuring a
common understanding of the concepts in the questionnaires and a uniform translation of
the questions.
Enumerators despatched to the field during the data collection began with a household
listing exercise. The listed households served as a sampling frame for the selection of
households for the detail interviews. Households in protected areas were not surveyed
(mostly military, police and prison camps etc.). Six teams made of 6 supervisors and 30
enumerators each were assigned to the different geographical locations. Each enumerator
covered 40 households in two EAs by quarter. Among these 40 households, 20
households were selected (10 per EA) for whom the daily diaries were administered. In
total the enumerators stayed 6 weeks in each EA. The data collection started in January
2003 and ended in May 2004.
For the purpose of collecting data on household expenditure daily diaries were kept for
the selected households by enumerators of the IHS. These diaries were used to keep
records of household expenditure for a period of a month. The data presented in this
report on household expenditure on health was derived from data compiled from these
diaries.
As is common to household surveys, particularly, income and expenditure surveys
reporting is often prone to varying degrees of errors. A limitation identified with the IHS
is the under-reporting of household expenditure attributed to respondent fatigue due to
the long duration of the completion of the daily diaries. This under-reporting of
expenditure might have affected the expenditure figure presented in this report.
Another limitation related to the IHS data is the fact that since the survey was not
specifically designed for the National Health Accounts, the data was not structured to fit
in the NHA tables. For example, to determine how much of health expenditure went to
out-patient services and how much to in-patient services, data on health seeking
behaviour had to be used as a proxy to disaggregate expenditure on health. As health
expenditure was also not disaggregated by service provider, data on health seeking
behaviour had to be used to disaggregate expenditure.
National Health Accounts (NHA) Household Health Expenditure and Utilization
Survey, 2006
The Household Health Expenditure and Utilization Survey conducted in 2006 targeted
1000 households distributed across LGAs. Probability of selecting a household from each
of the LGAs was proportional to the population size of the LGA. For the purpose of
NATIONAL HEALTH ACCOUNTS
42
selecting the sample EA the country was stratified into urban and rural. For the 38
enumeration areas selected for the survey 18 were in urban areas and the remaining 20 in
rural areas. As was the case with the IHS the EAs in the 2003 Population and Housing
Census were used as the sampling frame. The second stage of the sampling involved the
selection of households for the detail interviews. Upon the updating of the households in
the selected enumeration areas, enumerators selected 25-29 households in each of the
selected households. This selection process involved the use of random number table to
avoid any bias in the selection.
Enumerators were trained on the completion of the questionnaires for an initial period of
3 days. Following this training enumerators and supervisors were despatched to the field
to pre-test the questionnaires for a day. The following day the teams returned to the
training hall for a review of the completed questionnaires and also to share experiences of
the pre-test. Supervisors who reviewed the completed questionnaires commented on them
and identified errors and misconception. During mock interviewers in the course of the
training, the questions were translated into the local languages to enhance interviewers
understanding of the questionnaires.
The questionnaires were designed to collect data on the following areas;
Demographic characteristics
Education
Employment and remuneration of households in the last 12 months
Health Status of members of the household in the last four weeks
Smoking Habits
Presence of chronic illness
Health seeking behaviour
In-patient admission in the last one year; reasons for admission and duration for
admission
Utilization of out-patient and other health related services in past four weeks
Reasons for seeking health care:
Type of the health provider/facility visited and reasons for the choice
Cost of the services received
Availability of prescribed drugs
Perception on the quality of service received
Time and cost of transportation to health provider
Routine health expenses in the last four weeks
Type of the health provider/facility admitted in and reasons for the choice
Reasons for and cost of admission
source of funds for the services received including drugs
Travel time to health facility and cost of transportation (admissions)
Perception of the quality of services at the inpatient facility
Time and cost of transportation to inpatient health provider
Mortality of household members in the last 12 months
Did the deceased consume health services before he/she died?
How much did the household spend on treatment for the deceased?
NATIONAL HEALTH ACCOUNTS
43
Access to health insurance
HOUSING CONDITIONS
Construction material (walls, floor and roof)
Source of lighting
Cooking facility and fuel
Toilet facility
Source of drinking water
Tenure of accommodation of households
Notwithstanding the array of topics covered in this survey, for the purpose of the NHA,
data was compiled on selected areas which have been presented in this report. Topics
included in this report mainly relate to health seeking behaviour. Further analysis of the
results of this survey could be the subject of further research.
Data Collection, Processing and Analysis
For the data collection 4 teams, each consisting a supervisor and five enumerators, were
constituted. Two officials one from the Central Statistics Department and one from DPI
coordinated the data collection. The data collection lasted 20 days. Following the
completion of the data collection a coding and editing exercise was undertaken after
which using data was entered using the CSPro software. After the entry the data was
cleaned of errors and the tables generated.
3.2.2 Sampling Frame for organizations survey
Seventy-three (73) private firms (companies), 21 private/NGO health facilities, 37 NGOs,
17 donors and 4 insurance companies were identified for the survey. Table 3.1 shows the
numbers and percentages of different organizations contacted and those that responded.
In general the response was good.
Table 3.1: Breakdown of data sources contacted and respondents
Total number
contacted
Number of
Responded
Percentage
collected
Health Care Providers
Public 41 41 100
Private/NGO 21 18 86
Sources
Govt Department 5 5 100
LGAs 8 7 87.5
Donor 17 14 82
NGO 37 20 54
Insurance 4 1 25
NATIONAL HEALTH ACCOUNTS
44
Employer/Private firms 73 70 96
Households (2006) 1000 1000 100
3.2.2 Employer Survey
The lists of companies and other employers obtained from Registrar General’s
Department, The Gambia Chamber of Commerce and were compared to determine the
sample size and the cut off point (only organisations with more than (20) twenty
employees). All identified were included in the survey. The data collection was done by
Account Technicians provided by the Directorate of National Treasury. The NHA
Technical Committee provided the supervision of the data collection.
The employer survey instrument contained questions on: general information (firm name
and ownership, principal activity, number of full-and part-time employees); whether the
firm provided medical insurance in the year 2002 to 2004; number of employees covered
by insurance; whether the insurance covered dependents; amount of premiums paid by
the firm; amount employees contribute to private health insurance; types of health
services covered by insurance; amount the firm reimbursed employees for medical
expenses incurred; types of health care services (e.g. inpatient, outpatient, drugs) the firm
reimbursed for; amount spent to reimburse for services purchased at private and public
health care facilities; whether the firm provided on-site health services for employees;
amount spent to provide on-site health services (e.g. expenditure on salaries, drugs and
medical supplies, equipment etc); amount of subsidies the government or any other non-
governmental organization make in support of their health facilities; number of health
care facilities owned by the firm and types of services provided; amounts of money
employees pay for services and/or medication offered in these facilities; firm’s annual
expenditure on various public health sector services (See Employer questionnaires in the
Annex section).
3.2.3 Non-Governmental Organizations Survey
The lists of NGOs was obtained from the Registrar General, NGO Affairs Agency of the
Department of Local Government were used to determine the sample size and identified
NGOs involved in health. The data collection was done by Account Technicians provided
NATIONAL HEALTH ACCOUNTS
45
by the Directorate of National Treasury. The NHA Technical Committee provided the
supervision of the data collection.
The non-governmental organization survey questionnaire gathered information on: NGO
identity; types of health services or activities supported; amount of revenue obtained by
the NGO from cost sharing/user fees, grants from government, and foreign assistance;
types and market value of goods received in kind; organizations that the NGO provided
with funds for health activities and the amounts in 2002 to 2004; and details on the
amount spent on various health service functions (see NGO Questionnaires in Annex..).
3.2.4 Development partners/ Donor survey
The list of donors was provided by the Department of State for Foreign Affairs and all
were contacted. The data collection was done by the NHA Technical Committee.
The donor survey instrument contained items/questions on: identification information
(name and type of donor and contacts); type of health care related activities
provided/supported (financially and/or technically) and dollar value of that support;
grants/loans to other institutions/organization(s) that provide health care or health related
activities. Each donor was also asked to indicate the amount that it spent in the year 2002
to 2004 to support your health or health related activities within its own organization, e.g.
for programme administration, inpatient care, outpatient care, rehabilitative care, drugs
and medical supplies, public health administration of health services, administration of
public health programmes, education and training of health personnel, research, IEC, and
environmental health, among others (See Annex…). Lastly, the donor was asked to
indicate the amount that his/her organization spent in the year 2002 to 2004 to support
her activities (i.e. administration) in The Gambia as well as the amount spent on technical
assistance not included in the earlier amounts, e.g. administration/programme support,
technical assistance, in-kind support, etc (see Donor Questionnaires in Annex…).
3.2.5 Insurance firms survey
The list of insurance companies was obtained from Registrar General Department and all
were contacted. The data collection was done by Account Technicians provided by the
Directorate of National Treasury. The NHA Technical Committee provided the
supervision of the data collection.
The health insurance survey instrument had questions on: general information (e.g. type
of insurance company); type of insurance policies (e.g. health insurance, life assurance,
personal accident, car insurance, education insurance); whether health insurance is
included as part of other insurance, total premiums and health expenses; organisation’s
total revenues (group/company, individual/family); whether the insurance company
offered health insurance coverage for hospital inpatient care, out patient care, maternity
NATIONAL HEALTH ACCOUNTS
46
/antenatal care services, HIV/AIDs services, TB care services, evacuation to other
country and treatment in public, private, mission, and/or own facility; number of
subscribers to company/employer, group, and individual/family health insurance cover; a
breakdown of the amount of payment/reimbursement made according to various health
service providers; total revenue from own overall business in the period; own total
expenditure on health from overall business for the period; and types of services contract
out to hospitals/ nursing homes and medical expenses reimbursed (see Insurance
Questionnaires in Annex…).
3.2.6 Private practitioners
The Technical Committee had to use their knowledge of the health system to identify the
private practitioners as there was no up to date registration of these institutions. The data
collection was done by Account Technicians provided by the Directorate of National
Treasury. The NHA Technical Committee provided the supervision of the data collection
The health provider survey questionnaires contained items on: provider identification
(name, type and ownership); types and amounts of revenue for health care and related activities/functions from private insurance reimbursement, employer reimbursement, direct user fees, community funds (at public health centres and dispensaries only), individual contributions/premiums, employer/group contributions, volunteer labour, cash and in-kind grants from government, and foreign/NGO assistance-grants/donations/loans; amounts given to other organizations to provide health related services; amounts of money that the
provider spent on various health care functions (see Private Questionnaires in Annex…).
3.2.7 Government Departments/Parastatals Survey
The NHA Technical Committee encountered no difficulty to identify the departments and
parastatals as they were few. All the concerned departments and parastatals were
contacted. The data collection was done by Account Technicians provided by the
Directorate of National Treasury. The NHA Technical Committee provided the
supervision of the data collection
The respondents were asked to indicate the amount of revenue obtained by his/her
institution in 2002, 2003 and 2004 from Cost Sharing Schemes/User fees, Transfers from
Central Government (DoSFEA) in cash and kind, and Foreign assistance (loans, grants
and donations). S/he was also asked to indicate the amount her/his institution spent on the
following activities in year 2002 to 2004, namely: inpatient care services, outpatient care
services, rehabilitative care services, drugs and medical supplies, public health,
administration of health services, administration of public health programs, education and
training of health personnel, research, IEC, environmental health.
The questionnaire also asked for the actual expenditure on the following inputs (in the
years 2002 to 2004) on personnel emoluments (remuneration, employer contribution to
employees health insurance), goods and services (travel and subsistence expenses, drugs
and medical supplies, material supplies, transport, utilities, maintenance, property rental
NATIONAL HEALTH ACCOUNTS
47
and related charges, property rental and development), education and training (research
and development, nutritional surveillance, water and sanitation), subsidies and other
current transfers (membership fees and subscription, government organization,
individuals and non-profit, public and departmental enterprise), and development
expenditure (furniture and office equipment, vehicles, operational equipment and
machinery) (See Departments questionnaires Annex …).
The Local Government Area survey instrument contained questions on: general
information; amount of revenue obtained from general taxes (utility taxes), grants (cash
and kind) from government, foreign assistance (loans, grants/donations); amount spent on
the following activities Inpatient care services, Adopt and maintain hospital ward,
Outpatient care services, Rehabilitative care services, Drugs and medical supplies, Public
health administration and services, education and training of health personnel, research,
IEC, and environmental health; amounts spent on acquisition of health inputs.
The other departments included DoSFEA, DoSFA, DOSE, DOSD, and DOSI.
The survey instrument for other Departments of State gathered general information;
amount of revenue (from cost sharing schemes/user fees, transfers from DoSFEA, foreign
assistance) obtained by the Department of State in year 2002 to 2004; amount the
department spent on inpatient services, outpatient services, drugs and medical supplies,
public health administration and health services, education and training of health
personnel, research, IEC, and environmental information, among others; and actual
expenditure on the inputs in the year 2002 to 2004.
3.3 Data analysis
After checking for completeness of the questionnaires filled by various organizations, the
data were entered, cleaned and preliminary analysis done using Excel software. This data
was then entered into dummy matrix tables and analyzed using Excel software. The
matrices were built in accordance to the International Classification of NHA to facilitate
international comparison, but customised to the local situation. NHA uses many matrix
tables for analysis, but due to paucity of data, a decision was made to attempt completing
only the following four main matrices:
Financing Sources (FS) to Financing Agent (FA): (FS X FA)
Financing Agent (FA) to Providers (P): (FA X P)
Providers (P) to Inputs (RC): (P X RC)
Financing Agents (FA) to Health Functions (HF): (HF X FA)
3.4 Limitations of the NHA study
a) In the 2006 survey household sample size was very small
b) Poor response from the Bilateral donors and private health care providers
c) Expenditure data from some respondents was not in the NHA questionnaire
format
NATIONAL HEALTH ACCOUNTS
48
d) The IHS questionnaire was not designed to fulfil NHA
e) Pledged Funding support from other partners was never made available.
f) NAS could only provide the 2004 data
g) Complete expenditure on CISP (Italian Project) was not available
h) Expenditure on utility and telecommunication for DOSH and RVTH were not
available
i) The health insurance data was available in aggregate form and from only one
provider
References
1. WHO NHA Generic questionnaires
2. Kenyan NHA questionnaires
3. Namibia NHA questionnaires
4. Guide to developing NHA (WHO, WB and USAID)
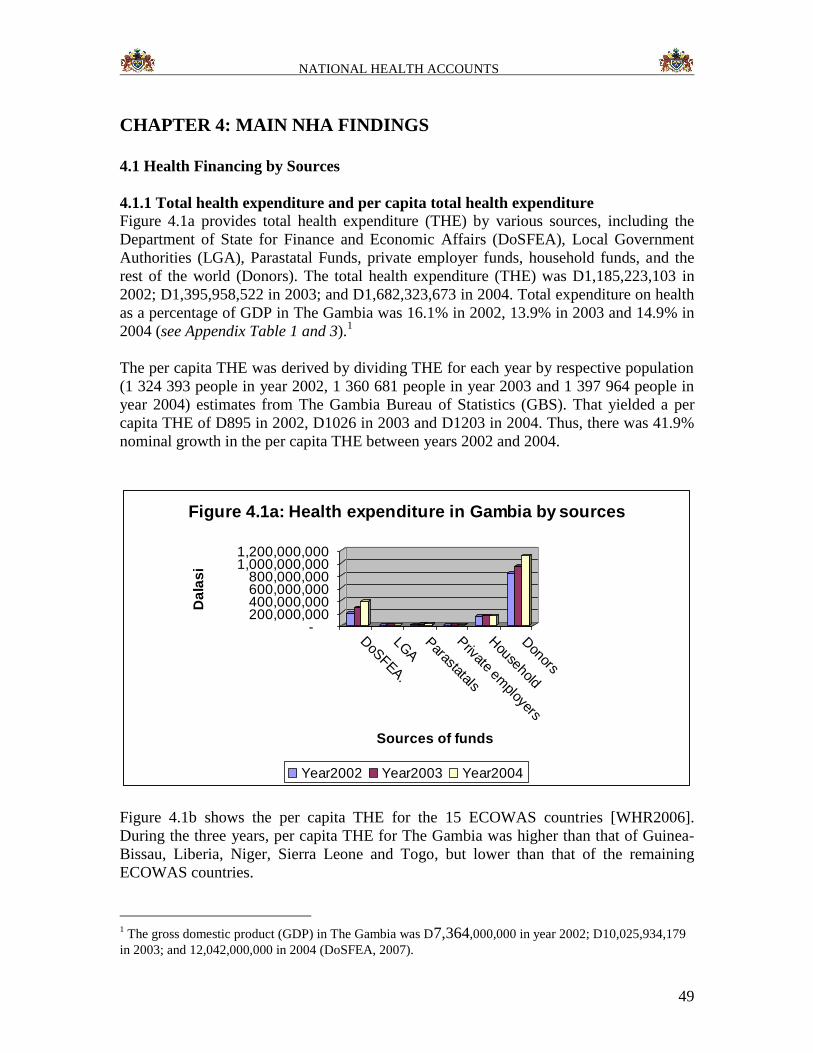
NATIONAL HEALTH ACCOUNTS
49
CHAPTER 4: MAIN NHA FINDINGS
4.1 Health Financing by Sources
4.1.1 Total health expenditure and per capita total health expenditure
Figure 4.1a provides total health expenditure (THE) by various sources, including the
Department of State for Finance and Economic Affairs (DoSFEA), Local Government
Authorities (LGA), Parastatal Funds, private employer funds, household funds, and the
rest of the world (Donors). The total health expenditure (THE) was D1,185,223,103 in
2002; D1,395,958,522 in 2003; and D1,682,323,673 in 2004. Total expenditure on health
as a percentage of GDP in The Gambia was 16.1% in 2002, 13.9% in 2003 and 14.9% in
2004 (see Appendix Table 1 and 3).1
The per capita THE was derived by dividing THE for each year by respective population
(1 324 393 people in year 2002, 1 360 681 people in year 2003 and 1 397 964 people in
year 2004) estimates from The Gambia Bureau of Statistics (GBS). That yielded a per
capita THE of D895 in 2002, D1026 in 2003 and D1203 in 2004. Thus, there was 41.9%
nominal growth in the per capita THE between years 2002 and 2004.
-200,000,000400,000,000600,000,000800,000,000
1,000,000,0001,200,000,000
Da
las
i
DoS
FEA.
LGA
Parastatals
Private em
ployers
Household
Donors
Sources of funds
Figure 4.1a: Health expenditure in Gambia by sources
Year2002 Year2003 Year2004
Figure 4.1b shows the per capita THE for the 15 ECOWAS countries [WHR2006].
During the three years, per capita THE for The Gambia was higher than that of Guinea-
Bissau, Liberia, Niger, Sierra Leone and Togo, but lower than that of the remaining
ECOWAS countries.
1 The gross domestic product (GDP) in The Gambia was D7,364,000,000 in year 2002; D10,025,934,179
in 2003; and 12,042,000,000 in 2004 (DoSFEA, 2007).
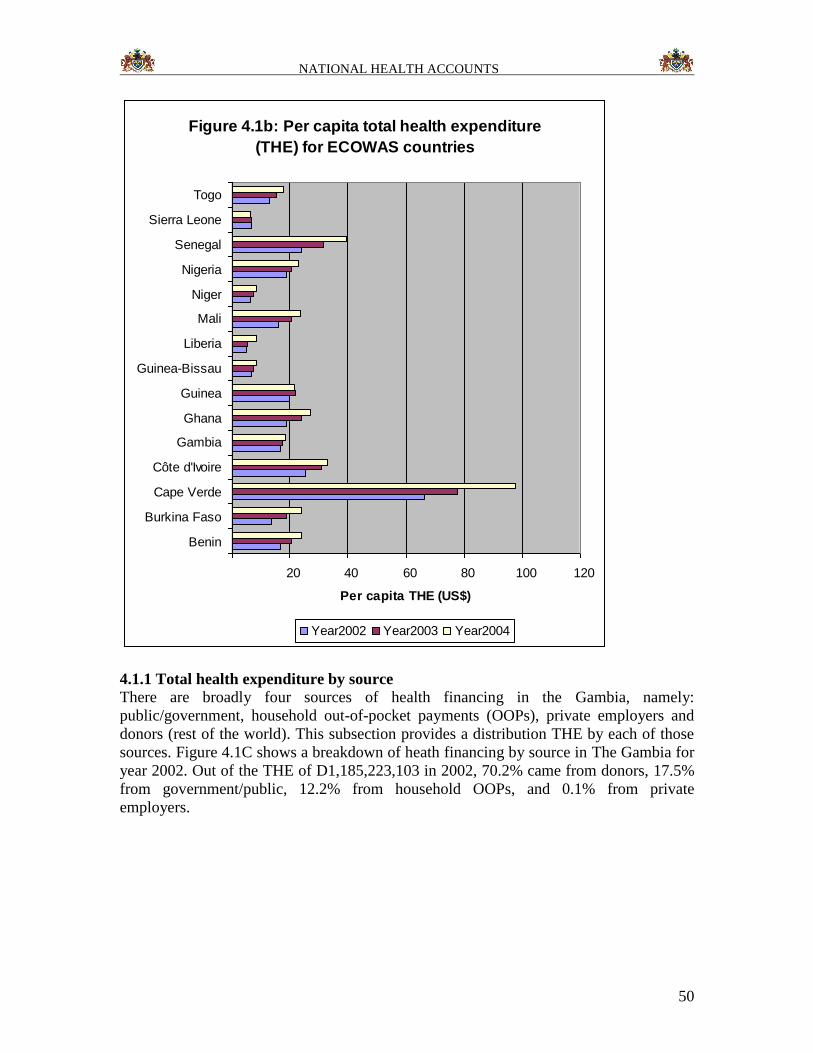
NATIONAL HEALTH ACCOUNTS
50
Figure 4.1b: Per capita total health expenditure
(THE) for ECOWAS countries
20 40 60 80 100 120
Benin
Burkina Faso
Cape Verde
Côte d'Ivoire
Gambia
Ghana
Guinea
Guinea-Bissau
Liberia
Mali
Niger
Nigeria
Senegal
Sierra Leone
Togo
Per capita THE (US$)
Year2002 Year2003 Year2004
4.1.1 Total health expenditure by source There are broadly four sources of health financing in the Gambia, namely:
public/government, household out-of-pocket payments (OOPs), private employers and
donors (rest of the world). This subsection provides a distribution THE by each of those
sources. Figure 4.1C shows a breakdown of heath financing by source in The Gambia for
year 2002. Out of the THE of D1,185,223,103 in 2002, 70.2% came from donors, 17.5%
from government/public, 12.2% from household OOPs, and 0.1% from private
employers.
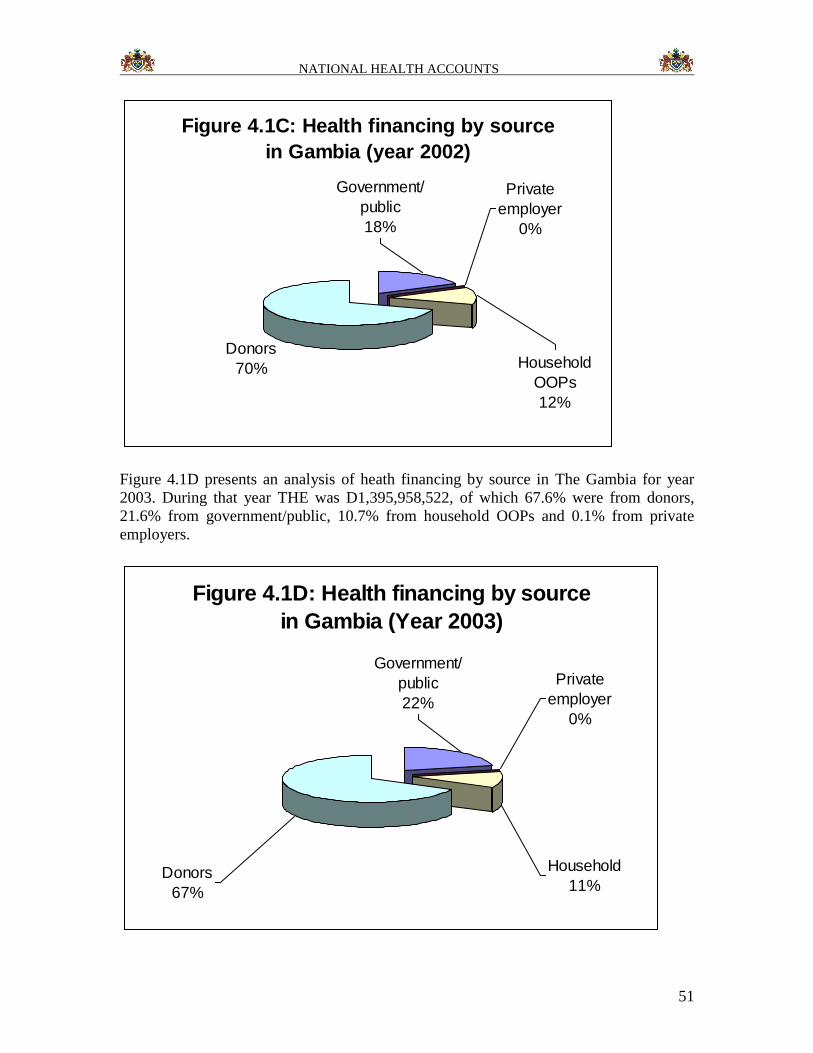
NATIONAL HEALTH ACCOUNTS
51
Figure 4.1C: Health financing by source
in Gambia (year 2002)
Donors
70% Household
OOPs
12%
Private
employer
0%
Government/
public
18%
Figure 4.1D presents an analysis of heath financing by source in The Gambia for year
2003. During that year THE was D1,395,958,522, of which 67.6% were from donors,
21.6% from government/public, 10.7% from household OOPs and 0.1% from private
employers.
Figure 4.1D: Health financing by source
in Gambia (Year 2003)
Private
employer
0%
Government/
public
22%
Donors
67%
Household
11%
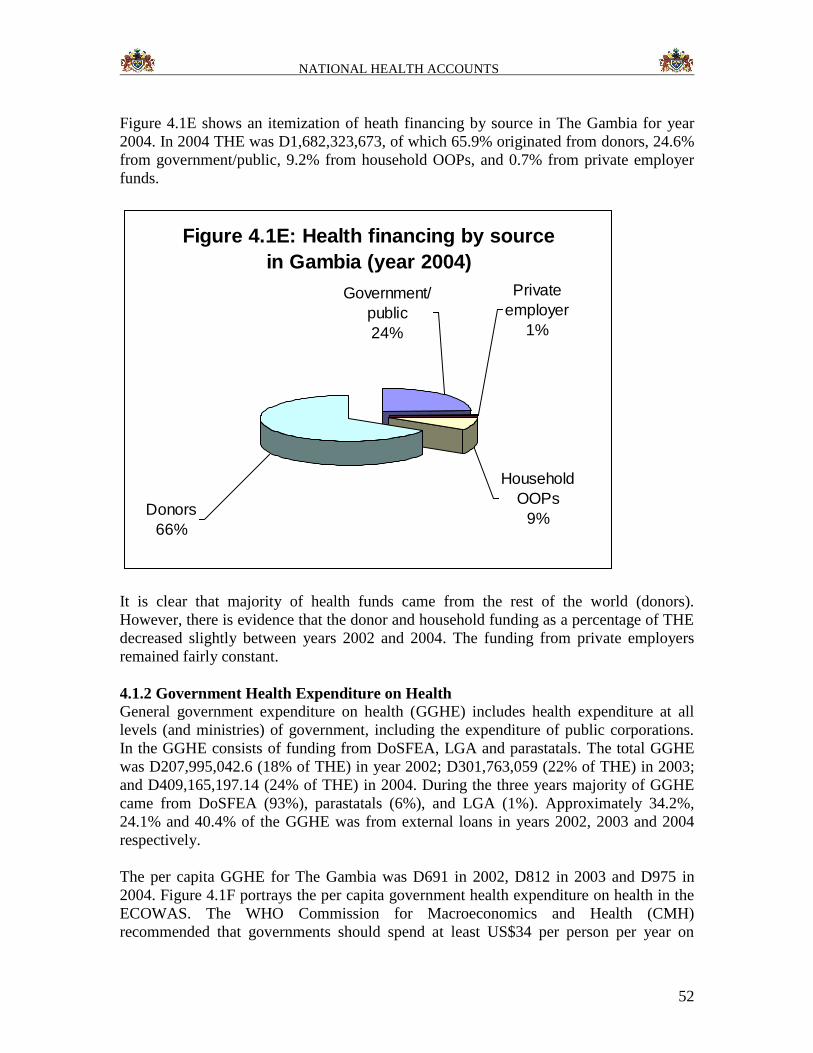
NATIONAL HEALTH ACCOUNTS
52
Figure 4.1E shows an itemization of heath financing by source in The Gambia for year
2004. In 2004 THE was D1,682,323,673, of which 65.9% originated from donors, 24.6%
from government/public, 9.2% from household OOPs, and 0.7% from private employer
funds.
Figure 4.1E: Health financing by source
in Gambia (year 2004)
Household
OOPs
9%
Private
employer
1%
Government/
public
24%
Donors
66%
It is clear that majority of health funds came from the rest of the world (donors).
However, there is evidence that the donor and household funding as a percentage of THE
decreased slightly between years 2002 and 2004. The funding from private employers
remained fairly constant.
4.1.2 Government Health Expenditure on Health
General government expenditure on health (GGHE) includes health expenditure at all
levels (and ministries) of government, including the expenditure of public corporations.
In the GGHE consists of funding from DoSFEA, LGA and parastatals. The total GGHE
was D207,995,042.6 (18% of THE) in year 2002; D301,763,059 (22% of THE) in 2003;
and D409,165,197.14 (24% of THE) in 2004. During the three years majority of GGHE
came from DoSFEA (93%), parastatals (6%), and LGA (1%). Approximately 34.2%,
24.1% and 40.4% of the GGHE was from external loans in years 2002, 2003 and 2004
respectively.
The per capita GGHE for The Gambia was D691 in 2002, D812 in 2003 and D975 in
2004. Figure 4.1F portrays the per capita government health expenditure on health in the
ECOWAS. The WHO Commission for Macroeconomics and Health (CMH)
recommended that governments should spend at least US$34 per person per year on
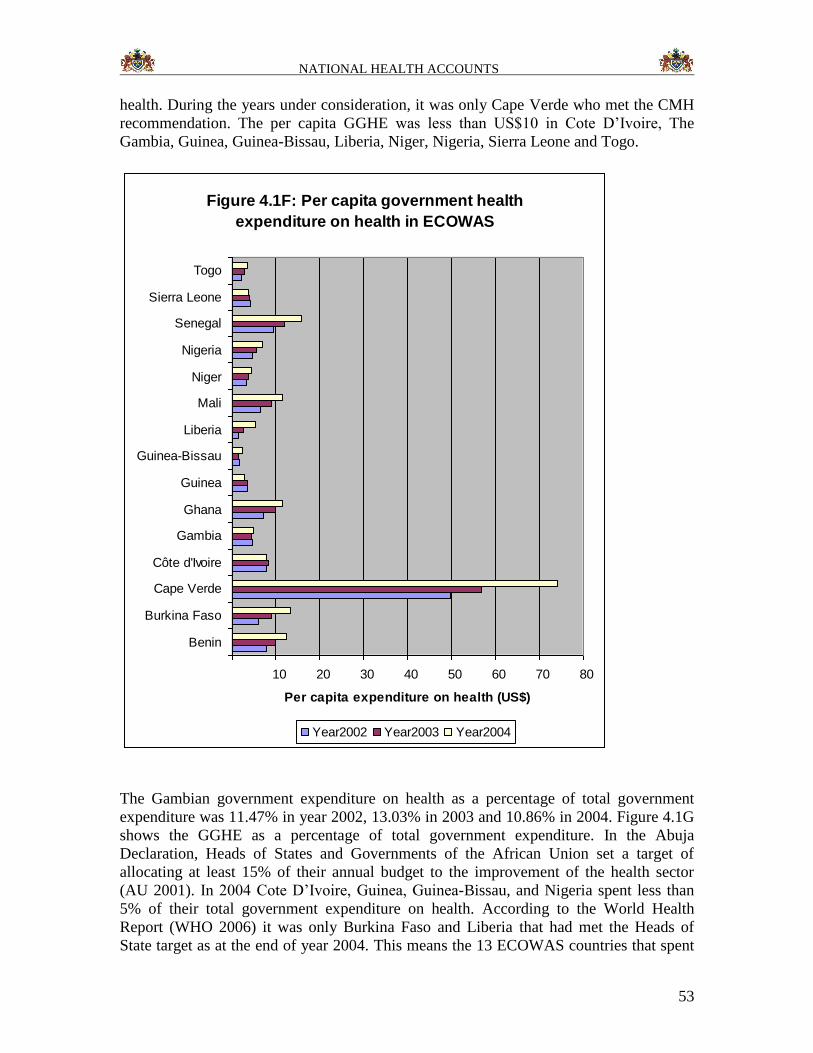
NATIONAL HEALTH ACCOUNTS
53
health. During the years under consideration, it was only Cape Verde who met the CMH
recommendation. The per capita GGHE was less than US$10 in Cote D’Ivoire, The
Gambia, Guinea, Guinea-Bissau, Liberia, Niger, Nigeria, Sierra Leone and Togo.
Figure 4.1F: Per capita government health
expenditure on health in ECOWAS
10 20 30 40 50 60 70 80
Benin
Burkina Faso
Cape Verde
Côte d'Ivoire
Gambia
Ghana
Guinea
Guinea-Bissau
Liberia
Mali
Niger
Nigeria
Senegal
Sierra Leone
Togo
Per capita expenditure on health (US$)
Year2002 Year2003 Year2004
The Gambian government expenditure on health as a percentage of total government
expenditure was 11.47% in year 2002, 13.03% in 2003 and 10.86% in 2004. Figure 4.1G
shows the GGHE as a percentage of total government expenditure. In the Abuja
Declaration, Heads of States and Governments of the African Union set a target of
allocating at least 15% of their annual budget to the improvement of the health sector
(AU 2001). In 2004 Cote D’Ivoire, Guinea, Guinea-Bissau, and Nigeria spent less than
5% of their total government expenditure on health. According to the World Health
Report (WHO 2006) it was only Burkina Faso and Liberia that had met the Heads of
State target as at the end of year 2004. This means the 13 ECOWAS countries that spent
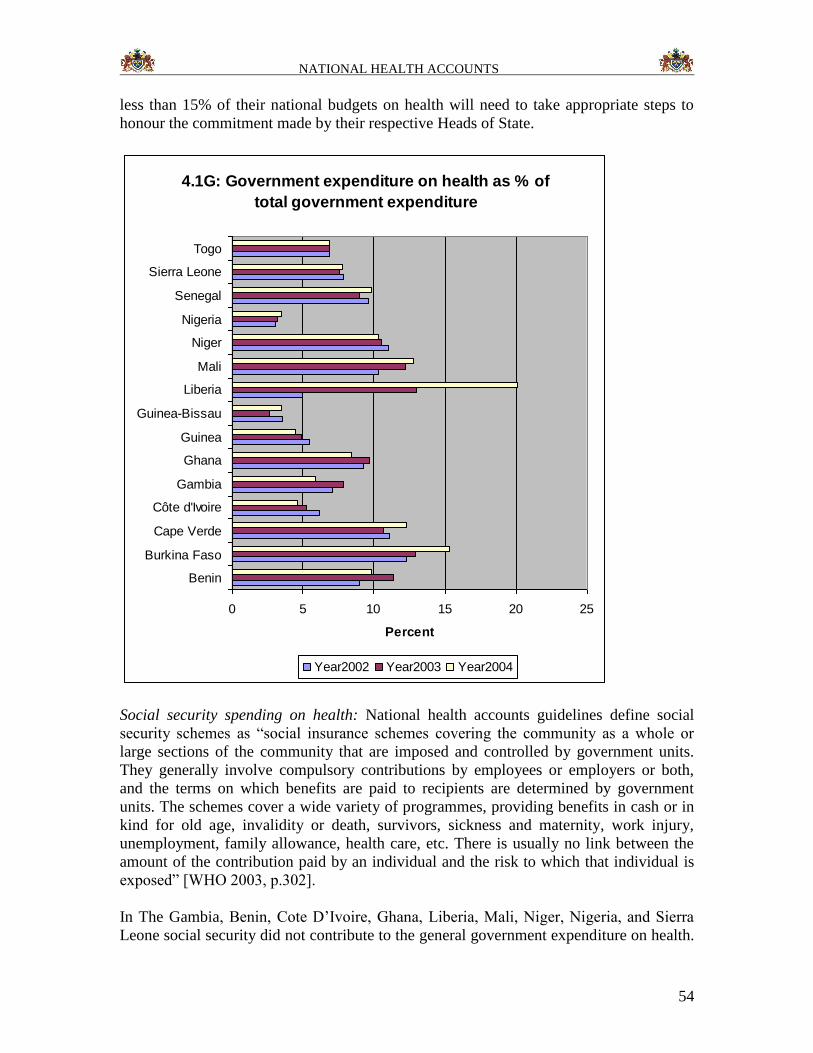
NATIONAL HEALTH ACCOUNTS
54
less than 15% of their national budgets on health will need to take appropriate steps to
honour the commitment made by their respective Heads of State.
4.1G: Government expenditure on health as % of
total government expenditure
0 5 10 15 20 25
Benin
Burkina Faso
Cape Verde
Côte d'Ivoire
Gambia
Ghana
Guinea
Guinea-Bissau
Liberia
Mali
Niger
Nigeria
Senegal
Sierra Leone
Togo
Percent
Year2002 Year2003 Year2004
Social security spending on health: National health accounts guidelines define social
security schemes as “social insurance schemes covering the community as a whole or
large sections of the community that are imposed and controlled by government units.
They generally involve compulsory contributions by employees or employers or both,
and the terms on which benefits are paid to recipients are determined by government
units. The schemes cover a wide variety of programmes, providing benefits in cash or in
kind for old age, invalidity or death, survivors, sickness and maternity, work injury,
unemployment, family allowance, health care, etc. There is usually no link between the
amount of the contribution paid by an individual and the risk to which that individual is
exposed” [WHO 2003, p.302].
In The Gambia, Benin, Cote D’Ivoire, Ghana, Liberia, Mali, Niger, Nigeria, and Sierra
Leone social security did not contribute to the general government expenditure on health.
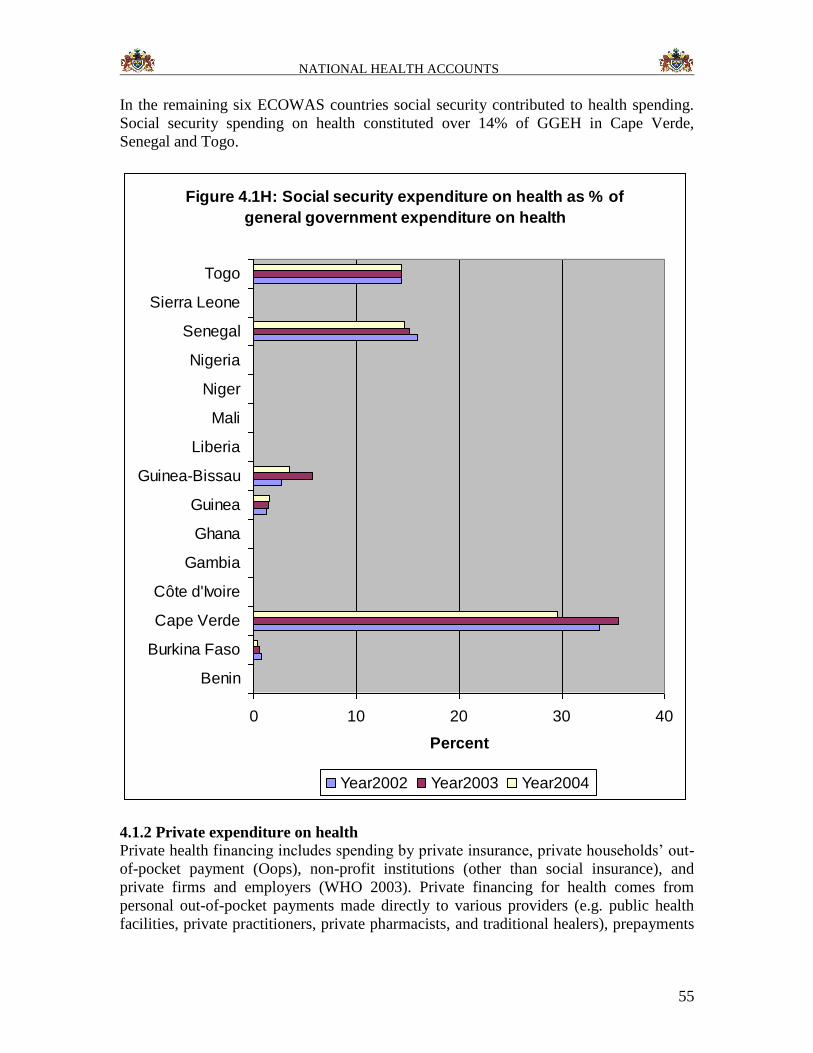
NATIONAL HEALTH ACCOUNTS
55
In the remaining six ECOWAS countries social security contributed to health spending.
Social security spending on health constituted over 14% of GGEH in Cape Verde,
Senegal and Togo.
Figure 4.1H: Social security expenditure on health as % of
general government expenditure on health
0 10 20 30 40
Benin
Burkina Faso
Cape Verde
Côte d'Ivoire
Gambia
Ghana
Guinea
Guinea-Bissau
Liberia
Mali
Niger
Nigeria
Senegal
Sierra Leone
Togo
Percent
Year2002 Year2003 Year2004
4.1.2 Private expenditure on health
Private health financing includes spending by private insurance, private households’ out-
of-pocket payment (Oops), non-profit institutions (other than social insurance), and
private firms and employers (WHO 2003). Private financing for health comes from
personal out-of-pocket payments made directly to various providers (e.g. public health
facilities, private practitioners, private pharmacists, and traditional healers), prepayments
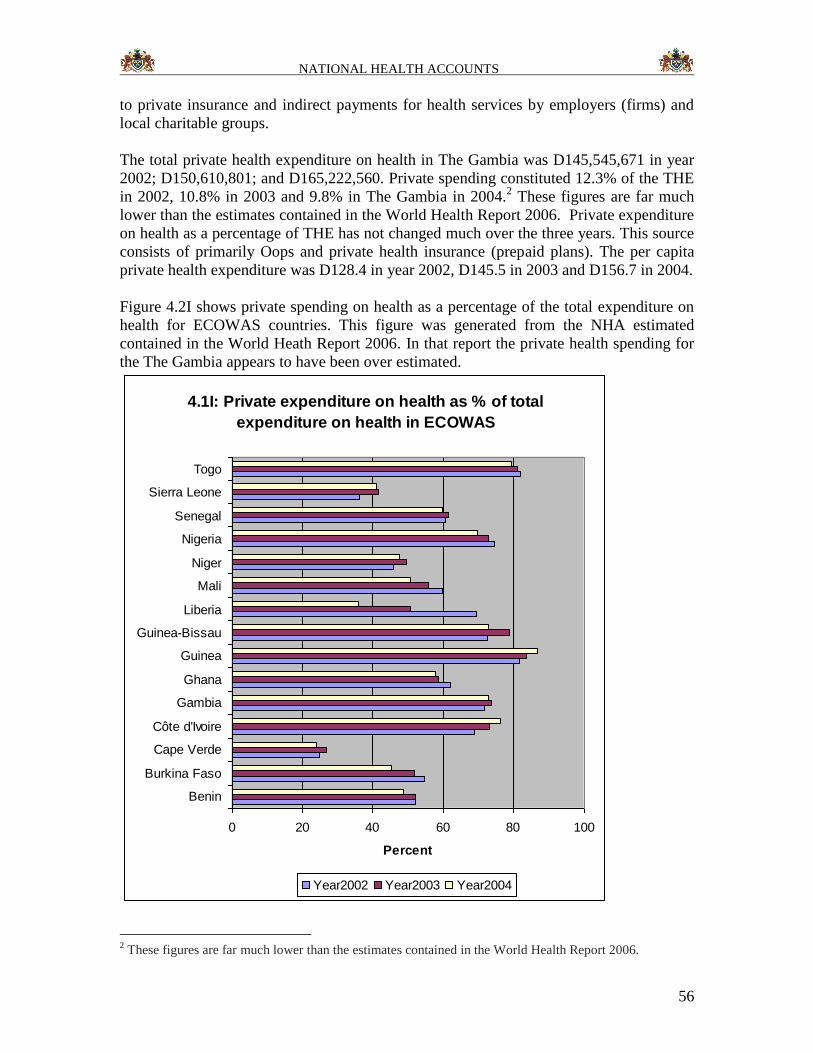
NATIONAL HEALTH ACCOUNTS
56
to private insurance and indirect payments for health services by employers (firms) and
local charitable groups.
The total private health expenditure on health in The Gambia was D145,545,671 in year
2002; D150,610,801; and D165,222,560. Private spending constituted 12.3% of the THE
in 2002, 10.8% in 2003 and 9.8% in The Gambia in 2004.2 These figures are far much
lower than the estimates contained in the World Health Report 2006. Private expenditure
on health as a percentage of THE has not changed much over the three years. This source
consists of primarily Oops and private health insurance (prepaid plans). The per capita
private health expenditure was D128.4 in year 2002, D145.5 in 2003 and D156.7 in 2004.
Figure 4.2I shows private spending on health as a percentage of the total expenditure on
health for ECOWAS countries. This figure was generated from the NHA estimated
contained in the World Heath Report 2006. In that report the private health spending for
the The Gambia appears to have been over estimated.
4.1I: Private expenditure on health as % of total
expenditure on health in ECOWAS
0 20 40 60 80 100
Benin
Burkina Faso
Cape Verde
Côte d'Ivoire
Gambia
Ghana
Guinea
Guinea-Bissau
Liberia
Mali
Niger
Nigeria
Senegal
Sierra Leone
Togo
Percent
Year2002 Year2003 Year2004
2 These figures are far much lower than the estimates contained in the World Health Report 2006.
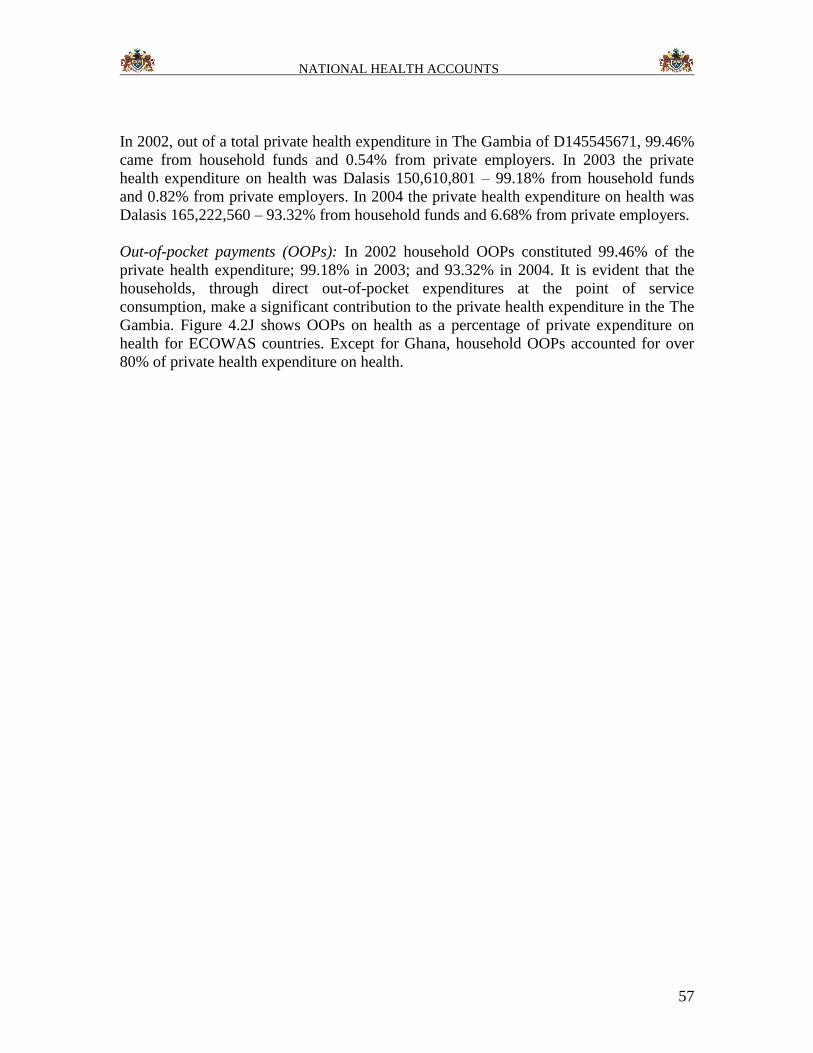
NATIONAL HEALTH ACCOUNTS
57
In 2002, out of a total private health expenditure in The Gambia of D145545671, 99.46%
came from household funds and 0.54% from private employers. In 2003 the private
health expenditure on health was Dalasis 150,610,801 – 99.18% from household funds
and 0.82% from private employers. In 2004 the private health expenditure on health was
Dalasis 165,222,560 – 93.32% from household funds and 6.68% from private employers.
Out-of-pocket payments (OOPs): In 2002 household OOPs constituted 99.46% of the
private health expenditure; 99.18% in 2003; and 93.32% in 2004. It is evident that the
households, through direct out-of-pocket expenditures at the point of service
consumption, make a significant contribution to the private health expenditure in the The
Gambia. Figure 4.2J shows OOPs on health as a percentage of private expenditure on
health for ECOWAS countries. Except for Ghana, household OOPs accounted for over
80% of private health expenditure on health.
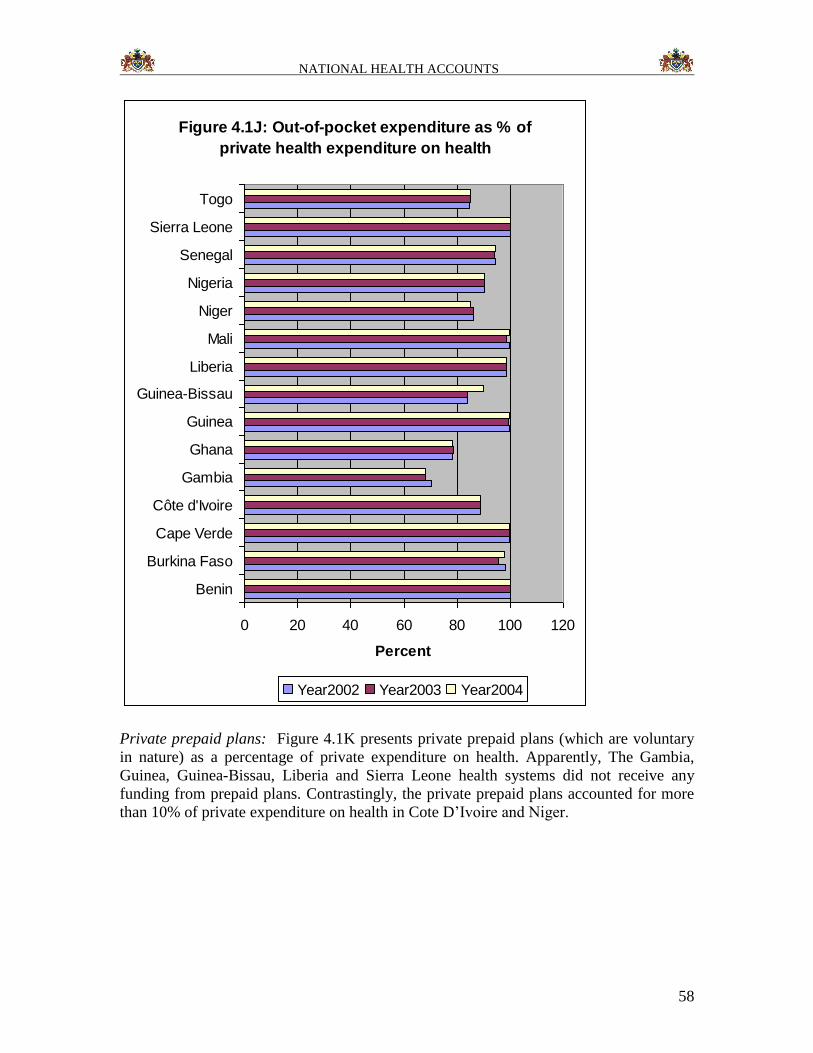
NATIONAL HEALTH ACCOUNTS
58
Figure 4.1J: Out-of-pocket expenditure as % of
private health expenditure on health
0 20 40 60 80 100 120
Benin
Burkina Faso
Cape Verde
Côte d'Ivoire
Gambia
Ghana
Guinea
Guinea-Bissau
Liberia
Mali
Niger
Nigeria
Senegal
Sierra Leone
Togo
Percent
Year2002 Year2003 Year2004
Private prepaid plans: Figure 4.1K presents private prepaid plans (which are voluntary
in nature) as a percentage of private expenditure on health. Apparently, The Gambia,
Guinea, Guinea-Bissau, Liberia and Sierra Leone health systems did not receive any
funding from prepaid plans. Contrastingly, the private prepaid plans accounted for more
than 10% of private expenditure on health in Cote D’Ivoire and Niger.
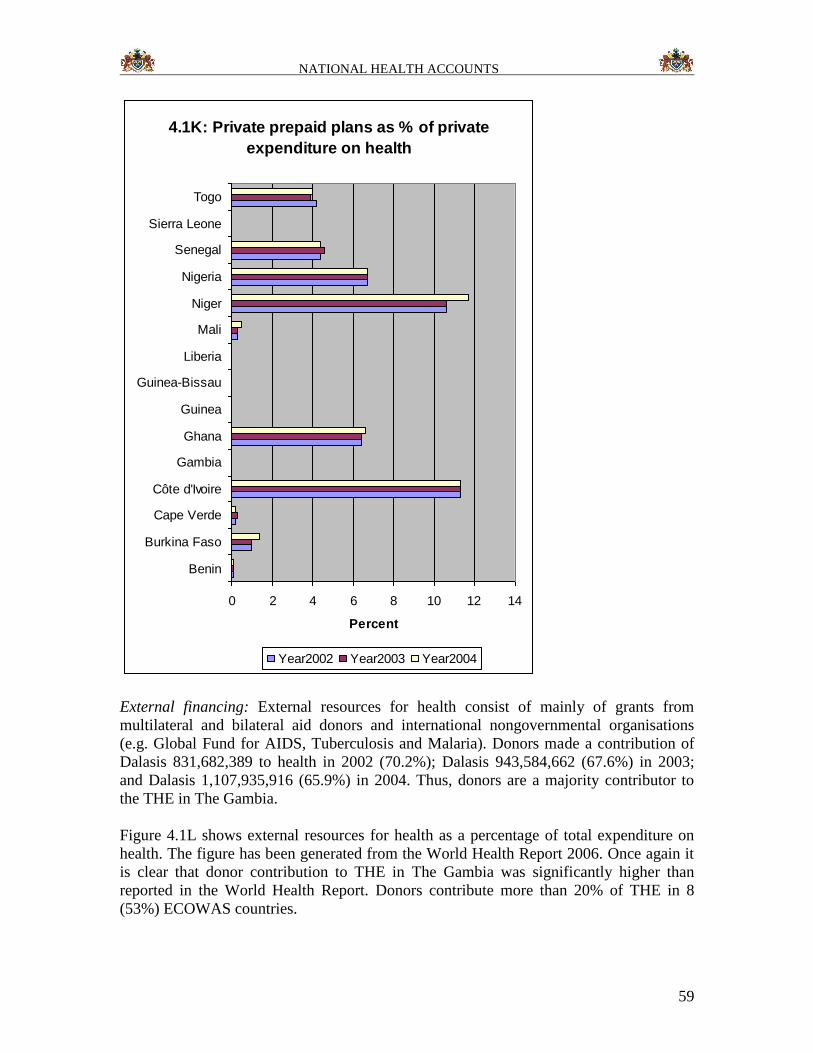
NATIONAL HEALTH ACCOUNTS
59
4.1K: Private prepaid plans as % of private
expenditure on health
0 2 4 6 8 10 12 14
Benin
Burkina Faso
Cape Verde
Côte d'Ivoire
Gambia
Ghana
Guinea
Guinea-Bissau
Liberia
Mali
Niger
Nigeria
Senegal
Sierra Leone
Togo
Percent
Year2002 Year2003 Year2004
External financing: External resources for health consist of mainly of grants from
multilateral and bilateral aid donors and international nongovernmental organisations
(e.g. Global Fund for AIDS, Tuberculosis and Malaria). Donors made a contribution of
Dalasis 831,682,389 to health in 2002 (70.2%); Dalasis 943,584,662 (67.6%) in 2003;
and Dalasis 1,107,935,916 (65.9%) in 2004. Thus, donors are a majority contributor to
the THE in The Gambia.
Figure 4.1L shows external resources for health as a percentage of total expenditure on
health. The figure has been generated from the World Health Report 2006. Once again it
is clear that donor contribution to THE in The Gambia was significantly higher than
reported in the World Health Report. Donors contribute more than 20% of THE in 8
(53%) ECOWAS countries.
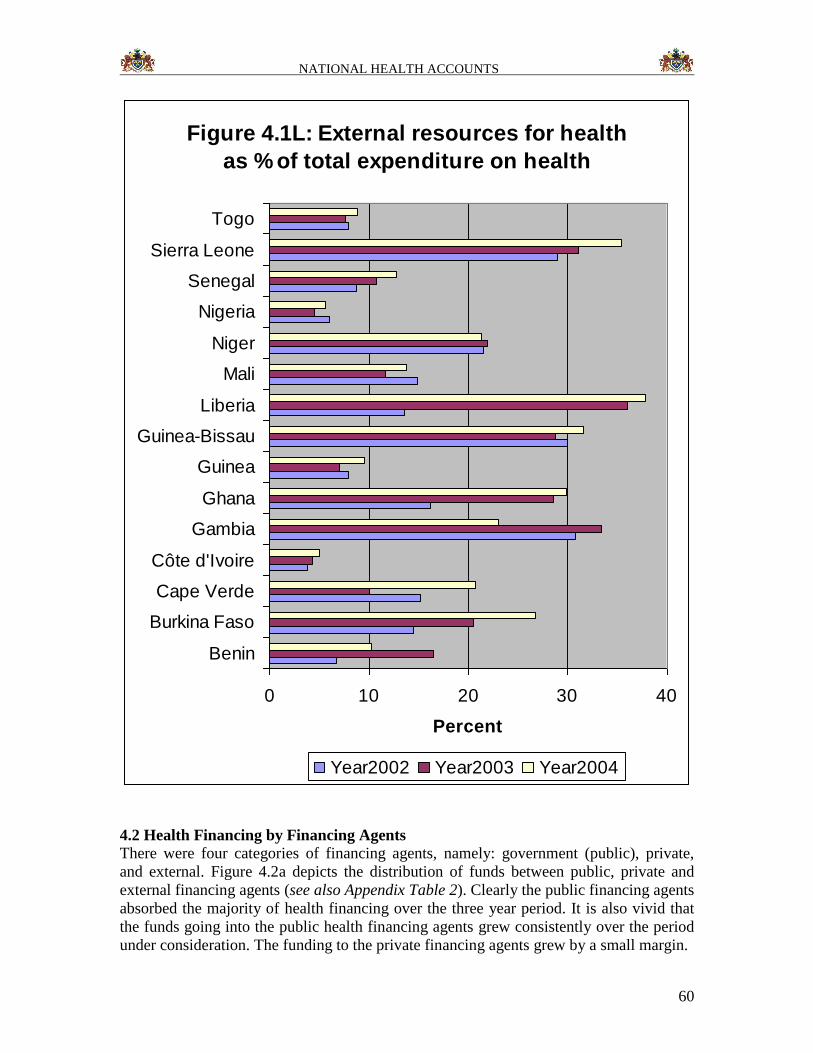
NATIONAL HEALTH ACCOUNTS
60
Figure 4.1L: External resources for health
as % of total expenditure on health
0 10 20 30 40
Benin
Burkina Faso
Cape Verde
Côte d'Ivoire
Gambia
Ghana
Guinea
Guinea-Bissau
Liberia
Mali
Niger
Nigeria
Senegal
Sierra Leone
Togo
Percent
Year2002 Year2003 Year2004
4.2 Health Financing by Financing Agents
There were four categories of financing agents, namely: government (public), private,
and external. Figure 4.2a depicts the distribution of funds between public, private and
external financing agents (see also Appendix Table 2). Clearly the public financing agents
absorbed the majority of health financing over the three year period. It is also vivid that
the funds going into the public health financing agents grew consistently over the period
under consideration. The funding to the private financing agents grew by a small margin.
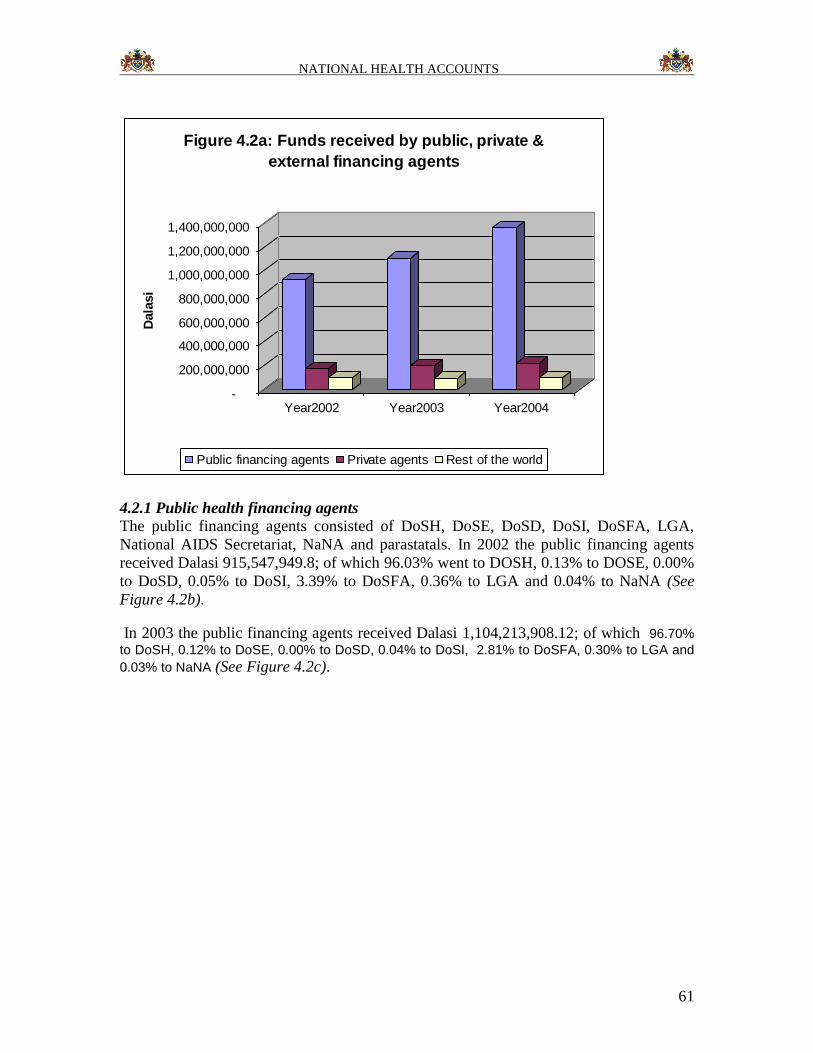
NATIONAL HEALTH ACCOUNTS
61
-
200,000,000
400,000,000
600,000,000
800,000,000
1,000,000,000
1,200,000,000
1,400,000,000
Dala
si
Year2002 Year2003 Year2004
Figure 4.2a: Funds received by public, private &
external financing agents
Public financing agents Private agents Rest of the world
4.2.1 Public health financing agents
The public financing agents consisted of DoSH, DoSE, DoSD, DoSI, DoSFA, LGA,
National AIDS Secretariat, NaNA and parastatals. In 2002 the public financing agents
received Dalasi 915,547,949.8; of which 96.03% went to DOSH, 0.13% to DOSE, 0.00%
to DoSD, 0.05% to DoSI, 3.39% to DoSFA, 0.36% to LGA and 0.04% to NaNA (See
Figure 4.2b).
In 2003 the public financing agents received Dalasi 1,104,213,908.12; of which 96.70%
to DoSH, 0.12% to DoSE, 0.00% to DoSD, 0.04% to DoSI, 2.81% to DoSFA, 0.30% to LGA and
0.03% to NaNA (See Figure 4.2c).
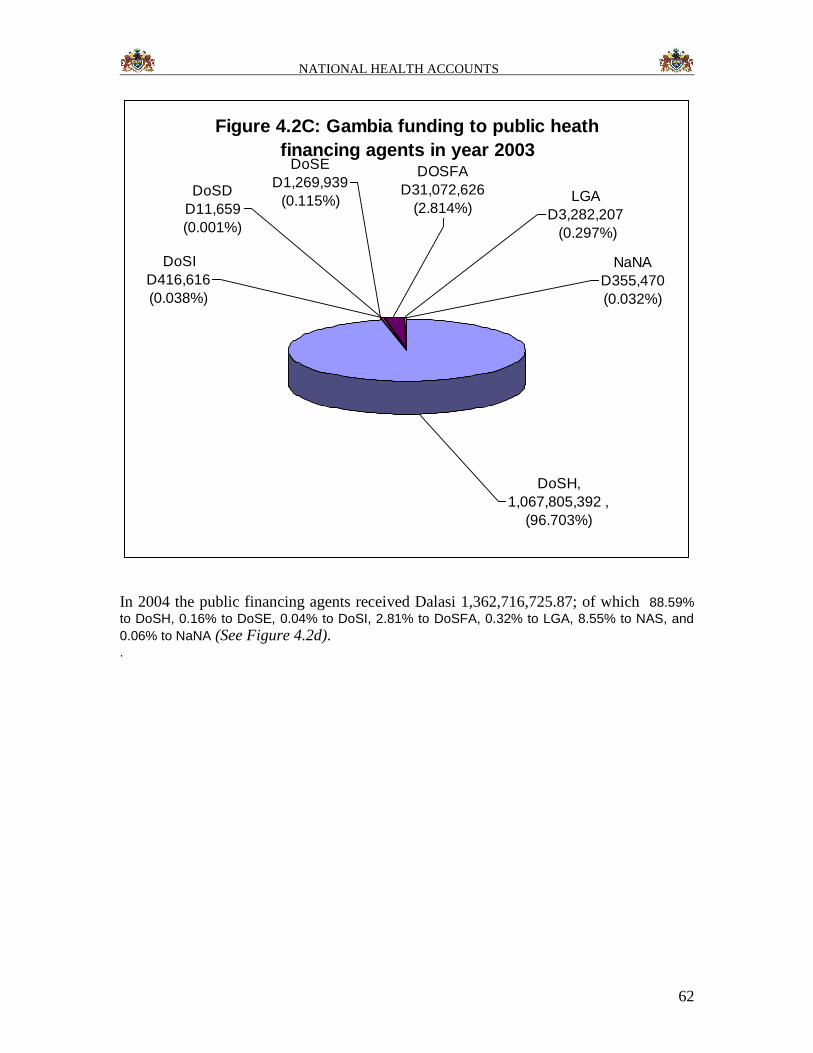
NATIONAL HEALTH ACCOUNTS
62
Figure 4.2C: Gambia funding to public heath
financing agents in year 2003DoSE
D1,269,939
(0.115%)DoSD
D11,659
(0.001%)
DOSFA
D31,072,626
(2.814%)LGA
D3,282,207
(0.297%)
NaNA
D355,470
(0.032%)
DoSI
D416,616
(0.038%)
DoSH,
1,067,805,392 ,
(96.703%)
In 2004 the public financing agents received Dalasi 1,362,716,725.87; of which 88.59%
to DoSH, 0.16% to DoSE, 0.04% to DoSI, 2.81% to DoSFA, 0.32% to LGA, 8.55% to NAS, and
0.06% to NaNA (See Figure 4.2d). .
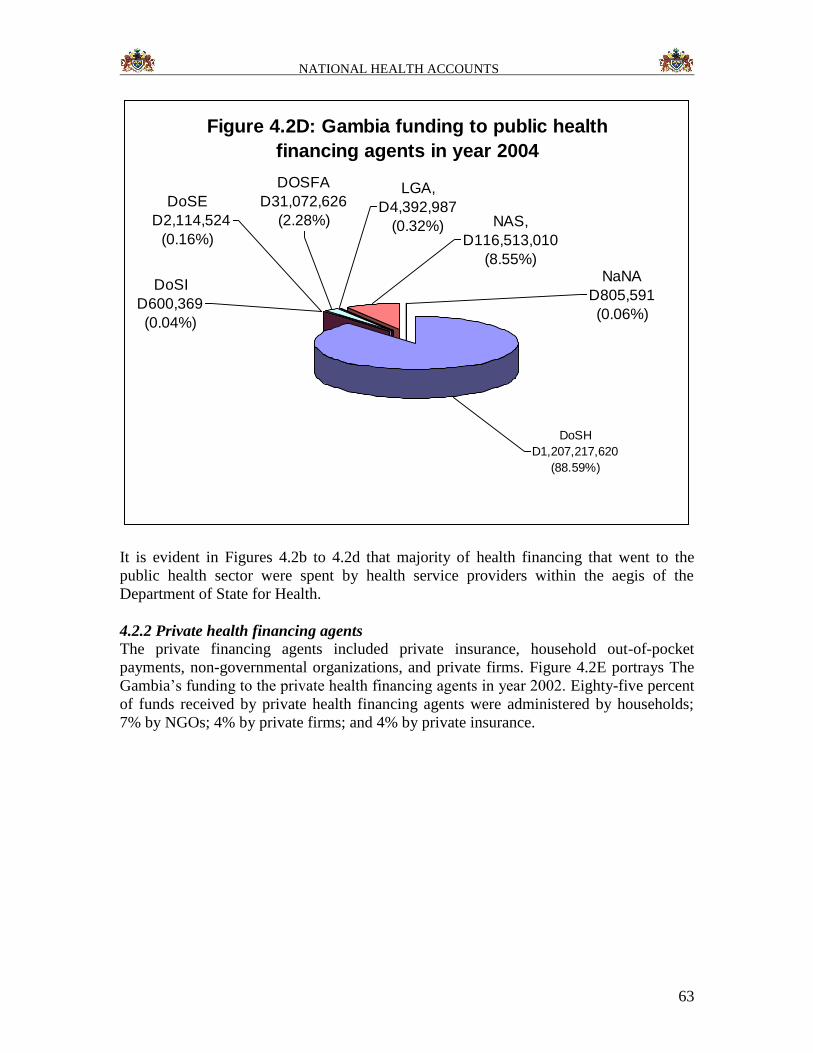
NATIONAL HEALTH ACCOUNTS
63
Figure 4.2D: Gambia funding to public health
financing agents in year 2004
DoSE
D2,114,524
(0.16%)
DoSI
D600,369
(0.04%)
LGA,
D4,392,987
(0.32%)
DOSFA
D31,072,626
(2.28%) NAS,
D116,513,010
(8.55%)NaNA
D805,591
(0.06%)
DoSH
D1,207,217,620
(88.59%)
It is evident in Figures 4.2b to 4.2d that majority of health financing that went to the
public health sector were spent by health service providers within the aegis of the
Department of State for Health.
4.2.2 Private health financing agents
The private financing agents included private insurance, household out-of-pocket
payments, non-governmental organizations, and private firms. Figure 4.2E portrays The
Gambia’s funding to the private health financing agents in year 2002. Eighty-five percent
of funds received by private health financing agents were administered by households;
7% by NGOs; 4% by private firms; and 4% by private insurance.
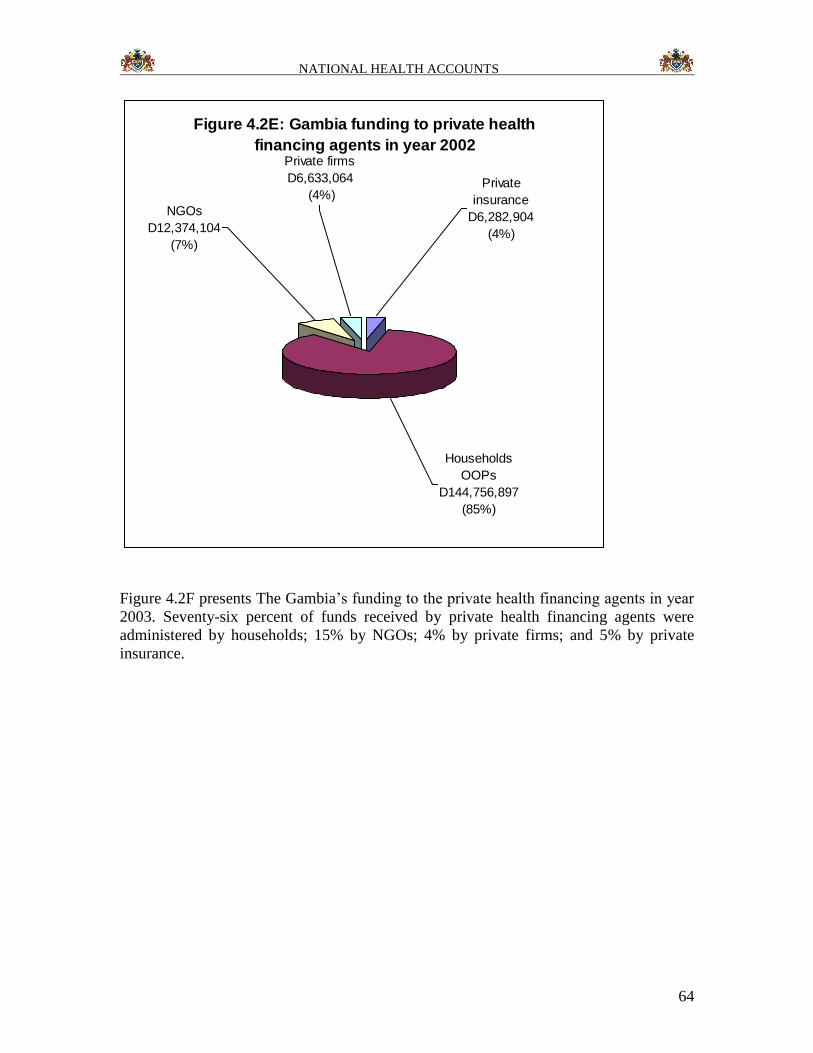
NATIONAL HEALTH ACCOUNTS
64
Figure 4.2E: Gambia funding to private health
financing agents in year 2002
Private
insurance
D6,282,904
(4%)
Private firms
D6,633,064
(4%)
NGOs
D12,374,104
(7%)
Households
OOPs
D144,756,897
(85%)
Figure 4.2F presents The Gambia’s funding to the private health financing agents in year
2003. Seventy-six percent of funds received by private health financing agents were
administered by households; 15% by NGOs; 4% by private firms; and 5% by private
insurance.
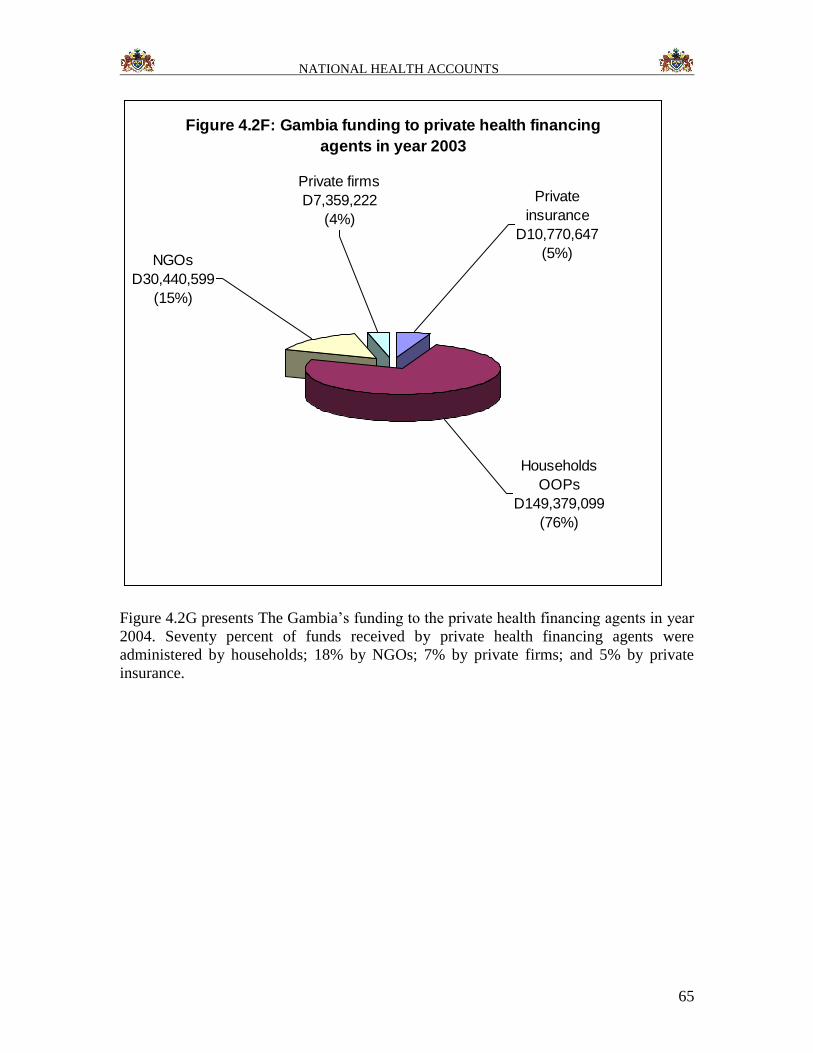
NATIONAL HEALTH ACCOUNTS
65
Figure 4.2F: Gambia funding to private health financing
agents in year 2003
Private firms
D7,359,222
(4%)
NGOs
D30,440,599
(15%)
Private
insurance
D10,770,647
(5%)
Households
OOPs
D149,379,099
(76%)
Figure 4.2G presents The Gambia’s funding to the private health financing agents in year
2004. Seventy percent of funds received by private health financing agents were
administered by households; 18% by NGOs; 7% by private firms; and 5% by private
insurance.
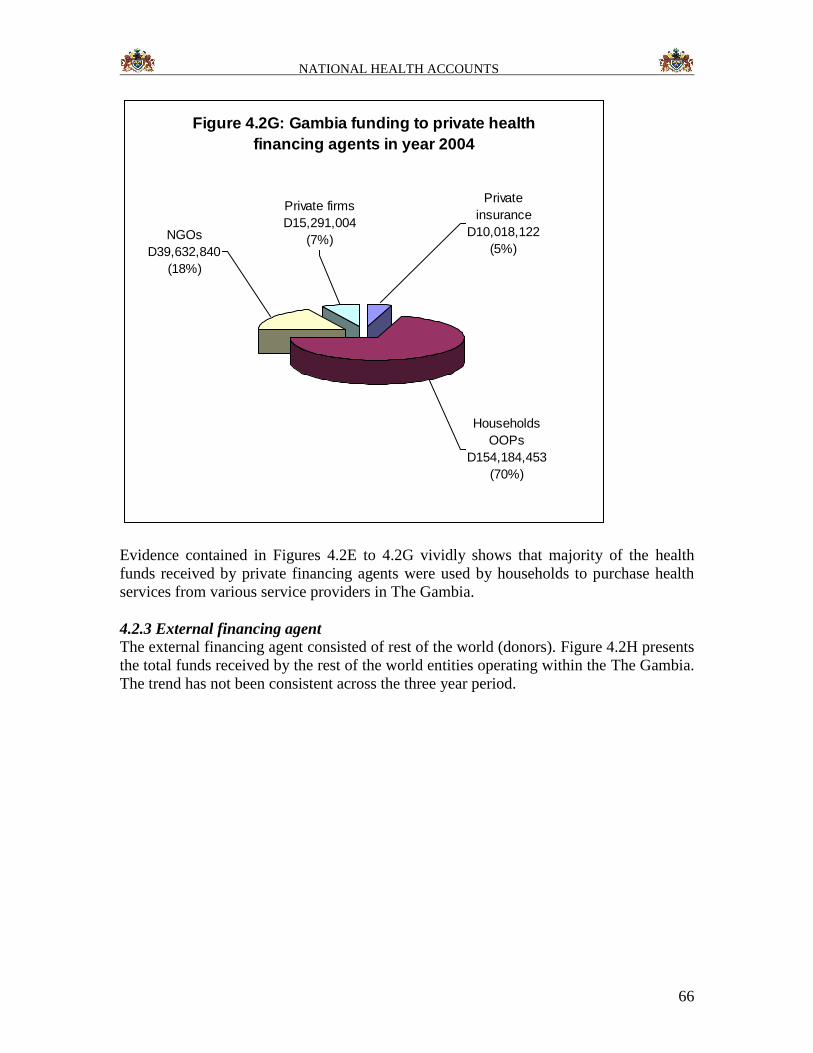
NATIONAL HEALTH ACCOUNTS
66
Figure 4.2G: Gambia funding to private health
financing agents in year 2004
NGOs
D39,632,840
(18%)
Private firms
D15,291,004
(7%)
Private
insurance
D10,018,122
(5%)
Households
OOPs
D154,184,453
(70%)
Evidence contained in Figures 4.2E to 4.2G vividly shows that majority of the health
funds received by private financing agents were used by households to purchase health
services from various service providers in The Gambia.
4.2.3 External financing agent
The external financing agent consisted of rest of the world (donors). Figure 4.2H presents
the total funds received by the rest of the world entities operating within the The Gambia.
The trend has not been consistent across the three year period.
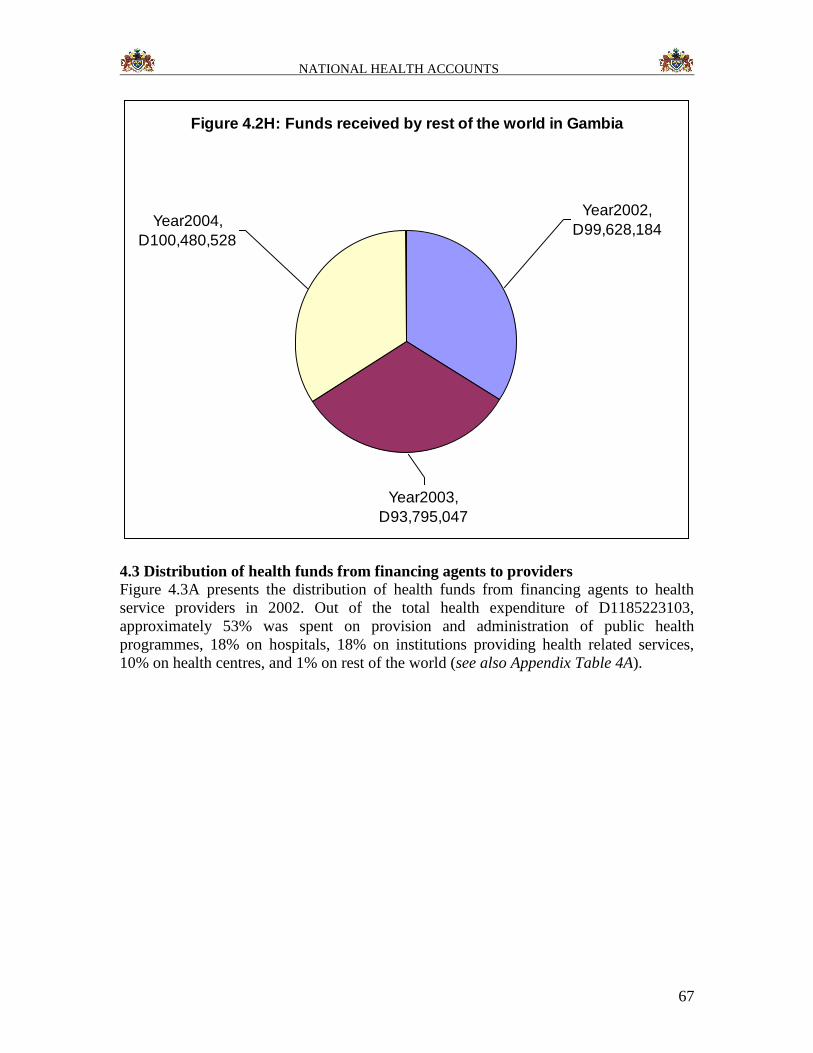
NATIONAL HEALTH ACCOUNTS
67
Figure 4.2H: Funds received by rest of the world in Gambia
Year2004,
D100,480,528
Year2003,
D93,795,047
Year2002,
D99,628,184
4.3 Distribution of health funds from financing agents to providers
Figure 4.3A presents the distribution of health funds from financing agents to health
service providers in 2002. Out of the total health expenditure of D1185223103,
approximately 53% was spent on provision and administration of public health
programmes, 18% on hospitals, 18% on institutions providing health related services,
10% on health centres, and 1% on rest of the world (see also Appendix Table 4A).
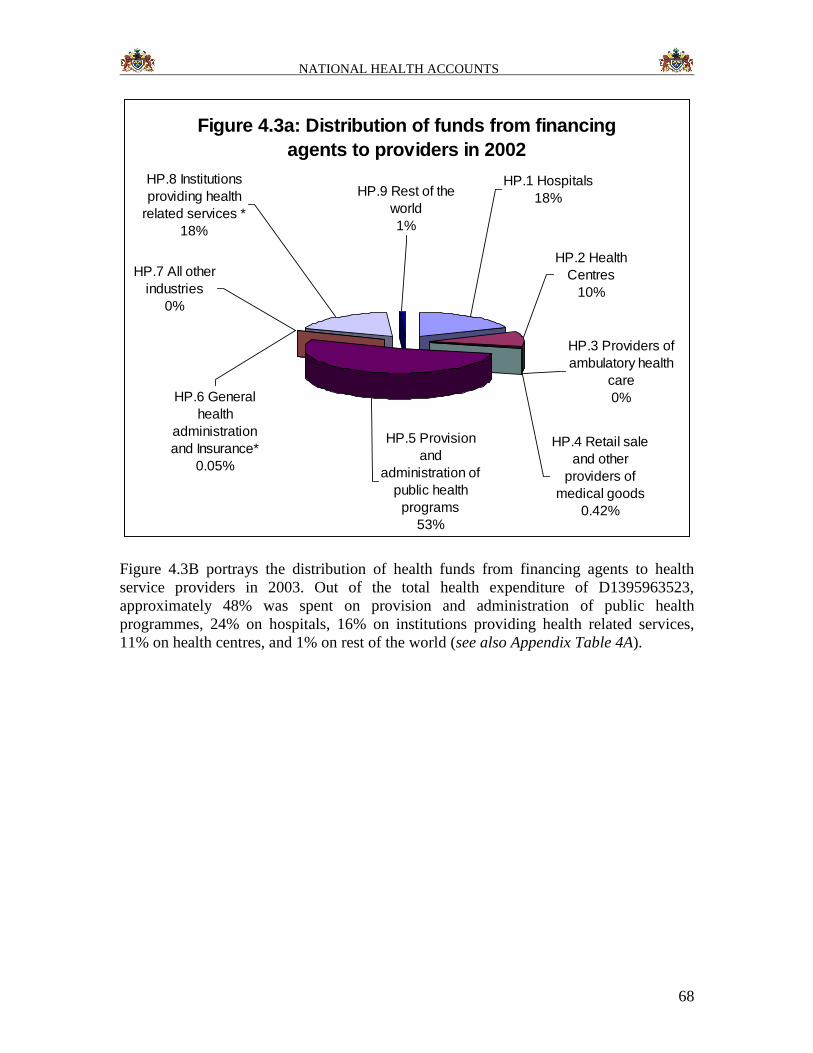
NATIONAL HEALTH ACCOUNTS
68
Figure 4.3a: Distribution of funds from financing
agents to providers in 2002
HP.3 Providers of
ambulatory health
care
0%
HP.4 Retail sale
and other
providers of
medical goods
0.42%
HP.2 Health
Centres
10%
HP.7 All other
industries
0%
HP.6 General
health
administration
and Insurance*
0.05%
HP.5 Provision
and
administration of
public health
programs
53%
HP.8 Institutions
providing health
related services *
18%
HP.9 Rest of the
world
1%
HP.1 Hospitals
18%
Figure 4.3B portrays the distribution of health funds from financing agents to health
service providers in 2003. Out of the total health expenditure of D1395963523,
approximately 48% was spent on provision and administration of public health
programmes, 24% on hospitals, 16% on institutions providing health related services,
11% on health centres, and 1% on rest of the world (see also Appendix Table 4A).
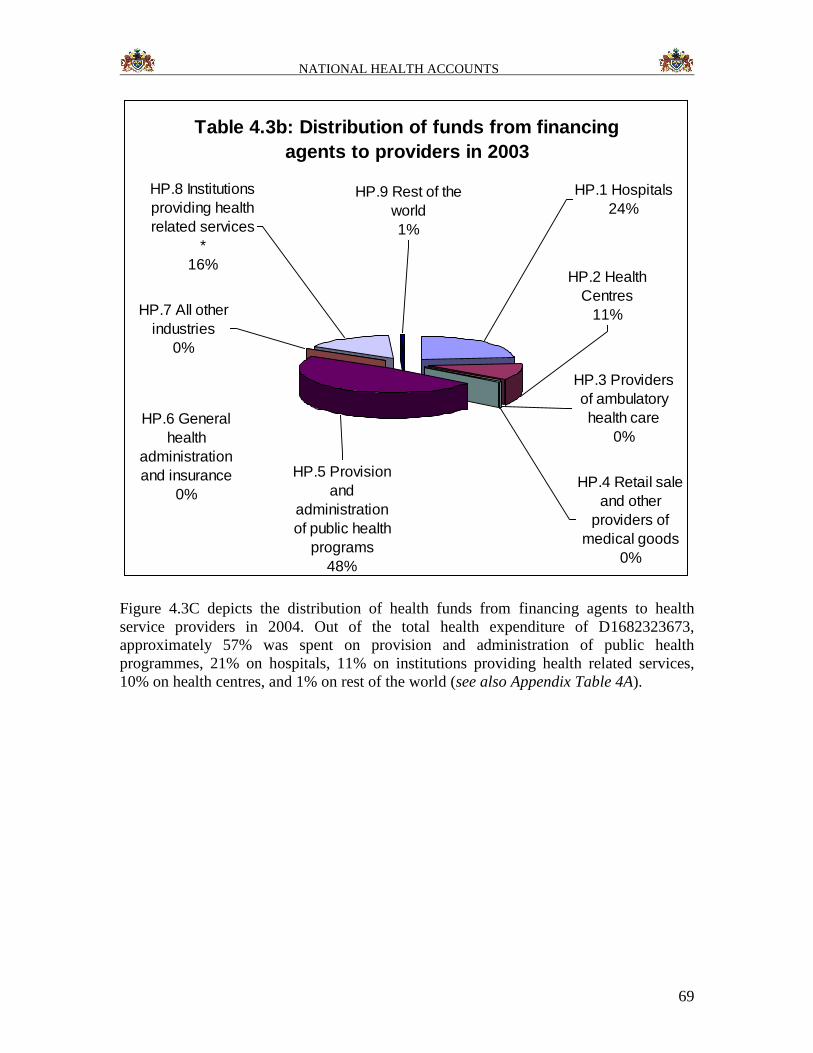
NATIONAL HEALTH ACCOUNTS
69
Table 4.3b: Distribution of funds from financing
agents to providers in 2003
HP.6 General
health
administration
and insurance
0%
HP.9 Rest of the
world
1%
HP.8 Institutions
providing health
related services
*
16%
HP.7 All other
industries
0%
HP.5 Provision
and
administration
of public health
programs
48%
HP.3 Providers
of ambulatory
health care
0%
HP.2 Health
Centres
11%
HP.4 Retail sale
and other
providers of
medical goods
0%
HP.1 Hospitals
24%
Figure 4.3C depicts the distribution of health funds from financing agents to health
service providers in 2004. Out of the total health expenditure of D1682323673,
approximately 57% was spent on provision and administration of public health
programmes, 21% on hospitals, 11% on institutions providing health related services,
10% on health centres, and 1% on rest of the world (see also Appendix Table 4A).
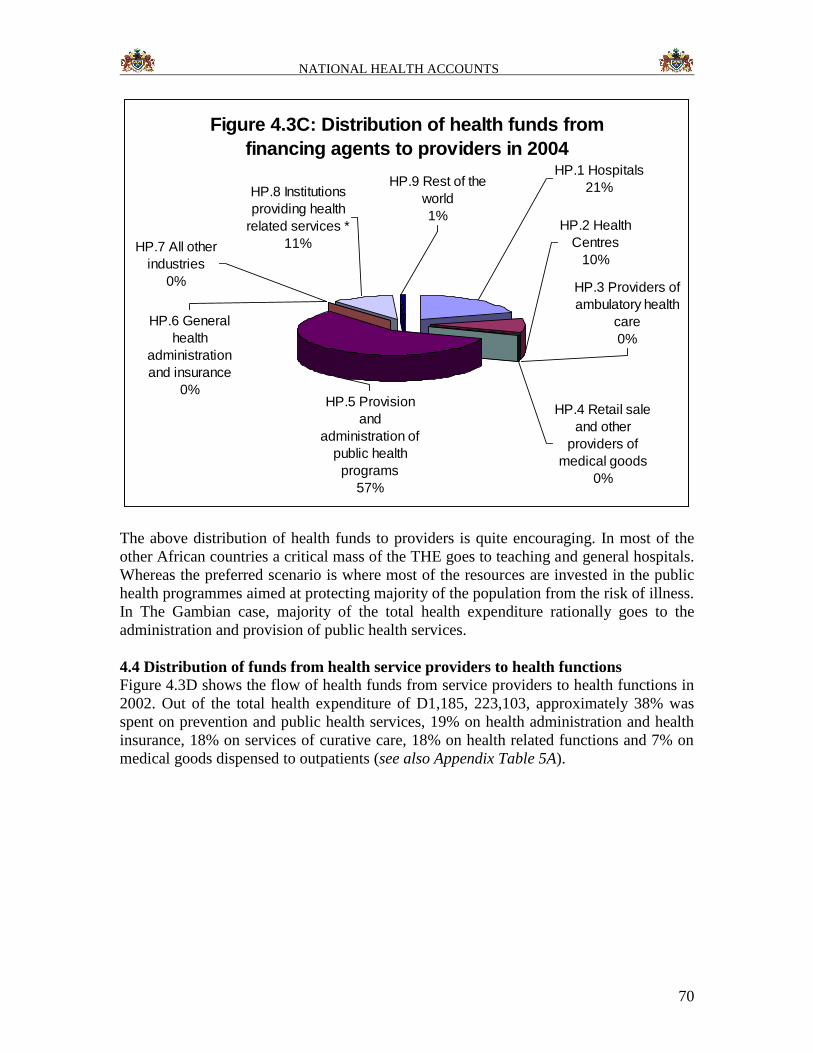
NATIONAL HEALTH ACCOUNTS
70
Figure 4.3C: Distribution of health funds from
financing agents to providers in 2004
HP.7 All other
industries
0%
HP.6 General
health
administration
and insurance
0%
HP.8 Institutions
providing health
related services *
11%
HP.5 Provision
and
administration of
public health
programs
57%
HP.3 Providers of
ambulatory health
care
0%
HP.2 Health
Centres
10%
HP.4 Retail sale
and other
providers of
medical goods
0%
HP.9 Rest of the
world
1%
HP.1 Hospitals
21%
The above distribution of health funds to providers is quite encouraging. In most of the
other African countries a critical mass of the THE goes to teaching and general hospitals.
Whereas the preferred scenario is where most of the resources are invested in the public
health programmes aimed at protecting majority of the population from the risk of illness.
In The Gambian case, majority of the total health expenditure rationally goes to the
administration and provision of public health services.
4.4 Distribution of funds from health service providers to health functions
Figure 4.3D shows the flow of health funds from service providers to health functions in
2002. Out of the total health expenditure of D1,185, 223,103, approximately 38% was
spent on prevention and public health services, 19% on health administration and health
insurance, 18% on services of curative care, 18% on health related functions and 7% on
medical goods dispensed to outpatients (see also Appendix Table 5A).
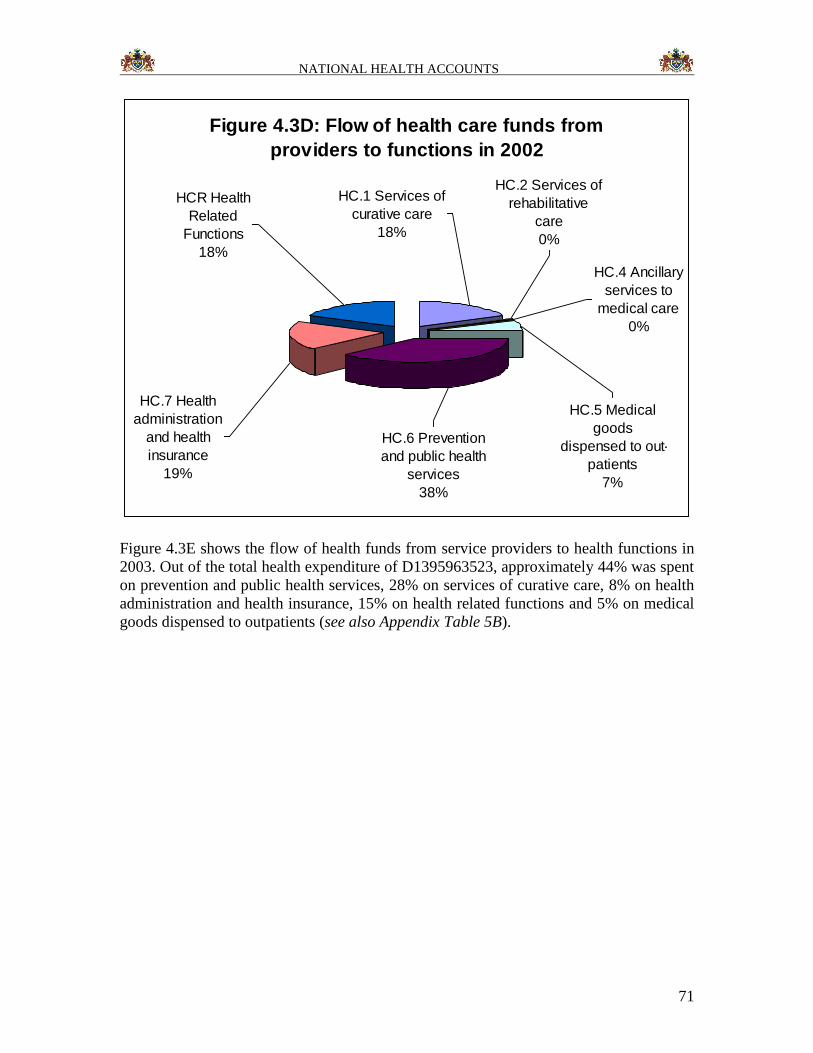
NATIONAL HEALTH ACCOUNTS
71
Figure 4.3D: Flow of health care funds from
providers to functions in 2002
HC.7 Health
administration
and health
insurance
19%
HC.2 Services of
rehabilitative
care
0%
HC.4 Ancillary
services to
medical care
0%
HC.5 Medical
goods
dispensed to out-
patients
7%
HC.6 Prevention
and public health
services
38%
HC.1 Services of
curative care
18%
HCR Health
Related
Functions
18%
Figure 4.3E shows the flow of health funds from service providers to health functions in
2003. Out of the total health expenditure of D1395963523, approximately 44% was spent
on prevention and public health services, 28% on services of curative care, 8% on health
administration and health insurance, 15% on health related functions and 5% on medical
goods dispensed to outpatients (see also Appendix Table 5B).
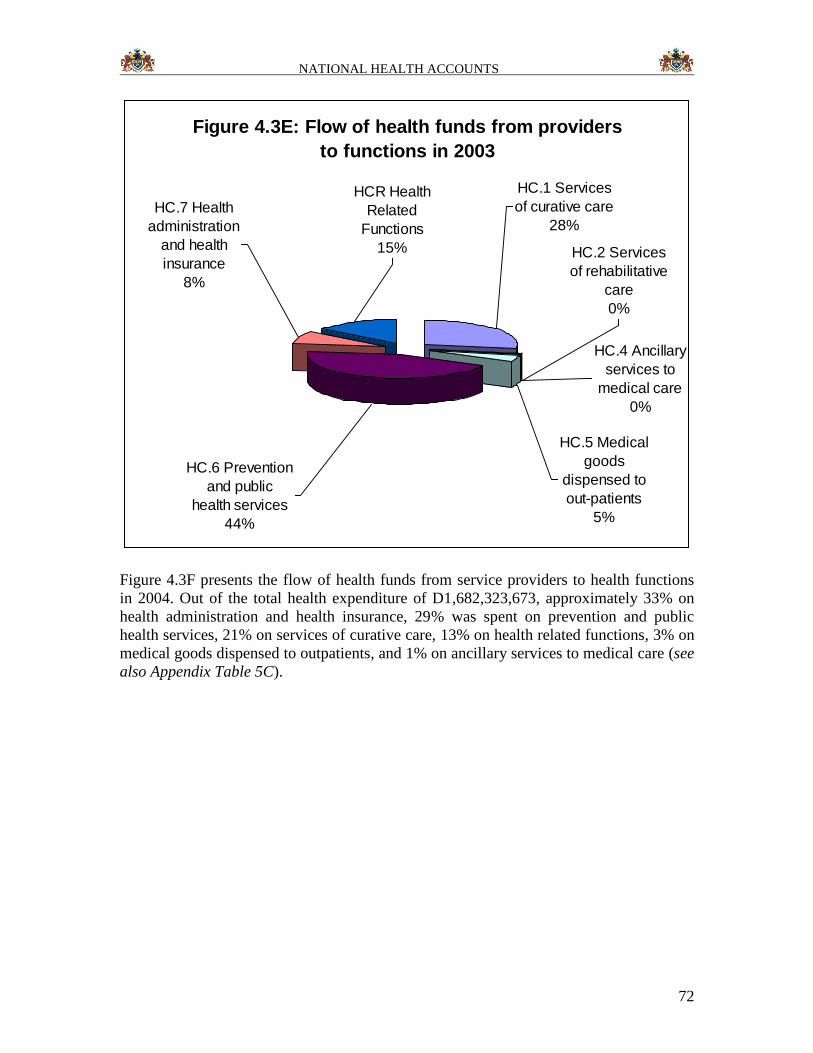
NATIONAL HEALTH ACCOUNTS
72
Figure 4.3E: Flow of health funds from providers
to functions in 2003
HC.6 Prevention
and public
health services
44%
HC.7 Health
administration
and health
insurance
8%
HCR Health
Related
Functions
15% HC.2 Services
of rehabilitative
care
0%
HC.4 Ancillary
services to
medical care
0%
HC.5 Medical
goods
dispensed to
out-patients
5%
HC.1 Services
of curative care
28%
Figure 4.3F presents the flow of health funds from service providers to health functions
in 2004. Out of the total health expenditure of D1,682,323,673, approximately 33% on
health administration and health insurance, 29% was spent on prevention and public
health services, 21% on services of curative care, 13% on health related functions, 3% on
medical goods dispensed to outpatients, and 1% on ancillary services to medical care (see
also Appendix Table 5C).
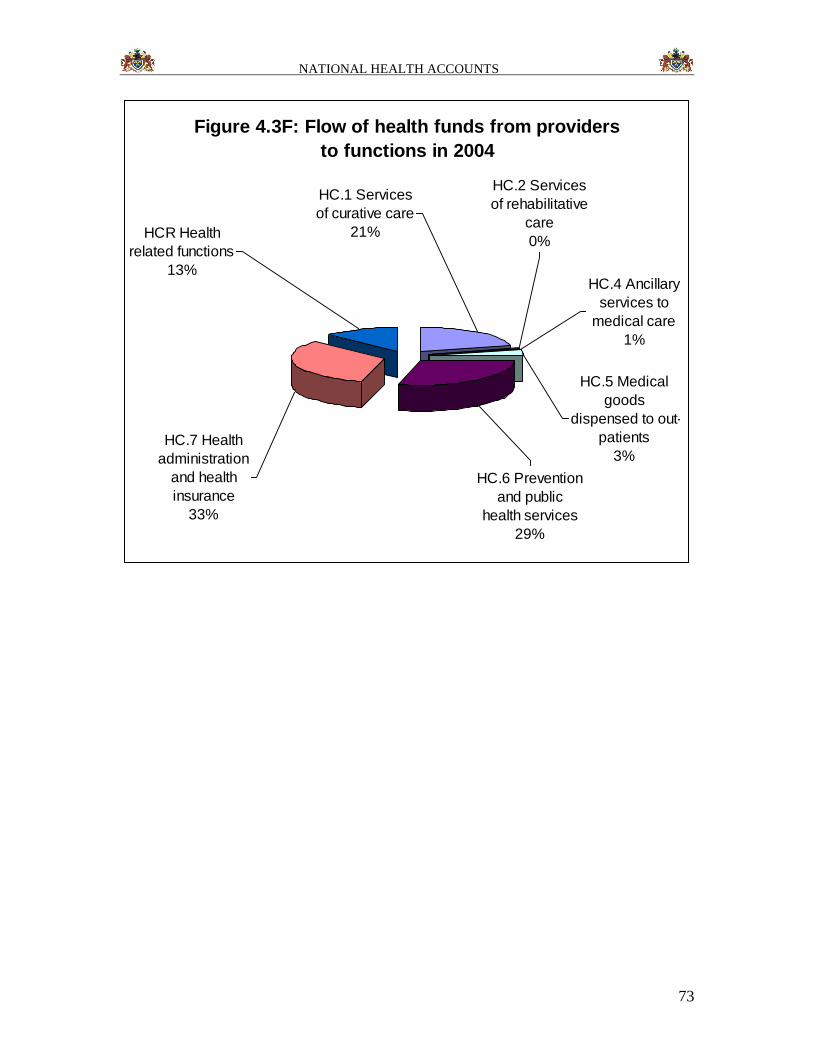
NATIONAL HEALTH ACCOUNTS
73
Figure 4.3F: Flow of health funds from providers
to functions in 2004
HC.2 Services
of rehabilitative
care
0%
HC.4 Ancillary
services to
medical care
1%
HC.5 Medical
goods
dispensed to out-
patients
3%HC.7 Health
administration
and health
insurance
33%
HC.6 Prevention
and public
health services
29%
HC.1 Services
of curative care
21%HCR Health
related functions
13%
NATIONAL HEALTH ACCOUNTS
74
CHAPTER 5: RECOMMENDATIONS
Based on the experience garnered in the process of undertaking this inaugural NHA
exercise in The Gambia, the NHA Technical Working Group (NHATWG), would like to
make the following recommendations:
1. NHA should be institutionalised to ensure that it can be conducted on a regular
and sustained basis. According to NHA guidelines (WHO, 2003),
institutionalization is an ongoing process in which NHA activities, structures, and
values become an integral and sustainable part of the government operations.
With institutionalization, a department or unit is designated to house and oversee
the gathering, analysis, and reporting of health expenditure data in a routine and
systematic manner, with full support of the government. The complex process can
take years and multiple estimates before it is integrated fully into the country’s
formal structure, but in order to ensure that NHA remains an effective policy tool
in the future, institutionalization should be a goal from initiation of NHA (see
http://www.who.int/nha). According to the NHA guidelines (WHO, 2003)
institutionalization process entails four steps:
a. Creating demand among policy makers for institutionalization;
b. Determining a location where NHA will be housed;
c. Establishing standards for data collection and analysis;
d. Institutionalizing data reporting requirements for all stakeholders (public,
private and development partners.
In the process of institutionalizing NHA, it will be necessary to: (i) explore the
possibility of integrating NHA data collection within the national health information
management systems; (ii) reinforce the institutional and human capacities of the unit
responsible for undertaking NHA; (iii) include questions on household out-pocket
payments for health care in the national household survey data collection instruments
routinely carried out by The Gambia Bureau of Statistics; (iv) continually involve
GBoS in NHA activities
2. The existence of a NHA Advisory/Steering Committee (NHASC) has proven to
be of value. The government may consider broadening the NHASC to include
permanent secretaries (or directors) from relevant Departments of State. Once
established, it would be necessary to organize a sensitization seminar for the
NHASC members on the usefulness of NHA evidence in health decision-making
(policy and plan development). The creation of NHASC may help to sensitize the
policymakers on the need for undertaking regular NHA exercises and
institutionalizing it.
3. In order to facilitate the process of institutionalizing data reporting, there might be
need to expand the membership of The Gambia NHATWG to include
representatives of all relevant Government Departments (e.g. DoSFEA, DOSE,
DOSI, DoSD, DoSFA, LGA), plus a representative of the health development
NATIONAL HEALTH ACCOUNTS
75
partner group in the country. Once NHATWG membership has been expanded it
would be necessary to organize a technical NHA workshop to ensure there is a
common understanding of the NHA conceptual framework.
4. There is need to plan for undertaking the second NHA exercise covering 2005,
2006 and 2007 and to include HIV/AIDS, TB, Malaria expenditure reviews, and
thereafter make a decision on the frequency of subsequent NHA studies. In
process of those plans, it may be necessary to revise the existing data collection
instruments for use among sources, financing agents, health care providers (plus
functions and inputs).
5. The DoSH should consider developing a comprehensive health financing policy
and health financing strategic plan with a roadmap of how the Government plans
to realize the vision of universal coverage of health services and universal
protection from potentially catastrophic and impoverishing health care
expenditures in the long-term. In the process of developing the national financing
policy, it may be informative to refer to the WHO regional strategy for health
financing for inspiration.
The following important findings should support the development of the
health Financing policy:
Government current per capita health expenditure is below $35 as
recommended by WHO. The financing policy should advocate for
government increase expenditure on health.
Currently Social Security contribution to health is insignificant. The policy
should therefore advocate for increase Social security contribution to
health expenditure.
The out- of-pocket expenditure as a propotion of total private health
expenditure is over 95%. The health financing policy should advocate for
the development of a national social insurance frame work including
health financing safety nets for the poor.
Donor contribution to the total health expenditure is over 65%. For
effective coordination of this input the health financing policy should
advocate for basket funding system.
6. There will be need to develop a Sector-Wide Approach (SWAp) for coordinating
partners efforts in the implementation of the national health policy. In the course
of designing the SWAp there will be need to make study visits to countries that
have been successfully implementing it, e.g. Ghana and Uganda.
7. The will be need for further training for core member of the National Health
Accounts Technical Working Group.
NATIONAL HEALTH ACCOUNTS
76
CHAPTER 6: CONCLUSION
The inaugural NHA study was the first step towards The Gambia’s aspiration of
institutionalizing NHA to facilitate DOSH stewardship of the national health system. The
study succeeded in addressing three of its four objectives: (i) to estimate the total health
expenditure from public, private and donor sources; (ii) to determine the total health
expenditure by financing agents; and (iii) to approximate the distribution of funds by
various public health functions. Due to dearth of disaggregated information, it was not
possible to estimate the amounts of funds spent on various health system inputs.
The total health expenditure (THE) was approximately D1,185,223,103 in 2002;
D1,395,958,522 in 2003; and D1,682,323,673 in 2004. THE as a percentage of GDP in
The Gambia was 16.1% in 2002, 13.9% in 2003 and 14.9% in 2004. The per capita total
health expenditure was D895 in 2002, D1026 in 2003 and D1203 in 2004. During the
three years over 66% of the total health funding came from donors (international health
development partners). The Government of The Gambia contribution grew from 18% in
2002 to 24% of the total health expenditure in 2004. The households, through direct out-
of-pocket payments to health care providers, contributed 12% in 2002, 11% in 2003 and
9% in 2004 to the total health expenditure.
The NHA evidence contained in this document constitutes a strong basis for developing a
comprehensive health financing policy and a health financing strategic plan mapping out
how the Government plans to realize the vision of universal coverage of health services
and universal protection from potentially catastrophic and impoverishing health care
expenditures in the long-term. In order to facilitate the monitoring and evaluation of such
policy documents once developed, it is important to institutionalize national health
accounts. The latter will require boosting of the capacities in the Directorate of Planning
and Information.
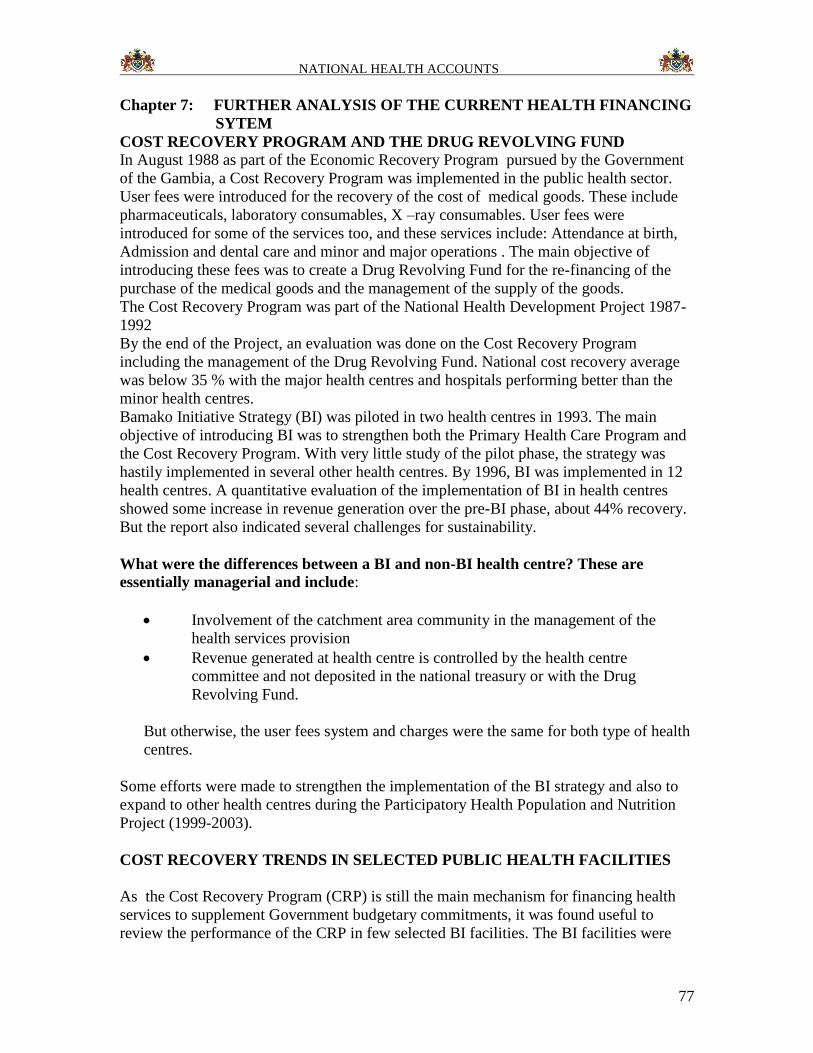
NATIONAL HEALTH ACCOUNTS
77
Chapter 7: FURTHER ANALYSIS OF THE CURRENT HEALTH FINANCING
SYTEM
COST RECOVERY PROGRAM AND THE DRUG REVOLVING FUND
In August 1988 as part of the Economic Recovery Program pursued by the Government
of the Gambia, a Cost Recovery Program was implemented in the public health sector.
User fees were introduced for the recovery of the cost of medical goods. These include
pharmaceuticals, laboratory consumables, X –ray consumables. User fees were
introduced for some of the services too, and these services include: Attendance at birth,
Admission and dental care and minor and major operations . The main objective of
introducing these fees was to create a Drug Revolving Fund for the re-financing of the
purchase of the medical goods and the management of the supply of the goods.
The Cost Recovery Program was part of the National Health Development Project 1987-
1992
By the end of the Project, an evaluation was done on the Cost Recovery Program
including the management of the Drug Revolving Fund. National cost recovery average
was below 35 % with the major health centres and hospitals performing better than the
minor health centres.
Bamako Initiative Strategy (BI) was piloted in two health centres in 1993. The main
objective of introducing BI was to strengthen both the Primary Health Care Program and
the Cost Recovery Program. With very little study of the pilot phase, the strategy was
hastily implemented in several other health centres. By 1996, BI was implemented in 12
health centres. A quantitative evaluation of the implementation of BI in health centres
showed some increase in revenue generation over the pre-BI phase, about 44% recovery.
But the report also indicated several challenges for sustainability.
What were the differences between a BI and non-BI health centre? These are
essentially managerial and include:
Involvement of the catchment area community in the management of the
health services provision
Revenue generated at health centre is controlled by the health centre
committee and not deposited in the national treasury or with the Drug
Revolving Fund.
But otherwise, the user fees system and charges were the same for both type of health
centres.
Some efforts were made to strengthen the implementation of the BI strategy and also to
expand to other health centres during the Participatory Health Population and Nutrition
Project (1999-2003).
COST RECOVERY TRENDS IN SELECTED PUBLIC HEALTH FACILITIES
As the Cost Recovery Program (CRP) is still the main mechanism for financing health
services to supplement Government budgetary commitments, it was found useful to
review the performance of the CRP in few selected BI facilities. The BI facilities were
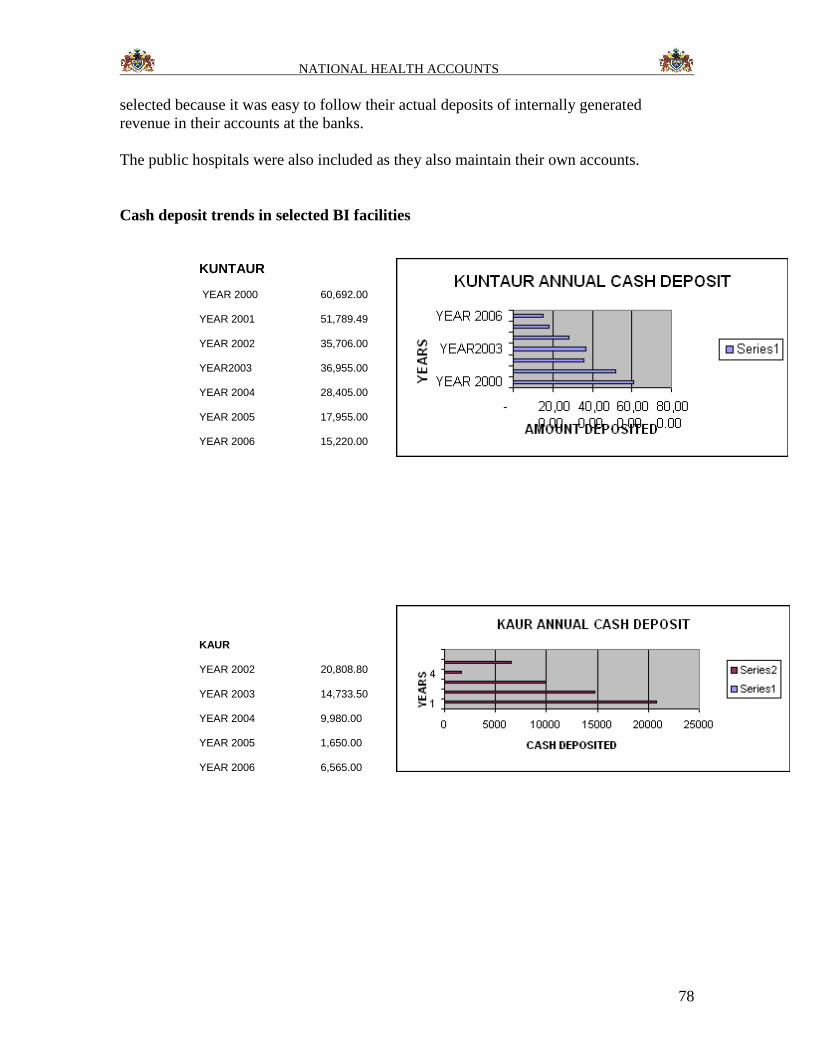
NATIONAL HEALTH ACCOUNTS
78
selected because it was easy to follow their actual deposits of internally generated
revenue in their accounts at the banks.
The public hospitals were also included as they also maintain their own accounts.
Cash deposit trends in selected BI facilities
KUNTAUR
YEAR 2000 60,692.00
YEAR 2001 51,789.49
YEAR 2002 35,706.00
YEAR2003 36,955.00
YEAR 2004 28,405.00
YEAR 2005 17,955.00
YEAR 2006 15,220.00
KAUR
YEAR 2002 20,808.80
YEAR 2003 14,733.50
YEAR 2004 9,980.00
YEAR 2005 1,650.00
YEAR 2006 6,565.00
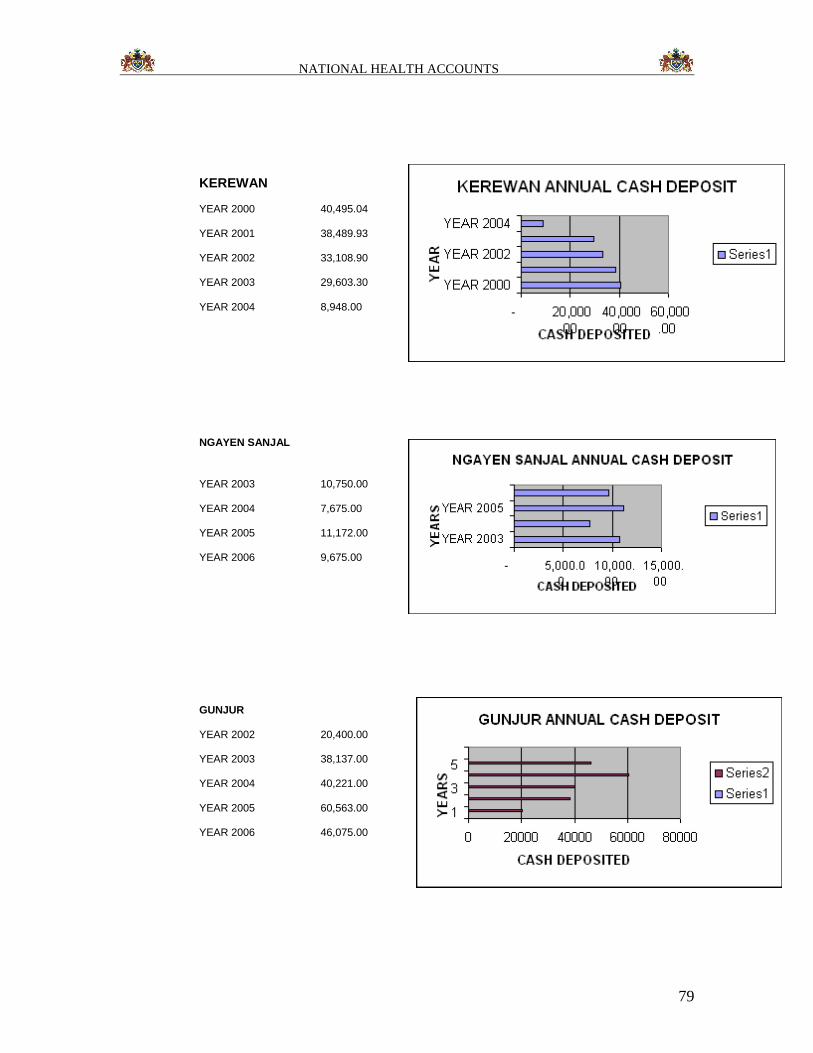
NATIONAL HEALTH ACCOUNTS
79
KEREWAN
YEAR 2000 40,495.04
YEAR 2001 38,489.93
YEAR 2002 33,108.90
YEAR 2003 29,603.30
YEAR 2004 8,948.00
NGAYEN SANJAL
YEAR 2003 10,750.00
YEAR 2004 7,675.00
YEAR 2005 11,172.00
YEAR 2006 9,675.00
GUNJUR
YEAR 2002 20,400.00
YEAR 2003 38,137.00
YEAR 2004 40,221.00
YEAR 2005 60,563.00
YEAR 2006 46,075.00
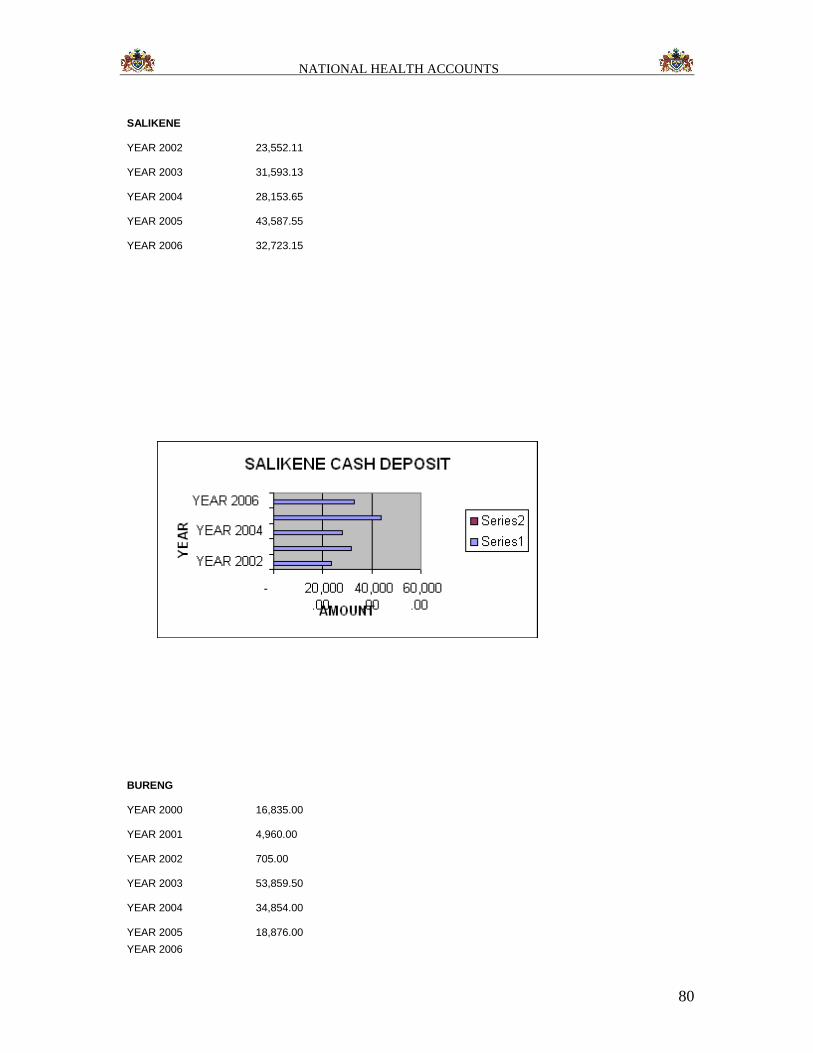
NATIONAL HEALTH ACCOUNTS
80
SALIKENE
YEAR 2002 23,552.11
YEAR 2003 31,593.13
YEAR 2004 28,153.65
YEAR 2005 43,587.55
YEAR 2006 32,723.15
BURENG
YEAR 2000 16,835.00
YEAR 2001 4,960.00
YEAR 2002 705.00
YEAR 2003 53,859.50
YEAR 2004 34,854.00
YEAR 2005 18,876.00
YEAR 2006
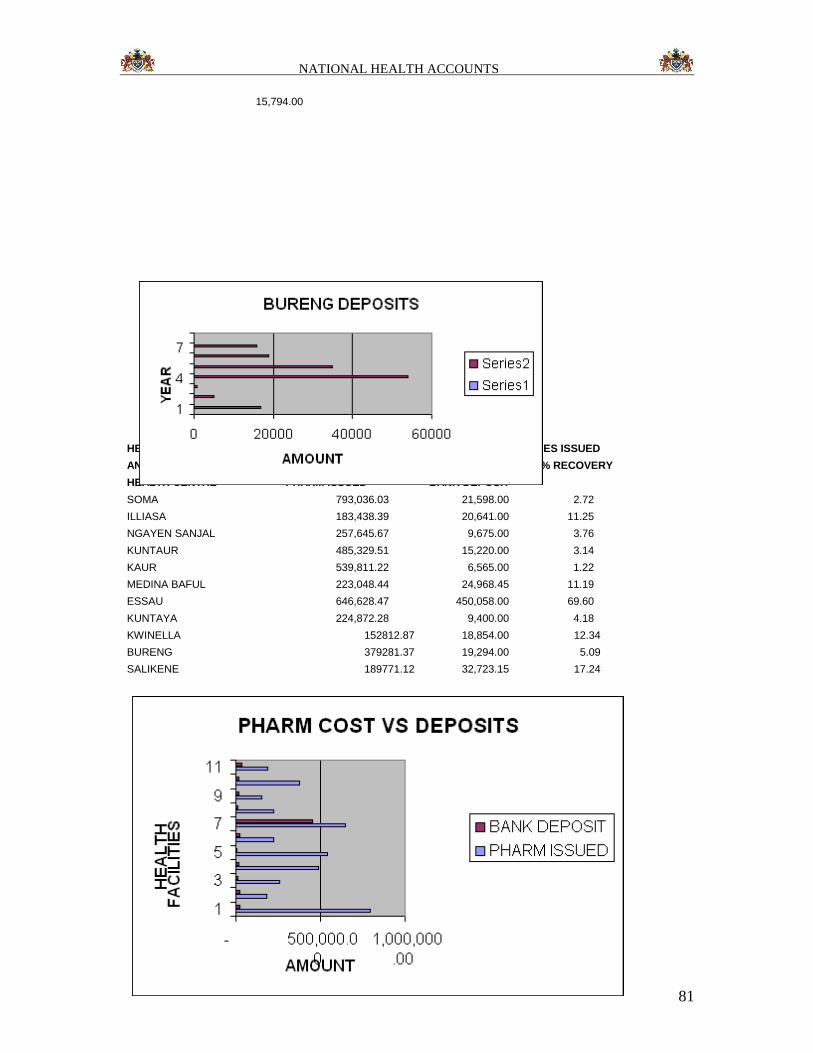
NATIONAL HEALTH ACCOUNTS
81
15,794.00
HEALTH CENTRES COST OF PHARMACEUTICALS AND OTHER MEDICAL SUPPLIES ISSUED
AND TOTAL BANK DEPOSIT IN 2006 % RECOVERY
HEALTH CENTRE PHARM ISSUED BANK DEPOSIT
SOMA 793,036.03 21,598.00 2.72
ILLIASA 183,438.39 20,641.00 11.25
NGAYEN SANJAL 257,645.67 9,675.00 3.76
KUNTAUR 485,329.51 15,220.00 3.14
KAUR 539,811.22 6,565.00 1.22
MEDINA BAFUL 223,048.44 24,968.45 11.19
ESSAU 646,628.47 450,058.00 69.60
KUNTAYA 224,872.28 9,400.00 4.18
KWINELLA 152812.87 18,854.00 12.34
BURENG 379281.37 19,294.00 5.09
SALIKENE 189771.12 32,723.15 17.24
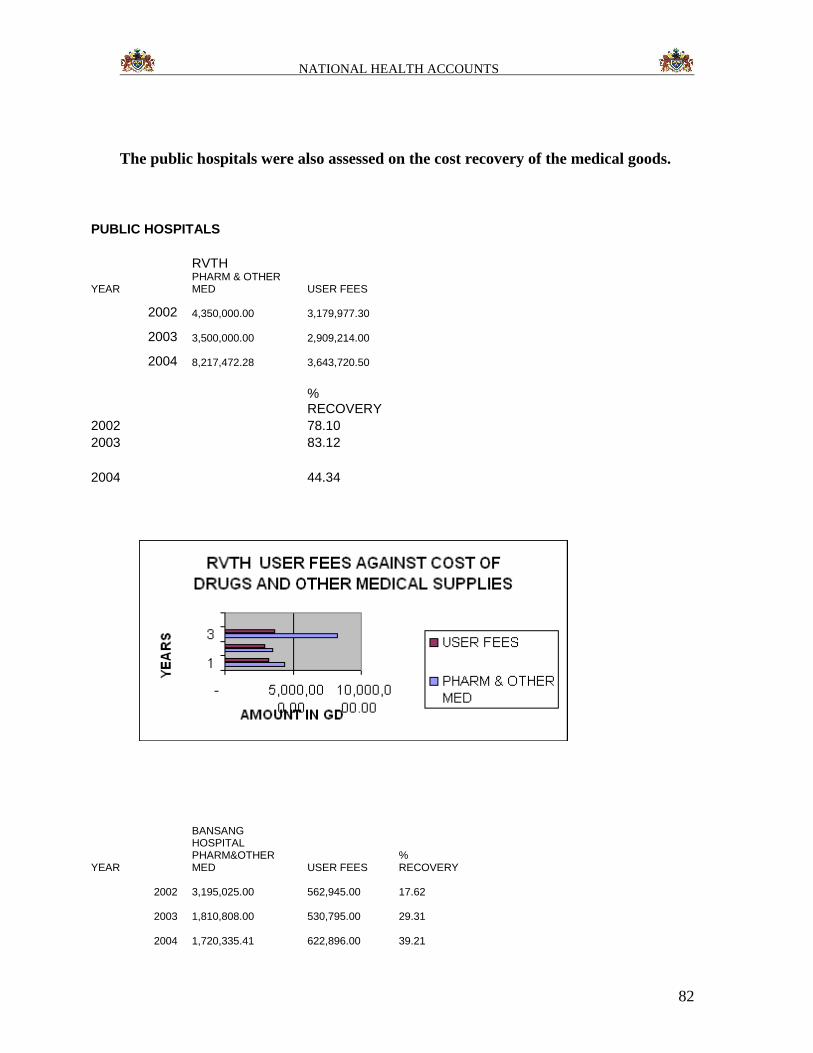
NATIONAL HEALTH ACCOUNTS
82
The public hospitals were also assessed on the cost recovery of the medical goods.
PUBLIC HOSPITALS
RVTH
YEAR PHARM & OTHER MED USER FEES
2002 4,350,000.00
3,179,977.30
2003 3,500,000.00
2,909,214.00
2004 8,217,472.28
3,643,720.50
% RECOVERY
2002 78.10
2003 83.12
2004 44.34
BANSANG HOSPITAL
YEAR PHARM&OTHER MED USER FEES
% RECOVERY
2002 3,195,025.00
562,945.00 17.62
2003 1,810,808.00
530,795.00 29.31
2004 1,720,335.41
622,896.00 39.21
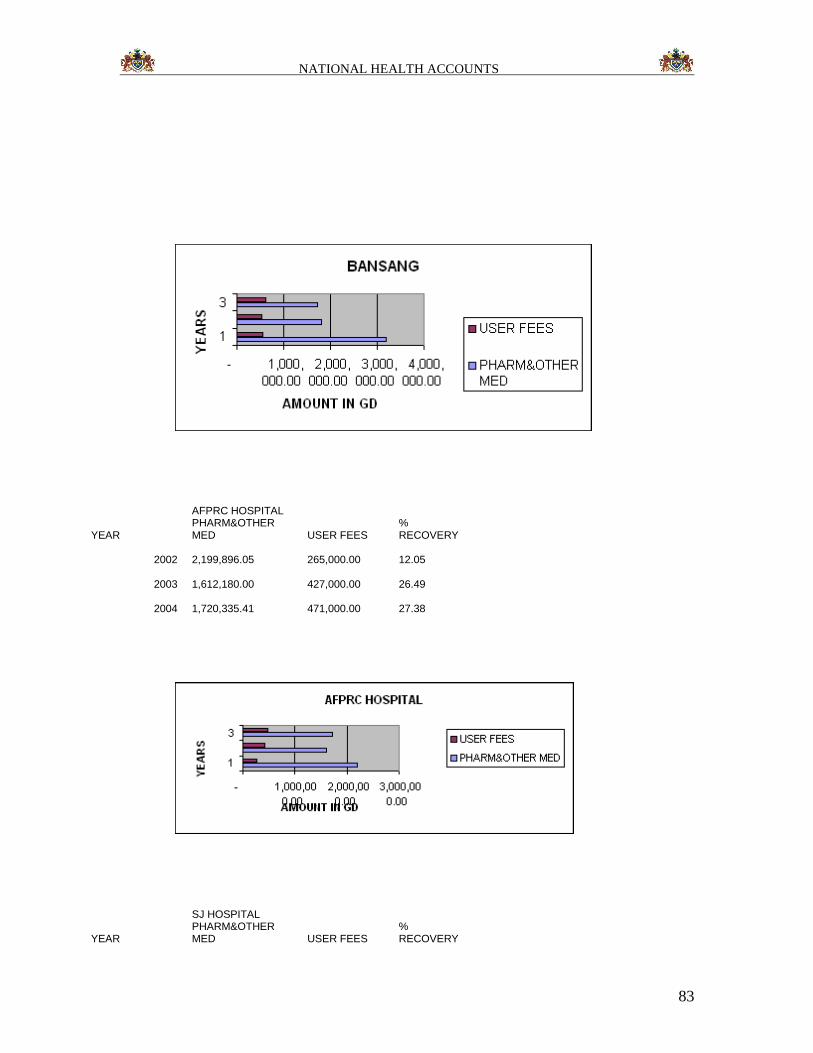
NATIONAL HEALTH ACCOUNTS
83
AFPRC HOSPITAL
YEAR PHARM&OTHER MED USER FEES
% RECOVERY
2002 2,199,896.05
265,000.00 12.05
2003 1,612,180.00
427,000.00 26.49
2004 1,720,335.41
471,000.00 27.38
SJ HOSPITAL
YEAR PHARM&OTHER MED USER FEES
% RECOVERY
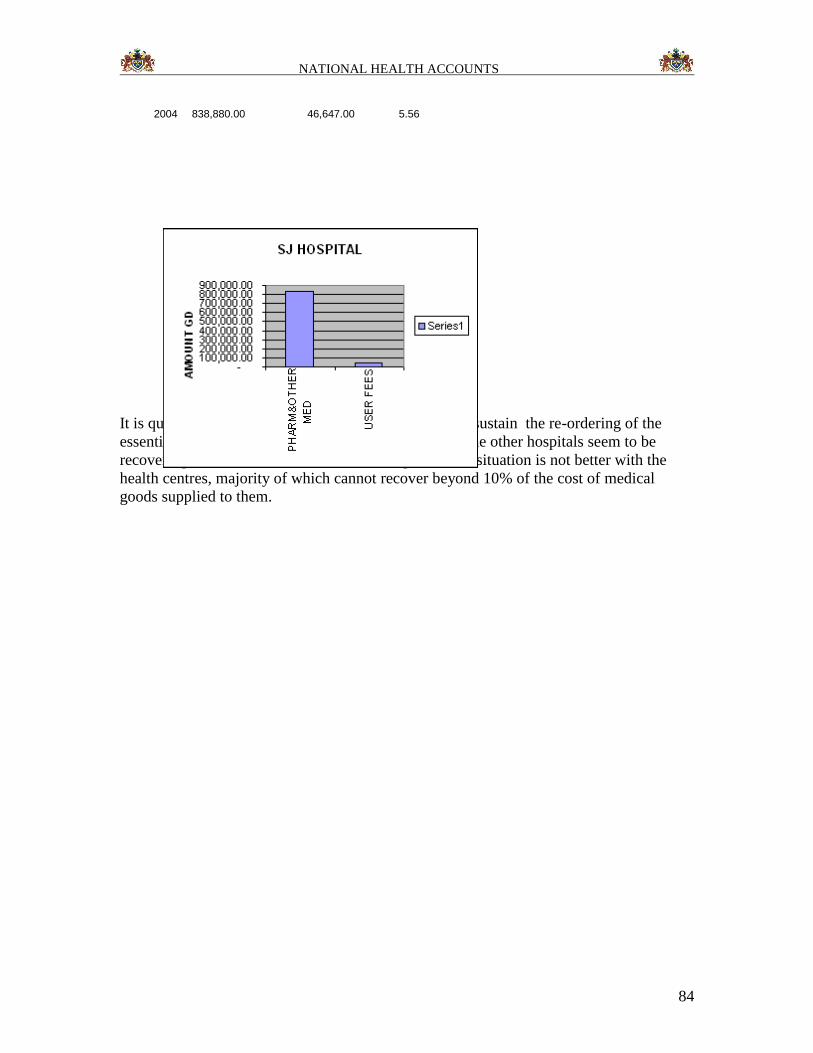
NATIONAL HEALTH ACCOUNTS
84
2004 838,880.00
46,647.00 5.56
It is quite easy to state that the current user fees cannot sustain the re-ordering of the
essential medical goods . Other than RVTH, none of the other hospitals seem to be
recovering even 50% of the cost of medical goods. The situation is not better with the
health centres, majority of which cannot recover beyond 10% of the cost of medical
goods supplied to them.
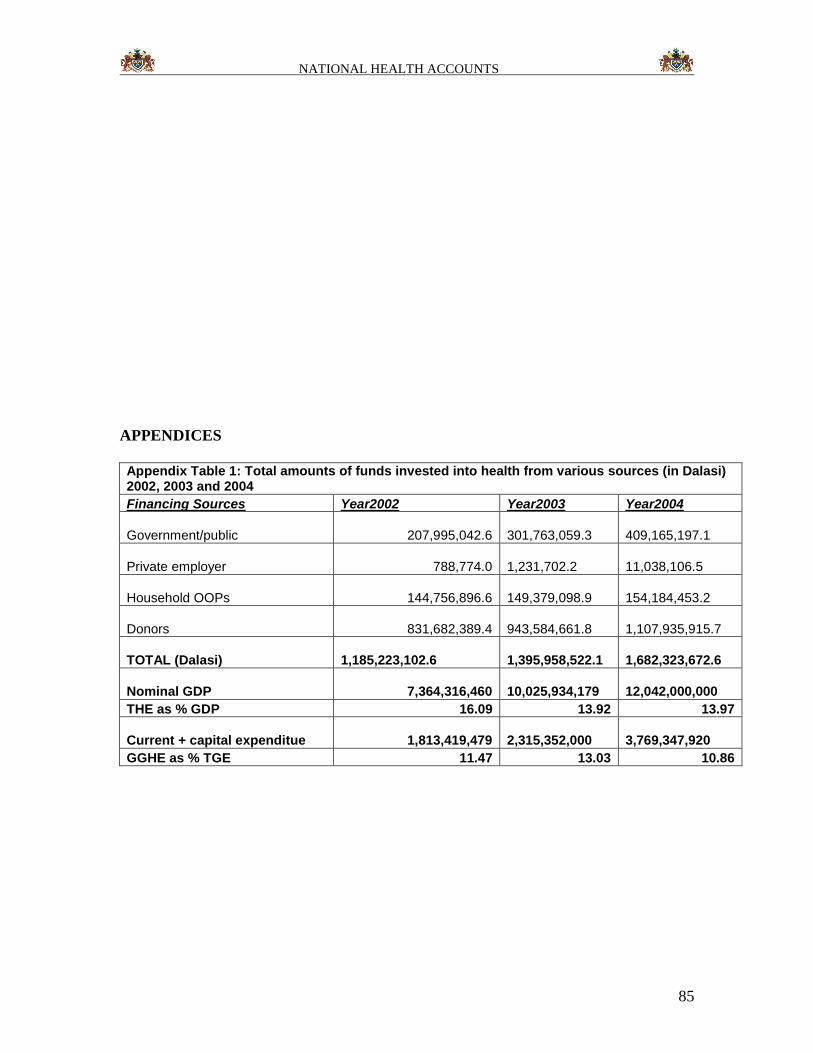
NATIONAL HEALTH ACCOUNTS
85
APPENDICES
Appendix Table 1: Total amounts of funds invested into health from various sources (in Dalasi) 2002, 2003 and 2004
Financing Sources Year2002 Year2003 Year2004
Government/public 207,995,042.6 301,763,059.3
409,165,197.1
Private employer 788,774.0 1,231,702.2
11,038,106.5
Household OOPs 144,756,896.6 149,379,098.9
154,184,453.2
Donors 831,682,389.4 943,584,661.8
1,107,935,915.7
TOTAL (Dalasi) 1,185,223,102.6
1,395,958,522.1
1,682,323,672.6
Nominal GDP 7,364,316,460 10,025,934,179
12,042,000,000
THE as % GDP 16.09 13.92 13.97
Current + capital expenditue 1,813,419,479 2,315,352,000
3,769,347,920
GGHE as % TGE 11.47 13.03 10.86
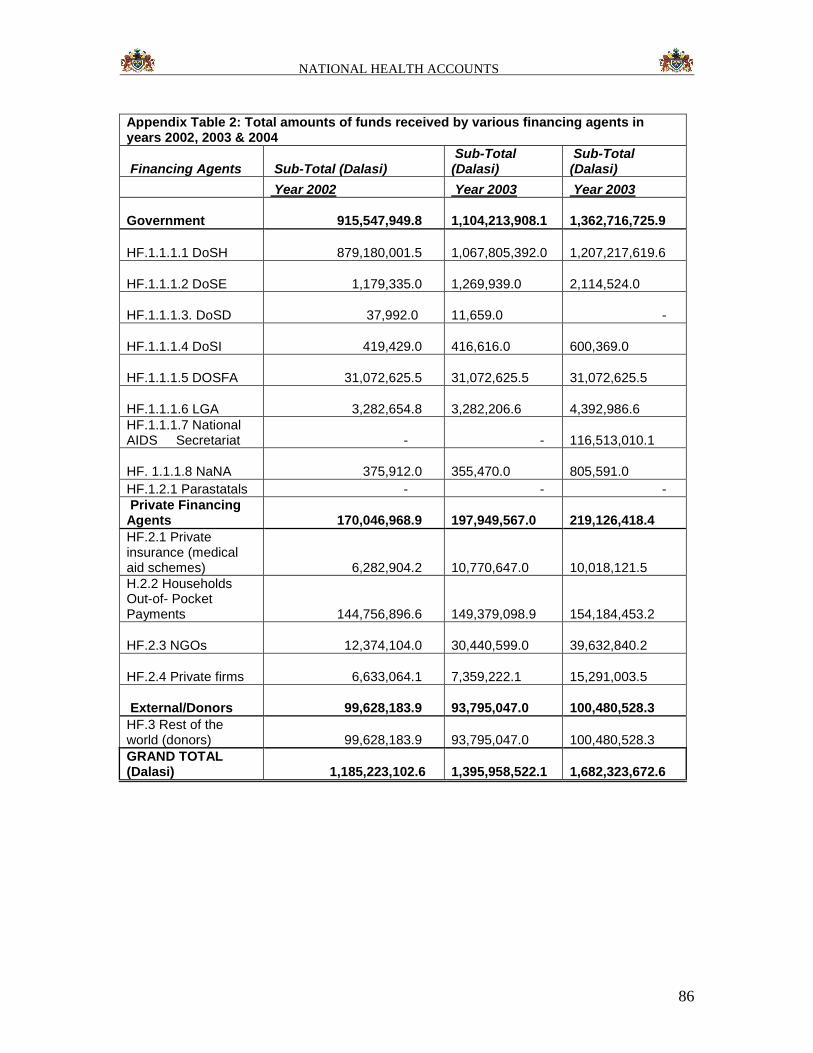
NATIONAL HEALTH ACCOUNTS
86
Appendix Table 2: Total amounts of funds received by various financing agents in years 2002, 2003 & 2004
Financing Agents Sub-Total (Dalasi) Sub-Total (Dalasi)
Sub-Total (Dalasi)
Year 2002 Year 2003 Year 2003
Government 915,547,949.8 1,104,213,908.1
1,362,716,725.9
HF.1.1.1.1 DoSH 879,180,001.5 1,067,805,392.0
1,207,217,619.6
HF.1.1.1.2 DoSE 1,179,335.0 1,269,939.0
2,114,524.0
HF.1.1.1.3. DoSD 37,992.0 11,659.0 -
HF.1.1.1.4 DoSI 419,429.0 416,616.0
600,369.0
HF.1.1.1.5 DOSFA 31,072,625.5 31,072,625.5
31,072,625.5
HF.1.1.1.6 LGA 3,282,654.8 3,282,206.6
4,392,986.6
HF.1.1.1.7 National AIDS Secretariat - -
116,513,010.1
HF. 1.1.1.8 NaNA 375,912.0 355,470.0
805,591.0
HF.1.2.1 Parastatals - - -
Private Financing Agents 170,046,968.9
197,949,567.0
219,126,418.4
HF.2.1 Private insurance (medical aid schemes) 6,282,904.2
10,770,647.0
10,018,121.5
H.2.2 Households Out-of- Pocket Payments 144,756,896.6
149,379,098.9
154,184,453.2
HF.2.3 NGOs 12,374,104.0 30,440,599.0
39,632,840.2
HF.2.4 Private firms 6,633,064.1 7,359,222.1
15,291,003.5
External/Donors 99,628,183.9 93,795,047.0
100,480,528.3
HF.3 Rest of the world (donors) 99,628,183.9
93,795,047.0
100,480,528.3
GRAND TOTAL (Dalasi) 1,185,223,102.6
1,395,958,522.1
1,682,323,672.6
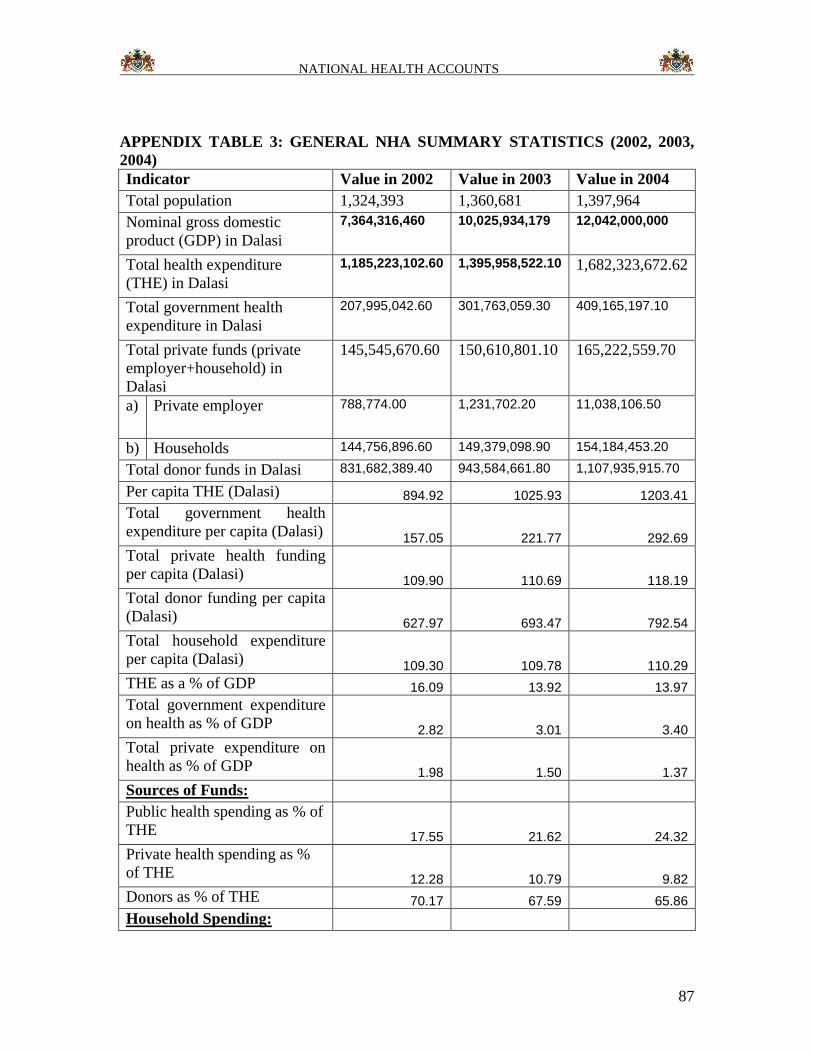
NATIONAL HEALTH ACCOUNTS
87
APPENDIX TABLE 3: GENERAL NHA SUMMARY STATISTICS (2002, 2003,
2004)
Indicator Value in 2002 Value in 2003 Value in 2004
Total population 1,324,393 1,360,681 1,397,964
Nominal gross domestic
product (GDP) in Dalasi
7,364,316,460 10,025,934,179 12,042,000,000
Total health expenditure
(THE) in Dalasi
1,185,223,102.60 1,395,958,522.10 1,682,323,672.62
Total government health
expenditure in Dalasi
207,995,042.60 301,763,059.30 409,165,197.10
Total private funds (private
employer+household) in
Dalasi
145,545,670.60 150,610,801.10 165,222,559.70
a) Private employer 788,774.00 1,231,702.20 11,038,106.50
b) Households 144,756,896.60 149,379,098.90 154,184,453.20
Total donor funds in Dalasi 831,682,389.40 943,584,661.80 1,107,935,915.70
Per capita THE (Dalasi) 894.92 1025.93 1203.41
Total government health
expenditure per capita (Dalasi) 157.05 221.77 292.69
Total private health funding
per capita (Dalasi) 109.90 110.69 118.19
Total donor funding per capita
(Dalasi) 627.97 693.47 792.54
Total household expenditure
per capita (Dalasi) 109.30 109.78 110.29
THE as a % of GDP 16.09 13.92 13.97
Total government expenditure
on health as % of GDP 2.82 3.01 3.40
Total private expenditure on
health as % of GDP 1.98 1.50 1.37
Sources of Funds:
Public health spending as % of
THE 17.55 21.62 24.32
Private health spending as %
of THE 12.28 10.79 9.82
Donors as % of THE 70.17 67.59 65.86
Household Spending:
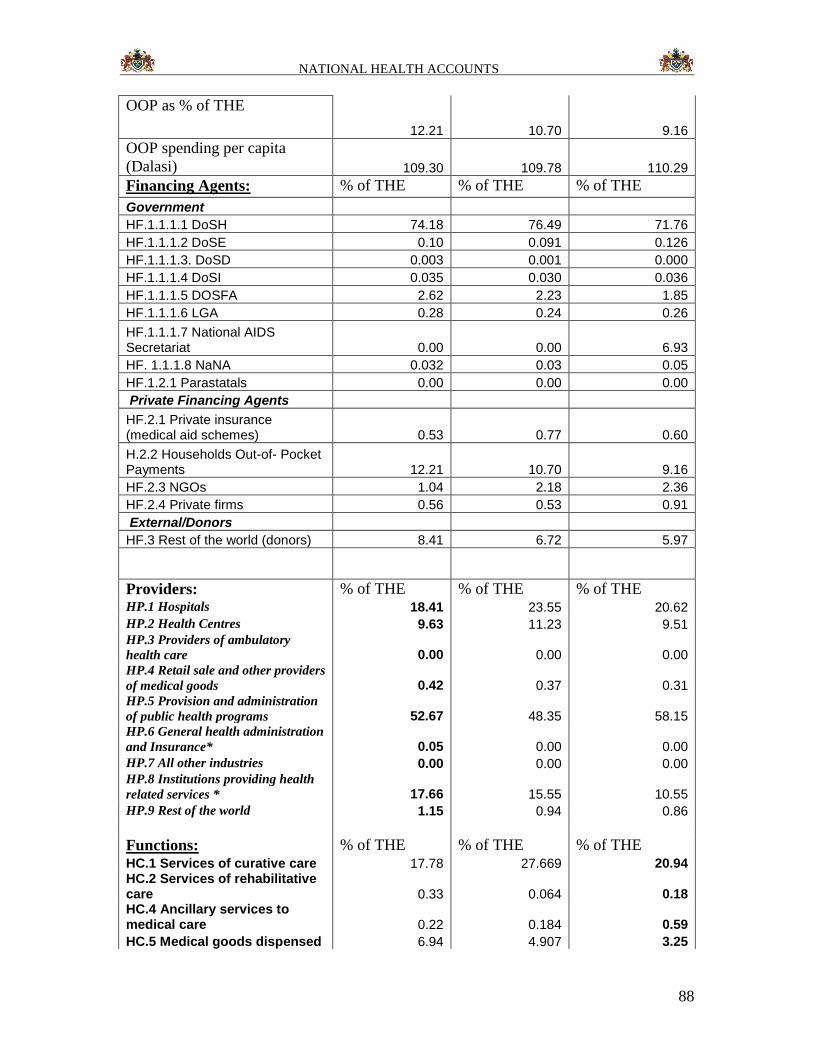
NATIONAL HEALTH ACCOUNTS
88
OOP as % of THE
12.21 10.70 9.16
OOP spending per capita
(Dalasi) 109.30 109.78 110.29
Financing Agents: % of THE % of THE % of THE
Government
HF.1.1.1.1 DoSH 74.18 76.49 71.76
HF.1.1.1.2 DoSE 0.10 0.091 0.126
HF.1.1.1.3. DoSD 0.003 0.001 0.000
HF.1.1.1.4 DoSI 0.035 0.030 0.036
HF.1.1.1.5 DOSFA 2.62 2.23 1.85
HF.1.1.1.6 LGA 0.28 0.24 0.26
HF.1.1.1.7 National AIDS Secretariat 0.00 0.00 6.93
HF. 1.1.1.8 NaNA 0.032 0.03 0.05
HF.1.2.1 Parastatals 0.00 0.00 0.00
Private Financing Agents
HF.2.1 Private insurance (medical aid schemes) 0.53 0.77 0.60
H.2.2 Households Out-of- Pocket Payments 12.21 10.70 9.16
HF.2.3 NGOs 1.04 2.18 2.36
HF.2.4 Private firms 0.56 0.53 0.91
External/Donors
HF.3 Rest of the world (donors) 8.41 6.72 5.97
Providers: % of THE % of THE % of THE HP.1 Hospitals 18.41 23.55 20.62
HP.2 Health Centres 9.63 11.23 9.51 HP.3 Providers of ambulatory
health care 0.00 0.00 0.00 HP.4 Retail sale and other providers
of medical goods 0.42 0.37 0.31 HP.5 Provision and administration
of public health programs 52.67 48.35 58.15 HP.6 General health administration
and Insurance* 0.05 0.00 0.00
HP.7 All other industries 0.00 0.00 0.00 HP.8 Institutions providing health
related services * 17.66 15.55 10.55
HP.9 Rest of the world 1.15 0.94 0.86
Functions: % of THE % of THE % of THE HC.1 Services of curative care 17.78 27.669 20.94 HC.2 Services of rehabilitative care 0.33 0.064 0.18 HC.4 Ancillary services to medical care 0.22 0.184 0.59
HC.5 Medical goods dispensed 6.94 4.907 3.25
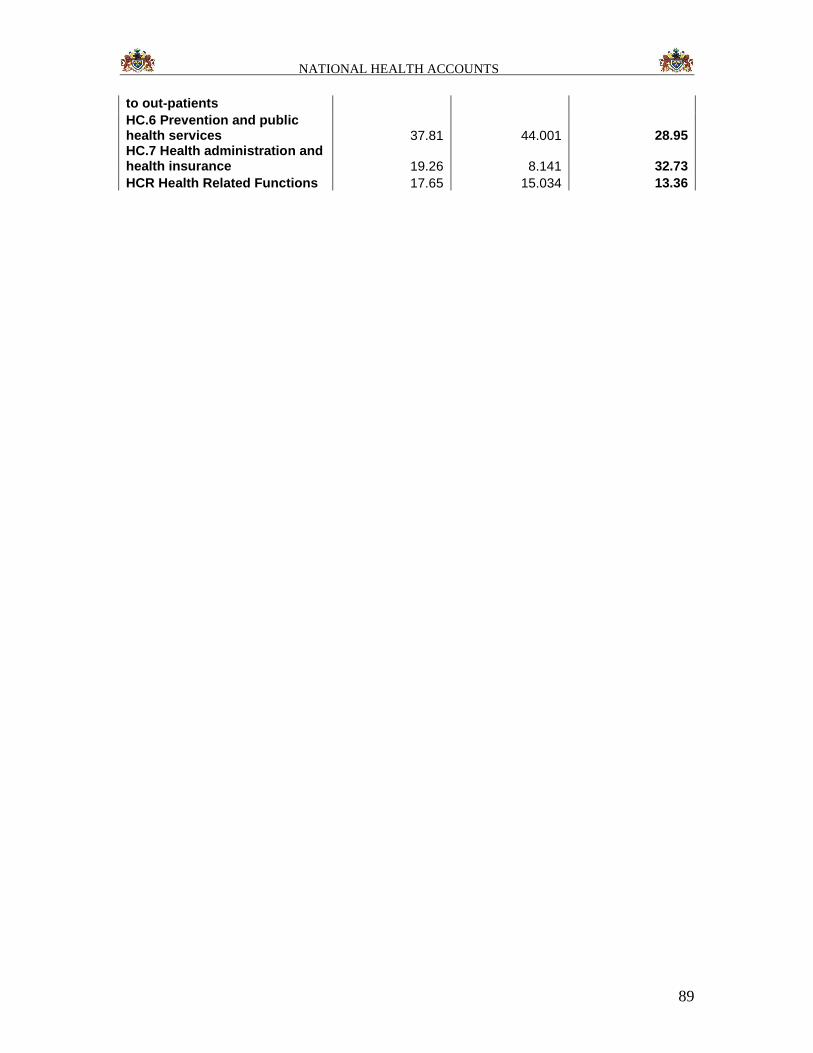
NATIONAL HEALTH ACCOUNTS
89
to out-patients
HC.6 Prevention and public health services 37.81 44.001 28.95 HC.7 Health administration and health insurance 19.26 8.141 32.73
HCR Health Related Functions 17.65 15.034 13.36
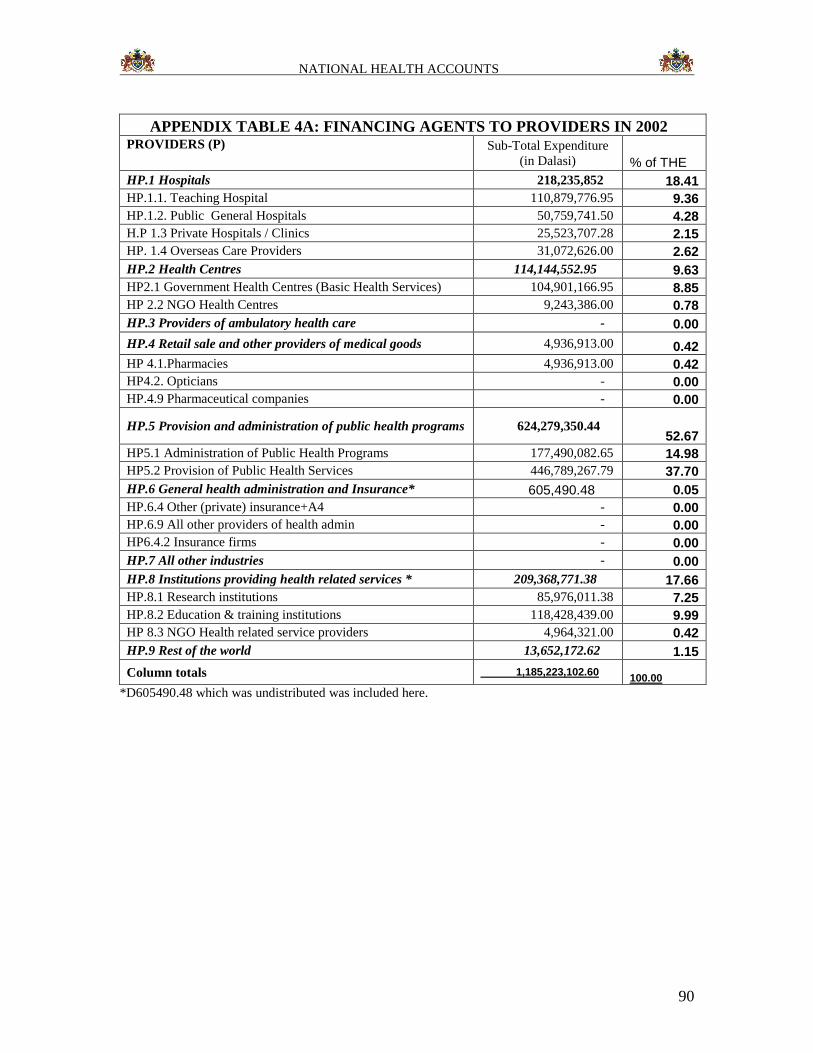
NATIONAL HEALTH ACCOUNTS
90
APPENDIX TABLE 4A: FINANCING AGENTS TO PROVIDERS IN 2002 PROVIDERS (P) Sub-Total Expenditure
(in Dalasi) % of THE
HP.1 Hospitals 218,235,852 18.41
HP.1.1. Teaching Hospital 110,879,776.95 9.36
HP.1.2. Public General Hospitals 50,759,741.50 4.28
H.P 1.3 Private Hospitals / Clinics 25,523,707.28 2.15
HP. 1.4 Overseas Care Providers 31,072,626.00 2.62
HP.2 Health Centres 114,144,552.95 9.63
HP2.1 Government Health Centres (Basic Health Services) 104,901,166.95 8.85
HP 2.2 NGO Health Centres 9,243,386.00 0.78
HP.3 Providers of ambulatory health care - 0.00
HP.4 Retail sale and other providers of medical goods 4,936,913.00 0.42
HP 4.1.Pharmacies 4,936,913.00 0.42
HP4.2. Opticians - 0.00
HP.4.9 Pharmaceutical companies - 0.00
HP.5 Provision and administration of public health programs 624,279,350.44 52.67
HP5.1 Administration of Public Health Programs 177,490,082.65 14.98
HP5.2 Provision of Public Health Services 446,789,267.79 37.70
HP.6 General health administration and Insurance* 605,490.48 0.05
HP.6.4 Other (private) insurance+A4 - 0.00
HP.6.9 All other providers of health admin - 0.00
HP6.4.2 Insurance firms - 0.00
HP.7 All other industries - 0.00
HP.8 Institutions providing health related services * 209,368,771.38 17.66
HP.8.1 Research institutions 85,976,011.38 7.25
HP.8.2 Education & training institutions 118,428,439.00 9.99
HP 8.3 NGO Health related service providers 4,964,321.00 0.42
HP.9 Rest of the world 13,652,172.62 1.15
Column totals 1,185,223,102.60 100.00
*D605490.48 which was undistributed was included here.
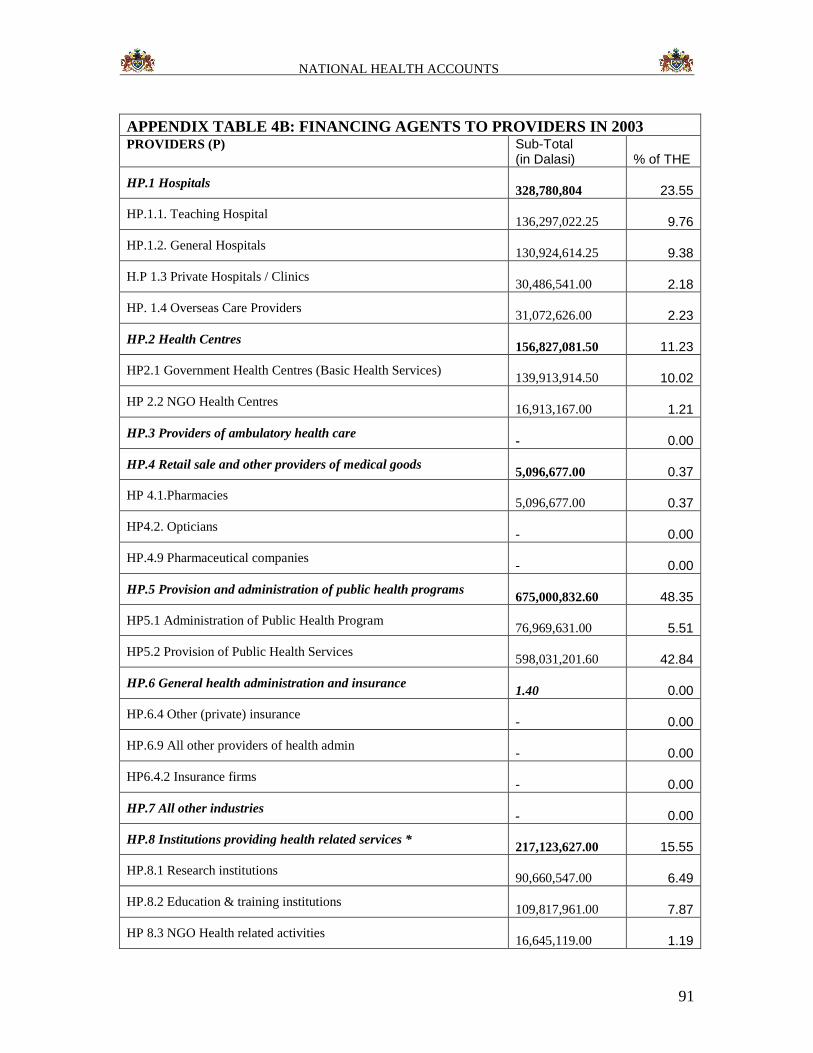
NATIONAL HEALTH ACCOUNTS
91
APPENDIX TABLE 4B: FINANCING AGENTS TO PROVIDERS IN 2003 PROVIDERS (P) Sub-Total
(in Dalasi) % of THE
HP.1 Hospitals
328,780,804 23.55
HP.1.1. Teaching Hospital
136,297,022.25 9.76
HP.1.2. General Hospitals
130,924,614.25 9.38
H.P 1.3 Private Hospitals / Clinics
30,486,541.00 2.18
HP. 1.4 Overseas Care Providers
31,072,626.00 2.23
HP.2 Health Centres
156,827,081.50 11.23
HP2.1 Government Health Centres (Basic Health Services)
139,913,914.50 10.02
HP 2.2 NGO Health Centres
16,913,167.00 1.21
HP.3 Providers of ambulatory health care
- 0.00
HP.4 Retail sale and other providers of medical goods
5,096,677.00 0.37
HP 4.1.Pharmacies
5,096,677.00 0.37
HP4.2. Opticians
- 0.00
HP.4.9 Pharmaceutical companies
- 0.00
HP.5 Provision and administration of public health programs
675,000,832.60 48.35
HP5.1 Administration of Public Health Program
76,969,631.00 5.51
HP5.2 Provision of Public Health Services
598,031,201.60 42.84
HP.6 General health administration and insurance
1.40 0.00
HP.6.4 Other (private) insurance
- 0.00
HP.6.9 All other providers of health admin
- 0.00
HP6.4.2 Insurance firms
- 0.00
HP.7 All other industries
- 0.00
HP.8 Institutions providing health related services *
217,123,627.00 15.55
HP.8.1 Research institutions
90,660,547.00 6.49
HP.8.2 Education & training institutions
109,817,961.00 7.87
HP 8.3 NGO Health related activities
16,645,119.00 1.19
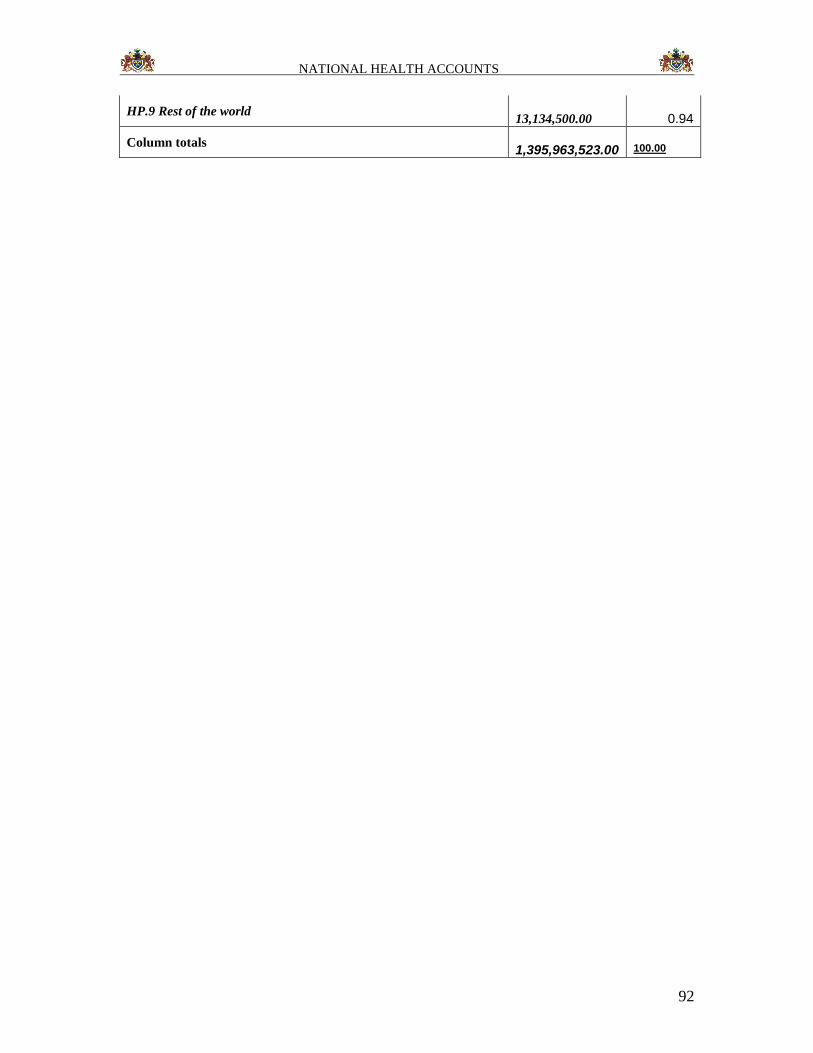
NATIONAL HEALTH ACCOUNTS
92
HP.9 Rest of the world
13,134,500.00 0.94
Column totals 1,395,963,523.00
100.00
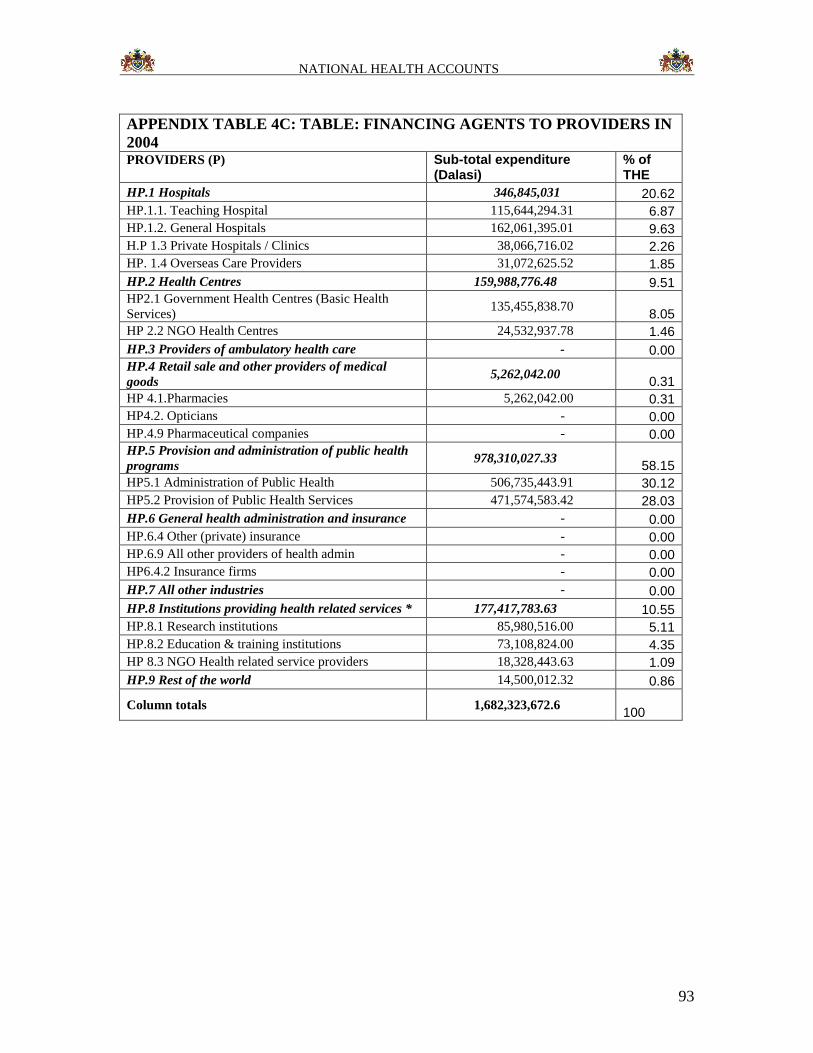
NATIONAL HEALTH ACCOUNTS
93
APPENDIX TABLE 4C: TABLE: FINANCING AGENTS TO PROVIDERS IN
2004 PROVIDERS (P) Sub-total expenditure
(Dalasi) % of THE
HP.1 Hospitals 346,845,031 20.62
HP.1.1. Teaching Hospital 115,644,294.31 6.87
HP.1.2. General Hospitals 162,061,395.01 9.63
H.P 1.3 Private Hospitals / Clinics 38,066,716.02 2.26
HP. 1.4 Overseas Care Providers 31,072,625.52 1.85
HP.2 Health Centres 159,988,776.48 9.51
HP2.1 Government Health Centres (Basic Health
Services) 135,455,838.70
8.05
HP 2.2 NGO Health Centres 24,532,937.78 1.46
HP.3 Providers of ambulatory health care - 0.00
HP.4 Retail sale and other providers of medical
goods 5,262,042.00
0.31
HP 4.1.Pharmacies 5,262,042.00 0.31
HP4.2. Opticians - 0.00
HP.4.9 Pharmaceutical companies - 0.00
HP.5 Provision and administration of public health
programs 978,310,027.33
58.15
HP5.1 Administration of Public Health 506,735,443.91 30.12
HP5.2 Provision of Public Health Services 471,574,583.42 28.03
HP.6 General health administration and insurance - 0.00
HP.6.4 Other (private) insurance - 0.00
HP.6.9 All other providers of health admin - 0.00
HP6.4.2 Insurance firms - 0.00
HP.7 All other industries - 0.00
HP.8 Institutions providing health related services * 177,417,783.63 10.55
HP.8.1 Research institutions 85,980,516.00 5.11
HP.8.2 Education & training institutions 73,108,824.00 4.35
HP 8.3 NGO Health related service providers 18,328,443.63 1.09
HP.9 Rest of the world 14,500,012.32 0.86
Column totals 1,682,323,672.6 100
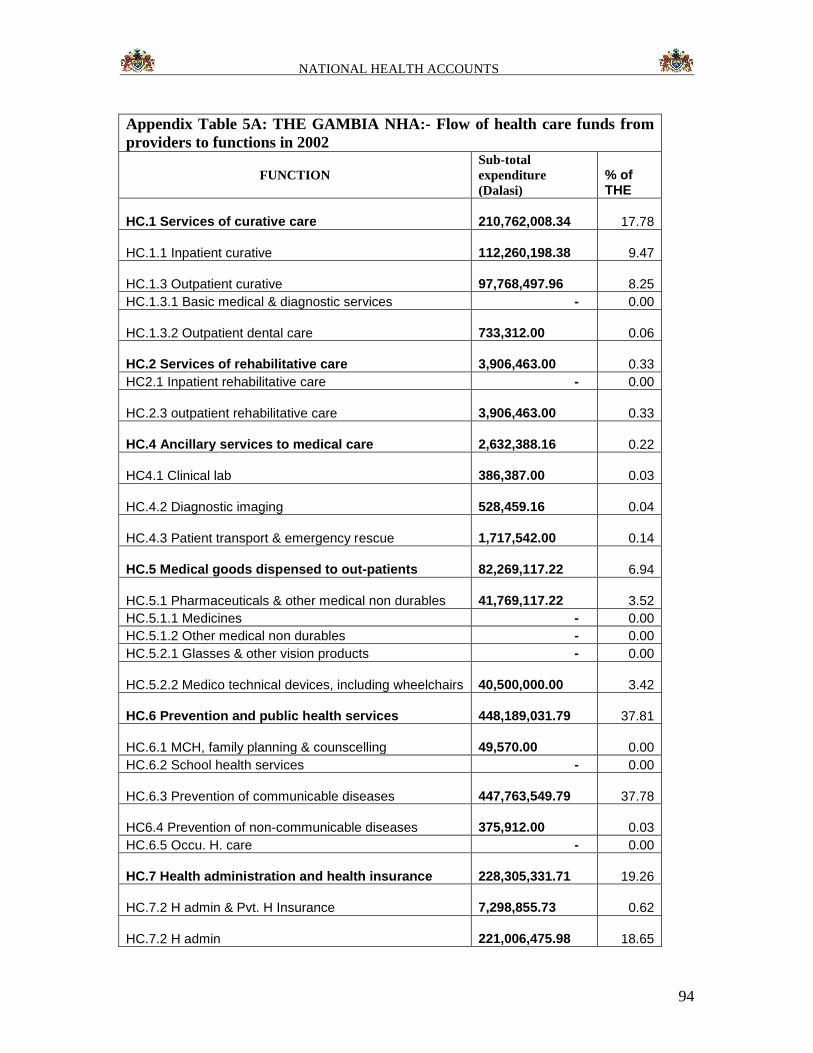
NATIONAL HEALTH ACCOUNTS
94
Appendix Table 5A: THE GAMBIA NHA:- Flow of health care funds from
providers to functions in 2002
FUNCTION
Sub-total
expenditure
(Dalasi)
% of THE
HC.1 Services of curative care 210,762,008.34 17.78
HC.1.1 Inpatient curative 112,260,198.38 9.47
HC.1.3 Outpatient curative 97,768,497.96 8.25
HC.1.3.1 Basic medical & diagnostic services - 0.00
HC.1.3.2 Outpatient dental care 733,312.00 0.06
HC.2 Services of rehabilitative care 3,906,463.00 0.33
HC2.1 Inpatient rehabilitative care - 0.00
HC.2.3 outpatient rehabilitative care 3,906,463.00 0.33
HC.4 Ancillary services to medical care 2,632,388.16 0.22
HC4.1 Clinical lab 386,387.00 0.03
HC.4.2 Diagnostic imaging 528,459.16 0.04
HC.4.3 Patient transport & emergency rescue 1,717,542.00 0.14
HC.5 Medical goods dispensed to out-patients 82,269,117.22 6.94
HC.5.1 Pharmaceuticals & other medical non durables 41,769,117.22 3.52
HC.5.1.1 Medicines - 0.00
HC.5.1.2 Other medical non durables - 0.00
HC.5.2.1 Glasses & other vision products - 0.00
HC.5.2.2 Medico technical devices, including wheelchairs 40,500,000.00 3.42
HC.6 Prevention and public health services 448,189,031.79 37.81
HC.6.1 MCH, family planning & counscelling 49,570.00 0.00
HC.6.2 School health services - 0.00
HC.6.3 Prevention of communicable diseases 447,763,549.79 37.78
HC6.4 Prevention of non-communicable diseases 375,912.00 0.03
HC.6.5 Occu. H. care - 0.00
HC.7 Health administration and health insurance 228,305,331.71 19.26
HC.7.2 H admin & Pvt. H Insurance 7,298,855.73 0.62
HC.7.2 H admin 221,006,475.98 18.65
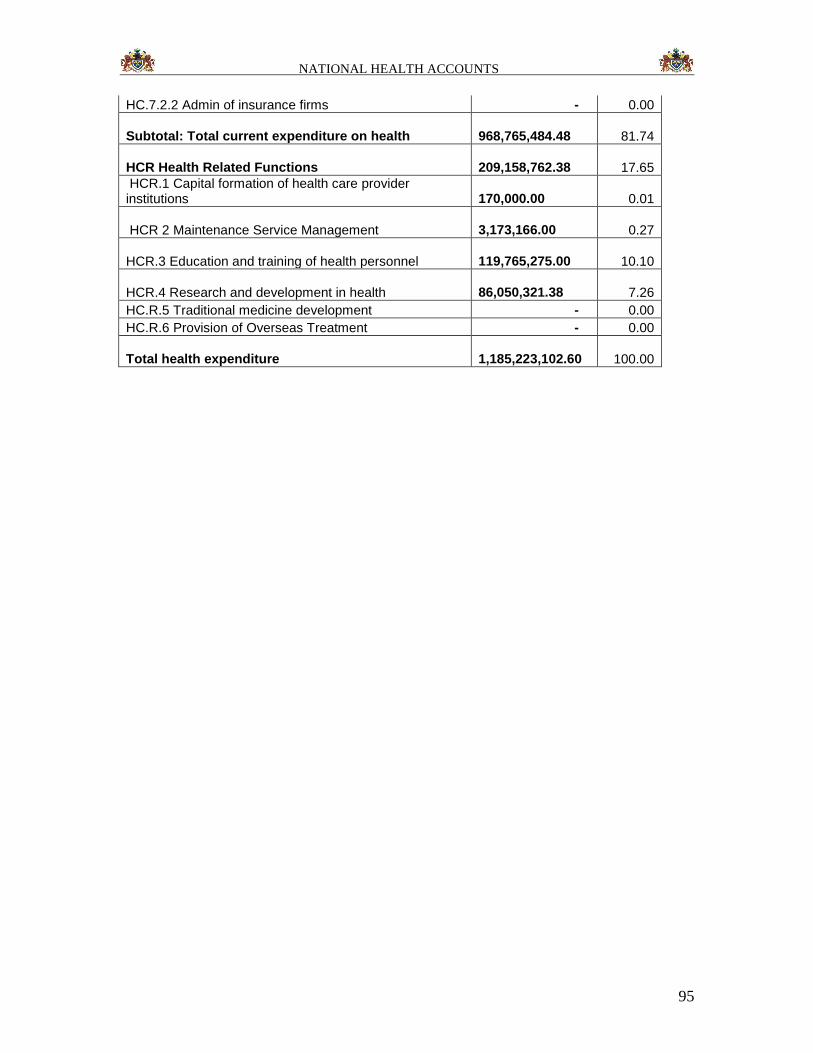
NATIONAL HEALTH ACCOUNTS
95
HC.7.2.2 Admin of insurance firms - 0.00
Subtotal: Total current expenditure on health 968,765,484.48 81.74
HCR Health Related Functions 209,158,762.38 17.65
HCR.1 Capital formation of health care provider institutions
170,000.00 0.01
HCR 2 Maintenance Service Management 3,173,166.00 0.27
HCR.3 Education and training of health personnel 119,765,275.00 10.10
HCR.4 Research and development in health 86,050,321.38 7.26
HC.R.5 Traditional medicine development - 0.00
HC.R.6 Provision of Overseas Treatment - 0.00
Total health expenditure 1,185,223,102.60 100.00
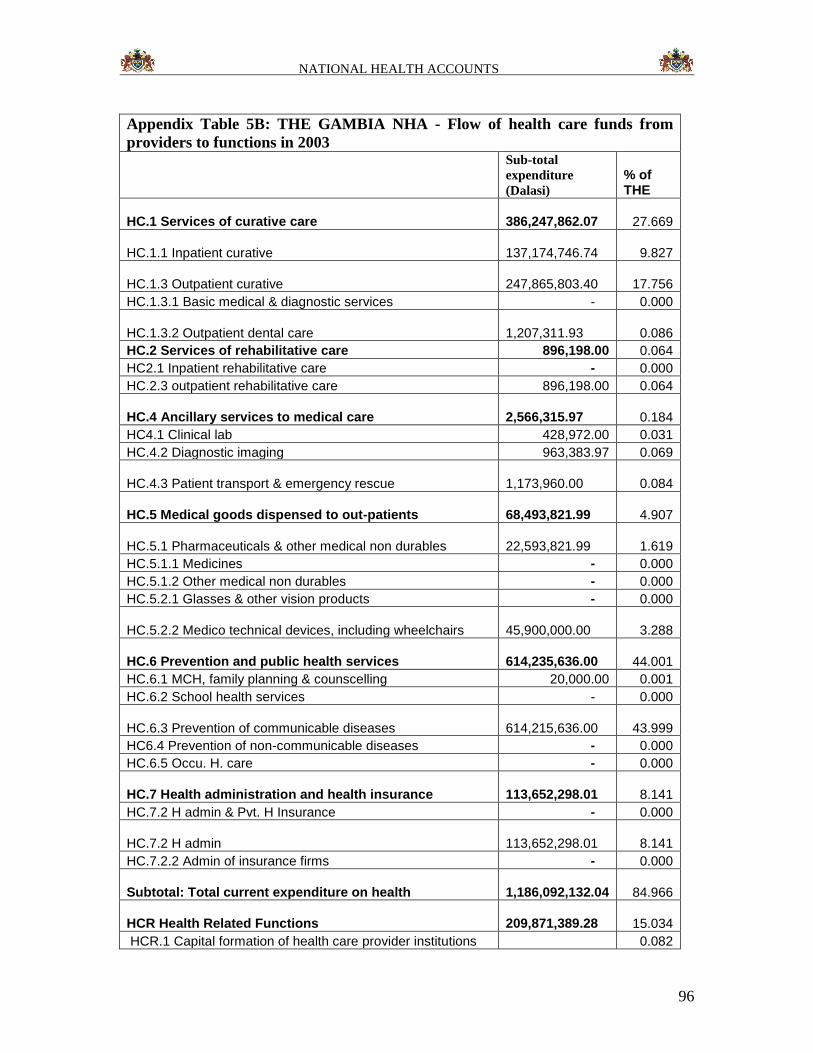
NATIONAL HEALTH ACCOUNTS
96
Appendix Table 5B: THE GAMBIA NHA - Flow of health care funds from
providers to functions in 2003
Sub-total
expenditure
(Dalasi)
% of THE
HC.1 Services of curative care 386,247,862.07 27.669
HC.1.1 Inpatient curative 137,174,746.74 9.827
HC.1.3 Outpatient curative 247,865,803.40 17.756
HC.1.3.1 Basic medical & diagnostic services - 0.000
HC.1.3.2 Outpatient dental care 1,207,311.93 0.086
HC.2 Services of rehabilitative care 896,198.00 0.064
HC2.1 Inpatient rehabilitative care - 0.000
HC.2.3 outpatient rehabilitative care 896,198.00 0.064
HC.4 Ancillary services to medical care 2,566,315.97 0.184
HC4.1 Clinical lab 428,972.00 0.031
HC.4.2 Diagnostic imaging 963,383.97 0.069
HC.4.3 Patient transport & emergency rescue 1,173,960.00 0.084
HC.5 Medical goods dispensed to out-patients 68,493,821.99 4.907
HC.5.1 Pharmaceuticals & other medical non durables 22,593,821.99 1.619
HC.5.1.1 Medicines - 0.000
HC.5.1.2 Other medical non durables - 0.000
HC.5.2.1 Glasses & other vision products - 0.000
HC.5.2.2 Medico technical devices, including wheelchairs 45,900,000.00 3.288
HC.6 Prevention and public health services 614,235,636.00 44.001
HC.6.1 MCH, family planning & counscelling 20,000.00 0.001
HC.6.2 School health services - 0.000
HC.6.3 Prevention of communicable diseases 614,215,636.00 43.999
HC6.4 Prevention of non-communicable diseases - 0.000
HC.6.5 Occu. H. care - 0.000
HC.7 Health administration and health insurance 113,652,298.01 8.141
HC.7.2 H admin & Pvt. H Insurance - 0.000
HC.7.2 H admin 113,652,298.01 8.141
HC.7.2.2 Admin of insurance firms - 0.000
Subtotal: Total current expenditure on health 1,186,092,132.04 84.966
HCR Health Related Functions 209,871,389.28 15.034
HCR.1 Capital formation of health care provider institutions 0.082
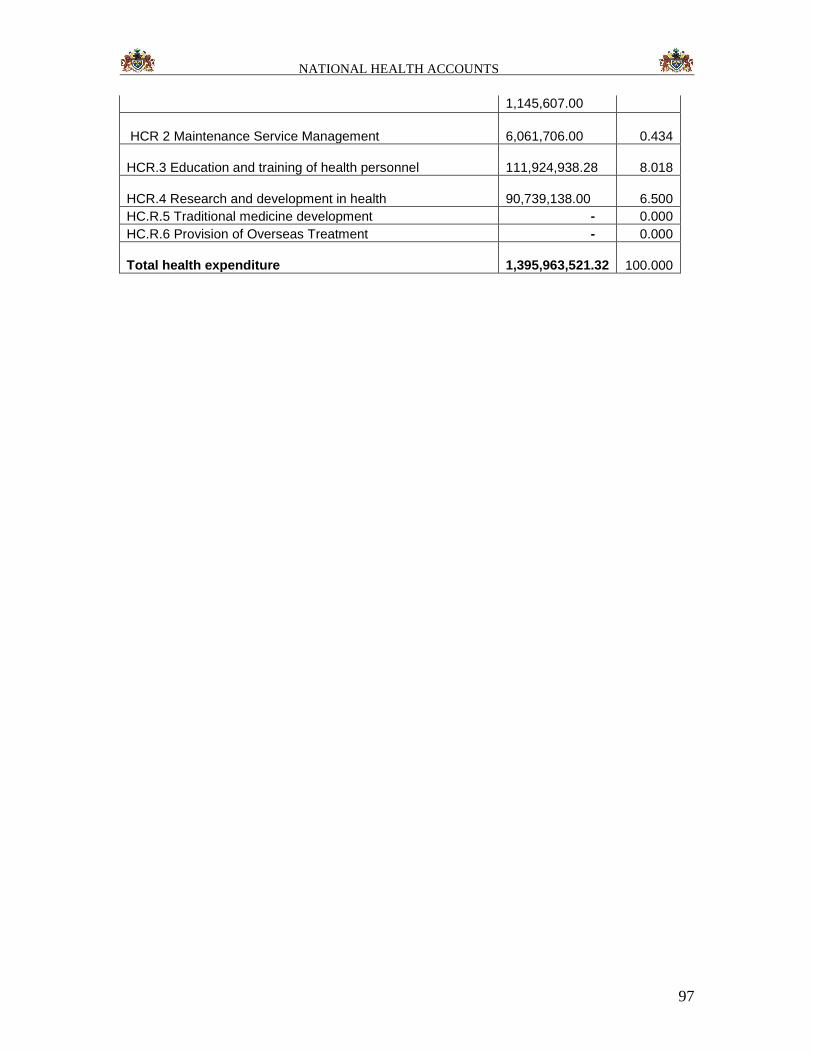
NATIONAL HEALTH ACCOUNTS
97
1,145,607.00
HCR 2 Maintenance Service Management 6,061,706.00 0.434
HCR.3 Education and training of health personnel 111,924,938.28 8.018
HCR.4 Research and development in health 90,739,138.00 6.500
HC.R.5 Traditional medicine development - 0.000
HC.R.6 Provision of Overseas Treatment - 0.000
Total health expenditure 1,395,963,521.32 100.000
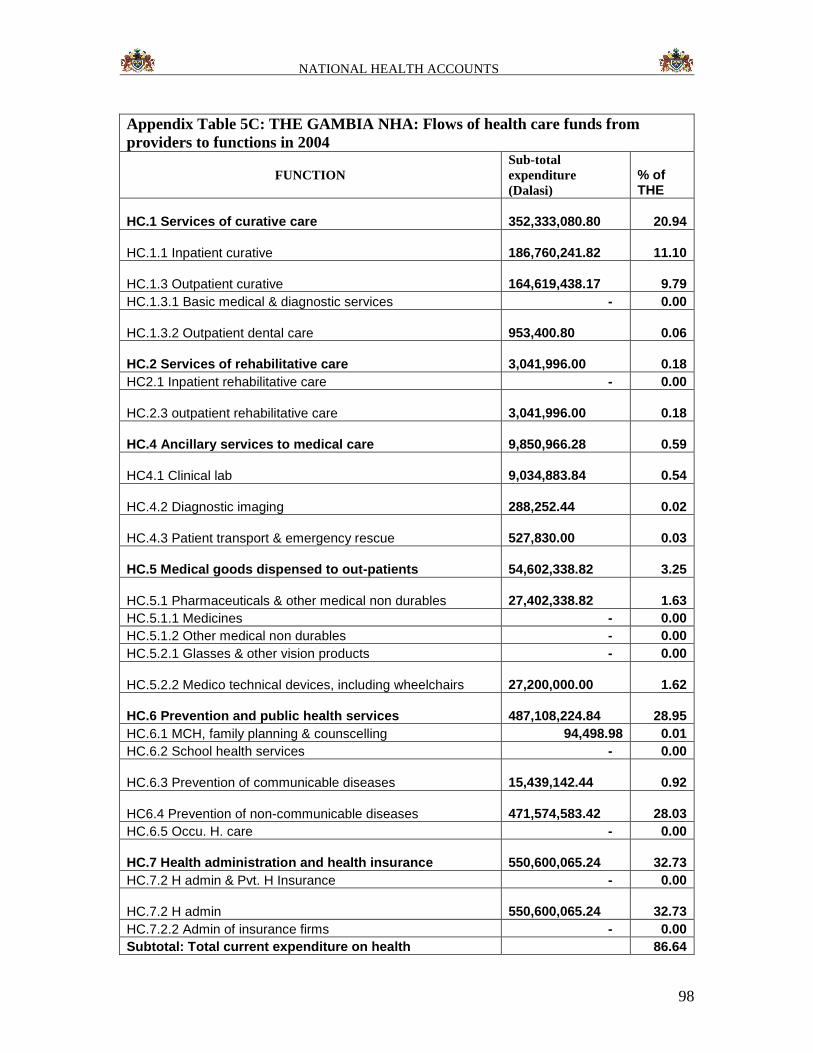
NATIONAL HEALTH ACCOUNTS
98
Appendix Table 5C: THE GAMBIA NHA: Flows of health care funds from
providers to functions in 2004
FUNCTION
Sub-total
expenditure
(Dalasi)
% of THE
HC.1 Services of curative care 352,333,080.80 20.94
HC.1.1 Inpatient curative 186,760,241.82 11.10
HC.1.3 Outpatient curative 164,619,438.17 9.79
HC.1.3.1 Basic medical & diagnostic services - 0.00
HC.1.3.2 Outpatient dental care 953,400.80 0.06
HC.2 Services of rehabilitative care 3,041,996.00 0.18
HC2.1 Inpatient rehabilitative care - 0.00
HC.2.3 outpatient rehabilitative care 3,041,996.00 0.18
HC.4 Ancillary services to medical care 9,850,966.28 0.59
HC4.1 Clinical lab 9,034,883.84 0.54
HC.4.2 Diagnostic imaging 288,252.44 0.02
HC.4.3 Patient transport & emergency rescue 527,830.00 0.03
HC.5 Medical goods dispensed to out-patients 54,602,338.82 3.25
HC.5.1 Pharmaceuticals & other medical non durables 27,402,338.82 1.63
HC.5.1.1 Medicines - 0.00
HC.5.1.2 Other medical non durables - 0.00
HC.5.2.1 Glasses & other vision products - 0.00
HC.5.2.2 Medico technical devices, including wheelchairs 27,200,000.00 1.62
HC.6 Prevention and public health services 487,108,224.84 28.95
HC.6.1 MCH, family planning & counscelling 94,498.98 0.01
HC.6.2 School health services - 0.00
HC.6.3 Prevention of communicable diseases 15,439,142.44 0.92
HC6.4 Prevention of non-communicable diseases 471,574,583.42 28.03
HC.6.5 Occu. H. care - 0.00
HC.7 Health administration and health insurance 550,600,065.24 32.73
HC.7.2 H admin & Pvt. H Insurance - 0.00
HC.7.2 H admin 550,600,065.24 32.73
HC.7.2.2 Admin of insurance firms - 0.00
Subtotal: Total current expenditure on health 86.64
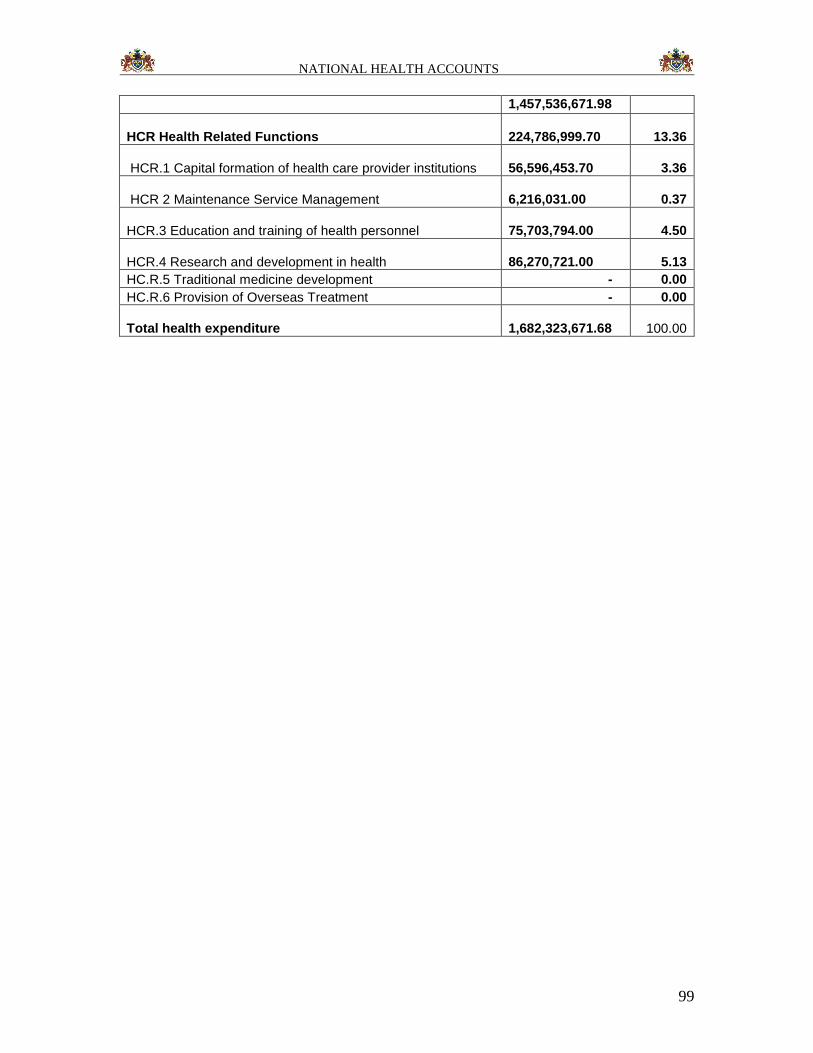
NATIONAL HEALTH ACCOUNTS
99
1,457,536,671.98
HCR Health Related Functions 224,786,999.70 13.36
HCR.1 Capital formation of health care provider institutions 56,596,453.70 3.36
HCR 2 Maintenance Service Management 6,216,031.00 0.37
HCR.3 Education and training of health personnel 75,703,794.00 4.50
HCR.4 Research and development in health 86,270,721.00 5.13
HC.R.5 Traditional medicine development - 0.00
HC.R.6 Provision of Overseas Treatment - 0.00
Total health expenditure 1,682,323,671.68 100.00
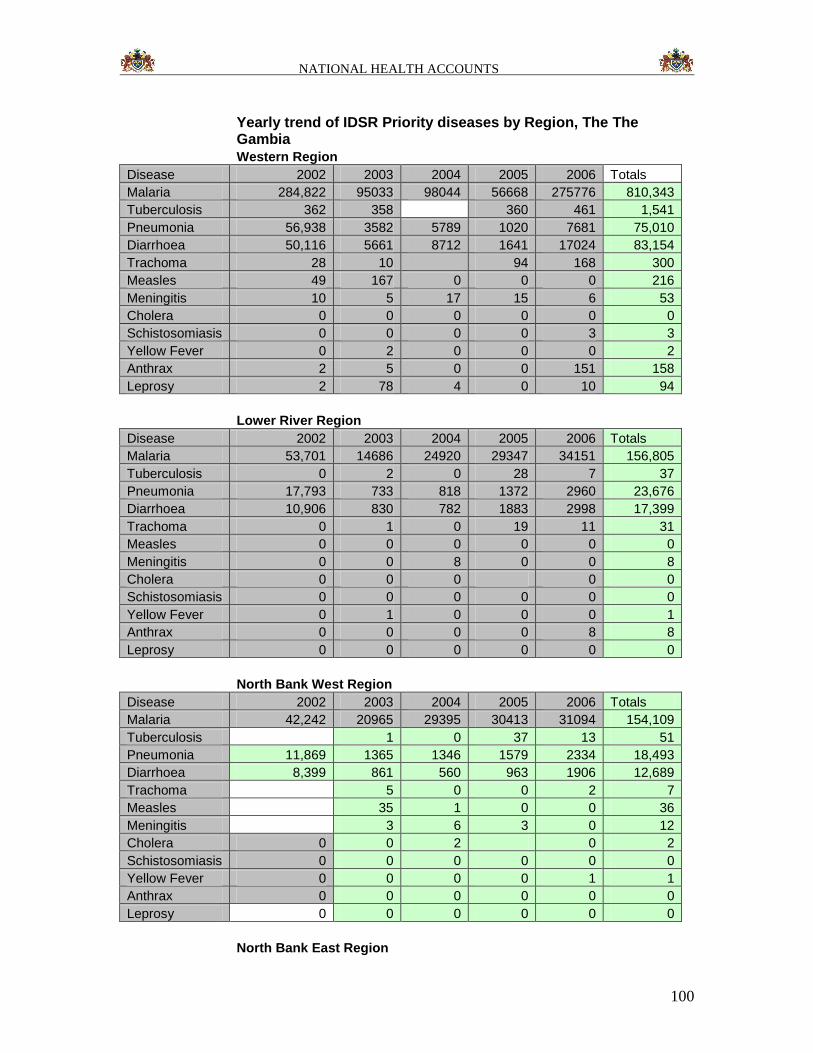
NATIONAL HEALTH ACCOUNTS
100
Yearly trend of IDSR Priority diseases by Region, The The Gambia
Western Region
Disease 2002 2003 2004 2005 2006 Totals
Malaria 284,822 95033 98044 56668 275776 810,343
Tuberculosis 362 358 360 461 1,541
Pneumonia 56,938 3582 5789 1020 7681 75,010
Diarrhoea 50,116 5661 8712 1641 17024 83,154
Trachoma 28 10 94 168 300
Measles 49 167 0 0 0 216
Meningitis 10 5 17 15 6 53
Cholera 0 0 0 0 0 0
Schistosomiasis 0 0 0 0 3 3
Yellow Fever 0 2 0 0 0 2
Anthrax 2 5 0 0 151 158
Leprosy 2 78 4 0 10 94
Lower River Region
Disease 2002 2003 2004 2005 2006 Totals
Malaria 53,701 14686 24920 29347 34151 156,805
Tuberculosis 0 2 0 28 7 37
Pneumonia 17,793 733 818 1372 2960 23,676
Diarrhoea 10,906 830 782 1883 2998 17,399
Trachoma 0 1 0 19 11 31
Measles 0 0 0 0 0 0
Meningitis 0 0 8 0 0 8
Cholera 0 0 0 0 0
Schistosomiasis 0 0 0 0 0 0
Yellow Fever 0 1 0 0 0 1
Anthrax 0 0 0 0 8 8
Leprosy 0 0 0 0 0 0
North Bank West Region
Disease 2002 2003 2004 2005 2006 Totals
Malaria 42,242 20965 29395 30413 31094 154,109
Tuberculosis 1 0 37 13 51
Pneumonia 11,869 1365 1346 1579 2334 18,493
Diarrhoea 8,399 861 560 963 1906 12,689
Trachoma 5 0 0 2 7
Measles 35 1 0 0 36
Meningitis 3 6 3 0 12
Cholera 0 0 2 0 2
Schistosomiasis 0 0 0 0 0 0
Yellow Fever 0 0 0 0 1 1
Anthrax 0 0 0 0 0 0
Leprosy 0 0 0 0 0 0
North Bank East Region
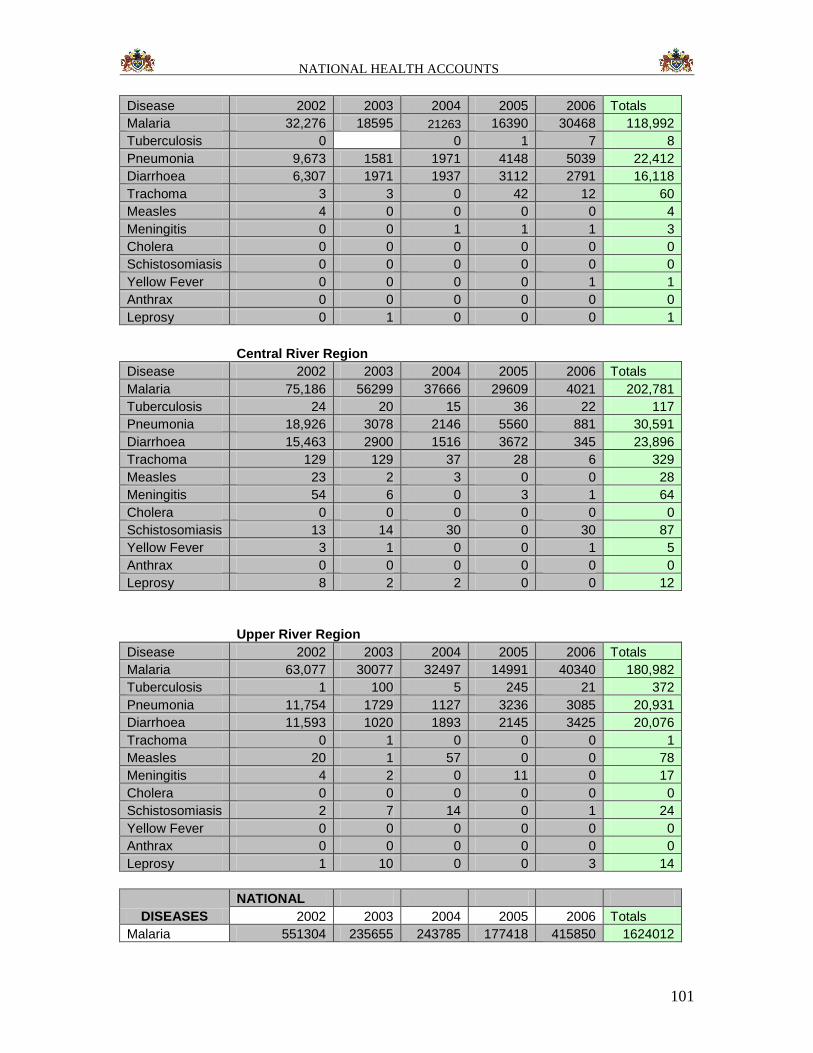
NATIONAL HEALTH ACCOUNTS
101
Disease 2002 2003 2004 2005 2006 Totals
Malaria 32,276 18595 21263 16390 30468 118,992
Tuberculosis 0 0 1 7 8
Pneumonia 9,673 1581 1971 4148 5039 22,412
Diarrhoea 6,307 1971 1937 3112 2791 16,118
Trachoma 3 3 0 42 12 60
Measles 4 0 0 0 0 4
Meningitis 0 0 1 1 1 3
Cholera 0 0 0 0 0 0
Schistosomiasis 0 0 0 0 0 0
Yellow Fever 0 0 0 0 1 1
Anthrax 0 0 0 0 0 0
Leprosy 0 1 0 0 0 1
Central River Region
Disease 2002 2003 2004 2005 2006 Totals
Malaria 75,186 56299 37666 29609 4021 202,781
Tuberculosis 24 20 15 36 22 117
Pneumonia 18,926 3078 2146 5560 881 30,591
Diarrhoea 15,463 2900 1516 3672 345 23,896
Trachoma 129 129 37 28 6 329
Measles 23 2 3 0 0 28
Meningitis 54 6 0 3 1 64
Cholera 0 0 0 0 0 0
Schistosomiasis 13 14 30 0 30 87
Yellow Fever 3 1 0 0 1 5
Anthrax 0 0 0 0 0 0
Leprosy 8 2 2 0 0 12
Upper River Region
Disease 2002 2003 2004 2005 2006 Totals
Malaria 63,077 30077 32497 14991 40340 180,982
Tuberculosis 1 100 5 245 21 372
Pneumonia 11,754 1729 1127 3236 3085 20,931
Diarrhoea 11,593 1020 1893 2145 3425 20,076
Trachoma 0 1 0 0 0 1
Measles 20 1 57 0 0 78
Meningitis 4 2 0 11 0 17
Cholera 0 0 0 0 0 0
Schistosomiasis 2 7 14 0 1 24
Yellow Fever 0 0 0 0 0 0
Anthrax 0 0 0 0 0 0
Leprosy 1 10 0 0 3 14
DISEASES
NATIONAL
2002 2003 2004 2005 2006 Totals
Malaria 551304 235655 243785 177418 415850 1624012
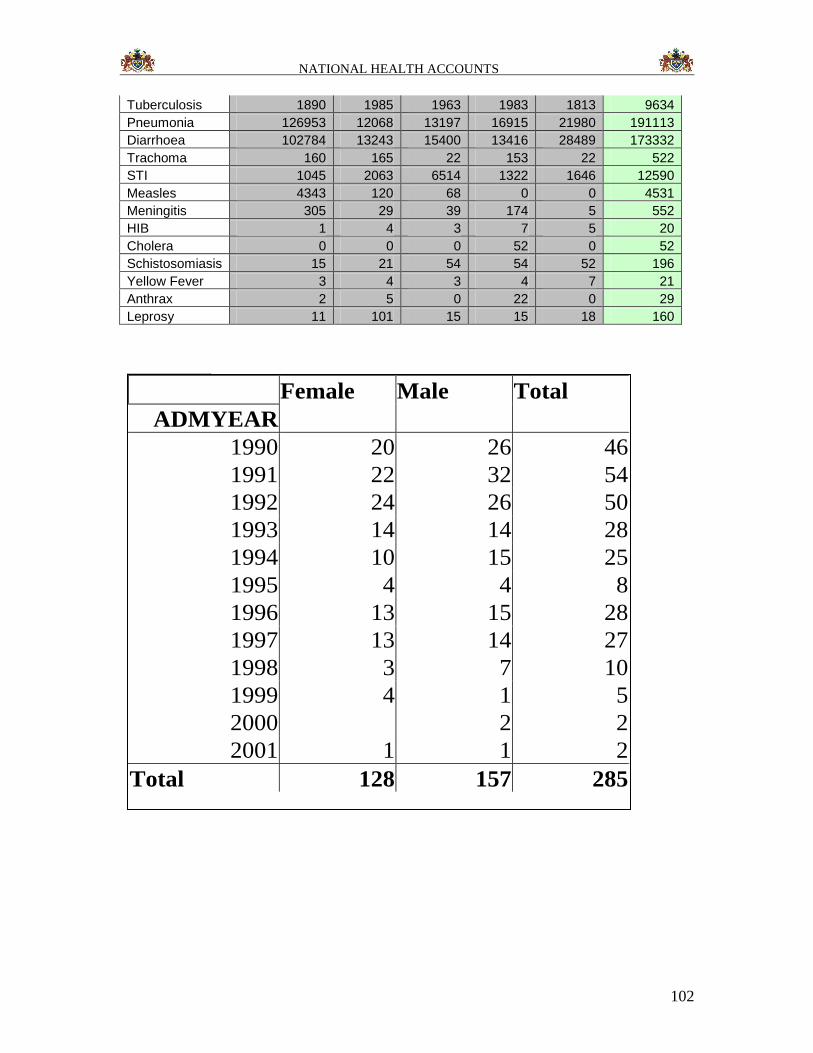
NATIONAL HEALTH ACCOUNTS
102
Tuberculosis 1890 1985 1963 1983 1813 9634
Pneumonia 126953 12068 13197 16915 21980 191113
Diarrhoea 102784 13243 15400 13416 28489 173332
Trachoma 160 165 22 153 22 522
STI 1045 2063 6514 1322 1646 12590
Measles 4343 120 68 0 0 4531
Meningitis 305 29 39 174 5 552
HIB 1 4 3 7 5 20
Cholera 0 0 0 52 0 52
Schistosomiasis 15 21 54 54 52 196
Yellow Fever 3 4 3 4 7 21
Anthrax 2 5 0 22 0 29
Leprosy 11 101 15 15 18 160
HIB
Female Male Total
ADMYEAR
1990 20 26 46
1991 22 32 54
1992 24 26 50
1993 14 14 28
1994 10 15 25
1995 4 4 8
1996 13 15 28
1997 13 14 27
1998 3 7 10
1999 4 1 5
2000 2 2
2001 1 1 2
Total 128 157 285


![National Health Accounts 2011[19]](https://img.pdfslide.us/doc/110x75/577d26ec1a28ab4e1ea28f66/national-health-accounts-201119.jpg)