Embed Size (px)
Citation preview
National Green Export Review of AngolaWood, Fish, and Coffee:
Baseline Report
AN
GO
LA
U N I T E D N AT I O N S C O N F E R E N C E O N T R A D E A N D D E V E L O P M E N T
UNCTAD/DITC/TED/2017/8
© 2018, United Nations Conference on Trade and Development
The findings, interpretations and conclusions expressed herein are those of the authors and do not necessarily reflect the views of the United Nations or its officials or Member States.
The designation employed and the presentation of material on any map in this work do not imply the expression of any opinion whatsoever on the part of the United Nations concerning the legal status of any country, territory, city or area or of its authorities, or concerning the delimitation of its frontiers or boundaries.
This document has not been formally edited.
iii
Contents
Note ........................................................................................................................................................ iiList of tables ........................................................................................................................................... ivList of figures .......................................................................................................................................... ivAcknowledgements ................................................................................................................................ ivAcronyms ................................................................................................................................................v
EXECUTIVE SUMMARY AND INTRODUCTION ............................................................... vi
1. GREEN EXPORTS: OPPORTUNITIES AND BENEFITS IN THE REPUBLIC OF ANGOLA ..... 11.1. Transition to a more sustainable and resilient economy through trade ............................................... 11.2 Green sectors and their products and services in a national economy .............................................. 21.3. Overview of UNCTAD’s National Green Export Review process ........................................................ 31.4. National Green Export Review process in the Republic of Angola ..................................................... 4
2. POLICY FRAMEWORK IN ANGOLA ......................................................................... 72.1. Environmental framework ................................................................................................................. 72.2. Development framework ................................................................................................................... 82.3. Trade framework .............................................................................................................................. 92.4. Certification and standardization framework ................................................................................... 10
Certified Organic Production in Angola ........................................................................................ 11Sanitary and phytosanitary measures .......................................................................................... 11ISO Certification in Angola ........................................................................................................... 11
2.5. Investment framework .................................................................................................................... 12Business Facilitation .................................................................................................................... 13
3. TRADE AND ECONOMIC GROWTH IN ANGOLA ..................................................... 143.1. Sustained long-term economic growth ........................................................................................... 143.2. Overview of Angolan trade .............................................................................................................. 153.3. Identifying Competitive Green Products .......................................................................................... 17
4. GREEN PRODUCTS UNDER PRELIMINARY ANALYSIS ............................................ 204.1. Wood exports ................................................................................................................................. 214.2. Fish exports .................................................................................................................................... 224.3. Coffee exports ................................................................................................................................ 234.4. Value chain of Angolan green products ........................................................................................... 24
5. CONCLUDING REMARKS .................................................................................... 26
References ........................................................................................................................................... 27Notes .................................................................................................................................................... 28
ANNEX: Sectoral legislations complementing the Environmental Framework Law ...... 30
iv
List of figures
Figure 1: Overview of the NGER process ..................................................................................................... 3Figure 2: Activity flow during STEP 1 of the Angola NGER ........................................................................... 5Figure 3: Number of ISO certified companies and organization in Angola ................................................... 12Figure 4: FDI inward flows and stock between 2000 and 2015 in Angola ................................................... 13Figure 5: Angolan GDP between 2000 and 2016 per main productive sector............................................. 14Figure 6: Comparison of the GDP ratio per sector between 2008 and 2015 values .................................... 15Figure 7: Overview of Angolan trade between 2009 and 2015 ................................................................... 16Figure 8: Angolan goods export in 2015 .................................................................................................... 16Figure 9: Export destination per geographical region in 2015 ..................................................................... 17Figure 10: Angolan product space network .................................................................................................. 18Figure 11: Dynamic RCA of Angola>s exports in 2015 ................................................................................. 18Figure 12: Selected green product exports between 2009 and 2015 ........................................................... 20Figure 13: YoY change in Angolan green product exports between 2009 and 2015 ..................................... 20Figure 14: Hierarchy chart of Angolan wood exports per trade partner in 2015 ............................................ 21Figure 15: Preliminary SWOT analysis for the Angolan wood sector ............................................................. 22Figure 16: Hierarchy chart of Angolan fish exports per trade partner in 2015 ................................................ 22Figure 17: Preliminary SWOT analysis for the Angolan fishery sector ............................................................ 23Figure 18: Hierarchy chart of Angolan coffee exports per trade partner in 2015 ........................................... 24Figure 19: Preliminary SWOT analysis for the Angolan coffee sector ............................................................ 24
List of tables
Table 1: Development dimensions and their fragility drivers ......................................................................... 8Table 2: Angola’s top three trade partners and their figures in 2015 .......................................................... 17Table 3: Angolan RCA index per type of product in 2015 .......................................................................... 19Table 4: Key export figures of Angolan selected green products in 2015 ................................................... 19
Acknowledgements
This report is a product of UNCTAD, prepared as part of the EU-UNCTAD Joint Programme for Angola: Train for Trade II. Dr. Alessandro Sanches-Pereira from the Research Group on Bioenergy (GBio) at São Paulo University (USP) prepared this report under the guidance of Henrique Pacini and supervision of Lucas Assunção from the UNCTAD secretariat. Malick Kane, Robert Hamwey, Riddhima Yadav, and Tamara Gregol and Laina Maia of UNCTAD have provided peer reviews and additional inputs. Graphic design of NGER figures by Nathalie Bouchek Cartolano and Lucas da Cunha Elias, report design and cover by Rafe Dent.
Shamika N. SirimanneOfficer-in-charge
Division on International Trade in Goods and Services, and Commodities
2 April, 2019
v
Acronyms
ACP African, Caribbean and Pacific StatesAGOA United States African Growth and Opportunity ActANIP National Private Investments AgencyAPIEX Angolan Investment and Export Promotion AgencyAU African UnionDFQF Chinese and Indian duty-free and quota-freeEBA Everything But ArmsECCAS Economic Community of Central African StatesEGS Environmental Goods and ServicesENA National Environmental StrategyEPP Environmentally Preferable Products EQSGS Environmental Quality Support Goods and ServicesEU European UnionFDI Foreign Direct InvestmentGDP Gross Domestic ProductGSP Generalized System of PreferencesGRN National Reconstruction OfficeGVC Global Value Chainsha HectareHS Harmonized SystemIANORQ Angolan Institute for Standardization and QualityIQM Internal Quality Management SystemsISO International Standards OrganizationKg Kilogramkm KilometersLDC Least Developing CountriesMINAMB Angolan Ministry of EnvironmentMINCO Angolan Ministry of CommerceMIND Angolan Ministry of IndustryMINPESCAS Angolan Ministry of FisheriesNGER National Green Exports ReviewNTMs Non-tariff measuresOPEC Organization of the Petroleum Exporting CountriesPAEA National Environmental PlanPNGA National Environmental Management Programmeprsvd PreservedPSM Product Space MethodologyRCA Revealed Comparative AdvantageREC Regional Economic CommunitiesSADC Southern African Development CommunitySADCAS SADC’s Accreditation SystemSDG Sustainable Development GoalsSME Small and Medium EnterprisesSPS Sanitary and Phytosanitary measuresSWOT Strengths, Weaknesses, Opportunities, and ThreatsTBT Technical Barriers to TradeToP Training of PractitionersToT Training of Trainers UNPAF United Nation Partnership FrameworkUS United States of AmericaUSD United States DollarsWTO World Trade OrganizationYoY Year-Over-Year
vi
EXECUTIVE SUMMARY AND INTRODUCTION
The 2030 Agenda for Sustainable Development and the Sustainable Development Goals (SDGs) suggest that to achieve sustainable development, a country must cover all three dimensions of sustainability – economic, social and environmental – simultaneously. In this context, international trade is expected to play an important role as a means – especially in developing countries and countries with economies in transition – to achieve the SDGs because it can be used as an enabler for reducing the environmental footprints of economic activities, for ensuring the sustainable use of natural resources, and for improving economic welfare and poverty alleviation efforts. From this perspective, UNCTAD has launched its National Green Exports Review (NGER)1 initiative, which is a tool to facilitate the transition of countries to a greener and cleaner development path.
Through NGERs, UNCTAD works in close partnership with countries seeking to strengthen their green economies. NGERs assist these countries to develop and implement green economy policies, to diversify the local economy and to establish regulatory and institutional frameworks and cooperative mechanisms to strengthen and increase local capacity, efficiency and competitiveness of green sectors. Hence, NGERs respond to a country’s demand for assessments of local potential to develop collaboratively selected green sectors at national level that can generate new employment and export opportunities while promoting national sustainable development (UNCTAD, 2017a).
NGERs are demand-driven; therefore, any NGER project necessarily involves an official request from a government to start a project. UNCTAD will then, in consultation with the designated national entity nominated by the inviting government, conduct a baseline study – such as this one – containing trade statistics and relevant regulatory and institutional frameworks related to the green economy. The baseline report presents an overview to guide not only national stakeholder discussions but also to assist them in designing an action plan and trainings to promote economic diversification and a more sustainable economy. Therefore, the expected results of a NGER are (UNCTAD, 2017a):• Enhanced collaboration among sectoral stakeholders through collaborative activities and partnerships
formed by the project;• Improved understanding of national strengths and weaknesses for the production and export of
selected green products and related value chains;• Appreciation by policymakers of ways to create an enabling environment for the development of
green sectors and exports of green products and services;• An action plan validated by stakeholders to advance the adoption of sustainable production techniques
and the promotion of promising green products and their value chains; and• Positive socioeconomic and environmental impacts at local and national levels.
In short, the NGER process can help local stakeholders – public and private – to reformulate policies and institutions in order to diversify the local economy and leverage regional and global trade opportunities.
In addition, the NGER conducted in Angola includes, as one of its core objectives, capacity building activities that aim to train staff at the Ministry of Commerce2 (MINCO) and other relevant key stakeholders in the analysis of green export opportunities. The overall outcomes are: 15 trainers trained, a set of policy recommendations, a country report validated with national stakeholders, training material (e.g. Green Products and Services Factsheets) for at least 200 people, and a set of potential actions for fostering local green products and services.
NATIONAL GREEN EXPORT REVIEW OF ANGOLA – BASELINE REPORT:
1WOOD, FISH, AND COFFEE
1. GREEN EXPORTS: OPPORTUNITIES AND BENEFITS IN THE REPUBLIC OF ANGOLA
This baseline report evaluates green sectors already in place in the Republic of Angola and works as a background document and a step-by-step guideline to support discussions at national level with local stakeholders. Evaluation and identification of sectors will take place initially using a Revealed Comparative Advantage (RCA) analysis of green sectors with expansion potential in Angola. In short, the baseline report aims to present a panorama of key issues related to local green sectors, with attention given to enhancing their regulatory, institutional and trade-related performance. As such, the baseline report operates as a supporting document for discussion among local stakeholders on strategic approaches to further the development of Angola’s green products and services and their related sectors based on a collaborative, inter-sectoral, and strategic approach.
It is important to mention that selected sectors covered in this baseline report include those sectors in which Angola has already achieved considerable experience, but further growth can be achieved. The intention is to use them as stepping-stones to prepare national consultant(s) and to promote local stakeholder workshops, which will serve as training activities and canvass a wide spectrum of viewpoints by collaboratively identifying and selecting new options of green products and services for Angola and develop sectoral action plans. In addition, they guarantee that this inter-sectoral forum will undertake follow-up measures for further implementation of the NGER process with UNCTAD’s support.
1.1 Transition to a more sustainable and resilient economy through trade
Across countries, transitions to a greener economy are expected to make increasing contributions to economic diversification, employment creation, export earnings, poverty alleviation, and to environmental protection and social equity. A greener economy is driven by both domestic and foreign demand for green products and services. However, it includes the use of more efficient and low-carbon energy and
transportation as well as the incentive to undertake organic agricultural production, ecotourism activities, waste and water recycling, environmental practices, and other emerging categories such as green construction, sustainably harvested timber products and natural fibers (UNCTAD, 2017a).
Looking specifically at trade, green products represent just a small fraction of their “brown” counterparts indicating a vast potential for growth. Whether in high-tech goods, commodities, basic manufactures or services, the export opportunities offered in a greening global economy are significant and expanding faster than overall global trade; a trend that is expected to continue (UNCTAD, 2017b).
There is a large untapped potential for developing countries and countries with economies in transition to advance the development of their green sectors. In this context international trade, through exports and imports of green goods and services, can facilitate the expansion of green sectors already in place and the development of new sectors based on local potential. Despite formidable challenges, undertaking this transition successfully can help countries to improve their competitive advantage, diversify the local economy and engage in international trade more effectively.
Principal approaches towards this goal rely on the creation of an enabling environment through improved regulatory and institutional frameworks for a greener economy, which include productive capacity building, investment and related financial services. In addition, these improved regulatory and institutional frameworks involve more open trade, with greater attention to social equity, poverty alleviation and environmental protection. Hence, green products and services can be used to enhance market access and investment opportunities. For example, green products related to renewable energy technologies such as solar panels and wind turbines and energy efficient products (e.g. compact fluorescent lamps) are among the products seeing the sharpest rise in exports during the last years (ITA, 2016; UNCTAD, 2017b). Although relatively few developing countries are participating directly in this trend, green technologies are often produced in developed and/or more industrialized developing countries using intermediate inputs originating from a wide variety of developing countries and countries with economies in transition that are integrated in global supply chains. Trade in intermediate goods, which accounts for about 40 per cent of world merchandise trade, is thus an important entry point for
2 NATIONAL GREEN EXPORT REVIEW OF ANGOLA – BASELINE REPORT:
these countries to supply indirectly to green markets (UNCTAD, 2011). Participation in intermediate tiers of supply chains has the potential to generate economy-wide gains, such as employment, improvement in technology and skills, productive capacity upgrading, and diversification into value-added exports. In addition, other green products based on organic agriculture have experienced global growth and are within reach of least developing countries like Angola.
While businesses in more industrialized developing countries are seizing new export opportunities for green products and services, especially green technologies, businesses in less industrialized developing countries continue to build their export capacities in green products, such as organic produce and beverages, natural cosmetics and fibers, biofuels, and sustainably harvested timber and fisheries products, and in green services, such as ecotourism. In each of these sectors developing country exports are experiencing sharp growth, employment, advancement of rural development and protection of the environment (UNCTAD, 2017b).
Dynamic green sectors can make important contributions towards the achievement of national development objectives relating to economic diversification, investment, poverty reduction, rural development, employment generation and an overall improvement of social welfare. Consequently, they can also make significant contributions to the SDGs.
1.2 Green sectors and their products and services in a national economy
There is no internationally agreed definition of what green sector, product and service are. However, it is generally agreed that they can be often considered as part of the Environmental Goods and Services (EGS) category since increasing access to and use of a green product and service can contribute to improving environmental quality and pollution abatement. Therefore, the majority of green products or services generally fall into one of two categories (OECD, 2001):• First category mostly covers products used to
provide an environmental service associated with wastewater treatment, solid waste management, and air pollution control. Related green products include a wide variety of industrial goods such as valves, pumps, compressors, etc. that can be specifically employed for environmental purposes. Such products and services sometimes are
mentioned as Environmental Quality Support Goods and Services (EQSGS) according to their end-use or purpose.
• Second category addresses products and services, from which production, end-use and/or disposal have reduced negative environmental impacts or, potentially, increased positive impact to the environment. In short, it considers a substitute of a traditional product or service that provides similar function and utility with less impact on the environment. This category also includes products and services that are generally used for purposes other than environmental ones. For example, related products may include items such as chlorine-free paper, renewable energy technologies, energy-efficient office machines, natural fiber packaging or floor covering materials, and a wide range of services associated with sustainable forestry and fisheries, organic agriculture, renewable energy transport, and ecotourism. Such products and services are sometimes referred to as Environmentally Preferable Products (EPPs), which have inherent environmentally superior qualities when compared to substitute goods.
While the first category defines a green product or service as one that is used to benefit the environment without considering its life-cycle, the second category defines as it as virtually any product or service, whatever it may be, as long it is a “greener” variant of a traditional counterpart. In short, they are considered green simply by having less of a negative impact on the environment than its traditional equivalent. Therefore, a green product variant could, for example, be manufactured from recycled components, be manufactured using renewable energy, be supplied to the market with less wasteful packaging, etc., or cover all options. The same logic applies to a service, for example, traditional tourism versus ecotourism.
When it comes to consumers’ perception of green products and services, there is a correlation between the confidence of consumers in the performance of green products and their pro‐environmental beliefs in general. This suggests that most consumers cannot easily identify greener products without access to information related to the product’s environmental benefits, although they would favor products manufactured by well-known greener companies (Pickett‐Baker and Ozaki, 2008).
The majority of green products and services are easily associated with EGS; however, green products
3WOOD, FISH, AND COFFEE
and services go beyond that. They can also include products and services that are related to improving economic welfare, gender equality, poverty alleviation efforts, and the decline of child labor. Examples of these socioeconomic benefits are goods produced or services provided by poor rural communities through fair trade schemes or ecotourism initiatives. This is because the income from the sale of these goods and services generates employment in poor rural communities thereby reducing poverty together with better positioning and empowerment to sustainably manage rural ecosystems, local natural resources and labor practices.
Other important characteristics of green products and services are their temporal relevance and local-based aspects. Regarding their temporal relevance, a green product or service today can be replaced for a greener one tomorrow and no longer is considered a green product or service. Regarding their local-based aspects, geopolitical context plays an important role in identifying local productive activities that allow improvements in economic welfare, gender equality, child labor decline, poverty alleviation efforts, among other country specific socioeconomic benefits. For example, developing countries may not be able to afford electric or semi-electric cars, but their people can greener the economy by carpooling, public transportation, riding bikes and reusing grocery bags, and so on.
In this context, green products and services can be
classified as anything that can be offered in a market that also promote local economy, assist achieving the SDGs and are used as an enabler not only for reducing the environmental footprints of economic activities but also for improving socioeconomic standards within the country. Hence, green sectors are much more than a source of income; they are drivers of socioeconomic transformation and environmental preservation.
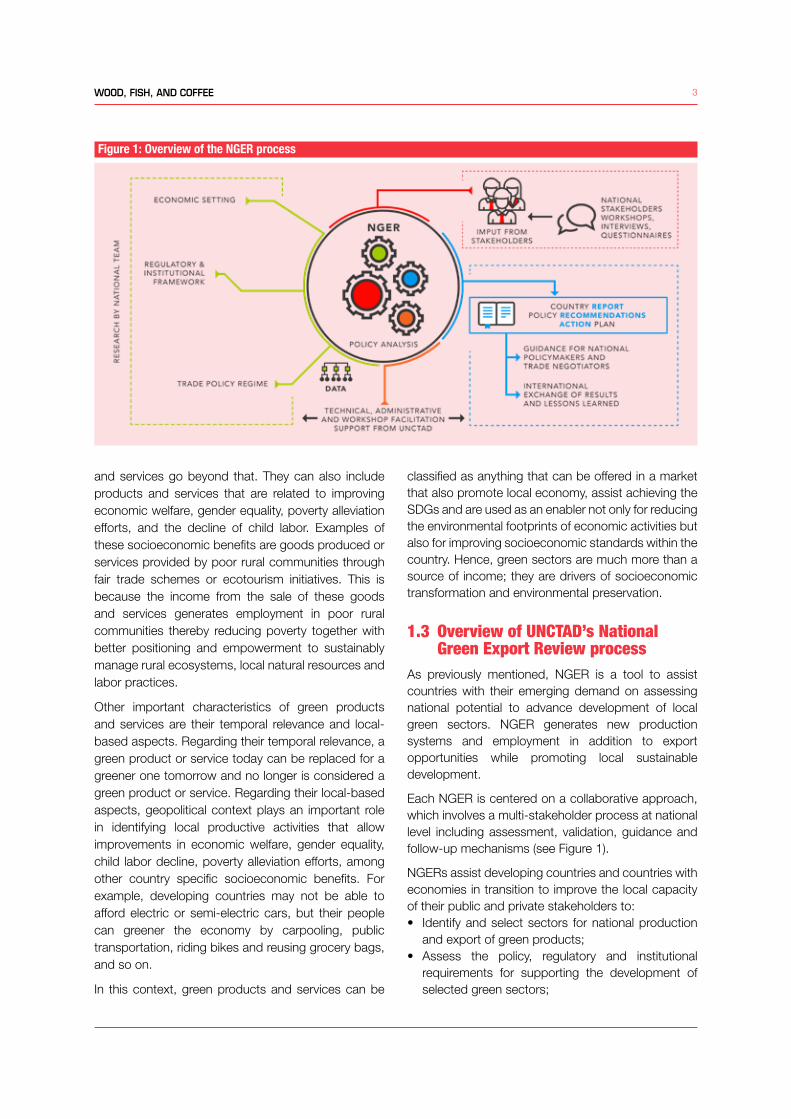
1.3 Overview of UNCTAD’s National Green Export Review process
As previously mentioned, NGER is a tool to assist countries with their emerging demand on assessing national potential to advance development of local green sectors. NGER generates new production systems and employment in addition to export opportunities while promoting local sustainable development.
Each NGER is centered on a collaborative approach, which involves a multi-stakeholder process at national level including assessment, validation, guidance and follow-up mechanisms (see Figure 1).
NGERs assist developing countries and countries with economies in transition to improve the local capacity of their public and private stakeholders to: • Identify and select sectors for national production
and export of green products;• Assess the policy, regulatory and institutional
requirements for supporting the development of selected green sectors;
Figure 1: Overview of the NGER process
4 NATIONAL GREEN EXPORT REVIEW OF ANGOLA – BASELINE REPORT:
• Prepare and adopt recommendations and action plan for building productive and export capacity in selected green sectors.
• Mobilize financial and technical support to implement the recommendations and action plan, which include mainstreaming them into national development plans and strategies.
UNCTAD’s green product space methodology assists national stakeholders in identifying green sectors with promising export prospects. The NGER process subsequently guides stakeholders through an interactive review of policy frameworks (e.g. economic, regulatory, institutional, environmental and trade policies) and local networks characterizing these sectors (Hamwey et al., 2013; UNCTAD, 2017a). By focusing on a particular green sector, an NGER has the potential of supporting national policymakers and other stakeholders – particularly businesses and entrepreneurs – to survey a range of important issues for the green sectors under study, such as:• National development objectives for the sector;• Areas of effectiveness and weakness in the current
policy framework for the sector;• Regulatory and institutional challenges inhibiting
sectoral development;• Innovative approaches to strengthening backward
and forward inter-sectoral linkages within the national economy;
• The role of women and youth in the sector and how employment conditions and opportunities can be improved going forward;
• The role of businesses and entrepreneurs in the sector and how to improve cooperation and build synergies along supply- and value-chains;
• The likely impacts of sectoral reforms on access to essential services, especially for the poor;
• Prospects for trade liberalization to generate increased efficiency, employment and access to foreign markets, particularly among small and medium enterprises (SMEs);
• Short-term adjustment costs and how to address them;
• The impact of trade liberalization on foreign and domestic investment;
• The overall impact of domestic reform and trade liberalization on sectoral development.
National teams – including two or more experts – with the support from UNCTAD work closely with local stakeholders to coordinate and conduct NGER activities and prepare progress reports. Stakeholders,
including national policymakers, are involved through direct interviews and roundtables, such as the national stakeholder workshops. This collaborative and intersectoral platform serves to define each NGER’s objectives and review findings and policy-relevant conclusions. In addition, results assist policymakers to design policy packages to support the development of local productive capacity and tap external markets for green products and services in which their country has demonstrated comparative advantage.
UNCTAD and the local government of beneficiary countries as well as other stakeholders will publish and disseminate the NGERs. Researchers, national decision-makers and trade negotiators in the wider trade and development community review and discuss NGER’s results through intergovernmental forums organized regionally and in Geneva, Switzerland. In turn, the dissemination processes allow the exchange of national experiences and best practices as well as of lessons learnt during NGER activities.
1.4 National Green Export Review process in the Republic of Angola
Being rich in resources but poor in capacity and skills creates a “dependency trap”. Low diversification and diminished capacity and skills, in turn result in a low competitive advantage of the Angolan economy as a whole and low earnings for its population (AfDB, 2017; ITA, 2017; UNCTAD, 2015a, 2015b, 2014). Local authorities have often used the country’s oil-dependency and limited economic diversification as the main reason to justify their resistance to opening up the Angolan market. This binding constraint contributes to the poor remaining poor since the problem of poverty remains closely intertwined with a lack of economic transformation in the country. Given this context, and in other to tackle this constrain, the Government of Angola launched, in January 2016, a strategic plan to invest in human capital, knowledge and technology and to tackle problems arising from low oil prices in international markets.
In the Strategy Angola 20253 and the National Development Plan4 (2013–2017), the government identified the need to promote and accelerate growth and competitiveness in Angola through economic diversification and poverty reduction (Republic of Angola, 2014). Taking that into consideration, the NGER process can assist local government and business in Angola in building economic resilience
5WOOD, FISH, AND COFFEE
to help the country to diversify its economy and to weather external shocks manifested in global oil price fluctuations. In short, the NGER process can help local stakeholders – public and private – to reformulate policies and institutions in order to diversifying local economy and leverage regional and global trade opportunities.
In order to improve local capacity and skills, the Angola NGER process has as one of its core objectives a capacity building goal that aims to train staff at MINCO and other relevant key stakeholders in the analysis of green export opportunities, especially with trade partners in Southern Africa.
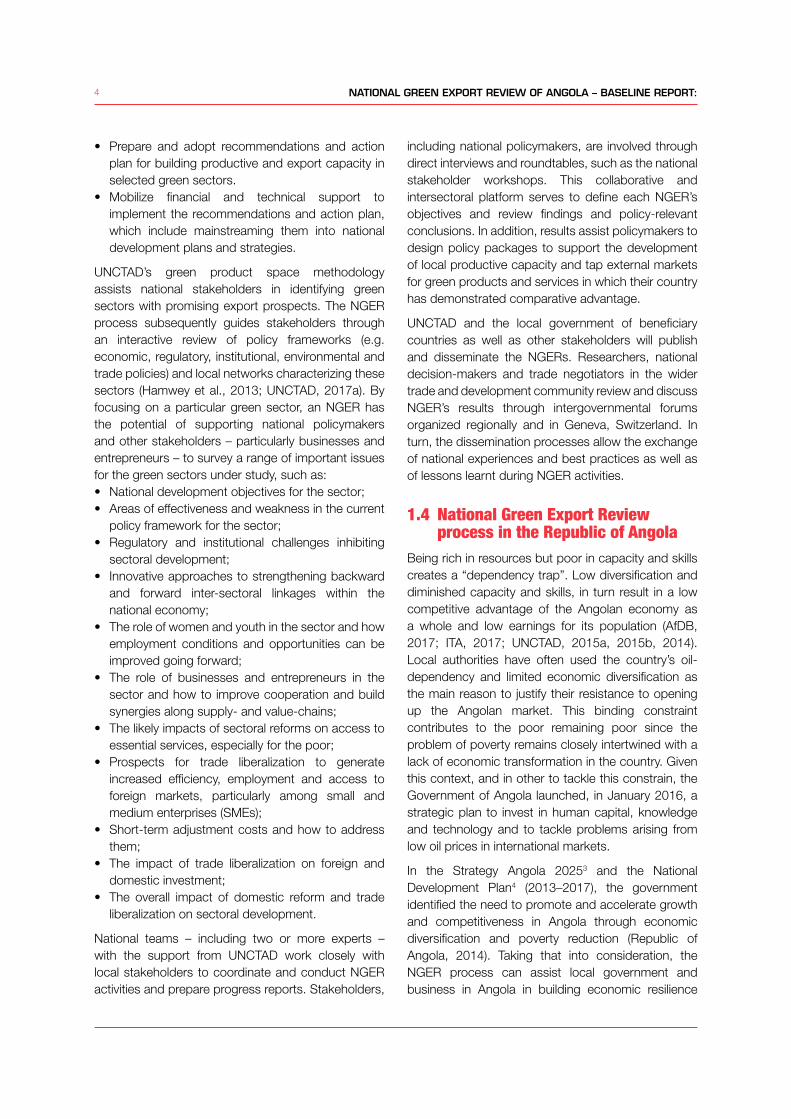
The Angola NGER presents two steps. While step one consists of activities related to defining the Angolan National Team and conducting the Training of Trainers (ToT), step two consists in the Training of Practitioners (ToP) through countrywide training courses (e.g. sector-specific training modules).
The step one consists of an analysis based on the baseline report and stakeholder discussions, which provides a starting point for the training of the national team and of trainers that will replicate the knowledge at national level. The National team includes two or more experts working closely with national stakeholders and UNCTAD to coordinate and conduct the NGER activities in STEPs 1 and 2. National trainers are responsible for countrywide training courses in STEP
2 under the supervision and guidance of the National Team.
The training activities in step one are part of the ToT component of the Angola NGER, which is divided into three training streams:• Training Stream 1: training of the national team;• Training Stream 2: training of national trainers on
data collection and systematization, trade analysis, analytical tools and methods;
• Training Stream 3: training of national trainers on reporting, validation methods, policy mechanisms, presentation techniques, and course plan development.
Throughout step one, UNCTAD organizes two national training workshops with local stakeholders. The first training workshop launches the project and collects important information related to key green products and their value-chains that are used to feed data into Training Stream 2 and create a preliminary national study. During the second training workshop, the national team and trainees with the support of UNCTAD presents the preliminary study for validation and adjustments at a national forum. The workshop’s outcomes are fed into the Training Stream 3 and produce a country report containing a set of policy recommendations. The overall outcomes of step one are 15 trainers trained, a set of policy recommendations, a country report validated with
DATA
ACTIVITY FLOW DURING STEP 1 OF THE ANGOLA NGER
FORMAL ACCEPTANCEBY UNCTAD
NATIONAL FOCAL POINT (NFP)
BASELINE REPORT TRAINING OF TRAINERS(STREAM 1)
NATIONAL TEAMESTABLISHEDAND TRAINED
ASSESSMENT ROUNDTABLE BETWEEN UNCTAD, NFP
AND KEY STAKEHOLDERS
TRAINING OF TRAINERS(STREAM 2)
TRAINING OF TRAINERS(STREAM 3)
SECOND NATIONALTRAINING
WORKSHOP WITH LOCAL
STAKEHOLDERS
FIRST NATIONAL TRAINING
WORKSHOP WITH LOCAL
STAKEHOLDERS
COUNTRY REPORT
POLICYRECOMMENDATIONS
PRELIMINARYNATIONAL
STUDY
DISSEMINATION AT LOCAL, REGIONAL AND INTERNATIONAL FORUMS
OUTPUTS OF STEP 1:
15 TRAINERS TRAINED SET OF POLICY RECOMMENDATIONSCOUNTRY REPORTTRAINING MATERIAL: GREEN PRODUCTS AND SERVICES FACTSHEETSPOTENTIAL ACTIONS TO FOSTER LOCAL GREEN PRODUCTS AND SERVICES
INPUT FROMSTAKEHOLDERS
COUNTRYREQUEST
Figure 2: Activity flow during STEP 1 of the Angola NGER
6 NATIONAL GREEN EXPORT REVIEW OF ANGOLA – BASELINE REPORT:
national stakeholders, training material (e.g. Green Products and Services Factsheets), and a set of potential actions for fostering local green products and services. Figure 2 shows the activity flow during step one and its associated components.
While in step one UNCTAD is active in training the trainers, in step two its active position is replaced by a supporting role for the ToP component, in which UNCTAD and the National Team back up local trainers – who were trained during ToT component – on their training activities of at least 200 people in Angola. The ToP component of the step two will consist of training modules on: • Technical Barriers to Trade (TBT) such as standards
and certifications;
• Private standards;• Sanitary and phytosanitary measures (SPS); and• Non-tariff measures (NTMs) of relevance to green
products.
The training modules also include related domestic economic policies, such as:• Regulatory and institutional frameworks and
cooperative mechanisms;• Product and sustainability certification, labeling and
traceability requirements;• Organic and fair-trade labels;• Use of geographical indications, sectoral
trademarks and branding to enhance market demand while strengthening local capacity, efficiency and competitiveness.
7WOOD, FISH, AND COFFEE
2. POLICY FRAMEWORK IN ANGOLA
At a time of pressing social and environmental challenges, harnessing economic growth for sustainable and inclusive development is more important than ever (UNCTAD, 2015c). Identifying leverage points for that in the current policy framework is, therefore, a priority to any baseline study.
Policies, laws, regulations and standards applicable to green products and sectors are very broad and, depending on the case, are spread through various sources of regulation. However, there are key types of regulations that can affect exports of green products and they are:• Environment Policy;• Development Policy;• Trade Policy;• Licenses;• Non-tariff measures, such as TBT, SPS, and private
standards;• Subsidies provided to local producers;• General economic command and control
instruments.
2.1 Environmental frameworkThe Constitution of the Republic of Angola from 2010 provides the basis for the Environment Framework Law through Article 39:• Everyone has the right to live in a healthy and
unpolluted environment and the duty to defend and preserve it.
• The State shall take the necessary measures to protect the environment and species of flora and fauna throughout the national territory, maintain the ecological balance, ensure the correct location of economic activities and the rational development and use of all natural resources, within the context of sustainable development, respect for the rights of future generations and the preservation of species.
• Acts that endanger or damage conservation of the environment shall be punishable by law.
In addition, Article 90 reads that the State shall promote social development by ensuring that all citizens enjoy the benefits resulting from collective efforts in terms of development, specifically with regard to quantitative and qualitative improvements to standards of living.
These two constitutional Articles are extremely
important for fostering local sustainable development since they imply improvements in the quality of life of people as well as their environment. Hence, the sustainable use of the environment is recognized as an important dimension of development by the Angolan government. In this context, Angola has developed comprehensive environmental legislation in the last decade regarding water resources, petroleum extraction, mining activities, and land uses, and has increased engagement with regional and international bodies and partners.
Another important legislation is the Environment Framework Law5 from 1998, which provides the framework for all environmental legislation and regulations in Angola. It gives the definitions of important concepts, such as protection, preservation and conservation of the environment.
The establishment of the Ministry of Environment6 (MINAMB) in 2009 gave the environmental sector fundamental institutional support to promote the country’s environmental strategies such as the National Environmental Management Programme7 (PNGA) and the National Environmental Plan8 (PAEA).
Importantly, the Environment Framework Law recognizes that the implementation of the PNGA should be the responsibility of all sectors of government whose activities may have an influence on the environment, all private individuals and organizations that make use of natural resources, as well as those individuals who may use resources unsustainably and cause pollution. The PNGA has five strategic subprograms, defined as:• Promotion of intersectoral coordination;• Protection of biodiversity, flora and terrestrial and
marine fauna;• Ecosystem rehabilitation and protection;• Environmental management; and• Environmental education, information and
awareness.
The National Environmental Strategy9 (ENA) is a guiding framework closely related to the PNGA, which aims to identify the main environmental problems in Angola and address them in order to achieve the sustainable development goals. There are other relevant sectoral legislations that complement the Environment Framework Law, which are listed in Annex 1 and show the intersectoral characteristics of the environmental dimension in Angola (Walmsley and Patel, 2011).
8 NATIONAL GREEN EXPORT REVIEW OF ANGOLA – BASELINE REPORT:
2.2 Development frameworkAngola’s oil and gas resources have become the main source of public revenue, but they also create significant challenges for macroeconomic stabilization and economic diversification. The booming oil and gas industry creates wealth in related sectors (i.e. finance, hospitality, and other industries that provide services to oil and gas companies) but it also makes it more costly for everyone to do business in every sector of local economy (WBG, 2017a).
Rather than targeting poverty reduction explicitly, the Angolan government has focused on large infrastructure and public works projects (AfDB, 2017). These projects are administered through the National Reconstruction Office10 (GRN), which was created in 2004. This focus on the “hardware” of development contrasts with the “software” approach taken by many international nongovernmental groups, which stress that Angola is going through its rehabilitation phase, which happens before the necessary development phase. As a result, structural transformation remains low in Angola, especially because the economy is dominated by oil and gas sectors with around 31 per cent of Gross Domestic Product (GDP)11 in 2015 (AfDB, 2017; CFR, 2008).
The country’s economic base remains narrow with oil accounting for over 96 per cent of total export revenue, 52 percent of government revenues and 30 percent of national GDP (AfDB, 2017; ITC, 2017). As a result of the currency depreciation, GDP per capita has decreased from USD 6,014 in 2014 to USD 4,714 in 2015 and it is expected to fall to USD 3,514 in 2016, the lowest level in a decade, thus aggravating the country’s economic fragility (AfDB, 2017; UNCTAD, 2017c).
Considering that agriculture represents only 13 per cent of the Angolan GDP, green products can represent an important enabler for local development because they have the potential to help leapfrogging the country from the required rehabilitation phase directly to sustainable development stage; especially, when focusing on products related to agriculture and fisheries sectors, which employ 70 per cent of the economically active population (AfDB, 2017). In addition, the majority of the Angola’s population lives and works in rural areas. Hence, rural development is the main driver of poverty reduction and will be essential to achieving the SDGs. However, this does not mean that urban development can be ignored. Sustainable development and poverty
eradication clearly require both; and, even for rural economies, the relationship with urban areas is a key consideration. Many rural households depend on urban markets or remittances from urban migrants. Equally, rural-urban migration is an important for urban economies, at best providing an urban workforce for industrial development, but at worst – when it results from failing rural economies – fuelling unsustainable urbanization, increasing urban poverty and exacerbating strains on social infrastructure (UNCTAD, 2015a)la Conferencia de las Naciones Unidas sobre Comercio y Desarrollo (UNCTAD).
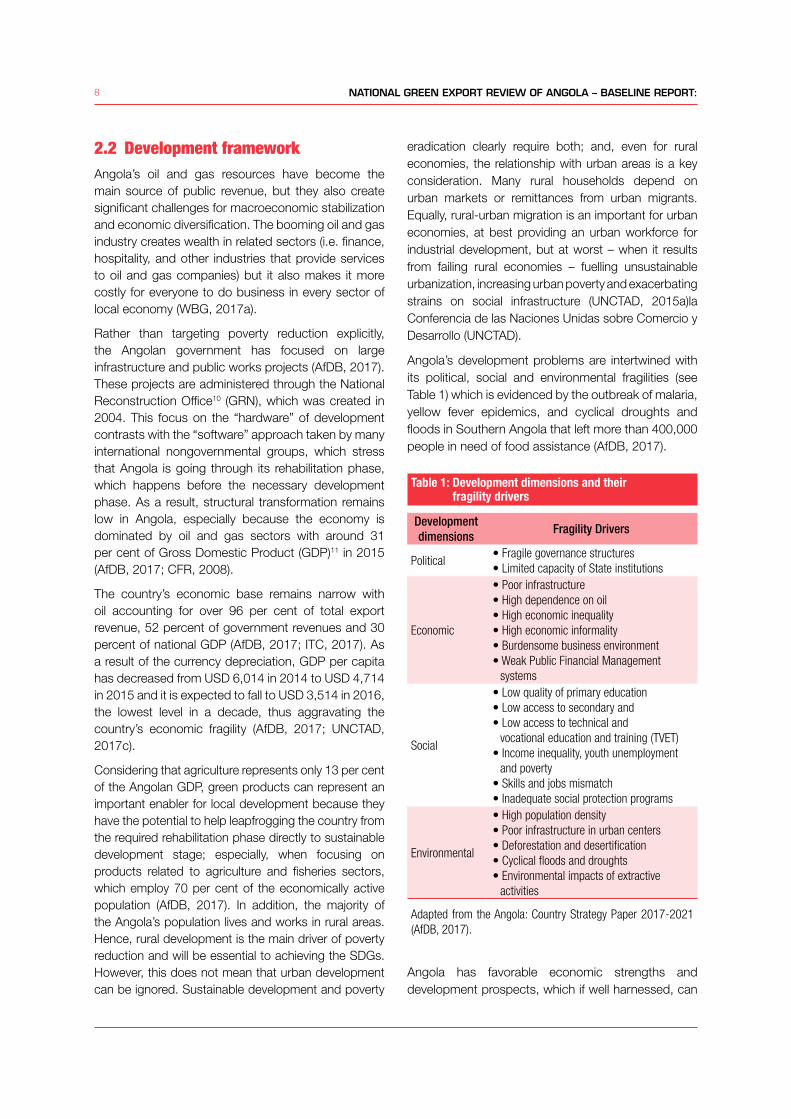
Angola’s development problems are intertwined with its political, social and environmental fragilities (see Table 1) which is evidenced by the outbreak of malaria, yellow fever epidemics, and cyclical droughts and floods in Southern Angola that left more than 400,000 people in need of food assistance (AfDB, 2017).
Table 1: Development dimensions and their fragility drivers
Development dimensions
Fragility Drivers
Political• Fragile governance structures• Limited capacity of State institutions
Economic
• Poor infrastructure• High dependence on oil• High economic inequality• High economic informality• Burdensome business environment • Weak Public Financial Management
systems
Social
• Low quality of primary education• Low access to secondary and • Low access to technical and
vocational education and training (TVET)• Income inequality, youth unemployment
and poverty • Skills and jobs mismatch • Inadequate social protection programs
Environmental
• High population density• Poor infrastructure in urban centers • Deforestation and desertification • Cyclical floods and droughts• Environmental impacts of extractive
activities
Adapted from the Angola: Country Strategy Paper 2017-2021 (AfDB, 2017).
Angola has favorable economic strengths and development prospects, which if well harnessed, can
9WOOD, FISH, AND COFFEE
promote inclusive and broad structural transformation nationally. Major opportunities are (AfDB, 2017):• Agricultural potential: Investments in agro-poles
and agro-industries through provision of lines of credit to private sector can help boost local food production and exports. It is also important to include small-scale farming activities and organic farming through cooperative networks;
• Natural resources: The sustainable exploration of natural resources, such as, arable land and water to sustain agribusiness, and promotion of local potential in tourism, forestry and fisheries can help Angola create value-adding activities, generate jobs and reduce poverty;
• Regional integration: Angola can take advantage of its ports as well as the untapped regional market to boost intra-regional trade, in particular through its Regional Economic Communities (RECs).
Despite the country’s development potential, there are persistent structural challenges that hinder inclusive growth, notably: low agricultural productivity; inadequate infrastructure; limited qualified human resources – in particular in business management, science and technology, construction, and manufacturing sectors –; weak trade facilitation and export support systems; and challenging business environment (AfDB, 2017; UNCTAD, 2016a).
The development framework in Angola relies essentially on the strategic national documents, namely the Constitutional Law of Angola, the Strategy Angola 2025 and the National Development Plan (2013-2017), which guarantee an inclusive approach to all citizens for the reduction of poverty based on human rights and pays particular attention to the most vulnerable groups in society. In 2015, the Angolan Government signed the Action Plans for the implementation of the United Nation Partnership Framework (UNPAF 2015-2019), which has the objective to support and extend until 2019 the objectives in the National Development Plan for the period between 2013 and 2017 (UNDP, 2015).
2.3 Trade frameworkAngola is a founding member of the World Trade Organization (WTO). It is currently engaged in the Doha Round trade negotiations, and, as a Least Developed Country (LDC), has been exempted from making reduction commitments in the substantive negotiating areas of agriculture, manufacturing and
services. Like most LDCs, Angola lacks the human and institutional capacity to implement the many WTO obligations and requires technical assistance from international institutions and its trading partners. Regionally, it is a member of the African Union (AU), Southern African Development Community (SADC), Economic Community of Central African States (ECCAS) and African, Caribbean and Pacific States (ACP) (UNCTAD, 2016b).
Within the framework of SADC, Angola has been negotiating an economic partnership agreement with the European Union (EU). Like other SADC countries12, Angola has refused to commit to signing the interim agreement because of outstanding contentious issues, including “substantially all trade”, the “most-favored-nation clause”, “development cooperation”, “bilateral safeguards” and “rules of origin”. Angola as a LDC continues to benefit from duty-free, quota-free access to the EUROPEAN UNION market through the Everything But Arms (EBA) initiative, which is a sub-scheme of the Generalized System of Preferences (GSP) (EU, 2017; UNCTAD, 2016b). In this context, Angola enjoys preferential market access, mainly for its oil exports, from the EUROPEAN UNION’s EBA initiative, the United States African Growth and Opportunity Act (AGOA) and more recently from the Chinese and Indian duty-free and quota-free (DFQF) market access schemes introduced in 2008. Currently, Angola’s main export markets are China and the United States (US) (UNCTAD, 2016b).
The Government of Angola is determined to overcome its dependence on a single commodity as its main source of economic growth. Thus, local government is focusing on economic diversification as a new source of income as well as to reduce its dependence on imports. While Angola has prioritized the development of agriculture and agro-industry, fisheries, and manufacturing as part of its diversification strategy, it requires support tools like NGER to upkeep its success. The government’s strategy also focuses on encouraging SMEs, increasing investments in infrastructure to reduce transaction costs, and improving the country’s economic competitiveness. Angola has also embarked on deregulation and liberalization of its services sector. An example of this initiative is the program for business promotion from the National Private Investments Agency13 (ANIP), which aims to increase the competitiveness of the Angolan economy in relation to its partners in sub-Saharan Africa (UNCTAD, 2016b).
10 NATIONAL GREEN EXPORT REVIEW OF ANGOLA – BASELINE REPORT:
In addition, the Government of Angola has formulated strategies for the period between 2010 and 2025, which include fast-tracking economic growth, promoting sustainable development and reducing poverty and regional inequalities. The strategy also states that the public sector shall assume an active, regulatory role, and defines strategic programs and policies and macroeconomic policies, while emphasizing that the private sector is what mainly drives economic growth (UNCTAD, 2016b). In short, the strategy document states as main objectives: stability, rebuilding and upgrading infrastructure, rebuilding the trade network, supporting the private sector, creating employment and income, and reactivating the rural economy (UNCTAD, 2016b).
Focusing on agriculture, local government, in partnership with the private sector, is using a combination of import substitution and export development measures to implement the following key objectives (UNCTAD, 2016b):• Creation of incentives for private sector participation
and reducing State intervention; • Increasing State investment;• Strengthening the productive capacities of national
producers and supplying basic services;• Strengthening institutional and human capacities to
support the rural sector;• Socioeconomic development to support
communities of small scale farmers;• Reconstruction of rural infrastructure;• Distribution of seeds and tools;• Assistance to farmers in gaining access to land
and acquisition of appropriate technology for production.
Focusing on industry and manufacturing, the government has put in place a reindustrialization strategy with four key components (UNCTAD, 2016b):• Building primary sector and labor-intensive
industries aimed at meeting the basic needs of Angolans, creating a significant number of jobs, achieving better income distribution, increasing purchasing power and generating higher levels of savings;
• Redeveloping import-substituting industrial sectors in which the country previously had significant production capacity, such as drinks, textiles and clothing, dairy products, processed fish products, milling, vegetable oils and derivatives, rice-hulling, tire and inner tube manufacture, construction materials, wood products and furniture, fertilizers
and plastics;• Promoting industries producing exportable goods
that may have present or potential comparative advantage, focusing on oil derivatives, non-metallic minerals, wood and its products, textiles, sugar and its products, paper pulp, tobacco and processed tobacco, decorative and semi-precious stones, non-ferrous metals and vegetable oils;
• Developing large-scale technology-intensive industrial projects using Foreign Direct Investment (FDI) and a cluster strategy, including in petrochemicals, refined petroleum, aluminum processing, liquid natural gas, methanol and ammonia.
Currently, Angola’s trade regime is relatively open to international trade and local government uses tariffs as its main trade policy tool. Regarding NTBs, product standards – which are more stringent in developed country markets – are also a growing problem in Angola and efforts to address it have not been successful in Angola. It is important to mention that NTBs are also a growing problem among SADC’s member states. The main problems associated with NTBs are inefficiencies in transport, customs and logistics, which raise trade costs; cumbersome fiscal arrangements at border posts; and restrictive rules of origin and technical regulations and standards (UNCTAD, 2016b). As a direct result, Angola is not effectively participating in regional trade integration.
2.4 Certification and standardization framework
Angola is not a full member of the International Standards Organization (ISO), but has been a corresponding member since 2002. The Angolan Institute for Standardization and Quality14 (IANORQ) within the Ministry of Industry15 (MIND) coordinates the country’s establishment and implementation of standards.
While Angola does not yet have a fully developed national standards regime, there is an increased focus in this area to support the government’s efforts to build domestic production capacity and promote exports. For example, in July 2015, ASTM International16 signed a memorandum of understanding with IANORQ that should contribute to the consistently growing strength of standards in Angola.
Regarding conformity assessments, Angola does not have a national accreditation body. Although a
11WOOD, FISH, AND COFFEE
member of SADC, Angola is not a member of SADC’s Accreditation System (SADCAS) that provides regional accreditation support. However, Angola is an affiliate to the International Electrotechnical Commission that publishes consensus-based International Standards and manages conformity assessment systems for electric and electronic products, systems and services.
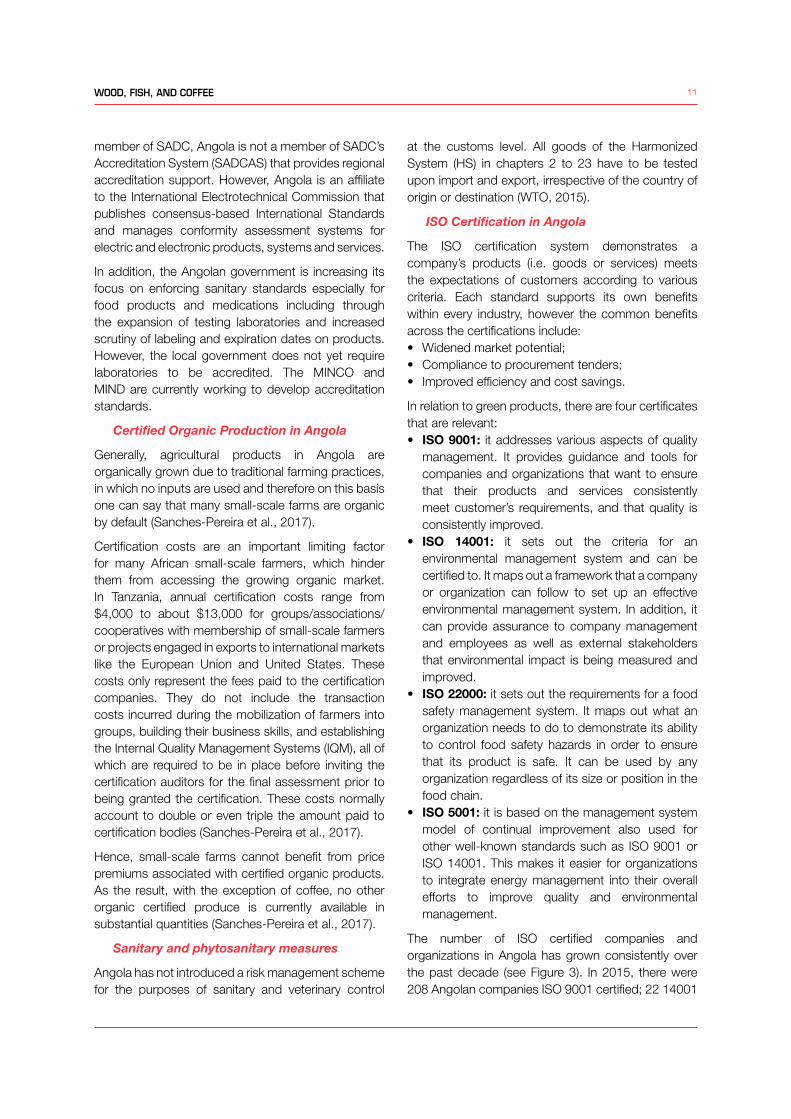
In addition, the Angolan government is increasing its focus on enforcing sanitary standards especially for food products and medications including through the expansion of testing laboratories and increased scrutiny of labeling and expiration dates on products. However, the local government does not yet require laboratories to be accredited. The MINCO and MIND are currently working to develop accreditation standards.
Certified Organic Production in Angola
Generally, agricultural products in Angola are organically grown due to traditional farming practices, in which no inputs are used and therefore on this basis one can say that many small-scale farms are organic by default (Sanches-Pereira et al., 2017).
Certification costs are an important limiting factor for many African small-scale farmers, which hinder them from accessing the growing organic market. In Tanzania, annual certification costs range from $4,000 to about $13,000 for groups/associations/cooperatives with membership of small-scale farmers or projects engaged in exports to international markets like the European Union and United States. These costs only represent the fees paid to the certification companies. They do not include the transaction costs incurred during the mobilization of farmers into groups, building their business skills, and establishing the Internal Quality Management Systems (IQM), all of which are required to be in place before inviting the certification auditors for the final assessment prior to being granted the certification. These costs normally account to double or even triple the amount paid to certification bodies (Sanches-Pereira et al., 2017).
Hence, small-scale farms cannot benefit from price premiums associated with certified organic products. As the result, with the exception of coffee, no other organic certified produce is currently available in substantial quantities (Sanches-Pereira et al., 2017).
Sanitary and phytosanitary measures
Angola has not introduced a risk management scheme for the purposes of sanitary and veterinary control
at the customs level. All goods of the Harmonized System (HS) in chapters 2 to 23 have to be tested upon import and export, irrespective of the country of origin or destination (WTO, 2015).
ISO Certification in Angola
The ISO certification system demonstrates a company’s products (i.e. goods or services) meets the expectations of customers according to various criteria. Each standard supports its own benefits within every industry, however the common benefits across the certifications include:• Widened market potential;• Compliance to procurement tenders;• Improved efficiency and cost savings.
In relation to green products, there are four certificates that are relevant:• ISO 9001: it addresses various aspects of quality
management. It provides guidance and tools for companies and organizations that want to ensure that their products and services consistently meet customer’s requirements, and that quality is consistently improved.
• ISO 14001: it sets out the criteria for an environmental management system and can be certified to. It maps out a framework that a company or organization can follow to set up an effective environmental management system. In addition, it can provide assurance to company management and employees as well as external stakeholders that environmental impact is being measured and improved.
• ISO 22000: it sets out the requirements for a food safety management system. It maps out what an organization needs to do to demonstrate its ability to control food safety hazards in order to ensure that its product is safe. It can be used by any organization regardless of its size or position in the food chain.
• ISO 5001: it is based on the management system model of continual improvement also used for other well-known standards such as ISO 9001 or ISO 14001. This makes it easier for organizations to integrate energy management into their overall efforts to improve quality and environmental management.
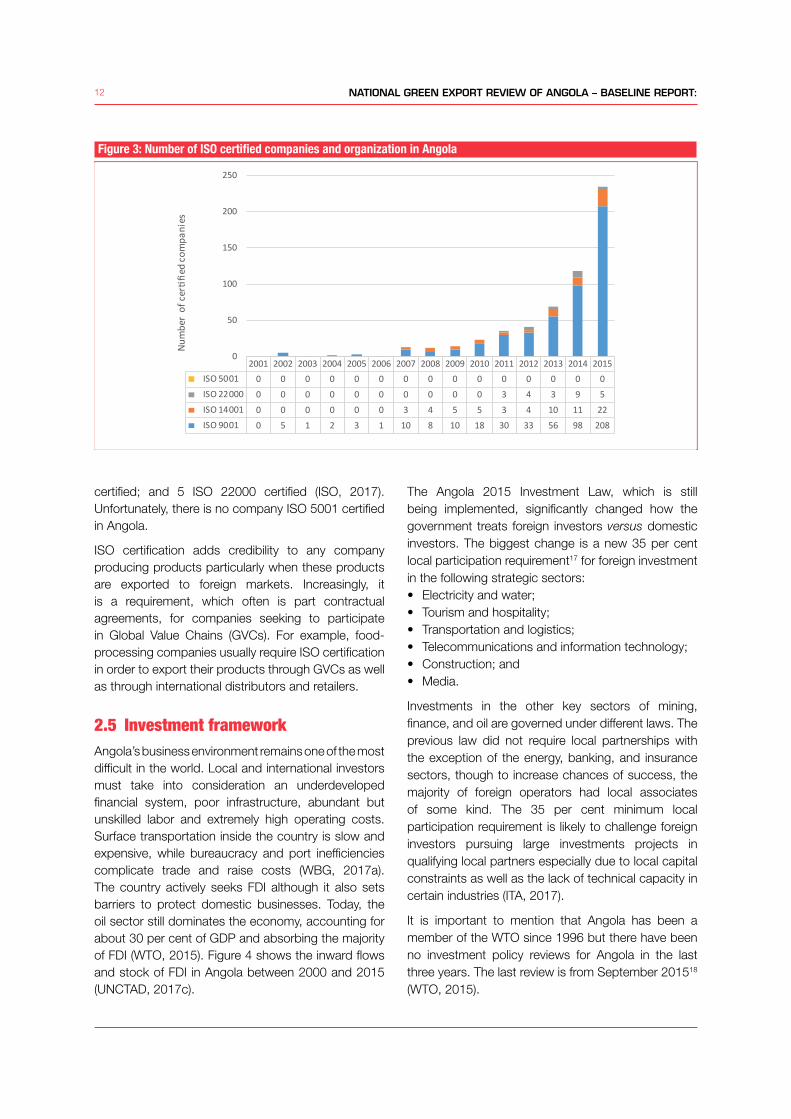
The number of ISO certified companies and organizations in Angola has grown consistently over the past decade (see Figure 3). In 2015, there were 208 Angolan companies ISO 9001 certified; 22 14001
12 NATIONAL GREEN EXPORT REVIEW OF ANGOLA – BASELINE REPORT:
certified; and 5 ISO 22000 certified (ISO, 2017). Unfortunately, there is no company ISO 5001 certified in Angola.
ISO certification adds credibility to any company producing products particularly when these products are exported to foreign markets. Increasingly, it is a requirement, which often is part contractual agreements, for companies seeking to participate in Global Value Chains (GVCs). For example, food-processing companies usually require ISO certification in order to export their products through GVCs as well as through international distributors and retailers.
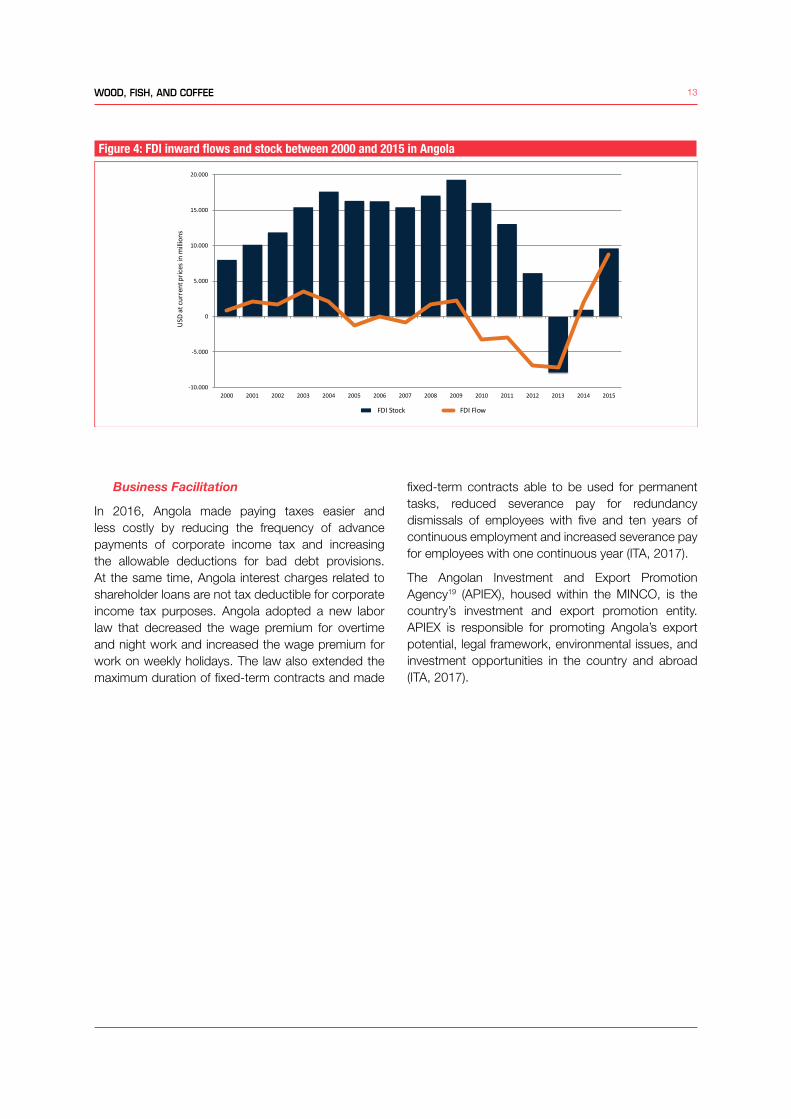
2.5 Investment frameworkAngola’s business environment remains one of the most difficult in the world. Local and international investors must take into consideration an underdeveloped financial system, poor infrastructure, abundant but unskilled labor and extremely high operating costs. Surface transportation inside the country is slow and expensive, while bureaucracy and port inefficiencies complicate trade and raise costs (WBG, 2017a). The country actively seeks FDI although it also sets barriers to protect domestic businesses. Today, the oil sector still dominates the economy, accounting for about 30 per cent of GDP and absorbing the majority of FDI (WTO, 2015). Figure 4 shows the inward flows and stock of FDI in Angola between 2000 and 2015 (UNCTAD, 2017c).
The Angola 2015 Investment Law, which is still being implemented, significantly changed how the government treats foreign investors versus domestic investors. The biggest change is a new 35 per cent local participation requirement17 for foreign investment in the following strategic sectors:• Electricity and water;• Tourism and hospitality;• Transportation and logistics;• Telecommunications and information technology;• Construction; and• Media.
Investments in the other key sectors of mining, finance, and oil are governed under different laws. The previous law did not require local partnerships with the exception of the energy, banking, and insurance sectors, though to increase chances of success, the majority of foreign operators had local associates of some kind. The 35 per cent minimum local participation requirement is likely to challenge foreign investors pursuing large investments projects in qualifying local partners especially due to local capital constraints as well as the lack of technical capacity in certain industries (ITA, 2017).
It is important to mention that Angola has been a member of the WTO since 1996 but there have been no investment policy reviews for Angola in the last three years. The last review is from September 201518 (WTO, 2015).
Figure 3: Number of ISO certified companies and organization in Angola
2001 2002 2003 2004 2005 2006 2007 2008 2009 2010 2011 2012 2013 2014 2015 ISO 5001 0 0 0 0 0 0 0 0 0 0 0 0 0 0 0 ISO 22000 0 0 0 0 0 0 0 0 0 0 3 4 3 9 5 ISO 14001 0 0 0 0 0 0 3 4 5 5 3 4 10 11 22 ISO 9001 0 5 1 2 3 1 10 8 10 18 30 33 56 98 208
0
50
100
150
200
250Nu
mbe
r of
cer�fie
d co
mpa
nies
13WOOD, FISH, AND COFFEE
Business Facilitation
In 2016, Angola made paying taxes easier and less costly by reducing the frequency of advance payments of corporate income tax and increasing the allowable deductions for bad debt provisions. At the same time, Angola interest charges related to shareholder loans are not tax deductible for corporate income tax purposes. Angola adopted a new labor law that decreased the wage premium for overtime and night work and increased the wage premium for work on weekly holidays. The law also extended the maximum duration of fixed-term contracts and made
fixed-term contracts able to be used for permanent tasks, reduced severance pay for redundancy dismissals of employees with five and ten years of continuous employment and increased severance pay for employees with one continuous year (ITA, 2017).
The Angolan Investment and Export Promotion Agency19 (APIEX), housed within the MINCO, is the country’s investment and export promotion entity. APIEX is responsible for promoting Angola’s export potential, legal framework, environmental issues, and investment opportunities in the country and abroad (ITA, 2017).
Figure 4: FDI inward flows and stock between 2000 and 2015 in Angola
-10.000
-5.000
0
5.000
10.000
15.000
20.000
2000 2001 2002 2003 2004 2005 2006 2007 2008 2009 2010 2011 2012 2013 2014 2015
USD
at c
urre
nt p
rices
in m
illio
ns
FDI Stock FDI Flow
14 NATIONAL GREEN EXPORT REVIEW OF ANGOLA – BASELINE REPORT:
3. TRADE AND ECONOMIC GROWTH IN ANGOLA
Angola has made substantial progress in economic and political terms since the end of the war in 2002. However, the country continues to face massive developmental challenges which include reducing the dependency on oil and diversifying the economy, rebuilding its infrastructure, improving institutional capacity, governance, public financial management systems, human development indicators and the living conditions of local population. Large pockets of the population still remain in poverty and without adequate access to basic services and could benefit from more inclusive development policies (AfDB, 2017; WBG, 2017b).
While inadequate institutional framework hinders diversification in the economy, the challenging local business environment inhibits growth of value-adding activities in the country (WBG, 2017a). As a result, oil and gas are by far the most important industries in Angola. Given the reliance on export earnings from the dominant oil industry, most economic activity is located in this sector. Even though oil export earnings will remain the country’s dominant source of FDI for years to come, its share will tend to decrease and other sectors must advance through economic
diversification in order to allow economic growth and stability (ITA, 2017).
3.1 Sustained long-term economic growth
Angola is important oil producing country and member of the Organization of the Petroleum Exporting Countries (OPEC) with output of around 1.8 million barrels of oil per day, making it one of the top producers in Sub-Saharan Africa. The country holds significant proven gas reserves as well as extensive mineral resources, such as diamonds20 and uranium (ITA, 2017).
Since 2015, Angola has faced a severe economic setback attributed largely to the significant drop in oil prices. Resulting federal budget cuts, currency devaluation and high inflation levels have hindered economic growth (AfDB, 2017; ITA, 2017; WBG, 2017b). Increased pressure to reduce production costs coupled with ongoing restrictions on foreign exchange access have led to significant downsizing of petroleum service companies, contractors, and operators, with some businesses closing operations (ITA, 2017).
Angola has a high level of export product concentration even by the standards of other
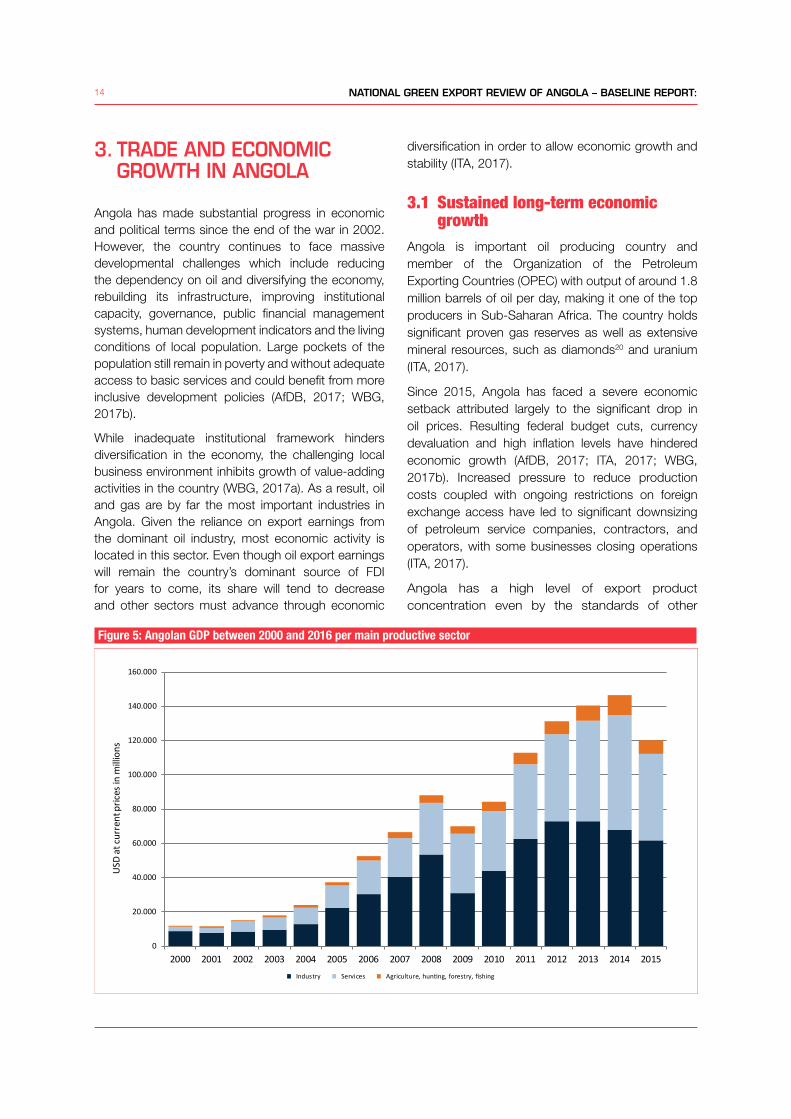
Figure 5: Angolan GDP between 2000 and 2016 per main productive sector
0
20.000
40.000
60.000
80.000
100.000
120.000
140.000
160.000
2000 2001 2002 2003 2004 2005 2006 2007 2008 2009 2010 2011 2012 2013 2014 2015
USD
at c
urre
nt p
rices
in m
illio
ns
Industry Services Agriculture, hun�ng, forestry, fishing
15WOOD, FISH, AND COFFEE
major oil exporters. Moreover, these exports reach very few destination markets, suggesting that Angolan firms face obstacles that limit their ability to participate in the global economy. Strengthening the export competitiveness of the non-oil sector (including non-oil extractive industries) will help maintaining a stable current account surplus and reduce Angola’s exposure to terms-of-trade volatility. On the fiscal side, non-oil tax revenue as a percentage of non-oil GDP has consistently decreased in recent years highlighting the need to reform the tax system in order to reduce the exposure to fluctuations in oil related revenues (WBG, 2017b, 2014). Figure 5 shows the Angolan GDP between 2000 and 2016 per main productive sector (UNCTAD, 2017c).
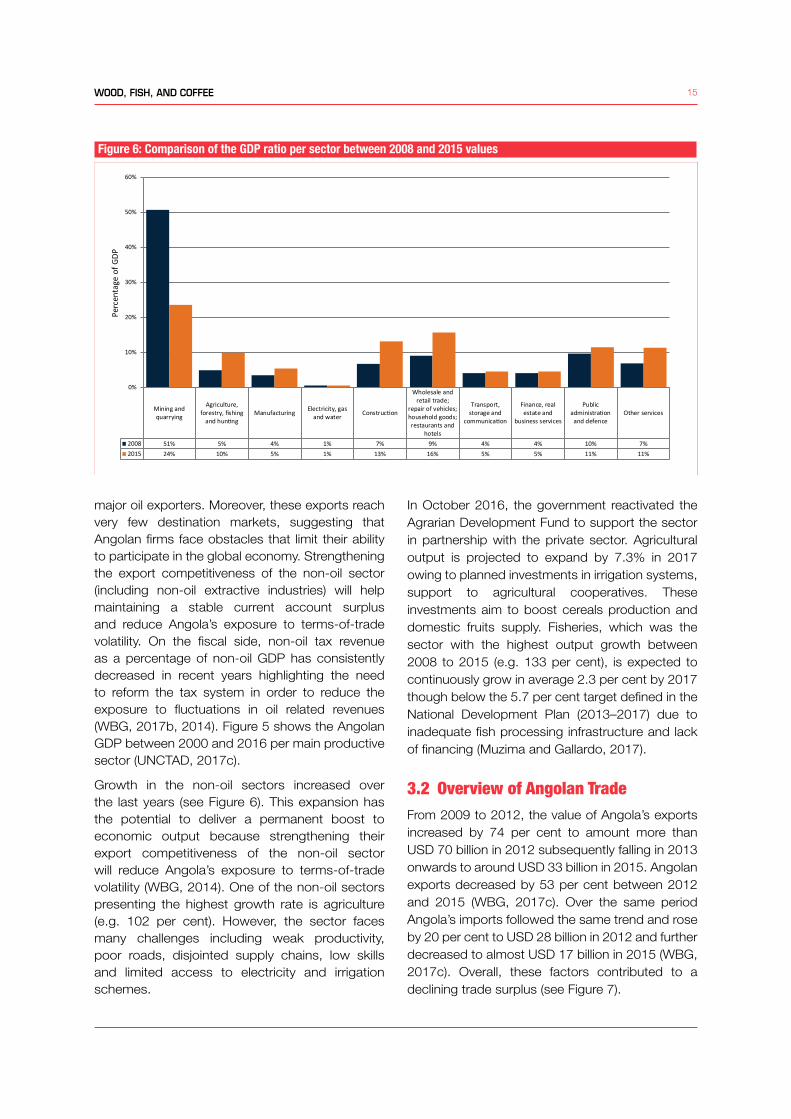
Growth in the non-oil sectors increased over the last years (see Figure 6). This expansion has the potential to deliver a permanent boost to economic output because strengthening their export competitiveness of the non-oil sector will reduce Angola’s exposure to terms-of-trade volatility (WBG, 2014). One of the non-oil sectors presenting the highest growth rate is agriculture (e.g. 102 per cent). However, the sector faces many challenges including weak productivity, poor roads, disjointed supply chains, low skills and limited access to electricity and irrigation schemes.
In October 2016, the government reactivated the Agrarian Development Fund to support the sector in partnership with the private sector. Agricultural output is projected to expand by 7.3% in 2017 owing to planned investments in irrigation systems, support to agricultural cooperatives. These investments aim to boost cereals production and domestic fruits supply. Fisheries, which was the sector with the highest output growth between 2008 to 2015 (e.g. 133 per cent), is expected to continuously grow in average 2.3 per cent by 2017 though below the 5.7 per cent target defined in the National Development Plan (2013–2017) due to inadequate fish processing infrastructure and lack of financing (Muzima and Gallardo, 2017).
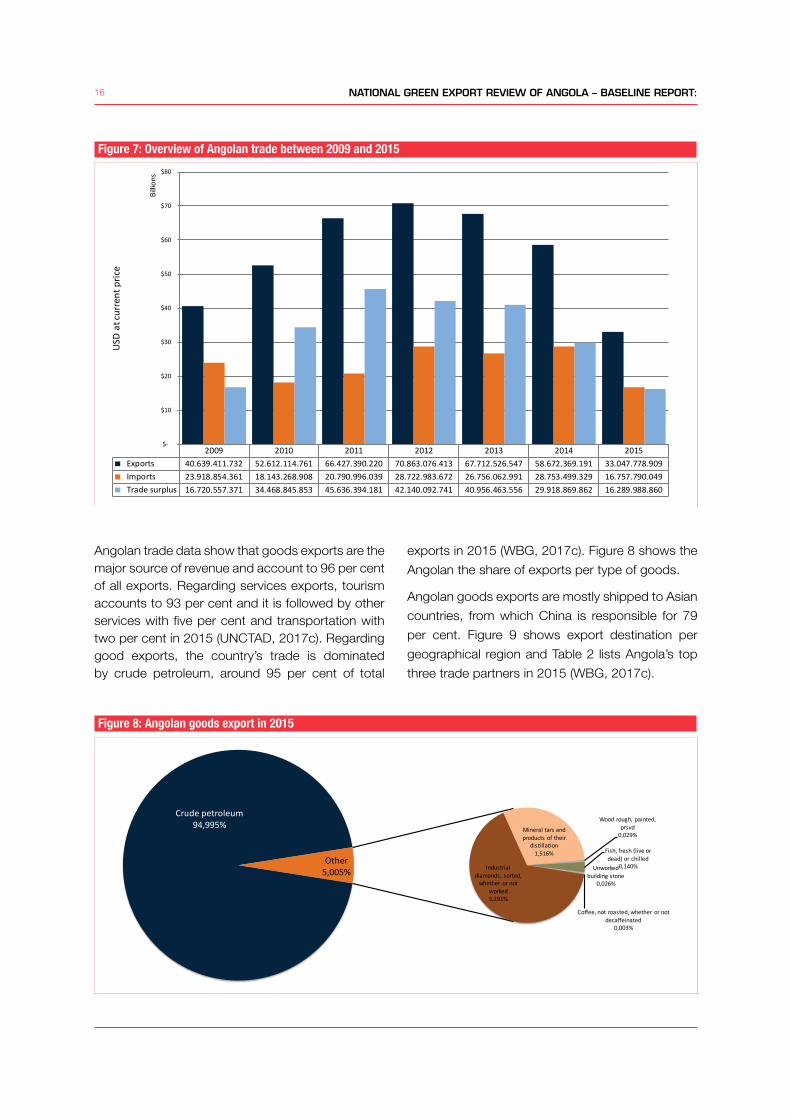
3.2 Overview of Angolan TradeFrom 2009 to 2012, the value of Angola’s exports increased by 74 per cent to amount more than USD 70 billion in 2012 subsequently falling in 2013 onwards to around USD 33 billion in 2015. Angolan exports decreased by 53 per cent between 2012 and 2015 (WBG, 2017c). Over the same period Angola’s imports followed the same trend and rose by 20 per cent to USD 28 billion in 2012 and further decreased to almost USD 17 billion in 2015 (WBG, 2017c). Overall, these factors contributed to a declining trade surplus (see Figure 7).
Figure 6: Comparison of the GDP ratio per sector between 2008 and 2015 values
Mining andquarrying
Agriculture,forestry, fishing
and hun�ngManufacturing Electricity, gas
and water Construc�on
Wholesale andretail trade;
repair of vehicles;household goods;restaurants and
hotels
Transport,storage and
communica�on
Finance, realestate and
business services
Publicadministra�on
and defenceOther services
2008 51% 5% 4% 1% 7% 9% 4% 4% 10% 7%2015 24% 10% 5% 1% 13% 16% 5% 5% 11% 11%
0%
10%
20%
30%
40%
50%
60%
Perc
enta
ge o
f GDP
16 NATIONAL GREEN EXPORT REVIEW OF ANGOLA – BASELINE REPORT:
Angolan trade data show that goods exports are the major source of revenue and account to 96 per cent of all exports. Regarding services exports, tourism accounts to 93 per cent and it is followed by other services with five per cent and transportation with two per cent in 2015 (UNCTAD, 2017c). Regarding good exports, the country’s trade is dominated by crude petroleum, around 95 per cent of total
Figure 7: Overview of Angolan trade between 2009 and 2015
2009 2010 2011 2012 2013 2014 2015 Exports 40.639.411.732 52.612.114.761 66.427.390.220 70.863.076.413 67.712.526.547 58.672.369.191 33.047.778.909 Imports 23.918.854.361 18.143.268.908 20.790.996.039 28.722.983.672 26.756.062.991 28.753.499.329 16.757.790.049 Trade surplus 16.720.557.371 34.468.845.853 45.636.394.181 42.140.092.741 40.956.463.556 29.918.869.862 16.289.988.860
$-
$10
$20
$30
$40
$50
$60
$70
$80
USD
at cu
rren
t pric
e
Billi
ons
Figure 8: Angolan goods export in 2015
Crude petroleum94,995%
Industrial diamonds, sorted,
whether or not worked3,291%
Mineral tars and products of their
dis�lla�on1,516%
Wood rough, painted, prsvd
0,029%
Fish, fresh (live or dead) or chilled
0,140%Unworked building stone
0,026%
Coffee, not roasted, whether or not decaffeinated
0,003%
Other5,005%
exports in 2015 (WBG, 2017c). Figure 8 shows the
Angolan the share of exports per type of goods.
Angolan goods exports are mostly shipped to Asian
countries, from which China is responsible for 79
per cent. Figure 9 shows export destination per
geographical region and Table 2 lists Angola’s top
three trade partners in 2015 (WBG, 2017c).
17WOOD, FISH, AND COFFEE
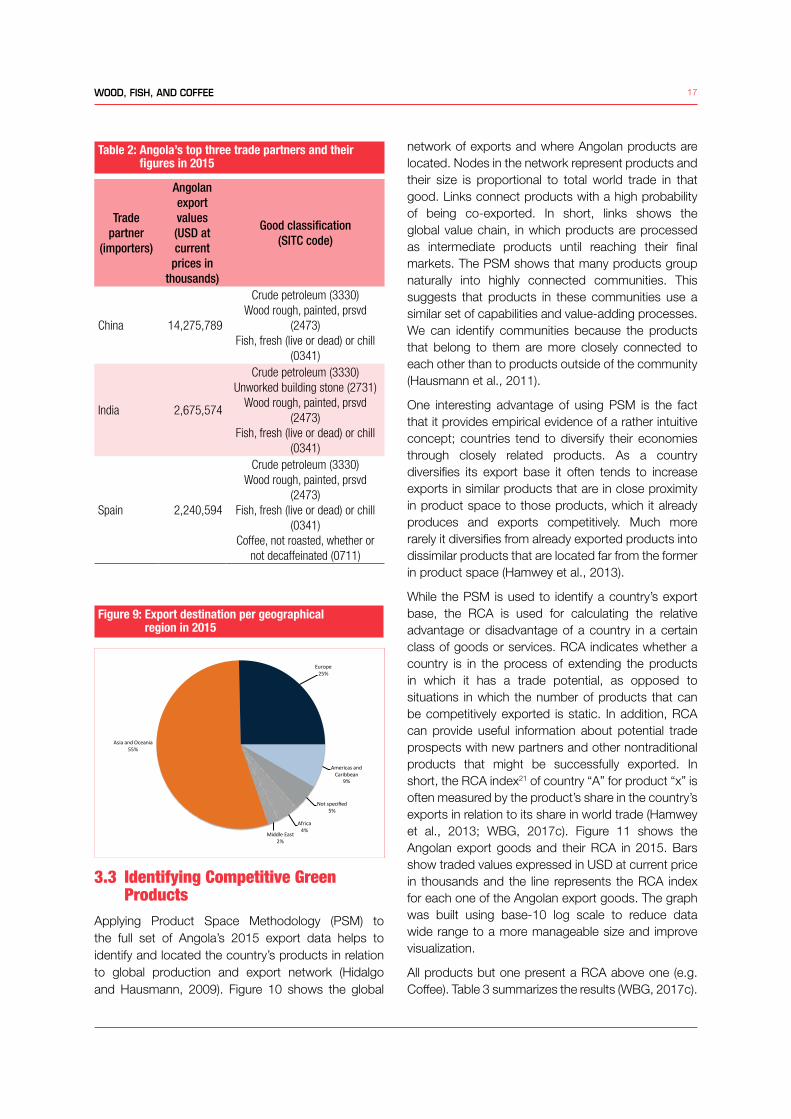
network of exports and where Angolan products are located. Nodes in the network represent products and their size is proportional to total world trade in that good. Links connect products with a high probability of being co-exported. In short, links shows the global value chain, in which products are processed as intermediate products until reaching their final markets. The PSM shows that many products group naturally into highly connected communities. This suggests that products in these communities use a similar set of capabilities and value-adding processes. We can identify communities because the products that belong to them are more closely connected to each other than to products outside of the community (Hausmann et al., 2011).
One interesting advantage of using PSM is the fact that it provides empirical evidence of a rather intuitive concept; countries tend to diversify their economies through closely related products. As a country diversifies its export base it often tends to increase exports in similar products that are in close proximity in product space to those products, which it already produces and exports competitively. Much more rarely it diversifies from already exported products into dissimilar products that are located far from the former in product space (Hamwey et al., 2013).
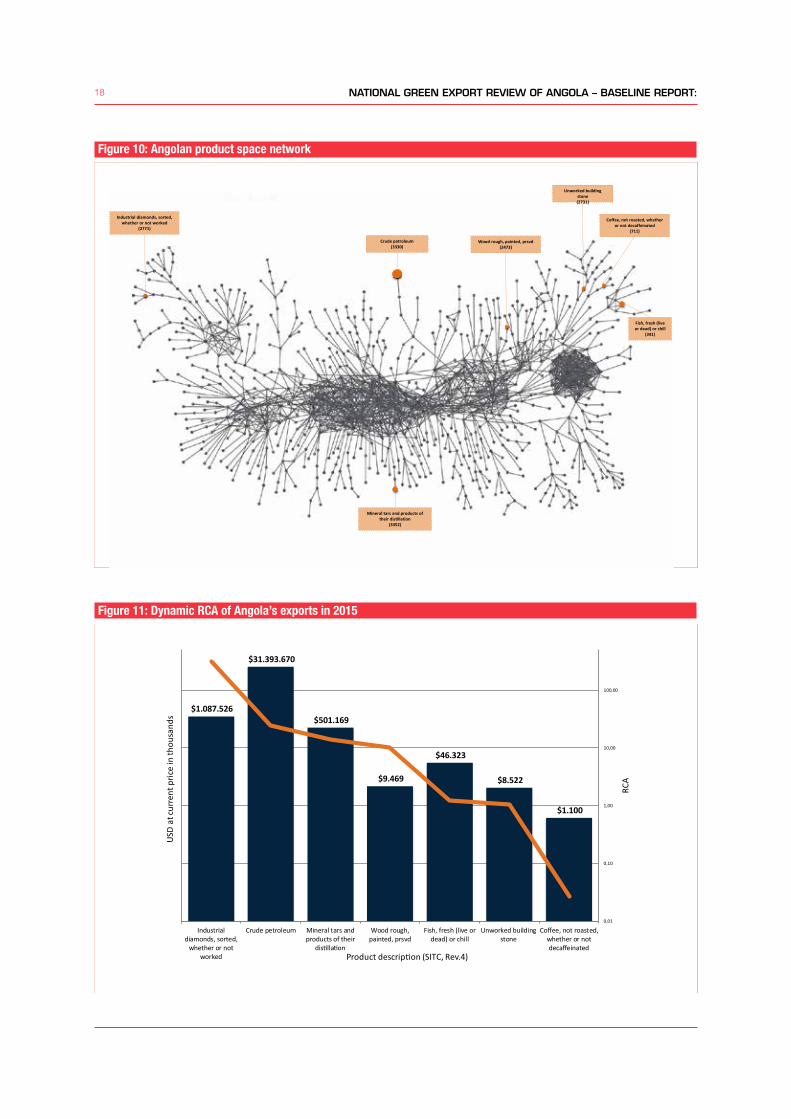
While the PSM is used to identify a country’s export base, the RCA is used for calculating the relative advantage or disadvantage of a country in a certain class of goods or services. RCA indicates whether a country is in the process of extending the products in which it has a trade potential, as opposed to situations in which the number of products that can be competitively exported is static. In addition, RCA can provide useful information about potential trade prospects with new partners and other nontraditional products that might be successfully exported. In short, the RCA index21 of country “A” for product “x” is often measured by the product’s share in the country’s exports in relation to its share in world trade (Hamwey et al., 2013; WBG, 2017c). Figure 11 shows the Angolan export goods and their RCA in 2015. Bars show traded values expressed in USD at current price in thousands and the line represents the RCA index for each one of the Angolan export goods. The graph was built using base-10 log scale to reduce data wide range to a more manageable size and improve visualization.
All products but one present a RCA above one (e.g. Coffee). Table 3 summarizes the results (WBG, 2017c).
Table 2: Angola’s top three trade partners and their figures in 2015
Trade partner
(importers)
Angolan export values(USD at current
prices in thousands)
Good classification (SITC code)
China 14,275,789
Crude petroleum (3330)Wood rough, painted, prsvd
(2473)Fish, fresh (live or dead) or chill
(0341)
India 2,675,574
Crude petroleum (3330)Unworked building stone (2731)
Wood rough, painted, prsvd (2473)
Fish, fresh (live or dead) or chill (0341)
Spain 2,240,594
Crude petroleum (3330)Wood rough, painted, prsvd
(2473)Fish, fresh (live or dead) or chill
(0341)Coffee, not roasted, whether or
not decaffeinated (0711)
Figure 9: Export destination per geographical region in 2015
Asia and Oceania55%
Europe25%
Americas and Caribbean
9%
Not specified5%
Africa4%
Middle East2%
3.3 Identifying Competitive Green Products
Applying Product Space Methodology (PSM) to the full set of Angola’s 2015 export data helps to identify and located the country’s products in relation to global production and export network (Hidalgo and Hausmann, 2009). Figure 10 shows the global
18 NATIONAL GREEN EXPORT REVIEW OF ANGOLA – BASELINE REPORT:
Figure 10: Angolan product space network
Crude petroleum(3330)
Industrial diamonds, sorted, whether or not worked
(2771)
Mineral tars and products of their distillation
(3352)
Wood rough, painted, prsvd(2473)
Fish, fresh (live or dead) or chill
(341)
Unworked building stone(2731)
Coffee, not roasted, whether or not decaffeinated
(711)
Figure 11: Dynamic RCA of Angola’s exports in 2015
$1.087.526
$31.393.670
$501.169
$9.469
$46.323
$8.522
$1.100
0,01
0,10
1,00
10,00
100,00
Industrialdiamonds, sorted,
whether or notworked
Crude petroleum Mineral tars andproducts of their
dis�lla�on
Wood rough,painted, prsvd
Fish, fresh (live ordead) or chill
Unworked buildingstone
Coffee, not roasted,whether or notdecaffeinated
RCA
USD
at cu
rren
t pric
e in
thou
sand
s
Product descrip�on (SITC, Rev.4)
19WOOD, FISH, AND COFFEE
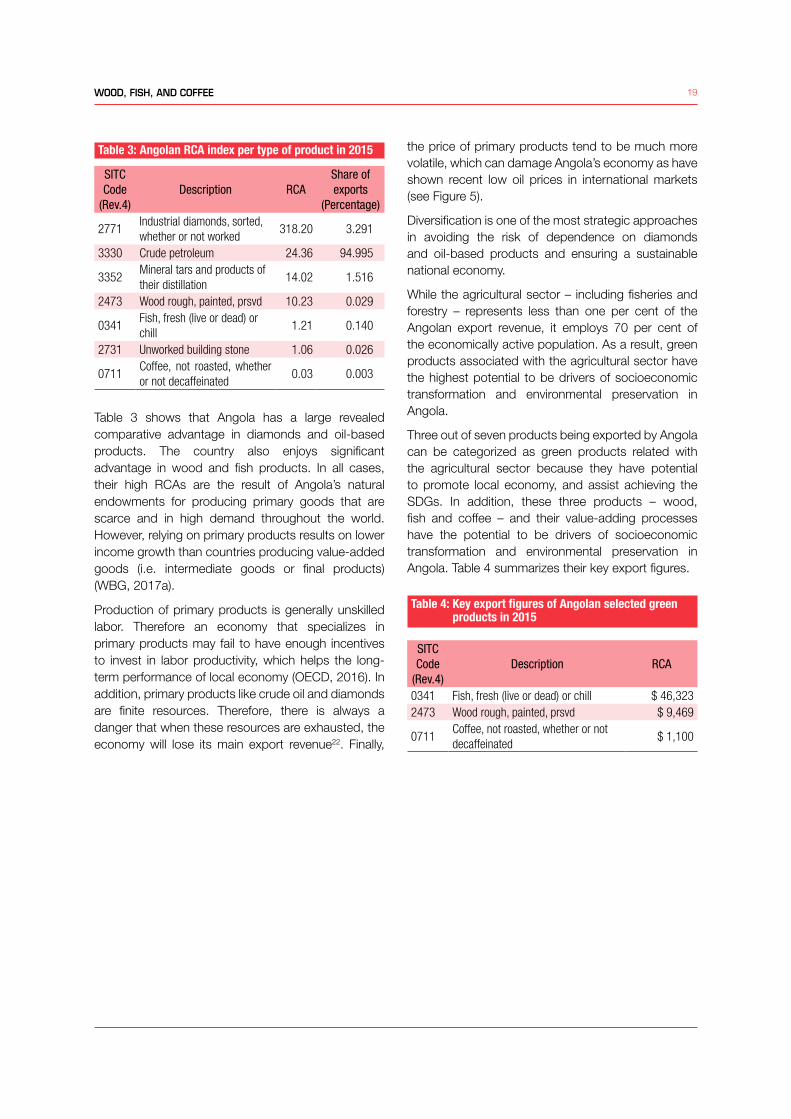
Table 3: Angolan RCA index per type of product in 2015
SITC Code
(Rev.4)Description RCA
Share of exports
(Percentage)
2771Industrial diamonds, sorted, whether or not worked
318.20 3.291
3330 Crude petroleum 24.36 94.995
3352Mineral tars and products of their distillation
14.02 1.516
2473 Wood rough, painted, prsvd 10.23 0.029
0341Fish, fresh (live or dead) or chill
1.21 0.140
2731 Unworked building stone 1.06 0.026
0711Coffee, not roasted, whether or not decaffeinated
0.03 0.003
Table 3 shows that Angola has a large revealed comparative advantage in diamonds and oil-based products. The country also enjoys significant advantage in wood and fish products. In all cases, their high RCAs are the result of Angola’s natural endowments for producing primary goods that are scarce and in high demand throughout the world. However, relying on primary products results on lower income growth than countries producing value-added goods (i.e. intermediate goods or final products) (WBG, 2017a).
Production of primary products is generally unskilled labor. Therefore an economy that specializes in primary products may fail to have enough incentives to invest in labor productivity, which helps the long-term performance of local economy (OECD, 2016). In addition, primary products like crude oil and diamonds are finite resources. Therefore, there is always a danger that when these resources are exhausted, the economy will lose its main export revenue22. Finally,
the price of primary products tend to be much more volatile, which can damage Angola’s economy as have shown recent low oil prices in international markets (see Figure 5).
Diversification is one of the most strategic approaches in avoiding the risk of dependence on diamonds and oil-based products and ensuring a sustainable national economy.
While the agricultural sector – including fisheries and forestry – represents less than one per cent of the Angolan export revenue, it employs 70 per cent of the economically active population. As a result, green products associated with the agricultural sector have the highest potential to be drivers of socioeconomic transformation and environmental preservation in Angola.
Three out of seven products being exported by Angola can be categorized as green products related with the agricultural sector because they have potential to promote local economy, and assist achieving the SDGs. In addition, these three products – wood, fish and coffee – and their value-adding processes have the potential to be drivers of socioeconomic transformation and environmental preservation in Angola. Table 4 summarizes their key export figures.
Table 4: Key export figures of Angolan selected green products in 2015
SITC Code
(Rev.4)Description RCA
0341 Fish, fresh (live or dead) or chill $ 46,3232473 Wood rough, painted, prsvd $ 9,469
0711Coffee, not roasted, whether or not decaffeinated
$ 1,100
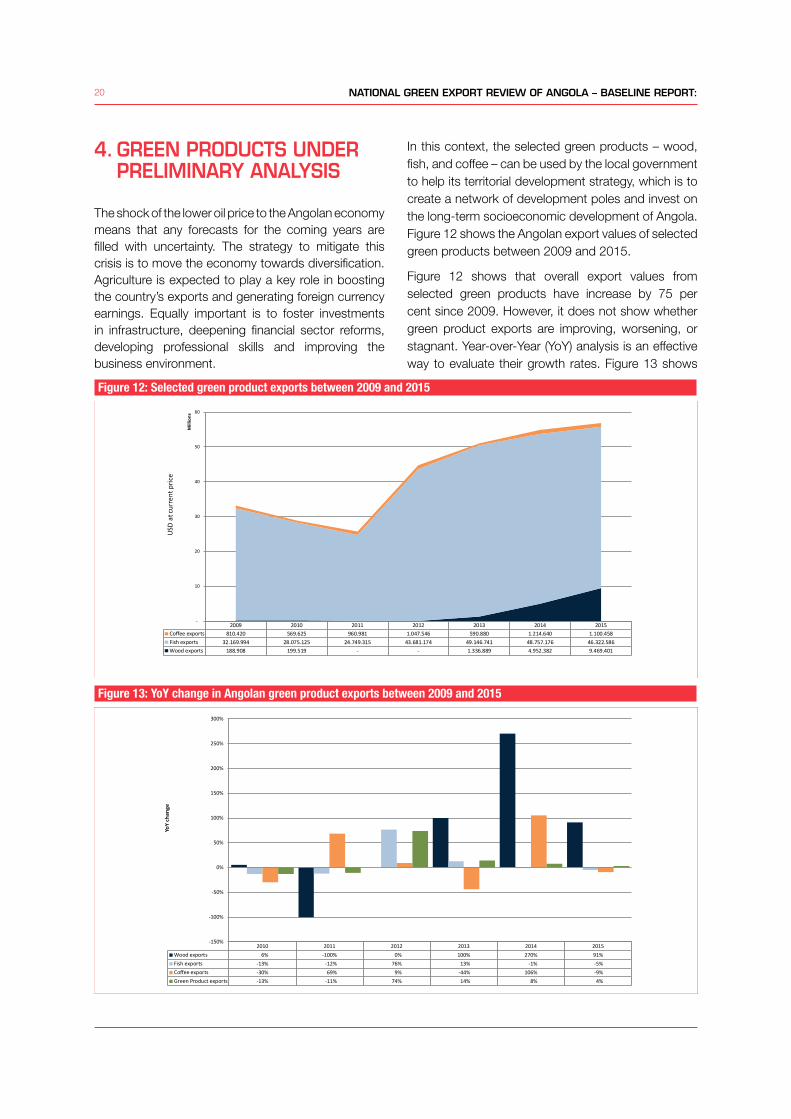
20 NATIONAL GREEN EXPORT REVIEW OF ANGOLA – BASELINE REPORT:
4. GREEN PRODUCTS UNDER PRELIMINARY ANALYSIS
The shock of the lower oil price to the Angolan economy means that any forecasts for the coming years are filled with uncertainty. The strategy to mitigate this crisis is to move the economy towards diversification. Agriculture is expected to play a key role in boosting the country’s exports and generating foreign currency earnings. Equally important is to foster investments in infrastructure, deepening financial sector reforms, developing professional skills and improving the business environment.
In this context, the selected green products – wood, fish, and coffee – can be used by the local government to help its territorial development strategy, which is to create a network of development poles and invest on the long-term socioeconomic development of Angola. Figure 12 shows the Angolan export values of selected green products between 2009 and 2015.
Figure 12 shows that overall export values from selected green products have increase by 75 per cent since 2009. However, it does not show whether green product exports are improving, worsening, or stagnant. Year-over-Year (YoY) analysis is an effective way to evaluate their growth rates. Figure 13 shows
Figure 12: Selected green product exports between 2009 and 2015
2009 2010 2011 2012 2013 2014 2015Coffee exports 810.420 569.625 960.981 1.047.546 590.880 1.214.640 1.100.458Fish exports 32.169.994 28.075.125 24.749.315 43.681.174 49.146.741 48.757.176 46.322.586Wood exports 188.908 199.519 - - 1.336.889 4.952.382 9.469.401
-
10
20
30
40
50
60
USD
at cu
rren
t pric
e
Mill
ions
Figure 13: YoY change in Angolan green product exports between 2009 and 2015
2010 2011 2012 2013 2014 2015Wood exports 6% -100% 0% 100% 270% 91%Fish exports -13% -12% 76% 13% -1% -5%Coffee exports -30% 69% 9% -44% 106% -9%Green Product exports -13% -11% 74% 14% 8% 4%
-150%
-100%
-50%
0%
50%
100%
150%
200%
250%
300%
YoY
chan
ge
21WOOD, FISH, AND COFFEE
the YoY change per type of green product and overall exports between 2009 and 2015.
Figure 12 shows that green product exports have increased by 75 per cent in the period between 2009 and 2015 but on a YoY basis for the last seven years, their average YoY increased only 13 per cent and numbers are declining. Hence, increasing green product exports will require investments in infrastructure, gradual reduction of imports, deepening of financial sector reforms, and improvement of local business environment (e.g. reducing bureaucracy and facilitating credit). In addition, it will require skills development at national level, which makes the Angolan NGER an important tool to assist Angola with this pressing demand on developing the country’s green sectors by training local professionals on how to assess national potential.
4.1 Wood exportsThe timber industry offers enormous developmental potential in Angola. According to the Centre for International Forestry Research, domestic wood or community logging markets in Sub-Saharan Africa employ hundreds of thousands of people. It is an industry that provides employment and wages for entire communities and that has huge socioeconomic and environmental importance, especially for LDCs (CIFOR, 2017).
The Angola’s rural population is one of the main and direct beneficiaries of forest and forest resources as part of their lives has a long and vital link to the forest. Apart from crop production, forest is one of the main income resources and energy source for a number of rural and peri-urban inhabitants. In Angola there are many small-scale wood farmers undertaking charcoal processing activities and also contributing
significantly to logging processes when recruited by forest exploiters. Also, from the forest they collect innumerable products, which they trade for improving household income (FAO, 2017).
Angola is one of the world’s fastest growing timber exporters from around 300 tonnes of wood in 2009 to 15,000 tonnes in 2015, which is reflected in the country’s high RCA (WBG, 2017c). The current boom in the Angolan timber exports is largely a result of the resource-intensive growth of China. Tropical timber is of strategic interest to China because wood is fuelling Chinese processing industries. Total tropical timber input requirements in China have outstripped domestic wood production capacities to such an extent that China is depending on imported wood to maintain its wood processing sector functional (Sun et al., 2008). As a result, Angola’s tropical timber industry is concentrated on the extraction and exportation of logs (e.g. primary products), especially to China. Figure 14 illustrates Angola’s wood exports per trade partners and their market share.
While Angola exports primary products to China and other countries, the country is still importing processed wood products from abroad because it does not have a developed wood processing industry. Another hindering factor is the lack of statistical data and availability of information with regard to forest resources and products in Angola. In fact, there is no inventory on forest resources at national and regional levels (FAO, 2017). Even without resource information, Angola has the ability to significantly increase forest products exports in the short-term, which would bring a number of positive socioeconomic benefits to its rural communities. Figure 15 shows a preliminary SWOT23 analysis for the Angolan wood sector.
There are strong arguments in support of sustainable
Figure 14: Hierarchy chart of Angolan wood exports per trade partner in 2015
22 NATIONAL GREEN EXPORT REVIEW OF ANGOLA – BASELINE REPORT:
harvesting and increasing forest products exports from Angolan planted forests. Angola provides an exceptional combination of large areas of underutilized land (FAO, 2017). Hence, expanding the forestry sector can create local employment and contribute to the creation of a diverse economy through moving the country from a primary product exporter to a country with a more complete value chain (e.g. locally producing plywood, paper and paperboard, and wood furniture).
4.2 Fish exportsAngola has rich coastal waters and a well-watered interior. Its active fisheries also include rivers, freshwater lakes and reservoirs. The country’s coast is 1,600 kilometers (km) long and its exclusive economic zone waters cover 330,000 km² (FAO, 2007). The country has plenty of potential to significantly increase the size of its fishing industry. Fish is part of the traditional diet in Angola and consumption has reached 15 kilograms (kg) annually per capita. Nearly one third of the required animal protein for the population comes
from fish. There is considerable potential to increase local sales for fresh, dried and/or processed fish (FAO, 2007).
Semi-industrial and industrial fishing center are based at four main ports: Namibe, Benguela, Porto Amboim and Luanda (ITA, 2017). Currently, 85 per cent of the fishing industry’s production in Angola is consumed domestically. The remaining 15 per cent is exported to foreign markets (FAO, 2014). Figure 16 illustrates Angola’s fish exports per trade partners and their market share.
Commercial fishing was responsible for more than 63 percent of total marine catches in 2013 with the remainder 37 per cent coming from artisanal fishing. Landings from the artisanal fishery are usually sold on the beach to the small number of traders, which are mainly women (e.g. 80 per cent of the work force), who transport the fish to local markets or processing plants. Most of the fish are locally sold fresh, dried or salted (FAO, 2014, 2007).
There is a large artisanal fishing fleet in Angola with around 100 thousand people earning their living in
Figure 15: Preliminary SWOT analysis for the Angolan wood sector
Strengths Opportunities
• Rural population.• Development works to improve rural areas.• Large underutilised areas.• RCA = 10.23.
• Regional demand for value-added wood products, in special plywood.
• Expanding supply chain and adding value across entire product line.
• Community-based plantations.
Weaknesses Threats
• Insufficient infrastructure for manufacture and transport.
• Strong dependency on timber exports.
• High cost of doing business.• Lack of finance availibilty for small holders.
Figure 16: Hierarchy chart of Angolan fish exports per trade partner in 2015
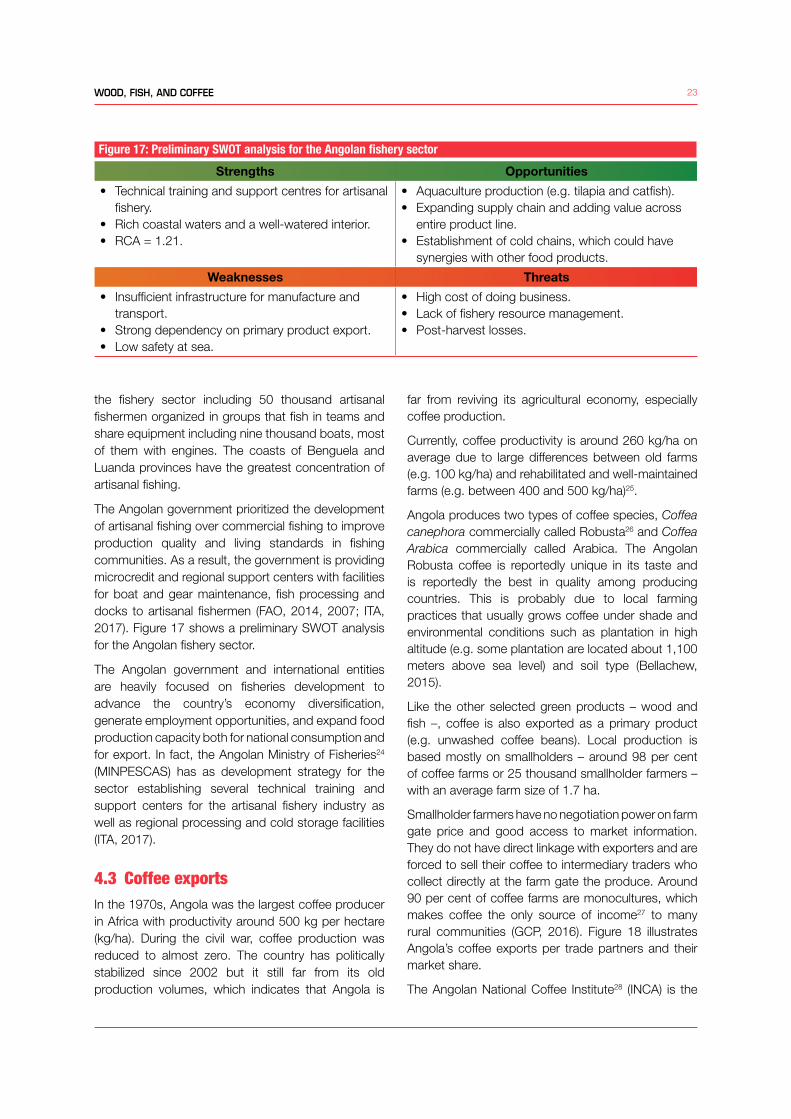
23WOOD, FISH, AND COFFEE
the fishery sector including 50 thousand artisanal fishermen organized in groups that fish in teams and share equipment including nine thousand boats, most of them with engines. The coasts of Benguela and Luanda provinces have the greatest concentration of artisanal fishing.
The Angolan government prioritized the development of artisanal fishing over commercial fishing to improve production quality and living standards in fishing communities. As a result, the government is providing microcredit and regional support centers with facilities for boat and gear maintenance, fish processing and docks to artisanal fishermen (FAO, 2014, 2007; ITA, 2017). Figure 17 shows a preliminary SWOT analysis for the Angolan fishery sector.
The Angolan government and international entities are heavily focused on fisheries development to advance the country’s economy diversification, generate employment opportunities, and expand food production capacity both for national consumption and for export. In fact, the Angolan Ministry of Fisheries24 (MINPESCAS) has as development strategy for the sector establishing several technical training and support centers for the artisanal fishery industry as well as regional processing and cold storage facilities (ITA, 2017).
4.3 Coffee exportsIn the 1970s, Angola was the largest coffee producer in Africa with productivity around 500 kg per hectare (kg/ha). During the civil war, coffee production was reduced to almost zero. The country has politically stabilized since 2002 but it still far from its old production volumes, which indicates that Angola is
far from reviving its agricultural economy, especially coffee production.
Currently, coffee productivity is around 260 kg/ha on average due to large differences between old farms (e.g. 100 kg/ha) and rehabilitated and well-maintained farms (e.g. between 400 and 500 kg/ha)25.
Angola produces two types of coffee species, Coffea canephora commercially called Robusta26 and Coffea Arabica commercially called Arabica. The Angolan Robusta coffee is reportedly unique in its taste and is reportedly the best in quality among producing countries. This is probably due to local farming practices that usually grows coffee under shade and environmental conditions such as plantation in high altitude (e.g. some plantation are located about 1,100 meters above sea level) and soil type (Bellachew, 2015).
Like the other selected green products – wood and fish –, coffee is also exported as a primary product (e.g. unwashed coffee beans). Local production is based mostly on smallholders – around 98 per cent of coffee farms or 25 thousand smallholder farmers – with an average farm size of 1.7 ha.
Smallholder farmers have no negotiation power on farm gate price and good access to market information. They do not have direct linkage with exporters and are forced to sell their coffee to intermediary traders who collect directly at the farm gate the produce. Around 90 per cent of coffee farms are monocultures, which makes coffee the only source of income27 to many rural communities (GCP, 2016). Figure 18 illustrates Angola’s coffee exports per trade partners and their market share.
The Angolan National Coffee Institute28 (INCA) is the
Figure 17: Preliminary SWOT analysis for the Angolan fishery sector
Strengths Opportunities
• Technical training and support centres for artisanal fishery.
• Rich coastal waters and a well-watered interior.• RCA = 1.21.
• Aquaculture production (e.g. tilapia and catfish).• Expanding supply chain and adding value across
entire product line.• Establishment of cold chains, which could have
synergies with other food products.
Weaknesses Threats
• Insufficient infrastructure for manufacture and transport.
• Strong dependency on primary product export.• Low safety at sea.
• High cost of doing business.• Lack of fishery resource management.• Post-harvest losses.
24 NATIONAL GREEN EXPORT REVIEW OF ANGOLA – BASELINE REPORT:
governmental body responsible for all matters related to coffee in the country, which includes research, development and marketing.
INCA runs three well established regional coffee research stations in Angola that are located in different provinces representing different agro-ecological zones under which coffee grows in the country. These stations are located in Cuanza Sul, Uige and Benguela provinces29. While the first two stations are dedicated to research on Robusta coffee research, the latter station is responsible for research on Arabica coffee (Bellachew, 2015). Figure 19 shows a preliminary SWOT analysis for the Angolan coffee sector.
4.4 Value chain of Angolan green products
In modern value chains, raw materials (e.g. wood, fish, or coffee) are harvested, processed into primary products, transported, processed into intermediate or final products, and delivered to final users in such a manner that the total aggregated value of the products is maximized. Each action within the value chain causes value addition to the intermediate product and
benefits to local economy. However, Angola – as an exporter of primary products – does not maximized the value of its green produce. In fact, Angola is the echelon within the value chain that benefits the least.
Most agricultural, fisheries and forestry production is subject to some form of transformation beyond the farm gate and prior to eventual end use. From the outset this transformation highlights the potential role that selected green products play in improving supply and value chains in Angola (Da Silva, 2009). The key-defining characteristic of the selected green products30 is their perishable nature, the supply and/or quality of which can vary significantly over time. Under conditions of uncertain raw material quality, planning of production and transformation processes and achieving economies of scale can be troubled with difficulties, especially where there are very specific quality parameters (e.g. ISO standards, fair trade label, organic certification, among others) that are required to guarantee products’ quality.
All selected green products have the potential for greater levels of transformation and value addition before being exported. The value adding processes involved can vary from artisan or craft skills to
Figure 18: Hierarchy chart of Angolan coffee exports per trade partner in 2015
Figure 19: Preliminary SWOT analysis for the Angolan coffee sector
Strengths Opportunities
• Past history of high-quality coffee production and knowledge
• Ongoing rehabilitation of coffee fields
• Expanding supply chain and adding value across entire product line.
• Coffee can become an example for diversification.
Weaknesses Threats
• Insufficient infrastructure for manufacture and transport.
• Strong dependency on primary product export.• Low RCA = 0.03.
• High cost of doing business.• Yields are low, quality is inconsistent, and supply
chains are inefficient.• Post-harvest losses.
25WOOD, FISH, AND COFFEE
industrial processes, across the informal and formal sectors. In addition, the creation of value adding activities of these green products requires diverse technologies operating side by side. Therefore, there may be significant interlinkages between enterprises that employ low levels of technology, predominantly in the informal sector, and those employing more advanced technologies, predominantly in the formal sector (Da Silva, 2009). Examples include the subcontracting of artisanal fishermen, smallholder farmers for fish and coffee production and/or the handling of by-products and waste from timber manufactures for charcoal production. This suggests potentially significant and complex relations between different forms of business and across the informal
and formal sectors in Angola, which may also link green products to other sectors.
The coexistence of the informal and formal sectors is perhaps one of the key distinguishing features of the green products, especially in Angola. While national accounts of most countries largely ignore the economic activities of the informal sector, in most low-income countries – such as Angola – informal agricultural produce remains strong (Sanches-Pereira et al., 2017). Indeed, “informality” can be considered the norm in the agricultural sector in LDCs, with formal sector enterprises comprising a relatively small fraction of the use of agricultural, fisheries and forestry raw materials, value addition and employment (Da Silva, 2009; UNCTAD, 2015a).
26 NATIONAL GREEN EXPORT REVIEW OF ANGOLA – BASELINE REPORT:
5. CONCLUDING REMARKS
The Angolan government recognizes the need to promote and accelerate growth and competitiveness in the country through economic diversification and poverty reduction. Considering that agriculture employs 70 per cent of the economically active population but represents only 13 per cent of the Angolan GDP, the agricultural sector has the potential to help leapfrogging the country from the required rehabilitation phase directly to the sustainable development stage.
The agricultural sector grew by 102 per cent between 2008 and 2015 (see Figure 6), and only about a third of Angola’s arable land has been cultivated. It certainly has available working force, right climate and arable land to expand its fisheries and forestry sectors. Although some advances have been made in these areas, there is still a long way to go in order to alleviate Angola’s dependency on imports of food and wood products.
In this context, this baseline report highlighted three green products – wood, fish and coffee – that have their value chains already in place in Angola. The results
show that selected green products have the potential to deliver a permanent boost to economic output because strengthening their export competitiveness through value chain expansion can reduce Angola’s exposure to terms-of-trade volatility related to of the oil sector.
Through the Angola NGER, selected green products represent an important enabler for local development by working in close partnership with local stakeholders to diversify local economy and to increase local capacity (i.e. training modules), efficiency and competitiveness of green sectors. In addition, this background document has presented a panorama of key issues related to local green sectors, with particular attention given to enhancing their regulatory, institutional and trade-related performance.
Finally, it is important to mention that available secondary data used in this baseline report not have the level of reliability necessary for confident decision-making. They provide more breadth than depth. Yet, their results make available a dataset that contains enough information reflecting the Angolan context that can be used to guide national stakeholder discussions and assist in designing training courses to promote the local green economy.
27WOOD, FISH, AND COFFEE
References
AfDB, 2017. Angola: Coutry Strategy Paper 2017-2021, Country Strategy Paper and Country Portfolio Performance Review. Abidjan.
Bellachew, B., 2015. A Brief Account of Coffee Production in Angola: a quick assessment report. Africa.CFR, 2008. Angola’s Political and Economic Development [WWW Document]. URL https://www.cfr.org/
backgrounder/angolas-political-and-economic-development (accessed 7.10.17).CIFOR, 2017. Centre for International Forestry Research [WWW Document]. URL http://www.cifor.org (accessed
7.20.17).Da Silva, C.A. et al., 2009. Agro-industries for Development. The Food and Agriculture Organization of the
United Nations (FAO),The United Nations Industrial Development Organization (UNIDO) & CAB International, Oxfordshire. doi:10.1017/CBO9781107415324.004.
EU, 2017. Interim Agreement with a view to an Economic Partnership Agreement between, the European Community and its Member States, of the one part, and the SADC EPA States, of the other part [WWW Document]. Summ. Treaty. URL http://ec.europa.eu/world/agreements/prepareCreateTreatiesWorkspace/treatiesGeneralData.do?step=0&redirect=true&treatyId=7904 (accessed 7.12.17).
FAO, 2007. Fishery Country Profile: Angola, FAO Fishery Country Profiles. Rome.FAO, 2014. The state of world fisheries and aquaculture, Food and Agriculture Oraganization of the United
Nations. Rome. doi:92-5-105177-1.FAO, 2017. Forestry sector in 2020 [WWW Document]. URL http://www.fao.org/docrep/003/X6772E/X6772E04.
htm (accessed 7.20.17).GCP, 2016. African Coffee Sector: Case Study Angola. African Coffee Sect. addressing Natl. Invest. agendas a
Cont. scale.Hamwey, R., Pacini, H., Assunção, L., 2013. Mapping Green Product Spaces of Nations. J. Environ. Dev. 22,
155–168. doi:10.1177/1070496513482837.Hausmann, R., Hidalgo, C.A., Bustos, S., Coscia, M., Chung, S., Jimenez, J., Simoes, A., Yıldırım, M.A., 2011.
The Atlas of Economic Complexity: mapping path to prosperity. Center for International Development at Harvard University ; Harvard Kennedy School ; Macro Connections, MIT Media Lab., Cambridge.
Hidalgo, C.A., Hausmann, R., 2009. The building blocks of economic complexity. Proc. Natl. Acad. Sci. U. S. A. 106, 10570–10575. doi:10.1073/pnas.0900943106.
ISO, 2017. ISO Survey [WWW Document]. ISO Surv. Certif. to Manag. Syst. Stand. - Full results. URL https://www.iso.org/the-iso-survey.html (accessed 7.3.17).
ITA, 2016. 2016 Top Markets Report: Renewable Energy. Washington. doi:10.5817/CP2013.ITA, 2017. Angola Country Commercial Guide [WWW Document]. URL https://www.export.gov/article?id=Angola-
Openness-to-Foreign-Investment (accessed 7.13.17).ITC, 2017. Trade statistics for international business development [WWW Document]. Trade Map. URL http://
www.trademap.org/Index.aspx (accessed 7.12.17).Muzima, J., Gallardo, G., 2017. African Economic Outlook 2017: Angola, African Economic Outlook 2017.
Abidjan.OECD, 2001. Environmental Goods and Services: The Benefits of Further Global Trade Liberalisation, Trade and
Environment. Paris.OECD, 2016. Promoting productivity and equality: a twin challenge, in: OECD Economic Outlook 2016.
Organisation for Economic Co-operation and Development (OECD), Paris, pp. 59–84.Pickett‐Baker, J., Ozaki, R., 2008. Pro‐environmental products: marketing influence on consumer purchase
decision. J. Consum. Mark. 25, 281–293. doi:10.1108/07363760810890516.Republic of Angola, 2014. Plano Nacional de Desenvolvimento (PND) para 2013-2017 [WWW Document]. URL
http://www.angola.gov.ao/VerPublicacao.aspx?id=1264 (accessed 7.17.17).Sanches-Pereira, A., Onguglo, B., Pacini, H., Coelho, S.T., Gómez Galindo, M.F., Muwanga, M.K., 2017.
Fostering local sustainable development in Tanzania by enhancing linkages between tourism and small-scale agriculture. J. Clean. Prod. 162, 1567–1581. doi:10.1016/j.jclepro.2017.06.164.
Sun, C., Chen, L., Han, L., Bass, S., 2008. Global Forest Product Chains - Identifying challenges and opportunities for China through a global commodity chain sustainability analysis. Winnipeg.
Tefera, A., Tefera, T., 2013. Ethiopia Coffee: Annual Report, Global Agricultural Information Network (GAIN) Report. Addis Ababa.
UNCTAD, 2011. Integration of developing countries in global supply chains, including through adding value to their exports, Trade and Development Commission. Geneva.
28 NATIONAL GREEN EXPORT REVIEW OF ANGOLA – BASELINE REPORT:
UNCTAD, 2014. The Least Developed Countries Report 2014. Geneva.UNCTAD, 2015a. The Least Developed Countries Report 2015. Geneva.UNCTAD, 2015b. The Continental Free Trade Area: making it work for Africa. Geneva.UNCTAD, 2015c. Investment Policy Framework for Sustainable Development. Geneva.UNCTAD, 2016a. The Least Developed Countries Report 2016. Geneva.UNCTAD, 2016b. Trade Policy Framework: Angola, Trade Negotiations and Commercial Diplomacy Branch.
Geneva.UNCTAD, 2017a. Overview of the National Green Export Reviews, UNCTAD NGER Brief. Geneva.UNCTAD, 2017b. UN Comtrade Database [WWW Document]. UN Trade Stat. URL https://comtrade.un.org
(accessed 8.20.14).UNCTAD, 2017c. UNCTADstats [WWW Document]. URL http://unctadstat.unctad.org/EN/ (accessed 7.12.17).UNDP, 2015. Partnership Framework between the Government of Angola and the United Nations System
(UNPAF) 2015-2019. New York.Walmsley, B., Patel, S., 2011. Handbook on environmental assessment legislation in the SADC. Development
Bank of Southern Africa (DBSA) in collaboration with the Southern African Institute for Environmental Assessment (SAIEA), Pretoria.
WBG, 2014. People’s Republic of Angola Angola Economic Update 2. Washington.WBG, 2017a. Doing Business 2017: Equal Opportunity for All. Washington. doi:10.1596/978-1-4648-0948-4.WBG, 2017b. Overview: Angola [WWW Document]. Econ. Overv. URL http://www.worldbank.org/en/country/
angola/overview (accessed 7.13.17).WBG, 2017c. World Integrated Trade Solution (WITS) [WWW Document].WTO, 2015. Trade Policy Review on Angola. Geneva.
Notes1 NGERs are undertaken under UNCTAD’s project on Supporting Member States in developing and launching
sustainable product export strategies through National Sustainable Product Export Reviews; made possible through support provided by the United Nations Development Account. Angola’s NGER is a product of the EU-UNCTAD Joint Programme for Angola: Train for Trade II.
2 Ministério do Comércio.3 Estratégia Angola 2025.4 Plano Nacional de Desenvolvimento.5 Lei de Bases do Ambiente.6 Ministério do Ambiente.7 Programa Nacional de Gestao Ambiental.8 Programa de Apoio Estratégico para o Ambiente.9 Estratégia Nacional Ambiental.10 Gabinete de Reconstruçao Nacional.11 The oil and gas sectors are followed by the service sector with 28 per cent of the GDP, industry sector with
20 per cent, in which construction being a dominant sub-sector with 11 per cent, public administration and financial services account for 8 per cent. Agriculture and fisheries are predominant economic activities, accounting for only 13 per cent of GDP (AfDB, 2017; CFR, 2008).
12 South Africa and Namibia.13 Agência Nacional do Investimento Privado.14 Instituto Angolano de Normalização e Qualidade.15 Ministério da Indústria.16 Formerly American Society for Testing Materials.17 Foreign companies who wish to do business in Angola are required to enter into a joint venture with a local
entity, in which the foreign entity can hold a maximum equity stake of 75 per cent.18 Based on Annex 3 of Marrakesh Agreement, LDCs are reviewed every 6-7 years. Although there is no
investment policy review, reviews of the trade policy deal briefly with the subject in Chapter 2.
29WOOD, FISH, AND COFFEE
19 Agência para Promoçao de Investimentos e Exportações.20 The second largest export product in Angola is diamonds. Diamond production grew swiftly until 2006.
Since then, production has fluctuated but, in 2015, it grew by four per cent and reached nine million carats. The country has still high potential to expand mining since only 40 per cent of the Angolan mining resources are known. Diamond exploration is being conducted in 13 provinces and 108 new projects are available for private investors (WBG, 2017b).
21 RCAij = (xij/Xit) / (xwj/Xwt) Where xij and xwj are the values of country i’s exports of product j and world exports of product j and where Xit and Xwt refer to the country’s total exports and world total exports. A value of less than unity (e.g. RCA < 1) implies that the country has a revealed comparative disadvantage in the product. Similarly, if the index exceeds unity (e.g. RCA > 1), the country is said to have a revealed comparative advantage in the product (WBG, 2017c).
22 In Angola, diamonds and oil-based products correspond to 99.80 per cent of export revenue, from which oil-based products corresponds to 96 per cent alone (WBG, 2017c).
23 SWOT is is an acronym for Strengths, Weaknesses, Opportunities, and Threats.24 Ministério das Pescas.25 Ethiopian productivity is estimated around 720 kg/ha on average (Tefera and Tefera, 2013).26 Robusta is responsible for 98 per cent of the country’s coffee production (Bellachew, 2015).27 Post-war challenges have resulted in smallholdings being managed usually by a woman with an average
household size of six people (GCP, 2016).28 Instituto Nacional do Café de Angola.29 The stations are situated in the Municipality of Amboim in Cuanza Sul province, Municipality of Uige in Uige
province and Municipality of Ganda in Benguela province.30 Wood products are – to a lesser degree – also bound to this key-defining characteristic.
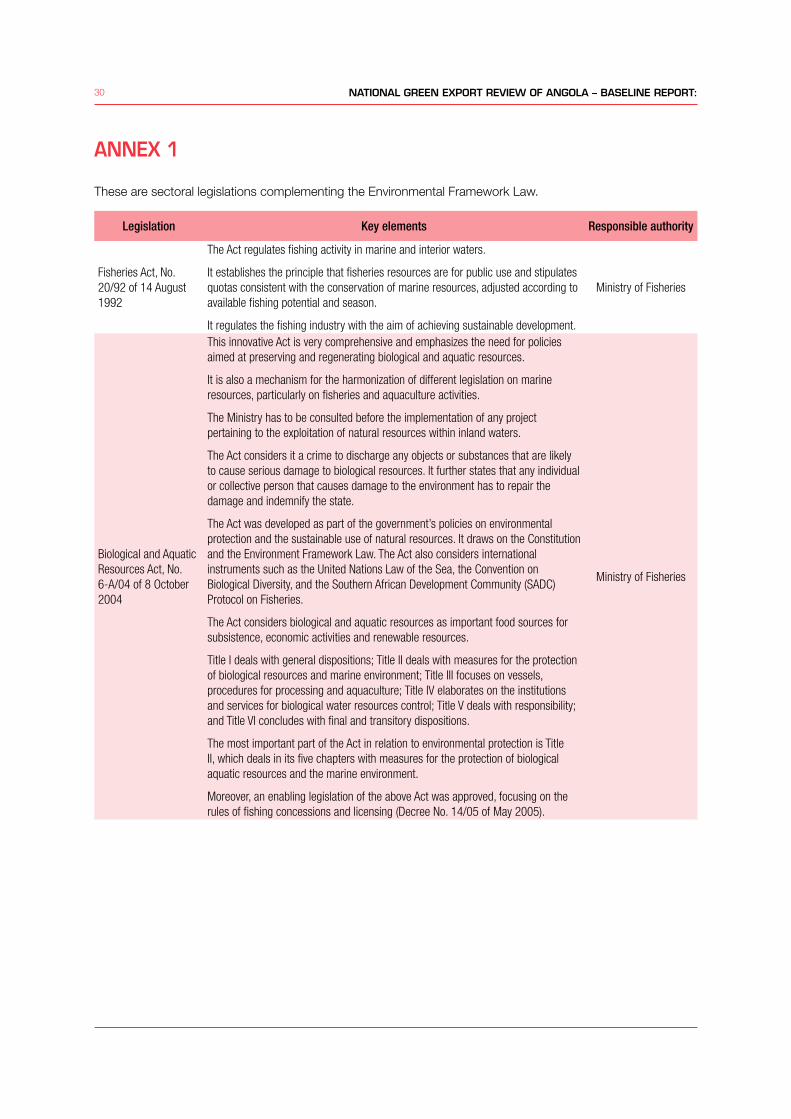
30 NATIONAL GREEN EXPORT REVIEW OF ANGOLA – BASELINE REPORT:
ANNEX 1
These are sectoral legislations complementing the Environmental Framework Law.
Legislation Key elements Responsible authority
Fisheries Act, No. 20/92 of 14 August 1992
The Act regulates fishing activity in marine and interior waters.
It establishes the principle that fisheries resources are for public use and stipulates quotas consistent with the conservation of marine resources, adjusted according to available fishing potential and season.
It regulates the fishing industry with the aim of achieving sustainable development.
Ministry of Fisheries
Biological and Aquatic Resources Act, No. 6-A/04 of 8 October 2004
This innovative Act is very comprehensive and emphasizes the need for policies aimed at preserving and regenerating biological and aquatic resources.
It is also a mechanism for the harmonization of different legislation on marine resources, particularly on fisheries and aquaculture activities.
The Ministry has to be consulted before the implementation of any project pertaining to the exploitation of natural resources within inland waters.
The Act considers it a crime to discharge any objects or substances that are likely to cause serious damage to biological resources. It further states that any individual or collective person that causes damage to the environment has to repair the damage and indemnify the state.
The Act was developed as part of the government’s policies on environmental protection and the sustainable use of natural resources. It draws on the Constitution and the Environment Framework Law. The Act also considers international instruments such as the United Nations Law of the Sea, the Convention on Biological Diversity, and the Southern African Development Community (SADC) Protocol on Fisheries.
The Act considers biological and aquatic resources as important food sources for subsistence, economic activities and renewable resources.
Title I deals with general dispositions; Title II deals with measures for the protection of biological resources and marine environment; Title III focuses on vessels, procedures for processing and aquaculture; Title IV elaborates on the institutions and services for biological water resources control; Title V deals with responsibility; and Title VI concludes with final and transitory dispositions.
The most important part of the Act in relation to environmental protection is Title II, which deals in its five chapters with measures for the protection of biological aquatic resources and the marine environment.
Moreover, an enabling legislation of the above Act was approved, focusing on the rules of fishing concessions and licensing (Decree No. 14/05 of May 2005).
Ministry of Fisheries
31WOOD, FISH, AND COFFEE
Decree on Soil, Flora and Fauna Protection, No. 40.040 of 1955
and
Various decrees from the colonial period
The first legislation on nature conservation and the establishment of protected areas for different purposes (initially for hunting and later for nature conservation) was issued on 20 January 1955 through Decree No. 40.040 (published in the Official Bulletin on 9 February 1955). This Decree covered aspects related to soil, fauna and flora protection, conservation and use of game, and the establishment of national parks, nature reserves and controlled hunting areas. It pioneered the establishment of the Nature Conservation Council to control protected areas and develop enabling legislation.
This legislation included the Hunting Regulation, Decree No. 2.873 of 11 December 1957, Forestry Regulation, Decree No. 44.531, and National Parks Regulation, Decree No. 10.375 of 15 October 1958.
In its annexes, Decree No. 40.040 included a list of mammal and bird species whose hunting was considered illegal.
Decree No. 43/77 of 5 May 1977 approved the structure of the Ministry of Agriculture and defined five different categories for protected areas, namely national parks, strict nature reserves, partial reserves, regional nature parks and special reserves. This differentiation of categories does not include issues such as rural community use of wildlife or the conservation on heritage sites and important monuments.
Ministry of Agriculture
Mining Code, 23 September 2011
The Mining Code of 2011 repeals a number of old laws relating to mining, such as the Law of Mines, No. 27 of 1979, the Geological and Mining Activities Law, No. 1 of 1992, and the Diamond Act, No. 16 of 1994.
The new Mining Code amalgamated these (and other laws) into a single set of regulations, with the intention of providing easier access to applicable laws and harmonizing, to the extent possible, the rules and procedures that apply to particular activities.
The Code applies to all mining activities (such as prospecting, mining and commercialization) that take place in Angola and all maritime areas that are subject to the Angolan jurisdiction. It does not apply to hydrocarbons, whether in liquid or gas form.
The Code further provides that, in consideration for granting mining rights, the Angolan state shall be entitled to compensation, in the form of a participation of not less than 10% in the company that conducts the activities and/or allocations in kind of the minerals to be extracted.
The Code contains specific rules for mining activities that involve strategic minerals. Gold, diamonds and radioactive minerals are currently designated as strategic minerals, although the Angolan Executive can designate others.
All mineral resources that can be found in Angola and within the maritime boundary of Angola are deemed the property of the Angolan state. However, the minerals explored and extracted by holders of mining rights are the property of these parties in accordance with the terms of their concession.
Mining rights can be granted for the following activities: a) Prospecting for specific minerals; b) Mining of specific minerals; c) Prospecting and exploitation of minerals for civil construction; and d) Artisanal mining.
The Mining Code imposes a number of obligations on the holders of mining rights regarding the exercise of their rights. These include obligations in the areas of: a) Hygiene, health, security and training; b) Environmental protection; c) Use of soil; and d) Use of explosives.
Ministry of Geology and Mines
32 NATIONAL GREEN EXPORT REVIEW OF ANGOLA – BASELINE REPORT:
Land Use Planning and Urban Development Act, No. 3/04 of 25 June 2004
After independence, issues relating to land use planning and urban management were not considered a priority in terms of the development of new legislation. Most of the legislation on this issue was inherited from the colonial period and is thus outdated and inefficient.
The existing legislation on territory, town and country planning and urban issues is fragmented and not in line with scientific and technological progress.
In addition, the growth of the main cities, particularly from urbanization in the coastal areas as result of the war and migration in search of urban opportunities, has exacerbated problems in the management of urban areas, leading to overcrowded and dilapidated cities. The lack of integrated and coordinated plans to respond to the growing number of people, which is associated with the inefficient development and growth of the cities, has motivated the development of this law.
The Act adopts a concept of integrated planning, which includes socio-economic aspects and attempts to create synergies in the relationship between the city and the countryside. It calls for the establishment of a decentralized system to coordinate land use planning.
Ministry of Environment
and
Ministry of Agriculture
Land Law, No. 9/04 of 9 November 2004
This Law deems land the property of the State and proposes the following multiple uses for the land: a) A shelter and home for the inhabitants of Angola, which implies the existence of an appropriate urban planning system; b) A source of natural resources that can be used for mining, agriculture, forestry and land planning; and c) A support for economic, agricultural and industrial activities.
The Land Law contains a number of aspects related to the environment, which are important to foster sustainable development and the improved use of the soil and natural resources. The Law refers to various other pieces of environmental legislation, with particular emphasis on the Environment Framework Law.
Other legislation is used to support mechanisms for the implementation and enforcement of certain Articles and clauses of the Land Law.
It presents two land classifications, namely urban land (areas for the construction of buildings) and rural land (areas for agriculture, raising livestock, forestry and mining). The ministry dealing with land planning and environment is the government institution that declares such land, based on a proposal from other government entities dealing with similar issues. This is the case for the establishment of mining and oil schemes and the industrial sector. The government decides on the establishment of protected areas (total and partial reserves) for specific purposes, such as environmental protection, national security, preservation of monuments, and historical sites. These reserves include both coastal areas (e.g. territorial sea, contiguous zone, economic exclusive zone, islands and estuaries) and land areas (e.g. roads, inland borders, airports and ports, and military bases).
Ministry of Environment
33WOOD, FISH, AND COFFEE
Water Law, No. 6/02 of 21 June 2002
This Law states the priorities for the use of surface water resources in Angola. It enables the State Secretariat to ensure environmental protection and conservation of areas of partial protection. It provides a list of water management principles, particularly the harmonization of the water management policy with land use planning. The law calls for the development of a General Plan for the Development and Use of Water Resources in Watershed.
It further notes that water resources are State property. Article 6 gives the right to the organ of State responsible for water affairs to ensure the preservation and conservation of areas of partial protection.
The Water Law describes a number of principles of water management that the government should put into practice. These include: the right of individuals and entities to access water; integrated management of water resources; institutional coordination and community participation; the harmonization of the water management policy with land use planning and environmental policies; water as a renewable resource for people; and the relationship between pollution and social and financial issues.
It encourages the development of a new administrative policy for the water sector, which includes a decentralized system of control over the use of water, as well as for the protection of water resources and the environment. In the implementation of such a policy, the government aims to achieve a number of objectives, namely to ensure access to water resources; ensure a continuous balance between the availability of water resources and demand; promote research activities and the sustainable use of existent water resources; ensure proper sewage systems; and regulate the discharge of domestic effluents.
State Secretariat for Water within the
Ministry of Energy and Water
Law on Internal Waters, Ocean and Exclusive Economic Zone, No. 21/92 of 28 August 1992
This Law regulates control over internal waters and lakes.
It also regulates the use of natural resources, the protection of the marine environment, the promotion of scientific marine research, and the use of artificial structures.
State Secretariat for Water within the
Ministry of Energy and Water
Local Municipalities Act, No. 17/99 of 1999
The Act establishes that local governments are responsible for the promotion of development, basic sanitation, environmental protection and land management.
Provincial and local authorities
Foreign Investment Act, No. 15/94 of 23 September 1994
The Act plays an important role in setting up mechanisms to enforce regulations on environmental protection, sanitation and the protection and security of workers against occupational diseases and accidents at work.
Ministry of Planning