Embed Size (px)
Citation preview
APPLIED AND ENVIRONMENTAL MICROBIOLOGY. June 1988, p. 1595-16010099-2240/88/061595-07$02.00/0Copyright C 1988, American Society for Microbiology
National Field Evaluation of a Defined Substrate Method for theSimultaneous Enumeration of Total Coliforms and Escherichia coli
from Drinking Water: Comparison with the Standard MultipleTube Fermentation Method
STEPHEN C. EDBERG,1* MARTIN J. ALLEN,2 DARRELL B. SMITH,3 ANDTHE NATIONAL COLLABORATIVE STUDYt
Depatrtnetit of Laboratory Medicine, Yale Univ'ersitv School oJfMedicine, P. 0. Box 3333, 333 Cedar Street, Newt, Haven.Connecticut 065101; Amieric an Water Wor-ks Association Research Founldationi, Denver, Colorado 802352; a(1id
Soitli Central Conne(cticuit Regionbal Water Authority, New1 Haven, Connecticut 065/ 13
Received 21 January 1988/Accepted 18 March 1988
A defined substrate method was developed to simultaneously enumerate total coliforms and Escherichia colifrom drinking waters without the need for confirmatory or completed tests. It is a new method based on
technology that uses a hydrolyzable substrate as a specific indicator-nutrient for the target microbes. Noequipment other than a 35°C incubator and long-wavelength (366-nm) light is necessary. To perform the test,one only has to add water to the powdered ingredients in a tube or flask. If total coliforms are present in thewater sample, the solution will change from its normal colorless state (no target microbes present) to yellow.The specific presence of E. coli will cause the same tube to fluoresce under a longwave (366-nm) UV lamp. Thetest, called Autoanalysis Colilert (AC), was compared with Standard Methodsfor the Examination of Water andWastewater 10-tube multiple tube fermentation (MTF) in a national evaluation. Five utilities, representing sixU.S. Environmental Protection Agency regions, participated. All water samples came from distributionsystems. Split samples from a wide variety of water sources were analyzed for the MPN-versus-MPNcomparison. A total of 1,086 tubes were positive by MTF, and 1,279 were positive by AC. There was no
statistical difference between MTF and AC. Species identifications from positive tubes confirmed the sensitivityof the AC. A national evaluation of the AC test showed that it: (i) was as sensitive as Standard Methods MTF,(ii) specifically enumerated 1 total coliform per 100 ml, in a maximum of 24 h, (iii) simultaneously enumerated1 E. coli per 100 ml in the same analysis, (iv) was not subject to false-positive or false-negative results byheterotrophic bacteria, (v) did not require confirmatory tests, (vi) grew injured coliforms, (vii) was easy toinoculate, and (viii) was very easy to interpret.
There are two standard methods for the enumeration oftotal coliforms from drinking water. The multiple tube fer-mentation (MTF) technique provides a most-probable-number (MPN) analysis after growth of total coliforms in
liquid medium. The membrane filter (MF) technique enumer-
ates total coliforms on the surface of agar by providing aCFU/100 ml count (1). Both methods require confirmed andcompleted tests after the initial observation of a positiveprimary medium. A complete analysis can require an addi-tional 24 to 72 h for a final result. In neither method is an
isolate identified to species or are any members of the fecalcoliform group differentiated from the total coliform group(9, 10, 14-16, 21). Both the MTF and MF techniques havebeen extensively studied and are approved for regulatorymonitoring purposes (3, 10, 11, 15, 18, 19, 21, 23).During a biofilm total coliform regrowth problem in the
8 Corresponding author.t Investigators in the National Collaborative Study include the
following: Mark LeChevallier, American Water Works ServiceCompany, Belleville, IL 62220; Nancy Kriz and Deborah Callan,Yale University School of Medicine. New Haven, CT 06510; RogerWard and Dawn Calvert, California-American Water Company.Monterey, CA 93940: Wayne Jackson and Michelle Uryc. CobbCounty Marietta Water. Ackworth, GA 30101; Carol Storms andJudy Loriner, Monmouth Consolidated Water Company. TintonFalls, NJ 07724: and Thomas Trok and Michael Burns. West-PennWater Company. Pittsburgh. PA 15226.
distribution system in New Haven, Connecticut (8), severalinherent properties of the MF and MTF techniques limitedthe ability of public health officials to make decisions regard-ing the health risk. Most restricting were the time required toobtain a definitive health-based answer, the inability todifferentiate fecal from total coliforms without either theperformance of tests specifically for fecal coliform or iden-tification of bacteria, and the subjective nature of interpre-tation of the analytical methods. In response to these limi-tations, a new technique was developed, based on
technology originally designed to identify microbes by theanalysis of their constitutive enzymes. This method uses a
hydrolyzable substrate as a defined substrate for only thetarget microbe(s) one wishes to enumerate (S. C. Edberg andM. K. Edberg, Yale J. Biol. Med., in press). The technologyis designated autoanalysis, because a color change is pro-duced by the target microbe(s), with no need for confirma-tory tests or technologist labor. To perform the test, one
need only add water to the powdered formula in a tube orflask and incubate. No equipment other than an incubatorand 366-nm lamp is necessary. Specific color changes denotethe presence of the target microbe(s). Only the target mi-
crobes, total coliforms (yellow) and Escherichia coli (fluo-rescence), produce color changes during the test period.
In applying the autoanalysis technology to microbial wateranalysis, we hoped to achieve the following goals: (i) tospecifically enumerate 1 total coliform per 100 ml in a
1595
Vol. 54. No. 6
on August 15, 2018 by guest
http://aem.asm
.org/D
ownloaded from

APPL. ENVIRON. MICROBIOL.
TABLE 1. Characteristics of participating water utilities
Geographical area Water source Type of Populationutility served
California, New Mexico, Arizona Well, ground, surface Private >250,000Southwestern Pennsylvania Surface, river Private >530,000Connecticut Well, ground, surface, mixed Municipal 400,000Northern New Jersey Well, ground, surface, river Private 250,000Northern Georgia Surface Municipal 250,000
maximum of 24 h, (ii) to simultaneously, specifically enu-merate 1 E. coli per 100 ml in the same test, (iii) to not beaffected by heterotrophic plate count (HPC) organismsfound in drinking water, (iv) to not require confirmatorytests, (v) to grow injured coliforms, (vi) to be easy toinoculate, and (vii) to be very easy to interpret.The autoanalysis method was compared in a national
evaluation with the 10-tube MTF test described in StandardMethods for the Examination of Water and Wastewater (1).The protocol explicitly followed was that of the U.S. Envi-ronmental Protection Agency (E.P.A.) Environmental Mon-itoring Support Laboratory for certification of an alternativemethod (6). Collaborative water utilities were chosen toreflect all sources of drinking water and to represent avariety of geographical locations, treatment techniques, andwater quality conditions.
MATERIALS AND METHODS
Participants and samples. Five utilities, representing sixU.S. E.P.A. regions, participated in the national evaluation(Table 1). The utilities ranged from those serving a singlegeographical area to those serving large numbers of smallcommunity water systems over three states. Water sourcesincluded deep and shallow wells, springs, rivers, and surfacereservoirs. All water samples were obtained from distribu-tion systems by the participating utilities; however, an effortwas made to obtain water from locations most likely to yieldpositive samples, such as dead ends, storage reservoirs, andknown problem sites. In accordance with U.S. E.P.A.Environmental Monitoring Support Laboratory guidelines,sites were permitted to mix small amounts of treatmenteffluent or raw water with a large volume of distributionwater to achieve positive samples with natural microbialpopulations (6). Samples were also collected during periodsof flushing. These water samples were not necessarily thoseused for routine monitoring for regulatory purposes. Sec-tions of two of the utilities had been experiencing totalcoliform regrowth problems.Water samples were collected, transported, and stored in
strict accordance with the guidelines described by StandardMethods and the U.S. E.P.A. (6, 13). Either sterile poly-methylpentene or glass flasks containing sodium thiosulfatewere used to collect the samples.AC test. The defined substrate method, called Auto-
analysis Colilert (AC), was prepared for us as 10-tube MPNtests (Access Medical Systems, Branford, Conn.). The pow-der formula contained, per liter, the following: (NH2)4SO4, 5g; Mn(SO4)2, 0.5 ,ug; ZnSO4, 0.5 ,ug; MgSO4, 100 mg; NaCl,10 g; CaCl2, 50 mg; KH2PO4, 900 mg; Na2HPO4, 6.2 g;Na2SO3, 40 mg; amphotericin B, 1 mg; ortho-nitrophenyl-p-D-galactopyranoside (ONPG), 500 mg; 4-methylumbelliferyl-P3-D-glucuronide (MUG), 75 mg; and Solanium, 50 mg.Solanium is a plant extract mixture that acts as an emulsifier.
All ingredients were obtained from Sigma Chemical Co.(St. Louis, Mo.), with the exception of Solanium (Access
Medical Systems). Each test tube (13 by 100 mm) wasaseptically filled and heat disinfected at 70°C for 0.5 h. Thequality control parameters were based on the followingcriteria; the test must detect 1 CFU/100 ml in 24 h inenvironmental isolates of E. coli, Klebsiella pneumoniae,Enterobacter cloacae, and Citrobacter freundii and not besubject to interference by at least 10,000 CFU of Pseudomo-nas, Flavobacterium, and Aeromonas spp. per ml. A highproportion (1.5%) of tubes was chosen for quality control.Each of the test species was diluted to 1 CFU/100 ml, and anMPN analysis was performed. In addition, species of heter-otrophs at concentrations of 10,000/ml were mixed withthese bacterial concentrations in separate test tubes. Posi-tive (yellow or yellow and fluorescent) had to be observed in24 h.The AC method was performed as follows: 10 ml of water
was added to each tube, dissolving the powder after agitationand producing a colorless solution. The test tubes wereincubated at 35°C for 24 h. Development of a yellow colorafter incubation indicated the presence of total coliforms inthe test tube. Each positive total coliform test tube wasexposed to a hand-held fluorescent (366-nm) light (EdmundScientific Co., Barrington, N.J.) Fluorescence in the testspecifically denoted the presence of E. coli. Therefore, aseparate MPN analysis was obtained for total coliforms andE. coli by the 10-tube AC method. It was designed so that noconfirmatory or completed tests need be performed with theAC test.MTF test. The 10-tube MTF test was performed with each
tube containing 10 ml of double-strength lauryl tryptosebroth (LTB; Difco Laboratories, Detroit, Mich.). Positivetubes were confirmed in brilliant green lactose bile broth(BGLB broth; Difco) (4). The number of coliforms per 100ml was estimated from a 10-tube MPN table (1). Tests thatconfirmed initial positive results were included in the database.HPC. An HPC was determined for each water sample
according to Standard Methods using R2A agar incubated at35°C for 48 h (1).
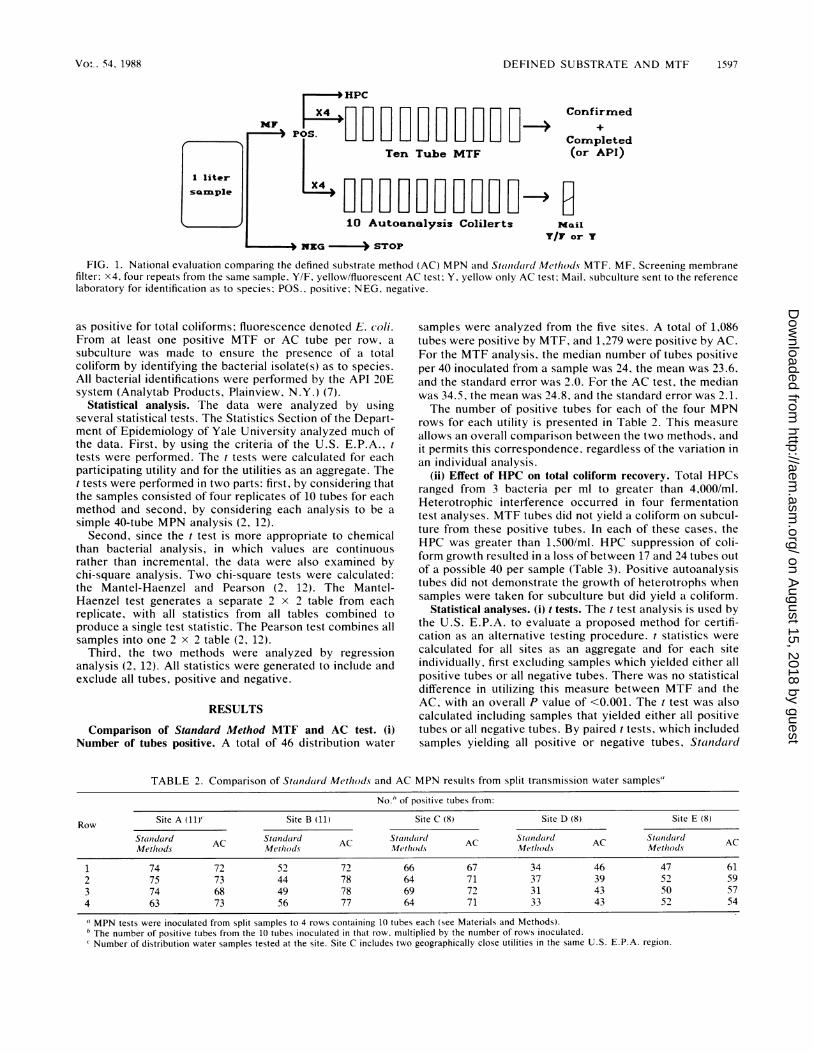
Evaluation protocol. Sufficient water was collected fromeach location to perform a simultaneous split sample analy-sis by the AC test and the MTF technique. For each watersample, the following microbiological analyses were per-formed: HPC, a 10-tube AC MPN analysis, and an MTF test(Fig. 1). Within the guidelines of the Handbook for Evaluat-ing Water Bacteriological Laboratories (13), samples wereprescreened for the presence of coliforms before beinganalyzed. The U.S. E.P.A. equivalency protocol called forfour replicate analyses of each method from each sample.Accordingly, four rows of 10 LTB tubes and four rowscontaining 10 AC tubes were inoculated from each 1-literwater sample. LTB tubes were examined for positivityaccording to Standard Methods (1). Confirmation tests werealso performed according to Standard Methods (1). The ACtube was examined at 24 h. Any yellow color was designated
1596 EDBERG ET AL.
on August 15, 2018 by guest
http://aem.asm
.org/D
ownloaded from
DEFINED SUBSTRATE AND MTF 1597
I liter
sample
*, HPC
Ten Tube MTF (
10 Autoanalysis Colilerts MliT/F o
NEG >- STOP
onfirmed
ompletedor API)
ilor Y
FIG. 1. National evaluation comparing the defined substrate method (AC) MPN and Standardl Metllods MTF. MF. Screening membranefilter, x4, four repeats from the same sample. Y/F, yellow/fluorescent AC test: Y. yellow only AC test: Mail, subculture sent to the reference
laboratory for identification as to species; POS.. positive: NEG. negative.
as positive for total coliforms; fluorescence denoted E. coli.From at least one positive MTF or AC tube per row, a
subculture was made to ensure the presence of a totalcoliform by identifying the bacterial isolate(s) as to species.All bacterial identifications were performed by the API 20Esystem (Analytab Products, Plainview, N.Y.) (7).
Statistical analysis. The data were analyzed by usingseveral statistical tests. The Statistics Section of the Depart-ment of Epidemiology of Yale University analyzed much ofthe data. First, by using the criteria of the U.S. E.P.A., ttests were performed. The t tests were calculated for eachparticipating utility and for the utilities as an aggregate. Thet tests were performed in two parts: first, by considering thatthe samples consisted of four replicates of 10 tubes for eachmethod and second, by considering each analysis to be a
simple 40-tube MPN analysis (2, 12).Second, since the t test is more appropriate to chemical
than bacterial analysis, in which values are continuousrather than incremental, the data were also examined bychi-square analysis. Two chi-square tests were calculated:the Mantel-Haenzel and Pearson (2, 12). The Mantel-Haenzel test generates a separate 2 x 2 table from eachreplicate, with all statistics from all tables combined toproduce a single test statistic. The Pearson test combines allsamples into one 2 x 2 table (2, 12).
Third, the two methods were analyzed by regressionanalysis (2, 12). All statistics were generated to include andexclude all tubes, positive and negative.
RESULTS
Comparison of Standard Method MTF and AC test. (i)Number of tubes positive. A total of 46 distribution water
samples were analyzed from the five sites. A total of 1,086tubes were positive by MTF, and 1,279 were positive by AC.For the MTF analysis, the median number of tubes positiveper 40 inoculated from a sample was 24, the mean was 23.6,and the standard error was 2.0. For the AC test, the medianwas 34.5, the mean was 24.8, and the standard error was 2.1.The number of positive tubes for each of the four MPN
rows for each utility is presented in Table 2. This measure
allows an overall comparison between the two methods, andit permits this correspondence, regardless of the variation in
an individual analysis.(ii) Effect of HPC on total coliform recovery. Total HPCs
ranged from 3 bacteria per ml to greater than 4,000/ml.Heterotrophic interference occurred in four fermentationtest analyses. MTF tubes did not yield a coliform on subcul-ture from these positive tubes. In each of these cases, theHPC was greater than 1,500/ml. HPC suppression of coli-form growth resulted in a loss of between 17 and 24 tubes outof a possible 40 per sample (Table 3). Positive autoanalysistubes did not demonstrate the growth of heterotrophs whensamples were taken for subculture but did yield a coliform.
Statistical analyses. (i) t tests. The t test analysis is used bythe U.S. E.P.A. to evaluate a proposed method for certifi-cation as an alternative testing procedure. t statistics were
calculated for all sites as an aggregate and for each siteindividually, first excluding samples which yielded either allpositive tubes or all negative tubes. There was no statisticaldifference in utilizing this measure between MTF and theAC, with an overall P value of <0.001. The t test was alsocalculated including samples that yielded either all positivetubes or all negative tubes. By paired t tests, which includedsamples yielding all positive or negative tubes, Standar-d
TABLE 2. Comparison of Standaird Metlhods and AC MPN results from split transmission water samples"No." of positive tubes from:
Row Site A (11)' Site B (11) Site C (8) Site D (8) Site E (8)Staidcard AC Standaird AC Standard AC Statidaird AC Stantdarcd ACMetliods Methlods Methods Metlhods Methods
1 74 72 52 72 66 67 34 46 47 612 75 73 44 78 64 71 37 39 52 593 74 68 49 78 69 72 31 43 50 574 63 73 56 77 64 71 33 43 52 54
MPN tests were inoculated from split samples to 4 rows containing 10 tubes each (see Materials and Methods).b The number of positive tubes from the 10 tubes inoculated in that row, multiplied by the number of rows inoculated.C Number of distribution water samples tested at the site. Site C includes two geographically close utilities in the same U.S. E.P.A. region.
Vo -. 54, 1988
on August 15, 2018 by guest
http://aem.asm
.org/D
ownloaded from
1598 EDBERG ET AL.
TABLE 3. Recovery of HPC-suppressed Standard Methodstube by AC
Standard Methods No. positive HPCSample no. b C (F/iNo. positive No. suppressed by AC (CFU/ml)
16 11 17 28 >3,00022 17 22 39 >4,50030 22 18 40 >1,00042 2 24 26 >2,500
Methods MPN gave a mean and standard deviation of 23.609+ 13.881 (compared with 27.804 + 14.120 by AC), with 46paired observations; the t statistic was -4.196, with 45degrees of freedom and 0.000 significance. Although the ACmethod appeared to yield somewhat higher MPN values(Table 2; also see Fig. 2), there was no difference betweenthe two methods by this anaylsis, with a P value of <0.001.
(ii) Chi-square analyses. The two methods were also com-
pared by two chi-square statistics. First, the Pearson chi-square test for the overall proportion of positive tubes was
determined. By this analysis, three of the utilities demon-strated that the AC was more sensitive than the StandardMethods MTF (P > 0.05); there was a positive bias, withslightly greater AC sensitivity overall. The Mantel-Haenzeltest compared the two methods by determining the differ-ence between the positive tubes for each method and sub-tracting from it the expected number of positive tubes andanalyzing the differences. This statistic yielded the same
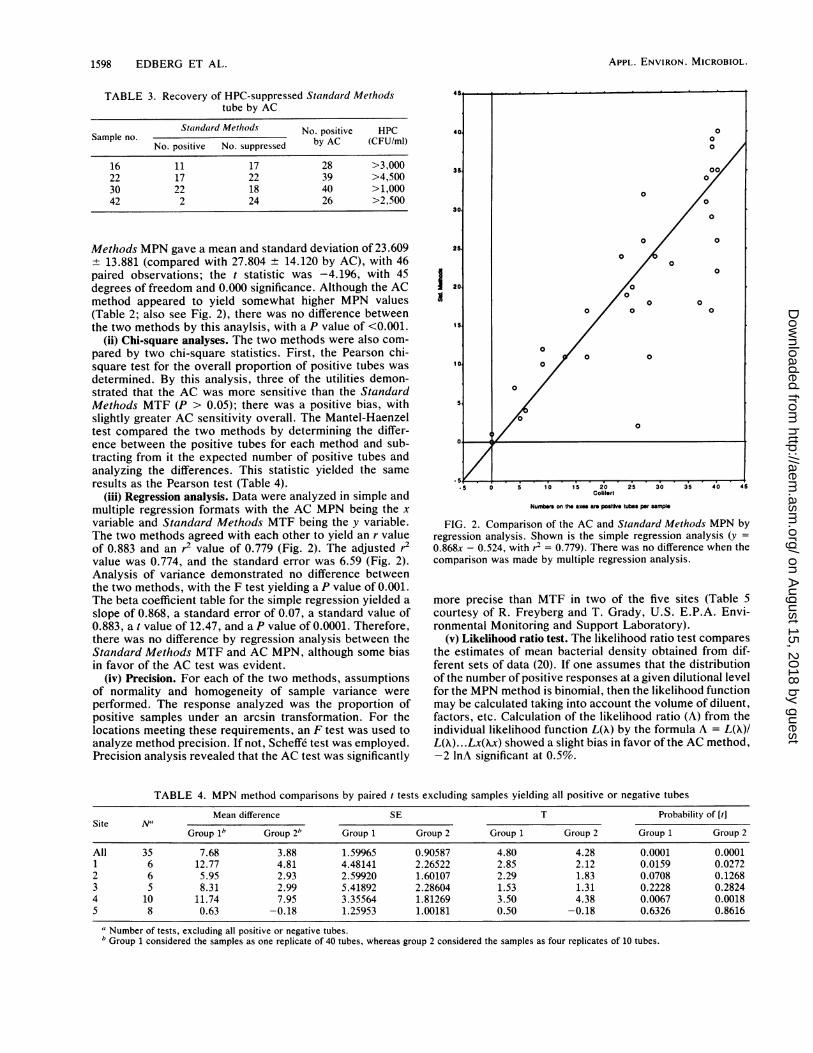
results as the Pearson test (Table 4).(iii) Regression analysis. Data were analyzed in simple and
multiple regression formats with the AC MPN being the x
variable and Standard Methods MTF being the y variable.The two methods agreed with each other to yield an r valueof 0.883 and an r2 value of 0.779 (Fig. 2). The adjusted r2value was 0.774, and the standard error was 6.59 (Fig. 2).Analysis of variance demonstrated no difference betweenthe two methods, with the F test yielding a P value of 0.001.The beta coefficient table for the simple regression yielded a
slope of 0.868, a standard error of 0.07, a standard value of0.883, a t value of 12.47, and a P value of 0.0001. Therefore,there was no difference by regression analysis between theStandard Methods MTF and AC MPN, although some biasin favor of the AC test was evident.
(iv) Precision. For each of the two methods, assumptionsof normality and homogeneity of sample variance were
performed. The response analyzed was the proportion ofpositive samples under an arcsin transformation. For thelocations meeting these requirements, an F test was used toanalyze method precision. If not, Scheffe test was employed.Precision analysis revealed that the AC test was significantly
1200
0 0
0 0
0
010 0
0
5.
0~~~~~~
0 1'5 25 310 40 45
Colilert
Numb on the axes are positiv tiubes per sample
FIG. 2. Comparison of the AC and Standard Methods MPN byregression analysis. Shown is the simple regression analysis (y =
0.868x - 0.524, with r2 = 0.779). There was no difference when thecomparison was made by multiple regression analysis.
more precise than MTF in two of the five sites (Table 5courtesy of R. Freyberg and T. Grady, U.S. E.P.A. Envi-ronmental Monitoring and Support Laboratory).
(v) Likelihood ratio test. The likelihood ratio test comparesthe estimates of mean bacterial density obtained from dif-ferent sets of data (20). If one assumes that the distributionof the number of positive responses at a given dilutional levelfor the MPN method is binomial, then the likelihood functionmay be calculated taking into account the volume of diluent,factors, etc. Calculation of the likelihood ratio (A) from theindividual likelihood function L(X) by the formula A = L(A)IL()...Lx(Xx) showed a slight bias in favor of the AC method,-2 InA significant at 0.5%.
TABLE 4. MPN method comparisons by paired t tests excluding samples yielding all positive or negative tubes
Mean difference SE T Probability of [t]Site NO
Group lb Group 2" Group 1 Group 2 Group 1 Group 2 Group 1 Group 2
All 35 7.68 3.88 1.59965 0.90587 4.80 4.28 0.0001 0.00011 6 12.77 4.81 4.48141 2.26522 2.85 2.12 0.0159 0.02722 6 5.95 2.93 2.59920 1.60107 2.29 1.83 0.0708 0.12683 5 8.31 2.99 5.41892 2.28604 1.53 1.31 0.2228 0.28244 10 11.74 7.95 3.35564 1.81269 3.50 4.38 0.0067 0.00185 8 0.63 -0.18 1.25953 1.00181 0.50 -0.18 0.6326 0.8616
"Number of tests, excluding all positive or negative tubes.b Group 1 considered the samples as one replicate of 40 tubes, whereas group 2 considered the samples as four replicates of 10 tubes.
APPL. ENVIRON. MICROBIOL.
on August 15, 2018 by guest
http://aem.asm
.org/D
ownloaded from

DEFINED SUBSTRATE AND MTF 1599
TABLE 5. Precision of the two methods by source
P valueLocation
F test Scheffe test
Cobb County, Ga. 0.2266Monterey, Calif. 0.0131aTinton Falls, N.J. 0.1534New Haven, Conn. 0.0006"Pittsburg, Pa. 0.5725
a Standard Methods MTF was significantly less precise than the ACmethod.
Performance characteristics. The original performancegoals for which the AC was designed were met, and addi-tional benefits became apparent. The collaborators felt thatthe yellow color produced by the total coliforms and thefluorescence generated by E. coli were distinct, easy to read,and apparent within the time framework of the test (24 h).They also noted that total coliform counts greater than 25/100 ml yielded results in 16 to 18 h. Separate MPNs for totalcoliforms and E. coli were produced simultaneously. Allparticipants affirmed the ease of one-step inoculation andclarity of interpretation of positive test results. They sub-stantiated the autoanalytical nature of the test by verifyingthe goal that confirmatory tests need not be performedbecause of the specificity of the ingredients.
Bacteria isolated. Bacteria isolated from each split samplewere identified as to species (Table 6). Bacteria commonlyconsidered part of the total coliform group were found fromboth Standard Methods MTF and AC tubes. K. pneumoniaewas the most common species isolated, followed by E.cloacae and C. freundii. There were mixed cultures of totalcoliforms present in both MTF and AC tubes. The higher thebacterial count in the water sample, the greater the numberof species found. There did not appear to be a significantdifference in the distribution of bacterial species in eithermethod.
DISCUSSIONThe AC test is based on a new technological principle in
which an indicator-nutrient is an essential food source for
TABLE 6. Species of total coliforms isolated'
% of all isolatesbelonging to species
Species by method:Standard ACMethods
Klebsiella pneumoniae 31 28K. oxytoca 3 6Enterobacter agglomerans 19 16Enterobacter species 3 7E. cloacae 10 11E. aerogenes 1 1Citrobacter freundii 16 12Serratia plymuthica 3 4S. fonticola 1 1S. rubidaea 3 4S. odorifera 2 3Hafnia alvei 1 1Escherichia coli 1 1CDC groups 3 4Unidentified Enterobacteriaceae 3 3
a All isolates confirmed in BGLB.
the target microbe (Edberg and Edberg, in press). Because achromophore is released each time an indicator-nutrientmolecule is hydrolyzed, color production is directly relatedto the growth of the target bacteria. In the application of thistechnology to drinking water analysis, the indicator-nutri-ents are ONPG (for total coliforms) and MUG (for E. coli).Unlike classical enzyme assays, which use ONPG or MUGonly as substrates for constitutive enzyme tests, the autoan-alysis technology uses these compounds both as an essentialgrowth substance and as an indicator system (color forma-tion and fluorescence). Therefore, there is not a directcorrespondence between tests in which ONPG and MUG areused as substrates in constitutive enzyme tests (e.g., Coli-ferm; Millipore Corp., Waltham, Mass.) and the growth-dependent AC test. For example, species in the generaAeromonas, Pseudomonas, or Flavobacterium that may bepositive in a constitutive ONPG or MUG enzyme assay willnot be positive in the 24-hour growth-based AC test, unlessa high density (.20,000 bacteria per ml) is present (Edbergand Edberg, in press).
In conventional medium, several secondary reactionsmust occur before a change in the indicator is visible. Thetarget microbe must transport the substrate (e.g., lactose)through the cell membrane, transform the substrate to glu-cose, metabolize glucose through the glycolytic cycle topyruvate, and then convert pyruvate to the desired endproduct, either acid or gas. Because conventional testingrequires the microbe to go through many steps to yield apositive visible endpoint, a number of anomalous resultsmay occur, such as false-negative gas producers (i.e., anae-rogenic E. coli) or false-positive tests (i.e., acid from lactoseby some clones of Aeromonas hydrophilia). ONPG-positivenoncoliforms do not yield a positive AC test, because theformula does not support their metabolism. Therefore, thedetection of the ,B-galactosidase system of heterotrophs willoccur only at extremely high microbial concentrations (>20to 100,000/ml). This phenomenon will be seen with approx-imately 10% of members of the genus Aeromonas.The specificity of the defined substrate autoanalysis tech-
nology eliminates the need to perform confirmatory andcompleted tests. In conventional methodology, transfersfrom the original positive tube or plate must be made intoBGLB broth for confirmatory testing and a second transfermust be made to solid or liquid medium for a completed test.As substantiated in this national evaluation (Table 6), the24-h AC test is as specific as the multiple day confirmed andcompleted Standard Methods MTF analysis.
Species identification from positive tubes confirmed thespecificity of the AC test. From positive AC tubes, membersof the total coliform group were recovered. Therefore,yellow test tubes were only the result of the growth of thetarget microbe(s). Likewise, E. coli was routinely recoveredfrom tubes that fluoresced.
In addition to specificity, the autoanalysis technology wasshown to have equal sensitivity with Standard MethodsMTF. Standard Methods MTF testing will enumerate one(.1.1 for a 10-tube test) total coliform per 100 ml (1). The ACtest also demonstrated this level of sensitivity, even in thepresence of high concentrations of heterotrophic bacteria. Ithas been noted that current methods are subject to hetero-troph interference above 500 to 1,000 HPC per ml (4).Because the AC test does not support the growth of hetero-trophs in the densities found in water, these bacteria did notinterfere.There did not appear to be a loss in sensitivity due to the
inability to enumerate injured coliforms. Previous laboratory
VOL. 54, 1988
on August 15, 2018 by guest
http://aem.asm
.org/D
ownloaded from

APPL. ENVIRON. MICROBIOL.
analysis demonstrated that the AC test can enumerate in-jured coliforms within 24 h, although the intensity of colorproduction is less, compared with that of noninjured coli-forms (Edberg and Edberg, in press).
Several benefits other than those described above werenoted by participating water utilities during the nationalevaluation. The autoanalytical nature of the method made itmuch more practical and efficient to perform than currentcoliform methods. The participants felt that interpretation ofthe AC test was less subjective than that of the StandardMethods procedure. It was much easier to see whether ayellow color or fluorescence was produced than to decidewhether LTB tubes were positive. The determination of gaswas often subjective and not enhanced by an additional 2 to4 h of incubation. Because the colors were distinct, it waspossible that a moderately trained individual could interpretthe AC test. Furthermore, since there were no additionaltests needed, an analysis did not extend through weekends,which could result in a delay of 2 to 5 days in obtainingdefinitive results. Also, in contrast to other methods inwhich weekends added 2 or more days to the analysis,several participants said that they would be willing to testwater on Friday and have someone briefly stop in onSaturday to read the results, thus adding only 1 day to thetesting regimen. Virtually any water utility employee couldaccurately read and record the AC test results.Because the ingredients are in powder form and have an
unrefrigerated shelf life of at least 1 year, the participants feltthat they could stock a large number of tubes. This wouldenable the utilities to respond quickly to either changes inthe work flow or emergencies.A strength of the AC test is its applicability to use by the
small utility. First, the AC test can be inoculated in the field.Once the formula is hydrated, the bacteria begin to grow,although more slowly at ambient than incubator tempera-ture. Moreover, one avoids any change in the bacterialcomposition of the water sample during storage and trans-port. After incubation, the characteristic nature of the colorsmakes it possible for the small-utility operator to determinethe presence of both total coliforms and E. coli. Thisimmediate reading of results could eliminate, with stateapproval, the inherent delay in sending samples to commer-cial laboratories. Prolonging sample transit times results inquestionable or unacceptable results (6). In addition, signif-icant monetary savings can be realized by the small utility,because their only cost for bacteriological water monitoringis the cost of the test itself. If state certifying agenciesrequire independent verification of the test, the small utilitycan forward the AC tube to a reference laboratory. Thetarget microbes remain viable in the test for at least 7 daysand can be analyzed by another laboratory, if required. Thedouble-strength lactose broth (DSLB) can also be inoculatedin the field. However, the determination of a positive resultfrom DSLB is much more subjective than the reading of anAC tube. Furthermore, once color forms in the AC tube it ispermanent; extended incubation of the DSLB can result inchanges in the medium which make it difficult to interpret.The cost of the AC test for a single water sample is
between 20 and 100% less than Standard Methods MTFtesting, depending upon whether the utility performs theanalysis itself or sends it to an outside laboratory (commer-cial or regulatory). The participants felt that the major costsaving associated with the test lies in decreased labor andbetter quality control.The AC test provides the simultaneous detection of the
major fecal coliform, E. coli, for no additional cost or effort.
Current Safe Water Drinking Act Regulations do not cur-rently require the routine analysis for this species. However,the new regulations may mandate it (11). It is generallythought that E. coli is a much more specific indicator of thefecal pollution of freshwater than are total coliforms. Thetotal coliform group is used now, because it has beentechnically difficult to analyze water directly for this species(5). Public health authorities generally feel that the absenceof E. coli, even when distribution water has total coliforms ina biofilm regrowth situation, indicates that the finished wateris acceptable for consumption (17). Therefore, the ability tosimultaneously assay for both total coliforms and E. coli isan added dimension to water analysis not previously avail-able. It will provide utilities an immediate measure ofwhether a sample has been subject to fecal contamination.The utility would not have to perform fecal coliform analysesor bacterial identifications on colonies after subculture of theprimary test, as they do now. This additional testing coulddelay a definitive answer for several days, an undesirablesituation engendered by the current available technology. Inmany cases, additional water samples have to be tested ifone wished to pursue a possible pollution event further todetermine whether E. coli was present in the positive sam-ple; with the AC method, this would not be necessary. Theanalyst would know whether total coliforms, for regulatorypurposes, and E. coli, for public health purposes, werepresent in the same sample.
It should be noted that the AC test has specific limitations.First, while it has been found to be refractory to the densityof heterotrophs encountered in the national evaluation, inthe laboratory one species of bacterium, A. hydrophilia, wasfound to yield a positive endpoint (yellow color) after 32 h ofincubation at very high densities. A total of 20 Aeromonasisolates were tested, and a wide range of activity wasobserved; however, 2 isolates showed positive total coliformreactions at inoculation densities of 20,000/ml at 32- and 36-hincubation, respectively (Edberg and Edberg, in press).While these Aeromonas concentrations are unlikely to beencountered in drinking water, and the test should notextend beyond a 24- to 28-h incubation period, it is recom-mended that any AC test incubated for more than 30 h andthen noted as positive should be confirmed by a BGLBbroth, other Standard Methods confirmation, or speciesidentification.
Isolates of Pseiudomonas and Flavobacterium species didnot demonstrate positive total coliform or E. coli tests atconcentrations up to 50,000 bacteria per ml. Petzel andHartman (22) did report Flavobacterium sp. isolates thatyielded a positive constitutive enzyme MUG test frombacterial colonies. These were tested (courtesy of EugeneRice, U.S. E.P.A.) and did not yield a positive result untildensities unlikely to be found in drinking water (.100,000bacteria per ml) were reached (unpublished results). Itappears that at very high bacterial densities, the AC test mayact as an enzyme assay and become positive, not through agrowth mechanism, but by direct enzyme measurement.Therefore, the AC test should not be used as a confirmatorytest from either MTF broths or colonies from plates.
Second, laboratory testing has shown that injured coli-forms exhibit a longer lag phase than normal coliforms in theAC test (Edberg and Edberg, in press). It was found thatonce the injured coliforms repaired themselves and enteredlog phase they grew as rapidly as normal coliforms. Practi-cally, this meant that the intensity of yellow color producedat 24 h by injured coliforms may be less than that producedby normal coliforms. If kept between 2 and 4 h longer than
1600 EDBERG ET AL.
on August 15, 2018 by guest
http://aem.asm
.org/D
ownloaded from
DEFINED SUBSTRATE AND MTF 1601
the 24-h incubation period, the injured coliforms achievedthe same color level as normal total coliforms. Therefore, itis recommended that if no color is noted at 24 h, the resultshould be considered negative; if any yellow color is noted,the result should be considered positive. If the analyst isunsure of color formation, he or she should reincubate thetest for an additional 2 to 4 h and examine it for an increasein yellow color. This additional incubation period will alsoaccount for the slightly yellow color that some waters mayhave due to humic material, because these tubes will notincrease their color intensity and can be classified negative.
Third, although the AC determines the presence of E. colisimultaneously with total coliforms, this should not beconsidered the same as a fecal coliform test. E. coli makesup approximately 90% or more of fecal coliforms, but otherbacteria, notably K. pneumoniae, may also fall into thiscategory if it grows at 44.5°C in E. C. broth with theproduction of gas (1). Therefore, if E. coli is found by the ACtest, one may consider the sample to be fecal coliformpositive; however, if E. coli is not detected, there may stillbe fecal coliforms in the sample.
Lastly, the national evaluation of the AC test was limitedby design to drinking water distribution samples. If the testis to be applied to a different water source, such as stormrunoff, marine waters, waste effluents, etc., the user shouldfirst establish the efficacy of the test in the environment.
In summary, the AC test can simultaneously detect totalcoliforms and E. coli from a water sample within 24 h. Noconfirmatory or completed tests need be performed. HPCbacteria do not interfere in densities likely to be encoun-tered. All one does is add water to the tubes and incubatethem for a maximum of 24 h. Interpretation of the endpoints,yellow for total coliforms and fluorescence for E. coli, isdistinct. A national evaluation conducted according to U.S.E.P.A. protocol demonstrated that this test was equivalentwith Standard Methods MTF. The AC is less costly thanStandard Methods MTF and requires considerably lesslabor. It allows small utilities to test as accurately as largeones, further ensuring safe water. The method is currentlyundergoing national evaluation as a presence-absence test,since this format may be mandated for regulatory purposesin the future (11).
ACKNOWLEDGMENTS
We thank Ramon Lee for his helpful discussions during the courseof this project. Edwin Geldreich, U.S. E.P.A., is thanked for hisreview of the manuscript. This study was reviewed by a projectadvisory committee of Joyce Kippin, Ipswich, Mass., RichardTobin, Health and Public Welfare, Canada, and Donald J. Reasoner,U.S. E.P.A.This work was supported, in part, by the U.S. E.P.A. through a
cooperative agreement (CR811335) with the American Water WorksAssociation Research Foundation.
LITERATURE CITED1. American Public Health Association. 1985. Standard methods for
the examination of water and wastewater, 16th ed. AmericanPublic Health Association, Inc., Washington, D.C.
2. Bishop, Y. M., W. E. Fienberg, and P. W. Holland. 1975.Discrete multivariate analysis: theory and practice. MIT Press,Cambridge, Mass.
3. Bissonnette, G. K., J. J. Jezeski, and G. A. McFeters, and D. G.Stuart. 1977. Evaluation of recovery methods to detect coli-forms in water. Appl. Microbiol. 33:590-595.
4. Bordner, R., and J. Winter (ed.). 1978. Microbiological methodsfor monitoring the environment-water and wastes. U.S. Envi-ronmental Protection Agency, Cincinnati.
5. Cabelli, V. J. 1982. Microbial indicator systems for assessingwater quality. Antonie van Leeuwenhoek J. Microbiol. 48:613-618.
6. Covert, T. C. 1985. U.S. Environmental Protection Agency'sMethods Equivalency Program For Drinking Water Samples.U.S. Environmental Protection Agency, Cincinnati.
7. Edberg, S. C., B. Atkinson, C. Chambers, M. H. Moore, L.Palumbo, C. F. Zorzon, and J. M. Singer. 1979. Clinical evalu-ation of the MICRO-ID, API 20E, and conventional mediasystems for identification of Enterobacteriaceae. J. Clin. Micro-biol. 10:161-167.
8. Edberg, S. C., V. Piscitelli, and M. Cartter. 1986. Phenotypiccharacteristics of coliform and noncoliform bacteria from apublic water supply compared with regional and national clinicalspecies. Appl. Environ. Microbiol. 52:474-478.
9. Evans, T. M., M. W. LeChevallier, C. E. Waarvick, and R. J.Seidler. 1981. Coliform species recovered from untreated sur-face water and drinking water by the membrane filter, standard,and modified most-probable-number techniques. Appl. Envi-ron. Microbiol. 41:657-663.
10. Evans, T. M., C. E. Waarvick, R. J. Seidler, and M. W.LeChevallier. 1981. Failure of the most-probable-number tech-nique to detect coliforms in drinking water and raw watersupplies. Appl. Environ. Microbiol. 41:130-138.
11. Federal Register. 1975. National interim primary water regula-tions. Fed. Regist. 40:59566-59588.
12. Fleiss, J. L. 1981. Statistical methods for rates and proportions,2nd ed. John Wiley & Sons, Inc., New York.
13. Geldreich, E. E. 1975. Handbook for evaluating water bacteri-ological laboratories, 2nd ed. U.S. Environmental ProtectionAgency, Cincinnati.
14. Geldreich, E. E., H. D. Nash, D. J. Reasoner, and R. H. Taylor.1972. The necessity of controlling bacterial populations inpotable waters: community water supply. J. Am. Water WorksAssoc. 64:596-602.
15. Jacobs, N. J., W. L. Zeigler, F. C. Reed, T. A. Stukel, and E. W.Rice. 1986. Comparison of membrane filter, multiple-fermenta-tion-tube, and presence-absence techniques for detecting totalcoliforms in small community water systems. Appl. Environ.Microbiol. 51:1007-1012.
16. LeChevallier, M. W., S. C. Cameron, and G. A. McFeters. 1983.New medium for improved recovery of coliform bacteria fromdrinking water. Appl. Environ. Microbiol. 45:484-492.
17. Ludwig, F., A. Cocco, S. C. Edberg, J. L. Hadler, and E. E.Geldreich. 1985. Detection of elevated levels of coliform bacte-ria in a public water supply-Connecticut. Morbid. Mortal.Weekly Rep. 34:142-144.
18. McFeters, G. A., S. C. Cameron, and M. W. LeChevallier. 1982.Influence of diluents, media, and membrane filters on thedetection of injured waterborne coliform bacteria. Appl. Envi-ron. Microbiol. 43:97-103.
19. McFeters, G. A., and D. G. Stuart. 1972. Survival of coliformbacteria in natural waters: field and laboratory studies withmembrane-filter chambers. Appl. Microbiol. 24:805-811.
20. Maul, A., J. C. Block, and A. H. El-Shaarawi. 1985. Statisticalapproach for comparison between methods of bacterial enumer-ation in drinking water. J. Microbiol. Methods 4:67-77.
21. Morgan, G. B., P. Gubbins, and V. Morgan. 1965. A criticalappraisal of the membrane filter technic. Health Lab. Sci.2:227-237.
22. Petzel, J. P., and P. A. Hartman. 1986. A note on starchhydrolysis and 3-glucuronidase activity among flavobacteria. J.Appl. Bacteriol. 61:421-426.
23. Shipe, E. L., Jr., and G. M. Cameron. 1954. A comparison ofthe membrane filter with the most probable number method forcoliform determinations from several waters. Appl. Microbiol.2:85-88.
VOL. 54, 1988
on August 15, 2018 by guest
http://aem.asm
.org/D
ownloaded from