Embed Size (px)
Citation preview

National Evaluation of the Transition Care Program
RFT 206/0506
Final Evaluation Report
31 May 2008
Jointly funded by the Commonwealth, State and Territory governments


i
Table of Contents LIST OF TABLES............................................................................................................................................. IV LIST OF FIGURES........................................................................................................................................... VI ACKNOWLEDGEMENTS ............................................................................................................................... VII TRANSITION CARE WORKING GROUP ..................................................................................................... VIII SUMMARY OF ETHICS APPLICATIONS....................................................................................................... IX GLOSSARY...................................................................................................................................................... XI EXECUTIVE SUMMARY................................................................................................................................... 1 1. INTRODUCTION.............................................................................................................................. 6
1.1. FRAMEWORK FOR THE EVALUATION .................................................................................................... 6 1.2. IMPLEMENTATION OF TRANSITION CARE IN EACH JURISDICTION .......................................................... 10
1.2.1. Australian Capital Territory ................................................................................................ 11 1.2.2. New South Wales................................................................................................................. 11 1.2.3. Northern Territory................................................................................................................ 11 1.2.4. Queensland .......................................................................................................................... 11 1.2.5. South Australia .................................................................................................................... 11 1.2.6. Tasmania .............................................................................................................................. 12 1.2.7. Victoria.................................................................................................................................. 12 1.2.8. Western Australia ................................................................................................................ 12
1.3. STRUCTURE OF THE FINAL EVALUATION REPORT .............................................................................. 12 2. BACKGROUND AND RELEVANT LITERATURE........................................................................ 13
2.1. AUSTRALIAN CONTEXT...................................................................................................................... 13 2.1.1. Innovative Care Rehabilitation Service - Australia .......................................................... 13 2.1.2. South Australian randomized controlled trial of a residential transitional care unit ... 14
2.2. INTERMEDIATE CARE IN THE UK........................................................................................................ 15 2.3. POST ACUTE CARE IN THE US .......................................................................................................... 16 2.4. METHODOLOGICAL DIFFICULTIES EVALUATING POST ACUTE CARE AND REHABILITATION INTERVENTIONS
........................................................................................................................................................ 18 2.5. THE HETEROGENEITY OF THE POPULATION TARGETED BY TRANSITION CARE ...................................... 18 2.6. WHAT EVIDENCE LIES BEHIND THE MODELS OF TRANSITION CARE USED IN AUSTRALIA? ..................... 20
2.6.1. Evidence base for Transition Care in the community setting ........................................ 20 2.6.2. Evidence base for Transition Care in the residential setting.......................................... 22 2.6.3. Evidence base for Integrated Systems of Care ................................................................ 22
2.7. SUMMARY ........................................................................................................................................ 25 3. TRANSITION CARE RECIPIENTS: CHARACTERISTICS AND OUTCOMES........................... 26
3.1. BASELINE CHARACTERISTICS OF TRANSITION CARE RECIPIENTS ........................................................ 27 3.2. FUNCTION ........................................................................................................................................ 31 3.3. LENGTH OF STAY .............................................................................................................................. 33 3.4. MODIFIED BARTHEL INDEX EFFICIENCY ............................................................................................. 34 3.5. THE TRANSITION CARE EXPERIENCE ................................................................................................. 34

ii
3.6. HOSPITAL READMISSIONS ................................................................................................................. 35 3.7. RESIDENTIAL AGED CARE ADMISSIONS .............................................................................................. 40 3.8. SURVIVAL ........................................................................................................................................ 41
4. HOW DID VARIATIONS BETWEEN TRANSITION CARE SERVICES AFFECT OUTCOMES? 42 4.1. WHAT AFFECTS INDIVIDUAL LEVEL OUTCOMES?................................................................................. 42 4.2. JURISDICTIONAL VARIATIONS IN HEALTH AND AGED CARE SERVICE PROVISION .................................... 46
5. COMPARISON OF TRANSITION CARE RECIPIENTS WITH OTHER GROUPS OF FRAIL OLDER PEOPLE ........................................................................................................................... 49
5.1. EXTERNAL COMPARISON OF TRANSITION CARE RECIPIENTS TO AUSTRALASIAN REHABILITATION
OUTCOMES CENTRE AND GERIATRIC EVALUATION AND MANAGEMENT UNITS ..................................... 49 5.2. COMPARISONS BASED ON DATA LINKAGE .......................................................................................... 51 5.3. IMPACT ON THE HOSPITAL SYSTEM .................................................................................................... 54 5.4. IMPACT ON THE AGED CARE SYSTEM.................................................................................................. 58 5.5. IMPACT ON AGED CARE ASSESSMENT PROCESSES ........................................................................... 62
6. WHAT ARE THE ESTIMATED COSTS OF ACHIEVING THE OUTCOMES?............................. 65 7. WHAT DID THE TRANSITION CARE SERVICES SAY ABOUT QUALITY IN
TRANSITION CARE?.................................................................................................................... 70 8. ISSUES FROM EACH JURISDICTION......................................................................................... 73
8.1. AUSTRALIAN CAPITAL TERRITORY .................................................................................................... 73 8.2. NEW SOUTH WALES ......................................................................................................................... 73 8.3. NORTHERN TERRITORY..................................................................................................................... 73 8.4. QUEENSLAND................................................................................................................................... 73 8.5. SOUTH AUSTRALIA ........................................................................................................................... 74 8.6. TASMANIA ........................................................................................................................................ 75 8.7. VICTORIA ......................................................................................................................................... 76 8.8. WESTERN AUSTRALIA ...................................................................................................................... 77
9. STRENGTHS AND LIMITATIONS OF THE NATIONAL EVALUATION OF THE TRANSITION CARE PROGRAM .................................................................................................. 79
9.1. REGIONAL CHARACTERIZATION STUDY ............................................................................................. 79 9.2. MODELS OF TRANSITION CARE ......................................................................................................... 79 9.3. QUALITY ASSESSMENT STUDY .......................................................................................................... 80 9.4. RECIPIENT SNAPSHOT STUDY ........................................................................................................... 80 9.5. CONTROLLED COMPARISON STUDY AND COSTS AND EFFECTS STUDY ............................................... 81 9.6. OVERALL STRENGTHS AND LIMITATIONS ............................................................................................ 82
10. SUMMARY AND FUTURE DIRECTIONS..................................................................................... 84 10.1. DISCUSSION ..................................................................................................................................... 84 10.2. COMPARISON OF THE INNOVATIVE CARE REHABILITATION SERVICES PILOT AND THE NATIONAL
EVALUATION OF THE TRANSITION CARE PROGRAM ............................................................................ 92 10.3. AREAS FOR FUTURE WORK ............................................................................................................... 96 10.4. SUMMARY ........................................................................................................................................ 97
11. REFERENCES............................................................................................................................... 98

iii
APPENDIX 1 ................................................................................................................................................. 104 APPENDIX 2 ................................................................................................................................................. 106 APPENDIX 3 ................................................................................................................................................. 108

iv
List of Tables Table 1.1: National Evaluation of the Transition Care Program timetable ............................................. 9
Table 1.2: Allocation and operation of Transition Care places as at 30 June 2007............................. 10
Table 1.3: Cumulative number of discharges by type of Transition Care October 2005-Feb 2008..... 10
Table 3.1: Sample of Transition Care recipients and number of ACAT assessments 1 October
2006 – 31 March 2007.............................................................................................................. 27
Table 3.2: Baseline characteristics of recipients of Transition Care .................................................... 29
Table 3.3: Median (IQR) Modified Barthel Index for all Transition Care recipients
by type of Transition Care: Community, Residential, and Combination................................... 32
Table 3.4: Length of stay and adjusted length of stay excluding those discharged to hospital or
death for all Transition Care recipients..................................................................................... 33
Table 3.5: Discharge destination by jurisdiction and type of care ........................................................ 36
Table 3.6: Hospital readmissions, residential aged care admissions and deaths for
Transition Care recipients at three months post ACAT approval ............................................. 39
Table 3.7: Hospital readmissions, residential aged care admissions, and deaths for
Transition Care recipients at six months post ACAT approval................................................. 40
Table 4.1: Risk of hospital readmission in the six month post ACAT approval ................................... 45
Table 4.2: Risk of residential aged care admission in the six months post ACAT approval ................ 46
Table 4.3: Distribution of population, aged care places, and hospital beds per 1,000 older people by
state/territory 2005/06............................................................................................................... 47
Table 5.1: Estimated Modified Barthel Index efficiencies from the Australasian Rehabilitation
Outcomes Centre 2006/07 ....................................................................................................... 50
Table 5.2: Modified Barthel Index efficiency at jurisdictional level for Victorian Geriatric
Evaluation and Management units vs. Transition Care delivered only in a residential
setting for 2006/07 period......................................................................................................... 51
Table 5.3: Hospital readmissions, residential aged care admissions, and deaths for
Transition Care recipients, Control 1 and Control 2 at three months post ACAT approval...... 52
Table 5.4: Hospital readmissions, residential aged care admissions, and deaths for
Transition Care recipients, Control 1 and Control 2 at six months post ACAT approval ......... 53
Table 5.5: Summary of hazard of hospital admission in the six month post ACAT approval............... 54
Table 5.6: Median length of stay of index hospitalization by group...................................................... 57
Table 5.7: Summary of hazard of residential aged care admission in the six months post ACAT
approval .................................................................................................................................... 58
Table 5.8: Summary of admission level for Transition Care recipients who were admitted to
residential aged care in the six months post ACAT approval................................................... 60
Table 5.9: Days from Aged Care Assessment Team approval to hospital separation and
Transition Care admission........................................................................................................ 63
Table 6.1: Summary of national incremental costs and effects at six months post ACAT approval in
recipients of Transition Care only in a community setting vs. Control 2................................... 67

v
Table 10.1: Transition Care Program: assumptions behind the model and evidence for
these assumptions.................................................................................................................... 90
Table 10.2: Comparison between the results from the National Evaluation of Innovative
Care Rehabilitation Services and the National Evaluation of Transition Care Program .......... 93

vi
List of Figures
Figure 2.1: Prototypical trajectories of the disablement process.......................................................... 19
Figure 3.1: Modified Barthel Index efficiencies by type of Transition Care per jurisdiction.................. 34
Figure 4.1: Composite indicator of number of aged care places and number of hospital beds per
1,000 older people 2005/06...................................................................................................... 48
Figure 5.1: Hazard of hospital readmission in six months post ACAT approval .................................. 55
Figure 5.2: Proportion of people with one or more hospital readmissions by jurisdiction in
six months post ACAT approval ............................................................................................... 56
Figure 5.3: Hazard of residential aged care admission in six months post ACAT approval ................ 59
Figure 5.4: Occupancy by jurisdiction, 2006/07 ................................................................................... 64
Figure 6.1: Joint distribution of incremental cost and effects for recipients of Transition Care
only in a community setting vs. Control 2 at three months post ACAT approval ..................... 66
Figure 6.2: Joint distribution of incremental cost and effects for recipients of Transition Care
only in a community setting vs. Control 2 at six months post ACAT approval ......................... 67
Figure 6.3: National cost effectiveness acceptability curve for recipients of Transition Care
only in a community setting vs. Control 2 at six months post ACAT approval ......................... 68
Figure 6.4: National net benefit curve for recipients of Transition Care only in a community
setting vs. Control 2 at six months post ACAT approval .......................................................... 69

vii
Acknowledgements This report has been compiled for the National Evaluation of the Transition Care Program on behalf of
Flinders Consulting by the Evaluation Management Team: Ms Lynne Giles, Dr Julie Halbert, Ms Jackie
Stepien-Hulleman, A/Prof Simon Eckermann, Ms Stacey Masters, Mr Justin Prendergast, A/Prof Craig
Whitehead, Ms Fiona Cheney, and Professor Maria Crotty (Chief Investigator). Professor Ian Cameron of
the Rehabilitation Studies Unit at the University of Sydney, Professor Len Gray of the Academic Unit in
Geriatric Medicine at the University of Queensland, and Dr Owen Davies of the Department of Rehabilitation
and Aged Care at Repatriation General Hospital provided helpful comments on a draft of this report.
A number of people have contributed to this report, and their help and advice is gratefully acknowledged.
Special thanks are due to members of the Modelling, Information, Reporting and Analysis Group (MIRAG) in
the Ageing and Aged Care Division of the Australian Government Department of Health and Ageing for
facilitating access to the Commonwealth data sets in this report. In particular, Dr David Cullen, Dr David
Martin, Ms Naomi Rogers, Mr Tom Goff, and Mr Carl Hernaman have helped members of the evaluation
team to obtain data and updates. Ms Allison Rosevear, Ms Jane Hanson, Ms Elke Zimmermann, and Ms Jo
Broad from the Residential Program Management Branch of the Ageing and Aged Care Division of the
Australian Government Department of Health and Ageing have also contributed to this report.
Members of the Transition Care Working Group in each state and territory have facilitated access to the
respective hospital morbidity data collections, and we gratefully acknowledge this help. Staff in Health
Information in each state or territory have extracted the data, and we particularly thank the following people:
Ms Julie Searle of ACT Health, Mr Gary Inglis of NT Department of Health and Community Services, Mr
Peter Brandt, Mr John Agland and Ms Sara Subramanian of NSW Health, Mr James Snodgrass of
Queensland Health, Mr Paul Basso and Ms Deborah Brown of SA Department of Health, Mr Peter Mansfield
of Tasmanian Department of Health and Human Services, and Dr Vijaya Sundararajan and Mr David Quin of
Victorian Department of Human Services.
Dr John Bass of the Data Linkage Group, Curtin University conducted the data linkages for the Australian
Capital Territory, New South Wales, Queensland, South Australia, Tasmania, and Victoria. Staff in the
Health Information Linkage Branch of the Western Australian Department of Health (formerly Western
Australian Data Linkage Unit) facilitated the linkage of Western Australian records, and we particularly thank
Ms Di Rosman, Ms Brooke Baxter, Ms Carol Garfield, and Ms Emma Brook in this regard. Mr Gary Inglis of
the Northern Territory Department of Health and Community Services facilitated the linkage of the Northern
Territory hospital records. Dr John Harding and Ms Khun Zhao of the Australian Institute of Health and
Welfare facilitated linkage to the National Death Index.
viii
Transition Care Working Group (Current and former members)
Name Jurisdiction
Jane Hanson Australian Government Department of Health and Ageing
Pierre Nijssen Australian Government Department of Health and Ageing
Linda Jackson Australian Government Department of Health and Ageing
David Cullen Australian Government Department of Health and Ageing
David Martin Australian Government Department of Health and Ageing
Therese Gehrig ACT Health
Dagmar Kelly ACT Health
Clare Gardiner NSW Health
Jane Fenn NSW Health
Barbara Anderson NSW Health
Michael Woodhouse Northern Territory
Liz Kasteel Northern Territory
Sue Keys Northern Territory
Loris Semple Northern Territory
Amanda Croker Queensland Health
Shelly Kulperger Queensland Health
Michael Edwards Queensland Health
Ann Crowhurst Queensland Health
Allan Quire SA Department of Health
Mick Urukalo SA Department of Health
Marie DeRieu SA Department of Health
Rachel Newrick (Beisiegel) SA Department of Health
Valerie Whelan Tasmanian Department of Health and Human Services
Fran Thompson Tasmanian Department of Health and Human Services
Sonia Lillico Tasmanian Department of Health and Human Services
Betty Tzouvelis Victorian Department of Human Services
Nicole Doran Victorian Department of Human Services
Carolyn Glover Victorian Department of Human Services
Kathy Stack WA Department of Health
Gail Milner WA Department of Health
Jeanette Plenty WA Department of Health
Professor Leon Flicker Royal Perth Hospital
Dr Paul Varghese Princess Alexandra Hospital (QLD)

ix
Summary of Ethics Applications National Applications Due date Date submitted Date of meeting Final approval Department of Health and Ageing Departmental Ethics Committee 18 Oct 2006 18 Oct 2006 06 Nov 2006 13 Dec 2006
Flinders Clinical Research Ethics Committee 27 Nov 2006 30 Oct 2006 11 Dec 2006 18 Dec 2006
ACT Government
ACT Health and Community Care Human Research Ethics Committee 28 Nov 2006 23 Nov 2006 11 Dec 2006 26 Feb 2007
Victorian Government
Austin Health Human Research Ethics Committee 28 Nov 2006 23 Nov 2006 12 Dec 2006 28 Feb 2007
Barwon Health Research and Ethics Advisory Committee 21 Nov 2006 21 Nov 2006 28 Nov 2006 12 Dec 2006
Bundoora Extended Care Centre Human Research Ethics Committee Have asked for project to be overseen by the Northern HREC (in
same health region)
30 Nov 2006
Eastern Health Research and Ethics Committee QA Process 21 Nov 2006 14 Dec 2006 Not Required
Human Research Ethics Committee - A St Vincent's Health Melbourne QA Process 21 Nov 2006 13 Dec 2006 Not Required
Melbourne Health Human Research Ethics Committee QA Process 04 Dec 2006 06 Dec 2006 18 Jul 2007
Peninsula Health Research & Ethics Committee 17 Nov 2006 16 Nov 2006 06 Dec 2006 06 Dec 2006
Southern Health Human Research Ethics Committee B QA Process 21 Nov 2006 14 Dec 2006 Not required
The Alfred Research & Ethics Unit (Bayside) 20 Nov 2006 21 Nov 2006 21 Dec 2006 02 Jan 2007
The Northern Hospital Human Research & Ethics Committee 17 Nov 2006 16 Nov 2006 28 Nov 2006 30 Nov 2006
Victorian Department of Human Services Human Research Ethics Committee 22 Nov 2006 20 Nov 2006 06 Dec 2006 19 Dec 2006
Queensland Government
Bayside Health Service District Human Research Ethics Committee 06 Dec 2006 29 Nov 2006 14 Dec 2006 14 Dec 2006
Cairns Base Hospital Ethics Committee 16 Jan 2007 19 Dec 2006 01 Mar 2007 09 Mar 2007
Gold Coast Health Service District Human Research Ethics Committee 17 Jan 2007 15 Dec 2006 31 Jan 2007 23 Apr 2007
Mackay Health Service District Human Research Ethics Committee 19 Dec 2006 17 Jan 2007 approved
Princess Alexandra Hospital Human Research Ethics Committee 17 Nov 2006 16 Nov 2006 05 Dec 2006 16 Apr 2007
Queensland Health Research Ethics Committee 06 Dec 2006 28 Nov 2006 18 Dec 2006 28 Feb 2007
Redcliffe-Caboolture Health Service District Ethics Committee 17 Jan 2007 15 Dec 2006 07 Feb 2007 04 Apr 2007

x
Summary of Ethics Applications National Applications Due date Date submitted Date of meeting Final approval
Rockhampton Health Service District HREC 07 Feb 2007 15 Dec 2006 22 Feb 2007 01 Mar 2007
Royal Brisbane and Women's Hospital Human Research Ethics Committee 11 Jan 2007 15 Dec 2006 19 Feb 2007 06 Jun 2007
The Prince Charles Hospital Health Service District HREC 29 Nov 2006 28 Nov 2006 13 Dec 2006 13 Dec 2006
The Townsville Health Service District Institutional Ethics Committee 23 Nov 2006 21 Nov 2006 07 Dec 2006 05 Feb 2007
Toowoomba Health Service District Human Research Ethics Committee 29 Nov 2006 27 Nov 2006 14 Dec 2006 06 Dec 2006
West Moreton Health Service District Human Research Ethics Committee 20 Nov 2006 17 Nov 2006 04 Dec 2006 26 Feb 2007
NSW Government
NSW Department of Health Human Research Ethics Committee 23 Nov 2006 20 Nov 2006 14 Dec 2006 01 Feb 2007
SA Government
SA Department of Health Human Research Ethics Committee 26 Oct 2006 26 Oct 2006 08 Nov 2006 09 Feb 2007
Tasmanian Government
Southern Tasmania Health & Medical Human Research Ethics Committee 09 Nov 2006 09 Nov 2006 11 Dec 2006 04 Dec 2006
WA Government
Confidentiality of Health Information Committee 29 Jan 2007 06 Feb 2007 19 Feb 2007
NT Government
Central Australia Human Research Ethics Committee 26 Oct 2006 21 Nov 2006 23 Nov 2006 24 Nov 2006
Human Research Ethics Committee of Northern Territory Department of Health & Community
Services and Menzies School of Health Research
15 Nov 2006 14 Nov 2006 07 Dec 2006 13 April 2007
xi
Glossary ABS Australian Bureau of Statistics
ACAT Aged Care Assessment Team
ACCR Aged Care Client Record
ADL Activity of Daily Living
AROC Australasian Rehabilitation Outcomes Centre
CACP Community Aged Care Package
CI Confidence Interval
CTM-3 Care Transition Measure
EACH Extended Aged Care at Home
EachD Extended Aged Care at Home Dementia
FIM Functional Independence Measure
Flexible Care Means care provided in a residential or community setting through an aged care service
that addresses the needs of the care recipients in alternative ways to the care provided
through residential care services and community care services
GEM Geriatric Evaluation and Management
GP General Practitioner
HACC Home and Community Care
HR Hazard Ratio
ICRS Innovative Care Rehabilitation Services
IQR InterQuartile Range
ISD Integrated Service Delivery
IRR Incidence Rate Ratio
MBI Modified Barthel Index
MCSI Modified Caregiver Strain Index
NETCP National Evaluation of the Transition Care Program
OR Odds Ratio
PAC Post Acute Care
SD Standard Deviation
SLA Statistical Local Area
SNFs Skilled Nursing Facilities
SWIC Survival without institutional care
TC Transition Care
TCP Transition Care Program

1
Executive Summary Key Findings
The Transition Care Program provided additional treatment and care options following hospitalization that
were highly valued by patients and their families.
Functional improvements occurred. When compared with similar groups of frail older people discharged
from hospital during the same time period, those who received Transition Care had fewer readmissions to
hospital and were less likely to move into permanent residential aged care.
These outcomes are achieved at a comparatively high cost. For every day a recipient of Transition Care
survives without institutional care i.e. without hospital or residential aged care over a six month period it costs
$344 per day. Costs were evaluated during an early phase of the program when they are likely to be high.
The program was implemented within a health context where older people across Australia have widely
variable access to rehabilitation and geriatric hospital beds. It did not appear that areas which were short of
aged care services or subacute beds had been prioritized in the allocation of the first 2,000 Transition Care
places.
What is Transition Care? Transition Care is a form of flexible care provided to an older person at the end of an inpatient hospital
episode in the form of a package of services that includes at least low intensity therapy and either nursing
support or personal care. The care is characterized as goal-oriented, time limited, therapy focused, and
necessary to complete the care recipient’s restorative process, optimize their functional capacity, and assist
them and their families to make long term arrangements for care.
Transition Care is legislated under the Aged Care Act 1997 and in the 2004-5 Federal Budget the national
Transition Care Program was announced as part of the Government Investing in Australia’s Aged Care:
More Places, Better Care package. The Australian Government committed to providing 2,000 flexible aged
care places for Transition Care with a proportion allocated to each state and territory broadly in line with their
proportion of people aged 70 years and over.
What did we do? We carried out six studies to assess the introduction of this new program across Australia:
1. The Regional Characterization Report described Commonwealth aged care places and state funded
acute and rehabilitation beds for older people across Australia in June 2006.
2. The Quality Report summarized 23 reports on the program operation which had been completed by
Transition Care services between 28 September 2006 and 18 May 2007, an average of nine months
following service commencement.
3. The Models of Transition Care Report described the characteristics of Transition Care recipients and the
three main types of Transition Care: predominantly community-based services, residential-based
services, and services that offered a combination of community-based and residential-based places.

2
4. The Recipient Snapshot Report described the reports of older people and their families on the program
three months after their discharge from the Transition Care Program between 1 February and 30 June
2007. No one in either Western Australia or Northern Territory was interviewed. We interviewed people
on the phone (374 interviews with an older person who received Transition Care and 256 with a family
member or carer who acted as a proxy) which represented a fifth of those who had received the
program. We asked them about: their living arrangements and use of community care services; their
satisfaction with the program; how well the move from Transition Care to the community or residential
aged care went (we used an American instrument to measure how successful this had been, the Care
Transition Measure); about their level of functional independence (using the Modified Barthel Index); any
hospital readmissions; any costs incurred and their self-rated health. We also asked carers about their
experiences.
5. Controlled Comparisons, Costs and Effects Report. We followed 2,443 people who were approved for
Transition Care between 1 October 2006 and 31 March 2007 by an Aged Care Assessment Team
(ACAT) and who were discharged from Transition Care by 30 September 2007. In the data linkage
component, administrative health records were matched on name (if available), sex, and date of birth,
with elements of address used to refine the matches. This enabled us to calculate how many hospital
readmissions, transfers into residential aged care and deaths occurred at both three and six months
following approval for Transition Care. We compared their outcomes with two groups of similar older
people coming out of hospital at the same time; i) people who were approved for a Transition Care place
but who did not receive it (n=879); and ii) people approved for Community Aged Care Packages between
1 October 2006 and 31 March 2007 (n=2,188). We estimated the costs of providing the program after
taking into account any savings achieved by reducing readmissions and movement into permanent
residential aged care.
What did we find?
• We found that the Transition Care Program was identifying people with a need for further care following
a stay in hospital and that recovery continued after discharge from hospital.
• Those selected were medically frail and 37% of older people who received the program had returned to
hospital at least once by three months. By six months this proportion had risen to 47%. Those receiving
Transition Care in a community-based setting were more likely to be readmitted (51%) when compared
with those who received Transition Care in a residential-based setting (43%). Despite this, there was
little evidence of medication review or medical assessment.
• About a quarter (22%) of people ended up in permanent residential aged care three months after
approval and by six months this was 30%. Those who had received Transition Care in a residential-
based setting were more likely to go onto long term care with 58% living in residential aged care at six
months. This group were frail and had an average admission score on the Modified Barthel Index of
51.1 out of a possible 100 (a measure of function where higher scores reflect higher levels of function).
• By six months 13% of people who received Transition Care had died. Of those who received Transition
Care only in a residential setting, 20% died and amongst those older than 85 almost a quarter had died
by six months.

3
• When we compared the outcomes of the people who received Transition Care with other frail groups
discharged from hospital in the same time period we found that Transition Care reduced the risk of
entering an institution (hospital and residential aged care) in the six months post ACAT approval. The
hazard (risk) of a hospital readmission in the six months post ACAT approval was significantly greater in
two control groups relative to the Transition Care recipients. Similarly, the hazard of an admission to
residential aged care in the six months post ACAT approval period was lower among Transition Care
recipients overall. However the risk was similar for those who received Transition Care only in a
residential setting and those who were approved but did not enter the program.
• Three months after ACAT approval, a recipient of Transition Care only in a community setting had
survived an additional 11.8 days without admission into hospital or residential aged care when compared
with those in the Control 2 group and the additional cost to achieve this for an individual Transition Care
recipient was $888 per day. At six months this reduced to $344 per day.
• Nursing and allied health hours on the Transition Care services affected outcomes. The risk of hospital
readmission decreased with more nursing hours. The risk of residential aged care admissions
decreased with more allied health hours.
• In the telephone interviews most recipients and carers felt that they had a good understanding of their
health issues and that staff had taken their wishes into account when planning services. Carer’s
experiences were assessed in telephone interviews and varied but overall moderate levels of strain (as
measured by the Modified Caregiver Strain index) were reported. The average age of the 386 carers
who were interviewed was 63 years and carers were predominantly spouses or daughters. Carers
reported most difficulty with restrictions on their free time, the recent changes to their personal plans and
they found it difficult to deal with the degree to which the person they cared for had changed from their
former self.
• The Transition Care services reported difficulties engaging GPs but it also appeared the models did not
emphasise assessment or management of medical issues. Few pharmacists or medical specialists
(such as geriatricians or medical rehabilitation specialists) were listed as staff in the Quality Reports.
• When we began the National Evaluation of the Transition Care Program in 2006 there were three
rehabilitation and geriatric evaluation and management (GEM) beds per 1,000 older persons aged 70
and over compared with 26 acute hospital beds per 1,000 older people, but there was considerable
variation across Australia with Victoria having the most rehabilitation beds.

4
• Transition Care places are making a significant contribution to post acute services in many areas of
Australia but the jurisdictions’ approach to allocation was unclear and many areas of service need had
not been allocated places.
• While the Transition Care Program was not intended to substitute for rehabilitation services it appeared
to take on this role in regions with limited services. However, it seemed less efficient than conventional
rehabilitation programs. Comparisons between the outcomes from Victorian GEM units and residential-
based Transition Care found that the Victorian GEM units admitted more disabled patients and achieved
functional improvements more rapidly.
• A similar inefficiency was noted in the use of community-based Transition Care places for people with
high Modified Barthel Index scores which suggested that in other jurisdictions they might have received
home rehabilitation programs. Transition Care requires an ACAT assessment to be completed while
home rehabilitation services do not. The delay associated with this extra step i.e. accessing an ACAT
assessment may introduce delays in hospital discharge. Delays of up to a week between ACAT
assessment and entry into Transition Care occurred, suggesting people were waiting in hospital for the
program.
What did we conclude?
• At the individual level positive outcomes were achieved. Transition Care was valued by patients and
carers and although it configured very differently across jurisdictions it seemed to increase the options
for older people following hospitalization. Appropriate people were offered the program and
improvements in individuals’ function occurred. When comparisons were made with other frail older
people discharged from hospital at the same time, decreases in the risk of transfer back to hospital and
permanent residential aged care were seen.
• These positive outcomes were achieved using flexible models and could be implemented in rural
settings. Higher nursing and allied health staffing hours were associated with better outcomes.
• The interface between Transition Care and hospital rehabilitation services needs to be clarified. The
level of access to rehabilitation and geriatric beds in a region influenced recipient selection and in many
regions the Transition Care Program appeared to be fulfilling the traditional role of rehabilitation services.
These programs seem less efficient than conventional rehabilitation particularly when providing a
substitute for GEM type wards.
• Transition Care provided in a residential-based setting requires more evaluation to clarify which groups
will benefit, to explore whether this care should be delivered to a minimum number of co-located
recipients, to identify minimum staffing levels and quality measures. Transition Care provided in a
residential-based setting alone did not appear to prevent transfer to residential aged care.
• The economic evaluation of the program suggested that the program was not low cost. Some of the
inefficiencies are probably related to evaluating the early phase of a new program addressing complex
policy issues. Issues that could be examined include: providing incentives to reduce episode costs or
rewarding Transition Care services for complex cases e.g. those with dementia.
• Without increasing medical, pharmacy and nursing input into the programs, further reductions in
readmissions will be difficult. Transition Care services struggled with the interface with acute care
(communication and support) therefore measures of the quality of transfer from hospital need monitoring.

5
Strategies to improve communication from hospitals (such as pay for performance approaches which
have been used in the US) should be explored.
• Given the shortfall in health and aged care services for older people and the significance of Transition
Care places to communities, transparent allocation of Transition Care places should ideally occur. In the
short term priority should be given to areas of service need including rural areas.
• It seems unlikely that simply adding more Transition Care places to regions will change hospital flows if
there is an inadequate investment in geriatric rehabilitation beds. If population based planning
benchmarks of the ideal number of rehabilitation beds for older people could be developed in tandem
with the expansion of the Transition Care Program, greater effects on flows across care sectors are likely
to occur.
• A broader range of interventions and models in the program could be considered. For example, models
for people with dementia could be developed further. One of the requirements for admission to the
Transition Care Program is that patients are medically stable, but one fifth of those in residential based
Transition Care had died by six months post ACAT approval. Thus end-of-life care is an issue faced by
Transition Care services, and this may reflect selection issues or the rapid onset of some medical
conditions among frail older people. Evaluation of new models should include an economic evaluation
with 12 month follow-up and assess medication costs.
• We demonstrated that using linked datasets is a feasible way of assessing the outcomes of the
Transition Care Program. Cognitive and other health issues can make interviewing a representative
sample of older people difficult but this approach allows timely evaluation of a national program at the
acute and aged care interface. Further analyses of linked data sets are likely to assist with future
iterations of the Transition Care Program.

6
1. Introduction 1.1. Framework for the Evaluation
The Transition Care Program (TCP) provides care that is therapeutic, goal oriented, time-limited and
targeted to older people at the conclusion of a hospital episode who require more time and support in a non
hospital environment to complete their restorative process and optimize their functional capacity while
assisting them and their family or carer to make long term care arrangements.
The six key questions for the National Evaluation of the Transition Care program (NETCP) are:
1. Are the outcomes being achieved?
2. How are the outcomes at the individual level being achieved?
3. How are the outcomes at the system level being achieved?
4. What are the costs of achieving the outcomes for the Australian Government, State and Territory
Governments, and the care recipient in absolute terms and relative terms?
5. What did the Quality Report say about quality in Transition Care (TC) Services?
6. How can the TCP design be improved?
To address these questions, a suite of six studies was undertaken for the NETCP. The six studies and a
brief description of the methods employed in each study are presented below. The timeframe covered by
each report is summarized in Table 1.1 on Page 9.
i) Regional Characterization Report
This report provided a summary of key health services for older people according to Aged Care Assessment
Team (ACAT) (known as Aged Care Assessment Service in Victoria) region. The demographic and health
service indicators were derived from data supplied by the Australian Bureau of Statistics (ABS), the
Australian Government Department of Health and Ageing, the Australasian Rehabilitation Outcomes Centre
(AROC) at the University of Wollongong, and the Lincoln Centre for Ageing and Community Care Research
at La Trobe University. The indicators that were shown in this report were population, provision ratio of aged
care places or TC places per 1,000 older people, the number of first-time admissions to residential aged care
per 1,000 older people, Home and Community Care (HACC) clients per 1,000 older people, number of ACAT
assessments, and number of acute and subacute hospital beds per 1,000 older people. The data
encompassed the period 1 July 2005 to 30 June 2006. In the Regional Characterization Report, population
data were estimated at 30 June 2006; Aged Care places at 31 December 2005 and 30 June 2006; AROC
provided data as at 30 June 2006. Estimates of hospital bed utilization were for the 2005/06 financial year.
ii) Quality Assessment Study
This study was designed to summarize and identify themes and report suggestions of ways to improve TC
services. Quality Reports were completed between 28 September 2006 and 18 May 2007, an average of
nine months following service commencement. A grounded theory, or inductive, approach was used
whereby the themes identified were derived from the text rather than a body of literature. The reporting of

7
TC services’ responses to the Quality Report focused on a description of responses and, where appropriate,
thematic analysis.
iii) Models of Transition Care
This study was conducted to characterize the types of TC models used by different TC services. The report
drew data from the TC Quality and Quarterly Reports, survey of TC services conducted in November 2006,
and information from the Australian Government Department of Health and Ageing administrative database
concerning TC Payments for the 2006/07 financial year.
iv) Recipient Snapshot Study
This study was designed to describe the demographic, residential, and cognitive characteristics, and health
service use of TC recipients, three months after completion of TC. A secondary purpose was to describe the
satisfaction of carers with TC and any strain that they reported. The interviews took place between 1 May
and 30 September 2007, corresponding to recipients who were discharged from TC between 1 February and
30 June 2007.
The telephone interview schedule included seven domains concerning the recipient’s experience and
outcomes from TC including: i) living arrangements and use of community care services; ii) satisfaction with
TC; iii) the quality of the transition from TC to the community or residential aged care (Care Transition
Measure, CTM-3); iv) functional independence (Modified Barthel Index; MBI); v) hospital readmissions vi)
costs associated with TC and main source of income; and vii) self-rated health. The number of outcome
measures was kept low in order to minimise the respondent burden imposed by the interviews.
A brief carer interview was also administered. This included carer’s age, relationship to TC recipient, the
Modified Caregiver Strain Index (MCSI), carer involvement in decisions, and overall satisfaction with TC.
v) Controlled Comparison Study
The purpose of this report was to describe the hospital readmissions, residential aged care service
utilization, and mortality in the three months and the six months post ACAT approval for individuals who were
ACAT assessed for TC between 1 October 2006 and 31 March 2007, and who were discharged from TC by
30 September 2007. These three outcomes were compared to those for people who were approved for a TC
place (who either did not receive TC despite approval or who had not been discharged from TC by 30
September 2007; Control 1) and for people approved for Community Aged Care Packages (CACP); Control
2) with the approvals for both groups occurring between 1 October 2006 and 31 March 2007.
vi) Costs and Effects Study
This study built on the Controlled Comparison Study to describe the costs and effects of the outcomes of TC
recipients relative to the two control groups, and considered both the three and six months post ACAT
approval periods. The impact of regional level variables such as hospital and residential aged care
availability on the analyses are considered in a national analysis of admissions to residential aged care and

8
readmissions to hospital in the three months post ACAT approval. Data linkage of a number of
administrative health datasets was undertaken to assess the outcomes.
Both studies were undertaken using a controlled comparison design with three months and six months
follow-up from the date of ACAT approval. Data were extracted from a range of primary sources for the data
linkage, the starting point for the linkage was the ACAT approval, and the other datasets were linked into the
originating ACAT approval.

9
Table 1.1: National Evaluation of the Transition Care Program timetable
1: In the Regional Characterization Study, population data were estimated at 30 June 2006; Aged Care places at 31 December 2005 and 30 June 2006; Australasian Rehabilitation Outcomes Centre
provided data as at 30 June 2006
Report Name 2005 2006 2007
July
Aug
ust
Sept
embe
r
Oct
ober
Nov
embe
r
Dec
embe
r
Janu
ary
Febr
uary
Mar
ch
Apr
il
May
June
July
Aug
ust
Sept
embe
r
Oct
ober
Nov
embe
r
Dec
embe
r
Janu
ary
Febr
uary
Mar
ch
Apr
il
May
June
July
Aug
ust
Sept
embe
r
Oct
ober
Nov
embe
r
Dec
embe
r
Regional
Characterization Study1
Quality Assessment
Study
Models of Transition
Care Study
Recipient Snapshot
Study
Controlled Comparison
Study
Cost and Effects Study

10
1.2. Implementation of Transition Care in each jurisdiction TC is a new program in Australia and the rollout of TC in each of the Australian states and territories has
varied according to the local climate of health service provision. TC places are flexible care places under the
Aged Care Act 1997 which can be used flexibly in either the residential or community setting. TC services
include state funded health services and aged care organizations. There is heterogeneity in the number and
mix of TC places allocated (residential and community), time since the service became operational, model of
service delivery and extent of brokerage arrangements. The allocation of TC places (broken down by type of
operational place which can be changed according to needs) is presented in Table 1.2.
Table 1.2: Allocation and operation of Transition Care places as at 30 June 2007
Jurisdiction Residential operational Community operational Total allocated
ACT 15 20 35
NSW 81 490 703
NT 8 0 16
QLD 17 240 351
SA 94 53 176
TAS 27 25 57
VIC 247 182 502
WA 50 50 160
Total 539 1,060 2,000
As Table 1.3 shows, different proportions of the TC places were delivered in residential-based and
community-based settings in each of the jurisdictions. These cumulative data are drawn from the TCP
COGNOS database and cover the period 1 October 2005 to 29 February 2008 (Department of Health and
Ageing 2008).
Table 1.3: Cumulative number of discharges by type of Transition Care October 2005 - Feb 2008
Jurisdiction Community n (%)
Residential n (%)
Combination n (%)
Total number of discharges
ACT 110 (37%) 87 (30%) 97 (33%) 294
NSW 3,692 (84%) 631 (15%) 58 (1%) 4,381
NT 0 (%) 55 (100%) 0 (0%) 55
QLD 1,213 (93%) 39 (3%) 52 (4%) 1,304
SA 637 (38%) 914 (54%) 131 (8%) 1,682
TAS 120 (37%) 188 (52%) 15 (5%) 323
VIC 780 (21%) 2,569 (70%) 338 (9%) 3,687
WA 214 (25%) 386 (46%) 247 (29%) 847
Total 6,766 (54%) 4,869 (39%) 938 (7%) 12,573
To understand the evolution and national roll-out of the TCP, a description of the implementation of TC in
each jurisdiction is presented in the subsections that follow.

11
1.2.1. Australian Capital Territory The ACT has a single TC service which has been in operation since December 2005, making it one of the
most mature TC services in the TCP. ACT Health Transition Care Program had all 35 allocated places
operational at 30 June 2007. Of these 15, were operating as residential-based places and 20 were
operating as community-based places.
1.2.2. New South Wales NSW has 28 TC services located in metropolitan, regional, and rural areas throughout the state. At June
2007 571 of the 703 allocated places were operational, with seven TC services yet to commence operations.
The majority of NSW places operate in a community-based setting (86% at 30 June 2007). The first TC
services in NSW began providing services in January 2006 (Richmond Valley Transitional Aged Care
service, Transitional Aged Care Program – Prince of Wales Community Health Service, Tweed Transitional
Aged Care Service) and TC has continued to be rolled out in the state since then. Newer TC services have
begun operation in 2008 in Dubbo and Lower Hunter.
1.2.3. Northern Territory TC places have been allocated to three TC services in the Northern Territory with only one TC service
(Katherine Transition Care Program) operational at 30 June 2007. Both of the Alice Springs and Darwin
services commenced operation in 2008. Of the 16 allocated places, eight were operational at 30 June 2007
and all of these were residential-based places. Katherine Transition Care Program has been operational
since February 2007.
1.2.4. Queensland Queensland has 12 operational services located in metropolitan, regional, and rural areas. Gold Coast
Transition Care Program, Bayside Transition Care, Brisbane South Transition Care, and West Moreton
Transition Care were the earliest services to begin offering TC services in June - August 2006. At 30 June
2007 all but three TC services had commenced operations and these were located in rural areas of
Queensland (Mackay, Tablelands, and Innisfail). A total of 257 of the 351 allocated places were operational
at 30 June 2007, and 240 (93%) of these were used as community-based places.
1.2.5. South Australia There are four TC services in South Australia. Country Health SA Transition Care Program delivers 26
places across rural and remote South Australia and the remaining places operate in the metropolitan area.
SA has two services that have been in operation for the longest period, commencing in October 2005. In
contrast to other jurisdictions, the flexibility of the TCP has led to 40 of the SA TC places being designated as
residential-based and the remainder as ‘mixed’ so that they can be used as either community-based or
residential-based places dependent on need. At 30 June 2007, 147 of the 176 allocated places were
operational.

12
1.2.6. Tasmania Tasmania has two TC services that began operations in July and December 2006, respectively. At June
2007 52 of the 57 allocated places were operational with 27 residential-based and 25 community-based
places at this time.
1.2.7. Victoria Victoria has 12 operational services and the second largest allocation of TC places. Unlike other
jurisdictions, more than half of the 424 operational places were used as residential-based TC places (n=247;
58%) at 30 June 2007. This reflects that older people living in Victoria have access to a broad range of
health services under the sub-acute system, and the Victorian TCP appears to service a more disabled
group of people than programs in other jurisdictions.
1.2.8. Western Australia Two TC services began delivery of services in Perth in 2006, with 100 places operational at 30 June 2007,
half of which delivered TC in a residential-based setting. An additional 60 places were allocated to the
Western Australian Country Health Service with distinct operations in the Midwest and South West of this
state.
1.3. Structure of the Final Evaluation Report The current national and international literature is first reviewed, to place the operation of the Australian TCP
in context. Each of the six key evaluation questions is then addressed in separate chapters of this report.
A discussion of the limitations in the evaluation methodology is then presented in Chapter 9. The report
concludes in Chapter 10 with a summary chapter and recommendations.

13
2. Background and relevant literature 2.1. Australian context
Older people, those aged 70 years or older, accounted for about 31% of non-same day hospital episodes in
2004/05. Demand for hospital services increases with age, with 353.5 non-same day hospital separations in
2004/05 for every 1,000 people aged 70 to 74 compared to 753.7 non-same day hospital separations in
2004/05 for every 1,000 people aged 85 or over (Australian Institute of Health and Welfare 2007).
Older people are also consumers of aged care services and again consumption increases with age. About
4% of men aged 80 and 6% of women aged 80 are receiving permanent residential aged care at any one
time, while at the peak of usage (age 96) 22% of men and 41% per cent of women are receiving permanent
residential aged care at any one time. Moreover, such cross-sectional data tends to understate the
likelihood that an individual will require permanent residential aged care at some time in their life. Life table
analysis shows that, at age 65, an individual woman who has never received permanent residential aged
care has a lifetime risk of entry to permanent residential aged care of 50% (32% for a man) (Liu, Braun et al.
2001).
Australian governments already contribute considerable resources to the provision of hospital and aged care
services. In 2004/05, for example, they provided $20 billion for public hospitals and $7.3 billion for aged care
services (Steering Committee for the Review of Government Service Provisions 2007). As the demand for
hospital and aged care services increase with age, the ageing of Australia’s population will see this
expenditure increase significantly in real terms over the coming decades. Commonwealth aged care
expenditure alone is projected to increase from 0.8% of GDP in 2006/07 to 2.0% of GDP by 2046/47, while
Commonwealth expenditure on public hospitals and private health insurance is projected to increase from
1.2% of GDP to 2.3% of GDP over the same period (Australian Government Department of Health and
Ageing 2007).
Improving the allocative efficiency of both the hospital and aged care sectors, so that older people do not
wait unnecessarily in hospital for a residential aged care place, and conversely so that older people are not
prematurely discharged to residential aged care before they receive appropriate rehabilitation services to
address reversible disability, will therefore become of increasing importance both for the health/aged care
system as a whole as well as for the welfare of the individuals concerned. The need to address these issues
has been recognized by governments at all levels (Dwyer and Jackson 2001). In 2004 the National Action
Plan for improving the care of older people across the acute-aged care continuum 2004-2008 was endorsed
by state and federal health ministers (Australian Health Ministers' Advisory Council 2004). The TCP is an
action which has emerged from Principle 4 of the plan and is provided as a form of flexible care under
legislation from the Aged Care Act 1997.
2.1.1. Innovative Care Rehabilitation Service - Australia The design of the TCP was informed by a series of pilots - The Innovative Care Rehabilitation Service
(ICRS) pilot program (Department of Health and Ageing 2005). Twelve pilots were established in 2001 to

14
explore new approaches to the care of older people who had experienced a period of acute hospitalization.
In an evaluation of 11 of these pilots 1,640 completed episodes were examined and it was estimated that the
interventions returned a high proportion of older people to the community with cost savings (Department of
Health and Ageing 2005).
The pilots were directed at older people, who had completed their acute treatment phase, had been
assessed for admission to long term residential aged care, and who were thought likely to benefit from a
phase of rehabilitation. The average entry MBI was 67.3 (77 in the community-based and 61 in the
residential-based setting), the average age was 81.5 years, and 58% were living alone. Their outcomes
were generally positive with a hospital readmission rate of 18.1%. Three months post discharge 87.7% of
those who could be contacted were still residing in the community. Six months post discharge 84% of those
who could be contacted were still residing in the community. An important finding was that 69 people (4.2%)
entered residential aged care as low care after having an ACAT assessment and being assessed as
requiring high level care. The report addressed the issue of whether the program should be offered to the
dementia population but noted that many pilots had excluded dementia and the overall numbers were so
small (3.1% of the ICRS client group) that they could not draw conclusions.
The estimated daily cost of the residential-based episode was $236 per day ($10,500 per ICRS episode) and
in the community-based setting costs were estimated as $86 per day ($5,300 per ICRS episode). Based on
a total expenditure of $16 million, the cost/benefit analysis suggested that $4.7 million dollars of savings
were achieved under the strong assumption that those who received ICRS services would have otherwise
had residential aged care for the same duration. However, no controls were available to permit accurate
assessments of what might have happened in the absence of TC.
While there were differences between the 11 pilot sites in terms of medical (both geriatrician and GP), allied
health, and nursing input overall they demonstrated an increase in physical function and a significant return
home rate. However, there were no control groups in this evaluation so the design did not allow robust
assessment of the additive benefits that TC recipients had made to the individual over and above natural
recovery. An important limitation the evaluators faced was the difficulty tracking individuals to establish
outcomes so the results were biased towards detecting positive outcomes.
In summary, the ICRS evaluation suggested significant cost savings were associated with the new model of
care. However, without a control group and with incomplete follow-up data estimates were difficult.
2.1.2. South Australian randomized controlled trial of a residential transitional care unit
In 2003/04 as part of the Commonwealth’s National Demonstration Hospitals Program Phase IV, 320 older
people admitted to a public hospital in Adelaide participated in a randomized controlled trial after a decision
was made that they should go to residential aged care (i.e. after receiving an ACAT assessment).
Participants were randomized to either stay in hospital to await transfer to a residential aged care facility or
move to an offsite facility run by an aged care organization and were provided with therapists and doctors

15
from the local hospital (Crotty, Whitehead et al. 2005). Everyone in the hospital who had received an ACAT
assessment and was waiting on residential aged care was eligible for transfer and was approached to take
part in the trial. At four months there were no differences in outcomes (deaths, function, or readmissions)
and hospital beds had been emptied. The approach was less efficient overall as those who moved to the
offsite facility took three weeks longer (total hospital and transitional care days) to reach their final residential
aged care bed than those who remained in hospital. However the hospital gained a median of 11 bed days
by moving the older adults out of an acute bed which allowed them to admit someone else.
While 7% of those in the group who went into the transitional care unit went home after the ACAT
assessment, a similar number went home without any intervention underlining the fact that some people will
recover with no intervention at all. The design of this study eliminated the selection bias which confounds
evaluations of these programs and once the selection bias was removed, the assessment of outcomes
(return home, improvement in function) was less positive than seen in the ICRS pilots.
Probably the most important finding in this study was that there was no increase in adverse outcomes such
as deaths and the transitional care unit did not appear unsafe which had been a major concern of clinicians.
While this program allowed “unblocking” of beds and cost shifting to the Commonwealth from the acute
sector, an assessment of the total time to care highlighted the potential inefficiencies of this approach to
overall flows. No cost study was included but it is unlikely that overall cost savings were achieved as the
older people who moved to the offsite facility faced additional costs given that they paid a contribution fee.
A qualitative adjunct study was also undertaken with 31 carers, which found that although the transitional
care unit did not reduce the stress experienced by carers when they searched for a permanent residential
aged care facility it was an acceptable alternative to waiting in hospital (Daff, Stepien et al. 2006).
Very little work has been published since the NETCP began. In July 2006 an audit was conducted at three
sites of the first 30 participants in three new TC services based in Adelaide and Sydney. The audit
confirmed that the residential-based services were taking more complex medical cases than the community-
based services and there was heterogeneity amongst clients (Cameron and Davies 2007).
2.2. Intermediate Care in the UK Intermediate Care has influenced the TC model. It was evaluated in the UK using a comparative case study
design to look at the program from different stakeholder perspectives at different levels (system, service,
individual levels) (Godfrey, Keen et al. 2005). The evaluation was undertaken by researchers at the
University of Leeds and the economic analyses by researchers form the University of York. Quantitative
patient data for 7,452 service users admitted to Intermediate Care over one year were analysed together
with data for a cohort admitted in a month (n=153) who were tracked for six months. Sixty-four users were
interviewed and 247 interviews were conducted with staff.
The evaluation found Intermediate Care included diverse programs such as conventional rehabilitation
programs as well as programs in the Emergency Department aimed at preventing admission. There was no

16
core data set used by services which made evaluation difficult as there were no common outcomes across
services.
Observational data suggested that there had been changes in the structure of service delivery, largely a shift
in providers’ culture to a focus on client centred goals. There was movement toward cross agency,
multidisciplinary working but the extent of this was variable. The patient level evaluation suggested that the
experience of “recovery” was much longer than the Intermediate Care episode. Finally, the evaluation
concluded that the programs needed more medical involvement at strategic and operational levels to
improve the quality and effectiveness of the service which implied the program had struggled to get
engagement in the early phase. The researchers identified three elements of “good user centred
Intermediate Care” which defined its quality:
• Enabling ethos which boosted individual’s confidence
• Partnership with informal support networks to maintain and sustain recovery
• Links into ongoing practical, clinical and social support services
Given the research approach, the researchers were cautious about committing to whether Intermediate Care
“worked”. The major conclusion of the report was to describe the nature of the program in conceptual terms.
Essentially it was described as “cloud-like”, as a program which cannot be reduced to individual service
components but should be “conceived of as a system of care in the space between locations, sectors, and
states”. Importantly it was noted that there was wide variation in the allocation of resources and the
expenditure of the various programs.
Intermediate Care has fostered an outcomes focused approach in community settings with a strong
emphasis on change outcomes (Glendinning, Clarke et al. 2008). Qureshi et al. identified three types of
outcomes desirable in older people (Qureshi, Patmore et al. 1998). Change outcomes describing
improvements in physical, mental, and emotional functioning. Maintenance outcomes prevent or delay
deterioration in health well being or quality of life. These include: living in a clean environment, having
access to social contact, control over everyday life and there are consistencies between these outcomes and
older people’s definitions of quality of life (Walker and Hennessy 2004). Finally, process outcomes refer to
the experience of seeking, obtaining, and using services. These include feeling valued and respected, being
treated as an individual having control over how and when services are provided. Intermediate Care is
focused on change outcomes and this has led to some debate (Glendinning, Clarke et al. 2008).
2.3. Post Acute Care in the US In the US post acute care (PAC) is seen as an extension of hospital care but there is a high dependence on
nursing home facilities for its provision. Medicaid is the primary public payer for long-term care and Medicare
the primary payer for acute care and in 2005 Medicare spent $42 billion on PAC services which represents
13% of all Medicare benefit spending. Acute hospital stays in US hospitals are short and PAC has a number
of venues, which include formal inpatient rehabilitation facilities, skilled nursing facilities, long term care
hospitals, and home health care. Overall, one third of Medicare patients leaving acute care hospitals in 2002
received some form of PAC (Buntin 2007) but non-clinical factors play a large part in the deciding which

17
patient groups access which post acute service. Among the non-clinical factors affecting use of PAC is
geographic location with those in rural areas less likely to access any PAC (Kane, Lin et al. 2002). The US is
currently reviewing PAC approaches recognising that the payment policies have focused on the phase of
illness rather than care needs and services, and although patient characteristics may be similar the
payments across PAC setting are different. In January 2008 a demonstration program was established
which will run for a three year period and report to Congress with recommendations on changes. The aims
are to standardize patient assessment information, use the data to inform payment policy and develop a
reimbursement policy that is patient-focused rather than facility-focused. However, there is also an
emphasis on improving the management of transitions between care settings and increasing consumer
choice and control (Centers for Medicare and Medicaid Services 2006). Many US evaluations use outcomes research approaches taking advantage of large administrative data
bases (Neu, Harrison et al. 1989; Kane, Finch et al. 1996; Kane, Chen et al. 1998; Chen, Kane et al. 2000).
In a comparison of joint replacement management across settings in the US it was found that 30% of people
who had joint replacements went to Subacute Nursing Facilities (SNFs), 35% to inpatient rehabilitation
facilities and 35% directly home with home care, outpatient therapy, or no care (Kaplan 2007). The
outcomes from these sites differed but it is unclear to what extent this is a result of case selection or
interventions offered. In rehabilitation facilities, of those discharged 14 or more days after admission, 1%
walk independently at admission while 76% walk independently at discharge. For SNF patients 9% walk
independently at admission but only 31% walk independently at discharge. The differences are not in the
case mix but those patients in SNFs are older with more co-morbidities, and the reimbursement in SNFs is
lower so again it remains unclear the degree to which the type of care provided is contributing to outcomes.
Lack of clinical consensus about where various conditions should be treated e.g. whether hip fractures
should be treated in rehabilitation units or nursing home units in the US has made the choice of PAC sites
highly vulnerable to the influence of financial factors (Kramer, Steiner et al. 1997; Parker, Bhakta et al. 2000;
Buntin 2007). Outcomes are emphasised and innovations which include bundled payments and pay for
performance (e.g. adherence to protocols, avoidance of adverse outcomes) have focused on improving
outcomes such as reduction of hospital readmission and reduction of falls.
New consumer directed approaches (e.g. Cash and Counselling) which increase the level of consumer
choice and control over Medicaid funds for obtaining personal care services and home and community based
services have been assessed for provision of long term care services. Evaluations have been undertaken to
see whether an approach where the allowance is directly made to the consumer will improve outcomes of
beneficiaries and carers without increasing Medicaid costs per recipient (Dale and Brown 2007). Recipients
can use funds allocated to them to pay family members to provide home-care or pay agencies or purchase
equipment and home modifications. The initial evaluations of these programs found high levels of
satisfaction and improvements in caregiver well-being but a Medicaid cost increase which has resulted in
further iterations of the program to reduce the costs of consumer direction and increase levels of monitoring
(Dale and Brown 2007).

18
The US SNFs appear similar to residential-based TC units set up in some Australian states although the US
facilities have medical directors and more medical involvement. They are also designed to accommodate a
mix of long term care and acute patients so have appropriate equipment such as gyms. Little work has been
undertaken on the effects of multidisciplinary care models within the SNF environment (Kauh, Polak et al.
2005).
In summary, very short lengths of stay and a high demand for PAC have led to blurred lines between
rehabilitation and PAC. This has been compounded by the lack of evidence on the cost effectiveness of
various settings. Economic incentives resulting from different payment systems have led to non patient-
centred decisions about types of PAC offered and to payments based on site of care rather than type of
care, so a large demonstration project is underway to inform a reform process. The major lessons from the
US outcomes literature are the need for: cost effectiveness studies for different models of post acute care for
different conditions, the importance of common assessment tools, and the utility of outcome data sets to
monitor selection practices, outcomes and costs.
2.4. Methodological difficulties evaluating post acute care and
rehabilitation interventions Assessing the effects of rehabilitation type interventions involves assessing the change the intervention
made to a clinical trajectory over time while recognising the significant role in recovery of environment,
informal care, and socio-economic status (Kane 2007). Issues that are problematic are the timing of
measurement, identifying which outcomes to measure, how to measure the intervention, whose perspective
the evaluation undertakes, and controlling for case-mix. Finally, there is an ascertainment bias where the
evaluators will focus on outcomes which they have knowledge of and will investigate these issues more
thoroughly.
Of particular importance in evaluations of post acute care interventions is the confusion between settings and
services and the subsequent confusion about the quality of the outcomes from these sites (Stone 2000). If
a clinical intervention which is delivered in a specialist setting (e.g. rehabilitation unit) has better outcomes
than the same intervention being offered in a non specialist setting (e.g. residential aged care) then it may be
the staff mix and not the location that is the important difference (Parker, Bhakta et al. 2000). The
inefficiencies associated with differing sites of care are often related less to the sites than to the staffing
patterns. Even within hospitals, short hospital lengths of stay are associated with increased readmission
rates of older people. However, higher staff intensity ratios can compensate for this (Heggestad 2002).
More acute care (such as IV antibiotics, wound care, ventilation) is now provided in non-hospital settings
particularly in the US but the funding source rather than the goals of the care or the characteristics of the
recipient have primarily determined whether the care is considered acute.
2.5. The heterogeneity of the population targeted by Transition Care The frail population of older adults who make high use of hospitals are described as generally 75 years or
older, disabled in Activities of Daily Living (ADL) and instrumental ADL, with acute and chronic medical

19
problems, having impaired social networks, making frequent transitions (community, residential aged care,
hospital), and needing complex combinations of medical and social services. The concept of frailty is used
widely in the care of older people and although controversy still surrounds the definition it is conceptualized
as a state of increased vulnerability to stressors which results from decreased physiologic reserves and
dysregulation of multiple systems (Fried, Ferrucci et al. 2004).
One difficulty in providing post hospitalization services is the overlap between chronic care, transitional care,
and end of life care and although it is not always apparent to TC services which group of patients they are
treating, the service needs, and priorities of care differ. A NSW study found that in 2002 10.3% of all hospital
days and 8.9% of all hospital inpatients costs were used by people aged 65 and older in their last year of life
(Kardamanidis, Lim et al. 2007). The palliative care literature describes three trajectories for individuals with
chronic and eventually fatal illness (Lunney, Lynn et al. 2002; Murray, Kendall et al. 2005) and while
interventions with older people are often targeted at those most likely to face readmission and movement into
supported care (Naylor, Brooten et al. 1999) services are being provided to people on different trajectories
and the interventions need to be individualized. While geriatric rehabilitation and palliative care services are
rarely provided by the same group of providers, the client group may overlap.
Figure 2.1: Prototypical trajectories of the disablement process (Freedman, Hodgson et al. 2006)
In this model of end of life three possible groups of older people are apparent. The first trajectory represents
someone typically associated with end of life care e.g. a solid tumour with a short period of rapid, relatively
predictable decline (Lunney, Lynn et al. 2002). The other trajectories may well be picked up in programs for
older people such as TC. The second trajectory represents chronic organ system failure with a gradual
decline marked by exacerbations and hospitalization. Chronic heart failure, emphysema, and renal failure
are typical and 25% of deaths in the US fit into this category (Lunney, Lynn et al. 2002). The third trajectory
is poor long term functioning with slow decline. Very old patients with frailty, dementia, and multiple co-
morbidities fit into this category. Around 40% of individuals in the US belong to this group (Lunney, Lynn et

20
al. 2002). There can be a shift between hospitals and aged care services during these trajectories. For
example in NSW, hospital end of life costs decrease with increasing age at death with those over 85 less
likely to die in hospital. The decline in hospital costs is offset by an increase in the costs carried by
residential aged care. To date there has been no complete assessment of the “cost of dying” in Australia or
on the amount of the costs shared by these sectors (Kardamanidis, Lim et al. 2007).
2.6. What evidence lies behind the models of Transition Care used
in Australia? TC has used two major models of service delivery: community-based places which support frail older adults
or residential-based places located either in residential aged care facilities or in hospitals. The evidence
behind these service models in use in the Australian program will be summarized:
i) Packages of care to support remaining independent in the community
ii) Low cost beds in residential aged care which provide an alternative to a hospital bed
Many demonstration projects assessing home packages and discharge supports have been evaluated and
comprehensive meta-analyses of these community based programs are starting to emerge which summarise
the effects (Beswick, Rees et al. 2008). The literature behind the provision of alternate settings for beds is
limited and generally poorer in quality (Carpenter, Gladman et al. 2002).
iii) Integrated care models attempt to move away from silo project assessments towards evaluations of
system level change. There is less literature in this area which merges with evaluations of
government health service innovations and is often difficult to access.
2.6.1. Evidence base for Transition Care in the community setting A large base of primary trials inform this approach ranging from discharge planning interventions such as
home visits, to geriatric assessment approaches. Several important systematic reviews have been
undertaken over the last decade to summarise the evidence on home-based care (Hughes, Ulasevich et al.
1997), early discharge programs (Shepperd and Iliffe 1998) and best place of care (Parker, Bhakta et al.
2000).
The most comprehensive systematic review examining interventions to improve function and maintain
independent living in older people included 89 trials covering 97,984 people and found multi-factorial
interventions could improve function, reduce hospital admission, falls, and residential aged care admission
but not death (Beswick, Rees et al. 2008). The effects however, were small with a reduction in hospital
readmissions from 40.5% to 38.2%, a reduction in transfer to residential aged care of 10.6% to 9.2% over six
months and a very small shift in function (Beswick, Rees et al. 2008). There are few economic assessments
of these interventions but the authors concluded that given the high costs of hospital and residential aged
care compared to community care, small reductions are likely to offset the costs of interventions (Chappell,
Dlitt et al. 2004).
In the face of the very high hospital readmission rates noted internationally in this frail older group there has
been a shift away from models which do not include medical assessment as part of multi-factorial care (Black

21
2007) and towards programs which include an accurate medical diagnosis as part of the intervention to
identify potentially reversible causes of falls and disability and increase the chances of effect (Stott,
Langhorne et al. 2008).
While many programs are set up using a traditional rehabilitation approach which emphasises physical
reconditioning, the population who benefit is not limited to those with physical disability. Given the
comparatively modest functional gains noted in systematic reviews and the lack of evidence emerging for a
“dose” effect i.e. the intensity of the programs are not related to the level of improvement, there has also
been a call for inclusion of patients with dementia in these types of programs. While rehabilitation programs
have historically been wary of patients with dementia and excluded them from inclusion there are now
studies confirming benefits (Tappen, Roach et al. 2000; Rolland, Pillard et al. 2007) and it is probable that
those most likely to gain from intervention are those at highest risk of admission to hospital or residential
aged care which includes those with dementia (Stott, Langhorne et al. 2008).
Improved discharge planning and reorganized PAC with more active medical oversight and active
involvement of physicians during transitions is associated with lower readmissions into acute care (Naylor,
Brooten et al. 1999). A systematic review examining discharge planning found that coordinated discharge of
elderly people across hospital-community interfaces reduces hospital readmissions by 17% (Parker, Lee et
al. 2004). Case management is a popular strategy but is been only weakly associated with preventing
hospital readmission (Hutt, Rosen et al. 2004). In 2002, the UK pilots were funded in 10 primary care units
known as the UK Evercare program to evaluate combined nurse led assessment and intensive case
management in the community. They focused on older people at risk of readmission and an initial
assessment in 2005 found that the benefits were mostly in terms of quality of care (United Health Europe
2005). A later evaluation found no effects on emergency admissions, emergency bed days, or mortality
(Gravelle, Dusheiko et al. 2007). Despite this evaluation “community matrons” who are trained in care
coordination, patient communication, and advocacy have been introduced in the UK with the goal of
achieving a 5% reduction in hospital admission. It is hoped that they will bridge social and clinical needs of
patients. While it is anticipated that they will be popular with older people and increase access to care, it is
thought unlikely that they will affect hospital readmissions without further system redesign e.g. strengthening
of primary care (Gravelle, Dusheiko et al. 2007).
Importantly there are risks associated with assessment approaches in older people. In a 1996 Australian
trial assessing the impact of preventive health assessments for older veterans and war widows (Byles,
Tavener et al. 2004), small positive improvements were demonstrated in quality of life amongst those who
remained resident in the community. However, there was no effect on mortality or hospital admission and
disturbingly there was an increase in the movement into residential aged care presumably because the
comprehensive assessments uncovered problems.
Trials attempting to improve the coordination of care without system redesign have also been associated
with ambiguous results. In 1997 the Australian Government funded nine national trials of Coordinated Care
to test new models of service delivery for chronic conditions and many of these trials included older people

22
(Council of Australian Government 1995). The hypothesis was that the better coordination of people with
chronic or complex needs would reduce hospitalization and the savings would cover the cost of coordination.
The results found no improvements in health and no savings were demonstrated. Three trials showed
reductions in hospital readmission rates and most trials went into deficit. Numerous reasons were put
forward to explain the weak effects (often by the trialists) including: “the constraints of a controlled trial and a
rigid hypothesis driven national evaluation”, patient heterogeneity, short term follow-up (Battersby, Harvey et
al. 2007), and poor outcome selection (Esterman and Ben-Tovim 2002). Victoria’s post acute program
included an implementation trial which examined the effects of case management, post acute nursing, and
community services on 654 older people following hospital discharge (Lim, Lambert et al. 2003) and was
unable to show reductions in hospital readmissions but over six months found reductions in days in hospital.
A key message that these ambitious Australian trials highlight is the risk of overemphasising assessment.
Uncovering unmet needs in complex older people without the capacity to then provide services or
interventions to address those needs has been in an issue in several care coordination studies (Weaver,
Hickey et al. 2008). The hope is that more utilization of services in the short term will be offset by longer
stays in the community, but long term evaluations have not been undertaken to test this assumption. In
addition, the trials demonstrate the difficulty in re-engineering the Australian health system from an acute to a
chronic focus is apparent and the likelihood of achieving, at best, very small effects if follow-up periods are
short.
2.6.2. Evidence base for Transition Care in the residential setting Pressures on hospitals have reduced the lengths of stays in many countries. Between 1982 and 1993 length
of stay for geriatric patients in England dropped by 60% and in Australia between 1992 and 2002 specialist
geriatric beds decreased by 24.8% (Gray, Dorevitch et al. 2002). The evidence for alternative sites of care
(e.g. nurse led wards, nursing home sites) to treat older people who often need more time to recover has
been reviewed (Parker, Peet et al. 2002). The review concludes that the quality of trials on nurse led beds is
poor and there is considerable uncertainty about both costs and outcomes of these alternate approaches. A
more positive message is that there is no evidence that alternate settings adversely affect mortality.
As a result of the poor evidence on nurse led trials, debate has occurred in both the UK and more recently
Australia around the “opportunity cost” of funding bed substitution programs (Black 2007; Gray, Travers et al.
2008). The weak results from trials evaluating these interventions has been contrasted with the lack of
investment in inpatient rehabilitation which remains the only intervention firmly associated with reduced
mortality and institutionalization rates as well as improved functional rates (Stuck, Siu et al. 1993; Evans,
Connis et al. 1995). However, this debate is often fuelled by an emphasis on substitution approaches as a
form of cost cutting, which distracts from the important discussion about where is the correct place of care for
older people to receive treatment.
2.6.3. Evidence base for Integrated Systems of Care Demonstration approaches are often defined by where the projects are delivered (e.g. at home, in residential
aged care facilities). However, when implemented as health programs where the emphasis is on flows

23
across a system, the focus tends to shift away from individual outcomes towards measures of integration
across services areas and towards measures which indicate improving coordination. Once programs enter
the health system governance issues, payment incentives, and sector alignments become more significant.
Although there are very limited rigorous analyses of effects and in particular on the cost effectiveness in
these programs a group of programs known as integrative service delivery (ISD) programs have been
developed to improve continuity and increase efficiency.
ISD programs aim to improve continuity and efficiency of services and have been defined as “a discrete set
of techniques and organizational models designed to create connectivity, alignment, and collaboration within
and between the cure and care sectors at the funding administrative and/or provider levels” (Kodner and
Kyriacou 2003). These models have shown variable levels of success in reducing movement into permanent
aged care and they have struggled to engage primary care physicians. Three levels of integration are
recognized: linkage, coordination, and full integration (Leutz 1999). Full integration models include PACE
(Program of All inclusive Care for the Elderly) projects (Branch, Coulam et al. 1995; Gross, Temkin-Greener
et al. 2006), Social Health Maintenance Organization (S/HMO) in the US (Harrington, Cassel et al. 1991),
and SIPA (systeme de services integers pour personnes agees en perte d’autonomie) in Montreal (Beland,
Bergman et al. 2006). Capitation budgeting is usually a key component of these programs which attempt to
integrate acute and longer term care delivery and financing to provide alternatives to nursing home
placement. Co-ordination models such as PRISMA (Program of Research to Integrate the Services for the
Maintenance of Autonomy) are established at the strategic level (governance) of health care, social
services, and community agencies where the decision makers agree on the policies and orientation then at
the management levels, with a service co-ordination committee and at the operational level (Hebert, Durand
et al. 2003). PACE is provided for frail elders eligible for Medicaid and nursing home certifiable. It uses an
ISD model with adult day care as the focal point and vigorously attempts to keep individuals out of nursing
homes (Branch, Coulam et al. 1995). The US Department of Veteran Affairs most recently has evaluated
three models of providing All-Inclusive Care for frail elderly veterans who meet the criteria for nursing home
placement and found days in SNFs increased but rates of permanent institutionalization decreased (Weaver,
Hickey et al. 2008).
Lack of integrated systems of care for older people with both medical issues (such as co-morbidities,
physical, and psychological health) and social factors (including support and housing) may adversely
influence their ability to live independently in the community (Stuck, Walthert et al. 1999; Ayis, Gooberman-
Hill et al. 2006). Reform programs which enhance clinical integration include innovations such as: the
pooling of health and social service resources, establishment of new cross-border roles to assist patients and
families e.g. transition managers (Coleman, Boult et al. 2003) and case managers (Gravelle, Dusheiko et al.
2007). This area of research is evolving and overlaps with the work on coordination. A 2007 report from the
Organization for Economic and Co-operation and Development (Hofmarcher, Oxley et al. 2007) summaries
four key areas for policy reform faced by all countries attempting to enhance the capacity of health care
systems to better coordinate care:
• Better patient information systems to allow transfer between providers and across institutional
boundaries.

24
• Review of the share of overall resources allocated to ambulatory care settings.
• Issues around how payment arrangements can be aligned to incentivise integration.
• Concerns about how best to break down barriers between care “silos”. The issue was noted to be
particularly important for transitions into long term care where problems are most fragmented.

25
2.7. Summary The TCP was developed by policy makers to address political issues while the literature emerges from
predominantly clinical practice interventions focused on maintaining frail older people in the community. The
research literature tends to focus on evidence for efficacy, effectiveness, safety and cost benefit but there is
very little information on effective ways to achieve system change for older people. The evidence for
multifaceted interventions delivered by multidisciplinary teams in the community suggests functional gains
are obtainable and small reductions in levels of re-hospitalization and transfer to aged care are possible.
The literature on using alternative sites to hospitals as beds is poor and there is little to suggest that it is
efficient. US models of PAC have identified case selection and payment incentives as important but there
are very few assessments of the cost effectiveness of various post acute programs for different conditions.
Comprehensive data capture across care sectors is required to drive quality improvement and improve
payment efficiency. Finally, the literature confirms that many western countries are engaged in an iterative
redesign process as they attempt to reorient away from acute care towards chronic care and improve the
integration of health and social services.

26
3. Transition Care recipients: Characteristics and outcomes
Key points
• The sample of 2,443 linked records for TC recipients represents 76.2% of the 3,206 approvals for TC
between 1 October 2006 and 31 March 2007.
• Sixty-four percent of the TC recipients were female, TC recipients had an average age of 82.2 years
and 41% had a co-resident carer.
• Overall, the mean MBI at admission to TC was 64.5 units and at discharge was 75.7 units. Those
who received community-based TC had admission and discharge mean MBIs of 75.2 and 86.0 units,
while those who received residential-based TC had lower physical functioning with mean 51.6 and
62.3 units at admission and discharge, respectively.
• The median length of stay in TC was 71.3 days, overall, shorter for recipients of TC only in a
residential setting (38.0 days) in comparison with recipients of TC only in a community setting (58.0
days).
• Both recipients and carers reported high levels of satisfaction with TC. However, one third did not
know the purpose for taking their medications.
• During the three months following ACAT approval, 37% of recipients were readmitted to hospital,
higher amongst those who received community-based TC (39%) than residential-based TC (35%).
Twenty-two percent had a permanent admission to residential aged care and 8% died.
• By six months post ACAT approval, the hospital readmission rate had increased to 47% for all
recipients, again higher for community-based versus residential based TC (51% versus 43%).
Twenty eight percent had a permanent admission to residential aged care and 14% died.
Outcomes at three month post-ACAT assessment for a cohort of 5,510 older people (2,443 TC recipients,
879 Control 1 and 2,188 Control 2) were reported previously in the Controlled Comparison Study and Costs
and Effects Study (National Evaluation of the Transition Care Program 2008). Aggregated data for individual
level outcomes were also reported in the Models of Transition Care Report (National Evaluation of the
Transition Care Program 2007a) and Recipient Snapshot Study (National Evaluation of the Transition Care
Program 2007b). In this section, these findings are synthesised and some additional findings in terms of
hospital readmissions, residential aged care admissions, and deaths at six months post ACAT approval are
also presented. Data are also drawn from the Australian Government Department of Health and Ageing
COGNOS database concerning TC to supplement existing data.
Three groups were compared in Controlled Comparison and Costs and Effects Study. The groups were
defined as follows:
i) TC recipients – People who were ACAT assessed in an acute or other hospital setting between 1
October 2006 and 31 March 2007, were approved to receive TC, and subsequently completed a TC episode
by 30 September 2007.

27
ii) Control 1 – People who were ACAT assessed in an acute or other hospital setting between 1
October 2006 and 31 March 2007, were approved to receive TC, but with no TC episode by 30 September
2007. This group did not progress to the program despite approval.
iii) Control 2 – People who were ACAT assessed in an acute or other hospital setting between 1
October 2006 and 31 March 2007, were approved for CACP but not TC.
As shown in Table 3.1, there were 3,206 ACAT approvals for TC where assessment took place in the acute
or other inpatient setting between 1 October 2006 and 31 March 2007. Table 3.1 presents a comparator of
the number of TC recipients from each state included in the data linkage sample versus the number of
approvals for TC in the same period. A further comparison can be drawn from the number of people
admitted to TC in the same period. TCP COGNOS admissions data show that 3,418 people were admitted
to TC between 1 October 2006 and 31 March 2007. The data linkage sample appears to have captured the
majority of TC recipients in all jurisdictions with the exception of NSW.
Table 3.1: Sample of Transition Care recipients and number of ACAT assessments 1 October 2006 – 31 March 2007
State Data linkage TC
recipients ACAT assessment TCP admissions data
ACT 69 114 91
NSW 630 1,194 1,219
NT 12 20 12
QLD 273 300 309
SA 289 403 354
TAS 98 111 104
VIC 934 1,435 1,098
WA 138 290 231
Overall 2,443 3,206 3,418
3.1. Baseline characteristics of Transition Care recipients Baseline characteristics of TC recipients from the cohort in the linked data set (i.e. n=2,443 TC recipients)
are presented in Table 3.2. As this table shows, the average age of recipients was more than 80 years and
slightly more than one third of recipients were male. The average improvement in MBI was slightly more
than 10 points on average. Not unexpectedly, the MBI at admission was higher among the community-
based TC recipients than the residential-based TC recipients. The data concerning indigenous status from
the Aged Care Client record (ACCR) suggested that 0.2% of recipients identified as Aboriginal or Torres
Strait Islander or both. More than three quarters of TC recipients were in private residences prior to TC
admission, and almost half of TC recipients lived alone prior to their ACAT assessment. A total of 41% had a
coresident carer at the time of ACAT assessment.
Twenty three percent of TC recipients elected to be treated as private hospital patients. Election status at
the index hospitalization was unavailable for recipients in Victoria and Tasmania. The data concerning

28
election status was derived from different variables for each of the hospital morbidity data collections. In
Western Australia it was derived from insurance status while in South Australia, Queensland, and New South
Wales it was based on payment at separation.
Of the 2,443 TC recipients, 1,204 (49%) received TC only in a community setting, 1,026 (42%) received TC
only in a residential setting, and 213 (9%) received TC in both a community-based and a residential-based
setting.

29
Table 3.2: Baseline characteristics of recipients of Transition Care All Community Residential n Data source
Age mean (SD) 82.2 (8.0) 81.0 (7.7) 83.2 (8.3) 2,443 ACCR/Medicare
Gender % male 36% 35% 37% 2,443 ACCR/Medicare
Number of ACAT assessments mean (SD) 1.07 (0.26) 1.08 (0.28) 1.06 (0.24) 2.443 ACCR/Medicare
MBI on admission mean (SD) 64.5 (24.2) 75.2 (18.0) 51.6 (25.1) 2,443 TC program
MBI on discharge mean (SD) 75.7 (25.3) 86.0 (17.5) 62.3 (27.7) 2,443 TC program
Length of stay in TC (median, IQR) 52 (28-75) 58 (37-78) 38 (19-62) 2,443 TC program
Length of stay in TC ex. Deaths, d/c to hospital (median, IQR) 57 (35-78) 65 (46-81) 41 (22-66) 2,443 TC program
Indigenous status % 0.2% 0.3% 0 2,158 ACCR
Usual client accommodation setting % 2,158 ACCR
Private residence owned or rental 79% 86% 73%
Independent living within retirement village 6% 6% 5%
Supported community 2% 0.2% 5%
Residential aged care – Low Level Care 4% 0.3% 8.4%
Residential aged care – High Level Care 0 0 0
Other 8% 7% 7%
Usual client living arrangements % 2,158 ACCR
Lives alone 49% 46% 50%
Lives with family 43% 51% 38%
Lives with others 2% 2% 3%
Not applicable/not stated 5% 1% 10%
Coresident carer 41% 45% 39% 1,984 ACCR
Measure of cognition % cognitively impaired 24% 14% 34% 2,157 ACCR
Primary health condition at admission to TCP % 2,158 ACCR
Infectious and parasitic disease 0.5% 0.5% 0.5%
continued

30
Table 3.2 (continued): Baseline characteristics of recipients of Transition Care All Community Residential n Data source
Neoplasms 3.6% 2.8% 4.5%
Blood, blood forming organs & immunological disorders 0.3% 0.3% 0.3%
Endocrine, nutritional and metabolic diseases 2.3% 2.1% 2.6%
Mental and behavioural disorders 12.4%% 6.4% 18.4%
Diseases of the nervous system 4.2% 4.8% 3.8%
Diseases of the eye and adnexa 0.7% 0.7% 0.6%
Disease of the ear and mastoid process 0.1% 0 0.2%
Diseases of the circulatory system 23.4% 25.2% 22.5%
Diseases of the respiratory system 4.6% 4.6% 5.0%
Diseases of the digestive system 2.8% 3.8% 1.9%
Diseases of the skin and subcutaneous tissue 0.9% 0.9% 1.1%
Diseases of musculoskeletal system & connective tissue 4.6% 5.9% 3.4%
Diseases of the genitourinary system 2.1% 2.8% 1.7%
Congenital malformations, deformations 0% 0% 0%
Injury, poisoning and other consequences of ext. trauma 24.1% 26.4% 20.3%
Symptoms, signs not otherwise classified 11.0% 9.6% 12.1%
Time from ACAT to TCP admission median (IQR) days 4 (1-8) 4 (2-8) 4 (1-8) 2,443 ACCR/TCP
Main language spoken at home %
English 87% 89% 85
German 1% 0.3% 1%
Greek 2% 1% 3%
Italian 3% 3% 3%
Polish 1% 0.3% 2%
Other 6% 6% 6%
Patient election status at initial referral1 %private 23% 20% 22% 1,169 Hospital morbidity collections 1: based on ACT, NSW, QLD, SA, WA

31
3.2. Function Evidence for a functional outcome of the TCP is based on the MBI, and this outcome has been considered in
each of the three aforementioned reports.
The Models of Transition Care Report (National Evaluation of the Transition Care Program 2007a)
demonstrated that overall the average MBI at admission to TC was 64.3 units and at discharge was 76.9
units, representing a change of 12.5 units. It is important to note that those who died or were discharged to
hospital are coded as ‘0’ in the TCP Program Management Data Set, and these cases have been excluded
in the calculation of the discharge MBI (National Evaluation of the Transition Care Program 2007a). When
expressed as MBI change per day of stay, this gives an MBI efficiency of 0.26 units. For TC delivered only in
a community setting, the average MBI at admission was 73.7 and discharge 84.8, representing a change of
11.1 units. The change from admission to discharge MBI among TC delivered only in a residential setting
was greater, being 51.1 at admission and 65.0 at discharge, with a change of 13.8 units.
This finding must be interpreted bearing in mind the considerable diversity both between and within states or
territories in terms of client profile and functional capacity. Telephone-based interviews with recipients of TC
at three months post TCP-discharge showed a mean MBI of 84.5 (SD 22.1) units, and this was higher
among the recipients receiving TC only in a community setting (88.7 SD 17.0) than those who received TC
only in a residential setting (74.0 SD 29.1). Among the group of TC recipients for whom linked data was
available (n=2,443), the average MBI on admission to TC was 64.5 units (SD 24.2) and on discharge was
75.7 units (SD 25.3). This can be further decomposed to type of TC received, which showed that those who
received TC only in a community setting entered with an average MBI of 75.2 units (SD 18.0) and were
discharged with an average MBI of 86.0 (SD 17.5). For those who received TC only in a residential setting,
the mean MBI on admission to TC was 51.6 units (SD 25.1) and the mean MBI at discharge from TC was
62.3 (SD 27.7). Those who received a combination of community-based and residential-based TC services
were intermediate between these average values. The mean MBI on admission for the combination group
was 63.0 (SD 21.1) and on discharge was 78.8 (SD 22.7).

32
Table 3.3: Median (IQR) Modified Barthel Index for all Transition Care recipients by type of Transition Care: Community, Residential, and Combination
Modified Barthel Index
n On admission On discharge ACT
Community 24 80 (73-84) 98 (87-98)
Residential 16 72 (64-80) 86 (71-95)
Combination 29 74 (69-80) 98 (94-100)
NSW
Community 531 80 (66-89) 94 (85-100)
Residential 94 60 (45-76) 86 (75-95)
Combination* 5 68 (59-84) 97 †
NT
Residential 12 38 (27-45) 53 (33-58)
QLD
Community 265 83 (74-89) 97 (88-100)
Residential** 3 89 † 77 †
Combination*** 5 78 (69-90) 84 (78-93)
SA
Community 110 77 (65-86) 84 (72-92)
Residential 140 56 (34-70) 80 (60-88)
Combination 39 67 (49-83) 86 (74-90)
TAS
Community 34 70 (62-79) 90 (74-95)
Residential 58 63 (54-75) 94 (81-98)
Combination 6 57 (42-69) 89 (69-94)
VIC
Community 205 75 (55-85) 84 (65-93)
Residential 646 48 (26-69) 56 (30-78)
Combination 83 56 (37-74) 68 (45-90)
WA
Community 35 84 (74-91) 92 (90-96)
Residential 57 59 (34-78) 76 (52-92)
Combination 46 71 (61-82) 95 (90-97) Median (IQR)
* only 5 recipients of Combination TC in NSW; ** only 3 recipients of Residential TC in QLD; *** only 5 recipients of Combination TC in
QLD; † IQR not calculable as too few observations

33
3.3. Length of stay The median length of stay in TC differed according to type of TC received. Those who were on the
residential-based program had a shorter length of stay in the program than those who received community-
based TC. When those who were discharged to hospital or died on the program were excluded, the length
of stay increased by several days for both types of TC.
Table 3.4: Length of stay and adjusted length of stay excluding those discharged to hospital or death for all Transition Care recipients
Length of Stay Adjusted Length of Stay n Median IQR Median IQR
ACT
Community 24 79.0 54.5 – 84.0 81.0 57.0 – 84.0
Residential 16 28.5 9.5 – 41.0 32.0 12.5 – 44.0
Combination 29 60.0 47.0 – 84.0 59.0 45.3 – 84.0
NSW
Community 531 56.0 35.0 – 72.6 58.0 43.0 – 78.0
Residential 94 47.0 28.0 – 65.0 49.0 29.5 – 66.5
NT
Residential 12 45.5 23.6 – 57.5 45.5 18.3 – 58.3
QLD
Community * 265 57.0 41.0 – 78.0 62.0 45.3 – 79.8
SA
Community 110 50.2 29.0 – 80.2 68.0 37.0 – 82.2
Residential 140 51.5 30.6 – 72.6 56.0 36.5 – 76.1
Combination 39 66.0 53.5 – 80.7 70.0 53.5 – 84.1
TAS
Community 34 78.5 41.2 – 84.0 80.0 64.0 – 85.0
Residential 58 53.0 28.0 – 80.0 59.0 34.0 – 82.0
Combination 6 80.5 54.0 – 85.0 80.5 46.0 – 86.1
VIC
Community 205 70.0 38.0 – 80.0 74.0 52.0 – 82.0
Residential 646 32.0 16.0 – 56.0 74.035.0 18.0 – 58.0
Combination 83 69.0 45.0 – 81.1 74.13 50.5 – 84.0
WA
Community 34 75.2 46.0 – 84.0 80.0 59.6 – 84.5
Residential 57 52.0 30.2 – 72.2 59.0 31.6 – 78.6
Combination 46 83.0 69.2 – 84.0 83.0 68.0 – 84.0
National
Community 1,204 58.0 37 – 78.25 65.0 46.0 – 81.0
Residential 1,026 38.0 19 – 62.3 41.0 22.0 – 66.0
Combination 213 71.3 48 – 83.1 76.6 51.3 – 84.0 * 265 of the 273 TC recipients in Queensland received community based services and therefore only results for this group are presented
for this state.

34
3.4. Modified Barthel Index Efficiency MBI efficiencies (i.e. change in function per day of stay) for the 2006/07 financial year were calculated in
each jurisdiction according to type of care (Community, Residential or Combination), and this is shown in
Figure 3.1. These data were drawn from the TCP COGNOS database maintained by the Department of
Health and Ageing.
In terms of MBI efficiency, the overall figures for TC in the community and residential setting were 0.15 (i.e.
change of 9.2 units in 61.1 days) and 0.24 (i.e. change of 10.3 units in 42.3 days), respectively. As Figure
3.1 demonstrates, TC delivered only in a residential setting had greater MBI efficiency for the majority of
jurisdictions, with the exception of Victoria. The combination of community-based and residential-based TC
also appears to be more efficient in terms of functional gain per day than TC only in a community setting.
Figure 3.1: Modified Barthel Index efficiencies by type of Transition Care per jurisdiction
0
0.05
0.1
0.15
0.2
0.25
0.3
0.35
0.4
0.45
0.5
ACT NSW NT QLD SA TAS VIC WA
Effic
ienc
y
CommunityResidentialCombination
3.5. The Transition Care experience Telephone interviews with 630 TC recipients and 386 carers three months post-discharge from TC (National
Evaluation of the Transition Care Program 2007b) showed that overall 93% of recipients (or their proxy) were
satisfied or very satisfied with TC. Furthermore, 93% of carers were satisfied or very satisfied with the TC
their relative/friend received. However, there was an issue concerning the lack of information provided to
potential TC recipients so that they knew what to expect from TC. As noted in the Recipient Snapshot Study
Report (National Evaluation of the Transition Care Program 2007b), it is unclear whether this reflected a lack
of communication with the recipient or their proxy from the acute hospital service or from the TC services.

35
The quality of the transition to TC was measured in the Recipient Snapshot Study using the CTM-3;
(Coleman, Mahoney et al. 2005). The CTM-3 includes three major domains that have been deemed as
critically important to an individual’s experience of a change in care setting, namely how well recipients
understood their own responsibilities in managing their health, the purpose for each of their medications, and
whether family/carer preferences were taken into account. The CTM-3 is scored between 0 and 100, with
higher scores indicating a better transition. Scores around 66.67 indicate TC recipients strongly agreed with
two of the three domains. The Recipient Snapshot Study (National Evaluation of the Transition Care
Program 2007b) showed the average CTM-3 score at three month follow-up was 68.6 (SD 13.8) and this
was similar to the average reported by Coleman et al. (Coleman, Mahoney et al. 2005) in their US-based
study of the quality of care transitions. The greatest difficulty that was reported by recipients was in
understanding the purpose of each of their medications, and 32% of the respondents in this study did not
know the purpose for taking all of their medications.
The Recipient Snapshot Study also highlighted the differences between jurisdictions, noting a significantly
lower average CTM-score among the Victorian TC recipients than in other states or territories. This appears
to correlate with the lower average MBI scores at admission to TC in Victoria than in other parts of Australia.
3.6. Hospital readmissions In terms of hospital readmissions, the Final Report of the Controlled Comparison Study and Costs and
Effects Study (National Evaluation of the Transition Care Program 2008) showed that 37% of TC recipients
overall were readmitted one or more times during the three months post ACAT approval. The readmission
rate was slightly higher among the recipients of TC only in a community setting (39%) than among either
recipients of TC only in a residential setting or those who received a combination of community-based and
residential-based TC services (35% in each). The Models of Transition Care Report (National Evaluation of
the Transition Care Program 2007a) reported that overall 22% of TC recipients were discharged from the
TCP to hospital in 2006/07. It is noteworthy that the discharge to hospital rate was somewhat higher in New
South Wales and Queensland, which have a large component of community-based TC places (exclusively
community in Queensland at the time of writing this report). A breakdown of discharge reason by jurisdiction
and type of care is presented in Table 3.5.

36
Table 3.5: Discharge destination by jurisdiction and type of care Community
State Type of Care Death Hospital Nursing
Home Hostel Other With no support HACC CACP EACH
Move to other
TC service Total
ACT Community Only 0 8 0 1 2 17 9 6 2 0 45
% 0.0 17.8 0.0 2.2 4.4 37.8 20.0 13.3 4.4 0.0
Residential Only 0 14 1 6 4 17 1 6 0 1 50
% 0.0 28.0 2.0 12.0 8.0 34.0 2.0 12.0 0.0 2.0
Combination 0 7 5 3 7 22 9 16 1 0 70
% 0.0 10.0 7.1 4.3 10.0 31.4 12.9 22.9 1.4 0.0
Total 0 29 6 10 13 56 19 28 3 1 165
% 0.0 17.6 3.6 6.1 7.9 33.9 11.5 17.0 1.8 0.6
NSW Community Only 14 458 18 26 162 472 487 244 29 6 1,916
% 0.7 23.9 0.9 1.4 8.5 24.6 25.4 12.7 1.5 0.3
Residential Only 2 74 14 61 25 22 67 25 3 9 302
% 0.7 24.5 4.6 20.2 8.3 7.3 22.2 8.3 1.0 3.0
Combination 1 8 2 4 3 3 2 4 0 1 28
% 3.6 28.6 7.1 14.3 10.7 10.7 7.1 14.3 0.0 3.6
Total 17 540 34 91 190 497 556 273 32 16 2,246
% 0.8 24.0 1.5 4.1 8.5 22.1 24.8 12.2 1.4 0.7
NT Community Only 0 0 0 0 0 0 0 0 0 0 0
%
Residential Only 1 4 3 5 1 0 7 1 0 0 22
% 4.5 18.2 13.6 22.7 4.5 0.0 31.8 4.5 0.0 0.0
Combination 0 0 0 0 0 0 0 0 0 0 0
%
Total 1 4 3 5 1 0 7 1 0 0 22
% 4.5 18.2 13.6 22.7 4.5 0.0 31.8 4.5 0.0 0.0
(cont)

37
Table 3.5 (continued): Discharge destination by jurisdiction and type of care Community
State Type of Care Death Hospital Nursing
Home Hostel Other With no support HACC CACP EACH
Move to other
TC service Total
QLD Community Only 6 120 4 3 32 94 177 62 2 2 502
% 1.2 23.9 0.8 0.6 6.4 18.7 35.3 12.4 0.4 0.4
Residential Only 1 7 0 1 0 1 0 0 0 0 10
% 10.0 70.0 0.0 10.0 0.0 10.0 0.0 0.0 0.0 0.0
Combination 0 1 0 0 2 2 4 0 0 0 9
% 0.0 11.1 0.0 0.0 22.2 22.2 44.4 0.0 0.0 0.0
Total 7 128 4 4 34 97 181 62 2 2 521
% 1.3 24.6 0.8 0.8 6.5 18.6 34.7 11.9 0.4 0.4
SA Community Only 3 66 6 7 6 58 57 53 5 2 263
% 1.1 25.1 2.3 2.7 2.3 22.1 21.7 20.2 1.9 0.8
Residential Only 6 69 75 60 24 44 41 25 4 23 371
% 1.6 18.6 20.2 16.2 6.5 11.9 11.1 6.7 1.1 6.2
Combination 0 4 0 0 2 19 12 6 0 0 43
% 0.0 9.3 0.0 0.0 4.7 44.2 27.9 14.0 0.0 0.0
Total 9 139 81 67 32 121 110 84 9 25 677
% 1.3 20.5 12.0 9.9 4.7 17.9 16.2 12.4 1.3 3.7
TAS Community Only 0 15 0 0 10 8 16 5 3 0 57
% 0.0 26.3 0.0 0.0 17.5 14.0 28.1 8.8 5.3 0.0
Residential Only 2 22 8 3 7 22 37 7 0 2 110
% 1.8 20.0 7.3 2.7 6.4 20.0 33.6 6.4 0.0 1.8
Combination 0 1 1 0 3 0 2 1 0 0 8
% 0.0 12.5 12.5 0.0 37.5 0.0 25.0 12.5 0.0 0.0
Total 2 38 9 3 20 30 55 13 3 2 175
% 1.1 21.7 5.1 1.7 11.4 17.1 31.4 7.4 1.7 1.1
(cont)

38
Table 3.5 (continued): Discharge destination by jurisdiction and type of care Community
State Type of Care Death Hospital Nursing
Home Hostel Other With no support HACC CACP EACH
Move to other
TC service Total
VIC Community Only 5 133 7 12 59 20 110 26 14 1 387
% 1.3 34.4 1.8 3.1 15.2 5.2 28.4 6.7 3.6 0.3
Residential Only 85 210 639 159 42 24 26 16 8 7 1,216
% 7.0 17.3 52.5 13.1 3.5 2.0 2.1 1.3 0.7 0.6
Combination 4 29 26 14 4 16 31 10 3 0 137
% 2.9 21.2 19.0 10.2 2.9 11.7 22.6 7.3 2.2 0.0
Total 94 372 672 185 105 60 167 52 25 8 1,740
% 5.4 21.4 38.6 10.6 6.0 3.4 9.6 3.0 1.4 0.5
WA Community Only 2 21 1 0 6 41 18 13 2 0 104
% 1.9 20.2 1.0 0.0 5.8 39.4 17.3 12.5 1.9 0.0
Residential Only 3 59 68 33 25 9 2 6 2 0 207
% 1.4 28.5 32.9 15.9 12.1 4.3 1.0 2.9 1.0 0.0
Combination 0 12 2 18 5 37 40 20 0 0 134
% 0.0 9.0 1.5 13.4 3.7 27.6 29.9 14.9 0.0 0.0
Total 5 92 71 51 36 87 60 39 4 0 445
% 1.1 20.7 16.0 11.5 8.1 19.6 13.5 8.8 0.9 0.0
Total Total 135 1,342 880 416 431 948 1,155 552 78 54 5,991
% 2.3 22.4 14.7 6.9 7.2 15.8 19.3 9.2 1.3 0.9

39
Tables 3.6 and 3.7 summarise hospital readmissions at three and six months post ACAT approval at a
jurisdictional and national level for recipients of TC only in a community setting versus those who received
TC only in a residential setting.
At three months post ACAT approval, 37% of TC recipients had at least one readmission to hospital, and this
was higher among those who received TC only in a community setting (38%) versus those who had TC only
in a residential setting (35%).
At six months post ACAT approval, 47% of TC recipients had at least one readmission to hospital, and this
readmission rate was higher among those who received TC only in a community setting (51%) versus those
who received TC only in a residential setting (43%). These high levels of readmission reinforce the frailty of
the TC recipients.
Table 3.6: Hospital readmissions, residential aged care admissions, and deaths for Transition Care recipients at three months post ACAT approval
Hospital readmissions Residential aged care
Dead at three
months TC recipient n (%) LOS (IQR) n (%) LOS (IQR) n (%)
ACT Community 7 (35%) 13 (3 – 29) 0 (0%) - 0 (0%)
Residential 10 (71%) 35 (9 – 53) 4 (25%) 9 (2 – 62) 4 (25%)
NSW Community 167 (38%) 13 (4 – 26) 25 (5%) 29 (14 – 54) 26 (5%)
Residential 28 (36%) 12 (1 – 36) 22 (23%) 30 (15 – 43) 8 (9%)
NT Residential 2 (25%) - 1 (8%) - 0 (0%)
QLD Community 73 (34%) 10 (3 – 22) 5 (2%) 37 (6 – 42) 7 (3%)
SA Community 37 (40%) 9 (5 – 31) 6 (6%) 27 (3 – 39) 5 (5%)
Residential 39 (36%) 9 (4 – 27) 37 (26%) 28 (12 – 36) 10 (7%)
TAS Community 21 (62%) 12 (2 – 23) 2 (6%) - 1 (3%)
Residential 54 (93%) 52 (31 – 81) 5 (9%) 45 (19 – 61) 3 (5%)
VIC Community 68 (41%) 9 (3 – 20) 8 (4%) 22 (16 – 31) 12 (6%)
Residential 123 (26%) 12 (4 – 23) 378 (59%) 49 (28 – 66) 111 (17%)
WA Community 9 (26%) 5 (2 – 40) 0 (0%) - 3 (9%)
Residential 25 (44%) 31 (10 – 45) 13 (23%) 28 (8 – 47) 4 (7%)
National Community 382 (38%) 12 (4 – 25) 46 (4%) 29 (14 – 44) 54 (4%)
Residential 283 (35%) 17 (6 – 43) 460 (45%) 45 (25 – 63) 141 (14%)

40
Table 3.7: Hospital readmissions, residential aged care admissions, and deaths for Transition Care recipients at six months post ACAT approval
Hospital readmissions Residential aged care
Dead at six
months TC recipient n (%) LOS (IQR) n (%) LOS (IQR) n (%)
ACT Community 12 (60%) 13 (5 – 51) 1 (4%) - 2 (8%)
Residential 10 (71%) 35 (10 – 55) 7 (44%) 70 (28 – 91) 6 (38%)
NSW Community 217 (50%) 17 (6 – 35) 48 (9%) 89 (47 – 120) 49 (9%)
Residential 36 (47%) 16 (4 – 45) 36 (38%) 94 (43 – 124) 16 (17%)
NT Residential 2 (25%) - 0 (0%) - 1 (8%)
QLD Community 98 (46%) 6 (2 – 22) 13 (5%) 77 (43 – 97) 15 (6%)
SA Community 45 (48%) 9 (5 – 27) 7 (6%) 95 (67 – 127) 11 (10%)
Residential 51 (47%) 9 (3 – 27) 65 (46%) 91 (50 – 119) 18 (13%)
TAS Community 24 (75%) 15 (2 – 25) 3 (9%) - 3 (9%)
Residential 54 (98%) 58 (35 – 84) 11 (19%) 86 (28 – 139) 3 (5%)
VIC Community 90 (54%) 14 (3 – 37) 14 (7%) 104 (67 – 114) 21 (10%)
Residential 152 (32%) 12 (5 – 33) 450 (70%) 125 (83 – 150) 155 (24%)
WA Community 16 (47%) 10 (1 – 21) 1 (3%) - 5 (14%)
Residential 33 (60%) 34 (13 – 64) 26 (46%) 90 (48 – 115) 9 (16%)
National Community 502 (51%) 13 (3 – 31) 87 (7%) 92 (55 – 120) 106 (9%)
Residential 340 (43%) 18 (6 – 49) 595 (58%) 116 (72 – 145) 209 (20%)
3.7. Residential aged care admissions A total of 22% of TC recipients were admitted to residential aged care in the three months post ACAT
approval (National Evaluation of the Transition Care Program 2008), and not unexpectedly this was 4%
among recipients of TC only in a community setting and 45% among the recipients of TC only in a residential
setting. This agrees very closely with the national discharge destination data from the Models of Transition
Care Report (National Evaluation of the Transition Care Program 2007a) which showed that overall 14.8% of
TC recipients were discharged to high level residential aged care, and 7.0% of TC recipients were
discharged to low-level residential aged care. There was a strong positive correlation observed between the
proportion of TC places that were allocated to residential-based TC and the rate of admissions to residential
aged care. The state with the largest residential-based TC component, Victoria, also had the highest rate of
discharge to residential aged care (49.4%), whereas Queensland had only 1.6% of TC recipients discharged
to residential aged care.

41
As shown in Table 3.6, at six months post ACAT approval, 28% of TC recipients had been admitted to
residential aged care, and this rate was much higher among those who received TC only in a residential
setting (58%) than those who received TC only in a community setting (7%).
3.8. Survival The Final Report of the Controlled Comparison Study and Costs and Effects Study (National Evaluation of
the Transition Care Program 2008) also demonstrated that 8% of TC recipients died within three months of
the ACAT approval for TC, and this was significantly higher among those who received TC only in a
residential setting (14%) versus those who received TC only in a community setting (5%) or a combination of
service types (4%). This death rate is markedly higher than the 2.2% of TC recipients who had a discharge
reason of ‘death’ reported in the Models of Transition Care Report (National Evaluation of the Transition
Care Program 2007a). It is possible that a sizeable proportion of TC recipients who were discharged from
TC to hospital died during the hospital readmission that directly followed their stay in TC.
By six months post ACAT approval, 14% of TC recipients had died, and this was greater among those who
received TC only in a residential setting (20%) than those who received TC only in a community setting (9%;
see Table 3.6). The proportion of deaths by six months post ACAT approval was greater among the
recipients aged 85 years or more (16%) than among the recipients aged less than 85 years (11%). When
further broken down by type of TC received, the difference between age group was more striking. Among
those who received TC only in a community setting, the proportion of recipients who had died was 8%
among the younger recipients and 10% among the older recipients. In contrast, among the recipients who
received TC only in a residential setting, 18% of those aged less than 85 years were dead at six months and
23% of those aged 85 years or more were dead at six months suggesting that for almost a quarter of those
moving to residential-based TC end of life management issues needed to be addressed.

42
4. How did variations between Transition Care services affect outcomes?
Key points:
• Recipients of TC only in a community setting had better physical functioning both at admission to
and discharge from TC, they were more likely than recipients of TC only in a residential setting or
combination TC recipients to have a hospital readmission, and less likely to have an admission to
residential aged care during the 3 and 6 months post ACAT approval.
• Length of stay in TC appeared to have only a weak relationship with changes in physical functioning
for all types of TC.
• Analyses that adjusted for the effects of jurisdictional, regional, service and individual level
characteristics demonstrated that greater nursing and allied health staffing provisions per person per
week reduced the risk of hospital readmissions and residential aged care admissions, respectively,
among TC recipients in the six months post ACAT approval.
4.1. What affects individual level outcomes? Service characteristics during the TC episode appeared to have an impact on the outcomes for TC
recipients. The setting of the TC place (community/residential or a combination of both) had a distinct impact
on function, as measured by the MBI. Those recipients who received TC only in a community setting
entered with an average MBI of 75.2 units (SD 18.0) and were discharged with an average MBI of 86.0 (SD
17.5). For those who received TC only in a residential setting, the mean MBI on admission to TC was 51.6
units (SD 25.1) and the mean MBI at discharge from TC was 62.3 (SD 27.7). Those who received a
combination of community-based and residential-based TC services were intermediate between these
average values. The mean MBI on admission for the combination group was 63.0 (SD 21.1) and on
discharge was 78.8 (SD 22.7). While there were some difficulties with the recording of discharge destination,
there was also a strong positive correlation between the proportion of TC places that were residential-based
TC and the rate of admissions to residential aged care. The percentage of hospital readmissions was also
influenced by the type of TC. Recipients of community-based places were more likely to have a hospital
readmission by three months (39% versus 35% for residential or combination places) and by six months
(51% versus 43% for residential places). Admissions to residential aged care were more likely for recipients
of residential-based TC places than community-based TC places at both three months (45% versus 4%) and
six months (58% versus 7%).
In order to examine the characteristics of each service and their effects on the outcomes for recipients,
services were grouped into three clusters based on 14 variables including regional, service, recipient, and
staffing characteristics (National Evaluation of the Transition Care Program 2007a). There appeared to be
no significant difference between the clusters for physical functioning, as measured by admission or
discharge MBI, the change in the MBI score or MBI efficiency. Differences were found for discharge
destination with the highest proportion of recipients discharged to the community from the predominantly
community cluster (P<0.001). Similarly, the proportion of recipients discharged to hospital was highest from
43
the predominantly community cluster while the proportion discharged to residential aged care was the lowest
from the same group.
There were significant yet weak relationships between length of TC stay and the change in physical
functioning (MBI) for the recipients of TC only in a community setting (r=0.186), recipients of TC only in a
residential setting (r=0.266), and the recipients of combination places (r=0.261).
Those recipients who received TC only in a community setting and were readmitted to hospital during the
three months post ACAT approval had a shorter length of stay in TC (45 versus 62 days), had a lower MBI
score at admission (72 versus 76 units), had lower MBI score at discharge (80 versus 87 units) and a smaller
improvement in their MBI score from admission to discharge (8 versus 11 units) in comparison to those with
no hospital readmission. In contrast, recipients of TC only in a residential setting who were admitted to
hospital during the three months post ACAT approval had higher MBI scores on admission (53 versus 49
units) and discharge (67 versus 61 units), with no differences in length of TC stay or the change in MBI from
admission to discharge. For recipients of combination TC places, those who had a hospital readmission
during the follow-up period had a shorter length of stay in TC than those who did not go to hospital (59
versus 70 days), but they were not different in terms of physical functioning.
Regardless of the setting of TC (community-based, residential-based or a combination), recipients who were
admitted to residential aged care by three and six months post ACAT approval had a significantly shorter
length of stay in TC, significantly lower physical functioning (MBI) at admission to and discharge from TC and
a significantly smaller increase in physical functioning at discharge from TC (all p <0.05). Recipients who
died had a shorter TC length of stay and lower MBI at admission to and discharge from TC.
The presence of a co-resident carer appeared to have no impact on admissions to residential aged care or
readmissions to hospital at either the three or six months post ACAT approval, regardless of the type of TC.
More recipients of TC only in a residential setting with a co-resident carer died in the six month post ACAT
approval period than their contemporaries without a carer (17% vs. 12%).
Multiple logistic regression models were fit to assess the effects of jurisdictional, regional, service and
individual level characteristics on the incidence of hospital readmissions and residential aged care
admissions in the six months post ACAT approval among the 2,443 TC recipients. The variables that were
considered as possible predictors of the two outcomes were drawn from the Regional Characterization,
Models of Transition Care, and Data Linkage Components reports from the evaluation (National Evaluation
of the Transition Care Program 2007a; National Evaluation of the Transition Care Program 2007c; National
Evaluation of the Transition Care Program 2008). The variables were:
Individual level
- Age at approval
- Gender
- MBI at admission

44
- Type of TC (community, residential or combination)
Service level
- Sub-contractor
- Location (major city vs. other)
- Service delivery (team vs. non-team)
- Service location (hospital vs. non-hospital)
- Model of TC (predominantly community, residential, mixed)
- Size of service (<40, >40)
- Allied health hours per place per week
- Nursing hours per place per week
Regional level
- Number of hospital beds per 1,000 older people
- Number of residential aged care places per 1,000 older people
Jurisdictional level
- State
The variables drawn from the Models of Transition Care deserve elaboration.
‘Sub-contractor’ refers to the sub-contracting arrangements that were reported by TC services in the Quality
Reports and/or supplied by the Department of Health and Ageing (National Evaluation of the Transition Care
Program 2007a). The location of each TC service was classified as major city, inner regional, outer regional,
remote, or very remote and collapsed to major city or other due to the smaller number of services located in
non-metropolitan regions. Team service delivery reflected employed staff making team decisions about the
care of each TC recipient or other. Non-team service delivery reflected TC services which purchased
nursing, allied health or personal care services as necessary without team-based decision making. Service
location was based on the physical location of the service and was classified as hospital-based or non-
hospital based. The model of TC was based on the cluster solution presented in the Models of Transition
Care Report, in which services clustered according to three main groups, namely predominantly community,
residential, and mixed. The size of the service related to the number of operational places, and this was
collapsed to two groups of <20 places and >20 places. Variables that represented the provision of total
allied health hours per operational place per week and total nursing hours per operational place per week, as
presented in the Quarterly Reports, were also included in the analyses (National Evaluation of the Transition
Care Program 2007a).
Because of notable differences in the residential aged care admissions between Victoria and the other
states, the Victorian residential aged care admissions were excluded from the model. Similarly, the pattern
of hospital readmissions appears to differ in Tasmania and elsewhere and therefore the effects of the
variables on hospital readmissions were examined without the Tasmanian hospital data.

45
In terms of hospital readmissions, males, services with subcontracting arrangements, and lower nursing
hours per place per week were associated with an increased risk of hospital readmission over the six months
post ACAT approval, as described in Table 4.1.
Table 4.1: Risk of hospital readmission in six months post ACAT approval
Variable OR 95%CI
Sex
Male (referent) 1.00
Female 0.71 0.57 – 0.89
Nursing hours per place per week 0.96 0.94 – 0.98
Subcontractor2
No (referent) 1.00
Yes 1.37 1.11 – 1.69 OR – Odds ratio
As summarized in Table 4.2, residential aged care admissions were affected by a number of different
variables. Increasing age, a lower MBI at admission to TC, and receiving TC only in a residential setting
increased the risk of a residential aged care admission. The TC services that offered residential-based or
both residential-based and community-based places were associated with an increased risk of residential
aged care admission. Another service characteristic that affected the risk of residential aged care admission
was the provision of allied health hours, such that risk of residential aged care admission decreased by 21%
for every additional hour of allied health services per place per week. The ACAT regions with a greater
number of hospital beds per 1,000 older people were associated with a reduced risk of residential aged care
admissions. The risk was also significantly lower in New South Wales and Queensland than in the other
jurisdictions, probably reflecting the large community components of the TC programs in these states.

46
Table 4.2: Risk of residential aged care admission in the six months post ACAT approval
Variable OR 95%CI
Age 1.05 1.02 – 1.07
MBI on admission2 0.99 0.98 – 0.99
Type of TC
Community (referent) 1.00
Residential 6.93 3.81 – 12.60
Combination 1.05 0.46 – 2.41
Model of TC
Predominantly community 1.00
Residential 5.58 2.11 – 14.75
Mixture 6.65 2.40 – 18.39
Total allied hours per place per week 0.79 0.67 – 0.94
Total hospital beds per 1,000 older people 0.99 0.98 – 1.00
State
ACT 1.00
NSW 0.15 0.04 – 0.54
QLD 0.12 0.03 – 0.52
SA 0.55 0.21 – 1.42
TAS 0.67 0.25 – 1.83
VIC -
WA 1.76 0.70 – 4.42
4.2. Jurisdictional variations in health and aged care service
provision At a jurisdictional level, estimates of the residential aged care provision ratio, acute beds and
rehabilitation/geriatric evaluation and management beds per 1,000 older people are presented in Table 4.3
for the 2005/06 period. This table highlights the differences between states and territories in terms of the
provision of acute and rehabilitation/Geriatric Evaluation and Management (GEM) beds in particular. The
more extensive services for older people in Victoria contrasts with Tasmania and Queensland where there
are fewer rehabilitation and GEM beds but more acute beds per 1,000 older people. It is important to bear in
mind that in Table 4.3, the older population in NT was estimated from a composite of the number of
Aboriginal or Torres Strait Islander Australians aged at least 50 years, and non-Aboriginal Australians aged
70 years or more. In other jurisdictions and for the national figure, 70 years was used as the lower limit for
older age.

47
Table 4.3: Distribution of population, aged care places, and hospital beds per 1,000 older people by state/territory for the 2005/06 period
State Total
population1
% Population
Older
Residential aged care provision
ratio
Acute beds / 1,000
older people
Rehabilitation + GEM beds /
1,000 older people2
Allocated Transition
Care places / 1,000 older
people
ACT 328,817 6.7 72.1 32.8 2.6 1.58
NSW 6,827,694 9.9 82.8 24.7 2.8 1.04
NT 206,688 7.8 27.0 41.2 0.9 0.99
QLD 4,053,444 8.5 84.6 26.8 2.2 1.02
SA 1,554,656 11.2 90.3 25.2 2.7 1.01
TAS 488,948 10.3 86.3 26.0 1.7 1.13
VIC 5,091,666 9.8 85.1 24.9 4.2 1.01
WA 2,050,884 8.3 80.9 26.0 2.4 0.94
Total 20,602,797 9.4 84.2 25.7 3.0 1.031: Includes estimated resident population in unknown area; NSW=1,170; NT=33,184; SA-4,881; VIC=466.
2: Includes rehabilitation and Geriatric Evaluation and Management beds
So as to aid in the identification of ACAT regions that were relatively well or poorly serviced in terms of aged
care places and hospital beds, Figure 4.1 displays a composite of the total number of mainstream and
flexible aged care places per 1,000 older people and the total number of hospital beds per 1,000 older
people for the 2005/06 period (National Evaluation of the Transition Care Program 2007c). To create this
figure, a score of 1 was assigned to the ACAT regions in the lowest quintile of aged care places per 1,000
older people, a score of 2 assigned to those in the second quintile, and so on through to a score of 5 for
those in the top quintile. A similar scoring regime was used for the number of hospital beds per 1,000 older
people. These two sets of scores were then summed to give a composite indicator of aged care places and
estimated hospital beds per 1,000 older people, which ranged between 2 and 10. Areas which were in the
lowest quintile for both aged care places and hospital beds per 1,000 older people scored 2 (represented as
green areas on the map) while areas that were in the highest quintile for both indicators scored 10, shown as
pink areas on the map in Figure 4.1.
It is important to note that the definition of a rehabilitation episode of care includes psychiatric rehabilitation
which appears to have led to some differences in reporting approaches from jurisdictions (Australian Institute
of Health and Welfare 2005).

48
Figure 4.1: Composite indicator of number of aged care places and number of hospital beds per 1,000 older people for 2005/06 period

49
5. Comparison of Transition Care recipients with other groups of frail older people
Key points
• Comparison of outcomes for those who received TC only in a residential setting with outcomes from
Victorian GEM units showed GEM units admitted more disabled people and achieved shifts in the
MBI more rapidly than residential-based TC.
• Older people in both control groups had a higher risk of hospital readmission in the six months post
ACAT approval than the TC recipients.
• Older people in both control groups had a greater hazard (risk) of a residential aged care admission
in the six months post ACAT approval than those who received TC only in a community setting.
• Older people who received TC only in a residential setting had a seven fold increase in hazard of
residential aged care admission compared with those who received TC only in a community setting.
TC in a residential-based setting alone did not prevent an aged care admission.
5.1. External comparison of Transition Care recipients to
Australasian Rehabilitation Outcomes Centre and Geriatric
Evaluation and Management units Evidence was drawn from several sources to ascertain how the outcomes for recipients of TC compared to
the outcomes for other older people who were approved for other post acute care and aged care programs.
The first external comparison was made with data concerning rehabilitation units, extracted by the Australian
Rehabilitation Outcomes Centre (AROC). Data for persons aged 65 years or more who were admitted for a
reason of Debility in the 2006/07 year were analysed. This admission condition represents older people who
were selected to enter rehabilitation units on the basis of their functional ability and their anticipated capacity
to make functional gains. It is reasonable to assume that this group is fitter than those ACAT assessed and
approved for TC.
Two points must be borne in mind in interpreting Table 5.1. Rehabilitation units have higher staffing to
patient ratios than TC units and this contributes to the apparently better MBI efficiency. A second point that
must be considered is that the Functional Independence Measure (FIM) and not MBI is reported to the
AROC by contributing rehabilitation units. The FIM averages were converted to MBI by use of the formula:
Estimated MBI = (FIM – 18)/0.67 (Eagar, Gordon et al. 2001).
It is important to note that this conversion is based on a regression equation and the random error
associated with the conversion is not taken into account.

50
The TC Program data were drawn from the Australian Government Department of Health and Ageing
COGNOS database for the 2006/07 financial year, to cover the same period as the AROC data. As Table
5.1 demonstrates, those in rehabilitation units make larger gains more quickly than those in TC. It confirms
that in general the TC group were different to the rehabilitation group, as indeed is appropriate given the
selection criteria for TC.
Table 5.1: Estimated Modified Barthel Index efficiencies from the Australasian Rehabilitation Outcomes Centre 2006/07
Age group
Admission MBI
Discharge MBI
Change in MBI
LOS
MBI efficiency
65-69 52.2 71.2 19.0 23.3 0.82
70-74 53.7 76.0 22.3 21.2 1.05
75-79 53.7 76.0 22.3 21.0 1.06
80-84 51.6 70.6 19.0 21.4 0.89
85-89 52.7 71.8 19.1 19.8 0.97
90-94 48.4 68.8 20.4 20.3 1.01
95+ 48.4 60.1 11.7 20.9 0.56
Overall 52.1 72.1 20.0 20.9 0.96
TC1 66.8 76.9 10.1 54.7 0.18 1 Cumulative data from COGNOS 2006/07 year
A second external comparison was between the MBI efficiencies of the Victorian GEM units and TC
delivered only in a residential setting, to examine the efficiency of the TC model relative to the GEM units.
Data were drawn from the TC Program Management Data Set managed by the Australian Government
Department of Health and Ageing (the COGNOS database) for the 2006/07 financial year, to cover the same
period as the GEM efficiency data (pers comm. N Doran 2008).
As Table 5.2 demonstrates, the GEM units have greater efficiency in terms of functional gain per day. It also
suggests that the Victorian GEM units are taking more disabled older people than the TC in residential-based
programs in some states. This does raise the possibility that TC delivered in a residential-based setting is
being used as a substitute for GEM programs. The lower efficiencies seen in most TC programs which are
likely to be associated with poorer flows through hospitals also raise questions about whether this approach
is cost effective. It is possible that increases in staffing numbers at these sites would increase the
efficiencies by reducing the time taken to achieve functional gains.
The efficiencies for the Tasmanian and NSW recipients of TC only in a residential setting appeared closest in
efficiency to the Victorian GEM units, while the WA residential model and NT residential model appeared
least efficient. However, the length of time of operation of the TCP in each jurisdiction is not taken into
account in this finding, and this may explain the lower efficiencies among jurisdictions with newer services.
The Victorian TC services accepted more disabled older people than other jurisdictions and appear to have
focused on avoiding functional decline and optimizing discharge outcomes rather than on returning home.

51
There are limitations in making these comparisons using administrative data and then drawing conclusions
about the quality of services. It is unclear at what point on the trajectory of recovery the individuals in each
group have reached when the comparisons are drawn and they may be at different points. The time post
event is thought to be an important predictor of outcome. Timing of measurement may be more important
than site of care in explaining differences in outcomes. As we do not have the timing since first presentation
we may be measuring outcomes at different times at each site of care. Nevertheless this is the only
evidence currently available.
Table 5.2: Modified Barthel Index efficiency at jurisdictional level for Victorian Geriatric Evaluation and Management units vs. Transition Care delivered only in a residential setting for 2006/07 period
MBI admission MBI discharge MBI change LOS Efficiency
VIC GEM 47.3 59.3 12.0 26.7 0.45
ACT residential 71.3 84.5 13.2 36.0 0.37
NSW residential 64.5 80.2 15.7 38.9 0.40
NT residential 48.4 59.9 11.5 34.9 0.33
SA residential 55.0 73.9 18.9 55.2 0.34
TAS residential 66.8 88.9 22.1 51.5 0.43
VIC residential 50.3 54.7 4.4 36.2 0.12
WA residential 54.7 65.7 11.0 54.5 0.20
5.2. Comparisons based on data linkage The Controlled Comparison and Costs and Effects Study (National Evaluation of the Transition Care
Program 2008) used two other groups of frail older people recently discharged from hospital to assess the
impact of the program. These comparisons suggested that the TCP offered some prevention of readmission
and movement into residential aged care.
The two groups that were compared to the TC recipients in the data linkage study (National Evaluation of the
Transition Care Program 2008) were drawn from the ACAT assessments of people between 1 October 2006
and 31 March 2007 that took place in the hospital setting (acute care or other inpatient care). The two
groups were:
• Control 1: People who were approved for a TC place with their ACAT assessment taking place in
hospital but had not been discharged from TC by 30 September 2007 and
• Control 2: People who were approved for a CACP only. Note that this does not distinguish between
those who actually received a CACP and those who were approved but did not receive a CACP.
Tables 5.3 and 5.4 summarise hospital readmissions and residential aged care admissions at three and six
months post ACAT approval at a jurisdictional and national level for TC recipients versus Control 1 and
Control 2. The results from this table are discussed below.

52
Table 5.3: Hospital readmissions, residential aged care admissions, and deaths for Transition Care recipients, Control 1 and Control 2 at three months post ACAT approval
Hospital readmissions Residential aged care Dead at three months
n (%) LOS (IQR) n (%) LOS (IQR) n (%)
ACT TC 28 (48%) 15 (4 – 37) 5 (7%) 15 (3 – 28) 4 (6%)
Control 1 24 (64%) 11 (5 – 24) 3 (7%) 42 (23 – 63) 3 (7%)
Control 2 15 (52%) 12 (7 – 23) 5 (13%) 36 (31 – 40) 5 (13%)
NSW TC 198 (38%) 12 (4 - 26) 48 (8%) 29 (15 – 47) 35 (6%)
Control 1 41 (40%) 14 (3 -30) 14 (11%) 48 (29 – 77) 12 (9%)
Control 2 306 (42%) 11 (5 – 23) 166 (16%) 41 (25 – 64) 115 (11%)
NT TC * * * * *
Control 1 * * * * *
Control 2 * * * * *
QLD TC 80 (36%) 7 (1 – 20) 5 (2%) 37 (11 – 41) 9 (3%)
Control 1 7 (35%) 25 (10 – 31) 4 (14%) 71 (53 – 87) 1 (3%)
Control 2 74 (42%) 14 (3 – 28) 0 (0%) - 26 (9%)
SA TC 89 (38%) 7 (1 – 23) 44 (15%) 28 (12 – 35) 15 (5%)
Control 1 44 (54%) 12 (4 – 25) 26 (25%) 36 (21 – 53) 16 (16%)
Control 2 95 (47%) 10 (5 – 17) 42 (17%) 41 (25 – 61) 25 (10%)
TAS TC 81 (83%) 39 (14 – 65) 8 (8%) 51 (39 – 61) 4 (4%)
Control 1 6 (55%) 4 (2 – 5) 1 (9%) 89 0 (0%)
Control 2 15 (60%) 14 (10 – 52) 4 (16%) 59 (37 – 77) 2 (8%)
VIC TC 210 (30%) 10 (3 – 21) 107 (44%) 48 (27 – 66) 129 (14%)
Control 1 113 (36%) 11 (4 – 27) 261 (60%) 77 (56 – 85) 75 (17%)
Control 2 107 (47%) 18 (8 – 29) 93 (30%) 63 (37 – 77) 27 (9%)
WA TC 43 (31%) 14 (2 – 38) 16 (12%) 32 (12 – 44) 7 (5%)
Control 1 55 (44%) 8 (4 – 33) 29 (23%) 46 (24 – 75) 3 (2%)
Control 2 113 (51%) 22 (8 – 39) 45 (20%) 51 (20 – 69) 14 (6%)
National TC 731 (37%) 13 (4 – 31) 534 (22%) 43 (23 – 63) 203 (8%)
Control 1 287 (42%) 11 (4 – 28) 339 (39%) 71 (46 – 84) 111 (13%)
Control 2 1,744 (45%) 14 (6 – 28) 356 (16%) 45 (26 -69) 215 (10%) * Too few individuals to present results without compromising identifiability

53
Table 5.4: Hospital readmissions, residential aged care admissions, and deaths for Transition Care recipients, Control 1 and Control 2 at six months post ACAT approval
Hospital readmissions Residential aged care Dead at six months
n (%) LOS (IQR) n (%) LOS (IQR) n (%)
ACT TC 34 (59%) 18 (4 – 49) 9 (13%) 70 (31 – 105) 8 (12%)
Control 1 24 (73%) 20 (8 – 32) 3 (7%) - 3 (7%)
Control 2 21 (72%) 12 (6 – 42) 8 (21%) 121 (30 – 130) 7 (18%)
NSW TC 257 (50%) 17 (6 – 35) 85 (14%) 92 (42 – 122) 66 (11%)
Control 1 56 (54%) 22 (7 – 35) 20 (16%) 120 (58 – 151) 16 (13%)
Control 2 391 (54%) 16 (6 – 31) 242 (23%) 103 (54 – 137) 184 (18%)
NT TC * * * * 1 (8%)
Control 1 * * * * 1 (11%)
Control 2 * * * * 1 (6%)
QLD TC 105 (48%) 6 (2 – 23) 13 (5%) 77 (43 – 97) 17 (6%)
Control 1 11 (55%) 12 (3 – 26) 6 (21%) 145 (60 – 178) 3 (10%)
Control 2 99 (56%) 15 (8 – 42) 0 (0%) - 41 (15%)
SA TC 111 (47%) 9 (4 – 27) 76 (26%) 92 (56 – 120) 32 (11%)
Control 1 46 (56%) 17 (8 – 31) 33 (32%) 117 (64 – 139) 24 (23%)
Control 2 122 (60%) 13 (5 – 24) 58 (24%) 113 (62 – 137) 35 (14%)
TAS TC 84 (90%) 41 (17 – 75) 15 (15%) 110 (51 – 148) 6 (6%)
Control 1 7 (70%) 4 (1 – 5) 1 (9%) - 0 (0%)
Control 2 20 (83%) 21 (2 – 52) 7 (28%) 109 (53 – 163) 4 (16%)
VIC TC 268 (38%) 13 (4 – 37) 494 (53%) 122 (81 – 148) 184 (20%)
Control 1 126 (40%) 14 (6 – 37) 272 (63%) 162 (118 – 176) 106 (25%)
Control 2 132 (58%) 22 (9 – 43) 114 (36%) 133 (77 – 167) 50 (16%)
WA TC 68 (50%) 15 (2 – 35) 31 (23%) 93 (55 – 117) 16 (12%)
Control 1 68 (54%) 9 (3 – 36) 45 (36%) 99 (58 – 155) 12 (10%)
Control 2 139 (65%) 30 (9 – 49) 56 (25%) 107 (64 – 154) 35 (16%)
National TC 929 (47%) 14 (4 – 37) 723 (30%) 112 (71 – 142) 330 (14%)
Control 1 338 (49%) 15 (5 – 34) 381 (43%) 149 (88 – 173) 165 (19%)
Control 2 925 (58%) 17 (7 – 37) 486 (22%) 110 (60 – 151) 357 (16%) * Too few individuals to present results without compromising identifiability

54
5.3. Impact on the hospital system Nationally the risk of hospital readmission during the three months post ACAT approval was between one
third and one half greater for the two control groups compared with the TC recipients (Control 1 IRR 1.3;
95%CI 1.1 – 1.6; Control 2 IRR 1.5; 95%CI 1.3 – 1.8). There was no difference in the incidence of any
hospital readmissions between those who received TC only in a community setting and those who received
TC only in a residential setting. When the hospital readmissions during the six months post ACAT approval
were considered, the analyses showed a significant effect of group on hospital readmissions over the six
months post ACAT approval, such that there was an increased risk of readmission among the Control 2
group (IRR 1.17; 95%CI 1.11 – 1.24) in comparison to the TC recipients.
A Cox proportional hazards model was fit to examine the hazard of a hospital readmission over the six
months post ACAT approval. The response variable was time to first hospital readmission. Age, availability
of aged care places and total hospital beds per 1,000 older people, jurisdiction, and type of TC or group (TC
community, TC residential, TC combination, Control 1, Control 2) were included in the analysis. The results
showed that there were significant effects of all of these variables, as shown in Table 5.5. Control 1 group
had a 17% increased risk of hospital readmission and Control 2 group had a 35% increased risk of hospital
readmission relative to those who received TC only in a community setting.
Table 5.5: Summary of hazard of hospital admission in the six months post ACAT approval
Variable HR 95%CI
Age 0.99 0.98 – 1.00
Type of TC/Group
Community (referent) 1.00
Residential 0.98 0.84 – 1.14
Combination 0.95 0.75 – 1.21
Control 1 1.17 1.01 – 1.36
Control 2 1.35 1.21 – 1.51
Aged care places per 1,000 older people 1.00 0.99 – 1.00
Total hospital beds per 1,000 older people 1.00 1.00 – 1.01
State
ACT (referent) 1.00
NSW 0.67 0.53 – 0.86
NT 0.37 0.12 – 1.19
QLD 0.67 0.51 – 0.87
SA 0.78 0.60 – 1.01
TAS 2.49 1.85 – 3.36
VIC 0.61 0.48 – 0.78
WA 0.77 0.60 – 1.00 HR: Hazard ratio

55
The median time to hospital readmission among those who were readmitted was 42 days (IQR 15-88)
among the recipients of TC only in a community, 23 days (IQR 3-61) among the recipients of TC only in a
residential setting, 27 days (IQR 3-76) among the recipients of combination TC, 20 days (IQR 5 – 56) among
the Control 1 group and 28 days (8 – 76) among the Control 2 group. Figure 5.1 presents the cumulative
hazard function for the TC recipients and control groups adjusted for the other variables included in the Cox
proportional hazards model.
Figure 5.1: Hazard of hospital readmission in six months post ACAT approval
Figure 5.2 presents the proportion of readmissions in each state by type of TC.

56
Figure 5.2: Proportion of people with one or more hospital readmissions by jurisdiction in the six months post ACAT approval
* No community places in NT; residential data not presented for Queensland as too few cases
The data linkage component of the National Evaluation showed that 23% of the TC recipients elected to be
treated as private patients during their index hospitalization. However, it must be noted that election status
for TC recipients in Northern Territory, Tasmania, and Victoria was not available in the evaluation. For the
other jurisdictions, the proportion of TC recipients who elected to be treated as private patients differed
slightly according to the type of TC received, with 24% of recipients of TC only in a community setting, 19%
of recipients of TC only in a residential setting and 24% of those who received a combination of community-
based and residential-based TC services having an election status of private for their index hospitalization.
The median length of stay for the index hospitalization varied considerably between jurisdictions (see Table
5.6). Nationally, the length of stay of the index hospitalization was shorter in the Control 2 group than the
other groups, and the length of stay was also longer in the Control 1 group (28 days) than in the other
groups. At a jurisdictional level the variations in length of stay between groups were less clear. For
example, in ACT the median length of stay was similar for the TC recipients and control groups, whereas in
SA the Control 2 group had a clearly shorter median length of stay than the TC recipients or the Control 1
group. The opposite held in Tasmania, although the numbers were small in each group for this state.
0
20
40
60
80
100
120
ACT NSW NT* QLD* SA TAS VIC WA Overall State
% re
adm
itted
CommunityResidential Total

57
Table 5.6: Median length of stay of index hospitalization by group
Jurisdiction Group n
LOS median (IQR)
ACT TC - Community 20 14 (7 – 40)
TC - Residential 14 13 (9 – 20)
TC - Combination 24 16 (9 – 24)
Control 1 33 16 (11 – 28)
Control 2 29 15 (9 – 34)
NSW TC - Community 435 20 (13 – 34)
TC - Residential 77 19 (13 – 31)
TC - Combination 4 19 (11 – 58)
Control 1 103 25 (14 – 40)
Control 2 727 18 (9 – 32)
NT TC - Residential 8 17 (10 – 20)
Control 2 1 *
QLD TC - Community 213 26 (15 – 43)
TC - Residential 3 *
TC - Combination 5 21 (19 – 77)
Control 1 20 40 (27 – 76)
Control 2 176 22 (13 – 45)
SA TC - Community 93 21 (15 – 35)
TC - Residential 109 21 (16 – 31)
TC - Combination 33 25 (17 – 35)
Control 1 82 25 (17 – 34)
Control 2 202 16 (9 – 24)
TAS TC - Community 32 25 (15 – 36)
TC - Residential 55 11 (6 – 19)
TC - Combination 6 26 (10 – 37)
Control 1 10 14 (9 – 20)
Control 2 24 33 (16 – 47)
VIC TC - Community 166 27 (17 – 42)
TC - Residential 478 27 (17 – 38)
TC - Combination 61 26 (17 – 40)
Control 1 312 30 (20 – 43)
Control 2 226 20 (12 – 29)
WA TC - Community 34 31 (21 – 48)
TC - Residential 55 26 (16 – 52)
TC - Combination 46 17 (10 – 24)
Control 1 126 28 (16 – 41)
Control 2 215 21 (13 - -33)
National TC - Community 993 23 (14 – 38)
TC - Residential 799 23 (15 – 36)
TC - Combination 179 21 (14 – 35)
Control 1 686 28 (17 – 41)
Control 2 1,600 19 (10 – 32) * data not shown as too few cases

58
In terms of total length of hospital stay during the six months post ACAT approval, there was no difference
between the former public versus former private patients, with an average length of stay of 25.6 (SD 43.5)
among the public patients and 27.2 (SD 32.5) among those who elected to be treated as private patients at
their index hospitalization.
5.4. Impact on the aged care system The risk of using residential aged care during the three months post ACAT approval was shown in the Final
Report of the Controlled Comparison and Costs and Costs and Effects Study (National Evaluation of the
Transition Care Program 2008) to be greater among the two control groups than among the TC recipients
(Control 1 OR 1.9; 95%CI 1.5 - 2.3; Control 2 OR 1.2; 95%CI 1.0 – 1.4).
A separate Cox proportional hazards model was fit for the hazard of a residential aged care admission over
the six months post ACAT approval. Age, availability of aged care places and total hospital beds per 1,000
older people, jurisdiction, and type of TC or group (TC community, TC residential, TC combination, Control 1,
Control 2) were included in the initial model. The results showed there were no effects of the availability of
aged care places or hospital beds, but significant effects of increasing age, type of TC or Group, and
jurisdiction. The hazard of a residential aged care admission was greatest among those who received TC
only in a residential setting or Control 1 (a seven fold increase in risk) when compared with the recipients of
TC only in a community setting. The hazard ratios from the final model are shown in Table 5.7. It must be
borne in mind that the reference group used is those who received TC only in a community setting but this
does not affect the size of the differences. If Control 1 were used as the reference group instead Figure 5.3
would appear identical to that shown.
Table 5.7: Summary of hazard of residential aged care admission in six months post ACAT approval
Variable HR 95%CI
Age 1.02 1.01 – 1.03
Type of TC/Group
Community (referent) 1.00
Residential 7.36 5.84 – 9.28
Combination 1.99 1.37 – 2.91
Control 1 6.99 5.52 – 8.86
Control 2 3.48 2.77 – 4.38
State
ACT (referent) 1.00
NSW 1.89 1.20 – 2.98
NT 0.33 0.08 – 1.42
QLD 0.38 0.20 – 0.71
SA 1.95 1.22 – 3.11
TAS 1.09 0.60 – 2.00
VIC 5.03 3.22 – 7.85

59
WA 1.93 1.20 – 3.09
The median time to first admission to residential aged care among those who were admitted was 83 days
(IQR 57-119) among those who received TC only in a community setting, 55 days (IQR 31 – 89) among
those who received TC only in a residential setting, 69 days (IQR 45-96 days) among those who received a
combination of TC services, 17 days (IQR 7-51) among the Control 1 and 59 days (IQR 28-95) among the
Control 2 group. The cumulative hazard function is illustrated in Figure 5.3.
Figure 5.3: Hazard of residential aged care admission in six months post ACAT approval
The level at which TC recipients go on to enter residential aged care in the six months post ACAT approval is
summarized in Table 5.8. As this table shows, those who received TC only in a community setting were
more likely to enter TC at low-level care according to the Residential Classification Scale (i.e. S5, S6 or S7),
although this did not hold in Victoria or New South Wales. In contrast, those who received TC only in a
residential setting generally entered residential aged care at a higher level (i.e. S1, S2, S3, or S4), although
New South Wales was an exception to this.

60
Table 5.8: Summary of admission level for Transition Care recipients who were admitted to residential aged care in the six months post ACAT approval
Number Percent S1 S2 S3 S4 S5 S6 S7 Total S1 S2 S3 S4 HLC1 S5 S6 S7 LLC2
ACT Community 0 0 1 0 1 0.0 0.0 0.0 0.0 0.0 100.0 0.0 0.0 100.0
Residential 2 4 0 1 7 28.6 57.1 0.0 0.0 85.7 0.0 0.0 14.3 14.3
Combination 0 0 1 0 1 0.0 0.0 0.0 0.0 0.0 100.0 0.0 0.0 100.0
Total 2 4 2 1 9 22.2 44.4 0.0 0.0 66.7 22.2 0.0 11.1 33.3
NSW Community 9 18 9 2 5 4 1 48 18.8 37.5 18.8 4.2 79.2 10.4 8.3 2.1 20.8
Residential 0 10 2 2 13 7 2 36 0.0 27.8 5.6 5.6 38.9 36.1 19.4 5.6 61.1
Combination 1 0 0 0 0 0 0 1 100.0 0.0 0.0 0.0 100.0 0.0 0.0 0.0 0.0
Total 10 28 11 4 18 11 3 85 11.8 32.9 12.9 4.7 62.4 21.2 12.9 3.5 37.6
QLD Community 2 3 3 1 4 13 15.4 23.1 23.1 0.0 61.5 7.7 30.8 0.0 38.5
Total 2 3 3 1 4 13 15.4 23.1 23.1 0.0 61.5 7.7 30.8 0.0 38.5
SA Community 1 2 1 0 2 1 0 7 14.3 28.6 14.3 0.0 57.1 28.6 14.3 0.0 42.9
Residential 19 16 9 6 12 2 1 65 29.2 24.6 13.8 9.2 76.9 18.5 3.1 1.5 23.1
Combination 1 1 0 0 1 0 1 4 25.0 25.0 0.0 0.0 50.0 25.0 0.0 25.0 50.0
Total 21 19 10 6 15 3 2 76 27.6 25.0 13.2 7.9 73.7 19.7 3.9 2.6 26.3
TAS Community 1 0 0 2 0 3 33.3 0.0 0.0 0.0 33.3 0.0 66.7 0.0 66.7
Residential 1 7 2 0 1 11 9.1 63.6 18.2 0.0 90.9 0.0 0.0 9.1 9.1
Combination 0 1 0 0 0 1 0.0 100.0 0.0 0.0 100.0 0.0 0.0 0.0 0.0
Total 2 8 2 2 1 15 13.3 53.3 13.3 0.0 80.0 0.0 13.3 6.7 20.0
(continued)

61
Table 5.8 (continued): Summary of admission level for Transition Care recipients who were admitted to residential aged care in the six months post ACAT approval Number Percent S1 S2 S3 S4 S5 S6 S7 Total S1 S2 S3 S4 HLC1 S5 S6 S7 LLC2
VIC Community 4 4 2 0 4 0 0 14 28.6 28.6 14.3 0.0 71.4 28.6 0.0 0.0 28.6
Residential 164 139 54 10 45 21 17 450 36.4 30.9 12.0 2.2 81.6 10.0 4.7 3.8 18.4
Combination 10 11 1 1 4 2 1 30 33.3 36.7 3.3 3.3 76.7 13.3 6.7 3.3 23.3
Total 178 154 57 11 53 23 18 494 36.0 31.2 11.5 2.2 81.0 10.7 4.7 3.6 19.0
WA Community 0 0 0 1 0 0 1 0.0 0.0 0.0 0.0 0.0 100.0 0.0 0.0 100.0
Residential 10 5 5 3 3 0 26 38.5 19.2 19.2 0.0 76.9 11.5 11.5 0.0 23.1
Combination 0 0 0 1 2 1 4 0.0 0.0 0.0 0.0 0.0 25.0 50.0 25.0 100.0
Total 10 5 5 5 5 1 31 32.3 16.1 16.1 0.0 64.5 16.1 16.1 3.2 35.5
Overall Community 17 27 15 2 14 11 1 87 19.5 31.0 17.2 2.3 70.1 16.1 12.6 1.1 29.9
Residential 196 181 72 18 73 33 22 595 32.9 30.4 12.1 3.0 78.5 12.3 5.5 3.7 21.5
Combination 12 13 1 1 7 4 3 41 29.3 31.7 2.4 2.4 65.9 17.1 9.8 7.3 34.1
Total 225 221 88 21 94 48 26 723 31.1 30.6 12.2 2.9 76.8 13.0 6.6 3.6 23.2 1: Entered High Level Care; 2: Entered Low Level Care

62
As demonstrated in the Models of Transition Care Report (National Evaluation of the Transition Care
Program 2007a), 22% of the TC recipients overall were discharged to low level or high level care. The
discharge to residential aged care was highest in Victoria (49%), with South Australia (22%) and Western
Australia (27%) also having relatively high discharge to residential aged care, in keeping with the proportion
of places that operated only in a residential setting in these states. The TCP administrative data also
demonstrated that overall 16% of the TC recipients were discharged to the community with no support, while
19% were discharged with HACC services, 9% with CACP services, and 1% with an Extended Aged Care at
Home (EACH) package.
The telephone interview component of the National Evaluation (National Evaluation of the Transition Care
Program 2007b) showed that 47% of the interviewed sample accessed community services prior to receiving
TC. Of those who were living in the community at the time of the follow-up interview, 55% were accessing
community services at follow-up. Assistance with meals and personal care were the most commonly
accessed community services. Recipients also had great difficulty in distinguishing the source of the
services they received, and mixtures of providers such as local councils, HACC services, and services
accessed through Department of Veteran’s Affairs were all reported.
5.5. Impact on Aged Care Assessment Processes As noted in the Models of Transition Care Report (National Evaluation of the Transition Care Program
2007a), there were 6,716 persons admitted to TC in the 2006/07 year. The location of the ACAT
assessment was classified as ‘Acute care setting’ in 63% of assessments, ‘Other hospital inpatient setting’
for 30% of assessments, ‘Residential aged care service’ for 0.7% of assessments, ‘Other location’ for 6% of
assessments or ‘Unknown’ for 0.7% of assessments. Thus while the TCP guidelines stipulate that people
assessed for TC must have the assessment in a hospital or other acute care setting, assessments are
occurring outside of this environment.
Based on the data linkage component of the evaluation, the median length of time to enter TC following
ACAT approval was 4 days (IQR 1-8 days), as shown in Table 5.9. NSW and the ACT appeared to have the
fastest entry to TC, while recipients of TC in SA and WA faced the longest wait from approval to entry to TC.
This may be partly explained by the occupancy rates at a jurisdictional level. As shown in Figure 5.4, the
occupancy over the 2006/07 year varied considerably between jurisdictions, and ranged from minima of 46%
in Queensland and 51% in Tasmania to a high of 84% in South Australia. However, the ACT and New South
Wales had fairly high occupancy rates, at 75% and 71% respectively. Thus the length of time to enter TC
following ACAT approval was affected by other factors aside from occupancy rates in TC services.

63
Table 5.9: Days from Aged Care Assessment Team approval to hospital separation and Transition Care admission
Days from ACAT Approval to
Hospital Separation Transition Care
Admission median IQR median IQR
ACT Community 1.0 (0 – 6.0) 3.5 (2.0 – 9.0)
Residential 1.0 (0 – 5.0) 2.0 (1.0 – 5.0)
Combination 3.0 (1.0 – 8.0) 3.5 (2.0 – 9.5)
NSW Community 2.5 (1.0 – 5.0) 3.0 (1.0 – 7.0)
Residential 1.0 (0 – 2.0) 1.0 (0 – 3.0)
Combination 0.5 (0 – 3.5) 2.0 (1.0 – 4.0)
NT Residential 2.0 (1.5 – 3.5) - -
QLD Community 3.5 (1.5 – 6.0) 4.5 (2.0 – 7.0)
SA Community 7.0 (5.0 – 10.0) 7.0 (5.0 – 12.0)
Residential 7.0 (3.0 – 11.0) 7.0 (4.0 – 12.0)
Combination 5.0 (2.0 – 8.0) 5.0 (2.0 – 9.0)
TAS Community 5.0 (3.0 – 6.0) 6.0 (4.0 – 8.0)
Residential 1.0 (0.5 – 3.0) 1.0 (1.0 – 3.0)
Combination 2.0 (1.0 – 3.0) 1.5 (0 – 2.0)
VIC Community 4.0 (1.0 – 7.0) 4.0 (1.0 – 10.0)
Residential 4.0 (1.0 – 8.0) 4.0 (1.0 – 8.0)
Combination 3.0 (1.0 – 7.0) 4.0 (1.0 – 9.0)
WA Community 6.0 (4.0 – 13.0) 6.0 (3.5 – 12.5)
Residential 6.0 (2.5 – 14.5) 7.0 (3.0 – 19.0)
Combination 2.0 (1.0 – 5.0) 3.0 (1.0 – 5.0)
National Community 4.0 (1.0 – 6.0) 4.0 (2.0 – 8.0)
Residential 3.0 (1.0 – 7.0) 4.0 (1.0 – 8.0)
Combination 3.0 (1.0 – 6.0) 4.0 (1.0 – 7.0)
Overall 3.0 (1.0 – 7.0) 4.0 (1.0 – 8.0)

64
Figure 5.4: Occupancy by jurisdiction, 2006/07
0%
10%
20%
30%
40%
50%
60%
70%
80%
90%
ACT NSW NT QLD SA TAS VIC WA Total

65
6. What are the estimated costs of achieving the outcomes?
Key points
• At six month post ACAT approval, a recipient of TC only in a community setting had survived an
additional 28.9 days without being admitted into hospital or residential aged care when compared
with those in the Control 2 group and the additional cost to achieve this for an individual TC recipient
had reduced to $344 per day.
• For every day a recipient of TC survives without institutional care i.e. without hospital or residential
aged care over a six month period it costs $344 per day.
Several of the reports in the evaluation of the TCP have considered different aspects of the costs of the
program, including costs from an individual perspective (Recipient Snapshot Study (National Evaluation of
the Transition Care Program 2007b)), jurisdictional perspective (Models of Transition Care Report (National
Evaluation of the Transition Care Program 2007a)) and the Cost and Effects Study (National Evaluation of
the Transition Care Program 2008). Further evidence concerning costs and effects of the TCP relative to
Control 2 are also presented in this section.
Information concerning the costs incurred by recipients of TC was collected in the telephone interviews with
recipients (National Evaluation of the Transition Care Program 2007b). Recipients were asked about the
daily charge for receiving TC that was levied by the TC service and any out of pocket costs they had incurred
in relation to equipment or home modifications as a result of receiving TC. Of the interviewed recipients who
received TC only in a community setting, 39% reported that their co-payment fees were waived. Among
those who made a co-payment, the weekly average was $35.36 (SD $11.48), less than the capped amount
of $45.95 that prevailed at the time of the interviews. A total of 32% of the recipients of TC only in a
residential setting reported their co-payment fees were waived, and the reported average weekly fee was
$178.97 (SD 91.51) among those who made a co-payment, again less than the capped fee of $223.17.
Close to one half of respondents reported additional costs were incurred as a direct result of receiving TC,
and the median expenditure was $200. The reported costs were predominantly for equipment and home
modifications.
Economic modelling in health technology assessment considers costs relative to effects of alternative
strategies in a defined population. From a government perspective, costs need to encompass program
delivery, hospital costs, and residential aged care costs. Analyses at three months post ACAT approval
have been reported previously and are summarized here. Additional analyses that examine the cost
effectiveness of TC at six months post ACAT approval are also reported here.
A national analysis that concentrated on the cost effectiveness of TC for recipients of TC only in a community
setting compared to Control 2 was undertaken at three months post ACAT approval as part of the Costs and
Effects Study (National Evaluation of the Transition Care Program 2008). This analysis demonstrated that
recipients of TC only in a community setting had an average of 11.8 days more of survival without
institutional care (SWIC) – that is, residential or hospital care – in comparison to the Control 2 group. Total

66
costs for the TC recipients over the three months post ACAT approval were estimated to be $10,461 greater
than those for the Control 2 group. Thus the incremental cost per day of SWIC for the TC recipients was
estimated $10,461/11.8 = $888 per day, with an estimated 95% CI of $737 - $1,135. This is illustrated in
Figure 6.1.
Figure 6.1: Joint distribution of incremental cost and effects for recipients of Transition Care only in a community setting vs. Control 2 at three months post ACAT approval
0
2000
4000
6000
8000
10000
12000
14000
-1 1 3 5 7 9 11 13 15
Incremental days of survival without institutional care (SWIC)
Incr
emen
tal c
ost
joint distribution point estimate, R=$888/day SWICupper 95% CI, R=$1135/ day SWIC lower CI, R=$737/day SWIC
It is important to note that the incremental costs varied considerably between jurisdictions, and ranged from
$557 per day in Victoria to $1,140 per day in New South Wales (National Evaluation of the Transition Care
Program 2008). This suggests that the different ways of implementing TC have very different costs.
At six months from the time of ACAT approval, the cost effectiveness of TC delivered only in a community
setting versus Control 2 was analysed. This showed that recipients of TC only in a community setting were
estimated to have an additional 28.9 days of SWIC in comparison with Control 2 (156.4 vs. 127.4 days).
The average costs for the recipients of TC only in a community setting were estimated to be $9,942 greater
per recipient than those for people in the Control 2 group over the six months post ACAT approval. This was
attributable to $12,094 greater direct payments ($12,949 vs. $855), less $1,226 for reduced hospitalization
($6,523 vs. $7,749) and $926 for reduced residential aged care use ($511 vs. $1,437). Table 6.1
summarises these results.

67
Table 6.1: Summary of national incremental costs and effects at six months post ACAT approval in recipients of Transition Care only in a community setting vs. Control 2
Item Community TC Control 2 Difference
Direct costs $12,949 $855 $12,094
Hospital costs $6,523 $7,749 -$1,226
Residential aged care costs $511 $1,437 -$926
Total costs $19,983 $10,041 $9,942
Days of survival without institutional care 156.4 127.4 28.9
Comparing national unadjusted effects and costs data for recipients of TC only in a community setting versus
Control 2 at six months, an incremental cost per day of SWIC (hospital or residential) is estimated at $344
(i.e. $9,942/28.9). Uncertainty around this point estimate is shown in Figure 6.2, which demonstrates the
95%CI around this estimate to be $279 - $420.
Figure 6.2: Joint distribution of incremental cost and effects for recipients of Transition Care only in a community setting vs. Control 2 at six months post ACAT approval
0
5000
10000
15000
20000
25000
-1 4 9 14 19 24 29 34 39
Incremental days of survival without institutional care (SWIC)
Incr
emen
tal c
ost
joint distribution point estimate, R=$344/day SWICupper 95% CI, R=$420/day SWIC lower CI, R=$279/day SWIC
Given the joint distribution displayed in Figure 6.2, the probability that receiving TC only in a community
setting is cost effective relative to Control 2 with six months post ACAT approval is shown in the cost
effectiveness acceptability curve (Figure 6.3). This figure informs decision makers of the probability that TC
is cost effective relative to Control 2 for plausible decision maker threshold values for an additional day of
SWIC.

68
Figure 6.3: National cost effectiveness acceptability curve for recipients of Transition Care only in a community setting vs. Control 2 at six months post ACAT approval
$279 $420$3440
0.1
0.2
0.3
0.4
0.5
0.6
0.7
0.8
0.9
1
$0 $100 $200 $300 $400 $500
Threshold value $ per additional day of survival without institutional care
prob
abili
ty c
ost e
ffect
ive
Figure 6.3 indicates that based on six month follow-up data from the time of ACAT approval there is a 50%
probability that receiving TC only in a community setting is cost effective relative to Control 2 at a value of
$344 per day of additional SWIC, given evidence of the distribution of costs and effects in Figure 6.2. At
$279 the probability is 2.5%, rising to 97.5% at $420 per day SWIC.
Figure 6.4 shows the expected incremental net benefit over six months post ACAT approval of receiving TC
only in a community setting relative to Control 2, dependant on threshold values for effects (additional days
of SWIC).

69
Figure 6.4: National net benefit curve for recipients of Transition Care only in a community setting vs. Control 2 at six months post ACAT approval
Figure 6.4 demonstrates that restricted to evidence from six months of follow-up, the expected value of
receiving TC only in a community setting is equivalent to that of Control 2 at a value of $344 per additional
day of SWIC. For values above this threshold, TC delivered only in a community setting has a higher
expected value, while for values below $344 Control 2 have higher expected value. More generally, the
difference in expected value at any given decision threshold value can be measured on the horizontal axis in
monetary terms.
It is important to note that the analyses presented here are restricted to six months of follow-up data post
ACAT approval. The direct costs of investing in TC are borne in the first three months post ACAT approval.
However, benefits in terms of health outcomes and associated cost offsets from reduced residential aged
care may continue beyond six months. Therefore an analysis of the costs and effects of TC relative to other
comparison groups over 12 months (to remove any seasonal effects) may provide further insight into the
medium term effects of the TCP.
Finally, a point to bear in mind is that the economic analyses have used days of survival without institutional
care as the effect. Other important outcomes, such as the cost to achieve a one unit improvement in
function (MBI) or quality of life, were not possible to examine as the data were not available.
-5000 -10000
0
5000
$0 $100 $200 $300 $400 $500 $600 $700 $800 $900 $1,000
Threshold value ($ per day of survival without institutional care)
Net
mon
etar
y be
nefit
for c
omm
unity
TC
vs.
Con
trol 2
($
per
pat
ient
)
Expected net benefit given value/ daySWIC

70
7. What did the Transition Care services say about quality in Transition Care?
Key points
• There was collaborative learning at state and regional levels and local service development.
• Formalizing agreements between hospitals and community aged care providers is emerging as best
practice in TC.
• There is a clear workforce issue with all staff needing training in a restorative/rehabilitative model.
• Engaging General Practice in care planning and review remains challenging, and very few teams
have succeeded in establishing a working relationship with medical specialists with expertise in
elderly care (geriatricians, rehabilitation physicians, and psychogeriatricians).
• The role of community pharmacists in medication review requires clarification.
We found evidence from the 23 Quality Reports that service delivery was goal oriented, time limited and
incorporated low intensity therapies aimed at maximising client independence. Individualized care planning
inclusive of the client, family members and other stakeholders involved in the client’s longer term care was
evidenced. It was apparent that the requirements of TC, which centre on teamwork, case management, a
restorative model of care, and efficient management of allocated TC places, require considerable adjustment
for staff trained in clinical and residential aged care models.
Less well evidenced were GP, medical and pharmacist involvement in care planning and review, although
this varied across services and regions. Case managers were identified as having a key role in facilitating
GP involvement in care planning and review. The barriers to GP involvement in care planning and case
conferencing are well documented (Shortus, Coulson et al. 2005; Preen, Bailey et al. 2006), although
Commonwealth initiatives to enhance GP involvement in residential aged care have had some success
(Gadzhanova and Reed 2007). Home Medication Management Reviews (Rigby 2006; Pit, Byles et al. 2007)
were not noted in the Quality Reports assessed as part of this study. Very few services were systematically
involving a medical specialist in elderly care such as a geriatrician or rehabilitation physician in TC.
It was reported that personal care staff were less familiar with the restorative/rehabilitation focus of TC and
additional training opportunities were sought. Timely transfer of information from the acute/sub-acute setting
was not always achieved. Similarly, waiting lists for HACC, CACP and EACH packages sometimes resulted
in less than optimal care at the conclusion of the TC episode.
We examined the first batch of quality reports submitted to state/territory Approved Providers and the
Australian Government Department of Health & Ageing. The reports were completed on average nine
months after commencement of the service and, with the exception of the pilot sites for the Innovation Care
Rehabilitation Services (ICRS) program (Department of Health and Ageing 2005), reflect the early
development of service teams and partnership or brokerage models of service delivery.

71
The TCP objectives, strategies, and service characteristics provide the conceptual framework for a set of key
requirements against which services are required to self-assess in their first year of operation. Self-
assessment is part of a broader approach to quality improvement and monitoring, which also involves the
selection of TC services, a Plan-Do-Study-Act cycle of continuous quality improvement, and an external
complaints mechanism. The Transition Care Quality Improvement and Monitoring Framework (Australian
Government Department of Health and Ageing 2005) proposes external assessment and stakeholder
feedback as additional checks of compliance with the requirements, although strategies to implement review
team visits have yet to be agreed.
The key requirements focus on those aspects of care specific to the TCP. TC services are provided by
health and aged care organizations and subject to various accreditation and external regulatory processes.
Although most Quality Reports have two or more signatories and are reviewed by state/territory Approved
Providers before submission to the Department of Health and Ageing, there is currently no mechanism for
direct external peer assessment.
The key requirements specify the expectations of TC services but do not prescribe how the requirements are
to be met. This approach allows for flexibility, innovation and the tailoring of strategies to meet local needs.
On the flipside, this lack of prescription contributes to ambiguity in the interpretation of the key requirements,
as do subtle differences in the wording of the requirements and relevant sections of the TCP guidelines.
Some of the key requirements comprised numerous criteria which presented an additional challenge. Few
services responded to the criteria in a systematic way and this detracted from the confidence with which
performance against a specific criterion could be reported.
It is anticipated that additional sources of information such as site visits and discussions with stakeholders
are required to expand on the evidence cited in the Quality Reports, particularly those areas where
compliance is currently not well evidenced. Site visits, or an alternative mechanism for external peer
assessment would also benefit the program more broadly.
Some services had been pilot sites for the ICRS program implemented in 2001/02 (Department of Health
and Ageing 2005). This experience was reflected in the maturity of service delivery processes and
partnerships apparent in responses to the Quality Report.
Quality in the TCP is inextricably concerned with care processes to support transfer between locations
(hospital to home or alternative care environment); between sectors (acute, primary, community, residential);
and between individual states (illness, frailty or disability to optimal independence and quality of life)
(Godfrey, Keen et al. 2005). Responses to the Quality Report highlight emerging best practice in TC with
respect to service agreements with referring hospitals that include protocols for the transfer of client
information and agreed processes concerning referral and response times. The analysis of the Quality
Reports also noted difficulties in providing for clients’ ongoing needs once TC has finished and suggestions
of less than optimal ongoing care arrangements in some instances.

72
In summary, the Quality Reports demonstrated there was collaborative learning at state and regional levels
and local service development. Formal agreements such as Memorandums of Understanding with hospitals
and community aged care providers are emerging as best practice in TC. All staff require training in a
restorative/rehabilitative model. Engaging General Practice in care planning and review remains
challenging, while the role of community pharmacists in medication review requires clarification. Finally, very
few teams have succeeded in establishing a working relationship with medical specialists with expertise in
elderly care such as geriatricians, psychogeriatricians, or rehabilitation physicians.
73
8. Issues from each jurisdiction Each jurisdiction was invited by the evaluators to contribute to this section concerning implementation and
issues around TC in each state and territory. The following subsections are the submissions that were
provided by the TCWG in response to that invitation.
8.1. Australian Capital Territory In December 2005, the ACT operationalized ten TC places. Following the end of the Intermittent Care
Service Pilot on 1 July 2006, an additional 25 TC places were allocated and operationalized. The ACT
currently has 15 residential and 20 community TC places and operates as the ACT Transitional Therapy and
Care Program.
Since the start of the ACT Transitional Therapy and Care Program a new purpose built sub and non-acute
facility was officially opened in February 2007, improving the capacity in the ACT to meet the needs of older
people across the acute-aged care continuum. The new facility added 28 new sub and non-acute beds to
the existing 12 geriatric evaluation management beds at the Calvary Hospital.
8.2. New South Wales To date, NSW has 31 Transitional Aged Care Services serving a population of people aged 70 years and
over numbering approximately 676,000. The majority of services offer community-based places and NSW is
seeking to expand its facility-based component over the next four years.
Given the increasing demands placed on ACATs following the introduction of this new service, it is pleasing
to see that in 2006/07 NSW had a median length of time to enter TC following ACAT approval of three days
and is reported as sharing with the ACT the “fastest entry to TC”.
NSW supports the researchers’ recommendations around the need for more work on quality indicators for
this type of service, on a detailed economic analysis of the different configurations and delivery approaches,
and on more investigation of the benefits and outcomes of experiencing facility-based or community-based
services or a combination of the two.
8.3. Northern Territory The small number of clients assisted through the TCP in the Northern Territory makes it difficult to draw
conclusions from the data. Based on the evidence in this report, future expansion of TC in the NT should
concentrate on establishing community based responses.
8.4. Queensland Queensland Health received 351 places under the TCP from 2005 to 2007. These places were approved in
three tranches – 106 places in 2004/05, 167 places in 2005/06, and 78 places in 2006/07. Queensland’s
Implementation Plan advised that these 351 places would be operationalized across both residential and

74
community settings depending upon the availability of unused and unfunded beds in residential aged care
facilities.
In recognition that there would be inherent difficulties in implementing TC in residential aged care facilities,
Queensland Health established higher subsidy rates for residential placements over community placements.
Despite this very significant higher subsidy rate, there were barriers to implementing TC in residential aged
care facilities. These barriers included a lack of spare bed capacity in residential aged care facilities to take
on TC and difficulties in recruiting the additional workforce required in residential aged care facilities to
provide restorative care. As a result approximately only 25% of the places were operationalized in
residential settings.
All 351 TC places will have been operationalized by 30 June 2008.
Rather than fund the TC places on an occupied bed basis as per the Australian Government arrangements,
Queensland Health fully funded its participating Health Service Districts on an annual basis at the beginning
of each financial year. The effect of this arrangement has been that Health Service Districts were able to
employ a number of allied health staff on an ongoing basis to support the roll-out of TC through State
funding. The funding available from unoccupied places was able to be used for infrastructure support.
Overall the TCP has been successful in Queensland and has delivered improvements in terms of hospital
readmissions, delayed transfer of older people to residential care and functional gain.
8.5. South Australia South Australia has placed a strong focus on re-organising our acute systems towards effective processes
for timely assessment and screening of potential TCP clients. We have a strong emphasis on early focussed
intensive service delivery.
South Australia has less clients participating in the program with cognitive impairment due to the need to
develop clearer care pathways for this group. Models of care are being developed that will result in easy to
access pathways of care for people with cognitive impairment and stronger integration of pre-acute, sub
acute and primary care based services.
The longer median waiting time from ACAT approval to TC admission in South Australia is a factor of
availability of residential care places. It is also a result of the need for improvements in patient flow across
the acute- aged care interface, which is being addressed by work associated with developing improved
models of care.

75
8.6. Tasmania Tasmania has two TC services, located in the south and north of the state, which became operational in July
and December 2006, respectively. As at 1st October 2007, all 57 places allocated to Tasmania were
operational.
Transition Care South The TCP South is coordinated from the Royal Hobart Hospital operating 47 flexible care packages. The
program followed on from the previous Intermittent Care Service Pilot. The program offers flexible packages
in both the residential and community setting delivered through a mix of service provision sourced from
private providers and the Tasmanian Department of Health and Human Services.
Residential Packages TCP South currently provides a total of 27 residential TC packages. Twenty-four residential packages are
provided at the department’s Karingal facility located approximately 15 kms from the Royal Hobart Hospital
(RHH) campus. A comprehensive tender process was undertaken for a TC service to provide nursing,
personal care, and hotel services in accordance with the TCP Guidelines. The successful tenderer was
awarded the contract for a period of three years to manage the facility and provide residential TC services to
recipients. The Department has responsibility for the maintenance and upkeep of the facility, all equipment
requirements, together with the provision of all Allied Health services, Geriatrician support to the facility is
provided through weekly clinics. The medical needs of the recipients are managed under the direction of a
General Practitioner. The remaining three residential packages are provided from the Repatriation Centre,
located approximately 2 kms from the RHH campus. An area of this building has recently been converted
into two non-acute wards, providing both TC and geriatric evaluation services. These packages are staffed
by departmental staff from all health disciplines.
Community Packages The RHH currently operates 20 community packages. A tender process was undertaken for a TC service to
undertake the provision of this service in accord with the TCP Guidelines. The successful tenderer was
awarded the contract for a period of three years. All referrals for community TCP come from the RHH
Rehabilitation and Aged Liaison Team (RASL). A case manager is appointed by the TC service at the
commencement of the program. The TC service is responsible for all discharge planning and referrals for
additional support on completion of TCP.
Transition Care North Currently the Launceston General Hospital operates 10 Transition Care packages which are all community
based. The catchment of the service is at the current time within a 20 minute radius of Launceston CBD. At
the current time all clients for the program are referred from the Launceston General Hospital. Clients are
assessed by the hospital Aged Care Assessment Team (ACAT) according to the Commonwealth guidelines.
The program is staffed by Launceston General Hospital which comprises, nursing, allied health and support
staff. Brokerage of services for support is coordinated by the TCP team on the basis of client need and may

76
include personal care, meal preparation, transport, nursing assessment, physiotherapy and occupational
therapy assessment, planning and intervention. The Service is staffed from 7.30 am to 8 pm with all clients
provided with out of hours support through the Launceston General Hospital.
All clients are case managed by a registered nurse, physiotherapist, occupational therapist, or social worker.
Client meetings are conducted weekly to discuss progress and modify care provision as required On
discharge from the program referrals to appropriate services are made or reconnection with previous
services are arranged.
The client’s General Practitioner (GP) is informed on acceptance and discharge to the program and as
required during the duration of the program. General information sessions are also provided to GP practices
as required.
Key Issues The cost of providing the program continues to be a key factor for Tasmania both in terms of direct funding
and in kind contribution and the corporate and local costs associated with the administrative burden of
managing the program. During the first year of implementation Tasmania’s contribution represented 75% of
the total program funding compared to the Australian Governments 25% contribution.
Tasmania’s experience following the first year of operation demonstrates that the program would benefit from
changes to the current guidelines in relation to increased flexibility for patients to enter the program from
settings other than acute inpatient care, for example Department of Emergency Medicine and from the
Community on General Practitioner referral.
The lack of appropriate leave provisions to exit and re-enter TC without readmission to hospital and ACAT
reassessment has been found to be a significant hindrance to the smooth operation of the program and
similarly the requirement for ACAT assessment for entry on to the program has also been found to cause
delays and blockages in the system, due to long wait times for ACAT approvals to be completed.
The evaluation results identified high readmission rates for TCP recipients in Tasmania when compared to
other states and territories. Whilst it is recognized that there were many limitations with the data set and the
data only represented a three month snapshot, this is a matter for further investigation, and further data
analysis at 12 months would be useful.
8.7. Victoria Victoria has led the way in Australia with a well-developed sub-acute service system. It has a strong focus
on inpatient and ambulatory sub-acute rehabilitation services and is becoming increasingly integrated within
the acute service system. Sub-acute services aim to maximise independence for patients of all ages, by
providing goal oriented (and in most instances, time-limited) interventions aimed at assessing, treating and
frequently managing complex conditions to maximise independence.

77
Victoria made a commitment, via the Australian Health Ministers Advisory Council, to implement the National
Action Plan for improving the care of older people across the acute-aged care continuum, 2004-2008. Part
of this commitment included the development of planning guides regarding the availability and mix of
inpatient and ambulatory services for sub-acute services for older people. In addition to this, Victoria
engaged the services of Aspex Consulting to develop a Sub-acute Planning Framework, which would ensure
that adequate levels of service were being provided. The final report will be available in June 2008.
The availability of TC services has allowed Victoria to bring the best elements of previous Commonwealth
and State funded service support initiatives (such as Innovative Care Rehabilitation Service and Intermittent
Care pilots and Interim Care) together under a single program, with capacity to tailor the service around the
needs of the individual. It also allowed broader and more systematic coverage across the state and serves
to complement Victoria’s acute and sub-acute service system. The intended outcome of this care provision
approach is to minimise the number of older people who experience inappropriate extended hospital lengths
of stay and/or may be prematurely admitted to residential aged care. TC services are located at the interface
between the acute/sub-acute and aged care sectors.
The TCP aims to provide an older person with the treatment and care that best suits their individual
requirements and in so doing, places the older person at the centre of their care. Older people may access
TC services from an acute or sub-acute service depending on the need of the individual. Consistent with the
Department of Human Services assuming the role of approved provider, Victoria’s TCP is operating as a
single program, although multiple Health Services are involved in the delivery of TC services.
The effectiveness of the TCP is reliant on the recipient’s capacity to ‘transition’ to a long-term care
environment, be it in the community or in a residential care setting. This requires access to care resources
(for example, Home and Community Care, Community Aged Care Packages, Extended Aged Care
Packages, Disability Support Services and residential care places) that can sustain and build on the goals
achieved by the client during the TCP episode of care. Imperative to the efficiency of the service is the close
working relationship between TCP personnel and Aged Care Assessment Teams. The use of multi-
disciplinary teams to deliver the TCP has proven successful in utilising the required skills and knowledge
each member contributes to the development and refinement of the care plan and service. The use of
geriatrician intervention has supported the general practitioner in effectively managing the needs of an older
person. TCP has been a great example to date of effective teamwork in achieving a common purpose:
better health and care outcomes for older Australians.
8.8. Western Australia Western Australia (WA) was keen to continue the model successfully established through the Aged Care
Innovative Pool, national pool of flexible care places.
WA planned during 2006 – 2008, within the first year the establishment of a metropolitan wide TCP with
north and south locations providing a community/residential mix, and by 30 June 2008 to further expand the
model to include flexible places in three rural locations.

78
A total of 160 TC places were requested to support the development of a program in WA:
a) 50 TC places operationalized by 1 January 2006
The initial 50-place allocation mainstreamed the Innovative Care Rehabilitation Service Pilot operating in the
north metropolitan region. The 50 flexible places consist of 20 residential places and 30 flexible community
packages.
b) 50 TC places operationalized by 1 July 2006
The next 50-place allocation mainstreamed the Intermittent Care Service Pilot operating in the south
metropolitan region. The 50 places consist of 30 residential places and 20 flexible community packages.
c) 60 TC places operationalized by 01 May 2008
The next 60-place allocation provided TC to three separate rural locations, South West, Midwest, and Great
Southern regions through equal distribution of 20 flexible community places/packages at each site.
The model has a single point of entry for each program with local arrangements to suit the primary public
health services in the area. The most appropriate service for the client, community or residential, is
determined following professional assessment by the Service Care Coordinator in the region in consultation
with the referring treatment team. The service has strong links with the teaching hospitals and with the
Departments of Geriatric Medicine, Aged Care Assessment Teams, and general practice.
The model of care and services are focussed on metropolitan clientele but access opportunities are
broadened to offer options statewide. Rural residents are able to access the residential aspects of the
metropolitan program should it be assessed that this is an appropriate service for the client and should
appropriate supports and discharge planning arrangements be available for the client to return to their local
area.
79
9. Strengths and limitations of the National Evaluation of the Transition Care Program
The framework for the evaluation necessitated a descriptive approach, and a series of studies that gave
snapshots in time of different aspects of the TCP were conducted. This approach has both strengths and
limitations, and in this section we recap briefly on the limitations in each of the six studies before commenting
on the strengths and limitations of the NETCP as a whole.
9.1. Regional Characterization Study To calculate the provision of health and aged care services for older people in each ACAT region, estimates
of the resident population in each region were made. Because the estimated resident population in each
Statistical Local Area (SLA) by age group was not available as at 30 June 2006 in time for submission of the
report for the Regional Characterization Study, the population in each SLA by age group was projected from
the estimated resident population at 30 June 2005. Thus a state level increase in population was applied at
a smaller geographic area level, and the actual growth in each SLA will have varied slightly from the overall
state growth in each age group. However, it is expected that this would have had a minor impact on the
reported availability of health and aged care services.
There were also differences in the timing of the concordance mappings for SLAs, ACAT regions and
postcodes that were used in this study. The concordance mapping between SLAs and ACAT region is
based on 2001 SLAs. However, the estimated resident population uses 2005 SLAs. The suburb and SLA
concordance is based on 2003 SLAs. The concordance between 2001 and 2006 SLAs was used in the few
instances where SLAs from later years did not map to ACAT regions. Any differences in SLA boundaries
between years are expected to have negligible effects when aggregated to the ACAT regional level, but
nonetheless some effects were possible.
In the ACAT-SLA concordance file, two of the SLAs in New South Wales map to more than one ACAT
region. South Sydney (C) maps to both South Eastern Sydney/Illawarra and Sydney South West. The
former was assumed in the Regional Characterization Report. Similarly the SLA of Sydney (C) – Remainder
maps to both South Eastern Sydney/Illawarra and Sydney South West. The latter has been assumed
throughout this report.
9.2. Models of Transition Care Two main limitations were evident in the derivation of models of TC. The first main limitation related to the
asynchrony of data that were used in the report. In the main, data for this report were drawn from the TCP
database COGNOS, administered by the Department of Health and Ageing, and covered the 2006/07
financial year. The characteristics of ACAT regions drew on data from the 2005/06 financial year, while a
survey of TC services that was also analysed in this report was carried out in November 2006. Quarterly
Reports completed by the services generally were completed for the April-June 2007 period, but there was

80
wide variation in the length of time that services had been operational when they submitted their Quarterly
Report.
The second limitation related to the integrity of some of the TCP administrative data, especially those drawn
from the TC Claim Form. This report identified some issues in the reporting of discharge reason on the TC
Claim Form, which possibly led to an underestimate of the proportion of TC recipients discharged to the
community.
9.3. Quality Assessment Study From an evaluation perspective, the analysis of the Quality Reports presented challenges. Quality Reports
were provided in a variety of electronic formats including Microsoft Word, portable document format, or
images embedded within Word, and with variable security settings which prevented the easy manipulation of
data. A further challenge arose from the combination of descriptive responses and multiple criteria
embedded within the reporting structure. Few services responded to the criteria in a systematic way and this
detracted from the confidence with which performance against a specific criterion could be reported. Other
quality review mechanisms, such as those proposed by the Department of Health and Ageing as part of the
Transition Care Quality Improvement and Monitoring Framework are required to validate and expand on the
findings of Quality Assessment Study.
9.4. Recipient Snapshot Study The sample of interviewed TC recipients represented one fifth of the population of TC recipients who were
discharged from TC in the timeframe of the Recipients Snapshot Study. The sample was not randomly
drawn from a list of all TC recipients, because the evaluators were not able to access the names and contact
details of individuals without the individual’s written consent for contact. This was because privacy legislation
in each of the jurisdictions limited the personal information that could be accessed by the evaluators.
Consent to a telephone interview was provided by recipients at discharge from TC, and recipients who were
discharged to hospital or residential aged care may have been discharged from TC quickly without
discussions concerning the evaluation taking place. This method of seeking consent also relied on TC
services, and it is possible that some recipients were not approached if they had been recalcitrant or
dissatisfied while in receipt of TC. Thus the interviewed sample does not appear representative of the
population of TC recipients in terms of discharge reason. There was also a discrepancy with coding of
discharge reason in Victoria (National Evaluation of the Transition Care Program, 2007b) so that a large
proportion of recipients were discharged to ‘other’, and a probably under-estimate of discharges to the
community. If correct discharge destination data were available, it is likely that for Victoria a better
representation of interviewed recipients from the total of all TC recipients would have been found.
Furthermore, no recipients of TC in Western Australia or the Northern Territory were interviewed. No
Western Australian recipients were approached at the request of the Department of Health in Western
Australia, while the Katherine Transitional Care Unit only commenced operation in February 2007 and had

81
few discharges by 30 June 2007. None of the recipients of TC from the Katherine Transitional Care Unit
consented to a telephone follow-up interview.
The results suggest that the interviewed sample had less functional dependence and were discharged to the
community at a higher rate than the population of TC recipients over the same period.
9.5. Controlled Comparison Study and Costs and Effects Study There are a number of limitations that must be borne in mind in interpreting the results from the data linkage
component of the evaluation.
One of the main limitations that must be considered is the validity of the control groups against whom the
comparisons of TC recipients’ outcomes are made. Without data from randomized controlled trials, an
assessment of both the effects and costs of the program are difficult because comparisons with unbiased
control groups are not possible. The comparability of controls is further limited by the availability of data
items to match the TC recipient, Control 1 and Control 2 groups. The proposed methodology for this part of
the NETCP was to control for comorbidity (including cognitive behaviours and continence) and demographic
profile in the comparisons of the three groups of people. However, data from Part 5 of the Aged Care Client
Record (ACCR) are not entered in the Aged Care Assessment Program Minimum Dataset despite being
collected by assessors. The most relevant items concerning cognitive function were unavailable and so they
could not be used to compare the three types of approvals with respect to this aspect of health. Instead, the
total number of Activity of Daily Living (ADL) items for which each individual in the cohort needed help was
calculated based on Question 23 of the ACCR form. The diagnosed diseases or disorders were used to
code an individual as having a diagnosed cognitive impairment.
On balance the control groups appeared a reasonable match to the TC recipients group overall. However,
within jurisdictions there was considerable variation between the three groups in terms of cognitive
impairment, co-resident carer availability and ADL needs. It remains unclear if this is a difference in
selection practices by different ACAT teams or whether the background differences between ACAT regions
in terms of services available for older people influences the operations of these programs.
A second important limitation in the results reported here is the large proportion of individuals (22%) for
whom an index hospital event could not be ascertained. The index hospitalization was defined as the
hospital event during which the ACAT assessment took place, with a leeway of up to a week allowed for
individuals with close matches on hospital episode dates and ACAT assessment dates. The proportion of
individuals with no match for an index hospitalization was greater in the Control 2 group (25%) than in the TC
recipients group (19%) or Control 1 group (22%). The members of the cohort without an index
hospitalization were not significantly different in terms of activity limitations or the availability of a co-resident
carer. There was, however, a significant difference in terms of cognitive impairment with 28% of those
without an index hospitalization versus 24% of those with an index hospitalization indicated to have cognitive
impairment in the health conditions on the ACCR form.

82
There are several reasons that may have contributed to the high proportion of individuals without an index
hospitalization. Hospital records were extracted in ACT, NSW, SA, Tasmania, and Victoria for all hospital
separations between 1 October 2006 and 30 September 2007 for persons aged 65 years or more (specific
records were extracted for NT, Queensland, and WA). Therefore an index hospitalization for those people
with an ACAT approval in these five states who were aged less than 65 years could not be determined.
An additional limitation is that the availability of data from private hospitals differed between jurisdictions.
Data from private hospitals were not available from NSW, and the effect of this on the data linkage is not
known. Twenty five per cent of the NSW cohort could not be linked to an index hospitalization in comparison
to 19% in SA where private hospital data were available.
It must also be borne in mind that the hospital morbidity data collections were accessed for the NETCP some
four months before the same data are supplied to the Australian Institute of Health and Welfare. The
hospital data were analysed as supplied, and so differences between jurisdictions in the coding of
administrative discharges, for example, may explain some of the differences observed here. The pattern of
hospital readmissions appears quite different for Tasmania compared to other jurisdictions.
The cost of each day in TC was estimated as $213.86 (that is, twice the flexible care subsidy for 2007/08 of
$106.93; Australian Government Department of Health and Ageing, 2008). However, different jurisdictions
may have funded the community-based and residential-based TC places at different rates, but these
differential rates were not available for the evaluation. Nevertheless, the total program costs to both
Commonwealth and State or Territory providers are accurately reflected in the costing method used in this
evaluation.
The economic analyses have used days of survival without institutional care as the effect. Other important
outcomes, such as the cost to achieve a one unit improvement in function (MBI) or quality of life, were not
possible to examine as the data for the two control groups were not available. Annual Accountability Reports
that are completed by TC services were not included in the analyses and this may be an area for future work
in informing the economic analyses.
Finally, the three and six month follow-up periods were based on time from ACAT approval, not discharge
from TC, which does not provide a particularly lengthy follow-up period following completion of TC.
9.6. Overall strengths and limitations One notable overall limitation is the lack of independence between the TC services and the measurement
and reporting of data for the evaluation. The evaluation design deliberately imposed as little burden as
possible on individual TC recipients or TC services. This meant that making maximum use of existing TC
administrative program data was an essential part of the evaluation.
The evaluation had to balance burden on TC services and individuals with the collection of quality data. One
casualty of minimising the burden is the relatively small amount of information that was able to be collected

83
from TC services. Important local issues in terms of TC implementation and service delivery that were not
captured in the performance indicators of function and institutional care use are therefore not addressed in
the evaluation.
The integrity of administrative data bases that are not collected for the primary purpose of evaluation has
been raised by other authors (Kelman and Smith 2000). The TCP database draws data from the TC claim
forms, which directly inform the financial management of the program. As noted in the limitations concerning
the Models of Transition Care Report, some of these administrative data appeared inaccurate.
A second important limitation of the evaluation overall is the limited qualitative data that were collected from
individual recipients of TC. The journey of individual TC recipients was not mapped as part of the evaluation,
and this would have added strength to our ability to describe the elements of TC which were associated with
successful outcomes as well as chart individuals’ trajectories through the emergency, acute, rehabilitation,
and aged care sectors.
It is also important to note that the hospital readmissions considered in this report included all inpatient
episodes. Some of these episodes may have been for reasons or conditions unrelated to the original index
hospitalization. In addition, a distinction between emergency and elective episodes has not been made so
that the overall use of the hospital system as inpatients by TC recipients and control groups was estimated.
These are balanced to some extent by one of the major strengths of the evaluation, the synthesis of findings
from different studies that examined the individual, service, regional and jurisdictional level factors that were
important in the delivery and experience of TC. Furthermore, all TC services that were operational at the
time of conducting the evaluation were included, rather than just a sample of TC services.
All data that were available from TC recipients were analysed. While only a sample of TC recipients took
part in telephone interviews, the data linkage methodology ensured that important outcomes of hospital
readmissions, residential care admissions, and deaths were examined for all recipients of TC. One of the
major strengths of the evaluation is the data linkage methodology that used current best practice. This
evaluation was the first study to link together the datasets that covered residential aged care, hospital use,
mortality, and TC use on a national scale.

84
10. Summary and future directions 10.1. Discussion
We found that the TCP was highly valued by both recipients and carers and that during the evaluation period
which covered July 2006 - September 2007 the program had successfully assisted older Australians to
remain in their own homes. Our results suggest that the target group of frail older people are being identified
and offered the program across Australia and that TC is preventing hospital readmissions and transfers to
residential aged care. We have summarized the evidence found for the TC models in Table 10.1. The
current configuration of the program is constraining its efficiency so the positive effects achieved by the
program are being delivered at a significant cost. This is not surprising in a new program which is tackling a
complex policy area so these costs are likely to reduce with further development of the program. Older
people moving out of hospital are at risk of experiencing fragmented services associated with the complex
governance arrangements in Australia. The program has emerged from a policy commitment to improving
the integration of older people’s services but translating this policy intent into an efficient operational program
is likely to be an iterative process taking three to five years.
Defining the interface between rehabilitation and TC appears an important issue. Issues of local governance
will need to be considered as the program is currently at risk of setting up another post acute care silo with
its own assessment processes, its own queues and introducing further fragmentation. In some states
subacute care is part of acute hospital services and TC falls under the umbrella of primary care service
structures; the interface is poor and there is early evidence of problems. If the services are to be considered
a continuum then the establishment of rehabilitation bed benchmarks may need to be part of the
development of TC. The variation in rehabilitation bed provision was clearly distorting the implementation
phase, exaggerating state differences and leading to inefficiencies manifest in both queues and case
selection.
A more complex issue is around the emphasis in the program on change outcomes i.e. improvements in
physical function, confidence and morale rather than on maintenance outcomes i.e. outcomes which prevent
or delay deterioration in health, well being or quality of life (Qureshi, Patmore et al. 1998). This emphasis
appears to have led to the selection of recipients who are able to achieve change outcomes, in a
comparatively short period of time and probably resulted in the exclusion of many people with dementia.
Data from Victoria on recipient MBIs suggest that in their services there was less emphasis on physical
function as an outcome and a greater emphasis on maintaining quality of life. However, Victorian services
were penalized in our assessments of MBI efficiency (changes in function per day).
There is comparatively little emphasis in the program on process outcomes such as feeling valued and
respected, having a say over the timing and type of services and the way that the funds were allocated
(Qureshi, Patmore et al. 1998). The TC interventions had the potential to be more flexible than was
observed. The close alignment of most programs to conventional physical rehabilitation programs has led to
less emphasis on active participation by recipients than is stated in the program guidelines. Recipients’
responses to the telephone survey indicated that the model has been implemented with the TC services

85
allocating services to the older adult after a negotiation but these goals are constrained by the staffing mix in
place. As a result, the decision on the type and amount of therapy was usually made by TC services. In
many areas competitive tendering has established panels of aged care providers to provide personal care
while hospitals provide therapists and so the service is complicated and non transparent to hospital staff,
patients and families. The program is tending to use conventional health “prioritization approaches” for entry
and then providing a service mix akin to hospital rehabilitation services. There are limitations to this
approach as it depends on a skilled work force, is inevitably associated with queues and there are incentives
which encourage the staff to influence negotiations about what types of services will be delivered.
There is currently debate in the UK around whether Intermediate Care (a similar although different approach
to post acute care) is over-emphasising physical maintenance outcomes instead of other maintenance
outcomes such as sustaining social contacts and being able to stay alert and active (Glendinning, Clarke et
al. 2008). There have been suggestions that leaving the house should be a key outcome of community
interventions for older people rather than the outcome currently given the highest priority by both researchers
and policy makers - staying out of an institution (hospital or residential aged care) (Close, Ellis et al. 1999;
Beswick, Rees et al. 2008). Given that an outcome focused approach is likely to continue, a broadening of
key outcomes to align with older people’s values could be considered. In the Australian context, one of the
stated aims of the TCP is to improve psycho-social functioning, with services contracted to provide activities
to prevent social isolation and facilitate social contact. A more flexible interpretation of the TC entry criteria
may result in a broadening of access to the program to include those with complexity, mental health, and
cognitive problems.
The analyses (although limited by reliance for comparisons on administrative data rather than appropriately
selected controls) also suggested that the use of TC only in a residential setting as sites for geriatric
evaluation and management by many states was probably not efficient or effective. It took longer to get
functional shifts in residential-based TC than in Victorian GEM units and this type of TC did not prevent
transfer to residential aged care. In some jurisdictions it is possible that patients in hospitals who were
waiting for a place in a high level residential aged care were less likely to move to residential-based TC than
patients who needed rehabilitation. In these jurisdictions it is likely that their hospitals would still be occupied
by people awaiting care while other patients likely to get home would be transferred to receive inefficient
rehabilitation programs.
This issue overlaps with the problems associated with using TC to substitute for rehabilitation services and
the more complex issue of how and where to deliver post acute care. However, it also raises questions
about whether the outcomes selected for performance monitoring, (which are similar to those used in
rehabilitation units) are influencing the approach staff are taking to operationalize the program. Residential-
based TC offers a more appropriate environment for individuals finalizing their care arrangements than
hospital wards and it allows maintenance of function and quality of life goals can be met. However, our
results suggest that while on the one hand caution should be observed in the use of these units as
rehabilitation sites, on the other those jurisdictions who used residential-based TC to assist very dependent

86
older people make long term arrangements for their care are penalized by the current performance
measures focused on functional improvement.
The efficiencies of the program need exploration particularly those at the front end of the program and those
factors affecting total episode costs. Our analyses suggested that paradoxically hospital delays were
occurring in the process of moving older people out of hospital with TC. We did not include the index
hospital admission in our economic analyses so ignored the delays in discharge associated with entry. As a
result it is likely that the costs we estimated are at the lower end of the spectrum. Another strategy for
decreasing costs would be to reduce the TC episode costs by examining incentives to increase turn over
without decreasing the complexity of those selected. In addition, the relative efficiencies of delivering post
acute care in a home-based model (which involves therapists visiting older people at home) versus using
hybrid models (e.g. home care plus centre based therapy, such as day centres/rehabilitation hospitals).
Specific issues identified during the implementation This evaluation focused on the period between July 2006 and September 2007 and so it represents a
snapshot of the implementation phase. We followed older people who were receiving the program from
newly configured teams, at a time when they were still on a learning curve and were experimenting with
triage processes and interventions. Therefore, it is possible that some of the inefficiencies noted have
reduced as staff and jurisdictional experience has increased.
i. Case selection. The services and configurations of the program appeared flexible and allowed older
people to receive a range of services in the community and in facilities. However, case selection is
important in determining the efficiency of the program. There are elements of TC which have been
imported from aged care services which are bureaucratic within a hospital setting. Most home
rehabilitation and discharge services involve a single assessment process rather than two assessments
(ACAT assessment to approve eligibility and TC services to accept into the program). Where recipients
have no option for discharge to the community unless they receive the level of support in these programs
this delay would not be a problem. However, the high functional scores of some recipients (MBI greater
than 90) suggest discharge might have been an option without the program. Given that the program was
set up to decrease time spent in hospital, the suggestion in some states and territories that the program
is introducing delays in hospital discharge needs to be monitored. Jurisdictions could also review case
selection for community-based TC places and consider whether alternative services might achieve the
same result in a more timely fashion. Admission to the program is complex and the investment in
supporting individuals comparatively high so the program could be reserved for more disabled
individuals. The eligibility requirements do not currently exclude older people with cognitive impairment
yet it appeared that several jurisdictions were excluding people with dementia (although they are at
particular risk of readmission to hospital and movement into residential aged care) and focusing on
physical disability. Consideration could be given to clarifying whether this group is intended to be
excluded.
ii. The interface with subacute care. The variation faced by older Australians in access to subacute beds
across Australia was one of the most striking findings of this evaluation. The selection of cases (as

87
evidenced by the recipients’ disability levels) to receive TC places is likely to be influenced by the
availability of other subacute services and cross state comparisons of disability levels suggested that TC
was substituting for traditional subacute services in many jurisdictions. For example, the program
appeared to provide services in Queensland to older adults who would probably have received state
funded Home Rehabilitation programs in other jurisdictions and in South Australia the residential-based
units appeared to accept older adults who may have entered GEM units in Victoria (it was noteworthy
that those entering residential-based TC in SA were less disabled (as measured by MBI) than those
entering GEM in Victoria). Based on the limited comparisons that we were able to make by using
administrative data, it appeared that by using TC as a substitution for conventional rehabilitation
approaches these states had settled for less efficient approaches (e.g. longer stays in residential-based
TC than in GEM, longer delays to accessing community TC for older people) and this is likely to be
contributing to the high costs of the program. As a result, it also seems that groups of very disabled
older adults who might access TC in regions with strong subacute services access are not entering TC in
states such as Queensland where the TC places are occupied by less disabled patient groups. This is a
complex area and it is unlikely that the services will ever accept the same cases in each state. However,
the boundary between subacute care and TC was very unclear in several states and unless this interface
is clarified it is likely to confound improvements in efficiency. The definition of a rehabilitation episode of
care includes psychiatric rehabilitation which appears to have led to some differences in reporting
approaches from jurisdictions, as some states included psychiatric rehabilitation episodes of care in their
count of rehabilitation episodes of care while others did not. It would be helpful if reporting allowed
national comparisons, longitudinal reporting of changes in bed stock and to allow for accurate workforce
planning. This would be consistent with Principle 5 of the National Action Plan for improving the care of
older people across the acute-aged care continuum 2004-2008 “… all jurisdictions will develop and
agree on standard definitions and consistent data collections and performance indicators to measure
access to rehabilitation, geriatric evaluation and management, psychogeriatric, palliative care and other
specialized health services for older people” (see Appendix 1).
iii. Allocation. Given the widespread shortages, access to TC places might be improved if a move was
made to incorporate a population based allocation such as currently used by the Commonwealth to
allocate aged care places i.e. per 1,000 population aged 70 years and over. If this were not possible
consideration should be given to allocation of TC places according to areas of need as assessed by the
map of aged care places and subacute hospital beds provided in the Regional Characterization Report.
A state or territory based plan, taking into account local issues such as workforce and service, could also
be explored. Many areas identified as particularly lacking in both aged care and subacute services were
rural which will present workforce difficulties. However, the program is flexible allowing a range of
professions and organizations to deliver TC services.
iv. Hospital readmissions. The hospital readmission rate was high particularly in the community-based
TC group. Access to a medical assessment and a pharmacy review of drugs is likely to reduce
(although not eliminate) this rate. Very few TC services had allocated funds to include medical or
pharmacy staff in their programs. Older adults with medication discrepancies on transfer are more likely
to be re-hospitalized within 30 days than those without (Coleman, Mahoney et al. 2005). In addition, a
relationship between readmission rates and number of nursing staff was established. Evidence that the

88
team members providing services to recipients are broad and collected at the service level in Quarterly
Reports, but are not available at the recipient level. The governance structures and responsibility for
clinical outcomes in residential-based TC units can be unclear and this has been identified in the UK as
a problem.
v. Leave rule. A substantial proportion of TC recipients (22%) ended their programs back in hospital and
many subsequently reapplied to return to TC, adding burden to ACATs through the additional
assessments required for many re-entries. Acknowledging the frailty of this group and the high hospital
readmission rates, the rule regarding transfer back to hospital which currently allows a leave period of
only 24 hours could be reviewed and consideration given to allowing a longer period of leave. For
example, seven days would allow for a short hospital stay and return to TC service without creating the
need for a second ACAT assessment. This may also reduce the proportion who are ultimately
discharged to hospital, with more discharged from the service to the community or residential aged care.
This would also allow a better assessment of the final residential outcome of TC recipients.
vi. Measures of Transition. Internationally the risks associated with transfer ‘episodes’ between
institutions and systems of care in institutionalized older adults are high enough and occur frequently
enough for the terms ‘falling through the cracks” and “transfer trauma” to have entered the literature
(Coleman 2003; Sherman 2006). The US is using a ’pay for performance’ strategy for managing transfer
outcomes (Sherman 2006). Recognising that older patients with complex conditions require care from a
variety of settings and that poor transitions between these settings threaten safety and increases costs,
there has been considerable focus in the US on guidelines to improve the transfer and on a patient tool
(the Care Transition Measure) which assess change in health system performance (Coleman, Boult et
al. 2003; Coleman, Mahoney et al. 2005). The Care Transition Measure is currently being trialled in 200
hospitals in 10 European countries as a quality indicator of transfer from hospital (Coleman, Parry et al.
2007). We trialled this tool in the telephone survey of recipients and we found that the scores were
suggesting problems with medication management. However, scores did not predict rehospitalization so
further work is needed to identify an indicator that has predictive validity.
vii. End of life care. Achieving a good death e.g. advance directives could be reasonably considered with
certain patients. Twenty percent of those over 80 who received TC only in a residential setting were
dead at six months suggesting end of life issues were important. In the UK, programs have been
developed to ask doctors to identify patients using the questions “would you be surprised if this patient
died within the next year?” Patients identified in this way then have differing quality measures applied
(Dy and Lynn 2007). Consideration could be given to including end of life quality measures in
residential-based TC.
viii. Workforce has been a significant barrier in the US to providing post acute care. In particular, many
doctors are not prepared to work in geriatrics and long term care and this lack of medical practitioner
interest is viewed as a greater impediment than the financial and delivery problems (Anonymous 2008).
Disease management programs have been in place in the US since the 1990s and more recently
variations of these chronic care models with strategies to increase the level of medical involvement have
been described (e.g. telemedicine, Advanced Medical Homes) in the US (Wagner, Austin et al. 2001;
Bodenheimer, Lorig et al. 2002). There may need to be some exploration of these new models to allow
rural areas to deal with accessing specialist staff.

89
ix. Residential-based TC – minimum size. We were unable to answer the question around whether TC
provided in a residential-based setting should be offered as single places in aged care settings or
whether larger numbers of co-located clients will achieve greater outcomes. We were also unable to find
differences in outcomes of residential sites provided on hospital grounds compared with residential-
based TC in existing facilities. Without critical mass it seems unlikely that older adults are receiving
adequate therapy and nursing levels, the facilities are unlikely to have appropriate equipment and gyms
for one or two clients and more importantly the interface with acute care is more likely to improve with
higher numbers of TC recipients.
x. Access to other aged care services. At a recipient level the long-term effectiveness of the program is
largely dependent on the ability for the individual to transition to long-term care support, whether this is in
the community or in a residential care setting. Access to supports such as HACC, CACP, EACH, low
and high care places is essential in supporting and maintaining the goals achieved for the TCP recipient.
The current levels of service provision are potentially limiting the benefit of the program, especially where
recipients are unable to access a CACP or EACH and therefore require residential aged care.
xi. Reducing out-of-pocket costs. Developing a funding method to reduce out-of-pocket costs for TC
recipients with extensive equipment needs, especially where it is unlikely that other resource programs
will be in a position to intervene in time, is another potential area for consideration.
xii. A future evaluation of the TCP could include an analysis of the financial data included in the Annual
Accountability reporting that all TC services have to submit. This could usefully supplement the other
resource use estimates that were used in the evaluation. While the Annual Accountability Reports do
not include patient level data, the reports demonstrate the wide variability in expenditure by TC services
with different models.
xiii. Longer-term follow-up. A longitudinal study involving either the client group included in the Recipient
Snapshot Study or the client group included in the data linkage study (Controlled Comparison Study and
Costs and Effects Study) may provide useful data about the longer term effect of the TCP, particularly if
combined with several years of Annual Accountability Reporting.

90
Table 10.1: Transition Care Program: assumptions behind the model and evidence for these assumptions.
Assumption Evidence
1. The planning benchmark for residential aged
care is not being met in a number of regions
(Principle 1 page 5 (Australian Health Ministers'
Advisory Council 2004)).
We identified regions where the planning
benchmarks for residential aged care were not
met.
2. Provision of step-down and rehabilitation is
variable and few jurisdictions have known
benchmarks for estimating the level of provision
(Principle 1 page 5 (Australian Health Ministers'
Advisory Council 2004)).
We confirmed that provision of rehabilitation
beds was variable but across Australia was
around 3.0 per 1,000 older people aged 70 plus
for the 2005/06 period. Victoria had a
substantially larger subacute sector than other
jurisdictions.
3. Alternate models of care in settings other than
hospitals can lead to improvements in functional
status from an additional period of time limited low
intensity therapy and care.
We confirmed that improvements in functional
status occurred.
4. The alternative models should be in additional to
the other existing services jurisdictions provide to
support older people moving from hospital to home.
We found that these older people entered
these services at the end of existing hospital
services. There was much variation in the
point at which this occurred and in jurisdictions
where there were limited rehabilitation services
TC appeared to substitute for rehabilitation
services.
5. Older people waiting for residential aged care
are “blocking” hospital beds (Service provision for
older people in the acute – aged care system
(Gray, Dorevitch et al. 2002).
No evidence was provided on this issue.
6. TC services should have a focus on recovery or
maintaining function as well as facilitating long-term
care arrangements.
There was evidence that the units focused on
recovery and maintaining function.
(continued)

91
Table 10.1 (continued): Transition Care Program: assumptions behind the model and evidence for these assumptions. Assumption Evidence
7. TC services should have interdisciplinary input,
coordinated by a case manager where possible.
It was not clear that interdisciplinary input
occurred. Many services used a team
approach. However, brokerage services were
often in place for personal care and some
services were limited (medical, nursing,
pharmacy). Staffing levels varied. Lower
levels of allied health staff predicted transfer to
care and lower levels of nursing staff predicted
hospital readmission. It was unclear whether
an interdisciplinary model was in place (i.e. no
evidence of team case meetings and shared
goal setting) but there did appear to be a
multidisciplinary team in most areas.
8. TC is likely to be providing care [rehabilitation]
at a lower cost than hospital based care (ICRS
(Department of Health and Ageing 2005)).
Our results suggest that individuals with similar
levels of disability at entry spend longer in TC
units and have less efficient functional gain that
those in rehabilitation units and GEM units.
9. A consistent application of data definitions and
appropriate data items are fundamental to a robust
service planning process. Nationally consistent
application of existing definitions for subacute
services is therefore a priority.
We identified inconsistencies in the reporting of
rehabilitation beds with some states including
psychiatric rehabilitation beds in their count of
rehabilitation beds while others did not.
10. A model for data linkage to include the acute,
subacute aged care and community care data sets
should be established in every linkage jurisdiction.
The feasibility of data linkage of these data sets
was demonstrated.

92
10.2. Comparison of the Innovative Care Rehabilitation Services pilot
and the National Evaluation of the Transition Care Program Table 10.2 presents a comparison of the findings from the ICRS report and the present NETCP report.
Given that the ICRS evaluation was used to develop the TC funding model and the current evaluation of the
implementation phase has demonstrated that the costs are high, detailed comparisons of the two
approaches are included to assist policy makers’ assessments. There are many similarities between ICRS
and the NETCP. Both the demographics of the recipients and the functional changes that were achieved are
comparable. Differences between the two evaluations result from the sampling methodologies, the retention
rates of participants, and the approach to the economic evaluation. The strength of the ICRS evaluation is
the significantly richer data for the TC experience, in terms of the characteristics of the services, the type,
and duration of therapy. In contrast, the NETCP was able to sample and follow-up a large percentage of TC
recipients which provides a more comprehensive picture of the outcomes of TC.
The two reports used different approaches to the economic evaluation. Strong assumptions concerning
residential aged care use were inherent in the ICRS report, and their conclusion heavily relies on the
assumption that in the absence of TC, people would have received residential aged care for the entire
period. In contrast, the NETCP compared program costs and cost offsets for TC recipients and people
approved for CACP, and this showed that only 28% of TC recipients were admitted to residential aged care
in the six months post ACAT approval. A fuller description of the differences is presented in Appendix 2.
Finally, the analysis of the linked datasets gave many opportunities for analysing the health outcomes of
both TC recipients and other frail older people who had recently been hospitalized. As noted by Kelman,
Bass and Holman (Kelman, Bass et al. 2002), the increasing number and availability of health data
resources in Australia provides an opportunity for significant advances in the monitoring and evaluation of
health outcomes, and thus could lead to improvements in the quality of health care. The investment in the
national ‘Population health and clinical data linkage’ funded from the National Collaborative Research
Infrastructure Strategy will help to realize the full potential of health data linkage in evaluations of new health
services and programs such as the TCP. A data linkage approach is particularly attractive in evaluations that
involve older groups of people, because cognitive and other health issues can lead to significant difficulties in
interviewing a representative sample of people. Further analysis of the linked data sets from the national
evaluation will help to fully realize the potential that exists with this approach.
This evaluation of the implementation phase of TC provides evidence that the current TC model is reaching
an appropriate group and delivering positive outcomes, our estimates around program efficiency suggest that
piloting of different interventions, and different delivery approaches with rigorous economic evaluations
should be considered.

93
Table 10.2: Comparison between the results from the National Evaluation of Innovative Care Rehabilitation Services and the National Evaluation of the Transition Care Program
Item ICRS NETCP Comment
Sample • 2001-2004
• 1,810 completed episodes
• 170 excluded from the analysis
as they did not meet eligibility
criteria
• Final dataset 1,640 episodes
• 2006-2007
• 3,206 ACAT approvals for TC
• Final linked data available for
2,443
• 879 Control 1.
• 2,188 Control 2.
• ICRS sample of 907 represents
55% of eligible episodes
• NETCP sampled 76% of TC
approvals
Follow-up and retention • 3 months post discharge
• 6 months post discharge
• At discharge n= 907
• 3 month n=350
• 6 month n=309
• 3 months post ACAT approval
• 6 months post ACAT approval
• All 2,443 recipients included
• ICRS retention rate was 39% at 3
months and 34% at 6 months
Demographics
• 70% female
• Mean age 81.5 years
• 46% had a carer
• 64% aged 80+
• 64% female
• Mean age 82.2 years
• 41% had a co-resident carer
• 61% aged 80+
• The groups appear similar
(continued)

94
Table 10.2 (continued): Comparison between the results from the National Evaluation of Innovative Care Rehabilitation Services and the National Evaluation of the Transition Care Program
Item ICRS NETCP Comment
Service characteristics • Community 54.9 mins/day
• Residential 38.7 mins/day
• Combination 60.3 mins/day
• 1203 Community places
• 1026 Residential places
• 213 Combination places
• Comparable data on therapy time
per day not available
Functional Change (as measured
using the MBI at admission and
discharge for the TC episode)
• Overall
Mean admission MBI 67.3
Mean discharge MBI 79.1
• Community
Mean admission MBI 77.1
Mean discharge MBI 85.8
• Residential
Mean admission MBI 60.5
Mean discharge MBI 72.3
• Overall
Mean admission MBI 64.3
Mean discharge MBI 76.9
• Community
Mean admission MBI 73.7
Mean discharge MBI 84.8
• Residential
Mean admission MBI 51.1
Mean discharge MBI 65.0
• Overall the groups appear
similar, however, the functional
status at entry of residential-
based TC and community-based
TC recipients in the NETCP
appears lower than the ICRS
sample
Hospital Readmission
(one or more times in the follow-up
period)
• 3 months follow-up
Overall 21%
• 6 month follow-up
Overall 22%
• A breakdown by type of TC was
not presented in the ICRS report
• 3 months post ACAT approval
Overall 37%
Community 39%
Residential 35%
• 6 months follow-up
Overall 47%
Community 51%
Residential 43%
• ICRS used self-reported data for
hospital readmissions which may
have underestimated the true
incidence
(continued)

95
Table 10.2 (continued): Comparison between the results from the National Evaluation of Innovative Care Rehabilitation Services and the National Evaluation of the Transition Care Program
Item ICRS NETCP Comment
Living at home at follow-up • 3 months follow-up
Overall 81.6%
• 6 months follow-up
Overall 81.5%
• A breakdown by type of TC was
not presented in the ICRS report
• 3 months post ACAT approval
Overall 78%
Community 96%
Residential 55%
• 6 months post ACAT approval
Overall 70%
Community 93%
Residential 42%
• The difference between ICRS
and NETCP possibly reflects the
higher proportion of community-
dwelling TC recipients in ICRS
Economic analysis • Cost-benefit approach
• Residential costs $236 per day or
10,500 per episode
• Community costs $86 per day
(5,300 per episode)
• Overall cost benefit of 4.7 million
in savings
• Cost-effectiveness approach
• Taking into account costs of
hospital readmissions and
residential aged care admissions
in the follow-up period, at six
months post ACAT approval TC
cost $344 per additional day of
survival without institutional care
compared with Control 2
• Two different approaches were
used. ICRS implicitly assumed
that the average 65 day LOS in
TC would have been spent
entirely in residential aged care in
the absence of TC. Hospital
costs were not taken into account
in ICRS

96
10.3. Areas for future work A number of areas have been identified as important for further work that may lead to improvements in the
TCP:
i. There is considerable uncertainty around the effectiveness and resource implications of model
configurations and delivery approaches. This evaluation failed to produce information on the impact on
costs of different governance and brokerage arrangements across Australia and their impact on costs. A
detailed economic analysis of differing models of delivery (e.g. voucher system versus conventional TC)
which included Medicare Australia data items at an individual level would significantly contribute to a
better understanding of key areas of decision-making uncertainty.
ii. Modelling could be undertaken to assess costs by week to explore the MBI shifts per week. Exploration
of ideal lengths of stay could be undertaken e.g. can you truncate the episode cost without losing the
effect?
iii. Very little qualitative data was collected in this evaluation and very little information was available on the
differences in the approach to implementation which occurred in each state. It is unclear what role the
state policy makers and context had on the approach. The definition of the target population, approach
to assessment, care planning, and composition of the teams differed substantially in each state. There
was no information on the background services against which the program was introduced or on barriers
to success. Finally, there was no information on which organizational structures appeared to work well
or on processes e.g. what happened when deteriorations occurred, which might have informed our
understanding of the readmission rates. Overall, there appeared to be poor engagement with GPs and
local hospital elderly care units – it is unclear why. Information on these issues would enhance
development of the program.
iv. More work on appropriate outcomes should be undertaken. Using the model of outcomes put forward by
Qureshi (Qureshi, Patmore et al. 1998) where there are three types of outcomes, namely change
outcomes, maintenance outcomes, and process outcomes, the program is currently very focused on
change outcomes. Inclusion of additional outcomes of relevance to older people such as being able to
go out or having an appropriate environment should be explored. More work on quality indicators for
these types of services is required.
v. Further investigation of the types of intervention that should be offered is necessary. For example, case
management may have been a key intervention with navigation provided through the complex health and
social care systems providing information on referrals and ensuring that follow-up care occurred.
Evidence on this approach from the UK and US is mixed but reviews could be sought to assist in
evaluating the approach.
vi. Work could be undertaken to gain a better understanding of readmissions in the frail elderly. UK data
suggests that there is no stable pool of “frequent flyers”. A cohort of patients with two unplanned
admissions in a year reverts over four years to the same level of unplanned readmissions for that age
group (Roland, Dusheiko et al. 2005). It is not clear what happens in Australia and information on this
issue would inform interventions.
vii. TC delivered in a residential setting generally needed more investigation as there is much uncertainty
around this model e.g. the types of cases who benefit most, appropriate staffing levels and
competencies, quality approaches.

97
10.4. Summary This evaluation of the implementation phase found evidence that TC is improving the experiences of older
people at the interface between acute and aged care services. Individual outcomes are improving and
system processes are evolving. Meeting the needs of the ageing population cost effectively without
compromising on quality is difficult and it appears at this stage the program is trading off higher costs to
ensure quality services which is a reasonable approach for a new program focusing on vulnerable older
people. Over time efficiencies are very likely and evaluation of costs at a later date with longer follow-up
(e.g. 12 months) and greater coverage (e.g. medications) would very likely show reductions in the costs.
There were surprising differences between jurisdictions in the availability of subacute rehabilitation and
geriatric services which did affect the implementation, as TC was often required to fill a pre-existing gap in
state and territory services. This does raise questions about the level of improvement that can be made by
simply adding one program and whether a larger review of post acute services may be necessary. The risk
of setting up an additional post acute silo has been identified and evidence provided on queues and
inconsistent case selection across jurisdictions. Nevertheless our evaluation found that the program has
made a significant contribution to post acute options for older people and appears to be successfully
assisting older people to stay living independently in the community.

98
11. References
Anonymous (2008). "Who cares for the elderly?" Lancet 371(9617): 959.
Australian Government Department of Health and Ageing (2005). "Transition Care Program Guidelines."
Department of Health and Ageing, Canberra, Australia.
Australian Government Department of Health and Ageing (2007). "Securing the future of aged care for
Australians." Department of Health and Ageing, Canberra, Australia.
Australian Health Ministers' Advisory Council (2004). "From hospital to home: Improving care outcomes for
older people." Victorian Department of Human Services, Melbourne, Australia.
Australian Institute of Health and Welfare (2005). "METeOR: Metadata online registry (Hospital service - care
type, code)." Australian Institute of Health and Welfare, Canberra, Australia
http://meteor.aihw.gov.au/content/index.phtml/itemId/270174.
Australian Institute of Health and Welfare (2007). "Older Australians in hospital. Bulletin 53, Cat. No. AUS
92." Australian Institute of Health and Welfare, Canberra, Australia.
Ayis, S., R. Gooberman-Hill, et al. (2006). "Predicting catastrophic decline in mobility among older people."
Age & Ageing 35(4): 382-7.
Battersby, M., P. Harvey, et al. (2007). "SA HealthPlus: a controlled trial of a statewide application of a
generic model of chronic illness care." Milbank Quarterly 85(1): 37-67.
Beland, F., H. Bergman, et al. (2006). "Integrated services for frail elders (SIPA): a trial of a model for
Canada." Canadian Journal on Aging 25(1): 5-42.
Beswick, A. D., K. Rees, et al. (2008). "Complex interventions to improve physical function and maintain
independent living in elderly people: a systematic review and meta-analysis." Lancet 371(9614):
725-35.
Black, D. A. (2007). "Case management for elderly people in the community." BMJ 334(7583): 3-4.
Bodenheimer, T., K. Lorig, et al. (2002). "Patient self-management of chronic disease in primary care." JAMA
288(19): 2469-75.
Branch, L. G., R. F. Coulam, et al. (1995). "The PACE evaluation: initial findings." Gerontologist 35(3): 349-
59.
Buntin, M. B. (2007). "Access to postacute rehabilitation." Archives of Physical Medicine & Rehabilitation
88(11): 1488-93.
Byles, J. E., M. Tavener, et al. (2004). "Randomised controlled trial of health assessments for older
Australian veterans and war widows." Medical Journal of Australia 181(4): 186-90.
Cameron, I. D. and O. Davies (2007). "Transition Care: what is it and what are its outcomes?" Medical
Journal of Australia 187(3): 197-8.

99
Carpenter, I., J. R. Gladman, et al. (2002). "Clinical and research challenges of intermediate care." Age &
Ageing 31(2): 97-100.
Centers for Medicare and Medicaid Services (2006). "Post-acute care reform plan." Centers for Medicare
and Medicaid Services, Baltimore, US
http://www.cms.hhs.gov/SNFPPS/Downloads/pac_reform_plan_2006.pdf.
Chappell, N. L., B. H. Dlitt, et al. (2004). "Comparative costs of home care and residential care."
Gerontologist 44(3): 389-400.
Chen, Q., R. L. Kane, et al. (2000). "The cost effectiveness of post-acute care for elderly Medicare
beneficiaries." Inquiry 37(4): 359-75.
Close, J., M. Ellis, et al. (1999). "Prevention of falls in the elderly trial (PROFET): a randomised controlled
trial." Lancet 353(9147): 93-7.
Coleman, E. A. (2003). "Falling through the cracks: challenges and opportunities for improving transitional
care for persons with continuous complex care needs." Journal of the American Geriatrics Society
51(4): 549-55.
Coleman, E. A., C. Boult, et al. (2003). "Improving the quality of transitional care for persons with complex
care needs." Journal of the American Geriatrics Society 51(4): 556-7.
Coleman, E. A., E. Mahoney, et al. (2005). "Assessing the quality of preparation for posthospital care from
the patient's perspective: the care transitions measure." Medical Care 43(3): 246-55.
Coleman, E. A., C. Parry, et al. (2007). "The central role of performance measurement in improving the
quality of transitional care." Home Health Care Services Quarterly 26(4): 93-104.
Council of Australian Government (1995). "Task force on health and community services. Health and
community services: meeting people's needs better. A discussion paper." Commonwealth of
Australia, Canberra.
Crotty, M., C. H. Whitehead, et al. (2005). "Transitional care facility for elderly people in hospital awaiting a
long term care bed: a randomised controlled trial." Br Med J 331(7525): 1110-1113.
Daff, D., J. M. Stepien, et al. (2006). "Moving from hospital to a transitional care unit: carers' views."
Qualitative Health Research 16(2): 189-205.
Dale, S. B. and R. S. Brown (2007). "How does Cash and Counseling affect costs?" Health Services
Research 42(1 Pt 2): 488-509.
Department of Health and Ageing (2005). "National evaluation of the Innovative Care Rehabilitation Services
(ICRS) pilot program." Canberra Department of Health and Ageing.
Department of Health and Ageing (2008). "Transition Care Program COGNOS database." Department of
Health and Ageing, Canberra, Australia.
Dwyer, J. and T. Jackson (2001). "Literature review: Integrated bed and patient management." Department
of Human Services Victoria.
Dy, S. and J. Lynn (2007). "Getting services right for those sick enough to die." BMJ 334(7592): 511-3.

100
Eagar, K., R. Gordon, et al. (2001). "The Australian Sub-Acute and Non-Acute patient Classification (AN-
SNAP): report on the National Sub-Acute and Non-Acute Casemix Study." Centre for Health Service
Development, University of Wollongong.
Esterman, A. J. and D. I. Ben-Tovim (2002). "The Australian coordinated care trials: success or failure? The
second round of trials may provide more answers." Medical Journal of Australia 177(9): 469-70.
Evans, R. L., R. T. Connis, et al. (1995). "Multidisciplinary rehabilitation versus medical care: a meta-
analysis." Social Science & Medicine 40(12): 1699-706.
Freedman, V. A., N. Hodgson, et al. (2006). "Promoting declines in the prevalence of late-life disability:
comparisons of three potentially high-impact interventions." Milbank Quarterly 84(3): 493-520.
Fried, L. P., L. Ferrucci, et al. (2004). "Untangling the concepts of disability, frailty, and comorbidity:
implications for improved targeting and care." Journals of Gerontology Series A-Biological Sciences
& Medical Sciences 59(3): 255-63.
Gadzhanova, S. and R. Reed (2007). "Medical services provided by general practitioners in residential aged-
care facilities in Australia." Medical Journal of Australia 187(2): 92-4.
Glendinning, C., S. Clarke, et al. (2008). "Progress and problems in developing outcomes-focused social
care services for older people in England." Health & Social Care in the Community 16(1): 54-63.
Godfrey, M., J. Keen, et al. (2005). "An evaluation of Intermediate Care for older people." Institute of Health
Sciences and Public Health Research Leeds, UK.
Gravelle, H., M. Dusheiko, et al. (2007). "Impact of case management (Evercare) on frail elderly patients:
controlled before and after analysis of quantitative outcome data." BMJ 334(7583): 31.
Gray, L., M. Dorevitch, et al. (2002). "Service provision for older people in the acute-aged care system."
Victorian Department of Human Services, Melbourne, Australia.
Gray, L. C., C. M. Travers, et al. (2008). "Transition care: will it deliver?" Medical Journal of Australia 188(4):
251-3.
Gross, D. L., H. Temkin-Greener, et al. (2006). "The growing pains of integrated health care for the elderly:
Lessons from the expansion of PACE." Milbank Quarterly 82(2): 257-82.
Harrington, C., C. Cassel, et al. (1991). "A national long-term care program for the United States. A caring
vision. The Working Group on Long-term Care Program Design, Physicians for a National Health
Program." JAMA 266(21): 3023-9.
Hebert, R., P. J. Durand, et al. (2003). "PRISMA: a new model of Integrated Service Delivery for the frail
older people in Canada." International Journal of Integrated Care 3: e08.
Heggestad, T. (2002). "Do hospital length of stay and staffing ratio affect elderly patients' risk of
readmission? A nation-wide study of Norwegian hospitals." Health Services Research 37(3): 647-65.
Hofmarcher, M. M., H. Oxley, et al. (2007). "Improved health system performance through better care
coordination." OECD Health Working Paper No. 30.

101
Hughes, S. L., A. Ulasevich, et al. (1997). "Impact of home care on hospital days: a meta analysis." Health
Services Research 32(4): 415-32.
Hutt, R., R. Rosen, et al. (2004). "Case-managing long-term conditions: What impact does it have in the
treatment of older people?" King's Fund, London, UK.
Kane, R. L. (2007). "Assessing the effectiveness of postacute care rehabilitation." Archives of Physical
Medicine & Rehabilitation 88(11): 1500-4.
Kane, R. L., Q. Chen, et al. (1998). "Functional outcomes of posthospital care for stroke and hip fracture
patients under medicare." Journal of the American Geriatrics Society 46(12): 1525-33.
Kane, R. L., M. Finch, et al. (1996). "Use of post-hospital care by Medicare patients." Journal of the
American Geriatrics Society 44(3): 242-50.
Kane, R. L., W.-C. Lin, et al. (2002). "Geographic variation in the use of post-acute care." Health Services
Research 37(3): 667-82.
Kaplan, S. J. (2007). "Growth and payment adequacy of medicare postacute care rehabilitation." Archives of
Physical Medicine & Rehabilitation 88(11): 1494-9.
Kardamanidis, K., K. Lim, et al. (2007). "Hospital costs of older people in New South Wales in the last year of
life." Medical Journal of Australia 187(7): 383-6.
Kauh, B., T. Polak, et al. (2005). "A pilot study: post-acute geriatric rehabilitation versus usual care in skilled
nursing facilities." Journal of the American Medical Directors Association 6(5): 321-6.
Kelman, C. and L. Smith (2000). "It's time: record linkage--the vision and the reality." Australian & New
Zealand Journal of Public Health 24(1): 100-1.
Kelman, C. W., A. J. Bass, et al. (2002). "Research use of linked health data - a best practice protocol."
Australian and New Zealand Journal of Public Health 26: 251-255.
Kodner, D. L. and C. K. Kyriacou (2003). "Bringing managed care home to people with chronic, disabling
conditions: prospects and challenges for policy, practice, and research." Journal of Aging & Health
15(1): 189-22.
Kramer, A. M., J. F. Steiner, et al. (1997). "Outcomes and costs after hip fracture and stroke. A comparison
of rehabilitation settings." JAMA 277(5): 396-404.
Leutz, W. N. (1999). "Five laws for integrating medical and social services: lessons from the United States
and the United Kingdom." Milbank Quarterly 77(1): 77-110.
Lim, W. K., S. F. Lambert, et al. (2003). "Effectiveness of case management and post-acute services in older
people after hospital discharge." Medical Journal of Australia 178(6): 262-6.
Liu, Z., P. Braun, et al. (2001). "The probability of using an aged care home over a lifetime. AIHW cat, no.
AGE 21." Australian Institute of Health and Welfare, Canberra, Australia.
Lunney, J. R., J. Lynn, et al. (2002). "Profiles of older medicare decedents." Journal of the American
Geriatrics Society 50(6): 1108-12.

102
Murray, S. A., M. Kendall, et al. (2005). "Illness trajectories and palliative care." BMJ 330(7498): 1007-11.
National Evaluation of the Transition Care Program (2007a). "Models of Transition Care." Department of
Health and Ageing, Canberra, Australia.
National Evaluation of the Transition Care Program (2007b). "Recipient Snapshot Study." Department of
Health and Ageing, Canberra, Australia.
National Evaluation of the Transition Care Program (2007c). "Regional Characterization Report." Department
of Health and Ageing, Canberra, Australia.
National Evaluation of the Transition Care Program (2008). "Data Linkage Components: Controlled
Comparison Study, Costs and Effects Study." Department of Health and Ageing, Canberra,
Australia.
Naylor, M. D., D. Brooten, et al. (1999). "Comprehensive discharge planning and home follow-up of
hospitalized elders: a randomized clinical trial." JAMA 281(7): 613-20.
Neu, C. R., S. Harrison, et al. (1989). "Medicare patients and post-acute care: Who goes where? Report no.
R-3780-MN." Rand Corp, Santa Monica, US.
Parker, G., P. Bhakta, et al. (2000). "Best place of care for older people after acute and during subacute
illness: a systematic review." Journal of Health Services & Research Policy 5(3): 176-89.
Parker, S. G., S. D. Lee, et al. (2004). "The benefits of joined up care: Coordinated discharge procedures in
the elderly." Evidence-Based Healthcare and Public Health 8(6): 323-4.
Parker, S. G., S. M. Peet, et al. (2002). "A systematic review of discharge arrangements for older people."
Health Technology Assessment (Winchester, England) 6(4): 1-183.
Pit, S. W., J. E. Byles, et al. (2007). "A Quality Use of Medicines program for general practitioners and older
people: a cluster randomised controlled trial." Medical Journal of Australia 187(1): 23-30.
Preen, D. B., B. E. S. Bailey, et al. (2006). "Willingness of general practitioners to participate in enhanced
primary care discharge care planning." Medical Journal of Australia 184(2): 90-1.
Qureshi, H., C. Patmore, et al. (1998). "Outcomes in community care practice. Overview: Outcomes of social
care for older people and carers. Report no. 5." Social Policy Research Unit, University of York,
York, UK.
Rigby, D. (2006). "Residential MMRs leading the way [Pharmacists have been remunerated for Residential
Medication Management Reviews (RMMRs) by the Australian government since 1997]." Australian
Pharmacist 25(10): 766-70.
Roland, M., M. Dusheiko, et al. (2005). "Follow up of people aged 65 and over with a history of emergency
admissions: analysis of routine admission data." BMJ 330(7486): 289-92.
Rolland, Y., F. Pillard, et al. (2007). "Exercise program for nursing home residents with Alzheimer's disease:
a 1-year randomized, controlled trial." Journal of the American Geriatrics Society 55(2): 158-65.
Shepperd, S. and S. Iliffe (1998). "The effectiveness of hospital at home compared with in-patient hospital
care: A systematic review." Journal of Public Health Medicine 20(3): 344-50.

103
Sherman, F. T. (2006). "Don't let transitional care fall through the cracks." Geriatrics 61(4): 9-10.
Shortus, T. D., M. L. Coulson, et al. (2005). "An aged care liaison nurse can facilitate care planning using the
Enhanced Primary Care items." Australasian Journal on Ageing 24(2): 67-8.
Steering Committee for the Review of Government Service Provisions (2007). "Report on Government
Services 2007." Productivity Commission, Canberra, Australia.
Stone, R. I. (2000). "Long-term care for the elderly with disabilities: current policy, emerging trends, and
implications for the twenty-first century." Milbank Memorial Fund, New York, USA.
Stott, D. J., P. Langhorne, et al. (2008). "Multidisciplinary care for elderly people in the community." Lancet
371(9614): 699-700.
Stuck, A. E., A. L. Siu, et al. (1993). "Comprehensive geriatric assessment: a meta-analysis of controlled
trials." Lancet 342(8878): 1032-6.
Stuck, A. E., J. M. Walthert, et al. (1999). "Risk factors for functional status decline in community-living
elderly people: a systematic literature review." Social Science & Medicine 48(4): 445-69.
Tappen, R. M., K. E. Roach, et al. (2000). "Effect of a combined walking and conversation intervention on
functional mobility of nursing home residents with Alzheimer disease." Alzheimer Disease &
Associated Disorders 14(4): 196-201.
United Health Europe (2005). "Assessment of the Evercare Programme in England 2003-2004." Department
of Health, London, UK.
Wagner, E. H., B. T. Austin, et al. (2001). "Improving chronic illness care: translating evidence into action."
Health Affairs 20(6): 64-78.
Walker, A. and C. Hennessy (2004). "Growing older: Quality of life in old age." Open University Press,
Maidenhead.
Weaver, F. M., E. C. Hickey, et al. (2008). "Providing all-inclusive care for frail elderly veterans: evaluation of
three models of care." Journal of the American Geriatrics Society 56(2): 345-53.

104
Appendix 1
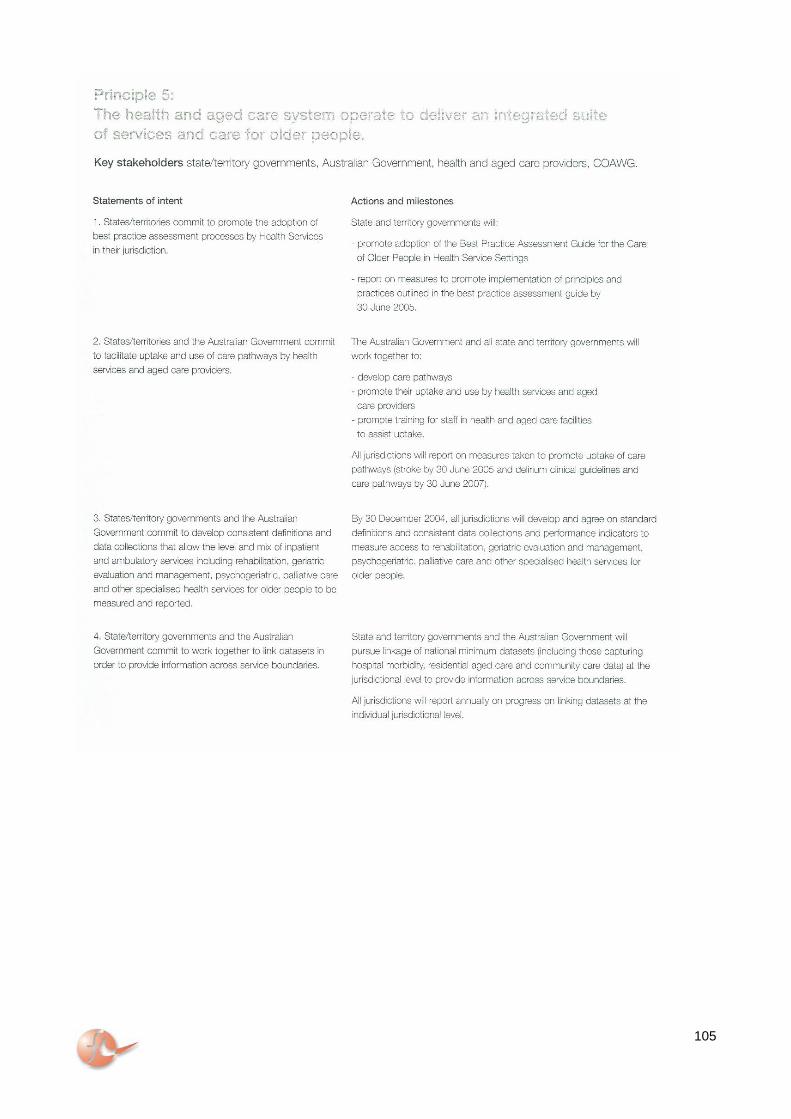
105

106
Appendix 2 The analysis of incremental costs in the ICRS report is based on pre-post estimates of:
(i) Direct costs on number of days and “pilot program derived” costs per day of ICRS Residential Aged
Care and ICRS Community Aged Care.
(ii) Incremental cost offsets for residential aged care use on observed number of days in residential
aged care in ICRS less an assumption (rather than evidence from a comparator) based estimate of
days in residential aged care without ICRS.
The cost per day in i) averages out to $149.75 per day of ICRS care over 106,601 observed days in ICRS
(65.00 = 106601/1640 days/patient), with “pilot derived” program costs of $86 per day for 45,302 days in
ICRS in a community-based setting and $236 per day for 61,299 days in ICRS in a residential-based setting.
The $9,733 ($15,962,986/1640) direct costs per person presented in the ICRS report implicitly would
increase to an average of $13,901 per person ($22,797,690/1640) if the daily cost was estimated at $213.86
(i.e. twice the 2006/07 flexible care subsidy).
To estimate the incremental residential aged care costs up to three months, the ICRS analysis implicitly
assumed that the number of additional days in residential aged care exactly matched the number of
additional days of ICRS, with 106,601 additional days saved (106,601 = “48,573 high care” plus “58,028 low
care”). That is, it is assumed that up to three months the average 65.00 days of ICRS per person would all
have been spent in residential aged care in the absence of ICRS. However, a high proportion of patients
without ICRS end up in the community and there are a proportion of patients who despite ICRS for three
months end up in residential aged care.
Evidence relative to a real comparator group in our study suggests that while the 65 days of stay in
Transition Care per person reported in the ICRS study is reasonable, residential aged care use can be
expected to be reduced by only 8.10 days (9.52 vs. 1.42 days) up to three months or approximately one
eighth of the 65 days assumed. Hence with an evidence-based, rather than assumption-based, estimate of
the number of days in residential aged care, and the same assumption about the proportion and cost per day
of residential days in high and low care, incremental cost savings from reduced residential aged care up to
three months are reduced from $10.426 million ($6.654 million in high care and $3.772 million in low care) to
$1.299 million. Brought back to a per person estimate, the cost saving reduce from $6,358 per person to
$792 per person.
However, this may still overestimate of the cost savings, given that the ICRS report did not use the seven
distinct Resident Classification Scale (RCS) subsidies but a dichotomy of high/low. If the difference in
payment is estimated using the full spectrum of RCS amounts, then this gives an estimate in cost saving of
$467 per person ($587 vs. $120) with the reduction in residential aged care use from 9.52 to 1.42 days. This
equates to a reduction of $0.766 million across 1640 people. Hence cost offsets to 3 months may be
overestimated by $5,891 ($6,358-$467) per person or $9.66 million across 1640 individuals.

107
Similar issues arose in the analysis of six months follow-up in the ICRS report. The modelled assumption-
based estimate of cost savings from modelled reduction in use of residential aged care days appear to have
been based on an even stronger assumption about the reduction in average residential aged care from three
to six months than that up to three months (i.e. greater than 65 days). An evidence-based, rather than
assumption-based, estimate from the current study suggests that at six months residential aged care use is
reduced by 15.55 days (24.22 vs. 6.67 days) and $866 per person ($1,437 vs. $571). Hence, from 3 to 6
months there is estimated to be a reduction in residential days of 7.45 days (15.55-8.10) and $399 per
person. Consequently, the assumption-based cost saving from reduced residential aged care of $7,750 per
person and $12.7 million for 1,640 people from 3 to 6 months is reduced to $399 per person and $0.654
million.
Another important difference between NETCP and ICRS is the follow-up period. The ICRS reported on
interviews at three and six months post discharge from the ICRS program, whereas the follow-up period in
the NETCP was three and six months post approval.
In summary, in the ICRS report the direct costs are possibly underestimated by $6.84 million or $4,168 per
person in having an average total cost per patient of $149.75 rather than $213.86 per patient and residential
aged care cost offsets are possibly overestimated by $9.66 million in the three month follow-up period and
$12.05 million in the six month follow-up period across the population of 1640 individuals, when using
evidence rather than assumption based estimates of number of residential aged care days avoided. Hence
the total incremental cost estimate is increased by $28.55 million ($17,410 per person) from that estimated in
the ICRS report.

108
Appendix 3 Episodes of care definition according to the Meteor data dictionary
Hospital service—care type, code N[N].N Identifying and definitional attributes Metadata item type: Data Element
Short name: Care type
METeOR identifier: 270174
Registration status: Health, Standard 01/03/2005
Definition: The overall nature of a clinical service provided to an admitted patient during
an episode of care (admitted care), or the type of service provided by the
hospital for boarders or posthumous organ procurement (other care), as
represented by a code.
Data Element Concept: Hospital service—care type
Value domain attributes Representational attributes Representation class: Code
Data type: Number
Format: N[N].N
Maximum character length: 3
Permissible values: Value Meaning
1.0 Acute care (Admitted care)
2.0 Rehabilitation care (Admitted care)
2.1 Rehabilitation care delivered in a designated unit (optional)
2.2 Rehabilitation care according to a designated program
(optional)
2.3 Rehabilitation care is the principal clinical intent (optional)
3.0 Palliative care
3.1 Palliative care delivered in a designated unit (optional)
3.2 Palliative care according to a designated program (optional)
3.3 Palliative care is the principal clinical intent (optional)
4.0 Geriatric evaluation and management
5.0 Psychogeriatric care
6.0 Maintenance care
7.0 Newborn care
8.0 Other admitted patient care
9.0 Organ procurement - posthumous (Other care)
10.0 Hospital boarder (Other care)
![TUNISIA TRANSITION INITIATIVE FINAL EVALUATION · FINAL EVALUATION [This page has been intentionally left blank.] TUNISIA TRANSITION INITIATIVE (TTI) FINAL EVALUATION REPORT JUNE](https://img.pdfslide.us/doc/110x75/5ed87cb086e3a10d342b8c8b/tunisia-transition-initiative-final-evaluation-final-evaluation-this-page-has-been.jpg)