Embed Size (px)
Citation preview

National Drought Management Authority
LAMU COUNTY
DROUGHT MONITORING AND EARLY WARNING SYSTEM BULLETIN –
JANUARY 2014
DROUGHT EARLY WARNING STAGE/TRENDS
Seasonal Calendar
LIVELIHOOD
ZONE
WARNING
STAGE
TREND
Fishing and
Harvesting
Alert Worsening
Pastoral Farming Alert Worsening
Mixed Farming
Food/Cash
Alert
Worsening
Mixed Farming
Cash/Food
Alert Worsening
Short rains
harvests
Short dry
spell
(Current)
Long Rains
Planting/Weeding
Pest Control
Spraying
Long rains
harvests
A long dry spell
Land preparation
Short rains
Planting/weeding
Jan Feb Mar Apr May June Jun Jul Aug Sept Oct Nov Dec
HINDI
WITU
KIUNGA
MPEKETONI
AMU
FAZA KIZINGITINI
Lamu County Drought Early Warning Status/Trend for January 2014
0 10 20 30 40 5 Kilometers
Key Fishing and Harvesting
Mixed Farming:Cash
Mixed Farming: Food Crop/Livestock
Pastoral
Urban
Disclaimer: The boundaries and designations on this map do not imply official endorsement or acceptance - by NDMA-LAMU
Alert: Worsening
Alert: Worsening Alert: Worsening
Alert: Worsening

Situation Overview
Dry weather conditions prevailed throughout the month of under review. An average
of 4.5 mm was recorded within the month of January for the whole county. There was
18mm of rainfall recorded for 2 days in Witu division. The rest of the county did not
record any rainfall.
The main source of water during the month was shallow wells accounting for about
41.67% followed by bore holes (33.33%). Natural rivers, lakes and traditional wells
each accounted for 8.33%.
There has been water shortage, especially in the eastern side of the county. Water
trucking is being conducted to Kiunga by Coast Water Services Board in
collaboration with the county government About 2,000 people are benefitting from
this intervention so far. However, this number may increase as the drought
progresses. Island areas such as Faza, Ndau and Kizingitini remain water-stressed.
About 500 households are affected in the three islands, and the situation could get
worse if no intervention takes place. Water levels in shallow wells have reduced;
Volumes of water in earth pans have depleted by almost 70%. The remaining quantity
is expected to last human, livestock and wildlife for about one month in Koreni and
Pangani areas which are situated in Pastoral livelihood zone of Witu ward. Already,
approximately 15,000 heads of cattle and 800 households are affected and will soon
have no water if interventions are not undertaken in the next four weeks.
Grazing distances increased slightly from 2.65 km in December to 2.85 km. This
increase in distance could be attributed to the prevailing dry weather conditions which
necessitate the livestock to seek pastures farther afar.
The pasture and browse in the county have deteriorated both in quality and quantity in
most areas in the county. This could be attributed to overconsumption of pastures that
had regenerated following the short rains by both the in-migrating and resident herds
as well as by wildlife. Late onset and early cessation of the rains combined with the
heat generated by the current hot weather have also contributed to the present poor
state of the pasture and browse conditions.
Pasture and browse is expected to last for a period of one month in Hindi, Bargoni
and Mpeketoni where regeneration occurred following late rains in December,
whereas the whole eastern zone of the county lacks pasture because of failure of the
short rains.
Household watering distances increased from 1.58 km to 2.68 km against a long term
mean of 1.56 Km. Residents have been forced to seek water farther as the shallow
well water levels continue to reduce due to the progressing drought condition.
Average medium-sized bull price for the month of January was Ksh 12,199. This
figure was above the year (2006-2013) long term mean of Ksh.9, 522. The prices
have dipped since December price of Ksh.13, 008 perhaps due to the worsening body
condition as the drought progresses.
Goat prices rose to Ksh. 2,975 up from Ksh 2,899 recorded in December. This price
was higher than the long term average of Ksh.1, 628 experienced around this time of
the year. Goat prices remained relatively stable, perhaps, due to the on-going Maulidi
festivals within the county where a lot of animal slaughter is conducted.
Livestock body condition has continued to deteriorate considerably throughout the
month and could be said to be between fair and poor. This could be attributed to the
CURRENT

diminishing pastures following early cessation of the rains and the reduced quality of
both pasture and browse.
There is an outbreak of Newcastle disease in poultry in Baharini, Mpeketoni division
In- migration of herds from Tana delta to Didewaride has been noted. Herds from
Ijara and Garissa have also migrated into the county.
The average farm gate price of a 90kg bag of maize was KSh 2,857 up from Ksh.
2,830 recorded the previous month. This was way higher than the year (2006- 2013)
long-term average of KSh 2,127. The increase in maize prices could be attributed to
an increase in demand for the commodity as the stocks continue depleting. The crop
in the field has withered in most crop-growing areas as a result of the early cessation
of the rains and the continued dry weather conditions since the rains stopped. The
predicted output by the Ministry of Agriculture in this season is about 8 bags/acre
against a normal season harvest of 18-20 bags/acre
Beans prices also saw an increase from the previous amount of Ksh 7,758 recorded in
December to Ksh 7,851 recorded in January per 90 kg bag during the month of
January. This price is higher than the year 2006-2013 long term average of Ksh.
6,409 and this high cost can be attributed to the high demand for the commodity
versus the low stocks available.
Percentage of children under five years at risk of malnutrition was 3.63% down from
December’s 5.2% out of a total sample of 1440 children. This MUAC average was
lower than the 2006-2013 long term average of 5.01%. This improving trend could be
attributed to the increase in the number herds migrating into the county, which in turn
translates to an increase in milk supply and availability in the county, and Unimix
provided by ICRC recently especially in the fishing LZ areas has further helped
improve the situation.
Average milk production increased insignificantly from 0.81 litres/HH in December
to 0.83 litres/HH in January. This is in comparison with the (2006-2013) long-term
average of 0.77 litres per household is on the higher side.
The major sources of income within the county have not seen any drastic changes
with casual labour accounting for 53%, followed by petty trade at 17%, formal
employment at 10%, while sale of crops, sale of livestock products and remittance
accounted for 5%, 5% and 10% respectively.
The drought warning stage in the county for the month of January was alert with a
worsening trend.
Recommendations to KFSSG
Close monitoring of food stocks both in HHs and markets, close monitoring of food
and livestock prices.
Provision of home-based water treatment chemicals by MoH, Public Health dept and
other partners.
Support vitamin A supplement and deworming programmes in primary schools
within the county.
Support livestock disease surveillance, treatment and vaccination across the county.
Destocking in areas that are badly affected by the drought.
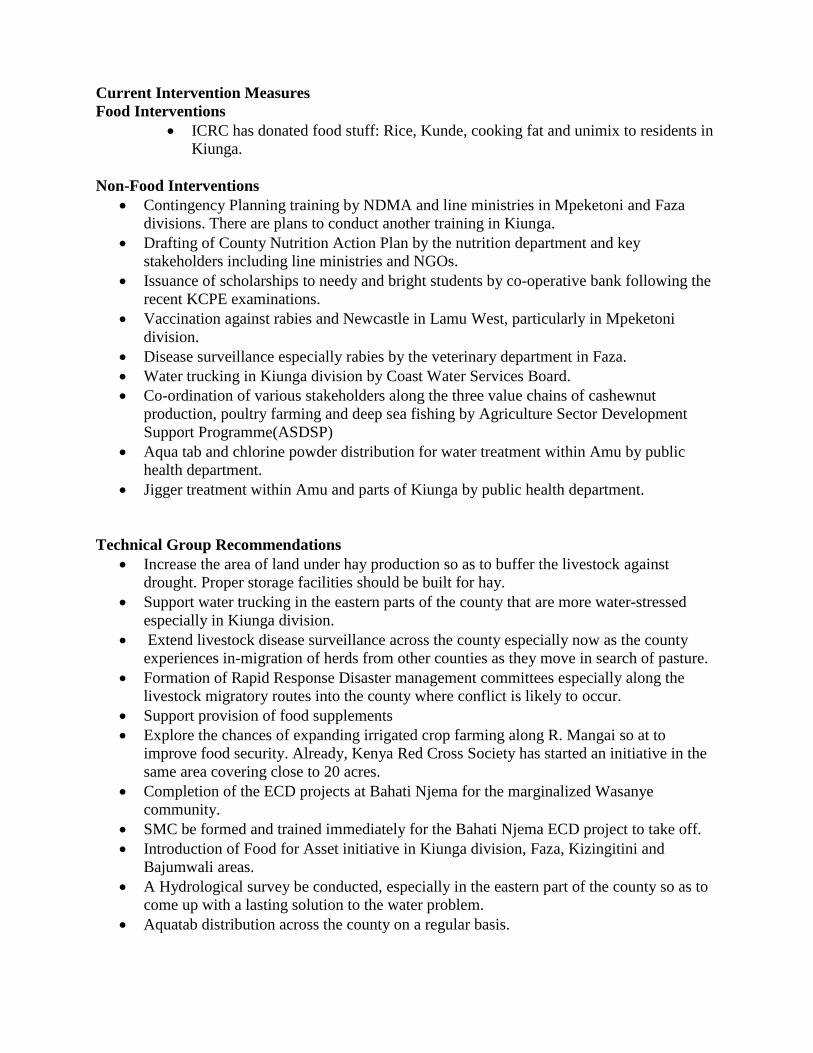
Current Intervention Measures
Food Interventions
ICRC has donated food stuff: Rice, Kunde, cooking fat and unimix to residents in
Kiunga.
Non-Food Interventions
Contingency Planning training by NDMA and line ministries in Mpeketoni and Faza
divisions. There are plans to conduct another training in Kiunga.
Drafting of County Nutrition Action Plan by the nutrition department and key
stakeholders including line ministries and NGOs.
Issuance of scholarships to needy and bright students by co-operative bank following the
recent KCPE examinations.
Vaccination against rabies and Newcastle in Lamu West, particularly in Mpeketoni
division.
Disease surveillance especially rabies by the veterinary department in Faza.
Water trucking in Kiunga division by Coast Water Services Board.
Co-ordination of various stakeholders along the three value chains of cashewnut
production, poultry farming and deep sea fishing by Agriculture Sector Development
Support Programme(ASDSP)
Aqua tab and chlorine powder distribution for water treatment within Amu by public
health department.
Jigger treatment within Amu and parts of Kiunga by public health department.
Technical Group Recommendations
Increase the area of land under hay production so as to buffer the livestock against
drought. Proper storage facilities should be built for hay.
Support water trucking in the eastern parts of the county that are more water-stressed
especially in Kiunga division.
Extend livestock disease surveillance across the county especially now as the county
experiences in-migration of herds from other counties as they move in search of pasture.
Formation of Rapid Response Disaster management committees especially along the
livestock migratory routes into the county where conflict is likely to occur.
Support provision of food supplements
Explore the chances of expanding irrigated crop farming along R. Mangai so at to
improve food security. Already, Kenya Red Cross Society has started an initiative in the
same area covering close to 20 acres.
Completion of the ECD projects at Bahati Njema for the marginalized Wasanye
community.
SMC be formed and trained immediately for the Bahati Njema ECD project to take off.
Introduction of Food for Asset initiative in Kiunga division, Faza, Kizingitini and
Bajumwali areas.
A Hydrological survey be conducted, especially in the eastern part of the county so as to
come up with a lasting solution to the water problem.
Aquatab distribution across the county on a regular basis.

Environmental indicators (Stability)
1.1 Rainfall
Amount of rainfall
The county remained dry for the major part of the month. An average of 4.5 mm was recorded
within the month of January for the whole county. There was 18mm of rainfall recorded for 2
days in Witu division. The rest of the county did not record any rainfall.
n=4
1.2 Condition of Natural Vegetation and Pasture
Quality
The pasture and browse quality in the county has deteriorated considerable over the past
one month. This is attributed to the continued dry weather and heat conditions.
Quantity
The pasture has decreased in quantity as a result of overconsumption by both resident
herds, wildlife and in-migrating herds from Garissa and Tana Delta.
Distance to Grazing Areas
Average grazing distance was 2.85 km, an increase from last month’s distance of 2.65 km. This
distance is more than the year 2008-2013 long-term average of 2.80 km. Fisheries livelihood
zone recorded a distance of 3 km, pastoral livelihood zone 3.7 Km, Mixed farming cash/food
crop livelihood zone 1.8 km while the mixed farming food/cash crop livelihood zone recorded
2.9 km. Water pans are currently at 70% depletion level. Some pastoralists have had to seek
water further to so as to avoid conflict over the scarce resource.
Lamu County Grazing distance distribution for year 2013 in Kilometers vs. 2008-13 long
term average

n=360
1.3 Water Sources and Availability
The main source of water during the month was shallow wells accounting for about
41.67% followed by bore holes (33.33%). Natural rivers, lakes and traditional wells
each accounted for 8.33 %.
These water sources have been replenished considerably after the start of the rains.
1.4 Water distances and Availability
Household watering distances increased from 1.58 km in the previous month to 2.68 km . This
compared with the long term mean of 1.65 Km is higher than usual. This average distance has
increased due to inconsistent rains in all livelihood zones, in addition to the continued dry
conditions. The Fishing and mangrove harvesting livelihood zone had an average distance of 3
km, while the mixed farming food/cash had a mean of 0.9 km and the mixed farming cash/food
zone recorded a distance of 1.8 Km.The pastoral livelihood zone had the highest distance of 5
km.

Lamu County average house hold water distance distribution for 2013 in kilometers vs.
2008-13 long term average.
Distance in km n=360
1.5 Emerging Issues
1.5.1 Insecurity/Conflict
There were cases of conflict in Mhamarani between pastoralists and farmers. The pastoralists
have driven some of their herds into the farming areas.
1.5.2 Migration
There has been migration of herds from both ends of the county. Some have come in from
Garissa County in the northern part of the county while others have come in from Tana Delta
into areas such as Didewaride in Witu division.
1.6 Implications on Food Security
Both pasture quality and quantity have deteriorated considerably in the past one month.
This is as a result of the prevailing dry conditions that continue to be witnessed in most
parts of the county. This has seen the body condition of livestock deteriorate and can be
said to be between fair and poor. The satellite herds within the county have led to an
increase in milk production. This has had a negative impact on food security.
The animals invading crop-growing areas will also have a negative impact on food
security by reducing the harvests.
2. Rural indicators (Food Availability)
2.1 Livestock Production
2.1.1 Livestock Body Condition
The livestock body condition for cattle and goats lies between fair and poor.
2.1.1 Livestock Diseases
There are suspected cases of rabies in livestock and Faza. The veterinary department is carrying
out surveillance.
There is an outbreak of Newcastle disease in Mpeketoni division. The veterinary department is
currently carrying out vaccinations.

2.1.2 Milk Production
Milk production increased from 0.81litres per household in December to 0.83 litres in January.
This is higher than the (2006-2012) long-term average of 0.77 litres per household.This increase
in milk production could be as a result of increase in the quantity of milk within the county as a
result of in-migration of herds from neighbouring counties. The increase in milk production
could have attributed to the reduction in cases of children at risk of malnutrition. The livestock
livelihood zone had an average production of 2.31 l/HH, whereas the mixed farming food/cash
crop livelihood zone had a mean of 0.59 l/HH with the mixed farming cash/food having an
average of 0.41 l/HH. While the fisheries livelihood zone had an average of 0.34 l/HH.
Graph of milk production is shown in the figure below.
2.1.3 Crop Production
Crops that were planted in the crop-growing areas have withered as a result of the late onset and
early cessation of the rains and the continued dry weather conditions since the rains stopped.
2.1.3 Implications on Food Security
The expected output is this time has gone down to 8 bags/acre while with normal rains,18-20
bags/acre can be harvested.
3. Access to Food
3.1 Livestock Marketing
3.1.1 Cattle Prices
Average price was Kshs 12,199 down from 13,009 the previous month. Pastoral farming
livelihood zone had a price of Kshs 11,930 and mixed farming cash crops/food crop recorded no
sales while mixed farming food crops/cash crops had an average price of 12,667.Fisheries
livelihood zone recorded an average price of Kshs 12,000 for sales during the month of January.
The 2006-2013 long-term average price of cattle is 9,522. The current price is above this long
term mean.

HINDI
WITU
KIUNGA
MPEKETONI
AMU
FAZA KIZINGITINI
Cattle price distribution for the Month of January Vs December
±
0 10 20 30 40 5 Kilometers
Key Fishing and Harvesting
Mixed Farming: Cash
Mixed Farming: Food Crop/Livestock
Pastoral
Urban
Disclaimer: The boundaries and designations on this map do not imply official endorsement or acceptance - by NDMA-LAMU
Kshs 11,930 down from Ksh 12,328
Ksh 12000 down from 15,000
Ksh 12,667
Lamu County Cattle prices 2014 Vs Long term Average 2006-2013
.

HINDI
WITU
KIUNGA
MPEKETONI
AMU
FAZA KIZINGITINI
Goat price distribution for the Month of January Vs December
±
0 10 20 30 40 5 Kilometers
Key
Fishing and Harvesting
Mixed Farming : Cash
Mixed Farming: Food Crop/Livestock Mixed Farming: Food Crop/Livestock
Pastoral
Urban
Disclaimer: The boundaries and designations on this map do not imply official endorsement or acceptance - by NDMA-LAMU
Ksh 3600 down from Ksh 3,812
Ksh 2,975 up from Ksh 2,425
Ksh 1,900 down from Ksh 2,000
Ksh 3,425 up from Ksh 3,360
3.1.2 Goat Prices
Goat prices increased from Ksh. 2,899 recorded the previous month to 2,975 in January.
Fisheries livelihood zone had a price of Kshs. 3,600, pastoral farming livelihood zone Ksh 1,
900, mixed farming cash/food LZ price was Ksh 3,425 while mixed farming food/cash was Ksh
2,975 during the reporting month. The 2006-2013 long-term average for the month was 1,718
which is lower than the current price for this month.
Lamu County goat prices 2014 Vs (2006-2013) long-term average
n=360
Goat price distribution is shown in map below.

HINDI
WITU
KIUNGA
MPEKETONI
AMU
FAZA KIZINGITINI
Maize price distribution for the Month of January Vs December
±
0 10 20 30 40 5 Kilometers
Key Fishing and Harvesting
Mixed Farming: Cash/food
Mixed Farming: Food/Cash
Pastoral
Urban
Disclaimer: The boundaries and designations on this map do not imply official endorsement or acceptance - by NDMA-LAMU
No sales recorded.
Ksh 2,790 up from Ksh 2,556
No sales recorded.
Ksh 2,925 down from Ksh 3,105
3.1.3 Maize
Average price of a 90 kg bag of maize was Ksh 2,858 up from 2,831 the previous month. Mixed
farming cash/food livelihood zone recorded a price of Ksh 2,925 down from Ksh 3,105 the
previous month, while mixed farming food /cash recorded a price of Ksh 2,790 up from Ksh
2,556. No sales were recorded in the other livelihood zones. The average price was above the
year (2006-2013) long term-average of Ksh 2,127.
Lamu County Maize prices 2014 Vs Long term Average 2006-2013
n=360

3.1.4 Beans
A 90 kg bag of beans retailed at an average of Ksh 7,851 during the month of January up from
7,758 in the previous month. The pastoral farming LZ price stood at Ksh 8,550, Mixed farming
cash/food livelihood zone recorded a price of ksh 7,200 while mixed farming food /cash
livelihood zone had a price of Ksh 7, 803. The year (2006-2013) long-term average price of
beans is Ksh 6,409 The current price is way above the long-term average.
Lamu County Beans 2014 Vs Long Term Average 2006-2013
Average price of posho for January across the county was Kshs 40(grade 2) and Ksh 50
for(grade 1) while that of sifted maize meal was ksh 60 for one kg across the county.
3.1.6 Sorghum
Sorghum retailed at a market price of between Kshs 95.
3.1.7 Cow Peas
Cow peas retailed at an average price of Ksh. 60 within the county.
3.1.9 Green Grams
The average price/kg for green grams was Ksh. 50.
3.2.0 Millet
Millet retailed at an average price of ksh 100 during the month.
3.2.1 Rice
Rice retailed at a price of 86 during the month of January.
4.0 Income
The main source of income was casual labour accounting for 53% of income sources, followed
by petty trade at 17%. Formal employment and remittance came third at 10%. The rest of the
income sources were sale of crops and livestock at 5% each. Their percentages are shown in the
chart below.

4.1. Crops
Income from crops accounted for 5% of total household income .This did not change
from the previous month’s figure.
That was normal at that time of the year.
The highest rate was recorded in the mixed farming: food crops/cash crop livelihood zone
while the least was recorded in fishing and pastoral farming livelihood zones
4.2 Livestock
Sale of livestock products accounted for 5% of total household income. This figure
remained constant from the previous month.
4.3 Other Income
Casual labour was main source of income during the month at 53%, same as last month.
Petty trading accounted for 17% of the total household income down slightly from last
month’s recorded figure at 18%.
Formal employment accounted for 10% of all household income.
4.4 Implication on Food Security
Casual labour is the main source of income for more than half the county. With the
current average wage rate of Ksh. 262 combined with the high food prices, the food
security situation seems to be getting worse.
5.0 Utilization
5.1 Nutritional Status.
The percentage of children in the County with mid upper arm circumference levels of less
than 135 mm was 3.63% down from last month’s figure of 5.2%. This is lower than the
year 2006-13 long term average of 5.01 %.
The pastoral livelihood zone recorded 6.4% down from 6.8% reported previously
,Fisheries LZ recorded 3.4% a marked improvement from 8.9% and mixed farming
food/cash LZ had 4.1% up from 3.9 % recorded previously and mixed farming cash/food
LZ had 0.6% down from 1.2 % recorded in December.
Graph of MUAC<135 mm % Year 2014 Vs 2006-2013 Long Term Average

HINDI
WITU
KIUNGA
MPEKETONI
AMU
FAZA KIZINGITINI
0 10 20 30 40 5 Kilometers
Key
Fishing and Harvesting
Mixed Farming: cash crop
Mixed Farming: Food Crop//cash crop Pastoral
Urban
Disclaimer: The boundaries and designations on this map do not imply official endorsement or acceptance - by NDMA-LAMU
3.4% down from 8.9%
4.1% up from 3.9%
6.4 down from 6.8%
0.6 % down from 1.2%
5.2 Coping Strategy Index
The average coping strategy Index was 1.6 down from 2.13 recorded last month and also higher
than long-term average of 1.30. FisheriesL.Z had the highest with 2.9, pastoral farming
livelihood zone had 0.7, and mixed cash/food 1.9 while mixed farming food/cash had a coping
strategy index of 0.9.
n=360

HINDI
WITU
KIUNGA
MPEKETONI
AMU
FAZA KIZINGITINI
Coping strategies index distribution for the Month of January Vs December
±
0 10 20 30 40 5 Kilometers
Key
Fishing and Harvesting Mixed Farming:Cash
Mixed Farming: Food Crop/Livestock Pastoral Urban
Disclaimer: The boundaries and designations on this map do not imply official endorsement or acceptance - by NDMA-LAMU
2.9 down from 5.0
0.9 No change 0.7 no change
1.9 up from 1.8
5.3 Warning Phase
Water scarcity is expected to be more widespread due to late onset and early cessation of
rainfall in most parts of the county. The impact of water scarcity has already been felt in
crop production as the crops have withered in some areas in the mixed-farming livelihood
zone such as Witu and Mpeketoni. This may impact negatively on food security since the
yield may be lower than expected.
Already, there are herds migrating into the county from Tana Delta, Ijara and Garissa.
This influx of livestock is leading to conflict over resources as there are reported cases of
skirmishes between pastoralists and crop farmers. Conflict rapid-response measures
should be put in place in hot-spot areas such as Didewaride, Bodhei and areas along the
entry points into the county. There is also urgent need for disease surveillance along
migratory routes, and if need be, vaccination and treatment should be readily available.
To make this possible, all key stakeholders including line government ministries, FBOs
and NGOs must be willing to co-ordinate.
Relief food may be required for about 20,000 people in the county. Water trucking is
expected soon. More water storage tanks and water bowsers are required as the county
has only one serviceable water bowser.
The county is on alert and the trend is worsening.