Embed Size (px)
Citation preview
NATIONAL DEFENSE BUDGET ESTIMATES FOR FY 2020
OFFICE OF THE UNDER SECRETARY OF DEFENSE (COMPTROLLER)
MAY 2019
The estimated cost of this report or study for the Department of Defense is
approximately $12,000 for the 2019 Fiscal Year. This includes $1,730 in expenses and $9,890 in DoD labor.
Generated on 2019Apr04 RefID: 6-83F16AB

This Page Intentionally Left Blank
i
Table of Contents
Overview – National Defense Budget Estimates for FY 2020 ........................................................................................................................... 1
Chapter 1: National Defense – An Overview ..................................................................................................................................................... 5 Table 1-1: National Defense Budget – Long Range Forecast (FY 2018 to FY 2024) ............................................................................ 6 Table 1-2: National Defense Budget Authority – Discretionary and Mandatory; Current and Constant Dollars (FY 2018 to FY 2024) ................................................................................................................................ 7 Table 1-3: National Defense Outlays – Discretionary and Mandatory; Current and Constant Dollars (FY 2018 to FY 2024) ........... 11 Table 1-4: Federal Unified Budget – Budget Authority by Function (FY 2018 to FY 2024) ............................................................... 15 Table 1-5: Federal Unified Budget – Outlays by Function (FY 2018 to FY 2024) .............................................................................. 16 Table 1-6: Discretionary Budget Authority for National Defense (FY 2020 to FY 2029) ................................................................... 17 Table 1-7: Discretionary Budget Authority for Past Defense Budgets to the Present (FY 2012 to FY 2024)...................................... 18
Chapter 2: Base Budget, War Funding and Supplementals .......................................................................................................................... 19 Table 2-1: Base Budget, War Funding and Supplementals by Military Department, by P.L. Title (FY 2001 to FY 2020) ................. 20
Chapter 3: Legislative Authorization ............................................................................................................................................................... 37 Table 3-1: FY 2020 Defense Budget – Reconciliation of Authorization, Appropriation, BA and TOA .............................................. 38 Table 3-2: Military Personnel Authorizations (FY 2018 to FY 2020) .................................................................................................. 45
Chapter 4: Chronology ...................................................................................................................................................................................... 47 Table 4-1: FY 2018 National Defense Budget Authority Chronology ................................................................................................. 48 Table 4-2: FY 2019 National Defense Budget Authority Chronology ................................................................................................. 50
Chapter 5: Treatment of Inflation .................................................................................................................................................................... 51 Table 5-1: DoD and Selected Economy-Wide Indices (FY 1970 to FY 2024) ..................................................................................... 52 Table 5-2: Pay and Inflation Rate Assumptions – Outlays (FY 2018 to FY 2024)............................................................................... 54 Table 5-3: Pay and Inflation Rate Assumptions – Budget Authority (FY 2018 to FY 2024) ............................................................... 55 Table 5-4: DoD Deflators – TOA by Public Law Title (FY 1970 to FY 2024) .................................................................................... 56 Table 5-5: DoD Deflators – TOA by Category (FY 1970 to FY 2024) ................................................................................................ 58 Table 5-6: DoD Deflators – Budget Authority by Public Law Title (FY 1970 to FY 2024) ................................................................ 60 Table 5-7: DoD Deflators – Budget Authority by Category (FY 1970 to FY 2024) ............................................................................ 62 Table 5-8: DoD Deflators – Outlays by Public Law Title (FY 1970 to FY 2024) ................................................................................ 64
ii
Table of Contents (Continued)
Table 5-9: DoD Deflators – Outlays by Category (FY 1970 to FY 2024) ............................................................................................ 66 Table 5-10: Chronology of Selected Inflation Profiles (FY 1999 to FY 2024)....................................................................................... 68 Table 5-11: Outlay Rates for Incremental Changes in Budget Authority Purchases .............................................................................. 70 Table 5-12: Military and Civilian Pay Increases Since 1945 (1945 to 2024) ......................................................................................... 73 Table 5-13: Civilian Pay Deflators by Category (FY 1970 to FY 2024) ................................................................................................ 75 Table 5-14: DoD Deflators – Budget Authority; Base, Discretionary (FY 2010 to FY 2024) ............................................................... 77
Chapter 6: TOA, BA, Outlay Trends and Program Changes ....................................................................................................................... 79 Table 6-1: DoD TOA by Public Law Title (FY 1948 to FY 2024) ....................................................................................................... 80 Table 6-2: DoD TOA by Category (FY 1948 to FY 2024) ................................................................................................................... 87 Table 6-3: DoD TOA by Military Department (FY 1948 to FY 2024) ................................................................................................. 94 Table 6-4: DoD TOA by Major Force Program – Current Dollars (FY 1962 to FY 2024) ................................................................ 101 Table 6-5: DoD TOA by Major Force Program – Constant Dollars (FY 1962 to FY 2024) .............................................................. 103 Table 6-6: DoD TOA, BA, and Outlays by Appropriation Account – Current Dollars (FY 2018 to FY 2024) ................................. 105 Table 6-7: DoD TOA, BA, and Outlays by Appropriation Account – Constant Dollars (FY 2018 to FY 2024) ............................... 119 Table 6-8: DoD Budget Authority by Public Law Title (FY 1948 to FY 2024) ................................................................................. 133 Table 6-9: DoD Budget Authority by Category (FY 1948 to FY 2024) ............................................................................................. 140 Table 6-10: DoD Budget Authority by Military Department (FY 1948 to FY 2024) ........................................................................... 147 Table 6-11: DoD Outlays by Public Law Title (FY 1948 to FY 2024) ................................................................................................. 154 Table 6-12: DoD Outlays by Category (FY 1948 to FY 2024) ............................................................................................................. 161 Table 6-13: DoD Outlays by Military Department (FY 1948 to FY 2024)........................................................................................... 168 Table 6-14: DoD Civilian Pay – Current Dollars (FY 1970 to FY 2024) ............................................................................................. 175 Table 6-15: DoD Civilian Pay – Constant Dollars (FY 1970 to FY 2024) ........................................................................................... 177 Table 6-16: Army TOA by Public Law Title (FY 1948 to FY 2024) ................................................................................................... 179 Table 6-17: Navy TOA by Public Law Title (FY 1948 to FY 2024) .................................................................................................... 186 Table 6-18: Air Force TOA by Public Law Title (FY 1948 to FY 2024) ............................................................................................. 193 Table 6-19: Army Budget Authority by Public Law Title (FY 1948 to FY 2024) ............................................................................... 200 Table 6-20: Navy Budget Authority by Public Law Title (FY 1948 to FY 2024) ................................................................................ 207 Table 6-21: Air Force Budget Authority by Public Law Title (FY 1948 to FY 2024) ......................................................................... 214 Table 6-22: Army Outlays by Public Law Title (FY 1948 to FY 2024) ............................................................................................... 221
iii
Table of Contents (Continued)
Table 6-23: Navy Outlays by Public Law Title (FY 1948 to FY 2024) ................................................................................................ 228 Table 6-24: Air Force Outlays by Public Law Title (FY 1948 to FY 2024) ......................................................................................... 235 Table 6-25: DoD Base, Discretionary BA by Public Law Title (FY 2010 to FY 2024) ....................................................................... 242 Table 6-26: DoD Base, Discretionary BA by Military Department (FY 2010 to FY 2024) ................................................................. 244
Chapter 7: Defense, the Public Sector and the Economy ............................................................................................................................. 247 Table 7-1: Total Federal Outlays – Current Dollars (FY 1945 to FY 2024) ....................................................................................... 248 Table 7-2: Total Federal Outlays – FY 2012 Constant Dollars (FY 1945 to FY 2024) ...................................................................... 251 Table 7-3: U.S. Public Spending: Federal, State, Local and GDP – Current Dollars (FY 1945 to FY 2024) ................................... 254 Table 7-4: U.S. Public Spending: Federal, State, Local and GDP – FY 2012 Constant Dollars (FY 1945 to FY 2024) .................. 257 Table 7-5: Department of Defense Manpower – End Strength/FTE's (FY 1940 to FY 2020) ............................................................ 260 Table 7-6: U.S. Labor Force – End Strength/FTE's (FY 1940 to FY 2020) ....................................................................................... 263 Table 7-7: Defense Shares of Economic and Budgetary Aggregates (FY 1940 to FY 2020) ............................................................. 266
Glossary of Terms ............................................................................................................................................................................................. 269
Notes ................................................................................................................................................................................................................... 273

This Page Intentionally Left Blank
Overview Overview
Overview - National Defense Budget Estimates for Fiscal Year (FY) 2020 The National Defense Budget Estimates, commonly referred to as “The Green Book,” is a reference source for data associated with the current budget estimates of the Department of Defense (DoD). It provides current (nominal) and constant (real) dollar historical data for the Department, as well as selected data on all National Defense, the total federal budget, and the U.S. economy. This edition reflects the FY 2020 President’s Budget as submitted to the Congress in March of 2019. The Green Book may be used as a companion to the Budget Request Summary Justification Book. However, while the Justification Book speaks mainly to the Department’s budgetary request in terms of discretionary budget authority, most tables in the Green Book display combined discretionary and mandatory funding. The difference between discretionary and mandatory is discussed later, and can also be found in the Glossary of Terms at the end of the book. Also to follow is a short guide to understanding the data presented in this document. There is an explanation of budget authority vs. total obligational authority, along with outlays. Next is a section on discretionary, mandatory and emergency funding. Current vs. constant dollars, a mainstay of inflationary analysis, is then defined, followed by an explanation of deflators. Finally, there is a discussion of calculation methodologies and how rounding and differences in scoring cause disparities between DoD reporting and that of the Office of Management and Budget (OMB).
Budget Authority, Total Obligational Authority and Outlays Green Book funding data are provided in three standard categories: (1) budget authority (BA) – discretionary and mandatory authority are combined in most tables; (2) total obligational authority (TOA);
and (3) outlays. While Department analysts may distinguish between BA and TOA, BA is what the general public tends to recognize as funding appropriated by the Congress. It is the authority to legally incur binding obligations (signing contracts and placing orders), which will result in current-year and future outlays. On the other hand, TOA is a DoD financial term expressing the value of the direct Defense program for a given fiscal year, exclusive of the obligation authority from other sources (such as reimbursable
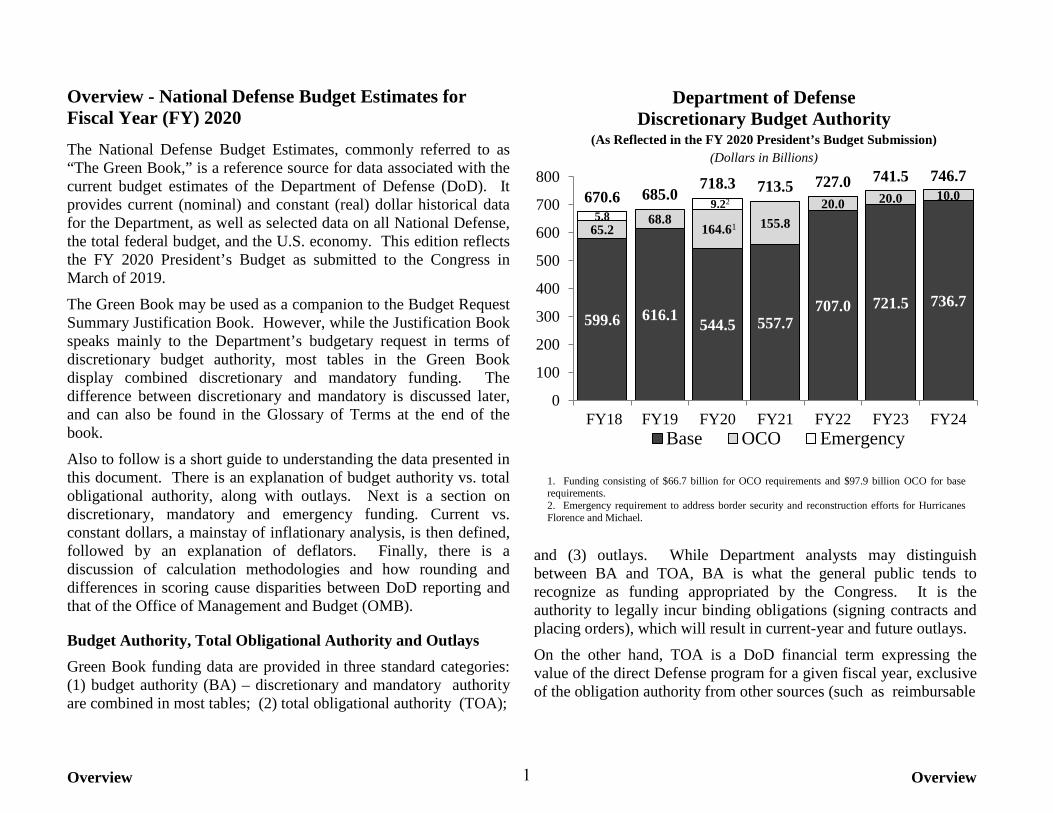
599.6 616.1 544.5 557.7707.0 721.5 736.7
65.268.8
164.61 155.820.0 20.0 10.0
5.89.22670.6 685.0
718.3 713.5 727.0 741.5 746.7
0
100
200
300
400
500
600
700
800
FY18 FY19 FY20 FY21 FY22 FY23 FY24Base OCO Emergency
Department of Defense Discretionary Budget Authority
(As Reflected in the FY 2020 President’s Budget Submission) (Dollars in Billions)
1. Funding consisting of $66.7 billion for OCO requirements and $97.9 billion OCO for base requirements. 2. Emergency requirement to address border security and reconstruction efforts for Hurricanes Florence and Michael.
1
Overview Overview
orders accepted). Here are some more differences between BA and TOA:
• If BA expires before obligations are incurred, the TOA for that year is reduced by the expired amount. There is no effect on BA.
• If legislation (proposed or enacted) transfers the unobligated balance of one account to another, where the purpose of the balance has changed, scoring rules require the transfer to be reflected as a change in BA in the year in which the transfer occurred (reduction of BA in the losing account, increase of BA in the gaining account). The adjustment to TOA will be in the original program, regardless of when the transaction occurred.
• Reappropriations (the extension of availability of previously appropriated funds) are scored as BA in the first year of extended availability, while TOA is unchanged.
• Rescissions (congressional action canceling new BA or unobligated balances) are reflected as a reduction to BA in the fiscal year in which the rescission is enacted. However, TOA reflects this adjustment in the program year of the rescinded funds (i.e., the fiscal year in which the funds were originally appropriated). If rescissions are proposed in the budget, they would be reflected in the TOA as if enacted.
• Net offsetting receipts (collections from the public that arise out of business-type or market-oriented activities of the federal government, and are deposited in receipt accounts) are deducted from BA, but have no effect on TOA.
The third category of data reflected in this book is outlays, also known as expenditures or disbursements. Outlays are the liquidation of the federal government’s obligations and generally represent cash payments. Outlays in a given fiscal year may represent the liquidation of obligations incurred over a number of years. There is a time lag between budgeting funds (congressional appropriation), signing contracts and placing orders (obligations), receiving goods or
services, and making payments (liquidation of obligations). For acquisition and construction programs, the Department operates under a “full funding” policy by which the Congress approves, in the year of the request, sufficient funds to complete a given quantity of items or build a facility, even though it may take a number of years to actually build and deliver these items. Thus, in exceptional cases (such as the building of an aircraft carrier), final outlays may be recorded a decade after the BA for the program was originally granted.
Discretionary, Mandatory, and Emergency Programs Discretionary programs are funded annually through the congressional appropriations process. The scorekeeping guidelines of the Budget Enforcement Act (BEA) establish annual limits on the amount of BA available for these programs. Adjustments to discretionary spending limits are provided for spending that is designated by both the Congress and the President as emergency requirements, or for Overseas Contingency Oper-ations/Global War on Terrorism, on an account-by-account basis. Mandatory programs, also known as “pay-as-you-go” or PAYGO programs, are direct spending programs and receipts defined as entitlement authority. This is BA authorized by permanent law, rather than annual appropriations acts. Social Security and Medicare are examples of mandatory programs. Military retirement and Medicare-Eligible Retiree Health Fund Contribution accounts are examples of DoD-specific mandatory programs. The Pay-As-You-Go Act of 2010 establishes the current guidelines for scorekeeping of mandatory programs. The Department of Defense is unique in that it is one of the few federal entities where the majority of its funding falls into the discretionary category. The majority of the entire federal budget is
2
Overview Overview
mandatory, and much of the discretionary funding in the budget is comprised of DoD dollars.
Current Dollars and Constant Dollars The Green Book displays funding in both current and constant dollars. If an item or service is priced in current dollars, the price includes all inflationary changes expected to occur in the program over the duration of the spendout of that program’s appropriation. Constant dollars measure the value of purchased goods and services at price levels that are the same as the base year level. Constant dollars do not contain any adjustments for inflation that have occurred outside the base year. Thus, by looking at funding across various years in constant dollars, the only changes a person will see are programmatic (referred to as “real” change). This will show how much spending has changed for a program, without the impact of inflation. Through understanding current and constant dollars, variations in purchasing power become more evident. If one dollar buys one widget in 2020, but in 1950 one dollar purchased five widgets, purchasing power has declined. A current-dollar analysis shows the DoD spending much more now than it did in 1950, but a constant-dollar analysis reveals that the percentage of program growth (its “real growth”) is not as great as the overall nominal growth. It is important to note that many inflation indices, such as the Gross Domestic Product (GDP) index, are chain-weighted. This means they account for differences in products purchased over the years; new expenditure patterns are accounted for in the inflation figure. For example, if typewriters were regularly purchased in 1970, but by 2000 had become obsolete in favor of PCs, a chain-weighted index would account for this new purchasing pattern.
Deflators Deflators are a way to measure broad price movements in the economy. The deflator in the base year equals 100, and in the Green Book the default base year is the budget request year – FY 2020 in this edition (except for Chapter 7, where the base year used by the OMB – FY 2012 – is applied). An item that has a deflator of 50.00 has a current dollar value that is half of what you would need to purchase the same item in FY 2020. An item that has a deflator of 200.00 has a current dollar value that is twice what you would need to purchase the same item in FY 2020. Formula for calculating a deflator when you have the current and constant dollar values: Deflator = X 100 Converting current dollars to constant dollars: Constant $ = X 100 Example: Converting FY 2004 total DoD budget authority to
FY 2020 constant dollars: Deflator = 71.61 FY 2004 budget authority (current $) = $471,011 million FY 2004 budget authority in FY 2020 constant dollars: X 100 = $657.7B (rounded) FY 2020 constant dollars
Current $ Constant $
Current $ Deflator
$471,011M 71.61
3
Overview Overview
Calculation Methodology and Rounding The DoD uses inflation rates provided by the OMB as a baseline. The OMB bases their rates on Gross Domestic Product (GDP) composite rates. The DoD includes military and civilian pay raise rates, fuel rates, and medical factors in its composite rates. In addition, outlay rates for each appropriation account are factored into the final DoD inflation rates. There are some discrepancies between the funding totals shown in this book and those in the OMB publications. These differences result from the way account totals are calculated and scored. For example, beginning with the FY 1998 budget, the OMB worked with
data that had been rounded to the millions of dollars, while the DoD data were derived from numbers rounded to the thousands. Further, the OMB and the DoD sometimes differ in how they report items like contract authority and transfers to other federal agencies (i.e. the Coast Guard), which impacts the total dollars reported. In those instances where a discrepancy exists, a delta is displayed as “scoring and rounding.” Finally, in some tables, small differences between the totals shown and the actual sum of the column or row entries are possible. These discrepancies are also due to rounding.
4
Introduction Chapter 1
Chapter 1: National Defense – An Overview
Tables Page1-1 National Defense Budget – Long Range Forecast (FY 2018 to FY 2024)............................................................................................................. 61-2 National Defense Budget Authority – Discretionary and Mandatory; Current and Constant Dollars (FY 2018 to FY 2024)................................ 71-3 National Defense Outlays – Discretionary and Mandatory; Current and Constant Dollars (FY 2018 to FY 2024)................................................ 111-4 Federal Unified Budget – Budget Authority by Function (FY 2018 to FY 2024).................................................................................................. 151-5 Federal Unified Budget – Outlays by Function (FY 2018 to FY 2024).................................................................................................................. 161-6 Discretionary Budget Authority for National Defense (FY 2020 to FY 2029)....................................................................................................... 171-7 Discretionary Budget Authority for Past Defense Budgets to the Present (FY 2012 to FY 2024).......................................................................... 18
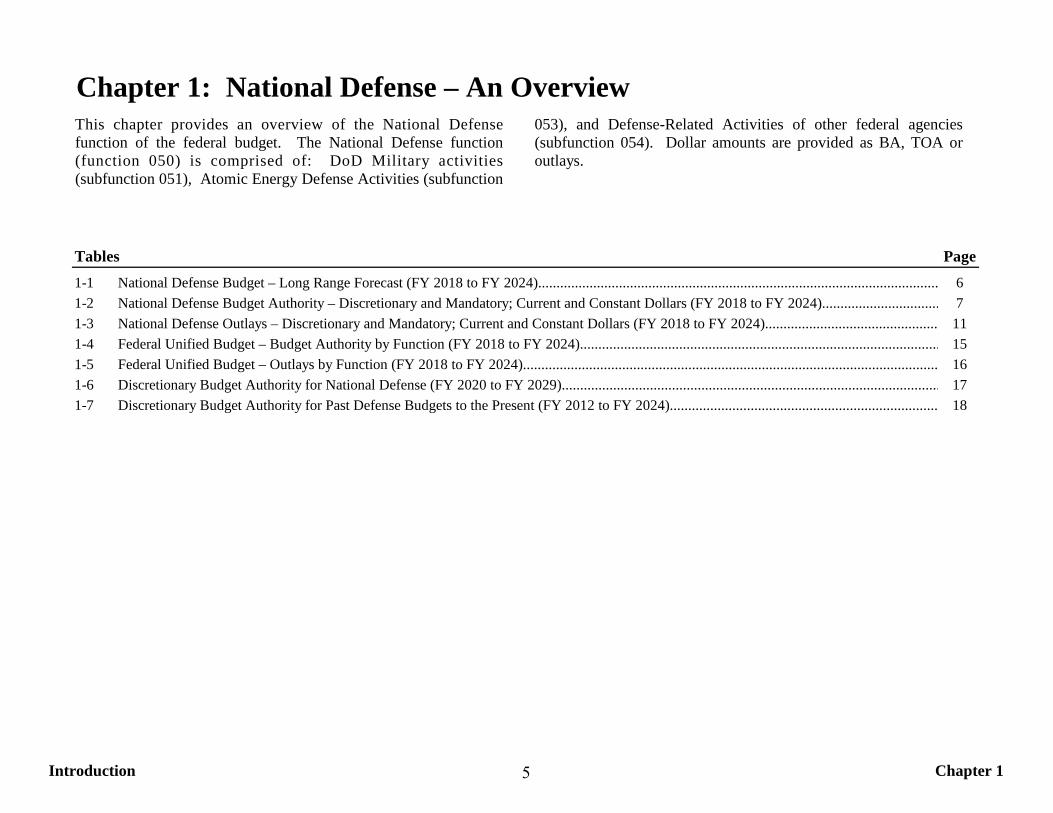
This chapter provides an overview of the National Defensefunction of the federal budget. The National Defense function(function 050) is comprised of: DoD Military activities(subfunction 051), Atomic Energy Defense Activities (subfunction
053), and Defense-Related Activities of other federal agencies(subfunction 054). Dollar amounts are provided as BA, TOA oroutlays.
5
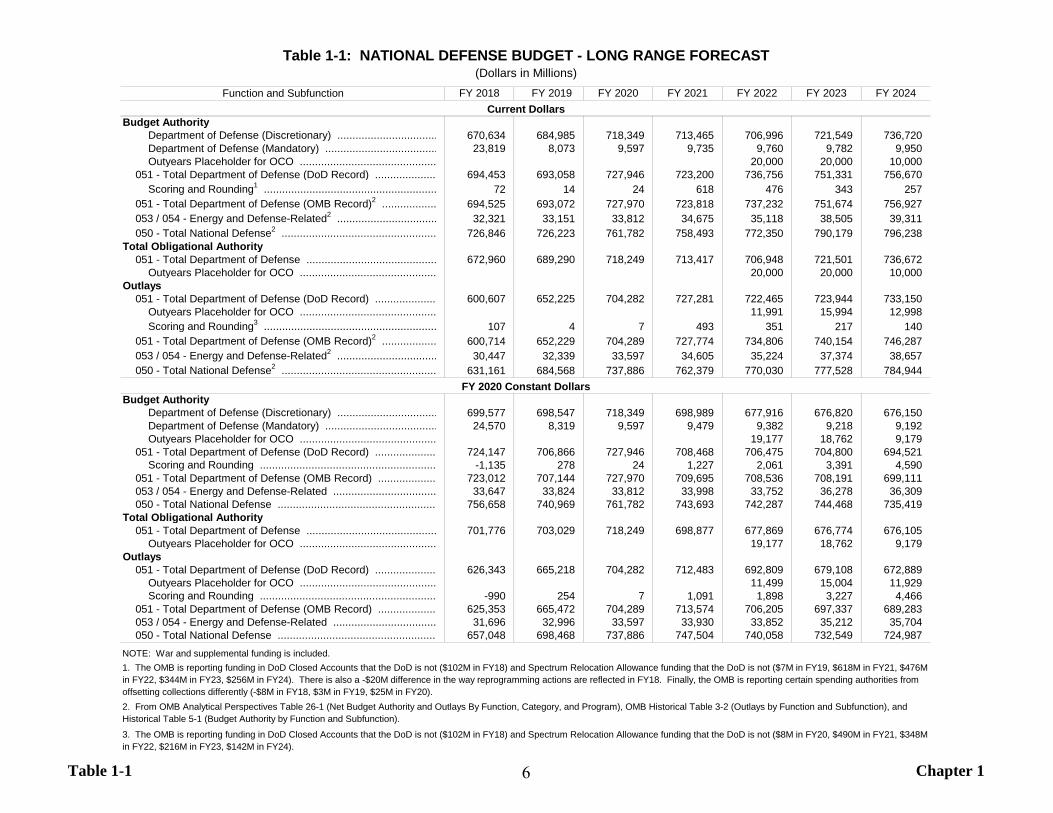
Table 1-1 Chapter 1
FY 2018 FY 2019 FY 2020 FY 2021 FY 2022 FY 2023 FY 2024
Budget Authority Department of Defense (Discretionary) ................................. 670,634 684,985 718,349 713,465 706,996 721,549 736,720 Department of Defense (Mandatory) ..................................... 23,819 8,073 9,597 9,735 9,760 9,782 9,950 Outyears Placeholder for OCO ............................................. 20,000 20,000 10,000
051 - Total Department of Defense (DoD Record) ..................... 694,453 693,058 727,946 723,200 736,756 751,331 756,670 Scoring and Rounding1 ......................................................... 72 14 24 618 476 343 257
051 - Total Department of Defense (OMB Record)2 .................. 694,525 693,072 727,970 723,818 737,232 751,674 756,927 053 / 054 - Energy and Defense-Related2 ................................. 32,321 33,151 33,812 34,675 35,118 38,505 39,311 050 - Total National Defense2 ................................................... 726,846 726,223 761,782 758,493 772,350 790,179 796,238
Total Obligational Authority 051 - Total Department of Defense ........................................... 672,960 689,290 718,249 713,417 706,948 721,501 736,672
Outyears Placeholder for OCO ............................................. 20,000 20,000 10,000 Outlays
051 - Total Department of Defense (DoD Record) ..................... 600,607 652,225 704,282 727,281 722,465 723,944 733,150 Outyears Placeholder for OCO ............................................. 11,991 15,994 12,998 Scoring and Rounding3 ......................................................... 107 4 7 493 351 217 140
051 - Total Department of Defense (OMB Record)2 .................. 600,714 652,229 704,289 727,774 734,806 740,154 746,287 053 / 054 - Energy and Defense-Related2 ................................. 30,447 32,339 33,597 34,605 35,224 37,374 38,657 050 - Total National Defense2 ................................................... 631,161 684,568 737,886 762,379 770,030 777,528 784,944
Budget Authority Department of Defense (Discretionary) ................................. 699,577 698,547 718,349 698,989 677,916 676,820 676,150 Department of Defense (Mandatory) ..................................... 24,570 8,319 9,597 9,479 9,382 9,218 9,192 Outyears Placeholder for OCO ............................................. 19,177 18,762 9,179
051 - Total Department of Defense (DoD Record) ..................... 724,147 706,866 727,946 708,468 706,475 704,800 694,521 Scoring and Rounding .......................................................... -1,135 278 24 1,227 2,061 3,391 4,590
051 - Total Department of Defense (OMB Record) .................... 723,012 707,144 727,970 709,695 708,536 708,191 699,111 053 / 054 - Energy and Defense-Related .................................. 33,647 33,824 33,812 33,998 33,752 36,278 36,309 050 - Total National Defense ..................................................... 756,658 740,969 761,782 743,693 742,287 744,468 735,419
Total Obligational Authority 051 - Total Department of Defense ........................................... 701,776 703,029 718,249 698,877 677,869 676,774 676,105
Outyears Placeholder for OCO ............................................. 19,177 18,762 9,179 Outlays
051 - Total Department of Defense (DoD Record) ..................... 626,343 665,218 704,282 712,483 692,809 679,108 672,889 Outyears Placeholder for OCO ............................................. 11,499 15,004 11,929 Scoring and Rounding ........................................................... -990 254 7 1,091 1,898 3,227 4,466
051 - Total Department of Defense (OMB Record) .................... 625,353 665,472 704,289 713,574 706,205 697,337 689,283 053 / 054 - Energy and Defense-Related .................................. 31,696 32,996 33,597 33,930 33,852 35,212 35,704 050 - Total National Defense ..................................................... 657,048 698,468 737,886 747,504 740,058 732,549 724,987
NOTE: War and supplemental funding is included.1. The OMB is reporting funding in DoD Closed Accounts that the DoD is not ($102M in FY18) and Spectrum Relocation Allowance funding that the DoD is not ($7M in FY19, $618M in FY21, $476M in FY22, $344M in FY23, $256M in FY24). There is also a -$20M difference in the way reprogramming actions are reflected in FY18. Finally, the OMB is reporting certain spending authorities from offsetting collections differently (-$8M in FY18, $3M in FY19, $25M in FY20).
3. The OMB is reporting funding in DoD Closed Accounts that the DoD is not ($102M in FY18) and Spectrum Relocation Allowance funding that the DoD is not ($8M in FY20, $490M in FY21, $348M in FY22, $216M in FY23, $142M in FY24).
2. From OMB Analytical Perspectives Table 26-1 (Net Budget Authority and Outlays By Function, Category, and Program), OMB Historical Table 3-2 (Outlays by Function and Subfunction), and Historical Table 5-1 (Budget Authority by Function and Subfunction).
Table 1-1: NATIONAL DEFENSE BUDGET - LONG RANGE FORECAST(Dollars in Millions)
Function and SubfunctionCurrent Dollars
FY 2020 Constant Dollars
6
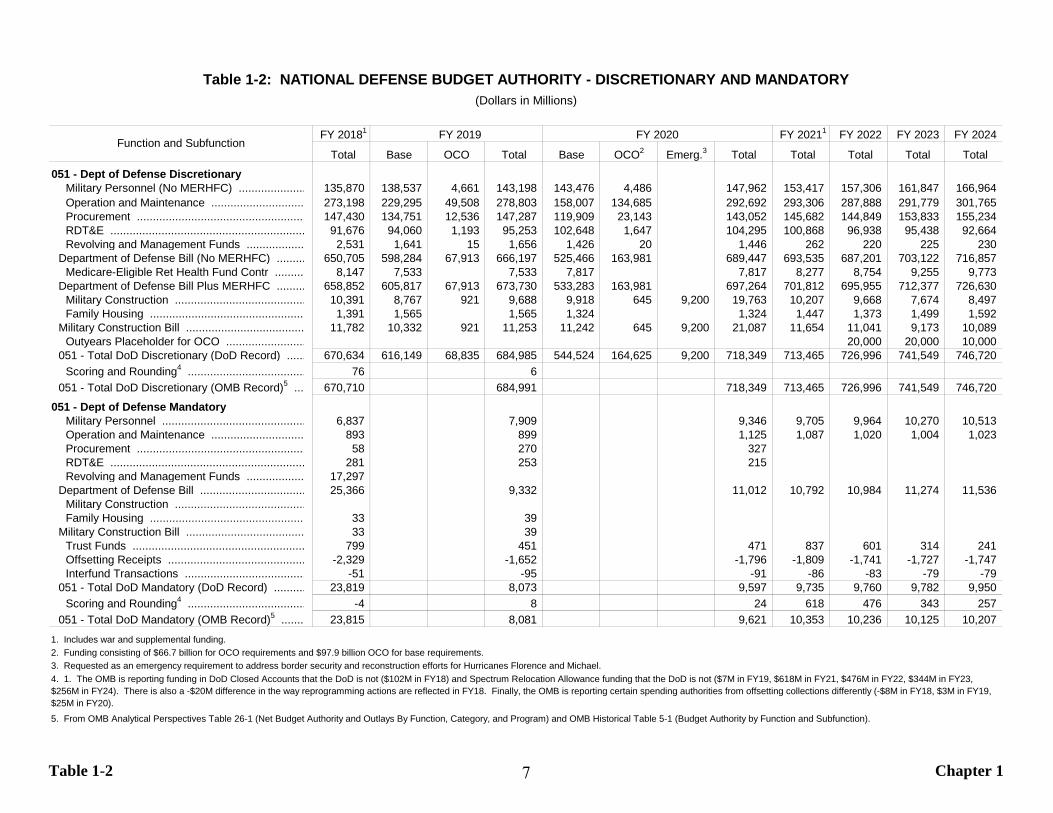
Table 1-2 Chapter 1
FY 20181 FY 20211 FY 2022 FY 2023 FY 2024
Total Base OCO Total Base OCO2 Emerg.3 Total Total Total Total Total051 - Dept of Defense Discretionary
Military Personnel (No MERHFC) ..................... 135,870 138,537 4,661 143,198 143,476 4,486 147,962 153,417 157,306 161,847 166,964 Operation and Maintenance ............................. 273,198 229,295 49,508 278,803 158,007 134,685 292,692 293,306 287,888 291,779 301,765 Procurement ..................................................... 147,430 134,751 12,536 147,287 119,909 23,143 143,052 145,682 144,849 153,833 155,234 RDT&E ............................................................. 91,676 94,060 1,193 95,253 102,648 1,647 104,295 100,868 96,938 95,438 92,664 Revolving and Management Funds .................. 2,531 1,641 15 1,656 1,426 20 1,446 262 220 225 230
Department of Defense Bill (No MERHFC) ......... 650,705 598,284 67,913 666,197 525,466 163,981 689,447 693,535 687,201 703,122 716,857 Medicare-Eligible Ret Health Fund Contr .......... 8,147 7,533 7,533 7,817 7,817 8,277 8,754 9,255 9,773
Department of Defense Bill Plus MERHFC ......... 658,852 605,817 67,913 673,730 533,283 163,981 697,264 701,812 695,955 712,377 726,630 Military Construction ......................................... 10,391 8,767 921 9,688 9,918 645 9,200 19,763 10,207 9,668 7,674 8,497 Family Housing ................................................. 1,391 1,565 1,565 1,324 1,324 1,447 1,373 1,499 1,592
Military Construction Bill ..................................... 11,782 10,332 921 11,253 11,242 645 9,200 21,087 11,654 11,041 9,173 10,089 Outyears Placeholder for OCO ......................... 20,000 20,000 10,000
051 - Total DoD Discretionary (DoD Record) ...... 670,634 616,149 68,835 684,985 544,524 164,625 9,200 718,349 713,465 726,996 741,549 746,720 Scoring and Rounding4 ..................................... 76 6
051 - Total DoD Discretionary (OMB Record)5 ... 670,710 684,991 718,349 713,465 726,996 741,549 746,720 051 - Dept of Defense Mandatory
Military Personnel ............................................. 6,837 7,909 9,346 9,705 9,964 10,270 10,513 Operation and Maintenance ............................. 893 899 1,125 1,087 1,020 1,004 1,023 Procurement ..................................................... 58 270 327 RDT&E ............................................................. 281 253 215 Revolving and Management Funds .................. 17,297
Department of Defense Bill ................................. 25,366 9,332 11,012 10,792 10,984 11,274 11,536 Military Construction ......................................... Family Housing ................................................. 33 39
Military Construction Bill ..................................... 33 39 Trust Funds ...................................................... 799 451 471 837 601 314 241 Offsetting Receipts ........................................... -2,329 -1,652 -1,796 -1,809 -1,741 -1,727 -1,747 Interfund Transactions ...................................... -51 -95 -91 -86 -83 -79 -79
051 - Total DoD Mandatory (DoD Record) .......... 23,819 8,073 9,597 9,735 9,760 9,782 9,950 Scoring and Rounding4 ..................................... -4 8 24 618 476 343 257
051 - Total DoD Mandatory (OMB Record)5 ........ 23,815 8,081 9,621 10,353 10,236 10,125 10,207 1. Includes war and supplemental funding.2. Funding consisting of $66.7 billion for OCO requirements and $97.9 billion OCO for base requirements.3. Requested as an emergency requirement to address border security and reconstruction efforts for Hurricanes Florence and Michael.
5. From OMB Analytical Perspectives Table 26-1 (Net Budget Authority and Outlays By Function, Category, and Program) and OMB Historical Table 5-1 (Budget Authority by Function and Subfunction).
4. 1. The OMB is reporting funding in DoD Closed Accounts that the DoD is not ($102M in FY18) and Spectrum Relocation Allowance funding that the DoD is not ($7M in FY19, $618M in FY21, $476M in FY22, $344M in FY23, $256M in FY24). There is also a -$20M difference in the way reprogramming actions are reflected in FY18. Finally, the OMB is reporting certain spending authorities from offsetting collections differently (-$8M in FY18, $3M in FY19, $25M in FY20).
(Dollars in Millions)Table 1-2: NATIONAL DEFENSE BUDGET AUTHORITY - DISCRETIONARY AND MANDATORY
XFY 2019 FY 2020Function and Subfunction
7
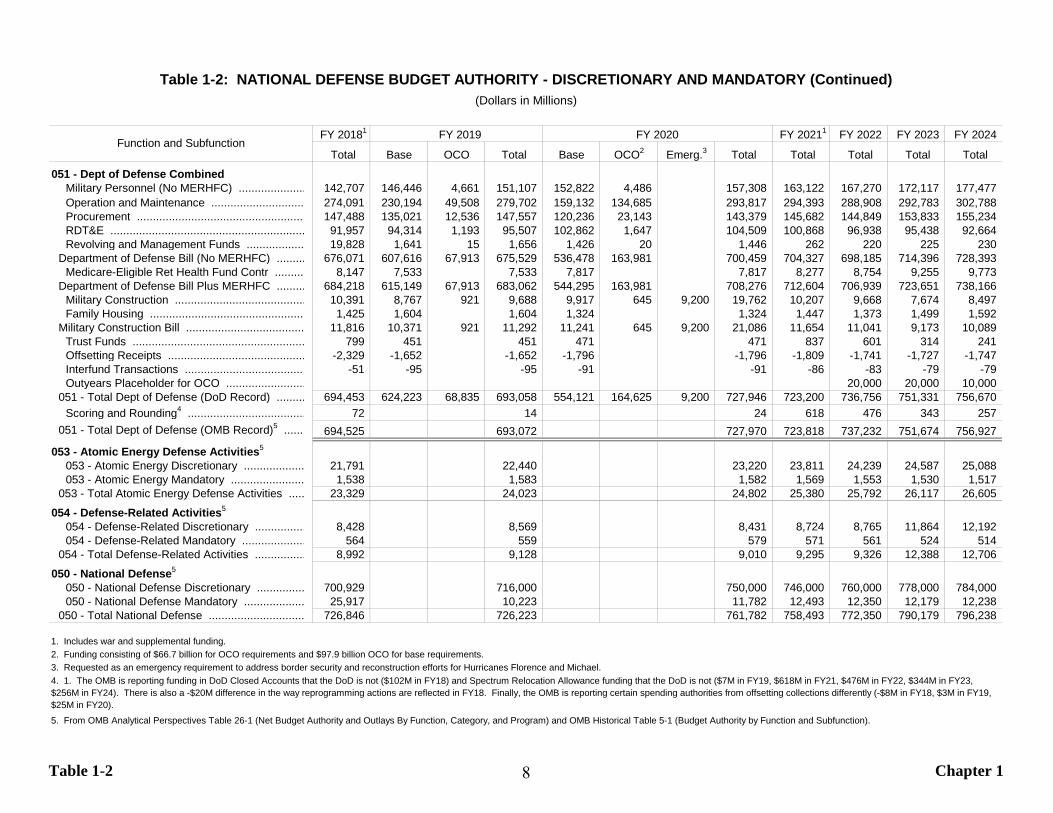
Table 1-2 Chapter 1
FY 20181 FY 20211 FY 2022 FY 2023 FY 2024
Total Base OCO Total Base OCO2 Emerg.3 Total Total Total Total Total051 - Dept of Defense Combined
Military Personnel (No MERHFC) ..................... 142,707 146,446 4,661 151,107 152,822 4,486 157,308 163,122 167,270 172,117 177,477 Operation and Maintenance ............................. 274,091 230,194 49,508 279,702 159,132 134,685 293,817 294,393 288,908 292,783 302,788 Procurement ..................................................... 147,488 135,021 12,536 147,557 120,236 23,143 143,379 145,682 144,849 153,833 155,234 RDT&E ............................................................. 91,957 94,314 1,193 95,507 102,862 1,647 104,509 100,868 96,938 95,438 92,664 Revolving and Management Funds .................. 19,828 1,641 15 1,656 1,426 20 1,446 262 220 225 230
Department of Defense Bill (No MERHFC) ......... 676,071 607,616 67,913 675,529 536,478 163,981 700,459 704,327 698,185 714,396 728,393 Medicare-Eligible Ret Health Fund Contr .......... 8,147 7,533 7,533 7,817 7,817 8,277 8,754 9,255 9,773
Department of Defense Bill Plus MERHFC ......... 684,218 615,149 67,913 683,062 544,295 163,981 708,276 712,604 706,939 723,651 738,166 Military Construction ......................................... 10,391 8,767 921 9,688 9,917 645 9,200 19,762 10,207 9,668 7,674 8,497 Family Housing ................................................. 1,425 1,604 1,604 1,324 1,324 1,447 1,373 1,499 1,592
Military Construction Bill ..................................... 11,816 10,371 921 11,292 11,241 645 9,200 21,086 11,654 11,041 9,173 10,089 Trust Funds ...................................................... 799 451 451 471 471 837 601 314 241 Offsetting Receipts ........................................... -2,329 -1,652 -1,652 -1,796 -1,796 -1,809 -1,741 -1,727 -1,747 Interfund Transactions ...................................... -51 -95 -95 -91 -91 -86 -83 -79 -79 Outyears Placeholder for OCO ......................... 20,000 20,000 10,000
051 - Total Dept of Defense (DoD Record) ......... 694,453 624,223 68,835 693,058 554,121 164,625 9,200 727,946 723,200 736,756 751,331 756,670 Scoring and Rounding4 ..................................... 72 14 24 618 476 343 257
051 - Total Dept of Defense (OMB Record)5 ....... 694,525 693,072 727,970 723,818 737,232 751,674 756,927
053 - Atomic Energy Defense Activities5 053 - Atomic Energy Discretionary ................... 21,791 22,440 23,220 23,811 24,239 24,587 25,088 053 - Atomic Energy Mandatory ....................... 1,538 1,583 1,582 1,569 1,553 1,530 1,517
053 - Total Atomic Energy Defense Activities ..... 23,329 24,023 24,802 25,380 25,792 26,117 26,605 054 - Defense-Related Activities5
054 - Defense-Related Discretionary ................ 8,428 8,569 8,431 8,724 8,765 11,864 12,192 054 - Defense-Related Mandatory .................... 564 559 579 571 561 524 514
054 - Total Defense-Related Activities ................ 8,992 9,128 9,010 9,295 9,326 12,388 12,706 050 - National Defense5
050 - National Defense Discretionary ............... 700,929 716,000 750,000 746,000 760,000 778,000 784,000 050 - National Defense Mandatory ................... 25,917 10,223 11,782 12,493 12,350 12,179 12,238
050 - Total National Defense .............................. 726,846 726,223 761,782 758,493 772,350 790,179 796,238
1. Includes war and supplemental funding.2. Funding consisting of $66.7 billion for OCO requirements and $97.9 billion OCO for base requirements.3. Requested as an emergency requirement to address border security and reconstruction efforts for Hurricanes Florence and Michael.
5. From OMB Analytical Perspectives Table 26-1 (Net Budget Authority and Outlays By Function, Category, and Program) and OMB Historical Table 5-1 (Budget Authority by Function and Subfunction).
4. 1. The OMB is reporting funding in DoD Closed Accounts that the DoD is not ($102M in FY18) and Spectrum Relocation Allowance funding that the DoD is not ($7M in FY19, $618M in FY21, $476M in FY22, $344M in FY23, $256M in FY24). There is also a -$20M difference in the way reprogramming actions are reflected in FY18. Finally, the OMB is reporting certain spending authorities from offsetting collections differently (-$8M in FY18, $3M in FY19, $25M in FY20).
(Dollars in Millions)Table 1-2: NATIONAL DEFENSE BUDGET AUTHORITY - DISCRETIONARY AND MANDATORY (Continued)
XFY 2019 FY 2020Function and Subfunction
8
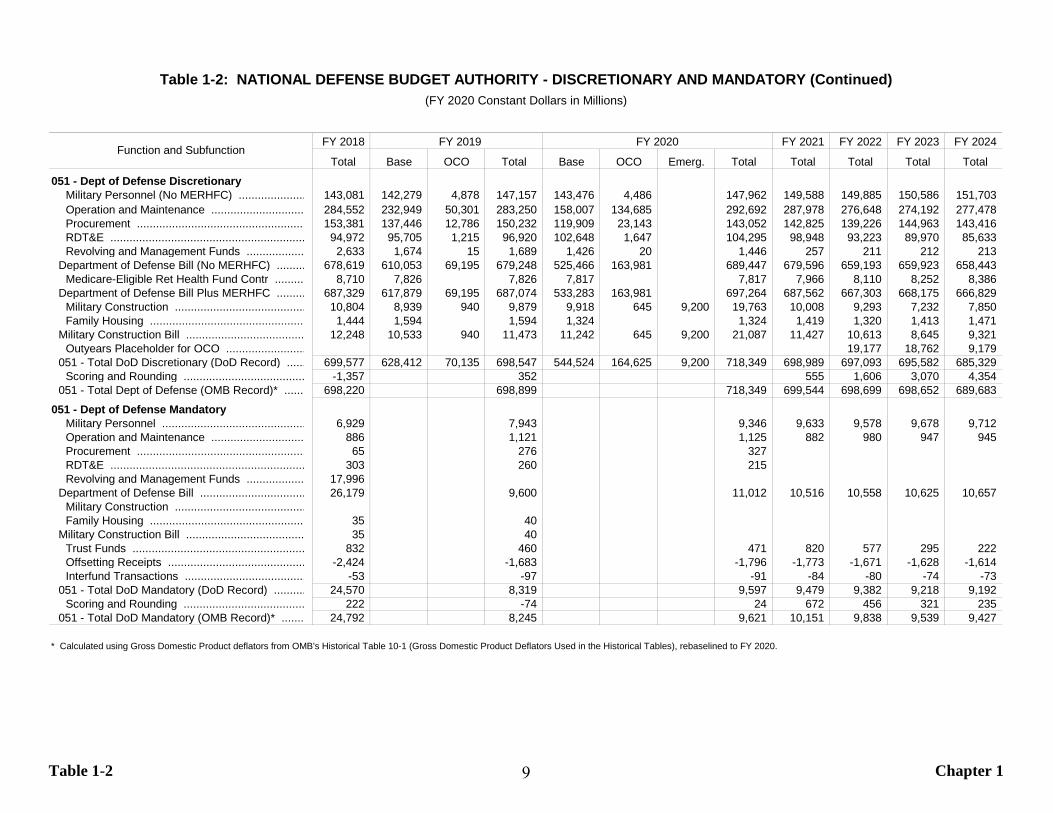
Table 1-2 Chapter 1
FY 2018 FY 2021 FY 2022 FY 2023 FY 2024
Total Base OCO Total Base OCO Emerg. Total Total Total Total Total051 - Dept of Defense Discretionary
Military Personnel (No MERHFC) ..................... 143,081 142,279 4,878 147,157 143,476 4,486 147,962 149,588 149,885 150,586 151,703 Operation and Maintenance ............................. 284,552 232,949 50,301 283,250 158,007 134,685 292,692 287,978 276,648 274,192 277,478 Procurement ..................................................... 153,381 137,446 12,786 150,232 119,909 23,143 143,052 142,825 139,226 144,963 143,416 RDT&E ............................................................. 94,972 95,705 1,215 96,920 102,648 1,647 104,295 98,948 93,223 89,970 85,633 Revolving and Management Funds .................. 2,633 1,674 15 1,689 1,426 20 1,446 257 211 212 213
Department of Defense Bill (No MERHFC) ......... 678,619 610,053 69,195 679,248 525,466 163,981 689,447 679,596 659,193 659,923 658,443 Medicare-Eligible Ret Health Fund Contr .......... 8,710 7,826 7,826 7,817 7,817 7,966 8,110 8,252 8,386
Department of Defense Bill Plus MERHFC ......... 687,329 617,879 69,195 687,074 533,283 163,981 697,264 687,562 667,303 668,175 666,829 Military Construction ......................................... 10,804 8,939 940 9,879 9,918 645 9,200 19,763 10,008 9,293 7,232 7,850 Family Housing ................................................. 1,444 1,594 1,594 1,324 1,324 1,419 1,320 1,413 1,471
Military Construction Bill ..................................... 12,248 10,533 940 11,473 11,242 645 9,200 21,087 11,427 10,613 8,645 9,321 Outyears Placeholder for OCO ......................... 19,177 18,762 9,179
051 - Total DoD Discretionary (DoD Record) ...... 699,577 628,412 70,135 698,547 544,524 164,625 9,200 718,349 698,989 697,093 695,582 685,329 Scoring and Rounding ...................................... -1,357 352 555 1,606 3,070 4,354
051 - Total Dept of Defense (OMB Record)* ....... 698,220 698,899 718,349 699,544 698,699 698,652 689,683 051 - Dept of Defense Mandatory
Military Personnel ............................................. 6,929 7,943 9,346 9,633 9,578 9,678 9,712 Operation and Maintenance ............................. 886 1,121 1,125 882 980 947 945 Procurement ..................................................... 65 276 327 RDT&E ............................................................. 303 260 215 Revolving and Management Funds .................. 17,996
Department of Defense Bill ................................. 26,179 9,600 11,012 10,516 10,558 10,625 10,657 Military Construction ......................................... Family Housing ................................................. 35 40
Military Construction Bill ..................................... 35 40 Trust Funds ...................................................... 832 460 471 820 577 295 222 Offsetting Receipts ........................................... -2,424 -1,683 -1,796 -1,773 -1,671 -1,628 -1,614 Interfund Transactions ...................................... -53 -97 -91 -84 -80 -74 -73
051 - Total DoD Mandatory (DoD Record) .......... 24,570 8,319 9,597 9,479 9,382 9,218 9,192 Scoring and Rounding ...................................... 222 -74 24 672 456 321 235
051 - Total DoD Mandatory (OMB Record)* ....... 24,792 8,245 9,621 10,151 9,838 9,539 9,427
* Calculated using Gross Domestic Product deflators from OMB's Historical Table 10-1 (Gross Domestic Product Deflators Used in the Historical Tables), rebaselined to FY 2020.
XFY 2019 FY 2020
Table 1-2: NATIONAL DEFENSE BUDGET AUTHORITY - DISCRETIONARY AND MANDATORY (Continued)(FY 2020 Constant Dollars in Millions)
Function and Subfunction
9
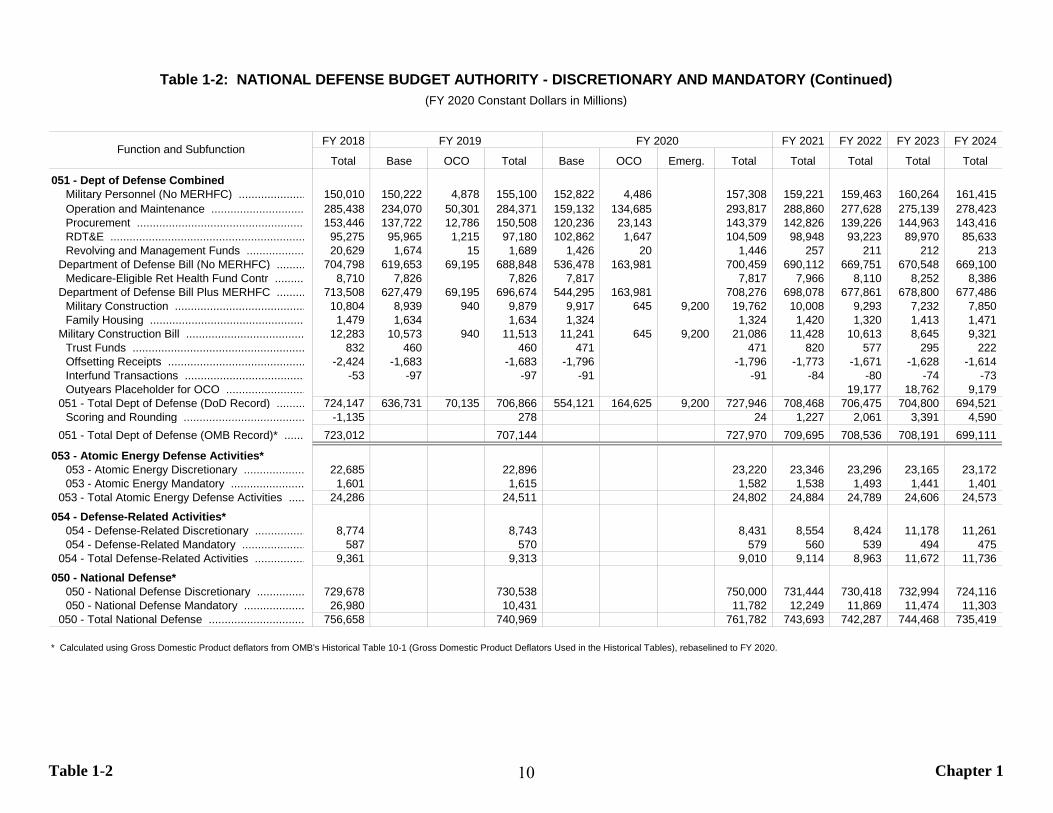
Table 1-2 Chapter 1
FY 2018 FY 2021 FY 2022 FY 2023 FY 2024
Total Base OCO Total Base OCO Emerg. Total Total Total Total Total051 - Dept of Defense Combined
Military Personnel (No MERHFC) ..................... 150,010 150,222 4,878 155,100 152,822 4,486 157,308 159,221 159,463 160,264 161,415 Operation and Maintenance ............................. 285,438 234,070 50,301 284,371 159,132 134,685 293,817 288,860 277,628 275,139 278,423 Procurement ..................................................... 153,446 137,722 12,786 150,508 120,236 23,143 143,379 142,826 139,226 144,963 143,416 RDT&E ............................................................. 95,275 95,965 1,215 97,180 102,862 1,647 104,509 98,948 93,223 89,970 85,633 Revolving and Management Funds .................. 20,629 1,674 15 1,689 1,426 20 1,446 257 211 212 213
Department of Defense Bill (No MERHFC) ......... 704,798 619,653 69,195 688,848 536,478 163,981 700,459 690,112 669,751 670,548 669,100 Medicare-Eligible Ret Health Fund Contr .......... 8,710 7,826 7,826 7,817 7,817 7,966 8,110 8,252 8,386
Department of Defense Bill Plus MERHFC ......... 713,508 627,479 69,195 696,674 544,295 163,981 708,276 698,078 677,861 678,800 677,486 Military Construction ......................................... 10,804 8,939 940 9,879 9,917 645 9,200 19,762 10,008 9,293 7,232 7,850 Family Housing ................................................. 1,479 1,634 1,634 1,324 1,324 1,420 1,320 1,413 1,471
Military Construction Bill ..................................... 12,283 10,573 940 11,513 11,241 645 9,200 21,086 11,428 10,613 8,645 9,321 Trust Funds ...................................................... 832 460 460 471 471 820 577 295 222 Offsetting Receipts ........................................... -2,424 -1,683 -1,683 -1,796 -1,796 -1,773 -1,671 -1,628 -1,614 Interfund Transactions ...................................... -53 -97 -97 -91 -91 -84 -80 -74 -73 Outyears Placeholder for OCO ......................... 19,177 18,762 9,179
051 - Total Dept of Defense (DoD Record) ......... 724,147 636,731 70,135 706,866 554,121 164,625 9,200 727,946 708,468 706,475 704,800 694,521 Scoring and Rounding ...................................... -1,135 278 24 1,227 2,061 3,391 4,590
051 - Total Dept of Defense (OMB Record)* ....... 723,012 707,144 727,970 709,695 708,536 708,191 699,111
053 - Atomic Energy Defense Activities* 053 - Atomic Energy Discretionary ................... 22,685 22,896 23,220 23,346 23,296 23,165 23,172 053 - Atomic Energy Mandatory ....................... 1,601 1,615 1,582 1,538 1,493 1,441 1,401
053 - Total Atomic Energy Defense Activities ..... 24,286 24,511 24,802 24,884 24,789 24,606 24,573 054 - Defense-Related Activities*
054 - Defense-Related Discretionary ................ 8,774 8,743 8,431 8,554 8,424 11,178 11,261 054 - Defense-Related Mandatory .................... 587 570 579 560 539 494 475
054 - Total Defense-Related Activities ................ 9,361 9,313 9,010 9,114 8,963 11,672 11,736 050 - National Defense*
050 - National Defense Discretionary ............... 729,678 730,538 750,000 731,444 730,418 732,994 724,116 050 - National Defense Mandatory ................... 26,980 10,431 11,782 12,249 11,869 11,474 11,303
050 - Total National Defense .............................. 756,658 740,969 761,782 743,693 742,287 744,468 735,419
* Calculated using Gross Domestic Product deflators from OMB's Historical Table 10-1 (Gross Domestic Product Deflators Used in the Historical Tables), rebaselined to FY 2020.
Table 1-2: NATIONAL DEFENSE BUDGET AUTHORITY - DISCRETIONARY AND MANDATORY (Continued)(FY 2020 Constant Dollars in Millions)
Function and SubfunctionXFY 2019 FY 2020
10
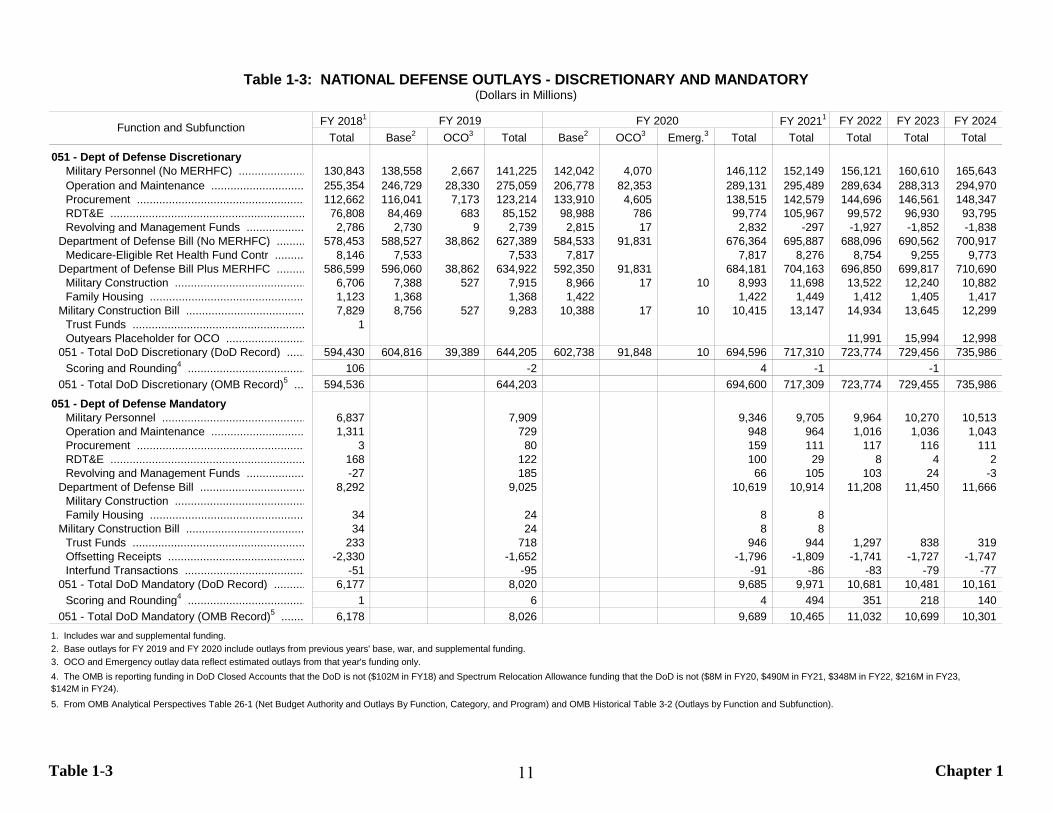
Table 1-3 Chapter 1
FY 20181 FY 20211 FY 2022 FY 2023 FY 2024Total Base2 OCO3 Total Base2 OCO3 Emerg.3 Total Total Total Total Total
051 - Dept of Defense DiscretionaryMilitary Personnel (No MERHFC) ..................... 130,843 138,558 2,667 141,225 142,042 4,070 146,112 152,149 156,121 160,610 165,643 Operation and Maintenance ............................. 255,354 246,729 28,330 275,059 206,778 82,353 289,131 295,489 289,634 288,313 294,970 Procurement ..................................................... 112,662 116,041 7,173 123,214 133,910 4,605 138,515 142,579 144,696 146,561 148,347 RDT&E ............................................................. 76,808 84,469 683 85,152 98,988 786 99,774 105,967 99,572 96,930 93,795 Revolving and Management Funds .................. 2,786 2,730 9 2,739 2,815 17 2,832 -297 -1,927 -1,852 -1,838
Department of Defense Bill (No MERHFC) ......... 578,453 588,527 38,862 627,389 584,533 91,831 676,364 695,887 688,096 690,562 700,917 Medicare-Eligible Ret Health Fund Contr .......... 8,146 7,533 7,533 7,817 7,817 8,276 8,754 9,255 9,773
Department of Defense Bill Plus MERHFC ......... 586,599 596,060 38,862 634,922 592,350 91,831 684,181 704,163 696,850 699,817 710,690 Military Construction ......................................... 6,706 7,388 527 7,915 8,966 17 10 8,993 11,698 13,522 12,240 10,882 Family Housing ................................................. 1,123 1,368 1,368 1,422 1,422 1,449 1,412 1,405 1,417
Military Construction Bill ..................................... 7,829 8,756 527 9,283 10,388 17 10 10,415 13,147 14,934 13,645 12,299 Trust Funds ...................................................... 1 Outyears Placeholder for OCO ......................... 11,991 15,994 12,998
051 - Total DoD Discretionary (DoD Record) ...... 594,430 604,816 39,389 644,205 602,738 91,848 10 694,596 717,310 723,774 729,456 735,986 Scoring and Rounding4 ..................................... 106 -2 4 -1 -1
051 - Total DoD Discretionary (OMB Record)5 ... 594,536 644,203 694,600 717,309 723,774 729,455 735,986 051 - Dept of Defense Mandatory
Military Personnel ............................................. 6,837 7,909 9,346 9,705 9,964 10,270 10,513 Operation and Maintenance ............................. 1,311 729 948 964 1,016 1,036 1,043 Procurement ..................................................... 3 80 159 111 117 116 111 RDT&E ............................................................. 168 122 100 29 8 4 2 Revolving and Management Funds .................. -27 185 66 105 103 24 -3
Department of Defense Bill ................................. 8,292 9,025 10,619 10,914 11,208 11,450 11,666 Military Construction ......................................... Family Housing ................................................. 34 24 8 8
Military Construction Bill ..................................... 34 24 8 8 Trust Funds ...................................................... 233 718 946 944 1,297 838 319 Offsetting Receipts ........................................... -2,330 -1,652 -1,796 -1,809 -1,741 -1,727 -1,747 Interfund Transactions ...................................... -51 -95 -91 -86 -83 -79 -77
051 - Total DoD Mandatory (DoD Record) .......... 6,177 8,020 9,685 9,971 10,681 10,481 10,161 Scoring and Rounding4 ..................................... 1 6 4 494 351 218 140
051 - Total DoD Mandatory (OMB Record)5 ........ 6,178 8,026 9,689 10,465 11,032 10,699 10,301 1. Includes war and supplemental funding.2. Base outlays for FY 2019 and FY 2020 include outlays from previous years' base, war, and supplemental funding.3. OCO and Emergency outlay data reflect estimated outlays from that year's funding only.
5. From OMB Analytical Perspectives Table 26-1 (Net Budget Authority and Outlays By Function, Category, and Program) and OMB Historical Table 3-2 (Outlays by Function and Subfunction).
4. The OMB is reporting funding in DoD Closed Accounts that the DoD is not ($102M in FY18) and Spectrum Relocation Allowance funding that the DoD is not ($8M in FY20, $490M in FY21, $348M in FY22, $216M in FY23,$142M in FY24).
Table 1-3: NATIONAL DEFENSE OUTLAYS - DISCRETIONARY AND MANDATORY(Dollars in Millions)
XFY 2019 FY 2020Function and Subfunction
11
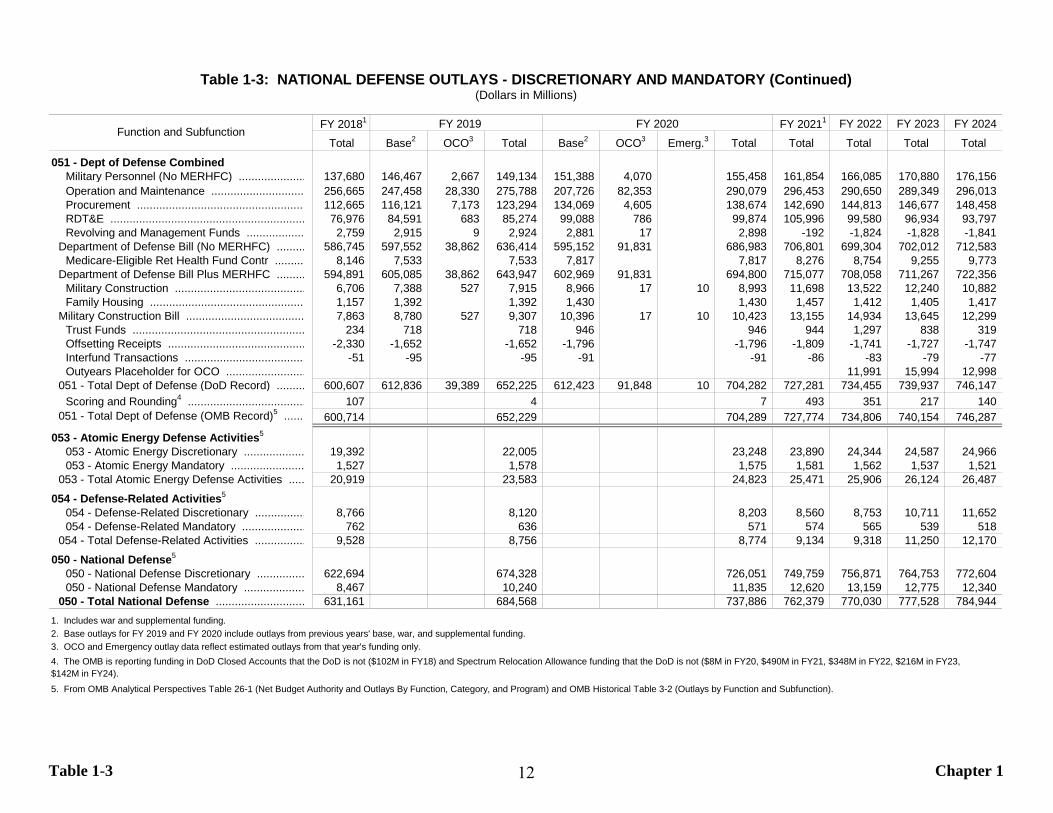
Table 1-3 Chapter 1
FY 20181 FY 20211 FY 2022 FY 2023 FY 2024Total Base2 OCO3 Total Base2 OCO3 Emerg.3 Total Total Total Total Total
051 - Dept of Defense CombinedMilitary Personnel (No MERHFC) ..................... 137,680 146,467 2,667 149,134 151,388 4,070 155,458 161,854 166,085 170,880 176,156 Operation and Maintenance ............................. 256,665 247,458 28,330 275,788 207,726 82,353 290,079 296,453 290,650 289,349 296,013 Procurement ..................................................... 112,665 116,121 7,173 123,294 134,069 4,605 138,674 142,690 144,813 146,677 148,458 RDT&E ............................................................. 76,976 84,591 683 85,274 99,088 786 99,874 105,996 99,580 96,934 93,797 Revolving and Management Funds .................. 2,759 2,915 9 2,924 2,881 17 2,898 -192 -1,824 -1,828 -1,841
Department of Defense Bill (No MERHFC) ......... 586,745 597,552 38,862 636,414 595,152 91,831 686,983 706,801 699,304 702,012 712,583 Medicare-Eligible Ret Health Fund Contr .......... 8,146 7,533 7,533 7,817 7,817 8,276 8,754 9,255 9,773
Department of Defense Bill Plus MERHFC ......... 594,891 605,085 38,862 643,947 602,969 91,831 694,800 715,077 708,058 711,267 722,356 Military Construction ......................................... 6,706 7,388 527 7,915 8,966 17 10 8,993 11,698 13,522 12,240 10,882 Family Housing ................................................. 1,157 1,392 1,392 1,430 1,430 1,457 1,412 1,405 1,417
Military Construction Bill ..................................... 7,863 8,780 527 9,307 10,396 17 10 10,423 13,155 14,934 13,645 12,299 Trust Funds ...................................................... 234 718 718 946 946 944 1,297 838 319 Offsetting Receipts ........................................... -2,330 -1,652 -1,652 -1,796 -1,796 -1,809 -1,741 -1,727 -1,747 Interfund Transactions ...................................... -51 -95 -95 -91 -91 -86 -83 -79 -77 Outyears Placeholder for OCO ......................... 11,991 15,994 12,998
051 - Total Dept of Defense (DoD Record) ......... 600,607 612,836 39,389 652,225 612,423 91,848 10 704,282 727,281 734,455 739,937 746,147 Scoring and Rounding4 ..................................... 107 4 7 493 351 217 140
051 - Total Dept of Defense (OMB Record)5 ....... 600,714 652,229 704,289 727,774 734,806 740,154 746,287
053 - Atomic Energy Defense Activities5 053 - Atomic Energy Discretionary ................... 19,392 22,005 23,248 23,890 24,344 24,587 24,966 053 - Atomic Energy Mandatory ....................... 1,527 1,578 1,575 1,581 1,562 1,537 1,521
053 - Total Atomic Energy Defense Activities ..... 20,919 23,583 24,823 25,471 25,906 26,124 26,487 054 - Defense-Related Activities5
054 - Defense-Related Discretionary ................ 8,766 8,120 8,203 8,560 8,753 10,711 11,652 054 - Defense-Related Mandatory .................... 762 636 571 574 565 539 518
054 - Total Defense-Related Activities ................ 9,528 8,756 8,774 9,134 9,318 11,250 12,170 050 - National Defense5
050 - National Defense Discretionary ............... 622,694 674,328 726,051 749,759 756,871 764,753 772,604 050 - National Defense Mandatory ................... 8,467 10,240 11,835 12,620 13,159 12,775 12,340
050 - Total National Defense ............................ 631,161 684,568 737,886 762,379 770,030 777,528 784,944 1. Includes war and supplemental funding.2. Base outlays for FY 2019 and FY 2020 include outlays from previous years' base, war, and supplemental funding.3. OCO and Emergency outlay data reflect estimated outlays from that year's funding only.
5. From OMB Analytical Perspectives Table 26-1 (Net Budget Authority and Outlays By Function, Category, and Program) and OMB Historical Table 3-2 (Outlays by Function and Subfunction).
4. The OMB is reporting funding in DoD Closed Accounts that the DoD is not ($102M in FY18) and Spectrum Relocation Allowance funding that the DoD is not ($8M in FY20, $490M in FY21, $348M in FY22, $216M in FY23,$142M in FY24).
Table 1-3: NATIONAL DEFENSE OUTLAYS - DISCRETIONARY AND MANDATORY (Continued)
Function and SubfunctionXFY 2019 FY 2020
(Dollars in Millions)
12
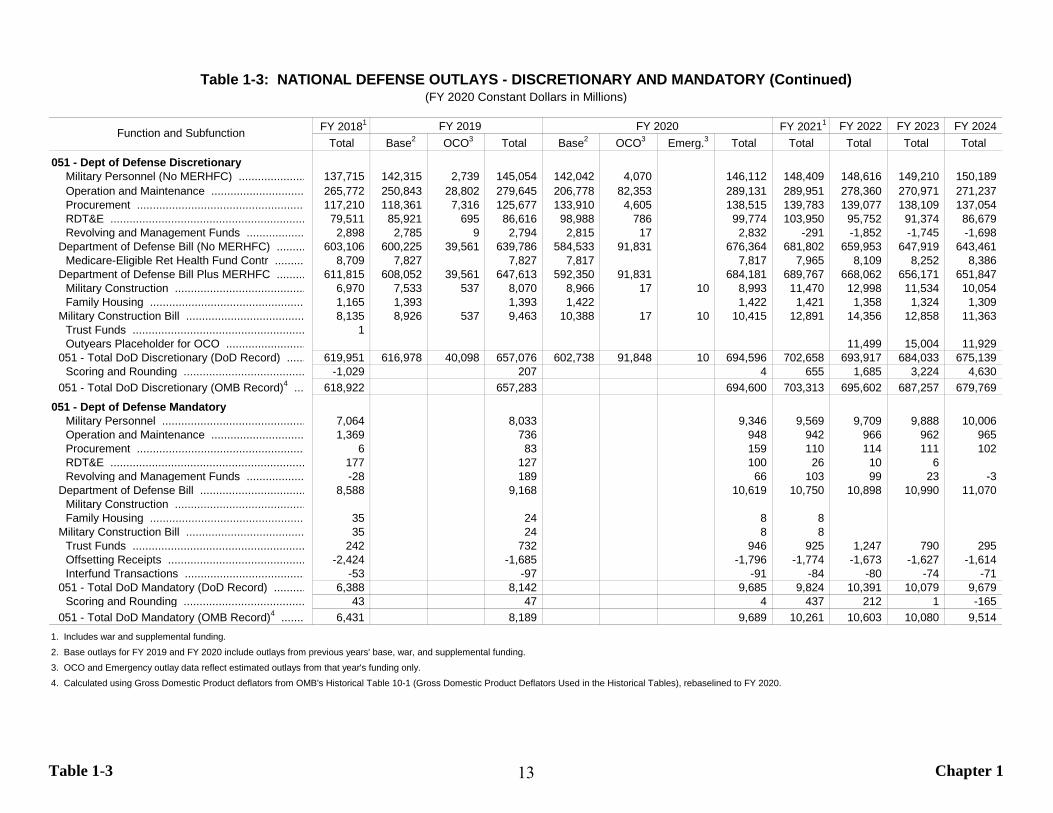
Table 1-3 Chapter 1
FY 20181 FY 20211 FY 2022 FY 2023 FY 2024Total Base2 OCO3 Total Base2 OCO3 Emerg.3 Total Total Total Total Total
051 - Dept of Defense DiscretionaryMilitary Personnel (No MERHFC) ..................... 137,715 142,315 2,739 145,054 142,042 4,070 146,112 148,409 148,616 149,210 150,189 Operation and Maintenance ............................. 265,772 250,843 28,802 279,645 206,778 82,353 289,131 289,951 278,360 270,971 271,237 Procurement ..................................................... 117,210 118,361 7,316 125,677 133,910 4,605 138,515 139,783 139,077 138,109 137,054 RDT&E ............................................................. 79,511 85,921 695 86,616 98,988 786 99,774 103,950 95,752 91,374 86,679 Revolving and Management Funds .................. 2,898 2,785 9 2,794 2,815 17 2,832 -291 -1,852 -1,745 -1,698
Department of Defense Bill (No MERHFC) ......... 603,106 600,225 39,561 639,786 584,533 91,831 676,364 681,802 659,953 647,919 643,461 Medicare-Eligible Ret Health Fund Contr .......... 8,709 7,827 7,827 7,817 7,817 7,965 8,109 8,252 8,386
Department of Defense Bill Plus MERHFC ......... 611,815 608,052 39,561 647,613 592,350 91,831 684,181 689,767 668,062 656,171 651,847 Military Construction ......................................... 6,970 7,533 537 8,070 8,966 17 10 8,993 11,470 12,998 11,534 10,054 Family Housing ................................................. 1,165 1,393 1,393 1,422 1,422 1,421 1,358 1,324 1,309
Military Construction Bill ..................................... 8,135 8,926 537 9,463 10,388 17 10 10,415 12,891 14,356 12,858 11,363 Trust Funds ...................................................... 1 Outyears Placeholder for OCO ......................... 11,499 15,004 11,929
051 - Total DoD Discretionary (DoD Record) ...... 619,951 616,978 40,098 657,076 602,738 91,848 10 694,596 702,658 693,917 684,033 675,139 Scoring and Rounding ...................................... -1,029 207 4 655 1,685 3,224 4,630
051 - Total DoD Discretionary (OMB Record)4 ... 618,922 657,283 694,600 703,313 695,602 687,257 679,769 051 - Dept of Defense Mandatory
Military Personnel ............................................. 7,064 8,033 9,346 9,569 9,709 9,888 10,006 Operation and Maintenance ............................. 1,369 736 948 942 966 962 965 Procurement ..................................................... 6 83 159 110 114 111 102 RDT&E ............................................................. 177 127 100 26 10 6 Revolving and Management Funds .................. -28 189 66 103 99 23 -3
Department of Defense Bill ................................. 8,588 9,168 10,619 10,750 10,898 10,990 11,070 Military Construction ......................................... Family Housing ................................................. 35 24 8 8
Military Construction Bill ..................................... 35 24 8 8 Trust Funds ...................................................... 242 732 946 925 1,247 790 295 Offsetting Receipts ........................................... -2,424 -1,685 -1,796 -1,774 -1,673 -1,627 -1,614 Interfund Transactions ...................................... -53 -97 -91 -84 -80 -74 -71
051 - Total DoD Mandatory (DoD Record) .......... 6,388 8,142 9,685 9,824 10,391 10,079 9,679 Scoring and Rounding ...................................... 43 47 4 437 212 1 -165
051 - Total DoD Mandatory (OMB Record)4 ........ 6,431 8,189 9,689 10,261 10,603 10,080 9,514 1. Includes war and supplemental funding.2. Base outlays for FY 2019 and FY 2020 include outlays from previous years' base, war, and supplemental funding.3. OCO and Emergency outlay data reflect estimated outlays from that year's funding only.4. Calculated using Gross Domestic Product deflators from OMB's Historical Table 10-1 (Gross Domestic Product Deflators Used in the Historical Tables), rebaselined to FY 2020.
Table 1-3: NATIONAL DEFENSE OUTLAYS - DISCRETIONARY AND MANDATORY (Continued)(FY 2020 Constant Dollars in Millions)
Function and Subfunction XFY 2019 FY 2020
13
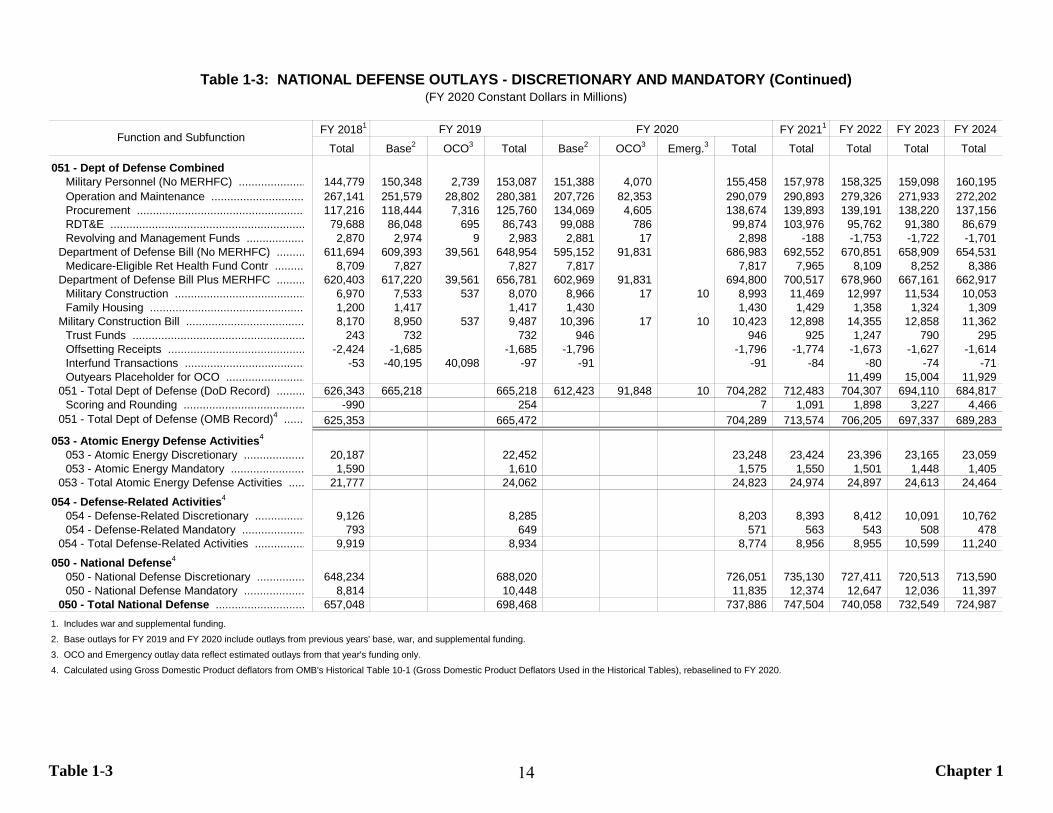
Table 1-3 Chapter 1
FY 20181 FY 20211 FY 2022 FY 2023 FY 2024Total Base2 OCO3 Total Base2 OCO3 Emerg.3 Total Total Total Total Total
051 - Dept of Defense CombinedMilitary Personnel (No MERHFC) ..................... 144,779 150,348 2,739 153,087 151,388 4,070 155,458 157,978 158,325 159,098 160,195 Operation and Maintenance ............................. 267,141 251,579 28,802 280,381 207,726 82,353 290,079 290,893 279,326 271,933 272,202 Procurement ..................................................... 117,216 118,444 7,316 125,760 134,069 4,605 138,674 139,893 139,191 138,220 137,156 RDT&E ............................................................. 79,688 86,048 695 86,743 99,088 786 99,874 103,976 95,762 91,380 86,679 Revolving and Management Funds .................. 2,870 2,974 9 2,983 2,881 17 2,898 -188 -1,753 -1,722 -1,701
Department of Defense Bill (No MERHFC) ......... 611,694 609,393 39,561 648,954 595,152 91,831 686,983 692,552 670,851 658,909 654,531 Medicare-Eligible Ret Health Fund Contr .......... 8,709 7,827 7,827 7,817 7,817 7,965 8,109 8,252 8,386
Department of Defense Bill Plus MERHFC ......... 620,403 617,220 39,561 656,781 602,969 91,831 694,800 700,517 678,960 667,161 662,917 Military Construction ......................................... 6,970 7,533 537 8,070 8,966 17 10 8,993 11,469 12,997 11,534 10,053 Family Housing ................................................. 1,200 1,417 1,417 1,430 1,430 1,429 1,358 1,324 1,309
Military Construction Bill ..................................... 8,170 8,950 537 9,487 10,396 17 10 10,423 12,898 14,355 12,858 11,362 Trust Funds ...................................................... 243 732 732 946 946 925 1,247 790 295 Offsetting Receipts ........................................... -2,424 -1,685 -1,685 -1,796 -1,796 -1,774 -1,673 -1,627 -1,614Interfund Transactions ...................................... -53 -40,195 40,098 -97 -91 -91 -84 -80 -74 -71Outyears Placeholder for OCO ......................... 11,499 15,004 11,929
051 - Total Dept of Defense (DoD Record) ......... 626,343 665,218 665,218 612,423 91,848 10 704,282 712,483 704,307 694,110 684,817 Scoring and Rounding ...................................... -990 254 7 1,091 1,898 3,227 4,466
051 - Total Dept of Defense (OMB Record)4 ....... 625,353 665,472 704,289 713,574 706,205 697,337 689,283
053 - Atomic Energy Defense Activities4
053 - Atomic Energy Discretionary ................... 20,187 22,452 23,248 23,424 23,396 23,165 23,059 053 - Atomic Energy Mandatory ....................... 1,590 1,610 1,575 1,550 1,501 1,448 1,405
053 - Total Atomic Energy Defense Activities ..... 21,777 24,062 24,823 24,974 24,897 24,613 24,464 054 - Defense-Related Activities4
054 - Defense-Related Discretionary ................ 9,126 8,285 8,203 8,393 8,412 10,091 10,762 054 - Defense-Related Mandatory .................... 793 649 571 563 543 508 478
054 - Total Defense-Related Activities ................ 9,919 8,934 8,774 8,956 8,955 10,599 11,240 050 - National Defense4
050 - National Defense Discretionary ............... 648,234 688,020 726,051 735,130 727,411 720,513 713,590 050 - National Defense Mandatory ................... 8,814 10,448 11,835 12,374 12,647 12,036 11,397
050 - Total National Defense ............................ 657,048 698,468 737,886 747,504 740,058 732,549 724,987 1. Includes war and supplemental funding.2. Base outlays for FY 2019 and FY 2020 include outlays from previous years' base, war, and supplemental funding.3. OCO and Emergency outlay data reflect estimated outlays from that year's funding only.4. Calculated using Gross Domestic Product deflators from OMB's Historical Table 10-1 (Gross Domestic Product Deflators Used in the Historical Tables), rebaselined to FY 2020.
Table 1-3: NATIONAL DEFENSE OUTLAYS - DISCRETIONARY AND MANDATORY (Continued)(FY 2020 Constant Dollars in Millions)
Function and SubfunctionXFY 2019 FY 2020
14

Table 1-4 Chapter 1
FY 2018 FY 2019 FY 2020 FY 2021 FY 2022 FY 2023 FY 2024
050 National Defense ........................................................................ 726.8 726.2 761.8 758.5 772.4 790.2 796.2150 International Affairs .................................................................... 80.3 75.4 51.0 51.0 48.8 48.1 49.0250 General Science, Space, and Technology .................................. 34.4 34.5 33.1 33.0 33.0 33.0 33.0270 Energy ........................................................................................ 6.0 6.2 -3.1 -5.9 0.2 -0.8 -1.9300 Natural Resources and Environment .......................................... 63.9 42.3 39.8 36.2 35.8 35.9 35.7350 Agriculture .................................................................................. 15.1 35.5 21.0 17.4 18.2 17.4 16.9370 Commerce and Housing Credit .................................................. 11.5 2.4 6.8 -1.1 -0.1 2.7400 Transportation ............................................................................ 104.6 103.2 89.9 96.5 96.2 96.2 96.2450 Community and Regional Development ..................................... 100.5 23.6 28.0 16.2 16.2 16.2 16.2500 Education, Training, Employment, and Social Services .............. 107.6 142.9 102.7 101.8 99.0 95.9 93.3550 Health ......................................................................................... 594.3 598.3 601.1 662.5 644.0 664.7 669.3570 Medicare .................................................................................... 606.3 695.3 705.8 717.7 806.5 828.8 846.9600 Income Security ......................................................................... 513.2 540.4 517.5 523.6 540.9 551.6 558.8650 Social Security ........................................................................... 989.7 1,052.5 1,112.7 1,176.5 1,245.4 1,318.9 1,396.6700 Veterans Benefits and Services ................................................. 192.4 194.8 216.5 234.0 245.1 254.2 263.4750 Administration of Justice ............................................................ 66.4 63.3 68.7 71.0 72.3 73.9 75.4800 General Government .................................................................. 25.7 27.8 39.2 29.3 30.6 30.6 31.1900 Net Interest ................................................................................ 325.0 393.5 478.8 547.5 609.9 663.7 701.7920 Allowances ................................................................................. -0.8 183.4 -55.4 -69.3 -82.7 -95.3950 Undistributed Offsetting Receipts ............................................... -97.9 -96.9 -110.4 -101.8 -103.5 -101.8 -102.4
Grand Total ............................................................................... 4,465.7 4,660.5 4,944.3 4,908.7 5,141.5 5,334.1 5,482.9
From OMB Historical Table 5-1 (Budget Authority by Function and Subfunction).
Table 1-4: FEDERAL UNIFIED BUDGET - BUDGET AUTHORITY BY FUNCTION(Dollars in Billions)
Function
15
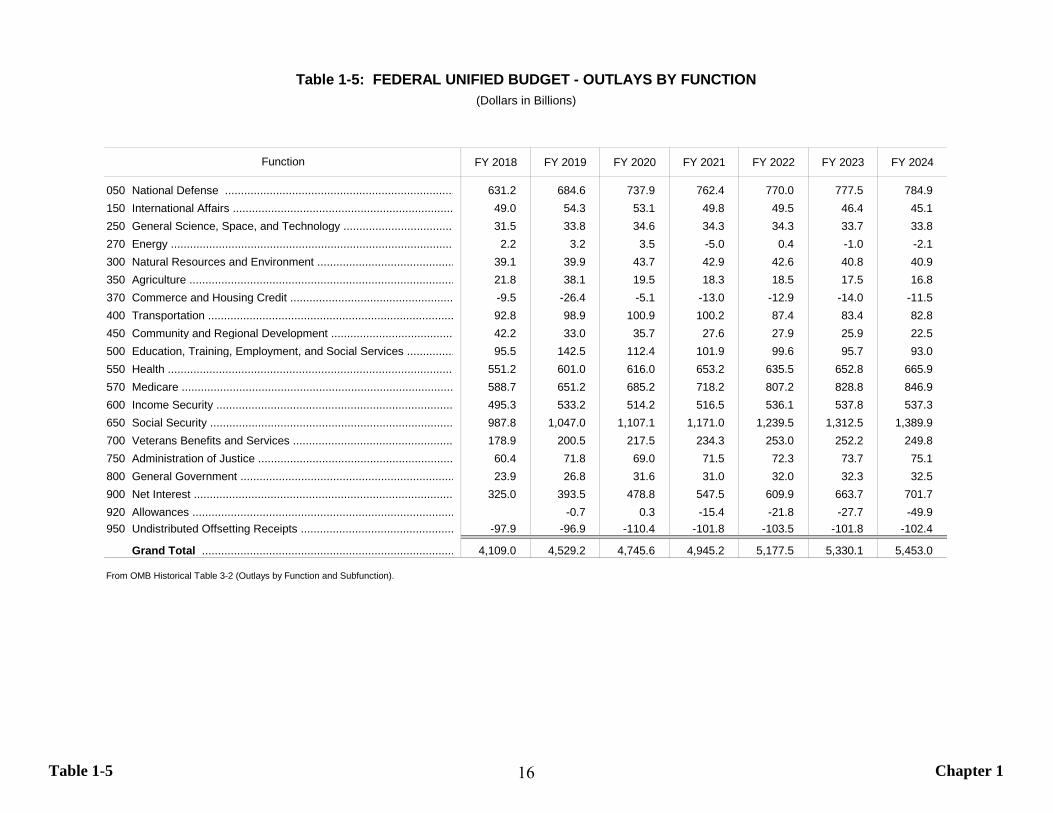
Table 1-5 Chapter 1
FY 2018 FY 2019 FY 2020 FY 2021 FY 2022 FY 2023 FY 2024
050 National Defense ........................................................................ 631.2 684.6 737.9 762.4 770.0 777.5 784.9150 International Affairs ..................................................................... 49.0 54.3 53.1 49.8 49.5 46.4 45.1250 General Science, Space, and Technology ................................... 31.5 33.8 34.6 34.3 34.3 33.7 33.8270 Energy ......................................................................................... 2.2 3.2 3.5 -5.0 0.4 -1.0 -2.1300 Natural Resources and Environment ........................................... 39.1 39.9 43.7 42.9 42.6 40.8 40.9350 Agriculture ................................................................................... 21.8 38.1 19.5 18.3 18.5 17.5 16.8370 Commerce and Housing Credit ................................................... -9.5 -26.4 -5.1 -13.0 -12.9 -14.0 -11.5400 Transportation ............................................................................. 92.8 98.9 100.9 100.2 87.4 83.4 82.8450 Community and Regional Development ...................................... 42.2 33.0 35.7 27.6 27.9 25.9 22.5500 Education, Training, Employment, and Social Services ............... 95.5 142.5 112.4 101.9 99.6 95.7 93.0550 Health .......................................................................................... 551.2 601.0 616.0 653.2 635.5 652.8 665.9570 Medicare ..................................................................................... 588.7 651.2 685.2 718.2 807.2 828.8 846.9600 Income Security .......................................................................... 495.3 533.2 514.2 516.5 536.1 537.8 537.3650 Social Security ............................................................................ 987.8 1,047.0 1,107.1 1,171.0 1,239.5 1,312.5 1,389.9700 Veterans Benefits and Services .................................................. 178.9 200.5 217.5 234.3 253.0 252.2 249.8750 Administration of Justice ............................................................. 60.4 71.8 69.0 71.5 72.3 73.7 75.1800 General Government ................................................................... 23.9 26.8 31.6 31.0 32.0 32.3 32.5900 Net Interest ................................................................................. 325.0 393.5 478.8 547.5 609.9 663.7 701.7920 Allowances .................................................................................. -0.7 0.3 -15.4 -21.8 -27.7 -49.9950 Undistributed Offsetting Receipts ................................................ -97.9 -96.9 -110.4 -101.8 -103.5 -101.8 -102.4
Grand Total ............................................................................... 4,109.0 4,529.2 4,745.6 4,945.2 5,177.5 5,330.1 5,453.0
From OMB Historical Table 3-2 (Outlays by Function and Subfunction).
Table 1-5: FEDERAL UNIFIED BUDGET - OUTLAYS BY FUNCTION(Dollars in Billions)
Function
16
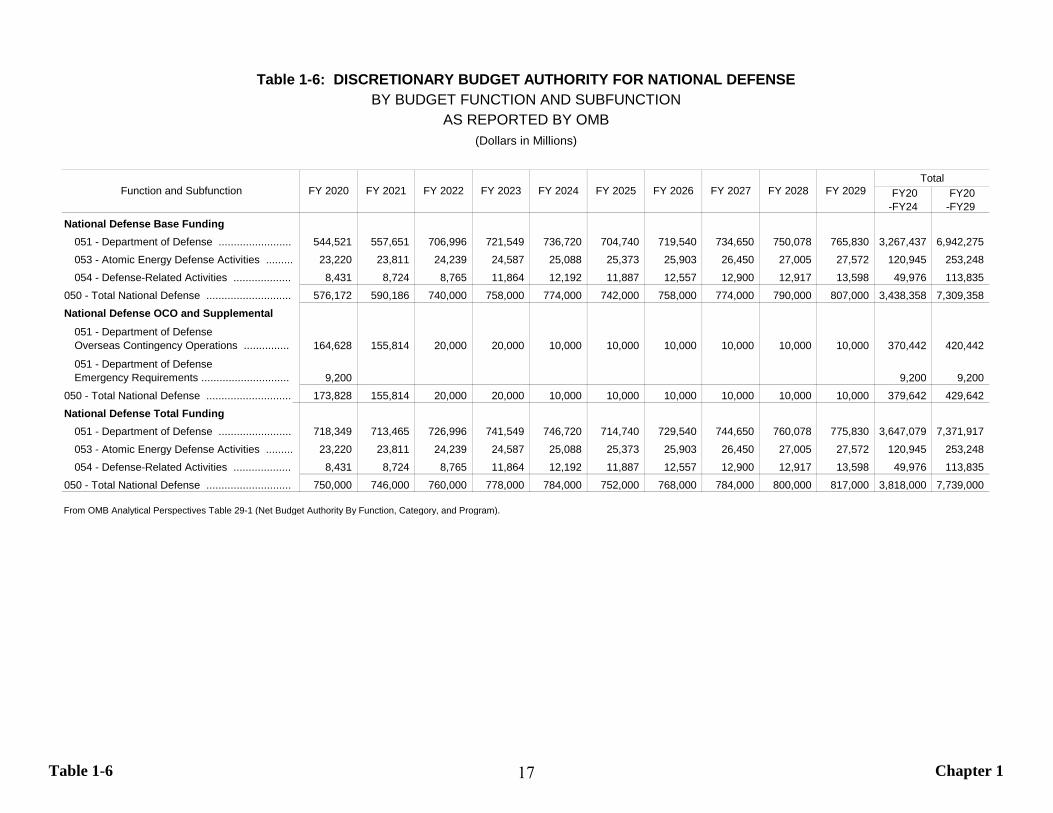
Table 1-6 Chapter 1
FY20-FY24
FY20-FY29
National Defense Base Funding 051 - Department of Defense ........................ 544,521 557,651 706,996 721,549 736,720 704,740 719,540 734,650 750,078 765,830 3,267,437 6,942,275 053 - Atomic Energy Defense Activities ......... 23,220 23,811 24,239 24,587 25,088 25,373 25,903 26,450 27,005 27,572 120,945 253,248 054 - Defense-Related Activities .................... 8,431 8,724 8,765 11,864 12,192 11,887 12,557 12,900 12,917 13,598 49,976 113,835
050 - Total National Defense ............................ 576,172 590,186 740,000 758,000 774,000 742,000 758,000 774,000 790,000 807,000 3,438,358 7,309,358 National Defense OCO and Supplemental
051 - Department of DefenseOverseas Contingency Operations ............... 164,628 155,814 20,000 20,000 10,000 10,000 10,000 10,000 10,000 10,000 370,442 420,442
051 - Department of DefenseEmergency Requirements ............................. 9,200 9,200 9,200
050 - Total National Defense ............................ 173,828 155,814 20,000 20,000 10,000 10,000 10,000 10,000 10,000 10,000 379,642 429,642 National Defense Total Funding
051 - Department of Defense ........................ 718,349 713,465 726,996 741,549 746,720 714,740 729,540 744,650 760,078 775,830 3,647,079 7,371,917 053 - Atomic Energy Defense Activities ......... 23,220 23,811 24,239 24,587 25,088 25,373 25,903 26,450 27,005 27,572 120,945 253,248 054 - Defense-Related Activities .................... 8,431 8,724 8,765 11,864 12,192 11,887 12,557 12,900 12,917 13,598 49,976 113,835
050 - Total National Defense ............................ 750,000 746,000 760,000 778,000 784,000 752,000 768,000 784,000 800,000 817,000 3,818,000 7,739,000
From OMB Analytical Perspectives Table 29-1 (Net Budget Authority By Function, Category, and Program).
Function and Subfunction
Table 1-6: DISCRETIONARY BUDGET AUTHORITY FOR NATIONAL DEFENSEBY BUDGET FUNCTION AND SUBFUNCTION
AS REPORTED BY OMB
TotalFY 2020 FY 2021 FY 2022 FY 2023 FY 2024 FY 2025 FY 2026 FY 2027 FY 2028 FY 2029
(Dollars in Millions)
17
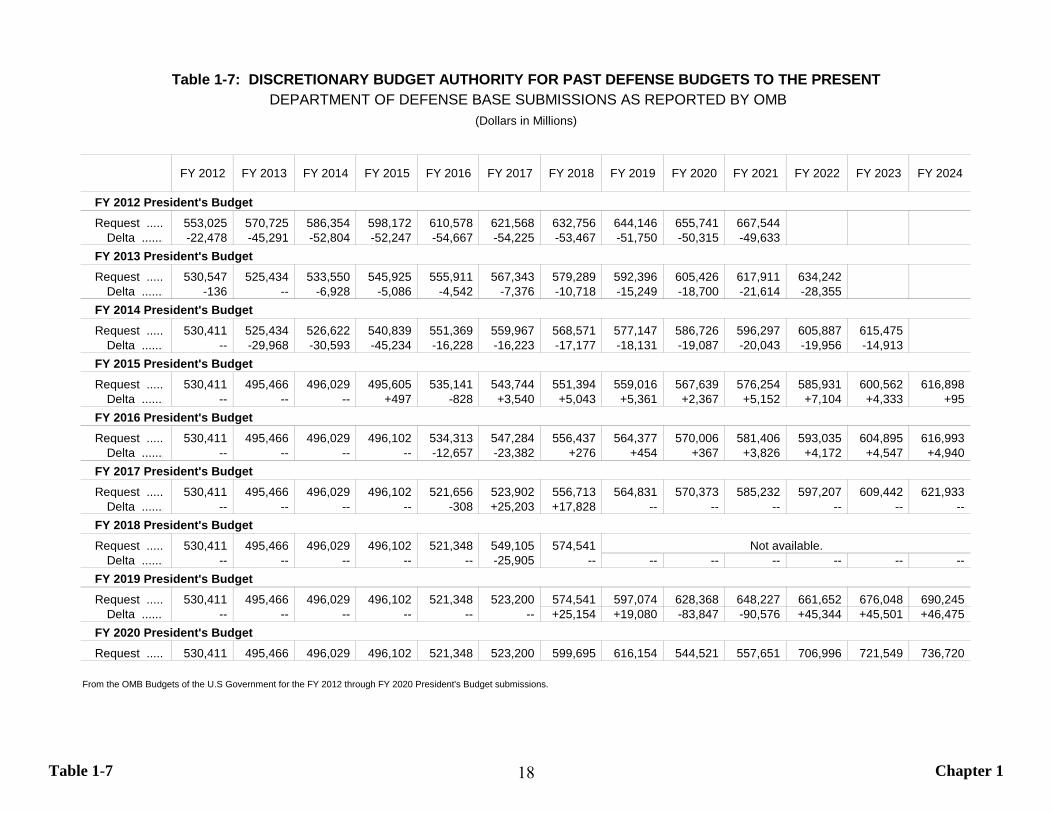
Table 1-7 Chapter 1
FY 2012 FY 2013 FY 2014 FY 2015 FY 2016 FY 2017 FY 2018 FY 2019 FY 2020 FY 2021 FY 2022 FY 2023 FY 2024
FY 2012 President's BudgetRequest ..... 553,025 570,725 586,354 598,172 610,578 621,568 632,756 644,146 655,741 667,544
Delta ....... -22,478 -45,291 -52,804 -52,247 -54,667 -54,225 -53,467 -51,750 -50,315 -49,633 FY 2013 President's BudgetRequest ..... 530,547 525,434 533,550 545,925 555,911 567,343 579,289 592,396 605,426 617,911 634,242
Delta ....... -136 -- -6,928 -5,086 -4,542 -7,376 -10,718 -15,249 -18,700 -21,614 -28,355 FY 2014 President's BudgetRequest ..... 530,411 525,434 526,622 540,839 551,369 559,967 568,571 577,147 586,726 596,297 605,887 615,475
Delta ....... -- -29,968 -30,593 -45,234 -16,228 -16,223 -17,177 -18,131 -19,087 -20,043 -19,956 -14,913 FY 2015 President's BudgetRequest ..... 530,411 495,466 496,029 495,605 535,141 543,744 551,394 559,016 567,639 576,254 585,931 600,562 616,898
Delta ....... -- -- -- +497 -828 +3,540 +5,043 +5,361 +2,367 +5,152 +7,104 +4,333 +95 FY 2016 President's BudgetRequest ..... 530,411 495,466 496,029 496,102 534,313 547,284 556,437 564,377 570,006 581,406 593,035 604,895 616,993
Delta ....... -- -- -- -- -12,657 -23,382 +276 +454 +367 +3,826 +4,172 +4,547 +4,940 FY 2017 President's BudgetRequest ..... 530,411 495,466 496,029 496,102 521,656 523,902 556,713 564,831 570,373 585,232 597,207 609,442 621,933
Delta ....... -- -- -- -- -308 +25,203 +17,828 -- -- -- -- -- -- FY 2018 President's BudgetRequest ..... 530,411 495,466 496,029 496,102 521,348 549,105 574,541
Delta ....... -- -- -- -- -- -25,905 -- -- -- -- -- -- -- FY 2019 President's BudgetRequest ..... 530,411 495,466 496,029 496,102 521,348 523,200 574,541 597,074 628,368 648,227 661,652 676,048 690,245
Delta ....... -- -- -- -- -- -- +25,154 +19,080 -83,847 -90,576 +45,344 +45,501 +46,475 FY 2020 President's BudgetRequest ..... 530,411 495,466 496,029 496,102 521,348 523,200 599,695 616,154 544,521 557,651 706,996 721,549 736,720
From the OMB Budgets of the U.S Government for the FY 2012 through FY 2020 President's Budget submissions.
Table 1-7: DISCRETIONARY BUDGET AUTHORITY FOR PAST DEFENSE BUDGETS TO THE PRESENT
(Dollars in Millions) DEPARTMENT OF DEFENSE BASE SUBMISSIONS AS REPORTED BY OMB
Not available.
18
Introduction Chapter 2
Chapter 2: Base Budget, War Funding and Supplementals
Tables Page2-1 Base Budget, War Funding and Supplementals by Military Department, by P.L. Title (FY 2001 to FY 2020)..................................................... 20
This chapter provides data on war and supplemental funding forthe Department of Defense since FY 2001, in addition to the basebudget. War and supplemental authorities presented here includethe American Recovery and Reinvestment Act of 2009, disaster
assistance, the Global War on Terror, Overseas ContingencyOperations, and funding for other emergency and unanticipatedurgent requirements.
19
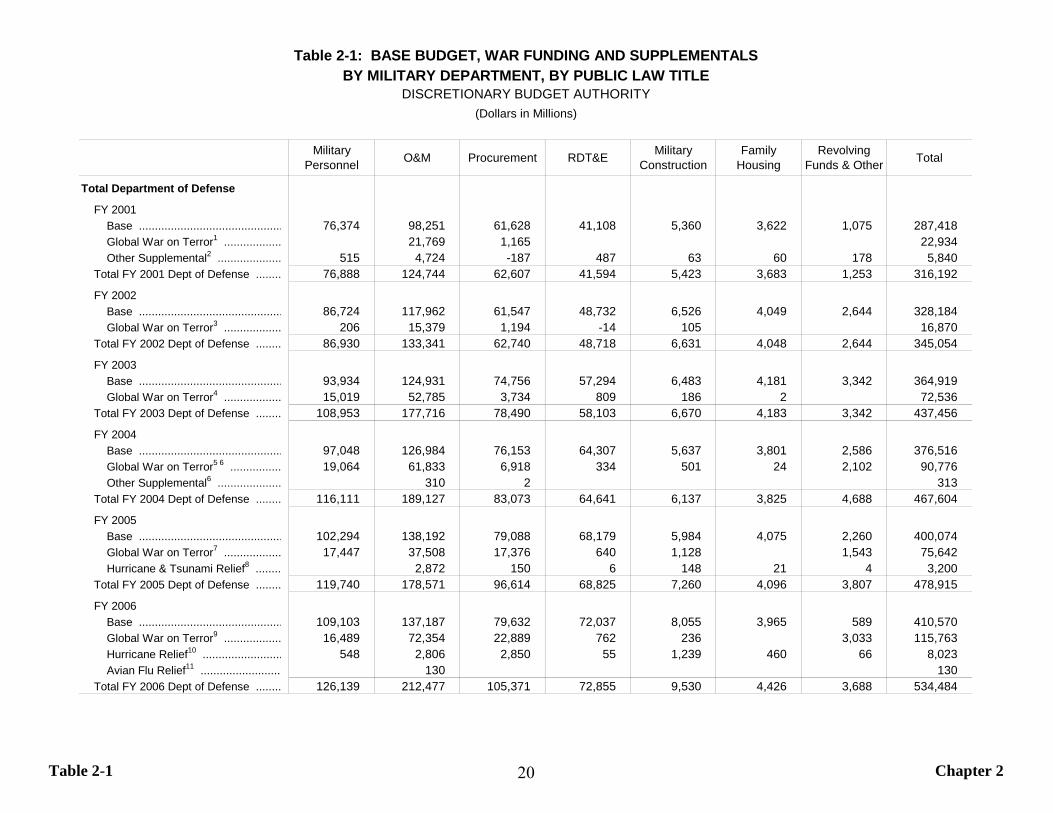
Table 2-1 Chapter 2
Military Personnel O&M Procurement RDT&E Military
ConstructionFamily
HousingRevolving
Funds & Other Total
Total Department of Defense
FY 2001 Base ............................................. 76,374 98,251 61,628 41,108 5,360 3,622 1,075 287,418Global War on Terror1 .................. 21,769 1,165 22,934Other Supplemental2 .................... 515 4,724 -187 487 63 60 178 5,840
Total FY 2001 Dept of Defense ........ 76,888 124,744 62,607 41,594 5,423 3,683 1,253 316,192
FY 2002 Base ............................................. 86,724 117,962 61,547 48,732 6,526 4,049 2,644 328,184Global War on Terror3 .................. 206 15,379 1,194 -14 105 16,870
Total FY 2002 Dept of Defense ........ 86,930 133,341 62,740 48,718 6,631 4,048 2,644 345,054
FY 2003 Base ............................................. 93,934 124,931 74,756 57,294 6,483 4,181 3,342 364,919Global War on Terror4 .................. 15,019 52,785 3,734 809 186 2 72,536
Total FY 2003 Dept of Defense ........ 108,953 177,716 78,490 58,103 6,670 4,183 3,342 437,456
FY 2004 Base ............................................. 97,048 126,984 76,153 64,307 5,637 3,801 2,586 376,516Global War on Terror5 6 ................ 19,064 61,833 6,918 334 501 24 2,102 90,776Other Supplemental6 .................... 310 2 313
Total FY 2004 Dept of Defense ........ 116,111 189,127 83,073 64,641 6,137 3,825 4,688 467,604
FY 2005 Base ............................................. 102,294 138,192 79,088 68,179 5,984 4,075 2,260 400,074Global War on Terror7 .................. 17,447 37,508 17,376 640 1,128 1,543 75,642Hurricane & Tsunami Relief8 ........ 2,872 150 6 148 21 4 3,200
Total FY 2005 Dept of Defense ........ 119,740 178,571 96,614 68,825 7,260 4,096 3,807 478,915
FY 2006 Base ............................................. 109,103 137,187 79,632 72,037 8,055 3,965 589 410,570Global War on Terror9 .................. 16,489 72,354 22,889 762 236 3,033 115,763Hurricane Relief10 ......................... 548 2,806 2,850 55 1,239 460 66 8,023Avian Flu Relief11 ......................... 130 130
Total FY 2006 Dept of Defense ........ 126,139 212,477 105,371 72,855 9,530 4,426 3,688 534,484
Table 2-1: BASE BUDGET, WAR FUNDING AND SUPPLEMENTALSBY MILITARY DEPARTMENT, BY PUBLIC LAW TITLE
(Dollars in Millions)DISCRETIONARY BUDGET AUTHORITY
20
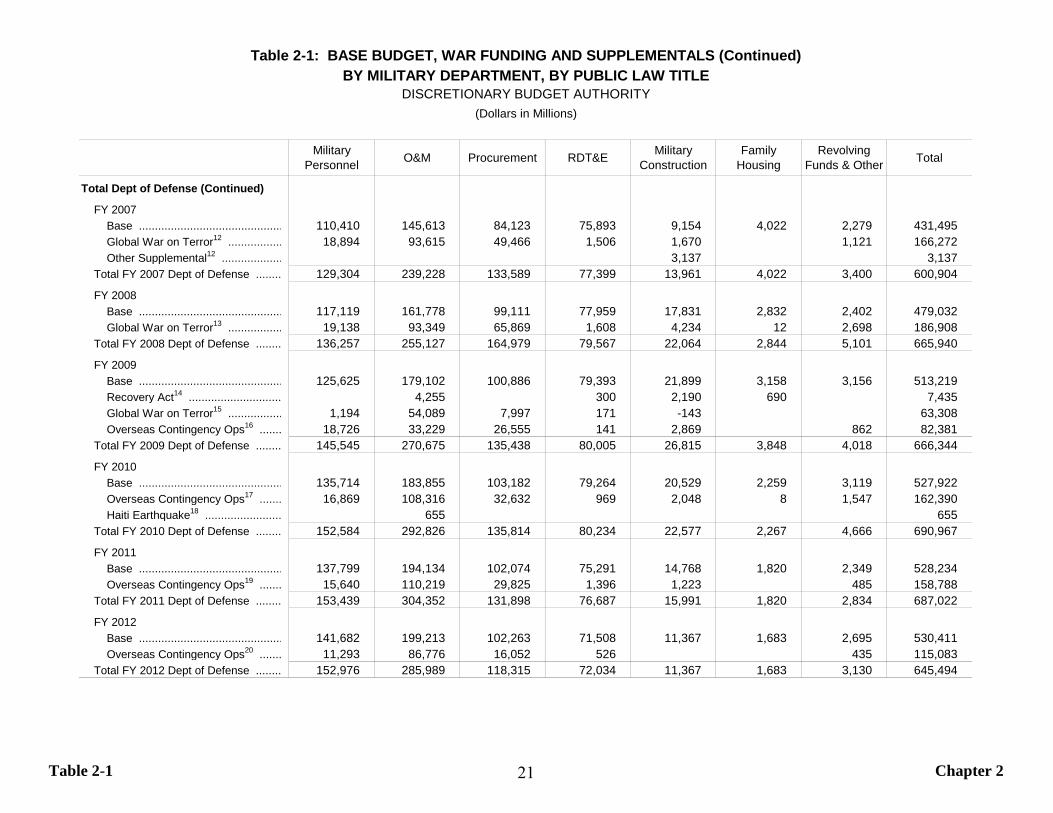
Table 2-1 Chapter 2
Military Personnel O&M Procurement RDT&E Military
ConstructionFamily
HousingRevolving
Funds & Other Total
Total Dept of Defense (Continued)
FY 2007 Base ............................................. 110,410 145,613 84,123 75,893 9,154 4,022 2,279 431,495Global War on Terror12 ................. 18,894 93,615 49,466 1,506 1,670 1,121 166,272Other Supplemental12 ................... 3,137 3,137
Total FY 2007 Dept of Defense ........ 129,304 239,228 133,589 77,399 13,961 4,022 3,400 600,904
FY 2008 Base ............................................. 117,119 161,778 99,111 77,959 17,831 2,832 2,402 479,032Global War on Terror13 ................. 19,138 93,349 65,869 1,608 4,234 12 2,698 186,908
Total FY 2008 Dept of Defense ........ 136,257 255,127 164,979 79,567 22,064 2,844 5,101 665,940
FY 2009 Base ............................................. 125,625 179,102 100,886 79,393 21,899 3,158 3,156 513,219Recovery Act14 ............................. 4,255 300 2,190 690 7,435Global War on Terror15 ................. 1,194 54,089 7,997 171 -143 63,308Overseas Contingency Ops16 ....... 18,726 33,229 26,555 141 2,869 862 82,381
Total FY 2009 Dept of Defense ........ 145,545 270,675 135,438 80,005 26,815 3,848 4,018 666,344
FY 2010 Base ............................................. 135,714 183,855 103,182 79,264 20,529 2,259 3,119 527,922Overseas Contingency Ops17 ....... 16,869 108,316 32,632 969 2,048 8 1,547 162,390Haiti Earthquake18 ........................ 655 655
Total FY 2010 Dept of Defense ........ 152,584 292,826 135,814 80,234 22,577 2,267 4,666 690,967
FY 2011 Base ............................................. 137,799 194,134 102,074 75,291 14,768 1,820 2,349 528,234Overseas Contingency Ops19 ....... 15,640 110,219 29,825 1,396 1,223 485 158,788
Total FY 2011 Dept of Defense ........ 153,439 304,352 131,898 76,687 15,991 1,820 2,834 687,022
FY 2012 Base ............................................. 141,682 199,213 102,263 71,508 11,367 1,683 2,695 530,411Overseas Contingency Ops20 ....... 11,293 86,776 16,052 526 435 115,083
Total FY 2012 Dept of Defense ........ 152,976 285,989 118,315 72,034 11,367 1,683 3,130 645,494
Table 2-1: BASE BUDGET, WAR FUNDING AND SUPPLEMENTALS (Continued)BY MILITARY DEPARTMENT, BY PUBLIC LAW TITLE
DISCRETIONARY BUDGET AUTHORITY(Dollars in Millions)
21
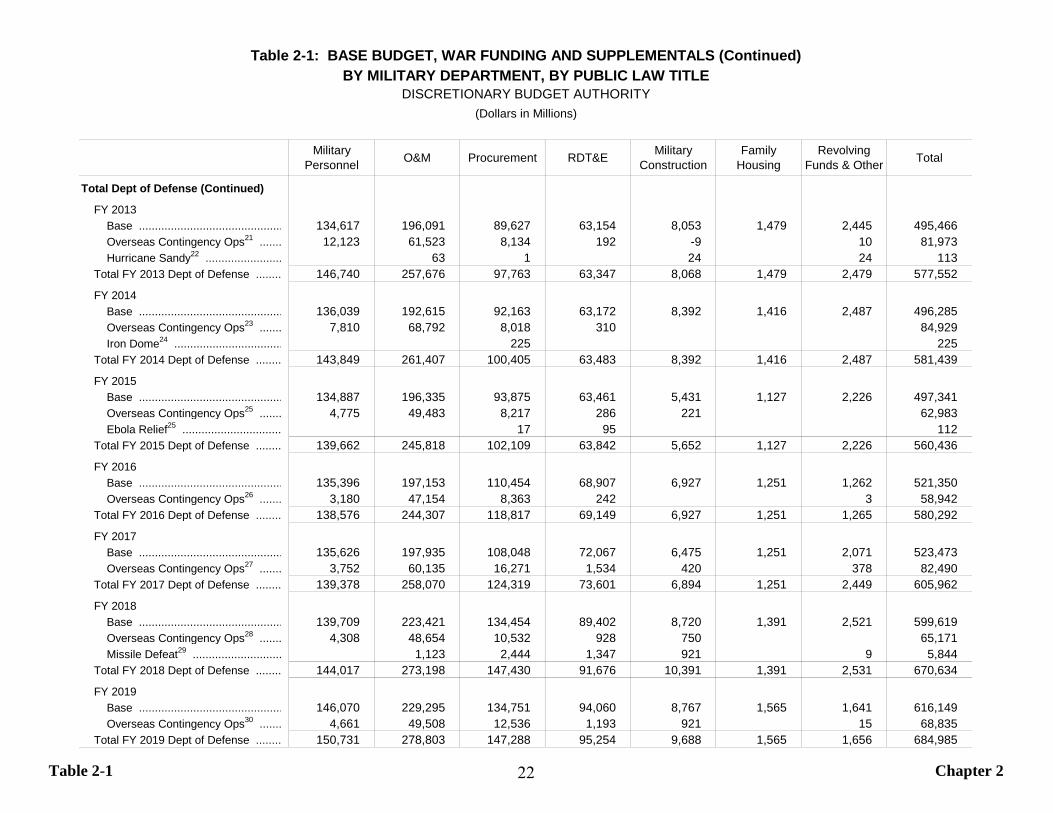
Table 2-1 Chapter 2
Military Personnel O&M Procurement RDT&E Military
ConstructionFamily
HousingRevolving
Funds & Other Total
Total Dept of Defense (Continued)
FY 2013 Base ............................................. 134,617 196,091 89,627 63,154 8,053 1,479 2,445 495,466Overseas Contingency Ops21 ....... 12,123 61,523 8,134 192 -9 10 81,973Hurricane Sandy22 ........................ 63 1 24 24 113
Total FY 2013 Dept of Defense ........ 146,740 257,676 97,763 63,347 8,068 1,479 2,479 577,552
FY 2014 Base ............................................. 136,039 192,615 92,163 63,172 8,392 1,416 2,487 496,285Overseas Contingency Ops23 ....... 7,810 68,792 8,018 310 84,929Iron Dome24 .................................. 225 225
Total FY 2014 Dept of Defense ........ 143,849 261,407 100,405 63,483 8,392 1,416 2,487 581,439
FY 2015 Base ............................................. 134,887 196,335 93,875 63,461 5,431 1,127 2,226 497,341Overseas Contingency Ops25 ....... 4,775 49,483 8,217 286 221 62,983Ebola Relief25 ............................... 17 95 112
Total FY 2015 Dept of Defense ........ 139,662 245,818 102,109 63,842 5,652 1,127 2,226 560,436
FY 2016 Base ............................................. 135,396 197,153 110,454 68,907 6,927 1,251 1,262 521,350Overseas Contingency Ops26 ....... 3,180 47,154 8,363 242 3 58,942
Total FY 2016 Dept of Defense ........ 138,576 244,307 118,817 69,149 6,927 1,251 1,265 580,292
FY 2017 Base ............................................. 135,626 197,935 108,048 72,067 6,475 1,251 2,071 523,473Overseas Contingency Ops27 ....... 3,752 60,135 16,271 1,534 420 378 82,490
Total FY 2017 Dept of Defense ........ 139,378 258,070 124,319 73,601 6,894 1,251 2,449 605,962
FY 2018 Base ............................................. 139,709 223,421 134,454 89,402 8,720 1,391 2,521 599,619Overseas Contingency Ops28 ....... 4,308 48,654 10,532 928 750 65,171Missile Defeat29 ............................ 1,123 2,444 1,347 921 9 5,844
Total FY 2018 Dept of Defense ........ 144,017 273,198 147,430 91,676 10,391 1,391 2,531 670,634
FY 2019 Base ............................................. 146,070 229,295 134,751 94,060 8,767 1,565 1,641 616,149Overseas Contingency Ops30 ....... 4,661 49,508 12,536 1,193 921 15 68,835
Total FY 2019 Dept of Defense ........ 150,731 278,803 147,288 95,254 9,688 1,565 1,656 684,985
Table 2-1: BASE BUDGET, WAR FUNDING AND SUPPLEMENTALS (Continued)BY MILITARY DEPARTMENT, BY PUBLIC LAW TITLE
DISCRETIONARY BUDGET AUTHORITY(Dollars in Millions)
22
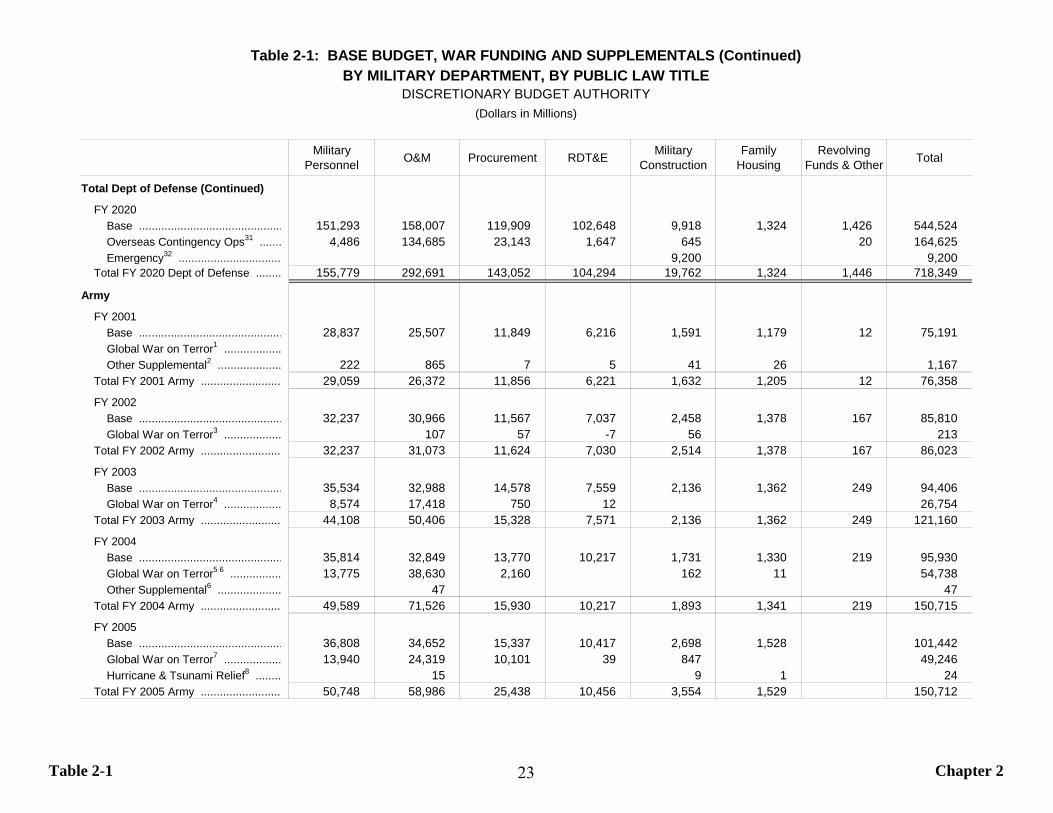
Table 2-1 Chapter 2
Military Personnel O&M Procurement RDT&E Military
ConstructionFamily
HousingRevolving
Funds & Other Total
Total Dept of Defense (Continued)
FY 2020 Base ............................................. 151,293 158,007 119,909 102,648 9,918 1,324 1,426 544,524Overseas Contingency Ops31 ....... 4,486 134,685 23,143 1,647 645 20 164,625Emergency32 ................................ 9,200 9,200
Total FY 2020 Dept of Defense ........ 155,779 292,691 143,052 104,294 19,762 1,324 1,446 718,349
Army
FY 2001 Base ............................................. 28,837 25,507 11,849 6,216 1,591 1,179 12 75,191Global War on Terror1 .................. Other Supplemental2 .................... 222 865 7 5 41 26 1,167
Total FY 2001 Army ......................... 29,059 26,372 11,856 6,221 1,632 1,205 12 76,358
FY 2002 Base ............................................. 32,237 30,966 11,567 7,037 2,458 1,378 167 85,810Global War on Terror3 .................. 107 57 -7 56 213
Total FY 2002 Army ......................... 32,237 31,073 11,624 7,030 2,514 1,378 167 86,023
FY 2003 Base ............................................. 35,534 32,988 14,578 7,559 2,136 1,362 249 94,406Global War on Terror4 .................. 8,574 17,418 750 12 26,754
Total FY 2003 Army ......................... 44,108 50,406 15,328 7,571 2,136 1,362 249 121,160
FY 2004 Base ............................................. 35,814 32,849 13,770 10,217 1,731 1,330 219 95,930Global War on Terror5 6 ................ 13,775 38,630 2,160 162 11 54,738Other Supplemental6 .................... 47 47
Total FY 2004 Army ......................... 49,589 71,526 15,930 10,217 1,893 1,341 219 150,715
FY 2005 Base ............................................. 36,808 34,652 15,337 10,417 2,698 1,528 101,442Global War on Terror7 .................. 13,940 24,319 10,101 39 847 49,246Hurricane & Tsunami Relief8 ........ 15 9 1 24
Total FY 2005 Army ......................... 50,748 58,986 25,438 10,456 3,554 1,529 150,712
Table 2-1: BASE BUDGET, WAR FUNDING AND SUPPLEMENTALS (Continued)BY MILITARY DEPARTMENT, BY PUBLIC LAW TITLE
DISCRETIONARY BUDGET AUTHORITY(Dollars in Millions)
23
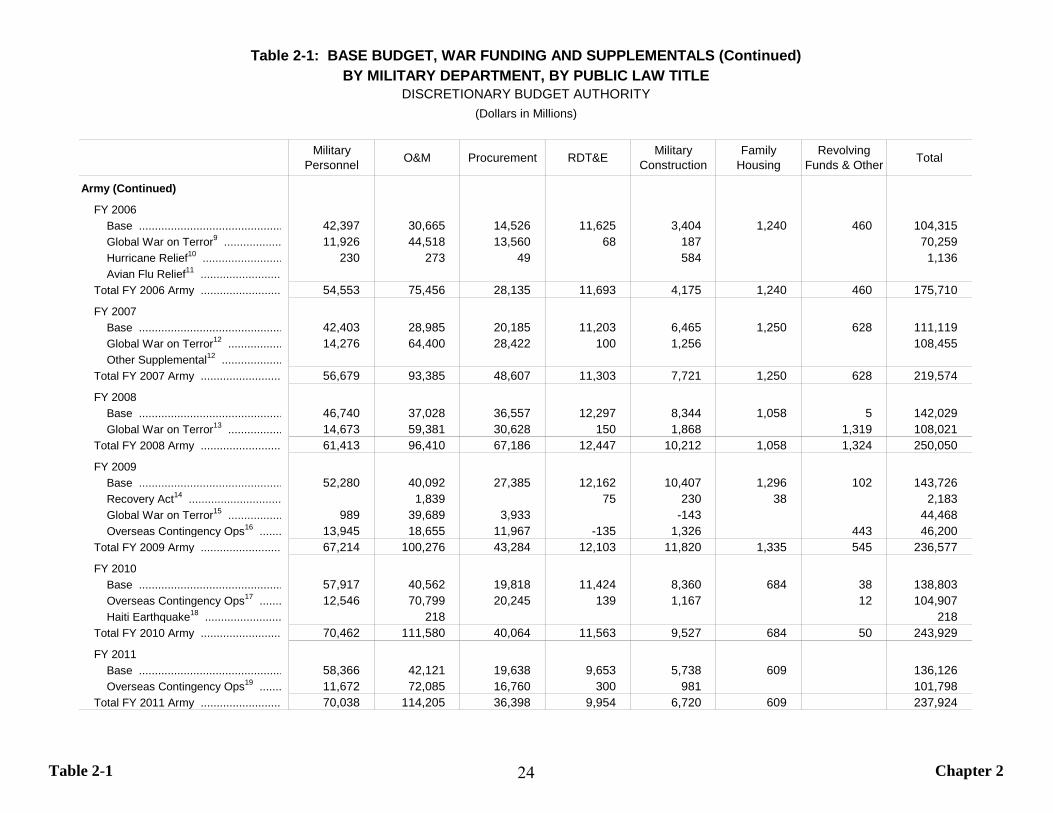
Table 2-1 Chapter 2
Military Personnel O&M Procurement RDT&E Military
ConstructionFamily
HousingRevolving
Funds & Other Total
Army (Continued)
FY 2006 Base ............................................. 42,397 30,665 14,526 11,625 3,404 1,240 460 104,315Global War on Terror9 .................. 11,926 44,518 13,560 68 187 70,259Hurricane Relief10 ......................... 230 273 49 584 1,136Avian Flu Relief11 .........................
Total FY 2006 Army ......................... 54,553 75,456 28,135 11,693 4,175 1,240 460 175,710
FY 2007 Base ............................................. 42,403 28,985 20,185 11,203 6,465 1,250 628 111,119Global War on Terror12 ................. 14,276 64,400 28,422 100 1,256 108,455Other Supplemental12 ...................
Total FY 2007 Army ......................... 56,679 93,385 48,607 11,303 7,721 1,250 628 219,574
FY 2008 Base ............................................. 46,740 37,028 36,557 12,297 8,344 1,058 5 142,029Global War on Terror13 ................. 14,673 59,381 30,628 150 1,868 1,319 108,021
Total FY 2008 Army ......................... 61,413 96,410 67,186 12,447 10,212 1,058 1,324 250,050
FY 2009 Base ............................................. 52,280 40,092 27,385 12,162 10,407 1,296 102 143,726Recovery Act14 ............................. 1,839 75 230 38 2,183Global War on Terror15 ................. 989 39,689 3,933 -143 44,468Overseas Contingency Ops16 ....... 13,945 18,655 11,967 -135 1,326 443 46,200
Total FY 2009 Army ......................... 67,214 100,276 43,284 12,103 11,820 1,335 545 236,577
FY 2010 Base ............................................. 57,917 40,562 19,818 11,424 8,360 684 38 138,803Overseas Contingency Ops17 ....... 12,546 70,799 20,245 139 1,167 12 104,907Haiti Earthquake18 ........................ 218 218
Total FY 2010 Army ......................... 70,462 111,580 40,064 11,563 9,527 684 50 243,929
FY 2011 Base ............................................. 58,366 42,121 19,638 9,653 5,738 609 136,126Overseas Contingency Ops19 ....... 11,672 72,085 16,760 300 981 101,798
Total FY 2011 Army ......................... 70,038 114,205 36,398 9,954 6,720 609 237,924
Table 2-1: BASE BUDGET, WAR FUNDING AND SUPPLEMENTALS (Continued)BY MILITARY DEPARTMENT, BY PUBLIC LAW TITLE
DISCRETIONARY BUDGET AUTHORITY(Dollars in Millions)
24
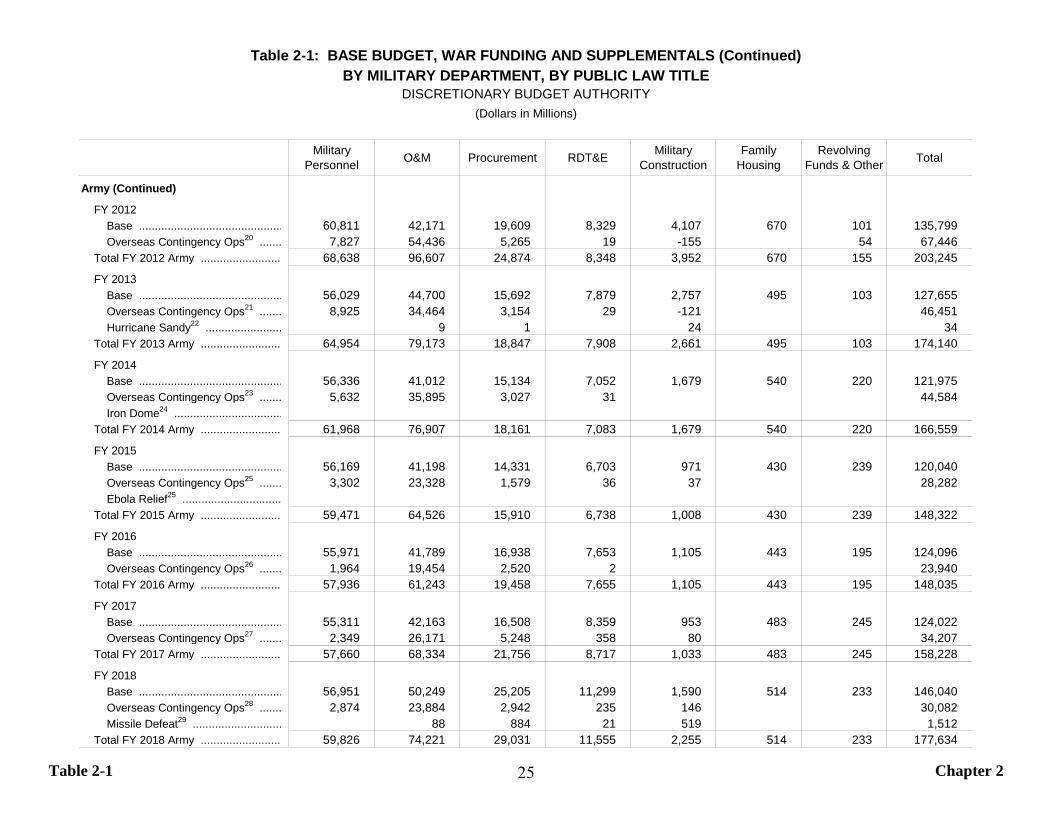
Table 2-1 Chapter 2
Military Personnel O&M Procurement RDT&E Military
ConstructionFamily
HousingRevolving
Funds & Other Total
Army (Continued)
FY 2012 Base ............................................. 60,811 42,171 19,609 8,329 4,107 670 101 135,799Overseas Contingency Ops20 ....... 7,827 54,436 5,265 19 -155 54 67,446
Total FY 2012 Army ......................... 68,638 96,607 24,874 8,348 3,952 670 155 203,245
FY 2013 Base ............................................. 56,029 44,700 15,692 7,879 2,757 495 103 127,655Overseas Contingency Ops21 ....... 8,925 34,464 3,154 29 -121 46,451Hurricane Sandy22 ........................ 9 1 24 34
Total FY 2013 Army ......................... 64,954 79,173 18,847 7,908 2,661 495 103 174,140
FY 2014 Base ............................................. 56,336 41,012 15,134 7,052 1,679 540 220 121,975Overseas Contingency Ops23 ....... 5,632 35,895 3,027 31 44,584Iron Dome24 ..................................
Total FY 2014 Army ......................... 61,968 76,907 18,161 7,083 1,679 540 220 166,559
FY 2015 Base ............................................. 56,169 41,198 14,331 6,703 971 430 239 120,040Overseas Contingency Ops25 ....... 3,302 23,328 1,579 36 37 28,282Ebola Relief25 ...............................
Total FY 2015 Army ......................... 59,471 64,526 15,910 6,738 1,008 430 239 148,322
FY 2016 Base ............................................. 55,971 41,789 16,938 7,653 1,105 443 195 124,096Overseas Contingency Ops26 ....... 1,964 19,454 2,520 2 23,940
Total FY 2016 Army ......................... 57,936 61,243 19,458 7,655 1,105 443 195 148,035
FY 2017 Base ............................................. 55,311 42,163 16,508 8,359 953 483 245 124,022Overseas Contingency Ops27 ....... 2,349 26,171 5,248 358 80 34,207
Total FY 2017 Army ......................... 57,660 68,334 21,756 8,717 1,033 483 245 158,228
FY 2018 Base ............................................. 56,951 50,249 25,205 11,299 1,590 514 233 146,040Overseas Contingency Ops28 ....... 2,874 23,884 2,942 235 146 30,082Missile Defeat29 ............................ 88 884 21 519 1,512
Total FY 2018 Army ......................... 59,826 74,221 29,031 11,555 2,255 514 233 177,634
Table 2-1: BASE BUDGET, WAR FUNDING AND SUPPLEMENTALS (Continued)BY MILITARY DEPARTMENT, BY PUBLIC LAW TITLE
DISCRETIONARY BUDGET AUTHORITY(Dollars in Millions)
25
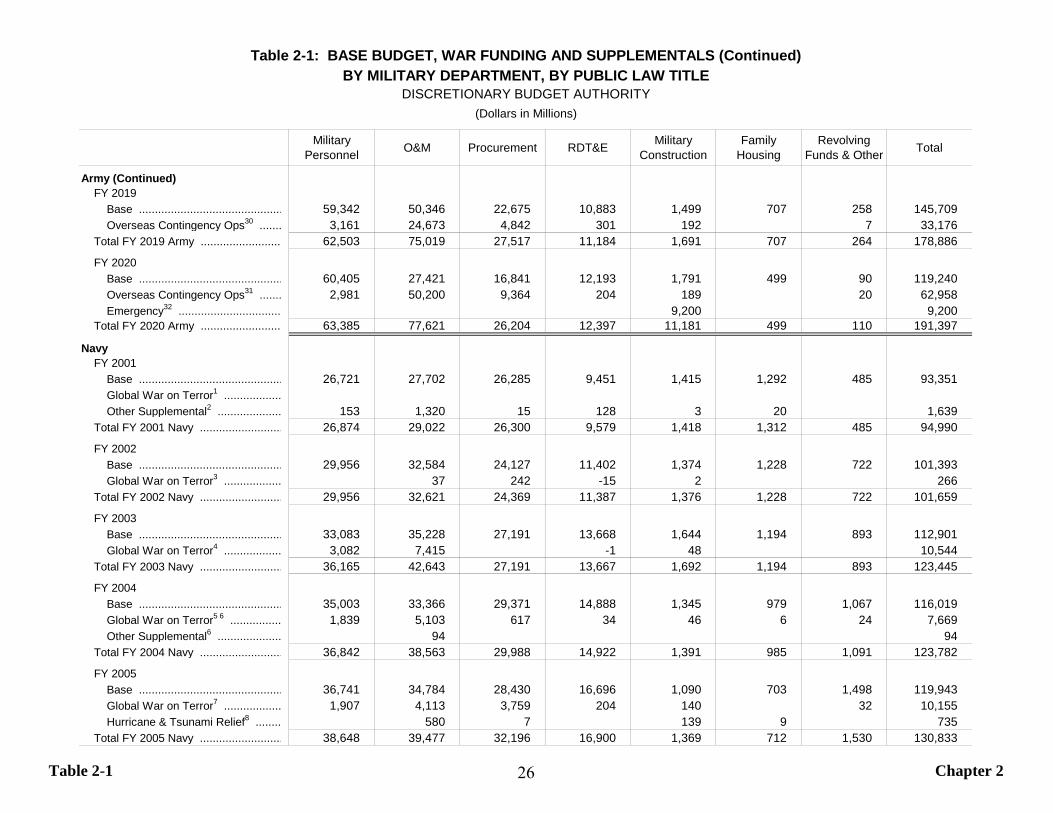
Table 2-1 Chapter 2
Military Personnel O&M Procurement RDT&E Military
ConstructionFamily
HousingRevolving
Funds & Other Total
Army (Continued) FY 2019
Base ............................................. 59,342 50,346 22,675 10,883 1,499 707 258 145,709Overseas Contingency Ops30 ....... 3,161 24,673 4,842 301 192 7 33,176
Total FY 2019 Army ......................... 62,503 75,019 27,517 11,184 1,691 707 264 178,886
FY 2020 Base ............................................. 60,405 27,421 16,841 12,193 1,791 499 90 119,240Overseas Contingency Ops31 ....... 2,981 50,200 9,364 204 189 20 62,958Emergency32 ................................ 9,200 9,200
Total FY 2020 Army ......................... 63,385 77,621 26,204 12,397 11,181 499 110 191,397
Navy FY 2001
Base ............................................. 26,721 27,702 26,285 9,451 1,415 1,292 485 93,351Global War on Terror1 .................. Other Supplemental2 .................... 153 1,320 15 128 3 20 1,639
Total FY 2001 Navy .......................... 26,874 29,022 26,300 9,579 1,418 1,312 485 94,990
FY 2002 Base ............................................. 29,956 32,584 24,127 11,402 1,374 1,228 722 101,393Global War on Terror3 .................. 37 242 -15 2 266
Total FY 2002 Navy .......................... 29,956 32,621 24,369 11,387 1,376 1,228 722 101,659
FY 2003 Base ............................................. 33,083 35,228 27,191 13,668 1,644 1,194 893 112,901Global War on Terror4 .................. 3,082 7,415 -1 48 10,544
Total FY 2003 Navy .......................... 36,165 42,643 27,191 13,667 1,692 1,194 893 123,445
FY 2004 Base ............................................. 35,003 33,366 29,371 14,888 1,345 979 1,067 116,019Global War on Terror5 6 ................ 1,839 5,103 617 34 46 6 24 7,669Other Supplemental6 .................... 94 94
Total FY 2004 Navy .......................... 36,842 38,563 29,988 14,922 1,391 985 1,091 123,782
FY 2005 Base ............................................. 36,741 34,784 28,430 16,696 1,090 703 1,498 119,943Global War on Terror7 .................. 1,907 4,113 3,759 204 140 32 10,155Hurricane & Tsunami Relief8 ........ 580 7 139 9 735
Total FY 2005 Navy .......................... 38,648 39,477 32,196 16,900 1,369 712 1,530 130,833
Table 2-1: BASE BUDGET, WAR FUNDING AND SUPPLEMENTALS (Continued)BY MILITARY DEPARTMENT, BY PUBLIC LAW TITLE
DISCRETIONARY BUDGET AUTHORITY(Dollars in Millions)
26
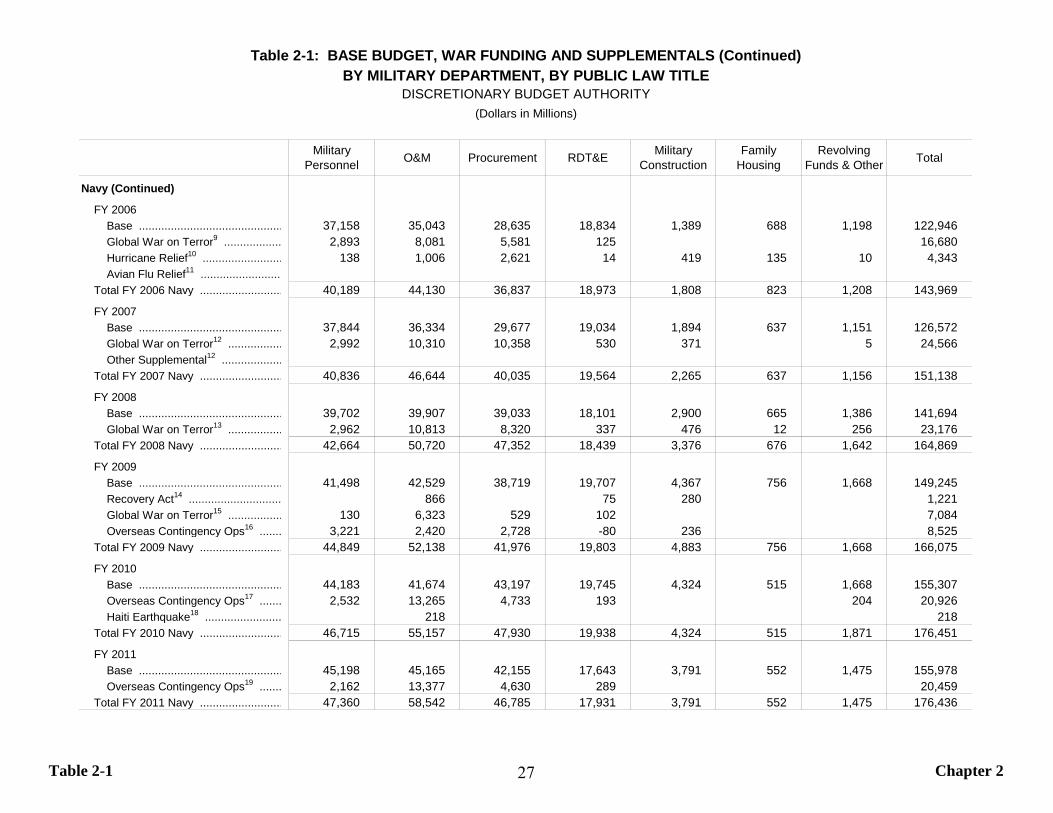
Table 2-1 Chapter 2
Military Personnel O&M Procurement RDT&E Military
ConstructionFamily
HousingRevolving
Funds & Other Total
Navy (Continued)
FY 2006 Base ............................................. 37,158 35,043 28,635 18,834 1,389 688 1,198 122,946Global War on Terror9 .................. 2,893 8,081 5,581 125 16,680Hurricane Relief10 ......................... 138 1,006 2,621 14 419 135 10 4,343Avian Flu Relief11 .........................
Total FY 2006 Navy .......................... 40,189 44,130 36,837 18,973 1,808 823 1,208 143,969
FY 2007 Base ............................................. 37,844 36,334 29,677 19,034 1,894 637 1,151 126,572Global War on Terror12 ................. 2,992 10,310 10,358 530 371 5 24,566Other Supplemental12 ...................
Total FY 2007 Navy .......................... 40,836 46,644 40,035 19,564 2,265 637 1,156 151,138
FY 2008 Base ............................................. 39,702 39,907 39,033 18,101 2,900 665 1,386 141,694Global War on Terror13 ................. 2,962 10,813 8,320 337 476 12 256 23,176
Total FY 2008 Navy .......................... 42,664 50,720 47,352 18,439 3,376 676 1,642 164,869
FY 2009 Base ............................................. 41,498 42,529 38,719 19,707 4,367 756 1,668 149,245Recovery Act14 ............................. 866 75 280 1,221Global War on Terror15 ................. 130 6,323 529 102 7,084Overseas Contingency Ops16 ....... 3,221 2,420 2,728 -80 236 8,525
Total FY 2009 Navy .......................... 44,849 52,138 41,976 19,803 4,883 756 1,668 166,075
FY 2010 Base ............................................. 44,183 41,674 43,197 19,745 4,324 515 1,668 155,307Overseas Contingency Ops17 ....... 2,532 13,265 4,733 193 204 20,926Haiti Earthquake18 ........................ 218 218
Total FY 2010 Navy .......................... 46,715 55,157 47,930 19,938 4,324 515 1,871 176,451
FY 2011 Base ............................................. 45,198 45,165 42,155 17,643 3,791 552 1,475 155,978Overseas Contingency Ops19 ....... 2,162 13,377 4,630 289 20,459
Total FY 2011 Navy .......................... 47,360 58,542 46,785 17,931 3,791 552 1,475 176,436
Table 2-1: BASE BUDGET, WAR FUNDING AND SUPPLEMENTALS (Continued)BY MILITARY DEPARTMENT, BY PUBLIC LAW TITLE
DISCRETIONARY BUDGET AUTHORITY(Dollars in Millions)
27
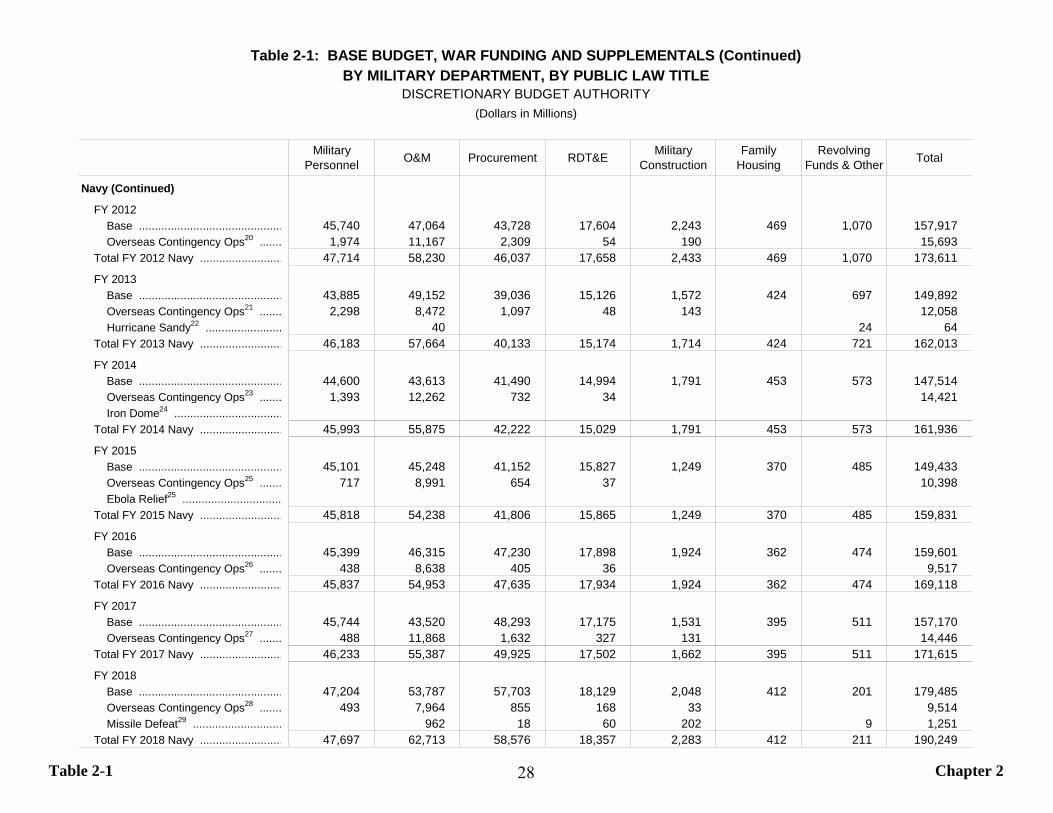
Table 2-1 Chapter 2
Military Personnel O&M Procurement RDT&E Military
ConstructionFamily
HousingRevolving
Funds & Other Total
Navy (Continued)
FY 2012 Base ............................................. 45,740 47,064 43,728 17,604 2,243 469 1,070 157,917Overseas Contingency Ops20 ....... 1,974 11,167 2,309 54 190 15,693
Total FY 2012 Navy .......................... 47,714 58,230 46,037 17,658 2,433 469 1,070 173,611
FY 2013 Base ............................................. 43,885 49,152 39,036 15,126 1,572 424 697 149,892Overseas Contingency Ops21 ....... 2,298 8,472 1,097 48 143 12,058Hurricane Sandy22 ........................ 40 24 64
Total FY 2013 Navy .......................... 46,183 57,664 40,133 15,174 1,714 424 721 162,013
FY 2014 Base ............................................. 44,600 43,613 41,490 14,994 1,791 453 573 147,514Overseas Contingency Ops23 ....... 1,393 12,262 732 34 14,421Iron Dome24 ..................................
Total FY 2014 Navy .......................... 45,993 55,875 42,222 15,029 1,791 453 573 161,936
FY 2015 Base ............................................. 45,101 45,248 41,152 15,827 1,249 370 485 149,433Overseas Contingency Ops25 ....... 717 8,991 654 37 10,398Ebola Relief25 ...............................
Total FY 2015 Navy .......................... 45,818 54,238 41,806 15,865 1,249 370 485 159,831
FY 2016 Base ............................................. 45,399 46,315 47,230 17,898 1,924 362 474 159,601Overseas Contingency Ops26 ....... 438 8,638 405 36 9,517
Total FY 2016 Navy .......................... 45,837 54,953 47,635 17,934 1,924 362 474 169,118
FY 2017 Base ............................................. 45,744 43,520 48,293 17,175 1,531 395 511 157,170Overseas Contingency Ops27 ....... 488 11,868 1,632 327 131 14,446
Total FY 2017 Navy .......................... 46,233 55,387 49,925 17,502 1,662 395 511 171,615
FY 2018 Base ............................................. 47,204 53,787 57,703 18,129 2,048 412 201 179,485Overseas Contingency Ops28 ....... 493 7,964 855 168 33 9,514Missile Defeat29 ............................ 962 18 60 202 9 1,251
Total FY 2018 Navy .......................... 47,697 62,713 58,576 18,357 2,283 412 211 190,249
Table 2-1: BASE BUDGET, WAR FUNDING AND SUPPLEMENTALS (Continued)BY MILITARY DEPARTMENT, BY PUBLIC LAW TITLE
DISCRETIONARY BUDGET AUTHORITY(Dollars in Millions)
28
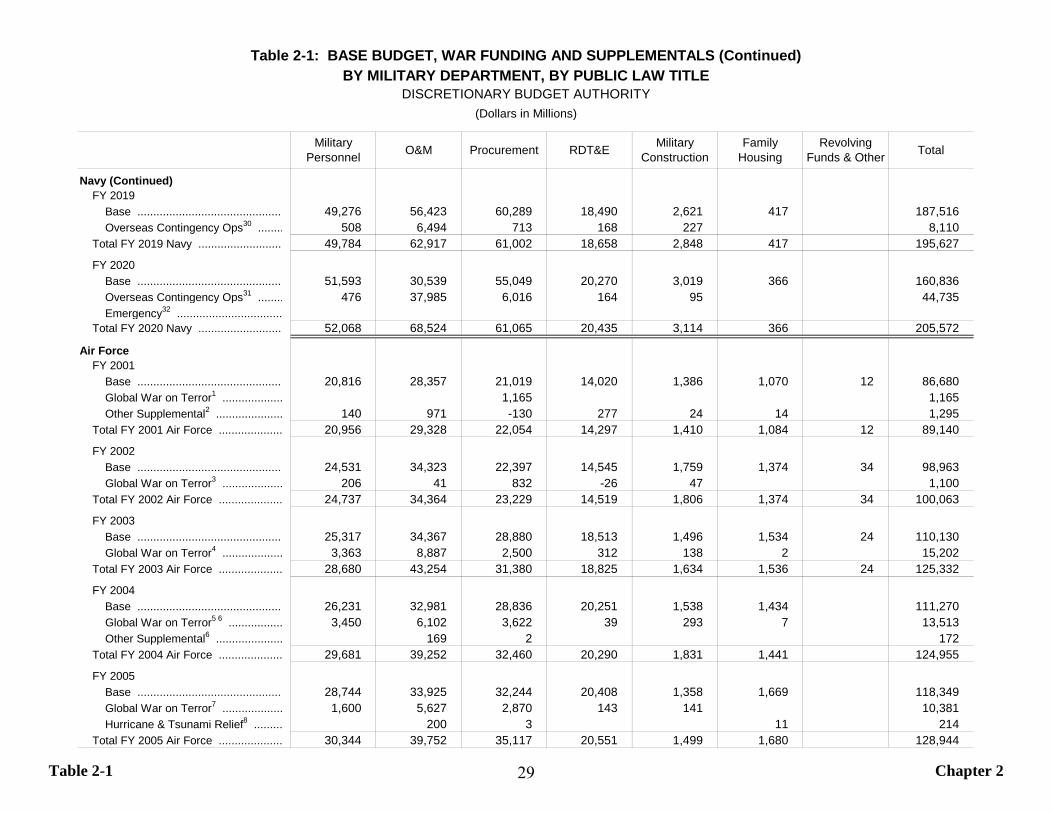
Table 2-1 Chapter 2
Military Personnel O&M Procurement RDT&E Military
ConstructionFamily
HousingRevolving
Funds & Other Total
Navy (Continued) FY 2019
Base .............................................. 49,276 56,423 60,289 18,490 2,621 417 187,516Overseas Contingency Ops30 ........ 508 6,494 713 168 227 8,110
Total FY 2019 Navy ........................... 49,784 62,917 61,002 18,658 2,848 417 195,627
FY 2020 Base .............................................. 51,593 30,539 55,049 20,270 3,019 366 160,836Overseas Contingency Ops31 ........ 476 37,985 6,016 164 95 44,735Emergency32 .................................
Total FY 2020 Navy ........................... 52,068 68,524 61,065 20,435 3,114 366 205,572
Air Force FY 2001
Base .............................................. 20,816 28,357 21,019 14,020 1,386 1,070 12 86,680Global War on Terror1 ................... 1,165 1,165Other Supplemental2 ..................... 140 971 -130 277 24 14 1,295
Total FY 2001 Air Force .................... 20,956 29,328 22,054 14,297 1,410 1,084 12 89,140
FY 2002 Base .............................................. 24,531 34,323 22,397 14,545 1,759 1,374 34 98,963Global War on Terror3 ................... 206 41 832 -26 47 1,100
Total FY 2002 Air Force .................... 24,737 34,364 23,229 14,519 1,806 1,374 34 100,063
FY 2003 Base .............................................. 25,317 34,367 28,880 18,513 1,496 1,534 24 110,130Global War on Terror4 ................... 3,363 8,887 2,500 312 138 2 15,202
Total FY 2003 Air Force .................... 28,680 43,254 31,380 18,825 1,634 1,536 24 125,332
FY 2004 Base .............................................. 26,231 32,981 28,836 20,251 1,538 1,434 111,270Global War on Terror5 6 ................. 3,450 6,102 3,622 39 293 7 13,513Other Supplemental6 ..................... 169 2 172
Total FY 2004 Air Force .................... 29,681 39,252 32,460 20,290 1,831 1,441 124,955
FY 2005 Base .............................................. 28,744 33,925 32,244 20,408 1,358 1,669 118,349Global War on Terror7 ................... 1,600 5,627 2,870 143 141 10,381Hurricane & Tsunami Relief8 ......... 200 3 11 214
Total FY 2005 Air Force .................... 30,344 39,752 35,117 20,551 1,499 1,680 128,944
Table 2-1: BASE BUDGET, WAR FUNDING AND SUPPLEMENTALS (Continued)BY MILITARY DEPARTMENT, BY PUBLIC LAW TITLE
DISCRETIONARY BUDGET AUTHORITY(Dollars in Millions)
29
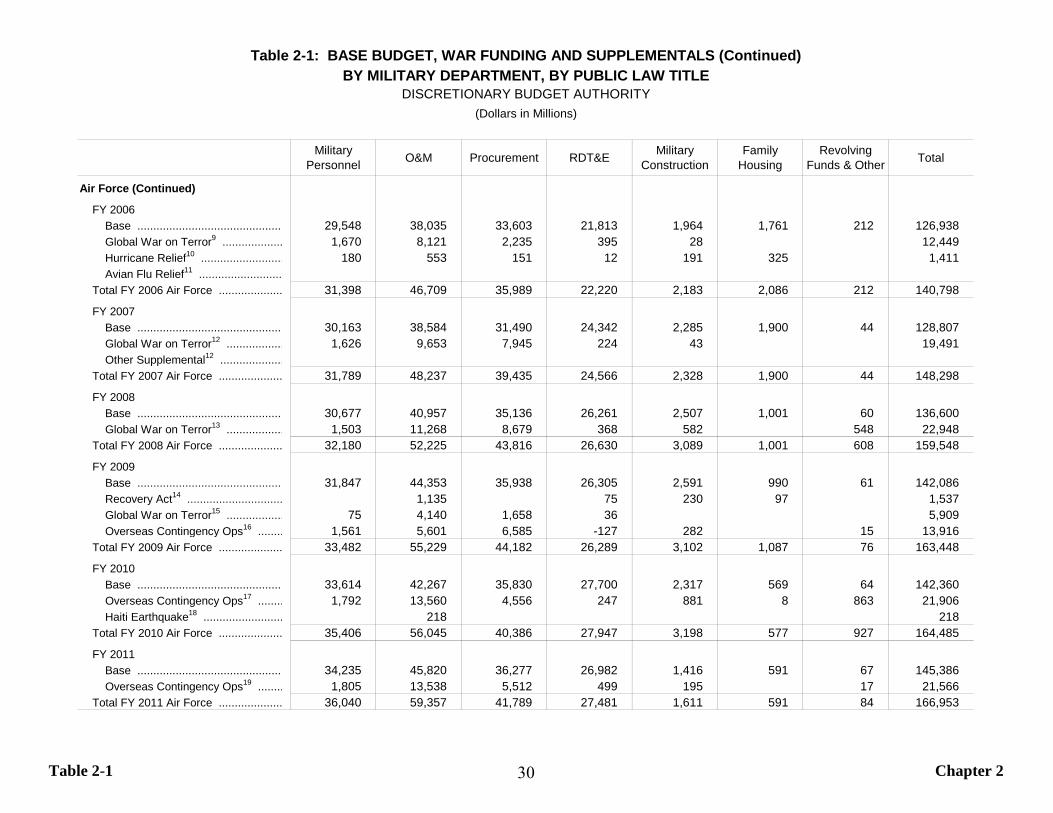
Table 2-1 Chapter 2
Military Personnel O&M Procurement RDT&E Military
ConstructionFamily
HousingRevolving
Funds & Other Total
Air Force (Continued)
FY 2006 Base .............................................. 29,548 38,035 33,603 21,813 1,964 1,761 212 126,938Global War on Terror9 ................... 1,670 8,121 2,235 395 28 12,449Hurricane Relief10 .......................... 180 553 151 12 191 325 1,411Avian Flu Relief11 ..........................
Total FY 2006 Air Force .................... 31,398 46,709 35,989 22,220 2,183 2,086 212 140,798
FY 2007 Base .............................................. 30,163 38,584 31,490 24,342 2,285 1,900 44 128,807Global War on Terror12 .................. 1,626 9,653 7,945 224 43 19,491Other Supplemental12 ....................
Total FY 2007 Air Force .................... 31,789 48,237 39,435 24,566 2,328 1,900 44 148,298
FY 2008 Base .............................................. 30,677 40,957 35,136 26,261 2,507 1,001 60 136,600Global War on Terror13 .................. 1,503 11,268 8,679 368 582 548 22,948
Total FY 2008 Air Force .................... 32,180 52,225 43,816 26,630 3,089 1,001 608 159,548
FY 2009 Base .............................................. 31,847 44,353 35,938 26,305 2,591 990 61 142,086Recovery Act14 .............................. 1,135 75 230 97 1,537Global War on Terror15 .................. 75 4,140 1,658 36 5,909Overseas Contingency Ops16 ........ 1,561 5,601 6,585 -127 282 15 13,916
Total FY 2009 Air Force .................... 33,482 55,229 44,182 26,289 3,102 1,087 76 163,448
FY 2010 Base .............................................. 33,614 42,267 35,830 27,700 2,317 569 64 142,360Overseas Contingency Ops17 ........ 1,792 13,560 4,556 247 881 8 863 21,906Haiti Earthquake18 ......................... 218 218
Total FY 2010 Air Force .................... 35,406 56,045 40,386 27,947 3,198 577 927 164,485
FY 2011 Base .............................................. 34,235 45,820 36,277 26,982 1,416 591 67 145,386Overseas Contingency Ops19 ........ 1,805 13,538 5,512 499 195 17 21,566
Total FY 2011 Air Force .................... 36,040 59,357 41,789 27,481 1,611 591 84 166,953
Table 2-1: BASE BUDGET, WAR FUNDING AND SUPPLEMENTALS (Continued)BY MILITARY DEPARTMENT, BY PUBLIC LAW TITLE
DISCRETIONARY BUDGET AUTHORITY(Dollars in Millions)
30
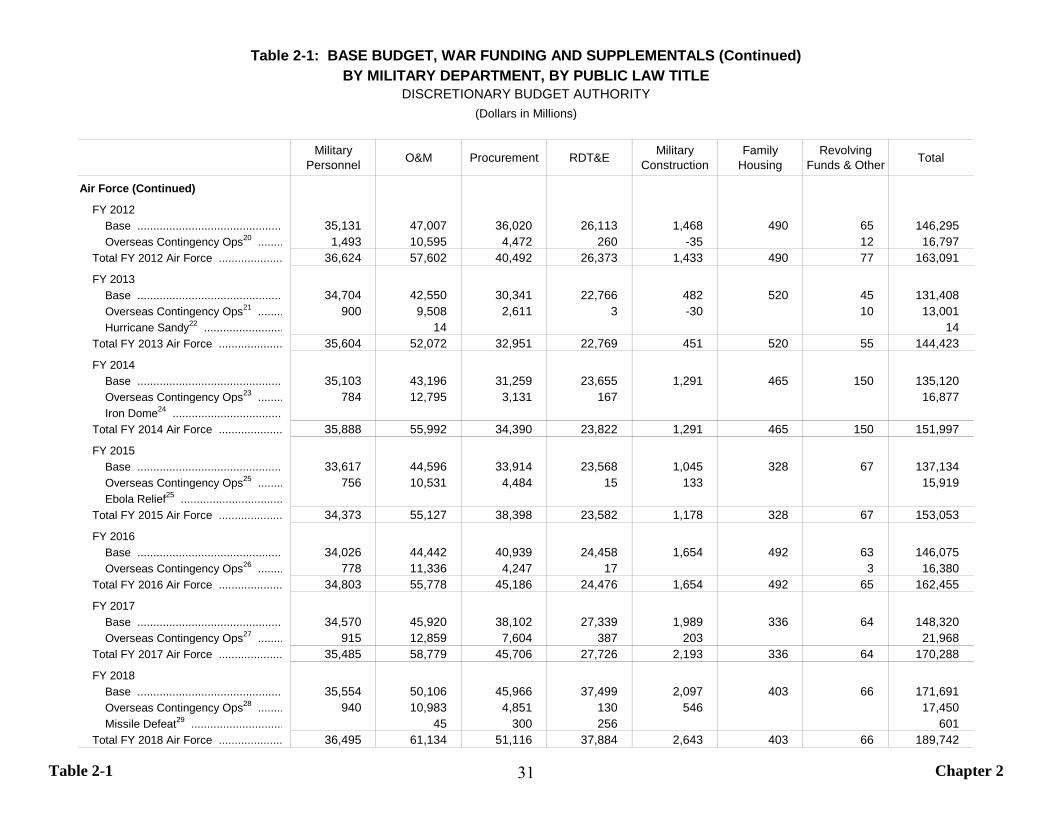
Table 2-1 Chapter 2
Military Personnel O&M Procurement RDT&E Military
ConstructionFamily
HousingRevolving
Funds & Other Total
Air Force (Continued)
FY 2012 Base .............................................. 35,131 47,007 36,020 26,113 1,468 490 65 146,295Overseas Contingency Ops20 ........ 1,493 10,595 4,472 260 -35 12 16,797
Total FY 2012 Air Force .................... 36,624 57,602 40,492 26,373 1,433 490 77 163,091
FY 2013 Base .............................................. 34,704 42,550 30,341 22,766 482 520 45 131,408Overseas Contingency Ops21 ........ 900 9,508 2,611 3 -30 10 13,001Hurricane Sandy22 ......................... 14 14
Total FY 2013 Air Force .................... 35,604 52,072 32,951 22,769 451 520 55 144,423
FY 2014 Base .............................................. 35,103 43,196 31,259 23,655 1,291 465 150 135,120Overseas Contingency Ops23 ........ 784 12,795 3,131 167 16,877Iron Dome24 ...................................
Total FY 2014 Air Force .................... 35,888 55,992 34,390 23,822 1,291 465 150 151,997
FY 2015 Base .............................................. 33,617 44,596 33,914 23,568 1,045 328 67 137,134Overseas Contingency Ops25 ........ 756 10,531 4,484 15 133 15,919Ebola Relief25 ................................
Total FY 2015 Air Force .................... 34,373 55,127 38,398 23,582 1,178 328 67 153,053
FY 2016 Base .............................................. 34,026 44,442 40,939 24,458 1,654 492 63 146,075Overseas Contingency Ops26 ........ 778 11,336 4,247 17 3 16,380
Total FY 2016 Air Force .................... 34,803 55,778 45,186 24,476 1,654 492 65 162,455
FY 2017 Base .............................................. 34,570 45,920 38,102 27,339 1,989 336 64 148,320Overseas Contingency Ops27 ........ 915 12,859 7,604 387 203 21,968
Total FY 2017 Air Force .................... 35,485 58,779 45,706 27,726 2,193 336 64 170,288
FY 2018 Base .............................................. 35,554 50,106 45,966 37,499 2,097 403 66 171,691Overseas Contingency Ops28 ........ 940 10,983 4,851 130 546 17,450Missile Defeat29 ............................. 45 300 256 601
Total FY 2018 Air Force .................... 36,495 61,134 51,116 37,884 2,643 403 66 189,742
Table 2-1: BASE BUDGET, WAR FUNDING AND SUPPLEMENTALS (Continued)BY MILITARY DEPARTMENT, BY PUBLIC LAW TITLE
DISCRETIONARY BUDGET AUTHORITY(Dollars in Millions)
31
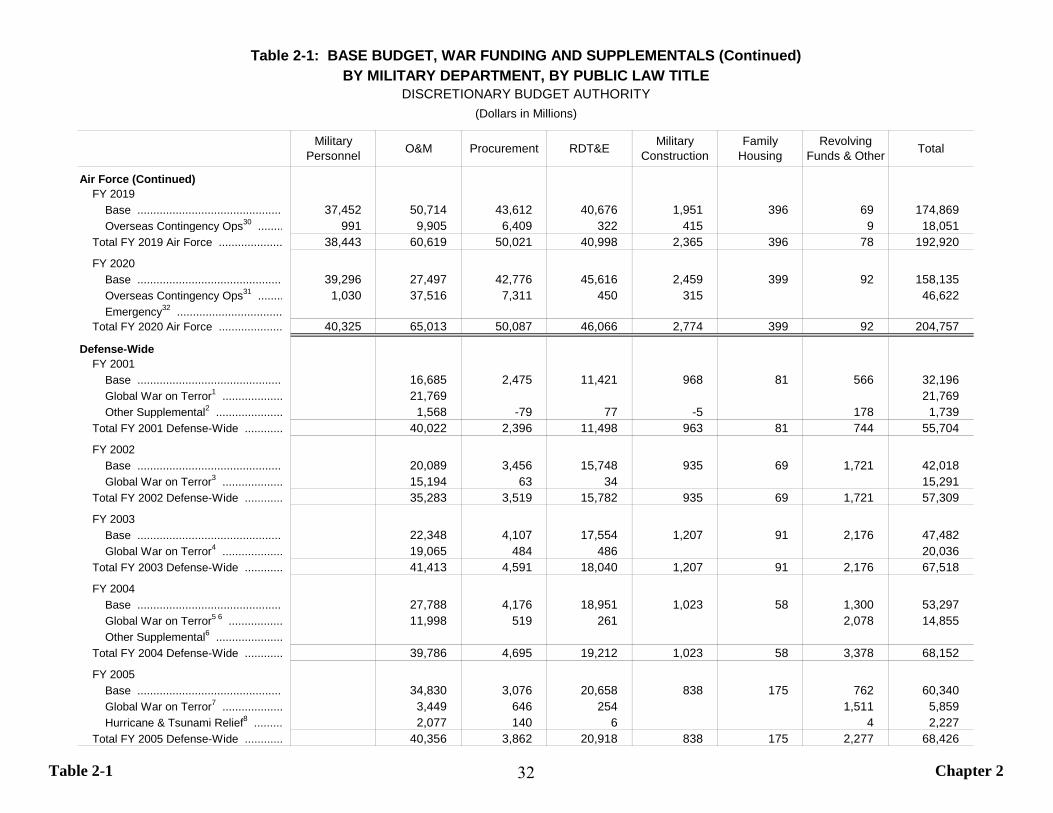
Table 2-1 Chapter 2
Military Personnel O&M Procurement RDT&E Military
ConstructionFamily
HousingRevolving
Funds & Other Total
Air Force (Continued) FY 2019
Base .............................................. 37,452 50,714 43,612 40,676 1,951 396 69 174,869Overseas Contingency Ops30 ........ 991 9,905 6,409 322 415 9 18,051
Total FY 2019 Air Force .................... 38,443 60,619 50,021 40,998 2,365 396 78 192,920
FY 2020 Base .............................................. 39,296 27,497 42,776 45,616 2,459 399 92 158,135Overseas Contingency Ops31 ........ 1,030 37,516 7,311 450 315 46,622Emergency32 .................................
Total FY 2020 Air Force .................... 40,325 65,013 50,087 46,066 2,774 399 92 204,757
Defense-Wide FY 2001
Base .............................................. 16,685 2,475 11,421 968 81 566 32,196Global War on Terror1 ................... 21,769 21,769Other Supplemental2 ..................... 1,568 -79 77 -5 178 1,739
Total FY 2001 Defense-Wide ............ 40,022 2,396 11,498 963 81 744 55,704
FY 2002 Base .............................................. 20,089 3,456 15,748 935 69 1,721 42,018Global War on Terror3 ................... 15,194 63 34 15,291
Total FY 2002 Defense-Wide ............ 35,283 3,519 15,782 935 69 1,721 57,309
FY 2003 Base .............................................. 22,348 4,107 17,554 1,207 91 2,176 47,482Global War on Terror4 ................... 19,065 484 486 20,036
Total FY 2003 Defense-Wide ............ 41,413 4,591 18,040 1,207 91 2,176 67,518
FY 2004 Base .............................................. 27,788 4,176 18,951 1,023 58 1,300 53,297Global War on Terror5 6 ................. 11,998 519 261 2,078 14,855Other Supplemental6 .....................
Total FY 2004 Defense-Wide ............ 39,786 4,695 19,212 1,023 58 3,378 68,152
FY 2005 Base .............................................. 34,830 3,076 20,658 838 175 762 60,340Global War on Terror7 ................... 3,449 646 254 1,511 5,859Hurricane & Tsunami Relief8 ......... 2,077 140 6 4 2,227
Total FY 2005 Defense-Wide ............ 40,356 3,862 20,918 838 175 2,277 68,426
Table 2-1: BASE BUDGET, WAR FUNDING AND SUPPLEMENTALS (Continued)BY MILITARY DEPARTMENT, BY PUBLIC LAW TITLE
DISCRETIONARY BUDGET AUTHORITY(Dollars in Millions)
32
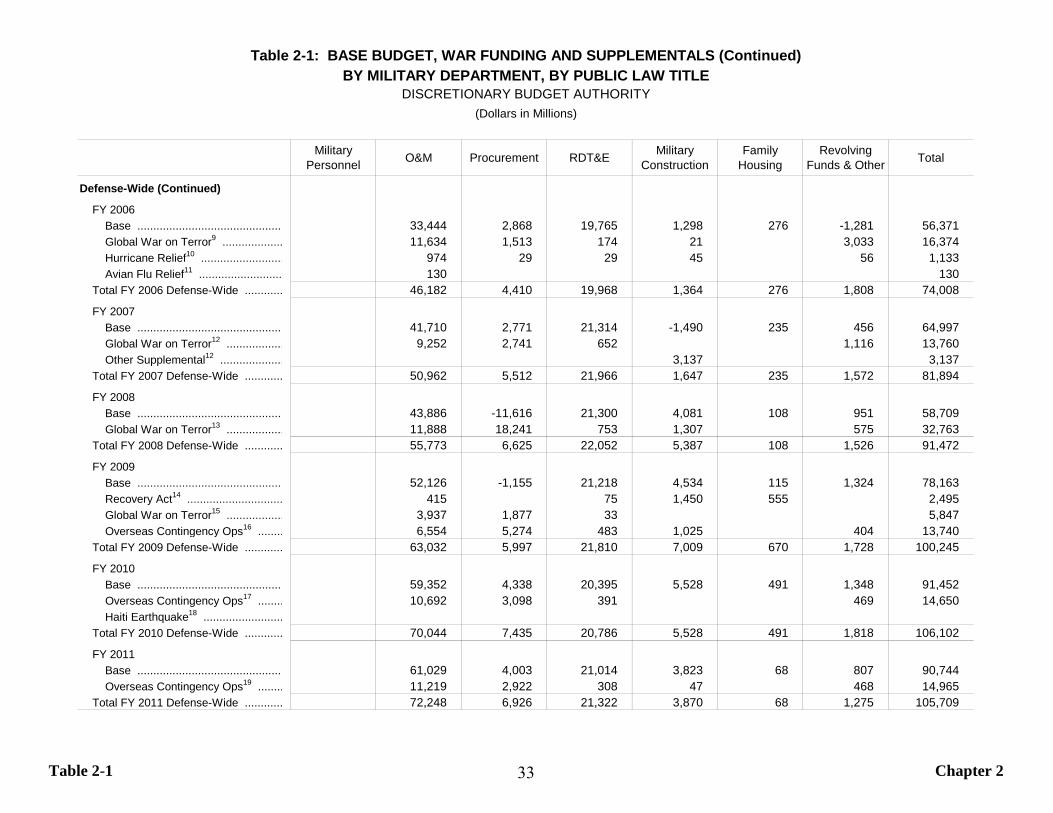
Table 2-1 Chapter 2
Military Personnel O&M Procurement RDT&E Military
ConstructionFamily
HousingRevolving
Funds & Other Total
Defense-Wide (Continued)
FY 2006 Base .............................................. 33,444 2,868 19,765 1,298 276 -1,281 56,371Global War on Terror9 ................... 11,634 1,513 174 21 3,033 16,374Hurricane Relief10 .......................... 974 29 29 45 56 1,133Avian Flu Relief11 .......................... 130 130
Total FY 2006 Defense-Wide ............ 46,182 4,410 19,968 1,364 276 1,808 74,008
FY 2007 Base .............................................. 41,710 2,771 21,314 -1,490 235 456 64,997Global War on Terror12 .................. 9,252 2,741 652 1,116 13,760Other Supplemental12 .................... 3,137 3,137
Total FY 2007 Defense-Wide ............ 50,962 5,512 21,966 1,647 235 1,572 81,894
FY 2008 Base .............................................. 43,886 -11,616 21,300 4,081 108 951 58,709Global War on Terror13 .................. 11,888 18,241 753 1,307 575 32,763
Total FY 2008 Defense-Wide ............ 55,773 6,625 22,052 5,387 108 1,526 91,472
FY 2009 Base .............................................. 52,126 -1,155 21,218 4,534 115 1,324 78,163Recovery Act14 .............................. 415 75 1,450 555 2,495Global War on Terror15 .................. 3,937 1,877 33 5,847Overseas Contingency Ops16 ........ 6,554 5,274 483 1,025 404 13,740
Total FY 2009 Defense-Wide ............ 63,032 5,997 21,810 7,009 670 1,728 100,245
FY 2010 Base .............................................. 59,352 4,338 20,395 5,528 491 1,348 91,452Overseas Contingency Ops17 ........ 10,692 3,098 391 469 14,650Haiti Earthquake18 .........................
Total FY 2010 Defense-Wide ............ 70,044 7,435 20,786 5,528 491 1,818 106,102
FY 2011 Base .............................................. 61,029 4,003 21,014 3,823 68 807 90,744Overseas Contingency Ops19 ........ 11,219 2,922 308 47 468 14,965
Total FY 2011 Defense-Wide ............ 72,248 6,926 21,322 3,870 68 1,275 105,709
Table 2-1: BASE BUDGET, WAR FUNDING AND SUPPLEMENTALS (Continued)BY MILITARY DEPARTMENT, BY PUBLIC LAW TITLE
DISCRETIONARY BUDGET AUTHORITY(Dollars in Millions)
33
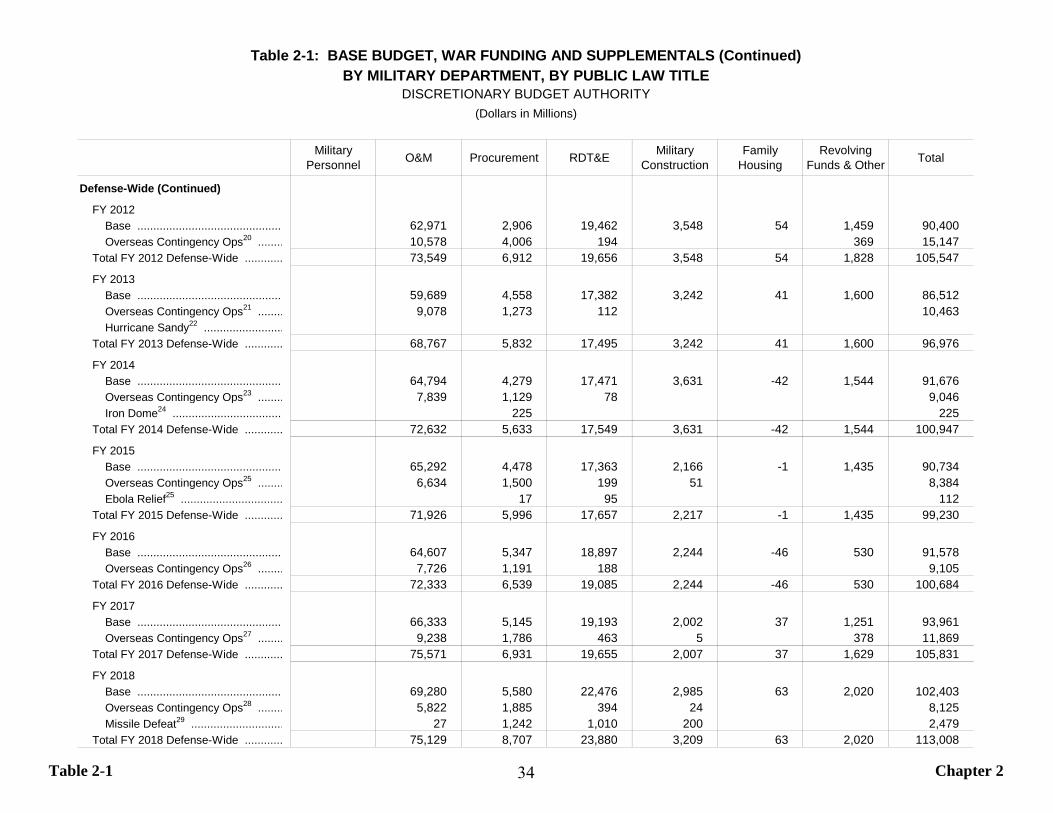
Table 2-1 Chapter 2
Military Personnel O&M Procurement RDT&E Military
ConstructionFamily
HousingRevolving
Funds & Other Total
Defense-Wide (Continued)
FY 2012 Base .............................................. 62,971 2,906 19,462 3,548 54 1,459 90,400Overseas Contingency Ops20 ........ 10,578 4,006 194 369 15,147
Total FY 2012 Defense-Wide ............ 73,549 6,912 19,656 3,548 54 1,828 105,547
FY 2013 Base .............................................. 59,689 4,558 17,382 3,242 41 1,600 86,512Overseas Contingency Ops21 ........ 9,078 1,273 112 10,463Hurricane Sandy22 .........................
Total FY 2013 Defense-Wide ............ 68,767 5,832 17,495 3,242 41 1,600 96,976
FY 2014 Base .............................................. 64,794 4,279 17,471 3,631 -42 1,544 91,676Overseas Contingency Ops23 ........ 7,839 1,129 78 9,046Iron Dome24 ................................... 225 225
Total FY 2014 Defense-Wide ............ 72,632 5,633 17,549 3,631 -42 1,544 100,947
FY 2015 Base .............................................. 65,292 4,478 17,363 2,166 -1 1,435 90,734Overseas Contingency Ops25 ........ 6,634 1,500 199 51 8,384Ebola Relief25 ................................ 17 95 112
Total FY 2015 Defense-Wide ............ 71,926 5,996 17,657 2,217 -1 1,435 99,230
FY 2016 Base .............................................. 64,607 5,347 18,897 2,244 -46 530 91,578Overseas Contingency Ops26 ........ 7,726 1,191 188 9,105
Total FY 2016 Defense-Wide ............ 72,333 6,539 19,085 2,244 -46 530 100,684
FY 2017 Base .............................................. 66,333 5,145 19,193 2,002 37 1,251 93,961Overseas Contingency Ops27 ........ 9,238 1,786 463 5 378 11,869
Total FY 2017 Defense-Wide ............ 75,571 6,931 19,655 2,007 37 1,629 105,831
FY 2018 Base .............................................. 69,280 5,580 22,476 2,985 63 2,020 102,403Overseas Contingency Ops28 ........ 5,822 1,885 394 24 8,125Missile Defeat29 ............................. 27 1,242 1,010 200 2,479
Total FY 2018 Defense-Wide ............ 75,129 8,707 23,880 3,209 63 2,020 113,008
Table 2-1: BASE BUDGET, WAR FUNDING AND SUPPLEMENTALS (Continued)BY MILITARY DEPARTMENT, BY PUBLIC LAW TITLE
DISCRETIONARY BUDGET AUTHORITY(Dollars in Millions)
34
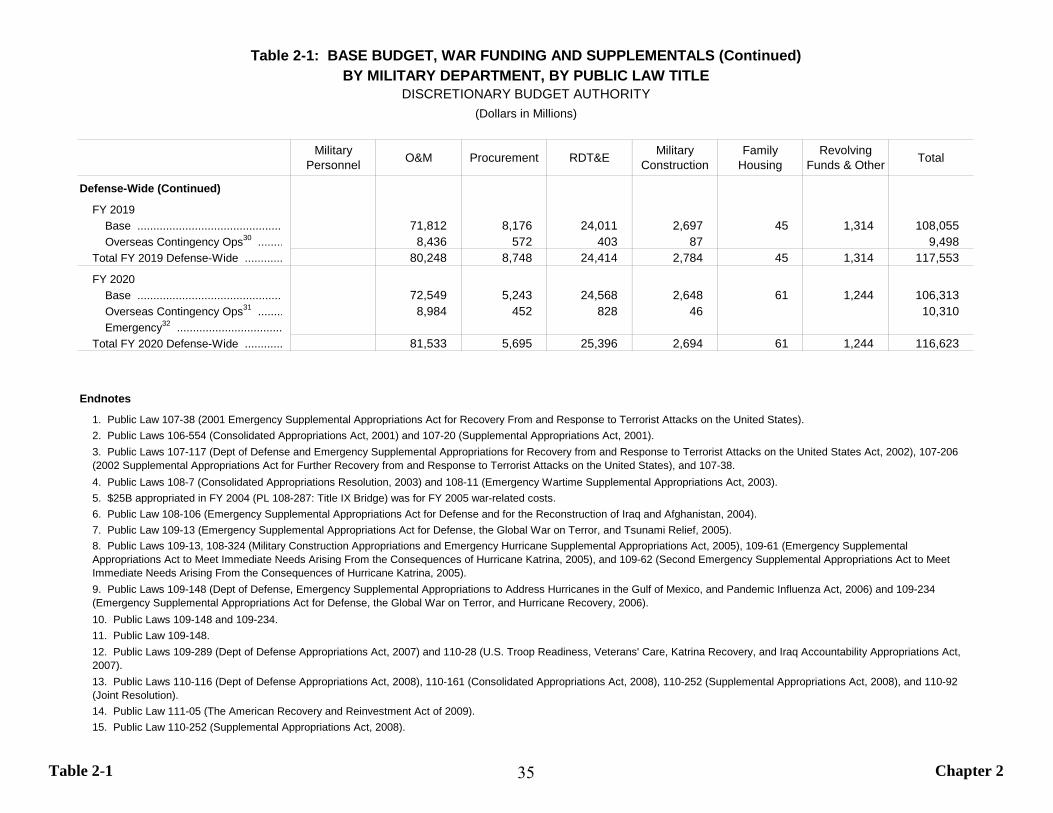
Table 2-1 Chapter 2
Military Personnel O&M Procurement RDT&E Military
ConstructionFamily
HousingRevolving
Funds & Other Total
Defense-Wide (Continued)
FY 2019 Base .............................................. 71,812 8,176 24,011 2,697 45 1,314 108,055Overseas Contingency Ops30 ........ 8,436 572 403 87 9,498
Total FY 2019 Defense-Wide ............ 80,248 8,748 24,414 2,784 45 1,314 117,553
FY 2020 Base .............................................. 72,549 5,243 24,568 2,648 61 1,244 106,313Overseas Contingency Ops31 ........ 8,984 452 828 46 10,310Emergency32 .................................
Total FY 2020 Defense-Wide ............ 81,533 5,695 25,396 2,694 61 1,244 116,623
Endnotes
1. Public Law 107-38 (2001 Emergency Supplemental Appropriations Act for Recovery From and Response to Terrorist Attacks on the United States).2. Public Laws 106-554 (Consolidated Appropriations Act, 2001) and 107-20 (Supplemental Appropriations Act, 2001).
4. Public Laws 108-7 (Consolidated Appropriations Resolution, 2003) and 108-11 (Emergency Wartime Supplemental Appropriations Act, 2003).5. $25B appropriated in FY 2004 (PL 108-287: Title IX Bridge) was for FY 2005 war-related costs.6. Public Law 108-106 (Emergency Supplemental Appropriations Act for Defense and for the Reconstruction of Iraq and Afghanistan, 2004).7. Public Law 109-13 (Emergency Supplemental Appropriations Act for Defense, the Global War on Terror, and Tsunami Relief, 2005).
10. Public Laws 109-148 and 109-234.11. Public Law 109-148.
14. Public Law 111-05 (The American Recovery and Reinvestment Act of 2009).15. Public Law 110-252 (Supplemental Appropriations Act, 2008).
8. Public Laws 109-13, 108-324 (Military Construction Appropriations and Emergency Hurricane Supplemental Appropriations Act, 2005), 109-61 (Emergency Supplemental Appropriations Act to Meet Immediate Needs Arising From the Consequences of Hurricane Katrina, 2005), and 109-62 (Second Emergency Supplemental Appropriations Act to Meet Immediate Needs Arising From the Consequences of Hurricane Katrina, 2005).9. Public Laws 109-148 (Dept of Defense, Emergency Supplemental Appropriations to Address Hurricanes in the Gulf of Mexico, and Pandemic Influenza Act, 2006) and 109-234 (Emergency Supplemental Appropriations Act for Defense, the Global War on Terror, and Hurricane Recovery, 2006).
12. Public Laws 109-289 (Dept of Defense Appropriations Act, 2007) and 110-28 (U.S. Troop Readiness, Veterans' Care, Katrina Recovery, and Iraq Accountability Appropriations Act, 2007).13. Public Laws 110-116 (Dept of Defense Appropriations Act, 2008), 110-161 (Consolidated Appropriations Act, 2008), 110-252 (Supplemental Appropriations Act, 2008), and 110-92 (Joint Resolution).
Table 2-1: BASE BUDGET, WAR FUNDING AND SUPPLEMENTALS (Continued)BY MILITARY DEPARTMENT, BY PUBLIC LAW TITLE
DISCRETIONARY BUDGET AUTHORITY(Dollars in Millions)
3. Public Laws 107-117 (Dept of Defense and Emergency Supplemental Appropriations for Recovery from and Response to Terrorist Attacks on the United States Act, 2002), 107-206 (2002 Supplemental Appropriations Act for Further Recovery from and Response to Terrorist Attacks on the United States), and 107-38.
35
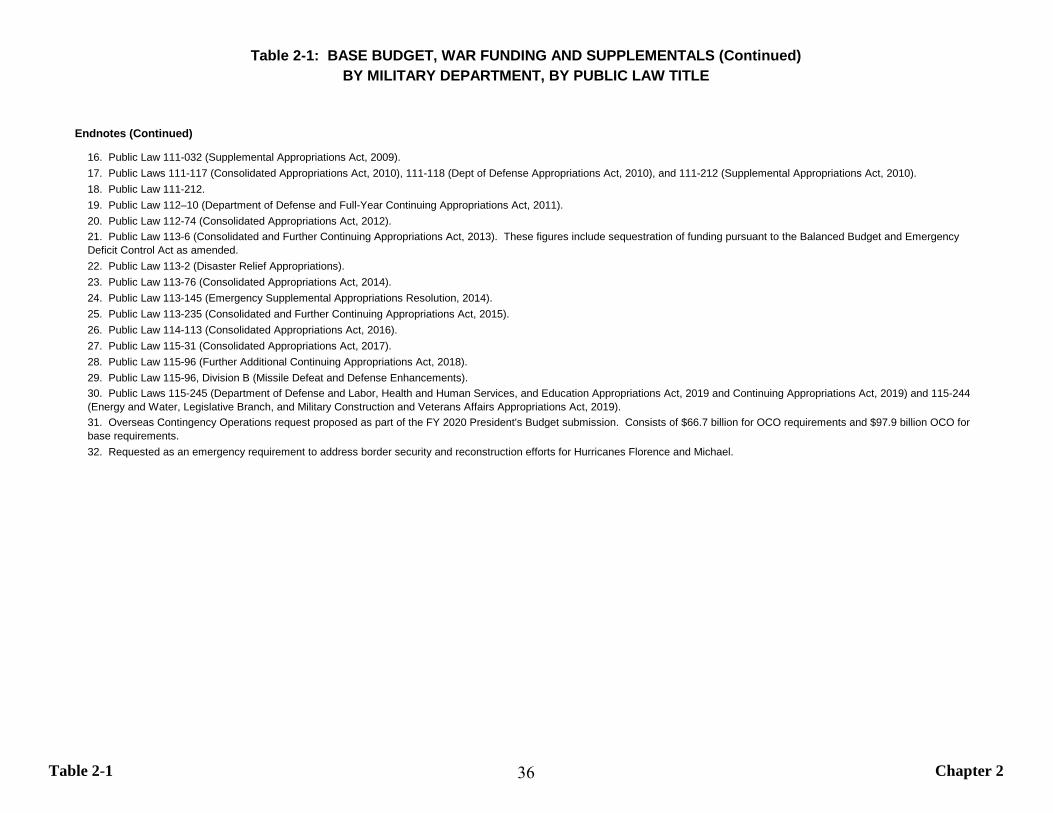
Table 2-1 Chapter 2
Endnotes (Continued)
16. Public Law 111-032 (Supplemental Appropriations Act, 2009).17. Public Laws 111-117 (Consolidated Appropriations Act, 2010), 111-118 (Dept of Defense Appropriations Act, 2010), and 111-212 (Supplemental Appropriations Act, 2010).18. Public Law 111-212.19. Public Law 112–10 (Department of Defense and Full-Year Continuing Appropriations Act, 2011).20. Public Law 112-74 (Consolidated Appropriations Act, 2012).
22. Public Law 113-2 (Disaster Relief Appropriations).23. Public Law 113-76 (Consolidated Appropriations Act, 2014).24. Public Law 113-145 (Emergency Supplemental Appropriations Resolution, 2014).25. Public Law 113-235 (Consolidated and Further Continuing Appropriations Act, 2015).26. Public Law 114-113 (Consolidated Appropriations Act, 2016).27. Public Law 115-31 (Consolidated Appropriations Act, 2017).28. Public Law 115-96 (Further Additional Continuing Appropriations Act, 2018).29. Public Law 115-96, Division B (Missile Defeat and Defense Enhancements).
32. Requested as an emergency requirement to address border security and reconstruction efforts for Hurricanes Florence and Michael.
21. Public Law 113-6 (Consolidated and Further Continuing Appropriations Act, 2013). These figures include sequestration of funding pursuant to the Balanced Budget and Emergency Deficit Control Act as amended.
Table 2-1: BASE BUDGET, WAR FUNDING AND SUPPLEMENTALS (Continued)BY MILITARY DEPARTMENT, BY PUBLIC LAW TITLE
30. Public Laws 115-245 (Department of Defense and Labor, Health and Human Services, and Education Appropriations Act, 2019 and Continuing Appropriations Act, 2019) and 115-244 (Energy and Water, Legislative Branch, and Military Construction and Veterans Affairs Appropriations Act, 2019).31. Overseas Contingency Operations request proposed as part of the FY 2020 President's Budget submission. Consists of $66.7 billion for OCO requirements and $97.9 billion OCO for base requirements.
36
Introduction Chapter 3
Chapter 3: Legislative Authorization
Tables Page3-1 FY 2020 Defense Budget – Reconciliation of Authorization, Appropriation, BA and TOA................................................................................. 383-2 Military Personnel Authorizations (FY 2018 to FY 2020)..................................................................................................................................... 45
Authorization legislation provides the authority for an agency tocarry out a particular activity. This legislation may be annual, for aspecified number of years, or indefinite. Most National Defenseactivities require annual authorization. Table 3-1 provides a
reconciliation between the FY 2020 DoD authorization request,appropriation request, budget authority, and TOA. Table 3-2presents military personnel end strength authorization data forFY 2018 through FY 2020.
37
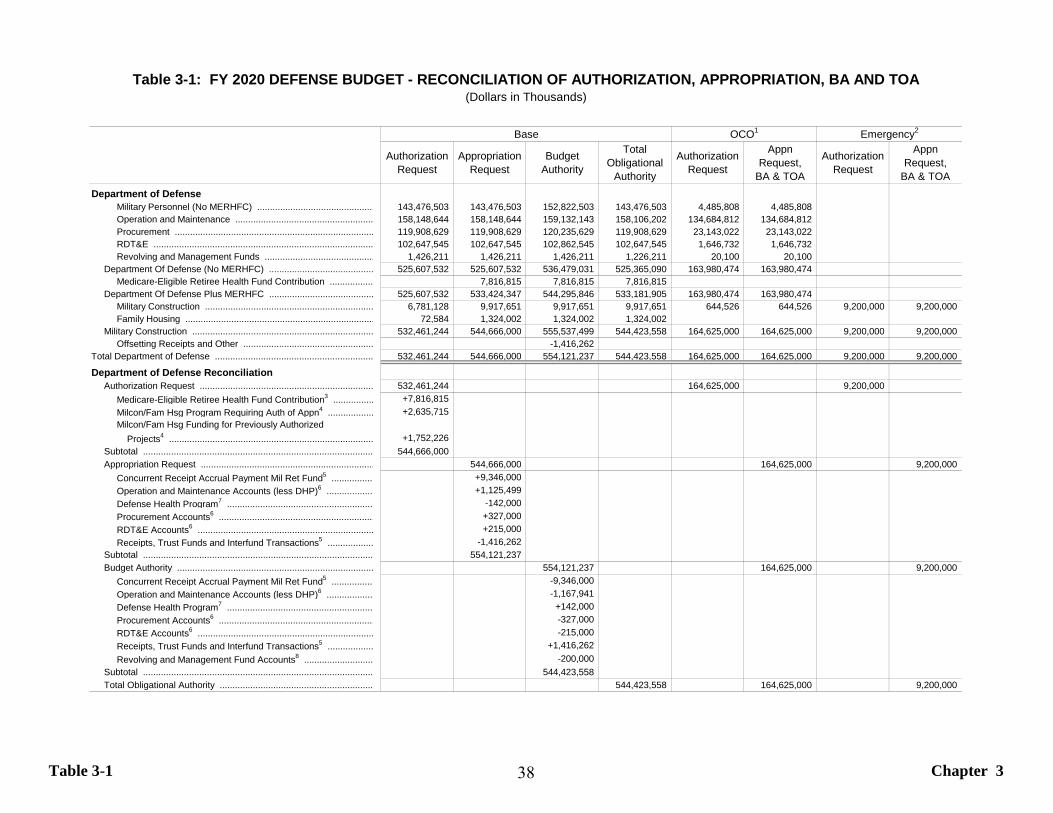
Table 3-1 Chapter 3
Authorization Request
Appropriation Request
BudgetAuthority
TotalObligational
Authority
Authorization Request
Appn Request,
BA & TOA
Authorization Request
Appn Request,
BA & TOADepartment of Defense
Military Personnel (No MERHFC) .............................................. 143,476,503 143,476,503 152,822,503 143,476,503 4,485,808 4,485,808 Operation and Maintenance ...................................................... 158,148,644 158,148,644 159,132,143 158,106,202 134,684,812 134,684,812 Procurement .............................................................................. 119,908,629 119,908,629 120,235,629 119,908,629 23,143,022 23,143,022 RDT&E ...................................................................................... 102,647,545 102,647,545 102,862,545 102,647,545 1,646,732 1,646,732 Revolving and Management Funds ........................................... 1,426,211 1,426,211 1,426,211 1,226,211 20,100 20,100
Department Of Defense (No MERHFC) ......................................... 525,607,532 525,607,532 536,479,031 525,365,090 163,980,474 163,980,474 Medicare-Eligible Retiree Health Fund Contribution ................. 7,816,815 7,816,815 7,816,815
Department Of Defense Plus MERHFC ......................................... 525,607,532 533,424,347 544,295,846 533,181,905 163,980,474 163,980,474 Military Construction .................................................................. 6,781,128 9,917,651 9,917,651 9,917,651 644,526 644,526 9,200,000 9,200,000 Family Housing .......................................................................... 72,584 1,324,002 1,324,002 1,324,002
Military Construction ....................................................................... 532,461,244 544,666,000 555,537,499 544,423,558 164,625,000 164,625,000 9,200,000 9,200,000 Offsetting Receipts and Other ................................................... -1,416,262
Total Department of Defense .............................................................. 532,461,244 544,666,000 554,121,237 544,423,558 164,625,000 164,625,000 9,200,000 9,200,000
Department of Defense Reconciliation Authorization Request .................................................................... 532,461,244 164,625,000 9,200,000
Medicare-Eligible Retiree Health Fund Contribution3 ................ +7,816,815 Milcon/Fam Hsg Program Requiring Auth of Appn4 .................. +2,635,715 Milcon/Fam Hsg Funding for Previously Authorized Projects4 ................................................................................ +1,752,226
Subtotal .......................................................................................... 544,666,000 Appropriation Request .................................................................... 544,666,000 164,625,000 9,200,000
Concurrent Receipt Accrual Payment Mil Ret Fund5 ................ +9,346,000 Operation and Maintenance Accounts (less DHP)6 .................. +1,125,499 Defense Health Program7 ......................................................... -142,000 Procurement Accounts6 ............................................................. +327,000 RDT&E Accounts6 ..................................................................... +215,000 Receipts, Trust Funds and Interfund Transactions5 .................. -1,416,262
Subtotal .......................................................................................... 554,121,237 Budget Authority ............................................................................. 554,121,237 164,625,000 9,200,000
Concurrent Receipt Accrual Payment Mil Ret Fund5 ................ -9,346,000 Operation and Maintenance Accounts (less DHP)6 .................. -1,167,941 Defense Health Program7 ......................................................... +142,000 Procurement Accounts6 ............................................................. -327,000 RDT&E Accounts6 ..................................................................... -215,000 Receipts, Trust Funds and Interfund Transactions5 .................. +1,416,262 Revolving and Management Fund Accounts8 ........................... -200,000
Subtotal .......................................................................................... 544,423,558 Total Obligational Authority ............................................................ 544,423,558 164,625,000 9,200,000
Table 3-1: FY 2020 DEFENSE BUDGET - RECONCILIATION OF AUTHORIZATION, APPROPRIATION, BA AND TOA(Dollars in Thousands)
Base Emergency2OCO1
38
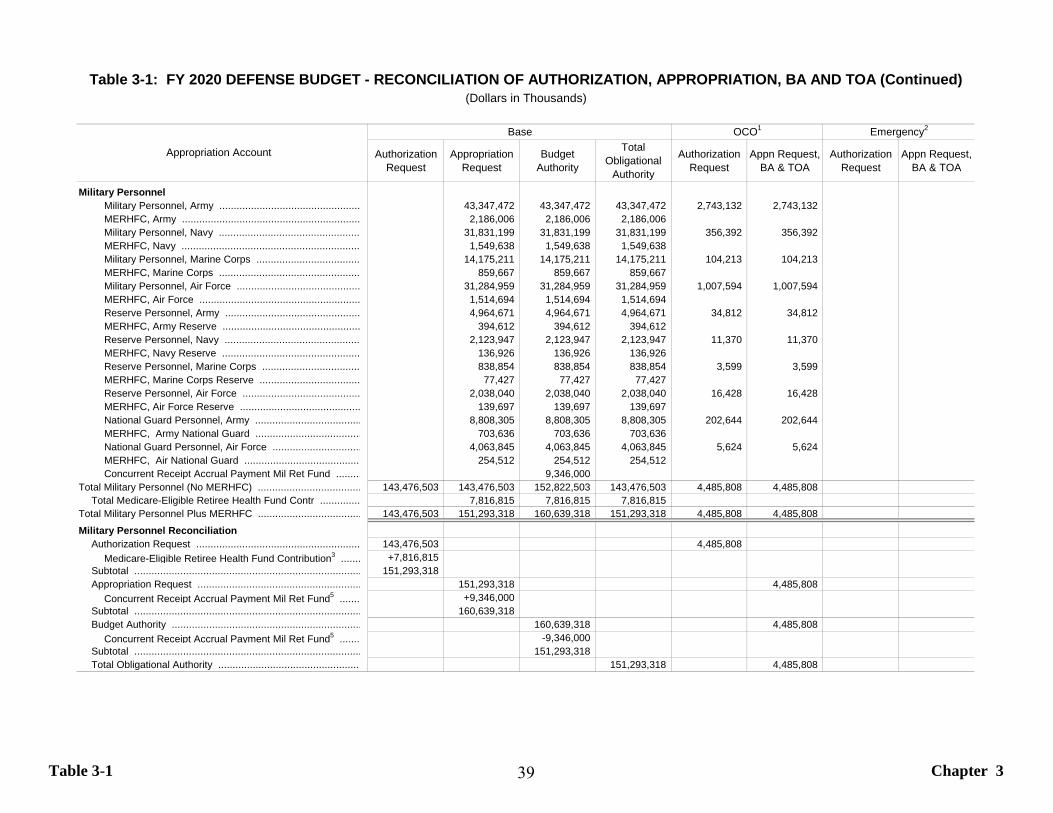
Table 3-1 Chapter 3
Authorization Request
Appropriation Request
BudgetAuthority
TotalObligational
Authority
Authorization Request
Appn Request,BA & TOA
Authorization Request
Appn Request,BA & TOA
Military Personnel Military Personnel, Army ................................................. 43,347,472 43,347,472 43,347,472 2,743,132 2,743,132 MERHFC, Army .............................................................. 2,186,006 2,186,006 2,186,006 Military Personnel, Navy ................................................. 31,831,199 31,831,199 31,831,199 356,392 356,392 MERHFC, Navy .............................................................. 1,549,638 1,549,638 1,549,638 Military Personnel, Marine Corps .................................... 14,175,211 14,175,211 14,175,211 104,213 104,213 MERHFC, Marine Corps ................................................. 859,667 859,667 859,667 Military Personnel, Air Force ........................................... 31,284,959 31,284,959 31,284,959 1,007,594 1,007,594 MERHFC, Air Force ........................................................ 1,514,694 1,514,694 1,514,694 Reserve Personnel, Army ............................................... 4,964,671 4,964,671 4,964,671 34,812 34,812 MERHFC, Army Reserve ................................................ 394,612 394,612 394,612 Reserve Personnel, Navy ............................................... 2,123,947 2,123,947 2,123,947 11,370 11,370 MERHFC, Navy Reserve ................................................ 136,926 136,926 136,926 Reserve Personnel, Marine Corps .................................. 838,854 838,854 838,854 3,599 3,599 MERHFC, Marine Corps Reserve ................................... 77,427 77,427 77,427 Reserve Personnel, Air Force ......................................... 2,038,040 2,038,040 2,038,040 16,428 16,428 MERHFC, Air Force Reserve .......................................... 139,697 139,697 139,697 National Guard Personnel, Army ..................................... 8,808,305 8,808,305 8,808,305 202,644 202,644 MERHFC, Army National Guard ..................................... 703,636 703,636 703,636 National Guard Personnel, Air Force ............................... 4,063,845 4,063,845 4,063,845 5,624 5,624 MERHFC, Air National Guard ......................................... 254,512 254,512 254,512 Concurrent Receipt Accrual Payment Mil Ret Fund ......... 9,346,000
Total Military Personnel (No MERHFC) .................................... 143,476,503 143,476,503 152,822,503 143,476,503 4,485,808 4,485,808 Total Medicare-Eligible Retiree Health Fund Contr .............. 7,816,815 7,816,815 7,816,815
Total Military Personnel Plus MERHFC .................................... 143,476,503 151,293,318 160,639,318 151,293,318 4,485,808 4,485,808 Military Personnel Reconciliation
Authorization Request ......................................................... 143,476,503 4,485,808 Medicare-Eligible Retiree Health Fund Contribution3 ....... +7,816,815
Subtotal ............................................................................... 151,293,318 Appropriation Request ......................................................... 151,293,318 4,485,808
Concurrent Receipt Accrual Payment Mil Ret Fund5 ....... +9,346,000 Subtotal ............................................................................... 160,639,318 Budget Authority .................................................................. 160,639,318 4,485,808
Concurrent Receipt Accrual Payment Mil Ret Fund5 ....... -9,346,000 Subtotal ............................................................................... 151,293,318 Total Obligational Authority .................................................. 151,293,318 4,485,808
Table 3-1: FY 2020 DEFENSE BUDGET - RECONCILIATION OF AUTHORIZATION, APPROPRIATION, BA AND TOA (Continued)(Dollars in Thousands)
Appropriation Account
Base Emergency2OCO1
39
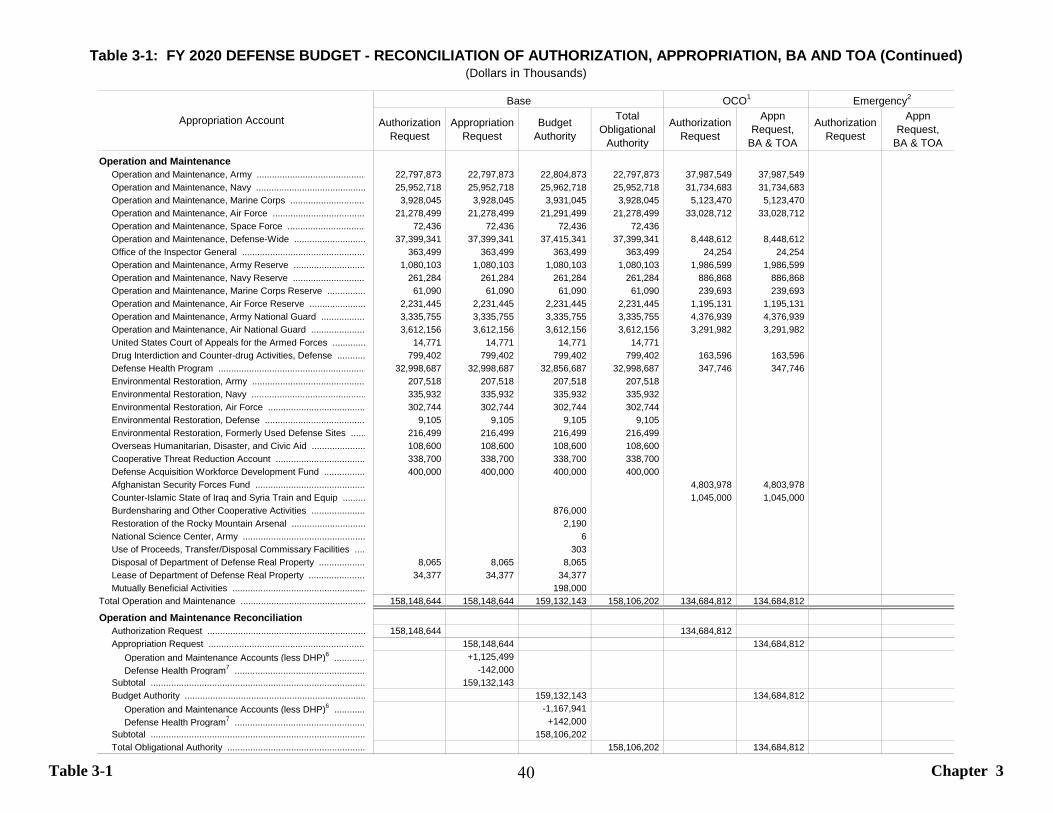
Table 3-1 Chapter 3
Authorization Request
Appropriation Request
BudgetAuthority
TotalObligational
Authority
Authorization Request
Appn Request,
BA & TOA
Authorization Request
Appn Request,
BA & TOAOperation and Maintenance
Operation and Maintenance, Army ........................................... 22,797,873 22,797,873 22,804,873 22,797,873 37,987,549 37,987,549 Operation and Maintenance, Navy ........................................... 25,952,718 25,952,718 25,962,718 25,952,718 31,734,683 31,734,683 Operation and Maintenance, Marine Corps .............................. 3,928,045 3,928,045 3,931,045 3,928,045 5,123,470 5,123,470 Operation and Maintenance, Air Force .................................... 21,278,499 21,278,499 21,291,499 21,278,499 33,028,712 33,028,712 Operation and Maintenance, Space Force ............................... 72,436 72,436 72,436 72,436 Operation and Maintenance, Defense-Wide ............................ 37,399,341 37,399,341 37,415,341 37,399,341 8,448,612 8,448,612 Office of the Inspector General ................................................ 363,499 363,499 363,499 363,499 24,254 24,254 Operation and Maintenance, Army Reserve ............................ 1,080,103 1,080,103 1,080,103 1,080,103 1,986,599 1,986,599 Operation and Maintenance, Navy Reserve ............................. 261,284 261,284 261,284 261,284 886,868 886,868 Operation and Maintenance, Marine Corps Reserve ............... 61,090 61,090 61,090 61,090 239,693 239,693 Operation and Maintenance, Air Force Reserve ...................... 2,231,445 2,231,445 2,231,445 2,231,445 1,195,131 1,195,131 Operation and Maintenance, Army National Guard ................. 3,335,755 3,335,755 3,335,755 3,335,755 4,376,939 4,376,939 Operation and Maintenance, Air National Guard ..................... 3,612,156 3,612,156 3,612,156 3,612,156 3,291,982 3,291,982 United States Court of Appeals for the Armed Forces ............. 14,771 14,771 14,771 14,771 Drug Interdiction and Counter-drug Activities, Defense ........... 799,402 799,402 799,402 799,402 163,596 163,596 Defense Health Program .......................................................... 32,998,687 32,998,687 32,856,687 32,998,687 347,746 347,746 Environmental Restoration, Army ............................................. 207,518 207,518 207,518 207,518 Environmental Restoration, Navy ............................................. 335,932 335,932 335,932 335,932 Environmental Restoration, Air Force ...................................... 302,744 302,744 302,744 302,744 Environmental Restoration, Defense ....................................... 9,105 9,105 9,105 9,105 Environmental Restoration, Formerly Used Defense Sites ...... 216,499 216,499 216,499 216,499 Overseas Humanitarian, Disaster, and Civic Aid ..................... 108,600 108,600 108,600 108,600 Cooperative Threat Reduction Account ................................... 338,700 338,700 338,700 338,700 Defense Acquisition Workforce Development Fund ................ 400,000 400,000 400,000 400,000 Afghanistan Security Forces Fund ........................................... 4,803,978 4,803,978 Counter-Islamic State of Iraq and Syria Train and Equip ......... 1,045,000 1,045,000 Burdensharing and Other Cooperative Activities ..................... 876,000 Restoration of the Rocky Mountain Arsenal ............................. 2,190 National Science Center, Army ................................................ 6 Use of Proceeds, Transfer/Disposal Commissary Facilities .... 303 Disposal of Department of Defense Real Property .................. 8,065 8,065 8,065 Lease of Department of Defense Real Property ...................... 34,377 34,377 34,377 Mutually Beneficial Activities .................................................... 198,000
Total Operation and Maintenance ................................................. 158,148,644 158,148,644 159,132,143 158,106,202 134,684,812 134,684,812
Operation and Maintenance Reconciliation Authorization Request .............................................................. 158,148,644 134,684,812 Appropriation Request .............................................................. 158,148,644 134,684,812
Operation and Maintenance Accounts (less DHP)6 ............ +1,125,499 Defense Health Program7 ................................................... -142,000
Subtotal .................................................................................... 159,132,143 Budget Authority ....................................................................... 159,132,143 134,684,812
Operation and Maintenance Accounts (less DHP)6 ............ -1,167,941 Defense Health Program7 ................................................... +142,000
Subtotal .................................................................................... 158,106,202 Total Obligational Authority ...................................................... 158,106,202 134,684,812
Table 3-1: FY 2020 DEFENSE BUDGET - RECONCILIATION OF AUTHORIZATION, APPROPRIATION, BA AND TOA (Continued)(Dollars in Thousands)
Appropriation Account
Base Emergency2OCO1
40
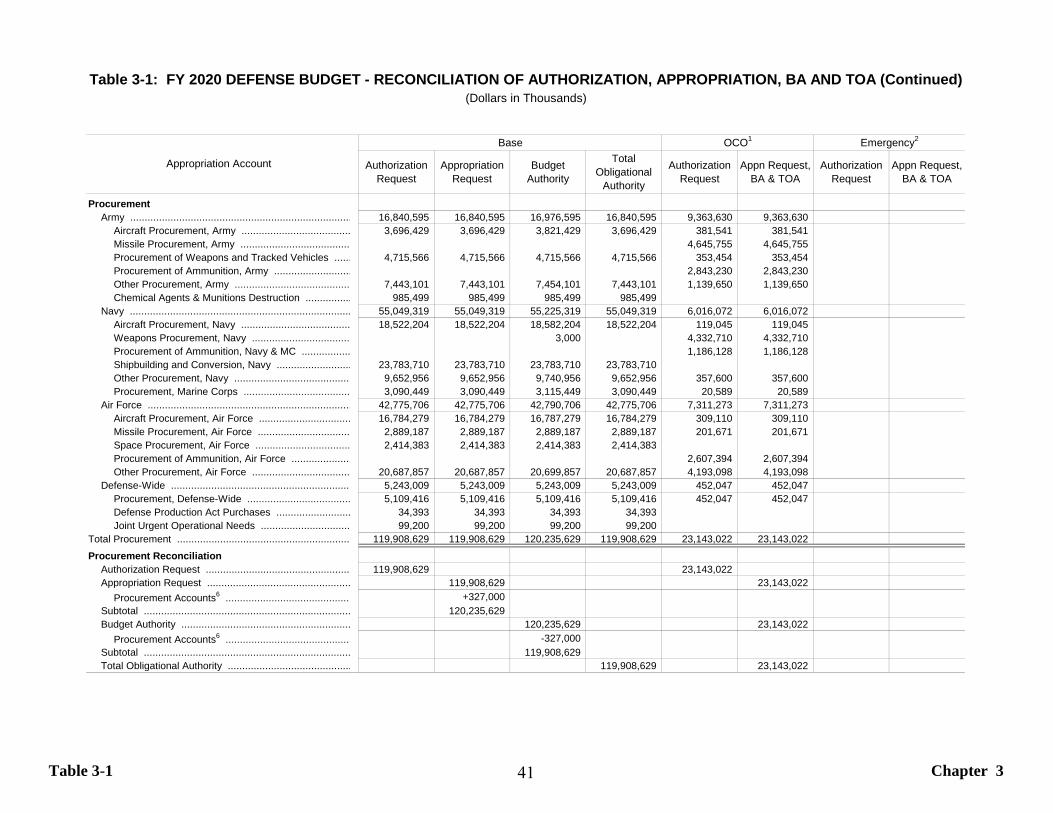
Table 3-1 Chapter 3
Authorization Request
AppropriationRequest
BudgetAuthority
TotalObligational
Authority
Authorization Request
Appn Request,BA & TOA
Authorization Request
Appn Request,BA & TOA
Procurement Army ............................................................................. 16,840,595 16,840,595 16,976,595 16,840,595 9,363,630 9,363,630
Aircraft Procurement, Army ...................................... 3,696,429 3,696,429 3,821,429 3,696,429 381,541 381,541 Missile Procurement, Army ....................................... 4,645,755 4,645,755 Procurement of Weapons and Tracked Vehicles ...... 4,715,566 4,715,566 4,715,566 4,715,566 353,454 353,454 Procurement of Ammunition, Army ........................... 2,843,230 2,843,230 Other Procurement, Army ......................................... 7,443,101 7,443,101 7,454,101 7,443,101 1,139,650 1,139,650 Chemical Agents & Munitions Destruction ................ 985,499 985,499 985,499 985,499
Navy ............................................................................. 55,049,319 55,049,319 55,225,319 55,049,319 6,016,072 6,016,072 Aircraft Procurement, Navy ...................................... 18,522,204 18,522,204 18,582,204 18,522,204 119,045 119,045 Weapons Procurement, Navy ................................... 3,000 4,332,710 4,332,710 Procurement of Ammunition, Navy & MC ................. 1,186,128 1,186,128 Shipbuilding and Conversion, Navy .......................... 23,783,710 23,783,710 23,783,710 23,783,710 Other Procurement, Navy ......................................... 9,652,956 9,652,956 9,740,956 9,652,956 357,600 357,600 Procurement, Marine Corps ..................................... 3,090,449 3,090,449 3,115,449 3,090,449 20,589 20,589
Air Force ....................................................................... 42,775,706 42,775,706 42,790,706 42,775,706 7,311,273 7,311,273 Aircraft Procurement, Air Force ................................ 16,784,279 16,784,279 16,787,279 16,784,279 309,110 309,110 Missile Procurement, Air Force ................................ 2,889,187 2,889,187 2,889,187 2,889,187 201,671 201,671 Space Procurement, Air Force ................................. 2,414,383 2,414,383 2,414,383 2,414,383 Procurement of Ammunition, Air Force ..................... 2,607,394 2,607,394 Other Procurement, Air Force .................................. 20,687,857 20,687,857 20,699,857 20,687,857 4,193,098 4,193,098
Defense-Wide ............................................................... 5,243,009 5,243,009 5,243,009 5,243,009 452,047 452,047 Procurement, Defense-Wide .................................... 5,109,416 5,109,416 5,109,416 5,109,416 452,047 452,047 Defense Production Act Purchases .......................... 34,393 34,393 34,393 34,393 Joint Urgent Operational Needs ............................... 99,200 99,200 99,200 99,200
Total Procurement ............................................................. 119,908,629 119,908,629 120,235,629 119,908,629 23,143,022 23,143,022 Procurement Reconciliation
Authorization Request ................................................... 119,908,629 23,143,022 Appropriation Request .................................................. 119,908,629 23,143,022
Procurement Accounts6 ............................................ +327,000 Subtotal ........................................................................ 120,235,629 Budget Authority ........................................................... 120,235,629 23,143,022
Procurement Accounts6 ............................................ -327,000 Subtotal ........................................................................ 119,908,629 Total Obligational Authority ........................................... 119,908,629 23,143,022
Table 3-1: FY 2020 DEFENSE BUDGET - RECONCILIATION OF AUTHORIZATION, APPROPRIATION, BA AND TOA (Continued)(Dollars in Thousands)
Appropriation Account
Base Emergency2OCO1
41
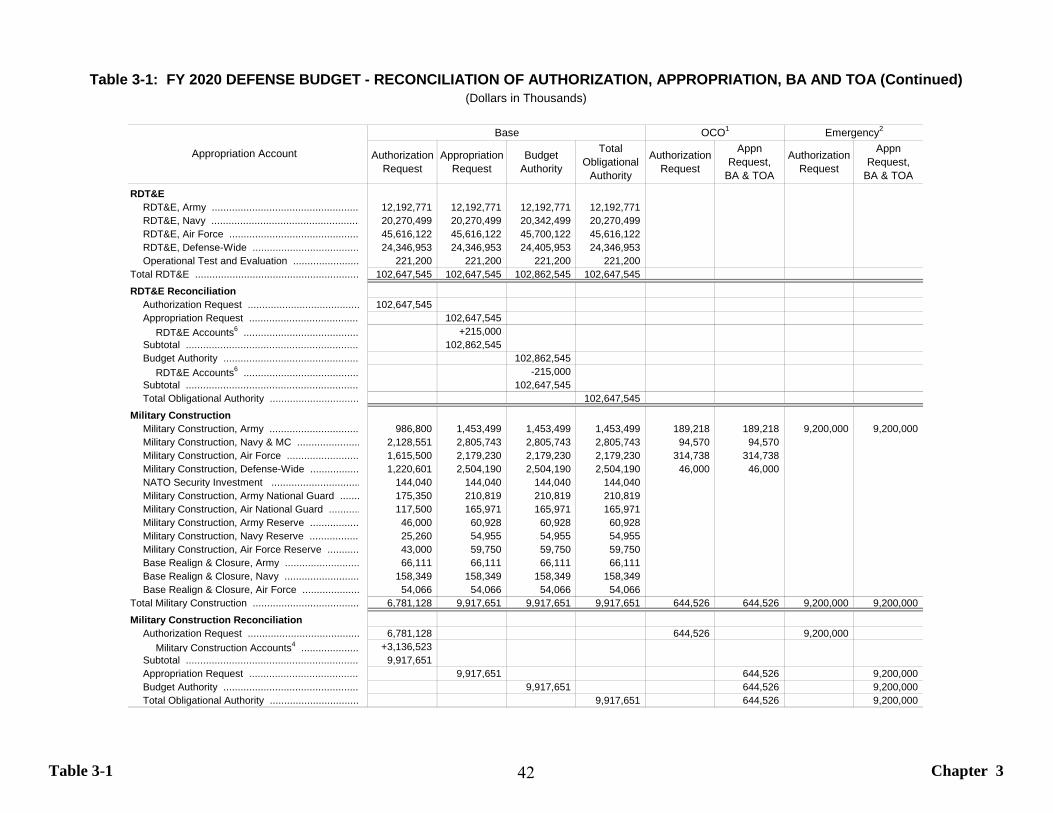
Table 3-1 Chapter 3
Authorization Request
Appropriation Request
BudgetAuthority
TotalObligational
Authority
Authorization Request
Appn Request,
BA & TOA
Authorization Request
Appn Request,
BA & TOARDT&E
RDT&E, Army .................................................... 12,192,771 12,192,771 12,192,771 12,192,771 RDT&E, Navy .................................................... 20,270,499 20,270,499 20,342,499 20,270,499 RDT&E, Air Force .............................................. 45,616,122 45,616,122 45,700,122 45,616,122 RDT&E, Defense-Wide ...................................... 24,346,953 24,346,953 24,405,953 24,346,953 Operational Test and Evaluation ....................... 221,200 221,200 221,200 221,200
Total RDT&E .......................................................... 102,647,545 102,647,545 102,862,545 102,647,545 RDT&E Reconciliation
Authorization Request ....................................... 102,647,545 Appropriation Request ....................................... 102,647,545
RDT&E Accounts6 ......................................... +215,000 Subtotal ............................................................. 102,862,545 Budget Authority ................................................ 102,862,545
RDT&E Accounts6 ......................................... -215,000 Subtotal ............................................................. 102,647,545 Total Obligational Authority ................................ 102,647,545
Military Construction Military Construction, Army ................................ 986,800 1,453,499 1,453,499 1,453,499 189,218 189,218 9,200,000 9,200,000 Military Construction, Navy & MC ...................... 2,128,551 2,805,743 2,805,743 2,805,743 94,570 94,570 Military Construction, Air Force .......................... 1,615,500 2,179,230 2,179,230 2,179,230 314,738 314,738 Military Construction, Defense-Wide ................. 1,220,601 2,504,190 2,504,190 2,504,190 46,000 46,000 NATO Security Investment ............................... 144,040 144,040 144,040 144,040 Military Construction, Army National Guard ....... 175,350 210,819 210,819 210,819 Military Construction, Air National Guard ........... 117,500 165,971 165,971 165,971 Military Construction, Army Reserve .................. 46,000 60,928 60,928 60,928 Military Construction, Navy Reserve .................. 25,260 54,955 54,955 54,955 Military Construction, Air Force Reserve ........... 43,000 59,750 59,750 59,750 Base Realign & Closure, Army .......................... 66,111 66,111 66,111 66,111 Base Realign & Closure, Navy .......................... 158,349 158,349 158,349 158,349 Base Realign & Closure, Air Force .................... 54,066 54,066 54,066 54,066
Total Military Construction ..................................... 6,781,128 9,917,651 9,917,651 9,917,651 644,526 644,526 9,200,000 9,200,000 Military Construction Reconciliation
Authorization Request ....................................... 6,781,128 644,526 9,200,000 Military Construction Accounts4 ..................... +3,136,523
Subtotal ............................................................. 9,917,651 Appropriation Request ....................................... 9,917,651 644,526 9,200,000 Budget Authority ................................................ 9,917,651 644,526 9,200,000 Total Obligational Authority ................................ 9,917,651 644,526 9,200,000
Appropriation Account
Base Emergency2
(Dollars in Thousands)Table 3-1: FY 2020 DEFENSE BUDGET - RECONCILIATION OF AUTHORIZATION, APPROPRIATION, BA AND TOA (Continued)
OCO1
42
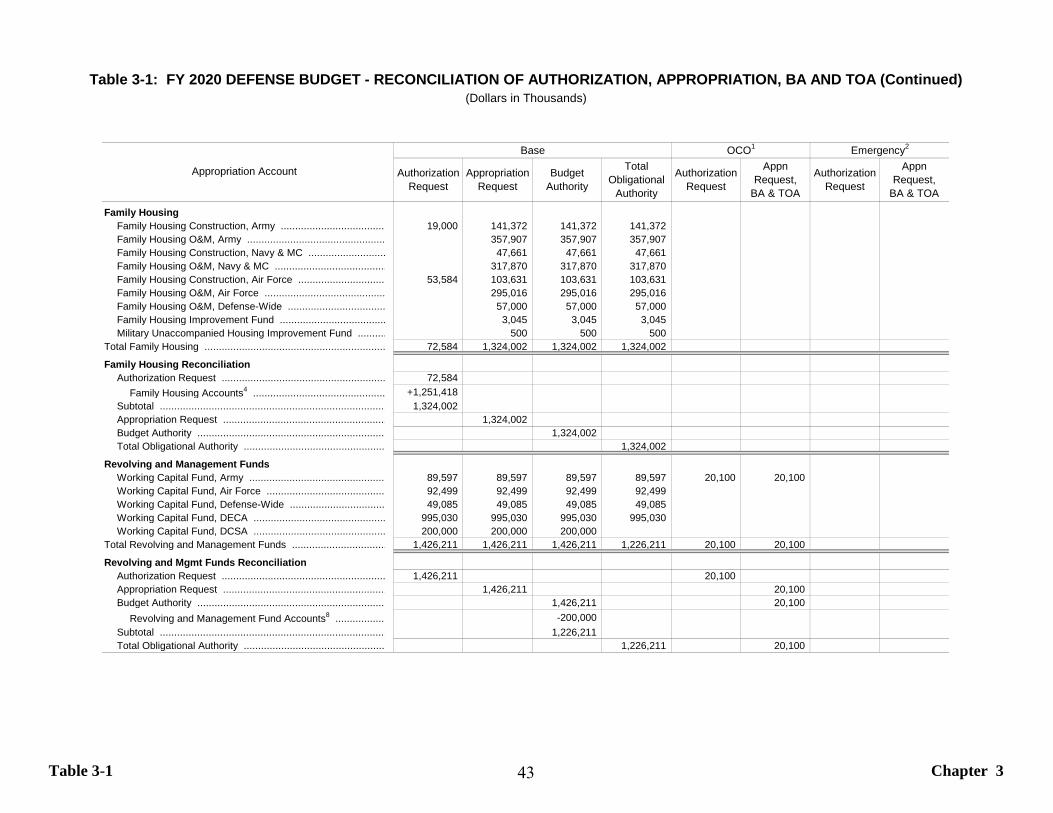
Table 3-1 Chapter 3
Authorization Request
Appropriation Request
BudgetAuthority
TotalObligational
Authority
Authorization Request
Appn Request,
BA & TOA
Authorization Request
Appn Request,
BA & TOA
Family Housing Family Housing Construction, Army ..................................... 19,000 141,372 141,372 141,372 Family Housing O&M, Army ................................................ 357,907 357,907 357,907 Family Housing Construction, Navy & MC ........................... 47,661 47,661 47,661 Family Housing O&M, Navy & MC ....................................... 317,870 317,870 317,870 Family Housing Construction, Air Force ............................... 53,584 103,631 103,631 103,631 Family Housing O&M, Air Force .......................................... 295,016 295,016 295,016 Family Housing O&M, Defense-Wide .................................. 57,000 57,000 57,000 Family Housing Improvement Fund ..................................... 3,045 3,045 3,045 Military Unaccompanied Housing Improvement Fund .......... 500 500 500
Total Family Housing ............................................................... 72,584 1,324,002 1,324,002 1,324,002
Family Housing Reconciliation Authorization Request ......................................................... 72,584
Family Housing Accounts4 .............................................. +1,251,418 Subtotal ............................................................................... 1,324,002 Appropriation Request ......................................................... 1,324,002 Budget Authority .................................................................. 1,324,002 Total Obligational Authority .................................................. 1,324,002
Revolving and Management Funds Working Capital Fund, Army ................................................ 89,597 89,597 89,597 89,597 20,100 20,100 Working Capital Fund, Air Force .......................................... 92,499 92,499 92,499 92,499 Working Capital Fund, Defense-Wide .................................. 49,085 49,085 49,085 49,085 Working Capital Fund, DECA .............................................. 995,030 995,030 995,030 995,030 Working Capital Fund, DCSA .............................................. 200,000 200,000 200,000
Total Revolving and Management Funds ................................. 1,426,211 1,426,211 1,426,211 1,226,211 20,100 20,100
Revolving and Mgmt Funds Reconciliation Authorization Request ......................................................... 1,426,211 20,100 Appropriation Request ......................................................... 1,426,211 20,100 Budget Authority .................................................................. 1,426,211 20,100
Revolving and Management Fund Accounts8 .................. -200,000 Subtotal ............................................................................... 1,226,211 Total Obligational Authority .................................................. 1,226,211 20,100
Table 3-1: FY 2020 DEFENSE BUDGET - RECONCILIATION OF AUTHORIZATION, APPROPRIATION, BA AND TOA (Continued)
Emergency2Base
Appropriation Account
(Dollars in Thousands)
OCO1
43
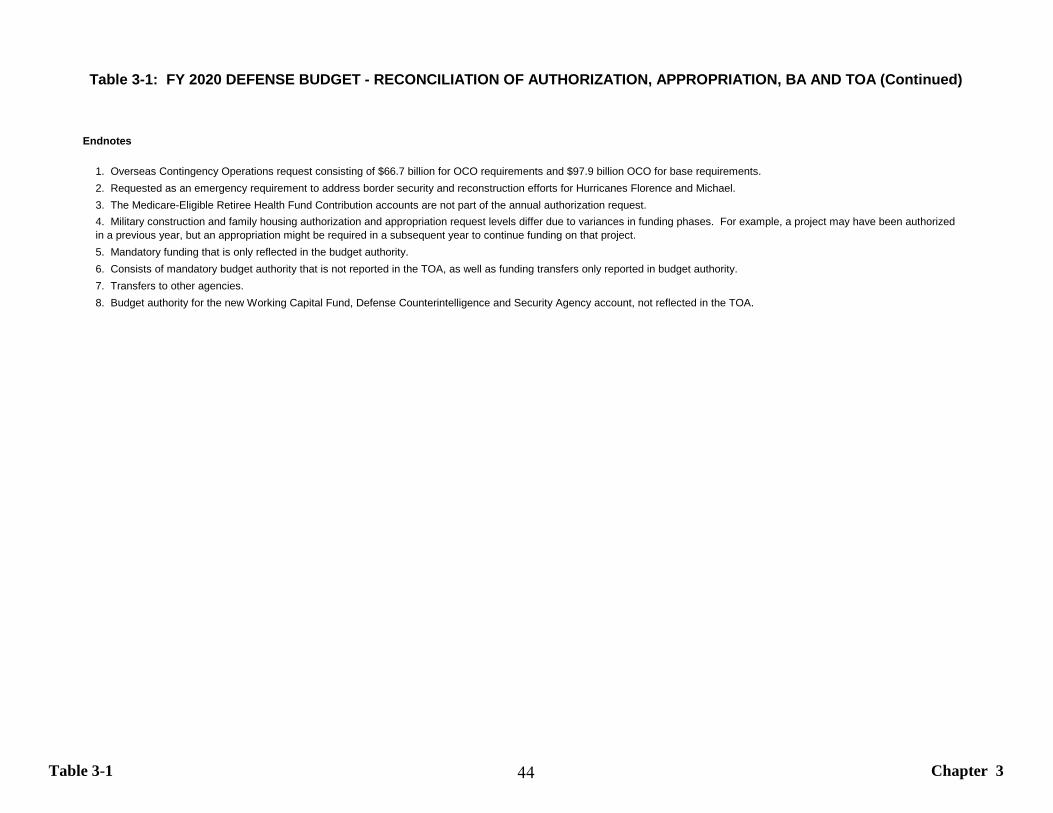
Table 3-1 Chapter 3
Endnotes
1. Overseas Contingency Operations request consisting of $66.7 billion for OCO requirements and $97.9 billion OCO for base requirements.2. Requested as an emergency requirement to address border security and reconstruction efforts for Hurricanes Florence and Michael.3. The Medicare-Eligible Retiree Health Fund Contribution accounts are not part of the annual authorization request.
5. Mandatory funding that is only reflected in the budget authority.6. Consists of mandatory budget authority that is not reported in the TOA, as well as funding transfers only reported in budget authority.7. Transfers to other agencies.8. Budget authority for the new Working Capital Fund, Defense Counterintelligence and Security Agency account, not reflected in the TOA.
4. Military construction and family housing authorization and appropriation request levels differ due to variances in funding phases. For example, a project may have been authorized in a previous year, but an appropriation might be required in a subsequent year to continue funding on that project.
Table 3-1: FY 2020 DEFENSE BUDGET - RECONCILIATION OF AUTHORIZATION, APPROPRIATION, BA AND TOA (Continued)
44
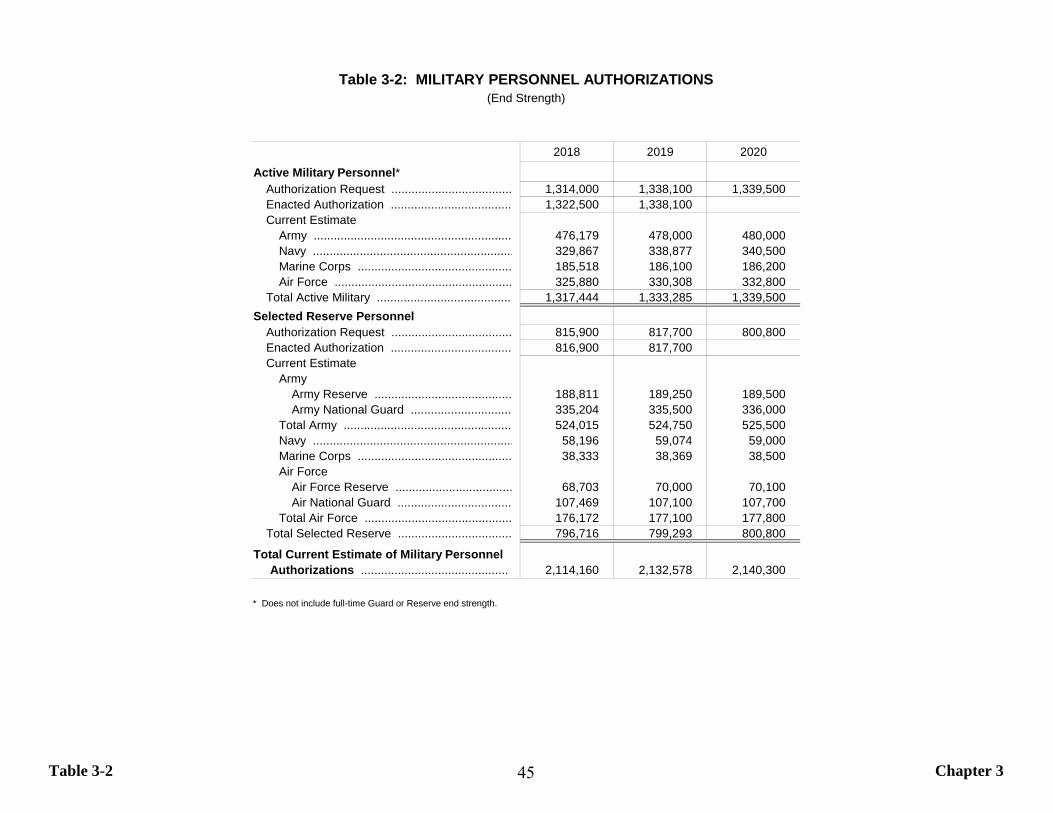
Table 3-2 Chapter 3
2018 2019 2020
Active Military Personnel* Authorization Request .................................... 1,314,000 1,338,100 1,339,500Enacted Authorization .................................... 1,322,500 1,338,100Current Estimate
Army ........................................................... 476,179 478,000 480,000Navy ............................................................ 329,867 338,877 340,500Marine Corps .............................................. 185,518 186,100 186,200Air Force ..................................................... 325,880 330,308 332,800
Total Active Military ......................................... 1,317,444 1,333,285 1,339,500Selected Reserve Personnel
Authorization Request .................................... 815,900 817,700 800,800Enacted Authorization .................................... 816,900 817,700Current Estimate
Army Army Reserve ......................................... 188,811 189,250 189,500Army National Guard ............................... 335,204 335,500 336,000
Total Army ................................................... 524,015 524,750 525,500Navy ............................................................ 58,196 59,074 59,000Marine Corps .............................................. 38,333 38,369 38,500Air Force
Air Force Reserve ................................... 68,703 70,000 70,100Air National Guard .................................. 107,469 107,100 107,700
Total Air Force ............................................ 176,172 177,100 177,800Total Selected Reserve .................................. 796,716 799,293 800,800
2,114,160 2,132,578 2,140,300
* Does not include full-time Guard or Reserve end strength.
Total Current Estimate of Military Personnel Authorizations ............................................
Table 3-2: MILITARY PERSONNEL AUTHORIZATIONS(End Strength)
45

This Page Intentionally Left Blank
46
Introduction Chapter 4
Chapter 4: Chronology
Tables Page4-1 FY 2018 National Defense Budget Authority Chronology..................................................................................................................................... 484-2 FY 2019 National Defense Budget Authority Chronology..................................................................................................................................... 50
Chronologies are important because of the scorekeeping provisionsof the Congressional Budget and Impoundment Act. Table 4-1provides a chronology of FY 2018 National Defense budgetauthority, beginning with the FY 2018 budget request submitted tothe Congress. Then the table shows congressional action resultingin the FY 2018 column of the FY 2019 budget submitted to theCongress. Finally, further appropriations, rescissions, transfers and
other adjustments are shown, resulting in the FY 2018 column ofthe FY 2020 budget request submitted to the Congress. Similarly,Table 4-2 provides a chronology of FY 2019 National Defensebudget authority, beginning with the FY 2019 budget requestsubmitted to the Congress, and ends with the FY 2019 column ofthe FY 2020 budget request.
47
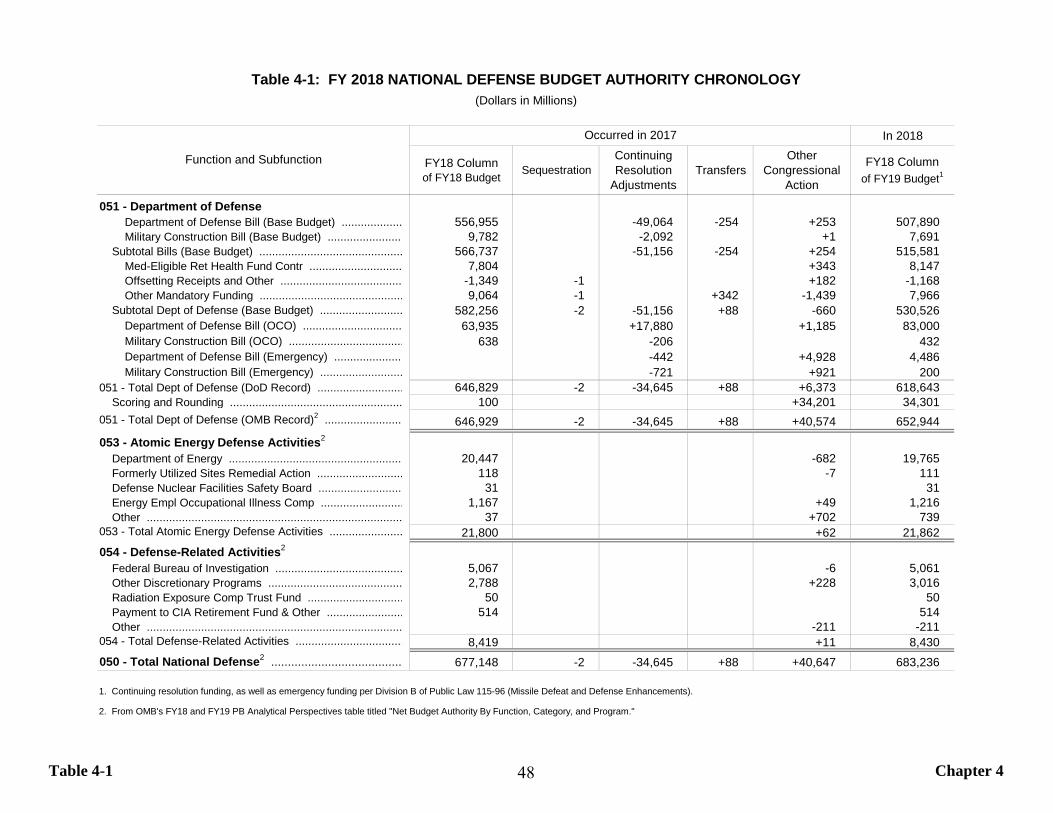
Table 4-1 Chapter 4
In 2018
FY18 Columnof FY18 Budget Sequestration
Continuing Resolution
AdjustmentsTransfers
Other Congressional
Action
FY18 Columnof FY19 Budget1
051 - Department of DefenseDepartment of Defense Bill (Base Budget) ................... 556,955 -49,064 -254 +253 507,890Military Construction Bill (Base Budget) ........................ 9,782 -2,092 +1 7,691
Subtotal Bills (Base Budget) ............................................. 566,737 -51,156 -254 +254 515,581Med-Eligible Ret Health Fund Contr ............................. 7,804 +343 8,147Offsetting Receipts and Other ...................................... -1,349 -1 +182 -1,168Other Mandatory Funding ............................................. 9,064 -1 +342 -1,439 7,966
Subtotal Dept of Defense (Base Budget) .......................... 582,256 -2 -51,156 +88 -660 530,526Department of Defense Bill (OCO) ............................... 63,935 +17,880 +1,185 83,000Military Construction Bill (OCO) .................................... 638 -206 432Department of Defense Bill (Emergency) ...................... -442 +4,928 4,486Military Construction Bill (Emergency) .......................... -721 +921 200
051 - Total Dept of Defense (DoD Record) ........................... 646,829 -2 -34,645 +88 +6,373 618,643Scoring and Rounding ...................................................... 100 +34,201 34,301
051 - Total Dept of Defense (OMB Record)2 ........................ 646,929 -2 -34,645 +88 +40,574 652,944
053 - Atomic Energy Defense Activities2 Department of Energy ....................................................... 20,447 -682 19,765Formerly Utilized Sites Remedial Action ........................... 118 -7 111Defense Nuclear Facilities Safety Board .......................... 31 31Energy Empl Occupational Illness Comp .......................... 1,167 +49 1,216Other ................................................................................ 37 +702 739
053 - Total Atomic Energy Defense Activities ....................... 21,800 +62 21,862054 - Defense-Related Activities2
Federal Bureau of Investigation ........................................ 5,067 -6 5,061Other Discretionary Programs .......................................... 2,788 +228 3,016Radiation Exposure Comp Trust Fund .............................. 50 50Payment to CIA Retirement Fund & Other ........................ 514 514Other ................................................................................ -211 -211
054 - Total Defense-Related Activities .................................. 8,419 +11 8,430050 - Total National Defense2 ....................................... 677,148 -2 -34,645 +88 +40,647 683,236
1. Continuing resolution funding, as well as emergency funding per Division B of Public Law 115-96 (Missile Defeat and Defense Enhancements).
2. From OMB's FY18 and FY19 PB Analytical Perspectives table titled "Net Budget Authority By Function, Category, and Program."
Table 4-1: FY 2018 NATIONAL DEFENSE BUDGET AUTHORITY CHRONOLOGY(Dollars in Millions)
Function and Subfunction
Occurred in 2017
48
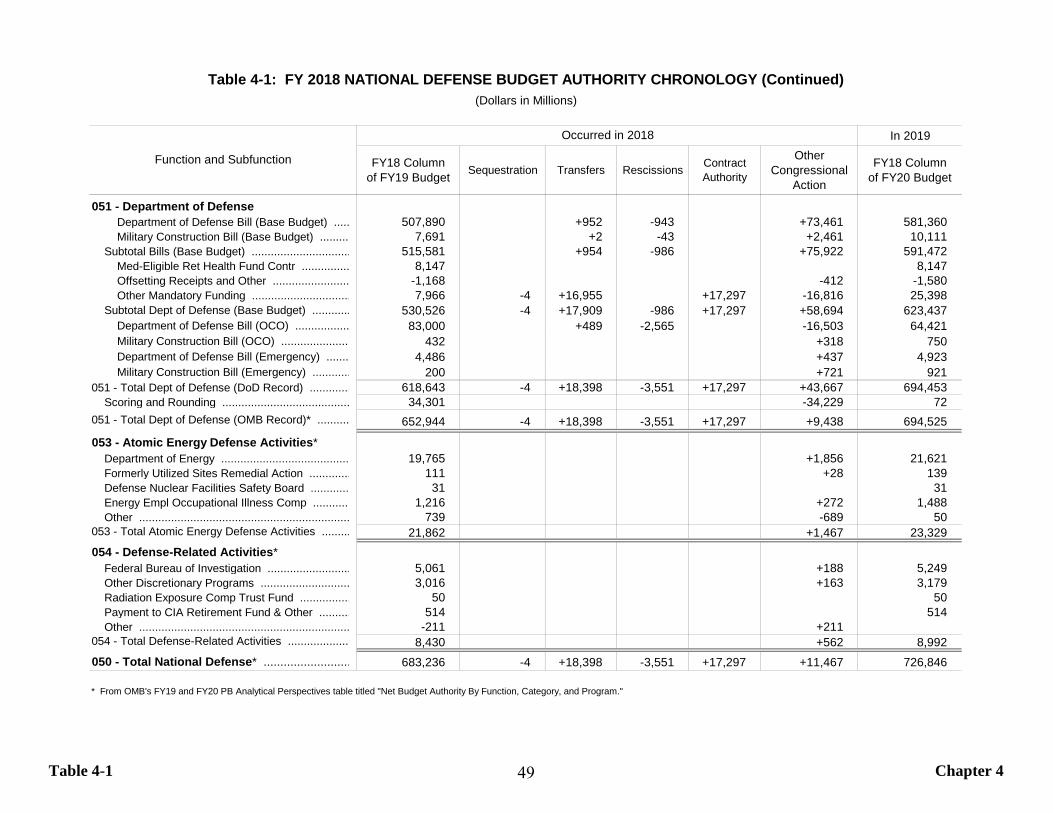
Table 4-1 Chapter 4
In 2019
FY18 Columnof FY19 Budget Sequestration Transfers Rescissions Contract
Authority
Other Congressional
Action
FY18 Columnof FY20 Budget
051 - Department of DefenseDepartment of Defense Bill (Base Budget) ..... 507,890 +952 -943 +73,461 581,360Military Construction Bill (Base Budget) ......... 7,691 +2 -43 +2,461 10,111
Subtotal Bills (Base Budget) ............................... 515,581 +954 -986 +75,922 591,472Med-Eligible Ret Health Fund Contr ............... 8,147 8,147Offsetting Receipts and Other ........................ -1,168 -412 -1,580Other Mandatory Funding ............................... 7,966 -4 +16,955 +17,297 -16,816 25,398
Subtotal Dept of Defense (Base Budget) ............ 530,526 -4 +17,909 -986 +17,297 +58,694 623,437Department of Defense Bill (OCO) ................. 83,000 +489 -2,565 -16,503 64,421Military Construction Bill (OCO) ..................... 432 +318 750Department of Defense Bill (Emergency) ....... 4,486 +437 4,923Military Construction Bill (Emergency) ............ 200 +721 921
051 - Total Dept of Defense (DoD Record) ............. 618,643 -4 +18,398 -3,551 +17,297 +43,667 694,453Scoring and Rounding ........................................ 34,301 -34,229 72
051 - Total Dept of Defense (OMB Record)* .......... 652,944 -4 +18,398 -3,551 +17,297 +9,438 694,525
053 - Atomic Energy Defense Activities* Department of Energy ........................................ 19,765 +1,856 21,621Formerly Utilized Sites Remedial Action ............. 111 +28 139Defense Nuclear Facilities Safety Board ............ 31 31Energy Empl Occupational Illness Comp ........... 1,216 +272 1,488Other .................................................................. 739 -689 50
053 - Total Atomic Energy Defense Activities ......... 21,862 +1,467 23,329054 - Defense-Related Activities*
Federal Bureau of Investigation .......................... 5,061 +188 5,249Other Discretionary Programs ............................ 3,016 +163 3,179Radiation Exposure Comp Trust Fund ................ 50 50Payment to CIA Retirement Fund & Other .......... 514 514Other .................................................................. -211 +211
054 - Total Defense-Related Activities ................... 8,430 +562 8,992050 - Total National Defense* .......................... 683,236 -4 +18,398 -3,551 +17,297 +11,467 726,846
* From OMB's FY19 and FY20 PB Analytical Perspectives table titled "Net Budget Authority By Function, Category, and Program."
Table 4-1: FY 2018 NATIONAL DEFENSE BUDGET AUTHORITY CHRONOLOGY (Continued)(Dollars in Millions)
Function and Subfunction
Occurred in 2018
49
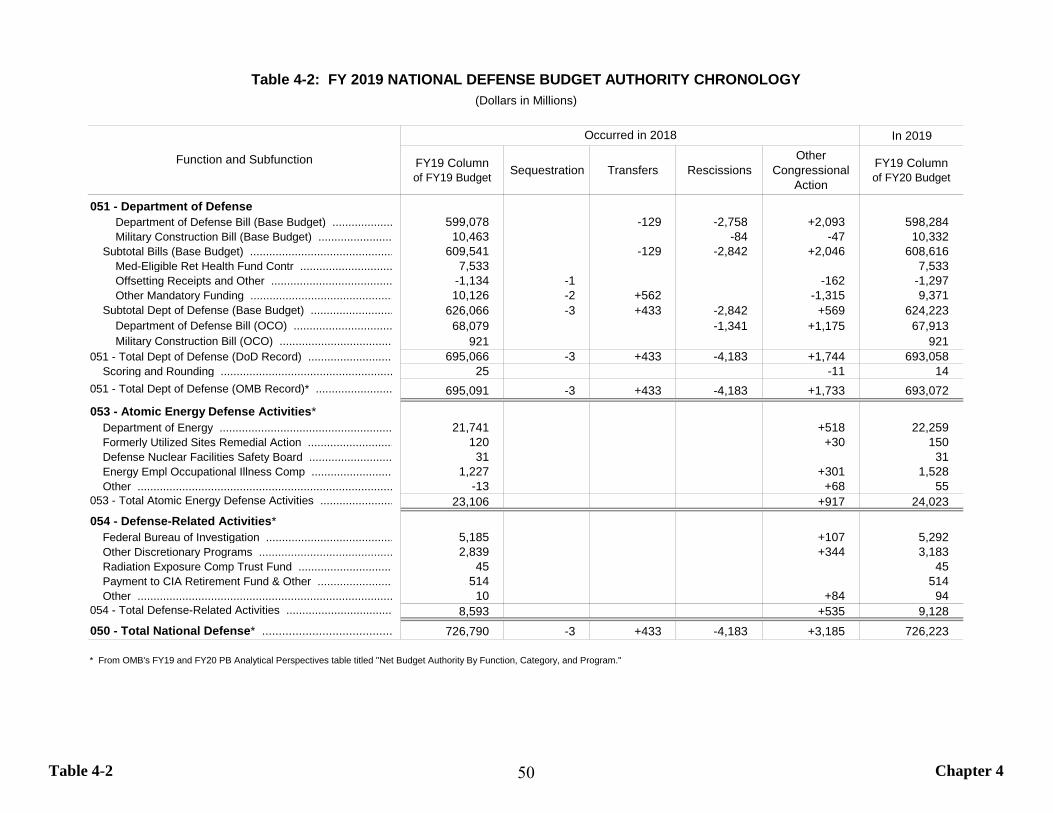
Table 4-2 Chapter 4
In 2019
FY19 Columnof FY19 Budget Sequestration Transfers Rescissions
Other Congressional
Action
FY19 Columnof FY20 Budget
051 - Department of DefenseDepartment of Defense Bill (Base Budget) ................... 599,078 -129 -2,758 +2,093 598,284Military Construction Bill (Base Budget) ........................ 10,463 -84 -47 10,332
Subtotal Bills (Base Budget) ............................................. 609,541 -129 -2,842 +2,046 608,616Med-Eligible Ret Health Fund Contr ............................. 7,533 7,533Offsetting Receipts and Other ...................................... -1,134 -1 -162 -1,297Other Mandatory Funding ............................................. 10,126 -2 +562 -1,315 9,371
Subtotal Dept of Defense (Base Budget) .......................... 626,066 -3 +433 -2,842 +569 624,223Department of Defense Bill (OCO) ............................... 68,079 -1,341 +1,175 67,913Military Construction Bill (OCO) .................................... 921 921
051 - Total Dept of Defense (DoD Record) ........................... 695,066 -3 +433 -4,183 +1,744 693,058Scoring and Rounding ...................................................... 25 -11 14
051 - Total Dept of Defense (OMB Record)* ........................ 695,091 -3 +433 -4,183 +1,733 693,072
053 - Atomic Energy Defense Activities* Department of Energy ...................................................... 21,741 +518 22,259Formerly Utilized Sites Remedial Action ........................... 120 +30 150Defense Nuclear Facilities Safety Board .......................... 31 31Energy Empl Occupational Illness Comp .......................... 1,227 +301 1,528Other ................................................................................ -13 +68 55
053 - Total Atomic Energy Defense Activities ....................... 23,106 +917 24,023054 - Defense-Related Activities*
Federal Bureau of Investigation ........................................ 5,185 +107 5,292Other Discretionary Programs .......................................... 2,839 +344 3,183Radiation Exposure Comp Trust Fund .............................. 45 45Payment to CIA Retirement Fund & Other ........................ 514 514Other ................................................................................ 10 +84 94
054 - Total Defense-Related Activities .................................. 8,593 +535 9,128050 - Total National Defense* ....................................... 726,790 -3 +433 -4,183 +3,185 726,223
* From OMB's FY19 and FY20 PB Analytical Perspectives table titled "Net Budget Authority By Function, Category, and Program."
Table 4-2: FY 2019 NATIONAL DEFENSE BUDGET AUTHORITY CHRONOLOGY(Dollars in Millions)
Function and Subfunction
Occurred in 2018
50
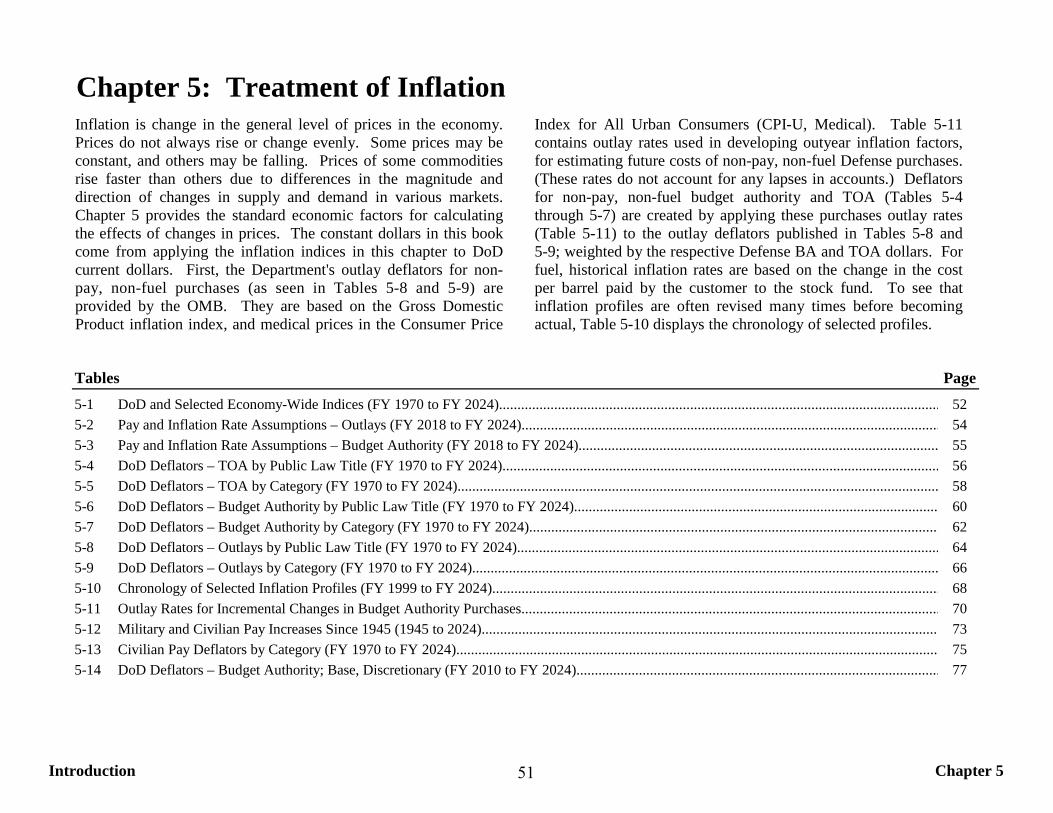
Introduction Chapter 5
Chapter 5: Treatment of Inflation
Tables Page5-1 DoD and Selected Economy-Wide Indices (FY 1970 to FY 2024)........................................................................................................................ 525-2 Pay and Inflation Rate Assumptions – Outlays (FY 2018 to FY 2024).................................................................................................................. 545-3 Pay and Inflation Rate Assumptions – Budget Authority (FY 2018 to FY 2024).................................................................................................. 555-4 DoD Deflators – TOA by Public Law Title (FY 1970 to FY 2024)....................................................................................................................... 565-5 DoD Deflators – TOA by Category (FY 1970 to FY 2024)................................................................................................................................... 585-6 DoD Deflators – Budget Authority by Public Law Title (FY 1970 to FY 2024).................................................................................................... 605-7 DoD Deflators – Budget Authority by Category (FY 1970 to FY 2024)................................................................................................................ 625-8 DoD Deflators – Outlays by Public Law Title (FY 1970 to FY 2024)................................................................................................................... 645-9 DoD Deflators – Outlays by Category (FY 1970 to FY 2024)............................................................................................................................... 665-10 Chronology of Selected Inflation Profiles (FY 1999 to FY 2024).......................................................................................................................... 685-11 Outlay Rates for Incremental Changes in Budget Authority Purchases.................................................................................................................. 705-12 Military and Civilian Pay Increases Since 1945 (1945 to 2024)............................................................................................................................. 735-13 Civilian Pay Deflators by Category (FY 1970 to FY 2024).................................................................................................................................... 755-14 DoD Deflators – Budget Authority; Base, Discretionary (FY 2010 to FY 2024)................................................................................................... 77
Inflation is change in the general level of prices in the economy.Prices do not always rise or change evenly. Some prices may beconstant, and others may be falling. Prices of some commoditiesrise faster than others due to differences in the magnitude anddirection of changes in supply and demand in various markets.Chapter 5 provides the standard economic factors for calculatingthe effects of changes in prices. The constant dollars in this bookcome from applying the inflation indices in this chapter to DoDcurrent dollars. First, the Department's outlay deflators for non-pay, non-fuel purchases (as seen in Tables 5-8 and 5-9) areprovided by the OMB. They are based on the Gross DomesticProduct inflation index, and medical prices in the Consumer Price
Index for All Urban Consumers (CPI-U, Medical). Table 5-11contains outlay rates used in developing outyear inflation factors,for estimating future costs of non-pay, non-fuel Defense purchases.(These rates do not account for any lapses in accounts.) Deflatorsfor non-pay, non-fuel budget authority and TOA (Tables 5-4through 5-7) are created by applying these purchases outlay rates(Table 5-11) to the outlay deflators published in Tables 5-8 and5-9; weighted by the respective Defense BA and TOA dollars. Forfuel, historical inflation rates are based on the change in the costper barrel paid by the customer to the stock fund. To see thatinflation profiles are often revised many times before becomingactual, Table 5-10 displays the chronology of selected profiles.
51
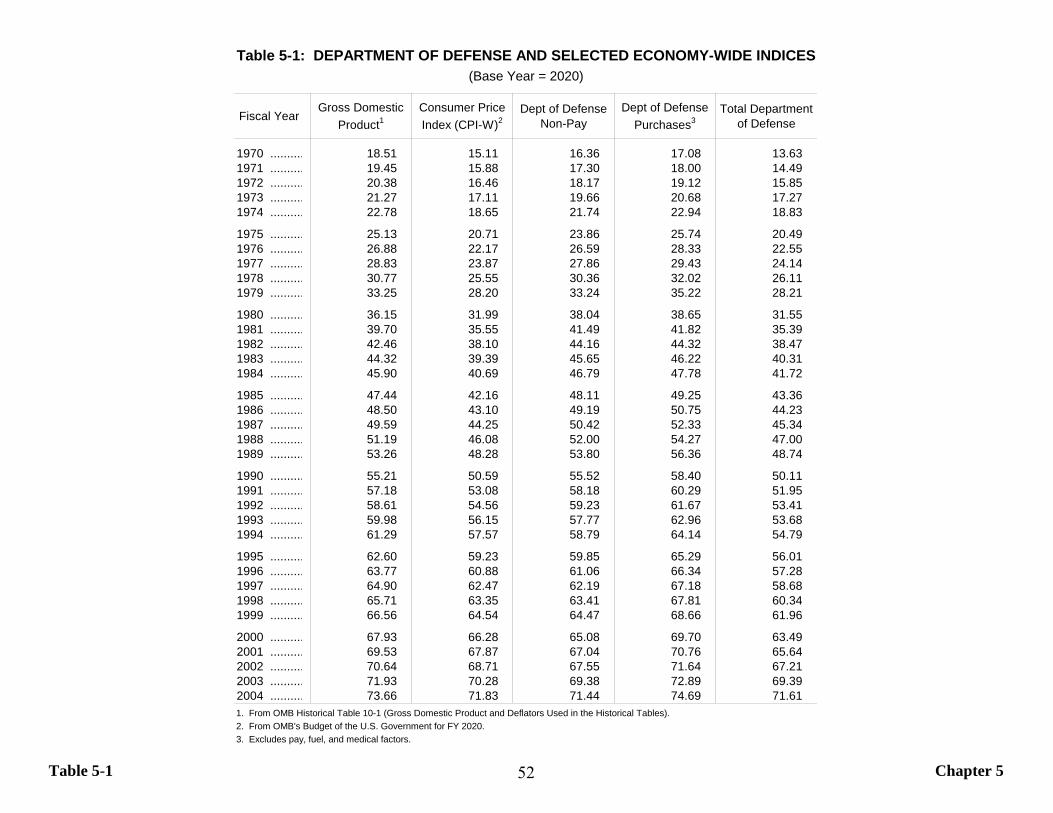
Table 5-1 Chapter 5
Fiscal YearGross Domestic
Product1Consumer Price Index (CPI-W)2
Dept of Defense Non-Pay
Dept of Defense Purchases3
Total Department of Defense
1970 .......... 18.51 15.11 16.36 17.08 13.631971 .......... 19.45 15.88 17.30 18.00 14.491972 .......... 20.38 16.46 18.17 19.12 15.851973 .......... 21.27 17.11 19.66 20.68 17.271974 .......... 22.78 18.65 21.74 22.94 18.83
1975 .......... 25.13 20.71 23.86 25.74 20.491976 .......... 26.88 22.17 26.59 28.33 22.551977 .......... 28.83 23.87 27.86 29.43 24.141978 .......... 30.77 25.55 30.36 32.02 26.111979 .......... 33.25 28.20 33.24 35.22 28.21
1980 .......... 36.15 31.99 38.04 38.65 31.551981 .......... 39.70 35.55 41.49 41.82 35.391982 .......... 42.46 38.10 44.16 44.32 38.471983 .......... 44.32 39.39 45.65 46.22 40.311984 .......... 45.90 40.69 46.79 47.78 41.72
1985 .......... 47.44 42.16 48.11 49.25 43.361986 .......... 48.50 43.10 49.19 50.75 44.231987 .......... 49.59 44.25 50.42 52.33 45.341988 .......... 51.19 46.08 52.00 54.27 47.001989 .......... 53.26 48.28 53.80 56.36 48.74
1990 .......... 55.21 50.59 55.52 58.40 50.111991 .......... 57.18 53.08 58.18 60.29 51.951992 .......... 58.61 54.56 59.23 61.67 53.411993 .......... 59.98 56.15 57.77 62.96 53.681994 .......... 61.29 57.57 58.79 64.14 54.79
1995 .......... 62.60 59.23 59.85 65.29 56.011996 .......... 63.77 60.88 61.06 66.34 57.281997 .......... 64.90 62.47 62.19 67.18 58.681998 .......... 65.71 63.35 63.41 67.81 60.341999 .......... 66.56 64.54 64.47 68.66 61.96
2000 .......... 67.93 66.28 65.08 69.70 63.492001 .......... 69.53 67.87 67.04 70.76 65.642002 .......... 70.64 68.71 67.55 71.64 67.212003 .......... 71.93 70.28 69.38 72.89 69.392004 .......... 73.66 71.83 71.44 74.69 71.611. From OMB Historical Table 10-1 (Gross Domestic Product and Deflators Used in the Historical Tables).2. From OMB's Budget of the U.S. Government for FY 2020.3. Excludes pay, fuel, and medical factors.
Table 5-1: DEPARTMENT OF DEFENSE AND SELECTED ECONOMY-WIDE INDICES(Base Year = 2020)
52
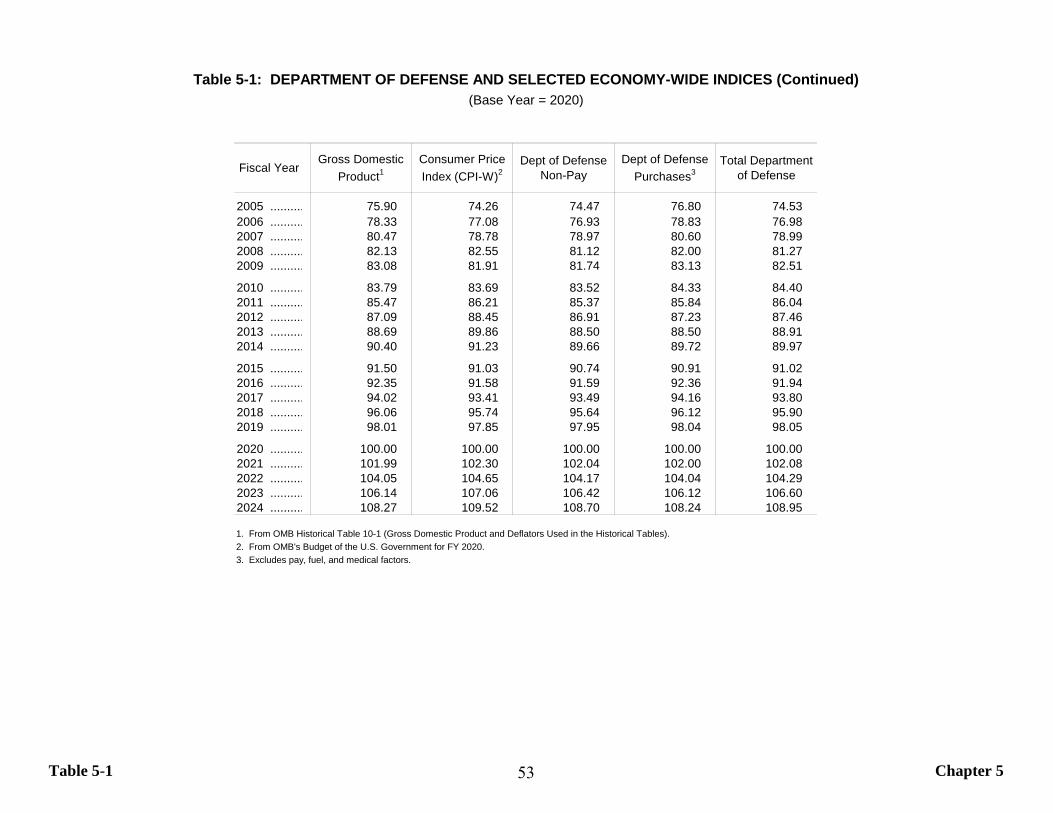
Table 5-1 Chapter 5
Fiscal YearGross Domestic
Product1Consumer Price Index (CPI-W)2
Dept of Defense Non-Pay
Dept of Defense Purchases3
Total Department of Defense
2005 .......... 75.90 74.26 74.47 76.80 74.532006 .......... 78.33 77.08 76.93 78.83 76.982007 .......... 80.47 78.78 78.97 80.60 78.992008 .......... 82.13 82.55 81.12 82.00 81.272009 .......... 83.08 81.91 81.74 83.13 82.51
2010 .......... 83.79 83.69 83.52 84.33 84.402011 .......... 85.47 86.21 85.37 85.84 86.042012 .......... 87.09 88.45 86.91 87.23 87.462013 .......... 88.69 89.86 88.50 88.50 88.912014 .......... 90.40 91.23 89.66 89.72 89.97
2015 .......... 91.50 91.03 90.74 90.91 91.022016 .......... 92.35 91.58 91.59 92.36 91.942017 .......... 94.02 93.41 93.49 94.16 93.802018 .......... 96.06 95.74 95.64 96.12 95.902019 .......... 98.01 97.85 97.95 98.04 98.05
2020 .......... 100.00 100.00 100.00 100.00 100.002021 .......... 101.99 102.30 102.04 102.00 102.082022 .......... 104.05 104.65 104.17 104.04 104.292023 .......... 106.14 107.06 106.42 106.12 106.602024 .......... 108.27 109.52 108.70 108.24 108.95
1. From OMB Historical Table 10-1 (Gross Domestic Product and Deflators Used in the Historical Tables).2. From OMB's Budget of the U.S. Government for FY 2020.3. Excludes pay, fuel, and medical factors.
(Base Year = 2020)Table 5-1: DEPARTMENT OF DEFENSE AND SELECTED ECONOMY-WIDE INDICES (Continued)
53
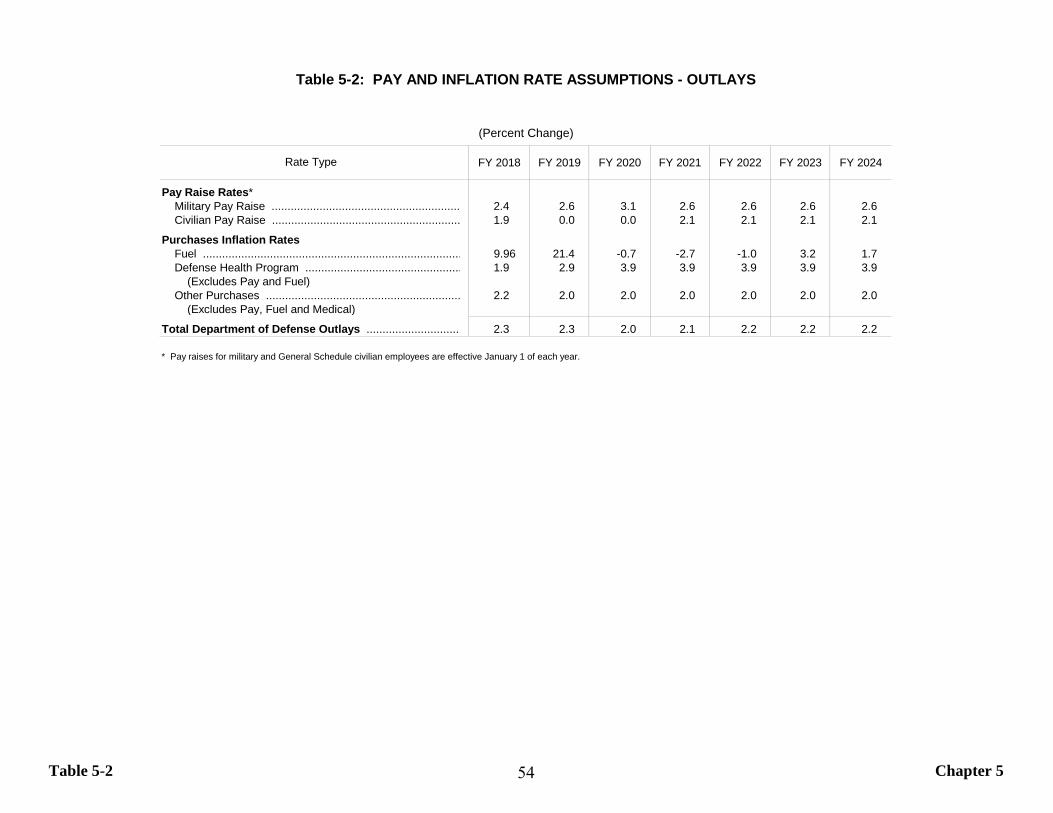
Table 5-2 Chapter 5
FY 2018 FY 2019 FY 2020 FY 2021 FY 2022 FY 2023 FY 2024
Pay Raise Rates* Military Pay Raise ........................................................... 2.4 2.6 3.1 2.6 2.6 2.6 2.6Civilian Pay Raise ........................................................... 1.9 0.0 0.0 2.1 2.1 2.1 2.1
Purchases Inflation Rates Fuel ................................................................................. 9.96 21.4 -0.7 -2.7 -1.0 3.2 1.7Defense Health Program ................................................. 1.9 2.9 3.9 3.9 3.9 3.9 3.9
(Excludes Pay and Fuel) Other Purchases ............................................................. 2.2 2.0 2.0 2.0 2.0 2.0 2.0
(Excludes Pay, Fuel and Medical)
Total Department of Defense Outlays .............................. 2.3 2.3 2.0 2.1 2.2 2.2 2.2
* Pay raises for military and General Schedule civilian employees are effective January 1 of each year.
Table 5-2: PAY AND INFLATION RATE ASSUMPTIONS - OUTLAYS
Rate Type
(Percent Change)
54
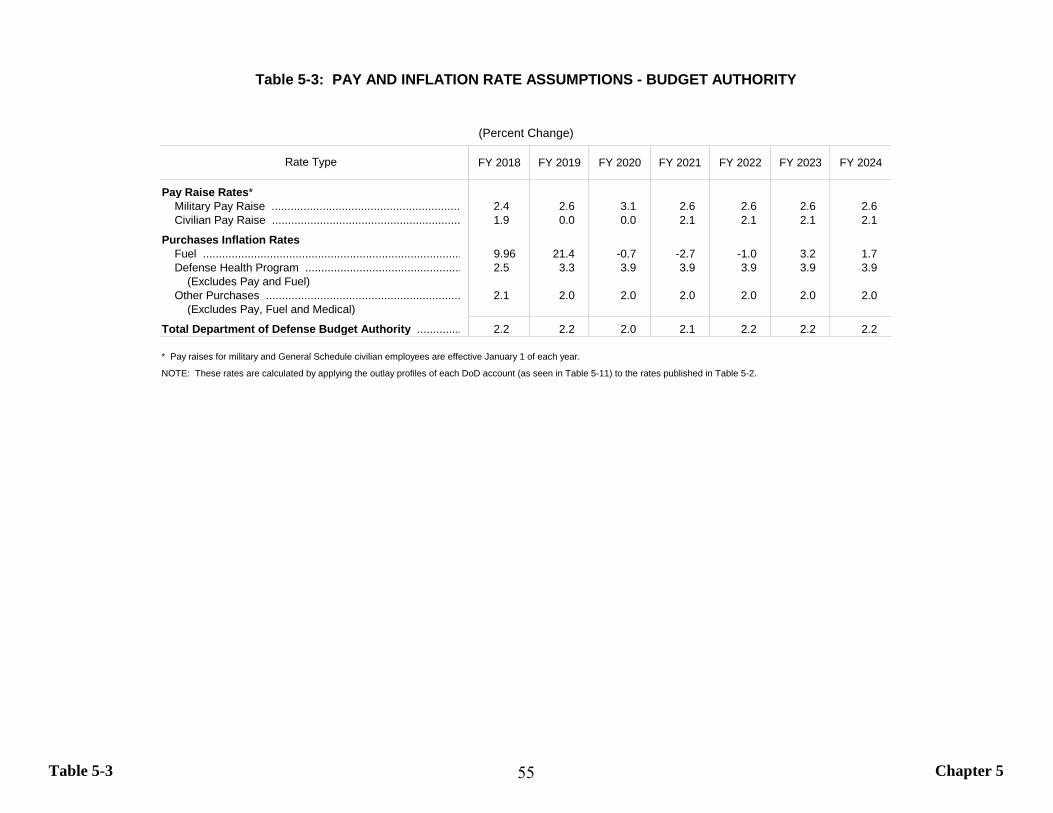
Table 5-3 Chapter 5
FY 2018 FY 2019 FY 2020 FY 2021 FY 2022 FY 2023 FY 2024
Pay Raise Rates* Military Pay Raise ........................................................... 2.4 2.6 3.1 2.6 2.6 2.6 2.6Civilian Pay Raise ........................................................... 1.9 0.0 0.0 2.1 2.1 2.1 2.1
Purchases Inflation Rates Fuel ................................................................................. 9.96 21.4 -0.7 -2.7 -1.0 3.2 1.7Defense Health Program ................................................. 2.5 3.3 3.9 3.9 3.9 3.9 3.9
(Excludes Pay and Fuel) Other Purchases ............................................................. 2.1 2.0 2.0 2.0 2.0 2.0 2.0
(Excludes Pay, Fuel and Medical)
Total Department of Defense Budget Authority .............. 2.2 2.2 2.0 2.1 2.2 2.2 2.2
* Pay raises for military and General Schedule civilian employees are effective January 1 of each year.
NOTE: These rates are calculated by applying the outlay profiles of each DoD account (as seen in Table 5-11) to the rates published in Table 5-2.
Table 5-3: PAY AND INFLATION RATE ASSUMPTIONS - BUDGET AUTHORITY
Rate Type
(Percent Change)
55
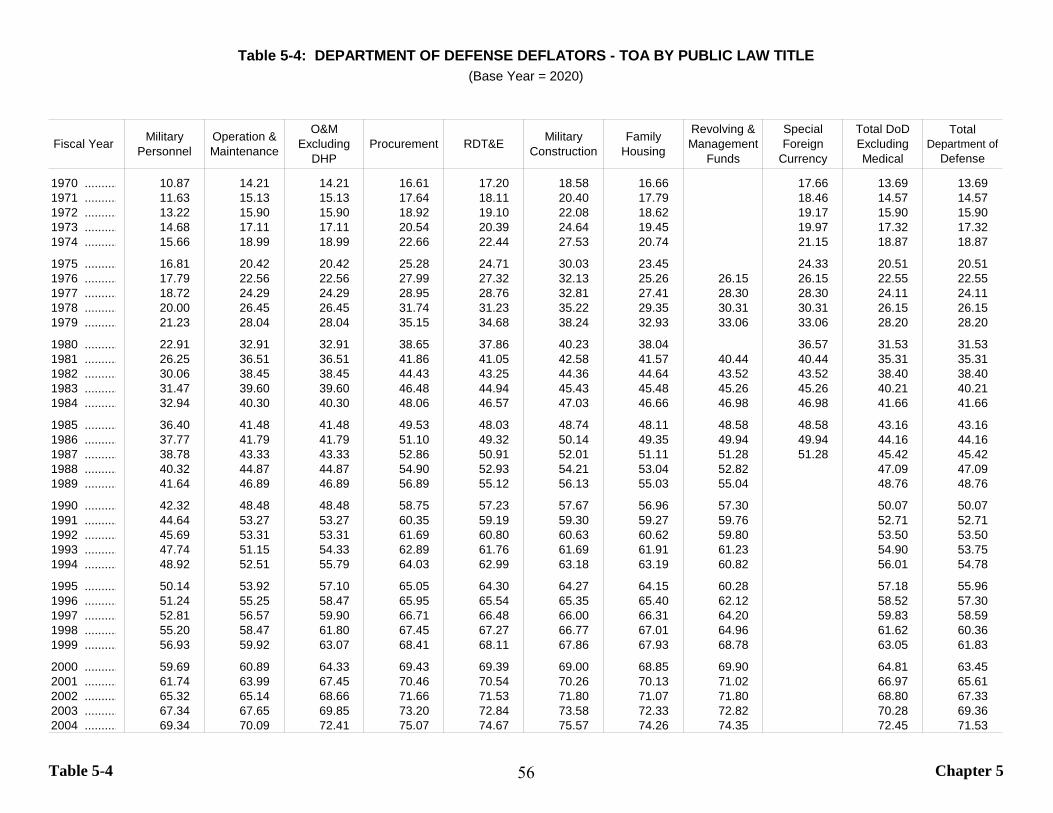
Table 5-4 Chapter 5
Fiscal Year Military Personnel
Operation & Maintenance
O&M Excluding
DHPProcurement RDT&E Military
ConstructionFamily
Housing
Revolving & Management
Funds
Special Foreign
Currency
Total DoD Excluding Medical
Total Department of
Defense
1970 .......... 10.87 14.21 14.21 16.61 17.20 18.58 16.66 17.66 13.69 13.691971 .......... 11.63 15.13 15.13 17.64 18.11 20.40 17.79 18.46 14.57 14.571972 .......... 13.22 15.90 15.90 18.92 19.10 22.08 18.62 19.17 15.90 15.901973 .......... 14.68 17.11 17.11 20.54 20.39 24.64 19.45 19.97 17.32 17.321974 .......... 15.66 18.99 18.99 22.66 22.44 27.53 20.74 21.15 18.87 18.87
1975 .......... 16.81 20.42 20.42 25.28 24.71 30.03 23.45 24.33 20.51 20.511976 .......... 17.79 22.56 22.56 27.99 27.32 32.13 25.26 26.15 26.15 22.55 22.551977 .......... 18.72 24.29 24.29 28.95 28.76 32.81 27.41 28.30 28.30 24.11 24.111978 .......... 20.00 26.45 26.45 31.74 31.23 35.22 29.35 30.31 30.31 26.15 26.151979 .......... 21.23 28.04 28.04 35.15 34.68 38.24 32.93 33.06 33.06 28.20 28.20
1980 .......... 22.91 32.91 32.91 38.65 37.86 40.23 38.04 36.57 31.53 31.531981 .......... 26.25 36.51 36.51 41.86 41.05 42.58 41.57 40.44 40.44 35.31 35.311982 .......... 30.06 38.45 38.45 44.43 43.25 44.36 44.64 43.52 43.52 38.40 38.401983 .......... 31.47 39.60 39.60 46.48 44.94 45.43 45.48 45.26 45.26 40.21 40.211984 .......... 32.94 40.30 40.30 48.06 46.57 47.03 46.66 46.98 46.98 41.66 41.66
1985 .......... 36.40 41.48 41.48 49.53 48.03 48.74 48.11 48.58 48.58 43.16 43.161986 .......... 37.77 41.79 41.79 51.10 49.32 50.14 49.35 49.94 49.94 44.16 44.161987 .......... 38.78 43.33 43.33 52.86 50.91 52.01 51.11 51.28 51.28 45.42 45.421988 .......... 40.32 44.87 44.87 54.90 52.93 54.21 53.04 52.82 47.09 47.091989 .......... 41.64 46.89 46.89 56.89 55.12 56.13 55.03 55.04 48.76 48.76
1990 .......... 42.32 48.48 48.48 58.75 57.23 57.67 56.96 57.30 50.07 50.071991 .......... 44.64 53.27 53.27 60.35 59.19 59.30 59.27 59.76 52.71 52.711992 .......... 45.69 53.31 53.31 61.69 60.80 60.63 60.62 59.80 53.50 53.501993 .......... 47.74 51.15 54.33 62.89 61.76 61.69 61.91 61.23 54.90 53.751994 .......... 48.92 52.51 55.79 64.03 62.99 63.18 63.19 60.82 56.01 54.78
1995 .......... 50.14 53.92 57.10 65.05 64.30 64.27 64.15 60.28 57.18 55.961996 .......... 51.24 55.25 58.47 65.95 65.54 65.35 65.40 62.12 58.52 57.301997 .......... 52.81 56.57 59.90 66.71 66.48 66.00 66.31 64.20 59.83 58.591998 .......... 55.20 58.47 61.80 67.45 67.27 66.77 67.01 64.96 61.62 60.361999 .......... 56.93 59.92 63.07 68.41 68.11 67.86 67.93 68.78 63.05 61.83
2000 .......... 59.69 60.89 64.33 69.43 69.39 69.00 68.85 69.90 64.81 63.452001 .......... 61.74 63.99 67.45 70.46 70.54 70.26 70.13 71.02 66.97 65.612002 .......... 65.32 65.14 68.66 71.66 71.53 71.80 71.07 71.80 68.80 67.332003 .......... 67.34 67.65 69.85 73.20 72.84 73.58 72.33 72.82 70.28 69.362004 .......... 69.34 70.09 72.41 75.07 74.67 75.57 74.26 74.35 72.45 71.53
Table 5-4: DEPARTMENT OF DEFENSE DEFLATORS - TOA BY PUBLIC LAW TITLE(Base Year = 2020)
56
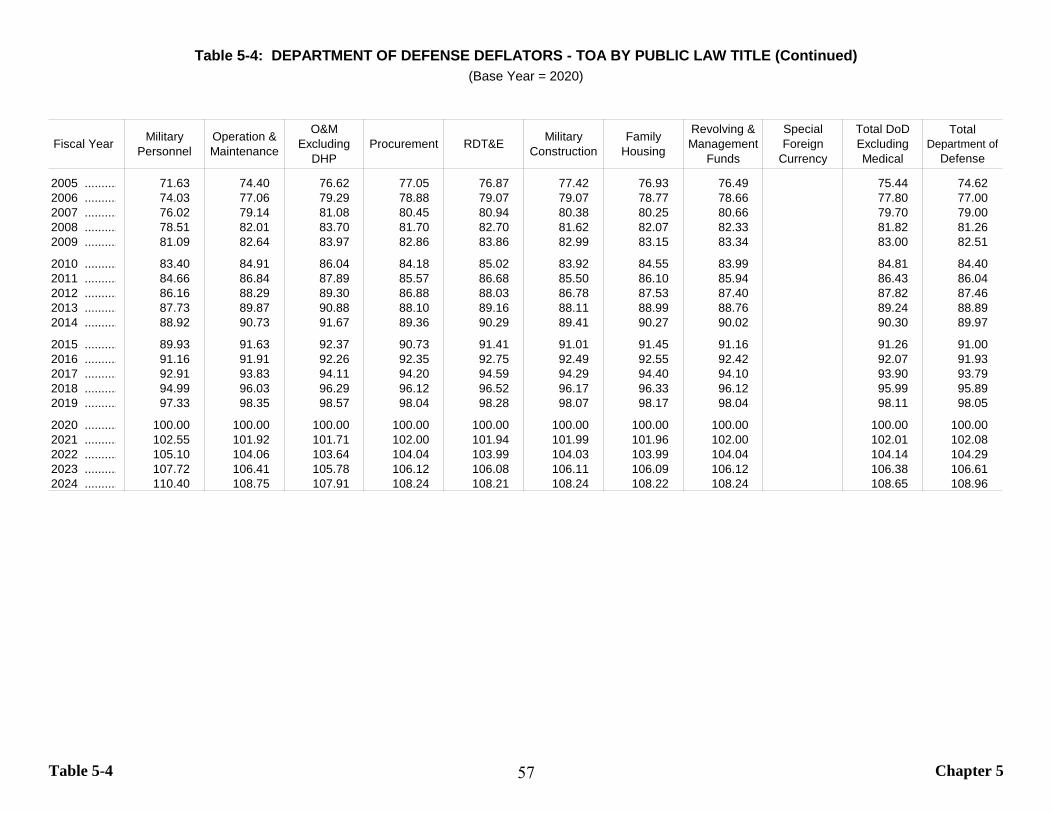
Table 5-4 Chapter 5
Fiscal Year Military Personnel
Operation & Maintenance
O&M Excluding
DHPProcurement RDT&E Military
ConstructionFamily
Housing
Revolving & Management
Funds
Special Foreign
Currency
Total DoD Excluding Medical
Total Department of
Defense
2005 .......... 71.63 74.40 76.62 77.05 76.87 77.42 76.93 76.49 75.44 74.622006 .......... 74.03 77.06 79.29 78.88 79.07 79.07 78.77 78.66 77.80 77.002007 .......... 76.02 79.14 81.08 80.45 80.94 80.38 80.25 80.66 79.70 79.002008 .......... 78.51 82.01 83.70 81.70 82.70 81.62 82.07 82.33 81.82 81.262009 .......... 81.09 82.64 83.97 82.86 83.86 82.99 83.15 83.34 83.00 82.51
2010 .......... 83.40 84.91 86.04 84.18 85.02 83.92 84.55 83.99 84.81 84.402011 .......... 84.66 86.84 87.89 85.57 86.68 85.50 86.10 85.94 86.43 86.042012 .......... 86.16 88.29 89.30 86.88 88.03 86.78 87.53 87.40 87.82 87.462013 .......... 87.73 89.87 90.88 88.10 89.16 88.11 88.99 88.76 89.24 88.892014 .......... 88.92 90.73 91.67 89.36 90.29 89.41 90.27 90.02 90.30 89.97
2015 .......... 89.93 91.63 92.37 90.73 91.41 91.01 91.45 91.16 91.26 91.002016 .......... 91.16 91.91 92.26 92.35 92.75 92.49 92.55 92.42 92.07 91.932017 .......... 92.91 93.83 94.11 94.20 94.59 94.29 94.40 94.10 93.90 93.792018 .......... 94.99 96.03 96.29 96.12 96.52 96.17 96.33 96.12 95.99 95.892019 .......... 97.33 98.35 98.57 98.04 98.28 98.07 98.17 98.04 98.11 98.05
2020 .......... 100.00 100.00 100.00 100.00 100.00 100.00 100.00 100.00 100.00 100.002021 .......... 102.55 101.92 101.71 102.00 101.94 101.99 101.96 102.00 102.01 102.082022 .......... 105.10 104.06 103.64 104.04 103.99 104.03 103.99 104.04 104.14 104.292023 .......... 107.72 106.41 105.78 106.12 106.08 106.11 106.09 106.12 106.38 106.612024 .......... 110.40 108.75 107.91 108.24 108.21 108.24 108.22 108.24 108.65 108.96
Table 5-4: DEPARTMENT OF DEFENSE DEFLATORS - TOA BY PUBLIC LAW TITLE (Continued)(Base Year = 2020)
57
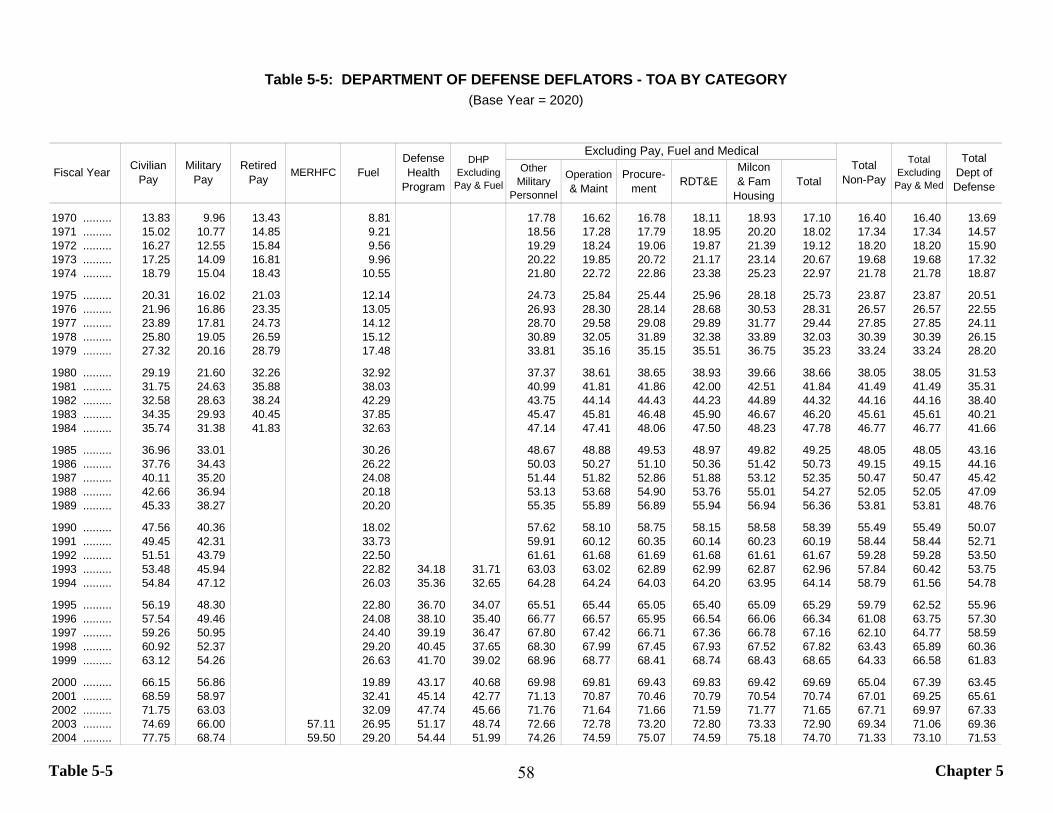
Table 5-5 Chapter 5
Other Military
Personnel
Operation & Maint
Procure-ment RDT&E
Milcon& Fam
HousingTotal
1970 ......... 13.83 9.96 13.43 8.81 17.78 16.62 16.78 18.11 18.93 17.10 16.40 16.40 13.69 1971 ......... 15.02 10.77 14.85 9.21 18.56 17.28 17.79 18.95 20.20 18.02 17.34 17.34 14.57 1972 ......... 16.27 12.55 15.84 9.56 19.29 18.24 19.06 19.87 21.39 19.12 18.20 18.20 15.90 1973 ......... 17.25 14.09 16.81 9.96 20.22 19.85 20.72 21.17 23.14 20.67 19.68 19.68 17.32 1974 ......... 18.79 15.04 18.43 10.55 21.80 22.72 22.86 23.38 25.23 22.97 21.78 21.78 18.87
1975 ......... 20.31 16.02 21.03 12.14 24.73 25.84 25.44 25.96 28.18 25.73 23.87 23.87 20.51 1976 ......... 21.96 16.86 23.35 13.05 26.93 28.30 28.14 28.68 30.53 28.31 26.57 26.57 22.55 1977 ......... 23.89 17.81 24.73 14.12 28.70 29.58 29.08 29.89 31.77 29.44 27.85 27.85 24.11 1978 ......... 25.80 19.05 26.59 15.12 30.89 32.05 31.89 32.38 33.89 32.03 30.39 30.39 26.15 1979 ......... 27.32 20.16 28.79 17.48 33.81 35.16 35.15 35.51 36.75 35.23 33.24 33.24 28.20
1980 ......... 29.19 21.60 32.26 32.92 37.37 38.61 38.65 38.93 39.66 38.66 38.05 38.05 31.53 1981 ......... 31.75 24.63 35.88 38.03 40.99 41.81 41.86 42.00 42.51 41.84 41.49 41.49 35.31 1982 ......... 32.58 28.63 38.24 42.29 43.75 44.14 44.43 44.23 44.89 44.32 44.16 44.16 38.40 1983 ......... 34.35 29.93 40.45 37.85 45.47 45.81 46.48 45.90 46.67 46.20 45.61 45.61 40.21 1984 ......... 35.74 31.38 41.83 32.63 47.14 47.41 48.06 47.50 48.23 47.78 46.77 46.77 41.66
1985 ......... 36.96 33.01 30.26 48.67 48.88 49.53 48.97 49.82 49.25 48.05 48.05 43.16 1986 ......... 37.76 34.43 26.22 50.03 50.27 51.10 50.36 51.42 50.73 49.15 49.15 44.16 1987 ......... 40.11 35.20 24.08 51.44 51.82 52.86 51.88 53.12 52.35 50.47 50.47 45.42 1988 ......... 42.66 36.94 20.18 53.13 53.68 54.90 53.76 55.01 54.27 52.05 52.05 47.09 1989 ......... 45.33 38.27 20.20 55.35 55.89 56.89 55.94 56.94 56.36 53.81 53.81 48.76
1990 ......... 47.56 40.36 18.02 57.62 58.10 58.75 58.15 58.58 58.39 55.49 55.49 50.07 1991 ......... 49.45 42.31 33.73 59.91 60.12 60.35 60.14 60.23 60.19 58.44 58.44 52.71 1992 ......... 51.51 43.79 22.50 61.61 61.68 61.69 61.68 61.61 61.67 59.28 59.28 53.50 1993 ......... 53.48 45.94 22.82 34.18 31.71 63.03 63.02 62.89 62.99 62.87 62.96 57.84 60.42 53.75 1994 ......... 54.84 47.12 26.03 35.36 32.65 64.28 64.24 64.03 64.20 63.95 64.14 58.79 61.56 54.78
1995 ......... 56.19 48.30 22.80 36.70 34.07 65.51 65.44 65.05 65.40 65.09 65.29 59.79 62.52 55.96 1996 ......... 57.54 49.46 24.08 38.10 35.40 66.77 66.57 65.95 66.54 66.06 66.34 61.08 63.75 57.30 1997 ......... 59.26 50.95 24.40 39.19 36.47 67.80 67.42 66.71 67.36 66.78 67.16 62.10 64.77 58.59 1998 ......... 60.92 52.37 29.20 40.45 37.65 68.30 67.99 67.45 67.93 67.52 67.82 63.43 65.89 60.36 1999 ......... 63.12 54.26 26.63 41.70 39.02 68.96 68.77 68.41 68.74 68.43 68.65 64.33 66.58 61.83
2000 ......... 66.15 56.86 19.89 43.17 40.68 69.98 69.81 69.43 69.83 69.42 69.69 65.04 67.39 63.45 2001 ......... 68.59 58.97 32.41 45.14 42.77 71.13 70.87 70.46 70.79 70.54 70.74 67.01 69.25 65.61 2002 ......... 71.75 63.03 32.09 47.74 45.66 71.76 71.64 71.66 71.59 71.77 71.65 67.71 69.97 67.33 2003 ......... 74.69 66.00 57.11 26.95 51.17 48.74 72.66 72.78 73.20 72.80 73.33 72.90 69.34 71.06 69.36 2004 ......... 77.75 68.74 59.50 29.20 54.44 51.99 74.26 74.59 75.07 74.59 75.18 74.70 71.33 73.10 71.53
Table 5-5: DEPARTMENT OF DEFENSE DEFLATORS - TOA BY CATEGORY(Base Year = 2020)
Excluding Pay, Fuel and Medical
Fiscal Year Civilian Pay
Military Pay
DHP Excluding
Pay & Fuel
Defense Health
ProgramFuelMERHFCRetired
PayTotal
Non-Pay
Total Excluding
Pay & Med
Total Dept of Defense
58

Table 5-5 Chapter 5
Other Military
Personnel
Operation & Maint
Procure-ment RDT&E
Milcon& Fam
HousingTotal
2005 ......... 80.48 71.14 62.00 55.83 58.00 55.43 76.38 76.74 77.05 76.72 77.05 76.80 74.60 76.25 74.62 2006 ......... 82.97 73.35 64.55 68.66 61.54 59.10 78.67 78.85 78.88 78.83 78.75 78.83 76.96 78.54 77.00 2007 ......... 84.80 75.33 67.19 69.63 65.16 62.98 80.71 80.70 80.45 80.70 80.20 80.60 78.99 80.34 79.00 2008 ......... 87.76 77.96 70.08 94.07 69.25 66.93 82.45 82.17 81.70 82.17 81.45 81.99 81.12 82.19 81.26 2009 ......... 91.19 81.00 72.18 64.72 72.88 70.76 83.58 83.25 82.86 83.21 82.74 83.13 81.76 82.67 82.51
2010 ......... 93.01 83.76 74.71 81.09 76.32 74.36 84.49 84.42 84.18 84.40 83.91 84.33 83.52 84.26 84.40 2011 ......... 93.01 84.93 76.95 100.71 78.80 76.67 86.12 85.97 85.57 85.95 85.25 85.84 85.38 86.14 86.04 2012 ......... 93.01 86.29 79.72 103.84 81.02 79.14 87.61 87.36 86.88 87.35 86.46 87.22 86.91 87.64 87.46 2013 ......... 93.01 87.76 81.95 112.56 83.17 81.27 88.92 88.63 88.10 88.63 87.86 88.49 88.48 89.17 88.89 2014 ......... 93.66 88.81 83.84 109.29 84.71 83.31 90.17 89.80 89.36 89.81 89.16 89.71 89.65 90.27 89.97
2015 ......... 94.60 89.70 86.02 102.85 86.96 85.70 91.20 90.94 90.73 90.94 90.66 90.90 90.73 91.22 91.00 2016 ......... 95.73 90.77 89.03 71.17 89.69 88.45 92.42 92.35 92.35 92.35 92.36 92.36 91.59 91.85 91.93 2017 ......... 97.55 92.50 91.79 75.44 92.00 90.95 94.09 94.15 94.20 94.15 94.21 94.16 93.48 93.69 93.79 2018 ......... 99.50 94.63 93.53 82.95 94.19 93.18 96.12 96.11 96.12 96.12 96.12 96.12 95.63 95.82 95.89 2019 ......... 100.00 97.09 96.25 100.70 96.83 96.25 98.04 98.04 98.04 98.04 98.04 98.04 97.95 98.08 98.05
2020 ......... 100.00 100.00 100.00 100.00 100.00 100.00 100.00 100.00 100.00 100.00 100.00 100.00 100.00 100.00 100.00 2021 ......... 101.50 102.70 103.90 97.30 103.50 103.90 102.00 102.00 102.00 102.00 102.00 102.00 102.04 101.91 102.08 2022 ......... 103.63 105.37 107.95 96.33 107.22 107.95 104.04 104.04 104.04 104.04 104.04 104.04 104.17 103.88 104.29 2023 ......... 105.80 108.11 112.16 99.41 111.10 112.16 106.12 106.12 106.12 106.12 106.12 106.12 106.42 105.98 106.61 2024 ......... 108.02 110.92 116.54 101.10 115.09 116.54 108.24 108.24 108.24 108.24 108.24 108.24 108.69 108.10 108.96
Excluding Pay, Fuel and MedicalTotal
Non-Pay
Total Excluding
Pay & Med
Total Dept of Defense
Table 5-5: DEPARTMENT OF DEFENSE DEFLATORS - TOA BY CATEGORY (Continued)(Base Year = 2020)
Fiscal Year Civilian Pay
Military Pay
Retired Pay MERHFC Fuel
Defense Health
Program
DHP Excluding
Pay & Fuel
59
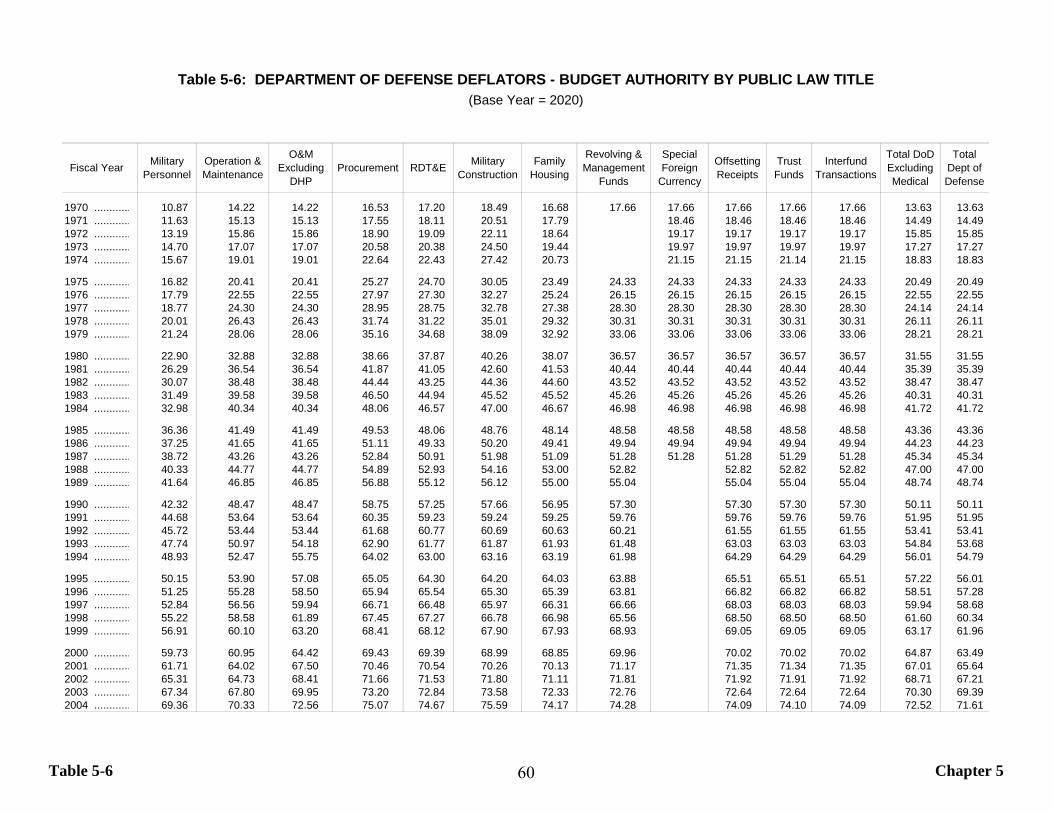
Table 5-6 Chapter 5
Fiscal Year Military Personnel
Operation & Maintenance
O&M Excluding
DHPProcurement RDT&E Military
ConstructionFamily
Housing
Revolving & Management
Funds
Special Foreign
Currency
Offsetting Receipts
Trust Funds
Interfund Transactions
Total DoD Excluding Medical
Total Dept of Defense
1970 ............ 10.87 14.22 14.22 16.53 17.20 18.49 16.68 17.66 17.66 17.66 17.66 17.66 13.63 13.63 1971 ............ 11.63 15.13 15.13 17.55 18.11 20.51 17.79 18.46 18.46 18.46 18.46 14.49 14.49 1972 ............ 13.19 15.86 15.86 18.90 19.09 22.11 18.64 19.17 19.17 19.17 19.17 15.85 15.85 1973 ............ 14.70 17.07 17.07 20.58 20.38 24.50 19.44 19.97 19.97 19.97 19.97 17.27 17.27 1974 ............ 15.67 19.01 19.01 22.64 22.43 27.42 20.73 21.15 21.15 21.14 21.15 18.83 18.83
1975 ............ 16.82 20.41 20.41 25.27 24.70 30.05 23.49 24.33 24.33 24.33 24.33 24.33 20.49 20.49 1976 ............ 17.79 22.55 22.55 27.97 27.30 32.27 25.24 26.15 26.15 26.15 26.15 26.15 22.55 22.55 1977 ............ 18.77 24.30 24.30 28.95 28.75 32.78 27.38 28.30 28.30 28.30 28.30 28.30 24.14 24.14 1978 ............ 20.01 26.43 26.43 31.74 31.22 35.01 29.32 30.31 30.31 30.31 30.31 30.31 26.11 26.11 1979 ............ 21.24 28.06 28.06 35.16 34.68 38.09 32.92 33.06 33.06 33.06 33.06 33.06 28.21 28.21
1980 ............ 22.90 32.88 32.88 38.66 37.87 40.26 38.07 36.57 36.57 36.57 36.57 36.57 31.55 31.55 1981 ............ 26.29 36.54 36.54 41.87 41.05 42.60 41.53 40.44 40.44 40.44 40.44 40.44 35.39 35.39 1982 ............ 30.07 38.48 38.48 44.44 43.25 44.36 44.60 43.52 43.52 43.52 43.52 43.52 38.47 38.47 1983 ............ 31.49 39.58 39.58 46.50 44.94 45.52 45.52 45.26 45.26 45.26 45.26 45.26 40.31 40.31 1984 ............ 32.98 40.34 40.34 48.06 46.57 47.00 46.67 46.98 46.98 46.98 46.98 46.98 41.72 41.72
1985 ............ 36.36 41.49 41.49 49.53 48.06 48.76 48.14 48.58 48.58 48.58 48.58 48.58 43.36 43.36 1986 ............ 37.25 41.65 41.65 51.11 49.33 50.20 49.41 49.94 49.94 49.94 49.94 49.94 44.23 44.23 1987 ............ 38.72 43.26 43.26 52.84 50.91 51.98 51.09 51.28 51.28 51.28 51.29 51.28 45.34 45.34 1988 ............ 40.33 44.77 44.77 54.89 52.93 54.16 53.00 52.82 52.82 52.82 52.82 47.00 47.00 1989 ............ 41.64 46.85 46.85 56.88 55.12 56.12 55.00 55.04 55.04 55.04 55.04 48.74 48.74
1990 ............ 42.32 48.47 48.47 58.75 57.25 57.66 56.95 57.30 57.30 57.30 57.30 50.11 50.11 1991 ............ 44.68 53.64 53.64 60.35 59.23 59.24 59.25 59.76 59.76 59.76 59.76 51.95 51.95 1992 ............ 45.72 53.44 53.44 61.68 60.77 60.69 60.63 60.21 61.55 61.55 61.55 53.41 53.41 1993 ............ 47.74 50.97 54.18 62.90 61.77 61.87 61.93 61.48 63.03 63.03 63.03 54.84 53.68 1994 ............ 48.93 52.47 55.75 64.02 63.00 63.16 63.19 61.98 64.29 64.29 64.29 56.01 54.79
1995 ............ 50.15 53.90 57.08 65.05 64.30 64.20 64.03 63.88 65.51 65.51 65.51 57.22 56.01 1996 ............ 51.25 55.28 58.50 65.94 65.54 65.30 65.39 63.81 66.82 66.82 66.82 58.51 57.28 1997 ............ 52.84 56.56 59.94 66.71 66.48 65.97 66.31 66.66 68.03 68.03 68.03 59.94 58.68 1998 ............ 55.22 58.58 61.89 67.45 67.27 66.78 66.98 65.56 68.50 68.50 68.50 61.60 60.34 1999 ............ 56.91 60.10 63.20 68.41 68.12 67.90 67.93 68.93 69.05 69.05 69.05 63.17 61.96
2000 ............ 59.73 60.95 64.42 69.43 69.39 68.99 68.85 69.96 70.02 70.02 70.02 64.87 63.49 2001 ............ 61.71 64.02 67.50 70.46 70.54 70.26 70.13 71.17 71.35 71.34 71.35 67.01 65.64 2002 ............ 65.31 64.73 68.41 71.66 71.53 71.80 71.11 71.81 71.92 71.91 71.92 68.71 67.21 2003 ............ 67.34 67.80 69.95 73.20 72.84 73.58 72.33 72.76 72.64 72.64 72.64 70.30 69.39 2004 ............ 69.36 70.33 72.56 75.07 74.67 75.59 74.17 74.28 74.09 74.10 74.09 72.52 71.61
Table 5-6: DEPARTMENT OF DEFENSE DEFLATORS - BUDGET AUTHORITY BY PUBLIC LAW TITLE(Base Year = 2020)
60

Table 5-6 Chapter 5
Fiscal Year Military Personnel
Operation & Maintenance
O&M Excluding
DHPProcurement RDT&E Military
ConstructionFamily
Housing
Revolving & Management
Funds
Special Foreign
Currency
Offsetting Receipts
Trust Funds
Interfund Transactions
Total DoD Excluding Medical
Total Dept of Defense
2005 ............ 71.62 74.17 76.61 77.05 76.87 77.43 76.93 76.39 76.17 76.19 76.17 75.38 74.53 2006 ............ 74.09 77.04 79.29 78.88 79.07 79.07 78.77 78.66 78.53 78.53 78.53 77.80 76.98 2007 ............ 76.07 79.13 81.08 80.45 80.94 80.39 80.24 80.59 80.65 80.65 80.65 79.70 78.99 2008 ............ 78.57 82.01 83.71 81.70 82.70 81.62 82.11 82.42 82.58 82.58 82.58 81.83 81.27 2009 ............ 81.16 82.65 83.97 82.87 83.86 82.99 83.25 84.84 83.82 83.69 83.82 83.00 82.51
2010 ............ 83.43 84.91 86.03 84.18 85.02 83.93 84.60 84.07 84.49 84.49 84.49 84.81 84.40 2011 ............ 84.70 86.82 87.88 85.58 86.67 85.52 86.32 85.86 86.18 86.17 86.18 86.43 86.04 2012 ............ 86.22 88.28 89.32 86.88 88.04 86.80 87.73 87.71 87.73 87.70 87.73 87.83 87.46 2013 ............ 87.79 89.87 90.86 88.11 89.16 88.08 89.27 88.86 89.05 89.00 89.05 89.25 88.91 2014 ............ 88.99 90.72 91.65 89.36 90.29 89.40 90.35 90.22 90.38 90.33 90.39 90.30 89.97
2015 ............ 90.00 91.64 92.38 90.73 91.42 91.04 91.52 91.24 91.38 91.28 91.38 91.27 91.02 2016 ............ 91.22 91.91 92.25 92.35 92.76 92.50 92.58 92.43 92.48 92.44 92.48 92.07 91.94 2017 ............ 92.97 93.82 94.11 94.20 94.59 94.30 94.41 94.08 94.05 94.08 94.05 93.90 93.80 2018 ............ 95.04 96.02 96.29 96.12 96.52 96.17 96.34 96.12 96.12 96.12 96.12 95.99 95.90 2019 ............ 97.37 98.36 98.57 98.04 98.28 98.07 98.17 98.04 98.04 98.04 98.04 98.11 98.05
2020 ............ 100.00 100.00 100.00 100.00 100.00 100.00 100.00 100.00 100.00 100.00 100.00 100.00 100.00 2021 ............ 102.52 101.92 101.71 102.00 101.94 101.99 101.96 102.00 102.00 102.00 102.00 102.01 102.08 2022 ............ 105.04 104.06 103.64 104.04 103.99 104.03 103.99 104.04 104.04 104.04 104.04 104.14 104.29 2023 ............ 107.63 106.41 105.78 106.12 106.08 106.11 106.09 106.12 106.12 106.12 106.12 106.38 106.60 2024 ............ 110.28 108.75 107.92 108.24 108.21 108.24 108.22 108.24 108.24 108.24 108.24 108.64 108.95
Table 5-6: DEPARTMENT OF DEFENSE DEFLATORS - BUDGET AUTHORITY BY PUBLIC LAW TITLE (Continued)(Base Year = 2020)
61

Table 5-7 Chapter 5
Other Military
Personnel
Operation & Maint
Procure-ment RDT&E
Milcon& Fam
HousingTotal
1970 ......... 13.83 9.96 13.43 8.81 17.78 16.62 16.71 18.11 18.86 17.08 16.36 16.36 13.63 1971 ......... 15.02 10.77 14.85 9.21 18.56 17.27 17.72 18.95 20.29 18.00 17.30 17.30 14.49 1972 ......... 16.27 12.55 15.84 9.56 19.29 18.25 19.04 19.87 21.40 19.12 18.17 18.17 15.85 1973 ......... 17.25 14.09 16.81 9.96 20.23 19.86 20.76 21.17 22.93 20.68 19.66 19.66 17.27 1974 ......... 18.79 15.04 18.43 10.55 21.80 22.72 22.85 23.38 24.93 22.94 21.74 21.74 18.83
1975 ......... 20.31 16.02 21.03 12.14 24.72 25.85 25.43 25.95 28.17 25.74 23.86 23.86 20.49 1976 ......... 21.96 16.86 23.35 13.05 26.93 28.32 28.12 28.68 30.76 28.33 26.59 26.59 22.55 1977 ......... 23.89 17.81 24.73 14.12 28.70 29.57 29.08 29.89 31.80 29.43 27.86 27.86 24.14 1978 ......... 25.80 19.05 26.59 15.12 30.89 32.05 31.89 32.38 33.72 32.02 30.36 30.36 26.11 1979 ......... 27.32 20.16 28.79 17.48 33.81 35.16 35.16 35.51 36.63 35.22 33.24 33.24 28.21
1980 ......... 29.19 21.60 32.26 32.92 37.37 38.61 38.66 38.93 39.71 38.65 38.04 38.04 31.55 1981 ......... 31.75 24.63 35.88 38.03 40.99 41.80 41.87 42.00 42.51 41.82 41.49 41.49 35.39 1982 ......... 32.58 28.63 38.24 42.29 43.75 44.14 44.44 44.23 44.88 44.32 44.16 44.16 38.47 1983 ......... 34.35 29.93 40.45 37.85 45.47 45.81 46.50 45.90 46.68 46.22 45.65 45.65 40.31 1984 ......... 35.74 31.38 41.83 32.63 47.14 47.41 48.06 47.50 48.26 47.78 46.79 46.79 41.72
1985 ......... 36.96 33.01 30.26 48.68 48.87 49.53 48.97 49.82 49.25 48.11 48.11 43.36 1986 ......... 37.76 34.43 26.22 50.04 50.27 51.11 50.36 51.44 50.75 49.19 49.19 44.23 1987 ......... 40.11 35.20 24.08 51.44 51.81 52.84 51.88 53.11 52.33 50.42 50.42 45.34 1988 ......... 42.66 36.94 20.18 53.13 53.68 54.89 53.76 54.99 54.27 52.00 52.00 47.00 1989 ......... 45.33 38.27 20.20 55.35 55.89 56.88 55.94 56.93 56.36 53.80 53.80 48.74
1990 ......... 47.56 40.36 18.02 57.62 58.10 58.75 58.16 58.58 58.40 55.52 55.52 50.11 1991 ......... 49.45 42.31 33.73 59.91 60.09 60.35 60.14 60.22 60.29 58.18 58.18 51.95 1992 ......... 51.51 43.79 22.50 61.61 61.68 61.68 61.68 61.62 61.67 59.23 59.23 53.41 1993 ......... 53.48 45.94 22.82 34.18 31.71 63.03 63.02 62.90 62.99 62.88 62.96 57.77 60.38 53.68 1994 ......... 54.84 47.12 26.03 35.36 32.65 64.28 64.24 64.02 64.20 63.98 64.14 58.79 61.56 54.79
1995 ......... 56.19 48.30 22.80 36.70 34.07 65.51 65.44 65.05 65.40 65.07 65.29 59.85 62.55 56.01 1996 ......... 57.54 49.46 24.08 38.09 35.40 66.77 66.57 65.94 66.54 66.06 66.34 61.06 63.74 57.28 1997 ......... 59.26 50.95 24.40 39.15 36.47 67.80 67.42 66.71 67.36 66.79 67.18 62.19 64.84 58.68 1998 ......... 60.92 52.37 29.20 40.45 37.65 68.30 67.99 67.45 67.93 67.53 67.81 63.41 65.88 60.34 1999 ......... 63.12 54.26 26.63 41.71 39.02 68.96 68.78 68.41 68.74 68.44 68.66 64.47 66.66 61.96
2000 ......... 66.15 56.86 19.89 43.12 40.68 69.98 69.80 69.43 69.83 69.43 69.70 65.08 67.44 63.49 2001 ......... 68.59 58.97 32.41 45.11 42.77 71.13 70.89 70.46 70.79 70.54 70.76 67.04 69.28 65.64 2002 ......... 71.75 63.03 32.09 47.74 45.66 71.76 71.59 71.66 71.59 71.77 71.64 67.55 69.88 67.21 2003 ......... 74.69 66.00 57.11 26.95 51.17 48.74 72.66 72.78 73.20 72.80 73.35 72.89 69.38 71.08 69.39 2004 ......... 77.75 68.74 59.50 29.20 54.40 51.99 74.26 74.59 75.07 74.59 75.18 74.69 71.44 73.16 71.61
Table 5-7: DEPARTMENT OF DEFENSE DEFLATORS - BUDGET AUTHORITY BY CATEGORY(Base Year = 2020)
Excluding Pay, Fuel and Medical
Fiscal Year Civilian Pay
Military Pay
DHP Excluding
Pay & Fuel
Defense Health
ProgramFuelMERHFCRetired
PayTotal
Non-Pay
Total Excluding
Pay & Med
Total Dept of Defense
62
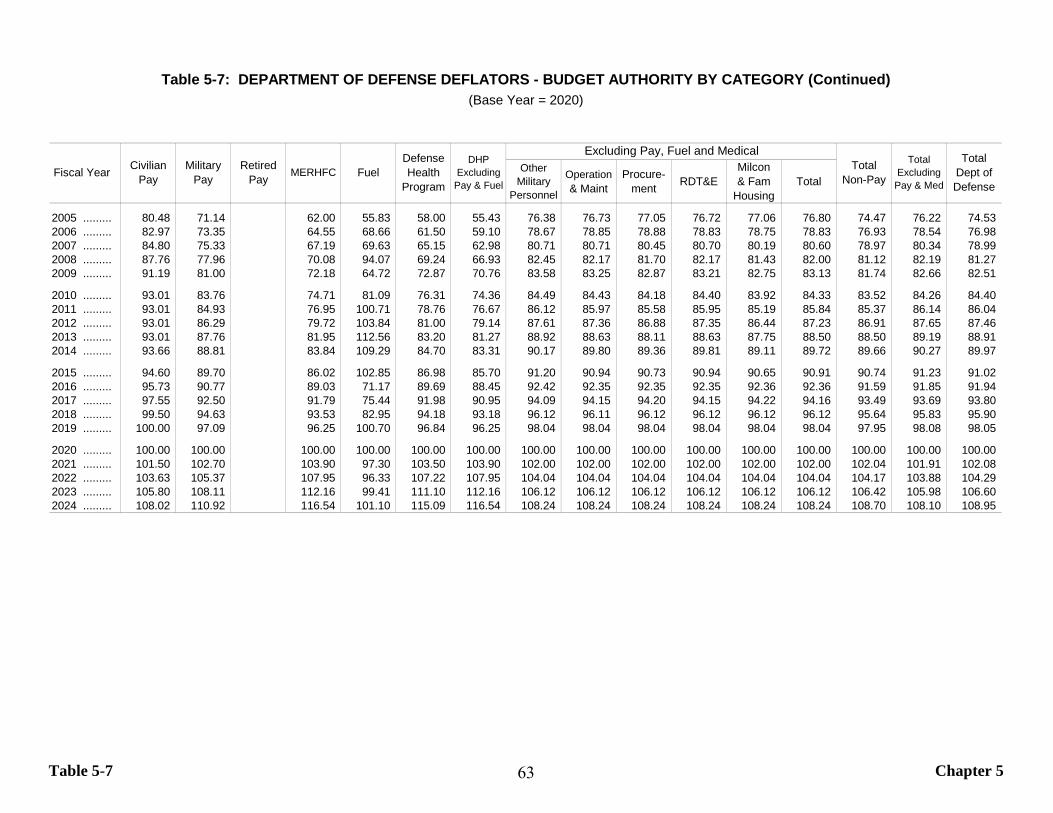
Table 5-7 Chapter 5
Other Military
Personnel
Operation & Maint
Procure-ment RDT&E
Milcon& Fam
HousingTotal
2005 ......... 80.48 71.14 62.00 55.83 58.00 55.43 76.38 76.73 77.05 76.72 77.06 76.80 74.47 76.22 74.53 2006 ......... 82.97 73.35 64.55 68.66 61.50 59.10 78.67 78.85 78.88 78.83 78.75 78.83 76.93 78.54 76.98 2007 ......... 84.80 75.33 67.19 69.63 65.15 62.98 80.71 80.71 80.45 80.70 80.19 80.60 78.97 80.34 78.99 2008 ......... 87.76 77.96 70.08 94.07 69.24 66.93 82.45 82.17 81.70 82.17 81.43 82.00 81.12 82.19 81.27 2009 ......... 91.19 81.00 72.18 64.72 72.87 70.76 83.58 83.25 82.87 83.21 82.75 83.13 81.74 82.66 82.51
2010 ......... 93.01 83.76 74.71 81.09 76.31 74.36 84.49 84.43 84.18 84.40 83.92 84.33 83.52 84.26 84.40 2011 ......... 93.01 84.93 76.95 100.71 78.76 76.67 86.12 85.97 85.58 85.95 85.19 85.84 85.37 86.14 86.04 2012 ......... 93.01 86.29 79.72 103.84 81.00 79.14 87.61 87.36 86.88 87.35 86.44 87.23 86.91 87.65 87.46 2013 ......... 93.01 87.76 81.95 112.56 83.20 81.27 88.92 88.63 88.11 88.63 87.75 88.50 88.50 89.19 88.91 2014 ......... 93.66 88.81 83.84 109.29 84.70 83.31 90.17 89.80 89.36 89.81 89.11 89.72 89.66 90.27 89.97
2015 ......... 94.60 89.70 86.02 102.85 86.98 85.70 91.20 90.94 90.73 90.94 90.65 90.91 90.74 91.23 91.02 2016 ......... 95.73 90.77 89.03 71.17 89.69 88.45 92.42 92.35 92.35 92.35 92.36 92.36 91.59 91.85 91.94 2017 ......... 97.55 92.50 91.79 75.44 91.98 90.95 94.09 94.15 94.20 94.15 94.22 94.16 93.49 93.69 93.80 2018 ......... 99.50 94.63 93.53 82.95 94.18 93.18 96.12 96.11 96.12 96.12 96.12 96.12 95.64 95.83 95.90 2019 ......... 100.00 97.09 96.25 100.70 96.84 96.25 98.04 98.04 98.04 98.04 98.04 98.04 97.95 98.08 98.05
2020 ......... 100.00 100.00 100.00 100.00 100.00 100.00 100.00 100.00 100.00 100.00 100.00 100.00 100.00 100.00 100.00 2021 ......... 101.50 102.70 103.90 97.30 103.50 103.90 102.00 102.00 102.00 102.00 102.00 102.00 102.04 101.91 102.08 2022 ......... 103.63 105.37 107.95 96.33 107.22 107.95 104.04 104.04 104.04 104.04 104.04 104.04 104.17 103.88 104.29 2023 ......... 105.80 108.11 112.16 99.41 111.10 112.16 106.12 106.12 106.12 106.12 106.12 106.12 106.42 105.98 106.60 2024 ......... 108.02 110.92 116.54 101.10 115.09 116.54 108.24 108.24 108.24 108.24 108.24 108.24 108.70 108.10 108.95
Excluding Pay, Fuel and MedicalTotal
Non-Pay
Total Excluding
Pay & Med
Total Dept of Defense
Table 5-7: DEPARTMENT OF DEFENSE DEFLATORS - BUDGET AUTHORITY BY CATEGORY (Continued)(Base Year = 2020)
Fiscal Year Civilian Pay
Military Pay
Retired Pay MERHFC Fuel
Defense Health
Program
DHP Excluding
Pay & Fuel
63
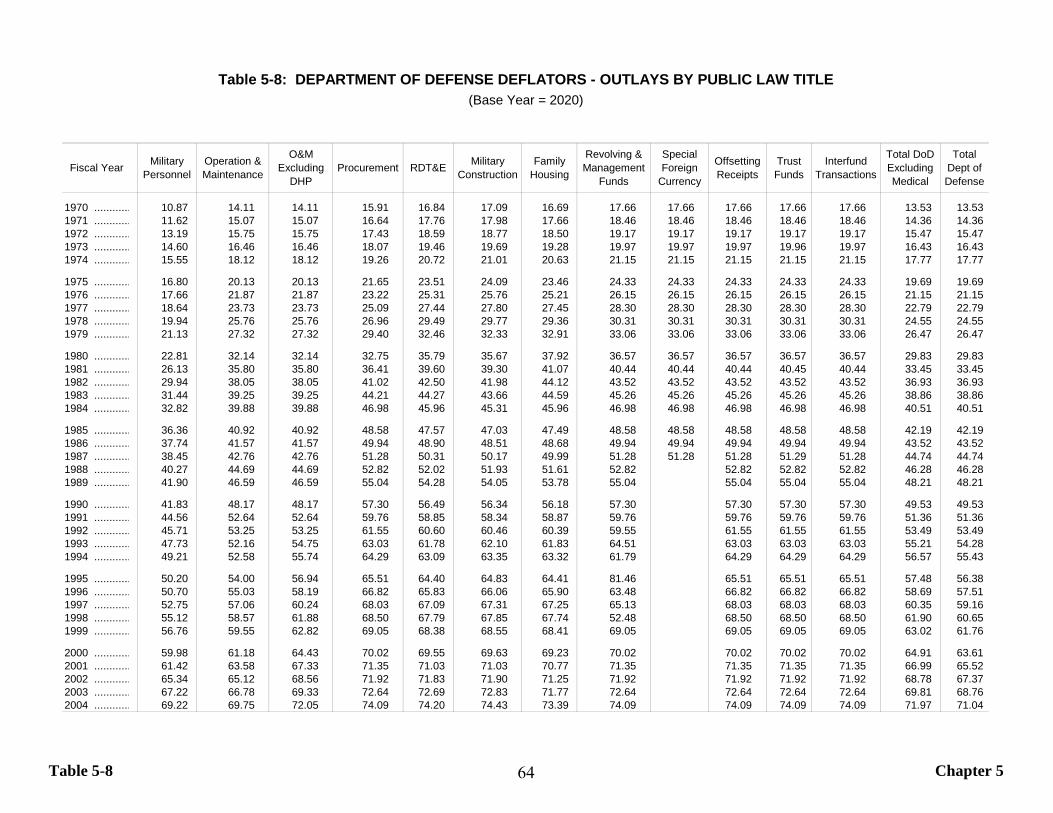
Table 5-8 Chapter 5
Fiscal Year Military Personnel
Operation & Maintenance
O&M Excluding
DHPProcurement RDT&E Military
ConstructionFamily
Housing
Revolving & Management
Funds
Special Foreign
Currency
Offsetting Receipts
Trust Funds
Interfund Transactions
Total DoD Excluding Medical
Total Dept of Defense
1970 ............ 10.87 14.11 14.11 15.91 16.84 17.09 16.69 17.66 17.66 17.66 17.66 17.66 13.53 13.53 1971 ............ 11.62 15.07 15.07 16.64 17.76 17.98 17.66 18.46 18.46 18.46 18.46 18.46 14.36 14.36 1972 ............ 13.19 15.75 15.75 17.43 18.59 18.77 18.50 19.17 19.17 19.17 19.17 19.17 15.47 15.47 1973 ............ 14.60 16.46 16.46 18.07 19.46 19.69 19.28 19.97 19.97 19.97 19.96 19.97 16.43 16.43 1974 ............ 15.55 18.12 18.12 19.26 20.72 21.01 20.63 21.15 21.15 21.15 21.15 21.15 17.77 17.77
1975 ............ 16.80 20.13 20.13 21.65 23.51 24.09 23.46 24.33 24.33 24.33 24.33 24.33 19.69 19.69 1976 ............ 17.66 21.87 21.87 23.22 25.31 25.76 25.21 26.15 26.15 26.15 26.15 26.15 21.15 21.15 1977 ............ 18.64 23.73 23.73 25.09 27.44 27.80 27.45 28.30 28.30 28.30 28.30 28.30 22.79 22.79 1978 ............ 19.94 25.76 25.76 26.96 29.49 29.77 29.36 30.31 30.31 30.31 30.31 30.31 24.55 24.55 1979 ............ 21.13 27.32 27.32 29.40 32.46 32.33 32.91 33.06 33.06 33.06 33.06 33.06 26.47 26.47
1980 ............ 22.81 32.14 32.14 32.75 35.79 35.67 37.92 36.57 36.57 36.57 36.57 36.57 29.83 29.83 1981 ............ 26.13 35.80 35.80 36.41 39.60 39.30 41.07 40.44 40.44 40.44 40.45 40.44 33.45 33.45 1982 ............ 29.94 38.05 38.05 41.02 42.50 41.98 44.12 43.52 43.52 43.52 43.52 43.52 36.93 36.93 1983 ............ 31.44 39.25 39.25 44.21 44.27 43.66 44.59 45.26 45.26 45.26 45.26 45.26 38.86 38.86 1984 ............ 32.82 39.88 39.88 46.98 45.96 45.31 45.96 46.98 46.98 46.98 46.98 46.98 40.51 40.51
1985 ............ 36.36 40.92 40.92 48.58 47.57 47.03 47.49 48.58 48.58 48.58 48.58 48.58 42.19 42.19 1986 ............ 37.74 41.57 41.57 49.94 48.90 48.51 48.68 49.94 49.94 49.94 49.94 49.94 43.52 43.52 1987 ............ 38.45 42.76 42.76 51.28 50.31 50.17 49.99 51.28 51.28 51.28 51.29 51.28 44.74 44.74 1988 ............ 40.27 44.69 44.69 52.82 52.02 51.93 51.61 52.82 52.82 52.82 52.82 46.28 46.28 1989 ............ 41.90 46.59 46.59 55.04 54.28 54.05 53.78 55.04 55.04 55.04 55.04 48.21 48.21
1990 ............ 41.83 48.17 48.17 57.30 56.49 56.34 56.18 57.30 57.30 57.30 57.30 49.53 49.53 1991 ............ 44.56 52.64 52.64 59.76 58.85 58.34 58.87 59.76 59.76 59.76 59.76 51.36 51.36 1992 ............ 45.71 53.25 53.25 61.55 60.60 60.46 60.39 59.55 61.55 61.55 61.55 53.49 53.49 1993 ............ 47.73 52.16 54.75 63.03 61.78 62.10 61.83 64.51 63.03 63.03 63.03 55.21 54.28 1994 ............ 49.21 52.58 55.74 64.29 63.09 63.35 63.32 61.79 64.29 64.29 64.29 56.57 55.43
1995 ............ 50.20 54.00 56.94 65.51 64.40 64.83 64.41 81.46 65.51 65.51 65.51 57.48 56.38 1996 ............ 50.70 55.03 58.19 66.82 65.83 66.06 65.90 63.48 66.82 66.82 66.82 58.69 57.51 1997 ............ 52.75 57.06 60.24 68.03 67.09 67.31 67.25 65.13 68.03 68.03 68.03 60.35 59.16 1998 ............ 55.12 58.57 61.88 68.50 67.79 67.85 67.74 52.48 68.50 68.50 68.50 61.90 60.65 1999 ............ 56.76 59.55 62.82 69.05 68.38 68.55 68.41 69.05 69.05 69.05 69.05 63.02 61.76
2000 ............ 59.98 61.18 64.43 70.02 69.55 69.63 69.23 70.02 70.02 70.02 70.02 64.91 63.61 2001 ............ 61.42 63.58 67.33 71.35 71.03 71.03 70.77 71.35 71.35 71.35 71.35 66.99 65.52 2002 ............ 65.34 65.12 68.56 71.92 71.83 71.90 71.25 71.92 71.92 71.92 71.92 68.78 67.37 2003 ............ 67.22 66.78 69.33 72.64 72.69 72.83 71.77 72.64 72.64 72.64 72.64 69.81 68.76 2004 ............ 69.22 69.75 72.05 74.09 74.20 74.43 73.39 74.09 74.09 74.09 74.09 71.97 71.04
Table 5-8: DEPARTMENT OF DEFENSE DEFLATORS - OUTLAYS BY PUBLIC LAW TITLE(Base Year = 2020)
64
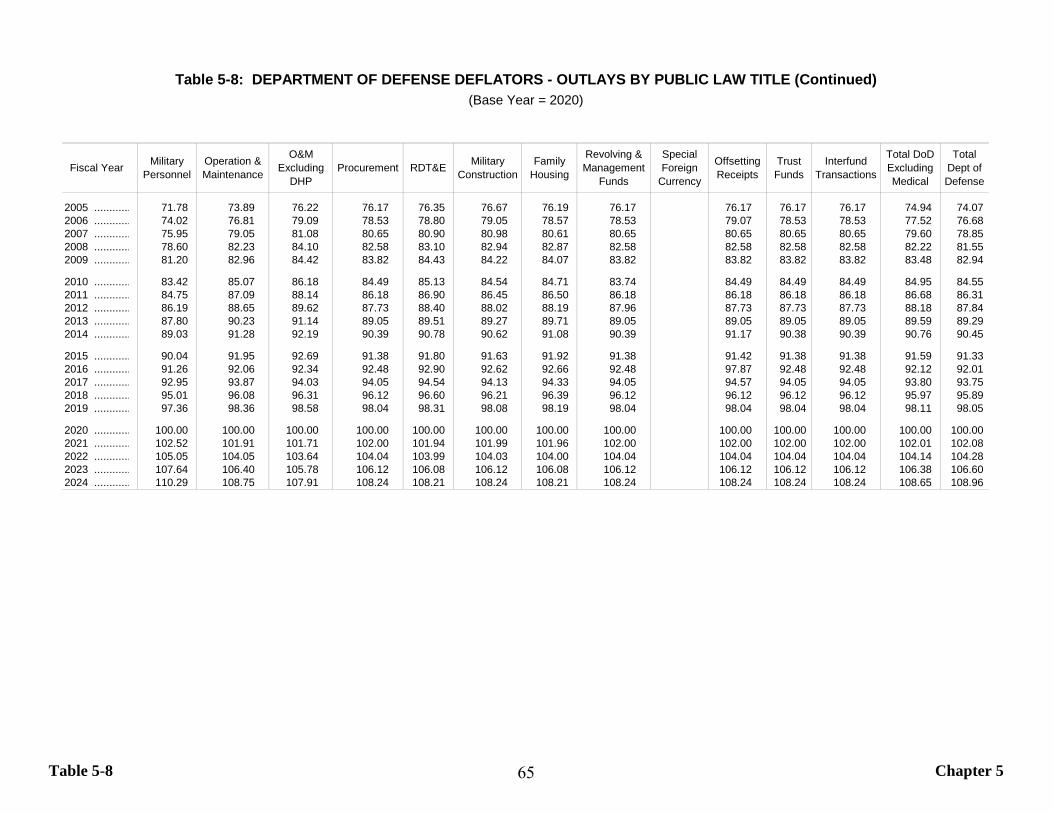
Table 5-8 Chapter 5
Fiscal Year Military Personnel
Operation & Maintenance
O&M Excluding
DHPProcurement RDT&E Military
ConstructionFamily
Housing
Revolving & Management
Funds
Special Foreign
Currency
Offsetting Receipts
Trust Funds
Interfund Transactions
Total DoD Excluding Medical
Total Dept of Defense
2005 ............ 71.78 73.89 76.22 76.17 76.35 76.67 76.19 76.17 76.17 76.17 76.17 74.94 74.07 2006 ............ 74.02 76.81 79.09 78.53 78.80 79.05 78.57 78.53 79.07 78.53 78.53 77.52 76.68 2007 ............ 75.95 79.05 81.08 80.65 80.90 80.98 80.61 80.65 80.65 80.65 80.65 79.60 78.85 2008 ............ 78.60 82.23 84.10 82.58 83.10 82.94 82.87 82.58 82.58 82.58 82.58 82.22 81.55 2009 ............ 81.20 82.96 84.42 83.82 84.43 84.22 84.07 83.82 83.82 83.82 83.82 83.48 82.94
2010 ............ 83.42 85.07 86.18 84.49 85.13 84.54 84.71 83.74 84.49 84.49 84.49 84.95 84.55 2011 ............ 84.75 87.09 88.14 86.18 86.90 86.45 86.50 86.18 86.18 86.18 86.18 86.68 86.31 2012 ............ 86.19 88.65 89.62 87.73 88.40 88.02 88.19 87.96 87.73 87.73 87.73 88.18 87.84 2013 ............ 87.80 90.23 91.14 89.05 89.51 89.27 89.71 89.05 89.05 89.05 89.05 89.59 89.29 2014 ............ 89.03 91.28 92.19 90.39 90.78 90.62 91.08 90.39 91.17 90.38 90.39 90.76 90.45
2015 ............ 90.04 91.95 92.69 91.38 91.80 91.63 91.92 91.38 91.42 91.38 91.38 91.59 91.33 2016 ............ 91.26 92.06 92.34 92.48 92.90 92.62 92.66 92.48 97.87 92.48 92.48 92.12 92.01 2017 ............ 92.95 93.87 94.03 94.05 94.54 94.13 94.33 94.05 94.57 94.05 94.05 93.80 93.75 2018 ............ 95.01 96.08 96.31 96.12 96.60 96.21 96.39 96.12 96.12 96.12 96.12 95.97 95.89 2019 ............ 97.36 98.36 98.58 98.04 98.31 98.08 98.19 98.04 98.04 98.04 98.04 98.11 98.05
2020 ............ 100.00 100.00 100.00 100.00 100.00 100.00 100.00 100.00 100.00 100.00 100.00 100.00 100.00 2021 ............ 102.52 101.91 101.71 102.00 101.94 101.99 101.96 102.00 102.00 102.00 102.00 102.01 102.08 2022 ............ 105.05 104.05 103.64 104.04 103.99 104.03 104.00 104.04 104.04 104.04 104.04 104.14 104.28 2023 ............ 107.64 106.40 105.78 106.12 106.08 106.12 106.08 106.12 106.12 106.12 106.12 106.38 106.60 2024 ............ 110.29 108.75 107.91 108.24 108.21 108.24 108.21 108.24 108.24 108.24 108.24 108.65 108.96
Table 5-8: DEPARTMENT OF DEFENSE DEFLATORS - OUTLAYS BY PUBLIC LAW TITLE (Continued)(Base Year = 2020)
65

Table 5-9 Chapter 5
Other Military
Personnel
Operation & Maint
Procure-ment RDT&E
Milcon& Fam
HousingTotal
1970 ......... 13.83 9.96 13.43 8.81 17.66 16.30 16.02 17.66 17.66 16.49 15.89 15.89 13.53 1971 ......... 15.02 10.77 14.85 9.21 18.46 16.95 16.72 18.46 18.46 17.25 16.68 16.68 14.36 1972 ......... 16.27 12.55 15.84 9.56 19.17 17.65 17.49 19.17 19.17 18.01 17.21 17.21 15.47 1973 ......... 17.25 14.09 16.81 9.96 19.97 18.07 18.12 19.97 19.97 18.63 17.79 17.79 16.43 1974 ......... 18.79 15.04 18.43 10.55 21.15 20.34 19.28 21.15 21.15 20.15 19.24 19.24 17.77
1975 ......... 20.31 16.02 21.03 12.14 24.33 24.58 21.69 24.33 24.33 23.25 21.82 21.82 19.69 1976 ......... 21.96 16.86 23.35 13.05 26.15 26.26 23.25 26.15 26.15 24.95 23.53 23.53 21.15 1977 ......... 23.89 17.81 24.73 14.12 28.30 28.30 25.13 28.30 28.30 26.94 25.42 25.42 22.79 1978 ......... 25.80 19.05 26.59 15.12 30.31 30.31 27.00 30.31 30.31 28.88 27.37 27.37 24.55 1979 ......... 27.32 20.16 28.79 17.48 33.06 33.06 29.40 33.06 33.06 31.27 29.66 29.66 26.47
1980 ......... 29.19 21.60 32.26 32.92 36.57 36.57 32.75 36.57 36.57 34.74 34.54 34.54 29.83 1981 ......... 31.75 24.63 35.88 38.03 40.44 40.44 36.41 40.44 40.44 38.56 38.50 38.50 33.45 1982 ......... 32.58 28.63 38.24 42.29 43.52 43.52 41.02 43.52 43.52 42.37 42.36 42.36 36.93 1983 ......... 34.35 29.93 40.45 37.85 45.26 45.26 44.21 45.26 45.26 44.75 44.17 44.17 38.86 1984 ......... 35.74 31.38 41.83 32.63 46.98 46.98 46.98 46.98 46.98 46.98 45.80 45.80 40.51
1985 ......... 36.96 33.01 30.26 48.58 48.58 48.58 48.58 48.58 48.58 47.20 47.20 42.19 1986 ......... 37.76 34.43 26.22 49.94 49.94 49.94 49.94 49.94 49.94 48.32 48.32 43.52 1987 ......... 40.11 35.20 24.08 51.28 51.28 51.28 51.28 51.28 51.28 49.42 49.42 44.74 1988 ......... 42.66 36.94 20.18 52.82 52.82 52.82 52.82 52.82 52.82 50.68 50.68 46.28 1989 ......... 45.33 38.27 20.20 55.04 55.04 55.04 55.04 55.04 55.04 52.68 52.68 48.21
1990 ......... 47.56 40.36 18.02 57.30 57.30 57.30 57.30 57.30 57.30 54.50 54.50 49.53 1991 ......... 49.45 42.31 33.73 59.76 59.76 59.76 59.76 59.76 59.76 57.52 57.52 51.36 1992 ......... 51.51 43.79 22.50 61.55 61.55 61.55 61.55 61.55 61.55 59.19 59.19 53.49 1993 ......... 53.48 45.94 22.82 34.83 31.90 63.03 63.03 63.03 63.03 63.03 63.03 58.62 60.64 54.28 1994 ......... 54.84 47.12 26.03 35.39 32.53 64.29 64.29 64.29 64.29 64.29 64.29 59.56 61.98 55.43
1995 ......... 56.19 48.30 22.80 36.94 34.06 65.51 65.51 65.51 65.51 65.51 65.51 60.44 62.85 56.38 1996 ......... 57.54 49.46 24.08 38.37 35.60 66.82 66.82 66.82 66.82 66.82 66.82 61.53 64.16 57.51 1997 ......... 59.26 50.95 24.40 39.47 36.63 68.03 68.03 68.03 68.03 68.03 68.03 63.08 65.63 59.16 1998 ......... 60.92 52.37 29.20 40.60 37.73 68.50 68.50 68.50 68.50 68.50 68.50 64.00 66.49 60.65 1999 ......... 63.12 54.26 26.63 41.68 38.97 69.05 69.05 69.05 69.05 69.05 69.05 64.39 66.80 61.76
2000 ......... 66.15 56.86 19.89 43.13 40.41 70.02 70.02 70.02 70.02 70.02 70.02 65.35 67.63 63.61 2001 ......... 68.59 58.97 32.41 44.56 42.03 71.35 71.35 71.35 71.35 71.35 71.35 67.06 69.61 65.52 2002 ......... 71.75 63.03 32.09 47.33 44.89 71.92 71.92 71.92 71.92 71.92 71.92 67.81 70.05 67.37 2003 ......... 74.69 66.00 57.11 26.95 50.41 47.94 72.64 72.64 72.64 72.64 72.64 72.64 68.49 70.50 68.76 2004 ......... 77.75 68.74 59.50 29.20 53.78 51.15 74.09 74.09 74.09 74.09 74.09 74.09 70.63 72.42 71.04
Table 5-9: DEPARTMENT OF DEFENSE DEFLATORS - OUTLAYS BY CATEGORY(Base Year = 2020)
Excluding Pay, Fuel and Medical
Fiscal Year Civilian Pay
Military Pay
DHP Excluding
Pay & Fuel
Defense Health
ProgramFuelMERHFCRetired
PayTotal
Non-Pay
Total Excluding
Pay & Med
Total Dept of Defense
66
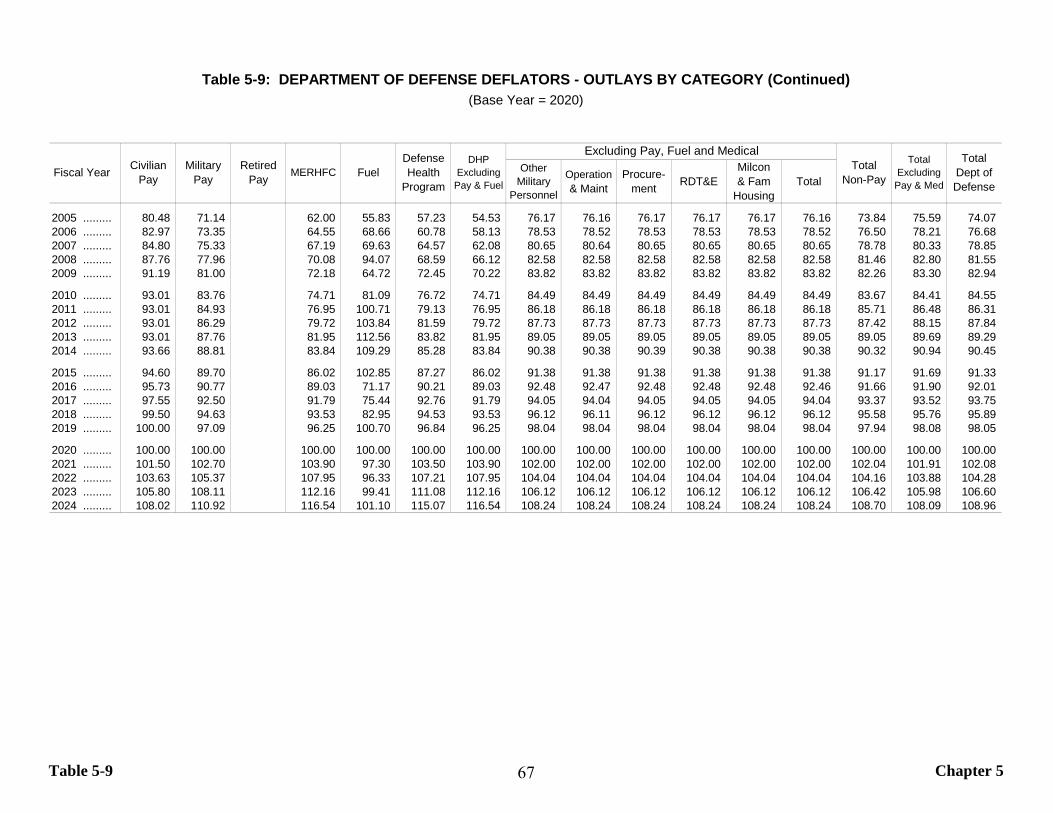
Table 5-9 Chapter 5
Other Military
Personnel
Operation & Maint
Procure-ment RDT&E
Milcon& Fam
HousingTotal
2005 ......... 80.48 71.14 62.00 55.83 57.23 54.53 76.17 76.16 76.17 76.17 76.17 76.16 73.84 75.59 74.07 2006 ......... 82.97 73.35 64.55 68.66 60.78 58.13 78.53 78.52 78.53 78.53 78.53 78.52 76.50 78.21 76.68 2007 ......... 84.80 75.33 67.19 69.63 64.57 62.08 80.65 80.64 80.65 80.65 80.65 80.65 78.78 80.33 78.85 2008 ......... 87.76 77.96 70.08 94.07 68.59 66.12 82.58 82.58 82.58 82.58 82.58 82.58 81.46 82.80 81.55 2009 ......... 91.19 81.00 72.18 64.72 72.45 70.22 83.82 83.82 83.82 83.82 83.82 83.82 82.26 83.30 82.94
2010 ......... 93.01 83.76 74.71 81.09 76.72 74.71 84.49 84.49 84.49 84.49 84.49 84.49 83.67 84.41 84.55 2011 ......... 93.01 84.93 76.95 100.71 79.13 76.95 86.18 86.18 86.18 86.18 86.18 86.18 85.71 86.48 86.31 2012 ......... 93.01 86.29 79.72 103.84 81.59 79.72 87.73 87.73 87.73 87.73 87.73 87.73 87.42 88.15 87.84 2013 ......... 93.01 87.76 81.95 112.56 83.82 81.95 89.05 89.05 89.05 89.05 89.05 89.05 89.05 89.69 89.29 2014 ......... 93.66 88.81 83.84 109.29 85.28 83.84 90.38 90.38 90.39 90.38 90.38 90.38 90.32 90.94 90.45
2015 ......... 94.60 89.70 86.02 102.85 87.27 86.02 91.38 91.38 91.38 91.38 91.38 91.38 91.17 91.69 91.33 2016 ......... 95.73 90.77 89.03 71.17 90.21 89.03 92.48 92.47 92.48 92.48 92.48 92.46 91.66 91.90 92.01 2017 ......... 97.55 92.50 91.79 75.44 92.76 91.79 94.05 94.04 94.05 94.05 94.05 94.04 93.37 93.52 93.75 2018 ......... 99.50 94.63 93.53 82.95 94.53 93.53 96.12 96.11 96.12 96.12 96.12 96.12 95.58 95.76 95.89 2019 ......... 100.00 97.09 96.25 100.70 96.84 96.25 98.04 98.04 98.04 98.04 98.04 98.04 97.94 98.08 98.05
2020 ......... 100.00 100.00 100.00 100.00 100.00 100.00 100.00 100.00 100.00 100.00 100.00 100.00 100.00 100.00 100.00 2021 ......... 101.50 102.70 103.90 97.30 103.50 103.90 102.00 102.00 102.00 102.00 102.00 102.00 102.04 101.91 102.08 2022 ......... 103.63 105.37 107.95 96.33 107.21 107.95 104.04 104.04 104.04 104.04 104.04 104.04 104.16 103.88 104.28 2023 ......... 105.80 108.11 112.16 99.41 111.08 112.16 106.12 106.12 106.12 106.12 106.12 106.12 106.42 105.98 106.60 2024 ......... 108.02 110.92 116.54 101.10 115.07 116.54 108.24 108.24 108.24 108.24 108.24 108.24 108.70 108.09 108.96
Excluding Pay, Fuel and MedicalTotal
Non-Pay
Total Excluding
Pay & Med
Total Dept of Defense
Table 5-9: DEPARTMENT OF DEFENSE DEFLATORS - OUTLAYS BY CATEGORY (Continued)(Base Year = 2020)
Fiscal Year Civilian Pay
Military Pay
Retired Pay MERHFC Fuel
Defense Health
Program
DHP Excluding
Pay & Fuel
67
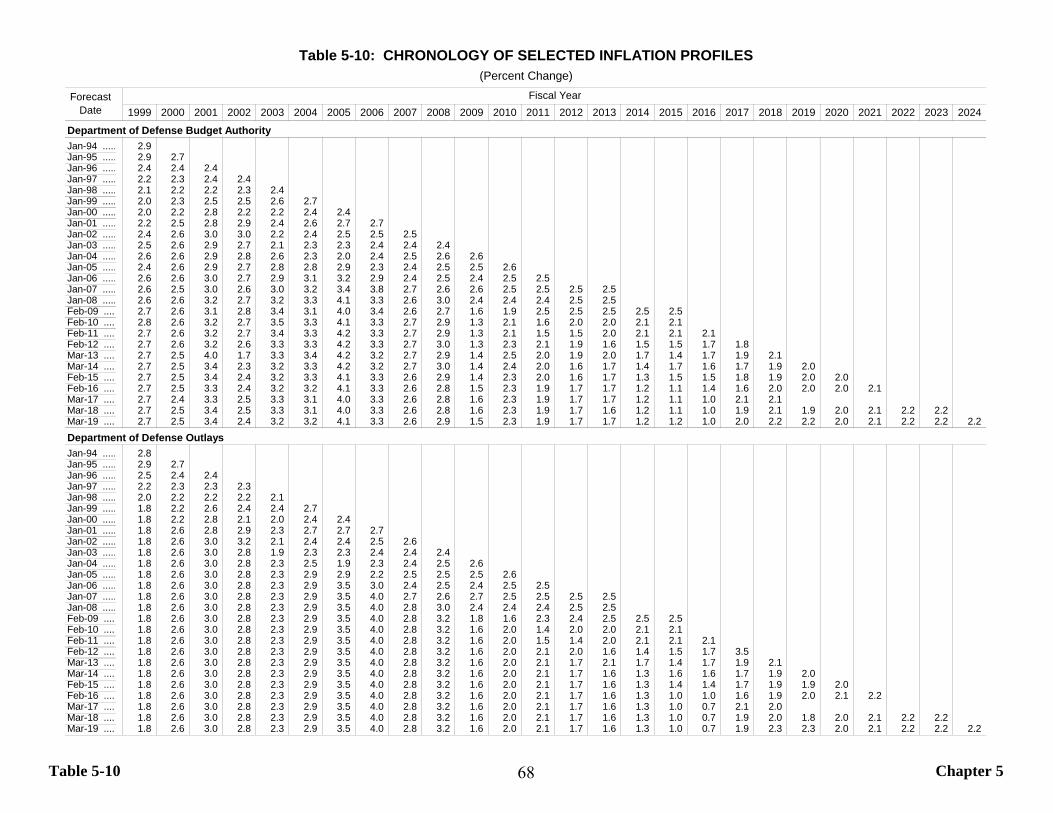
Table 5-10 Chapter 5
1999 2000 2001 2002 2003 2004 2005 2006 2007 2008 2009 2010 2011 2012 2013 2014 2015 2016 2017 2018 2019 2020 2021 2022 2023 2024
Department of Defense Budget AuthorityJan-94 ..... 2.9 Jan-95 ..... 2.9 2.7 Jan-96 ..... 2.4 2.4 2.4 Jan-97 ..... 2.2 2.3 2.4 2.4 Jan-98 ..... 2.1 2.2 2.2 2.3 2.4 Jan-99 ..... 2.0 2.3 2.5 2.5 2.6 2.7 Jan-00 ..... 2.0 2.2 2.8 2.2 2.2 2.4 2.4 Jan-01 ..... 2.2 2.5 2.8 2.9 2.4 2.6 2.7 2.7 Jan-02 ..... 2.4 2.6 3.0 3.0 2.2 2.4 2.5 2.5 2.5 Jan-03 ..... 2.5 2.6 2.9 2.7 2.1 2.3 2.3 2.4 2.4 2.4 Jan-04 ..... 2.6 2.6 2.9 2.8 2.6 2.3 2.0 2.4 2.5 2.6 2.6 Jan-05 ..... 2.4 2.6 2.9 2.7 2.8 2.8 2.9 2.3 2.4 2.5 2.5 2.6 Jan-06 ..... 2.6 2.6 3.0 2.7 2.9 3.1 3.2 2.9 2.4 2.5 2.4 2.5 2.5 Jan-07 ..... 2.6 2.5 3.0 2.6 3.0 3.2 3.4 3.8 2.7 2.6 2.6 2.5 2.5 2.5 2.5 Jan-08 ..... 2.6 2.6 3.2 2.7 3.2 3.3 4.1 3.3 2.6 3.0 2.4 2.4 2.4 2.5 2.5 Feb-09 .... 2.7 2.6 3.1 2.8 3.4 3.1 4.0 3.4 2.6 2.7 1.6 1.9 2.5 2.5 2.5 2.5 2.5 Feb-10 .... 2.8 2.6 3.2 2.7 3.5 3.3 4.1 3.3 2.7 2.9 1.3 2.1 1.6 2.0 2.0 2.1 2.1 Feb-11 .... 2.7 2.6 3.2 2.7 3.4 3.3 4.2 3.3 2.7 2.9 1.3 2.1 1.5 1.5 2.0 2.1 2.1 2.1 Feb-12 .... 2.7 2.6 3.2 2.6 3.3 3.3 4.2 3.3 2.7 3.0 1.3 2.3 2.1 1.9 1.6 1.5 1.5 1.7 1.8 Mar-13 .... 2.7 2.5 4.0 1.7 3.3 3.4 4.2 3.2 2.7 2.9 1.4 2.5 2.0 1.9 2.0 1.7 1.4 1.7 1.9 2.1 Mar-14 .... 2.7 2.5 3.4 2.3 3.2 3.3 4.2 3.2 2.7 3.0 1.4 2.4 2.0 1.6 1.7 1.4 1.7 1.6 1.7 1.9 2.0 Feb-15 .... 2.7 2.5 3.4 2.4 3.2 3.3 4.1 3.3 2.6 2.9 1.4 2.3 2.0 1.6 1.7 1.3 1.5 1.5 1.8 1.9 2.0 2.0 Feb-16 .... 2.7 2.5 3.3 2.4 3.2 3.2 4.1 3.3 2.6 2.8 1.5 2.3 1.9 1.7 1.7 1.2 1.1 1.4 1.6 2.0 2.0 2.0 2.1 Mar-17 .... 2.7 2.4 3.3 2.5 3.3 3.1 4.0 3.3 2.6 2.8 1.6 2.3 1.9 1.7 1.7 1.2 1.1 1.0 2.1 2.1 Mar-18 .... 2.7 2.5 3.4 2.5 3.3 3.1 4.0 3.3 2.6 2.8 1.6 2.3 1.9 1.7 1.6 1.2 1.1 1.0 1.9 2.1 1.9 2.0 2.1 2.2 2.2 Mar-19 .... 2.7 2.5 3.4 2.4 3.2 3.2 4.1 3.3 2.6 2.9 1.5 2.3 1.9 1.7 1.7 1.2 1.2 1.0 2.0 2.2 2.2 2.0 2.1 2.2 2.2 2.2 Department of Defense OutlaysJan-94 ..... 2.8 Jan-95 ..... 2.9 2.7 Jan-96 ..... 2.5 2.4 2.4 Jan-97 ..... 2.2 2.3 2.3 2.3 Jan-98 ..... 2.0 2.2 2.2 2.2 2.1 Jan-99 ..... 1.8 2.2 2.6 2.4 2.4 2.7 Jan-00 ..... 1.8 2.2 2.8 2.1 2.0 2.4 2.4 Jan-01 ..... 1.8 2.6 2.8 2.9 2.3 2.7 2.7 2.7 Jan-02 ..... 1.8 2.6 3.0 3.2 2.1 2.4 2.4 2.5 2.6 Jan-03 ..... 1.8 2.6 3.0 2.8 1.9 2.3 2.3 2.4 2.4 2.4 Jan-04 ..... 1.8 2.6 3.0 2.8 2.3 2.5 1.9 2.3 2.4 2.5 2.6 Jan-05 ..... 1.8 2.6 3.0 2.8 2.3 2.9 2.9 2.2 2.5 2.5 2.5 2.6 Jan-06 ..... 1.8 2.6 3.0 2.8 2.3 2.9 3.5 3.0 2.4 2.5 2.4 2.5 2.5 Jan-07 ..... 1.8 2.6 3.0 2.8 2.3 2.9 3.5 4.0 2.7 2.6 2.7 2.5 2.5 2.5 2.5 Jan-08 ..... 1.8 2.6 3.0 2.8 2.3 2.9 3.5 4.0 2.8 3.0 2.4 2.4 2.4 2.5 2.5 Feb-09 .... 1.8 2.6 3.0 2.8 2.3 2.9 3.5 4.0 2.8 3.2 1.8 1.6 2.3 2.4 2.5 2.5 2.5 Feb-10 .... 1.8 2.6 3.0 2.8 2.3 2.9 3.5 4.0 2.8 3.2 1.6 2.0 1.4 2.0 2.0 2.1 2.1 Feb-11 .... 1.8 2.6 3.0 2.8 2.3 2.9 3.5 4.0 2.8 3.2 1.6 2.0 1.5 1.4 2.0 2.1 2.1 2.1 Feb-12 .... 1.8 2.6 3.0 2.8 2.3 2.9 3.5 4.0 2.8 3.2 1.6 2.0 2.1 2.0 1.6 1.4 1.5 1.7 3.5 Mar-13 .... 1.8 2.6 3.0 2.8 2.3 2.9 3.5 4.0 2.8 3.2 1.6 2.0 2.1 1.7 2.1 1.7 1.4 1.7 1.9 2.1 Mar-14 .... 1.8 2.6 3.0 2.8 2.3 2.9 3.5 4.0 2.8 3.2 1.6 2.0 2.1 1.7 1.6 1.3 1.6 1.6 1.7 1.9 2.0 Feb-15 .... 1.8 2.6 3.0 2.8 2.3 2.9 3.5 4.0 2.8 3.2 1.6 2.0 2.1 1.7 1.6 1.3 1.4 1.4 1.7 1.9 1.9 2.0 Feb-16 .... 1.8 2.6 3.0 2.8 2.3 2.9 3.5 4.0 2.8 3.2 1.6 2.0 2.1 1.7 1.6 1.3 1.0 1.0 1.6 1.9 2.0 2.1 2.2 Mar-17 .... 1.8 2.6 3.0 2.8 2.3 2.9 3.5 4.0 2.8 3.2 1.6 2.0 2.1 1.7 1.6 1.3 1.0 0.7 2.1 2.0 Mar-18 .... 1.8 2.6 3.0 2.8 2.3 2.9 3.5 4.0 2.8 3.2 1.6 2.0 2.1 1.7 1.6 1.3 1.0 0.7 1.9 2.0 1.8 2.0 2.1 2.2 2.2 Mar-19 .... 1.8 2.6 3.0 2.8 2.3 2.9 3.5 4.0 2.8 3.2 1.6 2.0 2.1 1.7 1.6 1.3 1.0 0.7 1.9 2.3 2.3 2.0 2.1 2.2 2.2 2.2
Fiscal YearForecast Date
Table 5-10: CHRONOLOGY OF SELECTED INFLATION PROFILES(Percent Change)
68
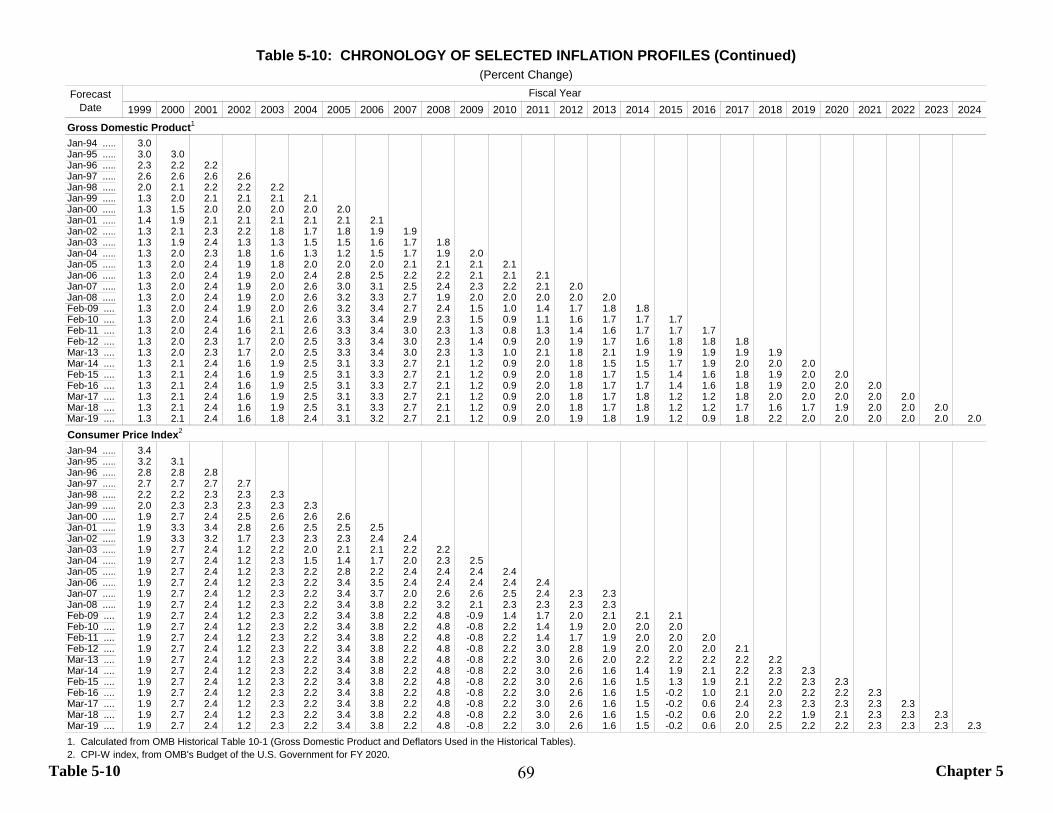
Table 5-10 Chapter 5
1999 2000 2001 2002 2003 2004 2005 2006 2007 2008 2009 2010 2011 2012 2013 2014 2015 2016 2017 2018 2019 2020 2021 2022 2023 2024Gross Domestic Product1
Jan-94 ..... 3.0 Jan-95 ..... 3.0 3.0 Jan-96 ..... 2.3 2.2 2.2 Jan-97 ..... 2.6 2.6 2.6 2.6 Jan-98 ..... 2.0 2.1 2.2 2.2 2.2 Jan-99 ..... 1.3 2.0 2.1 2.1 2.1 2.1 Jan-00 ..... 1.3 1.5 2.0 2.0 2.0 2.0 2.0 Jan-01 ..... 1.4 1.9 2.1 2.1 2.1 2.1 2.1 2.1 Jan-02 ..... 1.3 2.1 2.3 2.2 1.8 1.7 1.8 1.9 1.9 Jan-03 ..... 1.3 1.9 2.4 1.3 1.3 1.5 1.5 1.6 1.7 1.8 Jan-04 ..... 1.3 2.0 2.3 1.8 1.6 1.3 1.2 1.5 1.7 1.9 2.0 Jan-05 ..... 1.3 2.0 2.4 1.9 1.8 2.0 2.0 2.0 2.1 2.1 2.1 2.1 Jan-06 ..... 1.3 2.0 2.4 1.9 2.0 2.4 2.8 2.5 2.2 2.2 2.1 2.1 2.1 Jan-07 ..... 1.3 2.0 2.4 1.9 2.0 2.6 3.0 3.1 2.5 2.4 2.3 2.2 2.1 2.0 Jan-08 ..... 1.3 2.0 2.4 1.9 2.0 2.6 3.2 3.3 2.7 1.9 2.0 2.0 2.0 2.0 2.0 Feb-09 .... 1.3 2.0 2.4 1.9 2.0 2.6 3.2 3.4 2.7 2.4 1.5 1.0 1.4 1.7 1.8 1.8 Feb-10 .... 1.3 2.0 2.4 1.6 2.1 2.6 3.3 3.4 2.9 2.3 1.5 0.9 1.1 1.6 1.7 1.7 1.7 Feb-11 .... 1.3 2.0 2.4 1.6 2.1 2.6 3.3 3.4 3.0 2.3 1.3 0.8 1.3 1.4 1.6 1.7 1.7 1.7 Feb-12 .... 1.3 2.0 2.3 1.7 2.0 2.5 3.3 3.4 3.0 2.3 1.4 0.9 2.0 1.9 1.7 1.6 1.8 1.8 1.8 Mar-13 .... 1.3 2.0 2.3 1.7 2.0 2.5 3.3 3.4 3.0 2.3 1.3 1.0 2.1 1.8 2.1 1.9 1.9 1.9 1.9 1.9 Mar-14 .... 1.3 2.1 2.4 1.6 1.9 2.5 3.1 3.3 2.7 2.1 1.2 0.9 2.0 1.8 1.5 1.5 1.7 1.9 2.0 2.0 2.0 Feb-15 .... 1.3 2.1 2.4 1.6 1.9 2.5 3.1 3.3 2.7 2.1 1.2 0.9 2.0 1.8 1.7 1.5 1.4 1.6 1.8 1.9 2.0 2.0 Feb-16 .... 1.3 2.1 2.4 1.6 1.9 2.5 3.1 3.3 2.7 2.1 1.2 0.9 2.0 1.8 1.7 1.7 1.4 1.6 1.8 1.9 2.0 2.0 2.0 Mar-17 .... 1.3 2.1 2.4 1.6 1.9 2.5 3.1 3.3 2.7 2.1 1.2 0.9 2.0 1.8 1.7 1.8 1.2 1.2 1.8 2.0 2.0 2.0 2.0 2.0 Mar-18 .... 1.3 2.1 2.4 1.6 1.9 2.5 3.1 3.3 2.7 2.1 1.2 0.9 2.0 1.8 1.7 1.8 1.2 1.2 1.7 1.6 1.7 1.9 2.0 2.0 2.0 Mar-19 .... 1.3 2.1 2.4 1.6 1.8 2.4 3.1 3.2 2.7 2.1 1.2 0.9 2.0 1.9 1.8 1.9 1.2 0.9 1.8 2.2 2.0 2.0 2.0 2.0 2.0 2.0 Consumer Price Index2
Jan-94 ..... 3.4 Jan-95 ..... 3.2 3.1 Jan-96 ..... 2.8 2.8 2.8 Jan-97 ..... 2.7 2.7 2.7 2.7 Jan-98 ..... 2.2 2.2 2.3 2.3 2.3 Jan-99 ..... 2.0 2.3 2.3 2.3 2.3 2.3 Jan-00 ..... 1.9 2.7 2.4 2.5 2.6 2.6 2.6 Jan-01 ..... 1.9 3.3 3.4 2.8 2.6 2.5 2.5 2.5 Jan-02 ..... 1.9 3.3 3.2 1.7 2.3 2.3 2.3 2.4 2.4 Jan-03 ..... 1.9 2.7 2.4 1.2 2.2 2.0 2.1 2.1 2.2 2.2 Jan-04 ..... 1.9 2.7 2.4 1.2 2.3 1.5 1.4 1.7 2.0 2.3 2.5 Jan-05 ..... 1.9 2.7 2.4 1.2 2.3 2.2 2.8 2.2 2.4 2.4 2.4 2.4 Jan-06 ..... 1.9 2.7 2.4 1.2 2.3 2.2 3.4 3.5 2.4 2.4 2.4 2.4 2.4 Jan-07 ..... 1.9 2.7 2.4 1.2 2.3 2.2 3.4 3.7 2.0 2.6 2.6 2.5 2.4 2.3 2.3 Jan-08 ..... 1.9 2.7 2.4 1.2 2.3 2.2 3.4 3.8 2.2 3.2 2.1 2.3 2.3 2.3 2.3 Feb-09 .... 1.9 2.7 2.4 1.2 2.3 2.2 3.4 3.8 2.2 4.8 -0.9 1.4 1.7 2.0 2.1 2.1 2.1 Feb-10 .... 1.9 2.7 2.4 1.2 2.3 2.2 3.4 3.8 2.2 4.8 -0.8 2.2 1.4 1.9 2.0 2.0 2.0 Feb-11 .... 1.9 2.7 2.4 1.2 2.3 2.2 3.4 3.8 2.2 4.8 -0.8 2.2 1.4 1.7 1.9 2.0 2.0 2.0 Feb-12 .... 1.9 2.7 2.4 1.2 2.3 2.2 3.4 3.8 2.2 4.8 -0.8 2.2 3.0 2.8 1.9 2.0 2.0 2.0 2.1 Mar-13 .... 1.9 2.7 2.4 1.2 2.3 2.2 3.4 3.8 2.2 4.8 -0.8 2.2 3.0 2.6 2.0 2.2 2.2 2.2 2.2 2.2 Mar-14 .... 1.9 2.7 2.4 1.2 2.3 2.2 3.4 3.8 2.2 4.8 -0.8 2.2 3.0 2.6 1.6 1.4 1.9 2.1 2.2 2.3 2.3 Feb-15 .... 1.9 2.7 2.4 1.2 2.3 2.2 3.4 3.8 2.2 4.8 -0.8 2.2 3.0 2.6 1.6 1.5 1.3 1.9 2.1 2.2 2.3 2.3 Feb-16 .... 1.9 2.7 2.4 1.2 2.3 2.2 3.4 3.8 2.2 4.8 -0.8 2.2 3.0 2.6 1.6 1.5 -0.2 1.0 2.1 2.0 2.2 2.2 2.3 Mar-17 .... 1.9 2.7 2.4 1.2 2.3 2.2 3.4 3.8 2.2 4.8 -0.8 2.2 3.0 2.6 1.6 1.5 -0.2 0.6 2.4 2.3 2.3 2.3 2.3 2.3 Mar-18 .... 1.9 2.7 2.4 1.2 2.3 2.2 3.4 3.8 2.2 4.8 -0.8 2.2 3.0 2.6 1.6 1.5 -0.2 0.6 2.0 2.2 1.9 2.1 2.3 2.3 2.3 Mar-19 .... 1.9 2.7 2.4 1.2 2.3 2.2 3.4 3.8 2.2 4.8 -0.8 2.2 3.0 2.6 1.6 1.5 -0.2 0.6 2.0 2.5 2.2 2.2 2.3 2.3 2.3 2.3 1. Calculated from OMB Historical Table 10-1 (Gross Domestic Product and Deflators Used in the Historical Tables).2. CPI-W index, from OMB's Budget of the U.S. Government for FY 2020.
Table 5-10: CHRONOLOGY OF SELECTED INFLATION PROFILES (Continued)
Forecast Date
Fiscal Year(Percent Change)
69
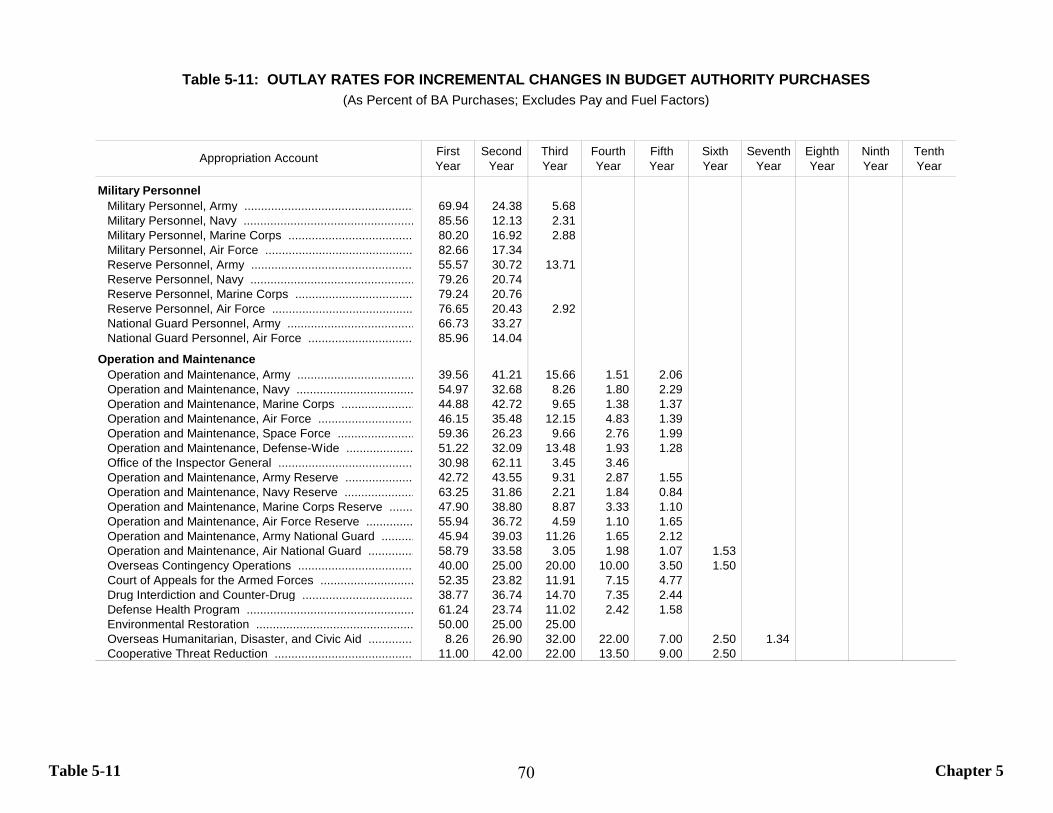
Table 5-11 Chapter 5
First Year
Second Year
Third Year
Fourth Year
FifthYear
Sixth Year
Seventh Year
Eighth Year
Ninth Year
Tenth Year
Military PersonnelMilitary Personnel, Army ................................................... 69.94 24.38 5.68 Military Personnel, Navy ................................................... 85.56 12.13 2.31 Military Personnel, Marine Corps ..................................... 80.20 16.92 2.88 Military Personnel, Air Force ............................................ 82.66 17.34 Reserve Personnel, Army ................................................. 55.57 30.72 13.71 Reserve Personnel, Navy ................................................. 79.26 20.74 Reserve Personnel, Marine Corps ................................... 79.24 20.76 Reserve Personnel, Air Force .......................................... 76.65 20.43 2.92 National Guard Personnel, Army ...................................... 66.73 33.27 National Guard Personnel, Air Force ................................ 85.96 14.04
Operation and MaintenanceOperation and Maintenance, Army ................................... 39.56 41.21 15.66 1.51 2.06 Operation and Maintenance, Navy ................................... 54.97 32.68 8.26 1.80 2.29 Operation and Maintenance, Marine Corps ...................... 44.88 42.72 9.65 1.38 1.37 Operation and Maintenance, Air Force ............................. 46.15 35.48 12.15 4.83 1.39 Operation and Maintenance, Space Force ....................... 59.36 26.23 9.66 2.76 1.99 Operation and Maintenance, Defense-Wide .................... 51.22 32.09 13.48 1.93 1.28 Office of the Inspector General ........................................ 30.98 62.11 3.45 3.46 Operation and Maintenance, Army Reserve .................... 42.72 43.55 9.31 2.87 1.55 Operation and Maintenance, Navy Reserve ..................... 63.25 31.86 2.21 1.84 0.84 Operation and Maintenance, Marine Corps Reserve ....... 47.90 38.80 8.87 3.33 1.10 Operation and Maintenance, Air Force Reserve .............. 55.94 36.72 4.59 1.10 1.65 Operation and Maintenance, Army National Guard .......... 45.94 39.03 11.26 1.65 2.12 Operation and Maintenance, Air National Guard .............. 58.79 33.58 3.05 1.98 1.07 1.53 Overseas Contingency Operations ................................... 40.00 25.00 20.00 10.00 3.50 1.50 Court of Appeals for the Armed Forces ............................ 52.35 23.82 11.91 7.15 4.77 Drug Interdiction and Counter-Drug ................................. 38.77 36.74 14.70 7.35 2.44 Defense Health Program .................................................. 61.24 23.74 11.02 2.42 1.58 Environmental Restoration ............................................... 50.00 25.00 25.00 Overseas Humanitarian, Disaster, and Civic Aid .............. 8.26 26.90 32.00 22.00 7.00 2.50 1.34 Cooperative Threat Reduction .......................................... 11.00 42.00 22.00 13.50 9.00 2.50
Table 5-11: OUTLAY RATES FOR INCREMENTAL CHANGES IN BUDGET AUTHORITY PURCHASES(As Percent of BA Purchases; Excludes Pay and Fuel Factors)
Appropriation Account
70
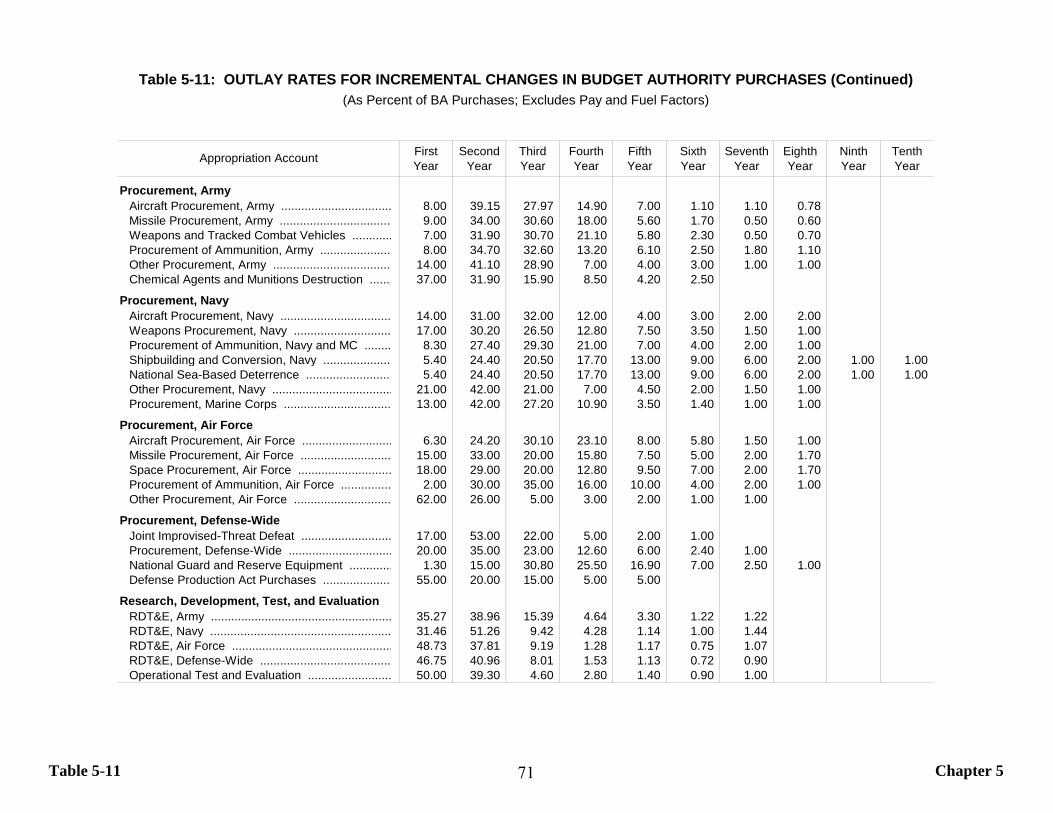
Table 5-11 Chapter 5
First Year
Second Year
Third Year
Fourth Year
FifthYear
Sixth Year
Seventh Year
Eighth Year
Ninth Year
Tenth Year
Procurement, ArmyAircraft Procurement, Army ................................. 8.00 39.15 27.97 14.90 7.00 1.10 1.10 0.78 Missile Procurement, Army ................................. 9.00 34.00 30.60 18.00 5.60 1.70 0.50 0.60 Weapons and Tracked Combat Vehicles ............ 7.00 31.90 30.70 21.10 5.80 2.30 0.50 0.70 Procurement of Ammunition, Army ..................... 8.00 34.70 32.60 13.20 6.10 2.50 1.80 1.10 Other Procurement, Army .................................... 14.00 41.10 28.90 7.00 4.00 3.00 1.00 1.00 Chemical Agents and Munitions Destruction ....... 37.00 31.90 15.90 8.50 4.20 2.50
Procurement, NavyAircraft Procurement, Navy ................................. 14.00 31.00 32.00 12.00 4.00 3.00 2.00 2.00 Weapons Procurement, Navy ............................. 17.00 30.20 26.50 12.80 7.50 3.50 1.50 1.00 Procurement of Ammunition, Navy and MC ........ 8.30 27.40 29.30 21.00 7.00 4.00 2.00 1.00 Shipbuilding and Conversion, Navy .................... 5.40 24.40 20.50 17.70 13.00 9.00 6.00 2.00 1.00 1.00 National Sea-Based Deterrence .......................... 5.40 24.40 20.50 17.70 13.00 9.00 6.00 2.00 1.00 1.00 Other Procurement, Navy .................................... 21.00 42.00 21.00 7.00 4.50 2.00 1.50 1.00 Procurement, Marine Corps ................................ 13.00 42.00 27.20 10.90 3.50 1.40 1.00 1.00
Procurement, Air ForceAircraft Procurement, Air Force ........................... 6.30 24.20 30.10 23.10 8.00 5.80 1.50 1.00 Missile Procurement, Air Force ........................... 15.00 33.00 20.00 15.80 7.50 5.00 2.00 1.70 Space Procurement, Air Force ............................ 18.00 29.00 20.00 12.80 9.50 7.00 2.00 1.70 Procurement of Ammunition, Air Force ............... 2.00 30.00 35.00 16.00 10.00 4.00 2.00 1.00 Other Procurement, Air Force ............................. 62.00 26.00 5.00 3.00 2.00 1.00 1.00
Procurement, Defense-WideJoint Improvised-Threat Defeat ........................... 17.00 53.00 22.00 5.00 2.00 1.00 Procurement, Defense-Wide ............................... 20.00 35.00 23.00 12.60 6.00 2.40 1.00 National Guard and Reserve Equipment ............. 1.30 15.00 30.80 25.50 16.90 7.00 2.50 1.00 Defense Production Act Purchases ..................... 55.00 20.00 15.00 5.00 5.00
Research, Development, Test, and EvaluationRDT&E, Army ...................................................... 35.27 38.96 15.39 4.64 3.30 1.22 1.22 RDT&E, Navy ...................................................... 31.46 51.26 9.42 4.28 1.14 1.00 1.44 RDT&E, Air Force ................................................ 48.73 37.81 9.19 1.28 1.17 0.75 1.07 RDT&E, Defense-Wide ....................................... 46.75 40.96 8.01 1.53 1.13 0.72 0.90 Operational Test and Evaluation ......................... 50.00 39.30 4.60 2.80 1.40 0.90 1.00
Table 5-11: OUTLAY RATES FOR INCREMENTAL CHANGES IN BUDGET AUTHORITY PURCHASES (Continued)(As Percent of BA Purchases; Excludes Pay and Fuel Factors)
Appropriation Account
71
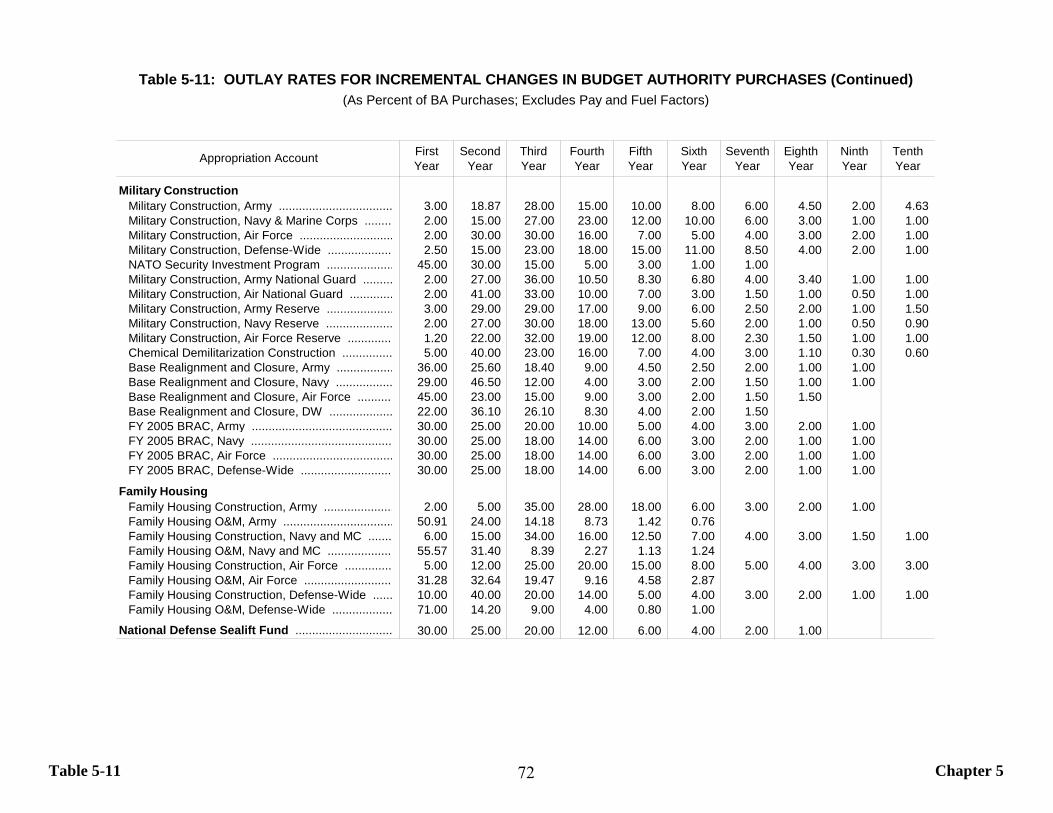
Table 5-11 Chapter 5
First Year
Second Year
Third Year
Fourth Year
FifthYear
Sixth Year
Seventh Year
Eighth Year
Ninth Year
Tenth Year
Military ConstructionMilitary Construction, Army .................................. 3.00 18.87 28.00 15.00 10.00 8.00 6.00 4.50 2.00 4.63 Military Construction, Navy & Marine Corps ........ 2.00 15.00 27.00 23.00 12.00 10.00 6.00 3.00 1.00 1.00 Military Construction, Air Force ............................ 2.00 30.00 30.00 16.00 7.00 5.00 4.00 3.00 2.00 1.00 Military Construction, Defense-Wide ................... 2.50 15.00 23.00 18.00 15.00 11.00 8.50 4.00 2.00 1.00 NATO Security Investment Program .................... 45.00 30.00 15.00 5.00 3.00 1.00 1.00 Military Construction, Army National Guard ......... 2.00 27.00 36.00 10.50 8.30 6.80 4.00 3.40 1.00 1.00 Military Construction, Air National Guard ............. 2.00 41.00 33.00 10.00 7.00 3.00 1.50 1.00 0.50 1.00 Military Construction, Army Reserve .................... 3.00 29.00 29.00 17.00 9.00 6.00 2.50 2.00 1.00 1.50 Military Construction, Navy Reserve .................... 2.00 27.00 30.00 18.00 13.00 5.60 2.00 1.00 0.50 0.90 Military Construction, Air Force Reserve ............. 1.20 22.00 32.00 19.00 12.00 8.00 2.30 1.50 1.00 1.00 Chemical Demilitarization Construction ............... 5.00 40.00 23.00 16.00 7.00 4.00 3.00 1.10 0.30 0.60 Base Realignment and Closure, Army ................. 36.00 25.60 18.40 9.00 4.50 2.50 2.00 1.00 1.00 Base Realignment and Closure, Navy ................. 29.00 46.50 12.00 4.00 3.00 2.00 1.50 1.00 1.00 Base Realignment and Closure, Air Force ........... 45.00 23.00 15.00 9.00 3.00 2.00 1.50 1.50 Base Realignment and Closure, DW ................... 22.00 36.10 26.10 8.30 4.00 2.00 1.50 FY 2005 BRAC, Army .......................................... 30.00 25.00 20.00 10.00 5.00 4.00 3.00 2.00 1.00 FY 2005 BRAC, Navy .......................................... 30.00 25.00 18.00 14.00 6.00 3.00 2.00 1.00 1.00 FY 2005 BRAC, Air Force .................................... 30.00 25.00 18.00 14.00 6.00 3.00 2.00 1.00 1.00 FY 2005 BRAC, Defense-Wide ........................... 30.00 25.00 18.00 14.00 6.00 3.00 2.00 1.00 1.00
Family HousingFamily Housing Construction, Army ..................... 2.00 5.00 35.00 28.00 18.00 6.00 3.00 2.00 1.00 Family Housing O&M, Army ................................. 50.91 24.00 14.18 8.73 1.42 0.76 Family Housing Construction, Navy and MC ....... 6.00 15.00 34.00 16.00 12.50 7.00 4.00 3.00 1.50 1.00 Family Housing O&M, Navy and MC ................... 55.57 31.40 8.39 2.27 1.13 1.24 Family Housing Construction, Air Force .............. 5.00 12.00 25.00 20.00 15.00 8.00 5.00 4.00 3.00 3.00 Family Housing O&M, Air Force .......................... 31.28 32.64 19.47 9.16 4.58 2.87 Family Housing Construction, Defense-Wide ...... 10.00 40.00 20.00 14.00 5.00 4.00 3.00 2.00 1.00 1.00 Family Housing O&M, Defense-Wide .................. 71.00 14.20 9.00 4.00 0.80 1.00
National Defense Sealift Fund ............................. 30.00 25.00 20.00 12.00 6.00 4.00 2.00 1.00
Table 5-11: OUTLAY RATES FOR INCREMENTAL CHANGES IN BUDGET AUTHORITY PURCHASES (Continued)(As Percent of BA Purchases; Excludes Pay and Fuel Factors)
Appropriation Account
72
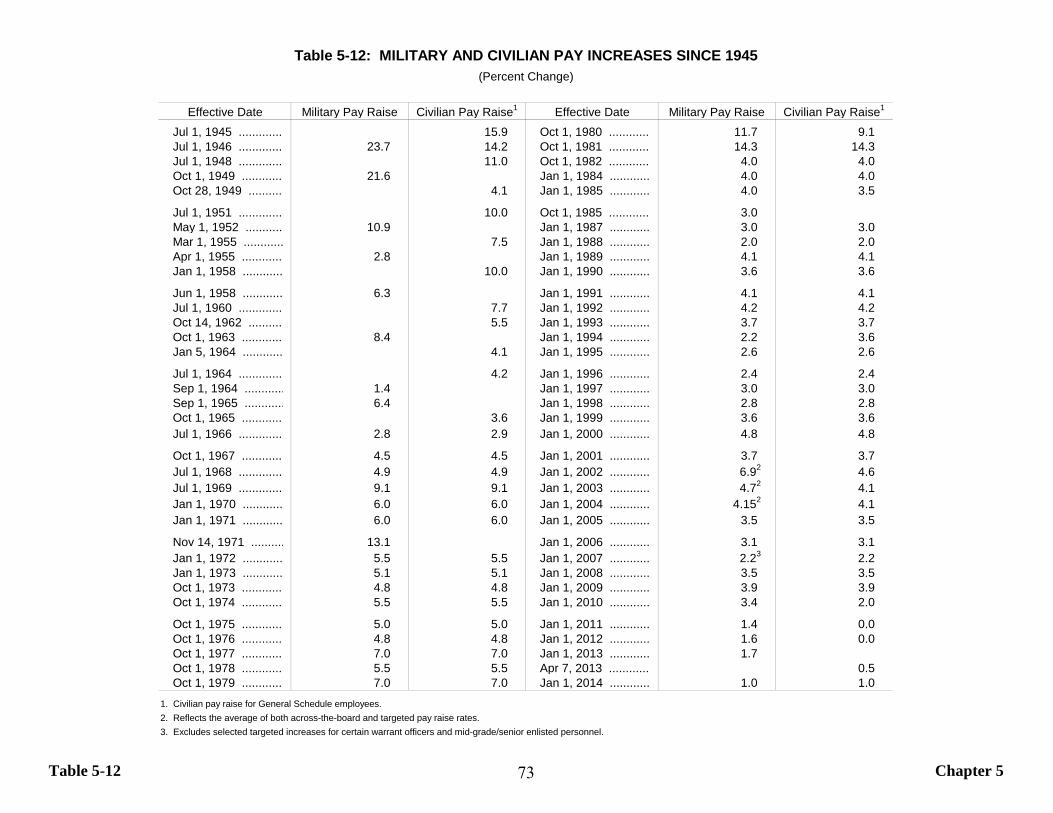
Table 5-12 Chapter 5
Military Pay Raise Civilian Pay Raise1 Military Pay Raise Civilian Pay Raise1
Jul 1, 1945 ............. 15.9 Oct 1, 1980 ............. 11.7 9.1 Jul 1, 1946 ............. 23.7 14.2 Oct 1, 1981 ............. 14.3 14.3 Jul 1, 1948 ............. 11.0 Oct 1, 1982 ............. 4.0 4.0 Oct 1, 1949 ............. 21.6 Jan 1, 1984 ............ 4.0 4.0 Oct 28, 1949 ........... 4.1 Jan 1, 1985 ............ 4.0 3.5
Jul 1, 1951 ............. 10.0 Oct 1, 1985 ............. 3.0 May 1, 1952 ........... 10.9 Jan 1, 1987 ............ 3.0 3.0 Mar 1, 1955 ............ 7.5 Jan 1, 1988 ............ 2.0 2.0 Apr 1, 1955 ............. 2.8 Jan 1, 1989 ............ 4.1 4.1 Jan 1, 1958 ............ 10.0 Jan 1, 1990 ............ 3.6 3.6
Jun 1, 1958 ............ 6.3 Jan 1, 1991 ............ 4.1 4.1 Jul 1, 1960 ............. 7.7 Jan 1, 1992 ............ 4.2 4.2 Oct 14, 1962 ........... 5.5 Jan 1, 1993 ............ 3.7 3.7 Oct 1, 1963 ............. 8.4 Jan 1, 1994 ............ 2.2 3.6 Jan 5, 1964 ............ 4.1 Jan 1, 1995 ............ 2.6 2.6
Jul 1, 1964 ............. 4.2 Jan 1, 1996 ............ 2.4 2.4 Sep 1, 1964 ............ 1.4 Jan 1, 1997 ............ 3.0 3.0 Sep 1, 1965 ............ 6.4 Jan 1, 1998 ............ 2.8 2.8 Oct 1, 1965 ............. 3.6 Jan 1, 1999 ............ 3.6 3.6 Jul 1, 1966 ............. 2.8 2.9 Jan 1, 2000 ............ 4.8 4.8
Oct 1, 1967 ............. 4.5 4.5 Jan 1, 2001 ............ 3.7 3.7 Jul 1, 1968 ............. 4.9 4.9 Jan 1, 2002 ............ 6.92 4.6 Jul 1, 1969 ............. 9.1 9.1 Jan 1, 2003 ............ 4.72 4.1 Jan 1, 1970 ............ 6.0 6.0 Jan 1, 2004 ............ 4.152 4.1 Jan 1, 1971 ............ 6.0 6.0 Jan 1, 2005 ............ 3.5 3.5
Nov 14, 1971 .......... 13.1 Jan 1, 2006 ............ 3.1 3.1 Jan 1, 1972 ............ 5.5 5.5 Jan 1, 2007 ............ 2.23 2.2 Jan 1, 1973 ............ 5.1 5.1 Jan 1, 2008 ............ 3.5 3.5 Oct 1, 1973 ............. 4.8 4.8 Jan 1, 2009 ............ 3.9 3.9 Oct 1, 1974 ............. 5.5 5.5 Jan 1, 2010 ............ 3.4 2.0
Oct 1, 1975 ............. 5.0 5.0 Jan 1, 2011 ............ 1.4 0.0 Oct 1, 1976 ............. 4.8 4.8 Jan 1, 2012 ............ 1.6 0.0 Oct 1, 1977 ............. 7.0 7.0 Jan 1, 2013 ............ 1.7 Oct 1, 1978 ............. 5.5 5.5 Apr 7, 2013 ............. 0.5 Oct 1, 1979 ............. 7.0 7.0 Jan 1, 2014 ............ 1.0 1.0
1. Civilian pay raise for General Schedule employees.2. Reflects the average of both across-the-board and targeted pay raise rates.3. Excludes selected targeted increases for certain warrant officers and mid-grade/senior enlisted personnel.
Table 5-12: MILITARY AND CIVILIAN PAY INCREASES SINCE 1945
Effective DateEffective Date
(Percent Change)
73
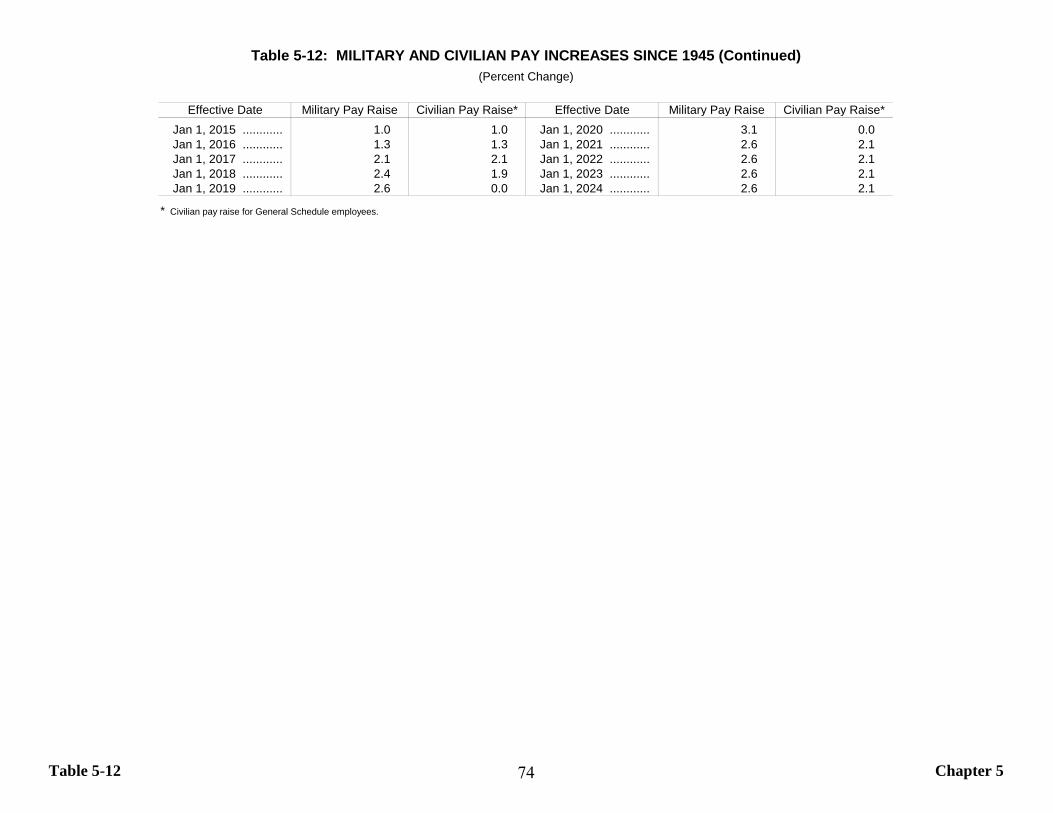
Table 5-12 Chapter 5
Military Pay Raise Civilian Pay Raise* Military Pay Raise Civilian Pay Raise*Jan 1, 2015 ............ 1.0 1.0 Jan 1, 2020 ............ 3.1 0.0 Jan 1, 2016 ............ 1.3 1.3 Jan 1, 2021 ............ 2.6 2.1 Jan 1, 2017 ............ 2.1 2.1 Jan 1, 2022 ............ 2.6 2.1 Jan 1, 2018 ............ 2.4 1.9 Jan 1, 2023 ............ 2.6 2.1 Jan 1, 2019 ............ 2.6 0.0 Jan 1, 2024 ............ 2.6 2.1
* Civilian pay raise for General Schedule employees.
Table 5-12: MILITARY AND CIVILIAN PAY INCREASES SINCE 1945 (Continued)(Percent Change)
Effective Date Effective Date
74
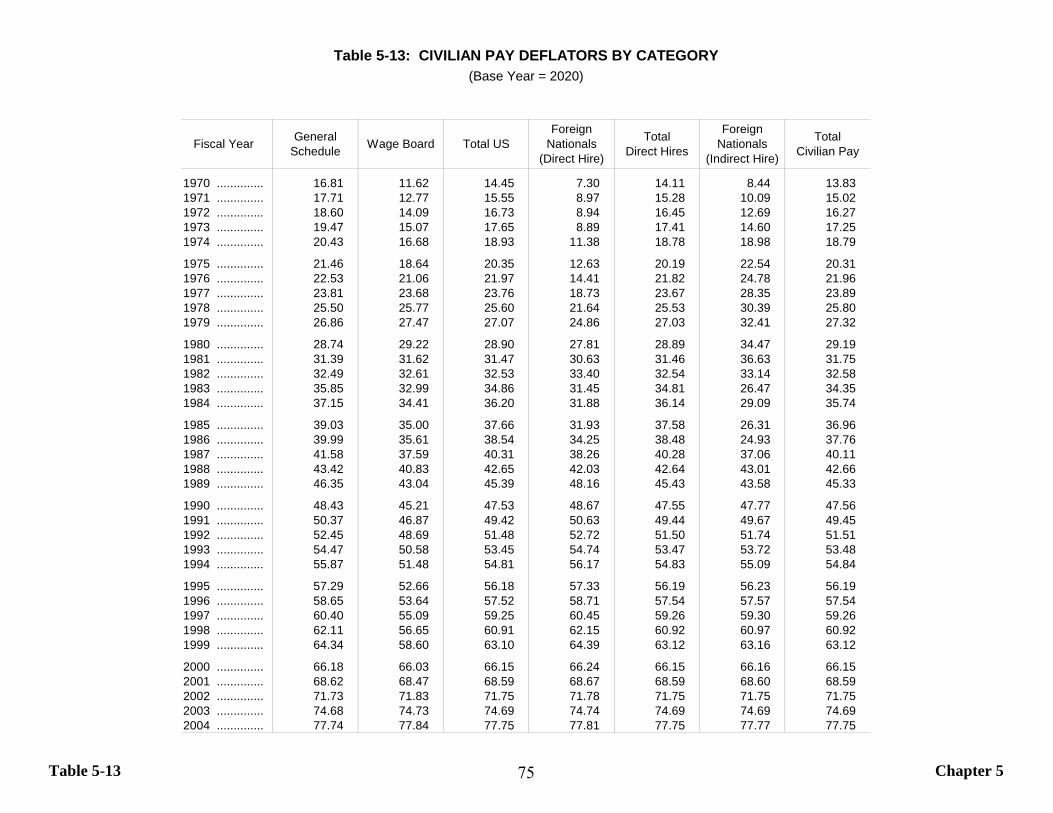
Table 5-13 Chapter 5
Fiscal Year General Schedule Wage Board Total US
ForeignNationals
(Direct Hire)
TotalDirect Hires
Foreign Nationals
(Indirect Hire)
TotalCivilian Pay
1970 ............... 16.81 11.62 14.45 7.30 14.11 8.44 13.831971 ............... 17.71 12.77 15.55 8.97 15.28 10.09 15.021972 ............... 18.60 14.09 16.73 8.94 16.45 12.69 16.271973 ............... 19.47 15.07 17.65 8.89 17.41 14.60 17.251974 ............... 20.43 16.68 18.93 11.38 18.78 18.98 18.79
1975 ............... 21.46 18.64 20.35 12.63 20.19 22.54 20.311976 ............... 22.53 21.06 21.97 14.41 21.82 24.78 21.961977 ............... 23.81 23.68 23.76 18.73 23.67 28.35 23.891978 ............... 25.50 25.77 25.60 21.64 25.53 30.39 25.801979 ............... 26.86 27.47 27.07 24.86 27.03 32.41 27.32
1980 ............... 28.74 29.22 28.90 27.81 28.89 34.47 29.191981 ............... 31.39 31.62 31.47 30.63 31.46 36.63 31.751982 ............... 32.49 32.61 32.53 33.40 32.54 33.14 32.581983 ............... 35.85 32.99 34.86 31.45 34.81 26.47 34.351984 ............... 37.15 34.41 36.20 31.88 36.14 29.09 35.74
1985 ............... 39.03 35.00 37.66 31.93 37.58 26.31 36.961986 ............... 39.99 35.61 38.54 34.25 38.48 24.93 37.761987 ............... 41.58 37.59 40.31 38.26 40.28 37.06 40.111988 ............... 43.42 40.83 42.65 42.03 42.64 43.01 42.661989 ............... 46.35 43.04 45.39 48.16 45.43 43.58 45.33
1990 ............... 48.43 45.21 47.53 48.67 47.55 47.77 47.561991 ............... 50.37 46.87 49.42 50.63 49.44 49.67 49.451992 ............... 52.45 48.69 51.48 52.72 51.50 51.74 51.511993 ............... 54.47 50.58 53.45 54.74 53.47 53.72 53.481994 ............... 55.87 51.48 54.81 56.17 54.83 55.09 54.84
1995 ............... 57.29 52.66 56.18 57.33 56.19 56.23 56.191996 ............... 58.65 53.64 57.52 58.71 57.54 57.57 57.541997 ............... 60.40 55.09 59.25 60.45 59.26 59.30 59.261998 ............... 62.11 56.65 60.91 62.15 60.92 60.97 60.921999 ............... 64.34 58.60 63.10 64.39 63.12 63.16 63.12
2000 ............... 66.18 66.03 66.15 66.24 66.15 66.16 66.152001 ............... 68.62 68.47 68.59 68.67 68.59 68.60 68.592002 ............... 71.73 71.83 71.75 71.78 71.75 71.75 71.752003 ............... 74.68 74.73 74.69 74.74 74.69 74.69 74.692004 ............... 77.74 77.84 77.75 77.81 77.75 77.77 77.75
Table 5-13: CIVILIAN PAY DEFLATORS BY CATEGORY(Base Year = 2020)
75
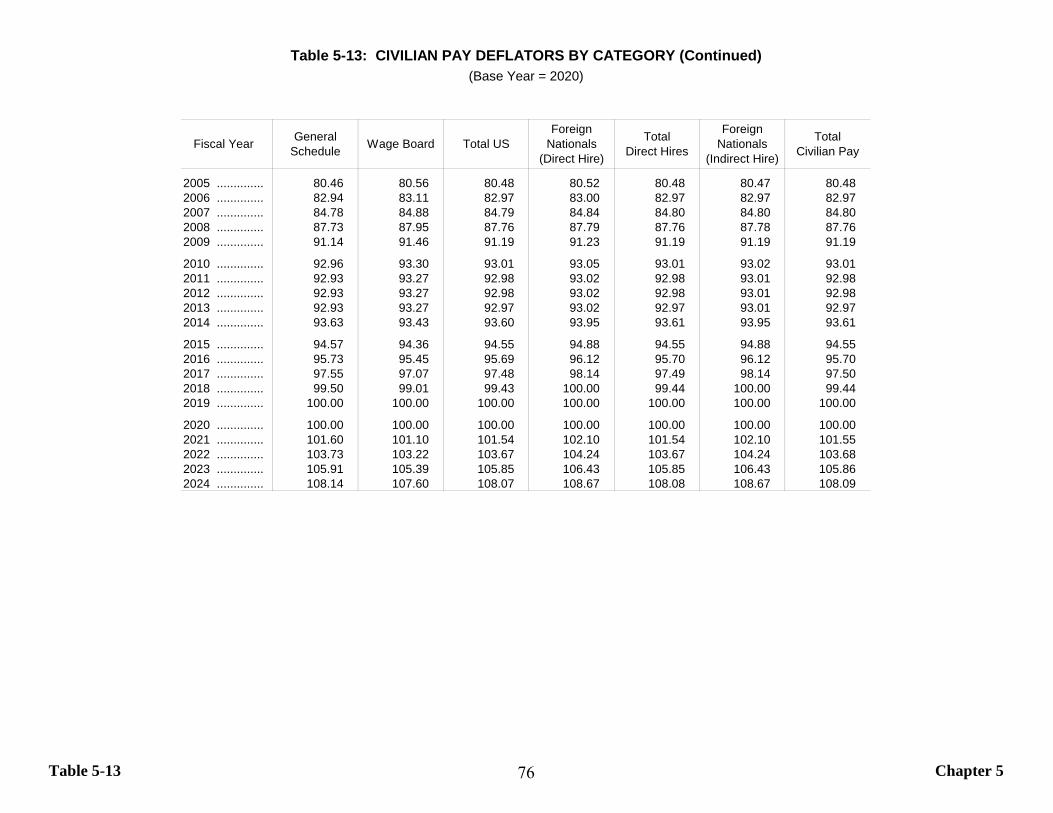
Table 5-13 Chapter 5
Fiscal Year General Schedule Wage Board Total US
ForeignNationals
(Direct Hire)
TotalDirect Hires
Foreign Nationals
(Indirect Hire)
TotalCivilian Pay
2005 ............... 80.46 80.56 80.48 80.52 80.48 80.47 80.482006 ............... 82.94 83.11 82.97 83.00 82.97 82.97 82.972007 ............... 84.78 84.88 84.79 84.84 84.80 84.80 84.802008 ............... 87.73 87.95 87.76 87.79 87.76 87.78 87.762009 ............... 91.14 91.46 91.19 91.23 91.19 91.19 91.19
2010 ............... 92.96 93.30 93.01 93.05 93.01 93.02 93.012011 ............... 92.93 93.27 92.98 93.02 92.98 93.01 92.982012 ............... 92.93 93.27 92.98 93.02 92.98 93.01 92.982013 ............... 92.93 93.27 92.97 93.02 92.97 93.01 92.972014 ............... 93.63 93.43 93.60 93.95 93.61 93.95 93.61
2015 ............... 94.57 94.36 94.55 94.88 94.55 94.88 94.552016 ............... 95.73 95.45 95.69 96.12 95.70 96.12 95.702017 ............... 97.55 97.07 97.48 98.14 97.49 98.14 97.502018 ............... 99.50 99.01 99.43 100.00 99.44 100.00 99.442019 ............... 100.00 100.00 100.00 100.00 100.00 100.00 100.00
2020 ............... 100.00 100.00 100.00 100.00 100.00 100.00 100.002021 ............... 101.60 101.10 101.54 102.10 101.54 102.10 101.552022 ............... 103.73 103.22 103.67 104.24 103.67 104.24 103.682023 ............... 105.91 105.39 105.85 106.43 105.85 106.43 105.862024 ............... 108.14 107.60 108.07 108.67 108.08 108.67 108.09
Table 5-13: CIVILIAN PAY DEFLATORS BY CATEGORY (Continued)(Base Year = 2020)
76
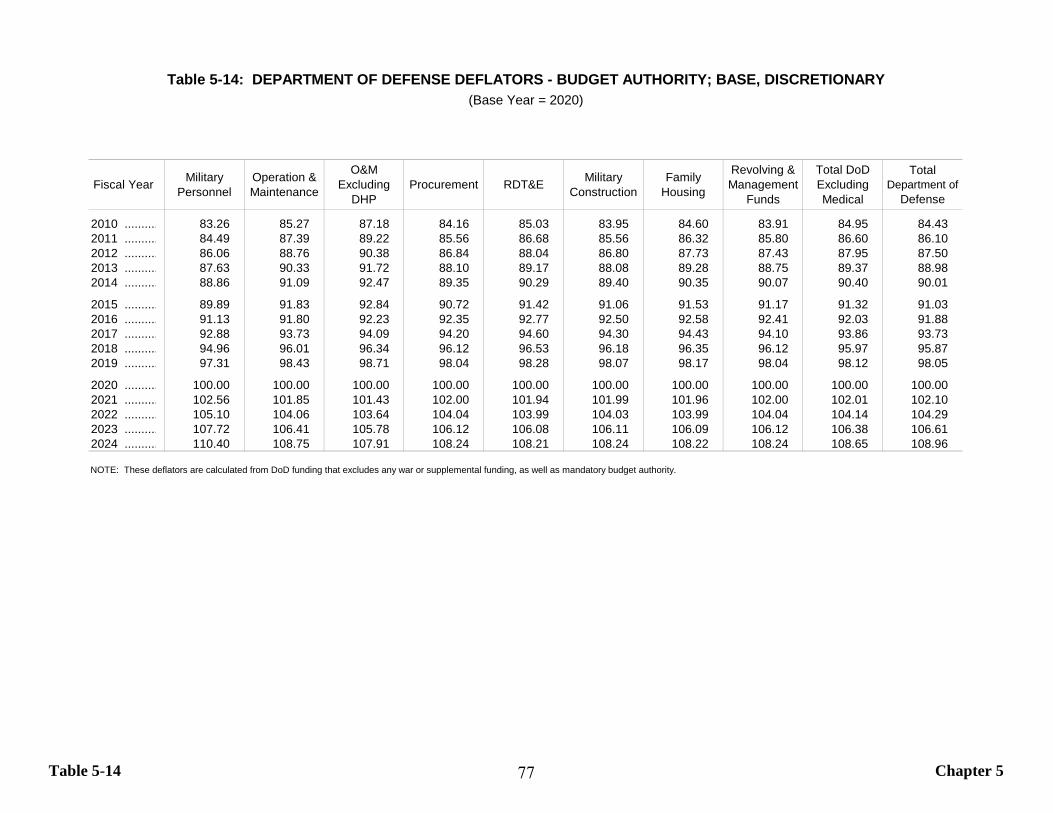
Table 5-14 Chapter 5
Fiscal Year Military Personnel
Operation & Maintenance
O&M Excluding
DHPProcurement RDT&E Military
ConstructionFamily
Housing
Revolving & Management
Funds
Total DoD Excluding Medical
Total Department of
Defense
2010 .......... 83.26 85.27 87.18 84.16 85.03 83.95 84.60 83.91 84.95 84.432011 .......... 84.49 87.39 89.22 85.56 86.68 85.56 86.32 85.80 86.60 86.102012 .......... 86.06 88.76 90.38 86.84 88.04 86.80 87.73 87.43 87.95 87.502013 .......... 87.63 90.33 91.72 88.10 89.17 88.08 89.28 88.75 89.37 88.982014 .......... 88.86 91.09 92.47 89.35 90.29 89.40 90.35 90.07 90.40 90.01
2015 .......... 89.89 91.83 92.84 90.72 91.42 91.06 91.53 91.17 91.32 91.032016 .......... 91.13 91.80 92.23 92.35 92.77 92.50 92.58 92.41 92.03 91.882017 .......... 92.88 93.73 94.09 94.20 94.60 94.30 94.43 94.10 93.86 93.732018 .......... 94.96 96.01 96.34 96.12 96.53 96.18 96.35 96.12 95.97 95.872019 .......... 97.31 98.43 98.71 98.04 98.28 98.07 98.17 98.04 98.12 98.05
2020 .......... 100.00 100.00 100.00 100.00 100.00 100.00 100.00 100.00 100.00 100.002021 .......... 102.56 101.85 101.43 102.00 101.94 101.99 101.96 102.00 102.01 102.102022 .......... 105.10 104.06 103.64 104.04 103.99 104.03 103.99 104.04 104.14 104.292023 .......... 107.72 106.41 105.78 106.12 106.08 106.11 106.09 106.12 106.38 106.612024 .......... 110.40 108.75 107.91 108.24 108.21 108.24 108.22 108.24 108.65 108.96
NOTE: These deflators are calculated from DoD funding that excludes any war or supplemental funding, as well as mandatory budget authority.
Table 5-14: DEPARTMENT OF DEFENSE DEFLATORS - BUDGET AUTHORITY; BASE, DISCRETIONARY(Base Year = 2020)
77
This Page Intentionally Left Blank
78
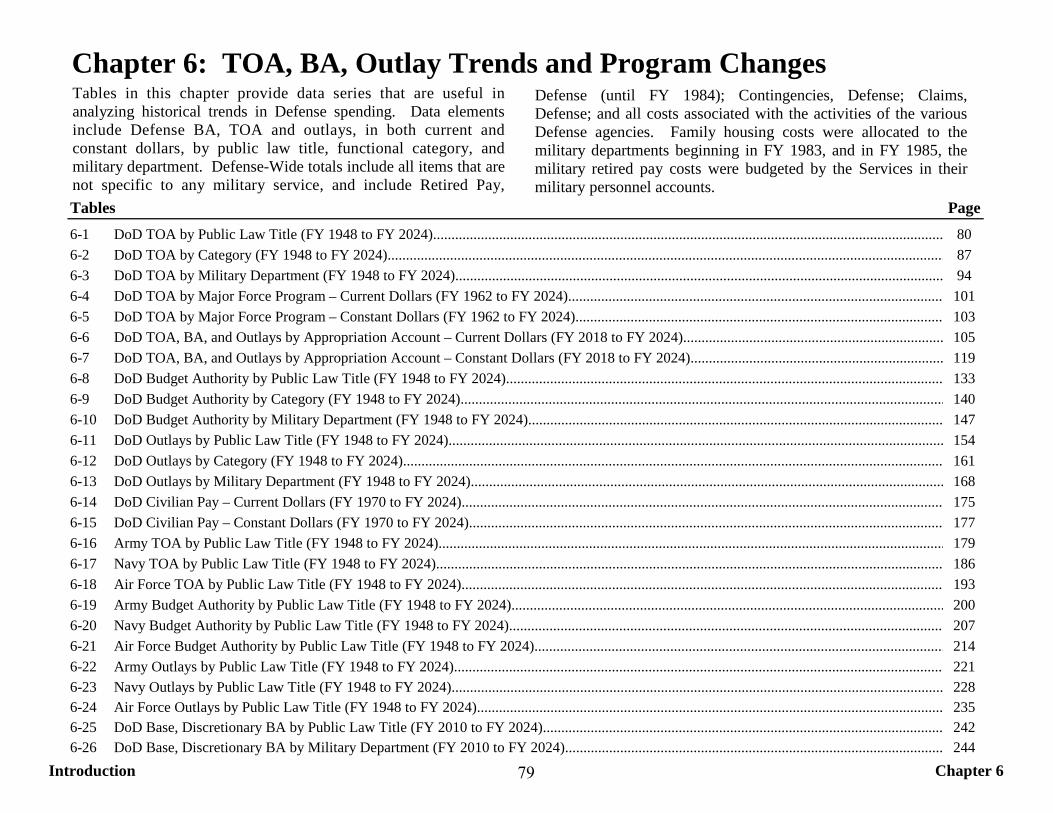
Introduction Chapter 6
Chapter 6: TOA, BA, Outlay Trends and Program Changes
Tables Page6-1 DoD TOA by Public Law Title (FY 1948 to FY 2024)........................................................................................................................................... 806-2 DoD TOA by Category (FY 1948 to FY 2024)........................................................................................................................................................ 876-3 DoD TOA by Military Department (FY 1948 to FY 2024)..................................................................................................................................... 946-4 DoD TOA by Major Force Program – Current Dollars (FY 1962 to FY 2024)...................................................................................................... 1016-5 DoD TOA by Major Force Program – Constant Dollars (FY 1962 to FY 2024).................................................................................................... 1036-6 DoD TOA, BA, and Outlays by Appropriation Account – Current Dollars (FY 2018 to FY 2024)....................................................................... 1056-7 DoD TOA, BA, and Outlays by Appropriation Account – Constant Dollars (FY 2018 to FY 2024)..................................................................... 1196-8 DoD Budget Authority by Public Law Title (FY 1948 to FY 2024)....................................................................................................................... 1336-9 DoD Budget Authority by Category (FY 1948 to FY 2024).................................................................................................................................... 1406-10 DoD Budget Authority by Military Department (FY 1948 to FY 2024)................................................................................................................. 1476-11 DoD Outlays by Public Law Title (FY 1948 to FY 2024)....................................................................................................................................... 1546-12 DoD Outlays by Category (FY 1948 to FY 2024)................................................................................................................................................... 1616-13 DoD Outlays by Military Department (FY 1948 to FY 2024)................................................................................................................................. 1686-14 DoD Civilian Pay – Current Dollars (FY 1970 to FY 2024)................................................................................................................................... 1756-15 DoD Civilian Pay – Constant Dollars (FY 1970 to FY 2024)................................................................................................................................. 1776-16 Army TOA by Public Law Title (FY 1948 to FY 2024).......................................................................................................................................... 1796-17 Navy TOA by Public Law Title (FY 1948 to FY 2024).......................................................................................................................................... 1866-18 Air Force TOA by Public Law Title (FY 1948 to FY 2024)................................................................................................................................... 1936-19 Army Budget Authority by Public Law Title (FY 1948 to FY 2024)...................................................................................................................... 2006-20 Navy Budget Authority by Public Law Title (FY 1948 to FY 2024)....................................................................................................................... 2076-21 Air Force Budget Authority by Public Law Title (FY 1948 to FY 2024)................................................................................................................ 2146-22 Army Outlays by Public Law Title (FY 1948 to FY 2024)...................................................................................................................................... 2216-23 Navy Outlays by Public Law Title (FY 1948 to FY 2024)...................................................................................................................................... 2286-24 Air Force Outlays by Public Law Title (FY 1948 to FY 2024)............................................................................................................................... 2356-25 DoD Base, Discretionary BA by Public Law Title (FY 2010 to FY 2024)............................................................................................................. 2426-26 DoD Base, Discretionary BA by Military Department (FY 2010 to FY 2024)....................................................................................................... 244
Tables in this chapter provide data series that are useful inanalyzing historical trends in Defense spending. Data elementsinclude Defense BA, TOA and outlays, in both current andconstant dollars, by public law title, functional category, andmilitary department. Defense-Wide totals include all items that arenot specific to any military service, and include Retired Pay,
Defense (until FY 1984); Contingencies, Defense; Claims,Defense; and all costs associated with the activities of the variousDefense agencies. Family housing costs were allocated to themilitary departments beginning in FY 1983, and in FY 1985, themilitary retired pay costs were budgeted by the Services in theirmilitary personnel accounts.
79
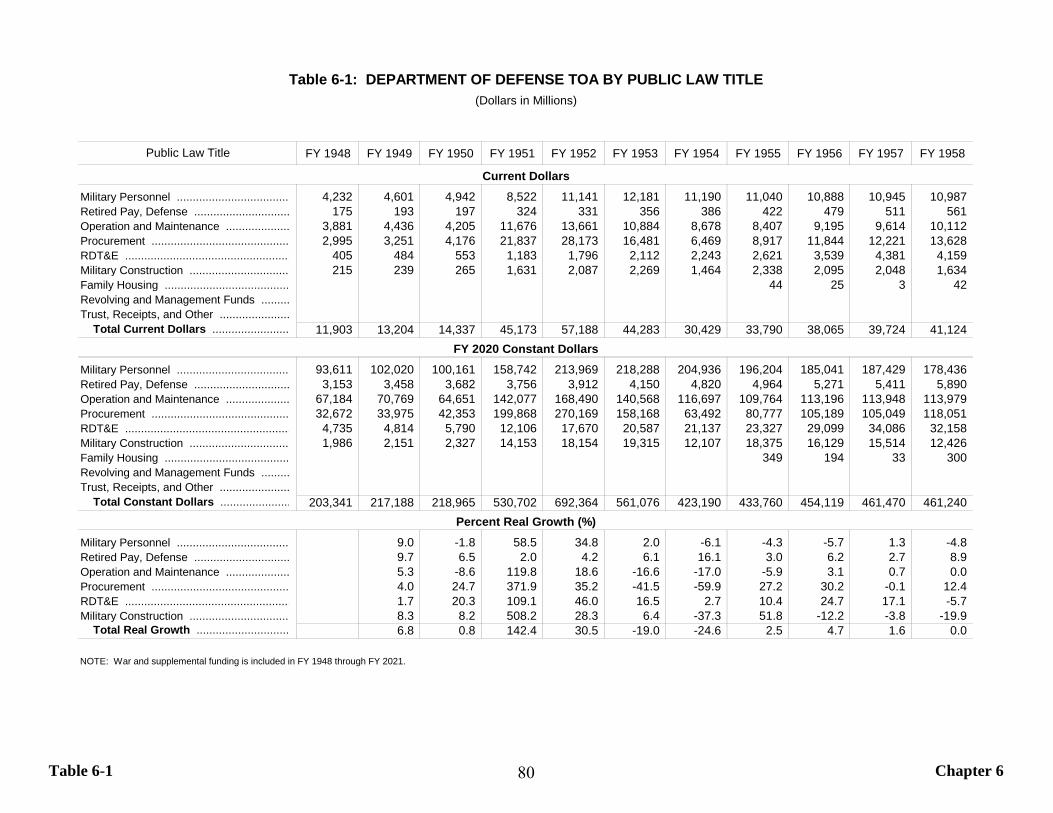
Table 6-1 Chapter 6
FY 1948 FY 1949 FY 1950 FY 1951 FY 1952 FY 1953 FY 1954 FY 1955 FY 1956 FY 1957 FY 1958
Military Personnel ................................... 4,232 4,601 4,942 8,522 11,141 12,181 11,190 11,040 10,888 10,945 10,987 Retired Pay, Defense .............................. 175 193 197 324 331 356 386 422 479 511 561 Operation and Maintenance .................... 3,881 4,436 4,205 11,676 13,661 10,884 8,678 8,407 9,195 9,614 10,112 Procurement ........................................... 2,995 3,251 4,176 21,837 28,173 16,481 6,469 8,917 11,844 12,221 13,628 RDT&E .................................................... 405 484 553 1,183 1,796 2,112 2,243 2,621 3,539 4,381 4,159 Military Construction ............................... 215 239 265 1,631 2,087 2,269 1,464 2,338 2,095 2,048 1,634 Family Housing ....................................... 44 25 3 42 Revolving and Management Funds ......... Trust, Receipts, and Other ......................
Total Current Dollars ........................ 11,903 13,204 14,337 45,173 57,188 44,283 30,429 33,790 38,065 39,724 41,124
Military Personnel ................................... 93,611 102,020 100,161 158,742 213,969 218,288 204,936 196,204 185,041 187,429 178,436 Retired Pay, Defense .............................. 3,153 3,458 3,682 3,756 3,912 4,150 4,820 4,964 5,271 5,411 5,890 Operation and Maintenance .................... 67,184 70,769 64,651 142,077 168,490 140,568 116,697 109,764 113,196 113,948 113,979 Procurement ........................................... 32,672 33,975 42,353 199,868 270,169 158,168 63,492 80,777 105,189 105,049 118,051 RDT&E .................................................... 4,735 4,814 5,790 12,106 17,670 20,587 21,137 23,327 29,099 34,086 32,158 Military Construction ............................... 1,986 2,151 2,327 14,153 18,154 19,315 12,107 18,375 16,129 15,514 12,426 Family Housing ....................................... 349 194 33 300 Revolving and Management Funds ......... Trust, Receipts, and Other ......................
Total Constant Dollars ...................... 203,341 217,188 218,965 530,702 692,364 561,076 423,190 433,760 454,119 461,470 461,240
Military Personnel ................................... 9.0 -1.8 58.5 34.8 2.0 -6.1 -4.3 -5.7 1.3 -4.8 Retired Pay, Defense .............................. 9.7 6.5 2.0 4.2 6.1 16.1 3.0 6.2 2.7 8.9 Operation and Maintenance .................... 5.3 -8.6 119.8 18.6 -16.6 -17.0 -5.9 3.1 0.7 0.0 Procurement ........................................... 4.0 24.7 371.9 35.2 -41.5 -59.9 27.2 30.2 -0.1 12.4 RDT&E .................................................... 1.7 20.3 109.1 46.0 16.5 2.7 10.4 24.7 17.1 -5.7 Military Construction ............................... 8.3 8.2 508.2 28.3 6.4 -37.3 51.8 -12.2 -3.8 -19.9
Total Real Growth ............................. 6.8 0.8 142.4 30.5 -19.0 -24.6 2.5 4.7 1.6 0.0
NOTE: War and supplemental funding is included in FY 1948 through FY 2021.
Percent Real Growth (%)
Table 6-1: DEPARTMENT OF DEFENSE TOA BY PUBLIC LAW TITLE(Dollars in Millions)
Public Law Title
Current Dollars
FY 2020 Constant Dollars
80
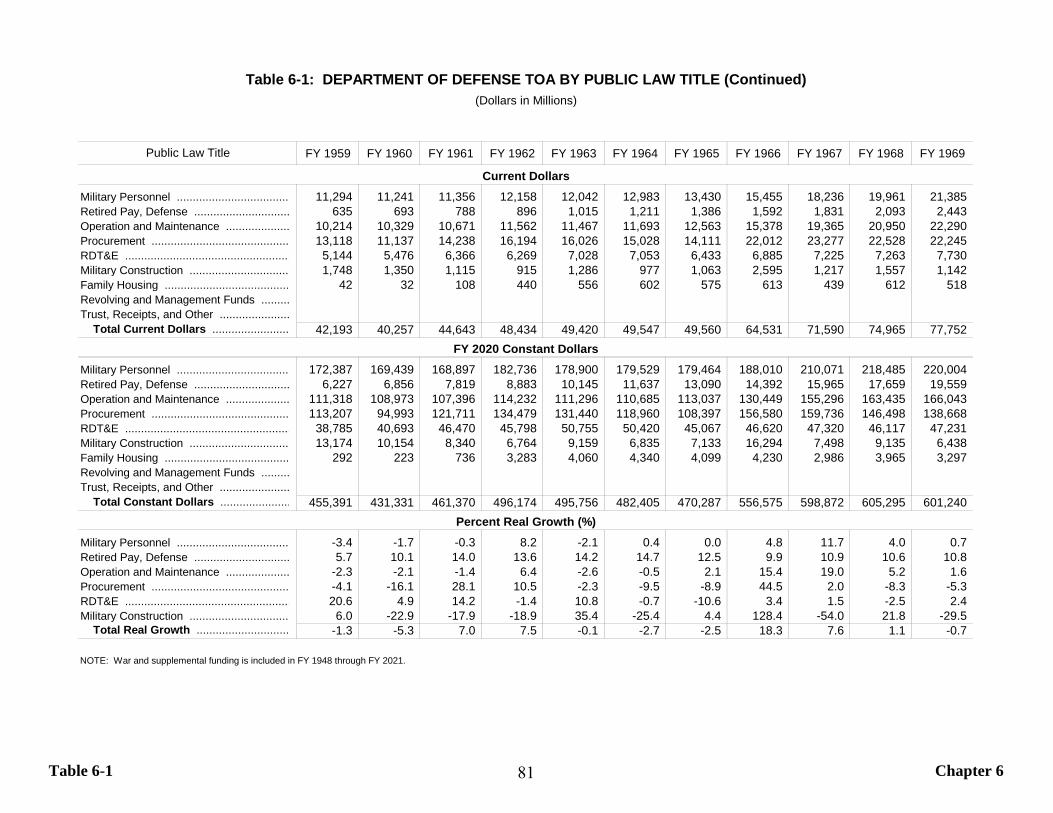
Table 6-1 Chapter 6
FY 1959 FY 1960 FY 1961 FY 1962 FY 1963 FY 1964 FY 1965 FY 1966 FY 1967 FY 1968 FY 1969
Military Personnel ................................... 11,294 11,241 11,356 12,158 12,042 12,983 13,430 15,455 18,236 19,961 21,385 Retired Pay, Defense .............................. 635 693 788 896 1,015 1,211 1,386 1,592 1,831 2,093 2,443 Operation and Maintenance .................... 10,214 10,329 10,671 11,562 11,467 11,693 12,563 15,378 19,365 20,950 22,290 Procurement ........................................... 13,118 11,137 14,238 16,194 16,026 15,028 14,111 22,012 23,277 22,528 22,245 RDT&E .................................................... 5,144 5,476 6,366 6,269 7,028 7,053 6,433 6,885 7,225 7,263 7,730 Military Construction ............................... 1,748 1,350 1,115 915 1,286 977 1,063 2,595 1,217 1,557 1,142 Family Housing ....................................... 42 32 108 440 556 602 575 613 439 612 518 Revolving and Management Funds ......... Trust, Receipts, and Other ......................
Total Current Dollars ........................ 42,193 40,257 44,643 48,434 49,420 49,547 49,560 64,531 71,590 74,965 77,752
Military Personnel ................................... 172,387 169,439 168,897 182,736 178,900 179,529 179,464 188,010 210,071 218,485 220,004 Retired Pay, Defense .............................. 6,227 6,856 7,819 8,883 10,145 11,637 13,090 14,392 15,965 17,659 19,559 Operation and Maintenance .................... 111,318 108,973 107,396 114,232 111,296 110,685 113,037 130,449 155,296 163,435 166,043 Procurement ........................................... 113,207 94,993 121,711 134,479 131,440 118,960 108,397 156,580 159,736 146,498 138,668 RDT&E .................................................... 38,785 40,693 46,470 45,798 50,755 50,420 45,067 46,620 47,320 46,117 47,231 Military Construction ............................... 13,174 10,154 8,340 6,764 9,159 6,835 7,133 16,294 7,498 9,135 6,438 Family Housing ....................................... 292 223 736 3,283 4,060 4,340 4,099 4,230 2,986 3,965 3,297 Revolving and Management Funds ......... Trust, Receipts, and Other ......................
Total Constant Dollars ...................... 455,391 431,331 461,370 496,174 495,756 482,405 470,287 556,575 598,872 605,295 601,240
Military Personnel ................................... -3.4 -1.7 -0.3 8.2 -2.1 0.4 0.0 4.8 11.7 4.0 0.7 Retired Pay, Defense .............................. 5.7 10.1 14.0 13.6 14.2 14.7 12.5 9.9 10.9 10.6 10.8 Operation and Maintenance .................... -2.3 -2.1 -1.4 6.4 -2.6 -0.5 2.1 15.4 19.0 5.2 1.6 Procurement ........................................... -4.1 -16.1 28.1 10.5 -2.3 -9.5 -8.9 44.5 2.0 -8.3 -5.3 RDT&E .................................................... 20.6 4.9 14.2 -1.4 10.8 -0.7 -10.6 3.4 1.5 -2.5 2.4 Military Construction ............................... 6.0 -22.9 -17.9 -18.9 35.4 -25.4 4.4 128.4 -54.0 21.8 -29.5
Total Real Growth ............................. -1.3 -5.3 7.0 7.5 -0.1 -2.7 -2.5 18.3 7.6 1.1 -0.7
NOTE: War and supplemental funding is included in FY 1948 through FY 2021.
Percent Real Growth (%)
Table 6-1: DEPARTMENT OF DEFENSE TOA BY PUBLIC LAW TITLE (Continued)(Dollars in Millions)
Public Law Title
Current Dollars
FY 2020 Constant Dollars
81
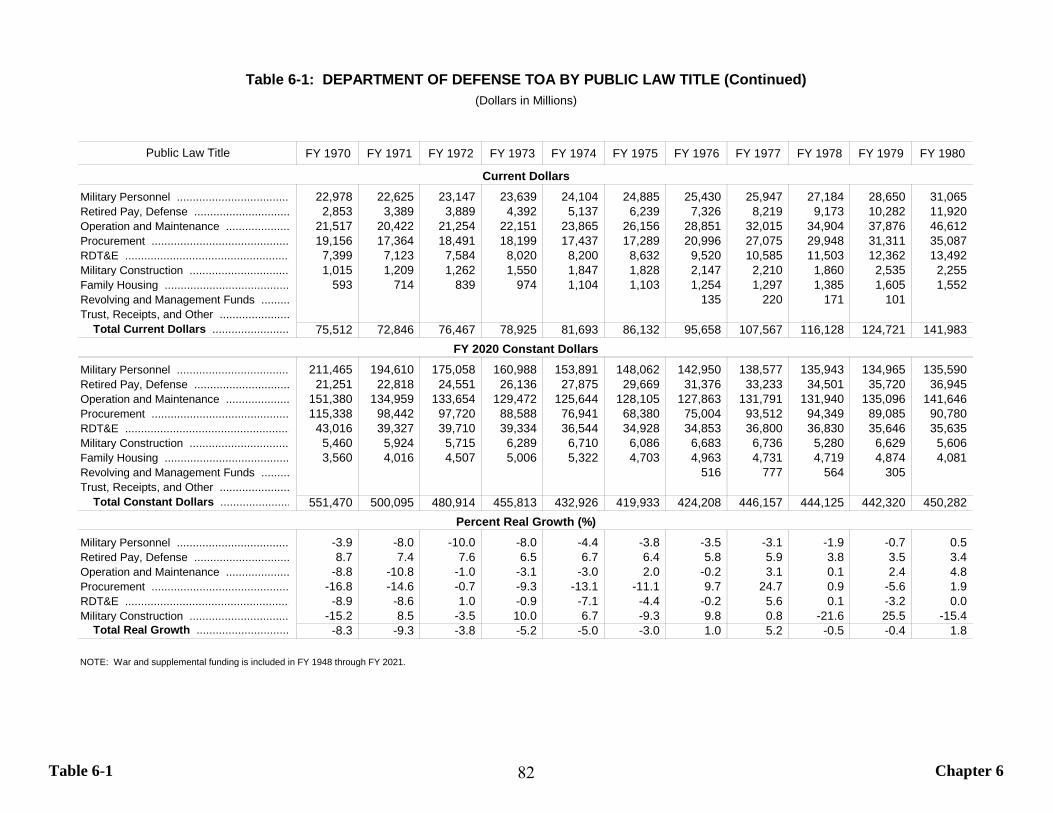
Table 6-1 Chapter 6
FY 1970 FY 1971 FY 1972 FY 1973 FY 1974 FY 1975 FY 1976 FY 1977 FY 1978 FY 1979 FY 1980
Military Personnel ................................... 22,978 22,625 23,147 23,639 24,104 24,885 25,430 25,947 27,184 28,650 31,065 Retired Pay, Defense .............................. 2,853 3,389 3,889 4,392 5,137 6,239 7,326 8,219 9,173 10,282 11,920 Operation and Maintenance .................... 21,517 20,422 21,254 22,151 23,865 26,156 28,851 32,015 34,904 37,876 46,612 Procurement ........................................... 19,156 17,364 18,491 18,199 17,437 17,289 20,996 27,075 29,948 31,311 35,087 RDT&E .................................................... 7,399 7,123 7,584 8,020 8,200 8,632 9,520 10,585 11,503 12,362 13,492 Military Construction ............................... 1,015 1,209 1,262 1,550 1,847 1,828 2,147 2,210 1,860 2,535 2,255 Family Housing ....................................... 593 714 839 974 1,104 1,103 1,254 1,297 1,385 1,605 1,552 Revolving and Management Funds ......... 135 220 171 101 Trust, Receipts, and Other ......................
Total Current Dollars ........................ 75,512 72,846 76,467 78,925 81,693 86,132 95,658 107,567 116,128 124,721 141,983
Military Personnel ................................... 211,465 194,610 175,058 160,988 153,891 148,062 142,950 138,577 135,943 134,965 135,590 Retired Pay, Defense .............................. 21,251 22,818 24,551 26,136 27,875 29,669 31,376 33,233 34,501 35,720 36,945 Operation and Maintenance .................... 151,380 134,959 133,654 129,472 125,644 128,105 127,863 131,791 131,940 135,096 141,646 Procurement ........................................... 115,338 98,442 97,720 88,588 76,941 68,380 75,004 93,512 94,349 89,085 90,780 RDT&E .................................................... 43,016 39,327 39,710 39,334 36,544 34,928 34,853 36,800 36,830 35,646 35,635 Military Construction ............................... 5,460 5,924 5,715 6,289 6,710 6,086 6,683 6,736 5,280 6,629 5,606 Family Housing ....................................... 3,560 4,016 4,507 5,006 5,322 4,703 4,963 4,731 4,719 4,874 4,081 Revolving and Management Funds ......... 516 777 564 305 Trust, Receipts, and Other ......................
Total Constant Dollars ...................... 551,470 500,095 480,914 455,813 432,926 419,933 424,208 446,157 444,125 442,320 450,282
Military Personnel ................................... -3.9 -8.0 -10.0 -8.0 -4.4 -3.8 -3.5 -3.1 -1.9 -0.7 0.5 Retired Pay, Defense .............................. 8.7 7.4 7.6 6.5 6.7 6.4 5.8 5.9 3.8 3.5 3.4 Operation and Maintenance .................... -8.8 -10.8 -1.0 -3.1 -3.0 2.0 -0.2 3.1 0.1 2.4 4.8 Procurement ........................................... -16.8 -14.6 -0.7 -9.3 -13.1 -11.1 9.7 24.7 0.9 -5.6 1.9 RDT&E .................................................... -8.9 -8.6 1.0 -0.9 -7.1 -4.4 -0.2 5.6 0.1 -3.2 0.0 Military Construction ............................... -15.2 8.5 -3.5 10.0 6.7 -9.3 9.8 0.8 -21.6 25.5 -15.4
Total Real Growth ............................. -8.3 -9.3 -3.8 -5.2 -5.0 -3.0 1.0 5.2 -0.5 -0.4 1.8
NOTE: War and supplemental funding is included in FY 1948 through FY 2021.
Percent Real Growth (%)
Table 6-1: DEPARTMENT OF DEFENSE TOA BY PUBLIC LAW TITLE (Continued)(Dollars in Millions)
Public Law Title
Current Dollars
FY 2020 Constant Dollars
82
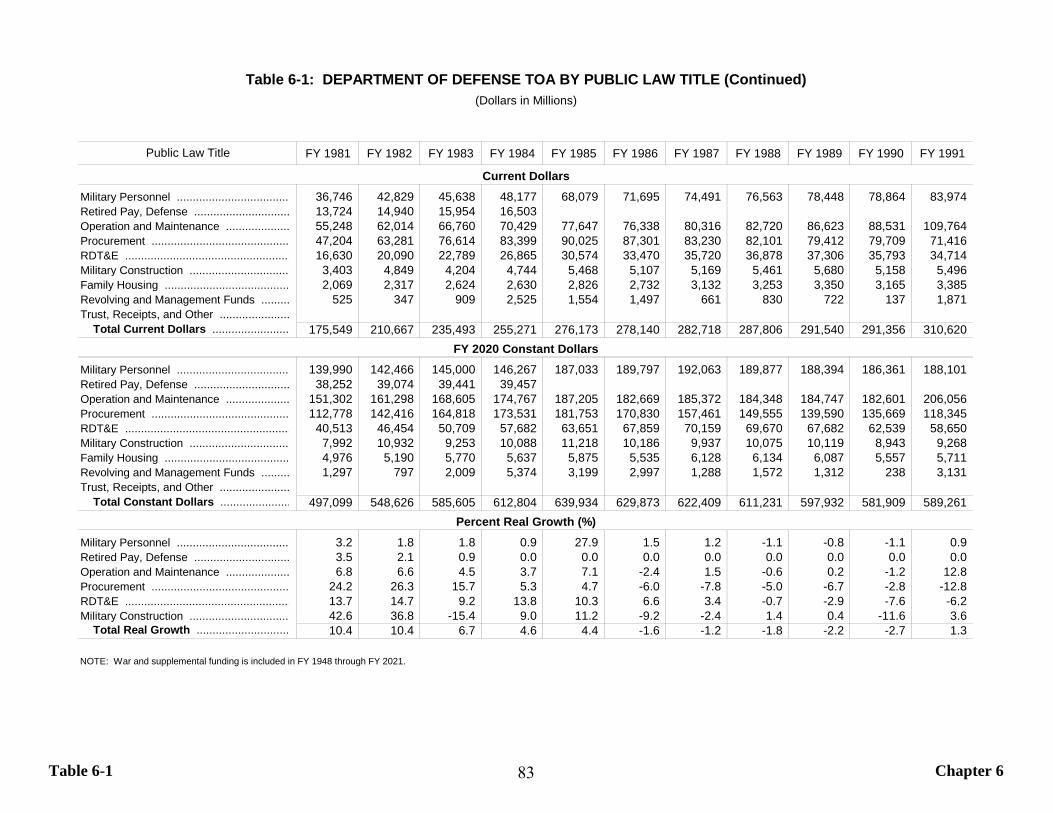
Table 6-1 Chapter 6
FY 1981 FY 1982 FY 1983 FY 1984 FY 1985 FY 1986 FY 1987 FY 1988 FY 1989 FY 1990 FY 1991
Military Personnel ................................... 36,746 42,829 45,638 48,177 68,079 71,695 74,491 76,563 78,448 78,864 83,974 Retired Pay, Defense .............................. 13,724 14,940 15,954 16,503 Operation and Maintenance .................... 55,248 62,014 66,760 70,429 77,647 76,338 80,316 82,720 86,623 88,531 109,764 Procurement ........................................... 47,204 63,281 76,614 83,399 90,025 87,301 83,230 82,101 79,412 79,709 71,416 RDT&E .................................................... 16,630 20,090 22,789 26,865 30,574 33,470 35,720 36,878 37,306 35,793 34,714 Military Construction ............................... 3,403 4,849 4,204 4,744 5,468 5,107 5,169 5,461 5,680 5,158 5,496 Family Housing ....................................... 2,069 2,317 2,624 2,630 2,826 2,732 3,132 3,253 3,350 3,165 3,385 Revolving and Management Funds ......... 525 347 909 2,525 1,554 1,497 661 830 722 137 1,871 Trust, Receipts, and Other ......................
Total Current Dollars ........................ 175,549 210,667 235,493 255,271 276,173 278,140 282,718 287,806 291,540 291,356 310,620
Military Personnel ................................... 139,990 142,466 145,000 146,267 187,033 189,797 192,063 189,877 188,394 186,361 188,101 Retired Pay, Defense .............................. 38,252 39,074 39,441 39,457 Operation and Maintenance .................... 151,302 161,298 168,605 174,767 187,205 182,669 185,372 184,348 184,747 182,601 206,056 Procurement ........................................... 112,778 142,416 164,818 173,531 181,753 170,830 157,461 149,555 139,590 135,669 118,345 RDT&E .................................................... 40,513 46,454 50,709 57,682 63,651 67,859 70,159 69,670 67,682 62,539 58,650 Military Construction ............................... 7,992 10,932 9,253 10,088 11,218 10,186 9,937 10,075 10,119 8,943 9,268 Family Housing ....................................... 4,976 5,190 5,770 5,637 5,875 5,535 6,128 6,134 6,087 5,557 5,711 Revolving and Management Funds ......... 1,297 797 2,009 5,374 3,199 2,997 1,288 1,572 1,312 238 3,131 Trust, Receipts, and Other ......................
Total Constant Dollars ...................... 497,099 548,626 585,605 612,804 639,934 629,873 622,409 611,231 597,932 581,909 589,261
Military Personnel ................................... 3.2 1.8 1.8 0.9 27.9 1.5 1.2 -1.1 -0.8 -1.1 0.9 Retired Pay, Defense .............................. 3.5 2.1 0.9 0.0 0.0 0.0 0.0 0.0 0.0 0.0 0.0 Operation and Maintenance .................... 6.8 6.6 4.5 3.7 7.1 -2.4 1.5 -0.6 0.2 -1.2 12.8 Procurement ........................................... 24.2 26.3 15.7 5.3 4.7 -6.0 -7.8 -5.0 -6.7 -2.8 -12.8 RDT&E .................................................... 13.7 14.7 9.2 13.8 10.3 6.6 3.4 -0.7 -2.9 -7.6 -6.2 Military Construction ............................... 42.6 36.8 -15.4 9.0 11.2 -9.2 -2.4 1.4 0.4 -11.6 3.6
Total Real Growth ............................. 10.4 10.4 6.7 4.6 4.4 -1.6 -1.2 -1.8 -2.2 -2.7 1.3
NOTE: War and supplemental funding is included in FY 1948 through FY 2021.
Percent Real Growth (%)
Table 6-1: DEPARTMENT OF DEFENSE TOA BY PUBLIC LAW TITLE (Continued)(Dollars in Millions)
Public Law Title
Current Dollars
FY 2020 Constant Dollars
83
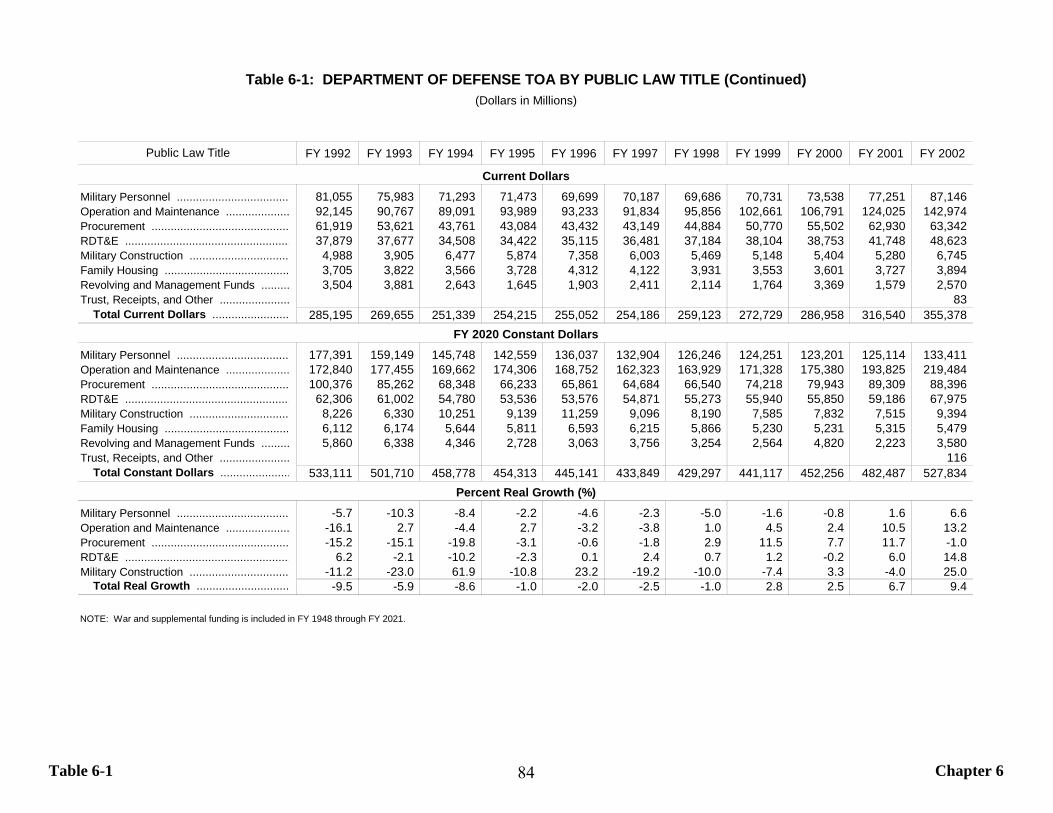
Table 6-1 Chapter 6
FY 1992 FY 1993 FY 1994 FY 1995 FY 1996 FY 1997 FY 1998 FY 1999 FY 2000 FY 2001 FY 2002
Military Personnel ................................... 81,055 75,983 71,293 71,473 69,699 70,187 69,686 70,731 73,538 77,251 87,146 Operation and Maintenance .................... 92,145 90,767 89,091 93,989 93,233 91,834 95,856 102,661 106,791 124,025 142,974 Procurement ........................................... 61,919 53,621 43,761 43,084 43,432 43,149 44,884 50,770 55,502 62,930 63,342 RDT&E .................................................... 37,879 37,677 34,508 34,422 35,115 36,481 37,184 38,104 38,753 41,748 48,623 Military Construction ............................... 4,988 3,905 6,477 5,874 7,358 6,003 5,469 5,148 5,404 5,280 6,745 Family Housing ....................................... 3,705 3,822 3,566 3,728 4,312 4,122 3,931 3,553 3,601 3,727 3,894 Revolving and Management Funds ......... 3,504 3,881 2,643 1,645 1,903 2,411 2,114 1,764 3,369 1,579 2,570 Trust, Receipts, and Other ...................... 83
Total Current Dollars ........................ 285,195 269,655 251,339 254,215 255,052 254,186 259,123 272,729 286,958 316,540 355,378
Military Personnel ................................... 177,391 159,149 145,748 142,559 136,037 132,904 126,246 124,251 123,201 125,114 133,411 Operation and Maintenance .................... 172,840 177,455 169,662 174,306 168,752 162,323 163,929 171,328 175,380 193,825 219,484 Procurement ........................................... 100,376 85,262 68,348 66,233 65,861 64,684 66,540 74,218 79,943 89,309 88,396 RDT&E .................................................... 62,306 61,002 54,780 53,536 53,576 54,871 55,273 55,940 55,850 59,186 67,975 Military Construction ............................... 8,226 6,330 10,251 9,139 11,259 9,096 8,190 7,585 7,832 7,515 9,394 Family Housing ....................................... 6,112 6,174 5,644 5,811 6,593 6,215 5,866 5,230 5,231 5,315 5,479 Revolving and Management Funds ......... 5,860 6,338 4,346 2,728 3,063 3,756 3,254 2,564 4,820 2,223 3,580 Trust, Receipts, and Other ...................... 116
Total Constant Dollars ...................... 533,111 501,710 458,778 454,313 445,141 433,849 429,297 441,117 452,256 482,487 527,834
Military Personnel ................................... -5.7 -10.3 -8.4 -2.2 -4.6 -2.3 -5.0 -1.6 -0.8 1.6 6.6 Operation and Maintenance .................... -16.1 2.7 -4.4 2.7 -3.2 -3.8 1.0 4.5 2.4 10.5 13.2 Procurement ........................................... -15.2 -15.1 -19.8 -3.1 -0.6 -1.8 2.9 11.5 7.7 11.7 -1.0 RDT&E .................................................... 6.2 -2.1 -10.2 -2.3 0.1 2.4 0.7 1.2 -0.2 6.0 14.8 Military Construction ............................... -11.2 -23.0 61.9 -10.8 23.2 -19.2 -10.0 -7.4 3.3 -4.0 25.0
Total Real Growth ............................. -9.5 -5.9 -8.6 -1.0 -2.0 -2.5 -1.0 2.8 2.5 6.7 9.4
NOTE: War and supplemental funding is included in FY 1948 through FY 2021.
Percent Real Growth (%)
Table 6-1: DEPARTMENT OF DEFENSE TOA BY PUBLIC LAW TITLE (Continued)(Dollars in Millions)
Public Law Title
Current Dollars
FY 2020 Constant Dollars
84
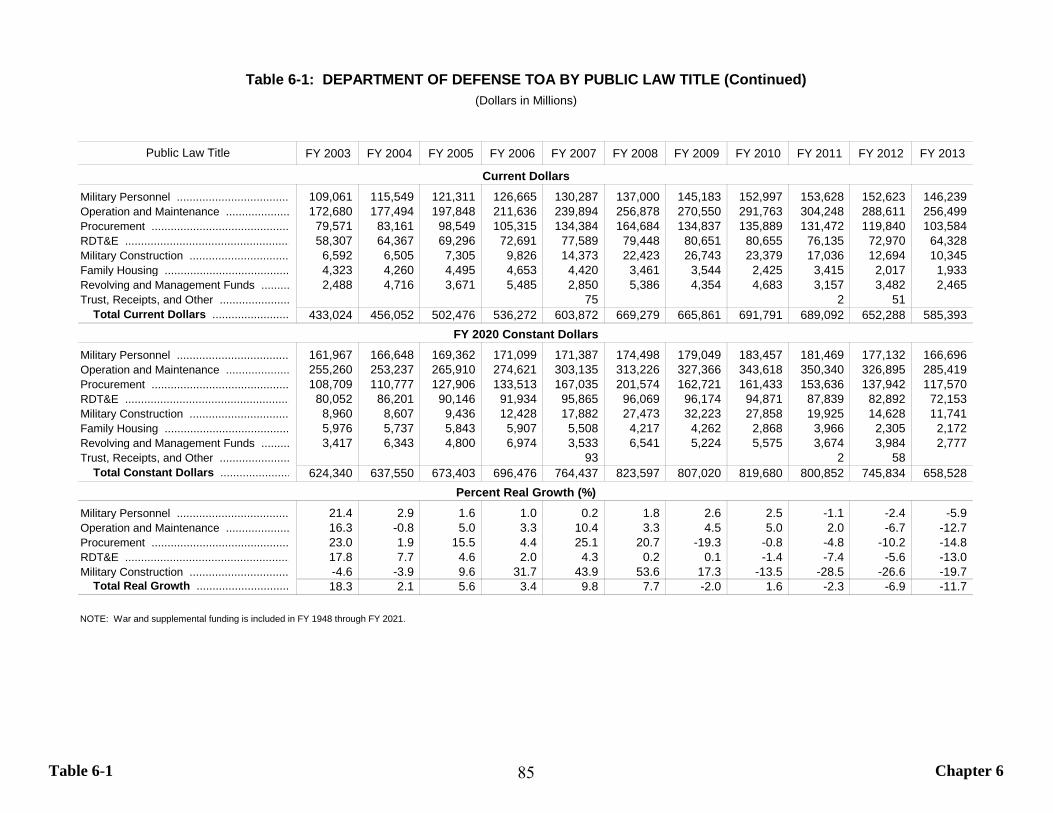
Table 6-1 Chapter 6
FY 2003 FY 2004 FY 2005 FY 2006 FY 2007 FY 2008 FY 2009 FY 2010 FY 2011 FY 2012 FY 2013
Military Personnel ................................... 109,061 115,549 121,311 126,665 130,287 137,000 145,183 152,997 153,628 152,623 146,239 Operation and Maintenance .................... 172,680 177,494 197,848 211,636 239,894 256,878 270,550 291,763 304,248 288,611 256,499 Procurement ........................................... 79,571 83,161 98,549 105,315 134,384 164,684 134,837 135,889 131,472 119,840 103,584 RDT&E .................................................... 58,307 64,367 69,296 72,691 77,589 79,448 80,651 80,655 76,135 72,970 64,328 Military Construction ............................... 6,592 6,505 7,305 9,826 14,373 22,423 26,743 23,379 17,036 12,694 10,345 Family Housing ....................................... 4,323 4,260 4,495 4,653 4,420 3,461 3,544 2,425 3,415 2,017 1,933 Revolving and Management Funds ......... 2,488 4,716 3,671 5,485 2,850 5,386 4,354 4,683 3,157 3,482 2,465 Trust, Receipts, and Other ...................... 75 2 51
Total Current Dollars ........................ 433,024 456,052 502,476 536,272 603,872 669,279 665,861 691,791 689,092 652,288 585,393
Military Personnel ................................... 161,967 166,648 169,362 171,099 171,387 174,498 179,049 183,457 181,469 177,132 166,696 Operation and Maintenance .................... 255,260 253,237 265,910 274,621 303,135 313,226 327,366 343,618 350,340 326,895 285,419 Procurement ........................................... 108,709 110,777 127,906 133,513 167,035 201,574 162,721 161,433 153,636 137,942 117,570 RDT&E .................................................... 80,052 86,201 90,146 91,934 95,865 96,069 96,174 94,871 87,839 82,892 72,153 Military Construction ............................... 8,960 8,607 9,436 12,428 17,882 27,473 32,223 27,858 19,925 14,628 11,741 Family Housing ....................................... 5,976 5,737 5,843 5,907 5,508 4,217 4,262 2,868 3,966 2,305 2,172 Revolving and Management Funds ......... 3,417 6,343 4,800 6,974 3,533 6,541 5,224 5,575 3,674 3,984 2,777 Trust, Receipts, and Other ...................... 93 2 58
Total Constant Dollars ...................... 624,340 637,550 673,403 696,476 764,437 823,597 807,020 819,680 800,852 745,834 658,528
Military Personnel ................................... 21.4 2.9 1.6 1.0 0.2 1.8 2.6 2.5 -1.1 -2.4 -5.9 Operation and Maintenance .................... 16.3 -0.8 5.0 3.3 10.4 3.3 4.5 5.0 2.0 -6.7 -12.7 Procurement ........................................... 23.0 1.9 15.5 4.4 25.1 20.7 -19.3 -0.8 -4.8 -10.2 -14.8 RDT&E .................................................... 17.8 7.7 4.6 2.0 4.3 0.2 0.1 -1.4 -7.4 -5.6 -13.0 Military Construction ............................... -4.6 -3.9 9.6 31.7 43.9 53.6 17.3 -13.5 -28.5 -26.6 -19.7
Total Real Growth ............................. 18.3 2.1 5.6 3.4 9.8 7.7 -2.0 1.6 -2.3 -6.9 -11.7
NOTE: War and supplemental funding is included in FY 1948 through FY 2021.
Percent Real Growth (%)
Table 6-1: DEPARTMENT OF DEFENSE TOA BY PUBLIC LAW TITLE (Continued)(Dollars in Millions)
Public Law Title
Current Dollars
FY 2020 Constant Dollars
85
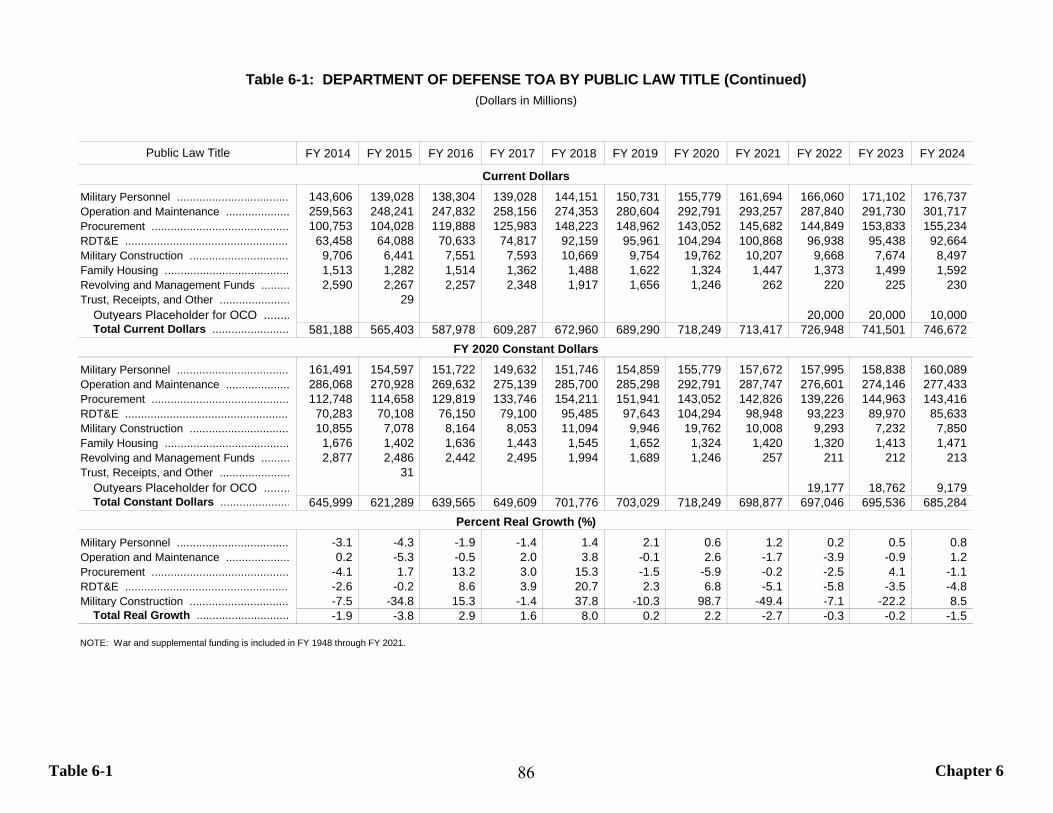
Table 6-1 Chapter 6
FY 2014 FY 2015 FY 2016 FY 2017 FY 2018 FY 2019 FY 2020 FY 2021 FY 2022 FY 2023 FY 2024
Military Personnel ................................... 143,606 139,028 138,304 139,028 144,151 150,731 155,779 161,694 166,060 171,102 176,737 Operation and Maintenance .................... 259,563 248,241 247,832 258,156 274,353 280,604 292,791 293,257 287,840 291,730 301,717 Procurement ........................................... 100,753 104,028 119,888 125,983 148,223 148,962 143,052 145,682 144,849 153,833 155,234 RDT&E .................................................... 63,458 64,088 70,633 74,817 92,159 95,961 104,294 100,868 96,938 95,438 92,664 Military Construction ............................... 9,706 6,441 7,551 7,593 10,669 9,754 19,762 10,207 9,668 7,674 8,497 Family Housing ....................................... 1,513 1,282 1,514 1,362 1,488 1,622 1,324 1,447 1,373 1,499 1,592 Revolving and Management Funds ......... 2,590 2,267 2,257 2,348 1,917 1,656 1,246 262 220 225 230 Trust, Receipts, and Other ...................... 29
Outyears Placeholder for OCO ........ 20,000 20,000 10,000 Total Current Dollars ........................ 581,188 565,403 587,978 609,287 672,960 689,290 718,249 713,417 726,948 741,501 746,672
Military Personnel ................................... 161,491 154,597 151,722 149,632 151,746 154,859 155,779 157,672 157,995 158,838 160,089 Operation and Maintenance .................... 286,068 270,928 269,632 275,139 285,700 285,298 292,791 287,747 276,601 274,146 277,433 Procurement ........................................... 112,748 114,658 129,819 133,746 154,211 151,941 143,052 142,826 139,226 144,963 143,416 RDT&E .................................................... 70,283 70,108 76,150 79,100 95,485 97,643 104,294 98,948 93,223 89,970 85,633 Military Construction ............................... 10,855 7,078 8,164 8,053 11,094 9,946 19,762 10,008 9,293 7,232 7,850 Family Housing ....................................... 1,676 1,402 1,636 1,443 1,545 1,652 1,324 1,420 1,320 1,413 1,471 Revolving and Management Funds ......... 2,877 2,486 2,442 2,495 1,994 1,689 1,246 257 211 212 213 Trust, Receipts, and Other ...................... 31
Outyears Placeholder for OCO ........ 19,177 18,762 9,179 Total Constant Dollars ...................... 645,999 621,289 639,565 649,609 701,776 703,029 718,249 698,877 697,046 695,536 685,284
Military Personnel ................................... -3.1 -4.3 -1.9 -1.4 1.4 2.1 0.6 1.2 0.2 0.5 0.8 Operation and Maintenance .................... 0.2 -5.3 -0.5 2.0 3.8 -0.1 2.6 -1.7 -3.9 -0.9 1.2 Procurement ........................................... -4.1 1.7 13.2 3.0 15.3 -1.5 -5.9 -0.2 -2.5 4.1 -1.1 RDT&E .................................................... -2.6 -0.2 8.6 3.9 20.7 2.3 6.8 -5.1 -5.8 -3.5 -4.8 Military Construction ............................... -7.5 -34.8 15.3 -1.4 37.8 -10.3 98.7 -49.4 -7.1 -22.2 8.5
Total Real Growth ............................. -1.9 -3.8 2.9 1.6 8.0 0.2 2.2 -2.7 -0.3 -0.2 -1.5
NOTE: War and supplemental funding is included in FY 1948 through FY 2021.
Percent Real Growth (%)
Table 6-1: DEPARTMENT OF DEFENSE TOA BY PUBLIC LAW TITLE (Continued)(Dollars in Millions)
Public Law Title
Current Dollars
FY 2020 Constant Dollars
86

Table 6-2 Chapter 6
FY 1948 FY 1949 FY 1950 FY 1951 FY 1952 FY 1953 FY 1954 FY 1955 FY 1956 FY 1957 FY 1958
Civilian Pay ............................................. 2,472 2,712 2,586 3,222 4,780 5,516 5,271 5,255 5,502 5,701 6,003 Military Pay ............................................. 3,428 3,747 4,154 6,890 9,375 10,097 9,461 9,244 9,136 9,117 8,993 Military Retired Pay Accrual .................... 175 193 197 324 331 356 386 422 479 511 561
Total Pay .......................................... 6,075 6,652 6,937 10,437 14,487 15,970 15,119 14,921 15,116 15,329 15,558 Other Military Personnel .......................... 804 854 788 1,632 1,766 2,084 1,729 1,796 1,752 1,828 1,994 Non-Pay Operations ................................ 1,608 1,900 1,828 8,855 9,686 6,419 4,289 3,943 4,485 4,695 5,032 Non-Pay Investment ................................ 3,416 3,798 4,784 24,250 31,251 19,811 9,292 13,130 16,711 17,872 18,541
Total Non-Pay .................................. 5,828 6,552 7,400 34,736 42,702 28,313 15,310 18,869 22,949 24,394 25,566 Total Current Dollars ............................ 11,903 13,204 14,337 45,173 57,188 44,283 30,429 33,790 38,065 39,724 41,124
Civilian Pay ............................................. 53,117 53,890 49,098 62,012 86,129 95,709 87,011 81,839 80,432 80,099 79,099 Military Pay ............................................. 86,288 94,571 93,263 145,308 199,080 200,865 190,475 182,044 171,843 174,457 164,471 Military Retired Pay Accrual .................... 3,153 3,458 3,682 3,756 3,912 4,150 4,820 4,964 5,271 5,411 5,890
Total Pay .......................................... 142,558 151,918 146,043 211,076 289,121 300,725 282,307 268,847 257,546 259,967 249,460 Other Military Personnel .......................... 7,322 7,450 6,898 13,434 14,889 17,423 14,460 14,159 13,197 12,972 13,965 Non-Pay Operations ................................ 18,343 20,376 19,521 87,793 96,872 63,099 44,250 39,898 44,169 44,824 46,781 Non-Pay Investment ................................ 35,117 37,443 46,502 218,399 291,483 179,830 82,172 110,855 139,208 143,707 151,033
Total Non-Pay .................................. 60,783 65,270 72,921 319,626 403,243 260,351 140,883 164,912 196,574 201,504 211,779 Total Constant Dollars .......................... 203,341 217,188 218,965 530,702 692,364 561,076 423,190 433,760 454,119 461,470 461,240
NOTE: War and supplemental funding is included in FY 1948 through FY 2021, with the exception of military pay. Military pay funding only includes war/supplemental funding through FY 2018. For more details on the composition of civilian pay, please see the "Notes" section at the end of this book.
Table 6-2: DEPARTMENT OF DEFENSE TOA BY CATEGORY(Dollars in Millions)
Category
Current Dollars
FY 2020 Constant Dollars
87
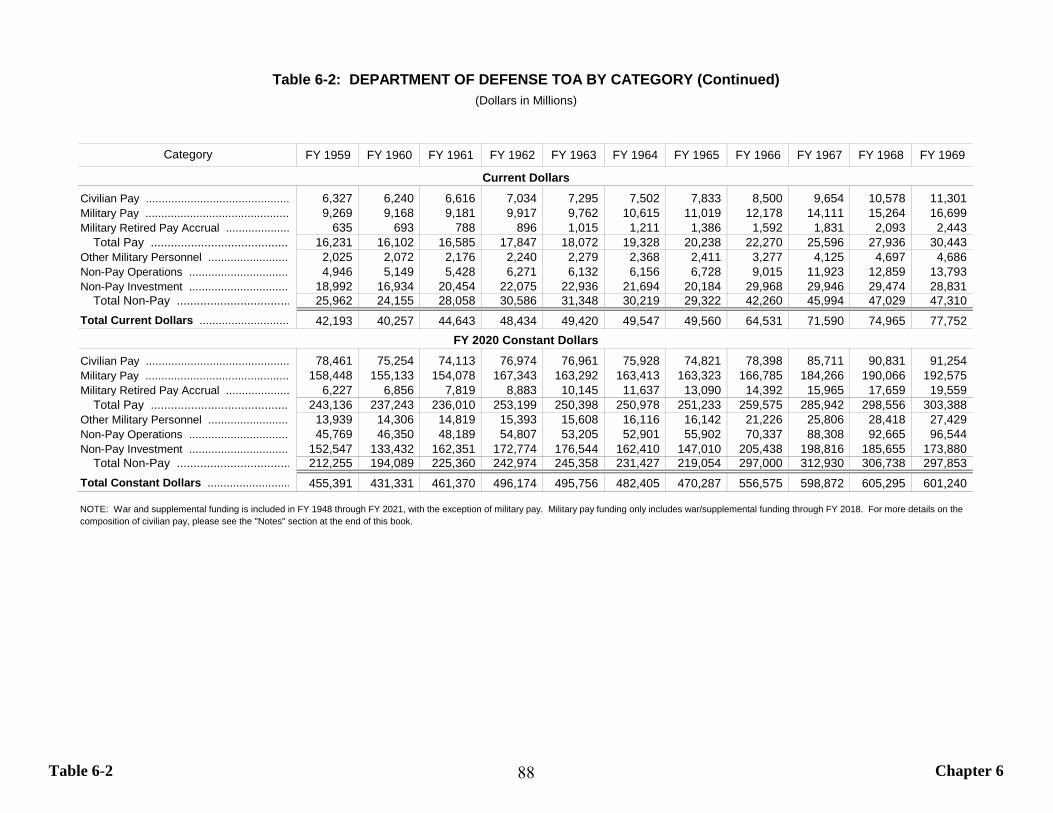
Table 6-2 Chapter 6
FY 1959 FY 1960 FY 1961 FY 1962 FY 1963 FY 1964 FY 1965 FY 1966 FY 1967 FY 1968 FY 1969
Civilian Pay ............................................. 6,327 6,240 6,616 7,034 7,295 7,502 7,833 8,500 9,654 10,578 11,301 Military Pay ............................................. 9,269 9,168 9,181 9,917 9,762 10,615 11,019 12,178 14,111 15,264 16,699 Military Retired Pay Accrual .................... 635 693 788 896 1,015 1,211 1,386 1,592 1,831 2,093 2,443
Total Pay .......................................... 16,231 16,102 16,585 17,847 18,072 19,328 20,238 22,270 25,596 27,936 30,443 Other Military Personnel .......................... 2,025 2,072 2,176 2,240 2,279 2,368 2,411 3,277 4,125 4,697 4,686 Non-Pay Operations ................................ 4,946 5,149 5,428 6,271 6,132 6,156 6,728 9,015 11,923 12,859 13,793 Non-Pay Investment ................................ 18,992 16,934 20,454 22,075 22,936 21,694 20,184 29,968 29,946 29,474 28,831
Total Non-Pay .................................. 25,962 24,155 28,058 30,586 31,348 30,219 29,322 42,260 45,994 47,029 47,310 Total Current Dollars ............................ 42,193 40,257 44,643 48,434 49,420 49,547 49,560 64,531 71,590 74,965 77,752
Civilian Pay ............................................. 78,461 75,254 74,113 76,974 76,961 75,928 74,821 78,398 85,711 90,831 91,254 Military Pay ............................................. 158,448 155,133 154,078 167,343 163,292 163,413 163,323 166,785 184,266 190,066 192,575 Military Retired Pay Accrual .................... 6,227 6,856 7,819 8,883 10,145 11,637 13,090 14,392 15,965 17,659 19,559
Total Pay .......................................... 243,136 237,243 236,010 253,199 250,398 250,978 251,233 259,575 285,942 298,556 303,388 Other Military Personnel .......................... 13,939 14,306 14,819 15,393 15,608 16,116 16,142 21,226 25,806 28,418 27,429 Non-Pay Operations ................................ 45,769 46,350 48,189 54,807 53,205 52,901 55,902 70,337 88,308 92,665 96,544 Non-Pay Investment ................................ 152,547 133,432 162,351 172,774 176,544 162,410 147,010 205,438 198,816 185,655 173,880
Total Non-Pay .................................. 212,255 194,089 225,360 242,974 245,358 231,427 219,054 297,000 312,930 306,738 297,853 Total Constant Dollars .......................... 455,391 431,331 461,370 496,174 495,756 482,405 470,287 556,575 598,872 605,295 601,240
NOTE: War and supplemental funding is included in FY 1948 through FY 2021, with the exception of military pay. Military pay funding only includes war/supplemental funding through FY 2018. For more details on the composition of civilian pay, please see the "Notes" section at the end of this book.
Table 6-2: DEPARTMENT OF DEFENSE TOA BY CATEGORY (Continued)(Dollars in Millions)
Category
Current Dollars
FY 2020 Constant Dollars
88
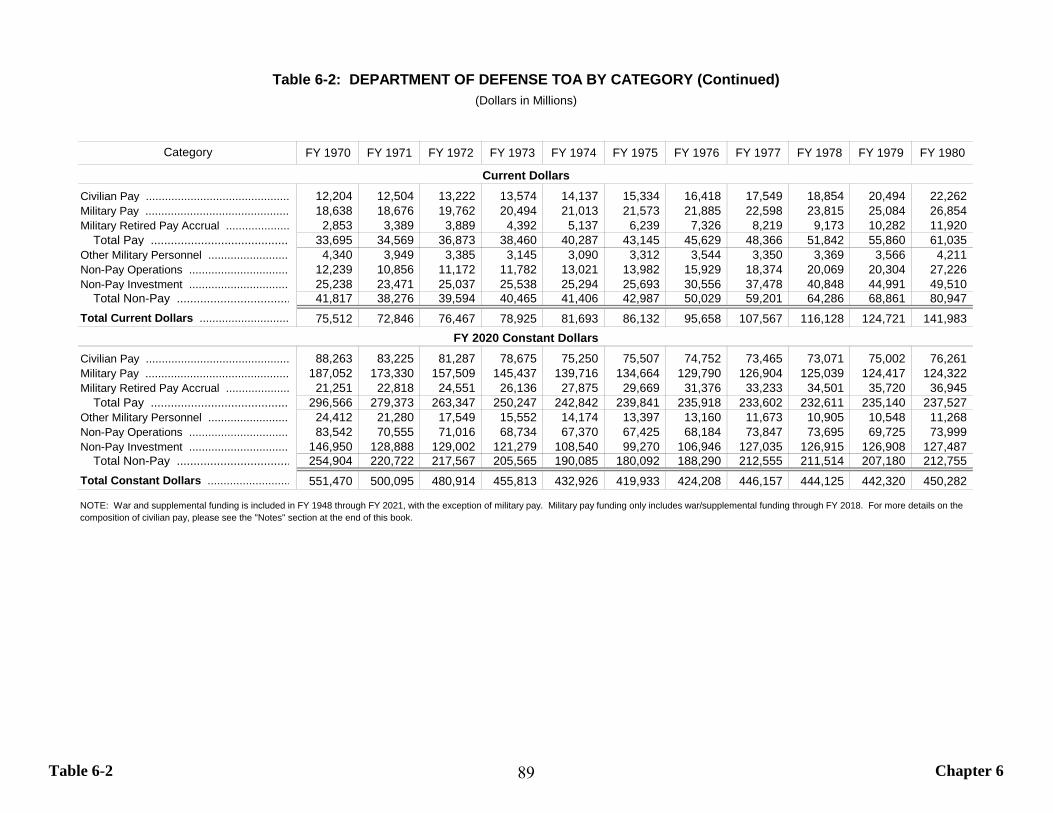
Table 6-2 Chapter 6
FY 1970 FY 1971 FY 1972 FY 1973 FY 1974 FY 1975 FY 1976 FY 1977 FY 1978 FY 1979 FY 1980
Civilian Pay ............................................. 12,204 12,504 13,222 13,574 14,137 15,334 16,418 17,549 18,854 20,494 22,262 Military Pay ............................................. 18,638 18,676 19,762 20,494 21,013 21,573 21,885 22,598 23,815 25,084 26,854 Military Retired Pay Accrual .................... 2,853 3,389 3,889 4,392 5,137 6,239 7,326 8,219 9,173 10,282 11,920
Total Pay .......................................... 33,695 34,569 36,873 38,460 40,287 43,145 45,629 48,366 51,842 55,860 61,035 Other Military Personnel .......................... 4,340 3,949 3,385 3,145 3,090 3,312 3,544 3,350 3,369 3,566 4,211 Non-Pay Operations ................................ 12,239 10,856 11,172 11,782 13,021 13,982 15,929 18,374 20,069 20,304 27,226 Non-Pay Investment ................................ 25,238 23,471 25,037 25,538 25,294 25,693 30,556 37,478 40,848 44,991 49,510
Total Non-Pay .................................. 41,817 38,276 39,594 40,465 41,406 42,987 50,029 59,201 64,286 68,861 80,947 Total Current Dollars ............................ 75,512 72,846 76,467 78,925 81,693 86,132 95,658 107,567 116,128 124,721 141,983
Civilian Pay ............................................. 88,263 83,225 81,287 78,675 75,250 75,507 74,752 73,465 73,071 75,002 76,261 Military Pay ............................................. 187,052 173,330 157,509 145,437 139,716 134,664 129,790 126,904 125,039 124,417 124,322 Military Retired Pay Accrual .................... 21,251 22,818 24,551 26,136 27,875 29,669 31,376 33,233 34,501 35,720 36,945
Total Pay .......................................... 296,566 279,373 263,347 250,247 242,842 239,841 235,918 233,602 232,611 235,140 237,527 Other Military Personnel .......................... 24,412 21,280 17,549 15,552 14,174 13,397 13,160 11,673 10,905 10,548 11,268 Non-Pay Operations ................................ 83,542 70,555 71,016 68,734 67,370 67,425 68,184 73,847 73,695 69,725 73,999 Non-Pay Investment ................................ 146,950 128,888 129,002 121,279 108,540 99,270 106,946 127,035 126,915 126,908 127,487
Total Non-Pay .................................. 254,904 220,722 217,567 205,565 190,085 180,092 188,290 212,555 211,514 207,180 212,755 Total Constant Dollars .......................... 551,470 500,095 480,914 455,813 432,926 419,933 424,208 446,157 444,125 442,320 450,282
NOTE: War and supplemental funding is included in FY 1948 through FY 2021, with the exception of military pay. Military pay funding only includes war/supplemental funding through FY 2018. For more details on the composition of civilian pay, please see the "Notes" section at the end of this book.
Table 6-2: DEPARTMENT OF DEFENSE TOA BY CATEGORY (Continued)(Dollars in Millions)
Category
Current Dollars
FY 2020 Constant Dollars
89

Table 6-2 Chapter 6
FY 1981 FY 1982 FY 1983 FY 1984 FY 1985 FY 1986 FY 1987 FY 1988 FY 1989 FY 1990 FY 1991
Civilian Pay ............................................. 23,775 26,065 27,762 29,452 31,404 32,161 34,095 35,851 37,612 39,806 41,139 Military Pay ............................................. 31,067 36,930 39,090 41,367 43,967 46,220 47,713 49,494 50,920 52,844 53,520 Military Retired Pay Accrual .................... 13,724 14,940 15,954 16,503 17,072 17,415 18,241 18,265 18,466 16,248 17,201
Total Pay .......................................... 68,567 77,936 82,806 87,322 92,443 95,796 100,049 103,610 106,998 108,898 111,860 Other Military Personnel .......................... 5,679 5,899 6,548 6,810 7,040 8,061 8,537 8,804 9,062 9,773 13,254 Non-Pay Operations ................................ 35,443 40,088 44,009 47,669 52,254 50,250 51,877 52,420 54,750 54,178 76,082 Non-Pay Investment ................................ 65,860 86,744 102,130 113,470 124,436 124,034 122,254 122,972 120,730 118,507 109,425
Total Non-Pay .................................. 106,982 132,731 152,687 167,949 183,731 182,344 182,669 184,196 184,542 182,458 198,761 Total Current Dollars ............................ 175,549 210,667 235,493 255,271 276,173 278,140 282,718 287,806 291,540 291,356 310,620
Civilian Pay ............................................. 74,892 80,011 80,827 82,396 84,966 85,165 85,000 84,045 82,970 83,699 83,197 Military Pay ............................................. 126,136 128,983 130,599 131,821 133,188 134,232 135,541 133,997 133,046 130,922 126,488 Military Retired Pay Accrual .................... 38,252 39,074 39,441 39,457 39,381 39,455 39,926 39,308 38,976 38,478 39,491
Total Pay .......................................... 239,279 248,067 250,866 253,674 257,534 258,851 260,467 257,350 254,991 253,099 249,176 Other Military Personnel .......................... 13,854 13,484 14,401 14,446 14,465 16,110 16,596 16,572 16,373 16,961 22,122 Non-Pay Operations ................................ 87,058 91,890 100,118 107,933 116,029 111,279 112,833 111,824 113,148 109,358 136,300 Non-Pay Investment ................................ 156,907 195,186 220,220 236,751 251,906 243,632 232,512 225,485 213,420 202,491 181,663
Total Non-Pay .................................. 257,820 300,559 334,739 359,130 382,399 371,022 361,941 353,881 342,941 328,810 340,085 Total Constant Dollars .......................... 497,099 548,626 585,605 612,804 639,934 629,873 622,409 611,231 597,932 581,909 589,261
NOTE: War and supplemental funding is included in FY 1948 through FY 2021, with the exception of military pay. Military pay funding only includes war/supplemental funding through FY 2018. For more details on the composition of civilian pay, please see the "Notes" section at the end of this book.
Table 6-2: DEPARTMENT OF DEFENSE TOA BY CATEGORY (Continued)(Dollars in Millions)
Category
Current Dollars
FY 2020 Constant Dollars
90

Table 6-2 Chapter 6
FY 1992 FY 1993 FY 1994 FY 1995 FY 1996 FY 1997 FY 1998 FY 1999 FY 2000 FY 2001 FY 2002
Civilian Pay ............................................. 41,779 44,168 43,580 43,559 43,031 42,740 41,255 41,226 41,932 43,241 45,864 Military Pay ............................................. 54,084 52,377 49,235 49,400 49,238 49,146 44,007 44,722 43,585 45,619 48,698 Military Retired Pay Accrual .................... 15,913 13,029 12,277 12,123 11,153 11,070 10,380 10,454 11,366 11,308 13,355
Total Pay .......................................... 111,776 109,574 105,093 105,082 103,422 102,957 95,642 96,403 96,883 100,168 107,916 Other Military Personnel .......................... 11,058 10,577 9,780 9,950 9,308 9,971 15,300 15,554 18,587 20,324 25,093 Non-Pay Operations ................................ 59,490 57,458 54,574 58,615 59,039 58,193 62,996 69,833 74,740 89,186 106,825 Non-Pay Investment ................................ 102,871 92,047 81,893 80,569 83,283 83,066 85,186 90,939 96,748 106,862 115,543
Total Non-Pay .................................. 173,419 160,082 146,247 149,133 151,630 151,230 163,481 176,326 190,075 216,372 247,461 Total Current Dollars ............................ 285,195 269,655 251,339 254,215 255,052 254,186 259,123 272,729 286,958 316,540 355,378
Civilian Pay ............................................. 81,108 82,587 79,473 77,520 74,787 72,117 67,715 65,317 63,392 63,039 63,921 Military Pay ............................................. 123,508 114,008 104,480 102,273 99,548 96,467 84,027 82,426 76,650 77,365 77,256 Military Retired Pay Accrual .................... 35,936 28,359 26,053 25,098 22,549 21,730 19,819 19,268 19,989 19,177 21,187
Total Pay .......................................... 240,551 224,954 210,005 204,891 196,883 190,315 171,562 167,011 160,031 159,581 162,364 Other Military Personnel .......................... 17,948 16,782 15,215 15,188 13,941 14,707 22,399 22,556 26,561 28,572 34,969 Non-Pay Operations ................................ 107,620 113,496 105,582 110,495 108,374 104,679 109,325 118,768 126,490 142,870 169,153 Non-Pay Investment ................................ 166,992 146,479 127,976 123,738 125,943 124,149 126,011 132,781 139,173 151,464 161,348
Total Non-Pay .................................. 292,560 276,756 248,773 249,422 248,258 243,534 257,736 274,106 292,225 322,906 365,471 Total Constant Dollars .......................... 533,111 501,710 458,778 454,313 445,141 433,849 429,297 441,117 452,256 482,487 527,834
NOTE: War and supplemental funding is included in FY 1948 through FY 2021, with the exception of military pay. Military pay funding only includes war/supplemental funding through FY 2018. For more details on the composition of civilian pay, please see the "Notes" section at the end of this book.
Table 6-2: DEPARTMENT OF DEFENSE TOA BY CATEGORY (Continued)(Dollars in Millions)
Category
Current Dollars
FY 2020 Constant Dollars
91
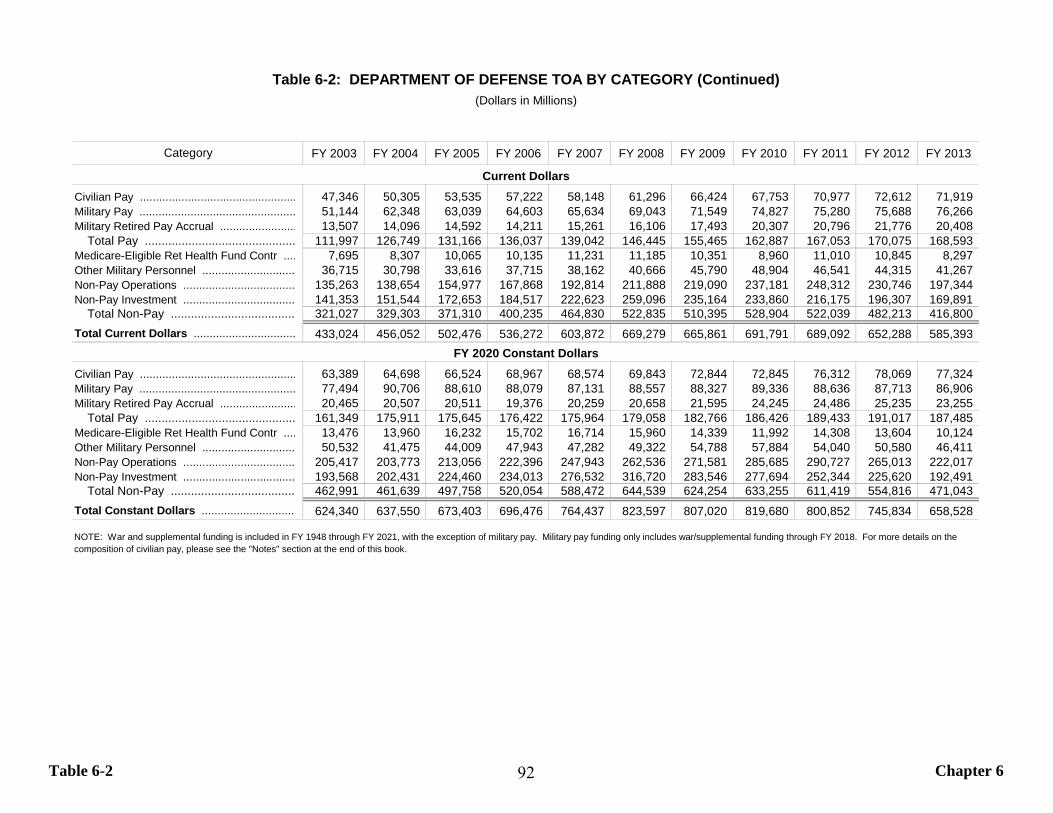
Table 6-2 Chapter 6
FY 2003 FY 2004 FY 2005 FY 2006 FY 2007 FY 2008 FY 2009 FY 2010 FY 2011 FY 2012 FY 2013
Civilian Pay ................................................. 47,346 50,305 53,535 57,222 58,148 61,296 66,424 67,753 70,977 72,612 71,919 Military Pay ................................................. 51,144 62,348 63,039 64,603 65,634 69,043 71,549 74,827 75,280 75,688 76,266 Military Retired Pay Accrual ........................ 13,507 14,096 14,592 14,211 15,261 16,106 17,493 20,307 20,796 21,776 20,408
Total Pay ............................................. 111,997 126,749 131,166 136,037 139,042 146,445 155,465 162,887 167,053 170,075 168,593 Medicare-Eligible Ret Health Fund Contr .... 7,695 8,307 10,065 10,135 11,231 11,185 10,351 8,960 11,010 10,845 8,297 Other Military Personnel ............................. 36,715 30,798 33,616 37,715 38,162 40,666 45,790 48,904 46,541 44,315 41,267 Non-Pay Operations ................................... 135,263 138,654 154,977 167,868 192,814 211,888 219,090 237,181 248,312 230,746 197,344 Non-Pay Investment ................................... 141,353 151,544 172,653 184,517 222,623 259,096 235,164 233,860 216,175 196,307 169,891
Total Non-Pay ..................................... 321,027 329,303 371,310 400,235 464,830 522,835 510,395 528,904 522,039 482,213 416,800 Total Current Dollars ................................ 433,024 456,052 502,476 536,272 603,872 669,279 665,861 691,791 689,092 652,288 585,393
Civilian Pay ................................................. 63,389 64,698 66,524 68,967 68,574 69,843 72,844 72,845 76,312 78,069 77,324 Military Pay ................................................. 77,494 90,706 88,610 88,079 87,131 88,557 88,327 89,336 88,636 87,713 86,906 Military Retired Pay Accrual ........................ 20,465 20,507 20,511 19,376 20,259 20,658 21,595 24,245 24,486 25,235 23,255
Total Pay ............................................. 161,349 175,911 175,645 176,422 175,964 179,058 182,766 186,426 189,433 191,017 187,485 Medicare-Eligible Ret Health Fund Contr .... 13,476 13,960 16,232 15,702 16,714 15,960 14,339 11,992 14,308 13,604 10,124 Other Military Personnel ............................. 50,532 41,475 44,009 47,943 47,282 49,322 54,788 57,884 54,040 50,580 46,411 Non-Pay Operations ................................... 205,417 203,773 213,056 222,396 247,943 262,536 271,581 285,685 290,727 265,013 222,017 Non-Pay Investment ................................... 193,568 202,431 224,460 234,013 276,532 316,720 283,546 277,694 252,344 225,620 192,491
Total Non-Pay ..................................... 462,991 461,639 497,758 520,054 588,472 644,539 624,254 633,255 611,419 554,816 471,043 Total Constant Dollars ............................. 624,340 637,550 673,403 696,476 764,437 823,597 807,020 819,680 800,852 745,834 658,528
NOTE: War and supplemental funding is included in FY 1948 through FY 2021, with the exception of military pay. Military pay funding only includes war/supplemental funding through FY 2018. For more details on the composition of civilian pay, please see the "Notes" section at the end of this book.
Table 6-2: DEPARTMENT OF DEFENSE TOA BY CATEGORY (Continued)(Dollars in Millions)
Category
Current Dollars
FY 2020 Constant Dollars
92
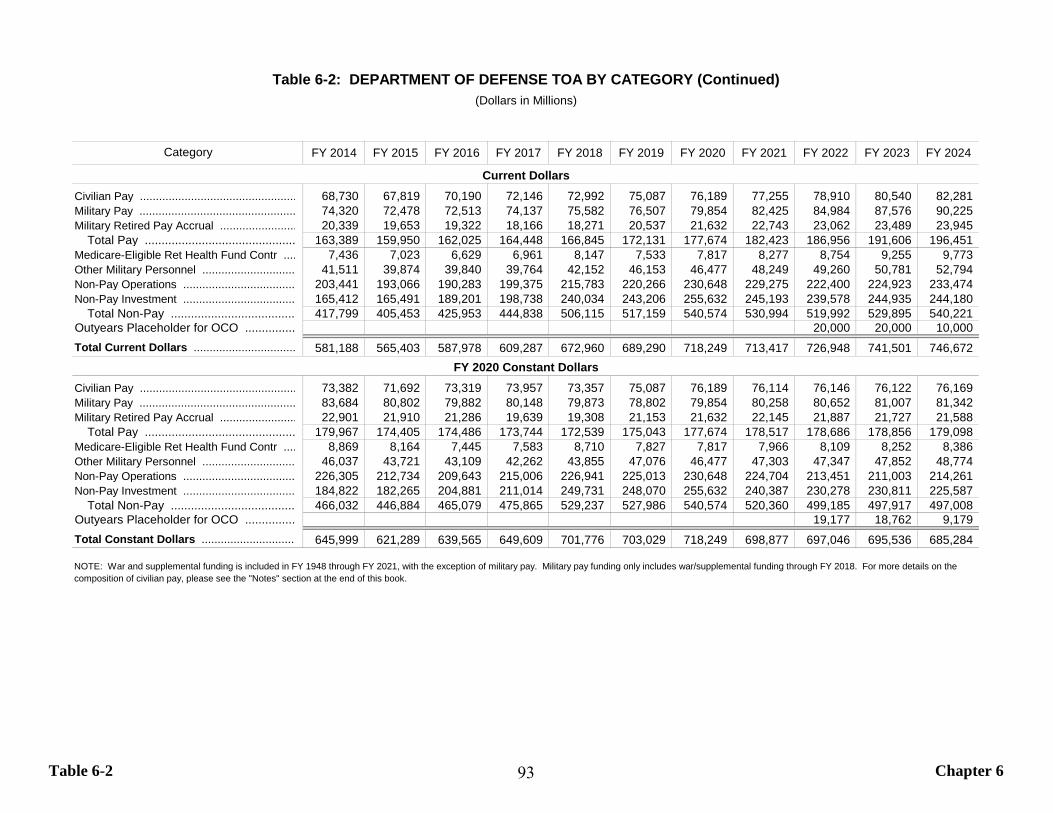
Table 6-2 Chapter 6
FY 2014 FY 2015 FY 2016 FY 2017 FY 2018 FY 2019 FY 2020 FY 2021 FY 2022 FY 2023 FY 2024
Civilian Pay ................................................. 68,730 67,819 70,190 72,146 72,992 75,087 76,189 77,255 78,910 80,540 82,281 Military Pay ................................................. 74,320 72,478 72,513 74,137 75,582 76,507 79,854 82,425 84,984 87,576 90,225 Military Retired Pay Accrual ........................ 20,339 19,653 19,322 18,166 18,271 20,537 21,632 22,743 23,062 23,489 23,945
Total Pay ............................................. 163,389 159,950 162,025 164,448 166,845 172,131 177,674 182,423 186,956 191,606 196,451 Medicare-Eligible Ret Health Fund Contr .... 7,436 7,023 6,629 6,961 8,147 7,533 7,817 8,277 8,754 9,255 9,773 Other Military Personnel ............................. 41,511 39,874 39,840 39,764 42,152 46,153 46,477 48,249 49,260 50,781 52,794 Non-Pay Operations ................................... 203,441 193,066 190,283 199,375 215,783 220,266 230,648 229,275 222,400 224,923 233,474 Non-Pay Investment ................................... 165,412 165,491 189,201 198,738 240,034 243,206 255,632 245,193 239,578 244,935 244,180
Total Non-Pay ..................................... 417,799 405,453 425,953 444,838 506,115 517,159 540,574 530,994 519,992 529,895 540,221 Outyears Placeholder for OCO ............... 20,000 20,000 10,000 Total Current Dollars ................................ 581,188 565,403 587,978 609,287 672,960 689,290 718,249 713,417 726,948 741,501 746,672
Civilian Pay ................................................. 73,382 71,692 73,319 73,957 73,357 75,087 76,189 76,114 76,146 76,122 76,169 Military Pay ................................................. 83,684 80,802 79,882 80,148 79,873 78,802 79,854 80,258 80,652 81,007 81,342 Military Retired Pay Accrual ........................ 22,901 21,910 21,286 19,639 19,308 21,153 21,632 22,145 21,887 21,727 21,588
Total Pay ............................................. 179,967 174,405 174,486 173,744 172,539 175,043 177,674 178,517 178,686 178,856 179,098 Medicare-Eligible Ret Health Fund Contr .... 8,869 8,164 7,445 7,583 8,710 7,827 7,817 7,966 8,109 8,252 8,386 Other Military Personnel ............................. 46,037 43,721 43,109 42,262 43,855 47,076 46,477 47,303 47,347 47,852 48,774 Non-Pay Operations ................................... 226,305 212,734 209,643 215,006 226,941 225,013 230,648 224,704 213,451 211,003 214,261 Non-Pay Investment ................................... 184,822 182,265 204,881 211,014 249,731 248,070 255,632 240,387 230,278 230,811 225,587
Total Non-Pay ..................................... 466,032 446,884 465,079 475,865 529,237 527,986 540,574 520,360 499,185 497,917 497,008 Outyears Placeholder for OCO ............... 19,177 18,762 9,179 Total Constant Dollars ............................. 645,999 621,289 639,565 649,609 701,776 703,029 718,249 698,877 697,046 695,536 685,284
NOTE: War and supplemental funding is included in FY 1948 through FY 2021, with the exception of military pay. Military pay funding only includes war/supplemental funding through FY 2018. For more details on the composition of civilian pay, please see the "Notes" section at the end of this book.
Table 6-2: DEPARTMENT OF DEFENSE TOA BY CATEGORY (Continued)(Dollars in Millions)
Category
FY 2020 Constant Dollars
Current Dollars
93
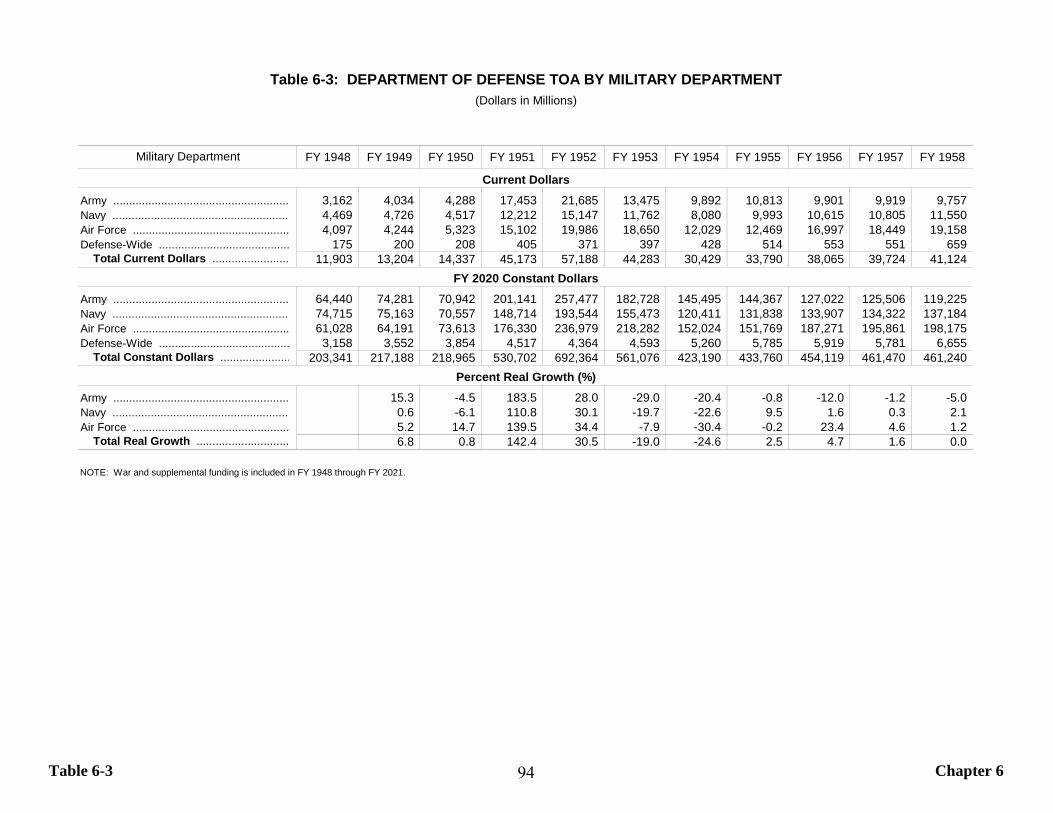
Table 6-3 Chapter 6
FY 1948 FY 1949 FY 1950 FY 1951 FY 1952 FY 1953 FY 1954 FY 1955 FY 1956 FY 1957 FY 1958
Army ....................................................... 3,162 4,034 4,288 17,453 21,685 13,475 9,892 10,813 9,901 9,919 9,757 Navy ........................................................ 4,469 4,726 4,517 12,212 15,147 11,762 8,080 9,993 10,615 10,805 11,550 Air Force ................................................. 4,097 4,244 5,323 15,102 19,986 18,650 12,029 12,469 16,997 18,449 19,158 Defense-Wide ......................................... 175 200 208 405 371 397 428 514 553 551 659
Total Current Dollars ........................ 11,903 13,204 14,337 45,173 57,188 44,283 30,429 33,790 38,065 39,724 41,124
Army ....................................................... 64,440 74,281 70,942 201,141 257,477 182,728 145,495 144,367 127,022 125,506 119,225 Navy ........................................................ 74,715 75,163 70,557 148,714 193,544 155,473 120,411 131,838 133,907 134,322 137,184 Air Force ................................................. 61,028 64,191 73,613 176,330 236,979 218,282 152,024 151,769 187,271 195,861 198,175 Defense-Wide ......................................... 3,158 3,552 3,854 4,517 4,364 4,593 5,260 5,785 5,919 5,781 6,655
Total Constant Dollars ...................... 203,341 217,188 218,965 530,702 692,364 561,076 423,190 433,760 454,119 461,470 461,240
Army ....................................................... 15.3 -4.5 183.5 28.0 -29.0 -20.4 -0.8 -12.0 -1.2 -5.0 Navy ........................................................ 0.6 -6.1 110.8 30.1 -19.7 -22.6 9.5 1.6 0.3 2.1 Air Force ................................................. 5.2 14.7 139.5 34.4 -7.9 -30.4 -0.2 23.4 4.6 1.2
Total Real Growth ............................. 6.8 0.8 142.4 30.5 -19.0 -24.6 2.5 4.7 1.6 0.0
NOTE: War and supplemental funding is included in FY 1948 through FY 2021.
FY 2020 Constant Dollars
Percent Real Growth (%)
Table 6-3: DEPARTMENT OF DEFENSE TOA BY MILITARY DEPARTMENT(Dollars in Millions)
Military Department
Current Dollars
94

Table 6-3 Chapter 6
FY 1959 FY 1960 FY 1961 FY 1962 FY 1963 FY 1964 FY 1965 FY 1966 FY 1967 FY 1968 FY 1969
Army ....................................................... 9,555 9,867 10,528 12,467 11,826 12,275 12,219 18,510 22,369 24,962 25,769 Navy ........................................................ 12,148 11,727 12,820 14,592 14,657 14,450 14,856 19,185 21,190 20,781 21,552 Air Force ................................................. 19,599 17,662 20,098 19,730 20,427 19,958 19,428 23,309 24,270 24,974 25,857 Defense-Wide ......................................... 892 1,001 1,197 1,646 2,510 2,864 3,057 3,527 3,760 4,247 4,574
Total Current Dollars ........................ 42,193 40,257 44,643 48,434 49,420 49,547 49,560 64,531 71,590 74,965 77,752
Army ....................................................... 112,983 113,112 115,869 133,801 126,368 125,705 121,977 160,933 187,631 201,479 200,074 Navy ........................................................ 138,295 130,556 139,609 154,233 151,721 144,627 143,319 167,689 178,865 169,478 167,761 Air Force ................................................. 196,028 178,598 195,199 193,771 196,273 188,088 179,591 199,480 202,475 201,726 199,570 Defense-Wide ......................................... 8,085 9,066 10,692 14,369 21,393 23,984 25,401 28,474 29,901 32,611 33,835
Total Constant Dollars ...................... 455,391 431,331 461,370 496,174 495,756 482,405 470,287 556,575 598,872 605,295 601,240
Army ....................................................... -5.2 0.1 2.4 15.5 -5.6 -0.5 -3.0 31.9 16.6 7.4 -0.7 Navy ........................................................ 0.8 -5.6 6.9 10.5 -1.6 -4.7 -0.9 17.0 6.7 -5.2 -1.0 Air Force ................................................. -1.1 -8.9 9.3 -0.7 1.3 -4.2 -4.5 11.1 1.5 -0.4 -1.1
Total Real Growth ............................. -1.3 -5.3 7.0 7.5 -0.1 -2.7 -2.5 18.3 7.6 1.1 -0.7
NOTE: War and supplemental funding is included in FY 1948 through FY 2021.
FY 2020 Constant Dollars
Percent Real Growth (%)
Table 6-3: DEPARTMENT OF DEFENSE TOA BY MILITARY DEPARTMENT (Continued)(Dollars in Millions)
Military Department
Current Dollars
95

Table 6-3 Chapter 6
FY 1970 FY 1971 FY 1972 FY 1973 FY 1974 FY 1975 FY 1976 FY 1977 FY 1978 FY 1979 FY 1980
Army ....................................................... 23,963 22,280 22,094 21,480 21,548 21,644 23,759 26,703 28,950 31,497 34,572 Navy ........................................................ 22,462 21,691 24,041 25,324 26,934 27,962 31,360 36,353 39,504 41,694 46,984 Air Force ................................................. 23,875 23,016 23,799 24,696 24,772 26,024 28,395 31,145 32,877 34,873 41,556 Defense-Wide ......................................... 5,212 5,859 6,533 7,425 8,439 10,501 12,144 13,367 14,797 16,657 18,871
Total Current Dollars ........................ 75,512 72,846 76,467 78,925 81,693 86,132 95,658 107,567 116,128 124,721 141,983
Army ....................................................... 200,074 176,538 156,207 140,931 125,724 116,777 109,627 110,704 116,004 115,873 117,117 Navy ........................................................ 167,761 162,810 146,694 148,993 144,047 139,620 134,028 136,158 147,463 147,396 144,432 Air Force ................................................. 199,570 176,177 159,939 151,892 144,097 132,739 128,471 127,203 130,831 127,341 125,126 Defense-Wide ......................................... 33,835 35,946 37,255 39,099 41,944 43,790 47,807 50,143 51,859 53,515 55,646
Total Constant Dollars ...................... 601,240 551,470 500,095 480,914 455,813 432,926 419,933 424,208 446,157 444,125 442,320
Army ....................................................... -11.8 -11.5 -9.8 -10.8 -7.1 -6.1 1.0 4.8 -0.1 1.1 0.5 Navy ........................................................ -3.0 -9.9 1.6 -3.3 -3.1 -4.0 1.6 8.3 0.0 -2.0 0.9 Air Force ................................................. -11.7 -9.2 -5.0 -5.1 -7.9 -3.2 -1.0 2.9 -2.7 -1.7 4.0
Total Real Growth ............................. -8.3 -9.3 -3.8 -5.2 -5.0 -3.0 1.0 5.2 -0.5 -0.4 1.8
NOTE: War and supplemental funding is included in FY 1948 through FY 2021.
FY 2020 Constant Dollars
Percent Real Growth (%)
Table 6-3: DEPARTMENT OF DEFENSE TOA BY MILITARY DEPARTMENT (Continued)(Dollars in Millions)
Military Department
Current Dollars
96
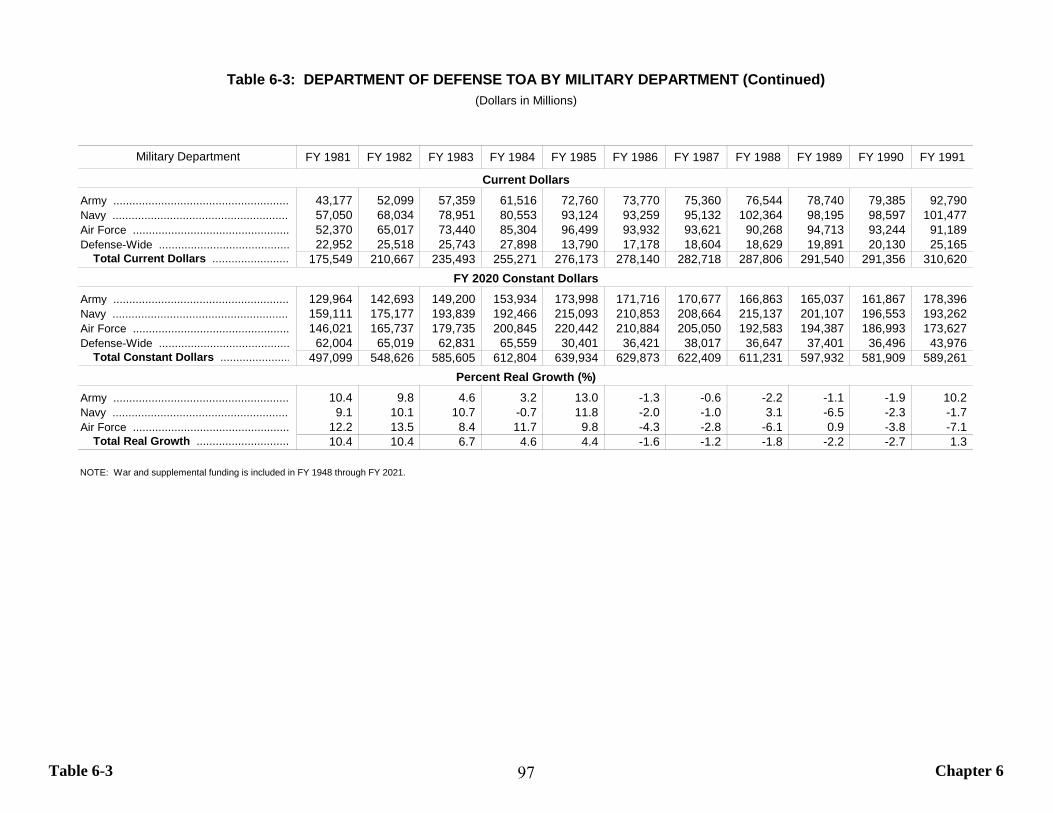
Table 6-3 Chapter 6
FY 1981 FY 1982 FY 1983 FY 1984 FY 1985 FY 1986 FY 1987 FY 1988 FY 1989 FY 1990 FY 1991
Army ....................................................... 43,177 52,099 57,359 61,516 72,760 73,770 75,360 76,544 78,740 79,385 92,790 Navy ........................................................ 57,050 68,034 78,951 80,553 93,124 93,259 95,132 102,364 98,195 98,597 101,477 Air Force ................................................. 52,370 65,017 73,440 85,304 96,499 93,932 93,621 90,268 94,713 93,244 91,189 Defense-Wide ......................................... 22,952 25,518 25,743 27,898 13,790 17,178 18,604 18,629 19,891 20,130 25,165
Total Current Dollars ........................ 175,549 210,667 235,493 255,271 276,173 278,140 282,718 287,806 291,540 291,356 310,620
Army ....................................................... 129,964 142,693 149,200 153,934 173,998 171,716 170,677 166,863 165,037 161,867 178,396 Navy ........................................................ 159,111 175,177 193,839 192,466 215,093 210,853 208,664 215,137 201,107 196,553 193,262 Air Force ................................................. 146,021 165,737 179,735 200,845 220,442 210,884 205,050 192,583 194,387 186,993 173,627 Defense-Wide ......................................... 62,004 65,019 62,831 65,559 30,401 36,421 38,017 36,647 37,401 36,496 43,976
Total Constant Dollars ...................... 497,099 548,626 585,605 612,804 639,934 629,873 622,409 611,231 597,932 581,909 589,261
Army ....................................................... 10.4 9.8 4.6 3.2 13.0 -1.3 -0.6 -2.2 -1.1 -1.9 10.2 Navy ........................................................ 9.1 10.1 10.7 -0.7 11.8 -2.0 -1.0 3.1 -6.5 -2.3 -1.7 Air Force ................................................. 12.2 13.5 8.4 11.7 9.8 -4.3 -2.8 -6.1 0.9 -3.8 -7.1
Total Real Growth ............................. 10.4 10.4 6.7 4.6 4.4 -1.6 -1.2 -1.8 -2.2 -2.7 1.3
NOTE: War and supplemental funding is included in FY 1948 through FY 2021.
FY 2020 Constant Dollars
Percent Real Growth (%)
Table 6-3: DEPARTMENT OF DEFENSE TOA BY MILITARY DEPARTMENT (Continued)(Dollars in Millions)
Military Department
Current Dollars
97
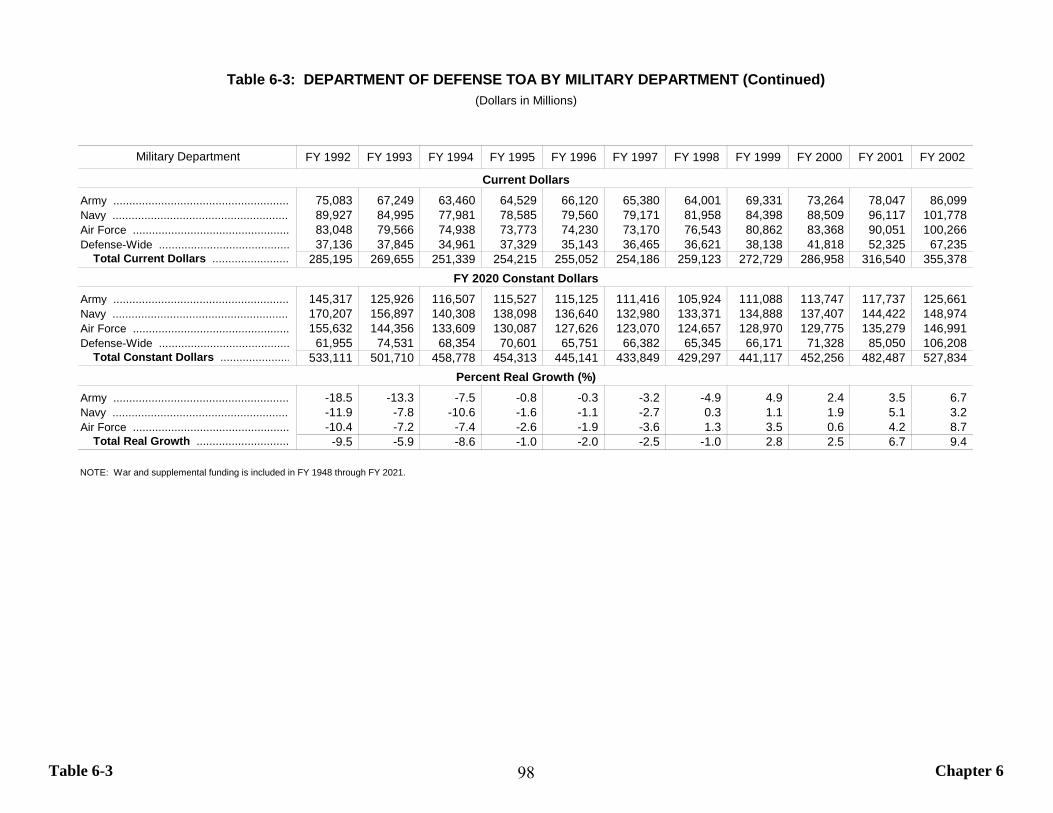
Table 6-3 Chapter 6
FY 1992 FY 1993 FY 1994 FY 1995 FY 1996 FY 1997 FY 1998 FY 1999 FY 2000 FY 2001 FY 2002
Army ....................................................... 75,083 67,249 63,460 64,529 66,120 65,380 64,001 69,331 73,264 78,047 86,099 Navy ........................................................ 89,927 84,995 77,981 78,585 79,560 79,171 81,958 84,398 88,509 96,117 101,778 Air Force ................................................. 83,048 79,566 74,938 73,773 74,230 73,170 76,543 80,862 83,368 90,051 100,266 Defense-Wide ......................................... 37,136 37,845 34,961 37,329 35,143 36,465 36,621 38,138 41,818 52,325 67,235
Total Current Dollars ........................ 285,195 269,655 251,339 254,215 255,052 254,186 259,123 272,729 286,958 316,540 355,378
Army ....................................................... 145,317 125,926 116,507 115,527 115,125 111,416 105,924 111,088 113,747 117,737 125,661 Navy ........................................................ 170,207 156,897 140,308 138,098 136,640 132,980 133,371 134,888 137,407 144,422 148,974 Air Force ................................................. 155,632 144,356 133,609 130,087 127,626 123,070 124,657 128,970 129,775 135,279 146,991 Defense-Wide ......................................... 61,955 74,531 68,354 70,601 65,751 66,382 65,345 66,171 71,328 85,050 106,208
Total Constant Dollars ...................... 533,111 501,710 458,778 454,313 445,141 433,849 429,297 441,117 452,256 482,487 527,834
Army ....................................................... -18.5 -13.3 -7.5 -0.8 -0.3 -3.2 -4.9 4.9 2.4 3.5 6.7 Navy ........................................................ -11.9 -7.8 -10.6 -1.6 -1.1 -2.7 0.3 1.1 1.9 5.1 3.2 Air Force ................................................. -10.4 -7.2 -7.4 -2.6 -1.9 -3.6 1.3 3.5 0.6 4.2 8.7
Total Real Growth ............................. -9.5 -5.9 -8.6 -1.0 -2.0 -2.5 -1.0 2.8 2.5 6.7 9.4
NOTE: War and supplemental funding is included in FY 1948 through FY 2021.
FY 2020 Constant Dollars
Percent Real Growth (%)
Table 6-3: DEPARTMENT OF DEFENSE TOA BY MILITARY DEPARTMENT (Continued)(Dollars in Millions)
Military Department
Current Dollars
98
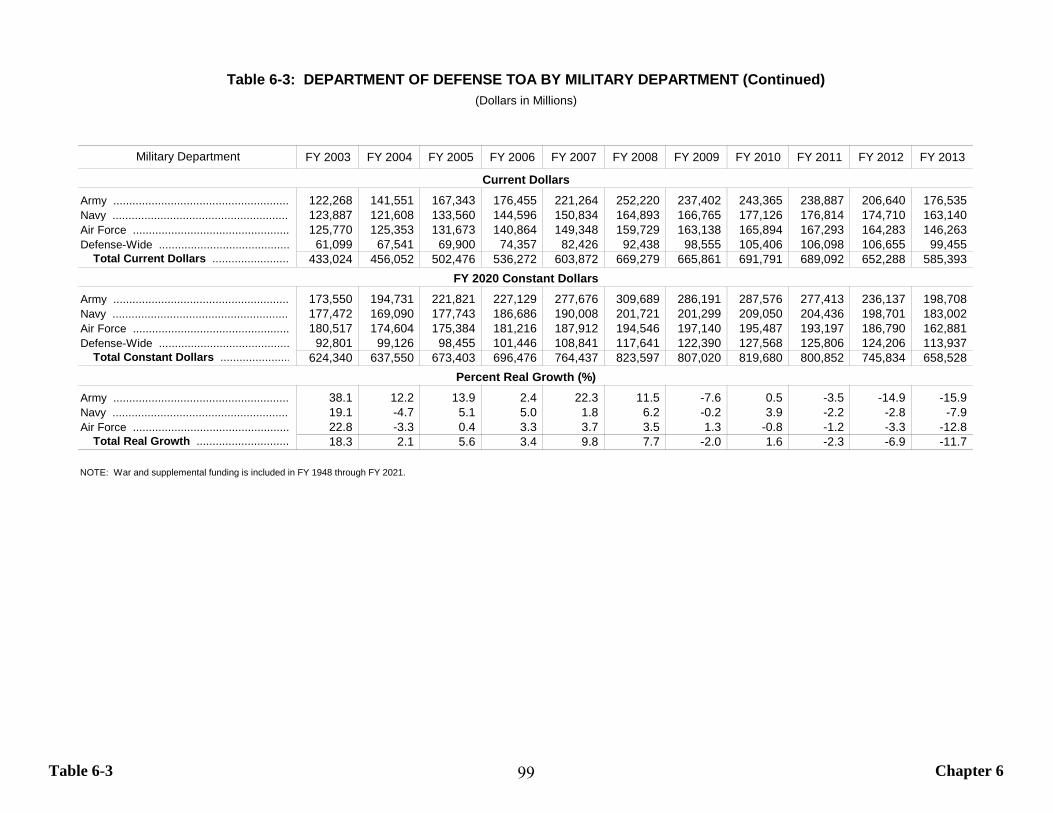
Table 6-3 Chapter 6
FY 2003 FY 2004 FY 2005 FY 2006 FY 2007 FY 2008 FY 2009 FY 2010 FY 2011 FY 2012 FY 2013
Army ....................................................... 122,268 141,551 167,343 176,455 221,264 252,220 237,402 243,365 238,887 206,640 176,535 Navy ........................................................ 123,887 121,608 133,560 144,596 150,834 164,893 166,765 177,126 176,814 174,710 163,140 Air Force ................................................. 125,770 125,353 131,673 140,864 149,348 159,729 163,138 165,894 167,293 164,283 146,263 Defense-Wide ......................................... 61,099 67,541 69,900 74,357 82,426 92,438 98,555 105,406 106,098 106,655 99,455
Total Current Dollars ........................ 433,024 456,052 502,476 536,272 603,872 669,279 665,861 691,791 689,092 652,288 585,393
Army ....................................................... 173,550 194,731 221,821 227,129 277,676 309,689 286,191 287,576 277,413 236,137 198,708 Navy ........................................................ 177,472 169,090 177,743 186,686 190,008 201,721 201,299 209,050 204,436 198,701 183,002 Air Force ................................................. 180,517 174,604 175,384 181,216 187,912 194,546 197,140 195,487 193,197 186,790 162,881 Defense-Wide ......................................... 92,801 99,126 98,455 101,446 108,841 117,641 122,390 127,568 125,806 124,206 113,937
Total Constant Dollars ...................... 624,340 637,550 673,403 696,476 764,437 823,597 807,020 819,680 800,852 745,834 658,528
Army ....................................................... 38.1 12.2 13.9 2.4 22.3 11.5 -7.6 0.5 -3.5 -14.9 -15.9 Navy ........................................................ 19.1 -4.7 5.1 5.0 1.8 6.2 -0.2 3.9 -2.2 -2.8 -7.9 Air Force ................................................. 22.8 -3.3 0.4 3.3 3.7 3.5 1.3 -0.8 -1.2 -3.3 -12.8
Total Real Growth ............................. 18.3 2.1 5.6 3.4 9.8 7.7 -2.0 1.6 -2.3 -6.9 -11.7
NOTE: War and supplemental funding is included in FY 1948 through FY 2021.
Percent Real Growth (%)
Table 6-3: DEPARTMENT OF DEFENSE TOA BY MILITARY DEPARTMENT (Continued)(Dollars in Millions)
Military Department
Current Dollars
FY 2020 Constant Dollars
99
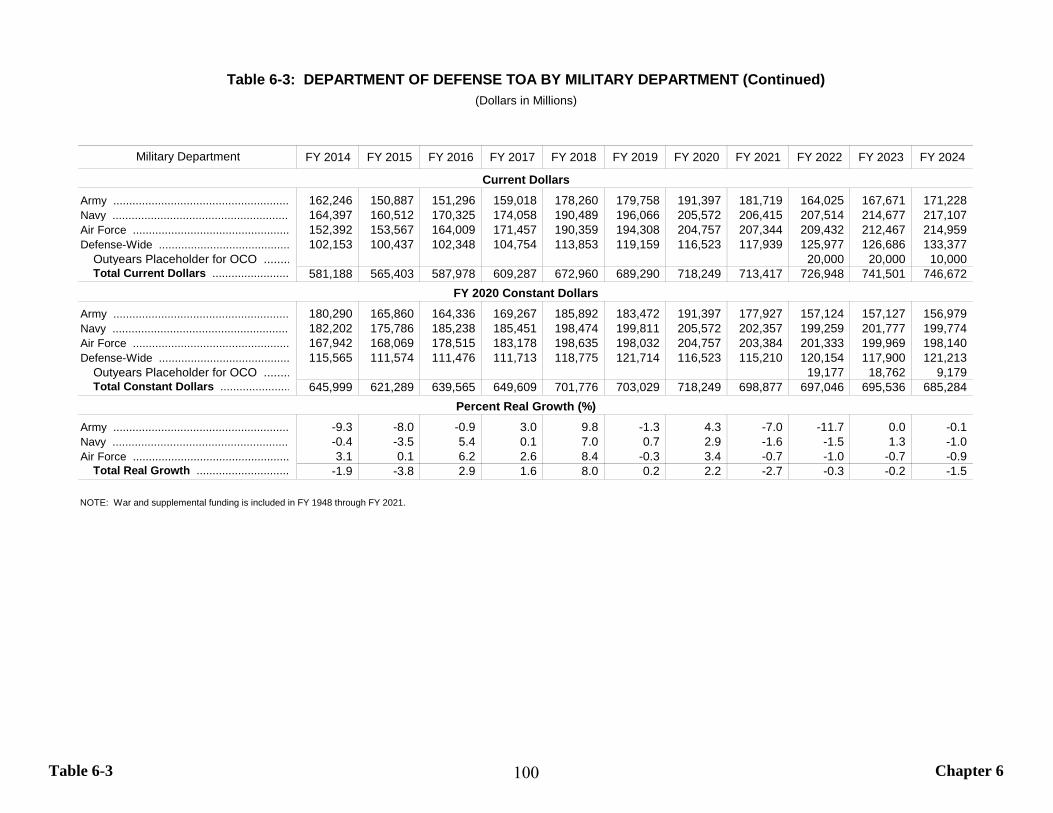
Table 6-3 Chapter 6
FY 2014 FY 2015 FY 2016 FY 2017 FY 2018 FY 2019 FY 2020 FY 2021 FY 2022 FY 2023 FY 2024
Army ....................................................... 162,246 150,887 151,296 159,018 178,260 179,758 191,397 181,719 164,025 167,671 171,228 Navy ........................................................ 164,397 160,512 170,325 174,058 190,489 196,066 205,572 206,415 207,514 214,677 217,107 Air Force ................................................. 152,392 153,567 164,009 171,457 190,359 194,308 204,757 207,344 209,432 212,467 214,959 Defense-Wide ......................................... 102,153 100,437 102,348 104,754 113,853 119,159 116,523 117,939 125,977 126,686 133,377
Outyears Placeholder for OCO ........ 20,000 20,000 10,000 Total Current Dollars ........................ 581,188 565,403 587,978 609,287 672,960 689,290 718,249 713,417 726,948 741,501 746,672
Army ....................................................... 180,290 165,860 164,336 169,267 185,892 183,472 191,397 177,927 157,124 157,127 156,979 Navy ........................................................ 182,202 175,786 185,238 185,451 198,474 199,811 205,572 202,357 199,259 201,777 199,774 Air Force ................................................. 167,942 168,069 178,515 183,178 198,635 198,032 204,757 203,384 201,333 199,969 198,140 Defense-Wide ......................................... 115,565 111,574 111,476 111,713 118,775 121,714 116,523 115,210 120,154 117,900 121,213
Outyears Placeholder for OCO ........ 19,177 18,762 9,179 Total Constant Dollars ...................... 645,999 621,289 639,565 649,609 701,776 703,029 718,249 698,877 697,046 695,536 685,284
Army ....................................................... -9.3 -8.0 -0.9 3.0 9.8 -1.3 4.3 -7.0 -11.7 0.0 -0.1 Navy ........................................................ -0.4 -3.5 5.4 0.1 7.0 0.7 2.9 -1.6 -1.5 1.3 -1.0 Air Force ................................................. 3.1 0.1 6.2 2.6 8.4 -0.3 3.4 -0.7 -1.0 -0.7 -0.9
Total Real Growth ............................. -1.9 -3.8 2.9 1.6 8.0 0.2 2.2 -2.7 -0.3 -0.2 -1.5
NOTE: War and supplemental funding is included in FY 1948 through FY 2021.
(Dollars in Millions)Table 6-3: DEPARTMENT OF DEFENSE TOA BY MILITARY DEPARTMENT (Continued)
Percent Real Growth (%)
FY 2020 Constant Dollars
Current Dollars
Military Department
100
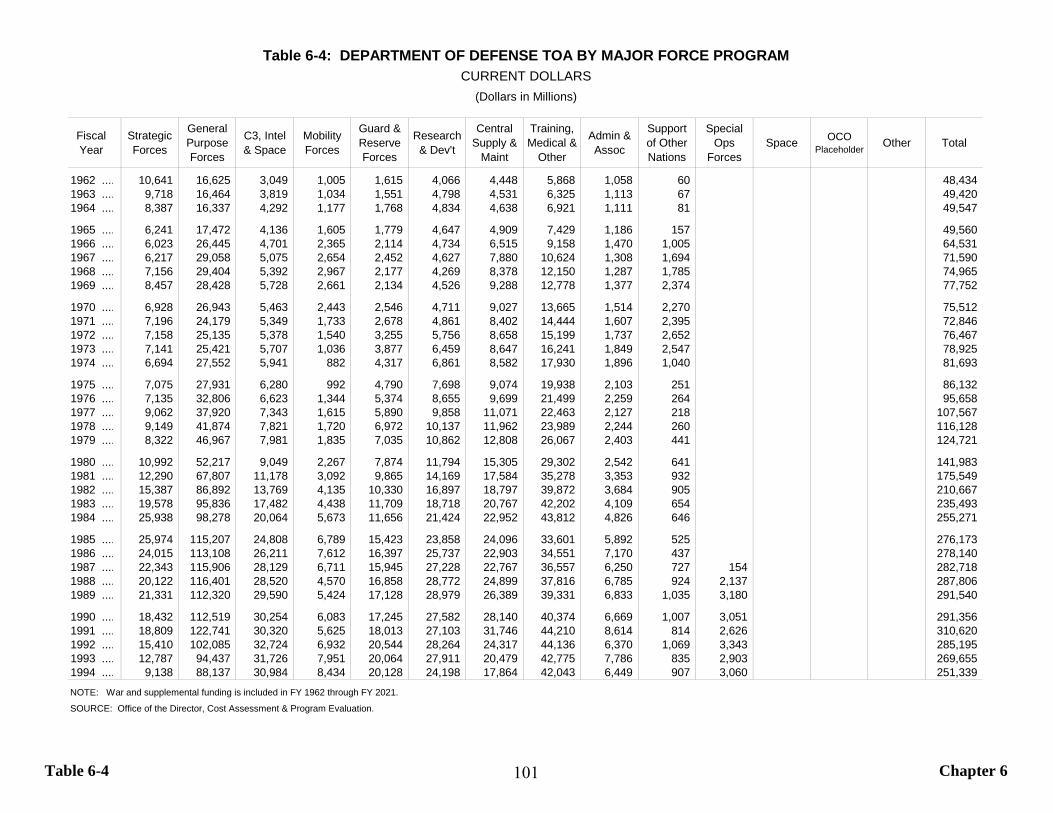
Table 6-4 Chapter 6
Fiscal Year
Strategic Forces
General Purpose Forces
C3, Intel& Space
Mobility Forces
Guard & Reserve Forces
Research & Dev't
Central Supply &
Maint
Training, Medical &
Other
Admin & Assoc
Supportof OtherNations
Special Ops
ForcesSpace OCO
Placeholder Other Total
1962 .... 10,641 16,625 3,049 1,005 1,615 4,066 4,448 5,868 1,058 60 48,434 1963 .... 9,718 16,464 3,819 1,034 1,551 4,798 4,531 6,325 1,113 67 49,420 1964 .... 8,387 16,337 4,292 1,177 1,768 4,834 4,638 6,921 1,111 81 49,547
1965 .... 6,241 17,472 4,136 1,605 1,779 4,647 4,909 7,429 1,186 157 49,560 1966 .... 6,023 26,445 4,701 2,365 2,114 4,734 6,515 9,158 1,470 1,005 64,531 1967 .... 6,217 29,058 5,075 2,654 2,452 4,627 7,880 10,624 1,308 1,694 71,590 1968 .... 7,156 29,404 5,392 2,967 2,177 4,269 8,378 12,150 1,287 1,785 74,965 1969 .... 8,457 28,428 5,728 2,661 2,134 4,526 9,288 12,778 1,377 2,374 77,752
1970 .... 6,928 26,943 5,463 2,443 2,546 4,711 9,027 13,665 1,514 2,270 75,512 1971 .... 7,196 24,179 5,349 1,733 2,678 4,861 8,402 14,444 1,607 2,395 72,846 1972 .... 7,158 25,135 5,378 1,540 3,255 5,756 8,658 15,199 1,737 2,652 76,467 1973 .... 7,141 25,421 5,707 1,036 3,877 6,459 8,647 16,241 1,849 2,547 78,925 1974 .... 6,694 27,552 5,941 882 4,317 6,861 8,582 17,930 1,896 1,040 81,693
1975 .... 7,075 27,931 6,280 992 4,790 7,698 9,074 19,938 2,103 251 86,132 1976 .... 7,135 32,806 6,623 1,344 5,374 8,655 9,699 21,499 2,259 264 95,658 1977 .... 9,062 37,920 7,343 1,615 5,890 9,858 11,071 22,463 2,127 218 107,567 1978 .... 9,149 41,874 7,821 1,720 6,972 10,137 11,962 23,989 2,244 260 116,128 1979 .... 8,322 46,967 7,981 1,835 7,035 10,862 12,808 26,067 2,403 441 124,721
1980 .... 10,992 52,217 9,049 2,267 7,874 11,794 15,305 29,302 2,542 641 141,983 1981 .... 12,290 67,807 11,178 3,092 9,865 14,169 17,584 35,278 3,353 932 175,549 1982 .... 15,387 86,892 13,769 4,135 10,330 16,897 18,797 39,872 3,684 905 210,667 1983 .... 19,578 95,836 17,482 4,438 11,709 18,718 20,767 42,202 4,109 654 235,493 1984 .... 25,938 98,278 20,064 5,673 11,656 21,424 22,952 43,812 4,826 646 255,271
1985 .... 25,974 115,207 24,808 6,789 15,423 23,858 24,096 33,601 5,892 525 276,173 1986 .... 24,015 113,108 26,211 7,612 16,397 25,737 22,903 34,551 7,170 437 278,140 1987 .... 22,343 115,906 28,129 6,711 15,945 27,228 22,767 36,557 6,250 727 154 282,718 1988 .... 20,122 116,401 28,520 4,570 16,858 28,772 24,899 37,816 6,785 924 2,137 287,806 1989 .... 21,331 112,320 29,590 5,424 17,128 28,979 26,389 39,331 6,833 1,035 3,180 291,540
1990 .... 18,432 112,519 30,254 6,083 17,245 27,582 28,140 40,374 6,669 1,007 3,051 291,356 1991 .... 18,809 122,741 30,320 5,625 18,013 27,103 31,746 44,210 8,614 814 2,626 310,620 1992 .... 15,410 102,085 32,724 6,932 20,544 28,264 24,317 44,136 6,370 1,069 3,343 285,195 1993 .... 12,787 94,437 31,726 7,951 20,064 27,911 20,479 42,775 7,786 835 2,903 269,655 1994 .... 9,138 88,137 30,984 8,434 20,128 24,198 17,864 42,043 6,449 907 3,060 251,339 NOTE: War and supplemental funding is included in FY 1962 through FY 2021.
SOURCE: Office of the Director, Cost Assessment & Program Evaluation.
Table 6-4: DEPARTMENT OF DEFENSE TOA BY MAJOR FORCE PROGRAMCURRENT DOLLARS
(Dollars in Millions)
101
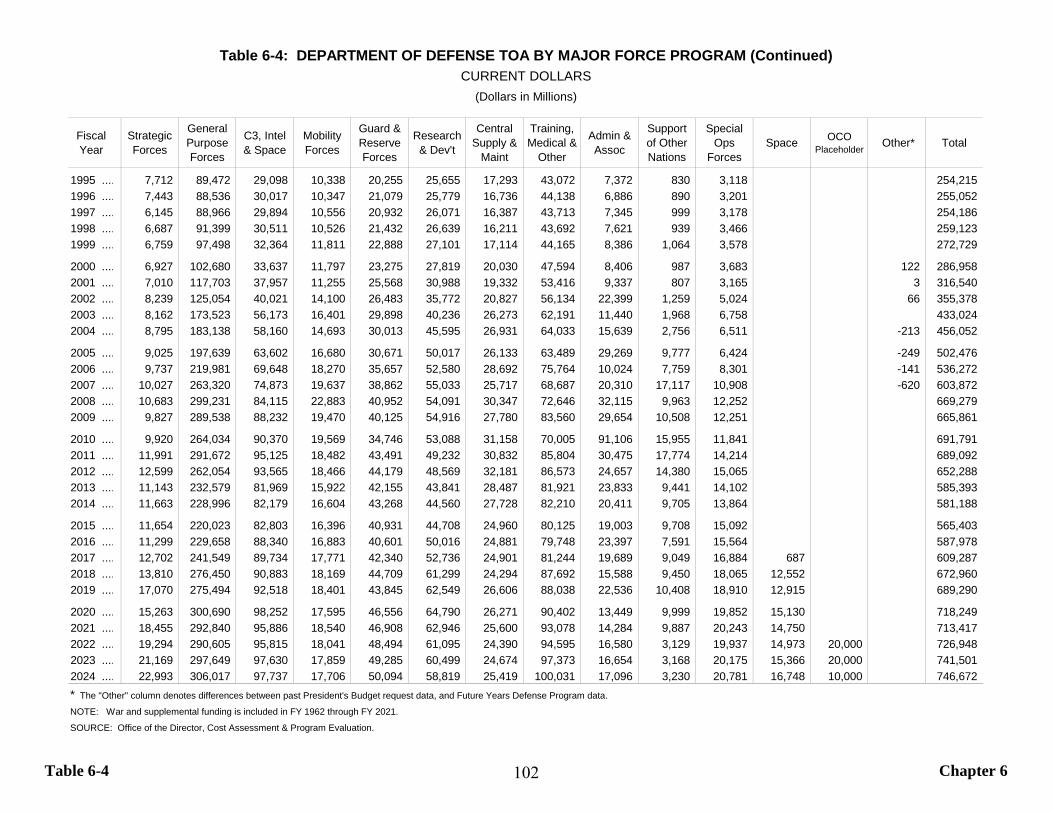
Table 6-4 Chapter 6
Fiscal Year
Strategic Forces
General Purpose Forces
C3, Intel& Space
Mobility Forces
Guard & Reserve Forces
Research & Dev't
Central Supply &
Maint
Training, Medical &
Other
Admin & Assoc
Supportof OtherNations
Special Ops
ForcesSpace OCO
Placeholder Other* Total
1995 .... 7,712 89,472 29,098 10,338 20,255 25,655 17,293 43,072 7,372 830 3,118 254,215 1996 .... 7,443 88,536 30,017 10,347 21,079 25,779 16,736 44,138 6,886 890 3,201 255,052 1997 .... 6,145 88,966 29,894 10,556 20,932 26,071 16,387 43,713 7,345 999 3,178 254,186 1998 .... 6,687 91,399 30,511 10,526 21,432 26,639 16,211 43,692 7,621 939 3,466 259,123 1999 .... 6,759 97,498 32,364 11,811 22,888 27,101 17,114 44,165 8,386 1,064 3,578 272,729
2000 .... 6,927 102,680 33,637 11,797 23,275 27,819 20,030 47,594 8,406 987 3,683 122 286,958 2001 .... 7,010 117,703 37,957 11,255 25,568 30,988 19,332 53,416 9,337 807 3,165 3 316,540 2002 .... 8,239 125,054 40,021 14,100 26,483 35,772 20,827 56,134 22,399 1,259 5,024 66 355,378 2003 .... 8,162 173,523 56,173 16,401 29,898 40,236 26,273 62,191 11,440 1,968 6,758 433,024 2004 .... 8,795 183,138 58,160 14,693 30,013 45,595 26,931 64,033 15,639 2,756 6,511 -213 456,052
2005 .... 9,025 197,639 63,602 16,680 30,671 50,017 26,133 63,489 29,269 9,777 6,424 -249 502,476 2006 .... 9,737 219,981 69,648 18,270 35,657 52,580 28,692 75,764 10,024 7,759 8,301 -141 536,272 2007 .... 10,027 263,320 74,873 19,637 38,862 55,033 25,717 68,687 20,310 17,117 10,908 -620 603,872 2008 .... 10,683 299,231 84,115 22,883 40,952 54,091 30,347 72,646 32,115 9,963 12,252 669,279 2009 .... 9,827 289,538 88,232 19,470 40,125 54,916 27,780 83,560 29,654 10,508 12,251 665,861
2010 .... 9,920 264,034 90,370 19,569 34,746 53,088 31,158 70,005 91,106 15,955 11,841 691,791 2011 .... 11,991 291,672 95,125 18,482 43,491 49,232 30,832 85,804 30,475 17,774 14,214 689,092 2012 .... 12,599 262,054 93,565 18,466 44,179 48,569 32,181 86,573 24,657 14,380 15,065 652,288 2013 .... 11,143 232,579 81,969 15,922 42,155 43,841 28,487 81,921 23,833 9,441 14,102 585,393 2014 .... 11,663 228,996 82,179 16,604 43,268 44,560 27,728 82,210 20,411 9,705 13,864 581,188
2015 .... 11,654 220,023 82,803 16,396 40,931 44,708 24,960 80,125 19,003 9,708 15,092 565,403 2016 .... 11,299 229,658 88,340 16,883 40,601 50,016 24,881 79,748 23,397 7,591 15,564 587,978 2017 .... 12,702 241,549 89,734 17,771 42,340 52,736 24,901 81,244 19,689 9,049 16,884 687 609,287 2018 .... 13,810 276,450 90,883 18,169 44,709 61,299 24,294 87,692 15,588 9,450 18,065 12,552 672,960 2019 .... 17,070 275,494 92,518 18,401 43,845 62,549 26,606 88,038 22,536 10,408 18,910 12,915 689,290
2020 .... 15,263 300,690 98,252 17,595 46,556 64,790 26,271 90,402 13,449 9,999 19,852 15,130 718,249 2021 .... 18,455 292,840 95,886 18,540 46,908 62,946 25,600 93,078 14,284 9,887 20,243 14,750 713,417 2022 .... 19,294 290,605 95,815 18,041 48,494 61,095 24,390 94,595 16,580 3,129 19,937 14,973 20,000 726,948 2023 .... 21,169 297,649 97,630 17,859 49,285 60,499 24,674 97,373 16,654 3,168 20,175 15,366 20,000 741,501 2024 .... 22,993 306,017 97,737 17,706 50,094 58,819 25,419 100,031 17,096 3,230 20,781 16,748 10,000 746,672 * The "Other" column denotes differences between past President's Budget request data, and Future Years Defense Program data.
NOTE: War and supplemental funding is included in FY 1962 through FY 2021.
SOURCE: Office of the Director, Cost Assessment & Program Evaluation.
Table 6-4: DEPARTMENT OF DEFENSE TOA BY MAJOR FORCE PROGRAM (Continued)CURRENT DOLLARS
(Dollars in Millions)
102
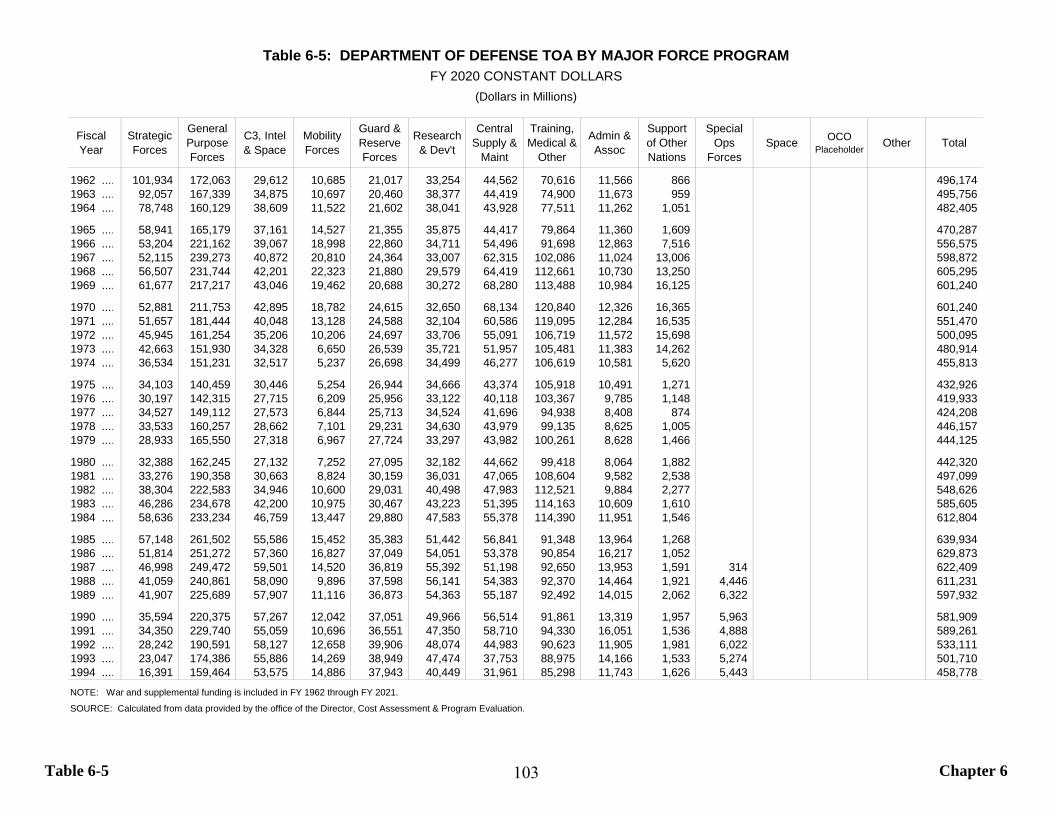
Table 6-5 Chapter 6
Fiscal Year
Strategic Forces
General Purpose Forces
C3, Intel& Space
Mobility Forces
Guard & Reserve Forces
Research & Dev't
Central Supply &
Maint
Training, Medical &
Other
Admin & Assoc
Supportof OtherNations
Special Ops
ForcesSpace OCO
Placeholder Other Total
1962 .... 101,934 172,063 29,612 10,685 21,017 33,254 44,562 70,616 11,566 866 496,174 1963 .... 92,057 167,339 34,875 10,697 20,460 38,377 44,419 74,900 11,673 959 495,756 1964 .... 78,748 160,129 38,609 11,522 21,602 38,041 43,928 77,511 11,262 1,051 482,405
1965 .... 58,941 165,179 37,161 14,527 21,355 35,875 44,417 79,864 11,360 1,609 470,287 1966 .... 53,204 221,162 39,067 18,998 22,860 34,711 54,496 91,698 12,863 7,516 556,575 1967 .... 52,115 239,273 40,872 20,810 24,364 33,007 62,315 102,086 11,024 13,006 598,872 1968 .... 56,507 231,744 42,201 22,323 21,880 29,579 64,419 112,661 10,730 13,250 605,295 1969 .... 61,677 217,217 43,046 19,462 20,688 30,272 68,280 113,488 10,984 16,125 601,240
1970 .... 52,881 211,753 42,895 18,782 24,615 32,650 68,134 120,840 12,326 16,365 601,240 1971 .... 51,657 181,444 40,048 13,128 24,588 32,104 60,586 119,095 12,284 16,535 551,470 1972 .... 45,945 161,254 35,206 10,206 24,697 33,706 55,091 106,719 11,572 15,698 500,095 1973 .... 42,663 151,930 34,328 6,650 26,539 35,721 51,957 105,481 11,383 14,262 480,914 1974 .... 36,534 151,231 32,517 5,237 26,698 34,499 46,277 106,619 10,581 5,620 455,813
1975 .... 34,103 140,459 30,446 5,254 26,944 34,666 43,374 105,918 10,491 1,271 432,926 1976 .... 30,197 142,315 27,715 6,209 25,956 33,122 40,118 103,367 9,785 1,148 419,933 1977 .... 34,527 149,112 27,573 6,844 25,713 34,524 41,696 94,938 8,408 874 424,208 1978 .... 33,533 160,257 28,662 7,101 29,231 34,630 43,979 99,135 8,625 1,005 446,157 1979 .... 28,933 165,550 27,318 6,967 27,724 33,297 43,982 100,261 8,628 1,466 444,125
1980 .... 32,388 162,245 27,132 7,252 27,095 32,182 44,662 99,418 8,064 1,882 442,320 1981 .... 33,276 190,358 30,663 8,824 30,159 36,031 47,065 108,604 9,582 2,538 497,099 1982 .... 38,304 222,583 34,946 10,600 29,031 40,498 47,983 112,521 9,884 2,277 548,626 1983 .... 46,286 234,678 42,200 10,975 30,467 43,223 51,395 114,163 10,609 1,610 585,605 1984 .... 58,636 233,234 46,759 13,447 29,880 47,583 55,378 114,390 11,951 1,546 612,804
1985 .... 57,148 261,502 55,586 15,452 35,383 51,442 56,841 91,348 13,964 1,268 639,934 1986 .... 51,814 251,272 57,360 16,827 37,049 54,051 53,378 90,854 16,217 1,052 629,873 1987 .... 46,998 249,472 59,501 14,520 36,819 55,392 51,198 92,650 13,953 1,591 314 622,409 1988 .... 41,059 240,861 58,090 9,896 37,598 56,141 54,383 92,370 14,464 1,921 4,446 611,231 1989 .... 41,907 225,689 57,907 11,116 36,873 54,363 55,187 92,492 14,015 2,062 6,322 597,932
1990 .... 35,594 220,375 57,267 12,042 37,051 49,966 56,514 91,861 13,319 1,957 5,963 581,909 1991 .... 34,350 229,740 55,059 10,696 36,551 47,350 58,710 94,330 16,051 1,536 4,888 589,261 1992 .... 28,242 190,591 58,127 12,658 39,906 48,074 44,983 90,623 11,905 1,981 6,022 533,111 1993 .... 23,047 174,386 55,886 14,269 38,949 47,474 37,753 88,975 14,166 1,533 5,274 501,710 1994 .... 16,391 159,464 53,575 14,886 37,943 40,449 31,961 85,298 11,743 1,626 5,443 458,778 NOTE: War and supplemental funding is included in FY 1962 through FY 2021.
SOURCE: Calculated from data provided by the office of the Director, Cost Assessment & Program Evaluation.
Table 6-5: DEPARTMENT OF DEFENSE TOA BY MAJOR FORCE PROGRAMFY 2020 CONSTANT DOLLARS
(Dollars in Millions)
103
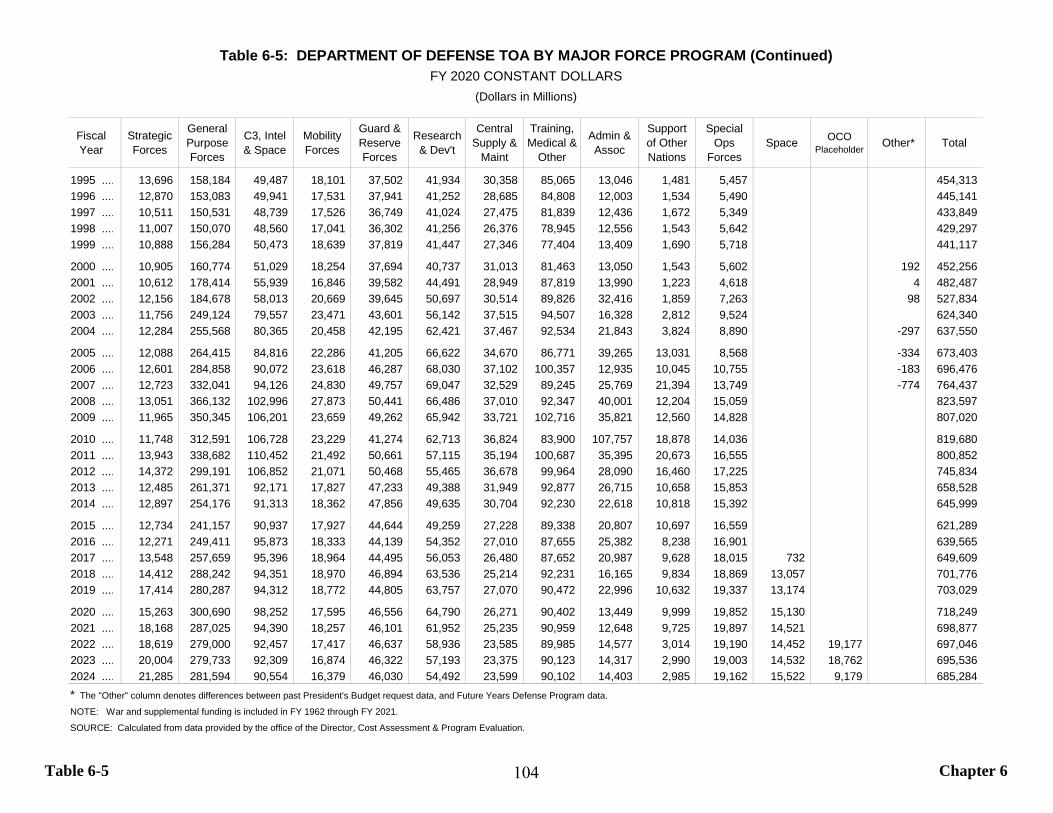
Table 6-5 Chapter 6
Fiscal Year
Strategic Forces
General Purpose Forces
C3, Intel& Space
Mobility Forces
Guard & Reserve Forces
Research & Dev't
Central Supply &
Maint
Training, Medical &
Other
Admin & Assoc
Supportof OtherNations
Special Ops
ForcesSpace OCO
Placeholder Other* Total
1995 .... 13,696 158,184 49,487 18,101 37,502 41,934 30,358 85,065 13,046 1,481 5,457 454,313 1996 .... 12,870 153,083 49,941 17,531 37,941 41,252 28,685 84,808 12,003 1,534 5,490 445,141 1997 .... 10,511 150,531 48,739 17,526 36,749 41,024 27,475 81,839 12,436 1,672 5,349 433,849 1998 .... 11,007 150,070 48,560 17,041 36,302 41,256 26,376 78,945 12,556 1,543 5,642 429,297 1999 .... 10,888 156,284 50,473 18,639 37,819 41,447 27,346 77,404 13,409 1,690 5,718 441,117
2000 .... 10,905 160,774 51,029 18,254 37,694 40,737 31,013 81,463 13,050 1,543 5,602 192 452,256 2001 .... 10,612 178,414 55,939 16,846 39,582 44,491 28,949 87,819 13,990 1,223 4,618 4 482,487 2002 .... 12,156 184,678 58,013 20,669 39,645 50,697 30,514 89,826 32,416 1,859 7,263 98 527,834 2003 .... 11,756 249,124 79,557 23,471 43,601 56,142 37,515 94,507 16,328 2,812 9,524 624,340 2004 .... 12,284 255,568 80,365 20,458 42,195 62,421 37,467 92,534 21,843 3,824 8,890 -297 637,550
2005 .... 12,088 264,415 84,816 22,286 41,205 66,622 34,670 86,771 39,265 13,031 8,568 -334 673,403 2006 .... 12,601 284,858 90,072 23,618 46,287 68,030 37,102 100,357 12,935 10,045 10,755 -183 696,476 2007 .... 12,723 332,041 94,126 24,830 49,757 69,047 32,529 89,245 25,769 21,394 13,749 -774 764,437 2008 .... 13,051 366,132 102,996 27,873 50,441 66,486 37,010 92,347 40,001 12,204 15,059 823,597 2009 .... 11,965 350,345 106,201 23,659 49,262 65,942 33,721 102,716 35,821 12,560 14,828 807,020
2010 .... 11,748 312,591 106,728 23,229 41,274 62,713 36,824 83,900 107,757 18,878 14,036 819,680 2011 .... 13,943 338,682 110,452 21,492 50,661 57,115 35,194 100,687 35,395 20,673 16,555 800,852 2012 .... 14,372 299,191 106,852 21,071 50,468 55,465 36,678 99,964 28,090 16,460 17,225 745,834 2013 .... 12,485 261,371 92,171 17,827 47,233 49,388 31,949 92,877 26,715 10,658 15,853 658,528 2014 .... 12,897 254,176 91,313 18,362 47,856 49,635 30,704 92,230 22,618 10,818 15,392 645,999
2015 .... 12,734 241,157 90,937 17,927 44,644 49,259 27,228 89,338 20,807 10,697 16,559 621,289 2016 .... 12,271 249,411 95,873 18,333 44,139 54,352 27,010 87,655 25,382 8,238 16,901 639,565 2017 .... 13,548 257,659 95,396 18,964 44,495 56,053 26,480 87,652 20,987 9,628 18,015 732 649,609 2018 .... 14,412 288,242 94,351 18,970 46,894 63,536 25,214 92,231 16,165 9,834 18,869 13,057 701,776 2019 .... 17,414 280,287 94,312 18,772 44,805 63,757 27,070 90,472 22,996 10,632 19,337 13,174 703,029
2020 .... 15,263 300,690 98,252 17,595 46,556 64,790 26,271 90,402 13,449 9,999 19,852 15,130 718,249 2021 .... 18,168 287,025 94,390 18,257 46,101 61,952 25,235 90,959 12,648 9,725 19,897 14,521 698,877 2022 .... 18,619 279,000 92,457 17,417 46,637 58,936 23,585 89,985 14,577 3,014 19,190 14,452 19,177 697,046 2023 .... 20,004 279,733 92,309 16,874 46,322 57,193 23,375 90,123 14,317 2,990 19,003 14,532 18,762 695,536 2024 .... 21,285 281,594 90,554 16,379 46,030 54,492 23,599 90,102 14,403 2,985 19,162 15,522 9,179 685,284 * The "Other" column denotes differences between past President's Budget request data, and Future Years Defense Program data.
NOTE: War and supplemental funding is included in FY 1962 through FY 2021.
SOURCE: Calculated from data provided by the office of the Director, Cost Assessment & Program Evaluation.
Table 6-5: DEPARTMENT OF DEFENSE TOA BY MAJOR FORCE PROGRAM (Continued)FY 2020 CONSTANT DOLLARS
(Dollars in Millions)
104
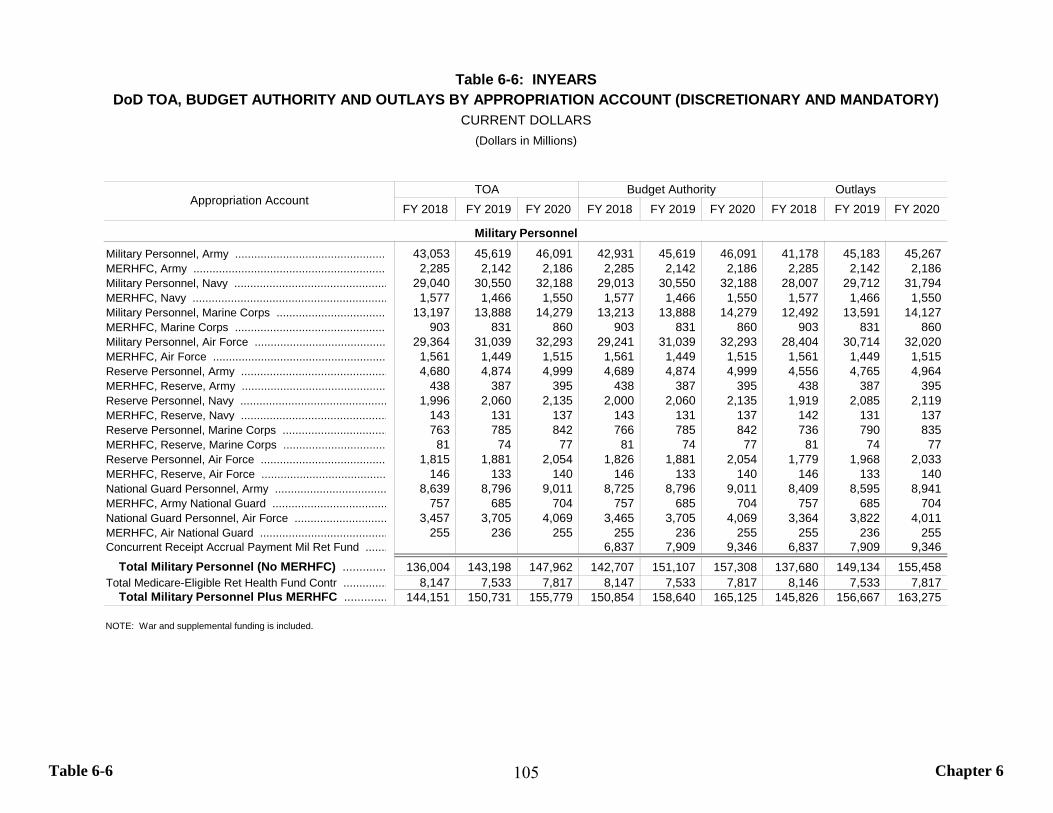
Table 6-6 Chapter 6
FY 2018 FY 2019 FY 2020 FY 2018 FY 2019 FY 2020 FY 2018 FY 2019 FY 2020
Military Personnel, Army ................................................ 43,053 45,619 46,091 42,931 45,619 46,091 41,178 45,183 45,267 MERHFC, Army ............................................................. 2,285 2,142 2,186 2,285 2,142 2,186 2,285 2,142 2,186 Military Personnel, Navy ................................................ 29,040 30,550 32,188 29,013 30,550 32,188 28,007 29,712 31,794 MERHFC, Navy ............................................................. 1,577 1,466 1,550 1,577 1,466 1,550 1,577 1,466 1,550 Military Personnel, Marine Corps ................................... 13,197 13,888 14,279 13,213 13,888 14,279 12,492 13,591 14,127 MERHFC, Marine Corps ................................................ 903 831 860 903 831 860 903 831 860 Military Personnel, Air Force ......................................... 29,364 31,039 32,293 29,241 31,039 32,293 28,404 30,714 32,020 MERHFC, Air Force ....................................................... 1,561 1,449 1,515 1,561 1,449 1,515 1,561 1,449 1,515 Reserve Personnel, Army .............................................. 4,680 4,874 4,999 4,689 4,874 4,999 4,556 4,765 4,964 MERHFC, Reserve, Army .............................................. 438 387 395 438 387 395 438 387 395 Reserve Personnel, Navy .............................................. 1,996 2,060 2,135 2,000 2,060 2,135 1,919 2,085 2,119 MERHFC, Reserve, Navy .............................................. 143 131 137 143 131 137 142 131 137 Reserve Personnel, Marine Corps ................................. 763 785 842 766 785 842 736 790 835 MERHFC, Reserve, Marine Corps ................................. 81 74 77 81 74 77 81 74 77 Reserve Personnel, Air Force ........................................ 1,815 1,881 2,054 1,826 1,881 2,054 1,779 1,968 2,033 MERHFC, Reserve, Air Force ....................................... 146 133 140 146 133 140 146 133 140 National Guard Personnel, Army ................................... 8,639 8,796 9,011 8,725 8,796 9,011 8,409 8,595 8,941 MERHFC, Army National Guard .................................... 757 685 704 757 685 704 757 685 704 National Guard Personnel, Air Force ............................. 3,457 3,705 4,069 3,465 3,705 4,069 3,364 3,822 4,011 MERHFC, Air National Guard ........................................ 255 236 255 255 236 255 255 236 255 Concurrent Receipt Accrual Payment Mil Ret Fund ....... 6,837 7,909 9,346 6,837 7,909 9,346
Total Military Personnel (No MERHFC) ............. 136,004 143,198 147,962 142,707 151,107 157,308 137,680 149,134 155,458 Total Medicare-Eligible Ret Health Fund Contr .............. 8,147 7,533 7,817 8,147 7,533 7,817 8,146 7,533 7,817
Total Military Personnel Plus MERHFC ............. 144,151 150,731 155,779 150,854 158,640 165,125 145,826 156,667 163,275
NOTE: War and supplemental funding is included.
Military Personnel
Table 6-6: INYEARS
CURRENT DOLLARSDoD TOA, BUDGET AUTHORITY AND OUTLAYS BY APPROPRIATION ACCOUNT (DISCRETIONARY AND MANDATORY)
TOA Budget Authority OutlaysAppropriation Account
(Dollars in Millions)
105
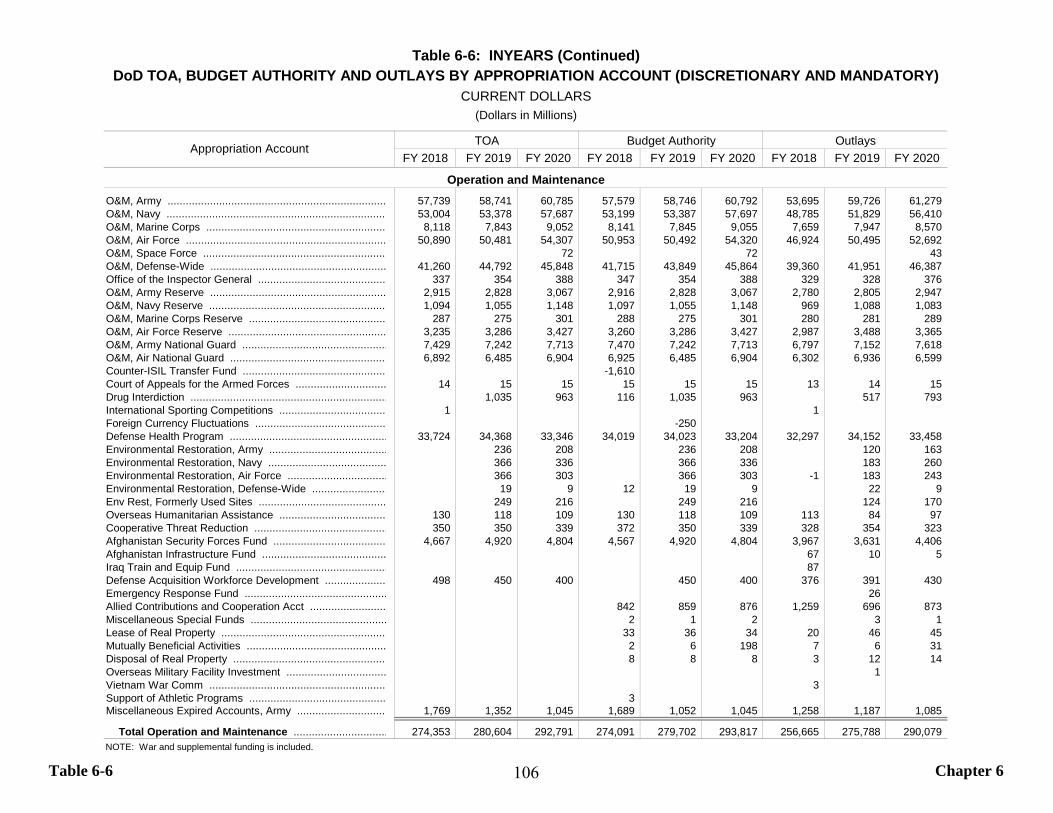
Table 6-6 Chapter 6
FY 2018 FY 2019 FY 2020 FY 2018 FY 2019 FY 2020 FY 2018 FY 2019 FY 2020
O&M, Army ........................................................................ 57,739 58,741 60,785 57,579 58,746 60,792 53,695 59,726 61,279 O&M, Navy ......................................................................... 53,004 53,378 57,687 53,199 53,387 57,697 48,785 51,829 56,410 O&M, Marine Corps ............................................................ 8,118 7,843 9,052 8,141 7,845 9,055 7,659 7,947 8,570 O&M, Air Force .................................................................. 50,890 50,481 54,307 50,953 50,492 54,320 46,924 50,495 52,692 O&M, Space Force ............................................................. 72 72 43 O&M, Defense-Wide .......................................................... 41,260 44,792 45,848 41,715 43,849 45,864 39,360 41,951 46,387 Office of the Inspector General ........................................... 337 354 388 347 354 388 329 328 376 O&M, Army Reserve .......................................................... 2,915 2,828 3,067 2,916 2,828 3,067 2,780 2,805 2,947 O&M, Navy Reserve ........................................................... 1,094 1,055 1,148 1,097 1,055 1,148 969 1,088 1,083 O&M, Marine Corps Reserve .............................................. 287 275 301 288 275 301 280 281 289 O&M, Air Force Reserve .................................................... 3,235 3,286 3,427 3,260 3,286 3,427 2,987 3,488 3,365 O&M, Army National Guard ................................................ 7,429 7,242 7,713 7,470 7,242 7,713 6,797 7,152 7,618 O&M, Air National Guard .................................................... 6,892 6,485 6,904 6,925 6,485 6,904 6,302 6,936 6,599 Counter-ISIL Transfer Fund ................................................ -1,610 Court of Appeals for the Armed Forces .............................. 14 15 15 15 15 15 13 14 15 Drug Interdiction ................................................................. 1,035 963 116 1,035 963 517 793 International Sporting Competitions .................................... 1 1 Foreign Currency Fluctuations ........................................... -250 Defense Health Program .................................................... 33,724 34,368 33,346 34,019 34,023 33,204 32,297 34,152 33,458 Environmental Restoration, Army ....................................... 236 208 236 208 120 163 Environmental Restoration, Navy ....................................... 366 336 366 336 183 260 Environmental Restoration, Air Force ................................. 366 303 366 303 -1 183 243 Environmental Restoration, Defense-Wide ......................... 19 9 12 19 9 22 9 Env Rest, Formerly Used Sites .......................................... 249 216 249 216 124 170 Overseas Humanitarian Assistance .................................... 130 118 109 130 118 109 113 84 97 Cooperative Threat Reduction ............................................ 350 350 339 372 350 339 328 354 323 Afghanistan Security Forces Fund ..................................... 4,667 4,920 4,804 4,567 4,920 4,804 3,967 3,631 4,406 Afghanistan Infrastructure Fund ......................................... 67 10 5 Iraq Train and Equip Fund .................................................. 87 Defense Acquisition Workforce Development .................... 498 450 400 450 400 376 391 430 Emergency Response Fund ............................................... 26 Allied Contributions and Cooperation Acct ......................... 842 859 876 1,259 696 873 Miscellaneous Special Funds ............................................. 2 1 2 3 1 Lease of Real Property ....................................................... 33 36 34 20 46 45 Mutually Beneficial Activities .............................................. 2 6 198 7 6 31 Disposal of Real Property ................................................... 8 8 8 3 12 14 Overseas Military Facility Investment ................................. 1 Vietnam War Comm ........................................................... 3 Support of Athletic Programs ............................................. 3 Miscellaneous Expired Accounts, Army .............................. 1,769 1,352 1,045 1,689 1,052 1,045 1,258 1,187 1,085
Total Operation and Maintenance ............................... 274,353 280,604 292,791 274,091 279,702 293,817 256,665 275,788 290,079 NOTE: War and supplemental funding is included.
Operation and Maintenance
Table 6-6: INYEARS (Continued)DoD TOA, BUDGET AUTHORITY AND OUTLAYS BY APPROPRIATION ACCOUNT (DISCRETIONARY AND MANDATORY)
CURRENT DOLLARS
Appropriation Account TOA Budget Authority Outlays
(Dollars in Millions)
106
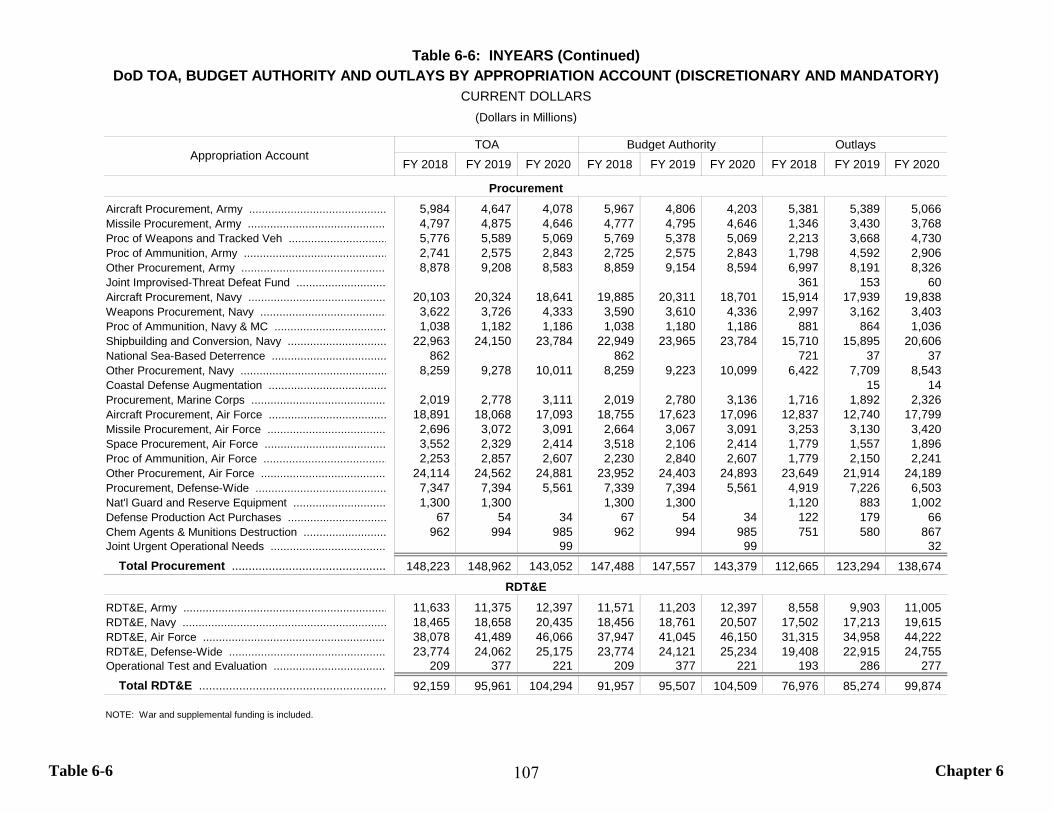
Table 6-6 Chapter 6
FY 2018 FY 2019 FY 2020 FY 2018 FY 2019 FY 2020 FY 2018 FY 2019 FY 2020
Aircraft Procurement, Army ........................................... 5,984 4,647 4,078 5,967 4,806 4,203 5,381 5,389 5,066 Missile Procurement, Army ............................................ 4,797 4,875 4,646 4,777 4,795 4,646 1,346 3,430 3,768 Proc of Weapons and Tracked Veh ............................... 5,776 5,589 5,069 5,769 5,378 5,069 2,213 3,668 4,730 Proc of Ammunition, Army ............................................. 2,741 2,575 2,843 2,725 2,575 2,843 1,798 4,592 2,906 Other Procurement, Army .............................................. 8,878 9,208 8,583 8,859 9,154 8,594 6,997 8,191 8,326 Joint Improvised-Threat Defeat Fund ............................ 361 153 60 Aircraft Procurement, Navy ........................................... 20,103 20,324 18,641 19,885 20,311 18,701 15,914 17,939 19,838 Weapons Procurement, Navy ........................................ 3,622 3,726 4,333 3,590 3,610 4,336 2,997 3,162 3,403 Proc of Ammunition, Navy & MC ................................... 1,038 1,182 1,186 1,038 1,180 1,186 881 864 1,036 Shipbuilding and Conversion, Navy ............................... 22,963 24,150 23,784 22,949 23,965 23,784 15,710 15,895 20,606 National Sea-Based Deterrence .................................... 862 862 721 37 37 Other Procurement, Navy .............................................. 8,259 9,278 10,011 8,259 9,223 10,099 6,422 7,709 8,543 Coastal Defense Augmentation ..................................... 15 14 Procurement, Marine Corps ........................................... 2,019 2,778 3,111 2,019 2,780 3,136 1,716 1,892 2,326 Aircraft Procurement, Air Force ..................................... 18,891 18,068 17,093 18,755 17,623 17,096 12,837 12,740 17,799 Missile Procurement, Air Force ..................................... 2,696 3,072 3,091 2,664 3,067 3,091 3,253 3,130 3,420 Space Procurement, Air Force ...................................... 3,552 2,329 2,414 3,518 2,106 2,414 1,779 1,557 1,896 Proc of Ammunition, Air Force ....................................... 2,253 2,857 2,607 2,230 2,840 2,607 1,779 2,150 2,241 Other Procurement, Air Force ........................................ 24,114 24,562 24,881 23,952 24,403 24,893 23,649 21,914 24,189 Procurement, Defense-Wide ......................................... 7,347 7,394 5,561 7,339 7,394 5,561 4,919 7,226 6,503 Nat'l Guard and Reserve Equipment ............................. 1,300 1,300 1,300 1,300 1,120 883 1,002 Defense Production Act Purchases ............................... 67 54 34 67 54 34 122 179 66 Chem Agents & Munitions Destruction .......................... 962 994 985 962 994 985 751 580 867 Joint Urgent Operational Needs .................................... 99 99 32
Total Procurement .............................................. 148,223 148,962 143,052 147,488 147,557 143,379 112,665 123,294 138,674
RDT&E, Army ................................................................ 11,633 11,375 12,397 11,571 11,203 12,397 8,558 9,903 11,005 RDT&E, Navy ................................................................ 18,465 18,658 20,435 18,456 18,761 20,507 17,502 17,213 19,615 RDT&E, Air Force .......................................................... 38,078 41,489 46,066 37,947 41,045 46,150 31,315 34,958 44,222 RDT&E, Defense-Wide .................................................. 23,774 24,062 25,175 23,774 24,121 25,234 19,408 22,915 24,755 Operational Test and Evaluation .................................... 209 377 221 209 377 221 193 286 277
Total RDT&E ........................................................ 92,159 95,961 104,294 91,957 95,507 104,509 76,976 85,274 99,874
NOTE: War and supplemental funding is included.
Procurement
RDT&E
Table 6-6: INYEARS (Continued)DoD TOA, BUDGET AUTHORITY AND OUTLAYS BY APPROPRIATION ACCOUNT (DISCRETIONARY AND MANDATORY)
CURRENT DOLLARS
Appropriation AccountTOA Budget Authority Outlays
(Dollars in Millions)
107

Table 6-6 Chapter 6
FY 2018 FY 2019 FY 2020 FY 2018 FY 2019 FY 2020 FY 2018 FY 2019 FY 2020
Military Construction, Army ............................................ 1,186 1,338 10,843 1,184 1,338 10,843 969 1,045 1,091 Military Construction, Navy & MC .................................. 1,993 2,593 2,900 1,990 2,593 2,900 1,505 1,587 1,835 Military Construction, Air Force ..................................... 2,235 2,024 2,494 2,228 1,992 2,494 852 988 1,575 Military Construction, Defense-Wide ............................. 3,056 2,638 2,550 3,056 2,638 2,550 2,244 2,373 2,552 NATO Security Investment ............................................ 334 171 144 153 146 144 115 482 394 Mil Construction, Army Nat'l Guard ................................ 853 212 211 853 202 211 234 473 474 Mil Construction, Air Nat'l Guard ................................... 223 183 166 223 183 166 84 234 208 Mil Construction, Army Reserve .................................... 160 88 61 160 88 61 169 64 161 Mil Construction, Navy Reserve .................................... 95 43 55 95 43 55 25 69 64 Mil Construction, Air Force Reserve .............................. 138 123 60 138 123 60 109 110 124 Chem Demil Construction .............................................. 1 10 8 DoD BRAC, Army .......................................................... 102 63 66 58 63 66 227 35 149 DoD BRAC, Navy .......................................................... 216 212 158 198 212 158 60 277 146 DoD BRAC, Air Force .................................................... 70 67 54 54 67 54 60 64 145 DoD BRAC, Defense-Wide ............................................ 3 11 BRAC, Army (1990) ....................................................... 3 17 4 BRAC, Navy (1990) ....................................................... 9 -3 4 BRAC, Air Force (1990) ................................................. 3 7 BRAC, Defense-Wide (1990) ........................................ 3 6 FY 2005 BRAC, Army .................................................... 14 29 18 FY 2005 BRAC, Navy .................................................... 4 29 18 FY 2005 BRAC, Air Force .............................................. 2 29 18
Military Construction .......................................... 10,669 9,754 19,762 10,391 9,688 19,762 6,706 7,915 8,993
Family Housing Construction, Army ............................... 183 331 141 165 331 141 105 118 148 Family Housing O&M, Army .......................................... 363 377 358 349 377 358 334 387 408 Family Housing Construction, Navy & MC ..................... 88 105 48 84 102 48 28 85 80 Family Housing O&M, Navy & MC ................................. 337 315 318 328 315 318 290 296 349 Family Housing Construction, Air Force ........................ 105 78 104 85 78 104 14 90 91 Family Housing O&M, Air Force .................................... 317 317 295 318 317 295 277 290 286 Family Housing O&M, D-W ........................................... 58 58 57 59 58 57 51 50 56 Homeowners Assistance Fund ...................................... 2 -15Family Housing Improvement Fund ............................... 36 41 3 36 41 3 56 75 11 Unaccompanied Housing Improvement Fund ................ 1 1 1 1 1
Total Family Housing .......................................... 1,488 1,622 1,324 1,425 1,604 1,324 1,157 1,392 1,430 NOTE: War and supplemental funding is included.
Military Construction
Family Housing
Table 6-6: INYEARS (Continued)DoD TOA, BUDGET AUTHORITY AND OUTLAYS BY APPROPRIATION ACCOUNT (DISCRETIONARY AND MANDATORY)
CURRENT DOLLARS
Appropriation AccountTOA Budget Authority Outlays
(Dollars in Millions)
108

Table 6-6 Chapter 6
FY 2018 FY 2019 FY 2020 FY 2018 FY 2019 FY 2020 FY 2018 FY 2019 FY 2020
National Defense Stockpile Fund ................................... -21 -1 45 Pentagon Reservation Maint Rev Fund ......................... 3 135 21 National Defense Sealift Fund ....................................... 226 201 147 57 30 Working Capital Fund, Army .......................................... 270 264 110 1,031 264 110 -305 64 657 Working Capital Fund, Navy .......................................... 3,818 -243 575 640 Working Capital Fund, Air Force ................................... 69 78 92 1,171 78 92 754 619 -12Working Capital Fund, Defense ..................................... 59 48 49 12,329 48 49 1,216 63 538 Working Capital Fund, DCSA ........................................ 200 -209Working Capital Fund, DECA ........................................ 1,293 1,266 995 1,277 1,266 995 1,217 1,362 1,188 Buildings Maintenance Fund ......................................... -10 51
Total Revolving and Management Funds ......... 1,917 1,656 1,246 19,828 1,656 1,446 2,759 2,924 2,898
Voluntary Separation Trust Fund ................................... 62 54 46 62 55 47 Host Nation Support ...................................................... 136 139 142 82 264 142 DoD General Gift Fund .................................................. 1 1 National Security Education Trust ................................. 1 Foreign National Employees Separation Pay ................. 3 44 44 4 253 208 Surcharge Collections, Commissary .............................. -27 -6 -1Army Gift Fund .............................................................. 26 5 4 28 5 4 Air Force Gift Fund ........................................................ 5 1 1 3 5 6 Ships Stores Profit ......................................................... 12 3 6 11 10 6 USNA Gift Fund ............................................................. 16 9 8 17 8 7 Navy Gift Fund .............................................................. 2 1 1 1 1 1 Support for US Relocation to Guam .............................. 536 194 219 52 122 525
Total Trust Funds ................................................ 799 451 471 235 718 946
Foreign National Employees Separation Trust ............... -3 -44 -44 -3 -44 -44Payment to VSI ............................................................. -37 -31 -27 -37 -31 -27Profits from Sales of Ships Stores ................................. -11 -20 -20 -11 -20 -20
Total Interfund Transactions .............................. -51 -95 -91 -51 -95 -91
NOTE: War and supplemental funding is included.
Revolving and Management Funds
Interfund Transactions
Trust Funds
Table 6-6: INYEARS (Continued)DoD TOA, BUDGET AUTHORITY AND OUTLAYS BY APPROPRIATION ACCOUNT (DISCRETIONARY AND MANDATORY)
CURRENT DOLLARS
Appropriation Account TOA Budget Authority Outlays
(Dollars in Millions)
109
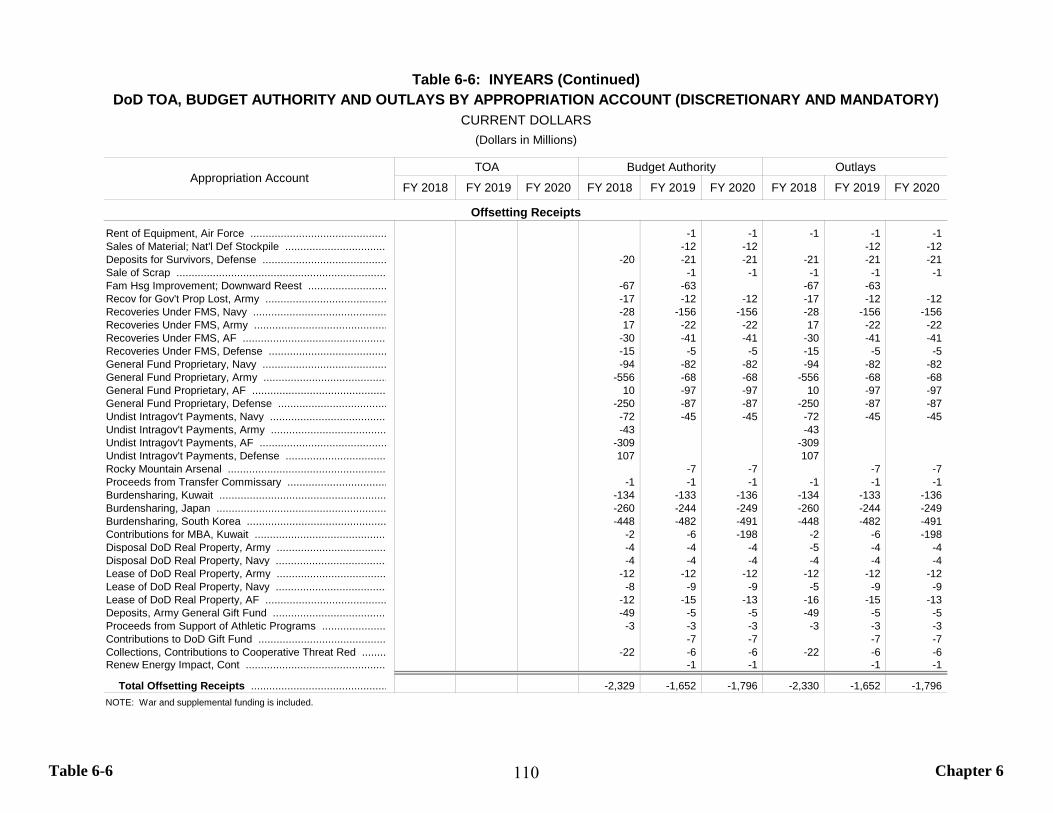
Table 6-6 Chapter 6
FY 2018 FY 2019 FY 2020 FY 2018 FY 2019 FY 2020 FY 2018 FY 2019 FY 2020
Rent of Equipment, Air Force ............................................. -1 -1 -1 -1 -1Sales of Material; Nat'l Def Stockpile .................................. -12 -12 -12 -12Deposits for Survivors, Defense ......................................... -20 -21 -21 -21 -21 -21Sale of Scrap ..................................................................... -1 -1 -1 -1 -1Fam Hsg Improvement; Downward Reest .......................... -67 -63 -67 -63Recov for Gov't Prop Lost, Army ........................................ -17 -12 -12 -17 -12 -12Recoveries Under FMS, Navy ............................................ -28 -156 -156 -28 -156 -156Recoveries Under FMS, Army ............................................ 17 -22 -22 17 -22 -22Recoveries Under FMS, AF ................................................ -30 -41 -41 -30 -41 -41Recoveries Under FMS, Defense ....................................... -15 -5 -5 -15 -5 -5General Fund Proprietary, Navy ......................................... -94 -82 -82 -94 -82 -82General Fund Proprietary, Army ......................................... -556 -68 -68 -556 -68 -68General Fund Proprietary, AF ............................................ 10 -97 -97 10 -97 -97General Fund Proprietary, Defense .................................... -250 -87 -87 -250 -87 -87Undist Intragov't Payments, Navy ....................................... -72 -45 -45 -72 -45 -45Undist Intragov't Payments, Army ...................................... -43 -43Undist Intragov't Payments, AF .......................................... -309 -309Undist Intragov't Payments, Defense ................................. 107 107Rocky Mountain Arsenal .................................................... -7 -7 -7 -7Proceeds from Transfer Commissary ................................. -1 -1 -1 -1 -1 -1Burdensharing, Kuwait ....................................................... -134 -133 -136 -134 -133 -136Burdensharing, Japan ........................................................ -260 -244 -249 -260 -244 -249Burdensharing, South Korea .............................................. -448 -482 -491 -448 -482 -491Contributions for MBA, Kuwait ............................................ -2 -6 -198 -2 -6 -198Disposal DoD Real Property, Army .................................... -4 -4 -4 -5 -4 -4Disposal DoD Real Property, Navy ..................................... -4 -4 -4 -4 -4 -4Lease of DoD Real Property, Army .................................... -12 -12 -12 -12 -12 -12Lease of DoD Real Property, Navy ..................................... -8 -9 -9 -5 -9 -9Lease of DoD Real Property, AF ........................................ -12 -15 -13 -16 -15 -13Deposits, Army General Gift Fund ...................................... -49 -5 -5 -49 -5 -5Proceeds from Support of Athletic Programs ..................... -3 -3 -3 -3 -3 -3Contributions to DoD Gift Fund .......................................... -7 -7 -7 -7Collections, Contributions to Cooperative Threat Red ........ -22 -6 -6 -22 -6 -6Renew Energy Impact, Cont ............................................... -1 -1 -1 -1
Total Offsetting Receipts ............................................. -2,329 -1,652 -1,796 -2,330 -1,652 -1,796NOTE: War and supplemental funding is included.
Offsetting Receipts
Table 6-6: INYEARS (Continued)DoD TOA, BUDGET AUTHORITY AND OUTLAYS BY APPROPRIATION ACCOUNT (DISCRETIONARY AND MANDATORY)
CURRENT DOLLARS
Appropriation AccountTOA Budget Authority Outlays
(Dollars in Millions)
110
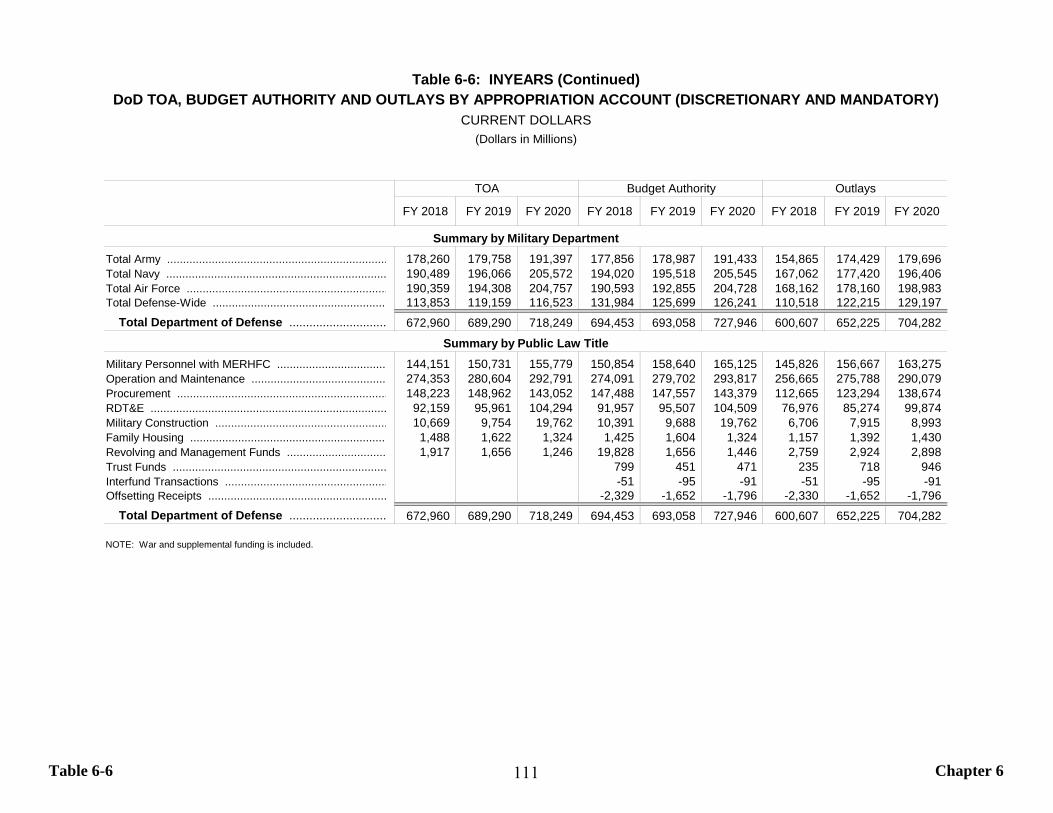
Table 6-6 Chapter 6
FY 2018 FY 2019 FY 2020 FY 2018 FY 2019 FY 2020 FY 2018 FY 2019 FY 2020
Total Army ..................................................................... 178,260 179,758 191,397 177,856 178,987 191,433 154,865 174,429 179,696 Total Navy ..................................................................... 190,489 196,066 205,572 194,020 195,518 205,545 167,062 177,420 196,406 Total Air Force ............................................................... 190,359 194,308 204,757 190,593 192,855 204,728 168,162 178,160 198,983 Total Defense-Wide ....................................................... 113,853 119,159 116,523 131,984 125,699 126,241 110,518 122,215 129,197
Total Department of Defense ............................. 672,960 689,290 718,249 694,453 693,058 727,946 600,607 652,225 704,282
Military Personnel with MERHFC .................................. 144,151 150,731 155,779 150,854 158,640 165,125 145,826 156,667 163,275 Operation and Maintenance .......................................... 274,353 280,604 292,791 274,091 279,702 293,817 256,665 275,788 290,079 Procurement .................................................................. 148,223 148,962 143,052 147,488 147,557 143,379 112,665 123,294 138,674 RDT&E .......................................................................... 92,159 95,961 104,294 91,957 95,507 104,509 76,976 85,274 99,874 Military Construction ...................................................... 10,669 9,754 19,762 10,391 9,688 19,762 6,706 7,915 8,993 Family Housing .............................................................. 1,488 1,622 1,324 1,425 1,604 1,324 1,157 1,392 1,430 Revolving and Management Funds ............................... 1,917 1,656 1,246 19,828 1,656 1,446 2,759 2,924 2,898 Trust Funds ................................................................... 799 451 471 235 718 946 Interfund Transactions ................................................... -51 -95 -91 -51 -95 -91 Offsetting Receipts ........................................................ -2,329 -1,652 -1,796 -2,330 -1,652 -1,796
Total Department of Defense ............................. 672,960 689,290 718,249 694,453 693,058 727,946 600,607 652,225 704,282
NOTE: War and supplemental funding is included.
Summary by Military Department
Summary by Public Law Title
Table 6-6: INYEARS (Continued)DoD TOA, BUDGET AUTHORITY AND OUTLAYS BY APPROPRIATION ACCOUNT (DISCRETIONARY AND MANDATORY)
CURRENT DOLLARS
TOA Budget Authority Outlays
(Dollars in Millions)
111
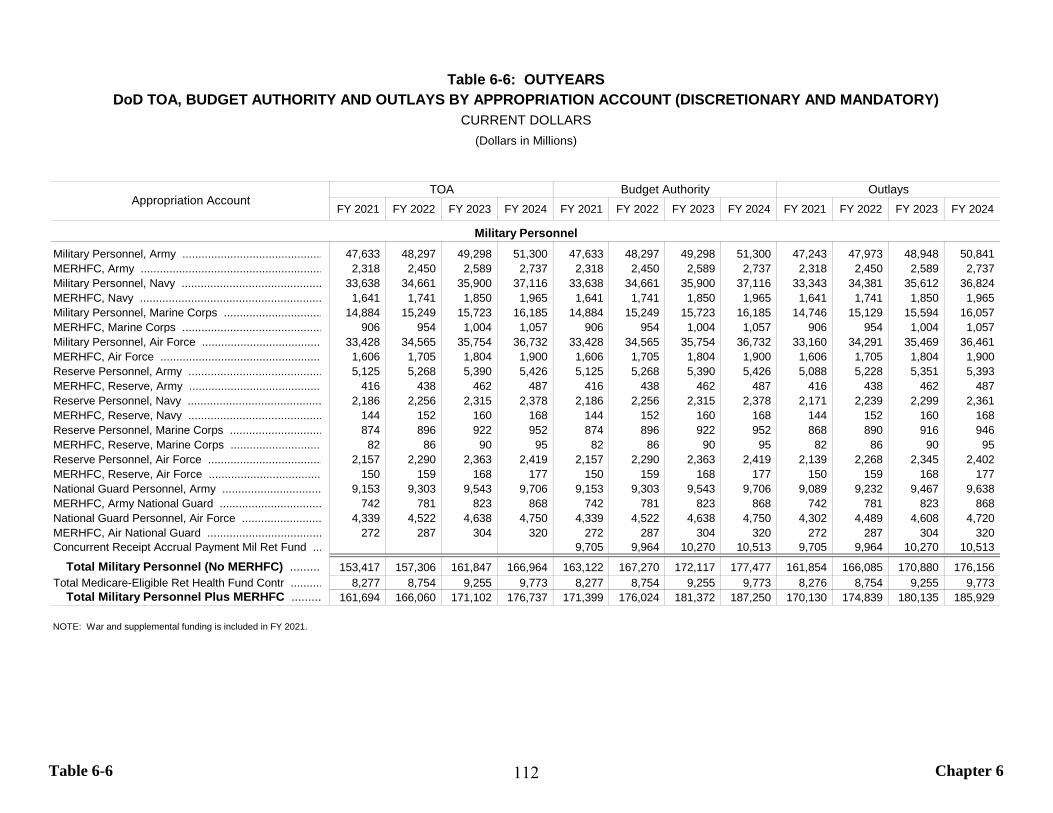
Table 6-6 Chapter 6
FY 2021 FY 2022 FY 2023 FY 2024 FY 2021 FY 2022 FY 2023 FY 2024 FY 2021 FY 2022 FY 2023 FY 2024
Military Personnel, Army ............................................ 47,633 48,297 49,298 51,300 47,633 48,297 49,298 51,300 47,243 47,973 48,948 50,841 MERHFC, Army ......................................................... 2,318 2,450 2,589 2,737 2,318 2,450 2,589 2,737 2,318 2,450 2,589 2,737 Military Personnel, Navy ............................................ 33,638 34,661 35,900 37,116 33,638 34,661 35,900 37,116 33,343 34,381 35,612 36,824 MERHFC, Navy ......................................................... 1,641 1,741 1,850 1,965 1,641 1,741 1,850 1,965 1,641 1,741 1,850 1,965 Military Personnel, Marine Corps ............................... 14,884 15,249 15,723 16,185 14,884 15,249 15,723 16,185 14,746 15,129 15,594 16,057 MERHFC, Marine Corps ............................................ 906 954 1,004 1,057 906 954 1,004 1,057 906 954 1,004 1,057 Military Personnel, Air Force ...................................... 33,428 34,565 35,754 36,732 33,428 34,565 35,754 36,732 33,160 34,291 35,469 36,461 MERHFC, Air Force ................................................... 1,606 1,705 1,804 1,900 1,606 1,705 1,804 1,900 1,606 1,705 1,804 1,900 Reserve Personnel, Army .......................................... 5,125 5,268 5,390 5,426 5,125 5,268 5,390 5,426 5,088 5,228 5,351 5,393 MERHFC, Reserve, Army .......................................... 416 438 462 487 416 438 462 487 416 438 462 487 Reserve Personnel, Navy .......................................... 2,186 2,256 2,315 2,378 2,186 2,256 2,315 2,378 2,171 2,239 2,299 2,361 MERHFC, Reserve, Navy .......................................... 144 152 160 168 144 152 160 168 144 152 160 168 Reserve Personnel, Marine Corps ............................. 874 896 922 952 874 896 922 952 868 890 916 946 MERHFC, Reserve, Marine Corps ............................. 82 86 90 95 82 86 90 95 82 86 90 95 Reserve Personnel, Air Force .................................... 2,157 2,290 2,363 2,419 2,157 2,290 2,363 2,419 2,139 2,268 2,345 2,402 MERHFC, Reserve, Air Force .................................... 150 159 168 177 150 159 168 177 150 159 168 177 National Guard Personnel, Army ............................... 9,153 9,303 9,543 9,706 9,153 9,303 9,543 9,706 9,089 9,232 9,467 9,638 MERHFC, Army National Guard ................................ 742 781 823 868 742 781 823 868 742 781 823 868 National Guard Personnel, Air Force ......................... 4,339 4,522 4,638 4,750 4,339 4,522 4,638 4,750 4,302 4,489 4,608 4,720 MERHFC, Air National Guard .................................... 272 287 304 320 272 287 304 320 272 287 304 320 Concurrent Receipt Accrual Payment Mil Ret Fund ... 9,705 9,964 10,270 10,513 9,705 9,964 10,270 10,513
Total Military Personnel (No MERHFC) .......... 153,417 157,306 161,847 166,964 163,122 167,270 172,117 177,477 161,854 166,085 170,880 176,156 Total Medicare-Eligible Ret Health Fund Contr .......... 8,277 8,754 9,255 9,773 8,277 8,754 9,255 9,773 8,276 8,754 9,255 9,773
Total Military Personnel Plus MERHFC ......... 161,694 166,060 171,102 176,737 171,399 176,024 181,372 187,250 170,130 174,839 180,135 185,929
NOTE: War and supplemental funding is included in FY 2021.
Military Personnel
Table 6-6: OUTYEARS
CURRENT DOLLARSDoD TOA, BUDGET AUTHORITY AND OUTLAYS BY APPROPRIATION ACCOUNT (DISCRETIONARY AND MANDATORY)
TOA Budget Authority OutlaysAppropriation Account
(Dollars in Millions)
112
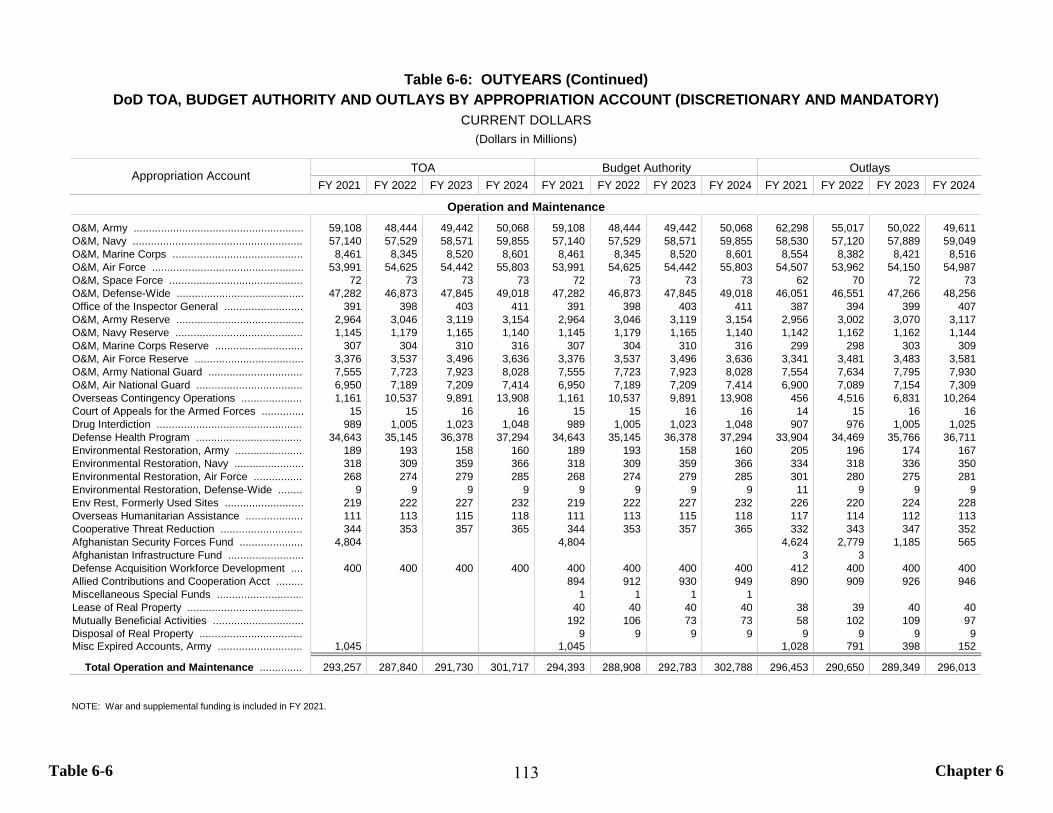
Table 6-6 Chapter 6
FY 2021 FY 2022 FY 2023 FY 2024 FY 2021 FY 2022 FY 2023 FY 2024 FY 2021 FY 2022 FY 2023 FY 2024
O&M, Army ........................................................ 59,108 48,444 49,442 50,068 59,108 48,444 49,442 50,068 62,298 55,017 50,022 49,611 O&M, Navy ........................................................ 57,140 57,529 58,571 59,855 57,140 57,529 58,571 59,855 58,530 57,120 57,889 59,049 O&M, Marine Corps ........................................... 8,461 8,345 8,520 8,601 8,461 8,345 8,520 8,601 8,554 8,382 8,421 8,516 O&M, Air Force .................................................. 53,991 54,625 54,442 55,803 53,991 54,625 54,442 55,803 54,507 53,962 54,150 54,987 O&M, Space Force ............................................ 72 73 73 73 72 73 73 73 62 70 72 73 O&M, Defense-Wide .......................................... 47,282 46,873 47,845 49,018 47,282 46,873 47,845 49,018 46,051 46,551 47,266 48,256 Office of the Inspector General .......................... 391 398 403 411 391 398 403 411 387 394 399 407 O&M, Army Reserve .......................................... 2,964 3,046 3,119 3,154 2,964 3,046 3,119 3,154 2,956 3,002 3,070 3,117 O&M, Navy Reserve .......................................... 1,145 1,179 1,165 1,140 1,145 1,179 1,165 1,140 1,142 1,162 1,162 1,144 O&M, Marine Corps Reserve ............................. 307 304 310 316 307 304 310 316 299 298 303 309 O&M, Air Force Reserve .................................... 3,376 3,537 3,496 3,636 3,376 3,537 3,496 3,636 3,341 3,481 3,483 3,581 O&M, Army National Guard ............................... 7,555 7,723 7,923 8,028 7,555 7,723 7,923 8,028 7,554 7,634 7,795 7,930 O&M, Air National Guard ................................... 6,950 7,189 7,209 7,414 6,950 7,189 7,209 7,414 6,900 7,089 7,154 7,309 Overseas Contingency Operations ..................... 1,161 10,537 9,891 13,908 1,161 10,537 9,891 13,908 456 4,516 6,831 10,264 Court of Appeals for the Armed Forces .............. 15 15 16 16 15 15 16 16 14 15 16 16 Drug Interdiction ................................................ 989 1,005 1,023 1,048 989 1,005 1,023 1,048 907 976 1,005 1,025 Defense Health Program .................................... 34,643 35,145 36,378 37,294 34,643 35,145 36,378 37,294 33,904 34,469 35,766 36,711 Environmental Restoration, Army ....................... 189 193 158 160 189 193 158 160 205 196 174 167 Environmental Restoration, Navy ....................... 318 309 359 366 318 309 359 366 334 318 336 350 Environmental Restoration, Air Force ................ 268 274 279 285 268 274 279 285 301 280 275 281 Environmental Restoration, Defense-Wide ........ 9 9 9 9 9 9 9 9 11 9 9 9 Env Rest, Formerly Used Sites .......................... 219 222 227 232 219 222 227 232 226 220 224 228 Overseas Humanitarian Assistance ................... 111 113 115 118 111 113 115 118 117 114 112 113 Cooperative Threat Reduction ........................... 344 353 357 365 344 353 357 365 332 343 347 352 Afghanistan Security Forces Fund ..................... 4,804 4,804 4,624 2,779 1,185 565 Afghanistan Infrastructure Fund ......................... 3 3 Defense Acquisition Workforce Development .... 400 400 400 400 400 400 400 400 412 400 400 400 Allied Contributions and Cooperation Acct ......... 894 912 930 949 890 909 926 946 Miscellaneous Special Funds ............................. 1 1 1 1 Lease of Real Property ...................................... 40 40 40 40 38 39 40 40 Mutually Beneficial Activities .............................. 192 106 73 73 58 102 109 97 Disposal of Real Property .................................. 9 9 9 9 9 9 9 9 Misc Expired Accounts, Army ............................ 1,045 1,045 1,028 791 398 152
Total Operation and Maintenance ............... 293,257 287,840 291,730 301,717 294,393 288,908 292,783 302,788 296,453 290,650 289,349 296,013
NOTE: War and supplemental funding is included in FY 2021.
Operation and Maintenance
Table 6-6: OUTYEARS (Continued)DoD TOA, BUDGET AUTHORITY AND OUTLAYS BY APPROPRIATION ACCOUNT (DISCRETIONARY AND MANDATORY)
CURRENT DOLLARS
Appropriation Account TOA Budget Authority Outlays
(Dollars in Millions)
113

Table 6-6 Chapter 6
FY 2021 FY 2022 FY 2023 FY 2024 FY 2021 FY 2022 FY 2023 FY 2024 FY 2021 FY 2022 FY 2023 FY 2024
Aircraft Procurement, Army ...................... 3,459 2,727 2,942 2,988 3,459 2,727 2,942 2,988 4,273 3,851 3,287 3,075 Missile Procurement, Army ...................... 4,993 3,978 4,239 3,965 4,993 3,978 4,239 3,965 4,138 4,688 4,547 4,252 Proc of Weapons and Tracked Veh .......... 4,167 4,738 6,450 7,404 4,167 4,738 6,450 7,404 5,016 4,769 4,777 5,361 Proc of Ammunition, Army ........................ 3,075 2,754 2,786 2,884 3,075 2,754 2,786 2,884 2,868 3,094 3,095 2,797 Other Procurement, Army ........................ 9,887 9,484 8,109 8,071 9,887 9,484 8,109 8,071 8,553 9,114 9,223 8,642 Joint Improvised-Threat Defeat Fund ....... 46 6 2 Aircraft Procurement, Navy ...................... 18,541 19,792 20,894 19,901 18,541 19,792 20,894 19,901 19,765 18,718 19,329 19,860 Weapons Procurement, Navy ................... 5,017 5,073 5,695 6,169 5,017 5,073 5,695 6,169 3,876 4,338 4,810 5,244 Proc of Ammunition, Navy & MC .............. 1,155 1,126 1,056 1,094 1,155 1,126 1,056 1,094 1,072 1,117 1,117 1,105 Shipbuilding and Conversion, Navy .......... 23,488 22,343 25,024 24,903 23,488 22,343 25,024 24,903 22,286 23,653 23,753 23,868 National Sea-Based Deterrence ............... 37 37 37 262 Other Procurement, Navy ......................... 10,173 10,523 10,831 11,134 10,173 10,523 10,831 11,134 9,140 9,727 10,121 10,471 Coastal Defense Augmentation ................ 10 5 5 Procurement, Marine Corps ..................... 3,411 3,806 3,427 3,557 3,411 3,806 3,427 3,557 2,810 3,206 3,465 3,491 Aircraft Procurement, Air Force ................ 19,770 19,410 22,117 23,301 19,770 19,410 22,117 23,301 18,662 18,700 19,410 20,046 Missile Procurement, Air Force ................ 3,068 3,076 3,721 3,262 3,068 3,076 3,721 3,262 3,242 3,102 3,189 3,310 Space Procurement, Air Force ................. 1,986 2,396 2,596 3,061 1,986 2,396 2,596 3,061 2,001 2,061 2,207 2,466 Proc of Ammunition, Air Force .................. 2,200 1,827 1,786 1,117 2,200 1,827 1,786 1,117 2,506 2,427 2,203 1,981 Other Procurement, Air Force .................. 24,274 24,850 24,995 25,252 24,274 24,850 24,995 25,252 24,121 24,456 24,733 24,985 Procurement, Defense-Wide .................... 5,987 6,009 6,214 6,201 5,987 6,009 6,214 6,201 6,109 6,093 6,105 6,103 Nat'l Guard and Reserve Equipment ........ 1,061 621 290 175 Defense Production Act Purchases .......... 35 29 29 29 35 29 29 29 34 31 31 29 Chem Agents & Munitions Destruction ..... 896 808 823 840 896 808 823 840 989 909 850 839 Joint Urgent Operational Needs ............... 99 99 99 101 99 99 99 101 76 89 93 96
Total Procurement .......................... 145,682 144,849 153,833 155,234 145,682 144,849 153,833 155,234 142,690 144,813 146,677 148,458
RDT&E, Army ........................................... 11,986 11,704 11,611 10,987 11,986 11,704 11,611 10,987 12,620 12,012 11,483 11,190 RDT&E, Navy ........................................... 20,094 18,370 18,084 17,317 20,094 18,370 18,084 17,317 20,346 19,139 18,286 17,656 RDT&E, Air Force .................................... 46,303 45,208 44,531 43,262 46,303 45,208 44,531 43,262 47,917 46,205 45,673 43,744 RDT&E, Defense-Wide ............................ 22,259 21,434 20,997 20,881 22,259 21,434 20,997 20,881 24,887 21,997 21,272 20,989 Operational Test and Evaluation .............. 226 223 214 218 226 223 214 218 226 227 220 217
Total RDT&E .................................... 100,868 96,938 95,438 92,664 100,868 96,938 95,438 92,664 105,996 99,580 96,934 93,797
NOTE: War and supplemental funding is included in FY 2021.
Procurement
RDT&E
Table 6-6: OUTYEARS (Continued)DoD TOA, BUDGET AUTHORITY AND OUTLAYS BY APPROPRIATION ACCOUNT (DISCRETIONARY AND MANDATORY)
CURRENT DOLLARS
Appropriation AccountTOA Budget Authority Outlays
(Dollars in Millions)
114
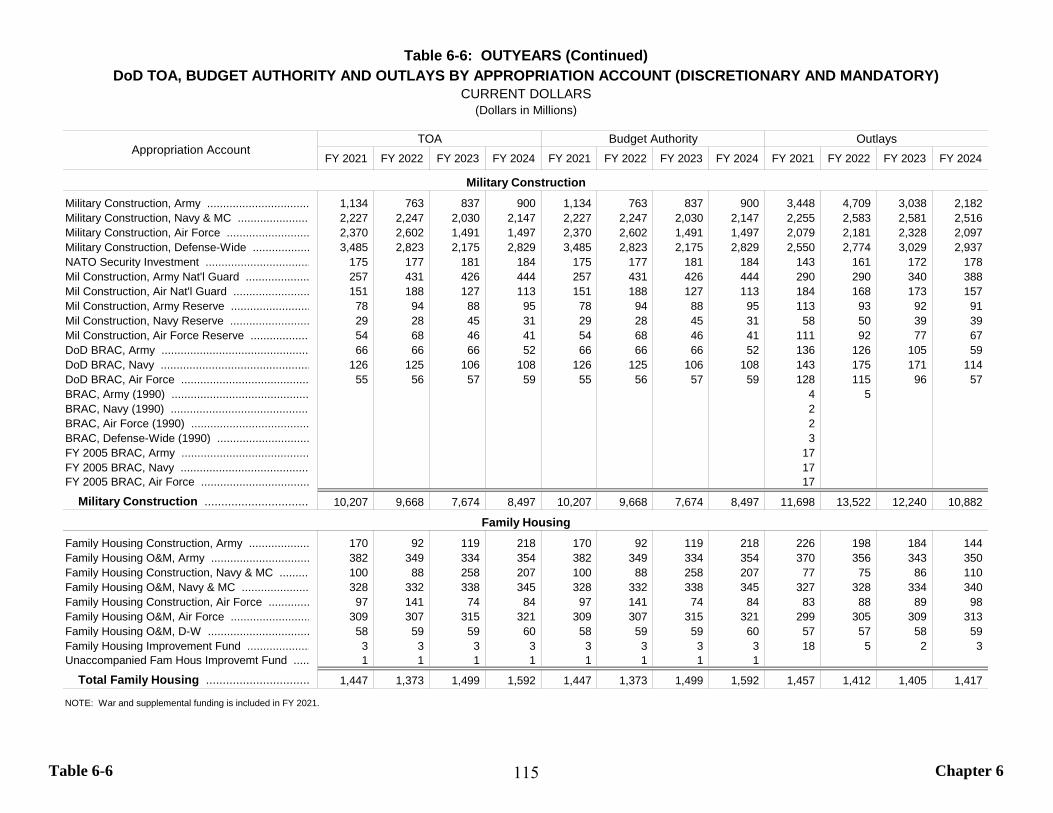
Table 6-6 Chapter 6
FY 2021 FY 2022 FY 2023 FY 2024 FY 2021 FY 2022 FY 2023 FY 2024 FY 2021 FY 2022 FY 2023 FY 2024
Military Construction, Army ................................ 1,134 763 837 900 1,134 763 837 900 3,448 4,709 3,038 2,182 Military Construction, Navy & MC ....................... 2,227 2,247 2,030 2,147 2,227 2,247 2,030 2,147 2,255 2,583 2,581 2,516 Military Construction, Air Force .......................... 2,370 2,602 1,491 1,497 2,370 2,602 1,491 1,497 2,079 2,181 2,328 2,097 Military Construction, Defense-Wide .................. 3,485 2,823 2,175 2,829 3,485 2,823 2,175 2,829 2,550 2,774 3,029 2,937 NATO Security Investment ................................. 175 177 181 184 175 177 181 184 143 161 172 178 Mil Construction, Army Nat'l Guard .................... 257 431 426 444 257 431 426 444 290 290 340 388 Mil Construction, Air Nat'l Guard ........................ 151 188 127 113 151 188 127 113 184 168 173 157 Mil Construction, Army Reserve ......................... 78 94 88 95 78 94 88 95 113 93 92 91 Mil Construction, Navy Reserve ......................... 29 28 45 31 29 28 45 31 58 50 39 39 Mil Construction, Air Force Reserve ................... 54 68 46 41 54 68 46 41 111 92 77 67 DoD BRAC, Army ............................................... 66 66 66 52 66 66 66 52 136 126 105 59 DoD BRAC, Navy ............................................... 126 125 106 108 126 125 106 108 143 175 171 114 DoD BRAC, Air Force ......................................... 55 56 57 59 55 56 57 59 128 115 96 57 BRAC, Army (1990) ............................................ 4 5 BRAC, Navy (1990) ............................................ 2 BRAC, Air Force (1990) ..................................... 2 BRAC, Defense-Wide (1990) ............................. 3 FY 2005 BRAC, Army ........................................ 17 FY 2005 BRAC, Navy ......................................... 17 FY 2005 BRAC, Air Force .................................. 17
Military Construction ................................ 10,207 9,668 7,674 8,497 10,207 9,668 7,674 8,497 11,698 13,522 12,240 10,882
Family Housing Construction, Army ................... 170 92 119 218 170 92 119 218 226 198 184 144 Family Housing O&M, Army ............................... 382 349 334 354 382 349 334 354 370 356 343 350 Family Housing Construction, Navy & MC .......... 100 88 258 207 100 88 258 207 77 75 86 110 Family Housing O&M, Navy & MC ...................... 328 332 338 345 328 332 338 345 327 328 334 340 Family Housing Construction, Air Force ............. 97 141 74 84 97 141 74 84 83 88 89 98 Family Housing O&M, Air Force ......................... 309 307 315 321 309 307 315 321 299 305 309 313 Family Housing O&M, D-W ................................ 58 59 59 60 58 59 59 60 57 57 58 59 Family Housing Improvement Fund .................... 3 3 3 3 3 3 3 3 18 5 2 3 Unaccompanied Fam Hous Improvemt Fund ..... 1 1 1 1 1 1 1 1
Total Family Housing ............................... 1,447 1,373 1,499 1,592 1,447 1,373 1,499 1,592 1,457 1,412 1,405 1,417
NOTE: War and supplemental funding is included in FY 2021.
Military Construction
Family Housing
Table 6-6: OUTYEARS (Continued)DoD TOA, BUDGET AUTHORITY AND OUTLAYS BY APPROPRIATION ACCOUNT (DISCRETIONARY AND MANDATORY)
CURRENT DOLLARS
Appropriation AccountTOA Budget Authority Outlays
(Dollars in Millions)
115

Table 6-6 Chapter 6
FY 2021 FY 2022 FY 2023 FY 2024 FY 2021 FY 2022 FY 2023 FY 2024 FY 2021 FY 2022 FY 2023 FY 2024
National Defense Stockpile Fund .............................. 11 -6 -4 -3 Pentagon Reservation Maint Rev Fund ..................... 34 59 -12 -30 National Defense Sealift Fund ................................... 30 15 Working Capital Fund, Army ..................................... 117 92 93 94 117 92 93 94 279 -103 -128 -131 Working Capital Fund, Navy ..................................... -665 -871 -569 -549 Working Capital Fund, Air Force ............................... 96 77 80 84 96 77 80 84 -440 -300 -307 -312 Working Capital Fund, Defense ................................ 50 51 52 53 50 51 52 53 262 -636 -815 -813 Working Capital Fund, DCSA .................................... -5 -4 -5 -4 Working Capital Fund, DECA .................................... 242 -28 -28 -29 Buildings Maintenance Fund ..................................... 60 50 40 30
Total Revolving and Management Funds ..... 262 220 225 230 262 220 225 230 -192 -1,824 -1,828 -1,841
Voluntary Separation Trust Fund ............................... 39 33 27 22 40 33 27 22 Host Nation Support .................................................. 145 148 151 154 145 148 394 164 Foreign National Employees Separation Pay ............ 44 44 44 44 128 121 44 44 Surcharge Collections, Commissary ......................... 62 35 24 19 Army Gift Fund .......................................................... 5 5 5 5 5 5 10 5 Air Force Gift Fund .................................................... 6 6 6 6 6 6 6 6 Ships Stores Profit .................................................... 5 5 5 5 5 5 1 5 USNA Gift Fund ........................................................ 4 4 4 4 4 4 4 4 Navy Gift Fund .......................................................... 1 1 1 1 1 1 1 1 Support for US Relocation to Guam .......................... 589 356 72 549 941 328 50
Total Trust Funds ........................................... 837 601 314 241 944 1,297 838 319
Foreign National Employees Separation Trust .......... -44 -44 -44 -44 -44 -44 -44 -44 Payment to VSI ......................................................... -22 -19 -15 -15 -22 -19 -15 -13 Profits from Sales of Ships Stores ............................ -20 -20 -20 -20 -20 -20 -20 -20
Total Interfund Transactions ......................... -86 -83 -79 -79 -86 -83 -79 -77
NOTE: War and supplemental funding is included in FY 2021.
Revolving and Management Funds
Interfund Transactions
Trust Funds
Table 6-6: OUTYEARS (Continued)DoD TOA, BUDGET AUTHORITY AND OUTLAYS BY APPROPRIATION ACCOUNT (DISCRETIONARY AND MANDATORY)
CURRENT DOLLARS
Appropriation Account TOA Budget Authority Outlays
(Dollars in Millions)
116

Table 6-6 Chapter 6
FY 2021 FY 2022 FY 2023 FY 2024 FY 2021 FY 2022 FY 2023 FY 2024 FY 2021 FY 2022 FY 2023 FY 2024
Rent of Equipment, Air Force ........................................ -1 -1 -1 -1 -1 -1 -1 -1 Sales of Material; Nat'l Def Stockpile ............................. -12 -12 -12 -12 -12 -12 -12 -12 Deposits for Survivors, Defense .................................... -21 -21 -21 -21 -21 -21 -21 -21 Sale of Scrap ................................................................ -1 -1 -1 -1 -1 -1 -1 -1 Recov for Gov't Prop Lost, Army ................................... -12 -12 -12 -12 -12 -12 -12 -12 Recoveries Under FMS, Navy ....................................... -156 -156 -156 -156 -156 -156 -156 -156 Recoveries Under FMS, Army ....................................... -22 -22 -22 -22 -22 -22 -22 -22 Recoveries Under FMS, AF ........................................... -41 -41 -41 -41 -41 -41 -41 -41 Recoveries Under FMS, Defense .................................. -5 -5 -5 -5 -5 -5 -5 -5 General Fund Proprietary, Navy .................................... -82 -82 -82 -82 -82 -82 -82 -82 General Fund Proprietary, Army .................................... -68 -68 -68 -68 -68 -68 -68 -68 General Fund Proprietary, AF ........................................ -97 -97 -97 -97 -97 -97 -97 -97 General Fund Proprietary, Defense ............................... -87 -87 -87 -87 -87 -87 -87 -87 Undist Intragov't Payments, Navy .................................. -45 -45 -45 -45 -45 -45 -45 -45 Rocky Mountain Arsenal ................................................ -7 -7 -7 -7 -7 -7 -7 -7 Proceeds from Transfer Commissary ............................ -1 -1 -1 -1 -1 -1 -1 -1 Burdensharing, Kuwait .................................................. -139 -141 -144 -147 -139 -141 -144 -147 Burdensharing, Japan ................................................... -254 -259 -265 -270 -254 -259 -265 -270 Burdensharing, South Korea ......................................... -501 -511 -521 -532 -501 -511 -521 -532 Contributions for MBA, Kuwait ....................................... -192 -106 -73 -73 -192 -106 -73 -73 Disposal DoD Real Property, Army ............................... -4 -4 -5 -5 -4 -4 -5 -5 Disposal DoD Real Property, Navy ................................ -4 -4 -4 -4 -4 -4 -4 -4 Lease of DoD Real Property, Army ............................... -13 -13 -13 -13 -13 -13 -13 -13 Lease of DoD Real Property, Navy ................................ -9 -9 -9 -9 -9 -9 -9 -9 Lease of DoD Real Property, AF ................................... -13 -14 -14 -15 -13 -14 -14 -15 Deposits, Army General Gift Fund ................................. -5 -5 -5 -5 -5 -5 -5 -5 Proceeds from Support of Athletic Programs ................ -3 -3 -3 -3 -3 -3 -3 -3 Contributions to DoD Gift Fund ..................................... -7 -7 -7 -7 -7 -7 -7 -7 Collections, Contributions to Cooperative Threat Red ... -6 -6 -6 -6 -6 -6 -6 -6 Renew Energy Impact, Cont .......................................... -1 -1 -1 -1 -1 -1 -1 -1
Total Offsetting Receipts ........................................ -1,809 -1,741 -1,727 -1,747 -1,809 -1,741 -1,727 -1,747
NOTE: War and supplemental funding is included in FY 2021.
Offsetting Receipts
Table 6-6: OUTYEARS (Continued)DoD TOA, BUDGET AUTHORITY AND OUTLAYS BY APPROPRIATION ACCOUNT (DISCRETIONARY AND MANDATORY)
CURRENT DOLLARS
Appropriation AccountTOA Budget Authority Outlays
(Dollars in Millions)
117
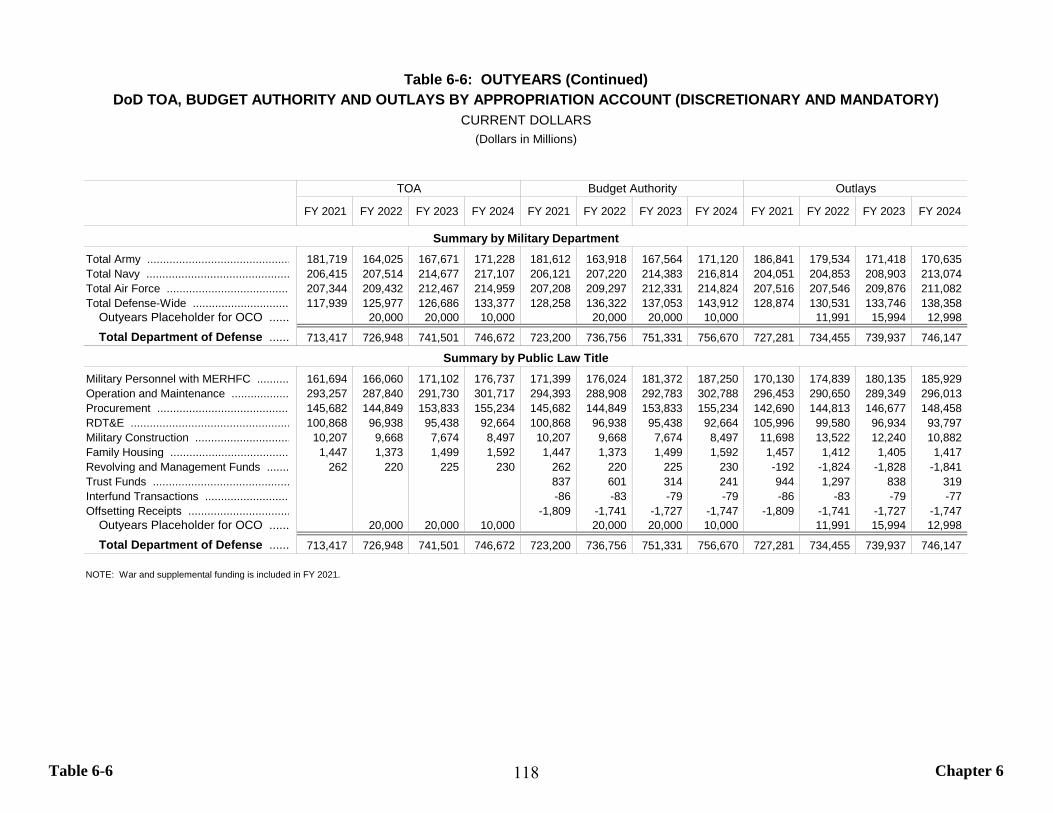
Table 6-6 Chapter 6
FY 2021 FY 2022 FY 2023 FY 2024 FY 2021 FY 2022 FY 2023 FY 2024 FY 2021 FY 2022 FY 2023 FY 2024
Total Army ............................................. 181,719 164,025 167,671 171,228 181,612 163,918 167,564 171,120 186,841 179,534 171,418 170,635 Total Navy ............................................. 206,415 207,514 214,677 217,107 206,121 207,220 214,383 216,814 204,051 204,853 208,903 213,074 Total Air Force ....................................... 207,344 209,432 212,467 214,959 207,208 209,297 212,331 214,824 207,516 207,546 209,876 211,082 Total Defense-Wide .............................. 117,939 125,977 126,686 133,377 128,258 136,322 137,053 143,912 128,874 130,531 133,746 138,358
Outyears Placeholder for OCO ...... 20,000 20,000 10,000 20,000 20,000 10,000 11,991 15,994 12,998
Total Department of Defense ...... 713,417 726,948 741,501 746,672 723,200 736,756 751,331 756,670 727,281 734,455 739,937 746,147
Military Personnel with MERHFC .......... 161,694 166,060 171,102 176,737 171,399 176,024 181,372 187,250 170,130 174,839 180,135 185,929 Operation and Maintenance .................. 293,257 287,840 291,730 301,717 294,393 288,908 292,783 302,788 296,453 290,650 289,349 296,013 Procurement .......................................... 145,682 144,849 153,833 155,234 145,682 144,849 153,833 155,234 142,690 144,813 146,677 148,458 RDT&E .................................................. 100,868 96,938 95,438 92,664 100,868 96,938 95,438 92,664 105,996 99,580 96,934 93,797 Military Construction .............................. 10,207 9,668 7,674 8,497 10,207 9,668 7,674 8,497 11,698 13,522 12,240 10,882 Family Housing ..................................... 1,447 1,373 1,499 1,592 1,447 1,373 1,499 1,592 1,457 1,412 1,405 1,417 Revolving and Management Funds ....... 262 220 225 230 262 220 225 230 -192 -1,824 -1,828 -1,841 Trust Funds ........................................... 837 601 314 241 944 1,297 838 319 Interfund Transactions ........................... -86 -83 -79 -79 -86 -83 -79 -77 Offsetting Receipts ................................ -1,809 -1,741 -1,727 -1,747 -1,809 -1,741 -1,727 -1,747
Outyears Placeholder for OCO ...... 20,000 20,000 10,000 20,000 20,000 10,000 11,991 15,994 12,998
Total Department of Defense ...... 713,417 726,948 741,501 746,672 723,200 736,756 751,331 756,670 727,281 734,455 739,937 746,147
NOTE: War and supplemental funding is included in FY 2021.
Summary by Military Department
Summary by Public Law Title
Table 6-6: OUTYEARS (Continued)DoD TOA, BUDGET AUTHORITY AND OUTLAYS BY APPROPRIATION ACCOUNT (DISCRETIONARY AND MANDATORY)
CURRENT DOLLARS
TOA Budget Authority Outlays
(Dollars in Millions)
118

Table 6-7 Chapter 6
FY 2018 FY 2019 FY 2020 FY 2018 FY 2019 FY 2020 FY 2018 FY 2019 FY 2020
Military Personnel, Army ................................................ 45,285 46,831 46,091 45,158 46,831 46,091 43,333 46,386 45,267 MERHFC, Army ............................................................. 2,443 2,225 2,186 2,443 2,225 2,186 2,443 2,225 2,186 Military Personnel, Navy ................................................ 30,526 31,362 32,188 30,498 31,362 32,188 29,451 30,508 31,794 MERHFC, Navy ............................................................. 1,686 1,523 1,550 1,686 1,523 1,550 1,686 1,523 1,550 Military Personnel, Marine Corps ................................... 13,885 14,265 14,279 13,902 14,265 14,279 13,151 13,962 14,127 MERHFC, Marine Corps ................................................ 965 863 860 965 863 860 965 863 860 Military Personnel, Air Force ......................................... 30,882 31,870 32,293 30,754 31,870 32,293 29,884 31,539 32,020 MERHFC, Air Force ....................................................... 1,669 1,505 1,515 1,669 1,505 1,515 1,669 1,505 1,515 Reserve Personnel, Army .............................................. 4,925 5,010 4,999 4,935 5,010 4,999 4,796 4,899 4,964 MERHFC, Reserve, Army .............................................. 468 402 395 468 402 395 468 402 395 Reserve Personnel, Navy .............................................. 2,097 2,115 2,135 2,102 2,115 2,135 2,017 2,141 2,119 MERHFC, Reserve, Navy .............................................. 153 136 137 153 136 137 152 136 137 Reserve Personnel, Marine Corps ................................. 803 806 842 806 806 842 775 811 835 MERHFC, Reserve, Marine Corps ................................. 87 77 77 87 77 77 87 77 77 Reserve Personnel, Air Force ........................................ 1,909 1,932 2,054 1,920 1,932 2,054 1,871 2,020 2,033 MERHFC, Reserve, Air Force ....................................... 156 138 140 156 138 140 156 138 140 National Guard Personnel, Army ................................... 9,088 9,035 9,011 9,177 9,035 9,011 8,849 8,829 8,941 MERHFC, Army National Guard .................................... 810 712 704 810 712 704 810 712 704 National Guard Personnel, Air Force ............................. 3,637 3,805 4,069 3,646 3,805 4,069 3,540 3,925 4,011 MERHFC, Air National Guard ........................................ 272 245 255 272 245 255 272 245 255 Concurrent Receipt Accrual Payment Mil Ret Fund ....... 7,113 8,068 9,346 7,113 8,068 9,346
Total Military Personnel (No MERHFC) ............. 143,036 147,032 147,962 150,010 155,100 157,308 144,779 153,087 155,458 Total Medicare-Eligible Ret Health Fund Contr .............. 8,710 7,827 7,817 8,710 7,826 7,817 8,709 7,827 7,817
Total Military Personnel Plus MERHFC ............. 151,746 154,859 155,779 158,720 162,926 165,125 153,488 160,914 163,275
NOTE: War and supplemental funding is included.
Military Personnel
Table 6-7: INYEARS
FY 2020 CONSTANT DOLLARSDoD TOA, BUDGET AUTHORITY AND OUTLAYS BY APPROPRIATION ACCOUNT (DISCRETIONARY AND MANDATORY)
TOA Budget Authority OutlaysAppropriation Account
(Dollars in Millions)
119

Table 6-7 Chapter 6
FY 2018 FY 2019 FY 2020 FY 2018 FY 2019 FY 2020 FY 2018 FY 2019 FY 2020
O&M, Army ........................................................................ 59,829 59,701 60,785 59,662 59,706 60,792 55,621 60,706 61,279 O&M, Navy ......................................................................... 55,088 54,070 57,687 55,291 54,079 57,697 50,698 52,491 56,410 O&M, Marine Corps ............................................................ 8,394 7,957 9,052 8,418 7,959 9,055 7,917 8,062 8,570 O&M, Air Force .................................................................. 53,112 51,188 54,307 53,178 51,199 54,320 48,986 51,202 52,692 O&M, Space Force ............................................................. 72 72 43 O&M, Defense-Wide .......................................................... 42,561 45,444 45,848 43,034 44,482 45,864 40,585 42,546 46,387 Office of the Inspector General ........................................... 343 356 388 352 356 388 334 330 376 O&M, Army Reserve .......................................................... 3,014 2,867 3,067 3,015 2,867 3,067 2,873 2,843 2,947 O&M, Navy Reserve ........................................................... 1,161 1,071 1,148 1,164 1,071 1,148 1,032 1,105 1,083 O&M, Marine Corps Reserve .............................................. 299 280 301 300 280 301 291 286 289 O&M, Air Force Reserve .................................................... 3,395 3,318 3,427 3,422 3,318 3,427 3,138 3,524 3,365 O&M, Army National Guard ................................................ 7,775 7,335 7,713 7,817 7,335 7,713 7,117 7,244 7,618 O&M, Air National Guard .................................................... 7,200 6,559 6,904 7,234 6,559 6,904 6,585 7,019 6,599 Counter-ISIL Transfer Fund ................................................ -1,675 Court of Appeals for the Armed Forces .............................. 15 15 15 15 15 15 13 14 15 Drug Interdiction ................................................................. 1,052 963 117 1,052 963 524 793 International Sporting Competitions .................................... 1 1 Foreign Currency Fluctuations ........................................... -255 Defense Health Program .................................................... 35,805 35,493 33,346 36,122 35,134 33,204 34,165 35,268 33,458 Environmental Restoration, Army ....................................... 241 208 241 208 122 163 Environmental Restoration, Navy ....................................... 373 336 373 336 187 260 Environmental Restoration, Air Force ................................. 373 303 373 303 -1 187 243 Environmental Restoration, Defense-Wide ......................... 19 9 13 19 9 22 9 Env Rest, Formerly Used Sites .......................................... 254 216 254 216 126 170 Overseas Humanitarian Assistance .................................... 135 120 109 135 120 109 117 86 97 Cooperative Threat Reduction ............................................ 364 357 339 387 357 339 342 361 323 Afghanistan Security Forces Fund ..................................... 4,855 5,018 4,804 4,751 5,018 4,804 4,127 3,704 4,406 Afghanistan Infrastructure Fund ......................................... 70 10 5 Iraq Train and Equip Fund .................................................. 91 Defense Acquisition Workforce Development .................... 513 456 400 456 400 386 396 430 Emergency Response Fund ............................................... 26 Allied Contributions and Cooperation Acct ......................... 876 876 876 1,309 710 873 Miscellaneous Special Funds ............................................. 2 1 2 3 1 Lease of Real Property ....................................................... 34 37 34 21 47 45 Mutually Beneficial Activities .............................................. 2 6 198 7 6 31 Disposal of Real Property ................................................... 8 8 8 3 12 14 Overseas Military Facility Investment ................................. 1 Vietnam War Comm ........................................................... 3 Support of Athletic Programs ............................................. 4 Miscellaneous Expired Accounts, Army .............................. 1,840 1,379 1,045 1,757 1,073 1,045 1,309 1,211 1,085
Total Operation and Maintenance ............................... 285,700 285,298 292,791 285,438 284,371 293,817 267,141 280,381 290,079 NOTE: War and supplemental funding is included.
Operation and Maintenance
Table 6-7: INYEARS (Continued)DoD TOA, BUDGET AUTHORITY AND OUTLAYS BY APPROPRIATION ACCOUNT (DISCRETIONARY AND MANDATORY)
FY 2020 CONSTANT DOLLARS
Appropriation Account TOA Budget Authority Outlays
(Dollars in Millions)
120

Table 6-7 Chapter 6
FY 2018 FY 2019 FY 2020 FY 2018 FY 2019 FY 2020 FY 2018 FY 2019 FY 2020
Aircraft Procurement, Army ........................................... 6,225 4,739 4,078 6,208 4,902 4,203 5,599 5,497 5,066 Missile Procurement, Army ............................................ 4,990 4,973 4,646 4,970 4,891 4,646 1,400 3,499 3,768 Proc of Weapons and Tracked Veh ............................... 6,010 5,700 5,069 6,002 5,486 5,069 2,302 3,741 4,730 Proc of Ammunition, Army ............................................. 2,851 2,627 2,843 2,835 2,627 2,843 1,870 4,684 2,906 Other Procurement, Army .............................................. 9,237 9,392 8,583 9,217 9,337 8,594 7,280 8,355 8,326 Joint Improvised-Threat Defeat Fund ............................ 376 156 60 Aircraft Procurement, Navy ........................................... 20,915 20,731 18,641 20,689 20,717 18,701 16,557 18,298 19,838 Weapons Procurement, Navy ........................................ 3,768 3,800 4,333 3,735 3,682 4,336 3,118 3,225 3,403 Proc of Ammunition, Navy & MC ................................... 1,080 1,206 1,186 1,080 1,204 1,186 917 881 1,036 Shipbuilding and Conversion, Navy ............................... 23,891 24,633 23,784 23,876 24,444 23,784 16,344 16,213 20,606 National Sea-Based Deterrence .................................... 897 897 750 37 37 Other Procurement, Navy .............................................. 8,592 9,464 10,011 8,592 9,407 10,099 6,682 7,863 8,543 Coastal Defense Augmentation ..................................... 15 14 Procurement, Marine Corps ........................................... 2,101 2,833 3,111 2,101 2,836 3,136 1,785 1,930 2,326 Aircraft Procurement, Air Force ..................................... 19,654 18,429 17,093 19,513 17,975 17,096 13,355 12,995 17,799 Missile Procurement, Air Force ..................................... 2,805 3,133 3,091 2,772 3,128 3,091 3,385 3,192 3,420 Space Procurement, Air Force ...................................... 3,696 2,376 2,414 3,660 2,148 2,414 1,851 1,588 1,896 Proc of Ammunition, Air Force ....................................... 2,345 2,915 2,607 2,321 2,897 2,607 1,851 2,193 2,241 Other Procurement, Air Force ........................................ 25,088 25,053 24,881 24,920 24,891 24,893 24,604 22,352 24,189 Procurement, Defense-Wide ......................................... 7,643 7,542 5,561 7,636 7,542 5,561 5,118 7,370 6,503 Nat'l Guard and Reserve Equipment ............................. 1,353 1,326 1,353 1,326 1,165 901 1,002 Defense Production Act Purchases ............................... 70 55 34 70 55 34 126 182 66 Chem Agents & Munitions Destruction .......................... 1,001 1,014 985 1,001 1,014 985 781 592 867 Joint Urgent Operational Needs .................................... 99 99 32
Total Procurement .............................................. 154,211 151,941 143,052 153,446 150,508 143,379 117,216 125,760 138,674
RDT&E, Army ................................................................ 12,010 11,548 12,397 11,945 11,372 12,397 8,810 10,046 11,005 RDT&E, Navy ................................................................ 19,013 18,912 20,435 19,004 19,017 20,507 18,011 17,438 19,615 RDT&E, Air Force .......................................................... 39,528 42,266 46,066 39,392 41,813 46,150 32,492 35,604 44,222 RDT&E, Defense-Wide .................................................. 24,717 24,533 25,175 24,717 24,593 25,234 20,175 23,363 24,755 Operational Test and Evaluation .................................... 217 385 221 217 385 221 201 292 277
Total RDT&E ........................................................ 95,485 97,643 104,294 95,275 97,180 104,509 79,688 86,743 99,874
NOTE: War and supplemental funding is included.
Procurement
RDT&E
Table 6-7: INYEARS (Continued)DoD TOA, BUDGET AUTHORITY AND OUTLAYS BY APPROPRIATION ACCOUNT (DISCRETIONARY AND MANDATORY)
FY 2020 CONSTANT DOLLARS
Appropriation AccountTOA Budget Authority Outlays
(Dollars in Millions)
121
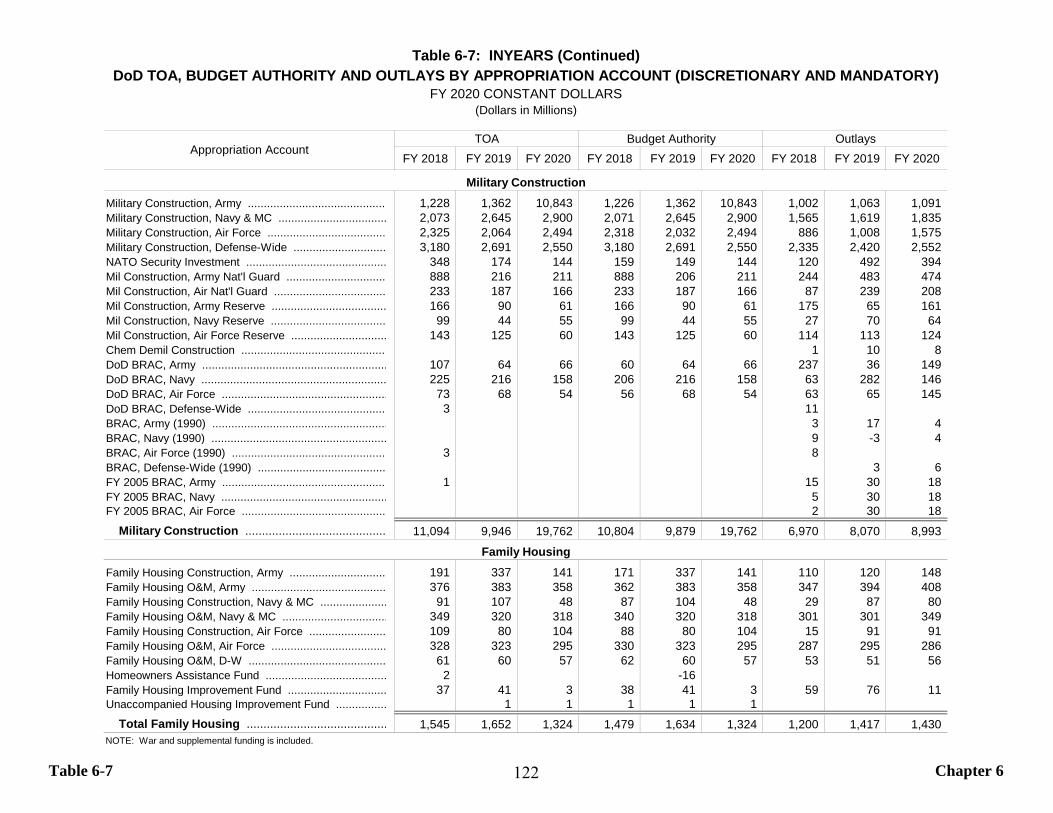
Table 6-7 Chapter 6
FY 2018 FY 2019 FY 2020 FY 2018 FY 2019 FY 2020 FY 2018 FY 2019 FY 2020
Military Construction, Army ............................................ 1,228 1,362 10,843 1,226 1,362 10,843 1,002 1,063 1,091 Military Construction, Navy & MC .................................. 2,073 2,645 2,900 2,071 2,645 2,900 1,565 1,619 1,835 Military Construction, Air Force ..................................... 2,325 2,064 2,494 2,318 2,032 2,494 886 1,008 1,575 Military Construction, Defense-Wide ............................. 3,180 2,691 2,550 3,180 2,691 2,550 2,335 2,420 2,552 NATO Security Investment ............................................ 348 174 144 159 149 144 120 492 394 Mil Construction, Army Nat'l Guard ................................ 888 216 211 888 206 211 244 483 474 Mil Construction, Air Nat'l Guard ................................... 233 187 166 233 187 166 87 239 208 Mil Construction, Army Reserve .................................... 166 90 61 166 90 61 175 65 161 Mil Construction, Navy Reserve .................................... 99 44 55 99 44 55 27 70 64 Mil Construction, Air Force Reserve .............................. 143 125 60 143 125 60 114 113 124 Chem Demil Construction .............................................. 1 10 8 DoD BRAC, Army .......................................................... 107 64 66 60 64 66 237 36 149 DoD BRAC, Navy .......................................................... 225 216 158 206 216 158 63 282 146 DoD BRAC, Air Force .................................................... 73 68 54 56 68 54 63 65 145 DoD BRAC, Defense-Wide ............................................ 3 11 BRAC, Army (1990) ....................................................... 3 17 4 BRAC, Navy (1990) ....................................................... 9 -3 4 BRAC, Air Force (1990) ................................................. 3 8 BRAC, Defense-Wide (1990) ........................................ 3 6 FY 2005 BRAC, Army .................................................... 1 15 30 18 FY 2005 BRAC, Navy .................................................... 5 30 18 FY 2005 BRAC, Air Force .............................................. 2 30 18
Military Construction .......................................... 11,094 9,946 19,762 10,804 9,879 19,762 6,970 8,070 8,993
Family Housing Construction, Army ............................... 191 337 141 171 337 141 110 120 148 Family Housing O&M, Army .......................................... 376 383 358 362 383 358 347 394 408 Family Housing Construction, Navy & MC ..................... 91 107 48 87 104 48 29 87 80 Family Housing O&M, Navy & MC ................................. 349 320 318 340 320 318 301 301 349 Family Housing Construction, Air Force ........................ 109 80 104 88 80 104 15 91 91 Family Housing O&M, Air Force .................................... 328 323 295 330 323 295 287 295 286 Family Housing O&M, D-W ........................................... 61 60 57 62 60 57 53 51 56 Homeowners Assistance Fund ...................................... 2 -16 Family Housing Improvement Fund ............................... 37 41 3 38 41 3 59 76 11 Unaccompanied Housing Improvement Fund ................ 1 1 1 1 1
Total Family Housing .......................................... 1,545 1,652 1,324 1,479 1,634 1,324 1,200 1,417 1,430 NOTE: War and supplemental funding is included.
Military Construction
Family Housing
Table 6-7: INYEARS (Continued)DoD TOA, BUDGET AUTHORITY AND OUTLAYS BY APPROPRIATION ACCOUNT (DISCRETIONARY AND MANDATORY)
FY 2020 CONSTANT DOLLARS
Appropriation AccountTOA Budget Authority Outlays
(Dollars in Millions)
122
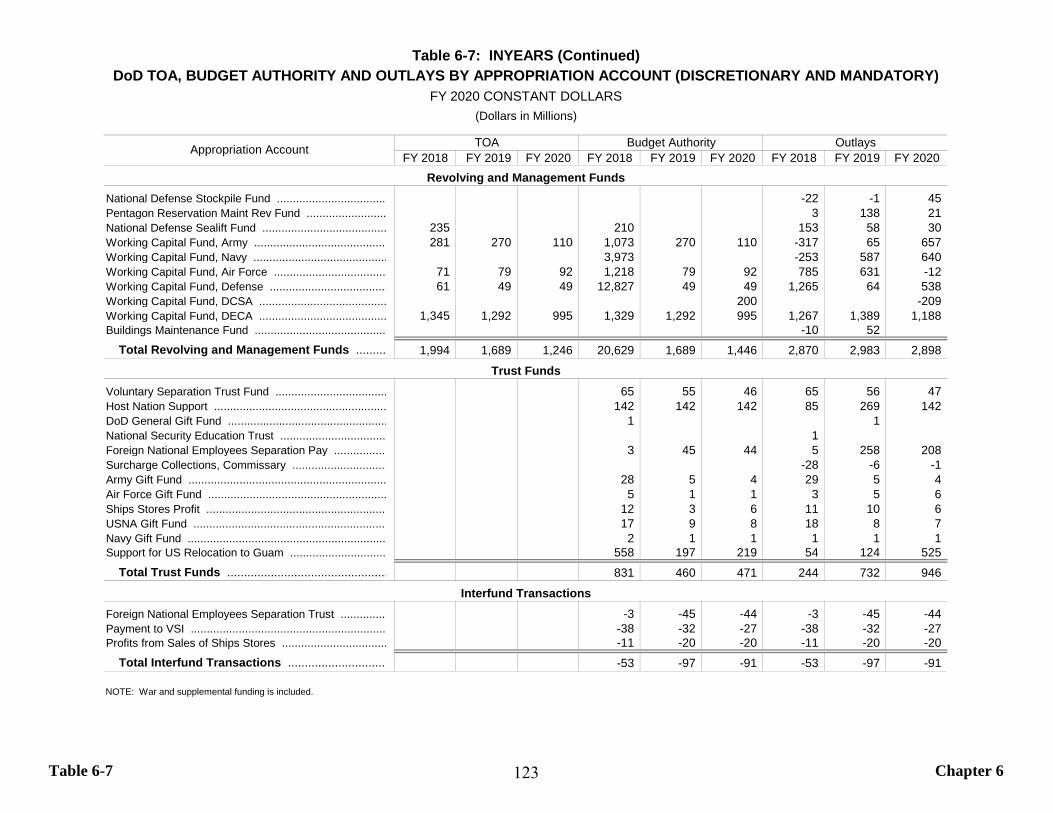
Table 6-7 Chapter 6
FY 2018 FY 2019 FY 2020 FY 2018 FY 2019 FY 2020 FY 2018 FY 2019 FY 2020
National Defense Stockpile Fund ................................... -22 -1 45 Pentagon Reservation Maint Rev Fund ......................... 3 138 21 National Defense Sealift Fund ....................................... 235 210 153 58 30 Working Capital Fund, Army .......................................... 281 270 110 1,073 270 110 -317 65 657 Working Capital Fund, Navy .......................................... 3,973 -253 587 640 Working Capital Fund, Air Force ................................... 71 79 92 1,218 79 92 785 631 -12 Working Capital Fund, Defense ..................................... 61 49 49 12,827 49 49 1,265 64 538 Working Capital Fund, DCSA ........................................ 200 -209 Working Capital Fund, DECA ........................................ 1,345 1,292 995 1,329 1,292 995 1,267 1,389 1,188 Buildings Maintenance Fund ......................................... -10 52
Total Revolving and Management Funds ......... 1,994 1,689 1,246 20,629 1,689 1,446 2,870 2,983 2,898
Voluntary Separation Trust Fund ................................... 65 55 46 65 56 47 Host Nation Support ...................................................... 142 142 142 85 269 142 DoD General Gift Fund .................................................. 1 1 National Security Education Trust ................................. 1 Foreign National Employees Separation Pay ................. 3 45 44 5 258 208 Surcharge Collections, Commissary .............................. -28 -6 -1 Army Gift Fund .............................................................. 28 5 4 29 5 4 Air Force Gift Fund ........................................................ 5 1 1 3 5 6 Ships Stores Profit ......................................................... 12 3 6 11 10 6 USNA Gift Fund ............................................................. 17 9 8 18 8 7 Navy Gift Fund .............................................................. 2 1 1 1 1 1 Support for US Relocation to Guam .............................. 558 197 219 54 124 525
Total Trust Funds ................................................ 831 460 471 244 732 946
Foreign National Employees Separation Trust ............... -3 -45 -44 -3 -45 -44 Payment to VSI ............................................................. -38 -32 -27 -38 -32 -27 Profits from Sales of Ships Stores ................................. -11 -20 -20 -11 -20 -20
Total Interfund Transactions .............................. -53 -97 -91 -53 -97 -91
NOTE: War and supplemental funding is included.
Revolving and Management Funds
Interfund Transactions
Trust Funds
Table 6-7: INYEARS (Continued)DoD TOA, BUDGET AUTHORITY AND OUTLAYS BY APPROPRIATION ACCOUNT (DISCRETIONARY AND MANDATORY)
FY 2020 CONSTANT DOLLARS
Appropriation Account TOA Budget Authority Outlays
(Dollars in Millions)
123
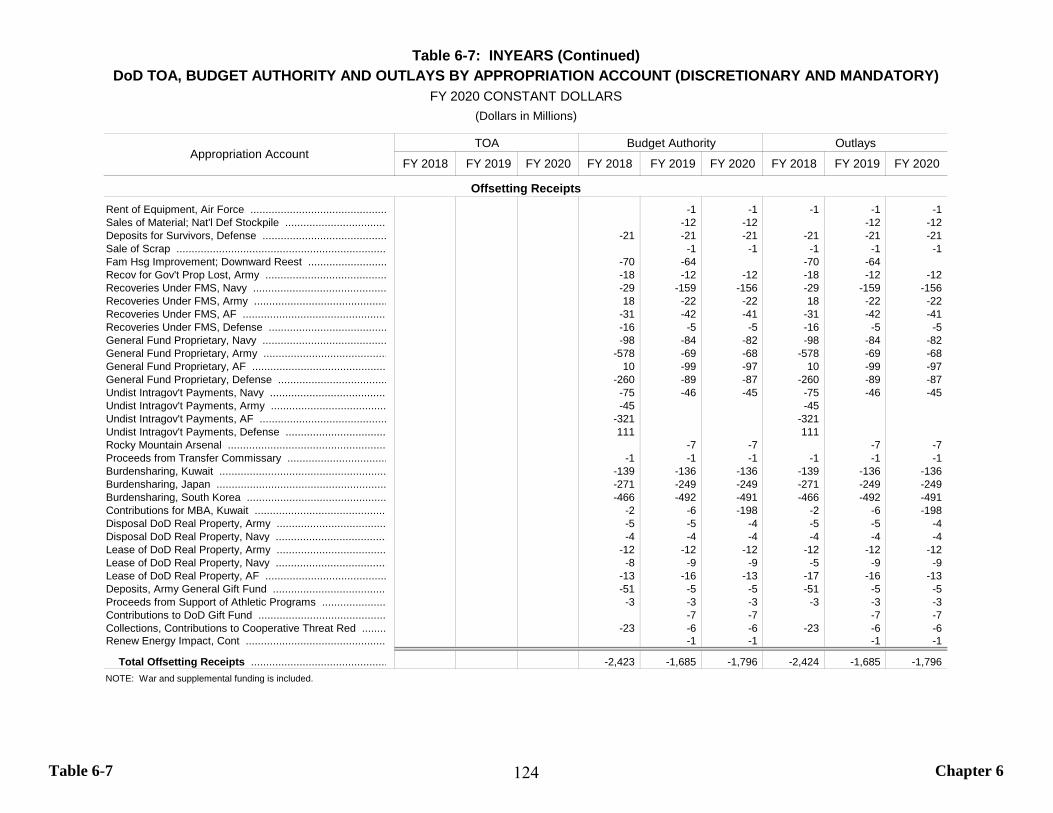
Table 6-7 Chapter 6
FY 2018 FY 2019 FY 2020 FY 2018 FY 2019 FY 2020 FY 2018 FY 2019 FY 2020
Rent of Equipment, Air Force ............................................. -1 -1 -1 -1 -1 Sales of Material; Nat'l Def Stockpile .................................. -12 -12 -12 -12 Deposits for Survivors, Defense ......................................... -21 -21 -21 -21 -21 -21 Sale of Scrap ..................................................................... -1 -1 -1 -1 -1 Fam Hsg Improvement; Downward Reest .......................... -70 -64 -70 -64 Recov for Gov't Prop Lost, Army ........................................ -18 -12 -12 -18 -12 -12 Recoveries Under FMS, Navy ............................................ -29 -159 -156 -29 -159 -156 Recoveries Under FMS, Army ............................................ 18 -22 -22 18 -22 -22 Recoveries Under FMS, AF ................................................ -31 -42 -41 -31 -42 -41 Recoveries Under FMS, Defense ....................................... -16 -5 -5 -16 -5 -5 General Fund Proprietary, Navy ......................................... -98 -84 -82 -98 -84 -82 General Fund Proprietary, Army ......................................... -578 -69 -68 -578 -69 -68 General Fund Proprietary, AF ............................................ 10 -99 -97 10 -99 -97 General Fund Proprietary, Defense .................................... -260 -89 -87 -260 -89 -87 Undist Intragov't Payments, Navy ....................................... -75 -46 -45 -75 -46 -45 Undist Intragov't Payments, Army ...................................... -45 -45 Undist Intragov't Payments, AF .......................................... -321 -321 Undist Intragov't Payments, Defense ................................. 111 111 Rocky Mountain Arsenal .................................................... -7 -7 -7 -7 Proceeds from Transfer Commissary ................................. -1 -1 -1 -1 -1 -1 Burdensharing, Kuwait ....................................................... -139 -136 -136 -139 -136 -136 Burdensharing, Japan ........................................................ -271 -249 -249 -271 -249 -249 Burdensharing, South Korea .............................................. -466 -492 -491 -466 -492 -491 Contributions for MBA, Kuwait ............................................ -2 -6 -198 -2 -6 -198 Disposal DoD Real Property, Army .................................... -5 -5 -4 -5 -5 -4 Disposal DoD Real Property, Navy ..................................... -4 -4 -4 -4 -4 -4 Lease of DoD Real Property, Army .................................... -12 -12 -12 -12 -12 -12 Lease of DoD Real Property, Navy ..................................... -8 -9 -9 -5 -9 -9 Lease of DoD Real Property, AF ........................................ -13 -16 -13 -17 -16 -13 Deposits, Army General Gift Fund ...................................... -51 -5 -5 -51 -5 -5 Proceeds from Support of Athletic Programs ..................... -3 -3 -3 -3 -3 -3 Contributions to DoD Gift Fund .......................................... -7 -7 -7 -7 Collections, Contributions to Cooperative Threat Red ........ -23 -6 -6 -23 -6 -6 Renew Energy Impact, Cont ............................................... -1 -1 -1 -1
Total Offsetting Receipts ............................................. -2,423 -1,685 -1,796 -2,424 -1,685 -1,796 NOTE: War and supplemental funding is included.
Offsetting Receipts
Table 6-7: INYEARS (Continued)DoD TOA, BUDGET AUTHORITY AND OUTLAYS BY APPROPRIATION ACCOUNT (DISCRETIONARY AND MANDATORY)
FY 2020 CONSTANT DOLLARS
Appropriation AccountTOA Budget Authority Outlays
(Dollars in Millions)
124
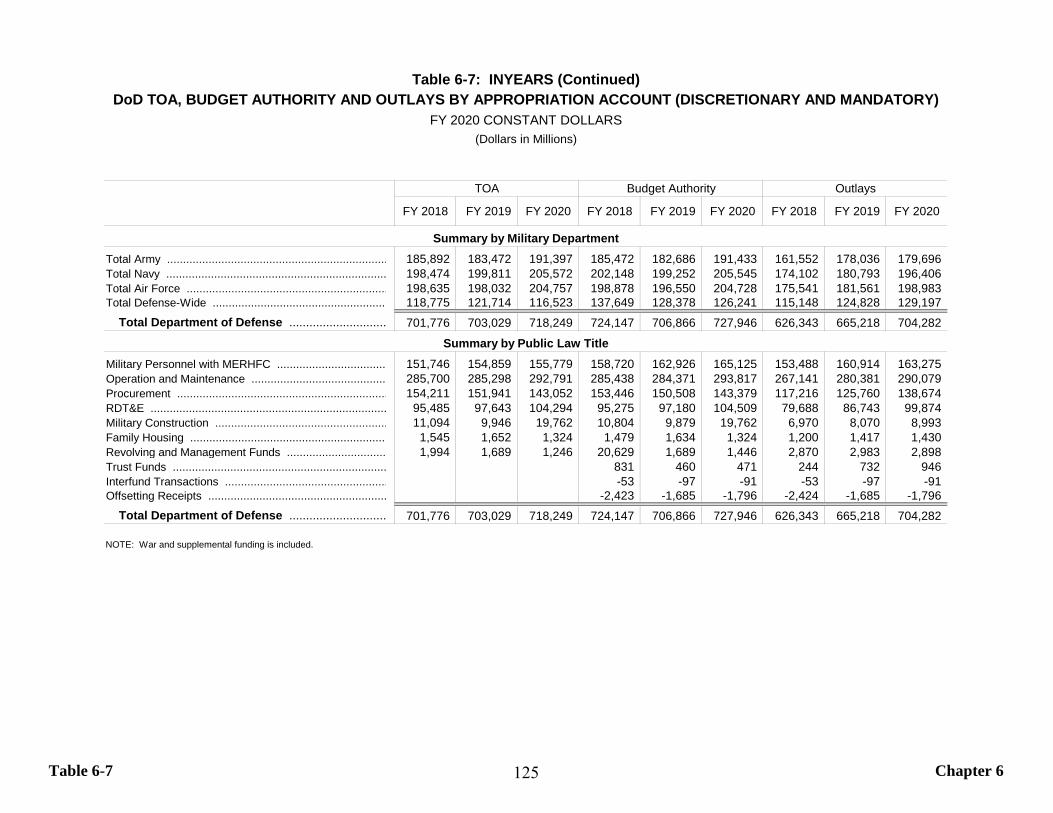
Table 6-7 Chapter 6
FY 2018 FY 2019 FY 2020 FY 2018 FY 2019 FY 2020 FY 2018 FY 2019 FY 2020
Total Army ..................................................................... 185,892 183,472 191,397 185,472 182,686 191,433 161,552 178,036 179,696 Total Navy ..................................................................... 198,474 199,811 205,572 202,148 199,252 205,545 174,102 180,793 196,406 Total Air Force ............................................................... 198,635 198,032 204,757 198,878 196,550 204,728 175,541 181,561 198,983 Total Defense-Wide ....................................................... 118,775 121,714 116,523 137,649 128,378 126,241 115,148 124,828 129,197
Total Department of Defense ............................. 701,776 703,029 718,249 724,147 706,866 727,946 626,343 665,218 704,282
Military Personnel with MERHFC .................................. 151,746 154,859 155,779 158,720 162,926 165,125 153,488 160,914 163,275 Operation and Maintenance .......................................... 285,700 285,298 292,791 285,438 284,371 293,817 267,141 280,381 290,079 Procurement .................................................................. 154,211 151,941 143,052 153,446 150,508 143,379 117,216 125,760 138,674 RDT&E .......................................................................... 95,485 97,643 104,294 95,275 97,180 104,509 79,688 86,743 99,874 Military Construction ...................................................... 11,094 9,946 19,762 10,804 9,879 19,762 6,970 8,070 8,993 Family Housing .............................................................. 1,545 1,652 1,324 1,479 1,634 1,324 1,200 1,417 1,430 Revolving and Management Funds ............................... 1,994 1,689 1,246 20,629 1,689 1,446 2,870 2,983 2,898 Trust Funds ................................................................... 831 460 471 244 732 946 Interfund Transactions ................................................... -53 -97 -91 -53 -97 -91 Offsetting Receipts ........................................................ -2,423 -1,685 -1,796 -2,424 -1,685 -1,796
Total Department of Defense ............................. 701,776 703,029 718,249 724,147 706,866 727,946 626,343 665,218 704,282
NOTE: War and supplemental funding is included.
Summary by Military Department
Summary by Public Law Title
Table 6-7: INYEARS (Continued)DoD TOA, BUDGET AUTHORITY AND OUTLAYS BY APPROPRIATION ACCOUNT (DISCRETIONARY AND MANDATORY)
FY 2020 CONSTANT DOLLARS
TOA Budget Authority Outlays
(Dollars in Millions)
125
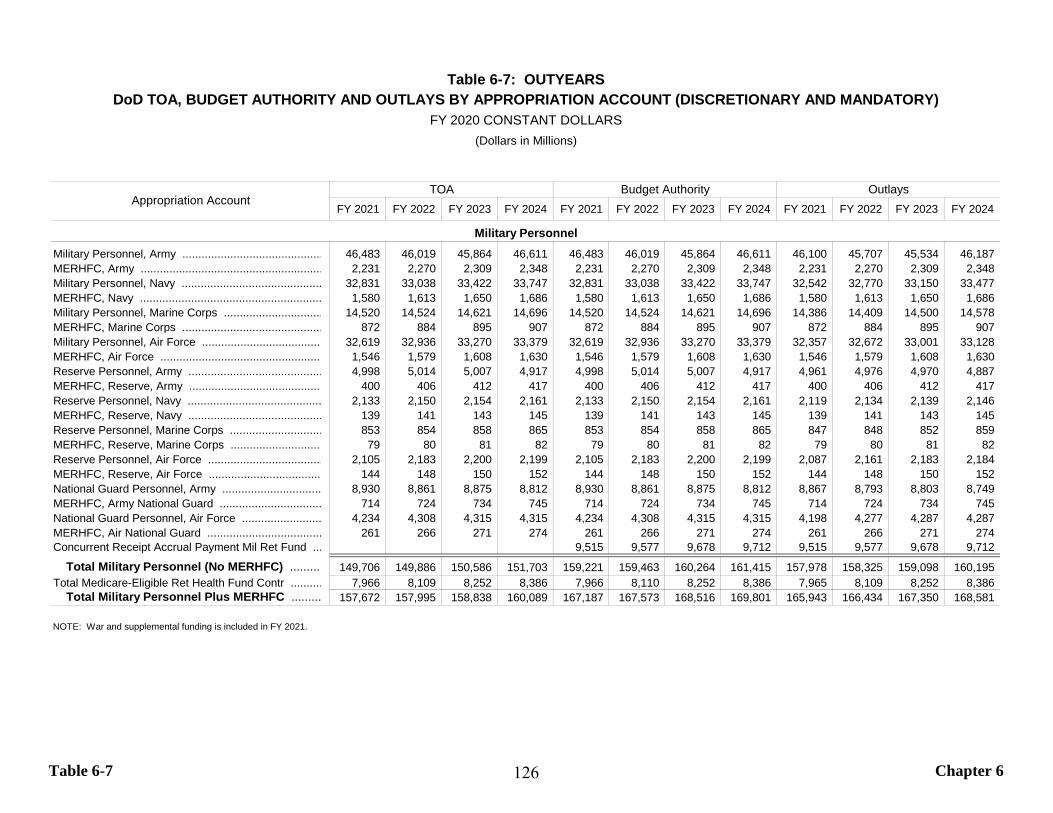
Table 6-7 Chapter 6
FY 2021 FY 2022 FY 2023 FY 2024 FY 2021 FY 2022 FY 2023 FY 2024 FY 2021 FY 2022 FY 2023 FY 2024
Military Personnel, Army ............................................ 46,483 46,019 45,864 46,611 46,483 46,019 45,864 46,611 46,100 45,707 45,534 46,187 MERHFC, Army ......................................................... 2,231 2,270 2,309 2,348 2,231 2,270 2,309 2,348 2,231 2,270 2,309 2,348 Military Personnel, Navy ............................................ 32,831 33,038 33,422 33,747 32,831 33,038 33,422 33,747 32,542 32,770 33,150 33,477 MERHFC, Navy ......................................................... 1,580 1,613 1,650 1,686 1,580 1,613 1,650 1,686 1,580 1,613 1,650 1,686 Military Personnel, Marine Corps ............................... 14,520 14,524 14,621 14,696 14,520 14,524 14,621 14,696 14,386 14,409 14,500 14,578 MERHFC, Marine Corps ............................................ 872 884 895 907 872 884 895 907 872 884 895 907 Military Personnel, Air Force ...................................... 32,619 32,936 33,270 33,379 32,619 32,936 33,270 33,379 32,357 32,672 33,001 33,128 MERHFC, Air Force ................................................... 1,546 1,579 1,608 1,630 1,546 1,579 1,608 1,630 1,546 1,579 1,608 1,630 Reserve Personnel, Army .......................................... 4,998 5,014 5,007 4,917 4,998 5,014 5,007 4,917 4,961 4,976 4,970 4,887 MERHFC, Reserve, Army .......................................... 400 406 412 417 400 406 412 417 400 406 412 417 Reserve Personnel, Navy .......................................... 2,133 2,150 2,154 2,161 2,133 2,150 2,154 2,161 2,119 2,134 2,139 2,146 MERHFC, Reserve, Navy .......................................... 139 141 143 145 139 141 143 145 139 141 143 145 Reserve Personnel, Marine Corps ............................. 853 854 858 865 853 854 858 865 847 848 852 859 MERHFC, Reserve, Marine Corps ............................. 79 80 81 82 79 80 81 82 79 80 81 82 Reserve Personnel, Air Force .................................... 2,105 2,183 2,200 2,199 2,105 2,183 2,200 2,199 2,087 2,161 2,183 2,184 MERHFC, Reserve, Air Force .................................... 144 148 150 152 144 148 150 152 144 148 150 152 National Guard Personnel, Army ............................... 8,930 8,861 8,875 8,812 8,930 8,861 8,875 8,812 8,867 8,793 8,803 8,749 MERHFC, Army National Guard ................................ 714 724 734 745 714 724 734 745 714 724 734 745 National Guard Personnel, Air Force ......................... 4,234 4,308 4,315 4,315 4,234 4,308 4,315 4,315 4,198 4,277 4,287 4,287 MERHFC, Air National Guard .................................... 261 266 271 274 261 266 271 274 261 266 271 274 Concurrent Receipt Accrual Payment Mil Ret Fund ... 9,515 9,577 9,678 9,712 9,515 9,577 9,678 9,712
Total Military Personnel (No MERHFC) .......... 149,706 149,886 150,586 151,703 159,221 159,463 160,264 161,415 157,978 158,325 159,098 160,195 Total Medicare-Eligible Ret Health Fund Contr .......... 7,966 8,109 8,252 8,386 7,966 8,110 8,252 8,386 7,965 8,109 8,252 8,386
Total Military Personnel Plus MERHFC ......... 157,672 157,995 158,838 160,089 167,187 167,573 168,516 169,801 165,943 166,434 167,350 168,581
NOTE: War and supplemental funding is included in FY 2021.
Military Personnel
Table 6-7: OUTYEARS
FY 2020 CONSTANT DOLLARSDoD TOA, BUDGET AUTHORITY AND OUTLAYS BY APPROPRIATION ACCOUNT (DISCRETIONARY AND MANDATORY)
TOA Budget Authority OutlaysAppropriation Account
(Dollars in Millions)
126
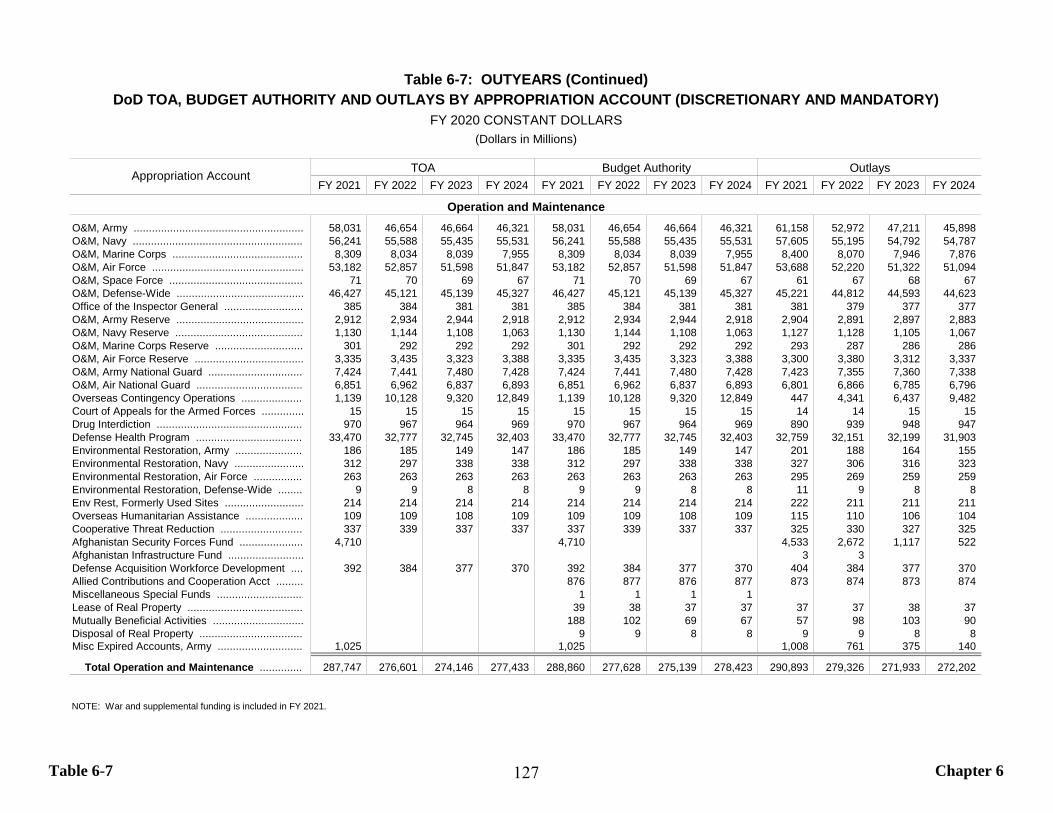
Table 6-7 Chapter 6
FY 2021 FY 2022 FY 2023 FY 2024 FY 2021 FY 2022 FY 2023 FY 2024 FY 2021 FY 2022 FY 2023 FY 2024
O&M, Army ........................................................ 58,031 46,654 46,664 46,321 58,031 46,654 46,664 46,321 61,158 52,972 47,211 45,898 O&M, Navy ........................................................ 56,241 55,588 55,435 55,531 56,241 55,588 55,435 55,531 57,605 55,195 54,792 54,787 O&M, Marine Corps ........................................... 8,309 8,034 8,039 7,955 8,309 8,034 8,039 7,955 8,400 8,070 7,946 7,876 O&M, Air Force .................................................. 53,182 52,857 51,598 51,847 53,182 52,857 51,598 51,847 53,688 52,220 51,322 51,094 O&M, Space Force ............................................ 71 70 69 67 71 70 69 67 61 67 68 67 O&M, Defense-Wide .......................................... 46,427 45,121 45,139 45,327 46,427 45,121 45,139 45,327 45,221 44,812 44,593 44,623 Office of the Inspector General .......................... 385 384 381 381 385 384 381 381 381 379 377 377 O&M, Army Reserve .......................................... 2,912 2,934 2,944 2,918 2,912 2,934 2,944 2,918 2,904 2,891 2,897 2,883 O&M, Navy Reserve .......................................... 1,130 1,144 1,108 1,063 1,130 1,144 1,108 1,063 1,127 1,128 1,105 1,067 O&M, Marine Corps Reserve ............................. 301 292 292 292 301 292 292 292 293 287 286 286 O&M, Air Force Reserve .................................... 3,335 3,435 3,323 3,388 3,335 3,435 3,323 3,388 3,300 3,380 3,312 3,337 O&M, Army National Guard ............................... 7,424 7,441 7,480 7,428 7,424 7,441 7,480 7,428 7,423 7,355 7,360 7,338 O&M, Air National Guard ................................... 6,851 6,962 6,837 6,893 6,851 6,962 6,837 6,893 6,801 6,866 6,785 6,796 Overseas Contingency Operations ..................... 1,139 10,128 9,320 12,849 1,139 10,128 9,320 12,849 447 4,341 6,437 9,482 Court of Appeals for the Armed Forces .............. 15 15 15 15 15 15 15 15 14 14 15 15 Drug Interdiction ................................................ 970 967 964 969 970 967 964 969 890 939 948 947 Defense Health Program .................................... 33,470 32,777 32,745 32,403 33,470 32,777 32,745 32,403 32,759 32,151 32,199 31,903 Environmental Restoration, Army ....................... 186 185 149 147 186 185 149 147 201 188 164 155 Environmental Restoration, Navy ....................... 312 297 338 338 312 297 338 338 327 306 316 323 Environmental Restoration, Air Force ................ 263 263 263 263 263 263 263 263 295 269 259 259 Environmental Restoration, Defense-Wide ........ 9 9 8 8 9 9 8 8 11 9 8 8 Env Rest, Formerly Used Sites .......................... 214 214 214 214 214 214 214 214 222 211 211 211 Overseas Humanitarian Assistance ................... 109 109 108 109 109 109 108 109 115 110 106 104 Cooperative Threat Reduction ........................... 337 339 337 337 337 339 337 337 325 330 327 325 Afghanistan Security Forces Fund ..................... 4,710 4,710 4,533 2,672 1,117 522 Afghanistan Infrastructure Fund ......................... 3 3 Defense Acquisition Workforce Development .... 392 384 377 370 392 384 377 370 404 384 377 370 Allied Contributions and Cooperation Acct ......... 876 877 876 877 873 874 873 874 Miscellaneous Special Funds ............................. 1 1 1 1 Lease of Real Property ...................................... 39 38 37 37 37 37 38 37 Mutually Beneficial Activities .............................. 188 102 69 67 57 98 103 90 Disposal of Real Property .................................. 9 9 8 8 9 9 8 8 Misc Expired Accounts, Army ............................ 1,025 1,025 1,008 761 375 140
Total Operation and Maintenance ............... 287,747 276,601 274,146 277,433 288,860 277,628 275,139 278,423 290,893 279,326 271,933 272,202
NOTE: War and supplemental funding is included in FY 2021.
Operation and Maintenance
Table 6-7: OUTYEARS (Continued)DoD TOA, BUDGET AUTHORITY AND OUTLAYS BY APPROPRIATION ACCOUNT (DISCRETIONARY AND MANDATORY)
FY 2020 CONSTANT DOLLARS
Appropriation Account TOA Budget Authority Outlays
(Dollars in Millions)
127
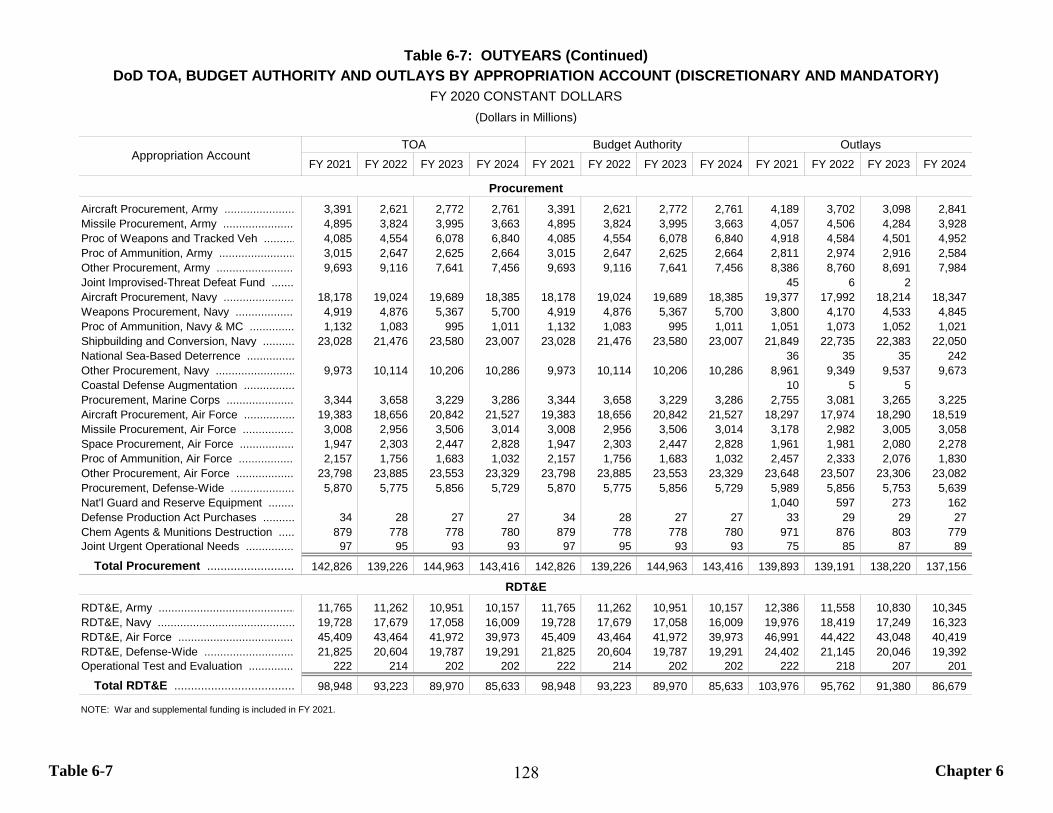
Table 6-7 Chapter 6
FY 2021 FY 2022 FY 2023 FY 2024 FY 2021 FY 2022 FY 2023 FY 2024 FY 2021 FY 2022 FY 2023 FY 2024
Aircraft Procurement, Army ...................... 3,391 2,621 2,772 2,761 3,391 2,621 2,772 2,761 4,189 3,702 3,098 2,841 Missile Procurement, Army ...................... 4,895 3,824 3,995 3,663 4,895 3,824 3,995 3,663 4,057 4,506 4,284 3,928 Proc of Weapons and Tracked Veh .......... 4,085 4,554 6,078 6,840 4,085 4,554 6,078 6,840 4,918 4,584 4,501 4,952 Proc of Ammunition, Army ........................ 3,015 2,647 2,625 2,664 3,015 2,647 2,625 2,664 2,811 2,974 2,916 2,584 Other Procurement, Army ........................ 9,693 9,116 7,641 7,456 9,693 9,116 7,641 7,456 8,386 8,760 8,691 7,984 Joint Improvised-Threat Defeat Fund ....... 45 6 2 Aircraft Procurement, Navy ...................... 18,178 19,024 19,689 18,385 18,178 19,024 19,689 18,385 19,377 17,992 18,214 18,347 Weapons Procurement, Navy ................... 4,919 4,876 5,367 5,700 4,919 4,876 5,367 5,700 3,800 4,170 4,533 4,845 Proc of Ammunition, Navy & MC .............. 1,132 1,083 995 1,011 1,132 1,083 995 1,011 1,051 1,073 1,052 1,021 Shipbuilding and Conversion, Navy .......... 23,028 21,476 23,580 23,007 23,028 21,476 23,580 23,007 21,849 22,735 22,383 22,050 National Sea-Based Deterrence ............... 36 35 35 242 Other Procurement, Navy ......................... 9,973 10,114 10,206 10,286 9,973 10,114 10,206 10,286 8,961 9,349 9,537 9,673 Coastal Defense Augmentation ................ 10 5 5 Procurement, Marine Corps ..................... 3,344 3,658 3,229 3,286 3,344 3,658 3,229 3,286 2,755 3,081 3,265 3,225 Aircraft Procurement, Air Force ................ 19,383 18,656 20,842 21,527 19,383 18,656 20,842 21,527 18,297 17,974 18,290 18,519 Missile Procurement, Air Force ................ 3,008 2,956 3,506 3,014 3,008 2,956 3,506 3,014 3,178 2,982 3,005 3,058 Space Procurement, Air Force ................. 1,947 2,303 2,447 2,828 1,947 2,303 2,447 2,828 1,961 1,981 2,080 2,278 Proc of Ammunition, Air Force .................. 2,157 1,756 1,683 1,032 2,157 1,756 1,683 1,032 2,457 2,333 2,076 1,830 Other Procurement, Air Force .................. 23,798 23,885 23,553 23,329 23,798 23,885 23,553 23,329 23,648 23,507 23,306 23,082 Procurement, Defense-Wide .................... 5,870 5,775 5,856 5,729 5,870 5,775 5,856 5,729 5,989 5,856 5,753 5,639 Nat'l Guard and Reserve Equipment ........ 1,040 597 273 162 Defense Production Act Purchases .......... 34 28 27 27 34 28 27 27 33 29 29 27 Chem Agents & Munitions Destruction ..... 879 778 778 780 879 778 778 780 971 876 803 779 Joint Urgent Operational Needs ............... 97 95 93 93 97 95 93 93 75 85 87 89
Total Procurement .......................... 142,826 139,226 144,963 143,416 142,826 139,226 144,963 143,416 139,893 139,191 138,220 137,156
RDT&E, Army ........................................... 11,765 11,262 10,951 10,157 11,765 11,262 10,951 10,157 12,386 11,558 10,830 10,345 RDT&E, Navy ........................................... 19,728 17,679 17,058 16,009 19,728 17,679 17,058 16,009 19,976 18,419 17,249 16,323 RDT&E, Air Force .................................... 45,409 43,464 41,972 39,973 45,409 43,464 41,972 39,973 46,991 44,422 43,048 40,419 RDT&E, Defense-Wide ............................ 21,825 20,604 19,787 19,291 21,825 20,604 19,787 19,291 24,402 21,145 20,046 19,392 Operational Test and Evaluation .............. 222 214 202 202 222 214 202 202 222 218 207 201
Total RDT&E .................................... 98,948 93,223 89,970 85,633 98,948 93,223 89,970 85,633 103,976 95,762 91,380 86,679
NOTE: War and supplemental funding is included in FY 2021.
Procurement
RDT&E
Table 6-7: OUTYEARS (Continued)DoD TOA, BUDGET AUTHORITY AND OUTLAYS BY APPROPRIATION ACCOUNT (DISCRETIONARY AND MANDATORY)
FY 2020 CONSTANT DOLLARS
Appropriation AccountTOA Budget Authority Outlays
(Dollars in Millions)
128
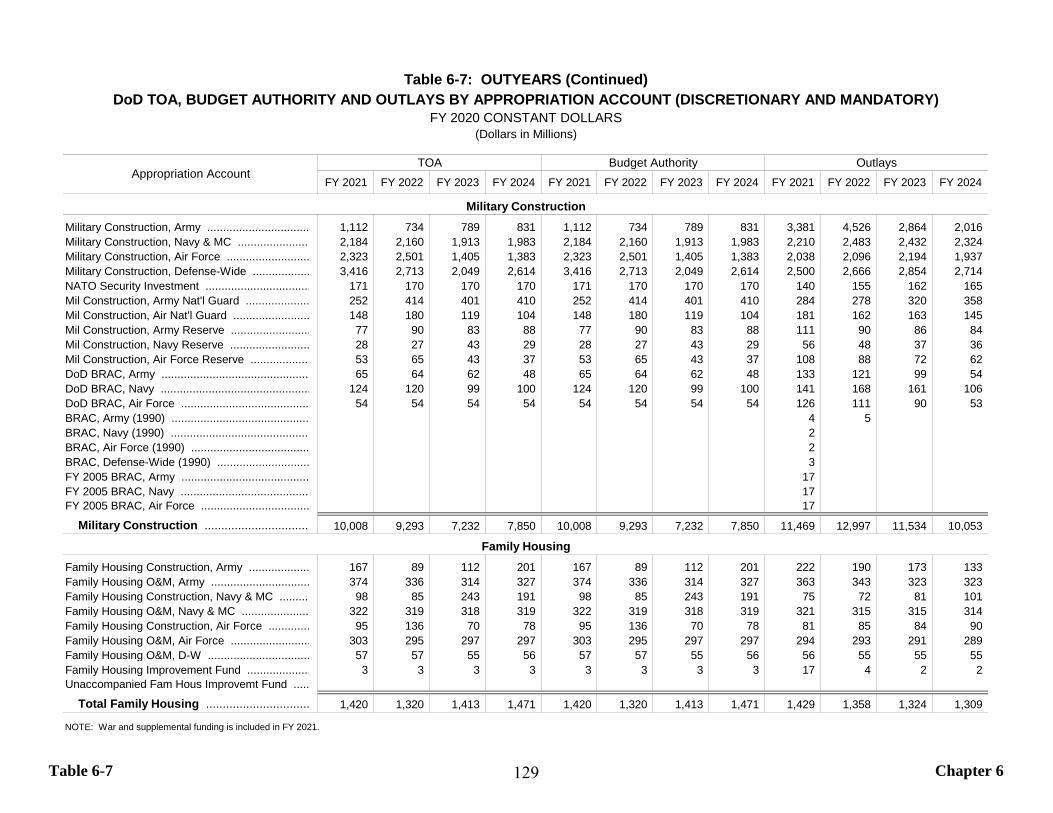
Table 6-7 Chapter 6
FY 2021 FY 2022 FY 2023 FY 2024 FY 2021 FY 2022 FY 2023 FY 2024 FY 2021 FY 2022 FY 2023 FY 2024
Military Construction, Army ................................ 1,112 734 789 831 1,112 734 789 831 3,381 4,526 2,864 2,016 Military Construction, Navy & MC ....................... 2,184 2,160 1,913 1,983 2,184 2,160 1,913 1,983 2,210 2,483 2,432 2,324 Military Construction, Air Force .......................... 2,323 2,501 1,405 1,383 2,323 2,501 1,405 1,383 2,038 2,096 2,194 1,937 Military Construction, Defense-Wide .................. 3,416 2,713 2,049 2,614 3,416 2,713 2,049 2,614 2,500 2,666 2,854 2,714 NATO Security Investment ................................. 171 170 170 170 171 170 170 170 140 155 162 165 Mil Construction, Army Nat'l Guard .................... 252 414 401 410 252 414 401 410 284 278 320 358 Mil Construction, Air Nat'l Guard ........................ 148 180 119 104 148 180 119 104 181 162 163 145 Mil Construction, Army Reserve ......................... 77 90 83 88 77 90 83 88 111 90 86 84 Mil Construction, Navy Reserve ......................... 28 27 43 29 28 27 43 29 56 48 37 36 Mil Construction, Air Force Reserve ................... 53 65 43 37 53 65 43 37 108 88 72 62 DoD BRAC, Army ............................................... 65 64 62 48 65 64 62 48 133 121 99 54 DoD BRAC, Navy ............................................... 124 120 99 100 124 120 99 100 141 168 161 106 DoD BRAC, Air Force ......................................... 54 54 54 54 54 54 54 54 126 111 90 53 BRAC, Army (1990) ............................................ 4 5 BRAC, Navy (1990) ............................................ 2 BRAC, Air Force (1990) ..................................... 2 BRAC, Defense-Wide (1990) ............................. 3 FY 2005 BRAC, Army ........................................ 17 FY 2005 BRAC, Navy ......................................... 17 FY 2005 BRAC, Air Force .................................. 17
Military Construction ................................ 10,008 9,293 7,232 7,850 10,008 9,293 7,232 7,850 11,469 12,997 11,534 10,053
Family Housing Construction, Army ................... 167 89 112 201 167 89 112 201 222 190 173 133 Family Housing O&M, Army ............................... 374 336 314 327 374 336 314 327 363 343 323 323 Family Housing Construction, Navy & MC .......... 98 85 243 191 98 85 243 191 75 72 81 101 Family Housing O&M, Navy & MC ...................... 322 319 318 319 322 319 318 319 321 315 315 314 Family Housing Construction, Air Force ............. 95 136 70 78 95 136 70 78 81 85 84 90 Family Housing O&M, Air Force ......................... 303 295 297 297 303 295 297 297 294 293 291 289 Family Housing O&M, D-W ................................ 57 57 55 56 57 57 55 56 56 55 55 55 Family Housing Improvement Fund .................... 3 3 3 3 3 3 3 3 17 4 2 2 Unaccompanied Fam Hous Improvemt Fund .....
Total Family Housing ............................... 1,420 1,320 1,413 1,471 1,420 1,320 1,413 1,471 1,429 1,358 1,324 1,309
NOTE: War and supplemental funding is included in FY 2021.
Military Construction
Family Housing
Table 6-7: OUTYEARS (Continued)DoD TOA, BUDGET AUTHORITY AND OUTLAYS BY APPROPRIATION ACCOUNT (DISCRETIONARY AND MANDATORY)
FY 2020 CONSTANT DOLLARS
Appropriation AccountTOA Budget Authority Outlays
(Dollars in Millions)
129
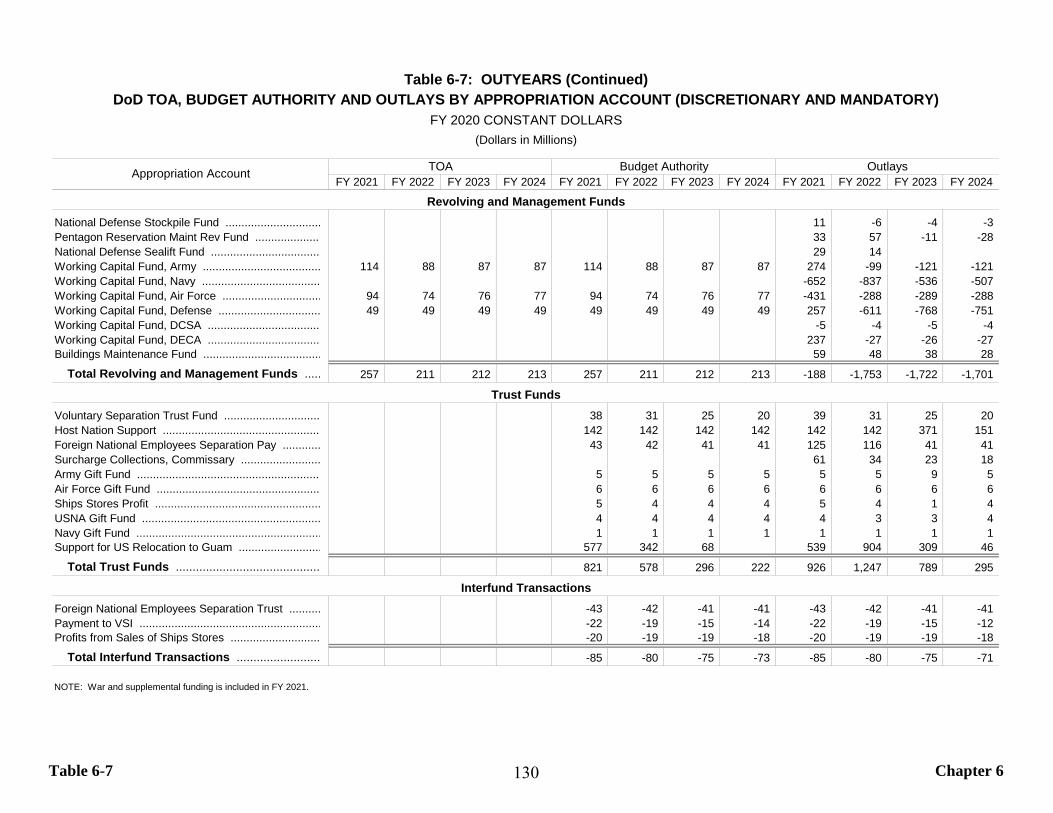
Table 6-7 Chapter 6
FY 2021 FY 2022 FY 2023 FY 2024 FY 2021 FY 2022 FY 2023 FY 2024 FY 2021 FY 2022 FY 2023 FY 2024
National Defense Stockpile Fund .............................. 11 -6 -4 -3 Pentagon Reservation Maint Rev Fund ..................... 33 57 -11 -28 National Defense Sealift Fund ................................... 29 14 Working Capital Fund, Army ..................................... 114 88 87 87 114 88 87 87 274 -99 -121 -121 Working Capital Fund, Navy ..................................... -652 -837 -536 -507 Working Capital Fund, Air Force ............................... 94 74 76 77 94 74 76 77 -431 -288 -289 -288 Working Capital Fund, Defense ................................ 49 49 49 49 49 49 49 49 257 -611 -768 -751 Working Capital Fund, DCSA .................................... -5 -4 -5 -4 Working Capital Fund, DECA .................................... 237 -27 -26 -27 Buildings Maintenance Fund ..................................... 59 48 38 28
Total Revolving and Management Funds ..... 257 211 212 213 257 211 212 213 -188 -1,753 -1,722 -1,701
Voluntary Separation Trust Fund ............................... 38 31 25 20 39 31 25 20 Host Nation Support .................................................. 142 142 142 142 142 142 371 151 Foreign National Employees Separation Pay ............ 43 42 41 41 125 116 41 41 Surcharge Collections, Commissary ......................... 61 34 23 18 Army Gift Fund .......................................................... 5 5 5 5 5 5 9 5 Air Force Gift Fund .................................................... 6 6 6 6 6 6 6 6 Ships Stores Profit .................................................... 5 4 4 4 5 4 1 4 USNA Gift Fund ........................................................ 4 4 4 4 4 3 3 4 Navy Gift Fund .......................................................... 1 1 1 1 1 1 1 1 Support for US Relocation to Guam .......................... 577 342 68 539 904 309 46
Total Trust Funds ........................................... 821 578 296 222 926 1,247 789 295
Foreign National Employees Separation Trust .......... -43 -42 -41 -41 -43 -42 -41 -41 Payment to VSI ......................................................... -22 -19 -15 -14 -22 -19 -15 -12 Profits from Sales of Ships Stores ............................ -20 -19 -19 -18 -20 -19 -19 -18
Total Interfund Transactions ......................... -85 -80 -75 -73 -85 -80 -75 -71
NOTE: War and supplemental funding is included in FY 2021.
Revolving and Management Funds
Interfund Transactions
Trust Funds
Table 6-7: OUTYEARS (Continued)DoD TOA, BUDGET AUTHORITY AND OUTLAYS BY APPROPRIATION ACCOUNT (DISCRETIONARY AND MANDATORY)
FY 2020 CONSTANT DOLLARS
Appropriation Account TOA Budget Authority Outlays
(Dollars in Millions)
130
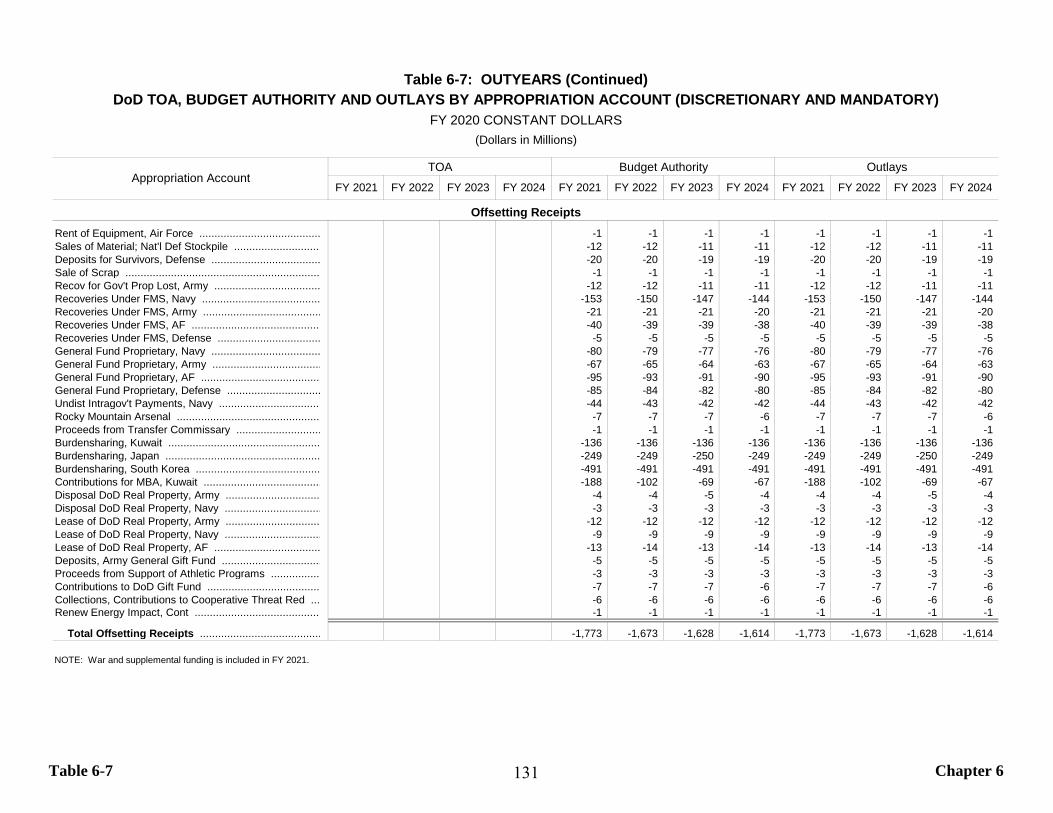
Table 6-7 Chapter 6
FY 2021 FY 2022 FY 2023 FY 2024 FY 2021 FY 2022 FY 2023 FY 2024 FY 2021 FY 2022 FY 2023 FY 2024
Rent of Equipment, Air Force ........................................ -1 -1 -1 -1 -1 -1 -1 -1Sales of Material; Nat'l Def Stockpile ............................. -12 -12 -11 -11 -12 -12 -11 -11Deposits for Survivors, Defense .................................... -20 -20 -19 -19 -20 -20 -19 -19Sale of Scrap ................................................................ -1 -1 -1 -1 -1 -1 -1 -1Recov for Gov't Prop Lost, Army ................................... -12 -12 -11 -11 -12 -12 -11 -11Recoveries Under FMS, Navy ....................................... -153 -150 -147 -144 -153 -150 -147 -144Recoveries Under FMS, Army ....................................... -21 -21 -21 -20 -21 -21 -21 -20Recoveries Under FMS, AF ........................................... -40 -39 -39 -38 -40 -39 -39 -38Recoveries Under FMS, Defense .................................. -5 -5 -5 -5 -5 -5 -5 -5General Fund Proprietary, Navy .................................... -80 -79 -77 -76 -80 -79 -77 -76General Fund Proprietary, Army .................................... -67 -65 -64 -63 -67 -65 -64 -63General Fund Proprietary, AF ........................................ -95 -93 -91 -90 -95 -93 -91 -90General Fund Proprietary, Defense ............................... -85 -84 -82 -80 -85 -84 -82 -80Undist Intragov't Payments, Navy .................................. -44 -43 -42 -42 -44 -43 -42 -42Rocky Mountain Arsenal ................................................ -7 -7 -7 -6 -7 -7 -7 -6Proceeds from Transfer Commissary ............................ -1 -1 -1 -1 -1 -1 -1 -1Burdensharing, Kuwait .................................................. -136 -136 -136 -136 -136 -136 -136 -136Burdensharing, Japan ................................................... -249 -249 -250 -249 -249 -249 -250 -249Burdensharing, South Korea ......................................... -491 -491 -491 -491 -491 -491 -491 -491Contributions for MBA, Kuwait ....................................... -188 -102 -69 -67 -188 -102 -69 -67Disposal DoD Real Property, Army ............................... -4 -4 -5 -4 -4 -4 -5 -4Disposal DoD Real Property, Navy ................................ -3 -3 -3 -3 -3 -3 -3 -3Lease of DoD Real Property, Army ............................... -12 -12 -12 -12 -12 -12 -12 -12Lease of DoD Real Property, Navy ................................ -9 -9 -9 -9 -9 -9 -9 -9Lease of DoD Real Property, AF ................................... -13 -14 -13 -14 -13 -14 -13 -14Deposits, Army General Gift Fund ................................. -5 -5 -5 -5 -5 -5 -5 -5Proceeds from Support of Athletic Programs ................ -3 -3 -3 -3 -3 -3 -3 -3Contributions to DoD Gift Fund ..................................... -7 -7 -7 -6 -7 -7 -7 -6Collections, Contributions to Cooperative Threat Red ... -6 -6 -6 -6 -6 -6 -6 -6Renew Energy Impact, Cont .......................................... -1 -1 -1 -1 -1 -1 -1 -1
Total Offsetting Receipts ........................................ -1,773 -1,673 -1,628 -1,614 -1,773 -1,673 -1,628 -1,614
NOTE: War and supplemental funding is included in FY 2021.
Offsetting Receipts
Table 6-7: OUTYEARS (Continued)DoD TOA, BUDGET AUTHORITY AND OUTLAYS BY APPROPRIATION ACCOUNT (DISCRETIONARY AND MANDATORY)
FY 2020 CONSTANT DOLLARS
Appropriation AccountTOA Budget Authority Outlays
(Dollars in Millions)
131
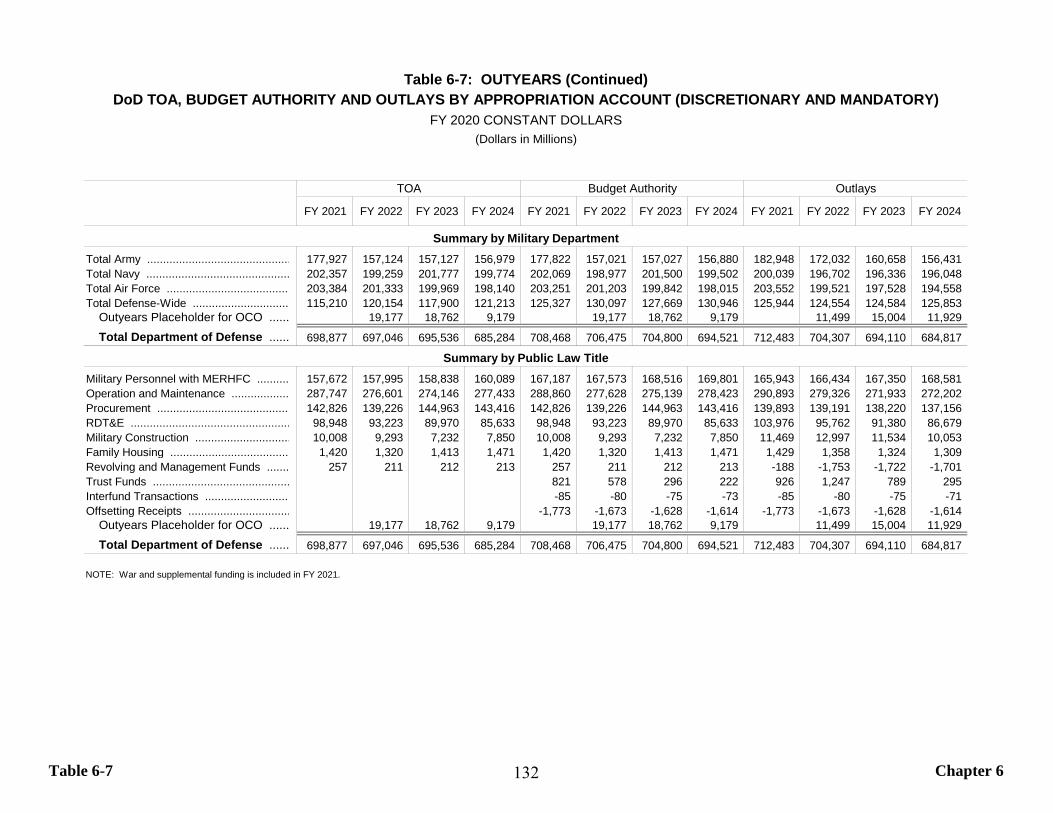
Table 6-7 Chapter 6
FY 2021 FY 2022 FY 2023 FY 2024 FY 2021 FY 2022 FY 2023 FY 2024 FY 2021 FY 2022 FY 2023 FY 2024
Total Army ............................................. 177,927 157,124 157,127 156,979 177,822 157,021 157,027 156,880 182,948 172,032 160,658 156,431 Total Navy ............................................. 202,357 199,259 201,777 199,774 202,069 198,977 201,500 199,502 200,039 196,702 196,336 196,048 Total Air Force ....................................... 203,384 201,333 199,969 198,140 203,251 201,203 199,842 198,015 203,552 199,521 197,528 194,558 Total Defense-Wide .............................. 115,210 120,154 117,900 121,213 125,327 130,097 127,669 130,946 125,944 124,554 124,584 125,853
Outyears Placeholder for OCO ...... 19,177 18,762 9,179 19,177 18,762 9,179 11,499 15,004 11,929
Total Department of Defense ...... 698,877 697,046 695,536 685,284 708,468 706,475 704,800 694,521 712,483 704,307 694,110 684,817
Military Personnel with MERHFC .......... 157,672 157,995 158,838 160,089 167,187 167,573 168,516 169,801 165,943 166,434 167,350 168,581 Operation and Maintenance .................. 287,747 276,601 274,146 277,433 288,860 277,628 275,139 278,423 290,893 279,326 271,933 272,202 Procurement .......................................... 142,826 139,226 144,963 143,416 142,826 139,226 144,963 143,416 139,893 139,191 138,220 137,156 RDT&E .................................................. 98,948 93,223 89,970 85,633 98,948 93,223 89,970 85,633 103,976 95,762 91,380 86,679 Military Construction .............................. 10,008 9,293 7,232 7,850 10,008 9,293 7,232 7,850 11,469 12,997 11,534 10,053 Family Housing ..................................... 1,420 1,320 1,413 1,471 1,420 1,320 1,413 1,471 1,429 1,358 1,324 1,309 Revolving and Management Funds ....... 257 211 212 213 257 211 212 213 -188 -1,753 -1,722 -1,701 Trust Funds ........................................... 821 578 296 222 926 1,247 789 295 Interfund Transactions ........................... -85 -80 -75 -73 -85 -80 -75 -71 Offsetting Receipts ................................ -1,773 -1,673 -1,628 -1,614 -1,773 -1,673 -1,628 -1,614
Outyears Placeholder for OCO ...... 19,177 18,762 9,179 19,177 18,762 9,179 11,499 15,004 11,929
Total Department of Defense ...... 698,877 697,046 695,536 685,284 708,468 706,475 704,800 694,521 712,483 704,307 694,110 684,817
NOTE: War and supplemental funding is included in FY 2021.
Summary by Military Department
Summary by Public Law Title
Table 6-7: OUTYEARS (Continued)DoD TOA, BUDGET AUTHORITY AND OUTLAYS BY APPROPRIATION ACCOUNT (DISCRETIONARY AND MANDATORY)
FY 2020 CONSTANT DOLLARS
TOA Budget Authority Outlays
(Dollars in Millions)
132
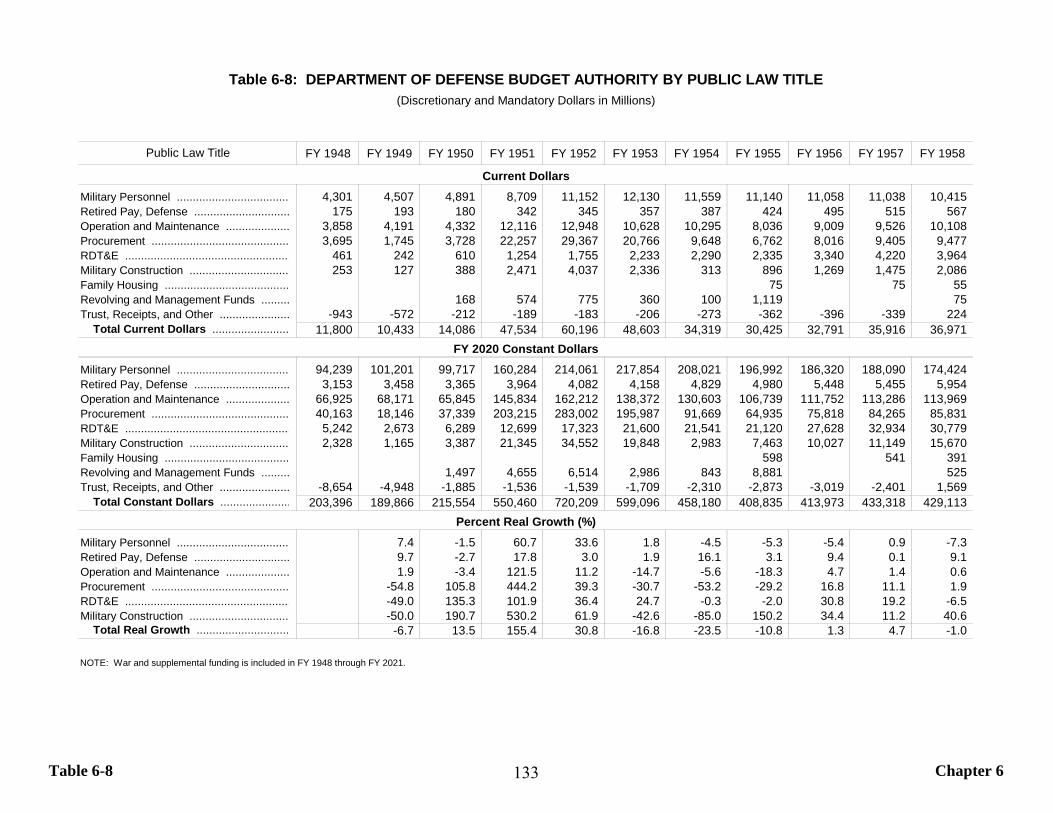
Table 6-8 Chapter 6
FY 1948 FY 1949 FY 1950 FY 1951 FY 1952 FY 1953 FY 1954 FY 1955 FY 1956 FY 1957 FY 1958
Military Personnel ................................... 4,301 4,507 4,891 8,709 11,152 12,130 11,559 11,140 11,058 11,038 10,415 Retired Pay, Defense .............................. 175 193 180 342 345 357 387 424 495 515 567 Operation and Maintenance .................... 3,858 4,191 4,332 12,116 12,948 10,628 10,295 8,036 9,009 9,526 10,108 Procurement ........................................... 3,695 1,745 3,728 22,257 29,367 20,766 9,648 6,762 8,016 9,405 9,477 RDT&E .................................................... 461 242 610 1,254 1,755 2,233 2,290 2,335 3,340 4,220 3,964 Military Construction ............................... 253 127 388 2,471 4,037 2,336 313 896 1,269 1,475 2,086 Family Housing ....................................... 75 75 55 Revolving and Management Funds ......... 168 574 775 360 100 1,119 75 Trust, Receipts, and Other ...................... -943 -572 -212 -189 -183 -206 -273 -362 -396 -339 224
Total Current Dollars ........................ 11,800 10,433 14,086 47,534 60,196 48,603 34,319 30,425 32,791 35,916 36,971
Military Personnel ................................... 94,239 101,201 99,717 160,284 214,061 217,854 208,021 196,992 186,320 188,090 174,424 Retired Pay, Defense .............................. 3,153 3,458 3,365 3,964 4,082 4,158 4,829 4,980 5,448 5,455 5,954 Operation and Maintenance .................... 66,925 68,171 65,845 145,834 162,212 138,372 130,603 106,739 111,752 113,286 113,969 Procurement ........................................... 40,163 18,146 37,339 203,215 283,002 195,987 91,669 64,935 75,818 84,265 85,831 RDT&E .................................................... 5,242 2,673 6,289 12,699 17,323 21,600 21,541 21,120 27,628 32,934 30,779 Military Construction ............................... 2,328 1,165 3,387 21,345 34,552 19,848 2,983 7,463 10,027 11,149 15,670 Family Housing ....................................... 598 541 391 Revolving and Management Funds ......... 1,497 4,655 6,514 2,986 843 8,881 525 Trust, Receipts, and Other ...................... -8,654 -4,948 -1,885 -1,536 -1,539 -1,709 -2,310 -2,873 -3,019 -2,401 1,569
Total Constant Dollars ...................... 203,396 189,866 215,554 550,460 720,209 599,096 458,180 408,835 413,973 433,318 429,113
Military Personnel ................................... 7.4 -1.5 60.7 33.6 1.8 -4.5 -5.3 -5.4 0.9 -7.3 Retired Pay, Defense .............................. 9.7 -2.7 17.8 3.0 1.9 16.1 3.1 9.4 0.1 9.1 Operation and Maintenance .................... 1.9 -3.4 121.5 11.2 -14.7 -5.6 -18.3 4.7 1.4 0.6 Procurement ........................................... -54.8 105.8 444.2 39.3 -30.7 -53.2 -29.2 16.8 11.1 1.9 RDT&E .................................................... -49.0 135.3 101.9 36.4 24.7 -0.3 -2.0 30.8 19.2 -6.5 Military Construction ............................... -50.0 190.7 530.2 61.9 -42.6 -85.0 150.2 34.4 11.2 40.6
Total Real Growth ............................. -6.7 13.5 155.4 30.8 -16.8 -23.5 -10.8 1.3 4.7 -1.0
NOTE: War and supplemental funding is included in FY 1948 through FY 2021.
Percent Real Growth (%)
Table 6-8: DEPARTMENT OF DEFENSE BUDGET AUTHORITY BY PUBLIC LAW TITLE(Discretionary and Mandatory Dollars in Millions)
Public Law Title
Current Dollars
FY 2020 Constant Dollars
133
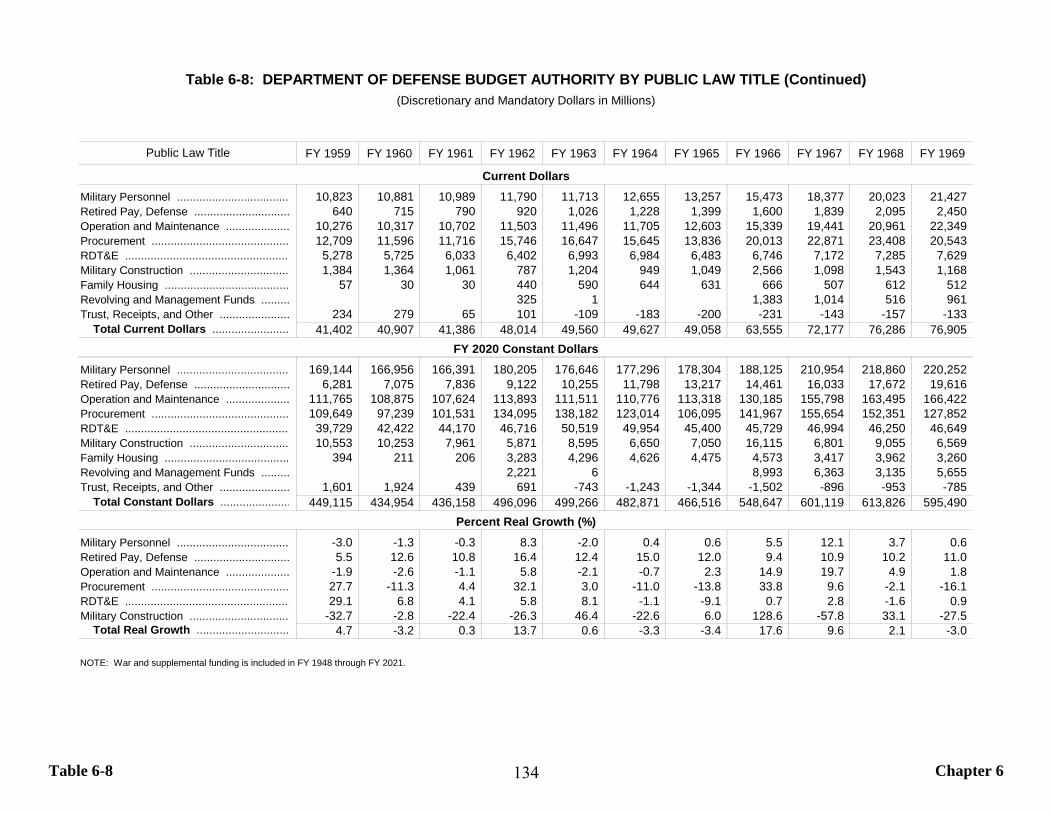
Table 6-8 Chapter 6
FY 1959 FY 1960 FY 1961 FY 1962 FY 1963 FY 1964 FY 1965 FY 1966 FY 1967 FY 1968 FY 1969
Military Personnel ................................... 10,823 10,881 10,989 11,790 11,713 12,655 13,257 15,473 18,377 20,023 21,427 Retired Pay, Defense .............................. 640 715 790 920 1,026 1,228 1,399 1,600 1,839 2,095 2,450 Operation and Maintenance .................... 10,276 10,317 10,702 11,503 11,496 11,705 12,603 15,339 19,441 20,961 22,349 Procurement ........................................... 12,709 11,596 11,716 15,746 16,647 15,645 13,836 20,013 22,871 23,408 20,543 RDT&E .................................................... 5,278 5,725 6,033 6,402 6,993 6,984 6,483 6,746 7,172 7,285 7,629 Military Construction ............................... 1,384 1,364 1,061 787 1,204 949 1,049 2,566 1,098 1,543 1,168 Family Housing ....................................... 57 30 30 440 590 644 631 666 507 612 512 Revolving and Management Funds ......... 325 1 1,383 1,014 516 961 Trust, Receipts, and Other ...................... 234 279 65 101 -109 -183 -200 -231 -143 -157 -133
Total Current Dollars ........................ 41,402 40,907 41,386 48,014 49,560 49,627 49,058 63,555 72,177 76,286 76,905
Military Personnel ................................... 169,144 166,956 166,391 180,205 176,646 177,296 178,304 188,125 210,954 218,860 220,252 Retired Pay, Defense .............................. 6,281 7,075 7,836 9,122 10,255 11,798 13,217 14,461 16,033 17,672 19,616 Operation and Maintenance .................... 111,765 108,875 107,624 113,893 111,511 110,776 113,318 130,185 155,798 163,495 166,422 Procurement ........................................... 109,649 97,239 101,531 134,095 138,182 123,014 106,095 141,967 155,654 152,351 127,852 RDT&E .................................................... 39,729 42,422 44,170 46,716 50,519 49,954 45,400 45,729 46,994 46,250 46,649 Military Construction ............................... 10,553 10,253 7,961 5,871 8,595 6,650 7,050 16,115 6,801 9,055 6,569 Family Housing ....................................... 394 211 206 3,283 4,296 4,626 4,475 4,573 3,417 3,962 3,260 Revolving and Management Funds ......... 2,221 6 8,993 6,363 3,135 5,655 Trust, Receipts, and Other ...................... 1,601 1,924 439 691 -743 -1,243 -1,344 -1,502 -896 -953 -785
Total Constant Dollars ...................... 449,115 434,954 436,158 496,096 499,266 482,871 466,516 548,647 601,119 613,826 595,490
Military Personnel ................................... -3.0 -1.3 -0.3 8.3 -2.0 0.4 0.6 5.5 12.1 3.7 0.6 Retired Pay, Defense .............................. 5.5 12.6 10.8 16.4 12.4 15.0 12.0 9.4 10.9 10.2 11.0 Operation and Maintenance .................... -1.9 -2.6 -1.1 5.8 -2.1 -0.7 2.3 14.9 19.7 4.9 1.8 Procurement ........................................... 27.7 -11.3 4.4 32.1 3.0 -11.0 -13.8 33.8 9.6 -2.1 -16.1 RDT&E .................................................... 29.1 6.8 4.1 5.8 8.1 -1.1 -9.1 0.7 2.8 -1.6 0.9 Military Construction ............................... -32.7 -2.8 -22.4 -26.3 46.4 -22.6 6.0 128.6 -57.8 33.1 -27.5
Total Real Growth ............................. 4.7 -3.2 0.3 13.7 0.6 -3.3 -3.4 17.6 9.6 2.1 -3.0
NOTE: War and supplemental funding is included in FY 1948 through FY 2021.
Percent Real Growth (%)
Table 6-8: DEPARTMENT OF DEFENSE BUDGET AUTHORITY BY PUBLIC LAW TITLE (Continued)(Discretionary and Mandatory Dollars in Millions)
Public Law Title
Current Dollars
FY 2020 Constant Dollars
134
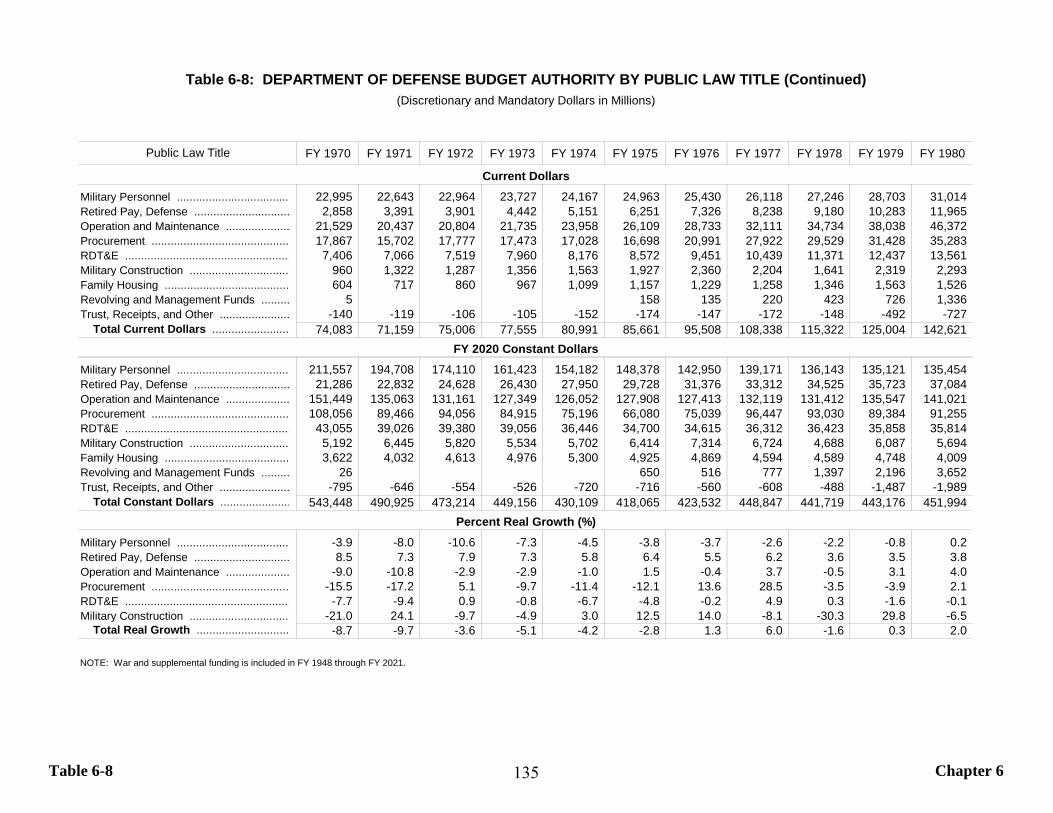
Table 6-8 Chapter 6
FY 1970 FY 1971 FY 1972 FY 1973 FY 1974 FY 1975 FY 1976 FY 1977 FY 1978 FY 1979 FY 1980
Military Personnel ................................... 22,995 22,643 22,964 23,727 24,167 24,963 25,430 26,118 27,246 28,703 31,014 Retired Pay, Defense .............................. 2,858 3,391 3,901 4,442 5,151 6,251 7,326 8,238 9,180 10,283 11,965 Operation and Maintenance .................... 21,529 20,437 20,804 21,735 23,958 26,109 28,733 32,111 34,734 38,038 46,372 Procurement ........................................... 17,867 15,702 17,777 17,473 17,028 16,698 20,991 27,922 29,529 31,428 35,283 RDT&E .................................................... 7,406 7,066 7,519 7,960 8,176 8,572 9,451 10,439 11,371 12,437 13,561 Military Construction ............................... 960 1,322 1,287 1,356 1,563 1,927 2,360 2,204 1,641 2,319 2,293 Family Housing ....................................... 604 717 860 967 1,099 1,157 1,229 1,258 1,346 1,563 1,526 Revolving and Management Funds ......... 5 158 135 220 423 726 1,336 Trust, Receipts, and Other ...................... -140 -119 -106 -105 -152 -174 -147 -172 -148 -492 -727
Total Current Dollars ........................ 74,083 71,159 75,006 77,555 80,991 85,661 95,508 108,338 115,322 125,004 142,621
Military Personnel ................................... 211,557 194,708 174,110 161,423 154,182 148,378 142,950 139,171 136,143 135,121 135,454 Retired Pay, Defense .............................. 21,286 22,832 24,628 26,430 27,950 29,728 31,376 33,312 34,525 35,723 37,084 Operation and Maintenance .................... 151,449 135,063 131,161 127,349 126,052 127,908 127,413 132,119 131,412 135,547 141,021 Procurement ........................................... 108,056 89,466 94,056 84,915 75,196 66,080 75,039 96,447 93,030 89,384 91,255 RDT&E .................................................... 43,055 39,026 39,380 39,056 36,446 34,700 34,615 36,312 36,423 35,858 35,814 Military Construction ............................... 5,192 6,445 5,820 5,534 5,702 6,414 7,314 6,724 4,688 6,087 5,694 Family Housing ....................................... 3,622 4,032 4,613 4,976 5,300 4,925 4,869 4,594 4,589 4,748 4,009 Revolving and Management Funds ......... 26 650 516 777 1,397 2,196 3,652 Trust, Receipts, and Other ...................... -795 -646 -554 -526 -720 -716 -560 -608 -488 -1,487 -1,989
Total Constant Dollars ...................... 543,448 490,925 473,214 449,156 430,109 418,065 423,532 448,847 441,719 443,176 451,994
Military Personnel ................................... -3.9 -8.0 -10.6 -7.3 -4.5 -3.8 -3.7 -2.6 -2.2 -0.8 0.2 Retired Pay, Defense .............................. 8.5 7.3 7.9 7.3 5.8 6.4 5.5 6.2 3.6 3.5 3.8 Operation and Maintenance .................... -9.0 -10.8 -2.9 -2.9 -1.0 1.5 -0.4 3.7 -0.5 3.1 4.0 Procurement ........................................... -15.5 -17.2 5.1 -9.7 -11.4 -12.1 13.6 28.5 -3.5 -3.9 2.1 RDT&E .................................................... -7.7 -9.4 0.9 -0.8 -6.7 -4.8 -0.2 4.9 0.3 -1.6 -0.1 Military Construction ............................... -21.0 24.1 -9.7 -4.9 3.0 12.5 14.0 -8.1 -30.3 29.8 -6.5
Total Real Growth ............................. -8.7 -9.7 -3.6 -5.1 -4.2 -2.8 1.3 6.0 -1.6 0.3 2.0
NOTE: War and supplemental funding is included in FY 1948 through FY 2021.
Percent Real Growth (%)
Table 6-8: DEPARTMENT OF DEFENSE BUDGET AUTHORITY BY PUBLIC LAW TITLE (Continued)(Discretionary and Mandatory Dollars in Millions)
Public Law Title
Current Dollars
FY 2020 Constant Dollars
135
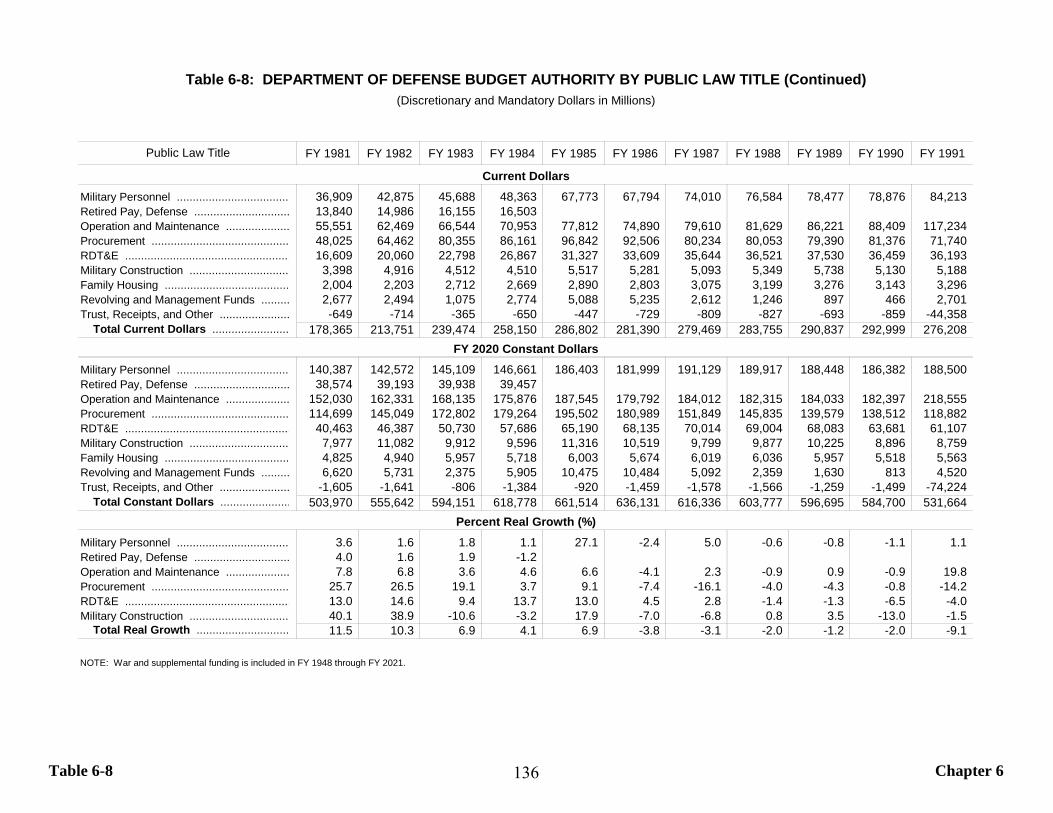
Table 6-8 Chapter 6
FY 1981 FY 1982 FY 1983 FY 1984 FY 1985 FY 1986 FY 1987 FY 1988 FY 1989 FY 1990 FY 1991
Military Personnel ................................... 36,909 42,875 45,688 48,363 67,773 67,794 74,010 76,584 78,477 78,876 84,213 Retired Pay, Defense .............................. 13,840 14,986 16,155 16,503 Operation and Maintenance .................... 55,551 62,469 66,544 70,953 77,812 74,890 79,610 81,629 86,221 88,409 117,234 Procurement ........................................... 48,025 64,462 80,355 86,161 96,842 92,506 80,234 80,053 79,390 81,376 71,740 RDT&E .................................................... 16,609 20,060 22,798 26,867 31,327 33,609 35,644 36,521 37,530 36,459 36,193 Military Construction ............................... 3,398 4,916 4,512 4,510 5,517 5,281 5,093 5,349 5,738 5,130 5,188 Family Housing ....................................... 2,004 2,203 2,712 2,669 2,890 2,803 3,075 3,199 3,276 3,143 3,296 Revolving and Management Funds ......... 2,677 2,494 1,075 2,774 5,088 5,235 2,612 1,246 897 466 2,701 Trust, Receipts, and Other ...................... -649 -714 -365 -650 -447 -729 -809 -827 -693 -859 -44,358
Total Current Dollars ........................ 178,365 213,751 239,474 258,150 286,802 281,390 279,469 283,755 290,837 292,999 276,208
Military Personnel ................................... 140,387 142,572 145,109 146,661 186,403 181,999 191,129 189,917 188,448 186,382 188,500 Retired Pay, Defense .............................. 38,574 39,193 39,938 39,457 Operation and Maintenance .................... 152,030 162,331 168,135 175,876 187,545 179,792 184,012 182,315 184,033 182,397 218,555 Procurement ........................................... 114,699 145,049 172,802 179,264 195,502 180,989 151,849 145,835 139,579 138,512 118,882 RDT&E .................................................... 40,463 46,387 50,730 57,686 65,190 68,135 70,014 69,004 68,083 63,681 61,107 Military Construction ............................... 7,977 11,082 9,912 9,596 11,316 10,519 9,799 9,877 10,225 8,896 8,759 Family Housing ....................................... 4,825 4,940 5,957 5,718 6,003 5,674 6,019 6,036 5,957 5,518 5,563 Revolving and Management Funds ......... 6,620 5,731 2,375 5,905 10,475 10,484 5,092 2,359 1,630 813 4,520 Trust, Receipts, and Other ...................... -1,605 -1,641 -806 -1,384 -920 -1,459 -1,578 -1,566 -1,259 -1,499 -74,224
Total Constant Dollars ...................... 503,970 555,642 594,151 618,778 661,514 636,131 616,336 603,777 596,695 584,700 531,664
Military Personnel ................................... 3.6 1.6 1.8 1.1 27.1 -2.4 5.0 -0.6 -0.8 -1.1 1.1 Retired Pay, Defense .............................. 4.0 1.6 1.9 -1.2 Operation and Maintenance .................... 7.8 6.8 3.6 4.6 6.6 -4.1 2.3 -0.9 0.9 -0.9 19.8 Procurement ........................................... 25.7 26.5 19.1 3.7 9.1 -7.4 -16.1 -4.0 -4.3 -0.8 -14.2 RDT&E .................................................... 13.0 14.6 9.4 13.7 13.0 4.5 2.8 -1.4 -1.3 -6.5 -4.0 Military Construction ............................... 40.1 38.9 -10.6 -3.2 17.9 -7.0 -6.8 0.8 3.5 -13.0 -1.5
Total Real Growth ............................. 11.5 10.3 6.9 4.1 6.9 -3.8 -3.1 -2.0 -1.2 -2.0 -9.1
NOTE: War and supplemental funding is included in FY 1948 through FY 2021.
Percent Real Growth (%)
Table 6-8: DEPARTMENT OF DEFENSE BUDGET AUTHORITY BY PUBLIC LAW TITLE (Continued)(Discretionary and Mandatory Dollars in Millions)
Public Law Title
Current Dollars
FY 2020 Constant Dollars
136
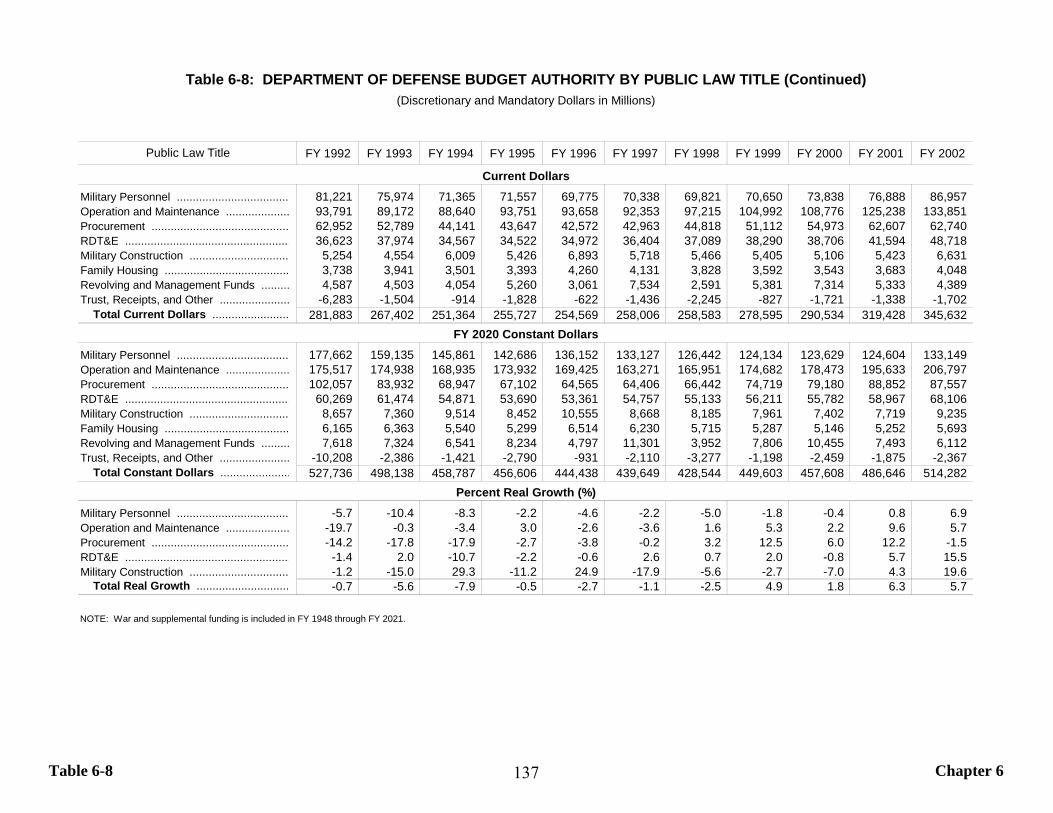
Table 6-8 Chapter 6
FY 1992 FY 1993 FY 1994 FY 1995 FY 1996 FY 1997 FY 1998 FY 1999 FY 2000 FY 2001 FY 2002
Military Personnel ................................... 81,221 75,974 71,365 71,557 69,775 70,338 69,821 70,650 73,838 76,888 86,957 Operation and Maintenance .................... 93,791 89,172 88,640 93,751 93,658 92,353 97,215 104,992 108,776 125,238 133,851 Procurement ........................................... 62,952 52,789 44,141 43,647 42,572 42,963 44,818 51,112 54,973 62,607 62,740 RDT&E .................................................... 36,623 37,974 34,567 34,522 34,972 36,404 37,089 38,290 38,706 41,594 48,718 Military Construction ............................... 5,254 4,554 6,009 5,426 6,893 5,718 5,466 5,405 5,106 5,423 6,631 Family Housing ....................................... 3,738 3,941 3,501 3,393 4,260 4,131 3,828 3,592 3,543 3,683 4,048 Revolving and Management Funds ......... 4,587 4,503 4,054 5,260 3,061 7,534 2,591 5,381 7,314 5,333 4,389 Trust, Receipts, and Other ...................... -6,283 -1,504 -914 -1,828 -622 -1,436 -2,245 -827 -1,721 -1,338 -1,702
Total Current Dollars ........................ 281,883 267,402 251,364 255,727 254,569 258,006 258,583 278,595 290,534 319,428 345,632
Military Personnel ................................... 177,662 159,135 145,861 142,686 136,152 133,127 126,442 124,134 123,629 124,604 133,149 Operation and Maintenance .................... 175,517 174,938 168,935 173,932 169,425 163,271 165,951 174,682 178,473 195,633 206,797 Procurement ........................................... 102,057 83,932 68,947 67,102 64,565 64,406 66,442 74,719 79,180 88,852 87,557 RDT&E .................................................... 60,269 61,474 54,871 53,690 53,361 54,757 55,133 56,211 55,782 58,967 68,106 Military Construction ............................... 8,657 7,360 9,514 8,452 10,555 8,668 8,185 7,961 7,402 7,719 9,235 Family Housing ....................................... 6,165 6,363 5,540 5,299 6,514 6,230 5,715 5,287 5,146 5,252 5,693 Revolving and Management Funds ......... 7,618 7,324 6,541 8,234 4,797 11,301 3,952 7,806 10,455 7,493 6,112 Trust, Receipts, and Other ...................... -10,208 -2,386 -1,421 -2,790 -931 -2,110 -3,277 -1,198 -2,459 -1,875 -2,367
Total Constant Dollars ...................... 527,736 498,138 458,787 456,606 444,438 439,649 428,544 449,603 457,608 486,646 514,282
Military Personnel ................................... -5.7 -10.4 -8.3 -2.2 -4.6 -2.2 -5.0 -1.8 -0.4 0.8 6.9 Operation and Maintenance .................... -19.7 -0.3 -3.4 3.0 -2.6 -3.6 1.6 5.3 2.2 9.6 5.7 Procurement ........................................... -14.2 -17.8 -17.9 -2.7 -3.8 -0.2 3.2 12.5 6.0 12.2 -1.5 RDT&E .................................................... -1.4 2.0 -10.7 -2.2 -0.6 2.6 0.7 2.0 -0.8 5.7 15.5 Military Construction ............................... -1.2 -15.0 29.3 -11.2 24.9 -17.9 -5.6 -2.7 -7.0 4.3 19.6
Total Real Growth ............................. -0.7 -5.6 -7.9 -0.5 -2.7 -1.1 -2.5 4.9 1.8 6.3 5.7
NOTE: War and supplemental funding is included in FY 1948 through FY 2021.
Percent Real Growth (%)
Table 6-8: DEPARTMENT OF DEFENSE BUDGET AUTHORITY BY PUBLIC LAW TITLE (Continued)(Discretionary and Mandatory Dollars in Millions)
Public Law Title
Current Dollars
FY 2020 Constant Dollars
137

Table 6-8 Chapter 6
FY 2003 FY 2004 FY 2005 FY 2006 FY 2007 FY 2008 FY 2009 FY 2010 FY 2011 FY 2012 FY 2013
Military Personnel ................................... 109,062 116,111 121,279 128,483 131,756 139,033 149,290 157,100 158,389 158,352 153,531 Operation and Maintenance .................... 178,316 189,763 179,215 213,532 240,252 256,223 271,564 293,630 305,235 286,775 258,353 Procurement ........................................... 78,490 83,073 96,614 105,371 133,772 165,006 135,438 135,817 131,898 118,316 97,763 RDT&E .................................................... 58,103 64,641 68,825 72,855 77,549 79,567 80,005 80,234 76,687 72,034 63,347 Military Construction ............................... 6,670 6,137 7,260 9,530 13,961 22,064 26,815 22,577 15,991 11,367 8,068 Family Housing ....................................... 4,183 3,829 4,098 4,426 4,024 2,846 3,848 2,267 1,833 1,690 1,489 Revolving and Management Funds ......... 4,154 7,977 7,880 4,754 2,836 10,296 -1,217 5,639 2,832 7,311 4,482 Trust, Receipts, and Other ...................... -1,178 -521 -1,259 -2,489 -1,905 -1,549 -1,219 -1,590 -2,086 -456 -1,672
Total Current Dollars ........................ 437,801 471,011 483,913 536,462 602,246 673,487 664,524 695,673 690,781 655,388 585,361
Military Personnel ................................... 161,968 167,405 169,327 173,417 173,209 176,959 183,951 188,312 186,994 183,662 174,886 Operation and Maintenance .................... 263,010 269,818 241,639 277,156 303,607 312,429 328,574 345,821 351,575 324,845 287,465 Procurement ........................................... 107,233 110,661 125,386 133,584 166,275 201,970 163,439 161,343 154,128 136,185 110,956 RDT&E .................................................... 79,771 86,570 89,534 92,141 95,814 96,213 95,400 94,371 88,482 81,820 71,045 Military Construction ............................... 9,065 8,119 9,377 12,052 17,368 27,034 32,310 26,899 18,700 13,096 9,161 Family Housing ....................................... 5,783 5,163 5,327 5,618 5,015 3,467 4,622 2,680 2,123 1,926 1,668 Revolving and Management Funds ......... 5,710 10,740 10,316 6,044 3,519 12,492 -1,435 6,707 3,299 8,336 5,044 Trust, Receipts, and Other ...................... -1,621 -703 -1,653 -3,169 -2,362 -1,876 -1,453 -1,882 -2,420 -520 -1,877
Total Constant Dollars ...................... 630,918 657,772 649,253 696,842 762,446 828,687 805,409 824,252 802,880 749,349 658,347
Military Personnel ................................... 21.6 3.4 1.1 2.4 -0.1 2.2 4.0 2.4 -0.7 -1.8 -4.8 Operation and Maintenance .................... 27.2 2.6 -10.4 14.7 9.5 2.9 5.2 5.2 1.7 -7.6 -11.5 Procurement ........................................... 22.5 3.2 13.3 6.5 24.5 21.5 -19.1 -1.3 -4.5 -11.6 -18.5 RDT&E .................................................... 17.1 8.5 3.4 2.9 4.0 0.4 -0.8 -1.1 -6.2 -7.5 -13.2 Military Construction ............................... -1.8 -10.4 15.5 28.5 44.1 55.7 19.5 -16.7 -30.5 -30.0 -30.0
Total Real Growth ............................. 22.7 4.3 -1.3 7.3 9.4 8.7 -2.8 2.3 -2.6 -6.7 -12.1
NOTE: War and supplemental funding is included in FY 1948 through FY 2021.
Percent Real Growth (%)
Table 6-8: DEPARTMENT OF DEFENSE BUDGET AUTHORITY BY PUBLIC LAW TITLE (Continued)(Discretionary and Mandatory Dollars in Millions)
Public Law Title
Current Dollars
FY 2020 Constant Dollars
138
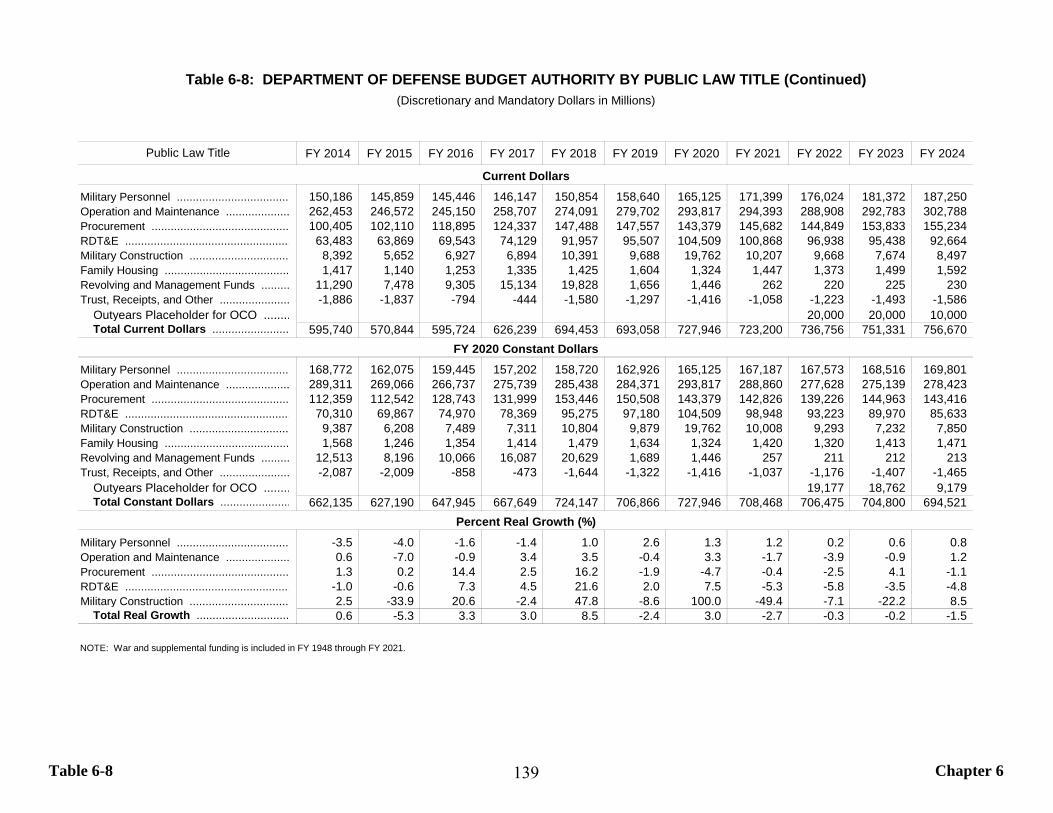
Table 6-8 Chapter 6
FY 2014 FY 2015 FY 2016 FY 2017 FY 2018 FY 2019 FY 2020 FY 2021 FY 2022 FY 2023 FY 2024
Military Personnel ................................... 150,186 145,859 145,446 146,147 150,854 158,640 165,125 171,399 176,024 181,372 187,250 Operation and Maintenance .................... 262,453 246,572 245,150 258,707 274,091 279,702 293,817 294,393 288,908 292,783 302,788 Procurement ........................................... 100,405 102,110 118,895 124,337 147,488 147,557 143,379 145,682 144,849 153,833 155,234 RDT&E .................................................... 63,483 63,869 69,543 74,129 91,957 95,507 104,509 100,868 96,938 95,438 92,664 Military Construction ............................... 8,392 5,652 6,927 6,894 10,391 9,688 19,762 10,207 9,668 7,674 8,497 Family Housing ....................................... 1,417 1,140 1,253 1,335 1,425 1,604 1,324 1,447 1,373 1,499 1,592 Revolving and Management Funds ......... 11,290 7,478 9,305 15,134 19,828 1,656 1,446 262 220 225 230 Trust, Receipts, and Other ...................... -1,886 -1,837 -794 -444 -1,580 -1,297 -1,416 -1,058 -1,223 -1,493 -1,586
Outyears Placeholder for OCO ........ 20,000 20,000 10,000 Total Current Dollars ........................ 595,740 570,844 595,724 626,239 694,453 693,058 727,946 723,200 736,756 751,331 756,670
Military Personnel ................................... 168,772 162,075 159,445 157,202 158,720 162,926 165,125 167,187 167,573 168,516 169,801 Operation and Maintenance .................... 289,311 269,066 266,737 275,739 285,438 284,371 293,817 288,860 277,628 275,139 278,423 Procurement ........................................... 112,359 112,542 128,743 131,999 153,446 150,508 143,379 142,826 139,226 144,963 143,416 RDT&E .................................................... 70,310 69,867 74,970 78,369 95,275 97,180 104,509 98,948 93,223 89,970 85,633 Military Construction ............................... 9,387 6,208 7,489 7,311 10,804 9,879 19,762 10,008 9,293 7,232 7,850 Family Housing ....................................... 1,568 1,246 1,354 1,414 1,479 1,634 1,324 1,420 1,320 1,413 1,471 Revolving and Management Funds ......... 12,513 8,196 10,066 16,087 20,629 1,689 1,446 257 211 212 213 Trust, Receipts, and Other ...................... -2,087 -2,009 -858 -473 -1,644 -1,322 -1,416 -1,037 -1,176 -1,407 -1,465
Outyears Placeholder for OCO ........ 19,177 18,762 9,179 Total Constant Dollars ...................... 662,135 627,190 647,945 667,649 724,147 706,866 727,946 708,468 706,475 704,800 694,521
Military Personnel ................................... -3.5 -4.0 -1.6 -1.4 1.0 2.6 1.3 1.2 0.2 0.6 0.8 Operation and Maintenance .................... 0.6 -7.0 -0.9 3.4 3.5 -0.4 3.3 -1.7 -3.9 -0.9 1.2 Procurement ........................................... 1.3 0.2 14.4 2.5 16.2 -1.9 -4.7 -0.4 -2.5 4.1 -1.1 RDT&E .................................................... -1.0 -0.6 7.3 4.5 21.6 2.0 7.5 -5.3 -5.8 -3.5 -4.8 Military Construction ............................... 2.5 -33.9 20.6 -2.4 47.8 -8.6 100.0 -49.4 -7.1 -22.2 8.5
Total Real Growth ............................. 0.6 -5.3 3.3 3.0 8.5 -2.4 3.0 -2.7 -0.3 -0.2 -1.5
NOTE: War and supplemental funding is included in FY 1948 through FY 2021.
Table 6-8: DEPARTMENT OF DEFENSE BUDGET AUTHORITY BY PUBLIC LAW TITLE (Continued)
Percent Real Growth (%)
(Discretionary and Mandatory Dollars in Millions)
Public Law Title
Current Dollars
FY 2020 Constant Dollars
139
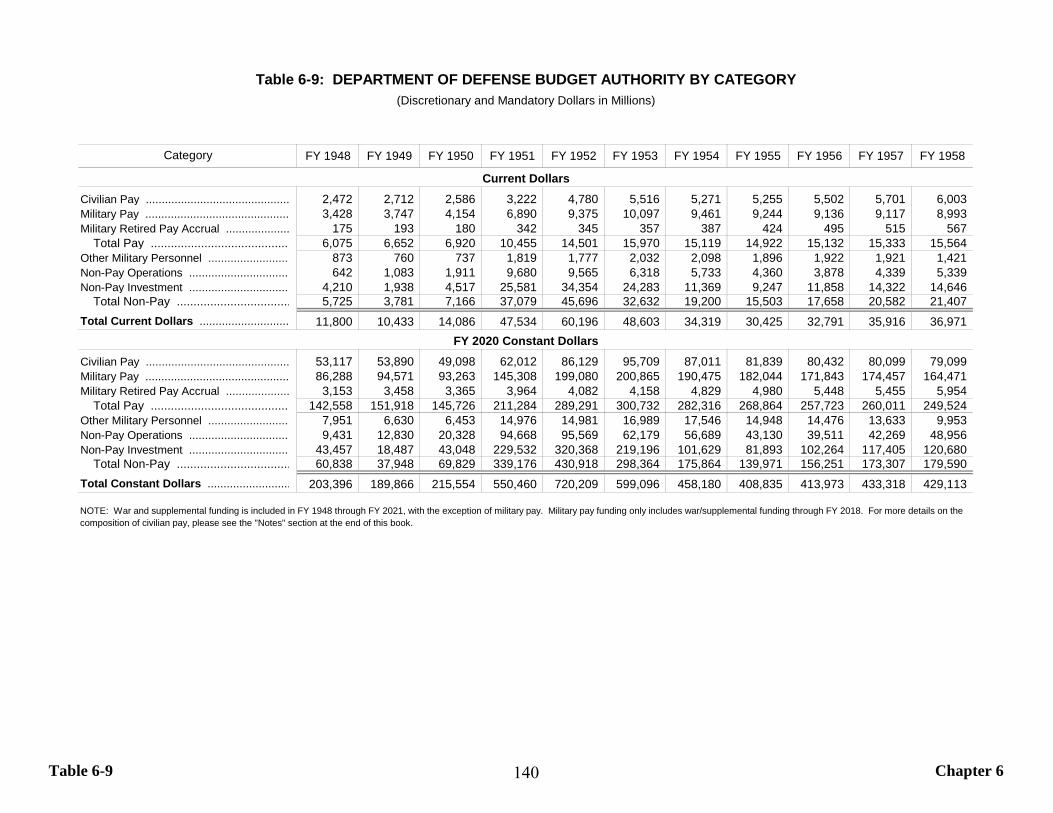
Table 6-9 Chapter 6
FY 1948 FY 1949 FY 1950 FY 1951 FY 1952 FY 1953 FY 1954 FY 1955 FY 1956 FY 1957 FY 1958
Civilian Pay ............................................. 2,472 2,712 2,586 3,222 4,780 5,516 5,271 5,255 5,502 5,701 6,003 Military Pay ............................................. 3,428 3,747 4,154 6,890 9,375 10,097 9,461 9,244 9,136 9,117 8,993 Military Retired Pay Accrual .................... 175 193 180 342 345 357 387 424 495 515 567
Total Pay .......................................... 6,075 6,652 6,920 10,455 14,501 15,970 15,119 14,922 15,132 15,333 15,564 Other Military Personnel .......................... 873 760 737 1,819 1,777 2,032 2,098 1,896 1,922 1,921 1,421 Non-Pay Operations ................................ 642 1,083 1,911 9,680 9,565 6,318 5,733 4,360 3,878 4,339 5,339 Non-Pay Investment ................................ 4,210 1,938 4,517 25,581 34,354 24,283 11,369 9,247 11,858 14,322 14,646
Total Non-Pay .................................. 5,725 3,781 7,166 37,079 45,696 32,632 19,200 15,503 17,658 20,582 21,407 Total Current Dollars ............................ 11,800 10,433 14,086 47,534 60,196 48,603 34,319 30,425 32,791 35,916 36,971
Civilian Pay ............................................. 53,117 53,890 49,098 62,012 86,129 95,709 87,011 81,839 80,432 80,099 79,099 Military Pay ............................................. 86,288 94,571 93,263 145,308 199,080 200,865 190,475 182,044 171,843 174,457 164,471 Military Retired Pay Accrual .................... 3,153 3,458 3,365 3,964 4,082 4,158 4,829 4,980 5,448 5,455 5,954
Total Pay .......................................... 142,558 151,918 145,726 211,284 289,291 300,732 282,316 268,864 257,723 260,011 249,524 Other Military Personnel .......................... 7,951 6,630 6,453 14,976 14,981 16,989 17,546 14,948 14,476 13,633 9,953 Non-Pay Operations ................................ 9,431 12,830 20,328 94,668 95,569 62,179 56,689 43,130 39,511 42,269 48,956 Non-Pay Investment ................................ 43,457 18,487 43,048 229,532 320,368 219,196 101,629 81,893 102,264 117,405 120,680
Total Non-Pay .................................. 60,838 37,948 69,829 339,176 430,918 298,364 175,864 139,971 156,251 173,307 179,590 Total Constant Dollars .......................... 203,396 189,866 215,554 550,460 720,209 599,096 458,180 408,835 413,973 433,318 429,113
NOTE: War and supplemental funding is included in FY 1948 through FY 2021, with the exception of military pay. Military pay funding only includes war/supplemental funding through FY 2018. For more details on the composition of civilian pay, please see the "Notes" section at the end of this book.
Table 6-9: DEPARTMENT OF DEFENSE BUDGET AUTHORITY BY CATEGORY(Discretionary and Mandatory Dollars in Millions)
Category
Current Dollars
FY 2020 Constant Dollars
140

Table 6-9 Chapter 6
FY 1959 FY 1960 FY 1961 FY 1962 FY 1963 FY 1964 FY 1965 FY 1966 FY 1967 FY 1968 FY 1969
Civilian Pay ............................................. 6,327 6,240 6,616 7,034 7,295 7,502 7,833 8,500 9,654 10,578 11,301 Military Pay ............................................. 9,269 9,168 9,181 9,917 9,762 10,615 11,019 12,178 14,111 15,264 16,699 Military Retired Pay Accrual .................... 640 715 790 920 1,026 1,228 1,399 1,600 1,839 2,095 2,450
Total Pay .......................................... 16,237 16,124 16,586 17,872 18,083 19,344 20,251 22,278 25,604 27,938 30,450 Other Military Personnel .......................... 1,554 1,713 1,808 1,873 1,951 2,040 2,237 3,295 4,267 4,759 4,728 Non-Pay Operations ................................ 5,258 5,414 5,445 6,638 6,087 6,027 6,624 10,181 12,938 13,228 14,673 Non-Pay Investment ................................ 18,353 17,656 17,545 21,632 23,440 22,215 19,946 27,801 29,369 30,362 27,054
Total Non-Pay .................................. 25,165 24,783 24,799 30,142 31,478 30,283 28,807 41,277 46,574 48,349 46,455 Total Current Dollars ............................ 41,402 40,907 41,386 48,014 49,560 49,627 49,058 63,555 72,177 76,286 76,905
Civilian Pay ............................................. 78,461 75,254 74,113 76,974 76,961 75,928 74,821 78,398 85,711 90,831 91,254 Military Pay ............................................. 158,448 155,133 154,078 167,343 163,292 163,413 163,323 166,785 184,266 190,066 192,575 Military Retired Pay Accrual .................... 6,281 7,075 7,836 9,122 10,255 11,798 13,217 14,461 16,033 17,672 19,616
Total Pay .......................................... 243,190 237,461 236,027 253,439 250,507 251,139 251,360 259,644 286,010 298,569 303,444 Other Military Personnel .......................... 10,695 11,823 12,313 12,861 13,354 13,883 14,982 21,341 26,688 28,794 27,677 Non-Pay Operations ................................ 47,919 48,164 48,327 57,380 52,919 52,034 55,216 77,907 94,709 94,903 101,757 Non-Pay Investment ................................ 147,311 137,505 139,492 172,416 182,486 165,815 144,959 189,756 193,712 191,560 162,612
Total Non-Pay .................................. 205,925 197,493 200,132 242,657 248,759 231,732 215,156 289,003 315,110 315,256 292,046 Total Constant Dollars .......................... 449,115 434,954 436,158 496,096 499,266 482,871 466,516 548,647 601,119 613,826 595,490
NOTE: War and supplemental funding is included in FY 1948 through FY 2021, with the exception of military pay. Military pay funding only includes war/supplemental funding through FY 2018. For more details on the composition of civilian pay, please see the "Notes" section at the end of this book.
Table 6-9: DEPARTMENT OF DEFENSE BUDGET AUTHORITY BY CATEGORY (Continued)(Discretionary and Mandatory Dollars in Millions)
Category
Current Dollars
FY 2020 Constant Dollars
141
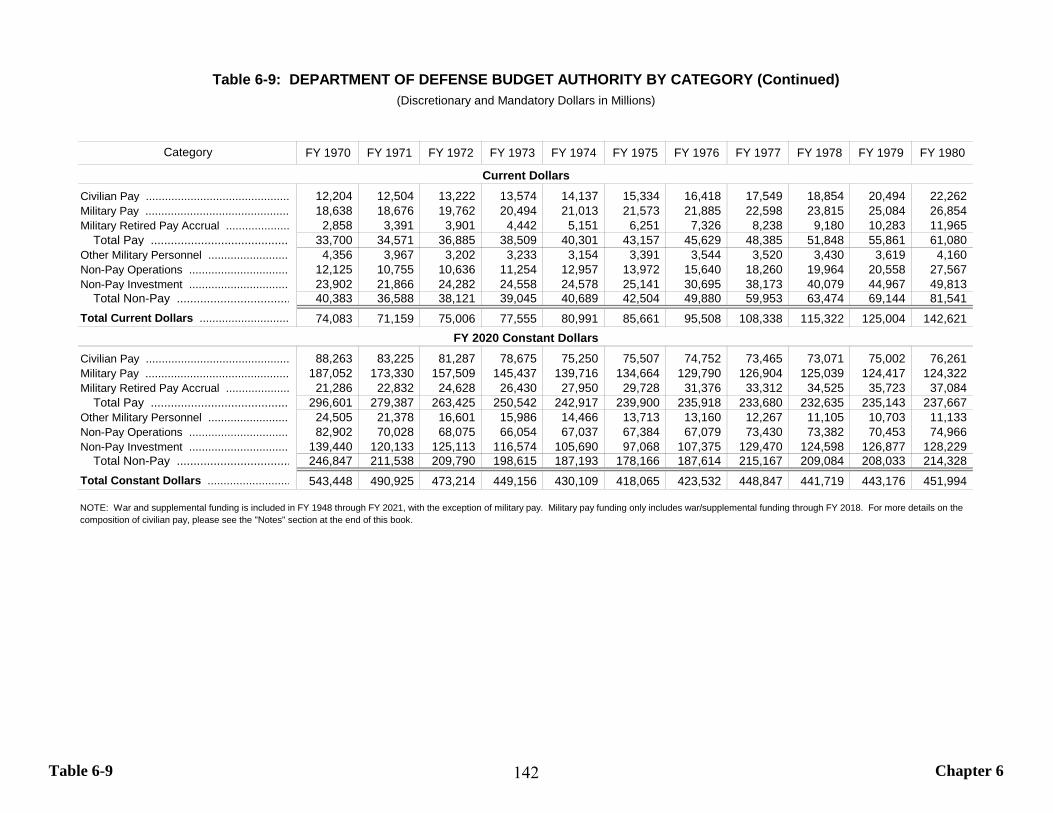
Table 6-9 Chapter 6
FY 1970 FY 1971 FY 1972 FY 1973 FY 1974 FY 1975 FY 1976 FY 1977 FY 1978 FY 1979 FY 1980
Civilian Pay ............................................. 12,204 12,504 13,222 13,574 14,137 15,334 16,418 17,549 18,854 20,494 22,262 Military Pay ............................................. 18,638 18,676 19,762 20,494 21,013 21,573 21,885 22,598 23,815 25,084 26,854 Military Retired Pay Accrual .................... 2,858 3,391 3,901 4,442 5,151 6,251 7,326 8,238 9,180 10,283 11,965
Total Pay .......................................... 33,700 34,571 36,885 38,509 40,301 43,157 45,629 48,385 51,848 55,861 61,080 Other Military Personnel .......................... 4,356 3,967 3,202 3,233 3,154 3,391 3,544 3,520 3,430 3,619 4,160 Non-Pay Operations ................................ 12,125 10,755 10,636 11,254 12,957 13,972 15,640 18,260 19,964 20,558 27,567 Non-Pay Investment ................................ 23,902 21,866 24,282 24,558 24,578 25,141 30,695 38,173 40,079 44,967 49,813
Total Non-Pay .................................. 40,383 36,588 38,121 39,045 40,689 42,504 49,880 59,953 63,474 69,144 81,541 Total Current Dollars ............................ 74,083 71,159 75,006 77,555 80,991 85,661 95,508 108,338 115,322 125,004 142,621
Civilian Pay ............................................. 88,263 83,225 81,287 78,675 75,250 75,507 74,752 73,465 73,071 75,002 76,261 Military Pay ............................................. 187,052 173,330 157,509 145,437 139,716 134,664 129,790 126,904 125,039 124,417 124,322 Military Retired Pay Accrual .................... 21,286 22,832 24,628 26,430 27,950 29,728 31,376 33,312 34,525 35,723 37,084
Total Pay .......................................... 296,601 279,387 263,425 250,542 242,917 239,900 235,918 233,680 232,635 235,143 237,667 Other Military Personnel .......................... 24,505 21,378 16,601 15,986 14,466 13,713 13,160 12,267 11,105 10,703 11,133 Non-Pay Operations ................................ 82,902 70,028 68,075 66,054 67,037 67,384 67,079 73,430 73,382 70,453 74,966 Non-Pay Investment ................................ 139,440 120,133 125,113 116,574 105,690 97,068 107,375 129,470 124,598 126,877 128,229
Total Non-Pay .................................. 246,847 211,538 209,790 198,615 187,193 178,166 187,614 215,167 209,084 208,033 214,328 Total Constant Dollars .......................... 543,448 490,925 473,214 449,156 430,109 418,065 423,532 448,847 441,719 443,176 451,994
NOTE: War and supplemental funding is included in FY 1948 through FY 2021, with the exception of military pay. Military pay funding only includes war/supplemental funding through FY 2018. For more details on the composition of civilian pay, please see the "Notes" section at the end of this book.
Table 6-9: DEPARTMENT OF DEFENSE BUDGET AUTHORITY BY CATEGORY (Continued)(Discretionary and Mandatory Dollars in Millions)
Category
Current Dollars
FY 2020 Constant Dollars
142
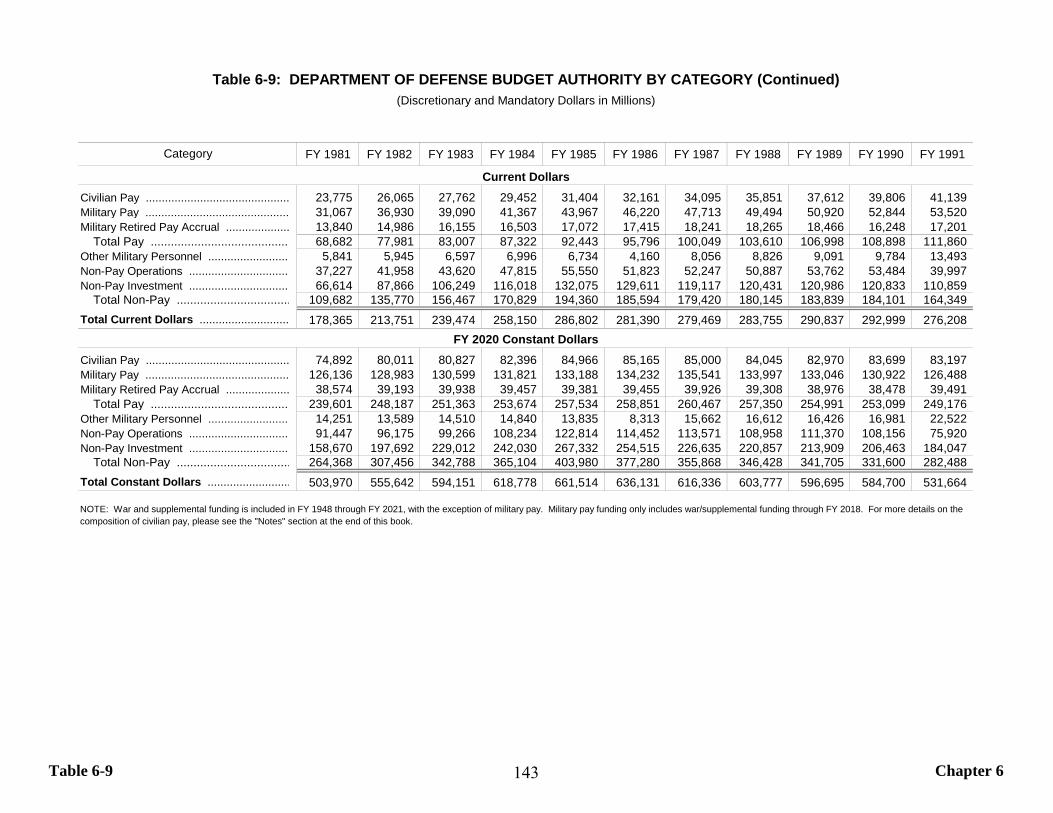
Table 6-9 Chapter 6
FY 1981 FY 1982 FY 1983 FY 1984 FY 1985 FY 1986 FY 1987 FY 1988 FY 1989 FY 1990 FY 1991
Civilian Pay ............................................. 23,775 26,065 27,762 29,452 31,404 32,161 34,095 35,851 37,612 39,806 41,139 Military Pay ............................................. 31,067 36,930 39,090 41,367 43,967 46,220 47,713 49,494 50,920 52,844 53,520 Military Retired Pay Accrual .................... 13,840 14,986 16,155 16,503 17,072 17,415 18,241 18,265 18,466 16,248 17,201
Total Pay .......................................... 68,682 77,981 83,007 87,322 92,443 95,796 100,049 103,610 106,998 108,898 111,860 Other Military Personnel .......................... 5,841 5,945 6,597 6,996 6,734 4,160 8,056 8,826 9,091 9,784 13,493 Non-Pay Operations ................................ 37,227 41,958 43,620 47,815 55,550 51,823 52,247 50,887 53,762 53,484 39,997 Non-Pay Investment ................................ 66,614 87,866 106,249 116,018 132,075 129,611 119,117 120,431 120,986 120,833 110,859
Total Non-Pay .................................. 109,682 135,770 156,467 170,829 194,360 185,594 179,420 180,145 183,839 184,101 164,349 Total Current Dollars ............................ 178,365 213,751 239,474 258,150 286,802 281,390 279,469 283,755 290,837 292,999 276,208
Civilian Pay ............................................. 74,892 80,011 80,827 82,396 84,966 85,165 85,000 84,045 82,970 83,699 83,197 Military Pay ............................................. 126,136 128,983 130,599 131,821 133,188 134,232 135,541 133,997 133,046 130,922 126,488 Military Retired Pay Accrual .................... 38,574 39,193 39,938 39,457 39,381 39,455 39,926 39,308 38,976 38,478 39,491
Total Pay .......................................... 239,601 248,187 251,363 253,674 257,534 258,851 260,467 257,350 254,991 253,099 249,176 Other Military Personnel .......................... 14,251 13,589 14,510 14,840 13,835 8,313 15,662 16,612 16,426 16,981 22,522 Non-Pay Operations ................................ 91,447 96,175 99,266 108,234 122,814 114,452 113,571 108,958 111,370 108,156 75,920 Non-Pay Investment ................................ 158,670 197,692 229,012 242,030 267,332 254,515 226,635 220,857 213,909 206,463 184,047
Total Non-Pay .................................. 264,368 307,456 342,788 365,104 403,980 377,280 355,868 346,428 341,705 331,600 282,488 Total Constant Dollars .......................... 503,970 555,642 594,151 618,778 661,514 636,131 616,336 603,777 596,695 584,700 531,664
NOTE: War and supplemental funding is included in FY 1948 through FY 2021, with the exception of military pay. Military pay funding only includes war/supplemental funding through FY 2018. For more details on the composition of civilian pay, please see the "Notes" section at the end of this book.
Table 6-9: DEPARTMENT OF DEFENSE BUDGET AUTHORITY BY CATEGORY (Continued)(Discretionary and Mandatory Dollars in Millions)
Category
Current Dollars
FY 2020 Constant Dollars
143

Table 6-9 Chapter 6
FY 1992 FY 1993 FY 1994 FY 1995 FY 1996 FY 1997 FY 1998 FY 1999 FY 2000 FY 2001 FY 2002
Civilian Pay ............................................. 41,779 44,168 43,580 43,559 43,031 42,740 41,255 41,226 41,932 43,241 45,864 Military Pay ............................................. 54,084 52,377 49,235 49,400 49,238 49,146 44,007 44,722 43,585 45,619 48,698 Military Retired Pay Accrual .................... 15,913 13,029 12,277 12,123 11,153 11,070 10,380 10,454 11,366 11,308 13,355
Total Pay .......................................... 111,776 109,574 105,093 105,082 103,422 102,957 95,642 96,403 96,883 100,168 107,916 Other Military Personnel .......................... 11,225 10,569 9,852 10,033 9,384 10,122 15,434 15,474 18,887 19,961 24,905 Non-Pay Operations ................................ 55,934 55,058 54,654 59,833 59,948 62,410 62,487 74,922 78,955 92,770 97,615 Non-Pay Investment ................................ 102,948 92,202 81,765 80,780 81,814 82,517 85,021 91,796 95,809 106,529 115,196
Total Non-Pay .................................. 170,107 157,829 146,271 150,645 151,146 155,049 162,942 182,192 193,651 219,260 237,716 Total Current Dollars ............................ 281,883 267,402 251,364 255,727 254,569 258,006 258,583 278,595 290,534 319,428 345,632
Civilian Pay ............................................. 81,108 82,587 79,473 77,520 74,787 72,117 67,715 65,317 63,392 63,039 63,921 Military Pay ............................................. 123,508 114,008 104,480 102,273 99,548 96,467 84,027 82,426 76,650 77,365 77,256 Military Retired Pay Accrual .................... 35,936 28,359 26,053 25,098 22,549 21,730 19,819 19,268 19,989 19,177 21,187
Total Pay .......................................... 240,551 224,954 210,005 204,891 196,883 190,315 171,562 167,011 160,031 159,581 162,364 Other Military Personnel .......................... 18,218 16,768 15,328 15,315 14,056 14,930 22,596 22,440 26,990 28,062 34,706 Non-Pay Operations ................................ 101,845 109,701 105,681 112,332 109,770 111,078 108,620 126,119 132,769 148,009 156,348 Non-Pay Investment ................................ 167,122 146,716 127,773 124,068 123,729 123,326 125,766 134,032 137,818 150,994 160,864
Total Non-Pay .................................. 287,185 273,184 248,782 251,715 247,555 249,335 256,982 282,592 297,577 327,065 351,918 Total Constant Dollars .......................... 527,736 498,138 458,787 456,606 444,438 439,649 428,544 449,603 457,608 486,646 514,282
NOTE: War and supplemental funding is included in FY 1948 through FY 2021, with the exception of military pay. Military pay funding only includes war/supplemental funding through FY 2018. For more details on the composition of civilian pay, please see the "Notes" section at the end of this book.
Table 6-9: DEPARTMENT OF DEFENSE BUDGET AUTHORITY BY CATEGORY (Continued)(Discretionary and Mandatory Dollars in Millions)
Category
Current Dollars
FY 2020 Constant Dollars
144
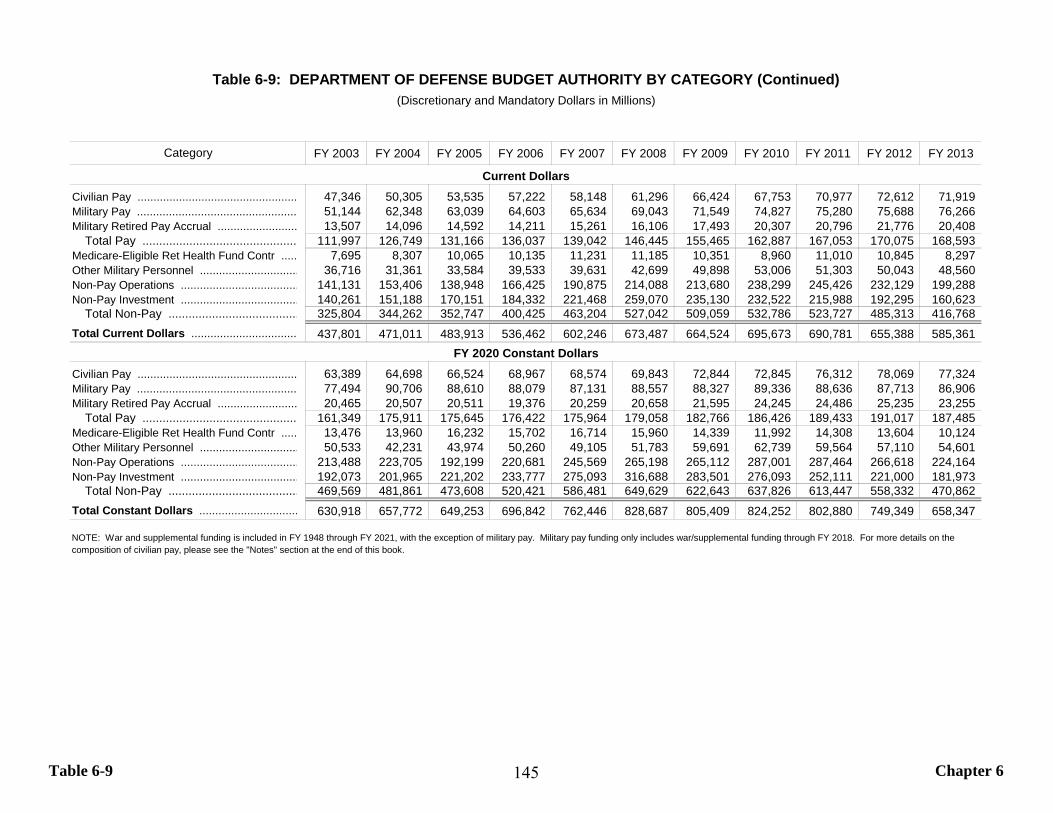
Table 6-9 Chapter 6
FY 2003 FY 2004 FY 2005 FY 2006 FY 2007 FY 2008 FY 2009 FY 2010 FY 2011 FY 2012 FY 2013
Civilian Pay .................................................. 47,346 50,305 53,535 57,222 58,148 61,296 66,424 67,753 70,977 72,612 71,919 Military Pay .................................................. 51,144 62,348 63,039 64,603 65,634 69,043 71,549 74,827 75,280 75,688 76,266 Military Retired Pay Accrual ......................... 13,507 14,096 14,592 14,211 15,261 16,106 17,493 20,307 20,796 21,776 20,408
Total Pay .............................................. 111,997 126,749 131,166 136,037 139,042 146,445 155,465 162,887 167,053 170,075 168,593 Medicare-Eligible Ret Health Fund Contr ..... 7,695 8,307 10,065 10,135 11,231 11,185 10,351 8,960 11,010 10,845 8,297 Other Military Personnel ............................... 36,716 31,361 33,584 39,533 39,631 42,699 49,898 53,006 51,303 50,043 48,560 Non-Pay Operations ..................................... 141,131 153,406 138,948 166,425 190,875 214,088 213,680 238,299 245,426 232,129 199,288 Non-Pay Investment ..................................... 140,261 151,188 170,151 184,332 221,468 259,070 235,130 232,522 215,988 192,295 160,623
Total Non-Pay ....................................... 325,804 344,262 352,747 400,425 463,204 527,042 509,059 532,786 523,727 485,313 416,768 Total Current Dollars ................................. 437,801 471,011 483,913 536,462 602,246 673,487 664,524 695,673 690,781 655,388 585,361
Civilian Pay .................................................. 63,389 64,698 66,524 68,967 68,574 69,843 72,844 72,845 76,312 78,069 77,324 Military Pay .................................................. 77,494 90,706 88,610 88,079 87,131 88,557 88,327 89,336 88,636 87,713 86,906 Military Retired Pay Accrual ......................... 20,465 20,507 20,511 19,376 20,259 20,658 21,595 24,245 24,486 25,235 23,255
Total Pay .............................................. 161,349 175,911 175,645 176,422 175,964 179,058 182,766 186,426 189,433 191,017 187,485 Medicare-Eligible Ret Health Fund Contr ..... 13,476 13,960 16,232 15,702 16,714 15,960 14,339 11,992 14,308 13,604 10,124 Other Military Personnel ............................... 50,533 42,231 43,974 50,260 49,105 51,783 59,691 62,739 59,564 57,110 54,601 Non-Pay Operations ..................................... 213,488 223,705 192,199 220,681 245,569 265,198 265,112 287,001 287,464 266,618 224,164 Non-Pay Investment ..................................... 192,073 201,965 221,202 233,777 275,093 316,688 283,501 276,093 252,111 221,000 181,973
Total Non-Pay ....................................... 469,569 481,861 473,608 520,421 586,481 649,629 622,643 637,826 613,447 558,332 470,862 Total Constant Dollars ............................... 630,918 657,772 649,253 696,842 762,446 828,687 805,409 824,252 802,880 749,349 658,347
NOTE: War and supplemental funding is included in FY 1948 through FY 2021, with the exception of military pay. Military pay funding only includes war/supplemental funding through FY 2018. For more details on the composition of civilian pay, please see the "Notes" section at the end of this book.
Table 6-9: DEPARTMENT OF DEFENSE BUDGET AUTHORITY BY CATEGORY (Continued)(Discretionary and Mandatory Dollars in Millions)
Category
Current Dollars
FY 2020 Constant Dollars
145
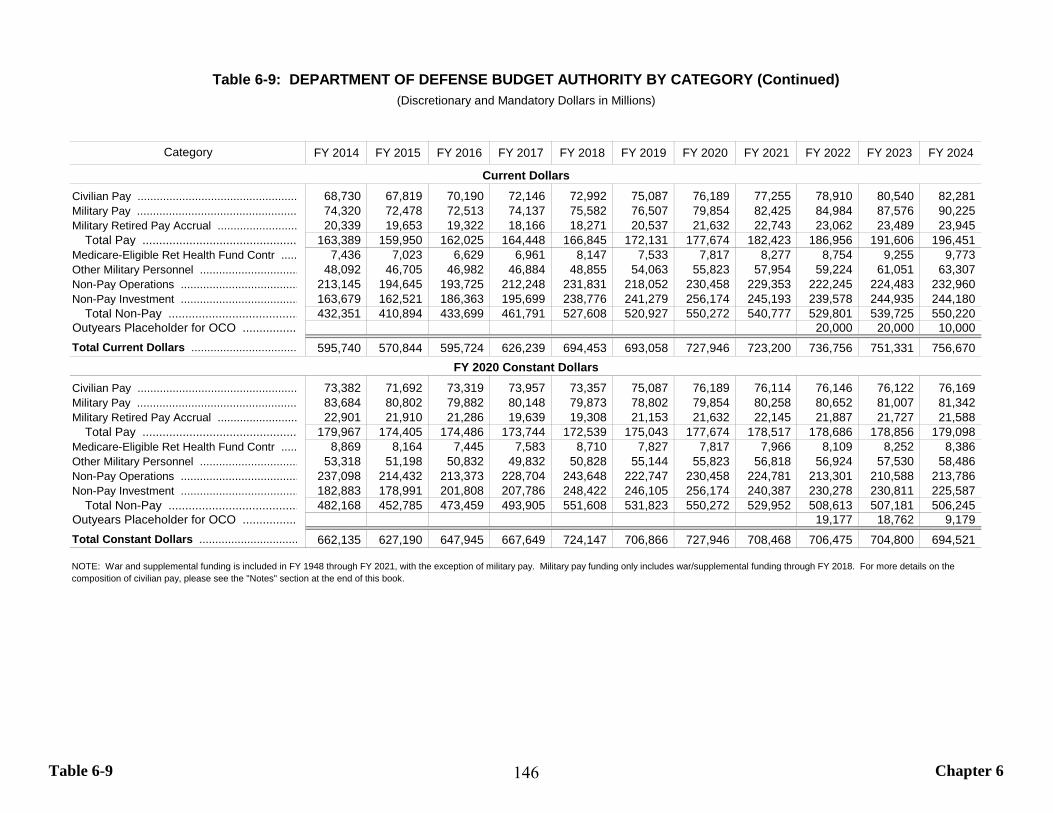
Table 6-9 Chapter 6
FY 2014 FY 2015 FY 2016 FY 2017 FY 2018 FY 2019 FY 2020 FY 2021 FY 2022 FY 2023 FY 2024
Civilian Pay .................................................. 68,730 67,819 70,190 72,146 72,992 75,087 76,189 77,255 78,910 80,540 82,281 Military Pay .................................................. 74,320 72,478 72,513 74,137 75,582 76,507 79,854 82,425 84,984 87,576 90,225 Military Retired Pay Accrual ......................... 20,339 19,653 19,322 18,166 18,271 20,537 21,632 22,743 23,062 23,489 23,945
Total Pay .............................................. 163,389 159,950 162,025 164,448 166,845 172,131 177,674 182,423 186,956 191,606 196,451 Medicare-Eligible Ret Health Fund Contr ..... 7,436 7,023 6,629 6,961 8,147 7,533 7,817 8,277 8,754 9,255 9,773 Other Military Personnel ............................... 48,092 46,705 46,982 46,884 48,855 54,063 55,823 57,954 59,224 61,051 63,307 Non-Pay Operations ..................................... 213,145 194,645 193,725 212,248 231,831 218,052 230,458 229,353 222,245 224,483 232,960 Non-Pay Investment ..................................... 163,679 162,521 186,363 195,699 238,776 241,279 256,174 245,193 239,578 244,935 244,180
Total Non-Pay ....................................... 432,351 410,894 433,699 461,791 527,608 520,927 550,272 540,777 529,801 539,725 550,220 Outyears Placeholder for OCO ................. 20,000 20,000 10,000 Total Current Dollars ................................. 595,740 570,844 595,724 626,239 694,453 693,058 727,946 723,200 736,756 751,331 756,670
Civilian Pay .................................................. 73,382 71,692 73,319 73,957 73,357 75,087 76,189 76,114 76,146 76,122 76,169 Military Pay .................................................. 83,684 80,802 79,882 80,148 79,873 78,802 79,854 80,258 80,652 81,007 81,342 Military Retired Pay Accrual ......................... 22,901 21,910 21,286 19,639 19,308 21,153 21,632 22,145 21,887 21,727 21,588
Total Pay .............................................. 179,967 174,405 174,486 173,744 172,539 175,043 177,674 178,517 178,686 178,856 179,098 Medicare-Eligible Ret Health Fund Contr ..... 8,869 8,164 7,445 7,583 8,710 7,827 7,817 7,966 8,109 8,252 8,386 Other Military Personnel ............................... 53,318 51,198 50,832 49,832 50,828 55,144 55,823 56,818 56,924 57,530 58,486 Non-Pay Operations ..................................... 237,098 214,432 213,373 228,704 243,648 222,747 230,458 224,781 213,301 210,588 213,786 Non-Pay Investment ..................................... 182,883 178,991 201,808 207,786 248,422 246,105 256,174 240,387 230,278 230,811 225,587
Total Non-Pay ....................................... 482,168 452,785 473,459 493,905 551,608 531,823 550,272 529,952 508,613 507,181 506,245 Outyears Placeholder for OCO ................. 19,177 18,762 9,179 Total Constant Dollars ............................... 662,135 627,190 647,945 667,649 724,147 706,866 727,946 708,468 706,475 704,800 694,521
NOTE: War and supplemental funding is included in FY 1948 through FY 2021, with the exception of military pay. Military pay funding only includes war/supplemental funding through FY 2018. For more details on the composition of civilian pay, please see the "Notes" section at the end of this book.
Table 6-9: DEPARTMENT OF DEFENSE BUDGET AUTHORITY BY CATEGORY (Continued)(Discretionary and Mandatory Dollars in Millions)
Category
FY 2020 Constant Dollars
Current Dollars
146
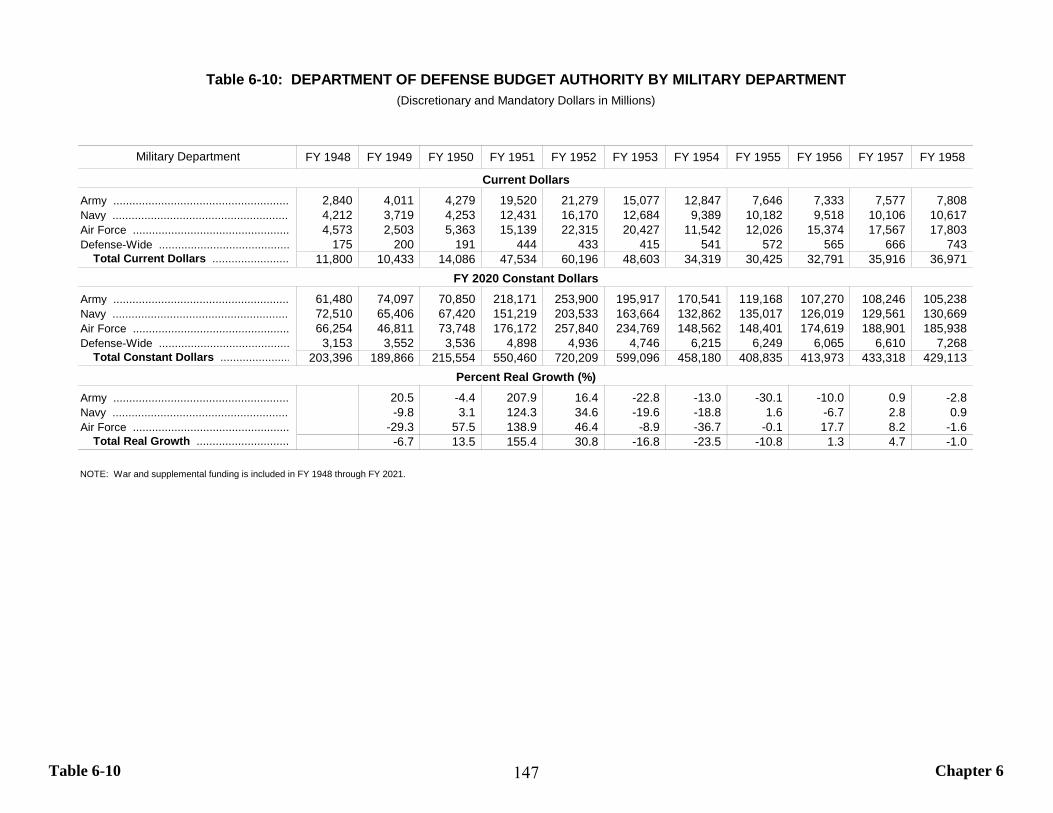
Table 6-10 Chapter 6
FY 1948 FY 1949 FY 1950 FY 1951 FY 1952 FY 1953 FY 1954 FY 1955 FY 1956 FY 1957 FY 1958
Army ....................................................... 2,840 4,011 4,279 19,520 21,279 15,077 12,847 7,646 7,333 7,577 7,808 Navy ........................................................ 4,212 3,719 4,253 12,431 16,170 12,684 9,389 10,182 9,518 10,106 10,617 Air Force ................................................. 4,573 2,503 5,363 15,139 22,315 20,427 11,542 12,026 15,374 17,567 17,803 Defense-Wide ......................................... 175 200 191 444 433 415 541 572 565 666 743
Total Current Dollars ........................ 11,800 10,433 14,086 47,534 60,196 48,603 34,319 30,425 32,791 35,916 36,971
Army ....................................................... 61,480 74,097 70,850 218,171 253,900 195,917 170,541 119,168 107,270 108,246 105,238 Navy ........................................................ 72,510 65,406 67,420 151,219 203,533 163,664 132,862 135,017 126,019 129,561 130,669 Air Force ................................................. 66,254 46,811 73,748 176,172 257,840 234,769 148,562 148,401 174,619 188,901 185,938 Defense-Wide ......................................... 3,153 3,552 3,536 4,898 4,936 4,746 6,215 6,249 6,065 6,610 7,268
Total Constant Dollars ...................... 203,396 189,866 215,554 550,460 720,209 599,096 458,180 408,835 413,973 433,318 429,113
Army ....................................................... 20.5 -4.4 207.9 16.4 -22.8 -13.0 -30.1 -10.0 0.9 -2.8 Navy ........................................................ -9.8 3.1 124.3 34.6 -19.6 -18.8 1.6 -6.7 2.8 0.9 Air Force ................................................. -29.3 57.5 138.9 46.4 -8.9 -36.7 -0.1 17.7 8.2 -1.6
Total Real Growth ............................. -6.7 13.5 155.4 30.8 -16.8 -23.5 -10.8 1.3 4.7 -1.0
NOTE: War and supplemental funding is included in FY 1948 through FY 2021.
FY 2020 Constant Dollars
Percent Real Growth (%)
Table 6-10: DEPARTMENT OF DEFENSE BUDGET AUTHORITY BY MILITARY DEPARTMENT(Discretionary and Mandatory Dollars in Millions)
Military Department
Current Dollars
147
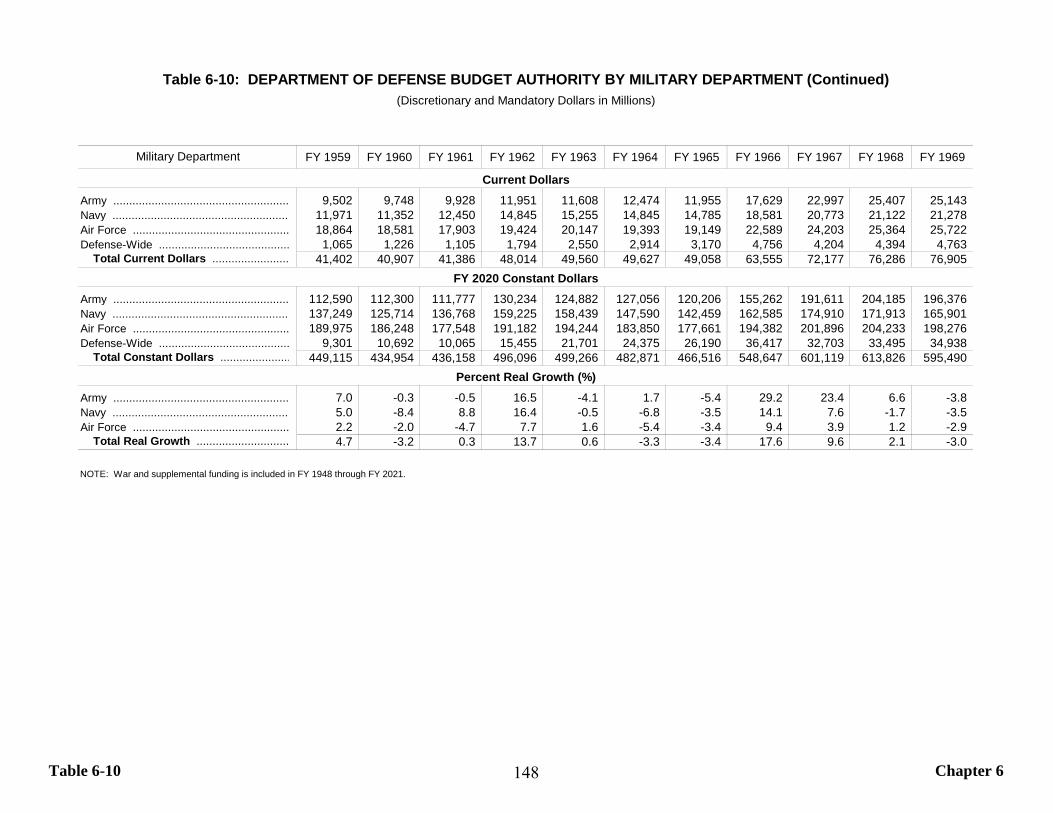
Table 6-10 Chapter 6
FY 1959 FY 1960 FY 1961 FY 1962 FY 1963 FY 1964 FY 1965 FY 1966 FY 1967 FY 1968 FY 1969
Army ....................................................... 9,502 9,748 9,928 11,951 11,608 12,474 11,955 17,629 22,997 25,407 25,143 Navy ........................................................ 11,971 11,352 12,450 14,845 15,255 14,845 14,785 18,581 20,773 21,122 21,278 Air Force ................................................. 18,864 18,581 17,903 19,424 20,147 19,393 19,149 22,589 24,203 25,364 25,722 Defense-Wide ......................................... 1,065 1,226 1,105 1,794 2,550 2,914 3,170 4,756 4,204 4,394 4,763
Total Current Dollars ........................ 41,402 40,907 41,386 48,014 49,560 49,627 49,058 63,555 72,177 76,286 76,905
Army ....................................................... 112,590 112,300 111,777 130,234 124,882 127,056 120,206 155,262 191,611 204,185 196,376 Navy ........................................................ 137,249 125,714 136,768 159,225 158,439 147,590 142,459 162,585 174,910 171,913 165,901 Air Force ................................................. 189,975 186,248 177,548 191,182 194,244 183,850 177,661 194,382 201,896 204,233 198,276 Defense-Wide ......................................... 9,301 10,692 10,065 15,455 21,701 24,375 26,190 36,417 32,703 33,495 34,938
Total Constant Dollars ...................... 449,115 434,954 436,158 496,096 499,266 482,871 466,516 548,647 601,119 613,826 595,490
Army ....................................................... 7.0 -0.3 -0.5 16.5 -4.1 1.7 -5.4 29.2 23.4 6.6 -3.8 Navy ........................................................ 5.0 -8.4 8.8 16.4 -0.5 -6.8 -3.5 14.1 7.6 -1.7 -3.5 Air Force ................................................. 2.2 -2.0 -4.7 7.7 1.6 -5.4 -3.4 9.4 3.9 1.2 -2.9
Total Real Growth ............................. 4.7 -3.2 0.3 13.7 0.6 -3.3 -3.4 17.6 9.6 2.1 -3.0
NOTE: War and supplemental funding is included in FY 1948 through FY 2021.
FY 2020 Constant Dollars
Percent Real Growth (%)
Table 6-10: DEPARTMENT OF DEFENSE BUDGET AUTHORITY BY MILITARY DEPARTMENT (Continued)(Discretionary and Mandatory Dollars in Millions)
Military Department
Current Dollars
148

Table 6-10 Chapter 6
FY 1970 FY 1971 FY 1972 FY 1973 FY 1974 FY 1975 FY 1976 FY 1977 FY 1978 FY 1979 FY 1980
Army ....................................................... 23,610 21,495 21,582 21,048 21,262 21,299 23,644 26,667 28,434 31,341 34,380 Navy ........................................................ 21,932 21,321 23,602 25,097 26,679 27,808 31,302 36,378 39,499 42,103 47,225 Air Force ................................................. 23,356 22,481 23,245 23,934 24,670 25,967 28,444 31,969 32,595 34,943 41,720 Defense-Wide ......................................... 5,185 5,863 6,577 7,475 8,380 10,586 12,119 13,324 14,794 16,618 19,296
Total Current Dollars ........................ 74,083 71,159 75,006 77,555 80,991 85,661 95,508 108,338 115,322 125,004 142,621
Army ....................................................... 174,596 151,893 138,282 123,742 115,676 108,292 110,267 115,883 114,312 116,661 117,161 Navy ........................................................ 160,037 144,821 146,723 142,899 138,551 133,405 135,849 147,529 147,397 145,615 146,393 Air Force ................................................. 173,019 156,960 148,868 140,292 132,337 128,210 127,371 133,720 126,501 125,330 130,541 Defense-Wide ......................................... 35,797 37,252 39,341 42,223 43,546 48,157 50,044 51,716 53,509 55,571 57,899
Total Constant Dollars ...................... 543,448 490,925 473,214 449,156 430,109 418,065 423,532 448,847 441,719 443,176 451,994
Army ....................................................... -11.1 -13.0 -9.0 -10.5 -6.5 -6.4 1.8 5.1 -1.4 2.1 0.4 Navy ........................................................ -3.5 -9.5 1.3 -2.6 -3.0 -3.7 1.8 8.6 -0.1 -1.2 0.5 Air Force ................................................. -12.7 -9.3 -5.2 -5.8 -5.7 -3.1 -0.7 5.0 -5.4 -0.9 4.2
Total Real Growth ............................. -8.7 -9.7 -3.6 -5.1 -4.2 -2.8 1.3 6.0 -1.6 0.3 2.0
NOTE: War and supplemental funding is included in FY 1948 through FY 2021.
FY 2020 Constant Dollars
Percent Real Growth (%)
Table 6-10: DEPARTMENT OF DEFENSE BUDGET AUTHORITY BY MILITARY DEPARTMENT (Continued)(Discretionary and Mandatory Dollars in Millions)
Military Department
Current Dollars
149

Table 6-10 Chapter 6
FY 1981 FY 1982 FY 1983 FY 1984 FY 1985 FY 1986 FY 1987 FY 1988 FY 1989 FY 1990 FY 1991
Army ....................................................... 43,252 52,254 57,529 62,181 74,270 73,128 74,102 76,011 78,258 78,733 92,118 Navy ........................................................ 58,011 69,569 81,854 82,088 99,015 96,113 93,500 100,281 97,675 99,977 103,470 Air Force ................................................. 53,144 64,821 74,074 86,108 99,420 94,870 91,624 88,324 94,685 92,890 91,257 Defense-Wide ......................................... 23,957 27,107 26,017 27,773 14,096 17,279 20,244 19,138 20,220 21,398 -10,636
Total Current Dollars ........................ 178,365 213,751 239,474 258,150 286,802 281,390 279,469 283,755 290,837 292,999 276,208
Army ....................................................... 130,140 143,039 149,560 155,311 177,053 170,401 168,253 165,861 164,162 160,737 177,280 Navy ........................................................ 161,404 178,639 200,030 195,663 227,103 216,456 205,629 211,304 200,215 198,891 196,567 Air Force ................................................. 147,920 165,286 181,077 202,506 226,325 212,646 201,243 189,019 194,322 186,371 173,747 Defense-Wide ......................................... 64,506 68,678 63,483 65,298 31,034 36,627 41,211 37,594 37,997 38,701 -15,930
Total Constant Dollars ...................... 503,970 555,642 594,151 618,778 661,514 636,131 616,336 603,777 596,695 584,700 531,664
Army ....................................................... 11.1 9.9 4.6 3.8 14.0 -3.8 -1.3 -1.4 -1.0 -2.1 10.3 Navy ........................................................ 10.3 10.7 12.0 -2.2 16.1 -4.7 -5.0 2.8 -5.2 -0.7 -1.2 Air Force ................................................. 13.3 11.7 9.6 11.8 11.8 -6.0 -5.4 -6.1 2.8 -4.1 -6.8
Total Real Growth ............................. 11.5 10.3 6.9 4.1 6.9 -3.8 -3.1 -2.0 -1.2 -2.0 -9.1
NOTE: War and supplemental funding is included in FY 1948 through FY 2021.
FY 2020 Constant Dollars
Percent Real Growth (%)
Table 6-10: DEPARTMENT OF DEFENSE BUDGET AUTHORITY BY MILITARY DEPARTMENT (Continued)(Discretionary and Mandatory Dollars in Millions)
Military Department
Current Dollars
150

Table 6-10 Chapter 6
FY 1992 FY 1993 FY 1994 FY 1995 FY 1996 FY 1997 FY 1998 FY 1999 FY 2000 FY 2001 FY 2002
Army ....................................................... 74,011 65,322 62,842 63,843 65,161 65,120 64,046 68,367 73,165 77,027 85,918 Navy ........................................................ 90,311 83,198 78,055 76,948 80,117 79,562 80,696 84,028 88,795 95,501 102,376 Air Force ................................................. 82,340 79,146 74,575 73,932 72,992 73,216 76,284 81,914 83,050 89,549 100,228 Defense-Wide ......................................... 35,222 39,736 35,890 41,005 36,298 40,108 37,558 44,287 45,524 57,352 57,109
Total Current Dollars ........................ 281,883 267,402 251,364 255,727 254,569 258,006 258,583 278,595 290,534 319,428 345,632
Army ....................................................... 143,578 122,867 115,546 114,479 113,682 111,034 105,990 109,686 113,603 116,289 125,410 Navy ........................................................ 170,833 154,035 140,424 135,596 137,481 133,555 131,528 134,347 137,808 143,548 149,808 Air Force ................................................. 154,483 143,691 133,044 130,332 125,759 123,134 124,279 130,495 129,319 134,566 146,937 Defense-Wide ......................................... 58,842 77,545 69,773 76,199 67,516 71,926 66,747 75,074 76,878 92,243 92,128
Total Constant Dollars ...................... 527,736 498,138 458,787 456,606 444,438 439,649 428,544 449,603 457,608 486,646 514,282
Army ....................................................... -19.0 -14.4 -6.0 -0.9 -0.7 -2.3 -4.5 3.5 3.6 2.4 7.8 Navy ........................................................ -13.1 -9.8 -8.8 -3.4 1.4 -2.9 -1.5 2.1 2.6 4.2 4.4 Air Force ................................................. -11.1 -7.0 -7.4 -2.0 -3.5 -2.1 0.9 5.0 -0.9 4.1 9.2
Total Real Growth ............................. -0.7 -5.6 -7.9 -0.5 -2.7 -1.1 -2.5 4.9 1.8 6.3 5.7
NOTE: War and supplemental funding is included in FY 1948 through FY 2021.
FY 2020 Constant Dollars
Percent Real Growth (%)
Table 6-10: DEPARTMENT OF DEFENSE BUDGET AUTHORITY BY MILITARY DEPARTMENT (Continued)(Discretionary and Mandatory Dollars in Millions)
Military Department
Current Dollars
151
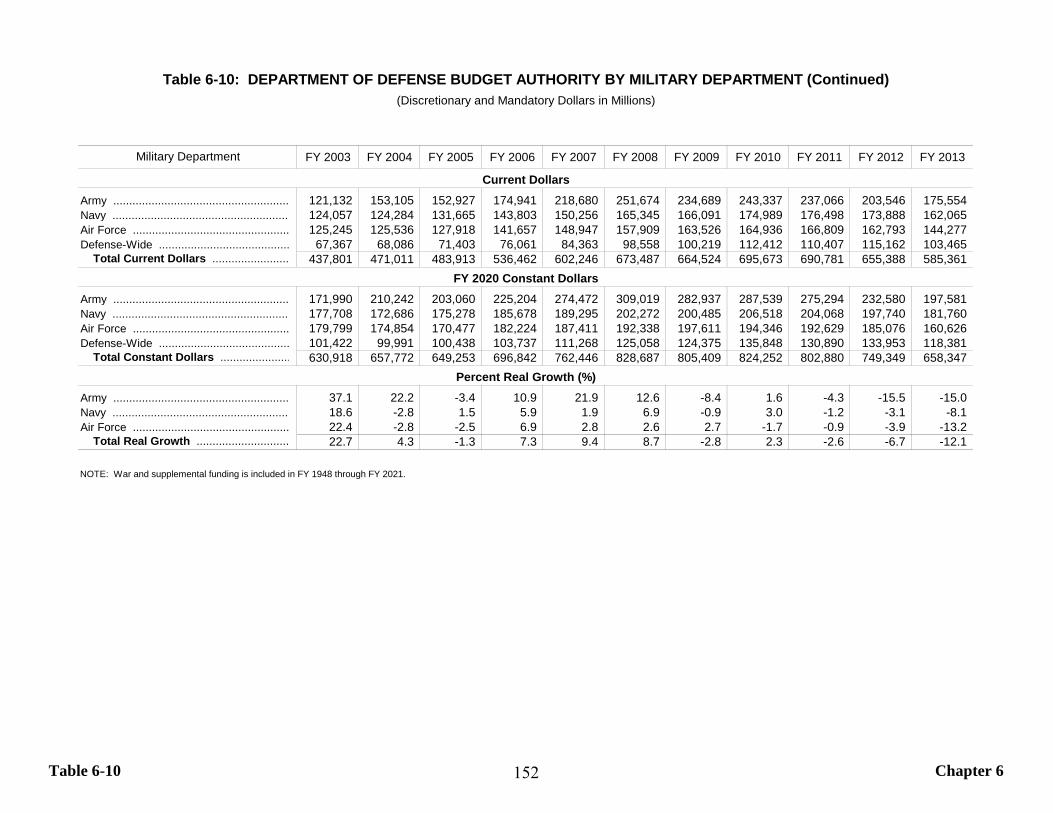
Table 6-10 Chapter 6
FY 2003 FY 2004 FY 2005 FY 2006 FY 2007 FY 2008 FY 2009 FY 2010 FY 2011 FY 2012 FY 2013
Army ....................................................... 121,132 153,105 152,927 174,941 218,680 251,674 234,689 243,337 237,066 203,546 175,554 Navy ........................................................ 124,057 124,284 131,665 143,803 150,256 165,345 166,091 174,989 176,498 173,888 162,065 Air Force ................................................. 125,245 125,536 127,918 141,657 148,947 157,909 163,526 164,936 166,809 162,793 144,277 Defense-Wide ......................................... 67,367 68,086 71,403 76,061 84,363 98,558 100,219 112,412 110,407 115,162 103,465
Total Current Dollars ........................ 437,801 471,011 483,913 536,462 602,246 673,487 664,524 695,673 690,781 655,388 585,361
Army ....................................................... 171,990 210,242 203,060 225,204 274,472 309,019 282,937 287,539 275,294 232,580 197,581 Navy ........................................................ 177,708 172,686 175,278 185,678 189,295 202,272 200,485 206,518 204,068 197,740 181,760 Air Force ................................................. 179,799 174,854 170,477 182,224 187,411 192,338 197,611 194,346 192,629 185,076 160,626 Defense-Wide ......................................... 101,422 99,991 100,438 103,737 111,268 125,058 124,375 135,848 130,890 133,953 118,381
Total Constant Dollars ...................... 630,918 657,772 649,253 696,842 762,446 828,687 805,409 824,252 802,880 749,349 658,347
Army ....................................................... 37.1 22.2 -3.4 10.9 21.9 12.6 -8.4 1.6 -4.3 -15.5 -15.0 Navy ........................................................ 18.6 -2.8 1.5 5.9 1.9 6.9 -0.9 3.0 -1.2 -3.1 -8.1 Air Force ................................................. 22.4 -2.8 -2.5 6.9 2.8 2.6 2.7 -1.7 -0.9 -3.9 -13.2
Total Real Growth ............................. 22.7 4.3 -1.3 7.3 9.4 8.7 -2.8 2.3 -2.6 -6.7 -12.1
NOTE: War and supplemental funding is included in FY 1948 through FY 2021.
Percent Real Growth (%)
Table 6-10: DEPARTMENT OF DEFENSE BUDGET AUTHORITY BY MILITARY DEPARTMENT (Continued)(Discretionary and Mandatory Dollars in Millions)
Military Department
Current Dollars
FY 2020 Constant Dollars
152
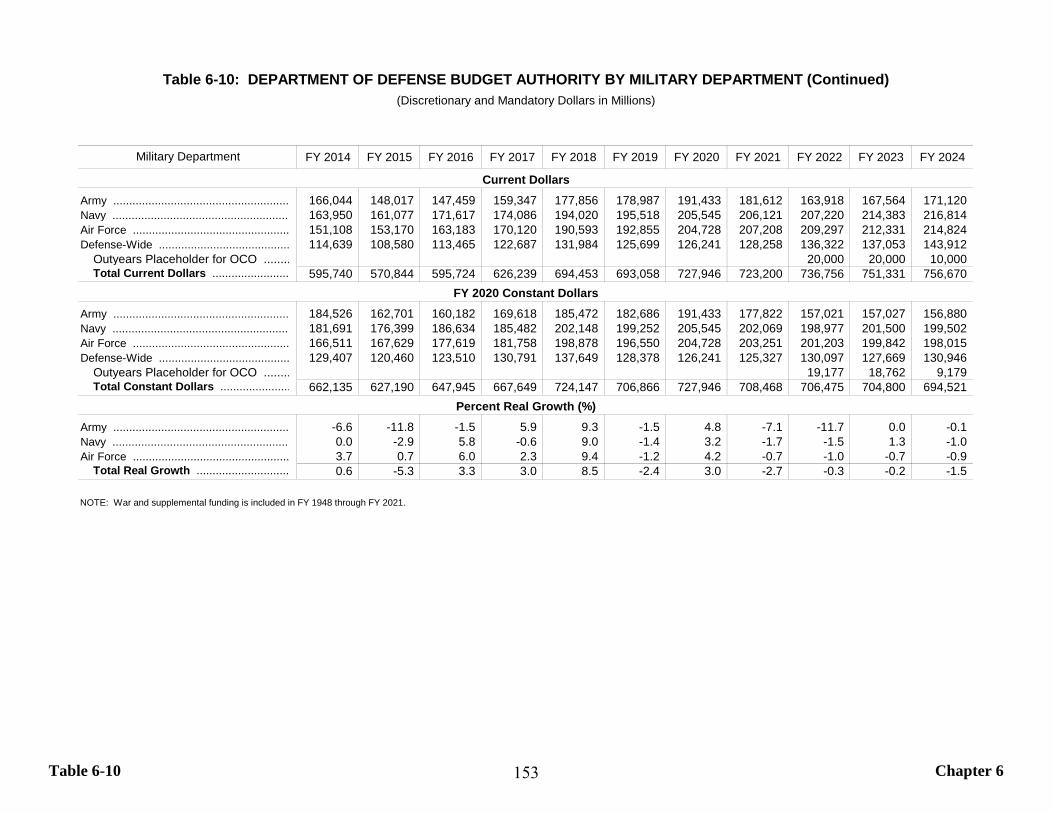
Table 6-10 Chapter 6
FY 2014 FY 2015 FY 2016 FY 2017 FY 2018 FY 2019 FY 2020 FY 2021 FY 2022 FY 2023 FY 2024
Army ....................................................... 166,044 148,017 147,459 159,347 177,856 178,987 191,433 181,612 163,918 167,564 171,120 Navy ........................................................ 163,950 161,077 171,617 174,086 194,020 195,518 205,545 206,121 207,220 214,383 216,814 Air Force ................................................. 151,108 153,170 163,183 170,120 190,593 192,855 204,728 207,208 209,297 212,331 214,824 Defense-Wide ......................................... 114,639 108,580 113,465 122,687 131,984 125,699 126,241 128,258 136,322 137,053 143,912
Outyears Placeholder for OCO ........ 20,000 20,000 10,000 Total Current Dollars ........................ 595,740 570,844 595,724 626,239 694,453 693,058 727,946 723,200 736,756 751,331 756,670
Army ....................................................... 184,526 162,701 160,182 169,618 185,472 182,686 191,433 177,822 157,021 157,027 156,880 Navy ........................................................ 181,691 176,399 186,634 185,482 202,148 199,252 205,545 202,069 198,977 201,500 199,502 Air Force ................................................. 166,511 167,629 177,619 181,758 198,878 196,550 204,728 203,251 201,203 199,842 198,015 Defense-Wide ......................................... 129,407 120,460 123,510 130,791 137,649 128,378 126,241 125,327 130,097 127,669 130,946
Outyears Placeholder for OCO ........ 19,177 18,762 9,179 Total Constant Dollars ...................... 662,135 627,190 647,945 667,649 724,147 706,866 727,946 708,468 706,475 704,800 694,521
Army ....................................................... -6.6 -11.8 -1.5 5.9 9.3 -1.5 4.8 -7.1 -11.7 0.0 -0.1 Navy ........................................................ 0.0 -2.9 5.8 -0.6 9.0 -1.4 3.2 -1.7 -1.5 1.3 -1.0 Air Force ................................................. 3.7 0.7 6.0 2.3 9.4 -1.2 4.2 -0.7 -1.0 -0.7 -0.9
Total Real Growth ............................. 0.6 -5.3 3.3 3.0 8.5 -2.4 3.0 -2.7 -0.3 -0.2 -1.5
NOTE: War and supplemental funding is included in FY 1948 through FY 2021.
Table 6-10: DEPARTMENT OF DEFENSE BUDGET AUTHORITY BY MILITARY DEPARTMENT (Continued)
Percent Real Growth (%)
FY 2020 Constant Dollars
Current Dollars
(Discretionary and Mandatory Dollars in Millions)
Military Department
153
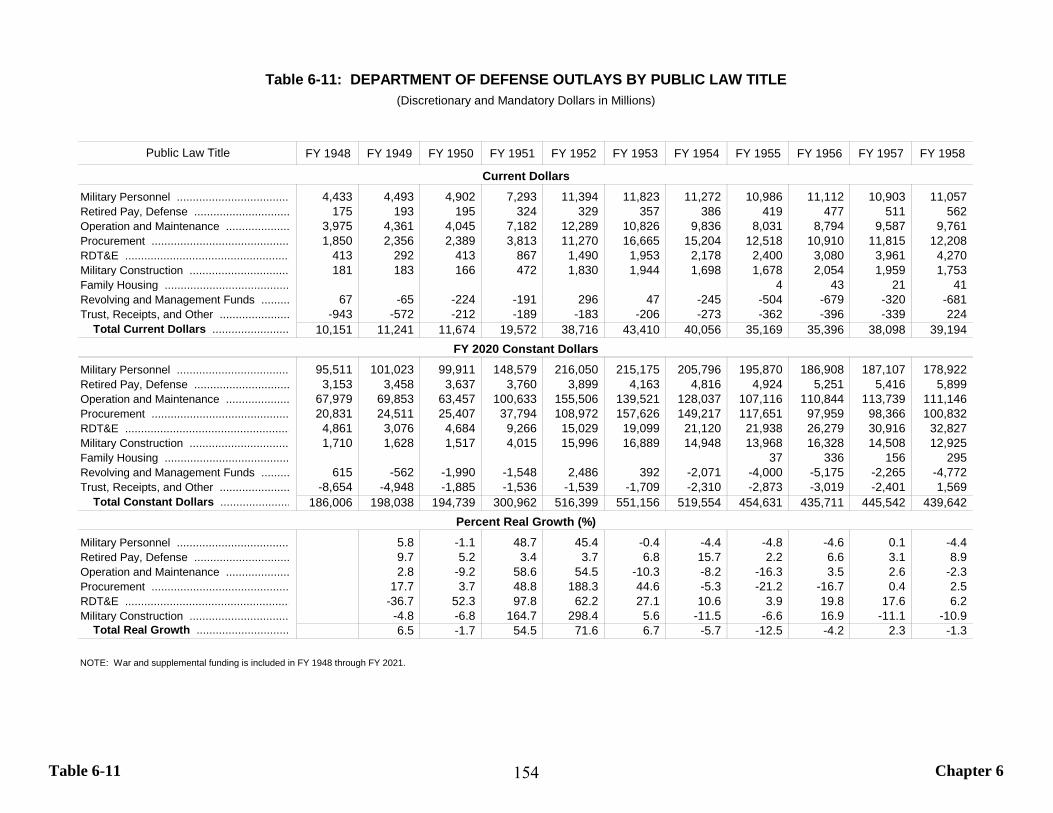
Table 6-11 Chapter 6
FY 1948 FY 1949 FY 1950 FY 1951 FY 1952 FY 1953 FY 1954 FY 1955 FY 1956 FY 1957 FY 1958
Military Personnel ................................... 4,433 4,493 4,902 7,293 11,394 11,823 11,272 10,986 11,112 10,903 11,057 Retired Pay, Defense .............................. 175 193 195 324 329 357 386 419 477 511 562 Operation and Maintenance .................... 3,975 4,361 4,045 7,182 12,289 10,826 9,836 8,031 8,794 9,587 9,761 Procurement ........................................... 1,850 2,356 2,389 3,813 11,270 16,665 15,204 12,518 10,910 11,815 12,208 RDT&E .................................................... 413 292 413 867 1,490 1,953 2,178 2,400 3,080 3,961 4,270 Military Construction ............................... 181 183 166 472 1,830 1,944 1,698 1,678 2,054 1,959 1,753 Family Housing ....................................... 4 43 21 41 Revolving and Management Funds ......... 67 -65 -224 -191 296 47 -245 -504 -679 -320 -681 Trust, Receipts, and Other ...................... -943 -572 -212 -189 -183 -206 -273 -362 -396 -339 224
Total Current Dollars ........................ 10,151 11,241 11,674 19,572 38,716 43,410 40,056 35,169 35,396 38,098 39,194
Military Personnel ................................... 95,511 101,023 99,911 148,579 216,050 215,175 205,796 195,870 186,908 187,107 178,922 Retired Pay, Defense .............................. 3,153 3,458 3,637 3,760 3,899 4,163 4,816 4,924 5,251 5,416 5,899 Operation and Maintenance .................... 67,979 69,853 63,457 100,633 155,506 139,521 128,037 107,116 110,844 113,739 111,146 Procurement ........................................... 20,831 24,511 25,407 37,794 108,972 157,626 149,217 117,651 97,959 98,366 100,832 RDT&E .................................................... 4,861 3,076 4,684 9,266 15,029 19,099 21,120 21,938 26,279 30,916 32,827 Military Construction ............................... 1,710 1,628 1,517 4,015 15,996 16,889 14,948 13,968 16,328 14,508 12,925 Family Housing ....................................... 37 336 156 295 Revolving and Management Funds ......... 615 -562 -1,990 -1,548 2,486 392 -2,071 -4,000 -5,175 -2,265 -4,772 Trust, Receipts, and Other ...................... -8,654 -4,948 -1,885 -1,536 -1,539 -1,709 -2,310 -2,873 -3,019 -2,401 1,569
Total Constant Dollars ...................... 186,006 198,038 194,739 300,962 516,399 551,156 519,554 454,631 435,711 445,542 439,642
Military Personnel ................................... 5.8 -1.1 48.7 45.4 -0.4 -4.4 -4.8 -4.6 0.1 -4.4 Retired Pay, Defense .............................. 9.7 5.2 3.4 3.7 6.8 15.7 2.2 6.6 3.1 8.9 Operation and Maintenance .................... 2.8 -9.2 58.6 54.5 -10.3 -8.2 -16.3 3.5 2.6 -2.3 Procurement ........................................... 17.7 3.7 48.8 188.3 44.6 -5.3 -21.2 -16.7 0.4 2.5 RDT&E .................................................... -36.7 52.3 97.8 62.2 27.1 10.6 3.9 19.8 17.6 6.2 Military Construction ............................... -4.8 -6.8 164.7 298.4 5.6 -11.5 -6.6 16.9 -11.1 -10.9
Total Real Growth ............................. 6.5 -1.7 54.5 71.6 6.7 -5.7 -12.5 -4.2 2.3 -1.3
NOTE: War and supplemental funding is included in FY 1948 through FY 2021.
Percent Real Growth (%)
Table 6-11: DEPARTMENT OF DEFENSE OUTLAYS BY PUBLIC LAW TITLE(Discretionary and Mandatory Dollars in Millions)
Public Law Title
Current Dollars
FY 2020 Constant Dollars
154
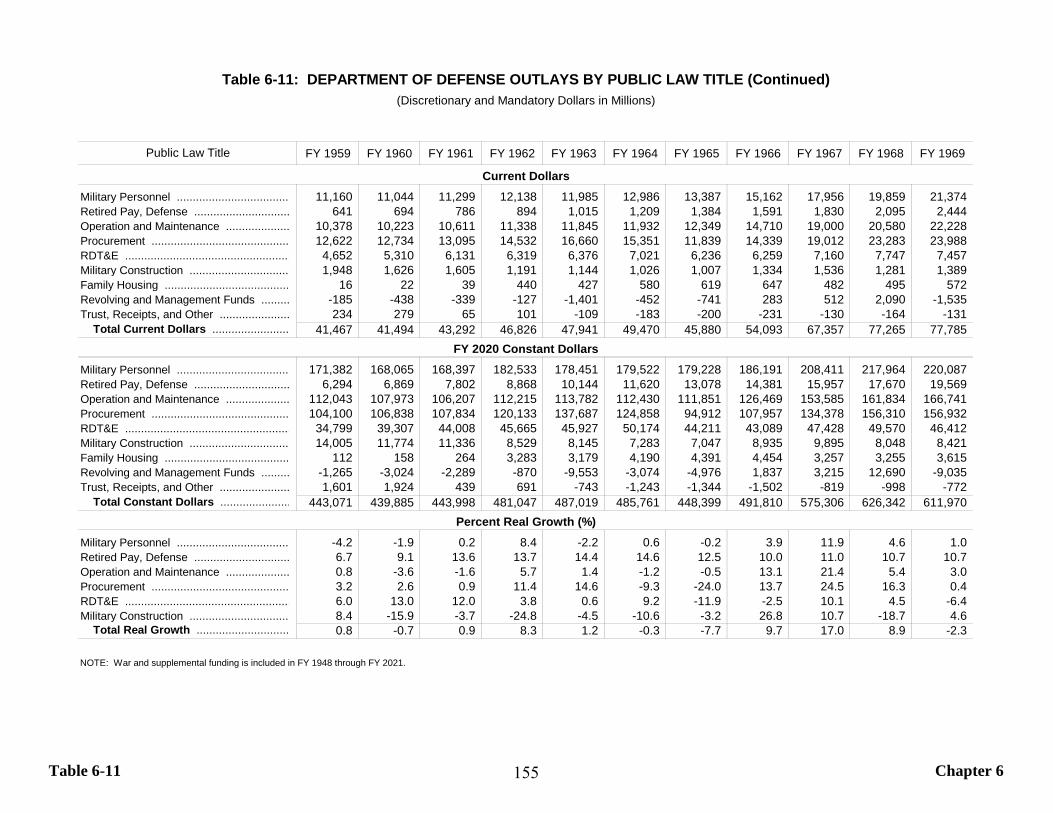
Table 6-11 Chapter 6
FY 1959 FY 1960 FY 1961 FY 1962 FY 1963 FY 1964 FY 1965 FY 1966 FY 1967 FY 1968 FY 1969
Military Personnel ................................... 11,160 11,044 11,299 12,138 11,985 12,986 13,387 15,162 17,956 19,859 21,374 Retired Pay, Defense .............................. 641 694 786 894 1,015 1,209 1,384 1,591 1,830 2,095 2,444 Operation and Maintenance .................... 10,378 10,223 10,611 11,338 11,845 11,932 12,349 14,710 19,000 20,580 22,228 Procurement ........................................... 12,622 12,734 13,095 14,532 16,660 15,351 11,839 14,339 19,012 23,283 23,988 RDT&E .................................................... 4,652 5,310 6,131 6,319 6,376 7,021 6,236 6,259 7,160 7,747 7,457 Military Construction ............................... 1,948 1,626 1,605 1,191 1,144 1,026 1,007 1,334 1,536 1,281 1,389 Family Housing ....................................... 16 22 39 440 427 580 619 647 482 495 572 Revolving and Management Funds ......... -185 -438 -339 -127 -1,401 -452 -741 283 512 2,090 -1,535 Trust, Receipts, and Other ...................... 234 279 65 101 -109 -183 -200 -231 -130 -164 -131
Total Current Dollars ........................ 41,467 41,494 43,292 46,826 47,941 49,470 45,880 54,093 67,357 77,265 77,785
Military Personnel ................................... 171,382 168,065 168,397 182,533 178,451 179,522 179,228 186,191 208,411 217,964 220,087 Retired Pay, Defense .............................. 6,294 6,869 7,802 8,868 10,144 11,620 13,078 14,381 15,957 17,670 19,569 Operation and Maintenance .................... 112,043 107,973 106,207 112,215 113,782 112,430 111,851 126,469 153,585 161,834 166,741 Procurement ........................................... 104,100 106,838 107,834 120,133 137,687 124,858 94,912 107,957 134,378 156,310 156,932 RDT&E .................................................... 34,799 39,307 44,008 45,665 45,927 50,174 44,211 43,089 47,428 49,570 46,412 Military Construction ............................... 14,005 11,774 11,336 8,529 8,145 7,283 7,047 8,935 9,895 8,048 8,421 Family Housing ....................................... 112 158 264 3,283 3,179 4,190 4,391 4,454 3,257 3,255 3,615 Revolving and Management Funds ......... -1,265 -3,024 -2,289 -870 -9,553 -3,074 -4,976 1,837 3,215 12,690 -9,035 Trust, Receipts, and Other ...................... 1,601 1,924 439 691 -743 -1,243 -1,344 -1,502 -819 -998 -772
Total Constant Dollars ...................... 443,071 439,885 443,998 481,047 487,019 485,761 448,399 491,810 575,306 626,342 611,970
Military Personnel ................................... -4.2 -1.9 0.2 8.4 -2.2 0.6 -0.2 3.9 11.9 4.6 1.0 Retired Pay, Defense .............................. 6.7 9.1 13.6 13.7 14.4 14.6 12.5 10.0 11.0 10.7 10.7 Operation and Maintenance .................... 0.8 -3.6 -1.6 5.7 1.4 -1.2 -0.5 13.1 21.4 5.4 3.0 Procurement ........................................... 3.2 2.6 0.9 11.4 14.6 -9.3 -24.0 13.7 24.5 16.3 0.4 RDT&E .................................................... 6.0 13.0 12.0 3.8 0.6 9.2 -11.9 -2.5 10.1 4.5 -6.4 Military Construction ............................... 8.4 -15.9 -3.7 -24.8 -4.5 -10.6 -3.2 26.8 10.7 -18.7 4.6
Total Real Growth ............................. 0.8 -0.7 0.9 8.3 1.2 -0.3 -7.7 9.7 17.0 8.9 -2.3
NOTE: War and supplemental funding is included in FY 1948 through FY 2021.
Percent Real Growth (%)
Table 6-11: DEPARTMENT OF DEFENSE OUTLAYS BY PUBLIC LAW TITLE (Continued)(Discretionary and Mandatory Dollars in Millions)
Public Law Title
Current Dollars
FY 2020 Constant Dollars
155
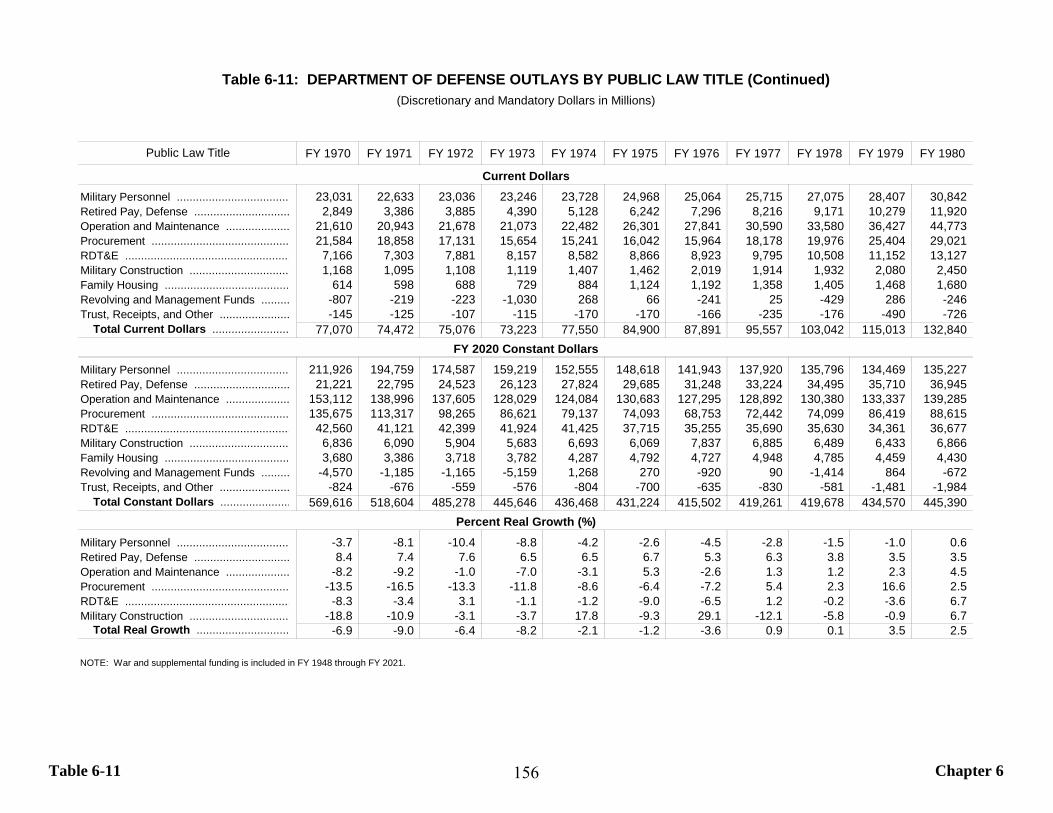
Table 6-11 Chapter 6
FY 1970 FY 1971 FY 1972 FY 1973 FY 1974 FY 1975 FY 1976 FY 1977 FY 1978 FY 1979 FY 1980
Military Personnel ................................... 23,031 22,633 23,036 23,246 23,728 24,968 25,064 25,715 27,075 28,407 30,842 Retired Pay, Defense .............................. 2,849 3,386 3,885 4,390 5,128 6,242 7,296 8,216 9,171 10,279 11,920 Operation and Maintenance .................... 21,610 20,943 21,678 21,073 22,482 26,301 27,841 30,590 33,580 36,427 44,773 Procurement ........................................... 21,584 18,858 17,131 15,654 15,241 16,042 15,964 18,178 19,976 25,404 29,021 RDT&E .................................................... 7,166 7,303 7,881 8,157 8,582 8,866 8,923 9,795 10,508 11,152 13,127 Military Construction ............................... 1,168 1,095 1,108 1,119 1,407 1,462 2,019 1,914 1,932 2,080 2,450 Family Housing ....................................... 614 598 688 729 884 1,124 1,192 1,358 1,405 1,468 1,680 Revolving and Management Funds ......... -807 -219 -223 -1,030 268 66 -241 25 -429 286 -246 Trust, Receipts, and Other ...................... -145 -125 -107 -115 -170 -170 -166 -235 -176 -490 -726
Total Current Dollars ........................ 77,070 74,472 75,076 73,223 77,550 84,900 87,891 95,557 103,042 115,013 132,840
Military Personnel ................................... 211,926 194,759 174,587 159,219 152,555 148,618 141,943 137,920 135,796 134,469 135,227 Retired Pay, Defense .............................. 21,221 22,795 24,523 26,123 27,824 29,685 31,248 33,224 34,495 35,710 36,945 Operation and Maintenance .................... 153,112 138,996 137,605 128,029 124,084 130,683 127,295 128,892 130,380 133,337 139,285 Procurement ........................................... 135,675 113,317 98,265 86,621 79,137 74,093 68,753 72,442 74,099 86,419 88,615 RDT&E .................................................... 42,560 41,121 42,399 41,924 41,425 37,715 35,255 35,690 35,630 34,361 36,677 Military Construction ............................... 6,836 6,090 5,904 5,683 6,693 6,069 7,837 6,885 6,489 6,433 6,866 Family Housing ....................................... 3,680 3,386 3,718 3,782 4,287 4,792 4,727 4,948 4,785 4,459 4,430 Revolving and Management Funds ......... -4,570 -1,185 -1,165 -5,159 1,268 270 -920 90 -1,414 864 -672 Trust, Receipts, and Other ...................... -824 -676 -559 -576 -804 -700 -635 -830 -581 -1,481 -1,984
Total Constant Dollars ...................... 569,616 518,604 485,278 445,646 436,468 431,224 415,502 419,261 419,678 434,570 445,390
Military Personnel ................................... -3.7 -8.1 -10.4 -8.8 -4.2 -2.6 -4.5 -2.8 -1.5 -1.0 0.6 Retired Pay, Defense .............................. 8.4 7.4 7.6 6.5 6.5 6.7 5.3 6.3 3.8 3.5 3.5 Operation and Maintenance .................... -8.2 -9.2 -1.0 -7.0 -3.1 5.3 -2.6 1.3 1.2 2.3 4.5 Procurement ........................................... -13.5 -16.5 -13.3 -11.8 -8.6 -6.4 -7.2 5.4 2.3 16.6 2.5 RDT&E .................................................... -8.3 -3.4 3.1 -1.1 -1.2 -9.0 -6.5 1.2 -0.2 -3.6 6.7 Military Construction ............................... -18.8 -10.9 -3.1 -3.7 17.8 -9.3 29.1 -12.1 -5.8 -0.9 6.7
Total Real Growth ............................. -6.9 -9.0 -6.4 -8.2 -2.1 -1.2 -3.6 0.9 0.1 3.5 2.5
NOTE: War and supplemental funding is included in FY 1948 through FY 2021.
Percent Real Growth (%)
Table 6-11: DEPARTMENT OF DEFENSE OUTLAYS BY PUBLIC LAW TITLE (Continued)(Discretionary and Mandatory Dollars in Millions)
Public Law Title
Current Dollars
FY 2020 Constant Dollars
156
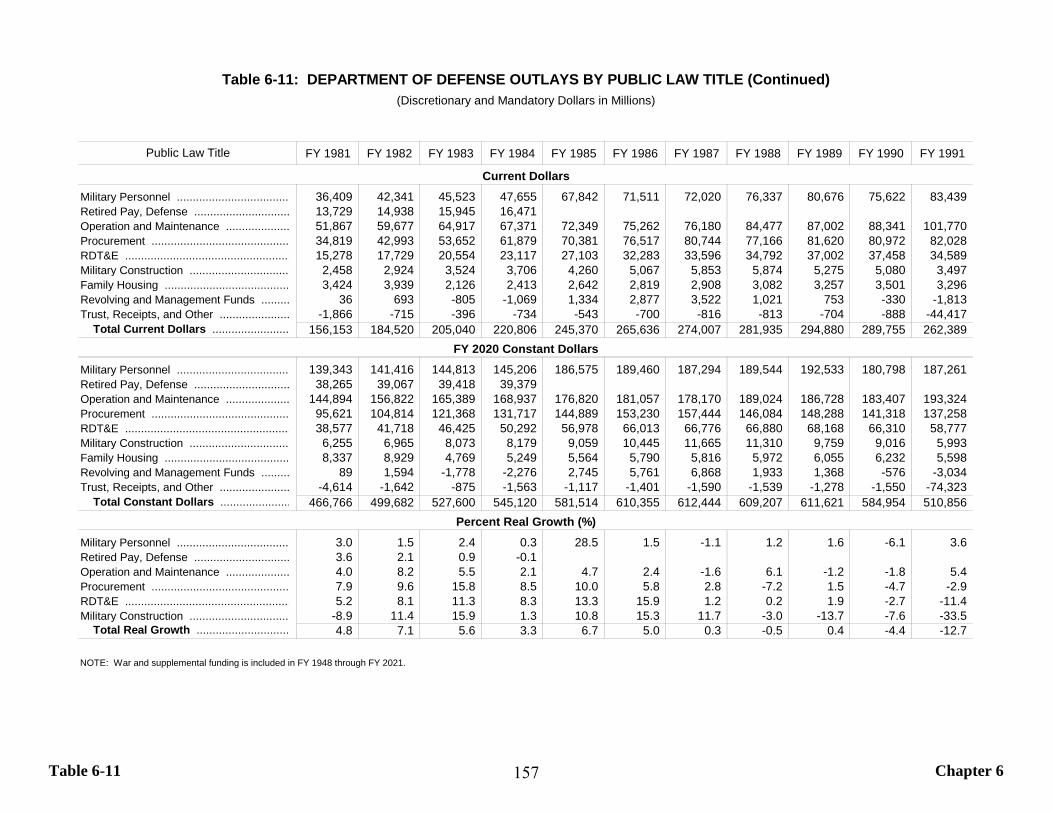
Table 6-11 Chapter 6
FY 1981 FY 1982 FY 1983 FY 1984 FY 1985 FY 1986 FY 1987 FY 1988 FY 1989 FY 1990 FY 1991
Military Personnel ................................... 36,409 42,341 45,523 47,655 67,842 71,511 72,020 76,337 80,676 75,622 83,439 Retired Pay, Defense .............................. 13,729 14,938 15,945 16,471 Operation and Maintenance .................... 51,867 59,677 64,917 67,371 72,349 75,262 76,180 84,477 87,002 88,341 101,770 Procurement ........................................... 34,819 42,993 53,652 61,879 70,381 76,517 80,744 77,166 81,620 80,972 82,028 RDT&E .................................................... 15,278 17,729 20,554 23,117 27,103 32,283 33,596 34,792 37,002 37,458 34,589 Military Construction ............................... 2,458 2,924 3,524 3,706 4,260 5,067 5,853 5,874 5,275 5,080 3,497 Family Housing ....................................... 3,424 3,939 2,126 2,413 2,642 2,819 2,908 3,082 3,257 3,501 3,296 Revolving and Management Funds ......... 36 693 -805 -1,069 1,334 2,877 3,522 1,021 753 -330 -1,813 Trust, Receipts, and Other ...................... -1,866 -715 -396 -734 -543 -700 -816 -813 -704 -888 -44,417
Total Current Dollars ........................ 156,153 184,520 205,040 220,806 245,370 265,636 274,007 281,935 294,880 289,755 262,389
Military Personnel ................................... 139,343 141,416 144,813 145,206 186,575 189,460 187,294 189,544 192,533 180,798 187,261 Retired Pay, Defense .............................. 38,265 39,067 39,418 39,379 Operation and Maintenance .................... 144,894 156,822 165,389 168,937 176,820 181,057 178,170 189,024 186,728 183,407 193,324 Procurement ........................................... 95,621 104,814 121,368 131,717 144,889 153,230 157,444 146,084 148,288 141,318 137,258 RDT&E .................................................... 38,577 41,718 46,425 50,292 56,978 66,013 66,776 66,880 68,168 66,310 58,777 Military Construction ............................... 6,255 6,965 8,073 8,179 9,059 10,445 11,665 11,310 9,759 9,016 5,993 Family Housing ....................................... 8,337 8,929 4,769 5,249 5,564 5,790 5,816 5,972 6,055 6,232 5,598 Revolving and Management Funds ......... 89 1,594 -1,778 -2,276 2,745 5,761 6,868 1,933 1,368 -576 -3,034 Trust, Receipts, and Other ...................... -4,614 -1,642 -875 -1,563 -1,117 -1,401 -1,590 -1,539 -1,278 -1,550 -74,323
Total Constant Dollars ...................... 466,766 499,682 527,600 545,120 581,514 610,355 612,444 609,207 611,621 584,954 510,856
Military Personnel ................................... 3.0 1.5 2.4 0.3 28.5 1.5 -1.1 1.2 1.6 -6.1 3.6 Retired Pay, Defense .............................. 3.6 2.1 0.9 -0.1 Operation and Maintenance .................... 4.0 8.2 5.5 2.1 4.7 2.4 -1.6 6.1 -1.2 -1.8 5.4 Procurement ........................................... 7.9 9.6 15.8 8.5 10.0 5.8 2.8 -7.2 1.5 -4.7 -2.9 RDT&E .................................................... 5.2 8.1 11.3 8.3 13.3 15.9 1.2 0.2 1.9 -2.7 -11.4 Military Construction ............................... -8.9 11.4 15.9 1.3 10.8 15.3 11.7 -3.0 -13.7 -7.6 -33.5
Total Real Growth ............................. 4.8 7.1 5.6 3.3 6.7 5.0 0.3 -0.5 0.4 -4.4 -12.7
NOTE: War and supplemental funding is included in FY 1948 through FY 2021.
Percent Real Growth (%)
Table 6-11: DEPARTMENT OF DEFENSE OUTLAYS BY PUBLIC LAW TITLE (Continued)(Discretionary and Mandatory Dollars in Millions)
Public Law Title
Current Dollars
FY 2020 Constant Dollars
157
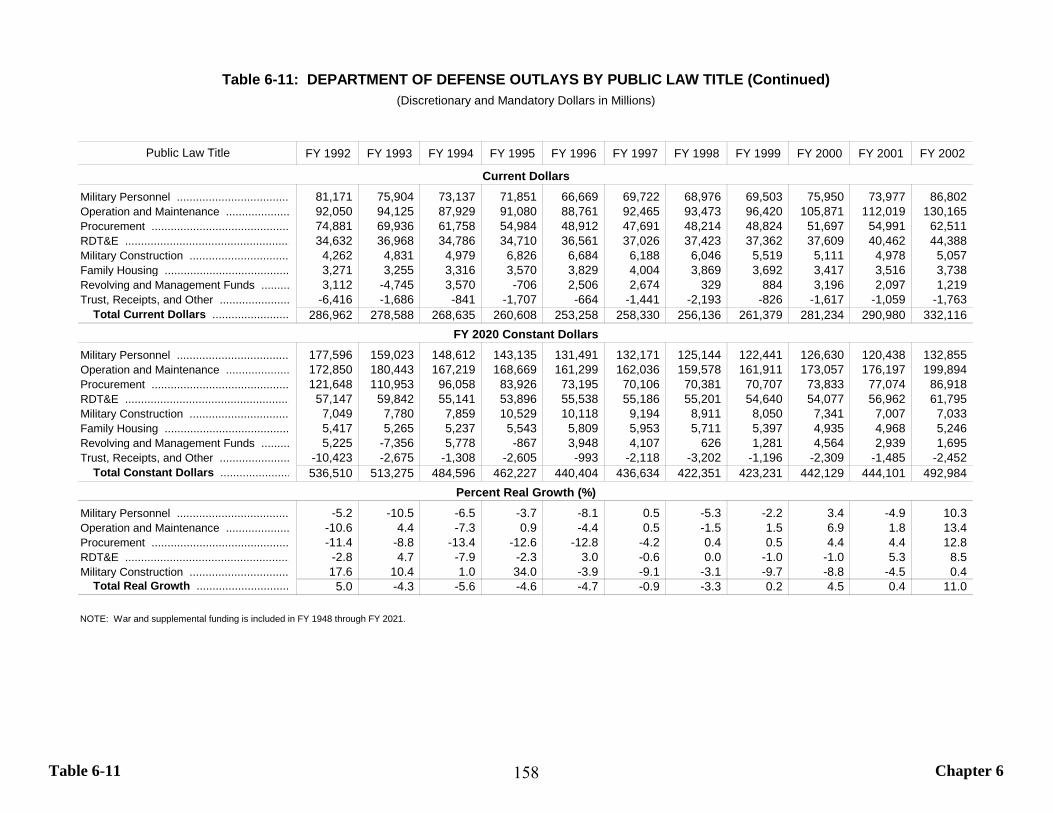
Table 6-11 Chapter 6
FY 1992 FY 1993 FY 1994 FY 1995 FY 1996 FY 1997 FY 1998 FY 1999 FY 2000 FY 2001 FY 2002
Military Personnel ................................... 81,171 75,904 73,137 71,851 66,669 69,722 68,976 69,503 75,950 73,977 86,802 Operation and Maintenance .................... 92,050 94,125 87,929 91,080 88,761 92,465 93,473 96,420 105,871 112,019 130,165 Procurement ........................................... 74,881 69,936 61,758 54,984 48,912 47,691 48,214 48,824 51,697 54,991 62,511 RDT&E .................................................... 34,632 36,968 34,786 34,710 36,561 37,026 37,423 37,362 37,609 40,462 44,388 Military Construction ............................... 4,262 4,831 4,979 6,826 6,684 6,188 6,046 5,519 5,111 4,978 5,057 Family Housing ....................................... 3,271 3,255 3,316 3,570 3,829 4,004 3,869 3,692 3,417 3,516 3,738 Revolving and Management Funds ......... 3,112 -4,745 3,570 -706 2,506 2,674 329 884 3,196 2,097 1,219 Trust, Receipts, and Other ...................... -6,416 -1,686 -841 -1,707 -664 -1,441 -2,193 -826 -1,617 -1,059 -1,763
Total Current Dollars ........................ 286,962 278,588 268,635 260,608 253,258 258,330 256,136 261,379 281,234 290,980 332,116
Military Personnel ................................... 177,596 159,023 148,612 143,135 131,491 132,171 125,144 122,441 126,630 120,438 132,855 Operation and Maintenance .................... 172,850 180,443 167,219 168,669 161,299 162,036 159,578 161,911 173,057 176,197 199,894 Procurement ........................................... 121,648 110,953 96,058 83,926 73,195 70,106 70,381 70,707 73,833 77,074 86,918 RDT&E .................................................... 57,147 59,842 55,141 53,896 55,538 55,186 55,201 54,640 54,077 56,962 61,795 Military Construction ............................... 7,049 7,780 7,859 10,529 10,118 9,194 8,911 8,050 7,341 7,007 7,033 Family Housing ....................................... 5,417 5,265 5,237 5,543 5,809 5,953 5,711 5,397 4,935 4,968 5,246 Revolving and Management Funds ......... 5,225 -7,356 5,778 -867 3,948 4,107 626 1,281 4,564 2,939 1,695 Trust, Receipts, and Other ...................... -10,423 -2,675 -1,308 -2,605 -993 -2,118 -3,202 -1,196 -2,309 -1,485 -2,452
Total Constant Dollars ...................... 536,510 513,275 484,596 462,227 440,404 436,634 422,351 423,231 442,129 444,101 492,984
Military Personnel ................................... -5.2 -10.5 -6.5 -3.7 -8.1 0.5 -5.3 -2.2 3.4 -4.9 10.3 Operation and Maintenance .................... -10.6 4.4 -7.3 0.9 -4.4 0.5 -1.5 1.5 6.9 1.8 13.4 Procurement ........................................... -11.4 -8.8 -13.4 -12.6 -12.8 -4.2 0.4 0.5 4.4 4.4 12.8 RDT&E .................................................... -2.8 4.7 -7.9 -2.3 3.0 -0.6 0.0 -1.0 -1.0 5.3 8.5 Military Construction ............................... 17.6 10.4 1.0 34.0 -3.9 -9.1 -3.1 -9.7 -8.8 -4.5 0.4
Total Real Growth ............................. 5.0 -4.3 -5.6 -4.6 -4.7 -0.9 -3.3 0.2 4.5 0.4 11.0
NOTE: War and supplemental funding is included in FY 1948 through FY 2021.
Percent Real Growth (%)
Table 6-11: DEPARTMENT OF DEFENSE OUTLAYS BY PUBLIC LAW TITLE (Continued)(Discretionary and Mandatory Dollars in Millions)
Public Law Title
Current Dollars
FY 2020 Constant Dollars
158
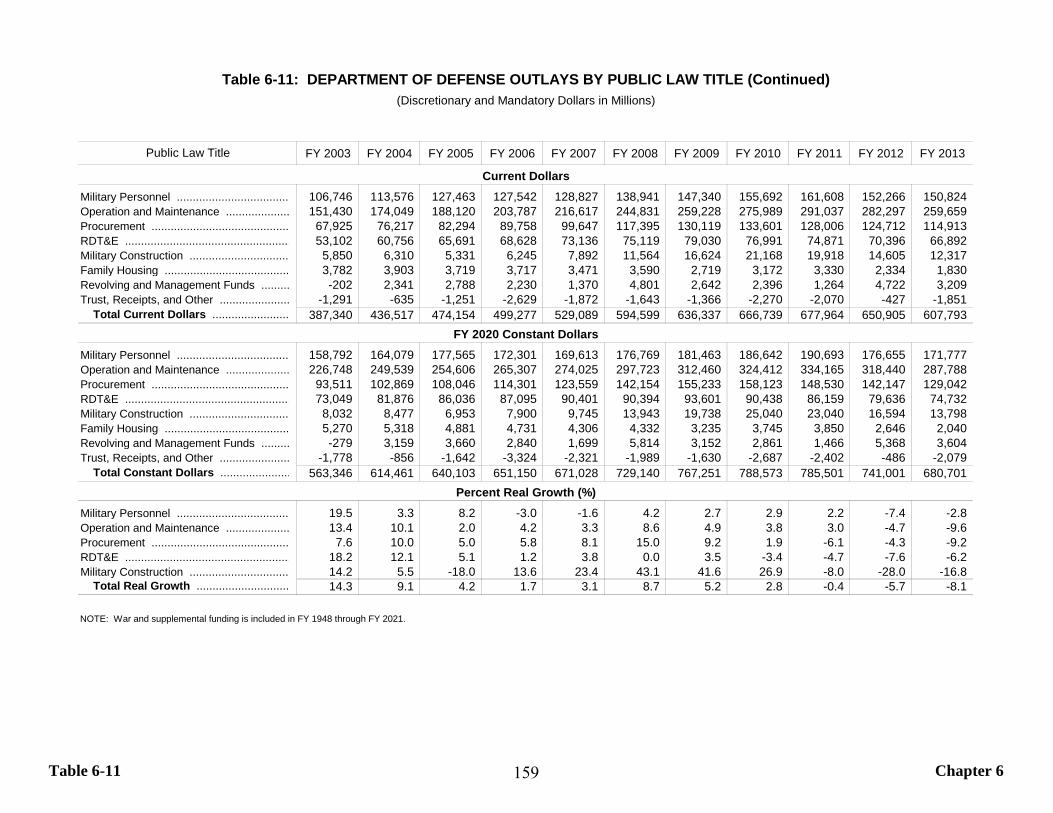
Table 6-11 Chapter 6
FY 2003 FY 2004 FY 2005 FY 2006 FY 2007 FY 2008 FY 2009 FY 2010 FY 2011 FY 2012 FY 2013
Military Personnel ................................... 106,746 113,576 127,463 127,542 128,827 138,941 147,340 155,692 161,608 152,266 150,824 Operation and Maintenance .................... 151,430 174,049 188,120 203,787 216,617 244,831 259,228 275,989 291,037 282,297 259,659 Procurement ........................................... 67,925 76,217 82,294 89,758 99,647 117,395 130,119 133,601 128,006 124,712 114,913 RDT&E .................................................... 53,102 60,756 65,691 68,628 73,136 75,119 79,030 76,991 74,871 70,396 66,892 Military Construction ............................... 5,850 6,310 5,331 6,245 7,892 11,564 16,624 21,168 19,918 14,605 12,317 Family Housing ....................................... 3,782 3,903 3,719 3,717 3,471 3,590 2,719 3,172 3,330 2,334 1,830 Revolving and Management Funds ......... -202 2,341 2,788 2,230 1,370 4,801 2,642 2,396 1,264 4,722 3,209 Trust, Receipts, and Other ...................... -1,291 -635 -1,251 -2,629 -1,872 -1,643 -1,366 -2,270 -2,070 -427 -1,851
Total Current Dollars ........................ 387,340 436,517 474,154 499,277 529,089 594,599 636,337 666,739 677,964 650,905 607,793
Military Personnel ................................... 158,792 164,079 177,565 172,301 169,613 176,769 181,463 186,642 190,693 176,655 171,777 Operation and Maintenance .................... 226,748 249,539 254,606 265,307 274,025 297,723 312,460 324,412 334,165 318,440 287,788 Procurement ........................................... 93,511 102,869 108,046 114,301 123,559 142,154 155,233 158,123 148,530 142,147 129,042 RDT&E .................................................... 73,049 81,876 86,036 87,095 90,401 90,394 93,601 90,438 86,159 79,636 74,732 Military Construction ............................... 8,032 8,477 6,953 7,900 9,745 13,943 19,738 25,040 23,040 16,594 13,798 Family Housing ....................................... 5,270 5,318 4,881 4,731 4,306 4,332 3,235 3,745 3,850 2,646 2,040 Revolving and Management Funds ......... -279 3,159 3,660 2,840 1,699 5,814 3,152 2,861 1,466 5,368 3,604 Trust, Receipts, and Other ...................... -1,778 -856 -1,642 -3,324 -2,321 -1,989 -1,630 -2,687 -2,402 -486 -2,079
Total Constant Dollars ...................... 563,346 614,461 640,103 651,150 671,028 729,140 767,251 788,573 785,501 741,001 680,701
Military Personnel ................................... 19.5 3.3 8.2 -3.0 -1.6 4.2 2.7 2.9 2.2 -7.4 -2.8 Operation and Maintenance .................... 13.4 10.1 2.0 4.2 3.3 8.6 4.9 3.8 3.0 -4.7 -9.6 Procurement ........................................... 7.6 10.0 5.0 5.8 8.1 15.0 9.2 1.9 -6.1 -4.3 -9.2 RDT&E .................................................... 18.2 12.1 5.1 1.2 3.8 0.0 3.5 -3.4 -4.7 -7.6 -6.2 Military Construction ............................... 14.2 5.5 -18.0 13.6 23.4 43.1 41.6 26.9 -8.0 -28.0 -16.8
Total Real Growth ............................. 14.3 9.1 4.2 1.7 3.1 8.7 5.2 2.8 -0.4 -5.7 -8.1
NOTE: War and supplemental funding is included in FY 1948 through FY 2021.
Percent Real Growth (%)
Table 6-11: DEPARTMENT OF DEFENSE OUTLAYS BY PUBLIC LAW TITLE (Continued)(Discretionary and Mandatory Dollars in Millions)
Public Law Title
Current Dollars
FY 2020 Constant Dollars
159
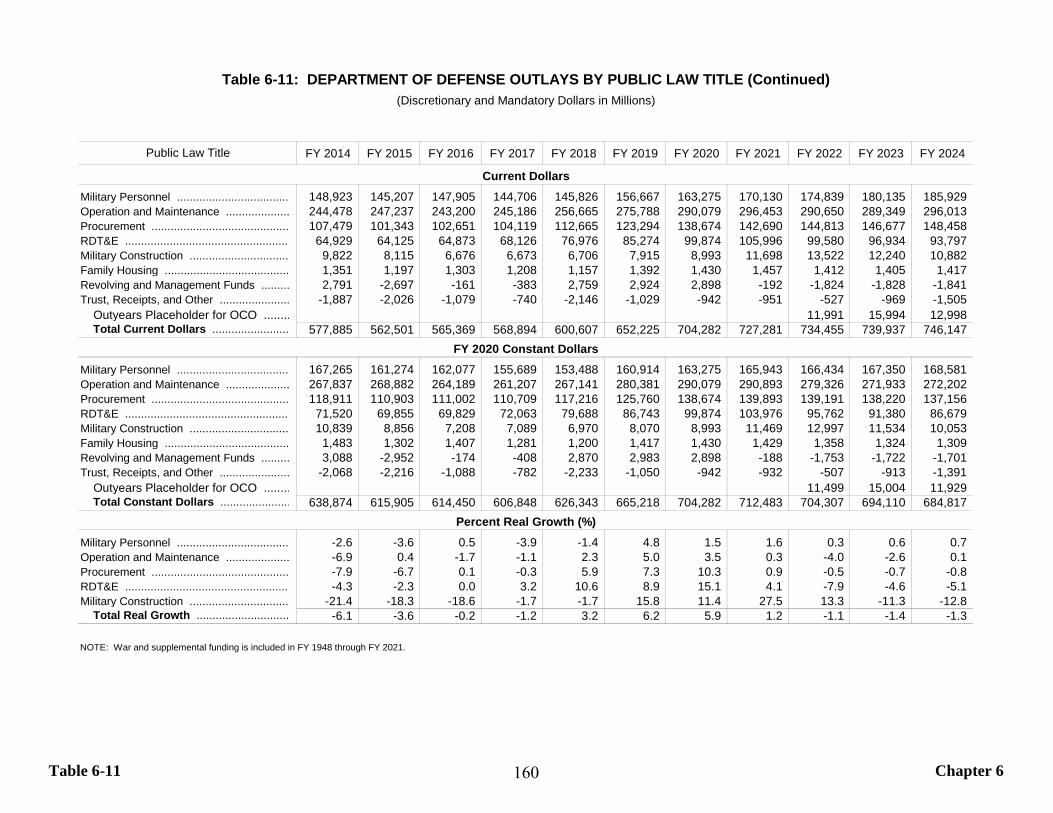
Table 6-11 Chapter 6
FY 2014 FY 2015 FY 2016 FY 2017 FY 2018 FY 2019 FY 2020 FY 2021 FY 2022 FY 2023 FY 2024
Military Personnel ................................... 148,923 145,207 147,905 144,706 145,826 156,667 163,275 170,130 174,839 180,135 185,929 Operation and Maintenance .................... 244,478 247,237 243,200 245,186 256,665 275,788 290,079 296,453 290,650 289,349 296,013 Procurement ........................................... 107,479 101,343 102,651 104,119 112,665 123,294 138,674 142,690 144,813 146,677 148,458 RDT&E .................................................... 64,929 64,125 64,873 68,126 76,976 85,274 99,874 105,996 99,580 96,934 93,797 Military Construction ............................... 9,822 8,115 6,676 6,673 6,706 7,915 8,993 11,698 13,522 12,240 10,882 Family Housing ....................................... 1,351 1,197 1,303 1,208 1,157 1,392 1,430 1,457 1,412 1,405 1,417 Revolving and Management Funds ......... 2,791 -2,697 -161 -383 2,759 2,924 2,898 -192 -1,824 -1,828 -1,841 Trust, Receipts, and Other ...................... -1,887 -2,026 -1,079 -740 -2,146 -1,029 -942 -951 -527 -969 -1,505
Outyears Placeholder for OCO ........ 11,991 15,994 12,998 Total Current Dollars ........................ 577,885 562,501 565,369 568,894 600,607 652,225 704,282 727,281 734,455 739,937 746,147
Military Personnel ................................... 167,265 161,274 162,077 155,689 153,488 160,914 163,275 165,943 166,434 167,350 168,581 Operation and Maintenance .................... 267,837 268,882 264,189 261,207 267,141 280,381 290,079 290,893 279,326 271,933 272,202 Procurement ........................................... 118,911 110,903 111,002 110,709 117,216 125,760 138,674 139,893 139,191 138,220 137,156 RDT&E .................................................... 71,520 69,855 69,829 72,063 79,688 86,743 99,874 103,976 95,762 91,380 86,679 Military Construction ............................... 10,839 8,856 7,208 7,089 6,970 8,070 8,993 11,469 12,997 11,534 10,053 Family Housing ....................................... 1,483 1,302 1,407 1,281 1,200 1,417 1,430 1,429 1,358 1,324 1,309 Revolving and Management Funds ......... 3,088 -2,952 -174 -408 2,870 2,983 2,898 -188 -1,753 -1,722 -1,701 Trust, Receipts, and Other ...................... -2,068 -2,216 -1,088 -782 -2,233 -1,050 -942 -932 -507 -913 -1,391
Outyears Placeholder for OCO ........ 11,499 15,004 11,929 Total Constant Dollars ...................... 638,874 615,905 614,450 606,848 626,343 665,218 704,282 712,483 704,307 694,110 684,817
Military Personnel ................................... -2.6 -3.6 0.5 -3.9 -1.4 4.8 1.5 1.6 0.3 0.6 0.7 Operation and Maintenance .................... -6.9 0.4 -1.7 -1.1 2.3 5.0 3.5 0.3 -4.0 -2.6 0.1 Procurement ........................................... -7.9 -6.7 0.1 -0.3 5.9 7.3 10.3 0.9 -0.5 -0.7 -0.8 RDT&E .................................................... -4.3 -2.3 0.0 3.2 10.6 8.9 15.1 4.1 -7.9 -4.6 -5.1 Military Construction ............................... -21.4 -18.3 -18.6 -1.7 -1.7 15.8 11.4 27.5 13.3 -11.3 -12.8
Total Real Growth ............................. -6.1 -3.6 -0.2 -1.2 3.2 6.2 5.9 1.2 -1.1 -1.4 -1.3
NOTE: War and supplemental funding is included in FY 1948 through FY 2021.
Table 6-11: DEPARTMENT OF DEFENSE OUTLAYS BY PUBLIC LAW TITLE (Continued)
Percent Real Growth (%)
(Discretionary and Mandatory Dollars in Millions)
Public Law Title
Current Dollars
FY 2020 Constant Dollars
160
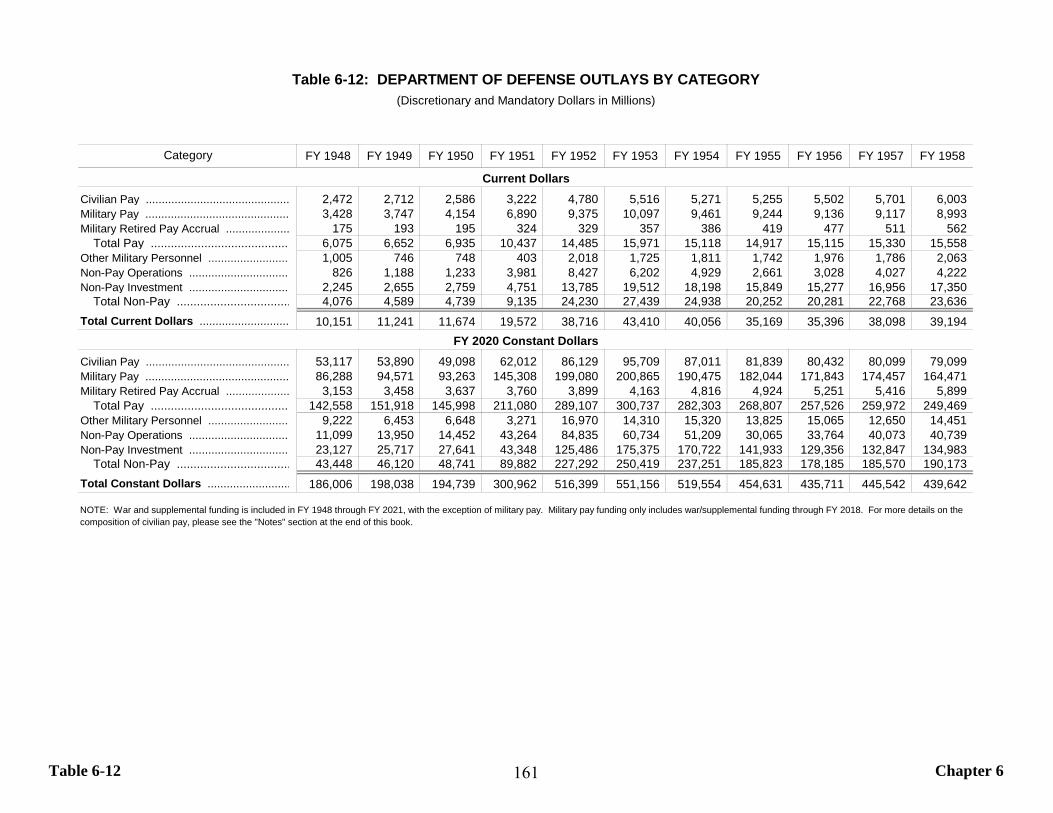
Table 6-12 Chapter 6
FY 1948 FY 1949 FY 1950 FY 1951 FY 1952 FY 1953 FY 1954 FY 1955 FY 1956 FY 1957 FY 1958
Civilian Pay ............................................. 2,472 2,712 2,586 3,222 4,780 5,516 5,271 5,255 5,502 5,701 6,003 Military Pay ............................................. 3,428 3,747 4,154 6,890 9,375 10,097 9,461 9,244 9,136 9,117 8,993 Military Retired Pay Accrual .................... 175 193 195 324 329 357 386 419 477 511 562
Total Pay .......................................... 6,075 6,652 6,935 10,437 14,485 15,971 15,118 14,917 15,115 15,330 15,558 Other Military Personnel .......................... 1,005 746 748 403 2,018 1,725 1,811 1,742 1,976 1,786 2,063 Non-Pay Operations ................................ 826 1,188 1,233 3,981 8,427 6,202 4,929 2,661 3,028 4,027 4,222 Non-Pay Investment ................................ 2,245 2,655 2,759 4,751 13,785 19,512 18,198 15,849 15,277 16,956 17,350
Total Non-Pay .................................. 4,076 4,589 4,739 9,135 24,230 27,439 24,938 20,252 20,281 22,768 23,636 Total Current Dollars ............................ 10,151 11,241 11,674 19,572 38,716 43,410 40,056 35,169 35,396 38,098 39,194
Civilian Pay ............................................. 53,117 53,890 49,098 62,012 86,129 95,709 87,011 81,839 80,432 80,099 79,099 Military Pay ............................................. 86,288 94,571 93,263 145,308 199,080 200,865 190,475 182,044 171,843 174,457 164,471 Military Retired Pay Accrual .................... 3,153 3,458 3,637 3,760 3,899 4,163 4,816 4,924 5,251 5,416 5,899
Total Pay .......................................... 142,558 151,918 145,998 211,080 289,107 300,737 282,303 268,807 257,526 259,972 249,469 Other Military Personnel .......................... 9,222 6,453 6,648 3,271 16,970 14,310 15,320 13,825 15,065 12,650 14,451 Non-Pay Operations ................................ 11,099 13,950 14,452 43,264 84,835 60,734 51,209 30,065 33,764 40,073 40,739 Non-Pay Investment ................................ 23,127 25,717 27,641 43,348 125,486 175,375 170,722 141,933 129,356 132,847 134,983
Total Non-Pay .................................. 43,448 46,120 48,741 89,882 227,292 250,419 237,251 185,823 178,185 185,570 190,173 Total Constant Dollars .......................... 186,006 198,038 194,739 300,962 516,399 551,156 519,554 454,631 435,711 445,542 439,642
NOTE: War and supplemental funding is included in FY 1948 through FY 2021, with the exception of military pay. Military pay funding only includes war/supplemental funding through FY 2018. For more details on the composition of civilian pay, please see the "Notes" section at the end of this book.
Table 6-12: DEPARTMENT OF DEFENSE OUTLAYS BY CATEGORY(Discretionary and Mandatory Dollars in Millions)
Category
Current Dollars
FY 2020 Constant Dollars
161
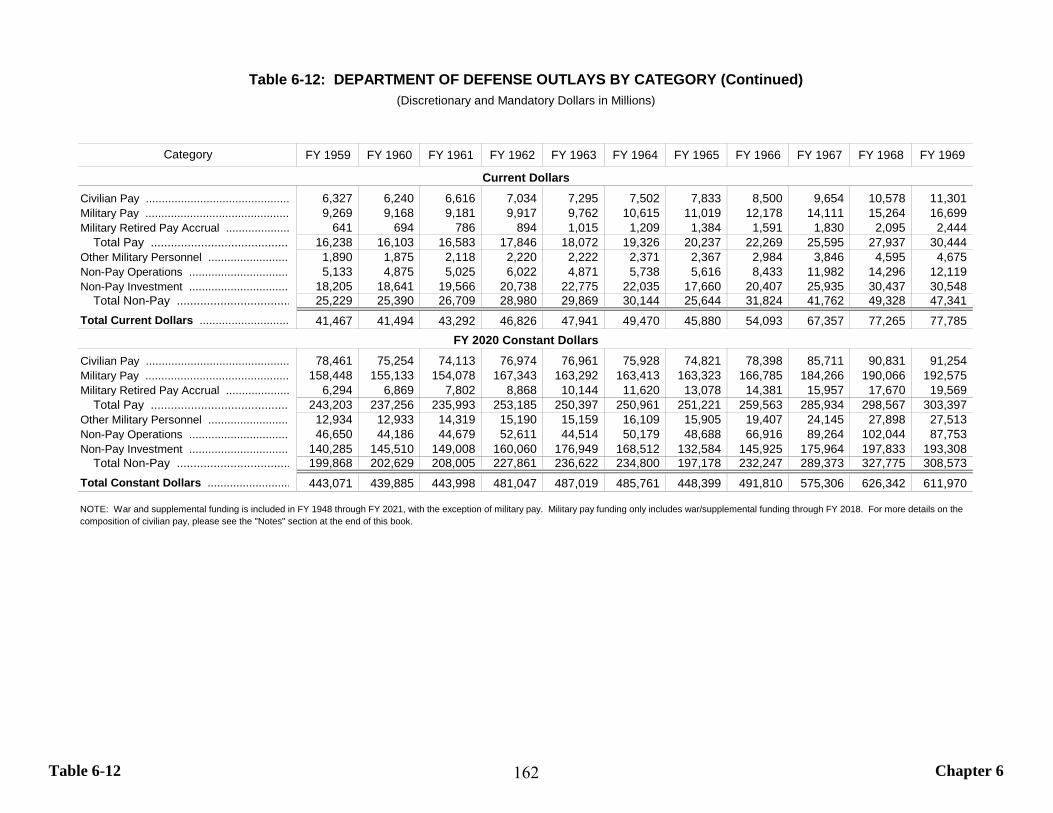
Table 6-12 Chapter 6
FY 1959 FY 1960 FY 1961 FY 1962 FY 1963 FY 1964 FY 1965 FY 1966 FY 1967 FY 1968 FY 1969
Civilian Pay ............................................. 6,327 6,240 6,616 7,034 7,295 7,502 7,833 8,500 9,654 10,578 11,301 Military Pay ............................................. 9,269 9,168 9,181 9,917 9,762 10,615 11,019 12,178 14,111 15,264 16,699 Military Retired Pay Accrual .................... 641 694 786 894 1,015 1,209 1,384 1,591 1,830 2,095 2,444
Total Pay .......................................... 16,238 16,103 16,583 17,846 18,072 19,326 20,237 22,269 25,595 27,937 30,444 Other Military Personnel .......................... 1,890 1,875 2,118 2,220 2,222 2,371 2,367 2,984 3,846 4,595 4,675 Non-Pay Operations ................................ 5,133 4,875 5,025 6,022 4,871 5,738 5,616 8,433 11,982 14,296 12,119 Non-Pay Investment ................................ 18,205 18,641 19,566 20,738 22,775 22,035 17,660 20,407 25,935 30,437 30,548
Total Non-Pay .................................. 25,229 25,390 26,709 28,980 29,869 30,144 25,644 31,824 41,762 49,328 47,341 Total Current Dollars ............................ 41,467 41,494 43,292 46,826 47,941 49,470 45,880 54,093 67,357 77,265 77,785
Civilian Pay ............................................. 78,461 75,254 74,113 76,974 76,961 75,928 74,821 78,398 85,711 90,831 91,254 Military Pay ............................................. 158,448 155,133 154,078 167,343 163,292 163,413 163,323 166,785 184,266 190,066 192,575 Military Retired Pay Accrual .................... 6,294 6,869 7,802 8,868 10,144 11,620 13,078 14,381 15,957 17,670 19,569
Total Pay .......................................... 243,203 237,256 235,993 253,185 250,397 250,961 251,221 259,563 285,934 298,567 303,397 Other Military Personnel .......................... 12,934 12,933 14,319 15,190 15,159 16,109 15,905 19,407 24,145 27,898 27,513 Non-Pay Operations ................................ 46,650 44,186 44,679 52,611 44,514 50,179 48,688 66,916 89,264 102,044 87,753 Non-Pay Investment ................................ 140,285 145,510 149,008 160,060 176,949 168,512 132,584 145,925 175,964 197,833 193,308
Total Non-Pay .................................. 199,868 202,629 208,005 227,861 236,622 234,800 197,178 232,247 289,373 327,775 308,573 Total Constant Dollars .......................... 443,071 439,885 443,998 481,047 487,019 485,761 448,399 491,810 575,306 626,342 611,970
NOTE: War and supplemental funding is included in FY 1948 through FY 2021, with the exception of military pay. Military pay funding only includes war/supplemental funding through FY 2018. For more details on the composition of civilian pay, please see the "Notes" section at the end of this book.
Table 6-12: DEPARTMENT OF DEFENSE OUTLAYS BY CATEGORY (Continued)(Discretionary and Mandatory Dollars in Millions)
Category
Current Dollars
FY 2020 Constant Dollars
162

Table 6-12 Chapter 6
FY 1970 FY 1971 FY 1972 FY 1973 FY 1974 FY 1975 FY 1976 FY 1977 FY 1978 FY 1979 FY 1980
Civilian Pay ............................................. 12,204 12,504 13,222 13,574 14,137 15,334 16,418 17,549 18,854 20,494 22,262 Military Pay ............................................. 18,638 18,676 19,762 20,494 21,013 21,573 21,885 22,598 23,815 25,084 26,854 Military Retired Pay Accrual .................... 2,849 3,386 3,885 4,390 5,128 6,242 7,296 8,216 9,171 10,279 11,920
Total Pay .......................................... 33,691 34,566 36,868 38,458 40,278 43,148 45,599 48,364 51,840 55,857 61,035 Other Military Personnel .......................... 4,393 3,956 3,274 2,752 2,715 3,395 3,178 3,117 3,260 3,323 3,988 Non-Pay Operations ................................ 11,400 10,918 11,114 9,314 11,517 14,043 14,316 16,581 17,989 18,413 24,543 Non-Pay Investment ................................ 27,586 25,032 23,820 22,699 23,041 24,314 24,798 27,495 29,953 37,420 43,274
Total Non-Pay .................................. 43,379 39,906 38,208 34,765 37,272 41,752 42,293 47,194 51,202 59,156 71,805 Total Current Dollars ............................ 77,070 74,472 75,076 73,223 77,550 84,900 87,891 95,557 103,042 115,013 132,840
Civilian Pay ............................................. 88,263 83,225 81,287 78,675 75,250 75,507 74,752 73,465 73,071 75,002 76,261 Military Pay ............................................. 187,052 173,330 157,509 145,437 139,716 134,664 129,790 126,904 125,039 124,417 124,322 Military Retired Pay Accrual .................... 21,221 22,795 24,523 26,123 27,824 29,685 31,248 33,224 34,495 35,710 36,945
Total Pay .......................................... 296,536 279,351 263,319 250,235 242,791 239,856 235,790 233,593 232,604 235,129 237,528 Other Military Personnel .......................... 24,874 21,429 17,078 13,783 12,838 13,954 12,153 11,016 10,757 10,052 10,906 Non-Pay Operations ................................ 79,999 72,101 72,455 60,331 65,239 69,662 65,309 69,648 69,641 66,629 69,332 Non-Pay Investment ................................ 168,207 145,724 132,426 121,297 115,600 107,752 102,251 105,004 106,676 122,760 127,624
Total Non-Pay .................................. 273,080 239,254 221,959 195,411 193,677 191,368 179,712 185,668 187,074 199,441 207,862 Total Constant Dollars .......................... 569,616 518,604 485,278 445,646 436,468 431,224 415,502 419,261 419,678 434,570 445,390
NOTE: War and supplemental funding is included in FY 1948 through FY 2021, with the exception of military pay. Military pay funding only includes war/supplemental funding through FY 2018. For more details on the composition of civilian pay, please see the "Notes" section at the end of this book.
Table 6-12: DEPARTMENT OF DEFENSE OUTLAYS BY CATEGORY (Continued)(Discretionary and Mandatory Dollars in Millions)
Category
Current Dollars
FY 2020 Constant Dollars
163
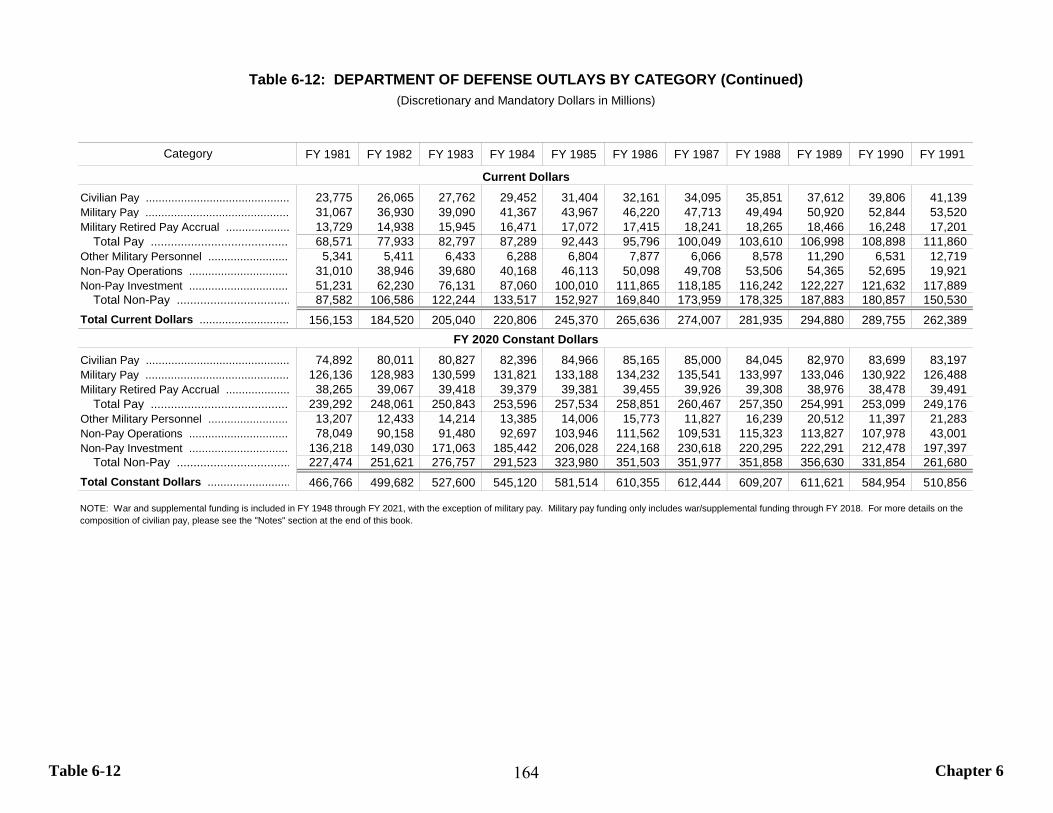
Table 6-12 Chapter 6
FY 1981 FY 1982 FY 1983 FY 1984 FY 1985 FY 1986 FY 1987 FY 1988 FY 1989 FY 1990 FY 1991
Civilian Pay ............................................. 23,775 26,065 27,762 29,452 31,404 32,161 34,095 35,851 37,612 39,806 41,139 Military Pay ............................................. 31,067 36,930 39,090 41,367 43,967 46,220 47,713 49,494 50,920 52,844 53,520 Military Retired Pay Accrual .................... 13,729 14,938 15,945 16,471 17,072 17,415 18,241 18,265 18,466 16,248 17,201
Total Pay .......................................... 68,571 77,933 82,797 87,289 92,443 95,796 100,049 103,610 106,998 108,898 111,860 Other Military Personnel .......................... 5,341 5,411 6,433 6,288 6,804 7,877 6,066 8,578 11,290 6,531 12,719 Non-Pay Operations ................................ 31,010 38,946 39,680 40,168 46,113 50,098 49,708 53,506 54,365 52,695 19,921 Non-Pay Investment ................................ 51,231 62,230 76,131 87,060 100,010 111,865 118,185 116,242 122,227 121,632 117,889
Total Non-Pay .................................. 87,582 106,586 122,244 133,517 152,927 169,840 173,959 178,325 187,883 180,857 150,530 Total Current Dollars ............................ 156,153 184,520 205,040 220,806 245,370 265,636 274,007 281,935 294,880 289,755 262,389
Civilian Pay ............................................. 74,892 80,011 80,827 82,396 84,966 85,165 85,000 84,045 82,970 83,699 83,197 Military Pay ............................................. 126,136 128,983 130,599 131,821 133,188 134,232 135,541 133,997 133,046 130,922 126,488 Military Retired Pay Accrual .................... 38,265 39,067 39,418 39,379 39,381 39,455 39,926 39,308 38,976 38,478 39,491
Total Pay .......................................... 239,292 248,061 250,843 253,596 257,534 258,851 260,467 257,350 254,991 253,099 249,176 Other Military Personnel .......................... 13,207 12,433 14,214 13,385 14,006 15,773 11,827 16,239 20,512 11,397 21,283 Non-Pay Operations ................................ 78,049 90,158 91,480 92,697 103,946 111,562 109,531 115,323 113,827 107,978 43,001 Non-Pay Investment ................................ 136,218 149,030 171,063 185,442 206,028 224,168 230,618 220,295 222,291 212,478 197,397
Total Non-Pay .................................. 227,474 251,621 276,757 291,523 323,980 351,503 351,977 351,858 356,630 331,854 261,680 Total Constant Dollars .......................... 466,766 499,682 527,600 545,120 581,514 610,355 612,444 609,207 611,621 584,954 510,856
NOTE: War and supplemental funding is included in FY 1948 through FY 2021, with the exception of military pay. Military pay funding only includes war/supplemental funding through FY 2018. For more details on the composition of civilian pay, please see the "Notes" section at the end of this book.
Table 6-12: DEPARTMENT OF DEFENSE OUTLAYS BY CATEGORY (Continued)(Discretionary and Mandatory Dollars in Millions)
Category
Current Dollars
FY 2020 Constant Dollars
164

Table 6-12 Chapter 6
FY 1992 FY 1993 FY 1994 FY 1995 FY 1996 FY 1997 FY 1998 FY 1999 FY 2000 FY 2001 FY 2002
Civilian Pay ............................................. 41,779 44,168 43,580 43,559 43,031 42,740 41,255 41,226 41,932 43,241 45,864 Military Pay ............................................. 54,084 52,377 49,235 49,400 49,238 49,146 44,007 44,722 43,585 45,619 48,698 Military Retired Pay Accrual .................... 15,913 13,029 12,277 12,123 11,153 11,070 10,380 10,454 11,366 11,308 13,355
Total Pay .......................................... 111,776 109,574 105,093 105,082 103,422 102,957 95,642 96,403 96,883 100,168 107,916 Other Military Personnel .......................... 11,174 10,498 11,624 10,327 6,278 9,506 14,590 14,326 20,999 17,049 24,749 Non-Pay Operations ................................ 52,490 50,330 53,506 51,379 53,918 57,529 56,631 61,956 71,952 76,647 90,674 Non-Pay Investment ................................ 111,521 108,186 98,413 93,820 89,640 88,339 89,274 88,694 91,400 97,115 108,777
Total Non-Pay .................................. 175,185 169,014 163,542 155,526 149,836 155,373 160,494 164,976 184,351 190,812 224,200 Total Current Dollars ............................ 286,962 278,588 268,635 260,608 253,258 258,330 256,136 261,379 281,234 290,980 332,116
Civilian Pay ............................................. 81,108 82,587 79,473 77,520 74,787 72,117 67,715 65,317 63,392 63,039 63,921 Military Pay ............................................. 123,508 114,008 104,480 102,273 99,548 96,467 84,027 82,426 76,650 77,365 77,256 Military Retired Pay Accrual .................... 35,936 28,359 26,053 25,098 22,549 21,730 19,819 19,268 19,989 19,177 21,187
Total Pay .......................................... 240,551 224,954 210,005 204,891 196,883 190,315 171,562 167,011 160,031 159,581 162,364 Other Military Personnel .......................... 18,153 16,656 18,080 15,763 9,395 13,974 21,298 20,747 29,991 23,896 34,413 Non-Pay Operations ................................ 96,426 99,837 103,269 98,237 99,904 102,404 99,103 106,950 121,474 124,452 144,895 Non-Pay Investment ................................ 181,379 171,828 153,242 143,335 134,223 129,942 130,388 128,524 130,633 136,172 151,312
Total Non-Pay .................................. 295,959 288,321 274,591 257,335 243,521 246,320 250,789 256,220 282,098 284,520 330,620 Total Constant Dollars .......................... 536,510 513,275 484,596 462,227 440,404 436,634 422,351 423,231 442,129 444,101 492,984
NOTE: War and supplemental funding is included in FY 1948 through FY 2021, with the exception of military pay. Military pay funding only includes war/supplemental funding through FY 2018. For more details on the composition of civilian pay, please see the "Notes" section at the end of this book.
Table 6-12: DEPARTMENT OF DEFENSE OUTLAYS BY CATEGORY (Continued)(Discretionary and Mandatory Dollars in Millions)
Category
Current Dollars
FY 2020 Constant Dollars
165
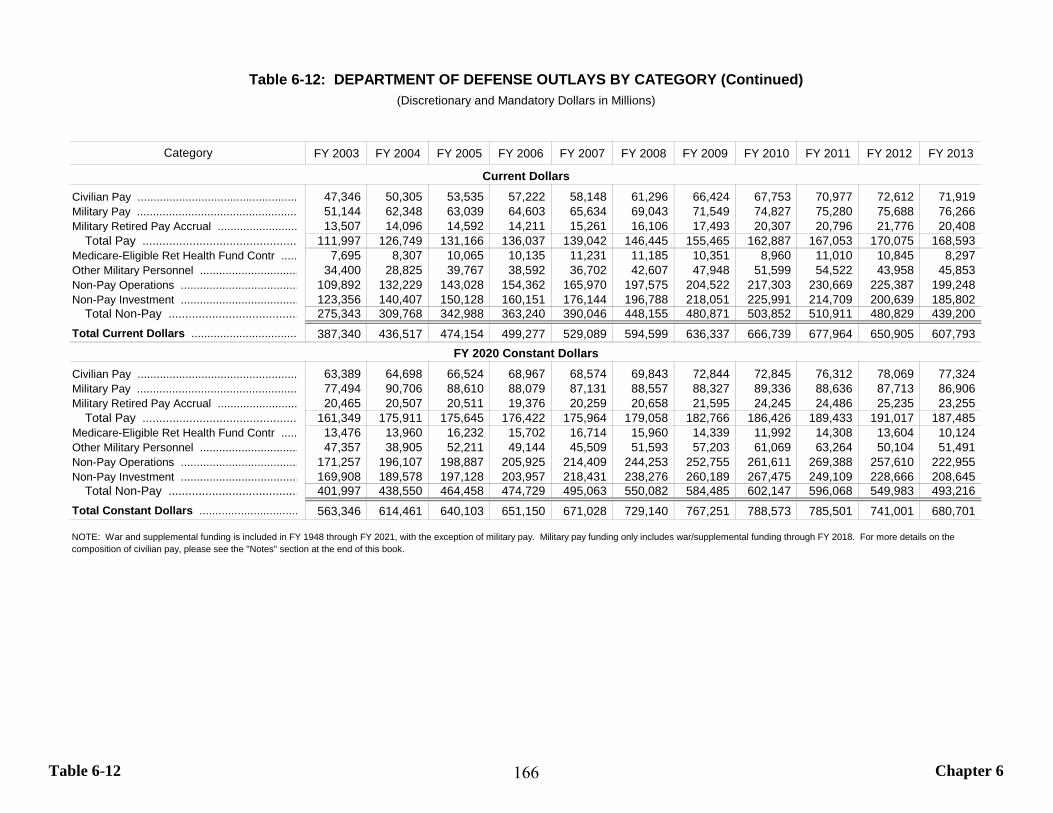
Table 6-12 Chapter 6
FY 2003 FY 2004 FY 2005 FY 2006 FY 2007 FY 2008 FY 2009 FY 2010 FY 2011 FY 2012 FY 2013
Civilian Pay .................................................. 47,346 50,305 53,535 57,222 58,148 61,296 66,424 67,753 70,977 72,612 71,919 Military Pay .................................................. 51,144 62,348 63,039 64,603 65,634 69,043 71,549 74,827 75,280 75,688 76,266 Military Retired Pay Accrual ......................... 13,507 14,096 14,592 14,211 15,261 16,106 17,493 20,307 20,796 21,776 20,408
Total Pay .............................................. 111,997 126,749 131,166 136,037 139,042 146,445 155,465 162,887 167,053 170,075 168,593 Medicare-Eligible Ret Health Fund Contr ..... 7,695 8,307 10,065 10,135 11,231 11,185 10,351 8,960 11,010 10,845 8,297 Other Military Personnel ............................... 34,400 28,825 39,767 38,592 36,702 42,607 47,948 51,599 54,522 43,958 45,853 Non-Pay Operations ..................................... 109,892 132,229 143,028 154,362 165,970 197,575 204,522 217,303 230,669 225,387 199,248 Non-Pay Investment ..................................... 123,356 140,407 150,128 160,151 176,144 196,788 218,051 225,991 214,709 200,639 185,802
Total Non-Pay ....................................... 275,343 309,768 342,988 363,240 390,046 448,155 480,871 503,852 510,911 480,829 439,200 Total Current Dollars ................................. 387,340 436,517 474,154 499,277 529,089 594,599 636,337 666,739 677,964 650,905 607,793
Civilian Pay .................................................. 63,389 64,698 66,524 68,967 68,574 69,843 72,844 72,845 76,312 78,069 77,324 Military Pay .................................................. 77,494 90,706 88,610 88,079 87,131 88,557 88,327 89,336 88,636 87,713 86,906 Military Retired Pay Accrual ......................... 20,465 20,507 20,511 19,376 20,259 20,658 21,595 24,245 24,486 25,235 23,255
Total Pay .............................................. 161,349 175,911 175,645 176,422 175,964 179,058 182,766 186,426 189,433 191,017 187,485 Medicare-Eligible Ret Health Fund Contr ..... 13,476 13,960 16,232 15,702 16,714 15,960 14,339 11,992 14,308 13,604 10,124 Other Military Personnel ............................... 47,357 38,905 52,211 49,144 45,509 51,593 57,203 61,069 63,264 50,104 51,491 Non-Pay Operations ..................................... 171,257 196,107 198,887 205,925 214,409 244,253 252,755 261,611 269,388 257,610 222,955 Non-Pay Investment ..................................... 169,908 189,578 197,128 203,957 218,431 238,276 260,189 267,475 249,109 228,666 208,645
Total Non-Pay ....................................... 401,997 438,550 464,458 474,729 495,063 550,082 584,485 602,147 596,068 549,983 493,216 Total Constant Dollars ............................... 563,346 614,461 640,103 651,150 671,028 729,140 767,251 788,573 785,501 741,001 680,701
NOTE: War and supplemental funding is included in FY 1948 through FY 2021, with the exception of military pay. Military pay funding only includes war/supplemental funding through FY 2018. For more details on the composition of civilian pay, please see the "Notes" section at the end of this book.
Table 6-12: DEPARTMENT OF DEFENSE OUTLAYS BY CATEGORY (Continued)(Discretionary and Mandatory Dollars in Millions)
Category
Current Dollars
FY 2020 Constant Dollars
166
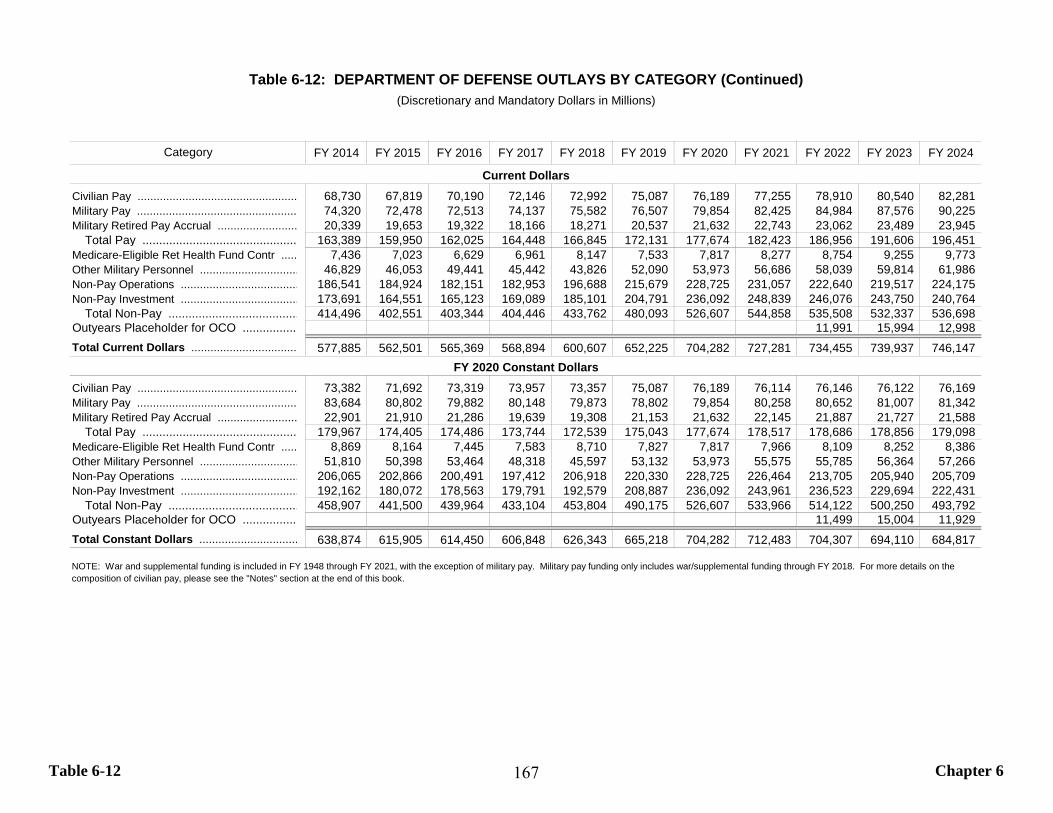
Table 6-12 Chapter 6
FY 2014 FY 2015 FY 2016 FY 2017 FY 2018 FY 2019 FY 2020 FY 2021 FY 2022 FY 2023 FY 2024
Civilian Pay .................................................. 68,730 67,819 70,190 72,146 72,992 75,087 76,189 77,255 78,910 80,540 82,281 Military Pay .................................................. 74,320 72,478 72,513 74,137 75,582 76,507 79,854 82,425 84,984 87,576 90,225 Military Retired Pay Accrual ......................... 20,339 19,653 19,322 18,166 18,271 20,537 21,632 22,743 23,062 23,489 23,945
Total Pay .............................................. 163,389 159,950 162,025 164,448 166,845 172,131 177,674 182,423 186,956 191,606 196,451 Medicare-Eligible Ret Health Fund Contr ..... 7,436 7,023 6,629 6,961 8,147 7,533 7,817 8,277 8,754 9,255 9,773 Other Military Personnel ............................... 46,829 46,053 49,441 45,442 43,826 52,090 53,973 56,686 58,039 59,814 61,986 Non-Pay Operations ..................................... 186,541 184,924 182,151 182,953 196,688 215,679 228,725 231,057 222,640 219,517 224,175 Non-Pay Investment ..................................... 173,691 164,551 165,123 169,089 185,101 204,791 236,092 248,839 246,076 243,750 240,764
Total Non-Pay ....................................... 414,496 402,551 403,344 404,446 433,762 480,093 526,607 544,858 535,508 532,337 536,698 Outyears Placeholder for OCO ................. 11,991 15,994 12,998 Total Current Dollars ................................. 577,885 562,501 565,369 568,894 600,607 652,225 704,282 727,281 734,455 739,937 746,147
Civilian Pay .................................................. 73,382 71,692 73,319 73,957 73,357 75,087 76,189 76,114 76,146 76,122 76,169 Military Pay .................................................. 83,684 80,802 79,882 80,148 79,873 78,802 79,854 80,258 80,652 81,007 81,342 Military Retired Pay Accrual ......................... 22,901 21,910 21,286 19,639 19,308 21,153 21,632 22,145 21,887 21,727 21,588
Total Pay .............................................. 179,967 174,405 174,486 173,744 172,539 175,043 177,674 178,517 178,686 178,856 179,098 Medicare-Eligible Ret Health Fund Contr ..... 8,869 8,164 7,445 7,583 8,710 7,827 7,817 7,966 8,109 8,252 8,386 Other Military Personnel ............................... 51,810 50,398 53,464 48,318 45,597 53,132 53,973 55,575 55,785 56,364 57,266 Non-Pay Operations ..................................... 206,065 202,866 200,491 197,412 206,918 220,330 228,725 226,464 213,705 205,940 205,709 Non-Pay Investment ..................................... 192,162 180,072 178,563 179,791 192,579 208,887 236,092 243,961 236,523 229,694 222,431
Total Non-Pay ....................................... 458,907 441,500 439,964 433,104 453,804 490,175 526,607 533,966 514,122 500,250 493,792 Outyears Placeholder for OCO ................. 11,499 15,004 11,929 Total Constant Dollars ............................... 638,874 615,905 614,450 606,848 626,343 665,218 704,282 712,483 704,307 694,110 684,817
NOTE: War and supplemental funding is included in FY 1948 through FY 2021, with the exception of military pay. Military pay funding only includes war/supplemental funding through FY 2018. For more details on the composition of civilian pay, please see the "Notes" section at the end of this book.
Table 6-12: DEPARTMENT OF DEFENSE OUTLAYS BY CATEGORY (Continued)(Discretionary and Mandatory Dollars in Millions)
Category
FY 2020 Constant Dollars
Current Dollars
167

Table 6-13 Chapter 6
FY 1948 FY 1949 FY 1950 FY 1951 FY 1952 FY 1953 FY 1954 FY 1955 FY 1956 FY 1957 FY 1958
Army ....................................................... 3,396 3,488 3,916 7,395 15,561 16,249 12,828 8,788 8,588 8,972 9,131 Navy ........................................................ 3,845 3,952 4,035 5,528 10,112 11,616 11,208 9,694 9,641 10,318 11,009 Air Force ................................................. 2,735 3,601 3,519 6,287 12,650 15,137 15,588 16,227 16,613 18,235 18,411 Defense-Wide ......................................... 175 200 204 362 393 408 432 461 553 572 644
Total Current Dollars ........................ 10,151 11,241 11,674 19,572 38,716 43,410 40,056 35,169 35,396 38,098 39,194
Army ....................................................... 66,716 69,418 67,939 117,588 205,465 205,355 171,354 128,866 117,574 118,582 114,657 Navy ........................................................ 68,820 67,600 66,791 88,984 141,613 156,479 151,986 130,842 125,203 127,385 128,099 Air Force ................................................. 47,312 57,469 56,216 90,223 164,778 184,629 190,920 189,575 187,016 193,644 190,331 Defense-Wide ......................................... 3,158 3,551 3,793 4,167 4,542 4,693 5,294 5,347 5,918 5,930 6,554
Total Constant Dollars ...................... 186,006 198,038 194,739 300,962 516,399 551,156 519,554 454,631 435,711 445,542 439,642
Army ....................................................... 4.1 -2.1 73.1 74.7 -0.1 -16.6 -24.8 -8.8 0.9 -3.3 Navy ........................................................ -1.8 -1.2 33.2 59.1 10.5 -2.9 -13.9 -4.3 1.7 0.6 Air Force ................................................. 21.5 -2.2 60.5 82.6 12.0 3.4 -0.7 -1.3 3.5 -1.7
Total Real Growth ............................. 6.5 -1.7 54.5 71.6 6.7 -5.7 -12.5 -4.2 2.3 -1.3
NOTE: War and supplemental funding is included in FY 1948 through FY 2021.
FY 2020 Constant Dollars
Percent Real Growth (%)
Table 6-13: DEPARTMENT OF DEFENSE OUTLAYS BY MILITARY DEPARTMENT(Discretionary and Mandatory Dollars in Millions)
Military Department
Current Dollars
168

Table 6-13 Chapter 6
FY 1959 FY 1960 FY 1961 FY 1962 FY 1963 FY 1964 FY 1965 FY 1966 FY 1967 FY 1968 FY 1969
Army ....................................................... 9,533 9,453 10,145 11,248 11,476 12,011 11,552 14,732 20,958 25,222 25,033 Navy ........................................................ 11,835 11,726 12,234 13,191 13,973 14,466 13,339 15,962 19,246 22,072 22,505 Air Force ................................................. 19,249 19,289 19,804 20,790 20,610 20,456 18,146 20,065 22,912 25,734 25,892 Defense-Wide ......................................... 849 1,025 1,109 1,597 1,883 2,537 2,843 3,335 4,241 4,237 4,355
Total Current Dollars ........................ 41,467 41,494 43,292 46,826 47,941 49,470 45,880 54,093 67,357 77,265 77,785
Army ....................................................... 112,430 110,059 112,768 125,110 123,804 123,929 117,870 137,151 179,490 203,852 196,837 Navy ........................................................ 132,319 130,949 132,129 141,737 149,005 147,762 134,905 147,946 167,326 181,071 179,160 Air Force ................................................. 190,531 189,648 189,045 200,188 197,138 192,311 171,605 179,422 195,512 208,800 203,329 Defense-Wide ......................................... 7,791 9,229 10,056 14,012 17,072 21,758 24,018 27,290 32,979 32,620 32,643
Total Constant Dollars ...................... 443,071 439,885 443,998 481,047 487,019 485,761 448,399 491,810 575,306 626,342 611,970
Army ....................................................... -1.9 -2.1 2.5 10.9 -1.0 0.1 -4.9 16.4 30.9 13.6 -3.4 Navy ........................................................ 3.3 -1.0 0.9 7.3 5.1 -0.8 -8.7 9.7 13.1 8.2 -1.1 Air Force ................................................. 0.1 -0.5 -0.3 5.9 -1.5 -2.4 -10.8 4.6 9.0 6.8 -2.6
Total Real Growth ............................. 0.8 -0.7 0.9 8.3 1.2 -0.3 -7.7 9.7 17.0 8.9 -2.3
NOTE: War and supplemental funding is included in FY 1948 through FY 2021.
FY 2020 Constant Dollars
Percent Real Growth (%)
Table 6-13: DEPARTMENT OF DEFENSE OUTLAYS BY MILITARY DEPARTMENT (Continued)(Discretionary and Mandatory Dollars in Millions)
Military Department
Current Dollars
169
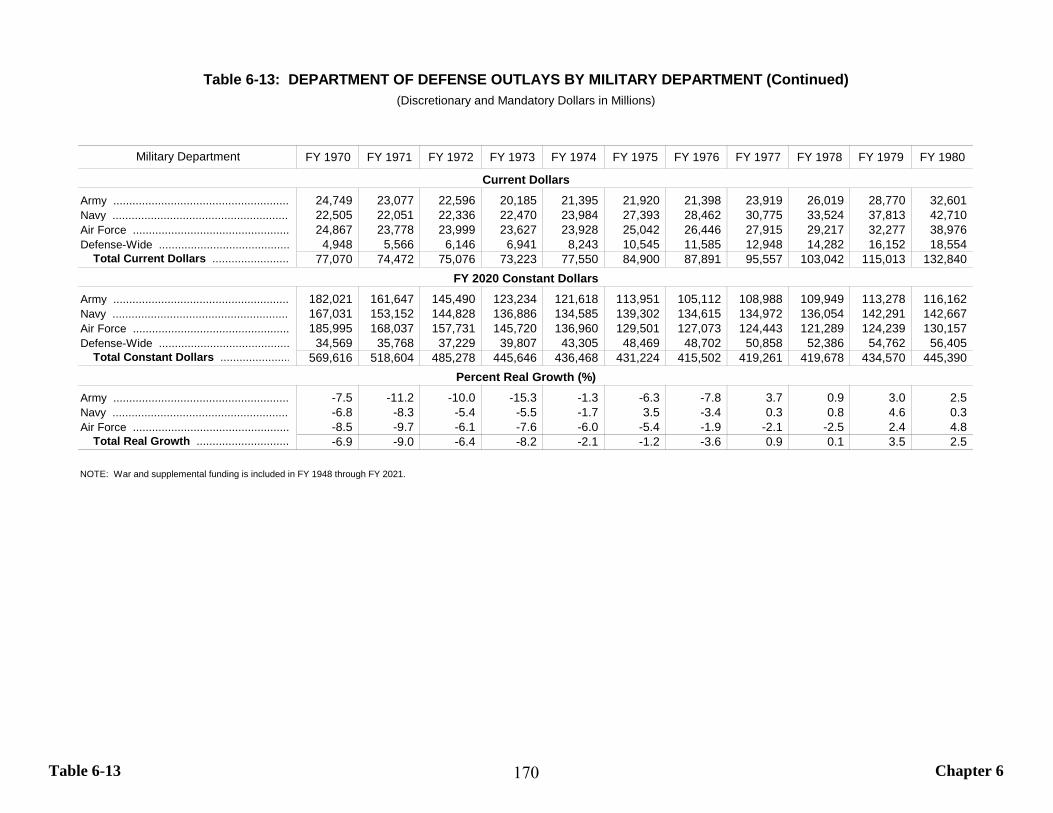
Table 6-13 Chapter 6
FY 1970 FY 1971 FY 1972 FY 1973 FY 1974 FY 1975 FY 1976 FY 1977 FY 1978 FY 1979 FY 1980
Army ....................................................... 24,749 23,077 22,596 20,185 21,395 21,920 21,398 23,919 26,019 28,770 32,601 Navy ........................................................ 22,505 22,051 22,336 22,470 23,984 27,393 28,462 30,775 33,524 37,813 42,710 Air Force ................................................. 24,867 23,778 23,999 23,627 23,928 25,042 26,446 27,915 29,217 32,277 38,976 Defense-Wide ......................................... 4,948 5,566 6,146 6,941 8,243 10,545 11,585 12,948 14,282 16,152 18,554
Total Current Dollars ........................ 77,070 74,472 75,076 73,223 77,550 84,900 87,891 95,557 103,042 115,013 132,840
Army ....................................................... 182,021 161,647 145,490 123,234 121,618 113,951 105,112 108,988 109,949 113,278 116,162 Navy ........................................................ 167,031 153,152 144,828 136,886 134,585 139,302 134,615 134,972 136,054 142,291 142,667 Air Force ................................................. 185,995 168,037 157,731 145,720 136,960 129,501 127,073 124,443 121,289 124,239 130,157 Defense-Wide ......................................... 34,569 35,768 37,229 39,807 43,305 48,469 48,702 50,858 52,386 54,762 56,405
Total Constant Dollars ...................... 569,616 518,604 485,278 445,646 436,468 431,224 415,502 419,261 419,678 434,570 445,390
Army ....................................................... -7.5 -11.2 -10.0 -15.3 -1.3 -6.3 -7.8 3.7 0.9 3.0 2.5 Navy ........................................................ -6.8 -8.3 -5.4 -5.5 -1.7 3.5 -3.4 0.3 0.8 4.6 0.3 Air Force ................................................. -8.5 -9.7 -6.1 -7.6 -6.0 -5.4 -1.9 -2.1 -2.5 2.4 4.8
Total Real Growth ............................. -6.9 -9.0 -6.4 -8.2 -2.1 -1.2 -3.6 0.9 0.1 3.5 2.5
NOTE: War and supplemental funding is included in FY 1948 through FY 2021.
FY 2020 Constant Dollars
Percent Real Growth (%)
Table 6-13: DEPARTMENT OF DEFENSE OUTLAYS BY MILITARY DEPARTMENT (Continued)(Discretionary and Mandatory Dollars in Millions)
Military Department
Current Dollars
170

Table 6-13 Chapter 6
FY 1981 FY 1982 FY 1983 FY 1984 FY 1985 FY 1986 FY 1987 FY 1988 FY 1989 FY 1990 FY 1991
Army ....................................................... 37,620 45,281 51,520 55,655 66,708 71,107 73,855 77,427 80,121 78,213 90,654 Navy ........................................................ 50,482 59,242 67,402 70,920 84,197 88,492 90,813 94,570 101,171 97,725 102,180 Air Force ................................................. 45,157 55,676 62,894 68,620 81,988 91,188 91,144 93,060 94,676 93,546 94,510 Defense-Wide ......................................... 22,895 24,321 23,224 25,611 12,476 14,848 18,195 16,878 18,912 20,272 -24,954
Total Current Dollars ........................ 156,153 184,520 205,040 220,806 245,370 265,636 274,007 281,935 294,880 289,755 262,389
Army ....................................................... 119,786 129,259 138,313 142,646 162,533 167,470 169,185 170,419 169,211 161,137 175,444 Navy ........................................................ 150,053 159,322 171,845 174,084 198,593 203,348 202,915 204,190 209,296 197,161 195,226 Air Force ................................................. 134,640 148,605 159,946 167,499 192,497 207,475 202,712 200,690 196,946 189,494 179,849 Defense-Wide ......................................... 62,286 62,497 57,497 60,890 27,891 32,062 37,632 33,908 36,168 37,161 -39,664
Total Constant Dollars ...................... 466,766 499,682 527,600 545,120 581,514 610,355 612,444 609,207 611,621 584,954 510,856
Army ....................................................... 3.1 7.9 7.0 3.1 13.9 3.0 1.0 0.7 -0.7 -4.8 8.9 Navy ........................................................ 5.2 6.2 7.9 1.3 14.1 2.4 -0.2 0.6 2.5 -5.8 -1.0 Air Force ................................................. 3.4 10.4 7.6 4.7 14.9 7.8 -2.3 -1.0 -1.9 -3.8 -5.1
Total Real Growth ............................. 4.8 7.1 5.6 3.3 6.7 5.0 0.3 -0.5 0.4 -4.4 -12.7
NOTE: War and supplemental funding is included in FY 1948 through FY 2021.
FY 2020 Constant Dollars
Percent Real Growth (%)
Table 6-13: DEPARTMENT OF DEFENSE OUTLAYS BY MILITARY DEPARTMENT (Continued)(Discretionary and Mandatory Dollars in Millions)
Military Department
Current Dollars
171

Table 6-13 Chapter 6
FY 1992 FY 1993 FY 1994 FY 1995 FY 1996 FY 1997 FY 1998 FY 1999 FY 2000 FY 2001 FY 2002
Army ....................................................... 79,501 72,584 65,350 64,079 61,682 64,857 64,586 65,773 70,617 73,854 83,324 Navy ........................................................ 96,858 94,914 85,927 85,910 79,587 82,098 78,047 78,598 87,204 90,444 98,547 Air Force ................................................. 85,019 83,802 80,289 76,799 75,378 76,622 77,906 79,158 82,092 84,827 95,561 Defense-Wide ......................................... 25,583 27,289 37,069 33,820 36,610 34,753 35,597 37,850 41,321 41,855 54,683
Total Current Dollars ........................ 286,962 278,588 268,635 260,608 253,258 258,330 256,136 261,379 281,234 290,980 332,116
Army ....................................................... 152,612 134,352 119,363 114,726 108,169 110,079 106,333 105,632 109,701 111,273 121,486 Navy ........................................................ 181,621 172,509 152,471 148,978 136,096 136,313 126,808 126,002 135,117 135,652 144,165 Air Force ................................................. 158,994 150,984 141,776 134,489 128,882 127,376 125,993 126,066 127,585 127,215 140,094 Defense-Wide ......................................... 43,283 55,429 70,986 64,034 67,258 62,866 63,217 65,531 69,725 69,961 87,239
Total Constant Dollars ...................... 536,510 513,275 484,596 462,227 440,404 436,634 422,351 423,231 442,129 444,101 492,984
Army ....................................................... -13.0 -12.0 -11.2 -3.9 -5.7 1.8 -3.4 -0.7 3.9 1.4 9.2 Navy ........................................................ -7.0 -5.0 -11.6 -2.3 -8.6 0.2 -7.0 -0.6 7.2 0.4 6.3 Air Force ................................................. -11.6 -5.0 -6.1 -5.1 -4.2 -1.2 -1.1 0.1 1.2 -0.3 10.1
Total Real Growth ............................. 5.0 -4.3 -5.6 -4.6 -4.7 -0.9 -3.3 0.2 4.5 0.4 11.0
NOTE: War and supplemental funding is included in FY 1948 through FY 2021.
FY 2020 Constant Dollars
Percent Real Growth (%)
Table 6-13: DEPARTMENT OF DEFENSE OUTLAYS BY MILITARY DEPARTMENT (Continued)(Discretionary and Mandatory Dollars in Millions)
Military Department
Current Dollars
172
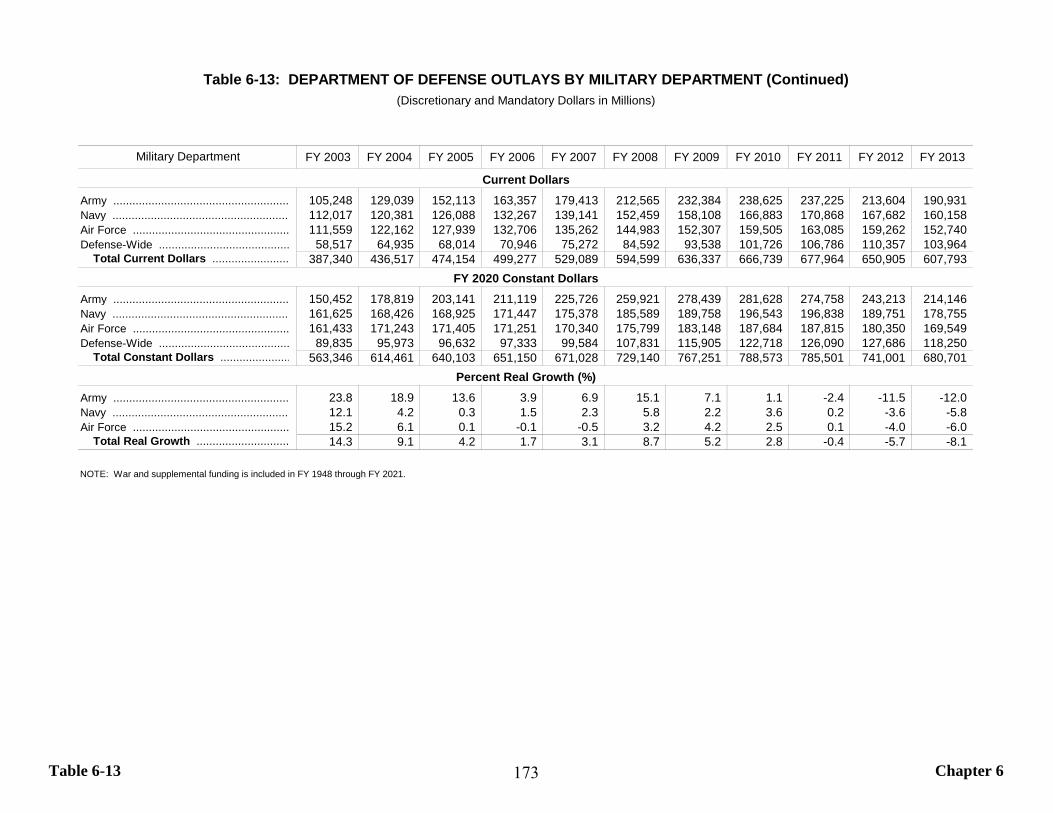
Table 6-13 Chapter 6
FY 2003 FY 2004 FY 2005 FY 2006 FY 2007 FY 2008 FY 2009 FY 2010 FY 2011 FY 2012 FY 2013
Army ....................................................... 105,248 129,039 152,113 163,357 179,413 212,565 232,384 238,625 237,225 213,604 190,931 Navy ........................................................ 112,017 120,381 126,088 132,267 139,141 152,459 158,108 166,883 170,868 167,682 160,158 Air Force ................................................. 111,559 122,162 127,939 132,706 135,262 144,983 152,307 159,505 163,085 159,262 152,740 Defense-Wide ......................................... 58,517 64,935 68,014 70,946 75,272 84,592 93,538 101,726 106,786 110,357 103,964
Total Current Dollars ........................ 387,340 436,517 474,154 499,277 529,089 594,599 636,337 666,739 677,964 650,905 607,793
Army ....................................................... 150,452 178,819 203,141 211,119 225,726 259,921 278,439 281,628 274,758 243,213 214,146 Navy ........................................................ 161,625 168,426 168,925 171,447 175,378 185,589 189,758 196,543 196,838 189,751 178,755 Air Force ................................................. 161,433 171,243 171,405 171,251 170,340 175,799 183,148 187,684 187,815 180,350 169,549 Defense-Wide ......................................... 89,835 95,973 96,632 97,333 99,584 107,831 115,905 122,718 126,090 127,686 118,250
Total Constant Dollars ...................... 563,346 614,461 640,103 651,150 671,028 729,140 767,251 788,573 785,501 741,001 680,701
Army ....................................................... 23.8 18.9 13.6 3.9 6.9 15.1 7.1 1.1 -2.4 -11.5 -12.0 Navy ........................................................ 12.1 4.2 0.3 1.5 2.3 5.8 2.2 3.6 0.2 -3.6 -5.8 Air Force ................................................. 15.2 6.1 0.1 -0.1 -0.5 3.2 4.2 2.5 0.1 -4.0 -6.0
Total Real Growth ............................. 14.3 9.1 4.2 1.7 3.1 8.7 5.2 2.8 -0.4 -5.7 -8.1
NOTE: War and supplemental funding is included in FY 1948 through FY 2021.
Percent Real Growth (%)
Table 6-13: DEPARTMENT OF DEFENSE OUTLAYS BY MILITARY DEPARTMENT (Continued)(Discretionary and Mandatory Dollars in Millions)
Military Department
Current Dollars
FY 2020 Constant Dollars
173
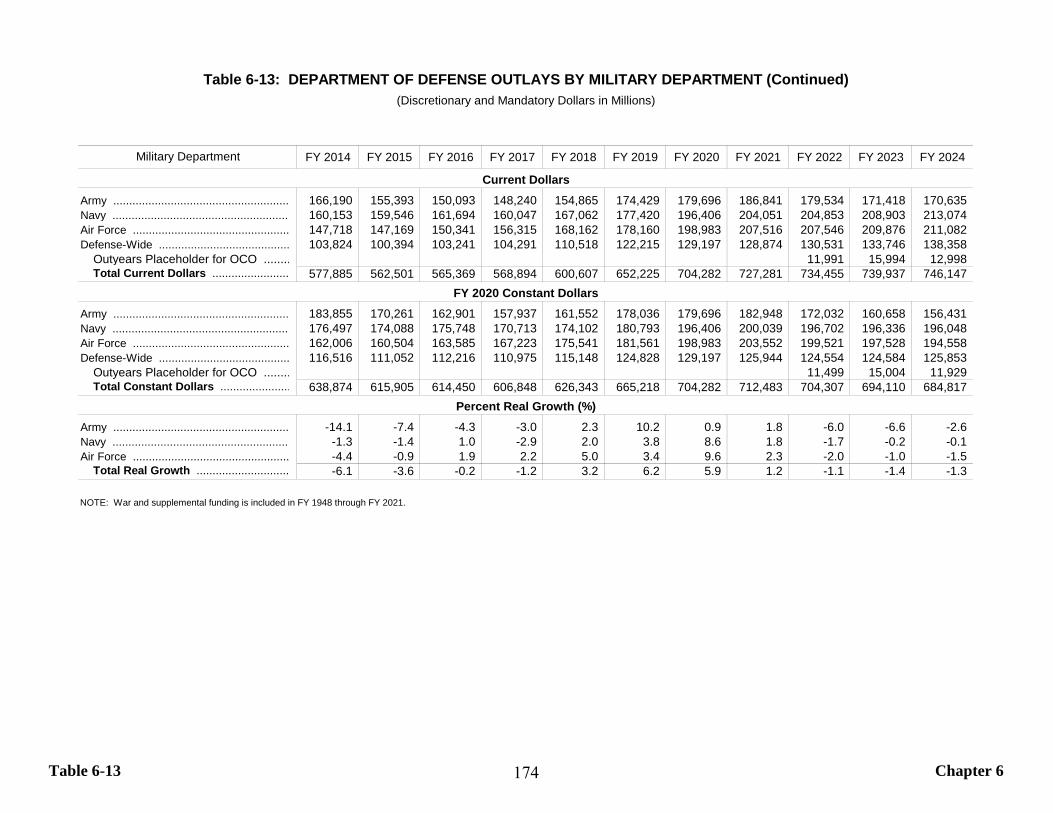
Table 6-13 Chapter 6
FY 2014 FY 2015 FY 2016 FY 2017 FY 2018 FY 2019 FY 2020 FY 2021 FY 2022 FY 2023 FY 2024
Army ....................................................... 166,190 155,393 150,093 148,240 154,865 174,429 179,696 186,841 179,534 171,418 170,635 Navy ........................................................ 160,153 159,546 161,694 160,047 167,062 177,420 196,406 204,051 204,853 208,903 213,074 Air Force ................................................. 147,718 147,169 150,341 156,315 168,162 178,160 198,983 207,516 207,546 209,876 211,082 Defense-Wide ......................................... 103,824 100,394 103,241 104,291 110,518 122,215 129,197 128,874 130,531 133,746 138,358
Outyears Placeholder for OCO ........ 11,991 15,994 12,998 Total Current Dollars ........................ 577,885 562,501 565,369 568,894 600,607 652,225 704,282 727,281 734,455 739,937 746,147
Army ....................................................... 183,855 170,261 162,901 157,937 161,552 178,036 179,696 182,948 172,032 160,658 156,431 Navy ........................................................ 176,497 174,088 175,748 170,713 174,102 180,793 196,406 200,039 196,702 196,336 196,048 Air Force ................................................. 162,006 160,504 163,585 167,223 175,541 181,561 198,983 203,552 199,521 197,528 194,558 Defense-Wide ......................................... 116,516 111,052 112,216 110,975 115,148 124,828 129,197 125,944 124,554 124,584 125,853
Outyears Placeholder for OCO ........ 11,499 15,004 11,929 Total Constant Dollars ...................... 638,874 615,905 614,450 606,848 626,343 665,218 704,282 712,483 704,307 694,110 684,817
Army ....................................................... -14.1 -7.4 -4.3 -3.0 2.3 10.2 0.9 1.8 -6.0 -6.6 -2.6 Navy ........................................................ -1.3 -1.4 1.0 -2.9 2.0 3.8 8.6 1.8 -1.7 -0.2 -0.1 Air Force ................................................. -4.4 -0.9 1.9 2.2 5.0 3.4 9.6 2.3 -2.0 -1.0 -1.5
Total Real Growth ............................. -6.1 -3.6 -0.2 -1.2 3.2 6.2 5.9 1.2 -1.1 -1.4 -1.3
NOTE: War and supplemental funding is included in FY 1948 through FY 2021.
Table 6-13: DEPARTMENT OF DEFENSE OUTLAYS BY MILITARY DEPARTMENT (Continued)
Percent Real Growth (%)
FY 2020 Constant Dollars
Current Dollars
(Discretionary and Mandatory Dollars in Millions)
Military Department
174
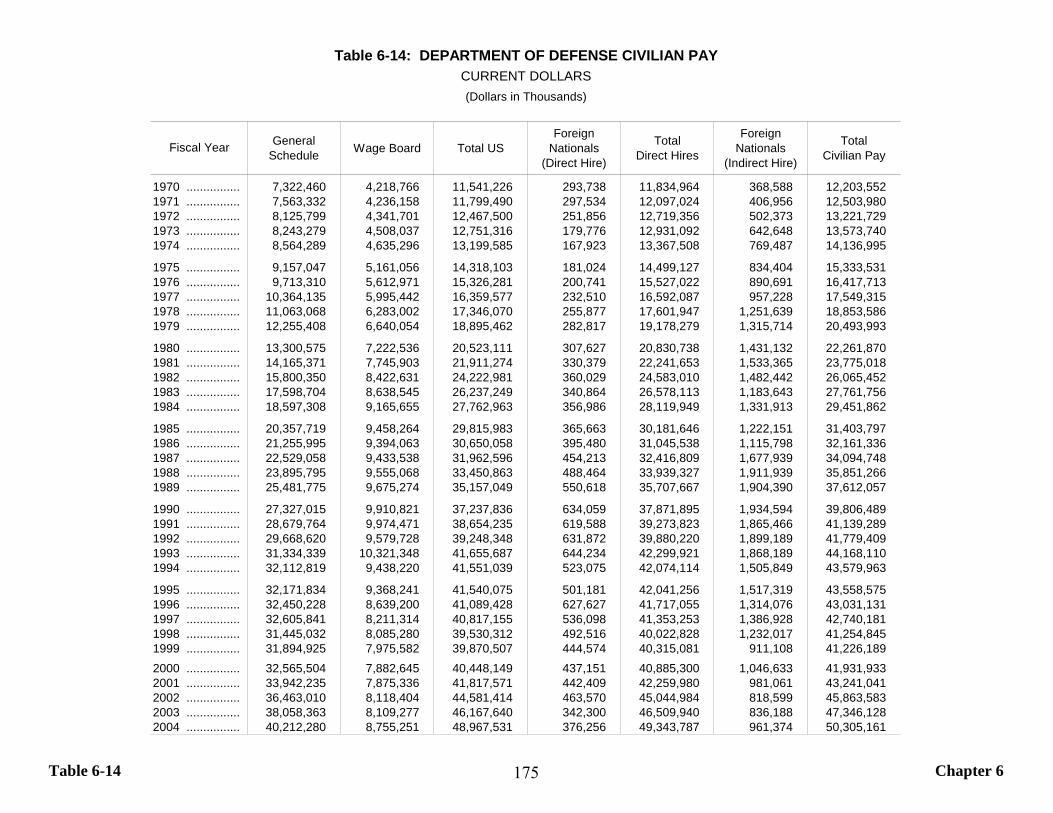
Table 6-14 Chapter 6
General Schedule Wage Board Total US
ForeignNationals
(Direct Hire)
TotalDirect Hires
Foreign Nationals
(Indirect Hire)
TotalCivilian Pay
1970 ................ 7,322,460 4,218,766 11,541,226 293,738 11,834,964 368,588 12,203,5521971 ................ 7,563,332 4,236,158 11,799,490 297,534 12,097,024 406,956 12,503,9801972 ................ 8,125,799 4,341,701 12,467,500 251,856 12,719,356 502,373 13,221,7291973 ................ 8,243,279 4,508,037 12,751,316 179,776 12,931,092 642,648 13,573,7401974 ................ 8,564,289 4,635,296 13,199,585 167,923 13,367,508 769,487 14,136,995
1975 ................ 9,157,047 5,161,056 14,318,103 181,024 14,499,127 834,404 15,333,5311976 ................ 9,713,310 5,612,971 15,326,281 200,741 15,527,022 890,691 16,417,7131977 ................ 10,364,135 5,995,442 16,359,577 232,510 16,592,087 957,228 17,549,3151978 ................ 11,063,068 6,283,002 17,346,070 255,877 17,601,947 1,251,639 18,853,5861979 ................ 12,255,408 6,640,054 18,895,462 282,817 19,178,279 1,315,714 20,493,993
1980 ................ 13,300,575 7,222,536 20,523,111 307,627 20,830,738 1,431,132 22,261,8701981 ................ 14,165,371 7,745,903 21,911,274 330,379 22,241,653 1,533,365 23,775,0181982 ................ 15,800,350 8,422,631 24,222,981 360,029 24,583,010 1,482,442 26,065,4521983 ................ 17,598,704 8,638,545 26,237,249 340,864 26,578,113 1,183,643 27,761,7561984 ................ 18,597,308 9,165,655 27,762,963 356,986 28,119,949 1,331,913 29,451,862
1985 ................ 20,357,719 9,458,264 29,815,983 365,663 30,181,646 1,222,151 31,403,7971986 ................ 21,255,995 9,394,063 30,650,058 395,480 31,045,538 1,115,798 32,161,3361987 ................ 22,529,058 9,433,538 31,962,596 454,213 32,416,809 1,677,939 34,094,7481988 ................ 23,895,795 9,555,068 33,450,863 488,464 33,939,327 1,911,939 35,851,2661989 ................ 25,481,775 9,675,274 35,157,049 550,618 35,707,667 1,904,390 37,612,057
1990 ................ 27,327,015 9,910,821 37,237,836 634,059 37,871,895 1,934,594 39,806,4891991 ................ 28,679,764 9,974,471 38,654,235 619,588 39,273,823 1,865,466 41,139,2891992 ................ 29,668,620 9,579,728 39,248,348 631,872 39,880,220 1,899,189 41,779,4091993 ................ 31,334,339 10,321,348 41,655,687 644,234 42,299,921 1,868,189 44,168,1101994 ................ 32,112,819 9,438,220 41,551,039 523,075 42,074,114 1,505,849 43,579,963
1995 ................ 32,171,834 9,368,241 41,540,075 501,181 42,041,256 1,517,319 43,558,5751996 ................ 32,450,228 8,639,200 41,089,428 627,627 41,717,055 1,314,076 43,031,1311997 ................ 32,605,841 8,211,314 40,817,155 536,098 41,353,253 1,386,928 42,740,1811998 ................ 31,445,032 8,085,280 39,530,312 492,516 40,022,828 1,232,017 41,254,8451999 ................ 31,894,925 7,975,582 39,870,507 444,574 40,315,081 911,108 41,226,1892000 ................ 32,565,504 7,882,645 40,448,149 437,151 40,885,300 1,046,633 41,931,9332001 ................ 33,942,235 7,875,336 41,817,571 442,409 42,259,980 981,061 43,241,0412002 ................ 36,463,010 8,118,404 44,581,414 463,570 45,044,984 818,599 45,863,5832003 ................ 38,058,363 8,109,277 46,167,640 342,300 46,509,940 836,188 47,346,1282004 ................ 40,212,280 8,755,251 48,967,531 376,256 49,343,787 961,374 50,305,161
Table 6-14: DEPARTMENT OF DEFENSE CIVILIAN PAYCURRENT DOLLARS(Dollars in Thousands)
Fiscal Year
175
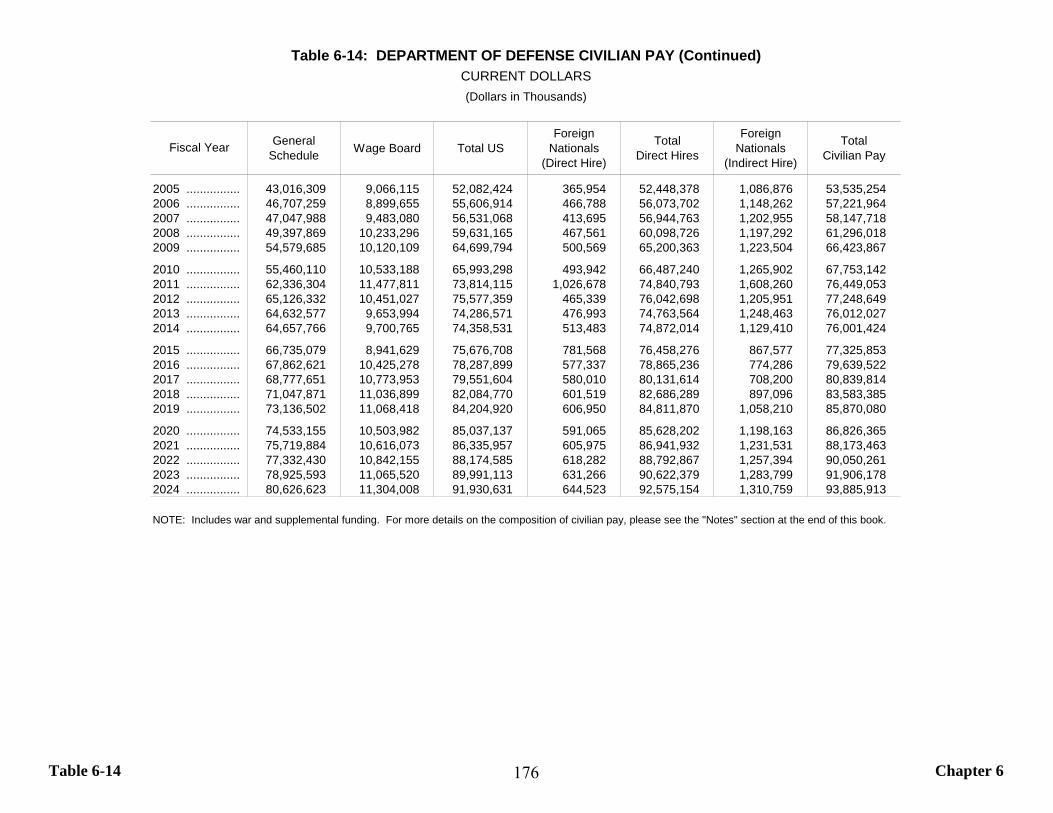
Table 6-14 Chapter 6
General Schedule Wage Board Total US
ForeignNationals
(Direct Hire)
TotalDirect Hires
Foreign Nationals
(Indirect Hire)
TotalCivilian Pay
2005 ................ 43,016,309 9,066,115 52,082,424 365,954 52,448,378 1,086,876 53,535,2542006 ................ 46,707,259 8,899,655 55,606,914 466,788 56,073,702 1,148,262 57,221,9642007 ................ 47,047,988 9,483,080 56,531,068 413,695 56,944,763 1,202,955 58,147,7182008 ................ 49,397,869 10,233,296 59,631,165 467,561 60,098,726 1,197,292 61,296,0182009 ................ 54,579,685 10,120,109 64,699,794 500,569 65,200,363 1,223,504 66,423,867
2010 ................ 55,460,110 10,533,188 65,993,298 493,942 66,487,240 1,265,902 67,753,1422011 ................ 62,336,304 11,477,811 73,814,115 1,026,678 74,840,793 1,608,260 76,449,0532012 ................ 65,126,332 10,451,027 75,577,359 465,339 76,042,698 1,205,951 77,248,6492013 ................ 64,632,577 9,653,994 74,286,571 476,993 74,763,564 1,248,463 76,012,0272014 ................ 64,657,766 9,700,765 74,358,531 513,483 74,872,014 1,129,410 76,001,424
2015 ................ 66,735,079 8,941,629 75,676,708 781,568 76,458,276 867,577 77,325,8532016 ................ 67,862,621 10,425,278 78,287,899 577,337 78,865,236 774,286 79,639,5222017 ................ 68,777,651 10,773,953 79,551,604 580,010 80,131,614 708,200 80,839,8142018 ................ 71,047,871 11,036,899 82,084,770 601,519 82,686,289 897,096 83,583,3852019 ................ 73,136,502 11,068,418 84,204,920 606,950 84,811,870 1,058,210 85,870,080
2020 ................ 74,533,155 10,503,982 85,037,137 591,065 85,628,202 1,198,163 86,826,3652021 ................ 75,719,884 10,616,073 86,335,957 605,975 86,941,932 1,231,531 88,173,4632022 ................ 77,332,430 10,842,155 88,174,585 618,282 88,792,867 1,257,394 90,050,2612023 ................ 78,925,593 11,065,520 89,991,113 631,266 90,622,379 1,283,799 91,906,1782024 ................ 80,626,623 11,304,008 91,930,631 644,523 92,575,154 1,310,759 93,885,913
NOTE: Includes war and supplemental funding. For more details on the composition of civilian pay, please see the "Notes" section at the end of this book.
Table 6-14: DEPARTMENT OF DEFENSE CIVILIAN PAY (Continued)CURRENT DOLLARS(Dollars in Thousands)
Fiscal Year
176
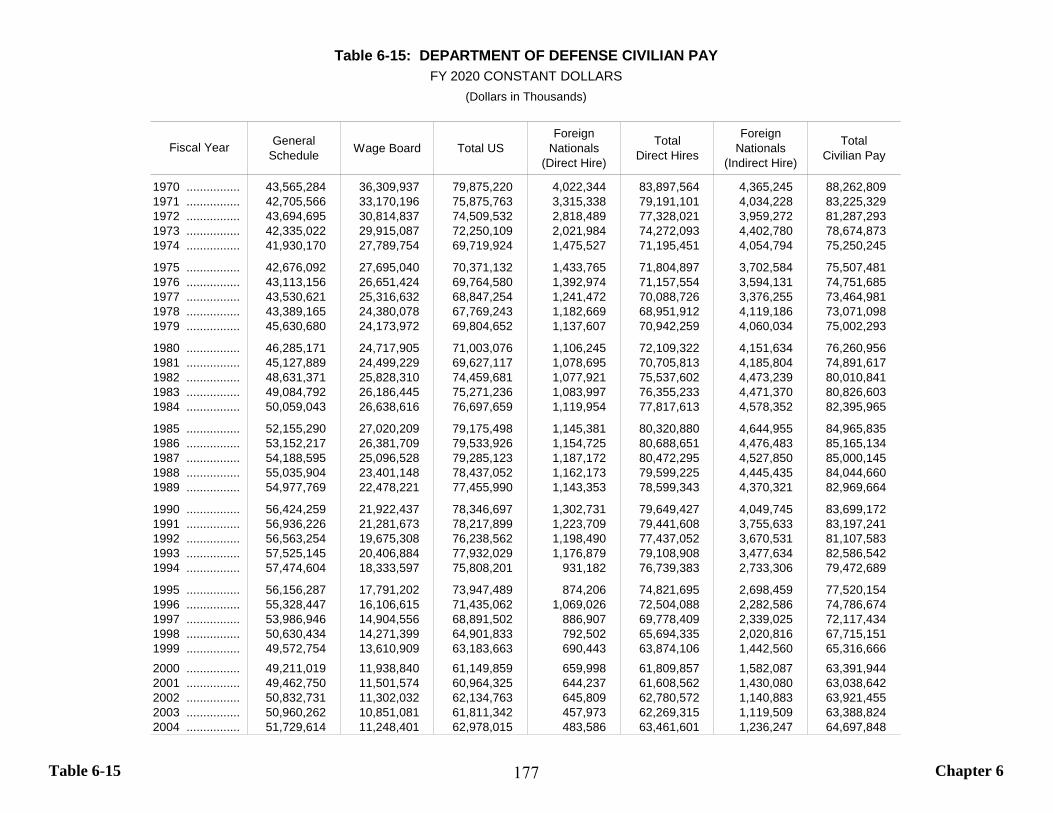
Table 6-15 Chapter 6
General Schedule Wage Board Total US
ForeignNationals
(Direct Hire)
TotalDirect Hires
Foreign Nationals
(Indirect Hire)
TotalCivilian Pay
1970 ................ 43,565,284 36,309,937 79,875,220 4,022,344 83,897,564 4,365,245 88,262,8091971 ................ 42,705,566 33,170,196 75,875,763 3,315,338 79,191,101 4,034,228 83,225,3291972 ................ 43,694,695 30,814,837 74,509,532 2,818,489 77,328,021 3,959,272 81,287,2931973 ................ 42,335,022 29,915,087 72,250,109 2,021,984 74,272,093 4,402,780 78,674,8731974 ................ 41,930,170 27,789,754 69,719,924 1,475,527 71,195,451 4,054,794 75,250,245
1975 ................ 42,676,092 27,695,040 70,371,132 1,433,765 71,804,897 3,702,584 75,507,4811976 ................ 43,113,156 26,651,424 69,764,580 1,392,974 71,157,554 3,594,131 74,751,6851977 ................ 43,530,621 25,316,632 68,847,254 1,241,472 70,088,726 3,376,255 73,464,9811978 ................ 43,389,165 24,380,078 67,769,243 1,182,669 68,951,912 4,119,186 73,071,0981979 ................ 45,630,680 24,173,972 69,804,652 1,137,607 70,942,259 4,060,034 75,002,293
1980 ................ 46,285,171 24,717,905 71,003,076 1,106,245 72,109,322 4,151,634 76,260,9561981 ................ 45,127,889 24,499,229 69,627,117 1,078,695 70,705,813 4,185,804 74,891,6171982 ................ 48,631,371 25,828,310 74,459,681 1,077,921 75,537,602 4,473,239 80,010,8411983 ................ 49,084,792 26,186,445 75,271,236 1,083,997 76,355,233 4,471,370 80,826,6031984 ................ 50,059,043 26,638,616 76,697,659 1,119,954 77,817,613 4,578,352 82,395,965
1985 ................ 52,155,290 27,020,209 79,175,498 1,145,381 80,320,880 4,644,955 84,965,8351986 ................ 53,152,217 26,381,709 79,533,926 1,154,725 80,688,651 4,476,483 85,165,1341987 ................ 54,188,595 25,096,528 79,285,123 1,187,172 80,472,295 4,527,850 85,000,1451988 ................ 55,035,904 23,401,148 78,437,052 1,162,173 79,599,225 4,445,435 84,044,6601989 ................ 54,977,769 22,478,221 77,455,990 1,143,353 78,599,343 4,370,321 82,969,664
1990 ................ 56,424,259 21,922,437 78,346,697 1,302,731 79,649,427 4,049,745 83,699,1721991 ................ 56,936,226 21,281,673 78,217,899 1,223,709 79,441,608 3,755,633 83,197,2411992 ................ 56,563,254 19,675,308 76,238,562 1,198,490 77,437,052 3,670,531 81,107,5831993 ................ 57,525,145 20,406,884 77,932,029 1,176,879 79,108,908 3,477,634 82,586,5421994 ................ 57,474,604 18,333,597 75,808,201 931,182 76,739,383 2,733,306 79,472,689
1995 ................ 56,156,287 17,791,202 73,947,489 874,206 74,821,695 2,698,459 77,520,1541996 ................ 55,328,447 16,106,615 71,435,062 1,069,026 72,504,088 2,282,586 74,786,6741997 ................ 53,986,946 14,904,556 68,891,502 886,907 69,778,409 2,339,025 72,117,4341998 ................ 50,630,434 14,271,399 64,901,833 792,502 65,694,335 2,020,816 67,715,1511999 ................ 49,572,754 13,610,909 63,183,663 690,443 63,874,106 1,442,560 65,316,6662000 ................ 49,211,019 11,938,840 61,149,859 659,998 61,809,857 1,582,087 63,391,9442001 ................ 49,462,750 11,501,574 60,964,325 644,237 61,608,562 1,430,080 63,038,6422002 ................ 50,832,731 11,302,032 62,134,763 645,809 62,780,572 1,140,883 63,921,4552003 ................ 50,960,262 10,851,081 61,811,342 457,973 62,269,315 1,119,509 63,388,8242004 ................ 51,729,614 11,248,401 62,978,015 483,586 63,461,601 1,236,247 64,697,848
Table 6-15: DEPARTMENT OF DEFENSE CIVILIAN PAYFY 2020 CONSTANT DOLLARS
(Dollars in Thousands)
Fiscal Year
177
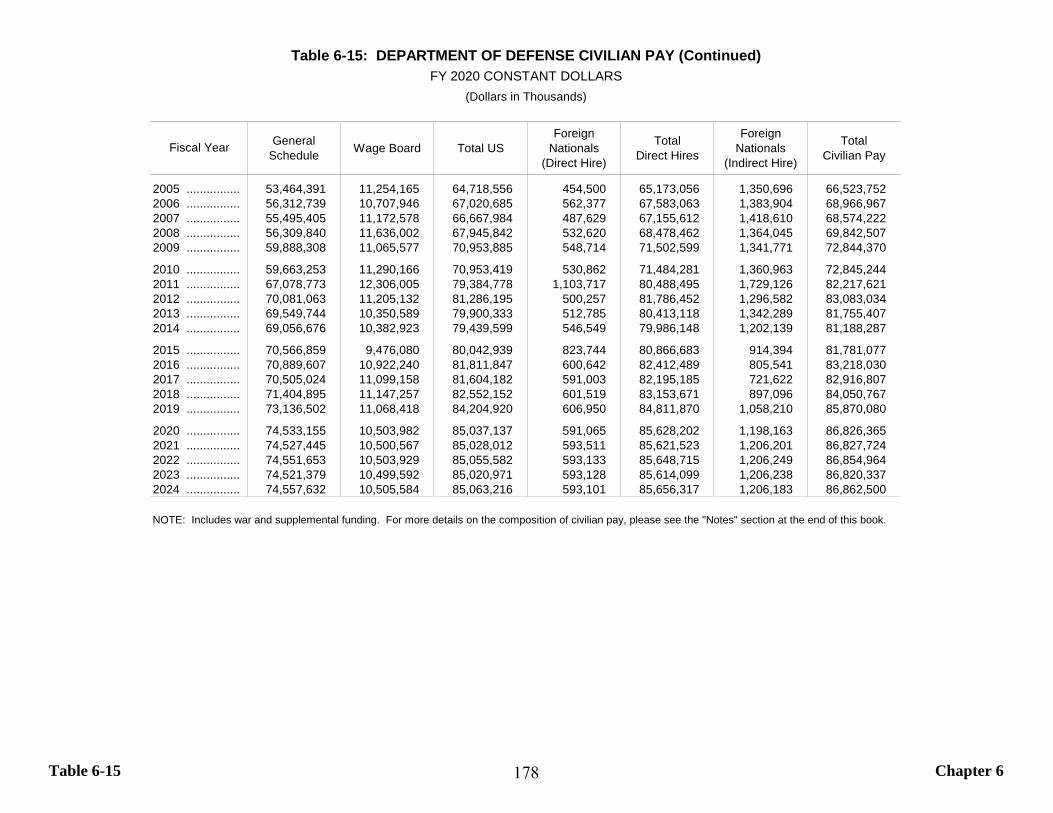
Table 6-15 Chapter 6
General Schedule Wage Board Total US
ForeignNationals
(Direct Hire)
TotalDirect Hires
Foreign Nationals
(Indirect Hire)
TotalCivilian Pay
2005 ................ 53,464,391 11,254,165 64,718,556 454,500 65,173,056 1,350,696 66,523,7522006 ................ 56,312,739 10,707,946 67,020,685 562,377 67,583,063 1,383,904 68,966,9672007 ................ 55,495,405 11,172,578 66,667,984 487,629 67,155,612 1,418,610 68,574,2222008 ................ 56,309,840 11,636,002 67,945,842 532,620 68,478,462 1,364,045 69,842,5072009 ................ 59,888,308 11,065,577 70,953,885 548,714 71,502,599 1,341,771 72,844,370
2010 ................ 59,663,253 11,290,166 70,953,419 530,862 71,484,281 1,360,963 72,845,2442011 ................ 67,078,773 12,306,005 79,384,778 1,103,717 80,488,495 1,729,126 82,217,6212012 ................ 70,081,063 11,205,132 81,286,195 500,257 81,786,452 1,296,582 83,083,0342013 ................ 69,549,744 10,350,589 79,900,333 512,785 80,413,118 1,342,289 81,755,4072014 ................ 69,056,676 10,382,923 79,439,599 546,549 79,986,148 1,202,139 81,188,287
2015 ................ 70,566,859 9,476,080 80,042,939 823,744 80,866,683 914,394 81,781,0772016 ................ 70,889,607 10,922,240 81,811,847 600,642 82,412,489 805,541 83,218,0302017 ................ 70,505,024 11,099,158 81,604,182 591,003 82,195,185 721,622 82,916,8072018 ................ 71,404,895 11,147,257 82,552,152 601,519 83,153,671 897,096 84,050,7672019 ................ 73,136,502 11,068,418 84,204,920 606,950 84,811,870 1,058,210 85,870,080
2020 ................ 74,533,155 10,503,982 85,037,137 591,065 85,628,202 1,198,163 86,826,3652021 ................ 74,527,445 10,500,567 85,028,012 593,511 85,621,523 1,206,201 86,827,7242022 ................ 74,551,653 10,503,929 85,055,582 593,133 85,648,715 1,206,249 86,854,9642023 ................ 74,521,379 10,499,592 85,020,971 593,128 85,614,099 1,206,238 86,820,3372024 ................ 74,557,632 10,505,584 85,063,216 593,101 85,656,317 1,206,183 86,862,500
NOTE: Includes war and supplemental funding. For more details on the composition of civilian pay, please see the "Notes" section at the end of this book.
Table 6-15: DEPARTMENT OF DEFENSE CIVILIAN PAY (Continued)FY 2020 CONSTANT DOLLARS
(Dollars in Thousands)
Fiscal Year
178

Table 6-16 Chapter 6
FY 1948 FY 1949 FY 1950 FY 1951 FY 1952 FY 1953 FY 1954 FY 1955 FY 1956 FY 1957 FY 1958
Military Personnel ................................... 1,688 1,900 1,984 4,256 4,993 5,352 4,696 4,455 3,933 3,952 3,895 Operation and Maintenance .................... 1,232 1,619 1,671 5,525 6,697 4,758 3,328 3,015 3,031 3,245 3,319 Procurement ........................................... 59 324 400 7,075 8,992 2,334 910 2,036 1,723 1,589 1,345 RDT&E .................................................... 96 104 117 288 456 525 592 704 714 735 801 Military Construction ............................... 87 87 116 309 548 507 367 603 500 398 396 Family Housing ....................................... Revolving and Management Funds .........
Total Current Dollars ........................ 3,162 4,034 4,288 17,453 21,685 13,475 9,892 10,813 9,901 9,919 9,757
Military Personnel ................................... 37,460 42,308 40,267 77,540 95,591 95,083 85,973 79,156 67,450 68,105 63,929 Operation and Maintenance .................... 24,329 27,022 24,676 59,612 75,297 56,444 41,909 37,403 35,978 36,550 35,882 Procurement ........................................... 603 2,915 3,658 57,981 77,043 21,351 8,743 16,505 13,455 11,642 9,731 RDT&E .................................................... 1,240 1,249 1,319 3,298 4,817 5,469 5,814 6,537 6,260 6,114 6,617 Military Construction ............................... 808 788 1,021 2,710 4,729 4,382 3,056 4,767 3,880 3,094 3,067 Family Housing ....................................... Revolving and Management Funds .........
Total Constant Dollars ...................... 64,440 74,281 70,942 201,141 257,477 182,728 145,495 144,367 127,022 125,506 119,225
Military Personnel ................................... 12.9 -4.8 92.6 23.3 -0.5 -9.6 -7.9 -14.8 1.0 -6.1 Operation and Maintenance .................... 11.1 -8.7 141.6 26.3 -25.0 -25.8 -10.8 -3.8 1.6 -1.8 Procurement ........................................... 383.4 25.5 1,485.2 32.9 -72.3 -59.1 88.8 -18.5 -13.5 -16.4 RDT&E .................................................... 0.7 5.6 150.1 46.1 13.5 6.3 12.4 -4.2 -2.3 8.2 Military Construction ............................... -2.6 29.7 165.3 74.5 -7.3 -30.3 56.0 -18.6 -20.3 -0.9
Total Real Growth ............................. 15.3 -4.5 183.5 28.0 -29.0 -20.4 -0.8 -12.0 -1.2 -5.0
NOTE: War and supplemental funding is included in FY 1948 through FY 2021.
Percent Real Growth (%)
Table 6-16: ARMY TOA BY PUBLIC LAW TITLE(Dollars in Millions)
Public Law Title
Current Dollars
FY 2020 Constant Dollars
179

Table 6-16 Chapter 6
FY 1959 FY 1960 FY 1961 FY 1962 FY 1963 FY 1964 FY 1965 FY 1966 FY 1967 FY 1968 FY 1969
Military Personnel ................................... 3,924 3,922 3,979 4,458 4,343 4,616 4,750 5,670 7,353 8,391 8,998 Operation and Maintenance .................... 3,234 3,221 3,382 3,875 3,537 3,554 3,737 5,098 7,520 8,372 8,249 Procurement ........................................... 1,097 1,388 1,755 2,578 2,503 2,480 1,955 5,123 5,411 6,182 6,333 RDT&E .................................................... 1,022 1,072 1,215 1,374 1,260 1,408 1,409 1,507 1,580 1,506 1,666 Military Construction ............................... 279 265 197 181 183 217 368 1,113 505 512 523 Family Housing ....................................... Revolving and Management Funds .........
Total Current Dollars ........................ 9,555 9,867 10,528 12,467 11,826 12,275 12,219 18,510 22,369 24,962 25,769
Military Personnel ................................... 60,715 60,138 60,202 67,939 65,211 64,651 64,248 69,507 84,607 91,357 92,811 Operation and Maintenance .................... 34,207 32,908 32,785 36,293 33,027 32,124 31,927 40,580 55,058 59,448 56,298 Procurement ........................................... 7,777 9,823 12,216 17,989 17,416 17,114 13,340 33,594 34,410 38,025 37,784 RDT&E .................................................... 8,095 8,205 9,162 10,204 9,336 10,223 9,959 10,302 10,452 9,652 10,277 Military Construction ............................... 2,188 2,037 1,504 1,376 1,379 1,594 2,502 6,948 3,104 2,997 2,905 Family Housing ....................................... Revolving and Management Funds .........
Total Constant Dollars ...................... 112,983 113,112 115,869 133,801 126,368 125,705 121,977 160,933 187,631 201,479 200,074
Military Personnel ................................... -5.0 -1.0 0.1 12.9 -4.0 -0.9 -0.6 8.2 21.7 8.0 1.6 Operation and Maintenance .................... -4.7 -3.8 -0.4 10.7 -9.0 -2.7 -0.6 27.1 35.7 8.0 -5.3 Procurement ........................................... -20.1 26.3 24.4 47.2 -3.2 -1.7 -22.0 151.8 2.4 10.5 -0.6 RDT&E .................................................... 22.3 1.4 11.7 11.4 -8.5 9.5 -2.6 3.4 1.5 -7.7 6.5 Military Construction ............................... -28.6 -6.9 -26.2 -8.5 0.2 15.6 57.0 177.7 -55.3 -3.5 -3.1
Total Real Growth ............................. -5.2 0.1 2.4 15.5 -5.6 -0.5 -3.0 31.9 16.6 7.4 -0.7
NOTE: War and supplemental funding is included in FY 1948 through FY 2021.
Percent Real Growth (%)
Table 6-16: ARMY TOA BY PUBLIC LAW TITLE (Continued)(Dollars in Millions)
Public Law Title
Current Dollars
FY 2020 Constant Dollars
180
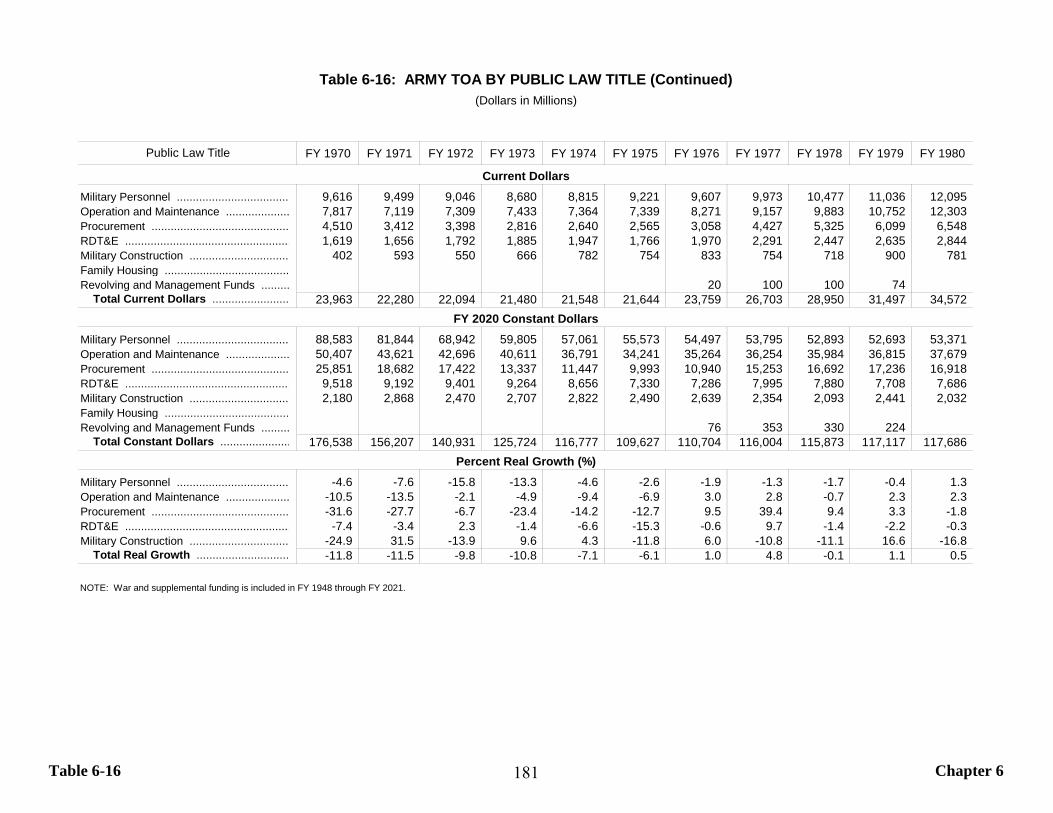
Table 6-16 Chapter 6
FY 1970 FY 1971 FY 1972 FY 1973 FY 1974 FY 1975 FY 1976 FY 1977 FY 1978 FY 1979 FY 1980
Military Personnel ................................... 9,616 9,499 9,046 8,680 8,815 9,221 9,607 9,973 10,477 11,036 12,095 Operation and Maintenance .................... 7,817 7,119 7,309 7,433 7,364 7,339 8,271 9,157 9,883 10,752 12,303 Procurement ........................................... 4,510 3,412 3,398 2,816 2,640 2,565 3,058 4,427 5,325 6,099 6,548 RDT&E .................................................... 1,619 1,656 1,792 1,885 1,947 1,766 1,970 2,291 2,447 2,635 2,844 Military Construction ............................... 402 593 550 666 782 754 833 754 718 900 781 Family Housing ....................................... Revolving and Management Funds ......... 20 100 100 74
Total Current Dollars ........................ 23,963 22,280 22,094 21,480 21,548 21,644 23,759 26,703 28,950 31,497 34,572
Military Personnel ................................... 88,583 81,844 68,942 59,805 57,061 55,573 54,497 53,795 52,893 52,693 53,371 Operation and Maintenance .................... 50,407 43,621 42,696 40,611 36,791 34,241 35,264 36,254 35,984 36,815 37,679 Procurement ........................................... 25,851 18,682 17,422 13,337 11,447 9,993 10,940 15,253 16,692 17,236 16,918 RDT&E .................................................... 9,518 9,192 9,401 9,264 8,656 7,330 7,286 7,995 7,880 7,708 7,686 Military Construction ............................... 2,180 2,868 2,470 2,707 2,822 2,490 2,639 2,354 2,093 2,441 2,032 Family Housing ....................................... Revolving and Management Funds ......... 76 353 330 224
Total Constant Dollars ...................... 176,538 156,207 140,931 125,724 116,777 109,627 110,704 116,004 115,873 117,117 117,686
Military Personnel ................................... -4.6 -7.6 -15.8 -13.3 -4.6 -2.6 -1.9 -1.3 -1.7 -0.4 1.3 Operation and Maintenance .................... -10.5 -13.5 -2.1 -4.9 -9.4 -6.9 3.0 2.8 -0.7 2.3 2.3 Procurement ........................................... -31.6 -27.7 -6.7 -23.4 -14.2 -12.7 9.5 39.4 9.4 3.3 -1.8 RDT&E .................................................... -7.4 -3.4 2.3 -1.4 -6.6 -15.3 -0.6 9.7 -1.4 -2.2 -0.3 Military Construction ............................... -24.9 31.5 -13.9 9.6 4.3 -11.8 6.0 -10.8 -11.1 16.6 -16.8
Total Real Growth ............................. -11.8 -11.5 -9.8 -10.8 -7.1 -6.1 1.0 4.8 -0.1 1.1 0.5
NOTE: War and supplemental funding is included in FY 1948 through FY 2021.
Percent Real Growth (%)
Table 6-16: ARMY TOA BY PUBLIC LAW TITLE (Continued)(Dollars in Millions)
Public Law Title
Current Dollars
FY 2020 Constant Dollars
181
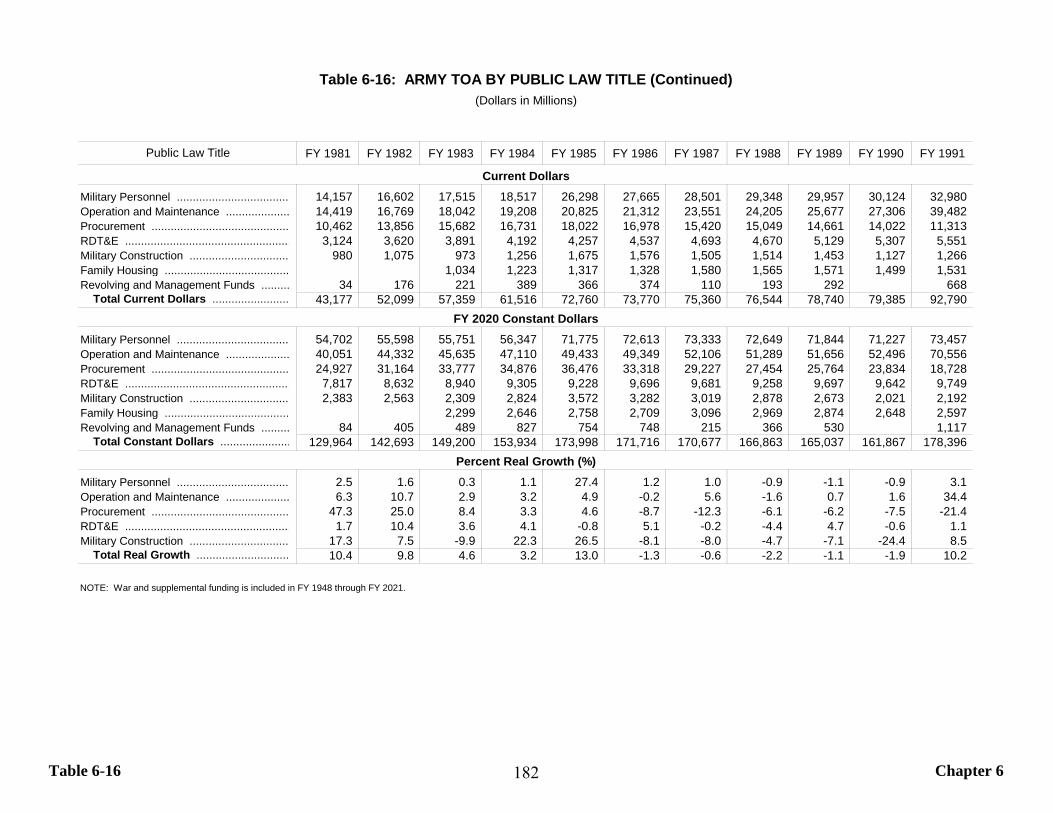
Table 6-16 Chapter 6
FY 1981 FY 1982 FY 1983 FY 1984 FY 1985 FY 1986 FY 1987 FY 1988 FY 1989 FY 1990 FY 1991
Military Personnel ................................... 14,157 16,602 17,515 18,517 26,298 27,665 28,501 29,348 29,957 30,124 32,980 Operation and Maintenance .................... 14,419 16,769 18,042 19,208 20,825 21,312 23,551 24,205 25,677 27,306 39,482 Procurement ........................................... 10,462 13,856 15,682 16,731 18,022 16,978 15,420 15,049 14,661 14,022 11,313 RDT&E .................................................... 3,124 3,620 3,891 4,192 4,257 4,537 4,693 4,670 5,129 5,307 5,551 Military Construction ............................... 980 1,075 973 1,256 1,675 1,576 1,505 1,514 1,453 1,127 1,266 Family Housing ....................................... 1,034 1,223 1,317 1,328 1,580 1,565 1,571 1,499 1,531 Revolving and Management Funds ......... 34 176 221 389 366 374 110 193 292 668
Total Current Dollars ........................ 43,177 52,099 57,359 61,516 72,760 73,770 75,360 76,544 78,740 79,385 92,790
Military Personnel ................................... 54,702 55,598 55,751 56,347 71,775 72,613 73,333 72,649 71,844 71,227 73,457 Operation and Maintenance .................... 40,051 44,332 45,635 47,110 49,433 49,349 52,106 51,289 51,656 52,496 70,556 Procurement ........................................... 24,927 31,164 33,777 34,876 36,476 33,318 29,227 27,454 25,764 23,834 18,728 RDT&E .................................................... 7,817 8,632 8,940 9,305 9,228 9,696 9,681 9,258 9,697 9,642 9,749 Military Construction ............................... 2,383 2,563 2,309 2,824 3,572 3,282 3,019 2,878 2,673 2,021 2,192 Family Housing ....................................... 2,299 2,646 2,758 2,709 3,096 2,969 2,874 2,648 2,597 Revolving and Management Funds ......... 84 405 489 827 754 748 215 366 530 1,117
Total Constant Dollars ...................... 129,964 142,693 149,200 153,934 173,998 171,716 170,677 166,863 165,037 161,867 178,396
Military Personnel ................................... 2.5 1.6 0.3 1.1 27.4 1.2 1.0 -0.9 -1.1 -0.9 3.1 Operation and Maintenance .................... 6.3 10.7 2.9 3.2 4.9 -0.2 5.6 -1.6 0.7 1.6 34.4 Procurement ........................................... 47.3 25.0 8.4 3.3 4.6 -8.7 -12.3 -6.1 -6.2 -7.5 -21.4 RDT&E .................................................... 1.7 10.4 3.6 4.1 -0.8 5.1 -0.2 -4.4 4.7 -0.6 1.1 Military Construction ............................... 17.3 7.5 -9.9 22.3 26.5 -8.1 -8.0 -4.7 -7.1 -24.4 8.5
Total Real Growth ............................. 10.4 9.8 4.6 3.2 13.0 -1.3 -0.6 -2.2 -1.1 -1.9 10.2
NOTE: War and supplemental funding is included in FY 1948 through FY 2021.
Percent Real Growth (%)
Table 6-16: ARMY TOA BY PUBLIC LAW TITLE (Continued)(Dollars in Millions)
Public Law Title
Current Dollars
FY 2020 Constant Dollars
182
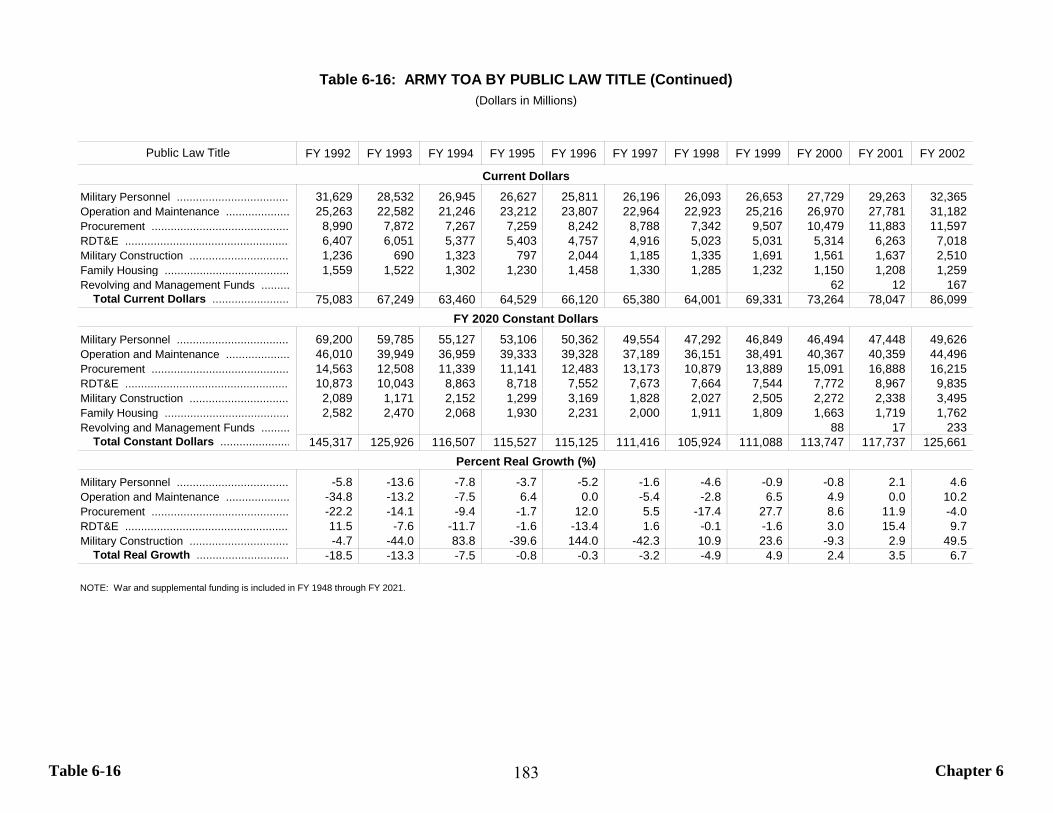
Table 6-16 Chapter 6
FY 1992 FY 1993 FY 1994 FY 1995 FY 1996 FY 1997 FY 1998 FY 1999 FY 2000 FY 2001 FY 2002
Military Personnel ................................... 31,629 28,532 26,945 26,627 25,811 26,196 26,093 26,653 27,729 29,263 32,365 Operation and Maintenance .................... 25,263 22,582 21,246 23,212 23,807 22,964 22,923 25,216 26,970 27,781 31,182 Procurement ........................................... 8,990 7,872 7,267 7,259 8,242 8,788 7,342 9,507 10,479 11,883 11,597 RDT&E .................................................... 6,407 6,051 5,377 5,403 4,757 4,916 5,023 5,031 5,314 6,263 7,018 Military Construction ............................... 1,236 690 1,323 797 2,044 1,185 1,335 1,691 1,561 1,637 2,510 Family Housing ....................................... 1,559 1,522 1,302 1,230 1,458 1,330 1,285 1,232 1,150 1,208 1,259 Revolving and Management Funds ......... 62 12 167
Total Current Dollars ........................ 75,083 67,249 63,460 64,529 66,120 65,380 64,001 69,331 73,264 78,047 86,099
Military Personnel ................................... 69,200 59,785 55,127 53,106 50,362 49,554 47,292 46,849 46,494 47,448 49,626 Operation and Maintenance .................... 46,010 39,949 36,959 39,333 39,328 37,189 36,151 38,491 40,367 40,359 44,496 Procurement ........................................... 14,563 12,508 11,339 11,141 12,483 13,173 10,879 13,889 15,091 16,888 16,215 RDT&E .................................................... 10,873 10,043 8,863 8,718 7,552 7,673 7,664 7,544 7,772 8,967 9,835 Military Construction ............................... 2,089 1,171 2,152 1,299 3,169 1,828 2,027 2,505 2,272 2,338 3,495 Family Housing ....................................... 2,582 2,470 2,068 1,930 2,231 2,000 1,911 1,809 1,663 1,719 1,762 Revolving and Management Funds ......... 88 17 233
Total Constant Dollars ...................... 145,317 125,926 116,507 115,527 115,125 111,416 105,924 111,088 113,747 117,737 125,661
Military Personnel ................................... -5.8 -13.6 -7.8 -3.7 -5.2 -1.6 -4.6 -0.9 -0.8 2.1 4.6 Operation and Maintenance .................... -34.8 -13.2 -7.5 6.4 0.0 -5.4 -2.8 6.5 4.9 0.0 10.2 Procurement ........................................... -22.2 -14.1 -9.4 -1.7 12.0 5.5 -17.4 27.7 8.6 11.9 -4.0 RDT&E .................................................... 11.5 -7.6 -11.7 -1.6 -13.4 1.6 -0.1 -1.6 3.0 15.4 9.7 Military Construction ............................... -4.7 -44.0 83.8 -39.6 144.0 -42.3 10.9 23.6 -9.3 2.9 49.5
Total Real Growth ............................. -18.5 -13.3 -7.5 -0.8 -0.3 -3.2 -4.9 4.9 2.4 3.5 6.7
NOTE: War and supplemental funding is included in FY 1948 through FY 2021.
Percent Real Growth (%)
Table 6-16: ARMY TOA BY PUBLIC LAW TITLE (Continued)(Dollars in Millions)
Public Law Title
Current Dollars
FY 2020 Constant Dollars
183
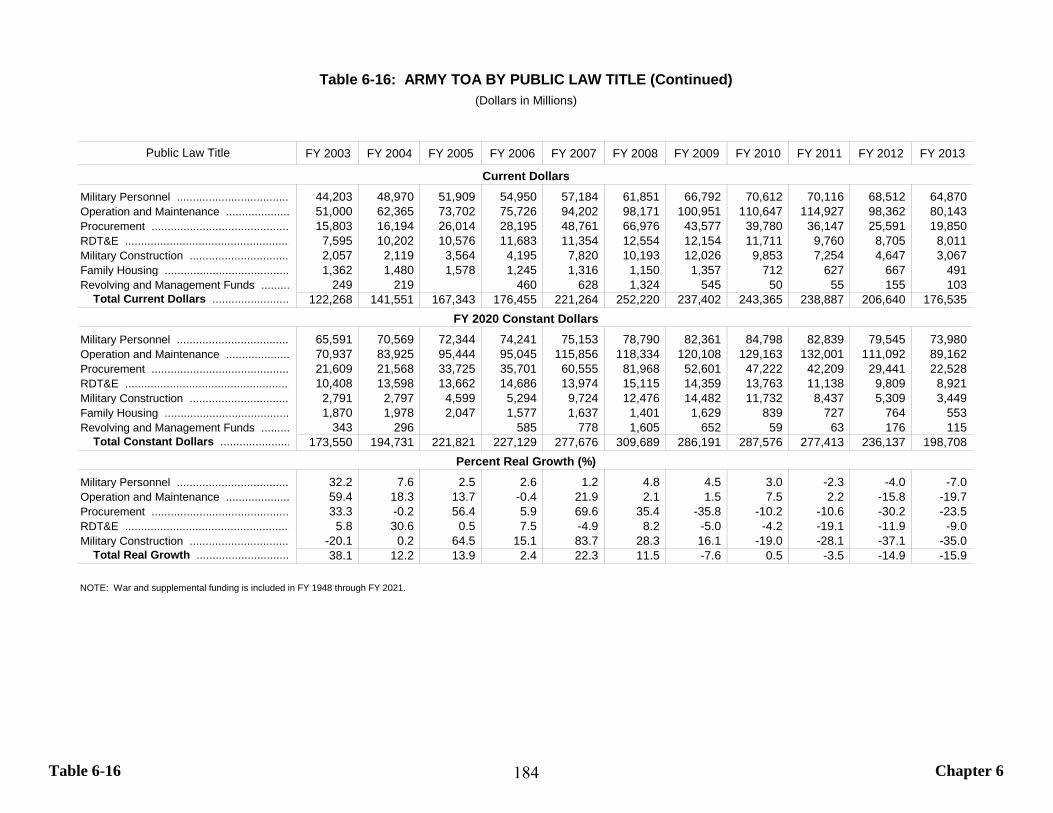
Table 6-16 Chapter 6
FY 2003 FY 2004 FY 2005 FY 2006 FY 2007 FY 2008 FY 2009 FY 2010 FY 2011 FY 2012 FY 2013
Military Personnel ................................... 44,203 48,970 51,909 54,950 57,184 61,851 66,792 70,612 70,116 68,512 64,870 Operation and Maintenance .................... 51,000 62,365 73,702 75,726 94,202 98,171 100,951 110,647 114,927 98,362 80,143 Procurement ........................................... 15,803 16,194 26,014 28,195 48,761 66,976 43,577 39,780 36,147 25,591 19,850 RDT&E .................................................... 7,595 10,202 10,576 11,683 11,354 12,554 12,154 11,711 9,760 8,705 8,011 Military Construction ............................... 2,057 2,119 3,564 4,195 7,820 10,193 12,026 9,853 7,254 4,647 3,067 Family Housing ....................................... 1,362 1,480 1,578 1,245 1,316 1,150 1,357 712 627 667 491 Revolving and Management Funds ......... 249 219 460 628 1,324 545 50 55 155 103
Total Current Dollars ........................ 122,268 141,551 167,343 176,455 221,264 252,220 237,402 243,365 238,887 206,640 176,535
Military Personnel ................................... 65,591 70,569 72,344 74,241 75,153 78,790 82,361 84,798 82,839 79,545 73,980 Operation and Maintenance .................... 70,937 83,925 95,444 95,045 115,856 118,334 120,108 129,163 132,001 111,092 89,162 Procurement ........................................... 21,609 21,568 33,725 35,701 60,555 81,968 52,601 47,222 42,209 29,441 22,528 RDT&E .................................................... 10,408 13,598 13,662 14,686 13,974 15,115 14,359 13,763 11,138 9,809 8,921 Military Construction ............................... 2,791 2,797 4,599 5,294 9,724 12,476 14,482 11,732 8,437 5,309 3,449 Family Housing ....................................... 1,870 1,978 2,047 1,577 1,637 1,401 1,629 839 727 764 553 Revolving and Management Funds ......... 343 296 585 778 1,605 652 59 63 176 115
Total Constant Dollars ...................... 173,550 194,731 221,821 227,129 277,676 309,689 286,191 287,576 277,413 236,137 198,708
Military Personnel ................................... 32.2 7.6 2.5 2.6 1.2 4.8 4.5 3.0 -2.3 -4.0 -7.0 Operation and Maintenance .................... 59.4 18.3 13.7 -0.4 21.9 2.1 1.5 7.5 2.2 -15.8 -19.7 Procurement ........................................... 33.3 -0.2 56.4 5.9 69.6 35.4 -35.8 -10.2 -10.6 -30.2 -23.5 RDT&E .................................................... 5.8 30.6 0.5 7.5 -4.9 8.2 -5.0 -4.2 -19.1 -11.9 -9.0 Military Construction ............................... -20.1 0.2 64.5 15.1 83.7 28.3 16.1 -19.0 -28.1 -37.1 -35.0
Total Real Growth ............................. 38.1 12.2 13.9 2.4 22.3 11.5 -7.6 0.5 -3.5 -14.9 -15.9
NOTE: War and supplemental funding is included in FY 1948 through FY 2021.
Percent Real Growth (%)
Table 6-16: ARMY TOA BY PUBLIC LAW TITLE (Continued)(Dollars in Millions)
Public Law Title
Current Dollars
FY 2020 Constant Dollars
184

Table 6-16 Chapter 6
FY 2014 FY 2015 FY 2016 FY 2017 FY 2018 FY 2019 FY 2020 FY 2021 FY 2022 FY 2023 FY 2024
Military Personnel ................................... 61,970 59,245 57,856 57,612 59,852 62,503 63,385 65,387 66,538 68,107 70,523 Operation and Maintenance .................... 72,529 65,937 63,886 68,716 74,519 75,319 77,621 75,666 59,406 60,642 61,410 Procurement ........................................... 17,643 16,807 19,606 21,928 29,137 27,888 26,204 26,476 24,490 25,349 26,152 RDT&E .................................................... 7,124 6,744 7,862 8,853 11,633 11,375 12,397 11,986 11,704 11,611 10,987 Military Construction ............................... 2,250 1,486 1,407 1,168 2,302 1,701 11,181 1,535 1,354 1,417 1,490 Family Housing ....................................... 502 417 470 480 546 707 499 552 441 452 572 Revolving and Management Funds ......... 229 251 209 262 270 264 110 117 92 93 94
Total Current Dollars ........................ 162,246 150,887 151,296 159,018 178,260 179,758 191,397 181,719 164,025 167,671 171,228
Military Personnel ................................... 69,726 65,915 63,494 62,027 63,018 64,215 63,385 63,756 63,293 63,201 63,851 Operation and Maintenance .................... 79,682 71,758 68,950 72,643 77,314 76,541 77,621 74,286 57,214 57,237 56,815 Procurement ........................................... 19,759 18,540 21,234 23,275 30,314 28,445 26,204 25,958 23,541 23,890 24,164 RDT&E .................................................... 7,828 7,306 8,413 9,301 12,010 11,548 12,397 11,765 11,262 10,951 10,157 Military Construction ............................... 2,484 1,608 1,511 1,234 2,389 1,732 11,181 1,506 1,302 1,336 1,377 Family Housing ....................................... 558 457 508 508 567 721 499 541 424 426 528 Revolving and Management Funds ......... 253 276 226 279 281 270 110 114 88 87 87
Total Constant Dollars ...................... 180,290 165,860 164,336 169,267 185,892 183,472 191,397 177,927 157,124 157,127 156,979
Military Personnel ................................... -5.8 -5.5 -3.7 -2.3 1.6 1.9 -1.3 0.6 -0.7 -0.1 1.0 Operation and Maintenance .................... -10.6 -9.9 -3.9 5.4 6.4 -1.0 1.4 -4.3 -23.0 0.0 -0.7 Procurement ........................................... -12.3 -6.2 14.5 9.6 30.2 -6.2 -7.9 -0.9 -9.3 1.5 1.1 RDT&E .................................................... -12.3 -6.7 15.1 10.6 29.1 -3.8 7.4 -5.1 -4.3 -2.8 -7.2 Military Construction ............................... -28.0 -35.3 -6.0 -18.4 93.6 -27.5 545.6 -86.5 -13.5 2.6 3.1
Total Real Growth ............................. -9.3 -8.0 -0.9 3.0 9.8 -1.3 4.3 -7.0 -11.7 0.0 -0.1
NOTE: War and supplemental funding is included in FY 1948 through FY 2021.
Percent Real Growth (%)
Table 6-16: ARMY TOA BY PUBLIC LAW TITLE (Continued)(Dollars in Millions)
Public Law Title
Current Dollars
FY 2020 Constant Dollars
185
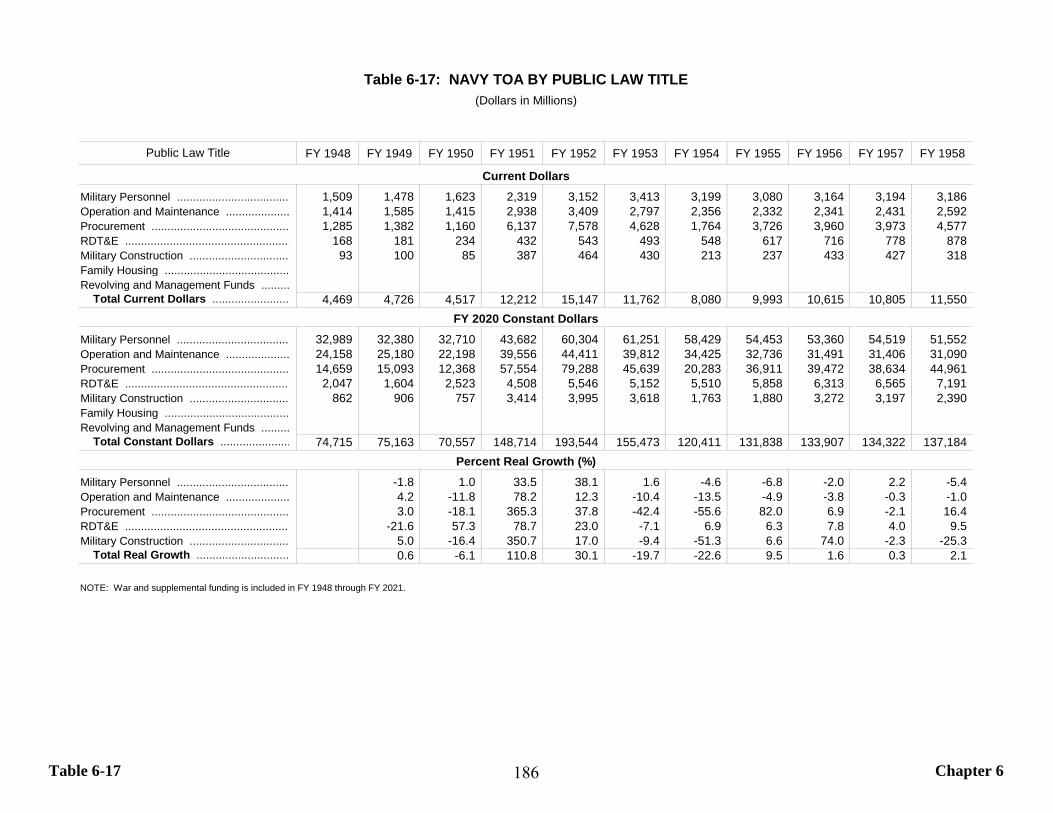
Table 6-17 Chapter 6
FY 1948 FY 1949 FY 1950 FY 1951 FY 1952 FY 1953 FY 1954 FY 1955 FY 1956 FY 1957 FY 1958
Military Personnel ................................... 1,509 1,478 1,623 2,319 3,152 3,413 3,199 3,080 3,164 3,194 3,186 Operation and Maintenance .................... 1,414 1,585 1,415 2,938 3,409 2,797 2,356 2,332 2,341 2,431 2,592 Procurement ........................................... 1,285 1,382 1,160 6,137 7,578 4,628 1,764 3,726 3,960 3,973 4,577 RDT&E .................................................... 168 181 234 432 543 493 548 617 716 778 878 Military Construction ............................... 93 100 85 387 464 430 213 237 433 427 318 Family Housing ....................................... Revolving and Management Funds .........
Total Current Dollars ........................ 4,469 4,726 4,517 12,212 15,147 11,762 8,080 9,993 10,615 10,805 11,550
Military Personnel ................................... 32,989 32,380 32,710 43,682 60,304 61,251 58,429 54,453 53,360 54,519 51,552 Operation and Maintenance .................... 24,158 25,180 22,198 39,556 44,411 39,812 34,425 32,736 31,491 31,406 31,090 Procurement ........................................... 14,659 15,093 12,368 57,554 79,288 45,639 20,283 36,911 39,472 38,634 44,961 RDT&E .................................................... 2,047 1,604 2,523 4,508 5,546 5,152 5,510 5,858 6,313 6,565 7,191 Military Construction ............................... 862 906 757 3,414 3,995 3,618 1,763 1,880 3,272 3,197 2,390 Family Housing ....................................... Revolving and Management Funds .........
Total Constant Dollars ...................... 74,715 75,163 70,557 148,714 193,544 155,473 120,411 131,838 133,907 134,322 137,184
Military Personnel ................................... -1.8 1.0 33.5 38.1 1.6 -4.6 -6.8 -2.0 2.2 -5.4 Operation and Maintenance .................... 4.2 -11.8 78.2 12.3 -10.4 -13.5 -4.9 -3.8 -0.3 -1.0 Procurement ........................................... 3.0 -18.1 365.3 37.8 -42.4 -55.6 82.0 6.9 -2.1 16.4 RDT&E .................................................... -21.6 57.3 78.7 23.0 -7.1 6.9 6.3 7.8 4.0 9.5 Military Construction ............................... 5.0 -16.4 350.7 17.0 -9.4 -51.3 6.6 74.0 -2.3 -25.3
Total Real Growth ............................. 0.6 -6.1 110.8 30.1 -19.7 -22.6 9.5 1.6 0.3 2.1
NOTE: War and supplemental funding is included in FY 1948 through FY 2021.
Percent Real Growth (%)
Table 6-17: NAVY TOA BY PUBLIC LAW TITLE(Dollars in Millions)
Public Law Title
Current Dollars
FY 2020 Constant Dollars
186
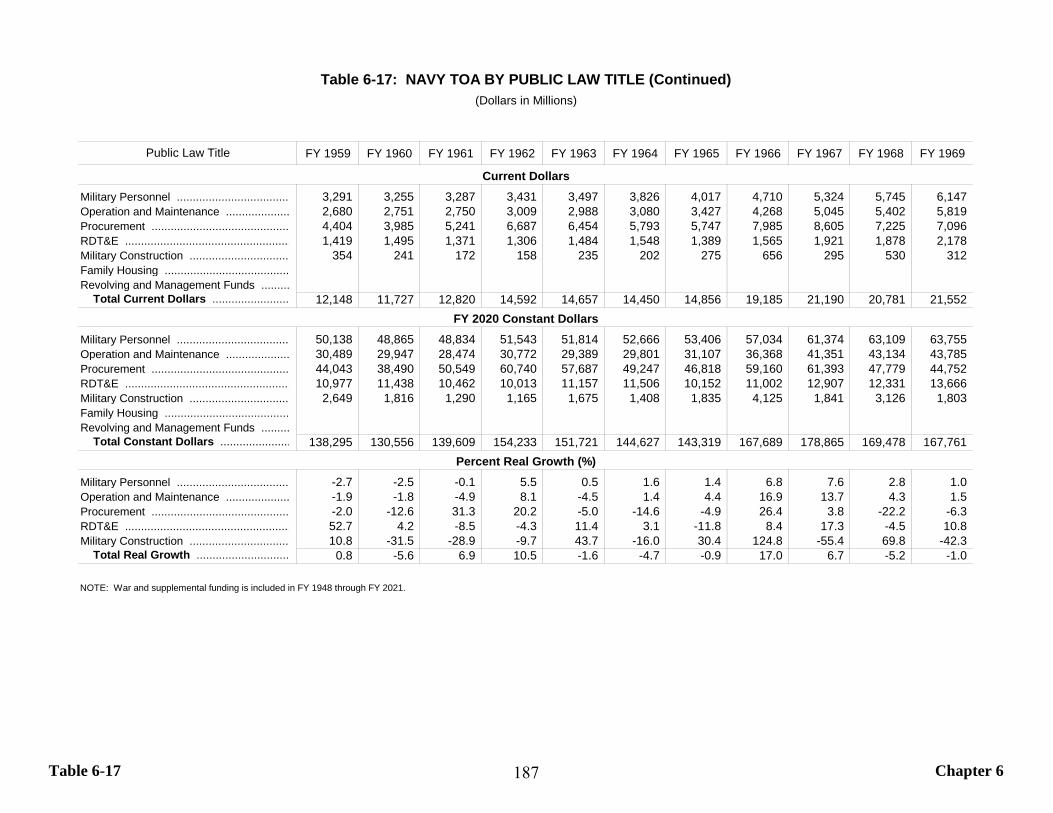
Table 6-17 Chapter 6
FY 1959 FY 1960 FY 1961 FY 1962 FY 1963 FY 1964 FY 1965 FY 1966 FY 1967 FY 1968 FY 1969
Military Personnel ................................... 3,291 3,255 3,287 3,431 3,497 3,826 4,017 4,710 5,324 5,745 6,147 Operation and Maintenance .................... 2,680 2,751 2,750 3,009 2,988 3,080 3,427 4,268 5,045 5,402 5,819 Procurement ........................................... 4,404 3,985 5,241 6,687 6,454 5,793 5,747 7,985 8,605 7,225 7,096 RDT&E .................................................... 1,419 1,495 1,371 1,306 1,484 1,548 1,389 1,565 1,921 1,878 2,178 Military Construction ............................... 354 241 172 158 235 202 275 656 295 530 312 Family Housing ....................................... Revolving and Management Funds .........
Total Current Dollars ........................ 12,148 11,727 12,820 14,592 14,657 14,450 14,856 19,185 21,190 20,781 21,552
Military Personnel ................................... 50,138 48,865 48,834 51,543 51,814 52,666 53,406 57,034 61,374 63,109 63,755 Operation and Maintenance .................... 30,489 29,947 28,474 30,772 29,389 29,801 31,107 36,368 41,351 43,134 43,785 Procurement ........................................... 44,043 38,490 50,549 60,740 57,687 49,247 46,818 59,160 61,393 47,779 44,752 RDT&E .................................................... 10,977 11,438 10,462 10,013 11,157 11,506 10,152 11,002 12,907 12,331 13,666 Military Construction ............................... 2,649 1,816 1,290 1,165 1,675 1,408 1,835 4,125 1,841 3,126 1,803 Family Housing ....................................... Revolving and Management Funds .........
Total Constant Dollars ...................... 138,295 130,556 139,609 154,233 151,721 144,627 143,319 167,689 178,865 169,478 167,761
Military Personnel ................................... -2.7 -2.5 -0.1 5.5 0.5 1.6 1.4 6.8 7.6 2.8 1.0 Operation and Maintenance .................... -1.9 -1.8 -4.9 8.1 -4.5 1.4 4.4 16.9 13.7 4.3 1.5 Procurement ........................................... -2.0 -12.6 31.3 20.2 -5.0 -14.6 -4.9 26.4 3.8 -22.2 -6.3 RDT&E .................................................... 52.7 4.2 -8.5 -4.3 11.4 3.1 -11.8 8.4 17.3 -4.5 10.8 Military Construction ............................... 10.8 -31.5 -28.9 -9.7 43.7 -16.0 30.4 124.8 -55.4 69.8 -42.3
Total Real Growth ............................. 0.8 -5.6 6.9 10.5 -1.6 -4.7 -0.9 17.0 6.7 -5.2 -1.0
NOTE: War and supplemental funding is included in FY 1948 through FY 2021.
Percent Real Growth (%)
Table 6-17: NAVY TOA BY PUBLIC LAW TITLE (Continued)(Dollars in Millions)
Public Law Title
Current Dollars
FY 2020 Constant Dollars
187
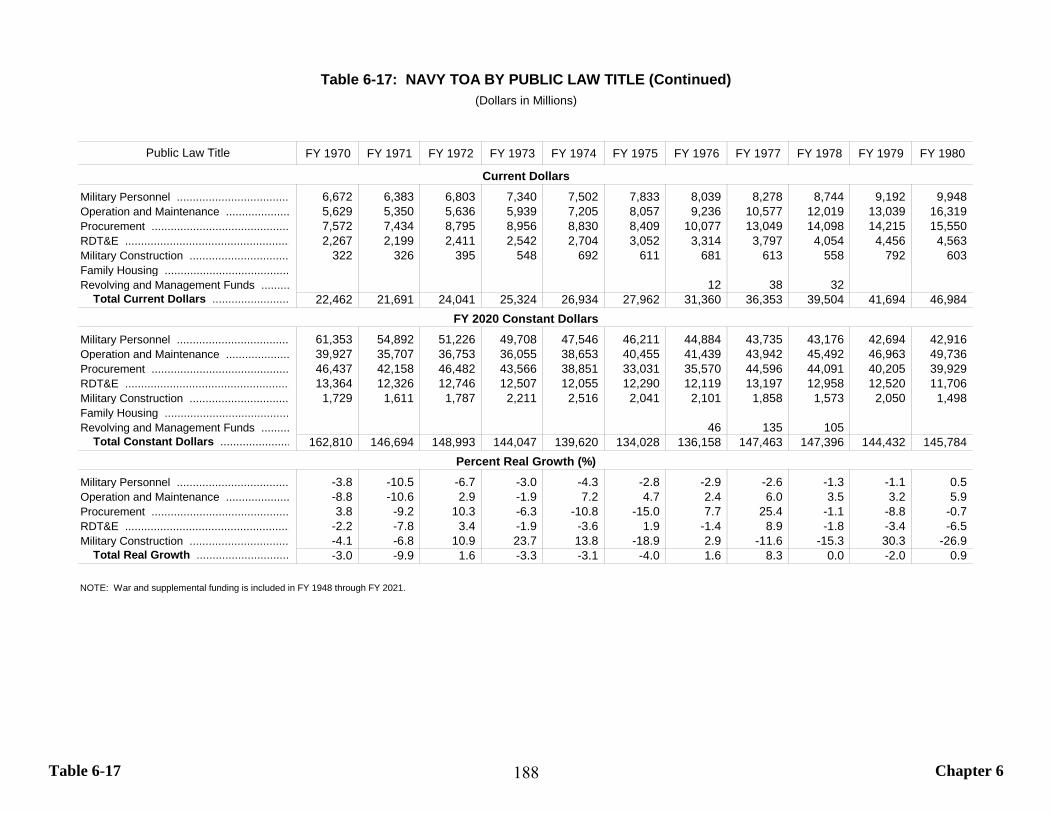
Table 6-17 Chapter 6
FY 1970 FY 1971 FY 1972 FY 1973 FY 1974 FY 1975 FY 1976 FY 1977 FY 1978 FY 1979 FY 1980
Military Personnel ................................... 6,672 6,383 6,803 7,340 7,502 7,833 8,039 8,278 8,744 9,192 9,948 Operation and Maintenance .................... 5,629 5,350 5,636 5,939 7,205 8,057 9,236 10,577 12,019 13,039 16,319 Procurement ........................................... 7,572 7,434 8,795 8,956 8,830 8,409 10,077 13,049 14,098 14,215 15,550 RDT&E .................................................... 2,267 2,199 2,411 2,542 2,704 3,052 3,314 3,797 4,054 4,456 4,563 Military Construction ............................... 322 326 395 548 692 611 681 613 558 792 603 Family Housing ....................................... Revolving and Management Funds ......... 12 38 32
Total Current Dollars ........................ 22,462 21,691 24,041 25,324 26,934 27,962 31,360 36,353 39,504 41,694 46,984
Military Personnel ................................... 61,353 54,892 51,226 49,708 47,546 46,211 44,884 43,735 43,176 42,694 42,916 Operation and Maintenance .................... 39,927 35,707 36,753 36,055 38,653 40,455 41,439 43,942 45,492 46,963 49,736 Procurement ........................................... 46,437 42,158 46,482 43,566 38,851 33,031 35,570 44,596 44,091 40,205 39,929 RDT&E .................................................... 13,364 12,326 12,746 12,507 12,055 12,290 12,119 13,197 12,958 12,520 11,706 Military Construction ............................... 1,729 1,611 1,787 2,211 2,516 2,041 2,101 1,858 1,573 2,050 1,498 Family Housing ....................................... Revolving and Management Funds ......... 46 135 105
Total Constant Dollars ...................... 162,810 146,694 148,993 144,047 139,620 134,028 136,158 147,463 147,396 144,432 145,784
Military Personnel ................................... -3.8 -10.5 -6.7 -3.0 -4.3 -2.8 -2.9 -2.6 -1.3 -1.1 0.5 Operation and Maintenance .................... -8.8 -10.6 2.9 -1.9 7.2 4.7 2.4 6.0 3.5 3.2 5.9 Procurement ........................................... 3.8 -9.2 10.3 -6.3 -10.8 -15.0 7.7 25.4 -1.1 -8.8 -0.7 RDT&E .................................................... -2.2 -7.8 3.4 -1.9 -3.6 1.9 -1.4 8.9 -1.8 -3.4 -6.5 Military Construction ............................... -4.1 -6.8 10.9 23.7 13.8 -18.9 2.9 -11.6 -15.3 30.3 -26.9
Total Real Growth ............................. -3.0 -9.9 1.6 -3.3 -3.1 -4.0 1.6 8.3 0.0 -2.0 0.9
NOTE: War and supplemental funding is included in FY 1948 through FY 2021.
Percent Real Growth (%)
Table 6-17: NAVY TOA BY PUBLIC LAW TITLE (Continued)(Dollars in Millions)
Public Law Title
Current Dollars
FY 2020 Constant Dollars
188
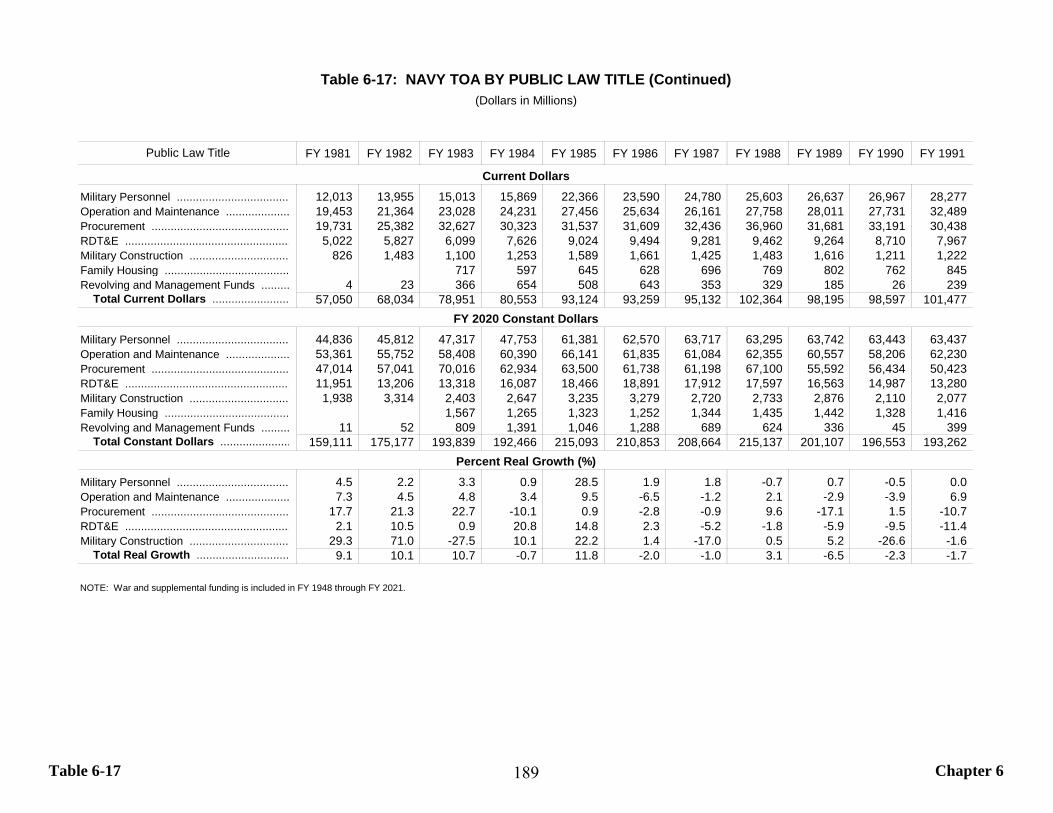
Table 6-17 Chapter 6
FY 1981 FY 1982 FY 1983 FY 1984 FY 1985 FY 1986 FY 1987 FY 1988 FY 1989 FY 1990 FY 1991
Military Personnel ................................... 12,013 13,955 15,013 15,869 22,366 23,590 24,780 25,603 26,637 26,967 28,277 Operation and Maintenance .................... 19,453 21,364 23,028 24,231 27,456 25,634 26,161 27,758 28,011 27,731 32,489 Procurement ........................................... 19,731 25,382 32,627 30,323 31,537 31,609 32,436 36,960 31,681 33,191 30,438 RDT&E .................................................... 5,022 5,827 6,099 7,626 9,024 9,494 9,281 9,462 9,264 8,710 7,967 Military Construction ............................... 826 1,483 1,100 1,253 1,589 1,661 1,425 1,483 1,616 1,211 1,222 Family Housing ....................................... 717 597 645 628 696 769 802 762 845 Revolving and Management Funds ......... 4 23 366 654 508 643 353 329 185 26 239
Total Current Dollars ........................ 57,050 68,034 78,951 80,553 93,124 93,259 95,132 102,364 98,195 98,597 101,477
Military Personnel ................................... 44,836 45,812 47,317 47,753 61,381 62,570 63,717 63,295 63,742 63,443 63,437 Operation and Maintenance .................... 53,361 55,752 58,408 60,390 66,141 61,835 61,084 62,355 60,557 58,206 62,230 Procurement ........................................... 47,014 57,041 70,016 62,934 63,500 61,738 61,198 67,100 55,592 56,434 50,423 RDT&E .................................................... 11,951 13,206 13,318 16,087 18,466 18,891 17,912 17,597 16,563 14,987 13,280 Military Construction ............................... 1,938 3,314 2,403 2,647 3,235 3,279 2,720 2,733 2,876 2,110 2,077 Family Housing ....................................... 1,567 1,265 1,323 1,252 1,344 1,435 1,442 1,328 1,416 Revolving and Management Funds ......... 11 52 809 1,391 1,046 1,288 689 624 336 45 399
Total Constant Dollars ...................... 159,111 175,177 193,839 192,466 215,093 210,853 208,664 215,137 201,107 196,553 193,262
Military Personnel ................................... 4.5 2.2 3.3 0.9 28.5 1.9 1.8 -0.7 0.7 -0.5 0.0 Operation and Maintenance .................... 7.3 4.5 4.8 3.4 9.5 -6.5 -1.2 2.1 -2.9 -3.9 6.9 Procurement ........................................... 17.7 21.3 22.7 -10.1 0.9 -2.8 -0.9 9.6 -17.1 1.5 -10.7 RDT&E .................................................... 2.1 10.5 0.9 20.8 14.8 2.3 -5.2 -1.8 -5.9 -9.5 -11.4 Military Construction ............................... 29.3 71.0 -27.5 10.1 22.2 1.4 -17.0 0.5 5.2 -26.6 -1.6
Total Real Growth ............................. 9.1 10.1 10.7 -0.7 11.8 -2.0 -1.0 3.1 -6.5 -2.3 -1.7
NOTE: War and supplemental funding is included in FY 1948 through FY 2021.
Percent Real Growth (%)
Table 6-17: NAVY TOA BY PUBLIC LAW TITLE (Continued)(Dollars in Millions)
Public Law Title
Current Dollars
FY 2020 Constant Dollars
189
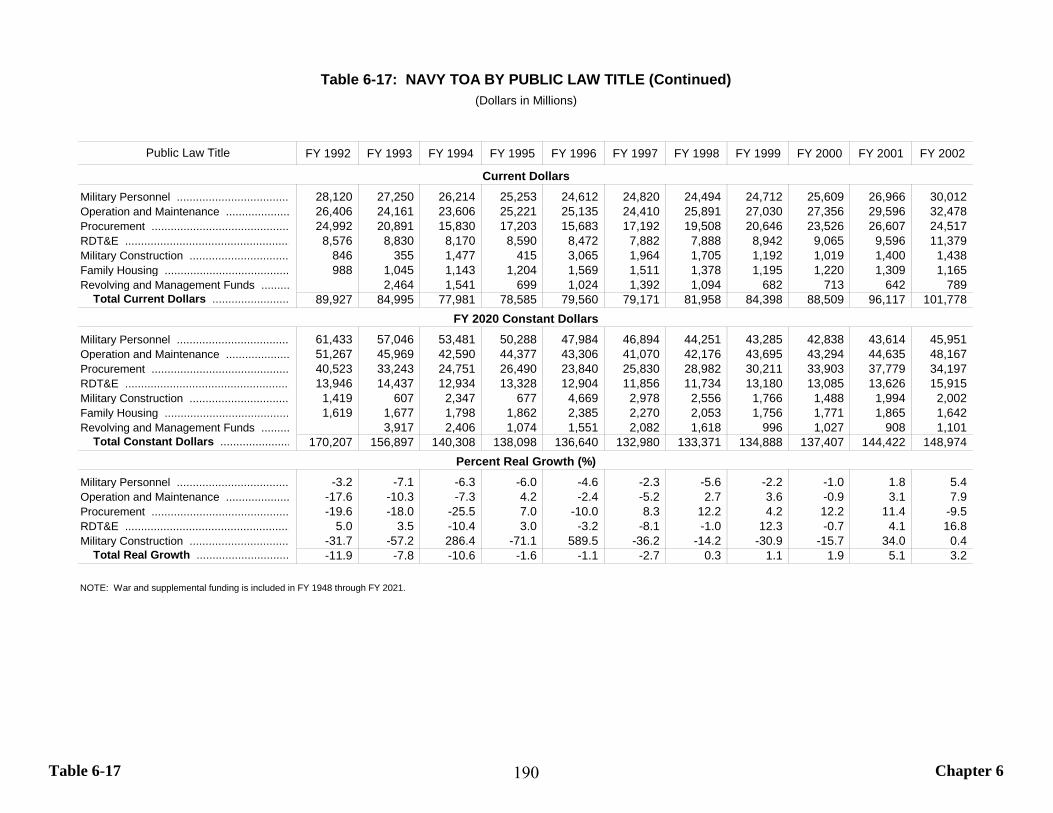
Table 6-17 Chapter 6
FY 1992 FY 1993 FY 1994 FY 1995 FY 1996 FY 1997 FY 1998 FY 1999 FY 2000 FY 2001 FY 2002
Military Personnel ................................... 28,120 27,250 26,214 25,253 24,612 24,820 24,494 24,712 25,609 26,966 30,012 Operation and Maintenance .................... 26,406 24,161 23,606 25,221 25,135 24,410 25,891 27,030 27,356 29,596 32,478 Procurement ........................................... 24,992 20,891 15,830 17,203 15,683 17,192 19,508 20,646 23,526 26,607 24,517 RDT&E .................................................... 8,576 8,830 8,170 8,590 8,472 7,882 7,888 8,942 9,065 9,596 11,379 Military Construction ............................... 846 355 1,477 415 3,065 1,964 1,705 1,192 1,019 1,400 1,438 Family Housing ....................................... 988 1,045 1,143 1,204 1,569 1,511 1,378 1,195 1,220 1,309 1,165 Revolving and Management Funds ......... 2,464 1,541 699 1,024 1,392 1,094 682 713 642 789
Total Current Dollars ........................ 89,927 84,995 77,981 78,585 79,560 79,171 81,958 84,398 88,509 96,117 101,778
Military Personnel ................................... 61,433 57,046 53,481 50,288 47,984 46,894 44,251 43,285 42,838 43,614 45,951 Operation and Maintenance .................... 51,267 45,969 42,590 44,377 43,306 41,070 42,176 43,695 43,294 44,635 48,167 Procurement ........................................... 40,523 33,243 24,751 26,490 23,840 25,830 28,982 30,211 33,903 37,779 34,197 RDT&E .................................................... 13,946 14,437 12,934 13,328 12,904 11,856 11,734 13,180 13,085 13,626 15,915 Military Construction ............................... 1,419 607 2,347 677 4,669 2,978 2,556 1,766 1,488 1,994 2,002 Family Housing ....................................... 1,619 1,677 1,798 1,862 2,385 2,270 2,053 1,756 1,771 1,865 1,642 Revolving and Management Funds ......... 3,917 2,406 1,074 1,551 2,082 1,618 996 1,027 908 1,101
Total Constant Dollars ...................... 170,207 156,897 140,308 138,098 136,640 132,980 133,371 134,888 137,407 144,422 148,974
Military Personnel ................................... -3.2 -7.1 -6.3 -6.0 -4.6 -2.3 -5.6 -2.2 -1.0 1.8 5.4 Operation and Maintenance .................... -17.6 -10.3 -7.3 4.2 -2.4 -5.2 2.7 3.6 -0.9 3.1 7.9 Procurement ........................................... -19.6 -18.0 -25.5 7.0 -10.0 8.3 12.2 4.2 12.2 11.4 -9.5 RDT&E .................................................... 5.0 3.5 -10.4 3.0 -3.2 -8.1 -1.0 12.3 -0.7 4.1 16.8 Military Construction ............................... -31.7 -57.2 286.4 -71.1 589.5 -36.2 -14.2 -30.9 -15.7 34.0 0.4
Total Real Growth ............................. -11.9 -7.8 -10.6 -1.6 -1.1 -2.7 0.3 1.1 1.9 5.1 3.2
NOTE: War and supplemental funding is included in FY 1948 through FY 2021.
Percent Real Growth (%)
Table 6-17: NAVY TOA BY PUBLIC LAW TITLE (Continued)(Dollars in Millions)
Public Law Title
Current Dollars
FY 2020 Constant Dollars
190
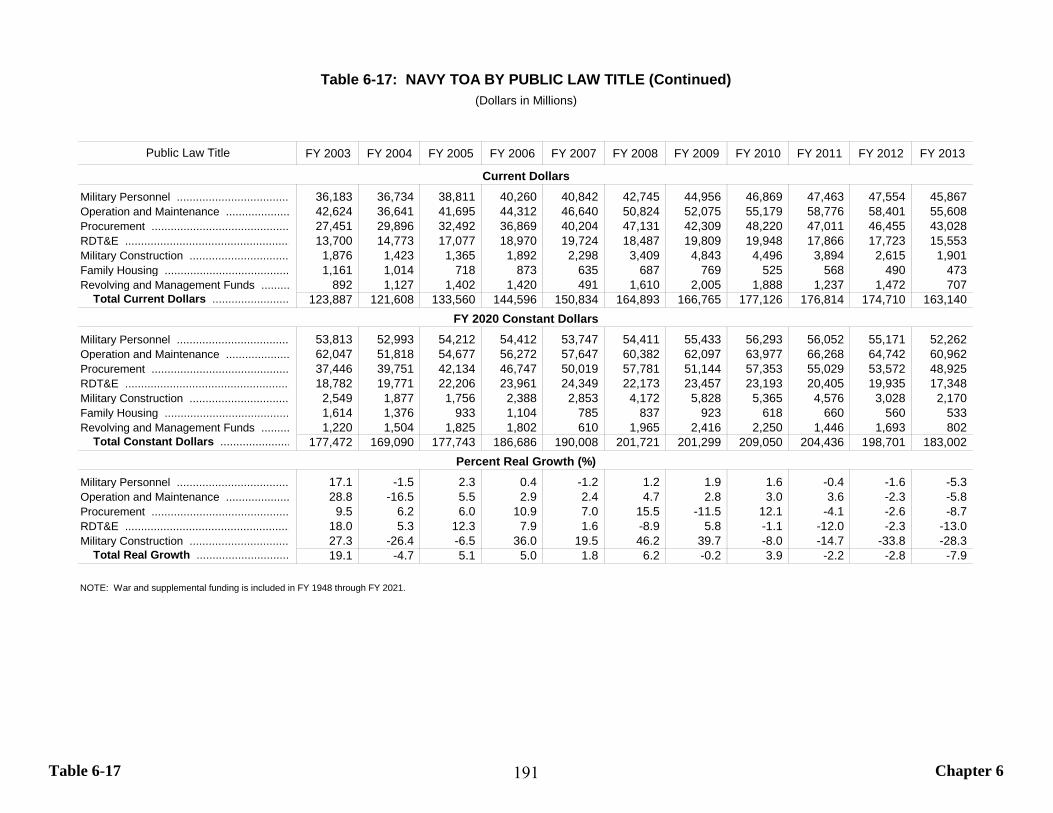
Table 6-17 Chapter 6
FY 2003 FY 2004 FY 2005 FY 2006 FY 2007 FY 2008 FY 2009 FY 2010 FY 2011 FY 2012 FY 2013
Military Personnel ................................... 36,183 36,734 38,811 40,260 40,842 42,745 44,956 46,869 47,463 47,554 45,867 Operation and Maintenance .................... 42,624 36,641 41,695 44,312 46,640 50,824 52,075 55,179 58,776 58,401 55,608 Procurement ........................................... 27,451 29,896 32,492 36,869 40,204 47,131 42,309 48,220 47,011 46,455 43,028 RDT&E .................................................... 13,700 14,773 17,077 18,970 19,724 18,487 19,809 19,948 17,866 17,723 15,553 Military Construction ............................... 1,876 1,423 1,365 1,892 2,298 3,409 4,843 4,496 3,894 2,615 1,901 Family Housing ....................................... 1,161 1,014 718 873 635 687 769 525 568 490 473 Revolving and Management Funds ......... 892 1,127 1,402 1,420 491 1,610 2,005 1,888 1,237 1,472 707
Total Current Dollars ........................ 123,887 121,608 133,560 144,596 150,834 164,893 166,765 177,126 176,814 174,710 163,140
Military Personnel ................................... 53,813 52,993 54,212 54,412 53,747 54,411 55,433 56,293 56,052 55,171 52,262 Operation and Maintenance .................... 62,047 51,818 54,677 56,272 57,647 60,382 62,097 63,977 66,268 64,742 60,962 Procurement ........................................... 37,446 39,751 42,134 46,747 50,019 57,781 51,144 57,353 55,029 53,572 48,925 RDT&E .................................................... 18,782 19,771 22,206 23,961 24,349 22,173 23,457 23,193 20,405 19,935 17,348 Military Construction ............................... 2,549 1,877 1,756 2,388 2,853 4,172 5,828 5,365 4,576 3,028 2,170 Family Housing ....................................... 1,614 1,376 933 1,104 785 837 923 618 660 560 533 Revolving and Management Funds ......... 1,220 1,504 1,825 1,802 610 1,965 2,416 2,250 1,446 1,693 802
Total Constant Dollars ...................... 177,472 169,090 177,743 186,686 190,008 201,721 201,299 209,050 204,436 198,701 183,002
Military Personnel ................................... 17.1 -1.5 2.3 0.4 -1.2 1.2 1.9 1.6 -0.4 -1.6 -5.3 Operation and Maintenance .................... 28.8 -16.5 5.5 2.9 2.4 4.7 2.8 3.0 3.6 -2.3 -5.8 Procurement ........................................... 9.5 6.2 6.0 10.9 7.0 15.5 -11.5 12.1 -4.1 -2.6 -8.7 RDT&E .................................................... 18.0 5.3 12.3 7.9 1.6 -8.9 5.8 -1.1 -12.0 -2.3 -13.0 Military Construction ............................... 27.3 -26.4 -6.5 36.0 19.5 46.2 39.7 -8.0 -14.7 -33.8 -28.3
Total Real Growth ............................. 19.1 -4.7 5.1 5.0 1.8 6.2 -0.2 3.9 -2.2 -2.8 -7.9
NOTE: War and supplemental funding is included in FY 1948 through FY 2021.
Percent Real Growth (%)
Table 6-17: NAVY TOA BY PUBLIC LAW TITLE (Continued)(Dollars in Millions)
Public Law Title
Current Dollars
FY 2020 Constant Dollars
191
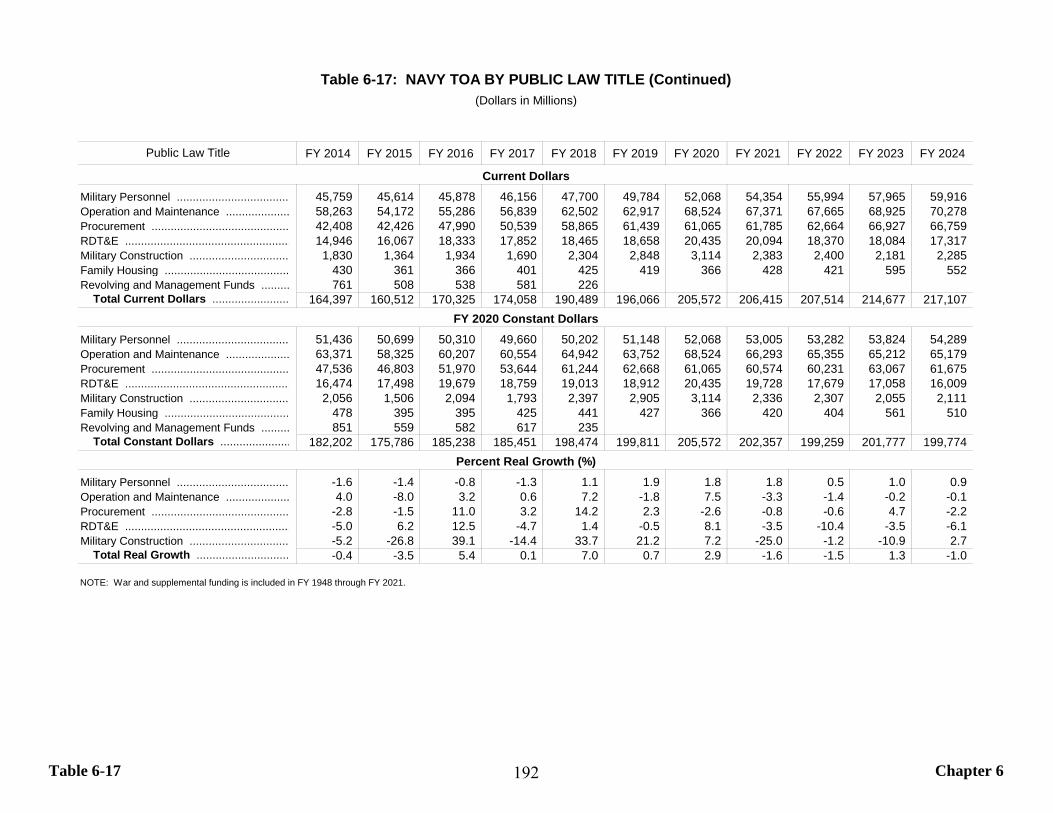
Table 6-17 Chapter 6
FY 2014 FY 2015 FY 2016 FY 2017 FY 2018 FY 2019 FY 2020 FY 2021 FY 2022 FY 2023 FY 2024
Military Personnel ................................... 45,759 45,614 45,878 46,156 47,700 49,784 52,068 54,354 55,994 57,965 59,916 Operation and Maintenance .................... 58,263 54,172 55,286 56,839 62,502 62,917 68,524 67,371 67,665 68,925 70,278 Procurement ........................................... 42,408 42,426 47,990 50,539 58,865 61,439 61,065 61,785 62,664 66,927 66,759 RDT&E .................................................... 14,946 16,067 18,333 17,852 18,465 18,658 20,435 20,094 18,370 18,084 17,317 Military Construction ............................... 1,830 1,364 1,934 1,690 2,304 2,848 3,114 2,383 2,400 2,181 2,285 Family Housing ....................................... 430 361 366 401 425 419 366 428 421 595 552 Revolving and Management Funds ......... 761 508 538 581 226
Total Current Dollars ........................ 164,397 160,512 170,325 174,058 190,489 196,066 205,572 206,415 207,514 214,677 217,107
Military Personnel ................................... 51,436 50,699 50,310 49,660 50,202 51,148 52,068 53,005 53,282 53,824 54,289 Operation and Maintenance .................... 63,371 58,325 60,207 60,554 64,942 63,752 68,524 66,293 65,355 65,212 65,179 Procurement ........................................... 47,536 46,803 51,970 53,644 61,244 62,668 61,065 60,574 60,231 63,067 61,675 RDT&E .................................................... 16,474 17,498 19,679 18,759 19,013 18,912 20,435 19,728 17,679 17,058 16,009 Military Construction ............................... 2,056 1,506 2,094 1,793 2,397 2,905 3,114 2,336 2,307 2,055 2,111 Family Housing ....................................... 478 395 395 425 441 427 366 420 404 561 510 Revolving and Management Funds ......... 851 559 582 617 235
Total Constant Dollars ...................... 182,202 175,786 185,238 185,451 198,474 199,811 205,572 202,357 199,259 201,777 199,774
Military Personnel ................................... -1.6 -1.4 -0.8 -1.3 1.1 1.9 1.8 1.8 0.5 1.0 0.9 Operation and Maintenance .................... 4.0 -8.0 3.2 0.6 7.2 -1.8 7.5 -3.3 -1.4 -0.2 -0.1 Procurement ........................................... -2.8 -1.5 11.0 3.2 14.2 2.3 -2.6 -0.8 -0.6 4.7 -2.2 RDT&E .................................................... -5.0 6.2 12.5 -4.7 1.4 -0.5 8.1 -3.5 -10.4 -3.5 -6.1 Military Construction ............................... -5.2 -26.8 39.1 -14.4 33.7 21.2 7.2 -25.0 -1.2 -10.9 2.7
Total Real Growth ............................. -0.4 -3.5 5.4 0.1 7.0 0.7 2.9 -1.6 -1.5 1.3 -1.0
NOTE: War and supplemental funding is included in FY 1948 through FY 2021.
Percent Real Growth (%)
Table 6-17: NAVY TOA BY PUBLIC LAW TITLE (Continued)(Dollars in Millions)
Public Law Title
Current Dollars
FY 2020 Constant Dollars
192

Table 6-18 Chapter 6
FY 1948 FY 1949 FY 1950 FY 1951 FY 1952 FY 1953 FY 1954 FY 1955 FY 1956 FY 1957 FY 1958
Military Personnel ................................... 1,035 1,223 1,335 1,947 2,996 3,416 3,295 3,505 3,791 3,799 3,906 Operation and Maintenance .................... 1,235 1,225 1,107 3,131 3,515 3,289 2,953 3,012 3,778 3,906 4,170 Procurement ........................................... 1,651 1,545 2,616 8,625 11,603 9,519 3,795 3,155 6,160 6,659 7,707 RDT&E .................................................... 141 199 202 463 797 1,094 1,102 1,300 2,109 2,868 2,464 Military Construction ............................... 35 52 64 936 1,075 1,332 884 1,498 1,158 1,217 911 Family Housing ....................................... Revolving and Management Funds .........
Total Current Dollars ........................ 4,097 4,244 5,323 15,102 19,986 18,650 12,029 12,469 16,997 18,449 19,158
Military Personnel ................................... 23,162 27,332 27,184 37,520 58,073 61,954 60,533 62,594 64,231 64,805 62,955 Operation and Maintenance .................... 18,693 18,473 17,605 42,148 48,330 43,870 39,923 39,153 45,305 45,693 46,717 Procurement ........................................... 17,410 15,967 26,327 84,332 113,838 91,178 34,466 27,361 52,263 54,773 63,359 RDT&E .................................................... 1,449 1,962 1,948 4,300 7,308 9,966 9,813 10,932 16,527 21,407 18,240 Military Construction ............................... 315 458 549 8,030 9,430 11,315 7,288 11,728 8,946 9,184 6,905 Family Housing ....................................... Revolving and Management Funds .........
Total Constant Dollars ...................... 61,028 64,191 73,613 176,330 236,979 218,282 152,024 151,769 187,271 195,861 198,175
Military Personnel ................................... 18.0 -0.5 38.0 54.8 6.7 -2.3 3.4 2.6 0.9 -2.9 Operation and Maintenance .................... -1.2 -4.7 139.4 14.7 -9.2 -9.0 -1.9 15.7 0.9 2.2 Procurement ........................................... -8.3 64.9 220.3 35.0 -19.9 -62.2 -20.6 91.0 4.8 15.7 RDT&E .................................................... 35.4 -0.7 120.7 69.9 36.4 -1.5 11.4 51.2 29.5 -14.8 Military Construction ............................... 45.6 19.7 1,363.6 17.4 20.0 -35.6 60.9 -23.7 2.7 -24.8
Total Real Growth ............................. 5.2 14.7 139.5 34.4 -7.9 -30.4 -0.2 23.4 4.6 1.2
NOTE: War and supplemental funding is included in FY 1948 through FY 2021.
Percent Real Growth (%)
Table 6-18: AIR FORCE TOA BY PUBLIC LAW TITLE(Dollars in Millions)
Public Law Title
Current Dollars
FY 2020 Constant Dollars
193

Table 6-18 Chapter 6
FY 1959 FY 1960 FY 1961 FY 1962 FY 1963 FY 1964 FY 1965 FY 1966 FY 1967 FY 1968 FY 1969
Military Personnel ................................... 4,079 4,064 4,090 4,268 4,202 4,540 4,663 5,075 5,558 5,825 6,240 Operation and Maintenance .................... 4,267 4,316 4,488 4,625 4,550 4,559 4,855 5,259 5,853 6,169 7,118 Procurement ........................................... 7,617 5,764 7,243 6,928 7,035 6,716 6,366 8,867 9,217 9,072 8,760 RDT&E .................................................... 2,550 2,704 3,572 3,343 3,837 3,627 3,137 3,315 3,234 3,412 3,446 Military Construction ............................... 1,085 813 706 565 803 517 407 792 408 495 293 Family Housing ....................................... Revolving and Management Funds .........
Total Current Dollars ........................ 19,599 17,662 20,098 19,730 20,427 19,958 19,428 23,309 24,270 24,974 25,857
Military Personnel ................................... 61,535 60,436 59,862 63,254 61,875 62,212 61,810 61,469 64,091 64,018 63,437 Operation and Maintenance .................... 46,326 45,770 45,725 46,746 45,455 44,511 45,480 47,326 51,339 53,110 57,952 Procurement ........................................... 61,387 46,680 58,945 55,750 56,098 52,331 47,958 63,592 63,663 60,403 55,817 RDT&E .................................................... 18,649 19,629 25,405 23,870 27,189 25,479 21,626 22,090 20,883 21,295 20,707 Military Construction ............................... 8,131 6,084 5,262 4,151 5,656 3,555 2,718 5,003 2,500 2,900 1,656 Family Housing ....................................... Revolving and Management Funds .........
Total Constant Dollars ...................... 196,028 178,598 195,199 193,771 196,273 188,088 179,591 199,480 202,475 201,726 199,570
Military Personnel ................................... -2.3 -1.8 -0.9 5.7 -2.2 0.5 -0.6 -0.6 4.3 -0.1 -0.9 Operation and Maintenance .................... -0.8 -1.2 -0.1 2.2 -2.8 -2.1 2.2 4.1 8.5 3.4 9.1 Procurement ........................................... -3.1 -24.0 26.3 -5.4 0.6 -6.7 -8.4 32.6 0.1 -5.1 -7.6 RDT&E .................................................... 2.2 5.3 29.4 -6.0 13.9 -6.3 -15.1 2.1 -5.5 2.0 -2.8 Military Construction ............................... 17.8 -25.2 -13.5 -21.1 36.3 -37.1 -23.6 84.1 -50.0 16.0 -42.9
Total Real Growth ............................. -1.1 -8.9 9.3 -0.7 1.3 -4.2 -4.5 11.1 1.5 -0.4 -1.1
NOTE: War and supplemental funding is included in FY 1948 through FY 2021.
Percent Real Growth (%)
Table 6-18: AIR FORCE TOA BY PUBLIC LAW TITLE (Continued)(Dollars in Millions)
Public Law Title
Current Dollars
FY 2020 Constant Dollars
194
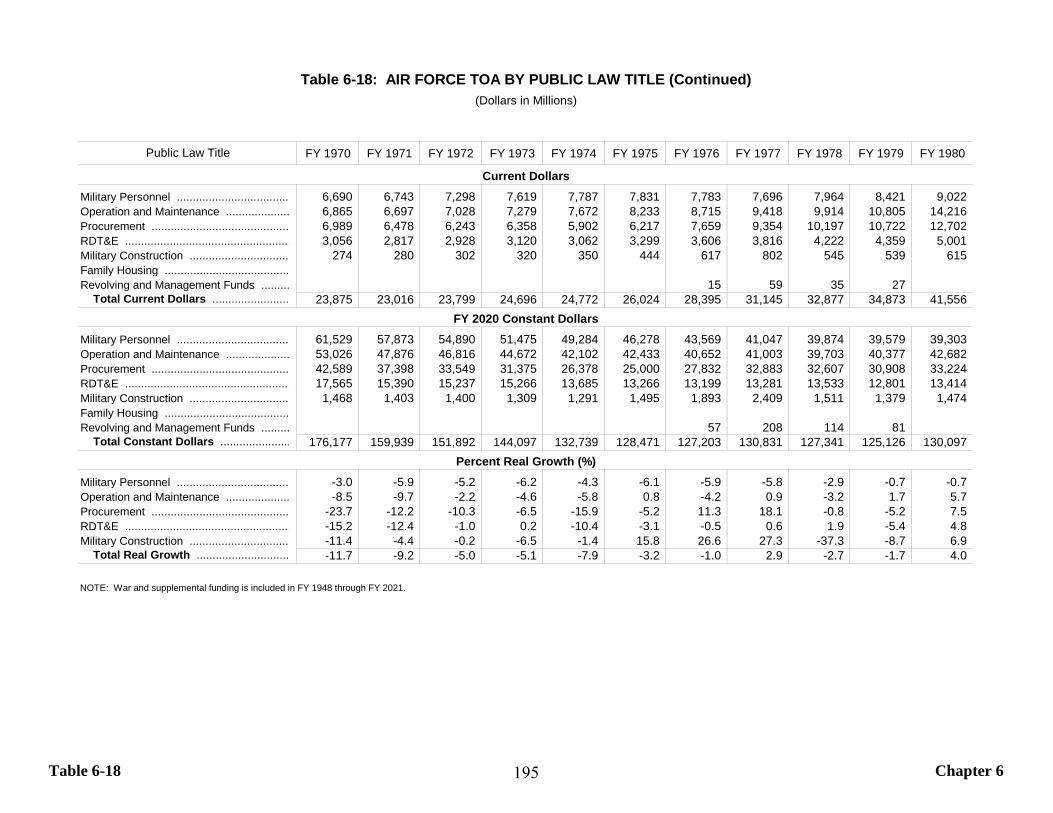
Table 6-18 Chapter 6
FY 1970 FY 1971 FY 1972 FY 1973 FY 1974 FY 1975 FY 1976 FY 1977 FY 1978 FY 1979 FY 1980
Military Personnel ................................... 6,690 6,743 7,298 7,619 7,787 7,831 7,783 7,696 7,964 8,421 9,022 Operation and Maintenance .................... 6,865 6,697 7,028 7,279 7,672 8,233 8,715 9,418 9,914 10,805 14,216 Procurement ........................................... 6,989 6,478 6,243 6,358 5,902 6,217 7,659 9,354 10,197 10,722 12,702 RDT&E .................................................... 3,056 2,817 2,928 3,120 3,062 3,299 3,606 3,816 4,222 4,359 5,001 Military Construction ............................... 274 280 302 320 350 444 617 802 545 539 615 Family Housing ....................................... Revolving and Management Funds ......... 15 59 35 27
Total Current Dollars ........................ 23,875 23,016 23,799 24,696 24,772 26,024 28,395 31,145 32,877 34,873 41,556
Military Personnel ................................... 61,529 57,873 54,890 51,475 49,284 46,278 43,569 41,047 39,874 39,579 39,303 Operation and Maintenance .................... 53,026 47,876 46,816 44,672 42,102 42,433 40,652 41,003 39,703 40,377 42,682 Procurement ........................................... 42,589 37,398 33,549 31,375 26,378 25,000 27,832 32,883 32,607 30,908 33,224 RDT&E .................................................... 17,565 15,390 15,237 15,266 13,685 13,266 13,199 13,281 13,533 12,801 13,414 Military Construction ............................... 1,468 1,403 1,400 1,309 1,291 1,495 1,893 2,409 1,511 1,379 1,474 Family Housing ....................................... Revolving and Management Funds ......... 57 208 114 81
Total Constant Dollars ...................... 176,177 159,939 151,892 144,097 132,739 128,471 127,203 130,831 127,341 125,126 130,097
Military Personnel ................................... -3.0 -5.9 -5.2 -6.2 -4.3 -6.1 -5.9 -5.8 -2.9 -0.7 -0.7 Operation and Maintenance .................... -8.5 -9.7 -2.2 -4.6 -5.8 0.8 -4.2 0.9 -3.2 1.7 5.7 Procurement ........................................... -23.7 -12.2 -10.3 -6.5 -15.9 -5.2 11.3 18.1 -0.8 -5.2 7.5 RDT&E .................................................... -15.2 -12.4 -1.0 0.2 -10.4 -3.1 -0.5 0.6 1.9 -5.4 4.8 Military Construction ............................... -11.4 -4.4 -0.2 -6.5 -1.4 15.8 26.6 27.3 -37.3 -8.7 6.9
Total Real Growth ............................. -11.7 -9.2 -5.0 -5.1 -7.9 -3.2 -1.0 2.9 -2.7 -1.7 4.0
NOTE: War and supplemental funding is included in FY 1948 through FY 2021.
Percent Real Growth (%)
Table 6-18: AIR FORCE TOA BY PUBLIC LAW TITLE (Continued)(Dollars in Millions)
Public Law Title
Current Dollars
FY 2020 Constant Dollars
195
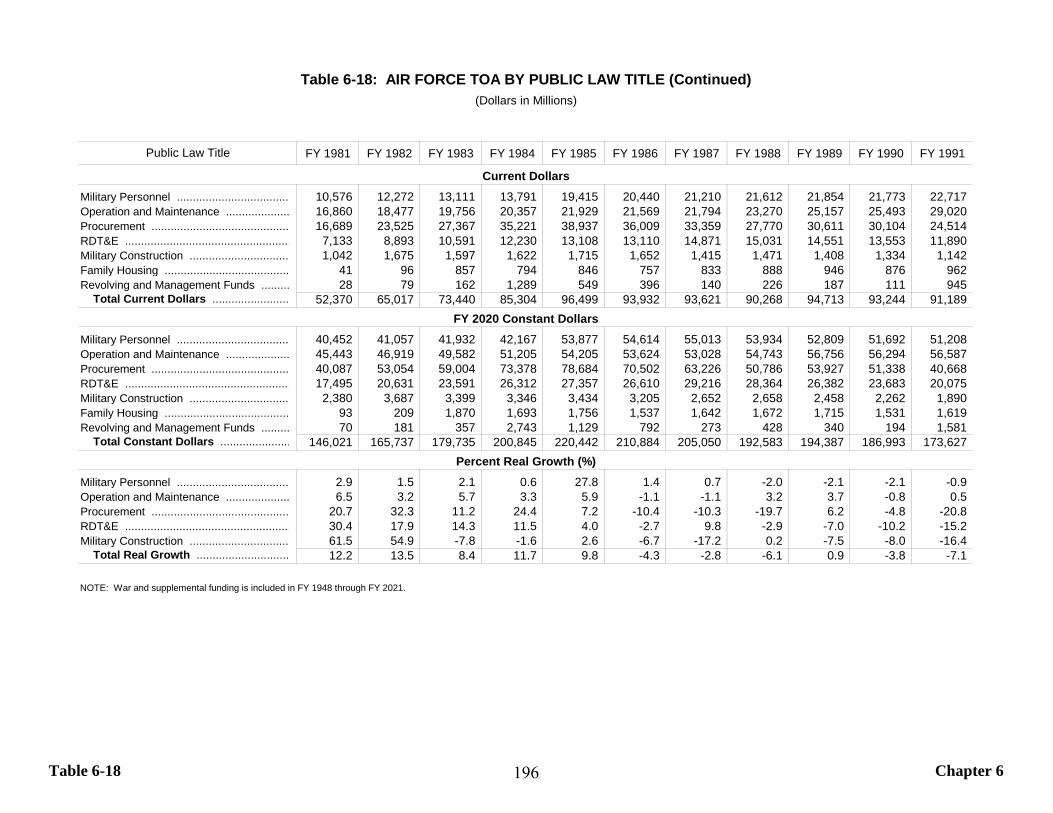
Table 6-18 Chapter 6
FY 1981 FY 1982 FY 1983 FY 1984 FY 1985 FY 1986 FY 1987 FY 1988 FY 1989 FY 1990 FY 1991
Military Personnel ................................... 10,576 12,272 13,111 13,791 19,415 20,440 21,210 21,612 21,854 21,773 22,717 Operation and Maintenance .................... 16,860 18,477 19,756 20,357 21,929 21,569 21,794 23,270 25,157 25,493 29,020 Procurement ........................................... 16,689 23,525 27,367 35,221 38,937 36,009 33,359 27,770 30,611 30,104 24,514 RDT&E .................................................... 7,133 8,893 10,591 12,230 13,108 13,110 14,871 15,031 14,551 13,553 11,890 Military Construction ............................... 1,042 1,675 1,597 1,622 1,715 1,652 1,415 1,471 1,408 1,334 1,142 Family Housing ....................................... 41 96 857 794 846 757 833 888 946 876 962 Revolving and Management Funds ......... 28 79 162 1,289 549 396 140 226 187 111 945
Total Current Dollars ........................ 52,370 65,017 73,440 85,304 96,499 93,932 93,621 90,268 94,713 93,244 91,189
Military Personnel ................................... 40,452 41,057 41,932 42,167 53,877 54,614 55,013 53,934 52,809 51,692 51,208 Operation and Maintenance .................... 45,443 46,919 49,582 51,205 54,205 53,624 53,028 54,743 56,756 56,294 56,587 Procurement ........................................... 40,087 53,054 59,004 73,378 78,684 70,502 63,226 50,786 53,927 51,338 40,668 RDT&E .................................................... 17,495 20,631 23,591 26,312 27,357 26,610 29,216 28,364 26,382 23,683 20,075 Military Construction ............................... 2,380 3,687 3,399 3,346 3,434 3,205 2,652 2,658 2,458 2,262 1,890 Family Housing ....................................... 93 209 1,870 1,693 1,756 1,537 1,642 1,672 1,715 1,531 1,619 Revolving and Management Funds ......... 70 181 357 2,743 1,129 792 273 428 340 194 1,581
Total Constant Dollars ...................... 146,021 165,737 179,735 200,845 220,442 210,884 205,050 192,583 194,387 186,993 173,627
Military Personnel ................................... 2.9 1.5 2.1 0.6 27.8 1.4 0.7 -2.0 -2.1 -2.1 -0.9 Operation and Maintenance .................... 6.5 3.2 5.7 3.3 5.9 -1.1 -1.1 3.2 3.7 -0.8 0.5 Procurement ........................................... 20.7 32.3 11.2 24.4 7.2 -10.4 -10.3 -19.7 6.2 -4.8 -20.8 RDT&E .................................................... 30.4 17.9 14.3 11.5 4.0 -2.7 9.8 -2.9 -7.0 -10.2 -15.2 Military Construction ............................... 61.5 54.9 -7.8 -1.6 2.6 -6.7 -17.2 0.2 -7.5 -8.0 -16.4
Total Real Growth ............................. 12.2 13.5 8.4 11.7 9.8 -4.3 -2.8 -6.1 0.9 -3.8 -7.1
NOTE: War and supplemental funding is included in FY 1948 through FY 2021.
Percent Real Growth (%)
Table 6-18: AIR FORCE TOA BY PUBLIC LAW TITLE (Continued)(Dollars in Millions)
Public Law Title
Current Dollars
FY 2020 Constant Dollars
196

Table 6-18 Chapter 6
FY 1992 FY 1993 FY 1994 FY 1995 FY 1996 FY 1997 FY 1998 FY 1999 FY 2000 FY 2001 FY 2002
Military Personnel ................................... 21,306 20,201 18,133 19,593 19,276 19,171 19,099 19,366 20,199 21,022 24,768 Operation and Maintenance .................... 22,829 22,870 24,542 24,537 23,405 22,795 25,131 27,068 27,299 30,072 34,294 Procurement ........................................... 23,539 21,505 17,501 15,829 16,619 14,388 15,328 18,209 18,924 22,143 23,591 RDT&E .................................................... 13,051 12,789 12,178 11,605 12,518 14,090 14,278 13,732 14,527 14,313 14,479 Military Construction ............................... 1,217 1,036 1,587 1,081 1,282 1,576 1,570 1,399 1,228 1,406 1,795 Family Housing ....................................... 1,106 1,164 985 1,123 1,130 1,119 1,103 1,058 1,161 1,085 1,304 Revolving and Management Funds ......... 12 5 31 33 31 28 12 34
Total Current Dollars ........................ 83,048 79,566 74,938 73,773 74,230 73,170 76,543 80,862 83,368 90,051 100,266
Military Personnel ................................... 46,758 42,317 37,140 39,164 37,691 36,456 34,703 34,117 33,869 34,052 37,835 Operation and Maintenance .................... 45,440 43,732 45,823 45,230 42,085 39,914 42,108 44,532 44,273 46,040 51,621 Procurement ........................................... 38,163 34,182 27,316 24,306 25,155 21,508 22,665 26,596 27,243 31,379 32,906 RDT&E .................................................... 21,469 20,590 19,263 17,958 19,004 21,074 21,144 20,068 20,882 20,242 20,234 Military Construction ............................... 1,976 1,651 2,485 1,665 1,945 2,365 2,327 2,045 1,772 1,996 2,505 Family Housing ....................................... 1,826 1,883 1,565 1,757 1,744 1,707 1,660 1,567 1,696 1,553 1,843 Revolving and Management Funds ......... 18 8 45 49 45 40 17 48
Total Constant Dollars ...................... 155,632 144,356 133,609 130,087 127,626 123,070 124,657 128,970 129,775 135,279 146,991
Military Personnel ................................... -8.7 -9.5 -12.2 5.5 -3.8 -3.3 -4.8 -1.7 -0.7 0.5 11.1 Operation and Maintenance .................... -19.7 -3.8 4.8 -1.3 -7.0 -5.2 5.5 5.8 -0.6 4.0 12.1 Procurement ........................................... -6.2 -10.4 -20.1 -11.0 3.5 -14.5 5.4 17.3 2.4 15.2 4.9 RDT&E .................................................... 6.9 -4.1 -6.4 -6.8 5.8 10.9 0.3 -5.1 4.1 -3.1 0.0 Military Construction ............................... 4.5 -16.4 50.5 -33.0 16.8 21.6 -1.6 -12.1 -13.3 12.7 25.5
Total Real Growth ............................. -10.4 -7.2 -7.4 -2.6 -1.9 -3.6 1.3 3.5 0.6 4.2 8.7
NOTE: War and supplemental funding is included in FY 1948 through FY 2021.
Percent Real Growth (%)
Table 6-18: AIR FORCE TOA BY PUBLIC LAW TITLE (Continued)(Dollars in Millions)
Public Law Title
Current Dollars
FY 2020 Constant Dollars
197

Table 6-18 Chapter 6
FY 2003 FY 2004 FY 2005 FY 2006 FY 2007 FY 2008 FY 2009 FY 2010 FY 2011 FY 2012 FY 2013
Military Personnel ................................... 28,676 29,845 30,590 31,455 32,262 32,403 33,435 35,517 36,048 36,557 35,501 Operation and Maintenance .................... 43,262 39,539 41,309 46,569 48,287 52,271 55,078 56,249 59,159 57,736 51,932 Procurement ........................................... 31,666 32,363 36,086 35,841 39,882 43,893 43,550 41,359 42,087 41,011 34,443 RDT&E .................................................... 18,935 20,233 20,478 22,191 24,492 26,347 26,767 27,917 27,421 26,631 23,163 Military Construction ............................... 1,638 1,853 1,488 2,328 2,364 3,104 3,104 3,305 1,783 1,562 519 Family Housing ....................................... 1,569 1,520 1,722 2,169 2,018 1,103 1,128 620 709 710 649 Revolving and Management Funds ......... 24 312 44 608 76 927 84 77 55
Total Current Dollars ........................ 125,770 125,353 131,673 140,864 149,348 159,729 163,138 165,894 167,293 164,283 146,263
Military Personnel ................................... 42,563 43,086 42,807 42,447 42,486 41,297 41,256 42,366 42,578 42,415 40,454 Operation and Maintenance .................... 64,196 56,682 54,815 59,070 60,049 61,749 66,157 65,238 66,678 64,156 55,988 Procurement ........................................... 43,295 43,190 46,913 45,475 49,575 53,639 52,459 49,102 49,124 47,125 39,003 RDT&E .................................................... 26,022 27,132 26,679 28,113 30,277 31,972 32,066 32,992 31,808 30,395 26,059 Military Construction ............................... 2,233 2,462 1,929 2,952 2,945 3,808 3,749 3,935 2,089 1,804 590 Family Housing ....................................... 2,176 2,053 2,242 2,762 2,526 1,345 1,361 739 822 808 724 Revolving and Management Funds ......... 33 397 54 737 91 1,114 97 87 62
Total Constant Dollars ...................... 180,517 174,604 175,384 181,216 187,912 194,546 197,140 195,487 193,197 186,790 162,881
Military Personnel ................................... 12.5 1.2 -0.6 -0.8 0.1 -2.8 -0.1 2.7 0.5 -0.4 -4.6 Operation and Maintenance .................... 24.4 -11.7 -3.3 7.8 1.7 2.8 7.1 -1.4 2.2 -3.8 -12.7 Procurement ........................................... 31.6 -0.2 8.6 -3.1 9.0 8.2 -2.2 -6.4 0.0 -4.1 -17.2 RDT&E .................................................... 28.6 4.3 -1.7 5.4 7.7 5.6 0.3 2.9 -3.6 -4.4 -14.3 Military Construction ............................... -10.9 10.3 -21.7 53.1 -0.3 29.3 -1.5 5.0 -46.9 -13.7 -67.3
Total Real Growth ............................. 22.8 -3.3 0.4 3.3 3.7 3.5 1.3 -0.8 -1.2 -3.3 -12.8
NOTE: War and supplemental funding is included in FY 1948 through FY 2021.
Percent Real Growth (%)
Table 6-18: AIR FORCE TOA BY PUBLIC LAW TITLE (Continued)(Dollars in Millions)
Public Law Title
Current Dollars
FY 2020 Constant Dollars
198
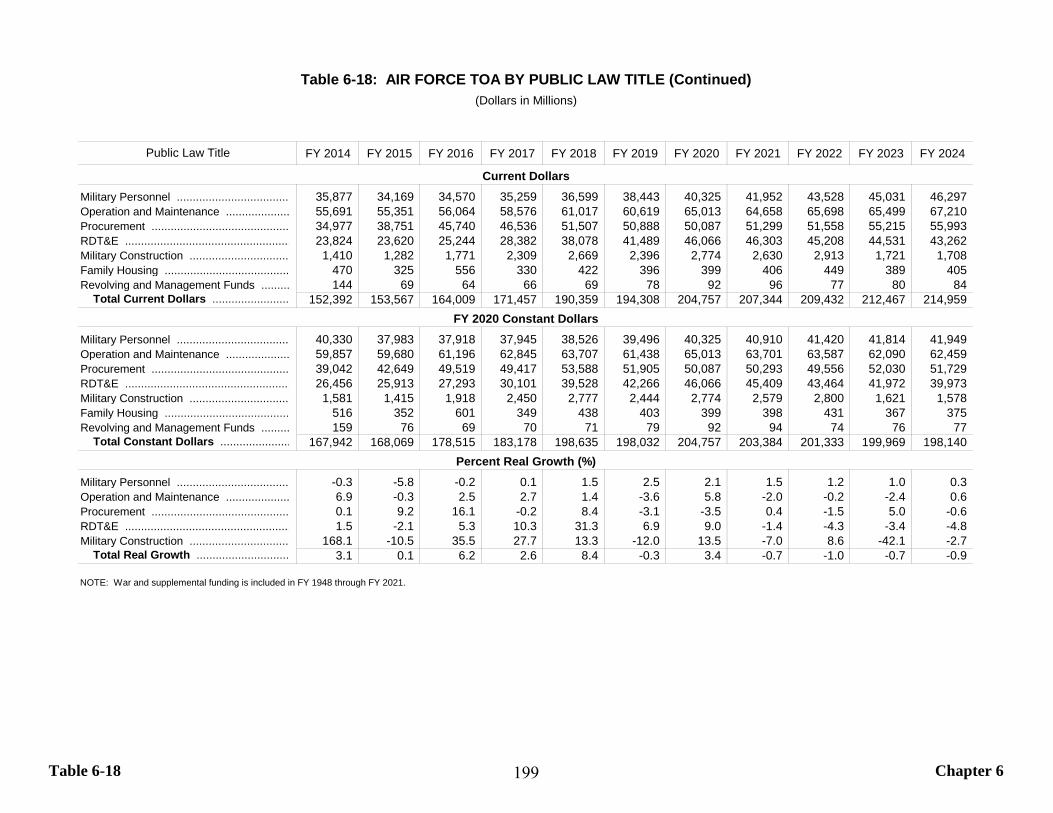
Table 6-18 Chapter 6
FY 2014 FY 2015 FY 2016 FY 2017 FY 2018 FY 2019 FY 2020 FY 2021 FY 2022 FY 2023 FY 2024
Military Personnel ................................... 35,877 34,169 34,570 35,259 36,599 38,443 40,325 41,952 43,528 45,031 46,297 Operation and Maintenance .................... 55,691 55,351 56,064 58,576 61,017 60,619 65,013 64,658 65,698 65,499 67,210 Procurement ........................................... 34,977 38,751 45,740 46,536 51,507 50,888 50,087 51,299 51,558 55,215 55,993 RDT&E .................................................... 23,824 23,620 25,244 28,382 38,078 41,489 46,066 46,303 45,208 44,531 43,262 Military Construction ............................... 1,410 1,282 1,771 2,309 2,669 2,396 2,774 2,630 2,913 1,721 1,708 Family Housing ....................................... 470 325 556 330 422 396 399 406 449 389 405 Revolving and Management Funds ......... 144 69 64 66 69 78 92 96 77 80 84
Total Current Dollars ........................ 152,392 153,567 164,009 171,457 190,359 194,308 204,757 207,344 209,432 212,467 214,959
Military Personnel ................................... 40,330 37,983 37,918 37,945 38,526 39,496 40,325 40,910 41,420 41,814 41,949 Operation and Maintenance .................... 59,857 59,680 61,196 62,845 63,707 61,438 65,013 63,701 63,587 62,090 62,459 Procurement ........................................... 39,042 42,649 49,519 49,417 53,588 51,905 50,087 50,293 49,556 52,030 51,729 RDT&E .................................................... 26,456 25,913 27,293 30,101 39,528 42,266 46,066 45,409 43,464 41,972 39,973 Military Construction ............................... 1,581 1,415 1,918 2,450 2,777 2,444 2,774 2,579 2,800 1,621 1,578 Family Housing ....................................... 516 352 601 349 438 403 399 398 431 367 375 Revolving and Management Funds ......... 159 76 69 70 71 79 92 94 74 76 77
Total Constant Dollars ...................... 167,942 168,069 178,515 183,178 198,635 198,032 204,757 203,384 201,333 199,969 198,140
Military Personnel ................................... -0.3 -5.8 -0.2 0.1 1.5 2.5 2.1 1.5 1.2 1.0 0.3 Operation and Maintenance .................... 6.9 -0.3 2.5 2.7 1.4 -3.6 5.8 -2.0 -0.2 -2.4 0.6 Procurement ........................................... 0.1 9.2 16.1 -0.2 8.4 -3.1 -3.5 0.4 -1.5 5.0 -0.6 RDT&E .................................................... 1.5 -2.1 5.3 10.3 31.3 6.9 9.0 -1.4 -4.3 -3.4 -4.8 Military Construction ............................... 168.1 -10.5 35.5 27.7 13.3 -12.0 13.5 -7.0 8.6 -42.1 -2.7
Total Real Growth ............................. 3.1 0.1 6.2 2.6 8.4 -0.3 3.4 -0.7 -1.0 -0.7 -0.9
NOTE: War and supplemental funding is included in FY 1948 through FY 2021.
Percent Real Growth (%)
Table 6-18: AIR FORCE TOA BY PUBLIC LAW TITLE (Continued)(Dollars in Millions)
Public Law Title
Current Dollars
FY 2020 Constant Dollars
199
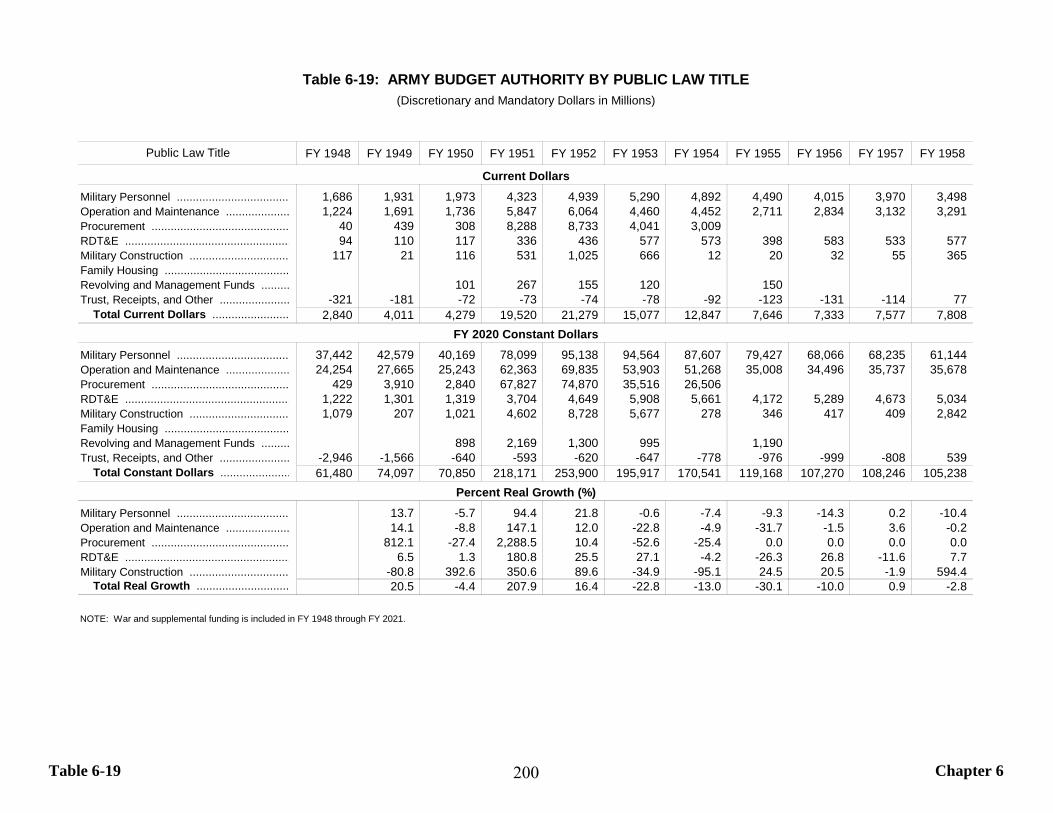
Table 6-19 Chapter 6
FY 1948 FY 1949 FY 1950 FY 1951 FY 1952 FY 1953 FY 1954 FY 1955 FY 1956 FY 1957 FY 1958
Military Personnel ................................... 1,686 1,931 1,973 4,323 4,939 5,290 4,892 4,490 4,015 3,970 3,498 Operation and Maintenance .................... 1,224 1,691 1,736 5,847 6,064 4,460 4,452 2,711 2,834 3,132 3,291 Procurement ........................................... 40 439 308 8,288 8,733 4,041 3,009 RDT&E .................................................... 94 110 117 336 436 577 573 398 583 533 577 Military Construction ............................... 117 21 116 531 1,025 666 12 20 32 55 365 Family Housing ....................................... Revolving and Management Funds ......... 101 267 155 120 150 Trust, Receipts, and Other ...................... -321 -181 -72 -73 -74 -78 -92 -123 -131 -114 77
Total Current Dollars ........................ 2,840 4,011 4,279 19,520 21,279 15,077 12,847 7,646 7,333 7,577 7,808
Military Personnel ................................... 37,442 42,579 40,169 78,099 95,138 94,564 87,607 79,427 68,066 68,235 61,144 Operation and Maintenance .................... 24,254 27,665 25,243 62,363 69,835 53,903 51,268 35,008 34,496 35,737 35,678 Procurement ........................................... 429 3,910 2,840 67,827 74,870 35,516 26,506 RDT&E .................................................... 1,222 1,301 1,319 3,704 4,649 5,908 5,661 4,172 5,289 4,673 5,034 Military Construction ............................... 1,079 207 1,021 4,602 8,728 5,677 278 346 417 409 2,842 Family Housing ....................................... Revolving and Management Funds ......... 898 2,169 1,300 995 1,190 Trust, Receipts, and Other ...................... -2,946 -1,566 -640 -593 -620 -647 -778 -976 -999 -808 539
Total Constant Dollars ...................... 61,480 74,097 70,850 218,171 253,900 195,917 170,541 119,168 107,270 108,246 105,238
Military Personnel ................................... 13.7 -5.7 94.4 21.8 -0.6 -7.4 -9.3 -14.3 0.2 -10.4 Operation and Maintenance .................... 14.1 -8.8 147.1 12.0 -22.8 -4.9 -31.7 -1.5 3.6 -0.2 Procurement ........................................... 812.1 -27.4 2,288.5 10.4 -52.6 -25.4 0.0 0.0 0.0 0.0 RDT&E .................................................... 6.5 1.3 180.8 25.5 27.1 -4.2 -26.3 26.8 -11.6 7.7 Military Construction ............................... -80.8 392.6 350.6 89.6 -34.9 -95.1 24.5 20.5 -1.9 594.4
Total Real Growth ............................. 20.5 -4.4 207.9 16.4 -22.8 -13.0 -30.1 -10.0 0.9 -2.8
NOTE: War and supplemental funding is included in FY 1948 through FY 2021.
Percent Real Growth (%)
Table 6-19: ARMY BUDGET AUTHORITY BY PUBLIC LAW TITLE(Discretionary and Mandatory Dollars in Millions)
Public Law Title
Current Dollars
FY 2020 Constant Dollars
200
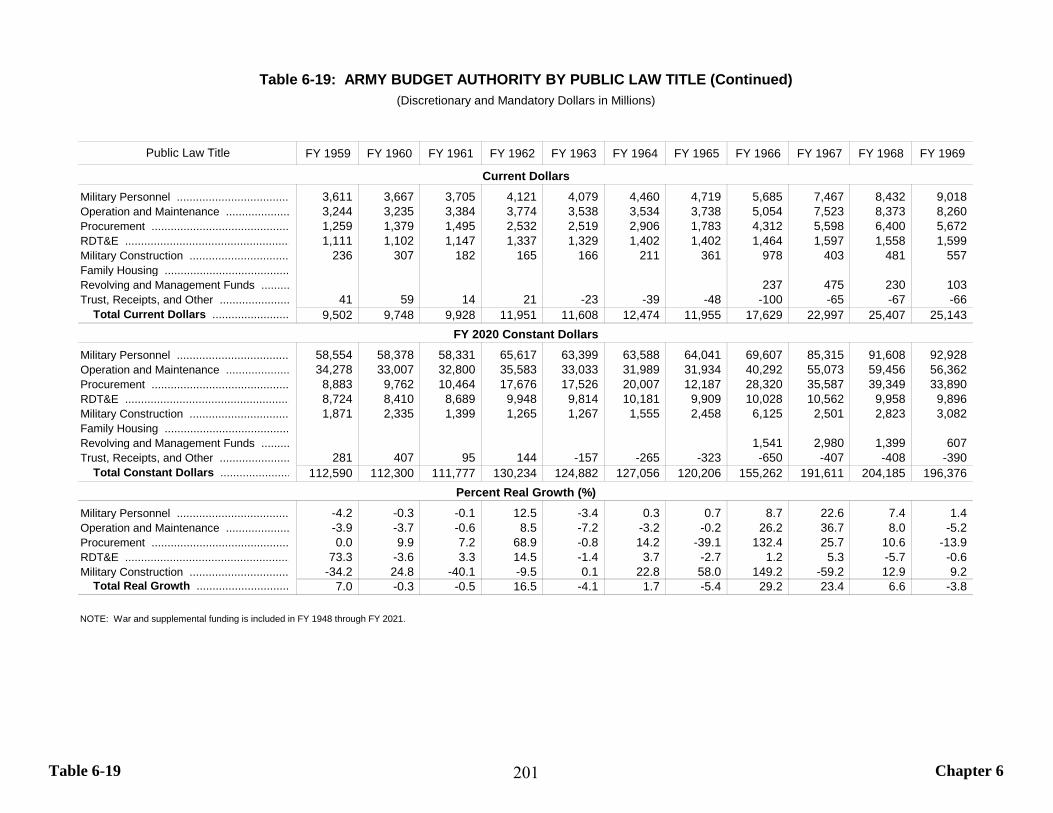
Table 6-19 Chapter 6
FY 1959 FY 1960 FY 1961 FY 1962 FY 1963 FY 1964 FY 1965 FY 1966 FY 1967 FY 1968 FY 1969
Military Personnel ................................... 3,611 3,667 3,705 4,121 4,079 4,460 4,719 5,685 7,467 8,432 9,018 Operation and Maintenance .................... 3,244 3,235 3,384 3,774 3,538 3,534 3,738 5,054 7,523 8,373 8,260 Procurement ........................................... 1,259 1,379 1,495 2,532 2,519 2,906 1,783 4,312 5,598 6,400 5,672 RDT&E .................................................... 1,111 1,102 1,147 1,337 1,329 1,402 1,402 1,464 1,597 1,558 1,599 Military Construction ............................... 236 307 182 165 166 211 361 978 403 481 557 Family Housing ....................................... Revolving and Management Funds ......... 237 475 230 103 Trust, Receipts, and Other ...................... 41 59 14 21 -23 -39 -48 -100 -65 -67 -66
Total Current Dollars ........................ 9,502 9,748 9,928 11,951 11,608 12,474 11,955 17,629 22,997 25,407 25,143
Military Personnel ................................... 58,554 58,378 58,331 65,617 63,399 63,588 64,041 69,607 85,315 91,608 92,928 Operation and Maintenance .................... 34,278 33,007 32,800 35,583 33,033 31,989 31,934 40,292 55,073 59,456 56,362 Procurement ........................................... 8,883 9,762 10,464 17,676 17,526 20,007 12,187 28,320 35,587 39,349 33,890 RDT&E .................................................... 8,724 8,410 8,689 9,948 9,814 10,181 9,909 10,028 10,562 9,958 9,896 Military Construction ............................... 1,871 2,335 1,399 1,265 1,267 1,555 2,458 6,125 2,501 2,823 3,082 Family Housing ....................................... Revolving and Management Funds ......... 1,541 2,980 1,399 607 Trust, Receipts, and Other ...................... 281 407 95 144 -157 -265 -323 -650 -407 -408 -390
Total Constant Dollars ...................... 112,590 112,300 111,777 130,234 124,882 127,056 120,206 155,262 191,611 204,185 196,376
Military Personnel ................................... -4.2 -0.3 -0.1 12.5 -3.4 0.3 0.7 8.7 22.6 7.4 1.4 Operation and Maintenance .................... -3.9 -3.7 -0.6 8.5 -7.2 -3.2 -0.2 26.2 36.7 8.0 -5.2 Procurement ........................................... 0.0 9.9 7.2 68.9 -0.8 14.2 -39.1 132.4 25.7 10.6 -13.9 RDT&E .................................................... 73.3 -3.6 3.3 14.5 -1.4 3.7 -2.7 1.2 5.3 -5.7 -0.6 Military Construction ............................... -34.2 24.8 -40.1 -9.5 0.1 22.8 58.0 149.2 -59.2 12.9 9.2
Total Real Growth ............................. 7.0 -0.3 -0.5 16.5 -4.1 1.7 -5.4 29.2 23.4 6.6 -3.8
NOTE: War and supplemental funding is included in FY 1948 through FY 2021.
Percent Real Growth (%)
Table 6-19: ARMY BUDGET AUTHORITY BY PUBLIC LAW TITLE (Continued)(Discretionary and Mandatory Dollars in Millions)
Public Law Title
Current Dollars
FY 2020 Constant Dollars
201

Table 6-19 Chapter 6
FY 1970 FY 1971 FY 1972 FY 1973 FY 1974 FY 1975 FY 1976 FY 1977 FY 1978 FY 1979 FY 1980
Military Personnel ................................... 9,629 9,507 8,951 8,748 8,837 9,233 9,607 10,043 10,482 11,057 12,074 Operation and Maintenance .................... 7,823 7,121 7,169 7,353 7,398 7,353 8,271 9,205 9,790 10,813 12,291 Procurement ........................................... 4,259 2,602 3,107 2,674 2,480 2,260 2,972 4,378 5,187 6,070 6,436 RDT&E .................................................... 1,632 1,638 1,800 1,825 1,939 1,741 1,958 2,281 2,408 2,641 2,846 Military Construction ............................... 313 672 599 492 654 760 903 713 628 812 832 Family Housing ....................................... Revolving and Management Funds ......... 20 100 100 176 204 Trust, Receipts, and Other ...................... -47 -45 -43 -44 -46 -48 -87 -52 -162 -227 -303
Total Current Dollars ........................ 23,610 21,495 21,582 21,048 21,262 21,299 23,644 26,667 28,434 31,341 34,380
Military Personnel ................................... 88,655 81,884 68,452 60,139 57,159 55,621 54,497 54,037 52,910 52,753 53,314 Operation and Maintenance .................... 50,444 43,632 41,974 40,227 36,937 34,295 35,264 36,414 35,696 36,988 37,649 Procurement ........................................... 24,432 14,291 15,964 12,572 10,801 8,824 10,671 15,067 16,294 17,130 16,626 RDT&E .................................................... 9,591 9,100 9,441 8,987 8,621 7,239 7,244 7,962 7,762 7,724 7,691 Military Construction ............................... 1,739 3,228 2,677 2,039 2,375 2,509 2,846 2,233 1,853 2,221 2,151 Family Housing ....................................... Revolving and Management Funds ......... 76 353 330 532 558 Trust, Receipts, and Other ...................... -265 -243 -227 -222 -218 -196 -331 -183 -534 -687 -828
Total Constant Dollars ...................... 174,596 151,893 138,282 123,742 115,676 108,292 110,267 115,883 114,312 116,661 117,161
Military Personnel ................................... -4.6 -7.6 -16.4 -12.1 -5.0 -2.7 -2.0 -0.8 -2.1 -0.3 1.1 Operation and Maintenance .................... -10.5 -13.5 -3.8 -4.2 -8.2 -7.2 2.8 3.3 -2.0 3.6 1.8 Procurement ........................................... -27.9 -41.5 11.7 -21.2 -14.1 -18.3 20.9 41.2 8.2 5.1 -2.9 RDT&E .................................................... -3.1 -5.1 3.8 -4.8 -4.1 -16.0 0.1 9.9 -2.5 -0.5 -0.4 Military Construction ............................... -43.6 85.7 -17.1 -23.8 16.5 5.6 13.4 -21.5 -17.0 19.8 -3.2
Total Real Growth ............................. -11.1 -13.0 -9.0 -10.5 -6.5 -6.4 1.8 5.1 -1.4 2.1 0.4
NOTE: War and supplemental funding is included in FY 1948 through FY 2021.
Percent Real Growth (%)
Table 6-19: ARMY BUDGET AUTHORITY BY PUBLIC LAW TITLE (Continued)(Discretionary and Mandatory Dollars in Millions)
Public Law Title
Current Dollars
FY 2020 Constant Dollars
202
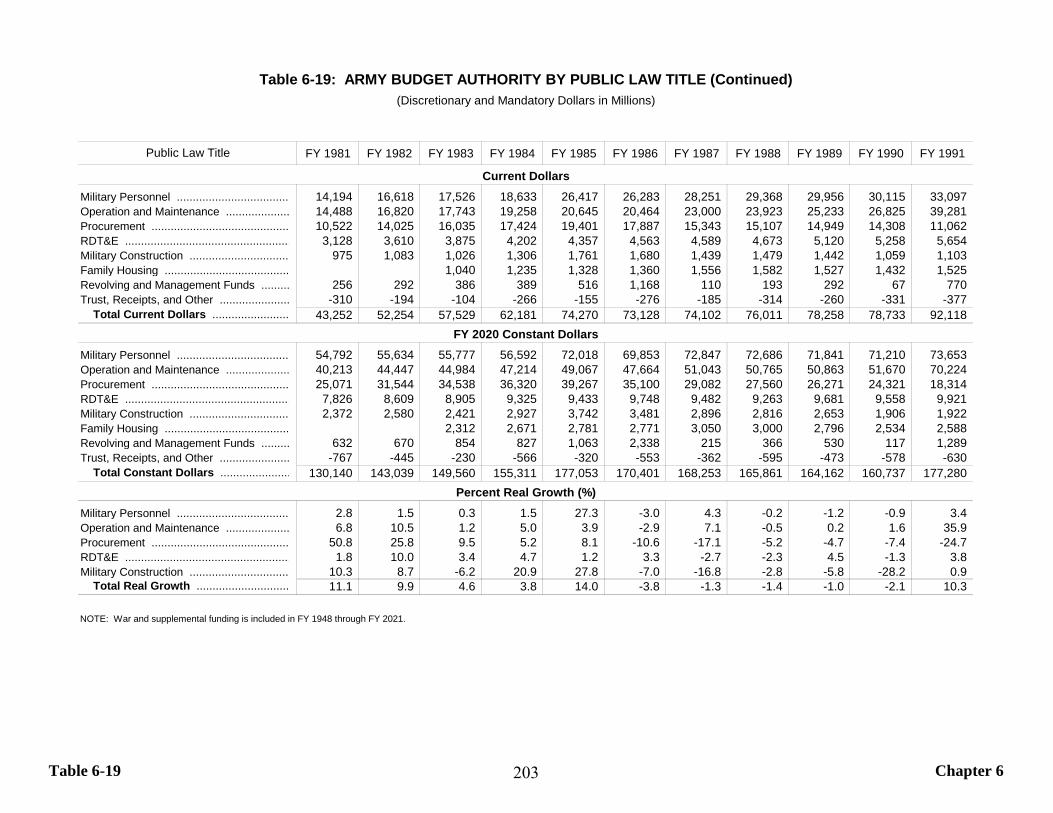
Table 6-19 Chapter 6
FY 1981 FY 1982 FY 1983 FY 1984 FY 1985 FY 1986 FY 1987 FY 1988 FY 1989 FY 1990 FY 1991
Military Personnel ................................... 14,194 16,618 17,526 18,633 26,417 26,283 28,251 29,368 29,956 30,115 33,097 Operation and Maintenance .................... 14,488 16,820 17,743 19,258 20,645 20,464 23,000 23,923 25,233 26,825 39,281 Procurement ........................................... 10,522 14,025 16,035 17,424 19,401 17,887 15,343 15,107 14,949 14,308 11,062 RDT&E .................................................... 3,128 3,610 3,875 4,202 4,357 4,563 4,589 4,673 5,120 5,258 5,654 Military Construction ............................... 975 1,083 1,026 1,306 1,761 1,680 1,439 1,479 1,442 1,059 1,103 Family Housing ....................................... 1,040 1,235 1,328 1,360 1,556 1,582 1,527 1,432 1,525 Revolving and Management Funds ......... 256 292 386 389 516 1,168 110 193 292 67 770 Trust, Receipts, and Other ...................... -310 -194 -104 -266 -155 -276 -185 -314 -260 -331 -377
Total Current Dollars ........................ 43,252 52,254 57,529 62,181 74,270 73,128 74,102 76,011 78,258 78,733 92,118
Military Personnel ................................... 54,792 55,634 55,777 56,592 72,018 69,853 72,847 72,686 71,841 71,210 73,653 Operation and Maintenance .................... 40,213 44,447 44,984 47,214 49,067 47,664 51,043 50,765 50,863 51,670 70,224 Procurement ........................................... 25,071 31,544 34,538 36,320 39,267 35,100 29,082 27,560 26,271 24,321 18,314 RDT&E .................................................... 7,826 8,609 8,905 9,325 9,433 9,748 9,482 9,263 9,681 9,558 9,921 Military Construction ............................... 2,372 2,580 2,421 2,927 3,742 3,481 2,896 2,816 2,653 1,906 1,922 Family Housing ....................................... 2,312 2,671 2,781 2,771 3,050 3,000 2,796 2,534 2,588 Revolving and Management Funds ......... 632 670 854 827 1,063 2,338 215 366 530 117 1,289 Trust, Receipts, and Other ...................... -767 -445 -230 -566 -320 -553 -362 -595 -473 -578 -630
Total Constant Dollars ...................... 130,140 143,039 149,560 155,311 177,053 170,401 168,253 165,861 164,162 160,737 177,280
Military Personnel ................................... 2.8 1.5 0.3 1.5 27.3 -3.0 4.3 -0.2 -1.2 -0.9 3.4 Operation and Maintenance .................... 6.8 10.5 1.2 5.0 3.9 -2.9 7.1 -0.5 0.2 1.6 35.9 Procurement ........................................... 50.8 25.8 9.5 5.2 8.1 -10.6 -17.1 -5.2 -4.7 -7.4 -24.7 RDT&E .................................................... 1.8 10.0 3.4 4.7 1.2 3.3 -2.7 -2.3 4.5 -1.3 3.8 Military Construction ............................... 10.3 8.7 -6.2 20.9 27.8 -7.0 -16.8 -2.8 -5.8 -28.2 0.9
Total Real Growth ............................. 11.1 9.9 4.6 3.8 14.0 -3.8 -1.3 -1.4 -1.0 -2.1 10.3
NOTE: War and supplemental funding is included in FY 1948 through FY 2021.
Percent Real Growth (%)
Table 6-19: ARMY BUDGET AUTHORITY BY PUBLIC LAW TITLE (Continued)(Discretionary and Mandatory Dollars in Millions)
Public Law Title
Current Dollars
FY 2020 Constant Dollars
203
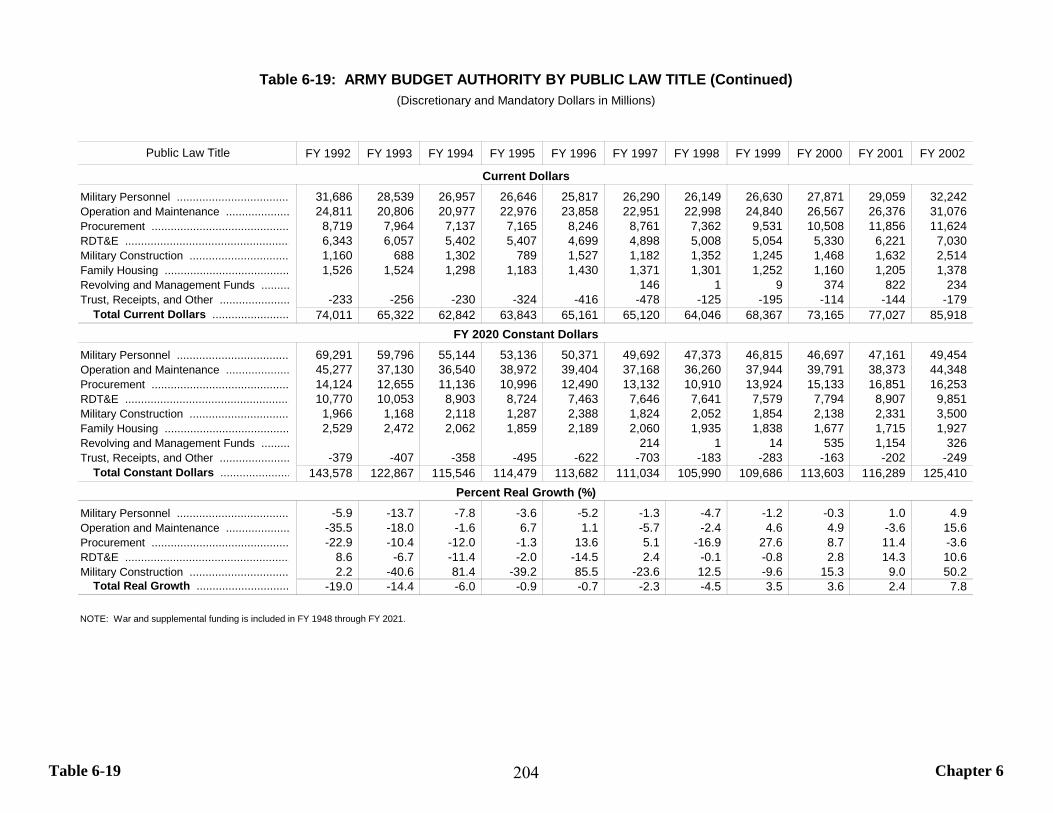
Table 6-19 Chapter 6
FY 1992 FY 1993 FY 1994 FY 1995 FY 1996 FY 1997 FY 1998 FY 1999 FY 2000 FY 2001 FY 2002
Military Personnel ................................... 31,686 28,539 26,957 26,646 25,817 26,290 26,149 26,630 27,871 29,059 32,242 Operation and Maintenance .................... 24,811 20,806 20,977 22,976 23,858 22,951 22,998 24,840 26,567 26,376 31,076 Procurement ........................................... 8,719 7,964 7,137 7,165 8,246 8,761 7,362 9,531 10,508 11,856 11,624 RDT&E .................................................... 6,343 6,057 5,402 5,407 4,699 4,898 5,008 5,054 5,330 6,221 7,030 Military Construction ............................... 1,160 688 1,302 789 1,527 1,182 1,352 1,245 1,468 1,632 2,514 Family Housing ....................................... 1,526 1,524 1,298 1,183 1,430 1,371 1,301 1,252 1,160 1,205 1,378 Revolving and Management Funds ......... 146 1 9 374 822 234 Trust, Receipts, and Other ...................... -233 -256 -230 -324 -416 -478 -125 -195 -114 -144 -179
Total Current Dollars ........................ 74,011 65,322 62,842 63,843 65,161 65,120 64,046 68,367 73,165 77,027 85,918
Military Personnel ................................... 69,291 59,796 55,144 53,136 50,371 49,692 47,373 46,815 46,697 47,161 49,454 Operation and Maintenance .................... 45,277 37,130 36,540 38,972 39,404 37,168 36,260 37,944 39,791 38,373 44,348 Procurement ........................................... 14,124 12,655 11,136 10,996 12,490 13,132 10,910 13,924 15,133 16,851 16,253 RDT&E .................................................... 10,770 10,053 8,903 8,724 7,463 7,646 7,641 7,579 7,794 8,907 9,851 Military Construction ............................... 1,966 1,168 2,118 1,287 2,388 1,824 2,052 1,854 2,138 2,331 3,500 Family Housing ....................................... 2,529 2,472 2,062 1,859 2,189 2,060 1,935 1,838 1,677 1,715 1,927 Revolving and Management Funds ......... 214 1 14 535 1,154 326 Trust, Receipts, and Other ...................... -379 -407 -358 -495 -622 -703 -183 -283 -163 -202 -249
Total Constant Dollars ...................... 143,578 122,867 115,546 114,479 113,682 111,034 105,990 109,686 113,603 116,289 125,410
Military Personnel ................................... -5.9 -13.7 -7.8 -3.6 -5.2 -1.3 -4.7 -1.2 -0.3 1.0 4.9 Operation and Maintenance .................... -35.5 -18.0 -1.6 6.7 1.1 -5.7 -2.4 4.6 4.9 -3.6 15.6 Procurement ........................................... -22.9 -10.4 -12.0 -1.3 13.6 5.1 -16.9 27.6 8.7 11.4 -3.6 RDT&E .................................................... 8.6 -6.7 -11.4 -2.0 -14.5 2.4 -0.1 -0.8 2.8 14.3 10.6 Military Construction ............................... 2.2 -40.6 81.4 -39.2 85.5 -23.6 12.5 -9.6 15.3 9.0 50.2
Total Real Growth ............................. -19.0 -14.4 -6.0 -0.9 -0.7 -2.3 -4.5 3.5 3.6 2.4 7.8
NOTE: War and supplemental funding is included in FY 1948 through FY 2021.
Percent Real Growth (%)
Table 6-19: ARMY BUDGET AUTHORITY BY PUBLIC LAW TITLE (Continued)(Discretionary and Mandatory Dollars in Millions)
Public Law Title
Current Dollars
FY 2020 Constant Dollars
204
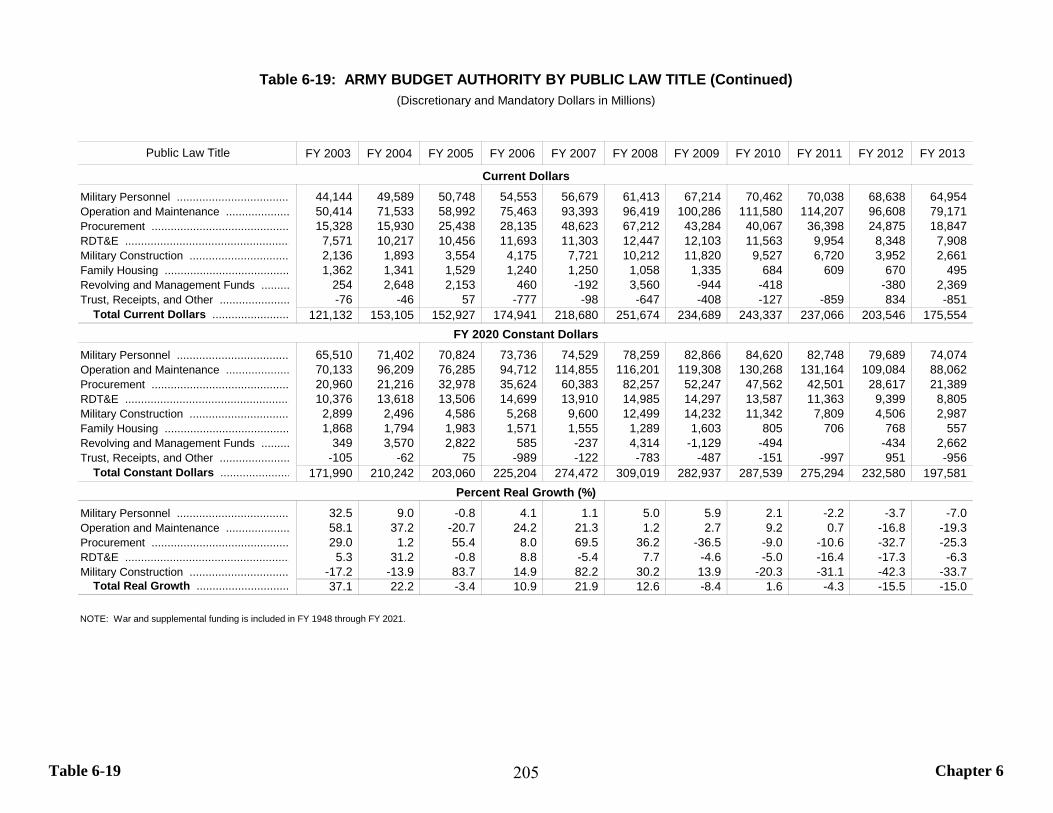
Table 6-19 Chapter 6
FY 2003 FY 2004 FY 2005 FY 2006 FY 2007 FY 2008 FY 2009 FY 2010 FY 2011 FY 2012 FY 2013
Military Personnel ................................... 44,144 49,589 50,748 54,553 56,679 61,413 67,214 70,462 70,038 68,638 64,954 Operation and Maintenance .................... 50,414 71,533 58,992 75,463 93,393 96,419 100,286 111,580 114,207 96,608 79,171 Procurement ........................................... 15,328 15,930 25,438 28,135 48,623 67,212 43,284 40,067 36,398 24,875 18,847 RDT&E .................................................... 7,571 10,217 10,456 11,693 11,303 12,447 12,103 11,563 9,954 8,348 7,908 Military Construction ............................... 2,136 1,893 3,554 4,175 7,721 10,212 11,820 9,527 6,720 3,952 2,661 Family Housing ....................................... 1,362 1,341 1,529 1,240 1,250 1,058 1,335 684 609 670 495 Revolving and Management Funds ......... 254 2,648 2,153 460 -192 3,560 -944 -418 -380 2,369 Trust, Receipts, and Other ...................... -76 -46 57 -777 -98 -647 -408 -127 -859 834 -851
Total Current Dollars ........................ 121,132 153,105 152,927 174,941 218,680 251,674 234,689 243,337 237,066 203,546 175,554
Military Personnel ................................... 65,510 71,402 70,824 73,736 74,529 78,259 82,866 84,620 82,748 79,689 74,074 Operation and Maintenance .................... 70,133 96,209 76,285 94,712 114,855 116,201 119,308 130,268 131,164 109,084 88,062 Procurement ........................................... 20,960 21,216 32,978 35,624 60,383 82,257 52,247 47,562 42,501 28,617 21,389 RDT&E .................................................... 10,376 13,618 13,506 14,699 13,910 14,985 14,297 13,587 11,363 9,399 8,805 Military Construction ............................... 2,899 2,496 4,586 5,268 9,600 12,499 14,232 11,342 7,809 4,506 2,987 Family Housing ....................................... 1,868 1,794 1,983 1,571 1,555 1,289 1,603 805 706 768 557 Revolving and Management Funds ......... 349 3,570 2,822 585 -237 4,314 -1,129 -494 -434 2,662 Trust, Receipts, and Other ...................... -105 -62 75 -989 -122 -783 -487 -151 -997 951 -956
Total Constant Dollars ...................... 171,990 210,242 203,060 225,204 274,472 309,019 282,937 287,539 275,294 232,580 197,581
Military Personnel ................................... 32.5 9.0 -0.8 4.1 1.1 5.0 5.9 2.1 -2.2 -3.7 -7.0 Operation and Maintenance .................... 58.1 37.2 -20.7 24.2 21.3 1.2 2.7 9.2 0.7 -16.8 -19.3 Procurement ........................................... 29.0 1.2 55.4 8.0 69.5 36.2 -36.5 -9.0 -10.6 -32.7 -25.3 RDT&E .................................................... 5.3 31.2 -0.8 8.8 -5.4 7.7 -4.6 -5.0 -16.4 -17.3 -6.3 Military Construction ............................... -17.2 -13.9 83.7 14.9 82.2 30.2 13.9 -20.3 -31.1 -42.3 -33.7
Total Real Growth ............................. 37.1 22.2 -3.4 10.9 21.9 12.6 -8.4 1.6 -4.3 -15.5 -15.0
NOTE: War and supplemental funding is included in FY 1948 through FY 2021.
Percent Real Growth (%)
Table 6-19: ARMY BUDGET AUTHORITY BY PUBLIC LAW TITLE (Continued)(Discretionary and Mandatory Dollars in Millions)
Public Law Title
Current Dollars
FY 2020 Constant Dollars
205
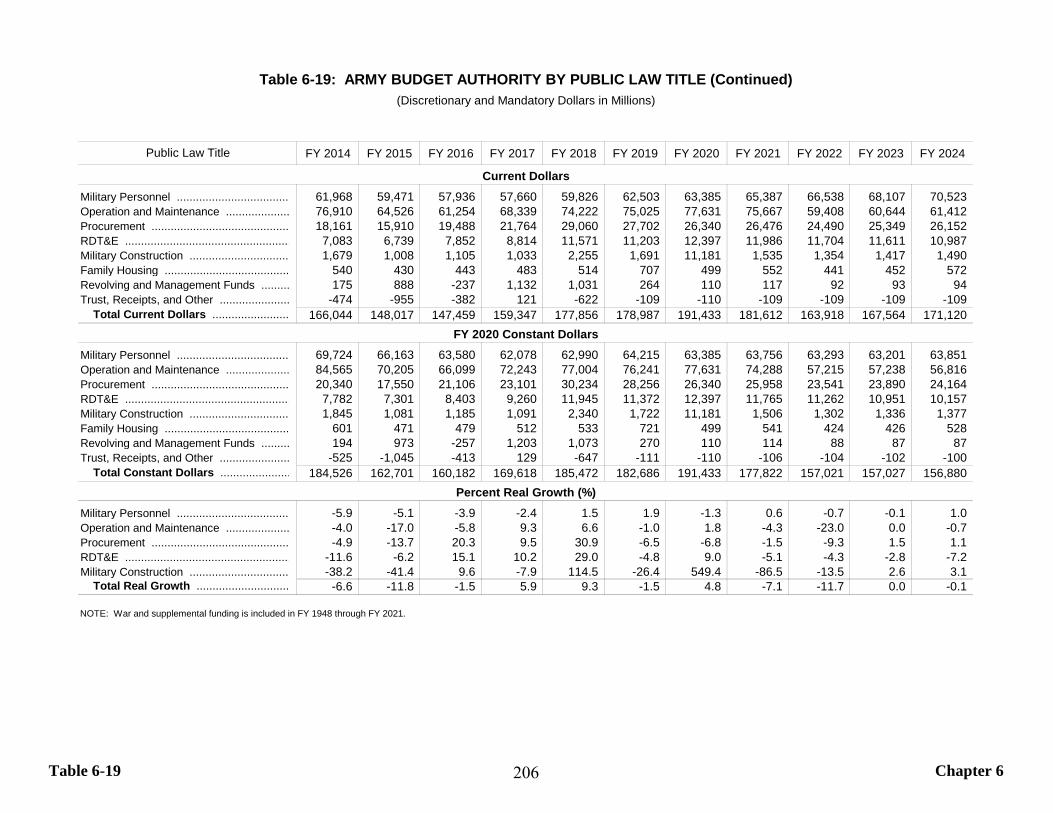
Table 6-19 Chapter 6
FY 2014 FY 2015 FY 2016 FY 2017 FY 2018 FY 2019 FY 2020 FY 2021 FY 2022 FY 2023 FY 2024
Military Personnel ................................... 61,968 59,471 57,936 57,660 59,826 62,503 63,385 65,387 66,538 68,107 70,523 Operation and Maintenance .................... 76,910 64,526 61,254 68,339 74,222 75,025 77,631 75,667 59,408 60,644 61,412 Procurement ........................................... 18,161 15,910 19,488 21,764 29,060 27,702 26,340 26,476 24,490 25,349 26,152 RDT&E .................................................... 7,083 6,739 7,852 8,814 11,571 11,203 12,397 11,986 11,704 11,611 10,987 Military Construction ............................... 1,679 1,008 1,105 1,033 2,255 1,691 11,181 1,535 1,354 1,417 1,490 Family Housing ....................................... 540 430 443 483 514 707 499 552 441 452 572 Revolving and Management Funds ......... 175 888 -237 1,132 1,031 264 110 117 92 93 94 Trust, Receipts, and Other ...................... -474 -955 -382 121 -622 -109 -110 -109 -109 -109 -109
Total Current Dollars ........................ 166,044 148,017 147,459 159,347 177,856 178,987 191,433 181,612 163,918 167,564 171,120
Military Personnel ................................... 69,724 66,163 63,580 62,078 62,990 64,215 63,385 63,756 63,293 63,201 63,851 Operation and Maintenance .................... 84,565 70,205 66,099 72,243 77,004 76,241 77,631 74,288 57,215 57,238 56,816 Procurement ........................................... 20,340 17,550 21,106 23,101 30,234 28,256 26,340 25,958 23,541 23,890 24,164 RDT&E .................................................... 7,782 7,301 8,403 9,260 11,945 11,372 12,397 11,765 11,262 10,951 10,157 Military Construction ............................... 1,845 1,081 1,185 1,091 2,340 1,722 11,181 1,506 1,302 1,336 1,377 Family Housing ....................................... 601 471 479 512 533 721 499 541 424 426 528 Revolving and Management Funds ......... 194 973 -257 1,203 1,073 270 110 114 88 87 87 Trust, Receipts, and Other ...................... -525 -1,045 -413 129 -647 -111 -110 -106 -104 -102 -100
Total Constant Dollars ...................... 184,526 162,701 160,182 169,618 185,472 182,686 191,433 177,822 157,021 157,027 156,880
Military Personnel ................................... -5.9 -5.1 -3.9 -2.4 1.5 1.9 -1.3 0.6 -0.7 -0.1 1.0 Operation and Maintenance .................... -4.0 -17.0 -5.8 9.3 6.6 -1.0 1.8 -4.3 -23.0 0.0 -0.7 Procurement ........................................... -4.9 -13.7 20.3 9.5 30.9 -6.5 -6.8 -1.5 -9.3 1.5 1.1 RDT&E .................................................... -11.6 -6.2 15.1 10.2 29.0 -4.8 9.0 -5.1 -4.3 -2.8 -7.2 Military Construction ............................... -38.2 -41.4 9.6 -7.9 114.5 -26.4 549.4 -86.5 -13.5 2.6 3.1
Total Real Growth ............................. -6.6 -11.8 -1.5 5.9 9.3 -1.5 4.8 -7.1 -11.7 0.0 -0.1
NOTE: War and supplemental funding is included in FY 1948 through FY 2021.
Percent Real Growth (%)
Table 6-19: ARMY BUDGET AUTHORITY BY PUBLIC LAW TITLE (Continued)(Discretionary and Mandatory Dollars in Millions)
Public Law Title
Current Dollars
FY 2020 Constant Dollars
206
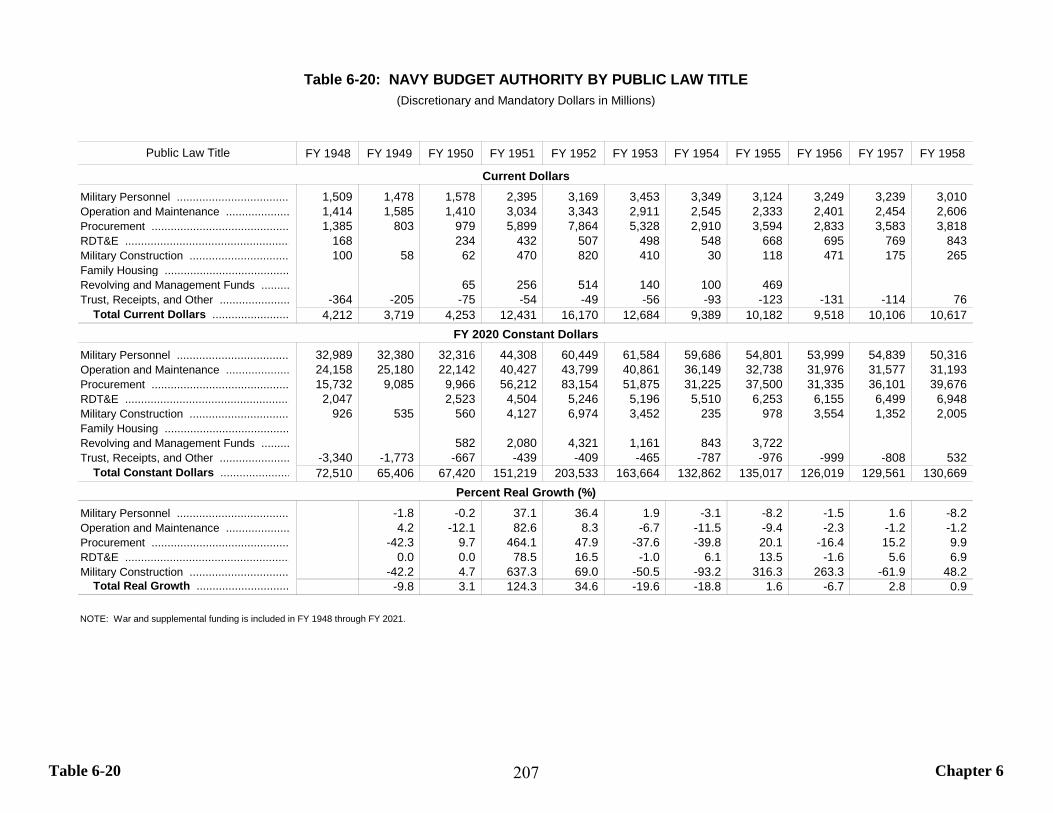
Table 6-20 Chapter 6
FY 1948 FY 1949 FY 1950 FY 1951 FY 1952 FY 1953 FY 1954 FY 1955 FY 1956 FY 1957 FY 1958
Military Personnel ................................... 1,509 1,478 1,578 2,395 3,169 3,453 3,349 3,124 3,249 3,239 3,010 Operation and Maintenance .................... 1,414 1,585 1,410 3,034 3,343 2,911 2,545 2,333 2,401 2,454 2,606 Procurement ........................................... 1,385 803 979 5,899 7,864 5,328 2,910 3,594 2,833 3,583 3,818 RDT&E .................................................... 168 234 432 507 498 548 668 695 769 843 Military Construction ............................... 100 58 62 470 820 410 30 118 471 175 265 Family Housing ....................................... Revolving and Management Funds ......... 65 256 514 140 100 469 Trust, Receipts, and Other ...................... -364 -205 -75 -54 -49 -56 -93 -123 -131 -114 76
Total Current Dollars ........................ 4,212 3,719 4,253 12,431 16,170 12,684 9,389 10,182 9,518 10,106 10,617
Military Personnel ................................... 32,989 32,380 32,316 44,308 60,449 61,584 59,686 54,801 53,999 54,839 50,316 Operation and Maintenance .................... 24,158 25,180 22,142 40,427 43,799 40,861 36,149 32,738 31,976 31,577 31,193 Procurement ........................................... 15,732 9,085 9,966 56,212 83,154 51,875 31,225 37,500 31,335 36,101 39,676 RDT&E .................................................... 2,047 2,523 4,504 5,246 5,196 5,510 6,253 6,155 6,499 6,948 Military Construction ............................... 926 535 560 4,127 6,974 3,452 235 978 3,554 1,352 2,005 Family Housing ....................................... Revolving and Management Funds ......... 582 2,080 4,321 1,161 843 3,722 Trust, Receipts, and Other ...................... -3,340 -1,773 -667 -439 -409 -465 -787 -976 -999 -808 532
Total Constant Dollars ...................... 72,510 65,406 67,420 151,219 203,533 163,664 132,862 135,017 126,019 129,561 130,669
Military Personnel ................................... -1.8 -0.2 37.1 36.4 1.9 -3.1 -8.2 -1.5 1.6 -8.2 Operation and Maintenance .................... 4.2 -12.1 82.6 8.3 -6.7 -11.5 -9.4 -2.3 -1.2 -1.2 Procurement ........................................... -42.3 9.7 464.1 47.9 -37.6 -39.8 20.1 -16.4 15.2 9.9 RDT&E .................................................... 0.0 0.0 78.5 16.5 -1.0 6.1 13.5 -1.6 5.6 6.9 Military Construction ............................... -42.2 4.7 637.3 69.0 -50.5 -93.2 316.3 263.3 -61.9 48.2
Total Real Growth ............................. -9.8 3.1 124.3 34.6 -19.6 -18.8 1.6 -6.7 2.8 0.9
NOTE: War and supplemental funding is included in FY 1948 through FY 2021.
Percent Real Growth (%)
Table 6-20: NAVY BUDGET AUTHORITY BY PUBLIC LAW TITLE(Discretionary and Mandatory Dollars in Millions)
Public Law Title
Current Dollars
FY 2020 Constant Dollars
207

Table 6-20 Chapter 6
FY 1959 FY 1960 FY 1961 FY 1962 FY 1963 FY 1964 FY 1965 FY 1966 FY 1967 FY 1968 FY 1969
Military Personnel ................................... 3,168 3,195 3,220 3,394 3,480 3,708 3,955 4,711 5,337 5,751 6,156 Operation and Maintenance .................... 2,700 2,684 2,774 3,029 3,014 3,100 3,447 4,261 5,094 5,407 5,835 Procurement ........................................... 4,195 3,670 4,903 6,764 7,113 6,326 5,778 7,296 8,012 7,608 6,570 RDT&E .................................................... 1,533 1,509 1,367 1,309 1,511 1,561 1,388 1,574 1,919 1,872 2,147 Military Construction ............................... 303 213 167 150 168 205 277 644 272 519 297 Family Housing ....................................... Revolving and Management Funds ......... 169 1 160 185 312 Trust, Receipts, and Other ...................... 72 82 19 30 -32 -54 -60 -65 -45 -35 -38
Total Current Dollars ........................ 11,971 11,352 12,450 14,845 15,255 14,845 14,785 18,581 20,773 21,122 21,278
Military Personnel ................................... 49,293 48,447 48,381 51,288 51,694 51,861 52,991 57,042 61,450 63,142 63,807 Operation and Maintenance .................... 30,640 29,437 28,655 30,922 29,584 29,948 31,257 36,315 41,681 43,165 43,884 Procurement ........................................... 42,770 34,117 47,917 64,510 64,809 53,129 46,626 53,501 56,298 50,463 41,391 RDT&E .................................................... 11,774 11,533 10,433 10,036 11,342 11,592 10,144 11,055 12,896 12,293 13,491 Military Construction ............................... 2,279 1,615 1,254 1,110 1,221 1,427 1,845 4,055 1,707 3,063 1,717 Family Housing ....................................... Revolving and Management Funds ......... 1,154 6 1,041 1,160 1,836 Trust, Receipts, and Other ...................... 493 566 128 205 -218 -367 -403 -423 -281 -212 -224
Total Constant Dollars ...................... 137,249 125,714 136,768 159,225 158,439 147,590 142,459 162,585 174,910 171,913 165,901
Military Personnel ................................... -2.0 -1.7 -0.1 6.0 0.8 0.3 2.2 7.6 7.7 2.8 1.1 Operation and Maintenance .................... -1.8 -3.9 -2.7 7.9 -4.3 1.2 4.4 16.2 14.8 3.6 1.7 Procurement ........................................... 7.8 -20.2 40.4 34.6 0.5 -18.0 -12.2 14.7 5.2 -10.4 -18.0 RDT&E .................................................... 69.5 -2.0 -9.5 -3.8 13.0 2.2 -12.5 9.0 16.7 -4.7 9.8 Military Construction ............................... 13.7 -29.1 -22.4 -11.5 10.1 16.8 29.3 119.8 -57.9 79.4 -43.9
Total Real Growth ............................. 5.0 -8.4 8.8 16.4 -0.5 -6.8 -3.5 14.1 7.6 -1.7 -3.5
NOTE: War and supplemental funding is included in FY 1948 through FY 2021.
Percent Real Growth (%)
Table 6-20: NAVY BUDGET AUTHORITY BY PUBLIC LAW TITLE (Continued)(Discretionary and Mandatory Dollars in Millions)
Public Law Title
Current Dollars
FY 2020 Constant Dollars
208

Table 6-20 Chapter 6
FY 1970 FY 1971 FY 1972 FY 1973 FY 1974 FY 1975 FY 1976 FY 1977 FY 1978 FY 1979 FY 1980
Military Personnel ................................... 6,675 6,393 6,758 7,346 7,532 7,881 8,039 8,349 8,774 9,220 9,944 Operation and Maintenance .................... 5,634 5,355 5,538 5,841 7,247 8,017 9,119 10,588 12,060 13,087 16,124 Procurement ........................................... 7,107 7,118 8,605 8,865 8,624 8,299 10,113 13,115 14,140 14,377 15,850 RDT&E .................................................... 2,236 2,178 2,368 2,542 2,681 3,024 3,257 3,723 4,018 4,480 4,572 Military Construction ............................... 310 307 366 538 632 629 806 594 493 782 603 Family Housing ....................................... Revolving and Management Funds ......... 5 12 38 32 251 238 Trust, Receipts, and Other ...................... -34 -30 -33 -34 -38 -40 -45 -29 -19 -95 -107
Total Current Dollars ........................ 21,932 21,321 23,602 25,097 26,679 27,808 31,302 36,378 39,499 42,103 47,225
Military Personnel ................................... 61,370 54,946 50,988 49,738 47,687 46,404 44,884 43,984 43,276 42,776 42,906 Operation and Maintenance .................... 39,954 35,736 36,209 35,553 38,837 40,283 40,989 43,981 45,624 47,101 49,226 Procurement ........................................... 44,023 40,564 45,510 43,096 37,947 32,604 35,709 44,781 44,206 40,651 40,676 RDT&E .................................................... 13,194 12,215 12,528 12,507 11,957 12,184 11,922 12,949 12,847 12,588 11,728 Military Construction ............................... 1,665 1,525 1,661 2,174 2,303 2,097 2,473 1,801 1,401 2,025 1,498 Family Housing ....................................... Revolving and Management Funds ......... 26 46 135 107 760 652 Trust, Receipts, and Other ...................... -195 -165 -173 -170 -180 -166 -173 -102 -63 -287 -293
Total Constant Dollars ...................... 160,037 144,821 146,723 142,899 138,551 133,405 135,849 147,529 147,397 145,615 146,393
Military Personnel ................................... -3.8 -10.5 -7.2 -2.5 -4.1 -2.7 -3.3 -2.0 -1.6 -1.2 0.3 Operation and Maintenance .................... -9.0 -10.6 1.3 -1.8 9.2 3.7 1.8 7.3 3.7 3.2 4.5 Procurement ........................................... 6.4 -7.9 12.2 -5.3 -11.9 -14.1 9.5 25.4 -1.3 -8.0 0.1 RDT&E .................................................... -2.2 -7.4 2.6 -0.2 -4.4 1.9 -2.1 8.6 -0.8 -2.0 -6.8 Military Construction ............................... -3.0 -8.4 9.0 30.9 5.9 -8.9 17.9 -27.2 -22.2 44.6 -26.0
Total Real Growth ............................. -3.5 -9.5 1.3 -2.6 -3.0 -3.7 1.8 8.6 -0.1 -1.2 0.5
NOTE: War and supplemental funding is included in FY 1948 through FY 2021.
Percent Real Growth (%)
Table 6-20: NAVY BUDGET AUTHORITY BY PUBLIC LAW TITLE (Continued)(Discretionary and Mandatory Dollars in Millions)
Public Law Title
Current Dollars
FY 2020 Constant Dollars
209
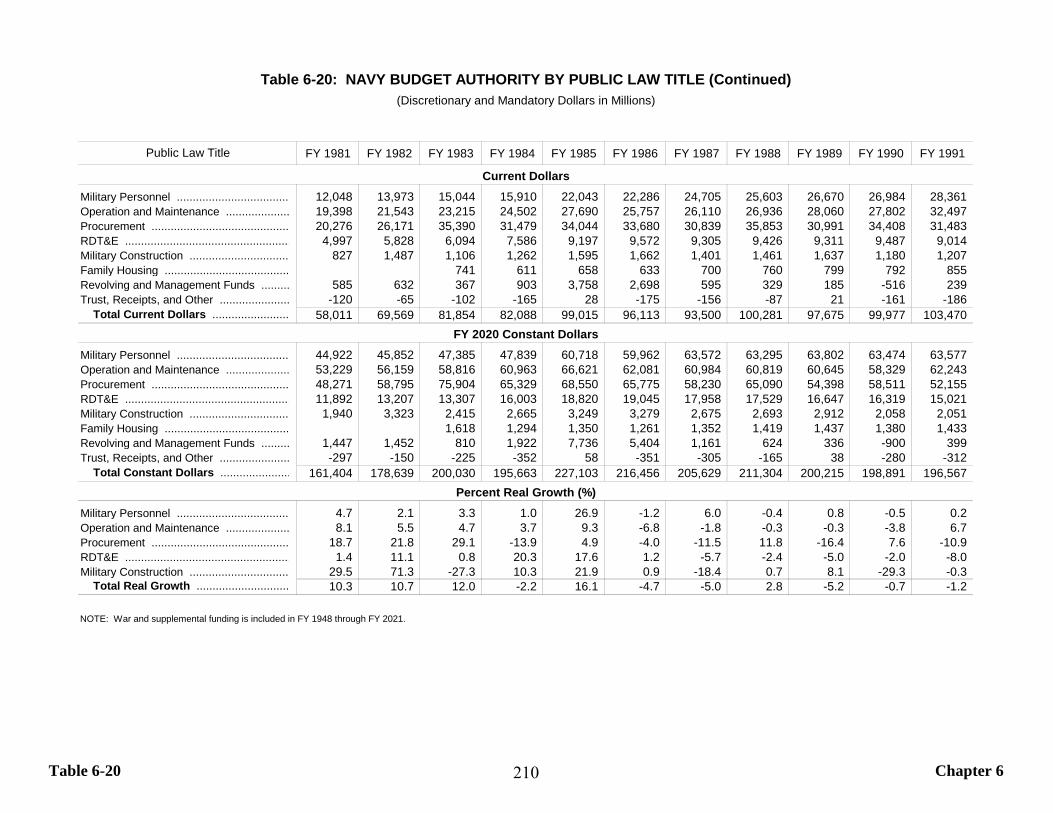
Table 6-20 Chapter 6
FY 1981 FY 1982 FY 1983 FY 1984 FY 1985 FY 1986 FY 1987 FY 1988 FY 1989 FY 1990 FY 1991
Military Personnel ................................... 12,048 13,973 15,044 15,910 22,043 22,286 24,705 25,603 26,670 26,984 28,361 Operation and Maintenance .................... 19,398 21,543 23,215 24,502 27,690 25,757 26,110 26,936 28,060 27,802 32,497 Procurement ........................................... 20,276 26,171 35,390 31,479 34,044 33,680 30,839 35,853 30,991 34,408 31,483 RDT&E .................................................... 4,997 5,828 6,094 7,586 9,197 9,572 9,305 9,426 9,311 9,487 9,014 Military Construction ............................... 827 1,487 1,106 1,262 1,595 1,662 1,401 1,461 1,637 1,180 1,207 Family Housing ....................................... 741 611 658 633 700 760 799 792 855 Revolving and Management Funds ......... 585 632 367 903 3,758 2,698 595 329 185 -516 239 Trust, Receipts, and Other ...................... -120 -65 -102 -165 28 -175 -156 -87 21 -161 -186
Total Current Dollars ........................ 58,011 69,569 81,854 82,088 99,015 96,113 93,500 100,281 97,675 99,977 103,470
Military Personnel ................................... 44,922 45,852 47,385 47,839 60,718 59,962 63,572 63,295 63,802 63,474 63,577 Operation and Maintenance .................... 53,229 56,159 58,816 60,963 66,621 62,081 60,984 60,819 60,645 58,329 62,243 Procurement ........................................... 48,271 58,795 75,904 65,329 68,550 65,775 58,230 65,090 54,398 58,511 52,155 RDT&E .................................................... 11,892 13,207 13,307 16,003 18,820 19,045 17,958 17,529 16,647 16,319 15,021 Military Construction ............................... 1,940 3,323 2,415 2,665 3,249 3,279 2,675 2,693 2,912 2,058 2,051 Family Housing ....................................... 1,618 1,294 1,350 1,261 1,352 1,419 1,437 1,380 1,433 Revolving and Management Funds ......... 1,447 1,452 810 1,922 7,736 5,404 1,161 624 336 -900 399 Trust, Receipts, and Other ...................... -297 -150 -225 -352 58 -351 -305 -165 38 -280 -312
Total Constant Dollars ...................... 161,404 178,639 200,030 195,663 227,103 216,456 205,629 211,304 200,215 198,891 196,567
Military Personnel ................................... 4.7 2.1 3.3 1.0 26.9 -1.2 6.0 -0.4 0.8 -0.5 0.2 Operation and Maintenance .................... 8.1 5.5 4.7 3.7 9.3 -6.8 -1.8 -0.3 -0.3 -3.8 6.7 Procurement ........................................... 18.7 21.8 29.1 -13.9 4.9 -4.0 -11.5 11.8 -16.4 7.6 -10.9 RDT&E .................................................... 1.4 11.1 0.8 20.3 17.6 1.2 -5.7 -2.4 -5.0 -2.0 -8.0 Military Construction ............................... 29.5 71.3 -27.3 10.3 21.9 0.9 -18.4 0.7 8.1 -29.3 -0.3
Total Real Growth ............................. 10.3 10.7 12.0 -2.2 16.1 -4.7 -5.0 2.8 -5.2 -0.7 -1.2
NOTE: War and supplemental funding is included in FY 1948 through FY 2021.
Percent Real Growth (%)
Table 6-20: NAVY BUDGET AUTHORITY BY PUBLIC LAW TITLE (Continued)(Discretionary and Mandatory Dollars in Millions)
Public Law Title
Current Dollars
FY 2020 Constant Dollars
210

Table 6-20 Chapter 6
FY 1992 FY 1993 FY 1994 FY 1995 FY 1996 FY 1997 FY 1998 FY 1999 FY 2000 FY 2001 FY 2002
Military Personnel ................................... 28,155 27,294 26,241 25,308 24,649 24,862 24,560 24,663 25,749 26,874 29,964 Operation and Maintenance .................... 26,258 23,596 23,642 25,306 25,151 24,475 26,000 27,138 27,759 29,022 32,621 Procurement ........................................... 26,587 19,699 16,126 17,303 15,850 17,143 19,499 20,731 23,141 26,300 24,369 RDT&E .................................................... 7,579 8,914 8,206 8,574 8,443 7,917 7,846 8,977 9,044 9,579 11,387 Military Construction ............................... 953 392 1,354 401 3,061 1,926 1,705 640 979 1,418 1,376 Family Housing ....................................... 989 1,044 1,102 1,207 1,573 1,521 1,375 1,215 1,177 1,312 1,228 Revolving and Management Funds ......... 2,464 1,541 -501 1,024 1,834 1,076 610 1,277 1,158 1,608 Trust, Receipts, and Other ...................... -211 -204 -156 -650 365 -116 -1,366 53 -331 -161 -176
Total Current Dollars ........................ 90,311 83,198 78,055 76,948 80,117 79,562 80,696 84,028 88,795 95,501 102,376
Military Personnel ................................... 61,490 57,117 53,522 50,373 48,040 46,956 44,347 43,214 43,038 43,484 45,884 Operation and Maintenance .................... 51,028 45,073 42,646 44,507 43,330 41,166 42,337 43,851 43,870 43,824 48,366 Procurement ........................................... 43,114 31,338 25,219 26,652 24,097 25,757 28,969 30,334 33,348 37,343 33,990 RDT&E .................................................... 12,330 14,571 12,990 13,303 12,862 11,908 11,672 13,232 13,056 13,602 15,926 Military Construction ............................... 1,592 667 2,150 656 4,664 2,921 2,556 962 1,430 2,019 1,915 Family Housing ....................................... 1,621 1,676 1,734 1,867 2,392 2,284 2,048 1,786 1,709 1,870 1,730 Revolving and Management Funds ......... 3,917 2,406 -769 1,551 2,733 1,592 890 1,832 1,631 2,241 Trust, Receipts, and Other ...................... -342 -324 -242 -992 546 -171 -1,995 77 -473 -226 -245
Total Constant Dollars ...................... 170,833 154,035 140,424 135,596 137,481 133,555 131,528 134,347 137,808 143,548 149,808
Military Personnel ................................... -3.3 -7.1 -6.3 -5.9 -4.6 -2.3 -5.6 -2.6 -0.4 1.0 5.5 Operation and Maintenance .................... -18.0 -11.7 -5.4 4.4 -2.6 -5.0 2.8 3.6 0.0 -0.1 10.4 Procurement ........................................... -17.3 -27.3 -19.5 5.7 -9.6 6.9 12.5 4.7 9.9 12.0 -9.0 RDT&E .................................................... -17.9 18.2 -10.9 2.4 -3.3 -7.4 -2.0 13.4 -1.3 4.2 17.1 Military Construction ............................... -22.4 -58.1 222.5 -69.5 610.7 -37.4 -12.5 -62.4 48.6 41.3 -5.2
Total Real Growth ............................. -13.1 -9.8 -8.8 -3.4 1.4 -2.9 -1.5 2.1 2.6 4.2 4.4
NOTE: War and supplemental funding is included in FY 1948 through FY 2021.
Percent Real Growth (%)
Table 6-20: NAVY BUDGET AUTHORITY BY PUBLIC LAW TITLE (Continued)(Discretionary and Mandatory Dollars in Millions)
Public Law Title
Current Dollars
FY 2020 Constant Dollars
211
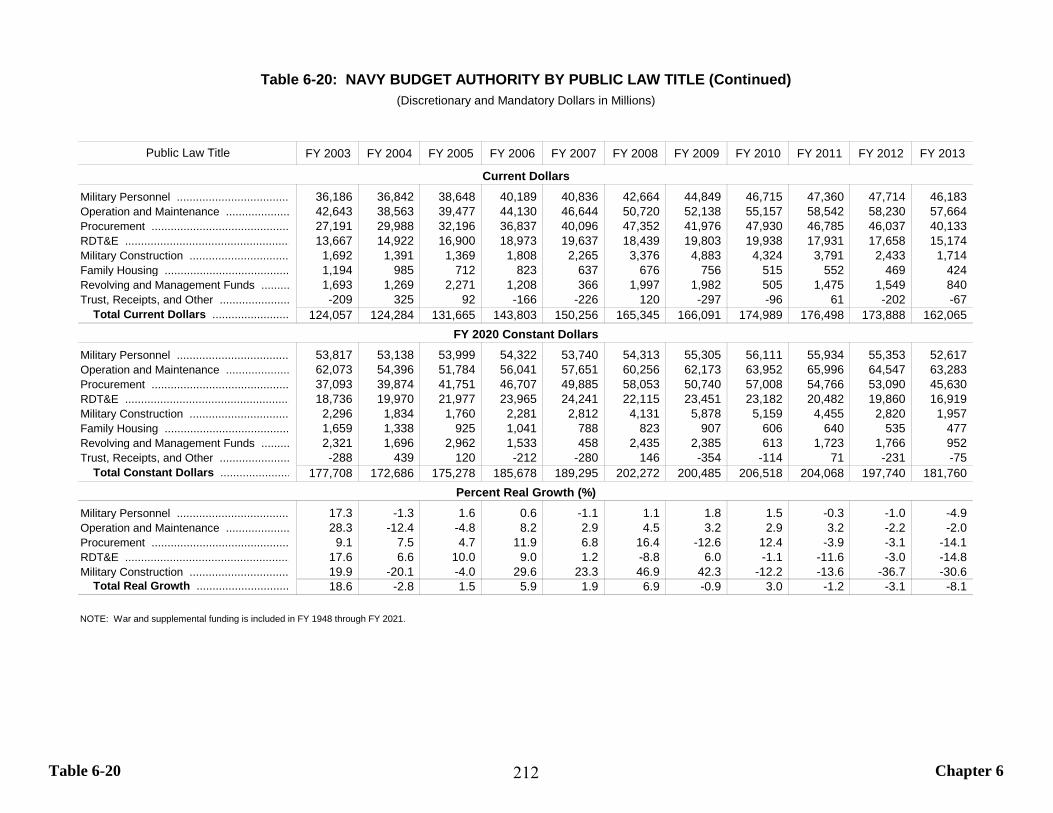
Table 6-20 Chapter 6
FY 2003 FY 2004 FY 2005 FY 2006 FY 2007 FY 2008 FY 2009 FY 2010 FY 2011 FY 2012 FY 2013
Military Personnel ................................... 36,186 36,842 38,648 40,189 40,836 42,664 44,849 46,715 47,360 47,714 46,183 Operation and Maintenance .................... 42,643 38,563 39,477 44,130 46,644 50,720 52,138 55,157 58,542 58,230 57,664 Procurement ........................................... 27,191 29,988 32,196 36,837 40,096 47,352 41,976 47,930 46,785 46,037 40,133 RDT&E .................................................... 13,667 14,922 16,900 18,973 19,637 18,439 19,803 19,938 17,931 17,658 15,174 Military Construction ............................... 1,692 1,391 1,369 1,808 2,265 3,376 4,883 4,324 3,791 2,433 1,714 Family Housing ....................................... 1,194 985 712 823 637 676 756 515 552 469 424 Revolving and Management Funds ......... 1,693 1,269 2,271 1,208 366 1,997 1,982 505 1,475 1,549 840 Trust, Receipts, and Other ...................... -209 325 92 -166 -226 120 -297 -96 61 -202 -67
Total Current Dollars ........................ 124,057 124,284 131,665 143,803 150,256 165,345 166,091 174,989 176,498 173,888 162,065
Military Personnel ................................... 53,817 53,138 53,999 54,322 53,740 54,313 55,305 56,111 55,934 55,353 52,617 Operation and Maintenance .................... 62,073 54,396 51,784 56,041 57,651 60,256 62,173 63,952 65,996 64,547 63,283 Procurement ........................................... 37,093 39,874 41,751 46,707 49,885 58,053 50,740 57,008 54,766 53,090 45,630 RDT&E .................................................... 18,736 19,970 21,977 23,965 24,241 22,115 23,451 23,182 20,482 19,860 16,919 Military Construction ............................... 2,296 1,834 1,760 2,281 2,812 4,131 5,878 5,159 4,455 2,820 1,957 Family Housing ....................................... 1,659 1,338 925 1,041 788 823 907 606 640 535 477 Revolving and Management Funds ......... 2,321 1,696 2,962 1,533 458 2,435 2,385 613 1,723 1,766 952 Trust, Receipts, and Other ...................... -288 439 120 -212 -280 146 -354 -114 71 -231 -75
Total Constant Dollars ...................... 177,708 172,686 175,278 185,678 189,295 202,272 200,485 206,518 204,068 197,740 181,760
Military Personnel ................................... 17.3 -1.3 1.6 0.6 -1.1 1.1 1.8 1.5 -0.3 -1.0 -4.9 Operation and Maintenance .................... 28.3 -12.4 -4.8 8.2 2.9 4.5 3.2 2.9 3.2 -2.2 -2.0 Procurement ........................................... 9.1 7.5 4.7 11.9 6.8 16.4 -12.6 12.4 -3.9 -3.1 -14.1 RDT&E .................................................... 17.6 6.6 10.0 9.0 1.2 -8.8 6.0 -1.1 -11.6 -3.0 -14.8 Military Construction ............................... 19.9 -20.1 -4.0 29.6 23.3 46.9 42.3 -12.2 -13.6 -36.7 -30.6
Total Real Growth ............................. 18.6 -2.8 1.5 5.9 1.9 6.9 -0.9 3.0 -1.2 -3.1 -8.1
NOTE: War and supplemental funding is included in FY 1948 through FY 2021.
Percent Real Growth (%)
Table 6-20: NAVY BUDGET AUTHORITY BY PUBLIC LAW TITLE (Continued)(Discretionary and Mandatory Dollars in Millions)
Public Law Title
Current Dollars
FY 2020 Constant Dollars
212
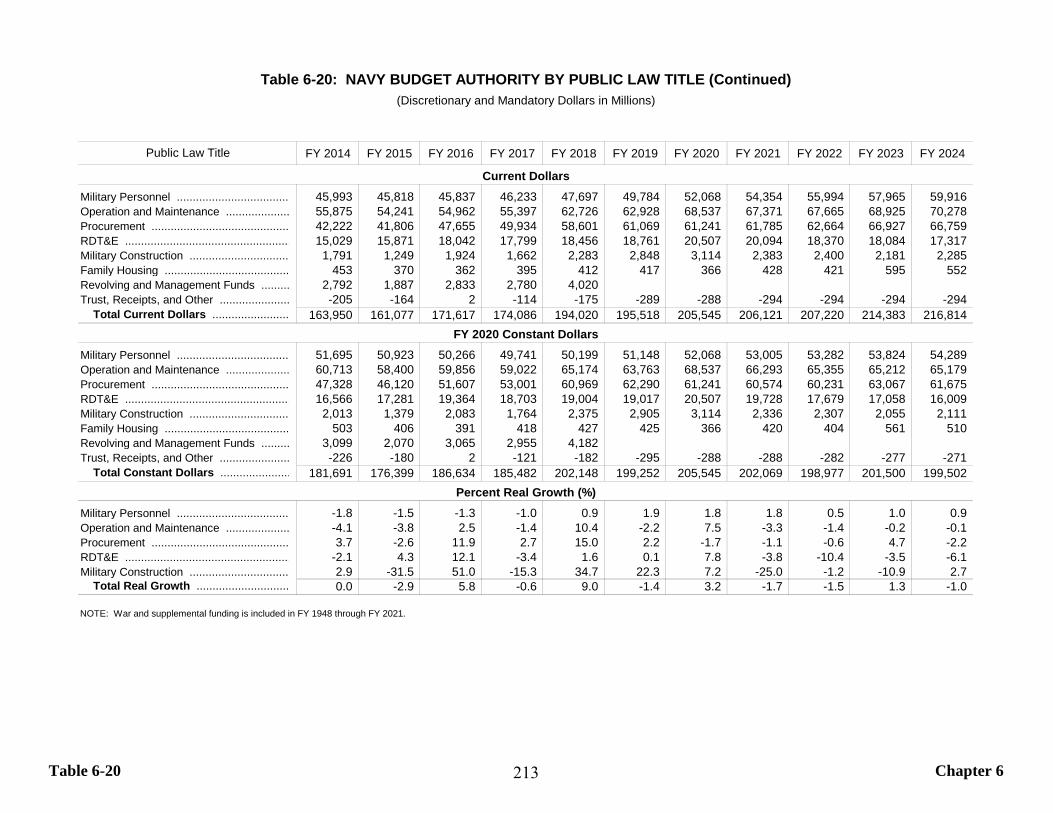
Table 6-20 Chapter 6
FY 2014 FY 2015 FY 2016 FY 2017 FY 2018 FY 2019 FY 2020 FY 2021 FY 2022 FY 2023 FY 2024
Military Personnel ................................... 45,993 45,818 45,837 46,233 47,697 49,784 52,068 54,354 55,994 57,965 59,916 Operation and Maintenance .................... 55,875 54,241 54,962 55,397 62,726 62,928 68,537 67,371 67,665 68,925 70,278 Procurement ........................................... 42,222 41,806 47,655 49,934 58,601 61,069 61,241 61,785 62,664 66,927 66,759 RDT&E .................................................... 15,029 15,871 18,042 17,799 18,456 18,761 20,507 20,094 18,370 18,084 17,317 Military Construction ............................... 1,791 1,249 1,924 1,662 2,283 2,848 3,114 2,383 2,400 2,181 2,285 Family Housing ....................................... 453 370 362 395 412 417 366 428 421 595 552 Revolving and Management Funds ......... 2,792 1,887 2,833 2,780 4,020 Trust, Receipts, and Other ...................... -205 -164 2 -114 -175 -289 -288 -294 -294 -294 -294
Total Current Dollars ........................ 163,950 161,077 171,617 174,086 194,020 195,518 205,545 206,121 207,220 214,383 216,814
Military Personnel ................................... 51,695 50,923 50,266 49,741 50,199 51,148 52,068 53,005 53,282 53,824 54,289 Operation and Maintenance .................... 60,713 58,400 59,856 59,022 65,174 63,763 68,537 66,293 65,355 65,212 65,179 Procurement ........................................... 47,328 46,120 51,607 53,001 60,969 62,290 61,241 60,574 60,231 63,067 61,675 RDT&E .................................................... 16,566 17,281 19,364 18,703 19,004 19,017 20,507 19,728 17,679 17,058 16,009 Military Construction ............................... 2,013 1,379 2,083 1,764 2,375 2,905 3,114 2,336 2,307 2,055 2,111 Family Housing ....................................... 503 406 391 418 427 425 366 420 404 561 510 Revolving and Management Funds ......... 3,099 2,070 3,065 2,955 4,182 Trust, Receipts, and Other ...................... -226 -180 2 -121 -182 -295 -288 -288 -282 -277 -271
Total Constant Dollars ...................... 181,691 176,399 186,634 185,482 202,148 199,252 205,545 202,069 198,977 201,500 199,502
Military Personnel ................................... -1.8 -1.5 -1.3 -1.0 0.9 1.9 1.8 1.8 0.5 1.0 0.9 Operation and Maintenance .................... -4.1 -3.8 2.5 -1.4 10.4 -2.2 7.5 -3.3 -1.4 -0.2 -0.1 Procurement ........................................... 3.7 -2.6 11.9 2.7 15.0 2.2 -1.7 -1.1 -0.6 4.7 -2.2 RDT&E .................................................... -2.1 4.3 12.1 -3.4 1.6 0.1 7.8 -3.8 -10.4 -3.5 -6.1 Military Construction ............................... 2.9 -31.5 51.0 -15.3 34.7 22.3 7.2 -25.0 -1.2 -10.9 2.7
Total Real Growth ............................. 0.0 -2.9 5.8 -0.6 9.0 -1.4 3.2 -1.7 -1.5 1.3 -1.0
NOTE: War and supplemental funding is included in FY 1948 through FY 2021.
Percent Real Growth (%)
Table 6-20: NAVY BUDGET AUTHORITY BY PUBLIC LAW TITLE (Continued)(Discretionary and Mandatory Dollars in Millions)
Public Law Title
Current Dollars
FY 2020 Constant Dollars
213
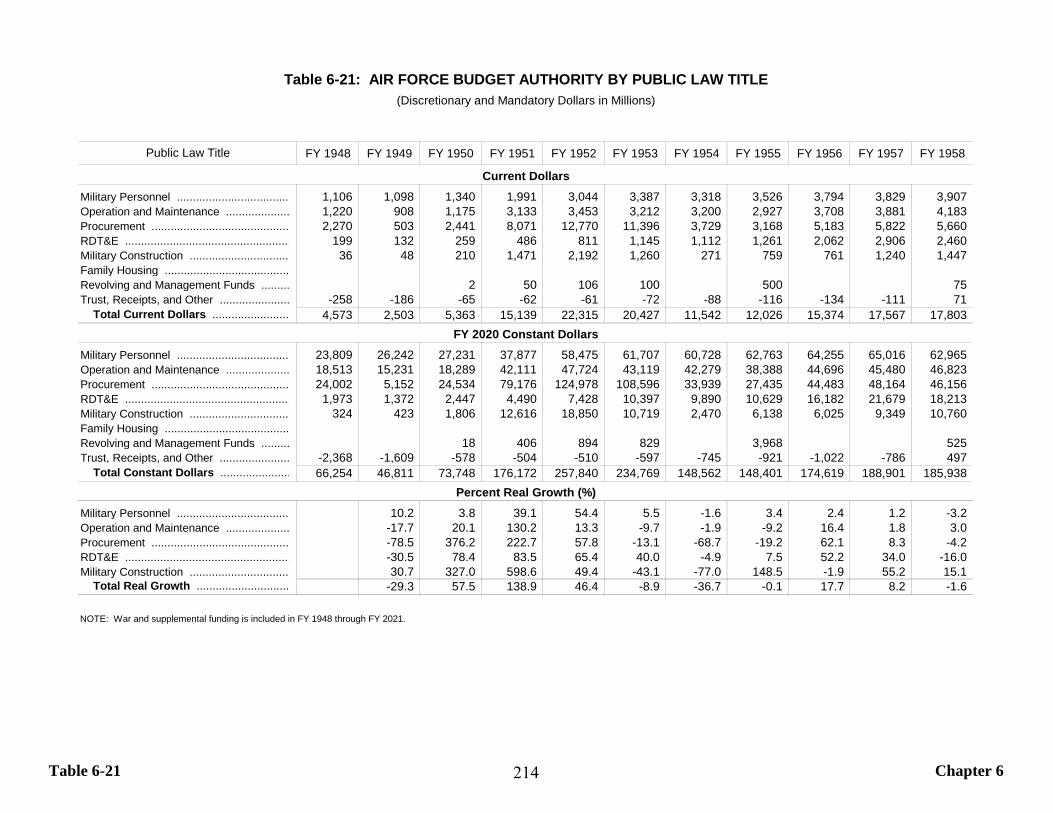
Table 6-21 Chapter 6
FY 1948 FY 1949 FY 1950 FY 1951 FY 1952 FY 1953 FY 1954 FY 1955 FY 1956 FY 1957 FY 1958
Military Personnel ................................... 1,106 1,098 1,340 1,991 3,044 3,387 3,318 3,526 3,794 3,829 3,907 Operation and Maintenance .................... 1,220 908 1,175 3,133 3,453 3,212 3,200 2,927 3,708 3,881 4,183 Procurement ........................................... 2,270 503 2,441 8,071 12,770 11,396 3,729 3,168 5,183 5,822 5,660 RDT&E .................................................... 199 132 259 486 811 1,145 1,112 1,261 2,062 2,906 2,460 Military Construction ............................... 36 48 210 1,471 2,192 1,260 271 759 761 1,240 1,447 Family Housing ....................................... Revolving and Management Funds ......... 2 50 106 100 500 75 Trust, Receipts, and Other ...................... -258 -186 -65 -62 -61 -72 -88 -116 -134 -111 71
Total Current Dollars ........................ 4,573 2,503 5,363 15,139 22,315 20,427 11,542 12,026 15,374 17,567 17,803
Military Personnel ................................... 23,809 26,242 27,231 37,877 58,475 61,707 60,728 62,763 64,255 65,016 62,965 Operation and Maintenance .................... 18,513 15,231 18,289 42,111 47,724 43,119 42,279 38,388 44,696 45,480 46,823 Procurement ........................................... 24,002 5,152 24,534 79,176 124,978 108,596 33,939 27,435 44,483 48,164 46,156 RDT&E .................................................... 1,973 1,372 2,447 4,490 7,428 10,397 9,890 10,629 16,182 21,679 18,213 Military Construction ............................... 324 423 1,806 12,616 18,850 10,719 2,470 6,138 6,025 9,349 10,760 Family Housing ....................................... Revolving and Management Funds ......... 18 406 894 829 3,968 525 Trust, Receipts, and Other ...................... -2,368 -1,609 -578 -504 -510 -597 -745 -921 -1,022 -786 497
Total Constant Dollars ...................... 66,254 46,811 73,748 176,172 257,840 234,769 148,562 148,401 174,619 188,901 185,938
Military Personnel ................................... 10.2 3.8 39.1 54.4 5.5 -1.6 3.4 2.4 1.2 -3.2 Operation and Maintenance .................... -17.7 20.1 130.2 13.3 -9.7 -1.9 -9.2 16.4 1.8 3.0 Procurement ........................................... -78.5 376.2 222.7 57.8 -13.1 -68.7 -19.2 62.1 8.3 -4.2 RDT&E .................................................... -30.5 78.4 83.5 65.4 40.0 -4.9 7.5 52.2 34.0 -16.0 Military Construction ............................... 30.7 327.0 598.6 49.4 -43.1 -77.0 148.5 -1.9 55.2 15.1
Total Real Growth ............................. -29.3 57.5 138.9 46.4 -8.9 -36.7 -0.1 17.7 8.2 -1.6
NOTE: War and supplemental funding is included in FY 1948 through FY 2021.
Percent Real Growth (%)
Table 6-21: AIR FORCE BUDGET AUTHORITY BY PUBLIC LAW TITLE(Discretionary and Mandatory Dollars in Millions)
Public Law Title
Current Dollars
FY 2020 Constant Dollars
214
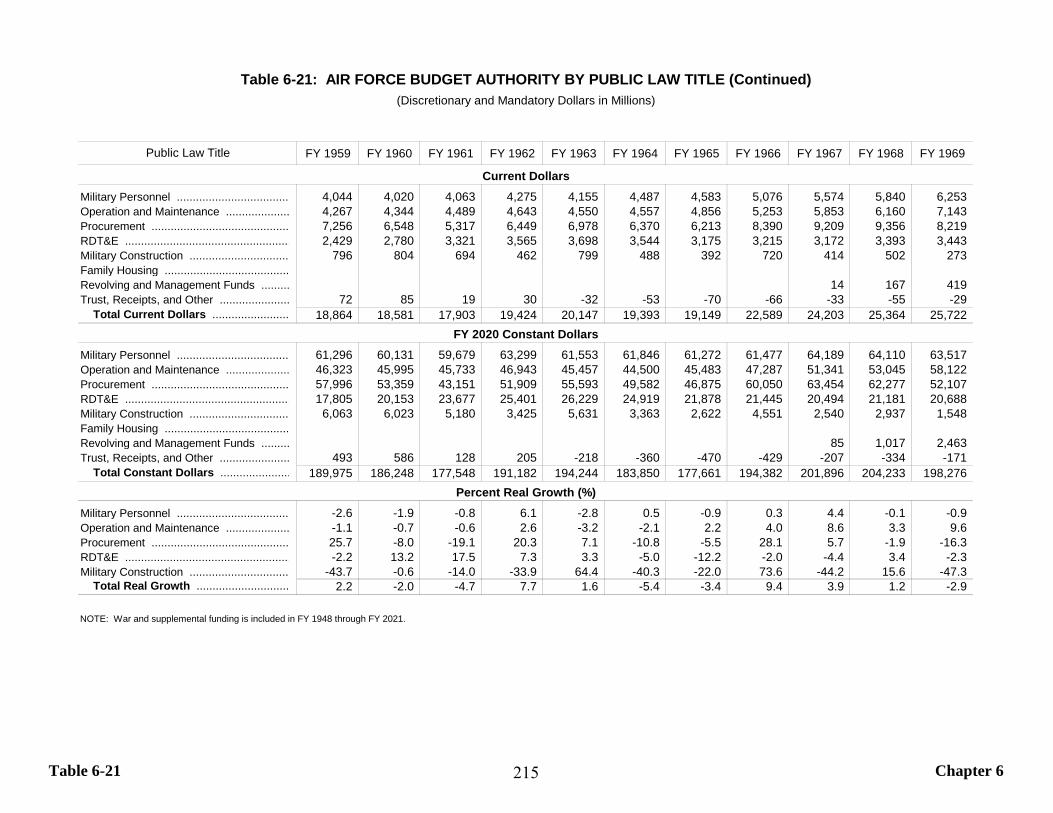
Table 6-21 Chapter 6
FY 1959 FY 1960 FY 1961 FY 1962 FY 1963 FY 1964 FY 1965 FY 1966 FY 1967 FY 1968 FY 1969
Military Personnel ................................... 4,044 4,020 4,063 4,275 4,155 4,487 4,583 5,076 5,574 5,840 6,253 Operation and Maintenance .................... 4,267 4,344 4,489 4,643 4,550 4,557 4,856 5,253 5,853 6,160 7,143 Procurement ........................................... 7,256 6,548 5,317 6,449 6,978 6,370 6,213 8,390 9,209 9,356 8,219 RDT&E .................................................... 2,429 2,780 3,321 3,565 3,698 3,544 3,175 3,215 3,172 3,393 3,443 Military Construction ............................... 796 804 694 462 799 488 392 720 414 502 273 Family Housing ....................................... Revolving and Management Funds ......... 14 167 419 Trust, Receipts, and Other ...................... 72 85 19 30 -32 -53 -70 -66 -33 -55 -29
Total Current Dollars ........................ 18,864 18,581 17,903 19,424 20,147 19,393 19,149 22,589 24,203 25,364 25,722
Military Personnel ................................... 61,296 60,131 59,679 63,299 61,553 61,846 61,272 61,477 64,189 64,110 63,517 Operation and Maintenance .................... 46,323 45,995 45,733 46,943 45,457 44,500 45,483 47,287 51,341 53,045 58,122 Procurement ........................................... 57,996 53,359 43,151 51,909 55,593 49,582 46,875 60,050 63,454 62,277 52,107 RDT&E .................................................... 17,805 20,153 23,677 25,401 26,229 24,919 21,878 21,445 20,494 21,181 20,688 Military Construction ............................... 6,063 6,023 5,180 3,425 5,631 3,363 2,622 4,551 2,540 2,937 1,548 Family Housing ....................................... Revolving and Management Funds ......... 85 1,017 2,463 Trust, Receipts, and Other ...................... 493 586 128 205 -218 -360 -470 -429 -207 -334 -171
Total Constant Dollars ...................... 189,975 186,248 177,548 191,182 194,244 183,850 177,661 194,382 201,896 204,233 198,276
Military Personnel ................................... -2.6 -1.9 -0.8 6.1 -2.8 0.5 -0.9 0.3 4.4 -0.1 -0.9 Operation and Maintenance .................... -1.1 -0.7 -0.6 2.6 -3.2 -2.1 2.2 4.0 8.6 3.3 9.6 Procurement ........................................... 25.7 -8.0 -19.1 20.3 7.1 -10.8 -5.5 28.1 5.7 -1.9 -16.3 RDT&E .................................................... -2.2 13.2 17.5 7.3 3.3 -5.0 -12.2 -2.0 -4.4 3.4 -2.3 Military Construction ............................... -43.7 -0.6 -14.0 -33.9 64.4 -40.3 -22.0 73.6 -44.2 15.6 -47.3
Total Real Growth ............................. 2.2 -2.0 -4.7 7.7 1.6 -5.4 -3.4 9.4 3.9 1.2 -2.9
NOTE: War and supplemental funding is included in FY 1948 through FY 2021.
Percent Real Growth (%)
Table 6-21: AIR FORCE BUDGET AUTHORITY BY PUBLIC LAW TITLE (Continued)(Discretionary and Mandatory Dollars in Millions)
Public Law Title
Current Dollars
FY 2020 Constant Dollars
215
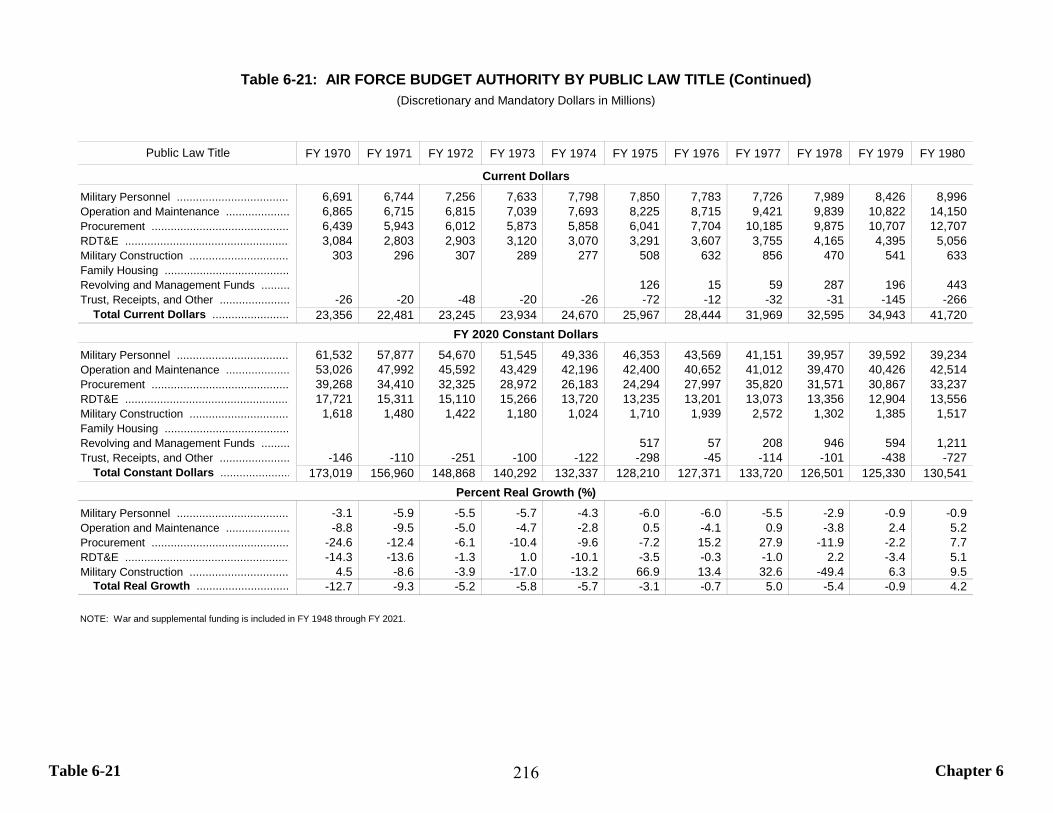
Table 6-21 Chapter 6
FY 1970 FY 1971 FY 1972 FY 1973 FY 1974 FY 1975 FY 1976 FY 1977 FY 1978 FY 1979 FY 1980
Military Personnel ................................... 6,691 6,744 7,256 7,633 7,798 7,850 7,783 7,726 7,989 8,426 8,996 Operation and Maintenance .................... 6,865 6,715 6,815 7,039 7,693 8,225 8,715 9,421 9,839 10,822 14,150 Procurement ........................................... 6,439 5,943 6,012 5,873 5,858 6,041 7,704 10,185 9,875 10,707 12,707 RDT&E .................................................... 3,084 2,803 2,903 3,120 3,070 3,291 3,607 3,755 4,165 4,395 5,056 Military Construction ............................... 303 296 307 289 277 508 632 856 470 541 633 Family Housing ....................................... Revolving and Management Funds ......... 126 15 59 287 196 443 Trust, Receipts, and Other ...................... -26 -20 -48 -20 -26 -72 -12 -32 -31 -145 -266
Total Current Dollars ........................ 23,356 22,481 23,245 23,934 24,670 25,967 28,444 31,969 32,595 34,943 41,720
Military Personnel ................................... 61,532 57,877 54,670 51,545 49,336 46,353 43,569 41,151 39,957 39,592 39,234 Operation and Maintenance .................... 53,026 47,992 45,592 43,429 42,196 42,400 40,652 41,012 39,470 40,426 42,514 Procurement ........................................... 39,268 34,410 32,325 28,972 26,183 24,294 27,997 35,820 31,571 30,867 33,237 RDT&E .................................................... 17,721 15,311 15,110 15,266 13,720 13,235 13,201 13,073 13,356 12,904 13,556 Military Construction ............................... 1,618 1,480 1,422 1,180 1,024 1,710 1,939 2,572 1,302 1,385 1,517 Family Housing ....................................... Revolving and Management Funds ......... 517 57 208 946 594 1,211 Trust, Receipts, and Other ...................... -146 -110 -251 -100 -122 -298 -45 -114 -101 -438 -727
Total Constant Dollars ...................... 173,019 156,960 148,868 140,292 132,337 128,210 127,371 133,720 126,501 125,330 130,541
Military Personnel ................................... -3.1 -5.9 -5.5 -5.7 -4.3 -6.0 -6.0 -5.5 -2.9 -0.9 -0.9 Operation and Maintenance .................... -8.8 -9.5 -5.0 -4.7 -2.8 0.5 -4.1 0.9 -3.8 2.4 5.2 Procurement ........................................... -24.6 -12.4 -6.1 -10.4 -9.6 -7.2 15.2 27.9 -11.9 -2.2 7.7 RDT&E .................................................... -14.3 -13.6 -1.3 1.0 -10.1 -3.5 -0.3 -1.0 2.2 -3.4 5.1 Military Construction ............................... 4.5 -8.6 -3.9 -17.0 -13.2 66.9 13.4 32.6 -49.4 6.3 9.5
Total Real Growth ............................. -12.7 -9.3 -5.2 -5.8 -5.7 -3.1 -0.7 5.0 -5.4 -0.9 4.2
NOTE: War and supplemental funding is included in FY 1948 through FY 2021.
Percent Real Growth (%)
Table 6-21: AIR FORCE BUDGET AUTHORITY BY PUBLIC LAW TITLE (Continued)(Discretionary and Mandatory Dollars in Millions)
Public Law Title
Current Dollars
FY 2020 Constant Dollars
216

Table 6-21 Chapter 6
FY 1981 FY 1982 FY 1983 FY 1984 FY 1985 FY 1986 FY 1987 FY 1988 FY 1989 FY 1990 FY 1991
Military Personnel ................................... 10,666 12,285 13,118 13,820 19,313 19,225 21,054 21,613 21,851 21,777 22,755 Operation and Maintenance .................... 16,889 18,486 19,645 20,369 21,846 21,249 21,682 23,040 24,973 25,160 29,061 Procurement ........................................... 16,907 23,747 27,982 36,092 41,838 38,197 31,959 26,701 30,981 30,276 24,041 RDT&E .................................................... 7,133 8,872 10,621 12,258 13,485 13,109 14,903 14,617 14,696 13,507 12,207 Military Construction ............................... 1,049 1,701 1,715 1,610 1,752 1,757 1,426 1,414 1,445 1,453 1,117 Family Housing ....................................... 914 805 885 793 798 828 921 870 888 Revolving and Management Funds ......... 593 79 162 1,289 549 752 202 452 187 121 1,672 Trust, Receipts, and Other ...................... -93 -349 -82 -134 -246 -214 -399 -340 -369 -274 -485
Total Current Dollars ........................ 53,144 64,821 74,074 86,108 99,420 94,870 91,624 88,324 94,685 92,890 91,257
Military Personnel ................................... 40,673 41,086 41,947 42,230 53,667 52,184 54,709 53,936 52,805 51,697 51,271 Operation and Maintenance .................... 45,513 46,939 49,341 51,232 54,036 52,989 52,813 54,314 56,425 55,721 56,655 Procurement ........................................... 40,607 53,553 60,316 75,181 84,532 74,769 60,582 48,848 54,585 51,631 39,884 RDT&E .................................................... 17,495 20,584 23,656 26,370 28,127 26,609 29,278 27,592 26,643 23,605 20,604 Military Construction ............................... 2,395 3,745 3,651 3,322 3,508 3,409 2,673 2,555 2,523 2,463 1,849 Family Housing ....................................... 1,990 1,714 1,834 1,607 1,574 1,562 1,671 1,521 1,497 Revolving and Management Funds ......... 1,466 181 357 2,743 1,129 1,507 393 856 340 211 2,798 Trust, Receipts, and Other ...................... -230 -801 -181 -286 -507 -429 -779 -644 -670 -478 -812
Total Constant Dollars ...................... 147,920 165,286 181,077 202,506 226,325 212,646 201,243 189,019 194,322 186,371 173,747
Military Personnel ................................... 3.7 1.0 2.1 0.7 27.1 -2.8 4.8 -1.4 -2.1 -2.1 -0.8 Operation and Maintenance .................... 7.1 3.1 5.1 3.8 5.5 -1.9 -0.3 2.8 3.9 -1.2 1.7 Procurement ........................................... 22.2 31.9 12.6 24.6 12.4 -11.5 -19.0 -19.4 11.7 -5.4 -22.8 RDT&E .................................................... 29.1 17.7 14.9 11.5 6.7 -5.4 10.0 -5.8 -3.4 -11.4 -12.7 Military Construction ............................... 57.9 56.4 -2.5 -9.0 5.6 -2.8 -21.6 -4.4 -1.2 -2.4 -24.9
Total Real Growth ............................. 13.3 11.7 9.6 11.8 11.8 -6.0 -5.4 -6.1 2.8 -4.1 -6.8
NOTE: War and supplemental funding is included in FY 1948 through FY 2021.
Percent Real Growth (%)
Table 6-21: AIR FORCE BUDGET AUTHORITY BY PUBLIC LAW TITLE (Continued)(Discretionary and Mandatory Dollars in Millions)
Public Law Title
Current Dollars
FY 2020 Constant Dollars
217

Table 6-21 Chapter 6
FY 1992 FY 1993 FY 1994 FY 1995 FY 1996 FY 1997 FY 1998 FY 1999 FY 2000 FY 2001 FY 2002
Military Personnel ................................... 21,381 20,141 18,168 19,602 19,309 19,186 19,111 19,357 20,217 20,956 24,751 Operation and Maintenance .................... 22,816 22,179 24,525 24,561 23,519 22,728 25,174 27,107 27,254 29,328 34,364 Procurement ........................................... 23,249 21,803 17,716 16,529 15,558 14,247 15,258 18,434 18,755 22,054 23,229 RDT&E .................................................... 12,867 12,979 12,021 11,787 12,427 14,017 14,265 13,807 14,511 14,297 14,519 Military Construction ............................... 1,200 1,053 1,554 816 1,285 1,567 1,537 862 1,174 1,410 1,806 Family Housing ....................................... 1,112 1,212 923 1,106 1,124 1,135 1,114 1,082 1,158 1,084 1,374 Revolving and Management Funds ......... 790 234 1,510 434 515 292 Trust, Receipts, and Other ...................... -286 -221 -332 -470 -231 -453 -409 -246 -453 -95 -108
Total Current Dollars ........................ 82,340 79,146 74,575 73,932 72,992 73,216 76,284 81,914 83,050 89,549 100,228
Military Personnel ................................... 46,880 42,221 37,194 39,178 37,741 36,479 34,722 34,104 33,894 33,959 37,811 Operation and Maintenance .................... 45,419 42,635 45,797 45,267 42,257 39,815 42,171 44,589 44,209 44,990 51,718 Procurement ........................................... 37,694 34,656 27,652 25,380 23,553 21,296 22,561 26,927 26,999 31,255 32,401 RDT&E .................................................... 21,171 20,892 19,019 18,236 18,868 20,966 21,124 20,177 20,858 20,218 20,289 Military Construction ............................... 1,948 1,678 2,432 1,258 1,951 2,352 2,278 1,263 1,694 2,002 2,520 Family Housing ....................................... 1,836 1,959 1,467 1,732 1,734 1,730 1,677 1,603 1,691 1,552 1,941 Revolving and Management Funds ......... 1,163 343 2,189 620 723 407 Trust, Receipts, and Other ...................... -465 -351 -516 -718 -346 -666 -597 -357 -647 -133 -150
Total Constant Dollars ...................... 154,483 143,691 133,044 130,332 125,759 123,134 124,279 130,495 129,319 134,566 146,937
Military Personnel ................................... -8.6 -9.9 -11.9 5.3 -3.7 -3.3 -4.8 -1.8 -0.6 0.2 11.3 Operation and Maintenance .................... -19.8 -6.1 7.4 -1.2 -6.6 -5.8 5.9 5.7 -0.9 1.8 15.0 Procurement ........................................... -5.5 -8.1 -20.2 -8.2 -7.2 -9.6 5.9 19.3 0.3 15.8 3.7 RDT&E .................................................... 2.8 -1.3 -9.0 -4.1 3.5 11.1 0.8 -4.5 3.4 -3.1 0.4 Military Construction ............................... 5.3 -13.8 44.9 -48.3 55.1 20.6 -3.1 -44.6 34.1 18.2 25.9
Total Real Growth ............................. -11.1 -7.0 -7.4 -2.0 -3.5 -2.1 0.9 5.0 -0.9 4.1 9.2
NOTE: War and supplemental funding is included in FY 1948 through FY 2021.
Percent Real Growth (%)
Table 6-21: AIR FORCE BUDGET AUTHORITY BY PUBLIC LAW TITLE (Continued)(Discretionary and Mandatory Dollars in Millions)
Public Law Title
Current Dollars
FY 2020 Constant Dollars
218
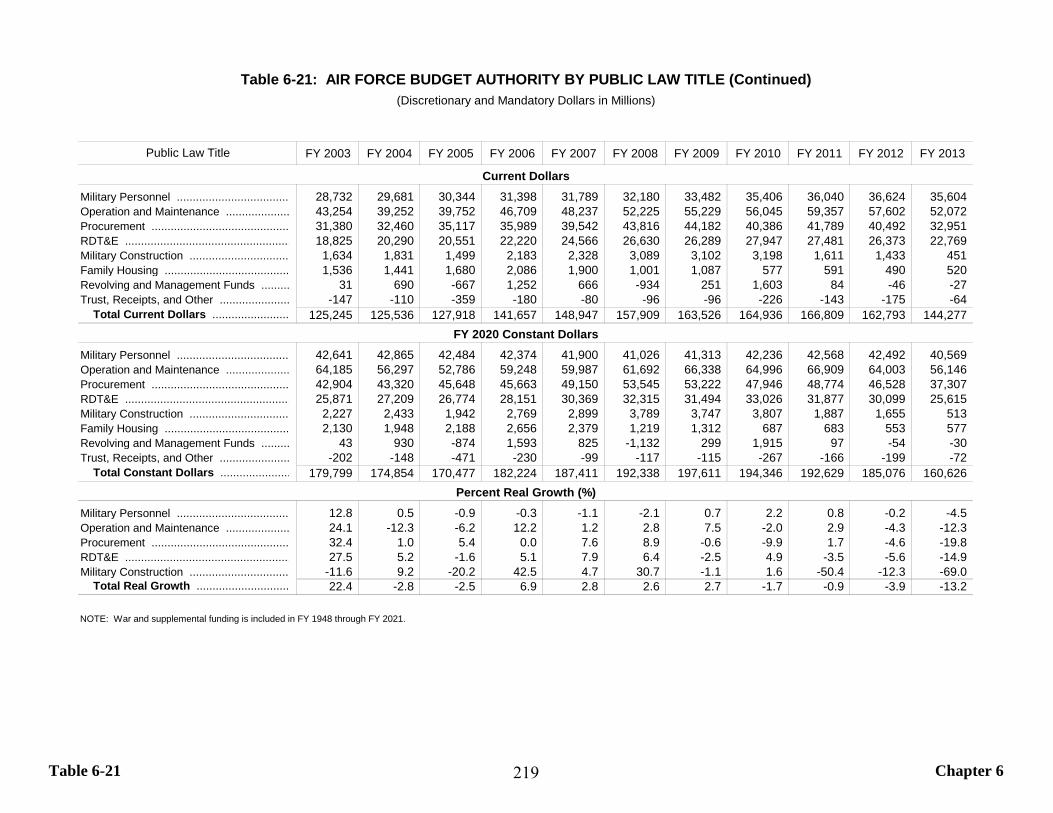
Table 6-21 Chapter 6
FY 2003 FY 2004 FY 2005 FY 2006 FY 2007 FY 2008 FY 2009 FY 2010 FY 2011 FY 2012 FY 2013
Military Personnel ................................... 28,732 29,681 30,344 31,398 31,789 32,180 33,482 35,406 36,040 36,624 35,604 Operation and Maintenance .................... 43,254 39,252 39,752 46,709 48,237 52,225 55,229 56,045 59,357 57,602 52,072 Procurement ........................................... 31,380 32,460 35,117 35,989 39,542 43,816 44,182 40,386 41,789 40,492 32,951 RDT&E .................................................... 18,825 20,290 20,551 22,220 24,566 26,630 26,289 27,947 27,481 26,373 22,769 Military Construction ............................... 1,634 1,831 1,499 2,183 2,328 3,089 3,102 3,198 1,611 1,433 451 Family Housing ....................................... 1,536 1,441 1,680 2,086 1,900 1,001 1,087 577 591 490 520 Revolving and Management Funds ......... 31 690 -667 1,252 666 -934 251 1,603 84 -46 -27 Trust, Receipts, and Other ...................... -147 -110 -359 -180 -80 -96 -96 -226 -143 -175 -64
Total Current Dollars ........................ 125,245 125,536 127,918 141,657 148,947 157,909 163,526 164,936 166,809 162,793 144,277
Military Personnel ................................... 42,641 42,865 42,484 42,374 41,900 41,026 41,313 42,236 42,568 42,492 40,569 Operation and Maintenance .................... 64,185 56,297 52,786 59,248 59,987 61,692 66,338 64,996 66,909 64,003 56,146 Procurement ........................................... 42,904 43,320 45,648 45,663 49,150 53,545 53,222 47,946 48,774 46,528 37,307 RDT&E .................................................... 25,871 27,209 26,774 28,151 30,369 32,315 31,494 33,026 31,877 30,099 25,615 Military Construction ............................... 2,227 2,433 1,942 2,769 2,899 3,789 3,747 3,807 1,887 1,655 513 Family Housing ....................................... 2,130 1,948 2,188 2,656 2,379 1,219 1,312 687 683 553 577 Revolving and Management Funds ......... 43 930 -874 1,593 825 -1,132 299 1,915 97 -54 -30 Trust, Receipts, and Other ...................... -202 -148 -471 -230 -99 -117 -115 -267 -166 -199 -72
Total Constant Dollars ...................... 179,799 174,854 170,477 182,224 187,411 192,338 197,611 194,346 192,629 185,076 160,626
Military Personnel ................................... 12.8 0.5 -0.9 -0.3 -1.1 -2.1 0.7 2.2 0.8 -0.2 -4.5 Operation and Maintenance .................... 24.1 -12.3 -6.2 12.2 1.2 2.8 7.5 -2.0 2.9 -4.3 -12.3 Procurement ........................................... 32.4 1.0 5.4 0.0 7.6 8.9 -0.6 -9.9 1.7 -4.6 -19.8 RDT&E .................................................... 27.5 5.2 -1.6 5.1 7.9 6.4 -2.5 4.9 -3.5 -5.6 -14.9 Military Construction ............................... -11.6 9.2 -20.2 42.5 4.7 30.7 -1.1 1.6 -50.4 -12.3 -69.0
Total Real Growth ............................. 22.4 -2.8 -2.5 6.9 2.8 2.6 2.7 -1.7 -0.9 -3.9 -13.2
NOTE: War and supplemental funding is included in FY 1948 through FY 2021.
Percent Real Growth (%)
Table 6-21: AIR FORCE BUDGET AUTHORITY BY PUBLIC LAW TITLE (Continued)(Discretionary and Mandatory Dollars in Millions)
Public Law Title
Current Dollars
FY 2020 Constant Dollars
219
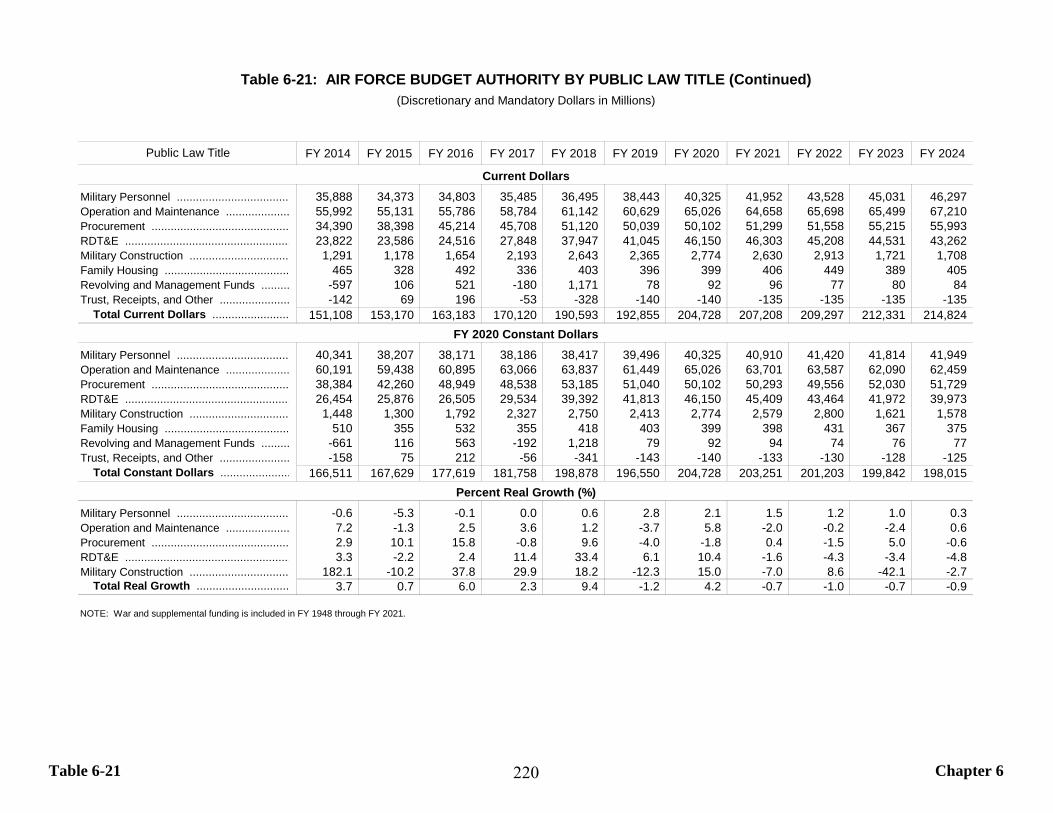
Table 6-21 Chapter 6
FY 2014 FY 2015 FY 2016 FY 2017 FY 2018 FY 2019 FY 2020 FY 2021 FY 2022 FY 2023 FY 2024
Military Personnel ................................... 35,888 34,373 34,803 35,485 36,495 38,443 40,325 41,952 43,528 45,031 46,297 Operation and Maintenance .................... 55,992 55,131 55,786 58,784 61,142 60,629 65,026 64,658 65,698 65,499 67,210 Procurement ........................................... 34,390 38,398 45,214 45,708 51,120 50,039 50,102 51,299 51,558 55,215 55,993 RDT&E .................................................... 23,822 23,586 24,516 27,848 37,947 41,045 46,150 46,303 45,208 44,531 43,262 Military Construction ............................... 1,291 1,178 1,654 2,193 2,643 2,365 2,774 2,630 2,913 1,721 1,708 Family Housing ....................................... 465 328 492 336 403 396 399 406 449 389 405 Revolving and Management Funds ......... -597 106 521 -180 1,171 78 92 96 77 80 84 Trust, Receipts, and Other ...................... -142 69 196 -53 -328 -140 -140 -135 -135 -135 -135
Total Current Dollars ........................ 151,108 153,170 163,183 170,120 190,593 192,855 204,728 207,208 209,297 212,331 214,824
Military Personnel ................................... 40,341 38,207 38,171 38,186 38,417 39,496 40,325 40,910 41,420 41,814 41,949 Operation and Maintenance .................... 60,191 59,438 60,895 63,066 63,837 61,449 65,026 63,701 63,587 62,090 62,459 Procurement ........................................... 38,384 42,260 48,949 48,538 53,185 51,040 50,102 50,293 49,556 52,030 51,729 RDT&E .................................................... 26,454 25,876 26,505 29,534 39,392 41,813 46,150 45,409 43,464 41,972 39,973 Military Construction ............................... 1,448 1,300 1,792 2,327 2,750 2,413 2,774 2,579 2,800 1,621 1,578 Family Housing ....................................... 510 355 532 355 418 403 399 398 431 367 375 Revolving and Management Funds ......... -661 116 563 -192 1,218 79 92 94 74 76 77 Trust, Receipts, and Other ...................... -158 75 212 -56 -341 -143 -140 -133 -130 -128 -125
Total Constant Dollars ...................... 166,511 167,629 177,619 181,758 198,878 196,550 204,728 203,251 201,203 199,842 198,015
Military Personnel ................................... -0.6 -5.3 -0.1 0.0 0.6 2.8 2.1 1.5 1.2 1.0 0.3 Operation and Maintenance .................... 7.2 -1.3 2.5 3.6 1.2 -3.7 5.8 -2.0 -0.2 -2.4 0.6 Procurement ........................................... 2.9 10.1 15.8 -0.8 9.6 -4.0 -1.8 0.4 -1.5 5.0 -0.6 RDT&E .................................................... 3.3 -2.2 2.4 11.4 33.4 6.1 10.4 -1.6 -4.3 -3.4 -4.8 Military Construction ............................... 182.1 -10.2 37.8 29.9 18.2 -12.3 15.0 -7.0 8.6 -42.1 -2.7
Total Real Growth ............................. 3.7 0.7 6.0 2.3 9.4 -1.2 4.2 -0.7 -1.0 -0.7 -0.9
NOTE: War and supplemental funding is included in FY 1948 through FY 2021.
Percent Real Growth (%)
Table 6-21: AIR FORCE BUDGET AUTHORITY BY PUBLIC LAW TITLE (Continued)(Discretionary and Mandatory Dollars in Millions)
Public Law Title
Current Dollars
FY 2020 Constant Dollars
220
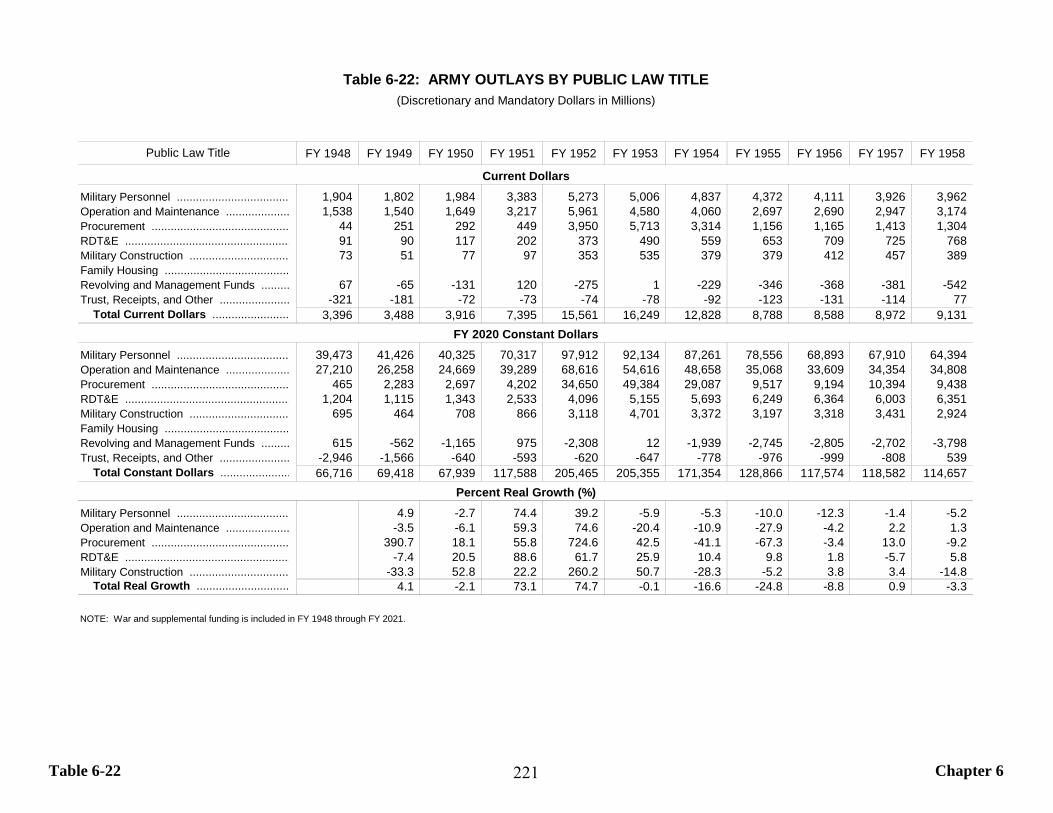
Table 6-22 Chapter 6
FY 1948 FY 1949 FY 1950 FY 1951 FY 1952 FY 1953 FY 1954 FY 1955 FY 1956 FY 1957 FY 1958
Military Personnel ................................... 1,904 1,802 1,984 3,383 5,273 5,006 4,837 4,372 4,111 3,926 3,962 Operation and Maintenance .................... 1,538 1,540 1,649 3,217 5,961 4,580 4,060 2,697 2,690 2,947 3,174 Procurement ........................................... 44 251 292 449 3,950 5,713 3,314 1,156 1,165 1,413 1,304 RDT&E .................................................... 91 90 117 202 373 490 559 653 709 725 768 Military Construction ............................... 73 51 77 97 353 535 379 379 412 457 389 Family Housing ....................................... Revolving and Management Funds ......... 67 -65 -131 120 -275 1 -229 -346 -368 -381 -542 Trust, Receipts, and Other ...................... -321 -181 -72 -73 -74 -78 -92 -123 -131 -114 77
Total Current Dollars ........................ 3,396 3,488 3,916 7,395 15,561 16,249 12,828 8,788 8,588 8,972 9,131
Military Personnel ................................... 39,473 41,426 40,325 70,317 97,912 92,134 87,261 78,556 68,893 67,910 64,394 Operation and Maintenance .................... 27,210 26,258 24,669 39,289 68,616 54,616 48,658 35,068 33,609 34,354 34,808 Procurement ........................................... 465 2,283 2,697 4,202 34,650 49,384 29,087 9,517 9,194 10,394 9,438 RDT&E .................................................... 1,204 1,115 1,343 2,533 4,096 5,155 5,693 6,249 6,364 6,003 6,351 Military Construction ............................... 695 464 708 866 3,118 4,701 3,372 3,197 3,318 3,431 2,924 Family Housing ....................................... Revolving and Management Funds ......... 615 -562 -1,165 975 -2,308 12 -1,939 -2,745 -2,805 -2,702 -3,798 Trust, Receipts, and Other ...................... -2,946 -1,566 -640 -593 -620 -647 -778 -976 -999 -808 539
Total Constant Dollars ...................... 66,716 69,418 67,939 117,588 205,465 205,355 171,354 128,866 117,574 118,582 114,657
Military Personnel ................................... 4.9 -2.7 74.4 39.2 -5.9 -5.3 -10.0 -12.3 -1.4 -5.2 Operation and Maintenance .................... -3.5 -6.1 59.3 74.6 -20.4 -10.9 -27.9 -4.2 2.2 1.3 Procurement ........................................... 390.7 18.1 55.8 724.6 42.5 -41.1 -67.3 -3.4 13.0 -9.2 RDT&E .................................................... -7.4 20.5 88.6 61.7 25.9 10.4 9.8 1.8 -5.7 5.8 Military Construction ............................... -33.3 52.8 22.2 260.2 50.7 -28.3 -5.2 3.8 3.4 -14.8
Total Real Growth ............................. 4.1 -2.1 73.1 74.7 -0.1 -16.6 -24.8 -8.8 0.9 -3.3
NOTE: War and supplemental funding is included in FY 1948 through FY 2021.
Percent Real Growth (%)
Table 6-22: ARMY OUTLAYS BY PUBLIC LAW TITLE(Discretionary and Mandatory Dollars in Millions)
Public Law Title
Current Dollars
FY 2020 Constant Dollars
221
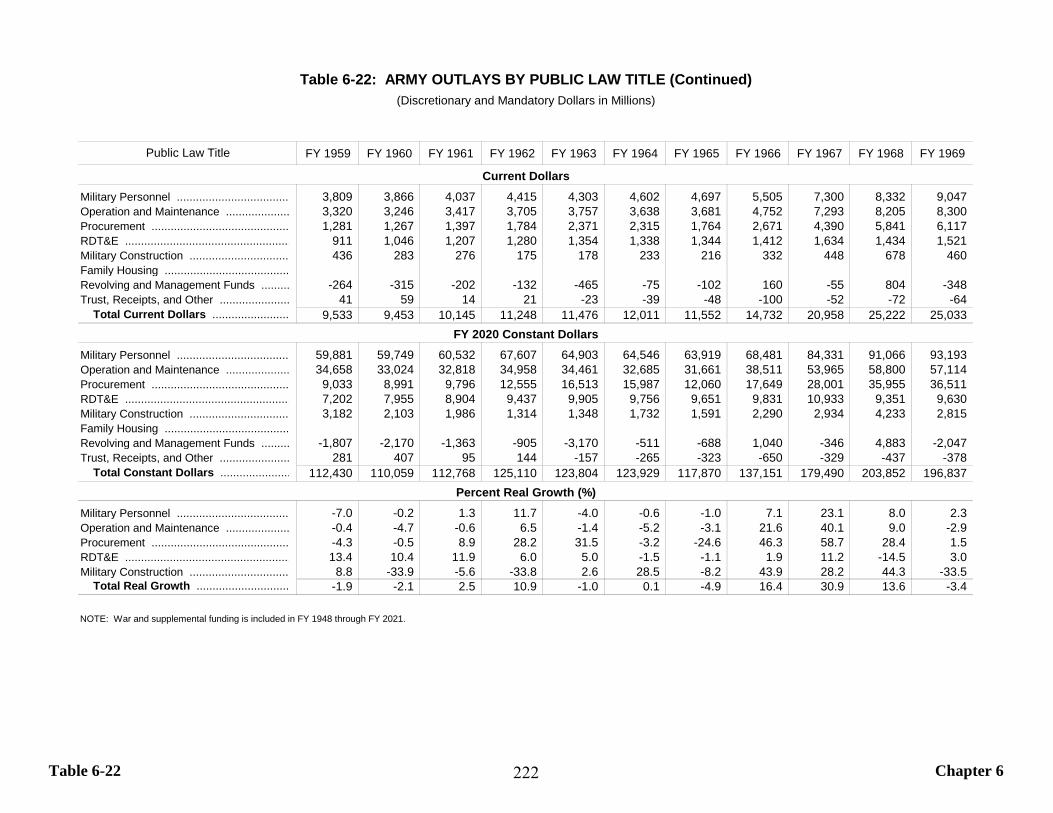
Table 6-22 Chapter 6
FY 1959 FY 1960 FY 1961 FY 1962 FY 1963 FY 1964 FY 1965 FY 1966 FY 1967 FY 1968 FY 1969
Military Personnel ................................... 3,809 3,866 4,037 4,415 4,303 4,602 4,697 5,505 7,300 8,332 9,047 Operation and Maintenance .................... 3,320 3,246 3,417 3,705 3,757 3,638 3,681 4,752 7,293 8,205 8,300 Procurement ........................................... 1,281 1,267 1,397 1,784 2,371 2,315 1,764 2,671 4,390 5,841 6,117 RDT&E .................................................... 911 1,046 1,207 1,280 1,354 1,338 1,344 1,412 1,634 1,434 1,521 Military Construction ............................... 436 283 276 175 178 233 216 332 448 678 460 Family Housing ....................................... Revolving and Management Funds ......... -264 -315 -202 -132 -465 -75 -102 160 -55 804 -348 Trust, Receipts, and Other ...................... 41 59 14 21 -23 -39 -48 -100 -52 -72 -64
Total Current Dollars ........................ 9,533 9,453 10,145 11,248 11,476 12,011 11,552 14,732 20,958 25,222 25,033
Military Personnel ................................... 59,881 59,749 60,532 67,607 64,903 64,546 63,919 68,481 84,331 91,066 93,193 Operation and Maintenance .................... 34,658 33,024 32,818 34,958 34,461 32,685 31,661 38,511 53,965 58,800 57,114 Procurement ........................................... 9,033 8,991 9,796 12,555 16,513 15,987 12,060 17,649 28,001 35,955 36,511 RDT&E .................................................... 7,202 7,955 8,904 9,437 9,905 9,756 9,651 9,831 10,933 9,351 9,630 Military Construction ............................... 3,182 2,103 1,986 1,314 1,348 1,732 1,591 2,290 2,934 4,233 2,815 Family Housing ....................................... Revolving and Management Funds ......... -1,807 -2,170 -1,363 -905 -3,170 -511 -688 1,040 -346 4,883 -2,047 Trust, Receipts, and Other ...................... 281 407 95 144 -157 -265 -323 -650 -329 -437 -378
Total Constant Dollars ...................... 112,430 110,059 112,768 125,110 123,804 123,929 117,870 137,151 179,490 203,852 196,837
Military Personnel ................................... -7.0 -0.2 1.3 11.7 -4.0 -0.6 -1.0 7.1 23.1 8.0 2.3 Operation and Maintenance .................... -0.4 -4.7 -0.6 6.5 -1.4 -5.2 -3.1 21.6 40.1 9.0 -2.9 Procurement ........................................... -4.3 -0.5 8.9 28.2 31.5 -3.2 -24.6 46.3 58.7 28.4 1.5 RDT&E .................................................... 13.4 10.4 11.9 6.0 5.0 -1.5 -1.1 1.9 11.2 -14.5 3.0 Military Construction ............................... 8.8 -33.9 -5.6 -33.8 2.6 28.5 -8.2 43.9 28.2 44.3 -33.5
Total Real Growth ............................. -1.9 -2.1 2.5 10.9 -1.0 0.1 -4.9 16.4 30.9 13.6 -3.4
NOTE: War and supplemental funding is included in FY 1948 through FY 2021.
Percent Real Growth (%)
Table 6-22: ARMY OUTLAYS BY PUBLIC LAW TITLE (Continued)(Discretionary and Mandatory Dollars in Millions)
Public Law Title
Current Dollars
FY 2020 Constant Dollars
222
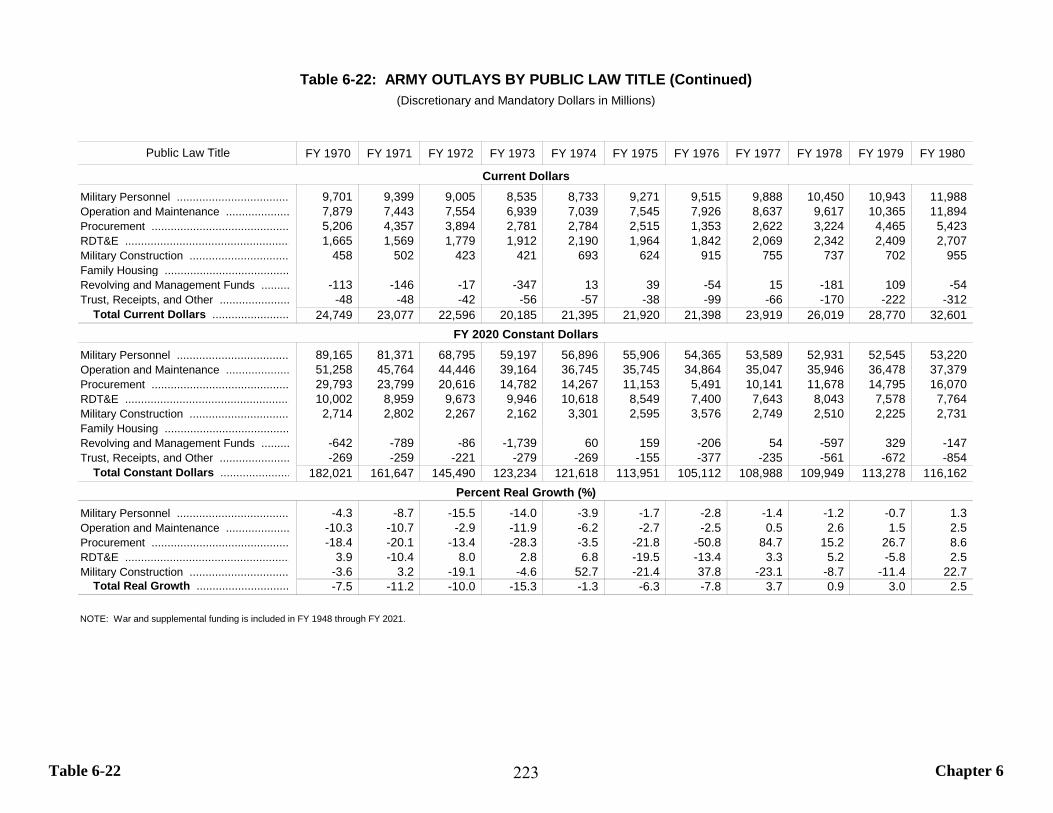
Table 6-22 Chapter 6
FY 1970 FY 1971 FY 1972 FY 1973 FY 1974 FY 1975 FY 1976 FY 1977 FY 1978 FY 1979 FY 1980
Military Personnel ................................... 9,701 9,399 9,005 8,535 8,733 9,271 9,515 9,888 10,450 10,943 11,988 Operation and Maintenance .................... 7,879 7,443 7,554 6,939 7,039 7,545 7,926 8,637 9,617 10,365 11,894 Procurement ........................................... 5,206 4,357 3,894 2,781 2,784 2,515 1,353 2,622 3,224 4,465 5,423 RDT&E .................................................... 1,665 1,569 1,779 1,912 2,190 1,964 1,842 2,069 2,342 2,409 2,707 Military Construction ............................... 458 502 423 421 693 624 915 755 737 702 955 Family Housing ....................................... Revolving and Management Funds ......... -113 -146 -17 -347 13 39 -54 15 -181 109 -54 Trust, Receipts, and Other ...................... -48 -48 -42 -56 -57 -38 -99 -66 -170 -222 -312
Total Current Dollars ........................ 24,749 23,077 22,596 20,185 21,395 21,920 21,398 23,919 26,019 28,770 32,601
Military Personnel ................................... 89,165 81,371 68,795 59,197 56,896 55,906 54,365 53,589 52,931 52,545 53,220 Operation and Maintenance .................... 51,258 45,764 44,446 39,164 36,745 35,745 34,864 35,047 35,946 36,478 37,379 Procurement ........................................... 29,793 23,799 20,616 14,782 14,267 11,153 5,491 10,141 11,678 14,795 16,070 RDT&E .................................................... 10,002 8,959 9,673 9,946 10,618 8,549 7,400 7,643 8,043 7,578 7,764 Military Construction ............................... 2,714 2,802 2,267 2,162 3,301 2,595 3,576 2,749 2,510 2,225 2,731 Family Housing ....................................... Revolving and Management Funds ......... -642 -789 -86 -1,739 60 159 -206 54 -597 329 -147 Trust, Receipts, and Other ...................... -269 -259 -221 -279 -269 -155 -377 -235 -561 -672 -854
Total Constant Dollars ...................... 182,021 161,647 145,490 123,234 121,618 113,951 105,112 108,988 109,949 113,278 116,162
Military Personnel ................................... -4.3 -8.7 -15.5 -14.0 -3.9 -1.7 -2.8 -1.4 -1.2 -0.7 1.3 Operation and Maintenance .................... -10.3 -10.7 -2.9 -11.9 -6.2 -2.7 -2.5 0.5 2.6 1.5 2.5 Procurement ........................................... -18.4 -20.1 -13.4 -28.3 -3.5 -21.8 -50.8 84.7 15.2 26.7 8.6 RDT&E .................................................... 3.9 -10.4 8.0 2.8 6.8 -19.5 -13.4 3.3 5.2 -5.8 2.5 Military Construction ............................... -3.6 3.2 -19.1 -4.6 52.7 -21.4 37.8 -23.1 -8.7 -11.4 22.7
Total Real Growth ............................. -7.5 -11.2 -10.0 -15.3 -1.3 -6.3 -7.8 3.7 0.9 3.0 2.5
NOTE: War and supplemental funding is included in FY 1948 through FY 2021.
Percent Real Growth (%)
Table 6-22: ARMY OUTLAYS BY PUBLIC LAW TITLE (Continued)(Discretionary and Mandatory Dollars in Millions)
Public Law Title
Current Dollars
FY 2020 Constant Dollars
223
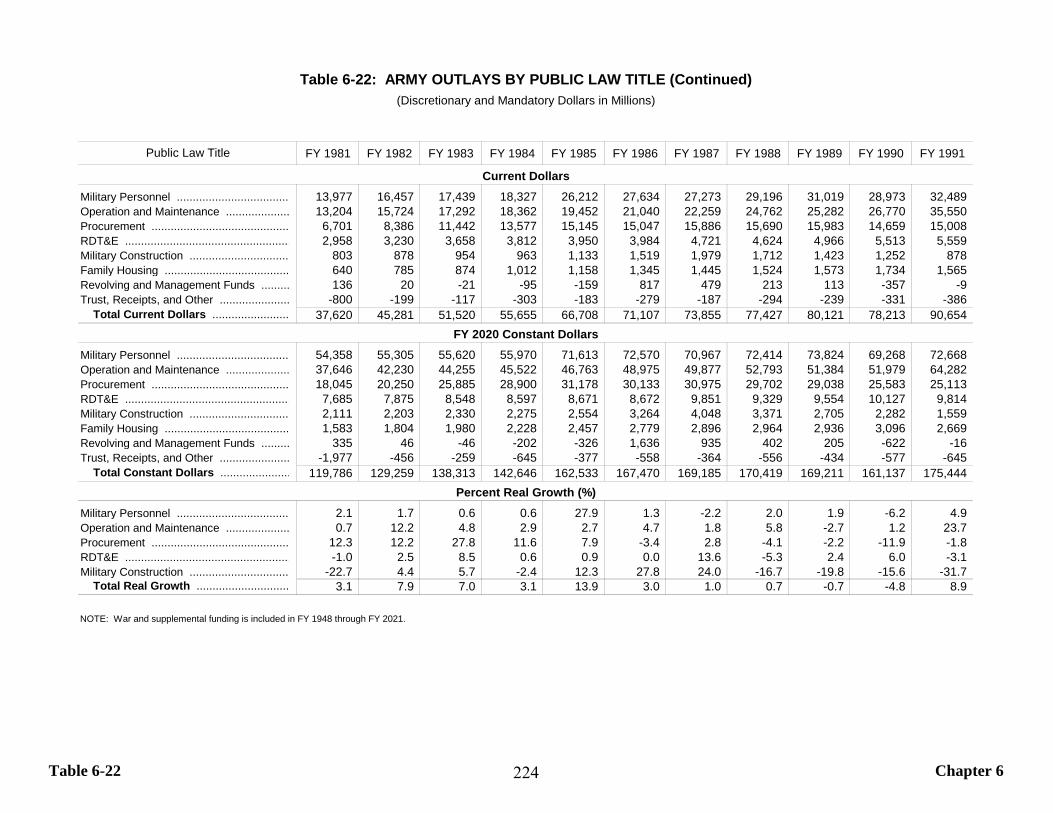
Table 6-22 Chapter 6
FY 1981 FY 1982 FY 1983 FY 1984 FY 1985 FY 1986 FY 1987 FY 1988 FY 1989 FY 1990 FY 1991
Military Personnel ................................... 13,977 16,457 17,439 18,327 26,212 27,634 27,273 29,196 31,019 28,973 32,489 Operation and Maintenance .................... 13,204 15,724 17,292 18,362 19,452 21,040 22,259 24,762 25,282 26,770 35,550 Procurement ........................................... 6,701 8,386 11,442 13,577 15,145 15,047 15,886 15,690 15,983 14,659 15,008 RDT&E .................................................... 2,958 3,230 3,658 3,812 3,950 3,984 4,721 4,624 4,966 5,513 5,559 Military Construction ............................... 803 878 954 963 1,133 1,519 1,979 1,712 1,423 1,252 878 Family Housing ....................................... 640 785 874 1,012 1,158 1,345 1,445 1,524 1,573 1,734 1,565 Revolving and Management Funds ......... 136 20 -21 -95 -159 817 479 213 113 -357 -9 Trust, Receipts, and Other ...................... -800 -199 -117 -303 -183 -279 -187 -294 -239 -331 -386
Total Current Dollars ........................ 37,620 45,281 51,520 55,655 66,708 71,107 73,855 77,427 80,121 78,213 90,654
Military Personnel ................................... 54,358 55,305 55,620 55,970 71,613 72,570 70,967 72,414 73,824 69,268 72,668 Operation and Maintenance .................... 37,646 42,230 44,255 45,522 46,763 48,975 49,877 52,793 51,384 51,979 64,282 Procurement ........................................... 18,045 20,250 25,885 28,900 31,178 30,133 30,975 29,702 29,038 25,583 25,113 RDT&E .................................................... 7,685 7,875 8,548 8,597 8,671 8,672 9,851 9,329 9,554 10,127 9,814 Military Construction ............................... 2,111 2,203 2,330 2,275 2,554 3,264 4,048 3,371 2,705 2,282 1,559 Family Housing ....................................... 1,583 1,804 1,980 2,228 2,457 2,779 2,896 2,964 2,936 3,096 2,669 Revolving and Management Funds ......... 335 46 -46 -202 -326 1,636 935 402 205 -622 -16 Trust, Receipts, and Other ...................... -1,977 -456 -259 -645 -377 -558 -364 -556 -434 -577 -645
Total Constant Dollars ...................... 119,786 129,259 138,313 142,646 162,533 167,470 169,185 170,419 169,211 161,137 175,444
Military Personnel ................................... 2.1 1.7 0.6 0.6 27.9 1.3 -2.2 2.0 1.9 -6.2 4.9 Operation and Maintenance .................... 0.7 12.2 4.8 2.9 2.7 4.7 1.8 5.8 -2.7 1.2 23.7 Procurement ........................................... 12.3 12.2 27.8 11.6 7.9 -3.4 2.8 -4.1 -2.2 -11.9 -1.8 RDT&E .................................................... -1.0 2.5 8.5 0.6 0.9 0.0 13.6 -5.3 2.4 6.0 -3.1 Military Construction ............................... -22.7 4.4 5.7 -2.4 12.3 27.8 24.0 -16.7 -19.8 -15.6 -31.7
Total Real Growth ............................. 3.1 7.9 7.0 3.1 13.9 3.0 1.0 0.7 -0.7 -4.8 8.9
NOTE: War and supplemental funding is included in FY 1948 through FY 2021.
Percent Real Growth (%)
Table 6-22: ARMY OUTLAYS BY PUBLIC LAW TITLE (Continued)(Discretionary and Mandatory Dollars in Millions)
Public Law Title
Current Dollars
FY 2020 Constant Dollars
224

Table 6-22 Chapter 6
FY 1992 FY 1993 FY 1994 FY 1995 FY 1996 FY 1997 FY 1998 FY 1999 FY 2000 FY 2001 FY 2002
Military Personnel ................................... 31,937 28,476 27,991 26,752 24,439 25,799 25,809 26,038 28,706 27,871 32,533 Operation and Maintenance .................... 26,397 23,879 21,024 22,450 22,466 23,067 22,498 23,711 25,719 27,017 29,923 Procurement ........................................... 13,132 11,622 8,495 7,855 7,780 8,678 8,866 9,194 9,204 10,476 11,567 RDT&E .................................................... 5,978 6,218 5,746 5,081 4,925 4,859 4,881 5,027 4,778 5,749 6,569 Military Construction ............................... 832 1,097 958 1,002 1,079 1,340 1,426 1,017 1,032 1,363 1,470 Family Housing ....................................... 1,550 1,354 1,289 1,228 1,312 1,392 1,288 1,255 1,169 1,137 1,157 Revolving and Management Funds ......... -91 195 76 36 96 202 -57 -273 125 385 287 Trust, Receipts, and Other ...................... -233 -257 -230 -324 -416 -478 -125 -195 -117 -144 -182
Total Current Dollars ........................ 79,501 72,584 65,350 64,079 61,682 64,857 64,586 65,773 70,617 73,854 83,324
Military Personnel ................................... 69,709 59,696 56,752 53,296 48,301 48,941 46,842 45,941 47,880 45,450 49,819 Operation and Maintenance .................... 47,896 42,002 36,601 38,150 37,246 37,172 35,386 36,213 38,505 39,088 42,605 Procurement ........................................... 21,334 18,438 13,212 11,990 11,642 12,757 12,942 13,314 13,146 14,683 16,084 RDT&E .................................................... 10,195 10,301 9,425 8,208 7,769 7,524 7,398 7,506 6,980 8,180 9,173 Military Construction ............................... 1,432 1,812 1,568 1,601 1,690 2,025 2,134 1,506 1,498 1,931 2,045 Family Housing ....................................... 2,572 2,201 2,044 1,920 1,998 2,067 1,898 1,831 1,681 1,602 1,614 Revolving and Management Funds ......... -148 309 119 55 144 296 -83 -396 179 540 398 Trust, Receipts, and Other ...................... -379 -407 -358 -495 -622 -703 -183 -283 -167 -202 -252
Total Constant Dollars ...................... 152,612 134,352 119,363 114,726 108,169 110,079 106,333 105,632 109,701 111,273 121,486
Military Personnel ................................... -4.1 -14.4 -4.9 -6.1 -9.4 1.3 -4.3 -1.9 4.2 -5.1 9.6 Operation and Maintenance .................... -25.5 -12.3 -12.9 4.2 -2.4 -0.2 -4.8 2.3 6.3 1.5 9.0 Procurement ........................................... -15.0 -13.6 -28.3 -9.2 -2.9 9.6 1.4 2.9 -1.3 11.7 9.5 RDT&E .................................................... 3.9 1.0 -8.5 -12.9 -5.4 -3.2 -1.7 1.5 -7.0 17.2 12.1 Military Construction ............................... -8.2 26.5 -13.5 2.1 5.6 19.8 5.4 -29.4 -0.5 28.9 5.9
Total Real Growth ............................. -13.0 -12.0 -11.2 -3.9 -5.7 1.8 -3.4 -0.7 3.9 1.4 9.2
NOTE: War and supplemental funding is included in FY 1948 through FY 2021.
Percent Real Growth (%)
Table 6-22: ARMY OUTLAYS BY PUBLIC LAW TITLE (Continued)(Discretionary and Mandatory Dollars in Millions)
Public Law Title
Current Dollars
FY 2020 Constant Dollars
225

Table 6-22 Chapter 6
FY 2003 FY 2004 FY 2005 FY 2006 FY 2007 FY 2008 FY 2009 FY 2010 FY 2011 FY 2012 FY 2013
Military Personnel ................................... 42,675 47,340 54,870 54,036 55,907 61,138 66,024 69,544 71,865 65,321 64,108 Operation and Maintenance .................... 40,907 56,916 66,487 72,968 79,716 93,709 98,942 101,217 106,568 96,124 84,401 Procurement ........................................... 12,527 13,702 17,860 22,356 28,756 40,169 46,945 47,358 40,798 36,562 29,668 RDT&E .................................................... 7,041 8,302 9,702 10,846 11,364 11,285 11,764 10,714 10,079 8,931 8,352 Military Construction ............................... 1,940 2,148 2,108 2,536 3,524 5,662 7,989 9,938 8,847 5,635 4,632 Family Housing ....................................... 1,249 1,292 1,224 1,173 1,155 1,149 717 671 666 617 430 Revolving and Management Funds ......... -1,019 -615 -201 219 -910 -418 256 -689 -738 -419 191 Trust, Receipts, and Other ...................... -73 -47 63 -777 -98 -129 -253 -127 -860 833 -851
Total Current Dollars ........................ 105,248 129,039 152,113 163,357 179,413 212,565 232,384 238,625 237,225 213,604 190,931
Military Personnel ................................... 63,499 68,425 76,308 73,128 73,591 77,875 81,344 83,530 84,845 75,865 73,081 Operation and Maintenance .................... 57,152 77,036 86,607 91,875 97,971 112,375 116,978 117,916 121,992 108,113 93,582 Procurement ........................................... 17,246 18,494 23,448 28,469 35,656 48,641 56,006 56,050 47,339 41,672 33,315 RDT&E .................................................... 9,679 11,136 12,617 13,673 13,984 13,493 13,792 12,561 11,474 10,021 9,262 Military Construction ............................... 2,657 2,874 2,738 3,194 4,343 6,813 9,465 11,749 10,194 6,370 5,167 Family Housing ....................................... 1,725 1,747 1,604 1,490 1,429 1,386 850 787 768 702 481 Revolving and Management Funds ......... -1,403 -830 -264 280 -1,128 -506 306 -815 -856 -479 215 Trust, Receipts, and Other ...................... -101 -63 83 -989 -122 -156 -302 -151 -998 950 -956
Total Constant Dollars ...................... 150,452 178,819 203,141 211,119 225,726 259,921 278,439 281,628 274,758 243,213 214,146
Military Personnel ................................... 27.5 7.8 11.5 -4.2 0.6 5.8 4.5 2.7 1.6 -10.6 -3.7 Operation and Maintenance .................... 34.1 34.8 12.4 6.1 6.6 14.7 4.1 0.8 3.5 -11.4 -13.4 Procurement ........................................... 7.2 7.2 26.8 21.4 25.2 36.4 15.1 0.1 -15.5 -12.0 -20.1 RDT&E .................................................... 5.5 15.1 13.3 8.4 2.3 -3.5 2.2 -8.9 -8.7 -12.7 -7.6 Military Construction ............................... 29.9 8.2 -4.7 16.6 36.0 56.9 38.9 24.1 -13.2 -37.5 -18.9
Total Real Growth ............................. 23.8 18.9 13.6 3.9 6.9 15.1 7.1 1.1 -2.4 -11.5 -12.0
NOTE: War and supplemental funding is included in FY 1948 through FY 2021.
Percent Real Growth (%)
Table 6-22: ARMY OUTLAYS BY PUBLIC LAW TITLE (Continued)(Discretionary and Mandatory Dollars in Millions)
Public Law Title
Current Dollars
FY 2020 Constant Dollars
226
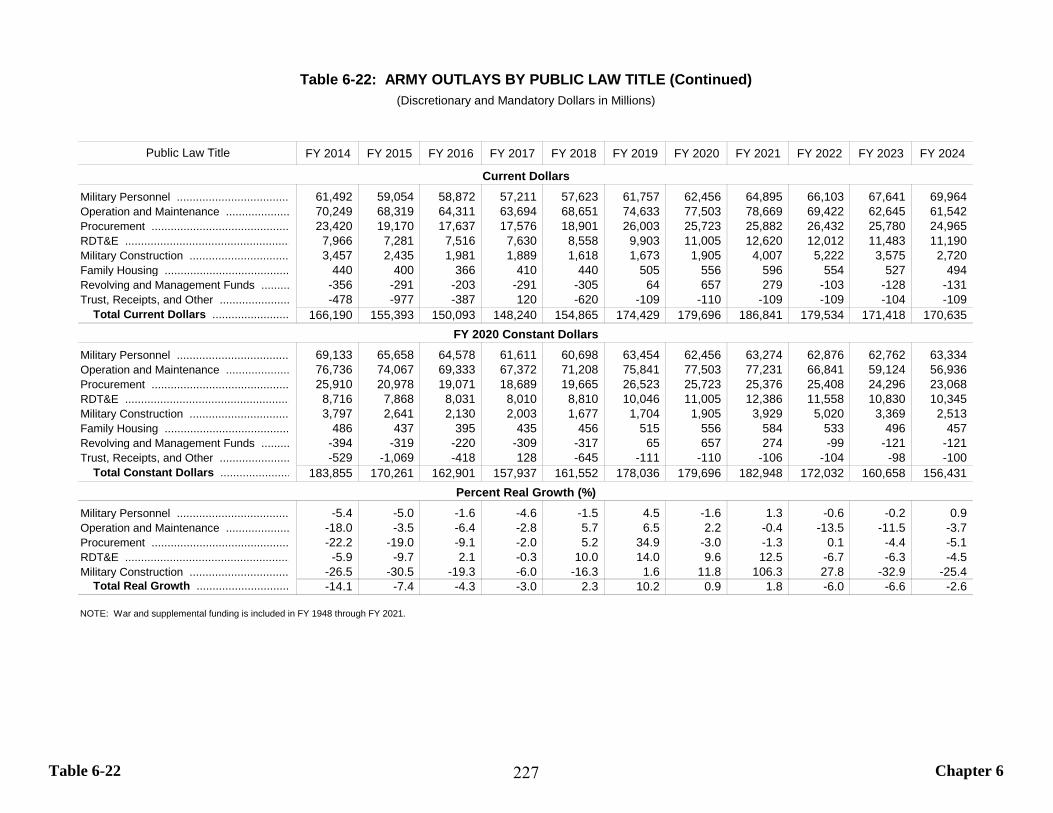
Table 6-22 Chapter 6
FY 2014 FY 2015 FY 2016 FY 2017 FY 2018 FY 2019 FY 2020 FY 2021 FY 2022 FY 2023 FY 2024
Military Personnel ................................... 61,492 59,054 58,872 57,211 57,623 61,757 62,456 64,895 66,103 67,641 69,964 Operation and Maintenance .................... 70,249 68,319 64,311 63,694 68,651 74,633 77,503 78,669 69,422 62,645 61,542 Procurement ........................................... 23,420 19,170 17,637 17,576 18,901 26,003 25,723 25,882 26,432 25,780 24,965 RDT&E .................................................... 7,966 7,281 7,516 7,630 8,558 9,903 11,005 12,620 12,012 11,483 11,190 Military Construction ............................... 3,457 2,435 1,981 1,889 1,618 1,673 1,905 4,007 5,222 3,575 2,720 Family Housing ....................................... 440 400 366 410 440 505 556 596 554 527 494 Revolving and Management Funds ......... -356 -291 -203 -291 -305 64 657 279 -103 -128 -131 Trust, Receipts, and Other ...................... -478 -977 -387 120 -620 -109 -110 -109 -109 -104 -109
Total Current Dollars ........................ 166,190 155,393 150,093 148,240 154,865 174,429 179,696 186,841 179,534 171,418 170,635
Military Personnel ................................... 69,133 65,658 64,578 61,611 60,698 63,454 62,456 63,274 62,876 62,762 63,334 Operation and Maintenance .................... 76,736 74,067 69,333 67,372 71,208 75,841 77,503 77,231 66,841 59,124 56,936 Procurement ........................................... 25,910 20,978 19,071 18,689 19,665 26,523 25,723 25,376 25,408 24,296 23,068 RDT&E .................................................... 8,716 7,868 8,031 8,010 8,810 10,046 11,005 12,386 11,558 10,830 10,345 Military Construction ............................... 3,797 2,641 2,130 2,003 1,677 1,704 1,905 3,929 5,020 3,369 2,513 Family Housing ....................................... 486 437 395 435 456 515 556 584 533 496 457 Revolving and Management Funds ......... -394 -319 -220 -309 -317 65 657 274 -99 -121 -121 Trust, Receipts, and Other ...................... -529 -1,069 -418 128 -645 -111 -110 -106 -104 -98 -100
Total Constant Dollars ...................... 183,855 170,261 162,901 157,937 161,552 178,036 179,696 182,948 172,032 160,658 156,431
Military Personnel ................................... -5.4 -5.0 -1.6 -4.6 -1.5 4.5 -1.6 1.3 -0.6 -0.2 0.9 Operation and Maintenance .................... -18.0 -3.5 -6.4 -2.8 5.7 6.5 2.2 -0.4 -13.5 -11.5 -3.7 Procurement ........................................... -22.2 -19.0 -9.1 -2.0 5.2 34.9 -3.0 -1.3 0.1 -4.4 -5.1 RDT&E .................................................... -5.9 -9.7 2.1 -0.3 10.0 14.0 9.6 12.5 -6.7 -6.3 -4.5 Military Construction ............................... -26.5 -30.5 -19.3 -6.0 -16.3 1.6 11.8 106.3 27.8 -32.9 -25.4
Total Real Growth ............................. -14.1 -7.4 -4.3 -3.0 2.3 10.2 0.9 1.8 -6.0 -6.6 -2.6
NOTE: War and supplemental funding is included in FY 1948 through FY 2021.
Percent Real Growth (%)
Table 6-22: ARMY OUTLAYS BY PUBLIC LAW TITLE (Continued)(Discretionary and Mandatory Dollars in Millions)
Public Law Title
Current Dollars
FY 2020 Constant Dollars
227

Table 6-23 Chapter 6
FY 1948 FY 1949 FY 1950 FY 1951 FY 1952 FY 1953 FY 1954 FY 1955 FY 1956 FY 1957 FY 1958
Military Personnel ................................... 1,509 1,478 1,583 2,112 3,086 3,385 3,210 3,066 3,156 3,184 3,189 Operation and Maintenance .................... 1,414 1,585 1,415 2,082 3,091 2,915 2,577 2,520 2,316 2,628 2,602 Procurement ........................................... 1,042 1,020 878 1,246 2,654 4,253 4,699 3,489 3,559 3,590 4,048 RDT&E .................................................... 168 234 332 488 517 521 583 667 747 827 Military Construction ............................... 76 74 85 124 380 489 363 235 279 374 391 Family Housing ....................................... Revolving and Management Funds ......... -85 -314 462 112 -69 -76 -206 -90 -125 Trust, Receipts, and Other ...................... -364 -205 -75 -54 -49 -56 -93 -123 -131 -114 76
Total Current Dollars ........................ 3,845 3,952 4,035 5,528 10,112 11,616 11,208 9,694 9,641 10,318 11,009
Military Personnel ................................... 33,003 32,366 32,380 41,971 59,737 60,996 58,554 54,359 53,337 54,441 51,574 Operation and Maintenance .................... 24,231 25,095 22,312 31,531 41,367 40,788 36,625 34,446 31,377 32,918 31,139 Procurement ........................................... 12,134 11,250 10,162 13,777 28,674 44,736 49,595 35,988 34,767 32,436 36,082 RDT&E .................................................... 2,071 2,585 3,589 5,060 5,306 5,412 5,669 6,083 6,306 6,818 Military Construction ............................... 722 663 774 1,107 3,301 4,189 3,172 1,956 2,206 2,729 2,827 Family Housing ....................................... Revolving and Management Funds ......... -755 -2,552 3,883 930 -585 -600 -1,568 -638 -873 Trust, Receipts, and Other ...................... -3,340 -1,773 -667 -439 -409 -465 -787 -976 -999 -808 532
Total Constant Dollars ...................... 68,820 67,600 66,791 88,984 141,613 156,479 151,986 130,842 125,203 127,385 128,099
Military Personnel ................................... -1.9 0.0 29.6 42.3 2.1 -4.0 -7.2 -1.9 2.1 -5.3 Operation and Maintenance .................... 3.6 -11.1 41.3 31.2 -1.4 -10.2 -5.9 -8.9 4.9 -5.4 Procurement ........................................... -7.3 -9.7 35.6 108.1 56.0 10.9 -27.4 -3.4 -6.7 11.2 RDT&E .................................................... 0.0 0.0 38.8 41.0 4.9 2.0 4.8 7.3 3.7 8.1 Military Construction ............................... -8.2 16.8 43.1 198.2 26.9 -24.3 -38.3 12.8 23.7 3.6
Total Real Growth ............................. -1.8 -1.2 33.2 59.1 10.5 -2.9 -13.9 -4.3 1.7 0.6
NOTE: War and supplemental funding is included in FY 1948 through FY 2021.
Percent Real Growth (%)
Table 6-23: NAVY OUTLAYS BY PUBLIC LAW TITLE(Discretionary and Mandatory Dollars in Millions)
Public Law Title
Current Dollars
FY 2020 Constant Dollars
228
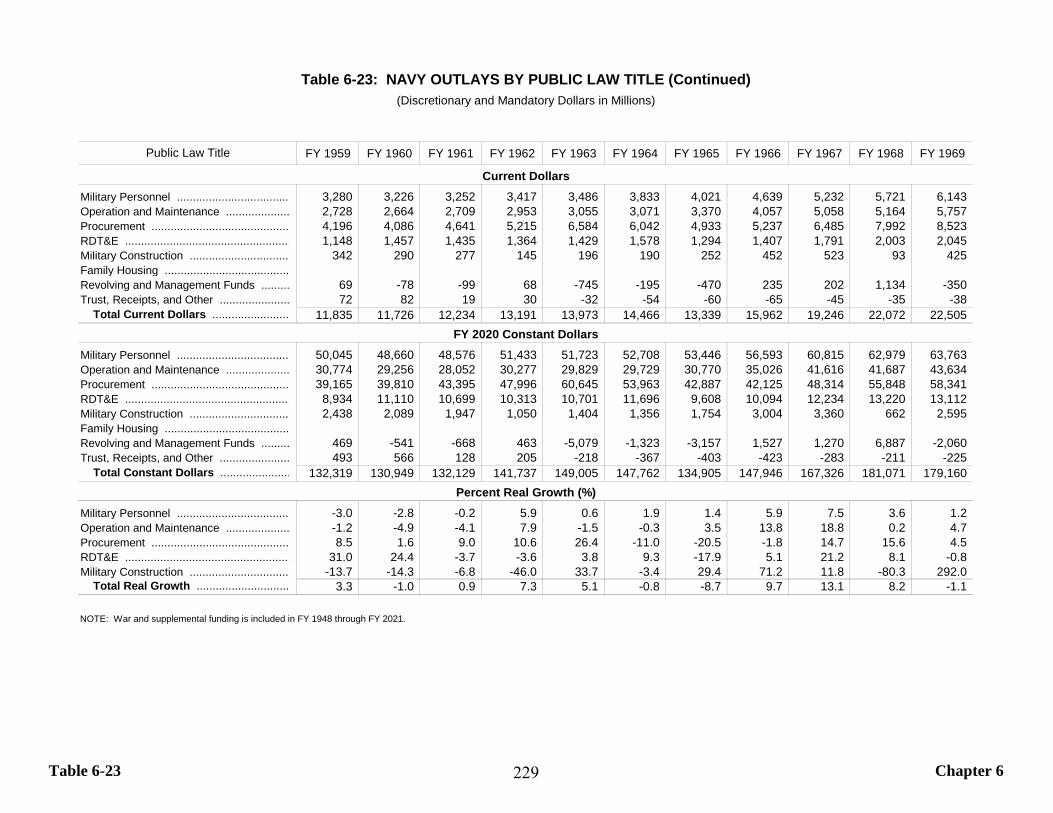
Table 6-23 Chapter 6
FY 1959 FY 1960 FY 1961 FY 1962 FY 1963 FY 1964 FY 1965 FY 1966 FY 1967 FY 1968 FY 1969
Military Personnel ................................... 3,280 3,226 3,252 3,417 3,486 3,833 4,021 4,639 5,232 5,721 6,143 Operation and Maintenance .................... 2,728 2,664 2,709 2,953 3,055 3,071 3,370 4,057 5,058 5,164 5,757 Procurement ........................................... 4,196 4,086 4,641 5,215 6,584 6,042 4,933 5,237 6,485 7,992 8,523 RDT&E .................................................... 1,148 1,457 1,435 1,364 1,429 1,578 1,294 1,407 1,791 2,003 2,045 Military Construction ............................... 342 290 277 145 196 190 252 452 523 93 425 Family Housing ....................................... Revolving and Management Funds ......... 69 -78 -99 68 -745 -195 -470 235 202 1,134 -350 Trust, Receipts, and Other ...................... 72 82 19 30 -32 -54 -60 -65 -45 -35 -38
Total Current Dollars ........................ 11,835 11,726 12,234 13,191 13,973 14,466 13,339 15,962 19,246 22,072 22,505
Military Personnel ................................... 50,045 48,660 48,576 51,433 51,723 52,708 53,446 56,593 60,815 62,979 63,763 Operation and Maintenance .................... 30,774 29,256 28,052 30,277 29,829 29,729 30,770 35,026 41,616 41,687 43,634 Procurement ........................................... 39,165 39,810 43,395 47,996 60,645 53,963 42,887 42,125 48,314 55,848 58,341 RDT&E .................................................... 8,934 11,110 10,699 10,313 10,701 11,696 9,608 10,094 12,234 13,220 13,112 Military Construction ............................... 2,438 2,089 1,947 1,050 1,404 1,356 1,754 3,004 3,360 662 2,595 Family Housing ....................................... Revolving and Management Funds ......... 469 -541 -668 463 -5,079 -1,323 -3,157 1,527 1,270 6,887 -2,060 Trust, Receipts, and Other ...................... 493 566 128 205 -218 -367 -403 -423 -283 -211 -225
Total Constant Dollars ...................... 132,319 130,949 132,129 141,737 149,005 147,762 134,905 147,946 167,326 181,071 179,160
Military Personnel ................................... -3.0 -2.8 -0.2 5.9 0.6 1.9 1.4 5.9 7.5 3.6 1.2 Operation and Maintenance .................... -1.2 -4.9 -4.1 7.9 -1.5 -0.3 3.5 13.8 18.8 0.2 4.7 Procurement ........................................... 8.5 1.6 9.0 10.6 26.4 -11.0 -20.5 -1.8 14.7 15.6 4.5 RDT&E .................................................... 31.0 24.4 -3.7 -3.6 3.8 9.3 -17.9 5.1 21.2 8.1 -0.8 Military Construction ............................... -13.7 -14.3 -6.8 -46.0 33.7 -3.4 29.4 71.2 11.8 -80.3 292.0
Total Real Growth ............................. 3.3 -1.0 0.9 7.3 5.1 -0.8 -8.7 9.7 13.1 8.2 -1.1
NOTE: War and supplemental funding is included in FY 1948 through FY 2021.
Percent Real Growth (%)
Table 6-23: NAVY OUTLAYS BY PUBLIC LAW TITLE (Continued)(Discretionary and Mandatory Dollars in Millions)
Public Law Title
Current Dollars
FY 2020 Constant Dollars
229
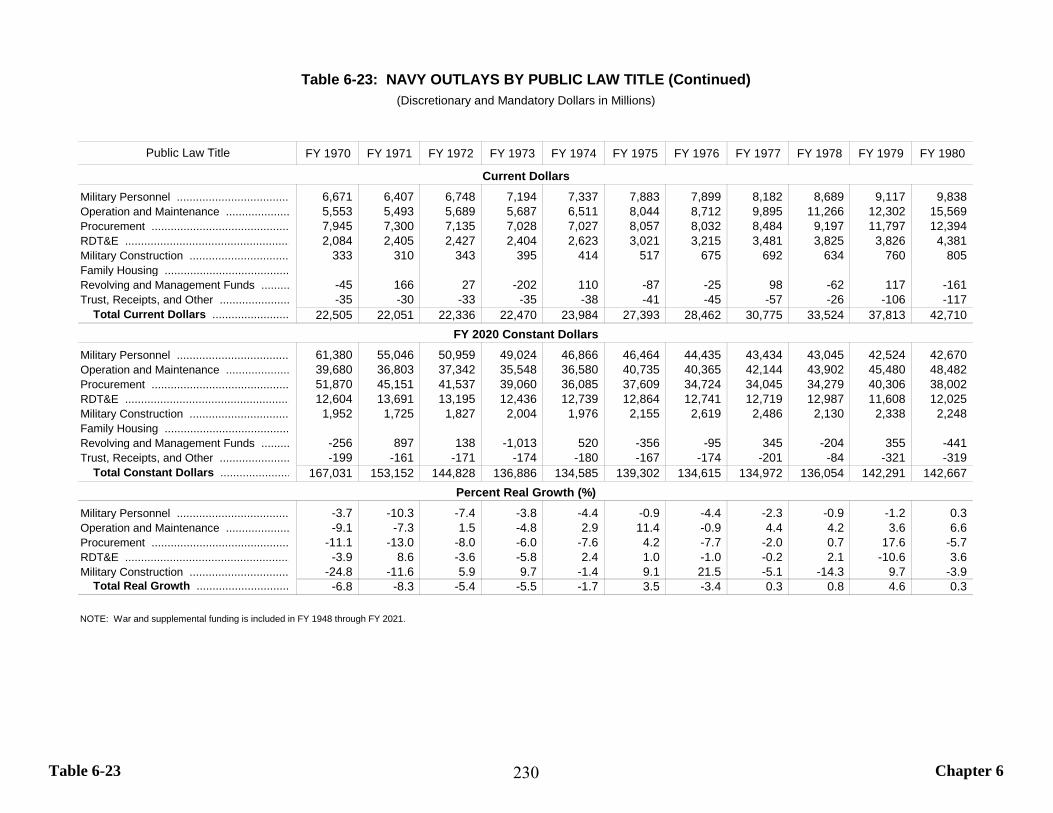
Table 6-23 Chapter 6
FY 1970 FY 1971 FY 1972 FY 1973 FY 1974 FY 1975 FY 1976 FY 1977 FY 1978 FY 1979 FY 1980
Military Personnel ................................... 6,671 6,407 6,748 7,194 7,337 7,883 7,899 8,182 8,689 9,117 9,838 Operation and Maintenance .................... 5,553 5,493 5,689 5,687 6,511 8,044 8,712 9,895 11,266 12,302 15,569 Procurement ........................................... 7,945 7,300 7,135 7,028 7,027 8,057 8,032 8,484 9,197 11,797 12,394 RDT&E .................................................... 2,084 2,405 2,427 2,404 2,623 3,021 3,215 3,481 3,825 3,826 4,381 Military Construction ............................... 333 310 343 395 414 517 675 692 634 760 805 Family Housing ....................................... Revolving and Management Funds ......... -45 166 27 -202 110 -87 -25 98 -62 117 -161 Trust, Receipts, and Other ...................... -35 -30 -33 -35 -38 -41 -45 -57 -26 -106 -117
Total Current Dollars ........................ 22,505 22,051 22,336 22,470 23,984 27,393 28,462 30,775 33,524 37,813 42,710
Military Personnel ................................... 61,380 55,046 50,959 49,024 46,866 46,464 44,435 43,434 43,045 42,524 42,670 Operation and Maintenance .................... 39,680 36,803 37,342 35,548 36,580 40,735 40,365 42,144 43,902 45,480 48,482 Procurement ........................................... 51,870 45,151 41,537 39,060 36,085 37,609 34,724 34,045 34,279 40,306 38,002 RDT&E .................................................... 12,604 13,691 13,195 12,436 12,739 12,864 12,741 12,719 12,987 11,608 12,025 Military Construction ............................... 1,952 1,725 1,827 2,004 1,976 2,155 2,619 2,486 2,130 2,338 2,248 Family Housing ....................................... Revolving and Management Funds ......... -256 897 138 -1,013 520 -356 -95 345 -204 355 -441 Trust, Receipts, and Other ...................... -199 -161 -171 -174 -180 -167 -174 -201 -84 -321 -319
Total Constant Dollars ...................... 167,031 153,152 144,828 136,886 134,585 139,302 134,615 134,972 136,054 142,291 142,667
Military Personnel ................................... -3.7 -10.3 -7.4 -3.8 -4.4 -0.9 -4.4 -2.3 -0.9 -1.2 0.3 Operation and Maintenance .................... -9.1 -7.3 1.5 -4.8 2.9 11.4 -0.9 4.4 4.2 3.6 6.6 Procurement ........................................... -11.1 -13.0 -8.0 -6.0 -7.6 4.2 -7.7 -2.0 0.7 17.6 -5.7 RDT&E .................................................... -3.9 8.6 -3.6 -5.8 2.4 1.0 -1.0 -0.2 2.1 -10.6 3.6 Military Construction ............................... -24.8 -11.6 5.9 9.7 -1.4 9.1 21.5 -5.1 -14.3 9.7 -3.9
Total Real Growth ............................. -6.8 -8.3 -5.4 -5.5 -1.7 3.5 -3.4 0.3 0.8 4.6 0.3
NOTE: War and supplemental funding is included in FY 1948 through FY 2021.
Percent Real Growth (%)
Table 6-23: NAVY OUTLAYS BY PUBLIC LAW TITLE (Continued)(Discretionary and Mandatory Dollars in Millions)
Public Law Title
Current Dollars
FY 2020 Constant Dollars
230
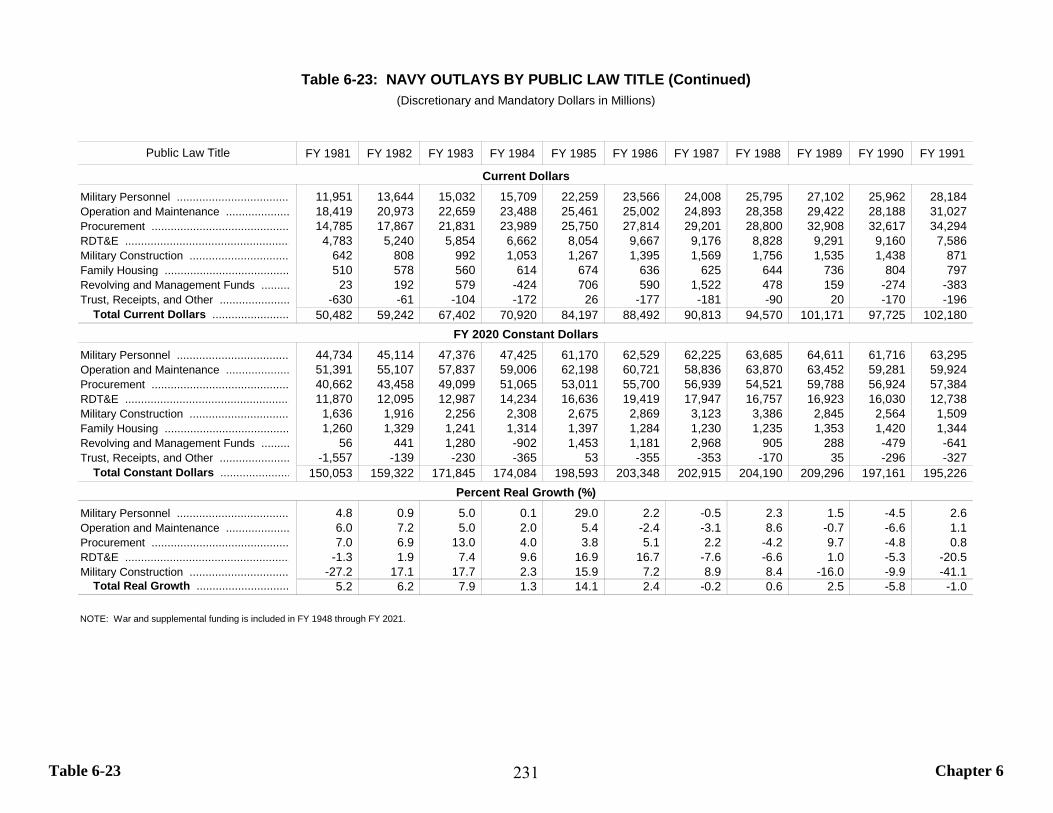
Table 6-23 Chapter 6
FY 1981 FY 1982 FY 1983 FY 1984 FY 1985 FY 1986 FY 1987 FY 1988 FY 1989 FY 1990 FY 1991
Military Personnel ................................... 11,951 13,644 15,032 15,709 22,259 23,566 24,008 25,795 27,102 25,962 28,184 Operation and Maintenance .................... 18,419 20,973 22,659 23,488 25,461 25,002 24,893 28,358 29,422 28,188 31,027 Procurement ........................................... 14,785 17,867 21,831 23,989 25,750 27,814 29,201 28,800 32,908 32,617 34,294 RDT&E .................................................... 4,783 5,240 5,854 6,662 8,054 9,667 9,176 8,828 9,291 9,160 7,586 Military Construction ............................... 642 808 992 1,053 1,267 1,395 1,569 1,756 1,535 1,438 871 Family Housing ....................................... 510 578 560 614 674 636 625 644 736 804 797 Revolving and Management Funds ......... 23 192 579 -424 706 590 1,522 478 159 -274 -383 Trust, Receipts, and Other ...................... -630 -61 -104 -172 26 -177 -181 -90 20 -170 -196
Total Current Dollars ........................ 50,482 59,242 67,402 70,920 84,197 88,492 90,813 94,570 101,171 97,725 102,180
Military Personnel ................................... 44,734 45,114 47,376 47,425 61,170 62,529 62,225 63,685 64,611 61,716 63,295 Operation and Maintenance .................... 51,391 55,107 57,837 59,006 62,198 60,721 58,836 63,870 63,452 59,281 59,924 Procurement ........................................... 40,662 43,458 49,099 51,065 53,011 55,700 56,939 54,521 59,788 56,924 57,384 RDT&E .................................................... 11,870 12,095 12,987 14,234 16,636 19,419 17,947 16,757 16,923 16,030 12,738 Military Construction ............................... 1,636 1,916 2,256 2,308 2,675 2,869 3,123 3,386 2,845 2,564 1,509 Family Housing ....................................... 1,260 1,329 1,241 1,314 1,397 1,284 1,230 1,235 1,353 1,420 1,344 Revolving and Management Funds ......... 56 441 1,280 -902 1,453 1,181 2,968 905 288 -479 -641 Trust, Receipts, and Other ...................... -1,557 -139 -230 -365 53 -355 -353 -170 35 -296 -327
Total Constant Dollars ...................... 150,053 159,322 171,845 174,084 198,593 203,348 202,915 204,190 209,296 197,161 195,226
Military Personnel ................................... 4.8 0.9 5.0 0.1 29.0 2.2 -0.5 2.3 1.5 -4.5 2.6 Operation and Maintenance .................... 6.0 7.2 5.0 2.0 5.4 -2.4 -3.1 8.6 -0.7 -6.6 1.1 Procurement ........................................... 7.0 6.9 13.0 4.0 3.8 5.1 2.2 -4.2 9.7 -4.8 0.8 RDT&E .................................................... -1.3 1.9 7.4 9.6 16.9 16.7 -7.6 -6.6 1.0 -5.3 -20.5 Military Construction ............................... -27.2 17.1 17.7 2.3 15.9 7.2 8.9 8.4 -16.0 -9.9 -41.1
Total Real Growth ............................. 5.2 6.2 7.9 1.3 14.1 2.4 -0.2 0.6 2.5 -5.8 -1.0
NOTE: War and supplemental funding is included in FY 1948 through FY 2021.
Percent Real Growth (%)
Table 6-23: NAVY OUTLAYS BY PUBLIC LAW TITLE (Continued)(Discretionary and Mandatory Dollars in Millions)
Public Law Title
Current Dollars
FY 2020 Constant Dollars
231
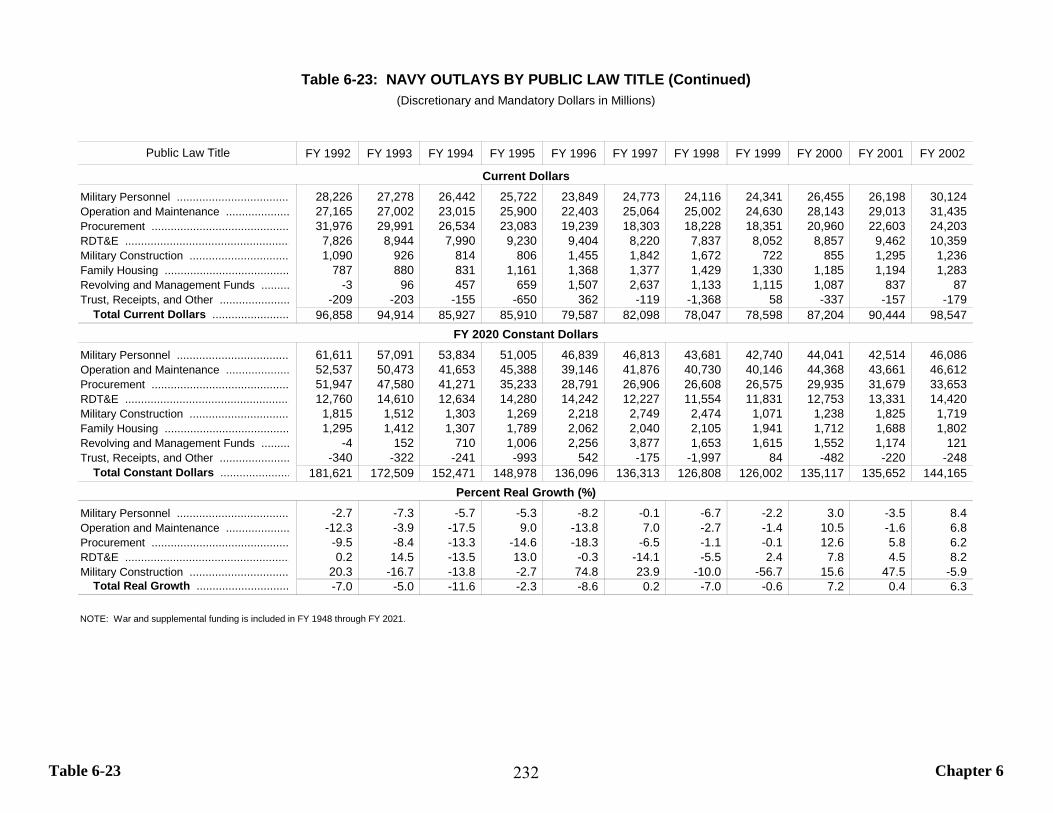
Table 6-23 Chapter 6
FY 1992 FY 1993 FY 1994 FY 1995 FY 1996 FY 1997 FY 1998 FY 1999 FY 2000 FY 2001 FY 2002
Military Personnel ................................... 28,226 27,278 26,442 25,722 23,849 24,773 24,116 24,341 26,455 26,198 30,124 Operation and Maintenance .................... 27,165 27,002 23,015 25,900 22,403 25,064 25,002 24,630 28,143 29,013 31,435 Procurement ........................................... 31,976 29,991 26,534 23,083 19,239 18,303 18,228 18,351 20,960 22,603 24,203 RDT&E .................................................... 7,826 8,944 7,990 9,230 9,404 8,220 7,837 8,052 8,857 9,462 10,359 Military Construction ............................... 1,090 926 814 806 1,455 1,842 1,672 722 855 1,295 1,236 Family Housing ....................................... 787 880 831 1,161 1,368 1,377 1,429 1,330 1,185 1,194 1,283 Revolving and Management Funds ......... -3 96 457 659 1,507 2,637 1,133 1,115 1,087 837 87 Trust, Receipts, and Other ...................... -209 -203 -155 -650 362 -119 -1,368 58 -337 -157 -179
Total Current Dollars ........................ 96,858 94,914 85,927 85,910 79,587 82,098 78,047 78,598 87,204 90,444 98,547
Military Personnel ................................... 61,611 57,091 53,834 51,005 46,839 46,813 43,681 42,740 44,041 42,514 46,086 Operation and Maintenance .................... 52,537 50,473 41,653 45,388 39,146 41,876 40,730 40,146 44,368 43,661 46,612 Procurement ........................................... 51,947 47,580 41,271 35,233 28,791 26,906 26,608 26,575 29,935 31,679 33,653 RDT&E .................................................... 12,760 14,610 12,634 14,280 14,242 12,227 11,554 11,831 12,753 13,331 14,420 Military Construction ............................... 1,815 1,512 1,303 1,269 2,218 2,749 2,474 1,071 1,238 1,825 1,719 Family Housing ....................................... 1,295 1,412 1,307 1,789 2,062 2,040 2,105 1,941 1,712 1,688 1,802 Revolving and Management Funds ......... -4 152 710 1,006 2,256 3,877 1,653 1,615 1,552 1,174 121 Trust, Receipts, and Other ...................... -340 -322 -241 -993 542 -175 -1,997 84 -482 -220 -248
Total Constant Dollars ...................... 181,621 172,509 152,471 148,978 136,096 136,313 126,808 126,002 135,117 135,652 144,165
Military Personnel ................................... -2.7 -7.3 -5.7 -5.3 -8.2 -0.1 -6.7 -2.2 3.0 -3.5 8.4 Operation and Maintenance .................... -12.3 -3.9 -17.5 9.0 -13.8 7.0 -2.7 -1.4 10.5 -1.6 6.8 Procurement ........................................... -9.5 -8.4 -13.3 -14.6 -18.3 -6.5 -1.1 -0.1 12.6 5.8 6.2 RDT&E .................................................... 0.2 14.5 -13.5 13.0 -0.3 -14.1 -5.5 2.4 7.8 4.5 8.2 Military Construction ............................... 20.3 -16.7 -13.8 -2.7 74.8 23.9 -10.0 -56.7 15.6 47.5 -5.9
Total Real Growth ............................. -7.0 -5.0 -11.6 -2.3 -8.6 0.2 -7.0 -0.6 7.2 0.4 6.3
NOTE: War and supplemental funding is included in FY 1948 through FY 2021.
Percent Real Growth (%)
Table 6-23: NAVY OUTLAYS BY PUBLIC LAW TITLE (Continued)(Discretionary and Mandatory Dollars in Millions)
Public Law Title
Current Dollars
FY 2020 Constant Dollars
232

Table 6-23 Chapter 6
FY 2003 FY 2004 FY 2005 FY 2006 FY 2007 FY 2008 FY 2009 FY 2010 FY 2011 FY 2012 FY 2013
Military Personnel ................................... 35,630 36,631 39,701 39,920 39,711 42,937 44,463 46,283 48,132 46,551 44,642 Operation and Maintenance .................... 36,471 37,935 39,256 42,179 43,720 48,953 50,218 52,769 56,150 57,266 54,063 Procurement ........................................... 25,097 27,243 27,974 30,031 32,982 37,679 39,810 42,425 42,894 42,079 41,720 RDT&E .................................................... 12,193 14,136 16,039 17,423 18,752 18,563 19,411 19,201 18,196 16,805 15,555 Military Construction ............................... 1,185 1,582 1,357 1,322 1,586 1,973 2,507 3,943 3,630 3,310 2,775 Family Housing ....................................... 1,226 1,090 938 750 646 525 496 442 483 448 417 Revolving and Management Funds ......... 428 1,437 719 804 1,971 1,891 1,258 1,925 1,318 1,426 1,053 Trust, Receipts, and Other ...................... -213 326 104 -162 -229 -61 -57 -104 66 -202 -66
Total Current Dollars ........................ 112,017 120,381 126,088 132,267 139,141 152,459 158,108 166,883 170,868 167,682 160,158
Military Personnel ................................... 53,055 52,875 55,408 53,999 52,353 54,626 54,811 55,598 56,822 54,012 50,870 Operation and Maintenance .................... 53,639 53,734 51,692 53,680 54,057 57,950 59,649 61,101 63,133 63,301 59,068 Procurement ........................................... 34,551 36,769 36,728 38,242 40,897 45,626 47,494 50,211 49,771 47,962 46,850 RDT&E .................................................... 16,751 19,058 21,024 22,090 23,160 22,167 22,820 22,285 20,738 18,812 17,276 Military Construction ............................... 1,623 2,122 1,766 1,667 1,953 2,371 2,963 4,667 4,212 3,772 3,116 Family Housing ....................................... 1,710 1,489 1,226 951 798 633 588 518 557 508 466 Revolving and Management Funds ......... 590 1,940 944 1,024 2,444 2,290 1,501 2,286 1,529 1,613 1,183 Trust, Receipts, and Other ...................... -293 440 137 -206 -284 -74 -68 -123 76 -230 -74
Total Constant Dollars ...................... 161,625 168,426 168,925 171,447 175,378 185,589 189,758 196,543 196,838 189,751 178,755
Military Personnel ................................... 15.1 -0.3 4.8 -2.5 -3.0 4.3 0.3 1.4 2.2 -4.9 -5.8 Operation and Maintenance .................... 15.1 0.2 -3.8 3.8 0.7 7.2 2.9 2.4 3.3 0.3 -6.7 Procurement ........................................... 2.7 6.4 -0.1 4.1 6.9 11.6 4.1 5.7 -0.9 -3.6 -2.3 RDT&E .................................................... 16.2 13.8 10.3 5.1 4.8 -4.3 2.9 -2.3 -6.9 -9.3 -8.2 Military Construction ............................... -5.5 30.7 -16.8 -5.6 17.1 21.4 25.0 57.5 -9.7 -10.4 -17.4
Total Real Growth ............................. 12.1 4.2 0.3 1.5 2.3 5.8 2.2 3.6 0.2 -3.6 -5.8
NOTE: War and supplemental funding is included in FY 1948 through FY 2021.
Percent Real Growth (%)
Table 6-23: NAVY OUTLAYS BY PUBLIC LAW TITLE (Continued)(Discretionary and Mandatory Dollars in Millions)
Public Law Title
Current Dollars
FY 2020 Constant Dollars
233
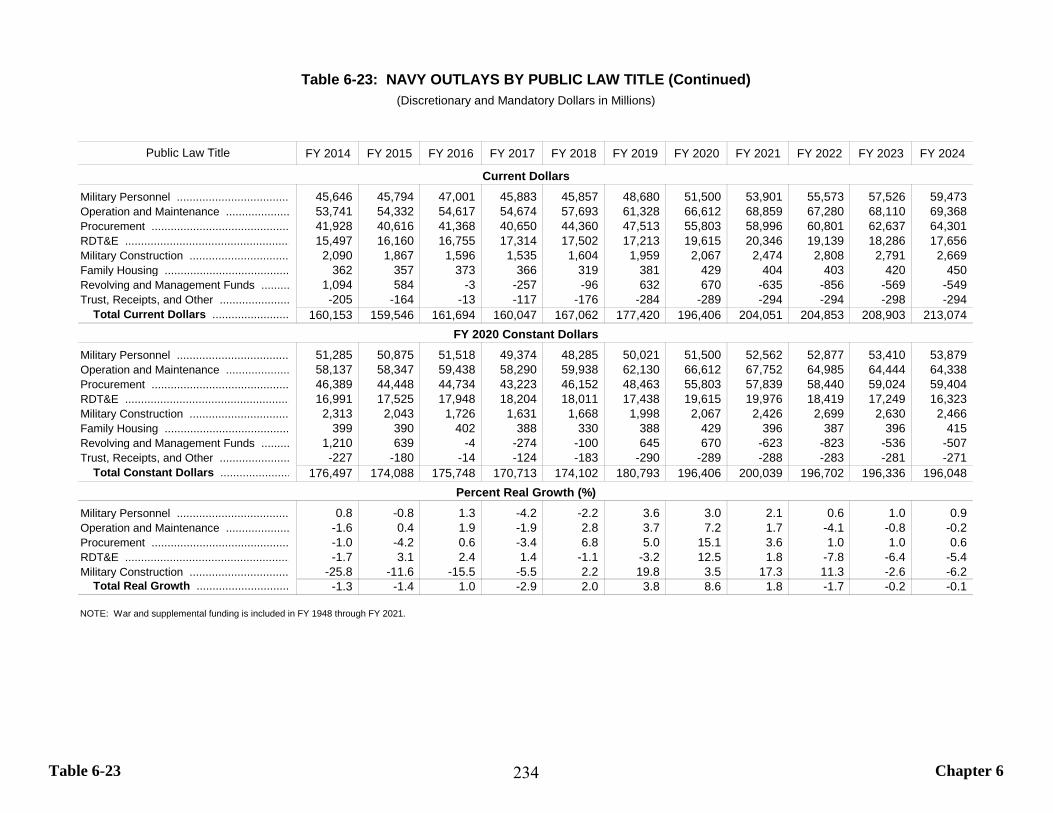
Table 6-23 Chapter 6
FY 2014 FY 2015 FY 2016 FY 2017 FY 2018 FY 2019 FY 2020 FY 2021 FY 2022 FY 2023 FY 2024
Military Personnel ................................... 45,646 45,794 47,001 45,883 45,857 48,680 51,500 53,901 55,573 57,526 59,473 Operation and Maintenance .................... 53,741 54,332 54,617 54,674 57,693 61,328 66,612 68,859 67,280 68,110 69,368 Procurement ........................................... 41,928 40,616 41,368 40,650 44,360 47,513 55,803 58,996 60,801 62,637 64,301 RDT&E .................................................... 15,497 16,160 16,755 17,314 17,502 17,213 19,615 20,346 19,139 18,286 17,656 Military Construction ............................... 2,090 1,867 1,596 1,535 1,604 1,959 2,067 2,474 2,808 2,791 2,669 Family Housing ....................................... 362 357 373 366 319 381 429 404 403 420 450 Revolving and Management Funds ......... 1,094 584 -3 -257 -96 632 670 -635 -856 -569 -549 Trust, Receipts, and Other ...................... -205 -164 -13 -117 -176 -284 -289 -294 -294 -298 -294
Total Current Dollars ........................ 160,153 159,546 161,694 160,047 167,062 177,420 196,406 204,051 204,853 208,903 213,074
Military Personnel ................................... 51,285 50,875 51,518 49,374 48,285 50,021 51,500 52,562 52,877 53,410 53,879 Operation and Maintenance .................... 58,137 58,347 59,438 58,290 59,938 62,130 66,612 67,752 64,985 64,444 64,338 Procurement ........................................... 46,389 44,448 44,734 43,223 46,152 48,463 55,803 57,839 58,440 59,024 59,404 RDT&E .................................................... 16,991 17,525 17,948 18,204 18,011 17,438 19,615 19,976 18,419 17,249 16,323 Military Construction ............................... 2,313 2,043 1,726 1,631 1,668 1,998 2,067 2,426 2,699 2,630 2,466 Family Housing ....................................... 399 390 402 388 330 388 429 396 387 396 415 Revolving and Management Funds ......... 1,210 639 -4 -274 -100 645 670 -623 -823 -536 -507 Trust, Receipts, and Other ...................... -227 -180 -14 -124 -183 -290 -289 -288 -283 -281 -271
Total Constant Dollars ...................... 176,497 174,088 175,748 170,713 174,102 180,793 196,406 200,039 196,702 196,336 196,048
Military Personnel ................................... 0.8 -0.8 1.3 -4.2 -2.2 3.6 3.0 2.1 0.6 1.0 0.9 Operation and Maintenance .................... -1.6 0.4 1.9 -1.9 2.8 3.7 7.2 1.7 -4.1 -0.8 -0.2 Procurement ........................................... -1.0 -4.2 0.6 -3.4 6.8 5.0 15.1 3.6 1.0 1.0 0.6 RDT&E .................................................... -1.7 3.1 2.4 1.4 -1.1 -3.2 12.5 1.8 -7.8 -6.4 -5.4 Military Construction ............................... -25.8 -11.6 -15.5 -5.5 2.2 19.8 3.5 17.3 11.3 -2.6 -6.2
Total Real Growth ............................. -1.3 -1.4 1.0 -2.9 2.0 3.8 8.6 1.8 -1.7 -0.2 -0.1
NOTE: War and supplemental funding is included in FY 1948 through FY 2021.
Percent Real Growth (%)
Table 6-23: NAVY OUTLAYS BY PUBLIC LAW TITLE (Continued)(Discretionary and Mandatory Dollars in Millions)
Public Law Title
Current Dollars
FY 2020 Constant Dollars
234
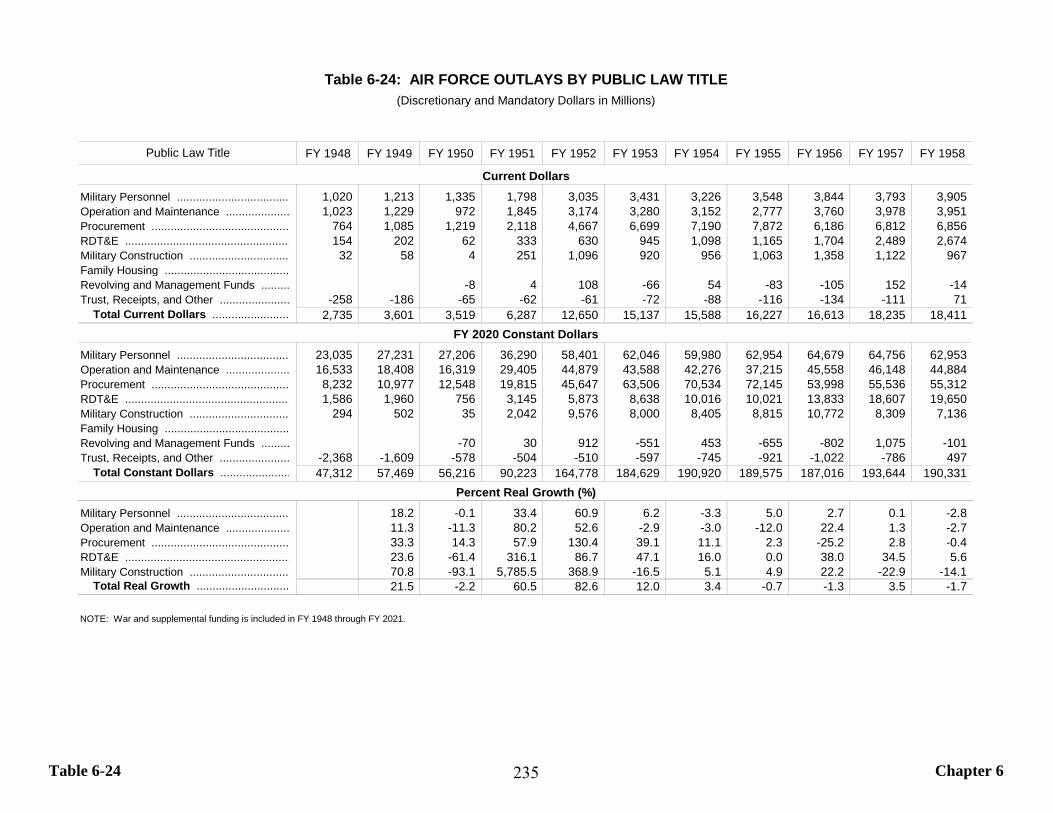
Table 6-24 Chapter 6
FY 1948 FY 1949 FY 1950 FY 1951 FY 1952 FY 1953 FY 1954 FY 1955 FY 1956 FY 1957 FY 1958
Military Personnel ................................... 1,020 1,213 1,335 1,798 3,035 3,431 3,226 3,548 3,844 3,793 3,905 Operation and Maintenance .................... 1,023 1,229 972 1,845 3,174 3,280 3,152 2,777 3,760 3,978 3,951 Procurement ........................................... 764 1,085 1,219 2,118 4,667 6,699 7,190 7,872 6,186 6,812 6,856 RDT&E .................................................... 154 202 62 333 630 945 1,098 1,165 1,704 2,489 2,674 Military Construction ............................... 32 58 4 251 1,096 920 956 1,063 1,358 1,122 967 Family Housing ....................................... Revolving and Management Funds ......... -8 4 108 -66 54 -83 -105 152 -14 Trust, Receipts, and Other ...................... -258 -186 -65 -62 -61 -72 -88 -116 -134 -111 71
Total Current Dollars ........................ 2,735 3,601 3,519 6,287 12,650 15,137 15,588 16,227 16,613 18,235 18,411
Military Personnel ................................... 23,035 27,231 27,206 36,290 58,401 62,046 59,980 62,954 64,679 64,756 62,953 Operation and Maintenance .................... 16,533 18,408 16,319 29,405 44,879 43,588 42,276 37,215 45,558 46,148 44,884 Procurement ........................................... 8,232 10,977 12,548 19,815 45,647 63,506 70,534 72,145 53,998 55,536 55,312 RDT&E .................................................... 1,586 1,960 756 3,145 5,873 8,638 10,016 10,021 13,833 18,607 19,650 Military Construction ............................... 294 502 35 2,042 9,576 8,000 8,405 8,815 10,772 8,309 7,136 Family Housing ....................................... Revolving and Management Funds ......... -70 30 912 -551 453 -655 -802 1,075 -101 Trust, Receipts, and Other ...................... -2,368 -1,609 -578 -504 -510 -597 -745 -921 -1,022 -786 497
Total Constant Dollars ...................... 47,312 57,469 56,216 90,223 164,778 184,629 190,920 189,575 187,016 193,644 190,331
Military Personnel ................................... 18.2 -0.1 33.4 60.9 6.2 -3.3 5.0 2.7 0.1 -2.8 Operation and Maintenance .................... 11.3 -11.3 80.2 52.6 -2.9 -3.0 -12.0 22.4 1.3 -2.7 Procurement ........................................... 33.3 14.3 57.9 130.4 39.1 11.1 2.3 -25.2 2.8 -0.4 RDT&E .................................................... 23.6 -61.4 316.1 86.7 47.1 16.0 0.0 38.0 34.5 5.6 Military Construction ............................... 70.8 -93.1 5,785.5 368.9 -16.5 5.1 4.9 22.2 -22.9 -14.1
Total Real Growth ............................. 21.5 -2.2 60.5 82.6 12.0 3.4 -0.7 -1.3 3.5 -1.7
NOTE: War and supplemental funding is included in FY 1948 through FY 2021.
Percent Real Growth (%)
Table 6-24: AIR FORCE OUTLAYS BY PUBLIC LAW TITLE(Discretionary and Mandatory Dollars in Millions)
Public Law Title
Current Dollars
FY 2020 Constant Dollars
235

Table 6-24 Chapter 6
FY 1959 FY 1960 FY 1961 FY 1962 FY 1963 FY 1964 FY 1965 FY 1966 FY 1967 FY 1968 FY 1969
Military Personnel ................................... 4,071 3,951 4,010 4,306 4,197 4,550 4,669 5,018 5,424 5,806 6,183 Operation and Maintenance .................... 4,298 4,275 4,440 4,622 4,682 4,719 4,771 5,176 5,714 6,211 7,073 Procurement ........................................... 7,146 7,381 7,058 7,533 7,698 6,959 5,101 6,414 8,096 9,408 9,294 RDT&E .................................................... 2,507 2,628 3,300 3,493 3,300 3,722 3,146 2,948 3,229 3,800 3,386 Military Construction ............................... 1,144 1,014 1,015 850 742 554 507 527 550 492 494 Family Housing ....................................... Revolving and Management Funds ......... 11 -45 -38 -44 22 5 23 47 -69 75 -508 Trust, Receipts, and Other ...................... 72 85 19 30 -32 -53 -70 -66 -33 -58 -29
Total Current Dollars ........................ 19,249 19,289 19,804 20,790 20,610 20,456 18,146 20,065 22,912 25,734 25,892
Military Personnel ................................... 61,455 59,657 59,288 63,494 61,825 62,268 61,864 61,117 63,265 63,919 63,131 Operation and Maintenance .................... 46,317 45,360 44,965 46,519 46,359 45,741 45,003 46,927 50,519 53,624 57,983 Procurement ........................................... 55,902 58,037 54,643 59,582 60,483 54,672 39,682 48,072 57,808 64,250 61,760 RDT&E .................................................... 18,082 19,005 23,124 24,667 23,332 26,098 21,886 19,935 21,053 23,863 20,662 Military Construction ............................... 8,209 7,315 7,154 6,018 5,205 3,862 3,489 3,491 3,508 3,042 2,951 Family Housing ....................................... Revolving and Management Funds ......... 73 -312 -257 -298 153 31 151 309 -433 453 -2,989 Trust, Receipts, and Other ...................... 493 586 128 205 -218 -360 -470 -429 -207 -351 -169
Total Constant Dollars ...................... 190,531 189,648 189,045 200,188 197,138 192,311 171,605 179,422 195,512 208,800 203,329
Military Personnel ................................... -2.4 -2.9 -0.6 7.1 -2.6 0.7 -0.6 -1.2 3.5 1.0 -1.2 Operation and Maintenance .................... 3.2 -2.1 -0.9 3.5 -0.3 -1.3 -1.6 4.3 7.7 6.1 8.1 Procurement ........................................... 1.1 3.8 -5.8 9.0 1.5 -9.6 -27.4 21.1 20.3 11.1 -3.9 RDT&E .................................................... -8.0 5.1 21.7 6.7 -5.4 11.9 -16.1 -8.9 5.6 13.3 -13.4 Military Construction ............................... 15.0 -10.9 -2.2 -15.9 -13.5 -25.8 -9.6 0.1 0.5 -13.3 -3.0
Total Real Growth ............................. 0.1 -0.5 -0.3 5.9 -1.5 -2.4 -10.8 4.6 9.0 6.8 -2.6
NOTE: War and supplemental funding is included in FY 1948 through FY 2021.
Percent Real Growth (%)
Table 6-24: AIR FORCE OUTLAYS BY PUBLIC LAW TITLE (Continued)(Discretionary and Mandatory Dollars in Millions)
Public Law Title
Current Dollars
FY 2020 Constant Dollars
236
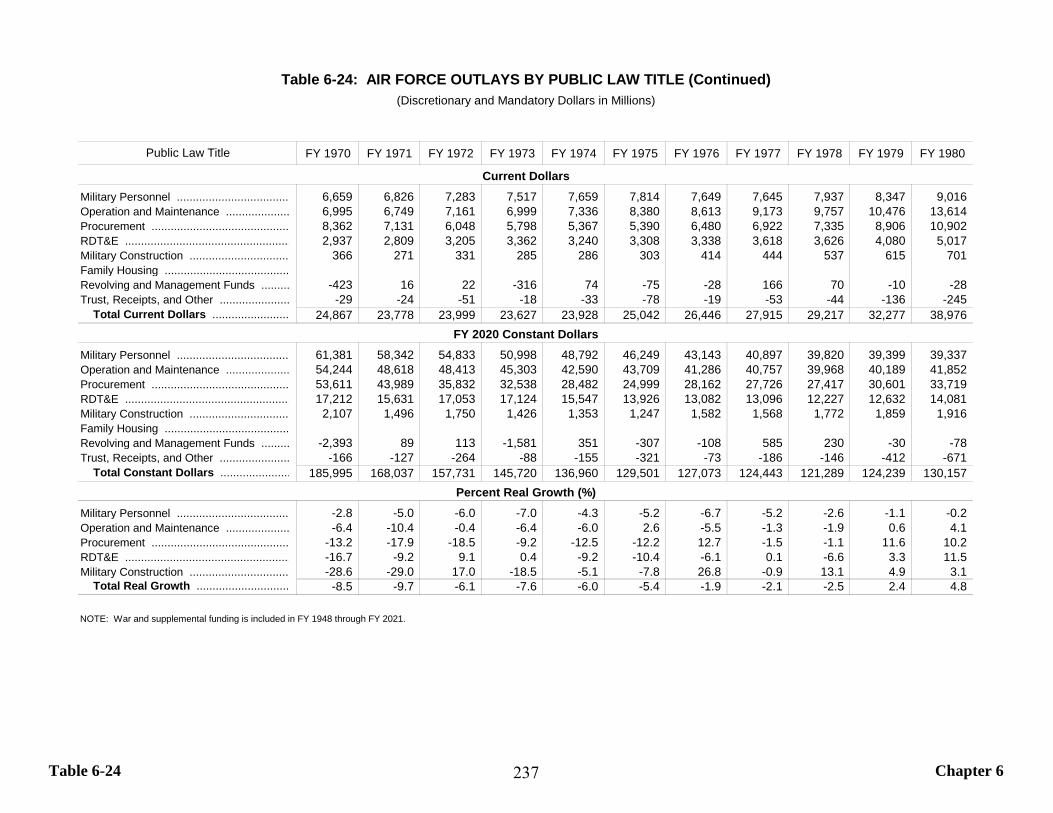
Table 6-24 Chapter 6
FY 1970 FY 1971 FY 1972 FY 1973 FY 1974 FY 1975 FY 1976 FY 1977 FY 1978 FY 1979 FY 1980
Military Personnel ................................... 6,659 6,826 7,283 7,517 7,659 7,814 7,649 7,645 7,937 8,347 9,016 Operation and Maintenance .................... 6,995 6,749 7,161 6,999 7,336 8,380 8,613 9,173 9,757 10,476 13,614 Procurement ........................................... 8,362 7,131 6,048 5,798 5,367 5,390 6,480 6,922 7,335 8,906 10,902 RDT&E .................................................... 2,937 2,809 3,205 3,362 3,240 3,308 3,338 3,618 3,626 4,080 5,017 Military Construction ............................... 366 271 331 285 286 303 414 444 537 615 701 Family Housing ....................................... Revolving and Management Funds ......... -423 16 22 -316 74 -75 -28 166 70 -10 -28 Trust, Receipts, and Other ...................... -29 -24 -51 -18 -33 -78 -19 -53 -44 -136 -245
Total Current Dollars ........................ 24,867 23,778 23,999 23,627 23,928 25,042 26,446 27,915 29,217 32,277 38,976
Military Personnel ................................... 61,381 58,342 54,833 50,998 48,792 46,249 43,143 40,897 39,820 39,399 39,337 Operation and Maintenance .................... 54,244 48,618 48,413 45,303 42,590 43,709 41,286 40,757 39,968 40,189 41,852 Procurement ........................................... 53,611 43,989 35,832 32,538 28,482 24,999 28,162 27,726 27,417 30,601 33,719 RDT&E .................................................... 17,212 15,631 17,053 17,124 15,547 13,926 13,082 13,096 12,227 12,632 14,081 Military Construction ............................... 2,107 1,496 1,750 1,426 1,353 1,247 1,582 1,568 1,772 1,859 1,916 Family Housing ....................................... Revolving and Management Funds ......... -2,393 89 113 -1,581 351 -307 -108 585 230 -30 -78 Trust, Receipts, and Other ...................... -166 -127 -264 -88 -155 -321 -73 -186 -146 -412 -671
Total Constant Dollars ...................... 185,995 168,037 157,731 145,720 136,960 129,501 127,073 124,443 121,289 124,239 130,157
Military Personnel ................................... -2.8 -5.0 -6.0 -7.0 -4.3 -5.2 -6.7 -5.2 -2.6 -1.1 -0.2 Operation and Maintenance .................... -6.4 -10.4 -0.4 -6.4 -6.0 2.6 -5.5 -1.3 -1.9 0.6 4.1 Procurement ........................................... -13.2 -17.9 -18.5 -9.2 -12.5 -12.2 12.7 -1.5 -1.1 11.6 10.2 RDT&E .................................................... -16.7 -9.2 9.1 0.4 -9.2 -10.4 -6.1 0.1 -6.6 3.3 11.5 Military Construction ............................... -28.6 -29.0 17.0 -18.5 -5.1 -7.8 26.8 -0.9 13.1 4.9 3.1
Total Real Growth ............................. -8.5 -9.7 -6.1 -7.6 -6.0 -5.4 -1.9 -2.1 -2.5 2.4 4.8
NOTE: War and supplemental funding is included in FY 1948 through FY 2021.
Percent Real Growth (%)
Table 6-24: AIR FORCE OUTLAYS BY PUBLIC LAW TITLE (Continued)(Discretionary and Mandatory Dollars in Millions)
Public Law Title
Current Dollars
FY 2020 Constant Dollars
237

Table 6-24 Chapter 6
FY 1981 FY 1982 FY 1983 FY 1984 FY 1985 FY 1986 FY 1987 FY 1988 FY 1989 FY 1990 FY 1991
Military Personnel ................................... 10,480 12,240 13,053 13,619 19,371 20,311 20,739 21,346 22,555 20,687 22,766 Operation and Maintenance .................... 16,017 17,819 19,106 19,274 20,203 21,300 20,587 23,752 24,751 25,195 27,017 Procurement ........................................... 13,028 16,356 19,886 23,541 28,445 32,638 33,815 30,845 30,215 30,926 29,923 RDT&E .................................................... 6,341 7,794 9,182 10,353 11,573 13,417 13,347 14,302 14,912 14,443 13,050 Military Construction ............................... 779 902 1,196 1,314 1,524 1,710 1,778 1,616 1,539 1,408 848 Family Housing ....................................... 543 571 679 772 795 834 804 889 929 943 888 Revolving and Management Funds ......... -15 341 -112 -78 389 1,158 454 654 177 239 545 Trust, Receipts, and Other ...................... -2,017 -349 -97 -176 -312 -181 -379 -344 -400 -295 -527
Total Current Dollars ........................ 45,157 55,676 62,894 68,620 81,988 91,188 91,144 93,060 94,676 93,546 94,510
Military Personnel ................................... 40,251 40,996 41,816 41,811 53,791 54,361 54,102 53,446 54,098 49,813 51,298 Operation and Maintenance .................... 43,931 45,652 48,395 49,097 50,801 53,249 50,918 56,072 56,430 56,134 53,401 Procurement ........................................... 36,163 40,223 45,296 50,110 58,557 65,360 65,936 58,393 54,895 53,974 50,070 RDT&E .................................................... 16,052 18,365 20,740 22,549 24,370 27,403 26,521 27,407 27,402 25,534 22,121 Military Construction ............................... 1,926 2,074 2,643 2,797 3,138 3,425 3,466 3,060 2,795 2,456 1,418 Family Housing ....................................... 1,343 1,313 1,518 1,676 1,679 1,720 1,623 1,726 1,733 1,680 1,509 Revolving and Management Funds ......... -38 784 -247 -167 802 2,319 886 1,239 321 418 912 Trust, Receipts, and Other ...................... -4,986 -801 -215 -374 -642 -362 -740 -652 -727 -515 -881
Total Constant Dollars ...................... 134,640 148,605 159,946 167,499 192,497 207,475 202,712 200,690 196,946 189,494 179,849
Military Personnel ................................... 2.3 1.9 2.0 0.0 28.7 1.1 -0.5 -1.2 1.2 -7.9 3.0 Operation and Maintenance .................... 5.0 3.9 6.0 1.5 3.5 4.8 -4.4 10.1 0.6 -0.5 -4.9 Procurement ........................................... 7.2 11.2 12.6 10.6 16.9 11.6 0.9 -11.4 -6.0 -1.7 -7.2 RDT&E .................................................... 14.0 14.4 12.9 8.7 8.1 12.4 -3.2 3.3 0.0 -6.8 -13.4 Military Construction ............................... 0.5 7.7 27.4 5.9 12.2 9.1 1.2 -11.7 -8.6 -12.1 -42.3
Total Real Growth ............................. 3.4 10.4 7.6 4.7 14.9 7.8 -2.3 -1.0 -1.9 -3.8 -5.1
NOTE: War and supplemental funding is included in FY 1948 through FY 2021.
Percent Real Growth (%)
Table 6-24: AIR FORCE OUTLAYS BY PUBLIC LAW TITLE (Continued)(Discretionary and Mandatory Dollars in Millions)
Public Law Title
Current Dollars
FY 2020 Constant Dollars
238
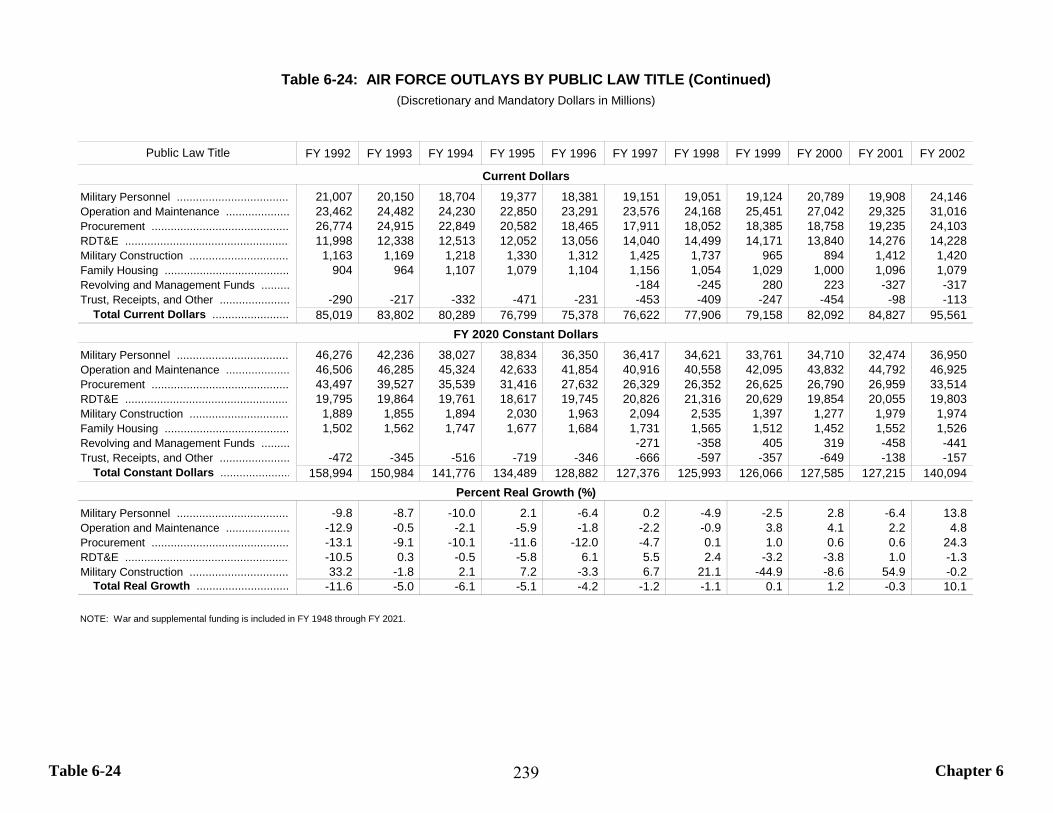
Table 6-24 Chapter 6
FY 1992 FY 1993 FY 1994 FY 1995 FY 1996 FY 1997 FY 1998 FY 1999 FY 2000 FY 2001 FY 2002
Military Personnel ................................... 21,007 20,150 18,704 19,377 18,381 19,151 19,051 19,124 20,789 19,908 24,146 Operation and Maintenance .................... 23,462 24,482 24,230 22,850 23,291 23,576 24,168 25,451 27,042 29,325 31,016 Procurement ........................................... 26,774 24,915 22,849 20,582 18,465 17,911 18,052 18,385 18,758 19,235 24,103 RDT&E .................................................... 11,998 12,338 12,513 12,052 13,056 14,040 14,499 14,171 13,840 14,276 14,228 Military Construction ............................... 1,163 1,169 1,218 1,330 1,312 1,425 1,737 965 894 1,412 1,420 Family Housing ....................................... 904 964 1,107 1,079 1,104 1,156 1,054 1,029 1,000 1,096 1,079 Revolving and Management Funds ......... -184 -245 280 223 -327 -317 Trust, Receipts, and Other ...................... -290 -217 -332 -471 -231 -453 -409 -247 -454 -98 -113
Total Current Dollars ........................ 85,019 83,802 80,289 76,799 75,378 76,622 77,906 79,158 82,092 84,827 95,561
Military Personnel ................................... 46,276 42,236 38,027 38,834 36,350 36,417 34,621 33,761 34,710 32,474 36,950 Operation and Maintenance .................... 46,506 46,285 45,324 42,633 41,854 40,916 40,558 42,095 43,832 44,792 46,925 Procurement ........................................... 43,497 39,527 35,539 31,416 27,632 26,329 26,352 26,625 26,790 26,959 33,514 RDT&E .................................................... 19,795 19,864 19,761 18,617 19,745 20,826 21,316 20,629 19,854 20,055 19,803 Military Construction ............................... 1,889 1,855 1,894 2,030 1,963 2,094 2,535 1,397 1,277 1,979 1,974 Family Housing ....................................... 1,502 1,562 1,747 1,677 1,684 1,731 1,565 1,512 1,452 1,552 1,526 Revolving and Management Funds ......... -271 -358 405 319 -458 -441 Trust, Receipts, and Other ...................... -472 -345 -516 -719 -346 -666 -597 -357 -649 -138 -157
Total Constant Dollars ...................... 158,994 150,984 141,776 134,489 128,882 127,376 125,993 126,066 127,585 127,215 140,094
Military Personnel ................................... -9.8 -8.7 -10.0 2.1 -6.4 0.2 -4.9 -2.5 2.8 -6.4 13.8 Operation and Maintenance .................... -12.9 -0.5 -2.1 -5.9 -1.8 -2.2 -0.9 3.8 4.1 2.2 4.8 Procurement ........................................... -13.1 -9.1 -10.1 -11.6 -12.0 -4.7 0.1 1.0 0.6 0.6 24.3 RDT&E .................................................... -10.5 0.3 -0.5 -5.8 6.1 5.5 2.4 -3.2 -3.8 1.0 -1.3 Military Construction ............................... 33.2 -1.8 2.1 7.2 -3.3 6.7 21.1 -44.9 -8.6 54.9 -0.2
Total Real Growth ............................. -11.6 -5.0 -6.1 -5.1 -4.2 -1.2 -1.1 0.1 1.2 -0.3 10.1
NOTE: War and supplemental funding is included in FY 1948 through FY 2021.
Percent Real Growth (%)
Table 6-24: AIR FORCE OUTLAYS BY PUBLIC LAW TITLE (Continued)(Discretionary and Mandatory Dollars in Millions)
Public Law Title
Current Dollars
FY 2020 Constant Dollars
239
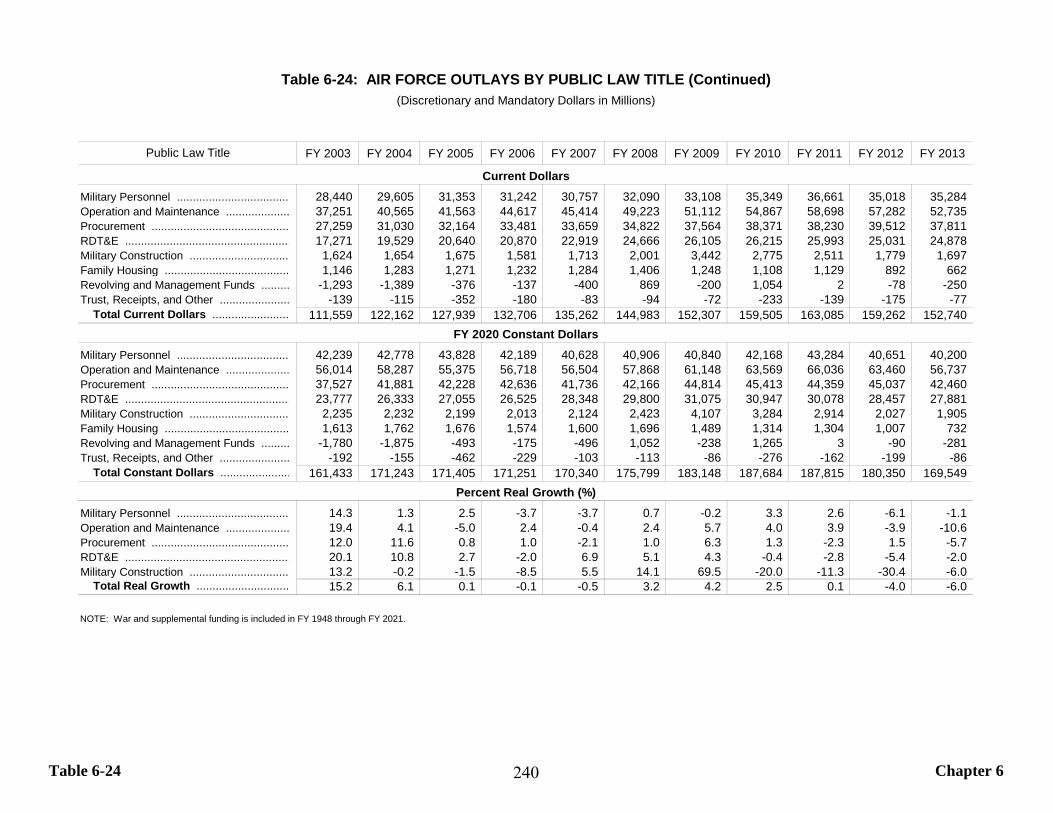
Table 6-24 Chapter 6
FY 2003 FY 2004 FY 2005 FY 2006 FY 2007 FY 2008 FY 2009 FY 2010 FY 2011 FY 2012 FY 2013
Military Personnel ................................... 28,440 29,605 31,353 31,242 30,757 32,090 33,108 35,349 36,661 35,018 35,284 Operation and Maintenance .................... 37,251 40,565 41,563 44,617 45,414 49,223 51,112 54,867 58,698 57,282 52,735 Procurement ........................................... 27,259 31,030 32,164 33,481 33,659 34,822 37,564 38,371 38,230 39,512 37,811 RDT&E .................................................... 17,271 19,529 20,640 20,870 22,919 24,666 26,105 26,215 25,993 25,031 24,878 Military Construction ............................... 1,624 1,654 1,675 1,581 1,713 2,001 3,442 2,775 2,511 1,779 1,697 Family Housing ....................................... 1,146 1,283 1,271 1,232 1,284 1,406 1,248 1,108 1,129 892 662 Revolving and Management Funds ......... -1,293 -1,389 -376 -137 -400 869 -200 1,054 2 -78 -250 Trust, Receipts, and Other ...................... -139 -115 -352 -180 -83 -94 -72 -233 -139 -175 -77
Total Current Dollars ........................ 111,559 122,162 127,939 132,706 135,262 144,983 152,307 159,505 163,085 159,262 152,740
Military Personnel ................................... 42,239 42,778 43,828 42,189 40,628 40,906 40,840 42,168 43,284 40,651 40,200 Operation and Maintenance .................... 56,014 58,287 55,375 56,718 56,504 57,868 61,148 63,569 66,036 63,460 56,737 Procurement ........................................... 37,527 41,881 42,228 42,636 41,736 42,166 44,814 45,413 44,359 45,037 42,460 RDT&E .................................................... 23,777 26,333 27,055 26,525 28,348 29,800 31,075 30,947 30,078 28,457 27,881 Military Construction ............................... 2,235 2,232 2,199 2,013 2,124 2,423 4,107 3,284 2,914 2,027 1,905 Family Housing ....................................... 1,613 1,762 1,676 1,574 1,600 1,696 1,489 1,314 1,304 1,007 732 Revolving and Management Funds ......... -1,780 -1,875 -493 -175 -496 1,052 -238 1,265 3 -90 -281 Trust, Receipts, and Other ...................... -192 -155 -462 -229 -103 -113 -86 -276 -162 -199 -86
Total Constant Dollars ...................... 161,433 171,243 171,405 171,251 170,340 175,799 183,148 187,684 187,815 180,350 169,549
Military Personnel ................................... 14.3 1.3 2.5 -3.7 -3.7 0.7 -0.2 3.3 2.6 -6.1 -1.1 Operation and Maintenance .................... 19.4 4.1 -5.0 2.4 -0.4 2.4 5.7 4.0 3.9 -3.9 -10.6 Procurement ........................................... 12.0 11.6 0.8 1.0 -2.1 1.0 6.3 1.3 -2.3 1.5 -5.7 RDT&E .................................................... 20.1 10.8 2.7 -2.0 6.9 5.1 4.3 -0.4 -2.8 -5.4 -2.0 Military Construction ............................... 13.2 -0.2 -1.5 -8.5 5.5 14.1 69.5 -20.0 -11.3 -30.4 -6.0
Total Real Growth ............................. 15.2 6.1 0.1 -0.1 -0.5 3.2 4.2 2.5 0.1 -4.0 -6.0
NOTE: War and supplemental funding is included in FY 1948 through FY 2021.
Percent Real Growth (%)
Table 6-24: AIR FORCE OUTLAYS BY PUBLIC LAW TITLE (Continued)(Discretionary and Mandatory Dollars in Millions)
Public Law Title
Current Dollars
FY 2020 Constant Dollars
240
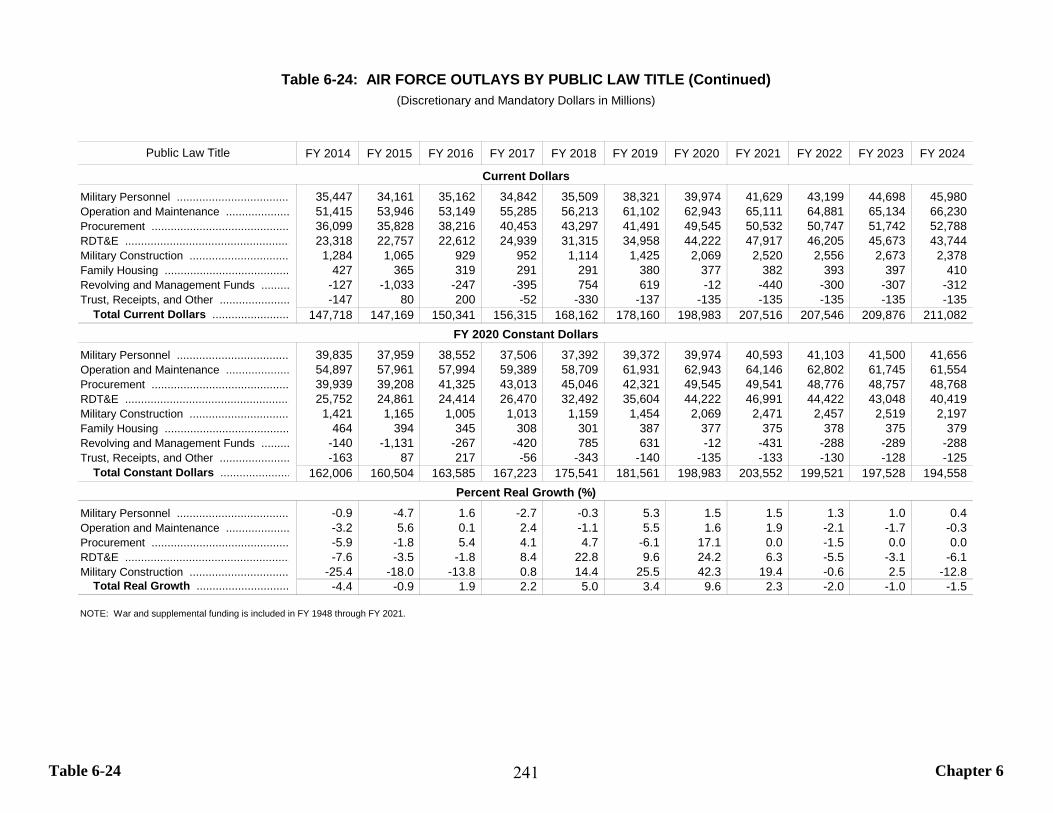
Table 6-24 Chapter 6
FY 2014 FY 2015 FY 2016 FY 2017 FY 2018 FY 2019 FY 2020 FY 2021 FY 2022 FY 2023 FY 2024
Military Personnel ................................... 35,447 34,161 35,162 34,842 35,509 38,321 39,974 41,629 43,199 44,698 45,980 Operation and Maintenance .................... 51,415 53,946 53,149 55,285 56,213 61,102 62,943 65,111 64,881 65,134 66,230 Procurement ........................................... 36,099 35,828 38,216 40,453 43,297 41,491 49,545 50,532 50,747 51,742 52,788 RDT&E .................................................... 23,318 22,757 22,612 24,939 31,315 34,958 44,222 47,917 46,205 45,673 43,744 Military Construction ............................... 1,284 1,065 929 952 1,114 1,425 2,069 2,520 2,556 2,673 2,378 Family Housing ....................................... 427 365 319 291 291 380 377 382 393 397 410 Revolving and Management Funds ......... -127 -1,033 -247 -395 754 619 -12 -440 -300 -307 -312 Trust, Receipts, and Other ...................... -147 80 200 -52 -330 -137 -135 -135 -135 -135 -135
Total Current Dollars ........................ 147,718 147,169 150,341 156,315 168,162 178,160 198,983 207,516 207,546 209,876 211,082
Military Personnel ................................... 39,835 37,959 38,552 37,506 37,392 39,372 39,974 40,593 41,103 41,500 41,656 Operation and Maintenance .................... 54,897 57,961 57,994 59,389 58,709 61,931 62,943 64,146 62,802 61,745 61,554 Procurement ........................................... 39,939 39,208 41,325 43,013 45,046 42,321 49,545 49,541 48,776 48,757 48,768 RDT&E .................................................... 25,752 24,861 24,414 26,470 32,492 35,604 44,222 46,991 44,422 43,048 40,419 Military Construction ............................... 1,421 1,165 1,005 1,013 1,159 1,454 2,069 2,471 2,457 2,519 2,197 Family Housing ....................................... 464 394 345 308 301 387 377 375 378 375 379 Revolving and Management Funds ......... -140 -1,131 -267 -420 785 631 -12 -431 -288 -289 -288 Trust, Receipts, and Other ...................... -163 87 217 -56 -343 -140 -135 -133 -130 -128 -125
Total Constant Dollars ...................... 162,006 160,504 163,585 167,223 175,541 181,561 198,983 203,552 199,521 197,528 194,558
Military Personnel ................................... -0.9 -4.7 1.6 -2.7 -0.3 5.3 1.5 1.5 1.3 1.0 0.4 Operation and Maintenance .................... -3.2 5.6 0.1 2.4 -1.1 5.5 1.6 1.9 -2.1 -1.7 -0.3 Procurement ........................................... -5.9 -1.8 5.4 4.1 4.7 -6.1 17.1 0.0 -1.5 0.0 0.0 RDT&E .................................................... -7.6 -3.5 -1.8 8.4 22.8 9.6 24.2 6.3 -5.5 -3.1 -6.1 Military Construction ............................... -25.4 -18.0 -13.8 0.8 14.4 25.5 42.3 19.4 -0.6 2.5 -12.8
Total Real Growth ............................. -4.4 -0.9 1.9 2.2 5.0 3.4 9.6 2.3 -2.0 -1.0 -1.5
NOTE: War and supplemental funding is included in FY 1948 through FY 2021.
Percent Real Growth (%)
Table 6-24: AIR FORCE OUTLAYS BY PUBLIC LAW TITLE (Continued)(Discretionary and Mandatory Dollars in Millions)
Public Law Title
Current Dollars
FY 2020 Constant Dollars
241
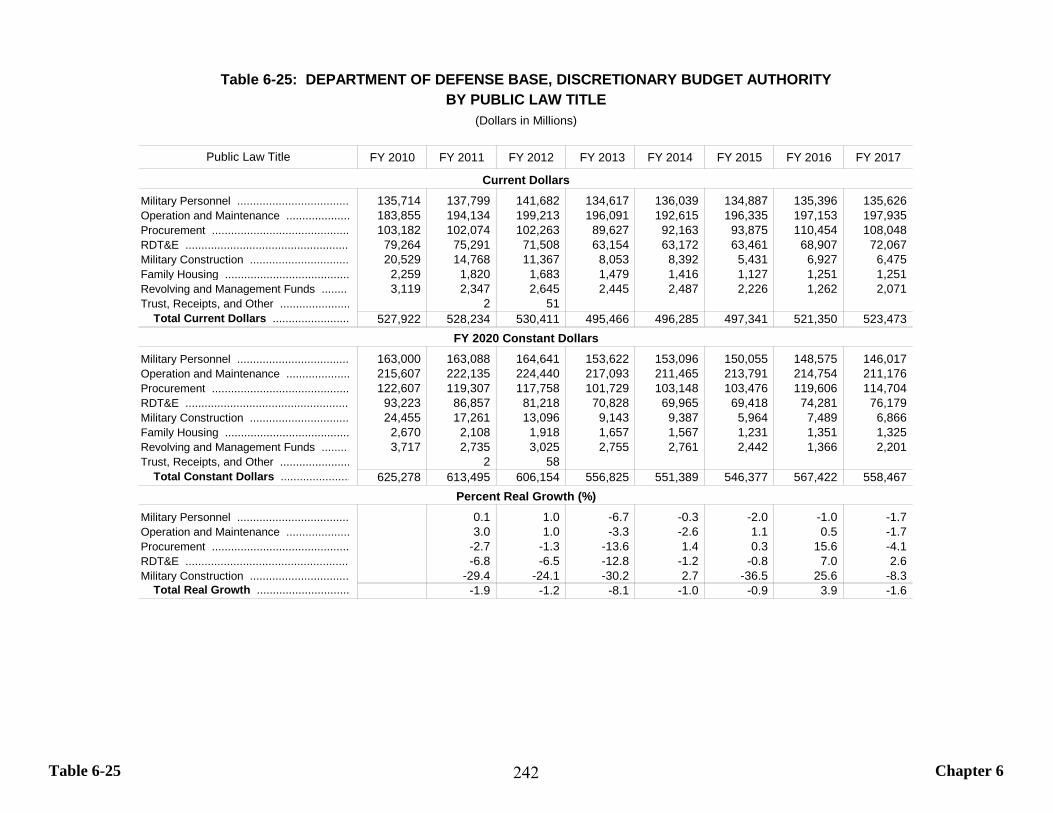
Table 6-25 Chapter 6
FY 2010 FY 2011 FY 2012 FY 2013 FY 2014 FY 2015 FY 2016 FY 2017
Military Personnel ................................... 135,714 137,799 141,682 134,617 136,039 134,887 135,396 135,626 Operation and Maintenance .................... 183,855 194,134 199,213 196,091 192,615 196,335 197,153 197,935 Procurement ........................................... 103,182 102,074 102,263 89,627 92,163 93,875 110,454 108,048 RDT&E .................................................... 79,264 75,291 71,508 63,154 63,172 63,461 68,907 72,067 Military Construction ............................... 20,529 14,768 11,367 8,053 8,392 5,431 6,927 6,475 Family Housing ....................................... 2,259 1,820 1,683 1,479 1,416 1,127 1,251 1,251
3,119 2,347 2,645 2,445 2,487 2,226 1,262 2,071 Trust, Receipts, and Other ...................... 2 51
Total Current Dollars ........................ 527,922 528,234 530,411 495,466 496,285 497,341 521,350 523,473
Military Personnel ................................... 163,000 163,088 164,641 153,622 153,096 150,055 148,575 146,017 Operation and Maintenance .................... 215,607 222,135 224,440 217,093 211,465 213,791 214,754 211,176 Procurement ........................................... 122,607 119,307 117,758 101,729 103,148 103,476 119,606 114,704 RDT&E .................................................... 93,223 86,857 81,218 70,828 69,965 69,418 74,281 76,179 Military Construction ............................... 24,455 17,261 13,096 9,143 9,387 5,964 7,489 6,866 Family Housing ....................................... 2,670 2,108 1,918 1,657 1,567 1,231 1,351 1,325
3,717 2,735 3,025 2,755 2,761 2,442 1,366 2,201 Trust, Receipts, and Other ...................... 2 58
Total Constant Dollars ...................... 625,278 613,495 606,154 556,825 551,389 546,377 567,422 558,467
Military Personnel ................................... 0.1 1.0 -6.7 -0.3 -2.0 -1.0 -1.7 Operation and Maintenance .................... 3.0 1.0 -3.3 -2.6 1.1 0.5 -1.7 Procurement ........................................... -2.7 -1.3 -13.6 1.4 0.3 15.6 -4.1 RDT&E .................................................... -6.8 -6.5 -12.8 -1.2 -0.8 7.0 2.6 Military Construction ............................... -29.4 -24.1 -30.2 2.7 -36.5 25.6 -8.3
Total Real Growth ............................. -1.9 -1.2 -8.1 -1.0 -0.9 3.9 -1.6
Percent Real Growth (%)
Table 6-25: DEPARTMENT OF DEFENSE BASE, DISCRETIONARY BUDGET AUTHORITY
(Dollars in Millions)
Public Law Title
Current Dollars
FY 2020 Constant Dollars
BY PUBLIC LAW TITLE
Revolving and Management Funds ........
Revolving and Management Funds ........
242
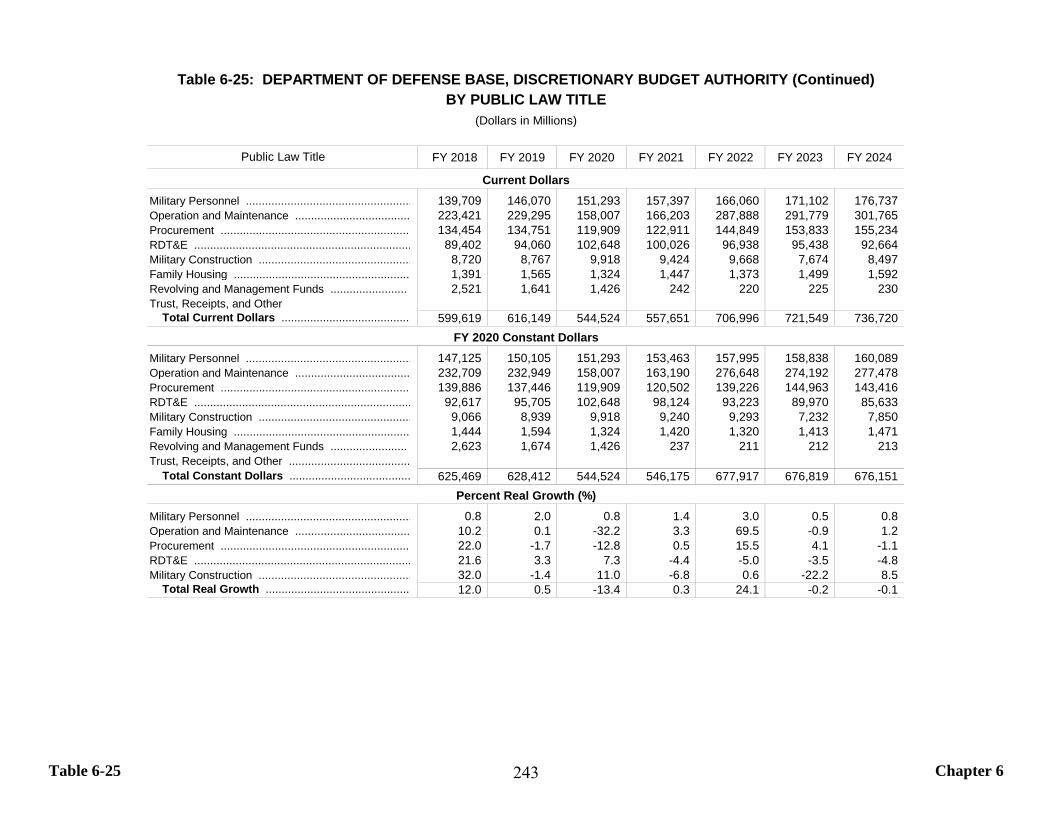
Table 6-25 Chapter 6
FY 2018 FY 2019 FY 2020 FY 2021 FY 2022 FY 2023 FY 2024
Military Personnel .................................................... 139,709 146,070 151,293 157,397 166,060 171,102 176,737 Operation and Maintenance .................................... 223,421 229,295 158,007 166,203 287,888 291,779 301,765 Procurement ............................................................ 134,454 134,751 119,909 122,911 144,849 153,833 155,234 RDT&E .................................................................... 89,402 94,060 102,648 100,026 96,938 95,438 92,664 Military Construction ................................................ 8,720 8,767 9,918 9,424 9,668 7,674 8,497 Family Housing ....................................................... 1,391 1,565 1,324 1,447 1,373 1,499 1,592
2,521 1,641 1,426 242 220 225 230
Total Current Dollars ........................................ 599,619 616,149 544,524 557,651 706,996 721,549 736,720
Military Personnel .................................................... 147,125 150,105 151,293 153,463 157,995 158,838 160,089 Operation and Maintenance .................................... 232,709 232,949 158,007 163,190 276,648 274,192 277,478 Procurement ............................................................ 139,886 137,446 119,909 120,502 139,226 144,963 143,416 RDT&E .................................................................... 92,617 95,705 102,648 98,124 93,223 89,970 85,633 Military Construction ................................................ 9,066 8,939 9,918 9,240 9,293 7,232 7,850 Family Housing ....................................................... 1,444 1,594 1,324 1,420 1,320 1,413 1,471
2,623 1,674 1,426 237 211 212 213 Trust, Receipts, and Other ......................................
Total Constant Dollars ...................................... 625,469 628,412 544,524 546,175 677,917 676,819 676,151
Military Personnel .................................................... 0.8 2.0 0.8 1.4 3.0 0.5 0.8 Operation and Maintenance .................................... 10.2 0.1 -32.2 3.3 69.5 -0.9 1.2 Procurement ............................................................ 22.0 -1.7 -12.8 0.5 15.5 4.1 -1.1 RDT&E .................................................................... 21.6 3.3 7.3 -4.4 -5.0 -3.5 -4.8 Military Construction ................................................ 32.0 -1.4 11.0 -6.8 0.6 -22.2 8.5
Total Real Growth ............................................. 12.0 0.5 -13.4 0.3 24.1 -0.2 -0.1
Table 6-25: DEPARTMENT OF DEFENSE BASE, DISCRETIONARY BUDGET AUTHORITY (Continued)
FY 2020 Constant Dollars
Revolving and Management Funds ........................
Percent Real Growth (%)
BY PUBLIC LAW TITLE(Dollars in Millions)
Public Law Title
Current Dollars
Revolving and Management Funds ........................Trust, Receipts, and Other
243
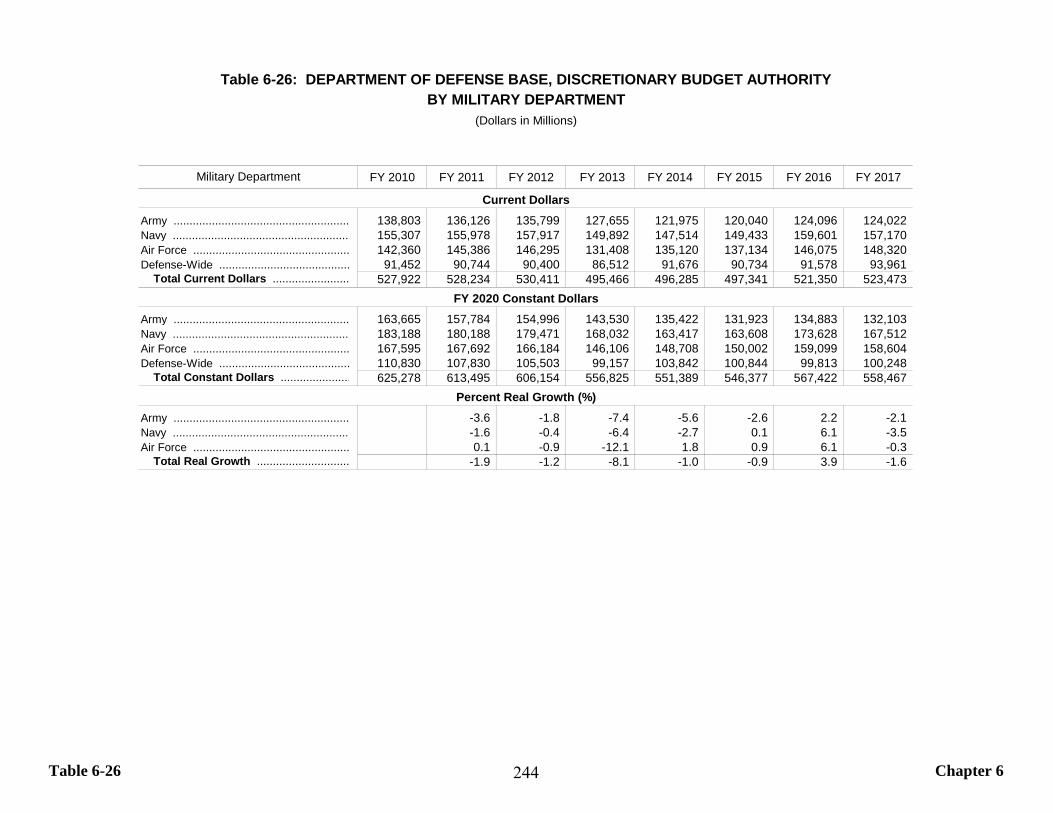
Table 6-26 Chapter 6
FY 2010 FY 2011 FY 2012 FY 2013 FY 2014 FY 2015 FY 2016 FY 2017
Army ....................................................... 138,803 136,126 135,799 127,655 121,975 120,040 124,096 124,022 Navy ........................................................ 155,307 155,978 157,917 149,892 147,514 149,433 159,601 157,170 Air Force ................................................. 142,360 145,386 146,295 131,408 135,120 137,134 146,075 148,320 Defense-Wide ......................................... 91,452 90,744 90,400 86,512 91,676 90,734 91,578 93,961
Total Current Dollars ........................ 527,922 528,234 530,411 495,466 496,285 497,341 521,350 523,473
Army ....................................................... 163,665 157,784 154,996 143,530 135,422 131,923 134,883 132,103 Navy ........................................................ 183,188 180,188 179,471 168,032 163,417 163,608 173,628 167,512 Air Force ................................................. 167,595 167,692 166,184 146,106 148,708 150,002 159,099 158,604 Defense-Wide ......................................... 110,830 107,830 105,503 99,157 103,842 100,844 99,813 100,248
Total Constant Dollars ...................... 625,278 613,495 606,154 556,825 551,389 546,377 567,422 558,467
Army ....................................................... -3.6 -1.8 -7.4 -5.6 -2.6 2.2 -2.1 Navy ........................................................ -1.6 -0.4 -6.4 -2.7 0.1 6.1 -3.5 Air Force ................................................. 0.1 -0.9 -12.1 1.8 0.9 6.1 -0.3
Total Real Growth ............................. -1.9 -1.2 -8.1 -1.0 -0.9 3.9 -1.6
FY 2020 Constant Dollars
Percent Real Growth (%)
Table 6-26: DEPARTMENT OF DEFENSE BASE, DISCRETIONARY BUDGET AUTHORITY
(Dollars in Millions)
Military Department
Current Dollars
BY MILITARY DEPARTMENT
244
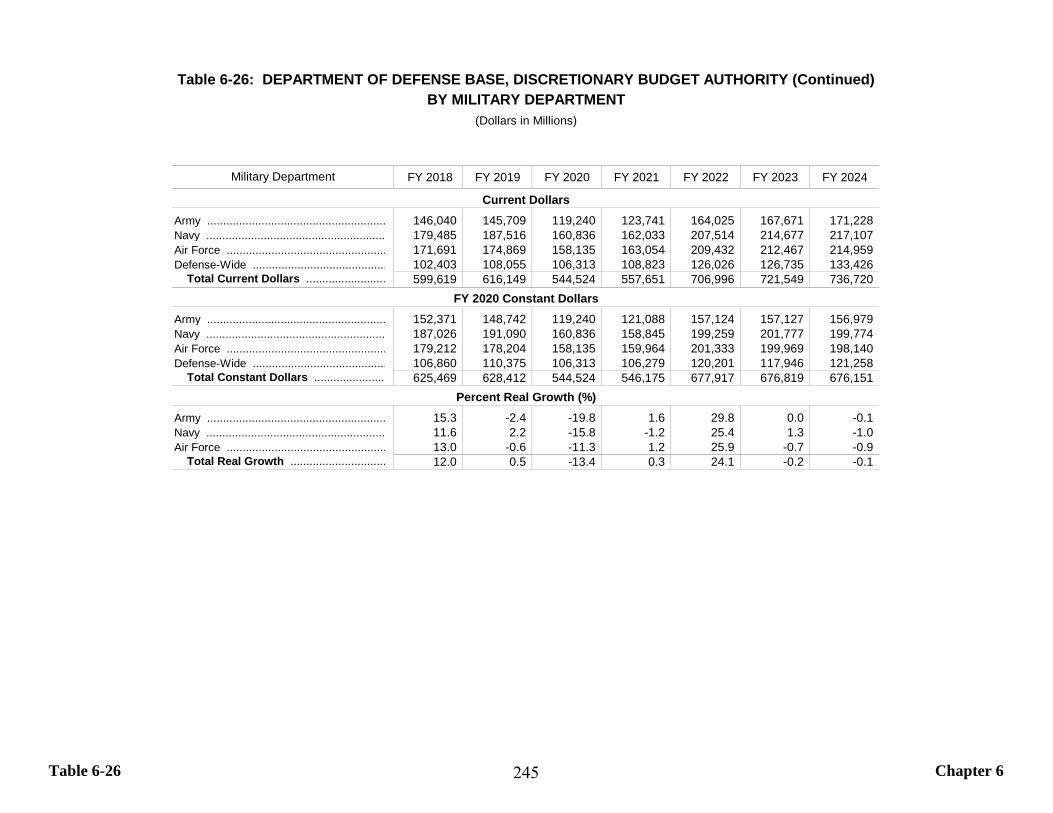
Table 6-26 Chapter 6
FY 2018 FY 2019 FY 2020 FY 2021 FY 2022 FY 2023 FY 2024
Army ........................................................ 146,040 145,709 119,240 123,741 164,025 167,671 171,228 Navy ........................................................ 179,485 187,516 160,836 162,033 207,514 214,677 217,107 Air Force .................................................. 171,691 174,869 158,135 163,054 209,432 212,467 214,959 Defense-Wide .......................................... 102,403 108,055 106,313 108,823 126,026 126,735 133,426
Total Current Dollars ......................... 599,619 616,149 544,524 557,651 706,996 721,549 736,720
Army ........................................................ 152,371 148,742 119,240 121,088 157,124 157,127 156,979 Navy ........................................................ 187,026 191,090 160,836 158,845 199,259 201,777 199,774 Air Force .................................................. 179,212 178,204 158,135 159,964 201,333 199,969 198,140 Defense-Wide .......................................... 106,860 110,375 106,313 106,279 120,201 117,946 121,258
Total Constant Dollars ....................... 625,469 628,412 544,524 546,175 677,917 676,819 676,151
Army ........................................................ 15.3 -2.4 -19.8 1.6 29.8 0.0 -0.1 Navy ........................................................ 11.6 2.2 -15.8 -1.2 25.4 1.3 -1.0 Air Force .................................................. 13.0 -0.6 -11.3 1.2 25.9 -0.7 -0.9
Total Real Growth .............................. 12.0 0.5 -13.4 0.3 24.1 -0.2 -0.1
Table 6-26: DEPARTMENT OF DEFENSE BASE, DISCRETIONARY BUDGET AUTHORITY (Continued)
Percent Real Growth (%)
BY MILITARY DEPARTMENT(Dollars in Millions)
Military Department
Current Dollars
FY 2020 Constant Dollars
245
This Page Intentionally Left Blank
246
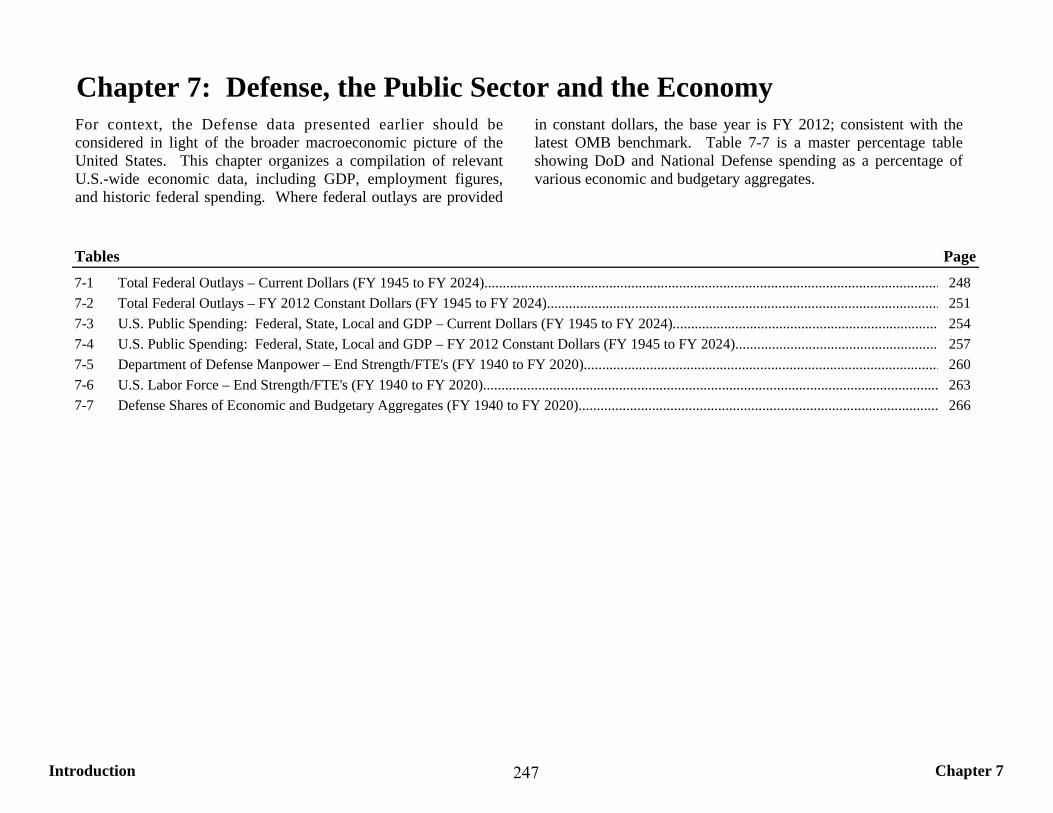
Introduction Chapter 7
Chapter 7: Defense, the Public Sector and the Economy
Tables Page7-1 Total Federal Outlays – Current Dollars (FY 1945 to FY 2024)............................................................................................................................ 2487-2 Total Federal Outlays – FY 2012 Constant Dollars (FY 1945 to FY 2024)........................................................................................................... 2517-3 U.S. Public Spending: Federal, State, Local and GDP – Current Dollars (FY 1945 to FY 2024)......................................................................... 2547-4 U.S. Public Spending: Federal, State, Local and GDP – FY 2012 Constant Dollars (FY 1945 to FY 2024)........................................................ 2577-5 Department of Defense Manpower – End Strength/FTE's (FY 1940 to FY 2020)................................................................................................. 2607-6 U.S. Labor Force – End Strength/FTE's (FY 1940 to FY 2020)............................................................................................................................ 2637-7 Defense Shares of Economic and Budgetary Aggregates (FY 1940 to FY 2020).................................................................................................. 266
For context, the Defense data presented earlier should beconsidered in light of the broader macroeconomic picture of theUnited States. This chapter organizes a compilation of relevantU.S.-wide economic data, including GDP, employment figures,and historic federal spending. Where federal outlays are provided
in constant dollars, the base year is FY 2012; consistent with thelatest OMB benchmark. Table 7-7 is a master percentage tableshowing DoD and National Defense spending as a percentage ofvarious economic and budgetary aggregates.
247
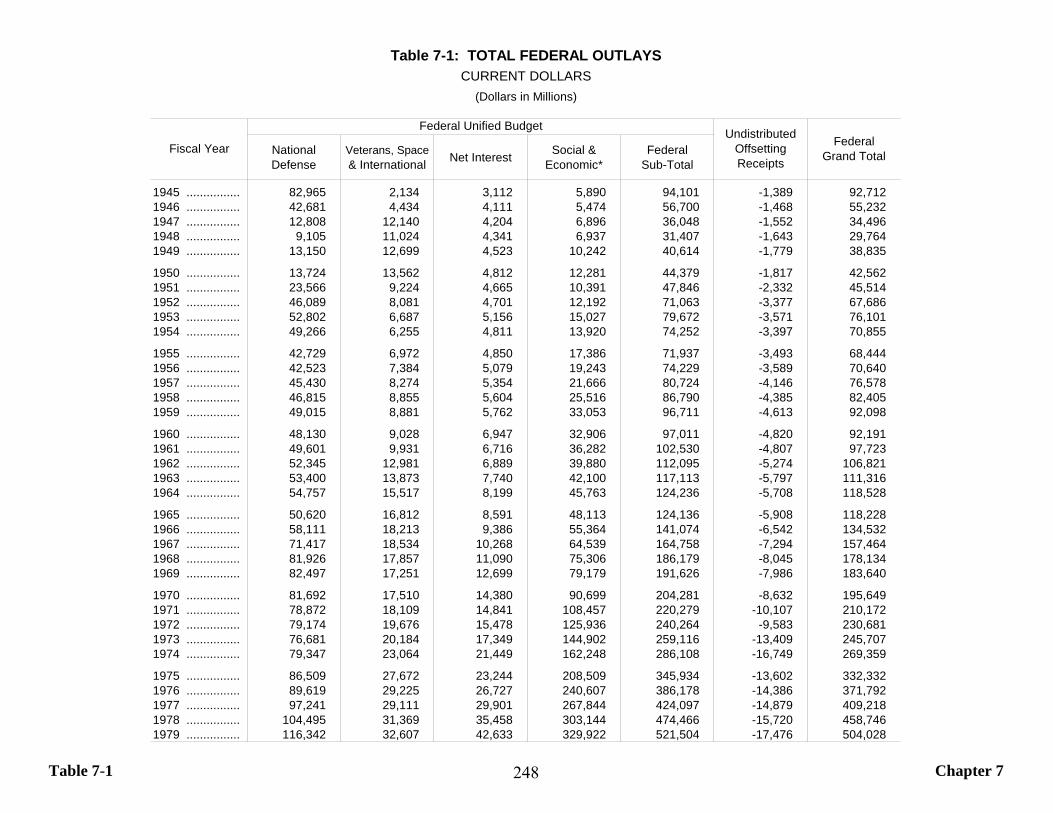
Table 7-1 Chapter 7
NationalDefense
Veterans, Space & International Net Interest Social &
Economic*Federal
Sub-Total
1945 ................ 82,965 2,134 3,112 5,890 94,101 -1,389 92,7121946 ................ 42,681 4,434 4,111 5,474 56,700 -1,468 55,2321947 ................ 12,808 12,140 4,204 6,896 36,048 -1,552 34,4961948 ................ 9,105 11,024 4,341 6,937 31,407 -1,643 29,7641949 ................ 13,150 12,699 4,523 10,242 40,614 -1,779 38,835
1950 ................ 13,724 13,562 4,812 12,281 44,379 -1,817 42,5621951 ................ 23,566 9,224 4,665 10,391 47,846 -2,332 45,5141952 ................ 46,089 8,081 4,701 12,192 71,063 -3,377 67,6861953 ................ 52,802 6,687 5,156 15,027 79,672 -3,571 76,1011954 ................ 49,266 6,255 4,811 13,920 74,252 -3,397 70,855
1955 ................ 42,729 6,972 4,850 17,386 71,937 -3,493 68,4441956 ................ 42,523 7,384 5,079 19,243 74,229 -3,589 70,6401957 ................ 45,430 8,274 5,354 21,666 80,724 -4,146 76,5781958 ................ 46,815 8,855 5,604 25,516 86,790 -4,385 82,4051959 ................ 49,015 8,881 5,762 33,053 96,711 -4,613 92,098
1960 ................ 48,130 9,028 6,947 32,906 97,011 -4,820 92,1911961 ................ 49,601 9,931 6,716 36,282 102,530 -4,807 97,7231962 ................ 52,345 12,981 6,889 39,880 112,095 -5,274 106,8211963 ................ 53,400 13,873 7,740 42,100 117,113 -5,797 111,3161964 ................ 54,757 15,517 8,199 45,763 124,236 -5,708 118,528
1965 ................ 50,620 16,812 8,591 48,113 124,136 -5,908 118,2281966 ................ 58,111 18,213 9,386 55,364 141,074 -6,542 134,5321967 ................ 71,417 18,534 10,268 64,539 164,758 -7,294 157,4641968 ................ 81,926 17,857 11,090 75,306 186,179 -8,045 178,1341969 ................ 82,497 17,251 12,699 79,179 191,626 -7,986 183,640
1970 ................ 81,692 17,510 14,380 90,699 204,281 -8,632 195,6491971 ................ 78,872 18,109 14,841 108,457 220,279 -10,107 210,1721972 ................ 79,174 19,676 15,478 125,936 240,264 -9,583 230,6811973 ................ 76,681 20,184 17,349 144,902 259,116 -13,409 245,7071974 ................ 79,347 23,064 21,449 162,248 286,108 -16,749 269,359
1975 ................ 86,509 27,672 23,244 208,509 345,934 -13,602 332,3321976 ................ 89,619 29,225 26,727 240,607 386,178 -14,386 371,7921977 ................ 97,241 29,111 29,901 267,844 424,097 -14,879 409,2181978 ................ 104,495 31,369 35,458 303,144 474,466 -15,720 458,7461979 ................ 116,342 32,607 42,633 329,922 521,504 -17,476 504,028
Table 7-1: TOTAL FEDERAL OUTLAYSCURRENT DOLLARS
(Dollars in Millions)
Federal Unified Budget Undistributed Offsetting Receipts
FederalGrand TotalFiscal Year
248
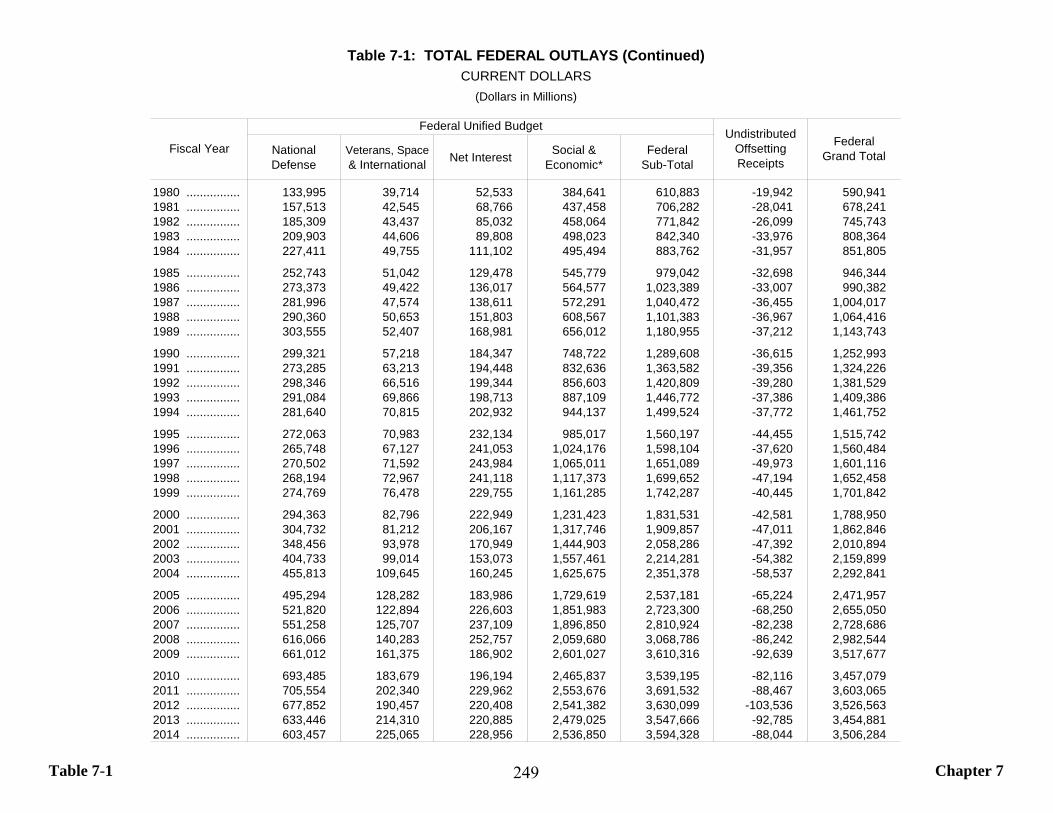
Table 7-1 Chapter 7
NationalDefense
Veterans, Space & International Net Interest Social &
Economic*Federal
Sub-Total
1980 ................ 133,995 39,714 52,533 384,641 610,883 -19,942 590,9411981 ................ 157,513 42,545 68,766 437,458 706,282 -28,041 678,2411982 ................ 185,309 43,437 85,032 458,064 771,842 -26,099 745,7431983 ................ 209,903 44,606 89,808 498,023 842,340 -33,976 808,3641984 ................ 227,411 49,755 111,102 495,494 883,762 -31,957 851,805
1985 ................ 252,743 51,042 129,478 545,779 979,042 -32,698 946,3441986 ................ 273,373 49,422 136,017 564,577 1,023,389 -33,007 990,3821987 ................ 281,996 47,574 138,611 572,291 1,040,472 -36,455 1,004,0171988 ................ 290,360 50,653 151,803 608,567 1,101,383 -36,967 1,064,4161989 ................ 303,555 52,407 168,981 656,012 1,180,955 -37,212 1,143,743
1990 ................ 299,321 57,218 184,347 748,722 1,289,608 -36,615 1,252,9931991 ................ 273,285 63,213 194,448 832,636 1,363,582 -39,356 1,324,2261992 ................ 298,346 66,516 199,344 856,603 1,420,809 -39,280 1,381,5291993 ................ 291,084 69,866 198,713 887,109 1,446,772 -37,386 1,409,3861994 ................ 281,640 70,815 202,932 944,137 1,499,524 -37,772 1,461,752
1995 ................ 272,063 70,983 232,134 985,017 1,560,197 -44,455 1,515,7421996 ................ 265,748 67,127 241,053 1,024,176 1,598,104 -37,620 1,560,4841997 ................ 270,502 71,592 243,984 1,065,011 1,651,089 -49,973 1,601,1161998 ................ 268,194 72,967 241,118 1,117,373 1,699,652 -47,194 1,652,4581999 ................ 274,769 76,478 229,755 1,161,285 1,742,287 -40,445 1,701,842
2000 ................ 294,363 82,796 222,949 1,231,423 1,831,531 -42,581 1,788,9502001 ................ 304,732 81,212 206,167 1,317,746 1,909,857 -47,011 1,862,8462002 ................ 348,456 93,978 170,949 1,444,903 2,058,286 -47,392 2,010,8942003 ................ 404,733 99,014 153,073 1,557,461 2,214,281 -54,382 2,159,8992004 ................ 455,813 109,645 160,245 1,625,675 2,351,378 -58,537 2,292,841
2005 ................ 495,294 128,282 183,986 1,729,619 2,537,181 -65,224 2,471,9572006 ................ 521,820 122,894 226,603 1,851,983 2,723,300 -68,250 2,655,0502007 ................ 551,258 125,707 237,109 1,896,850 2,810,924 -82,238 2,728,6862008 ................ 616,066 140,283 252,757 2,059,680 3,068,786 -86,242 2,982,5442009 ................ 661,012 161,375 186,902 2,601,027 3,610,316 -92,639 3,517,677
2010 ................ 693,485 183,679 196,194 2,465,837 3,539,195 -82,116 3,457,0792011 ................ 705,554 202,340 229,962 2,553,676 3,691,532 -88,467 3,603,0652012 ................ 677,852 190,457 220,408 2,541,382 3,630,099 -103,536 3,526,5632013 ................ 633,446 214,310 220,885 2,479,025 3,547,666 -92,785 3,454,8812014 ................ 603,457 225,065 228,956 2,536,850 3,594,328 -88,044 3,506,284
Table 7-1: TOTAL FEDERAL OUTLAYS (Continued)CURRENT DOLLARS
(Dollars in Millions)
Fiscal Year
Federal Unified Budget Undistributed Offsetting Receipts
FederalGrand Total
249
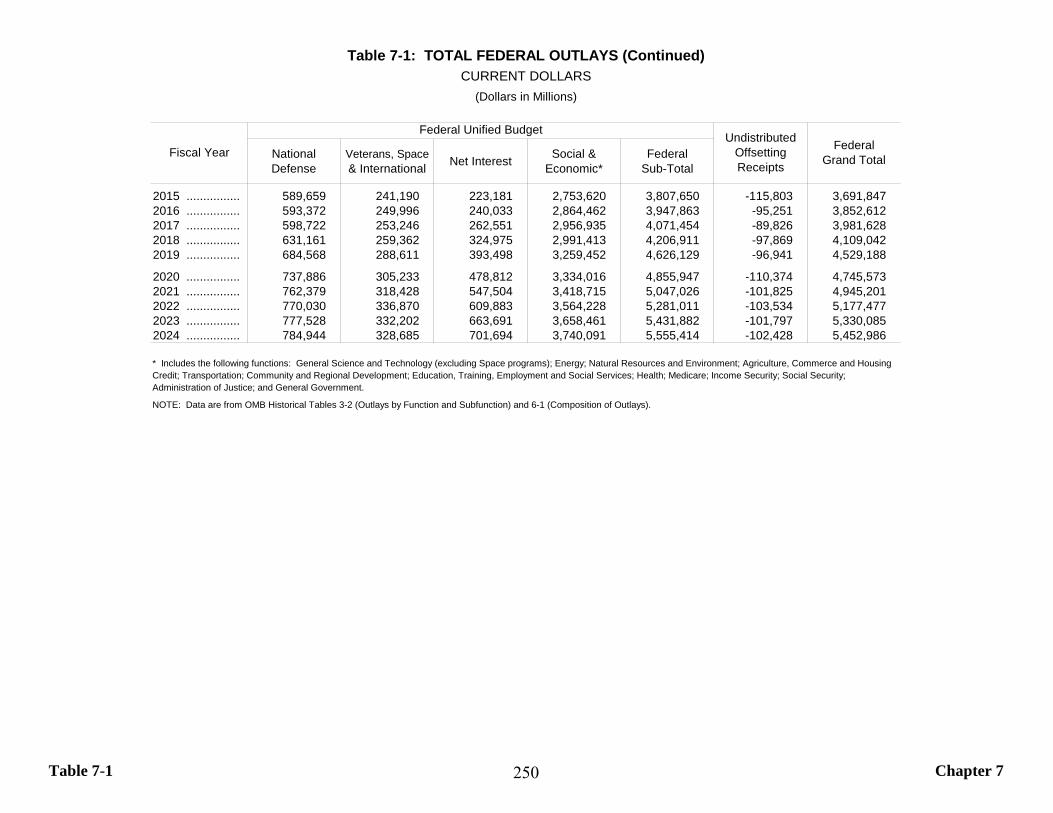
Table 7-1 Chapter 7
NationalDefense
Veterans, Space & International Net Interest Social &
Economic*Federal
Sub-Total
2015 ................ 589,659 241,190 223,181 2,753,620 3,807,650 -115,803 3,691,8472016 ................ 593,372 249,996 240,033 2,864,462 3,947,863 -95,251 3,852,6122017 ................ 598,722 253,246 262,551 2,956,935 4,071,454 -89,826 3,981,6282018 ................ 631,161 259,362 324,975 2,991,413 4,206,911 -97,869 4,109,0422019 ................ 684,568 288,611 393,498 3,259,452 4,626,129 -96,941 4,529,188
2020 ................ 737,886 305,233 478,812 3,334,016 4,855,947 -110,374 4,745,5732021 ................ 762,379 318,428 547,504 3,418,715 5,047,026 -101,825 4,945,2012022 ................ 770,030 336,870 609,883 3,564,228 5,281,011 -103,534 5,177,4772023 ................ 777,528 332,202 663,691 3,658,461 5,431,882 -101,797 5,330,0852024 ................ 784,944 328,685 701,694 3,740,091 5,555,414 -102,428 5,452,986
NOTE: Data are from OMB Historical Tables 3-2 (Outlays by Function and Subfunction) and 6-1 (Composition of Outlays).
* Includes the following functions: General Science and Technology (excluding Space programs); Energy; Natural Resources and Environment; Agriculture, Commerce and Housing Credit; Transportation; Community and Regional Development; Education, Training, Employment and Social Services; Health; Medicare; Income Security; Social Security; Administration of Justice; and General Government.
Table 7-1: TOTAL FEDERAL OUTLAYS (Continued)CURRENT DOLLARS
(Dollars in Millions)
Fiscal Year
Federal Unified Budget Undistributed Offsetting Receipts
FederalGrand Total
250
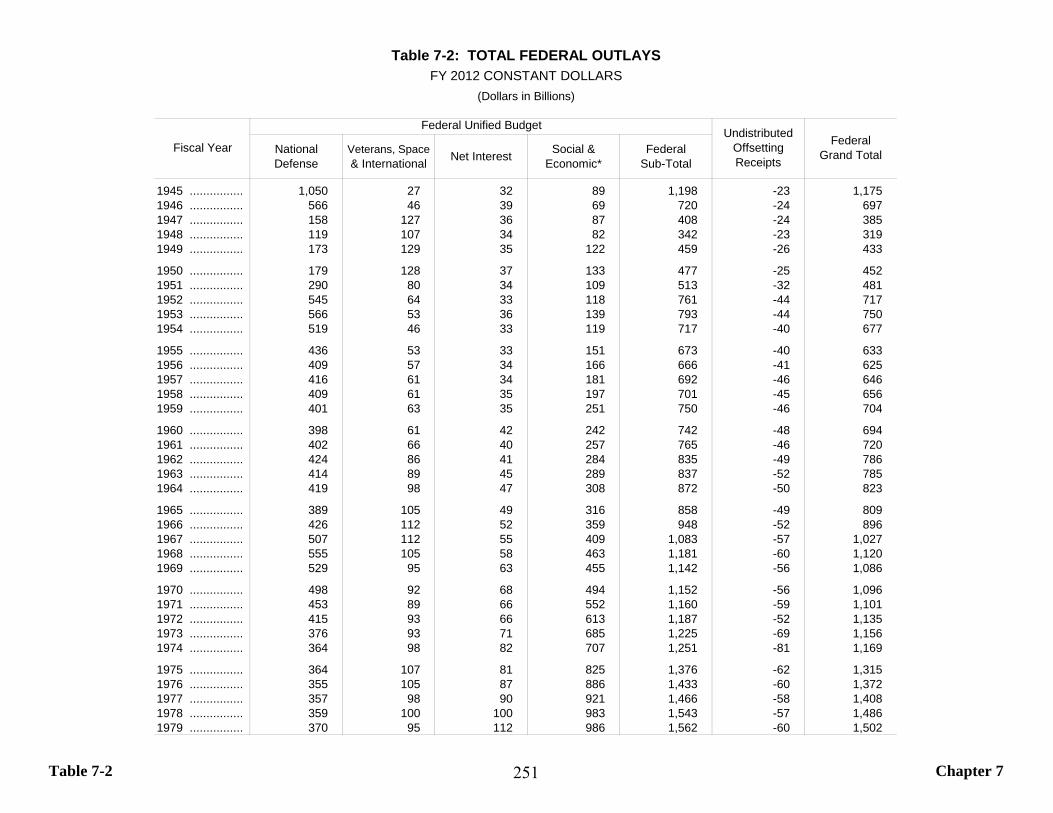
Table 7-2 Chapter 7
NationalDefense
Veterans, Space & International Net Interest Social &
Economic*Federal
Sub-Total
1945 ................ 1,050 27 32 89 1,198 -23 1,1751946 ................ 566 46 39 69 720 -24 6971947 ................ 158 127 36 87 408 -24 3851948 ................ 119 107 34 82 342 -23 3191949 ................ 173 129 35 122 459 -26 433
1950 ................ 179 128 37 133 477 -25 4521951 ................ 290 80 34 109 513 -32 4811952 ................ 545 64 33 118 761 -44 7171953 ................ 566 53 36 139 793 -44 7501954 ................ 519 46 33 119 717 -40 677
1955 ................ 436 53 33 151 673 -40 6331956 ................ 409 57 34 166 666 -41 6251957 ................ 416 61 34 181 692 -46 6461958 ................ 409 61 35 197 701 -45 6561959 ................ 401 63 35 251 750 -46 704
1960 ................ 398 61 42 242 742 -48 6941961 ................ 402 66 40 257 765 -46 7201962 ................ 424 86 41 284 835 -49 7861963 ................ 414 89 45 289 837 -52 7851964 ................ 419 98 47 308 872 -50 823
1965 ................ 389 105 49 316 858 -49 8091966 ................ 426 112 52 359 948 -52 8961967 ................ 507 112 55 409 1,083 -57 1,0271968 ................ 555 105 58 463 1,181 -60 1,1201969 ................ 529 95 63 455 1,142 -56 1,086
1970 ................ 498 92 68 494 1,152 -56 1,0961971 ................ 453 89 66 552 1,160 -59 1,1011972 ................ 415 93 66 613 1,187 -52 1,1351973 ................ 376 93 71 685 1,225 -69 1,1561974 ................ 364 98 82 707 1,251 -81 1,169
1975 ................ 364 107 81 825 1,376 -62 1,3151976 ................ 355 105 87 886 1,433 -60 1,3721977 ................ 357 98 90 921 1,466 -58 1,4081978 ................ 359 100 100 983 1,543 -57 1,4861979 ................ 370 95 112 986 1,562 -60 1,502
Table 7-2: TOTAL FEDERAL OUTLAYSFY 2012 CONSTANT DOLLARS
(Dollars in Billions)
Federal Unified Budget Undistributed Offsetting Receipts
FederalGrand TotalFiscal Year
251
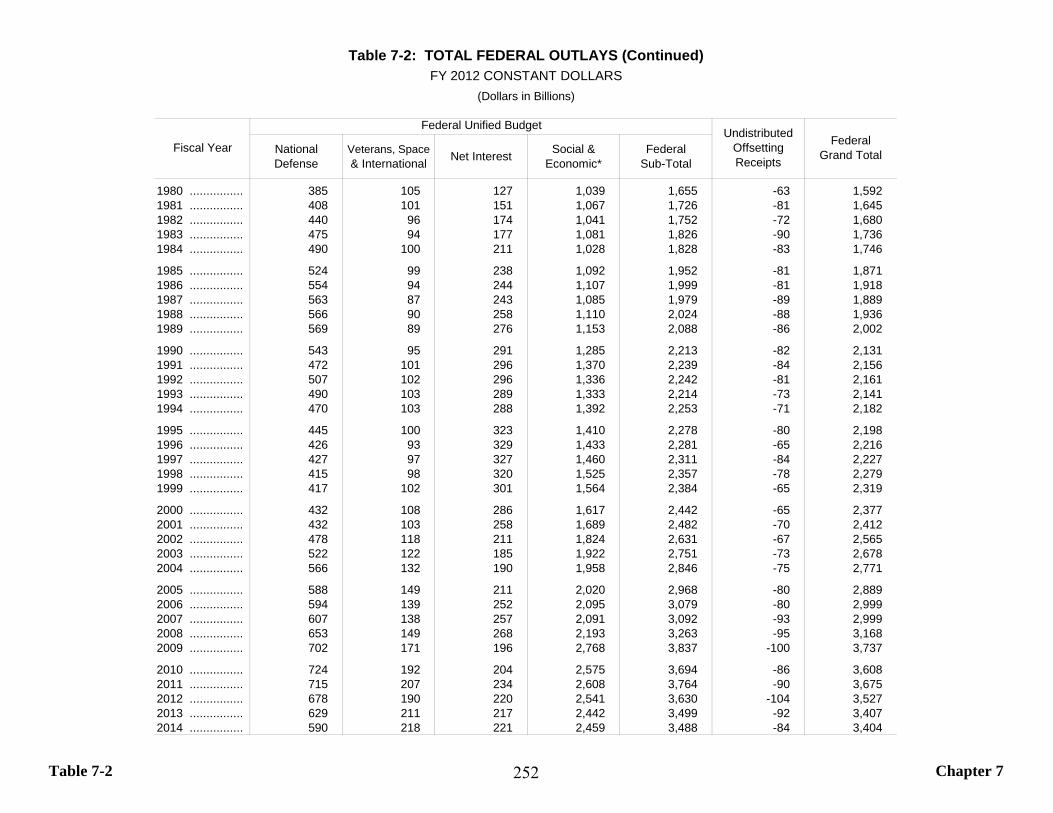
Table 7-2 Chapter 7
NationalDefense
Veterans, Space & International Net Interest Social &
Economic*Federal
Sub-Total
1980 ................ 385 105 127 1,039 1,655 -63 1,5921981 ................ 408 101 151 1,067 1,726 -81 1,6451982 ................ 440 96 174 1,041 1,752 -72 1,6801983 ................ 475 94 177 1,081 1,826 -90 1,7361984 ................ 490 100 211 1,028 1,828 -83 1,746
1985 ................ 524 99 238 1,092 1,952 -81 1,8711986 ................ 554 94 244 1,107 1,999 -81 1,9181987 ................ 563 87 243 1,085 1,979 -89 1,8891988 ................ 566 90 258 1,110 2,024 -88 1,9361989 ................ 569 89 276 1,153 2,088 -86 2,002
1990 ................ 543 95 291 1,285 2,213 -82 2,1311991 ................ 472 101 296 1,370 2,239 -84 2,1561992 ................ 507 102 296 1,336 2,242 -81 2,1611993 ................ 490 103 289 1,333 2,214 -73 2,1411994 ................ 470 103 288 1,392 2,253 -71 2,182
1995 ................ 445 100 323 1,410 2,278 -80 2,1981996 ................ 426 93 329 1,433 2,281 -65 2,2161997 ................ 427 97 327 1,460 2,311 -84 2,2271998 ................ 415 98 320 1,525 2,357 -78 2,2791999 ................ 417 102 301 1,564 2,384 -65 2,319
2000 ................ 432 108 286 1,617 2,442 -65 2,3772001 ................ 432 103 258 1,689 2,482 -70 2,4122002 ................ 478 118 211 1,824 2,631 -67 2,5652003 ................ 522 122 185 1,922 2,751 -73 2,6782004 ................ 566 132 190 1,958 2,846 -75 2,771
2005 ................ 588 149 211 2,020 2,968 -80 2,8892006 ................ 594 139 252 2,095 3,079 -80 2,9992007 ................ 607 138 257 2,091 3,092 -93 2,9992008 ................ 653 149 268 2,193 3,263 -95 3,1682009 ................ 702 171 196 2,768 3,837 -100 3,737
2010 ................ 724 192 204 2,575 3,694 -86 3,6082011 ................ 715 207 234 2,608 3,764 -90 3,6752012 ................ 678 190 220 2,541 3,630 -104 3,5272013 ................ 629 211 217 2,442 3,499 -92 3,4072014 ................ 590 218 221 2,459 3,488 -84 3,404
Table 7-2: TOTAL FEDERAL OUTLAYS (Continued)FY 2012 CONSTANT DOLLARS
(Dollars in Billions)
Fiscal Year
Federal Unified Budget Undistributed Offsetting Receipts
FederalGrand Total
252
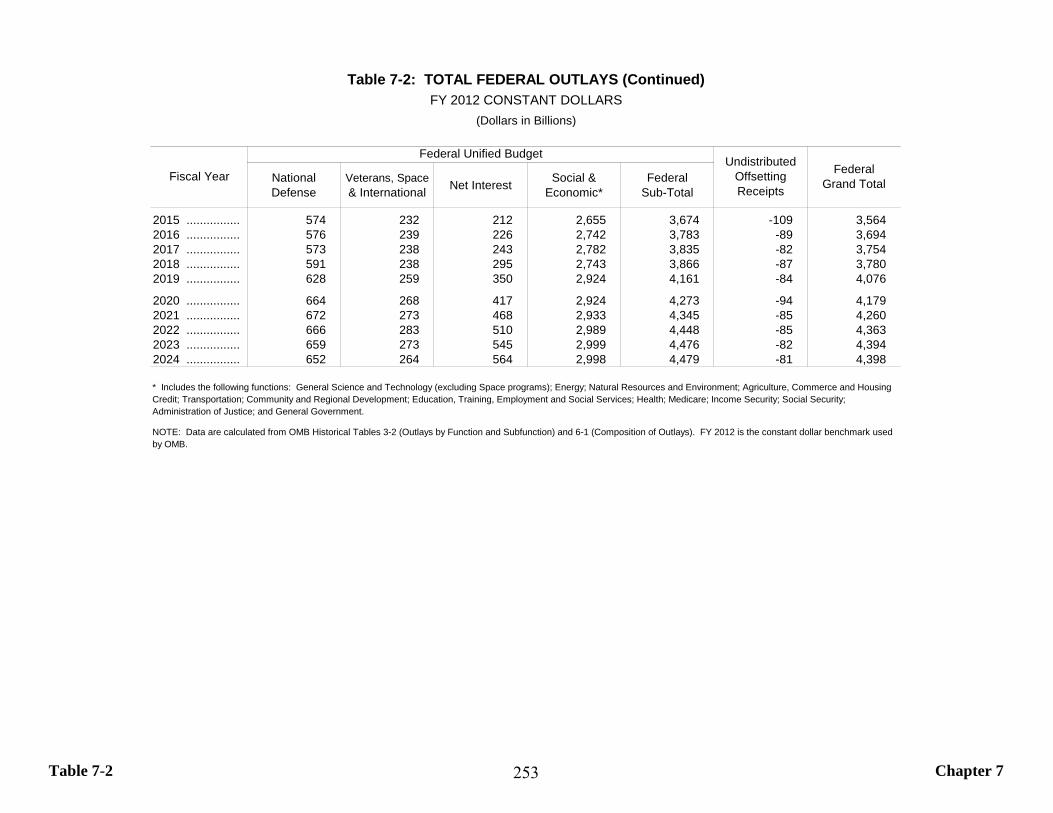
Table 7-2 Chapter 7
NationalDefense
Veterans, Space & International Net Interest Social &
Economic*Federal
Sub-Total
2015 ................ 574 232 212 2,655 3,674 -109 3,5642016 ................ 576 239 226 2,742 3,783 -89 3,6942017 ................ 573 238 243 2,782 3,835 -82 3,7542018 ................ 591 238 295 2,743 3,866 -87 3,7802019 ................ 628 259 350 2,924 4,161 -84 4,076
2020 ................ 664 268 417 2,924 4,273 -94 4,1792021 ................ 672 273 468 2,933 4,345 -85 4,2602022 ................ 666 283 510 2,989 4,448 -85 4,3632023 ................ 659 273 545 2,999 4,476 -82 4,3942024 ................ 652 264 564 2,998 4,479 -81 4,398
NOTE: Data are calculated from OMB Historical Tables 3-2 (Outlays by Function and Subfunction) and 6-1 (Composition of Outlays). FY 2012 is the constant dollar benchmark used by OMB.
* Includes the following functions: General Science and Technology (excluding Space programs); Energy; Natural Resources and Environment; Agriculture, Commerce and Housing Credit; Transportation; Community and Regional Development; Education, Training, Employment and Social Services; Health; Medicare; Income Security; Social Security; Administration of Justice; and General Government.
Table 7-2: TOTAL FEDERAL OUTLAYS (Continued)FY 2012 CONSTANT DOLLARS
(Dollars in Billions)
Fiscal Year
Federal Unified Budget Undistributed Offsetting Receipts
FederalGrand Total
253
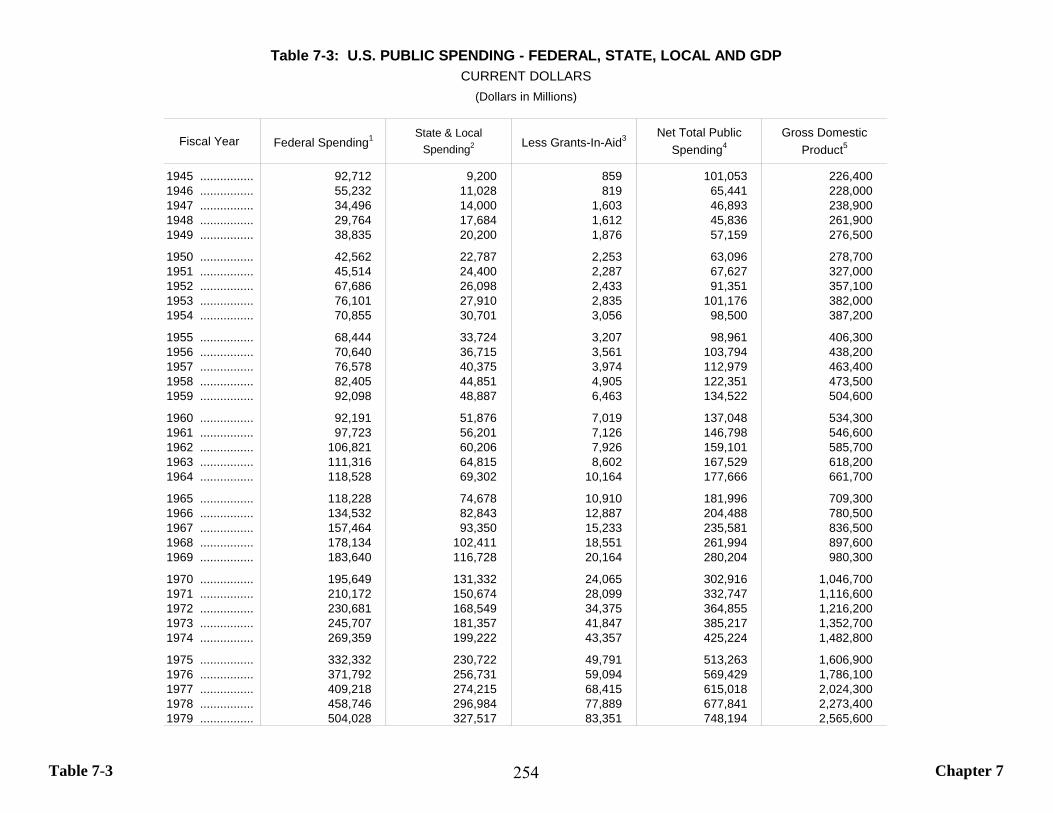
Table 7-3 Chapter 7
Fiscal Year Federal Spending1 State & LocalSpending2 Less Grants-In-Aid3 Net Total Public
Spending4Gross Domestic
Product5
1945 ................ 92,712 9,200 859 101,053 226,4001946 ................ 55,232 11,028 819 65,441 228,0001947 ................ 34,496 14,000 1,603 46,893 238,9001948 ................ 29,764 17,684 1,612 45,836 261,9001949 ................ 38,835 20,200 1,876 57,159 276,500
1950 ................ 42,562 22,787 2,253 63,096 278,7001951 ................ 45,514 24,400 2,287 67,627 327,0001952 ................ 67,686 26,098 2,433 91,351 357,1001953 ................ 76,101 27,910 2,835 101,176 382,0001954 ................ 70,855 30,701 3,056 98,500 387,200
1955 ................ 68,444 33,724 3,207 98,961 406,3001956 ................ 70,640 36,715 3,561 103,794 438,2001957 ................ 76,578 40,375 3,974 112,979 463,4001958 ................ 82,405 44,851 4,905 122,351 473,5001959 ................ 92,098 48,887 6,463 134,522 504,600
1960 ................ 92,191 51,876 7,019 137,048 534,3001961 ................ 97,723 56,201 7,126 146,798 546,6001962 ................ 106,821 60,206 7,926 159,101 585,7001963 ................ 111,316 64,815 8,602 167,529 618,2001964 ................ 118,528 69,302 10,164 177,666 661,700
1965 ................ 118,228 74,678 10,910 181,996 709,3001966 ................ 134,532 82,843 12,887 204,488 780,5001967 ................ 157,464 93,350 15,233 235,581 836,5001968 ................ 178,134 102,411 18,551 261,994 897,6001969 ................ 183,640 116,728 20,164 280,204 980,300
1970 ................ 195,649 131,332 24,065 302,916 1,046,7001971 ................ 210,172 150,674 28,099 332,747 1,116,6001972 ................ 230,681 168,549 34,375 364,855 1,216,2001973 ................ 245,707 181,357 41,847 385,217 1,352,7001974 ................ 269,359 199,222 43,357 425,224 1,482,800
1975 ................ 332,332 230,722 49,791 513,263 1,606,9001976 ................ 371,792 256,731 59,094 569,429 1,786,1001977 ................ 409,218 274,215 68,415 615,018 2,024,3001978 ................ 458,746 296,984 77,889 677,841 2,273,4001979 ................ 504,028 327,517 83,351 748,194 2,565,600
Table 7-3: U.S. PUBLIC SPENDING - FEDERAL, STATE, LOCAL AND GDPCURRENT DOLLARS
(Dollars in Millions)
254
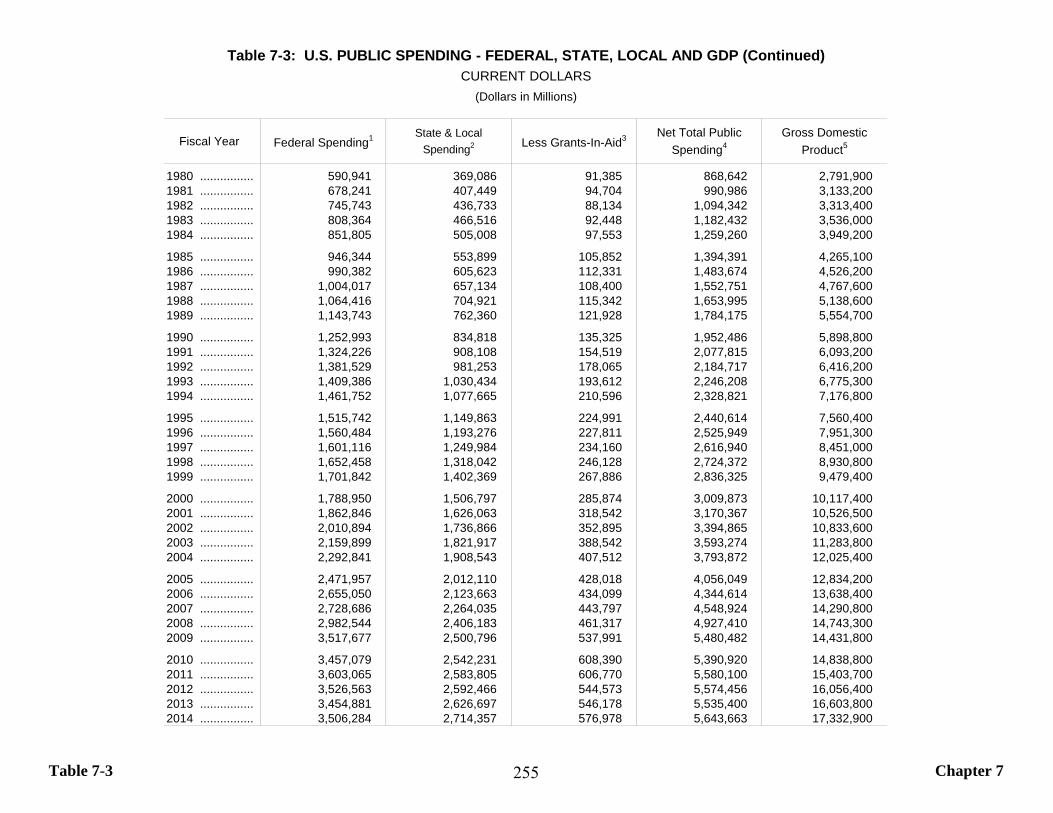
Table 7-3 Chapter 7
Fiscal Year Federal Spending1 State & LocalSpending2 Less Grants-In-Aid3 Net Total Public
Spending4Gross Domestic
Product5
1980 ................ 590,941 369,086 91,385 868,642 2,791,9001981 ................ 678,241 407,449 94,704 990,986 3,133,2001982 ................ 745,743 436,733 88,134 1,094,342 3,313,4001983 ................ 808,364 466,516 92,448 1,182,432 3,536,0001984 ................ 851,805 505,008 97,553 1,259,260 3,949,200
1985 ................ 946,344 553,899 105,852 1,394,391 4,265,1001986 ................ 990,382 605,623 112,331 1,483,674 4,526,2001987 ................ 1,004,017 657,134 108,400 1,552,751 4,767,6001988 ................ 1,064,416 704,921 115,342 1,653,995 5,138,6001989 ................ 1,143,743 762,360 121,928 1,784,175 5,554,700
1990 ................ 1,252,993 834,818 135,325 1,952,486 5,898,8001991 ................ 1,324,226 908,108 154,519 2,077,815 6,093,2001992 ................ 1,381,529 981,253 178,065 2,184,717 6,416,2001993 ................ 1,409,386 1,030,434 193,612 2,246,208 6,775,3001994 ................ 1,461,752 1,077,665 210,596 2,328,821 7,176,800
1995 ................ 1,515,742 1,149,863 224,991 2,440,614 7,560,4001996 ................ 1,560,484 1,193,276 227,811 2,525,949 7,951,3001997 ................ 1,601,116 1,249,984 234,160 2,616,940 8,451,0001998 ................ 1,652,458 1,318,042 246,128 2,724,372 8,930,8001999 ................ 1,701,842 1,402,369 267,886 2,836,325 9,479,400
2000 ................ 1,788,950 1,506,797 285,874 3,009,873 10,117,4002001 ................ 1,862,846 1,626,063 318,542 3,170,367 10,526,5002002 ................ 2,010,894 1,736,866 352,895 3,394,865 10,833,6002003 ................ 2,159,899 1,821,917 388,542 3,593,274 11,283,8002004 ................ 2,292,841 1,908,543 407,512 3,793,872 12,025,400
2005 ................ 2,471,957 2,012,110 428,018 4,056,049 12,834,2002006 ................ 2,655,050 2,123,663 434,099 4,344,614 13,638,4002007 ................ 2,728,686 2,264,035 443,797 4,548,924 14,290,8002008 ................ 2,982,544 2,406,183 461,317 4,927,410 14,743,3002009 ................ 3,517,677 2,500,796 537,991 5,480,482 14,431,800
2010 ................ 3,457,079 2,542,231 608,390 5,390,920 14,838,8002011 ................ 3,603,065 2,583,805 606,770 5,580,100 15,403,7002012 ................ 3,526,563 2,592,466 544,573 5,574,456 16,056,4002013 ................ 3,454,881 2,626,697 546,178 5,535,400 16,603,8002014 ................ 3,506,284 2,714,357 576,978 5,643,663 17,332,900
Table 7-3: U.S. PUBLIC SPENDING - FEDERAL, STATE, LOCAL AND GDP (Continued)CURRENT DOLLARS
(Dollars in Millions)
255
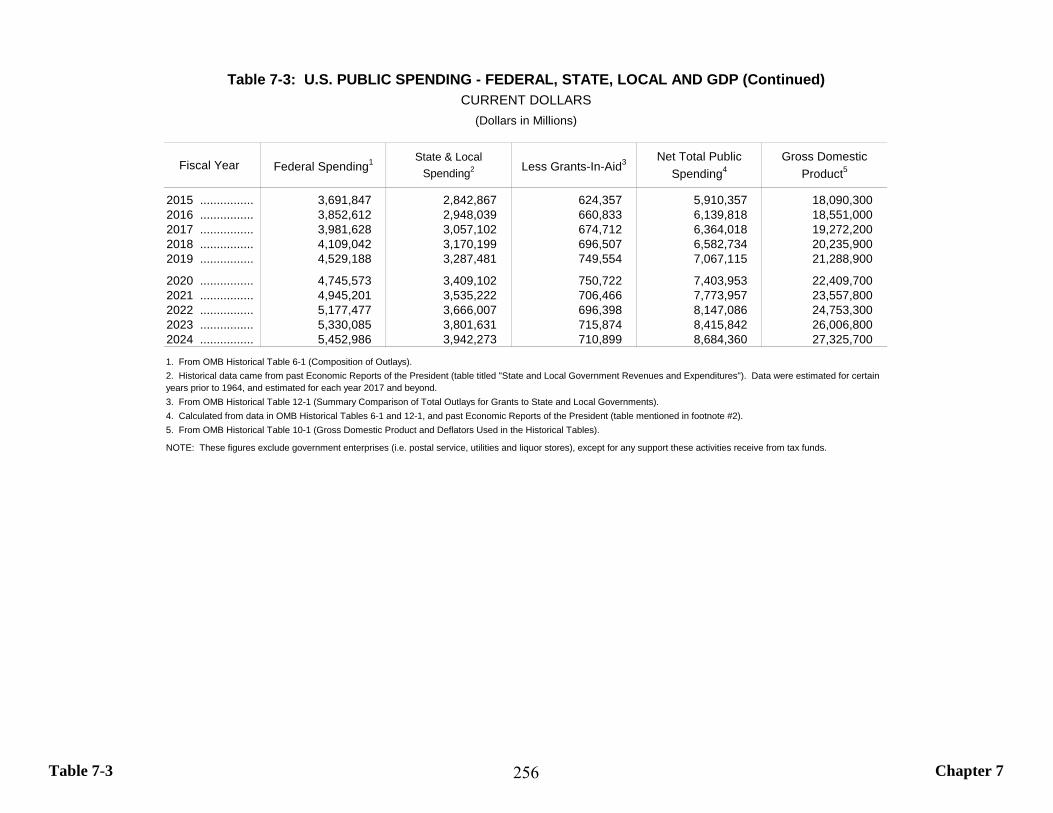
Table 7-3 Chapter 7
Fiscal Year Federal Spending1 State & LocalSpending2 Less Grants-In-Aid3 Net Total Public
Spending4Gross Domestic
Product5
2015 ................ 3,691,847 2,842,867 624,357 5,910,357 18,090,3002016 ................ 3,852,612 2,948,039 660,833 6,139,818 18,551,0002017 ................ 3,981,628 3,057,102 674,712 6,364,018 19,272,2002018 ................ 4,109,042 3,170,199 696,507 6,582,734 20,235,9002019 ................ 4,529,188 3,287,481 749,554 7,067,115 21,288,900
2020 ................ 4,745,573 3,409,102 750,722 7,403,953 22,409,7002021 ................ 4,945,201 3,535,222 706,466 7,773,957 23,557,8002022 ................ 5,177,477 3,666,007 696,398 8,147,086 24,753,3002023 ................ 5,330,085 3,801,631 715,874 8,415,842 26,006,8002024 ................ 5,452,986 3,942,273 710,899 8,684,360 27,325,700
1. From OMB Historical Table 6-1 (Composition of Outlays).
3. From OMB Historical Table 12-1 (Summary Comparison of Total Outlays for Grants to State and Local Governments).4. Calculated from data in OMB Historical Tables 6-1 and 12-1, and past Economic Reports of the President (table mentioned in footnote #2).5. From OMB Historical Table 10-1 (Gross Domestic Product and Deflators Used in the Historical Tables).
NOTE: These figures exclude government enterprises (i.e. postal service, utilities and liquor stores), except for any support these activities receive from tax funds.
Table 7-3: U.S. PUBLIC SPENDING - FEDERAL, STATE, LOCAL AND GDP (Continued)CURRENT DOLLARS
(Dollars in Millions)
2. Historical data came from past Economic Reports of the President (table titled "State and Local Government Revenues and Expenditures"). Data were estimated for certain years prior to 1964, and estimated for each year 2017 and beyond.
256
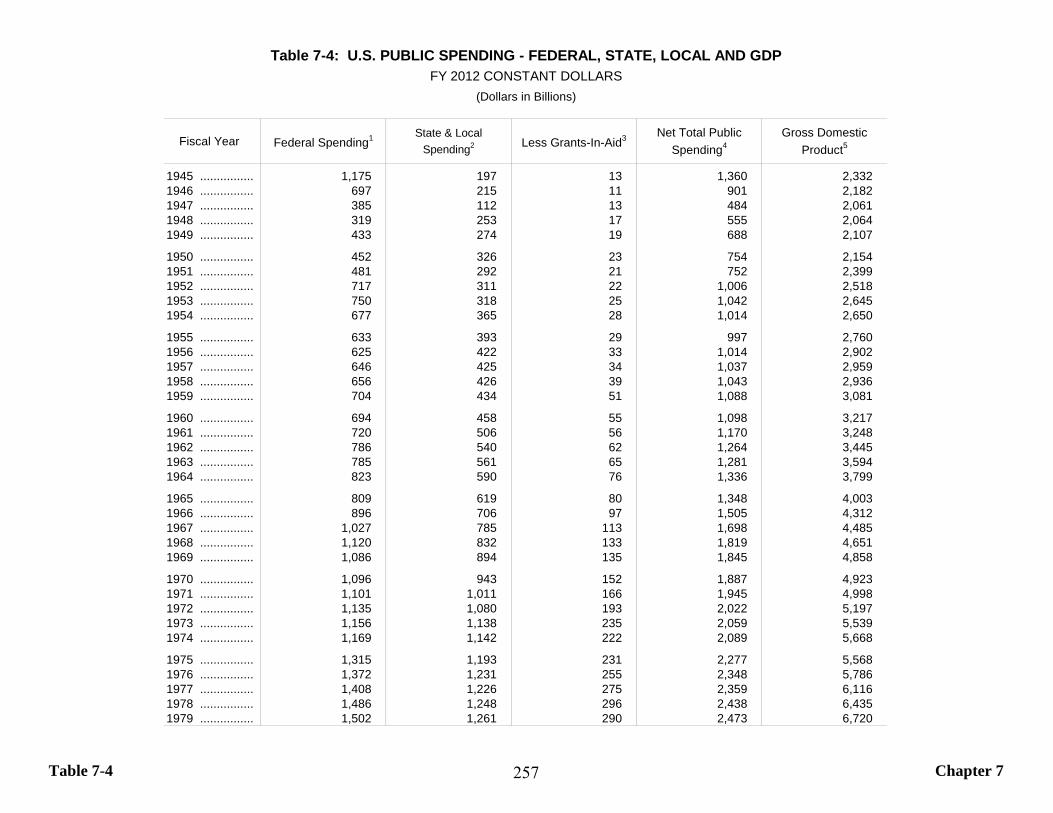
Table 7-4 Chapter 7
Fiscal Year Federal Spending1 State & LocalSpending2 Less Grants-In-Aid3 Net Total Public
Spending4Gross Domestic
Product5
1945 ................ 1,175 197 13 1,360 2,3321946 ................ 697 215 11 901 2,1821947 ................ 385 112 13 484 2,0611948 ................ 319 253 17 555 2,0641949 ................ 433 274 19 688 2,107
1950 ................ 452 326 23 754 2,1541951 ................ 481 292 21 752 2,3991952 ................ 717 311 22 1,006 2,5181953 ................ 750 318 25 1,042 2,6451954 ................ 677 365 28 1,014 2,650
1955 ................ 633 393 29 997 2,7601956 ................ 625 422 33 1,014 2,9021957 ................ 646 425 34 1,037 2,9591958 ................ 656 426 39 1,043 2,9361959 ................ 704 434 51 1,088 3,081
1960 ................ 694 458 55 1,098 3,2171961 ................ 720 506 56 1,170 3,2481962 ................ 786 540 62 1,264 3,4451963 ................ 785 561 65 1,281 3,5941964 ................ 823 590 76 1,336 3,799
1965 ................ 809 619 80 1,348 4,0031966 ................ 896 706 97 1,505 4,3121967 ................ 1,027 785 113 1,698 4,4851968 ................ 1,120 832 133 1,819 4,6511969 ................ 1,086 894 135 1,845 4,858
1970 ................ 1,096 943 152 1,887 4,9231971 ................ 1,101 1,011 166 1,945 4,9981972 ................ 1,135 1,080 193 2,022 5,1971973 ................ 1,156 1,138 235 2,059 5,5391974 ................ 1,169 1,142 222 2,089 5,668
1975 ................ 1,315 1,193 231 2,277 5,5681976 ................ 1,372 1,231 255 2,348 5,7861977 ................ 1,408 1,226 275 2,359 6,1161978 ................ 1,486 1,248 296 2,438 6,4351979 ................ 1,502 1,261 290 2,473 6,720
Table 7-4: U.S. PUBLIC SPENDING - FEDERAL, STATE, LOCAL AND GDPFY 2012 CONSTANT DOLLARS
(Dollars in Billions)
257
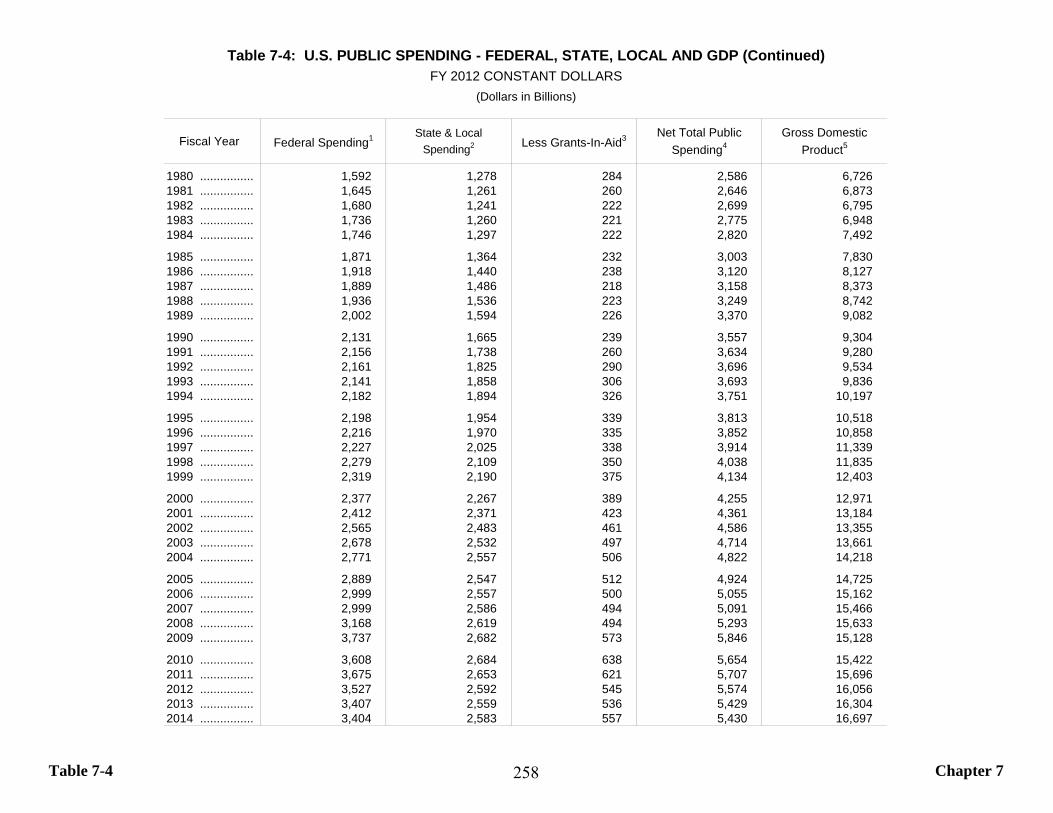
Table 7-4 Chapter 7
Fiscal Year Federal Spending1 State & LocalSpending2 Less Grants-In-Aid3 Net Total Public
Spending4Gross Domestic
Product5
1980 ................ 1,592 1,278 284 2,586 6,7261981 ................ 1,645 1,261 260 2,646 6,8731982 ................ 1,680 1,241 222 2,699 6,7951983 ................ 1,736 1,260 221 2,775 6,9481984 ................ 1,746 1,297 222 2,820 7,492
1985 ................ 1,871 1,364 232 3,003 7,8301986 ................ 1,918 1,440 238 3,120 8,1271987 ................ 1,889 1,486 218 3,158 8,3731988 ................ 1,936 1,536 223 3,249 8,7421989 ................ 2,002 1,594 226 3,370 9,082
1990 ................ 2,131 1,665 239 3,557 9,3041991 ................ 2,156 1,738 260 3,634 9,2801992 ................ 2,161 1,825 290 3,696 9,5341993 ................ 2,141 1,858 306 3,693 9,8361994 ................ 2,182 1,894 326 3,751 10,197
1995 ................ 2,198 1,954 339 3,813 10,5181996 ................ 2,216 1,970 335 3,852 10,8581997 ................ 2,227 2,025 338 3,914 11,3391998 ................ 2,279 2,109 350 4,038 11,8351999 ................ 2,319 2,190 375 4,134 12,403
2000 ................ 2,377 2,267 389 4,255 12,9712001 ................ 2,412 2,371 423 4,361 13,1842002 ................ 2,565 2,483 461 4,586 13,3552003 ................ 2,678 2,532 497 4,714 13,6612004 ................ 2,771 2,557 506 4,822 14,218
2005 ................ 2,889 2,547 512 4,924 14,7252006 ................ 2,999 2,557 500 5,055 15,1622007 ................ 2,999 2,586 494 5,091 15,4662008 ................ 3,168 2,619 494 5,293 15,6332009 ................ 3,737 2,682 573 5,846 15,128
2010 ................ 3,608 2,684 638 5,654 15,4222011 ................ 3,675 2,653 621 5,707 15,6962012 ................ 3,527 2,592 545 5,574 16,0562013 ................ 3,407 2,559 536 5,429 16,3042014 ................ 3,404 2,583 557 5,430 16,697
Table 7-4: U.S. PUBLIC SPENDING - FEDERAL, STATE, LOCAL AND GDP (Continued)FY 2012 CONSTANT DOLLARS
(Dollars in Billions)
258
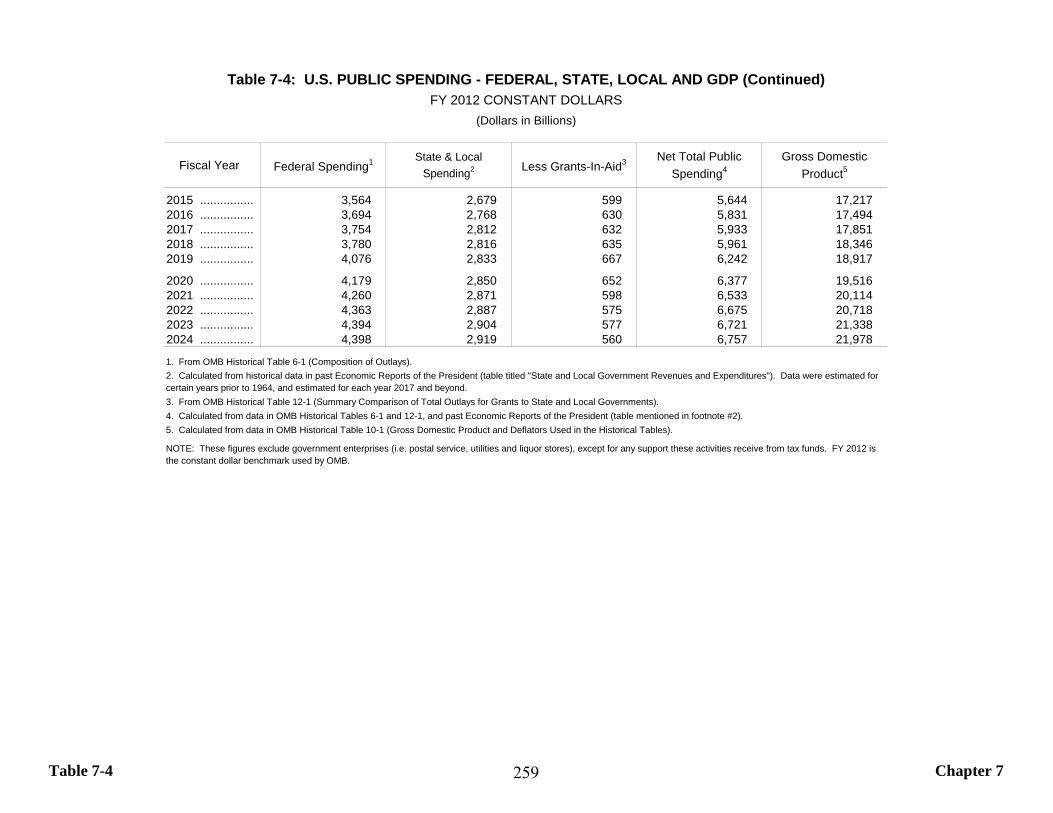
Table 7-4 Chapter 7
Fiscal Year Federal Spending1 State & LocalSpending2 Less Grants-In-Aid3 Net Total Public
Spending4Gross Domestic
Product5
2015 ................ 3,564 2,679 599 5,644 17,2172016 ................ 3,694 2,768 630 5,831 17,4942017 ................ 3,754 2,812 632 5,933 17,8512018 ................ 3,780 2,816 635 5,961 18,3462019 ................ 4,076 2,833 667 6,242 18,917
2020 ................ 4,179 2,850 652 6,377 19,5162021 ................ 4,260 2,871 598 6,533 20,1142022 ................ 4,363 2,887 575 6,675 20,7182023 ................ 4,394 2,904 577 6,721 21,3382024 ................ 4,398 2,919 560 6,757 21,978
1. From OMB Historical Table 6-1 (Composition of Outlays).
3. From OMB Historical Table 12-1 (Summary Comparison of Total Outlays for Grants to State and Local Governments).4. Calculated from data in OMB Historical Tables 6-1 and 12-1, and past Economic Reports of the President (table mentioned in footnote #2).5. Calculated from data in OMB Historical Table 10-1 (Gross Domestic Product and Deflators Used in the Historical Tables).
Table 7-4: U.S. PUBLIC SPENDING - FEDERAL, STATE, LOCAL AND GDP (Continued)FY 2012 CONSTANT DOLLARS
(Dollars in Billions)
2. Calculated from historical data in past Economic Reports of the President (table titled "State and Local Government Revenues and Expenditures"). Data were estimated for certain years prior to 1964, and estimated for each year 2017 and beyond.
NOTE: These figures exclude government enterprises (i.e. postal service, utilities and liquor stores), except for any support these activities receive from tax funds. FY 2012 is the constant dollar benchmark used by OMB.
259
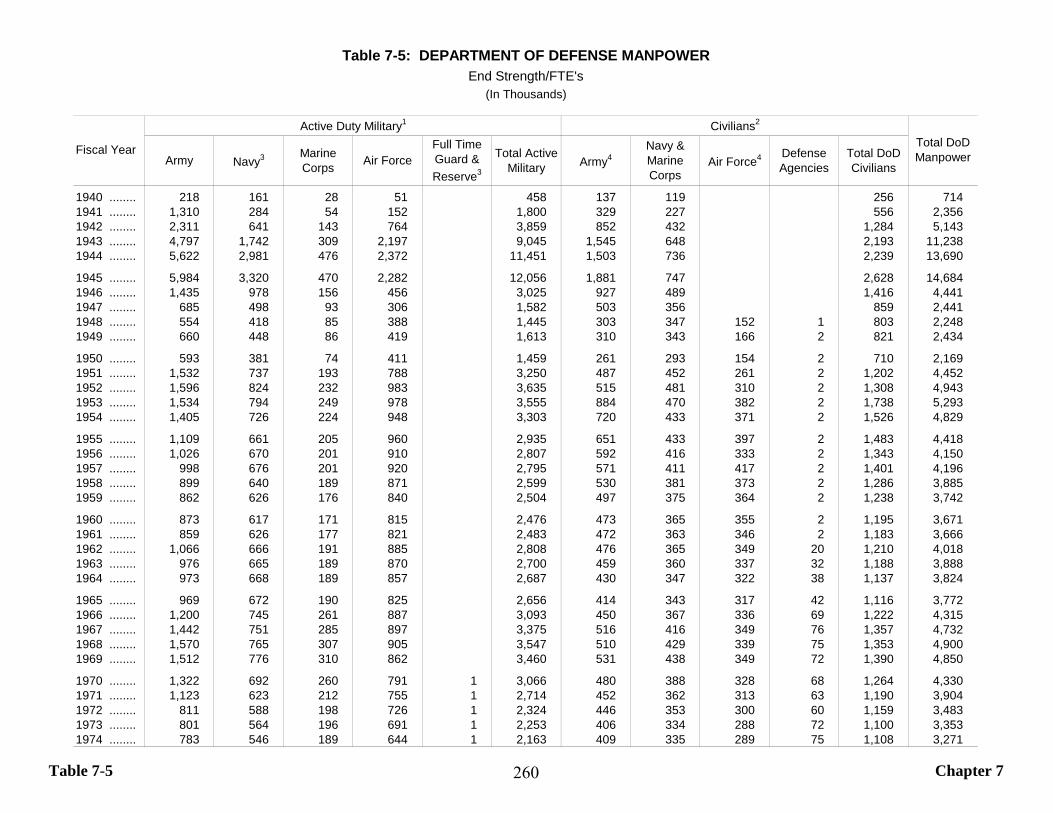
Table 7-5 Chapter 7
Army Navy3 Marine Corps Air Force
Full Time Guard & Reserve3
Total Active Military Army4
Navy & Marine Corps
Air Force4 Defense Agencies
Total DoD Civilians
1940 ........ 218 161 28 51 458 137 119 256 7141941 ........ 1,310 284 54 152 1,800 329 227 556 2,3561942 ........ 2,311 641 143 764 3,859 852 432 1,284 5,1431943 ........ 4,797 1,742 309 2,197 9,045 1,545 648 2,193 11,2381944 ........ 5,622 2,981 476 2,372 11,451 1,503 736 2,239 13,690
1945 ........ 5,984 3,320 470 2,282 12,056 1,881 747 2,628 14,6841946 ........ 1,435 978 156 456 3,025 927 489 1,416 4,4411947 ........ 685 498 93 306 1,582 503 356 859 2,4411948 ........ 554 418 85 388 1,445 303 347 152 1 803 2,2481949 ........ 660 448 86 419 1,613 310 343 166 2 821 2,434
1950 ........ 593 381 74 411 1,459 261 293 154 2 710 2,1691951 ........ 1,532 737 193 788 3,250 487 452 261 2 1,202 4,4521952 ........ 1,596 824 232 983 3,635 515 481 310 2 1,308 4,9431953 ........ 1,534 794 249 978 3,555 884 470 382 2 1,738 5,2931954 ........ 1,405 726 224 948 3,303 720 433 371 2 1,526 4,829
1955 ........ 1,109 661 205 960 2,935 651 433 397 2 1,483 4,4181956 ........ 1,026 670 201 910 2,807 592 416 333 2 1,343 4,1501957 ........ 998 676 201 920 2,795 571 411 417 2 1,401 4,1961958 ........ 899 640 189 871 2,599 530 381 373 2 1,286 3,8851959 ........ 862 626 176 840 2,504 497 375 364 2 1,238 3,742
1960 ........ 873 617 171 815 2,476 473 365 355 2 1,195 3,6711961 ........ 859 626 177 821 2,483 472 363 346 2 1,183 3,6661962 ........ 1,066 666 191 885 2,808 476 365 349 20 1,210 4,0181963 ........ 976 665 189 870 2,700 459 360 337 32 1,188 3,8881964 ........ 973 668 189 857 2,687 430 347 322 38 1,137 3,824
1965 ........ 969 672 190 825 2,656 414 343 317 42 1,116 3,7721966 ........ 1,200 745 261 887 3,093 450 367 336 69 1,222 4,3151967 ........ 1,442 751 285 897 3,375 516 416 349 76 1,357 4,7321968 ........ 1,570 765 307 905 3,547 510 429 339 75 1,353 4,9001969 ........ 1,512 776 310 862 3,460 531 438 349 72 1,390 4,850
1970 ........ 1,322 692 260 791 1 3,066 480 388 328 68 1,264 4,3301971 ........ 1,123 623 212 755 1 2,714 452 362 313 63 1,190 3,9041972 ........ 811 588 198 726 1 2,324 446 353 300 60 1,159 3,4831973 ........ 801 564 196 691 1 2,253 406 334 288 72 1,100 3,3531974 ........ 783 546 189 644 1 2,163 409 335 289 75 1,108 3,271
Table 7-5: DEPARTMENT OF DEFENSE MANPOWEREnd Strength/FTE's
(In Thousands)
Active Duty Military1 Civilians2
Fiscal Year Total DoD Manpower
260
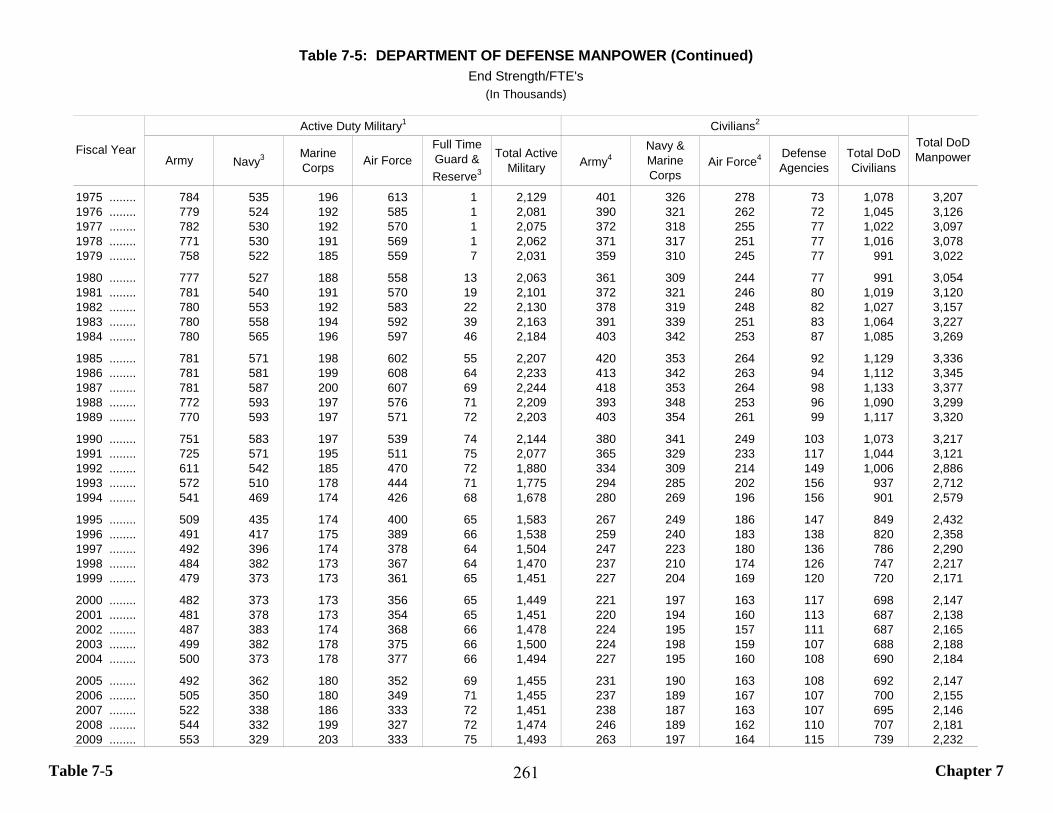
Table 7-5 Chapter 7
Army Navy3 Marine Corps Air Force
Full Time Guard & Reserve3
Total Active Military Army4
Navy & Marine Corps
Air Force4 Defense Agencies
Total DoD Civilians
1975 ........ 784 535 196 613 1 2,129 401 326 278 73 1,078 3,2071976 ........ 779 524 192 585 1 2,081 390 321 262 72 1,045 3,1261977 ........ 782 530 192 570 1 2,075 372 318 255 77 1,022 3,0971978 ........ 771 530 191 569 1 2,062 371 317 251 77 1,016 3,0781979 ........ 758 522 185 559 7 2,031 359 310 245 77 991 3,022
1980 ........ 777 527 188 558 13 2,063 361 309 244 77 991 3,0541981 ........ 781 540 191 570 19 2,101 372 321 246 80 1,019 3,1201982 ........ 780 553 192 583 22 2,130 378 319 248 82 1,027 3,1571983 ........ 780 558 194 592 39 2,163 391 339 251 83 1,064 3,2271984 ........ 780 565 196 597 46 2,184 403 342 253 87 1,085 3,269
1985 ........ 781 571 198 602 55 2,207 420 353 264 92 1,129 3,3361986 ........ 781 581 199 608 64 2,233 413 342 263 94 1,112 3,3451987 ........ 781 587 200 607 69 2,244 418 353 264 98 1,133 3,3771988 ........ 772 593 197 576 71 2,209 393 348 253 96 1,090 3,2991989 ........ 770 593 197 571 72 2,203 403 354 261 99 1,117 3,320
1990 ........ 751 583 197 539 74 2,144 380 341 249 103 1,073 3,2171991 ........ 725 571 195 511 75 2,077 365 329 233 117 1,044 3,1211992 ........ 611 542 185 470 72 1,880 334 309 214 149 1,006 2,8861993 ........ 572 510 178 444 71 1,775 294 285 202 156 937 2,7121994 ........ 541 469 174 426 68 1,678 280 269 196 156 901 2,579
1995 ........ 509 435 174 400 65 1,583 267 249 186 147 849 2,4321996 ........ 491 417 175 389 66 1,538 259 240 183 138 820 2,3581997 ........ 492 396 174 378 64 1,504 247 223 180 136 786 2,2901998 ........ 484 382 173 367 64 1,470 237 210 174 126 747 2,2171999 ........ 479 373 173 361 65 1,451 227 204 169 120 720 2,171
2000 ........ 482 373 173 356 65 1,449 221 197 163 117 698 2,1472001 ........ 481 378 173 354 65 1,451 220 194 160 113 687 2,1382002 ........ 487 383 174 368 66 1,478 224 195 157 111 687 2,1652003 ........ 499 382 178 375 66 1,500 224 198 159 107 688 2,1882004 ........ 500 373 178 377 66 1,494 227 195 160 108 690 2,184
2005 ........ 492 362 180 352 69 1,455 231 190 163 108 692 2,1472006 ........ 505 350 180 349 71 1,455 237 189 167 107 700 2,1552007 ........ 522 338 186 333 72 1,451 238 187 163 107 695 2,1462008 ........ 544 332 199 327 72 1,474 246 189 162 110 707 2,1812009 ........ 553 329 203 333 75 1,493 263 197 164 115 739 2,232
Table 7-5: DEPARTMENT OF DEFENSE MANPOWER (Continued)End Strength/FTE's
(In Thousands)
Fiscal Year
Active Duty Military1 Civilians2
Total DoD Manpower
261
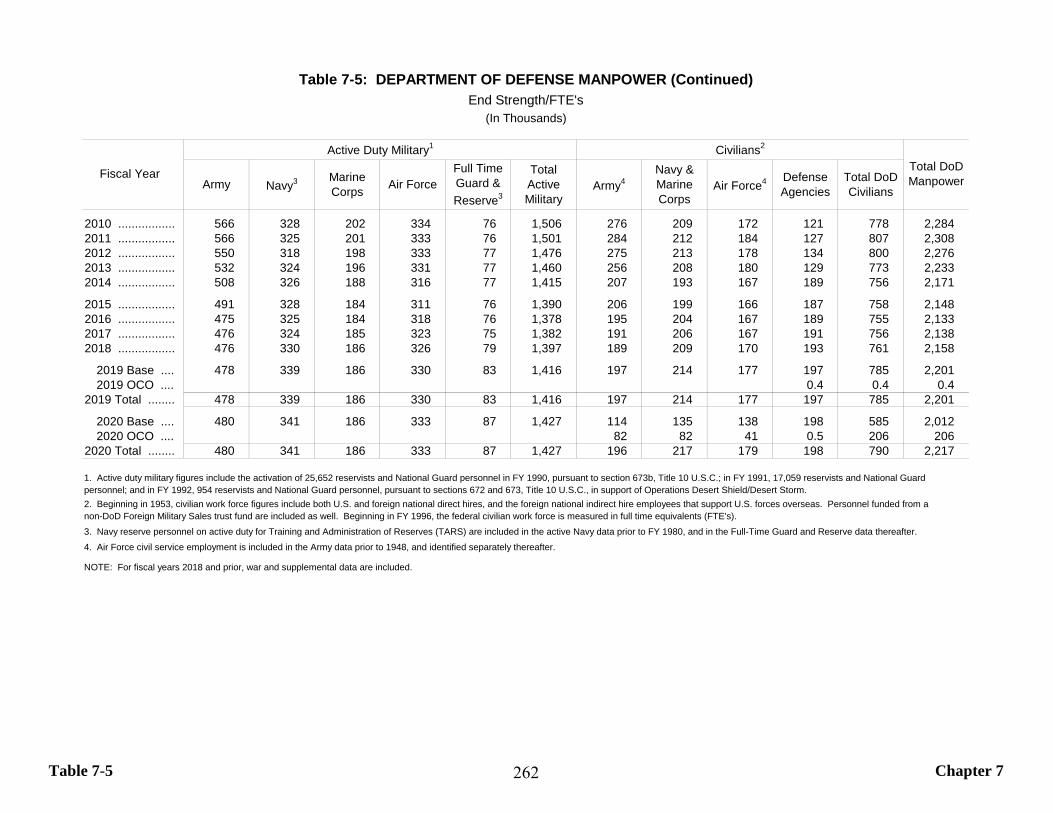
Table 7-5 Chapter 7
Army Navy3 Marine Corps Air Force
Full Time Guard & Reserve3
Total Active Military
Army4Navy & Marine Corps
Air Force4 Defense Agencies
Total DoD Civilians
2010 ................. 566 328 202 334 76 1,506 276 209 172 121 778 2,2842011 ................. 566 325 201 333 76 1,501 284 212 184 127 807 2,3082012 ................. 550 318 198 333 77 1,476 275 213 178 134 800 2,2762013 ................. 532 324 196 331 77 1,460 256 208 180 129 773 2,2332014 ................. 508 326 188 316 77 1,415 207 193 167 189 756 2,171
2015 ................. 491 328 184 311 76 1,390 206 199 166 187 758 2,1482016 ................. 475 325 184 318 76 1,378 195 204 167 189 755 2,1332017 ................. 476 324 185 323 75 1,382 191 206 167 191 756 2,1382018 ................. 476 330 186 326 79 1,397 189 209 170 193 761 2,158
2019 Base ..... 478 339 186 330 83 1,416 197 214 177 197 785 2,2012019 OCO ..... 0.4 0.4 0.4
2019 Total ........ 478 339 186 330 83 1,416 197 214 177 197 785 2,201
2020 Base ..... 480 341 186 333 87 1,427 114 135 138 198 585 2,0122020 OCO ..... 82 82 41 0.5 206 206
2020 Total ........ 480 341 186 333 87 1,427 196 217 179 198 790 2,217
3. Navy reserve personnel on active duty for Training and Administration of Reserves (TARS) are included in the active Navy data prior to FY 1980, and in the Full-Time Guard and Reserve data thereafter.4. Air Force civil service employment is included in the Army data prior to 1948, and identified separately thereafter.
NOTE: For fiscal years 2018 and prior, war and supplemental data are included.
1. Active duty military figures include the activation of 25,652 reservists and National Guard personnel in FY 1990, pursuant to section 673b, Title 10 U.S.C.; in FY 1991, 17,059 reservists and National Guard personnel; and in FY 1992, 954 reservists and National Guard personnel, pursuant to sections 672 and 673, Title 10 U.S.C., in support of Operations Desert Shield/Desert Storm.2. Beginning in 1953, civilian work force figures include both U.S. and foreign national direct hires, and the foreign national indirect hire employees that support U.S. forces overseas. Personnel funded from anon-DoD Foreign Military Sales trust fund are included as well. Beginning in FY 1996, the federal civilian work force is measured in full time equivalents (FTE's).
Table 7-5: DEPARTMENT OF DEFENSE MANPOWER (Continued)End Strength/FTE's
(In Thousands)
Fiscal Year
Active Duty Military1 Civilians2
Total DoD Manpower
262
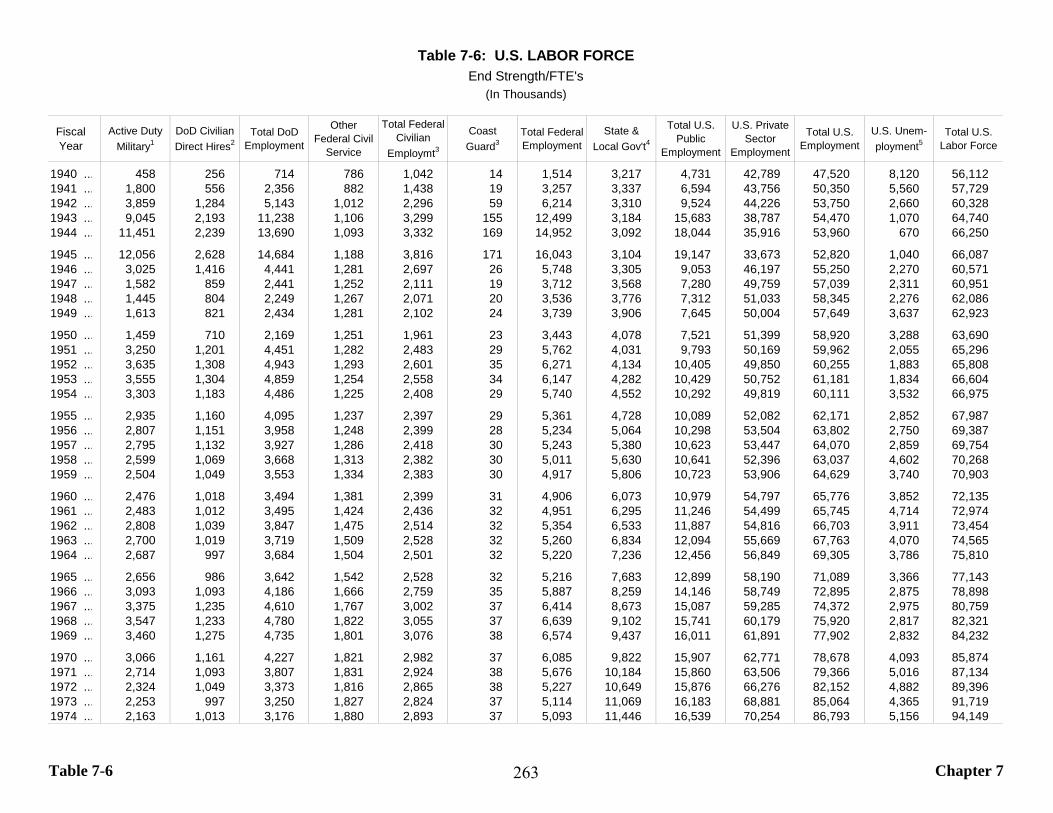
Table 7-6 Chapter 7
Fiscal Year
Active Duty Military1
DoD Civilian Direct Hires2
Total DoD Employment
Other Federal Civil
Service
Total Federal Civilian
Employmt3CoastGuard3
Total Federal Employment
State &Local Gov't4
Total U.S. Public
Employment
U.S. Private Sector
Employment
Total U.S. Employment
U.S. Unem-ployment5
Total U.S. Labor Force
1940 ... 458 256 714 786 1,042 14 1,514 3,217 4,731 42,789 47,520 8,120 56,1121941 ... 1,800 556 2,356 882 1,438 19 3,257 3,337 6,594 43,756 50,350 5,560 57,7291942 ... 3,859 1,284 5,143 1,012 2,296 59 6,214 3,310 9,524 44,226 53,750 2,660 60,3281943 ... 9,045 2,193 11,238 1,106 3,299 155 12,499 3,184 15,683 38,787 54,470 1,070 64,7401944 ... 11,451 2,239 13,690 1,093 3,332 169 14,952 3,092 18,044 35,916 53,960 670 66,250
1945 ... 12,056 2,628 14,684 1,188 3,816 171 16,043 3,104 19,147 33,673 52,820 1,040 66,0871946 ... 3,025 1,416 4,441 1,281 2,697 26 5,748 3,305 9,053 46,197 55,250 2,270 60,5711947 ... 1,582 859 2,441 1,252 2,111 19 3,712 3,568 7,280 49,759 57,039 2,311 60,9511948 ... 1,445 804 2,249 1,267 2,071 20 3,536 3,776 7,312 51,033 58,345 2,276 62,0861949 ... 1,613 821 2,434 1,281 2,102 24 3,739 3,906 7,645 50,004 57,649 3,637 62,923
1950 ... 1,459 710 2,169 1,251 1,961 23 3,443 4,078 7,521 51,399 58,920 3,288 63,6901951 ... 3,250 1,201 4,451 1,282 2,483 29 5,762 4,031 9,793 50,169 59,962 2,055 65,2961952 ... 3,635 1,308 4,943 1,293 2,601 35 6,271 4,134 10,405 49,850 60,255 1,883 65,8081953 ... 3,555 1,304 4,859 1,254 2,558 34 6,147 4,282 10,429 50,752 61,181 1,834 66,6041954 ... 3,303 1,183 4,486 1,225 2,408 29 5,740 4,552 10,292 49,819 60,111 3,532 66,975
1955 ... 2,935 1,160 4,095 1,237 2,397 29 5,361 4,728 10,089 52,082 62,171 2,852 67,9871956 ... 2,807 1,151 3,958 1,248 2,399 28 5,234 5,064 10,298 53,504 63,802 2,750 69,3871957 ... 2,795 1,132 3,927 1,286 2,418 30 5,243 5,380 10,623 53,447 64,070 2,859 69,7541958 ... 2,599 1,069 3,668 1,313 2,382 30 5,011 5,630 10,641 52,396 63,037 4,602 70,2681959 ... 2,504 1,049 3,553 1,334 2,383 30 4,917 5,806 10,723 53,906 64,629 3,740 70,903
1960 ... 2,476 1,018 3,494 1,381 2,399 31 4,906 6,073 10,979 54,797 65,776 3,852 72,1351961 ... 2,483 1,012 3,495 1,424 2,436 32 4,951 6,295 11,246 54,499 65,745 4,714 72,9741962 ... 2,808 1,039 3,847 1,475 2,514 32 5,354 6,533 11,887 54,816 66,703 3,911 73,4541963 ... 2,700 1,019 3,719 1,509 2,528 32 5,260 6,834 12,094 55,669 67,763 4,070 74,5651964 ... 2,687 997 3,684 1,504 2,501 32 5,220 7,236 12,456 56,849 69,305 3,786 75,810
1965 ... 2,656 986 3,642 1,542 2,528 32 5,216 7,683 12,899 58,190 71,089 3,366 77,1431966 ... 3,093 1,093 4,186 1,666 2,759 35 5,887 8,259 14,146 58,749 72,895 2,875 78,8981967 ... 3,375 1,235 4,610 1,767 3,002 37 6,414 8,673 15,087 59,285 74,372 2,975 80,7591968 ... 3,547 1,233 4,780 1,822 3,055 37 6,639 9,102 15,741 60,179 75,920 2,817 82,3211969 ... 3,460 1,275 4,735 1,801 3,076 38 6,574 9,437 16,011 61,891 77,902 2,832 84,232
1970 ... 3,066 1,161 4,227 1,821 2,982 37 6,085 9,822 15,907 62,771 78,678 4,093 85,8741971 ... 2,714 1,093 3,807 1,831 2,924 38 5,676 10,184 15,860 63,506 79,366 5,016 87,1341972 ... 2,324 1,049 3,373 1,816 2,865 38 5,227 10,649 15,876 66,276 82,152 4,882 89,3961973 ... 2,253 997 3,250 1,827 2,824 37 5,114 11,069 16,183 68,881 85,064 4,365 91,7191974 ... 2,163 1,013 3,176 1,880 2,893 37 5,093 11,446 16,539 70,254 86,793 5,156 94,149
Table 7-6: U.S. LABOR FORCEEnd Strength/FTE's
(In Thousands)
263
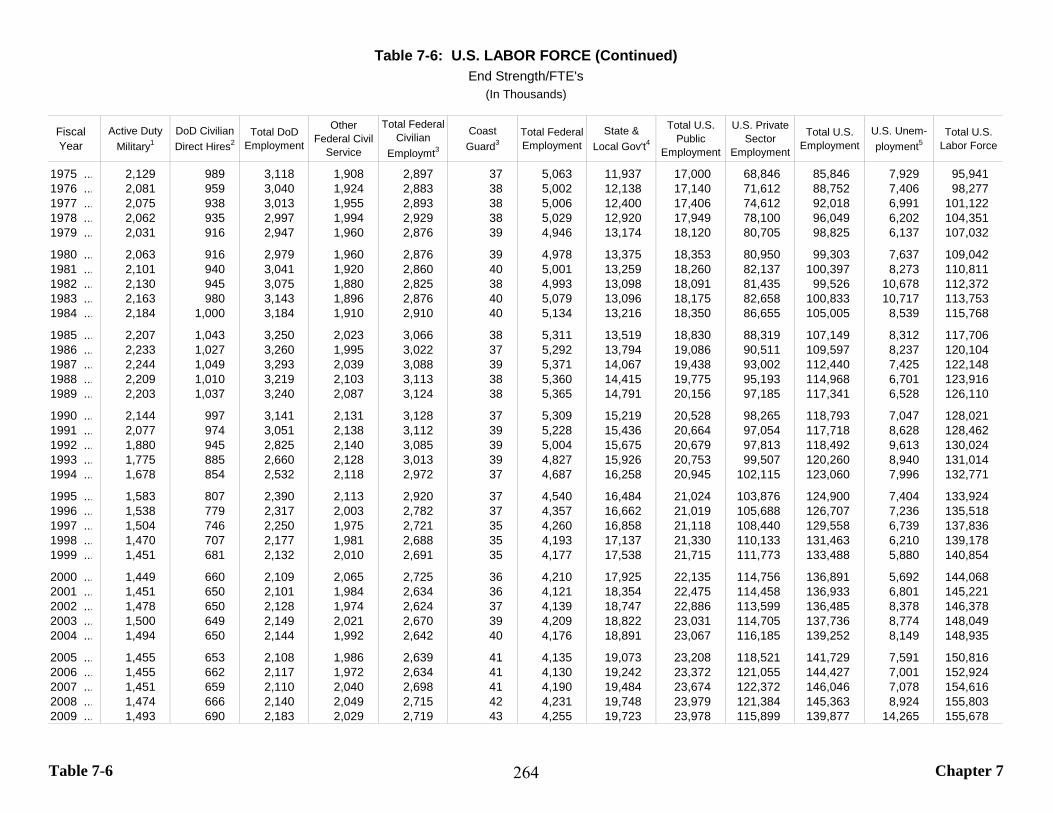
Table 7-6 Chapter 7
Fiscal Year
Active Duty Military1
DoD Civilian Direct Hires2
Total DoD Employment
Other Federal Civil
Service
Total Federal Civilian
Employmt3CoastGuard3
Total Federal Employment
State &Local Gov't4
Total U.S. Public
Employment
U.S. Private Sector
Employment
Total U.S. Employment
U.S. Unem-ployment5
Total U.S. Labor Force
1975 ... 2,129 989 3,118 1,908 2,897 37 5,063 11,937 17,000 68,846 85,846 7,929 95,9411976 ... 2,081 959 3,040 1,924 2,883 38 5,002 12,138 17,140 71,612 88,752 7,406 98,2771977 ... 2,075 938 3,013 1,955 2,893 38 5,006 12,400 17,406 74,612 92,018 6,991 101,1221978 ... 2,062 935 2,997 1,994 2,929 38 5,029 12,920 17,949 78,100 96,049 6,202 104,3511979 ... 2,031 916 2,947 1,960 2,876 39 4,946 13,174 18,120 80,705 98,825 6,137 107,032
1980 ... 2,063 916 2,979 1,960 2,876 39 4,978 13,375 18,353 80,950 99,303 7,637 109,0421981 ... 2,101 940 3,041 1,920 2,860 40 5,001 13,259 18,260 82,137 100,397 8,273 110,8111982 ... 2,130 945 3,075 1,880 2,825 38 4,993 13,098 18,091 81,435 99,526 10,678 112,3721983 ... 2,163 980 3,143 1,896 2,876 40 5,079 13,096 18,175 82,658 100,833 10,717 113,7531984 ... 2,184 1,000 3,184 1,910 2,910 40 5,134 13,216 18,350 86,655 105,005 8,539 115,768
1985 ... 2,207 1,043 3,250 2,023 3,066 38 5,311 13,519 18,830 88,319 107,149 8,312 117,7061986 ... 2,233 1,027 3,260 1,995 3,022 37 5,292 13,794 19,086 90,511 109,597 8,237 120,1041987 ... 2,244 1,049 3,293 2,039 3,088 39 5,371 14,067 19,438 93,002 112,440 7,425 122,1481988 ... 2,209 1,010 3,219 2,103 3,113 38 5,360 14,415 19,775 95,193 114,968 6,701 123,9161989 ... 2,203 1,037 3,240 2,087 3,124 38 5,365 14,791 20,156 97,185 117,341 6,528 126,110
1990 ... 2,144 997 3,141 2,131 3,128 37 5,309 15,219 20,528 98,265 118,793 7,047 128,0211991 ... 2,077 974 3,051 2,138 3,112 39 5,228 15,436 20,664 97,054 117,718 8,628 128,4621992 ... 1,880 945 2,825 2,140 3,085 39 5,004 15,675 20,679 97,813 118,492 9,613 130,0241993 ... 1,775 885 2,660 2,128 3,013 39 4,827 15,926 20,753 99,507 120,260 8,940 131,0141994 ... 1,678 854 2,532 2,118 2,972 37 4,687 16,258 20,945 102,115 123,060 7,996 132,771
1995 ... 1,583 807 2,390 2,113 2,920 37 4,540 16,484 21,024 103,876 124,900 7,404 133,9241996 ... 1,538 779 2,317 2,003 2,782 37 4,357 16,662 21,019 105,688 126,707 7,236 135,5181997 ... 1,504 746 2,250 1,975 2,721 35 4,260 16,858 21,118 108,440 129,558 6,739 137,8361998 ... 1,470 707 2,177 1,981 2,688 35 4,193 17,137 21,330 110,133 131,463 6,210 139,1781999 ... 1,451 681 2,132 2,010 2,691 35 4,177 17,538 21,715 111,773 133,488 5,880 140,854
2000 ... 1,449 660 2,109 2,065 2,725 36 4,210 17,925 22,135 114,756 136,891 5,692 144,0682001 ... 1,451 650 2,101 1,984 2,634 36 4,121 18,354 22,475 114,458 136,933 6,801 145,2212002 ... 1,478 650 2,128 1,974 2,624 37 4,139 18,747 22,886 113,599 136,485 8,378 146,3782003 ... 1,500 649 2,149 2,021 2,670 39 4,209 18,822 23,031 114,705 137,736 8,774 148,0492004 ... 1,494 650 2,144 1,992 2,642 40 4,176 18,891 23,067 116,185 139,252 8,149 148,935
2005 ... 1,455 653 2,108 1,986 2,639 41 4,135 19,073 23,208 118,521 141,729 7,591 150,8162006 ... 1,455 662 2,117 1,972 2,634 41 4,130 19,242 23,372 121,055 144,427 7,001 152,9242007 ... 1,451 659 2,110 2,040 2,698 41 4,190 19,484 23,674 122,372 146,046 7,078 154,6162008 ... 1,474 666 2,140 2,049 2,715 42 4,231 19,748 23,979 121,384 145,363 8,924 155,8032009 ... 1,493 690 2,183 2,029 2,719 43 4,255 19,723 23,978 115,899 139,877 14,265 155,678
Table 7-6: U.S. LABOR FORCE (Continued)End Strength/FTE's
(In Thousands)
264
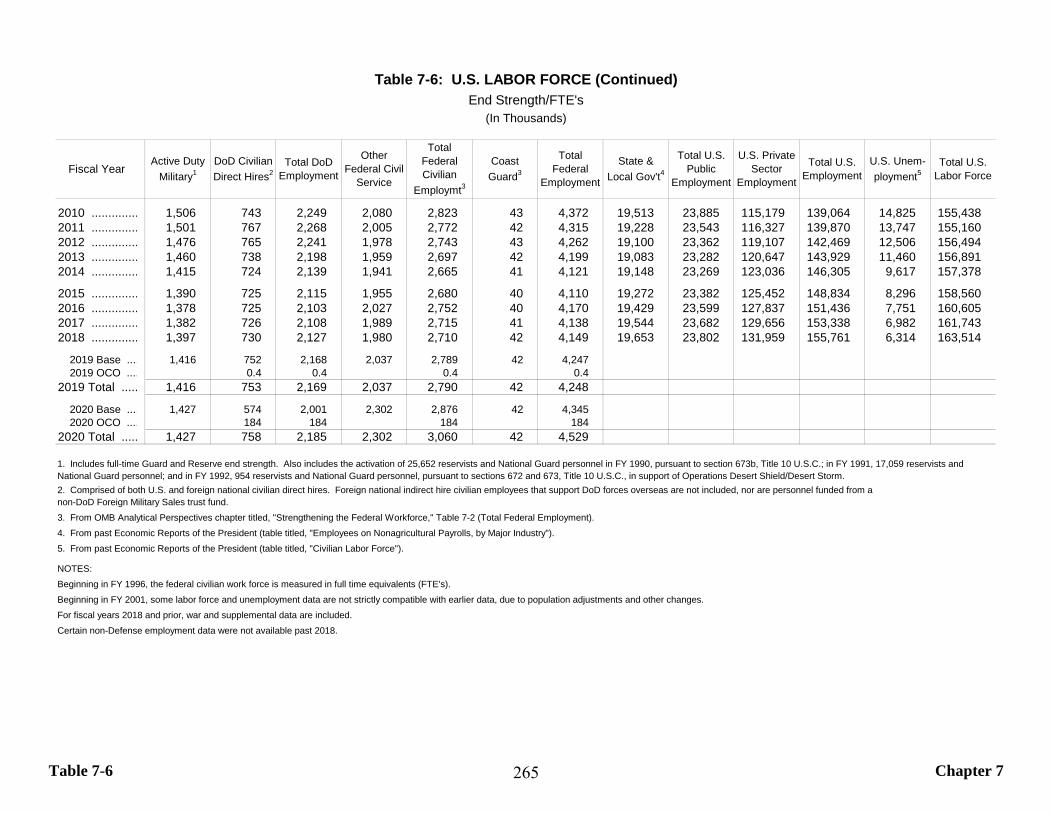
Table 7-6 Chapter 7
Fiscal YearActive Duty
Military1DoD Civilian Direct Hires2
Total DoD Employment
Other Federal Civil
Service
Total Federal Civilian
Employmt3
CoastGuard3
Total Federal
Employment
State &Local Gov't4
Total U.S. Public
Employment
U.S. Private Sector
Employment
Total U.S. Employment
U.S. Unem-ployment5
Total U.S. Labor Force
2010 .............. 1,506 743 2,249 2,080 2,823 43 4,372 19,513 23,885 115,179 139,064 14,825 155,4382011 .............. 1,501 767 2,268 2,005 2,772 42 4,315 19,228 23,543 116,327 139,870 13,747 155,1602012 .............. 1,476 765 2,241 1,978 2,743 43 4,262 19,100 23,362 119,107 142,469 12,506 156,4942013 .............. 1,460 738 2,198 1,959 2,697 42 4,199 19,083 23,282 120,647 143,929 11,460 156,8912014 .............. 1,415 724 2,139 1,941 2,665 41 4,121 19,148 23,269 123,036 146,305 9,617 157,378
2015 .............. 1,390 725 2,115 1,955 2,680 40 4,110 19,272 23,382 125,452 148,834 8,296 158,5602016 .............. 1,378 725 2,103 2,027 2,752 40 4,170 19,429 23,599 127,837 151,436 7,751 160,6052017 .............. 1,382 726 2,108 1,989 2,715 41 4,138 19,544 23,682 129,656 153,338 6,982 161,7432018 .............. 1,397 730 2,127 1,980 2,710 42 4,149 19,653 23,802 131,959 155,761 6,314 163,514
2019 Base .... 1,416 752 2,168 2,037 2,789 42 4,2472019 OCO .... 0.4 0.4 0.4 0.4
2019 Total ..... 1,416 753 2,169 2,037 2,790 42 4,248
2020 Base .... 1,427 574 2,001 2,302 2,876 42 4,3452020 OCO .... 184 184 184 184
2020 Total ..... 1,427 758 2,185 2,302 3,060 42 4,529
3. From OMB Analytical Perspectives chapter titled, "Strengthening the Federal Workforce," Table 7-2 (Total Federal Employment).4. From past Economic Reports of the President (table titled, "Employees on Nonagricultural Payrolls, by Major Industry").5. From past Economic Reports of the President (table titled, "Civilian Labor Force").
NOTES:Beginning in FY 1996, the federal civilian work force is measured in full time equivalents (FTE's).Beginning in FY 2001, some labor force and unemployment data are not strictly compatible with earlier data, due to population adjustments and other changes.For fiscal years 2018 and prior, war and supplemental data are included.Certain non-Defense employment data were not available past 2018.
1. Includes full-time Guard and Reserve end strength. Also includes the activation of 25,652 reservists and National Guard personnel in FY 1990, pursuant to section 673b, Title 10 U.S.C.; in FY 1991, 17,059 reservists and National Guard personnel; and in FY 1992, 954 reservists and National Guard personnel, pursuant to sections 672 and 673, Title 10 U.S.C., in support of Operations Desert Shield/Desert Storm.
Table 7-6: U.S. LABOR FORCE (Continued)End Strength/FTE's
(In Thousands)
2. Comprised of both U.S. and foreign national civilian direct hires. Foreign national indirect hire civilian employees that support DoD forces overseas are not included, nor are personnel funded from anon-DoD Foreign Military Sales trust fund.
265
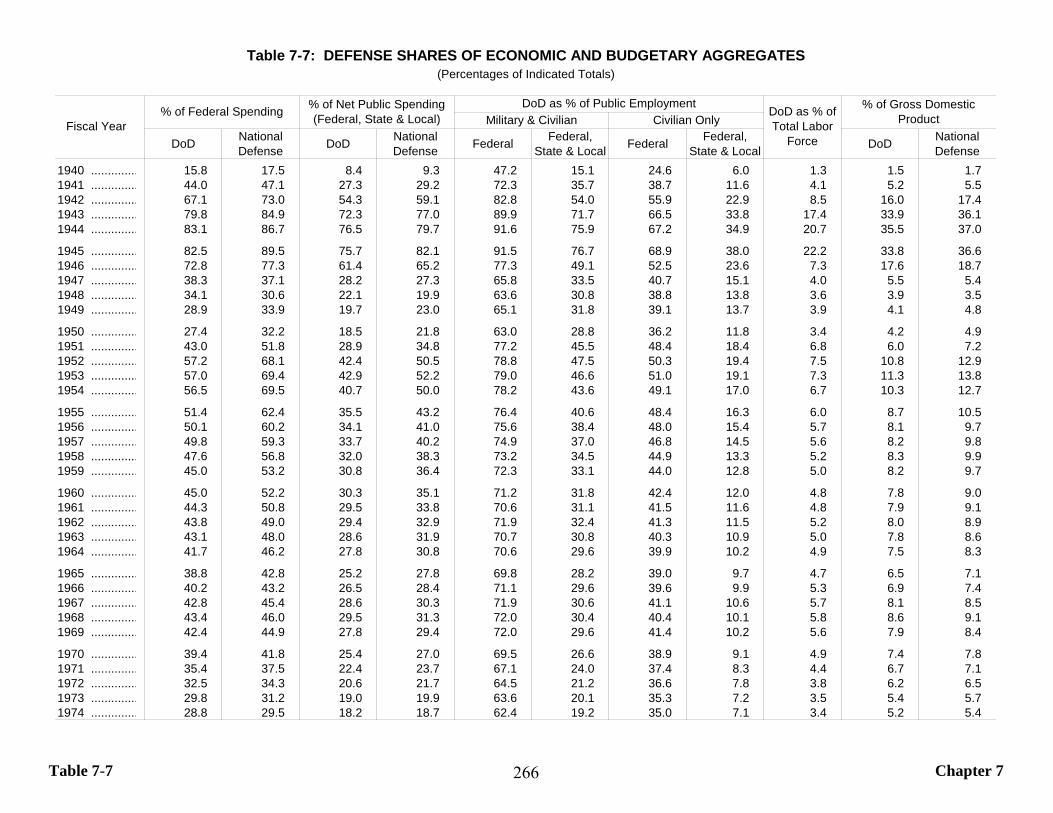
Table 7-7 Chapter 7
DoD National Defense DoD National
Defense Federal Federal, State & Local Federal Federal,
State & Local DoD National Defense
1940 .............. 15.8 17.5 8.4 9.3 47.2 15.1 24.6 6.0 1.3 1.5 1.71941 .............. 44.0 47.1 27.3 29.2 72.3 35.7 38.7 11.6 4.1 5.2 5.51942 .............. 67.1 73.0 54.3 59.1 82.8 54.0 55.9 22.9 8.5 16.0 17.41943 .............. 79.8 84.9 72.3 77.0 89.9 71.7 66.5 33.8 17.4 33.9 36.11944 .............. 83.1 86.7 76.5 79.7 91.6 75.9 67.2 34.9 20.7 35.5 37.0
1945 .............. 82.5 89.5 75.7 82.1 91.5 76.7 68.9 38.0 22.2 33.8 36.61946 .............. 72.8 77.3 61.4 65.2 77.3 49.1 52.5 23.6 7.3 17.6 18.71947 .............. 38.3 37.1 28.2 27.3 65.8 33.5 40.7 15.1 4.0 5.5 5.41948 .............. 34.1 30.6 22.1 19.9 63.6 30.8 38.8 13.8 3.6 3.9 3.51949 .............. 28.9 33.9 19.7 23.0 65.1 31.8 39.1 13.7 3.9 4.1 4.8
1950 .............. 27.4 32.2 18.5 21.8 63.0 28.8 36.2 11.8 3.4 4.2 4.91951 .............. 43.0 51.8 28.9 34.8 77.2 45.5 48.4 18.4 6.8 6.0 7.21952 .............. 57.2 68.1 42.4 50.5 78.8 47.5 50.3 19.4 7.5 10.8 12.91953 .............. 57.0 69.4 42.9 52.2 79.0 46.6 51.0 19.1 7.3 11.3 13.81954 .............. 56.5 69.5 40.7 50.0 78.2 43.6 49.1 17.0 6.7 10.3 12.7
1955 .............. 51.4 62.4 35.5 43.2 76.4 40.6 48.4 16.3 6.0 8.7 10.51956 .............. 50.1 60.2 34.1 41.0 75.6 38.4 48.0 15.4 5.7 8.1 9.71957 .............. 49.8 59.3 33.7 40.2 74.9 37.0 46.8 14.5 5.6 8.2 9.81958 .............. 47.6 56.8 32.0 38.3 73.2 34.5 44.9 13.3 5.2 8.3 9.91959 .............. 45.0 53.2 30.8 36.4 72.3 33.1 44.0 12.8 5.0 8.2 9.7
1960 .............. 45.0 52.2 30.3 35.1 71.2 31.8 42.4 12.0 4.8 7.8 9.01961 .............. 44.3 50.8 29.5 33.8 70.6 31.1 41.5 11.6 4.8 7.9 9.11962 .............. 43.8 49.0 29.4 32.9 71.9 32.4 41.3 11.5 5.2 8.0 8.91963 .............. 43.1 48.0 28.6 31.9 70.7 30.8 40.3 10.9 5.0 7.8 8.61964 .............. 41.7 46.2 27.8 30.8 70.6 29.6 39.9 10.2 4.9 7.5 8.3
1965 .............. 38.8 42.8 25.2 27.8 69.8 28.2 39.0 9.7 4.7 6.5 7.11966 .............. 40.2 43.2 26.5 28.4 71.1 29.6 39.6 9.9 5.3 6.9 7.41967 .............. 42.8 45.4 28.6 30.3 71.9 30.6 41.1 10.6 5.7 8.1 8.51968 .............. 43.4 46.0 29.5 31.3 72.0 30.4 40.4 10.1 5.8 8.6 9.11969 .............. 42.4 44.9 27.8 29.4 72.0 29.6 41.4 10.2 5.6 7.9 8.4
1970 .............. 39.4 41.8 25.4 27.0 69.5 26.6 38.9 9.1 4.9 7.4 7.81971 .............. 35.4 37.5 22.4 23.7 67.1 24.0 37.4 8.3 4.4 6.7 7.11972 .............. 32.5 34.3 20.6 21.7 64.5 21.2 36.6 7.8 3.8 6.2 6.51973 .............. 29.8 31.2 19.0 19.9 63.6 20.1 35.3 7.2 3.5 5.4 5.71974 .............. 28.8 29.5 18.2 18.7 62.4 19.2 35.0 7.1 3.4 5.2 5.4
Table 7-7: DEFENSE SHARES OF ECONOMIC AND BUDGETARY AGGREGATES(Percentages of Indicated Totals)
% of Federal Spending DoD as % of Total Labor
Force
% of Gross Domestic ProductFiscal Year
% of Net Public Spending (Federal, State & Local) Military & Civilian Civilian Only
DoD as % of Public Employment
266
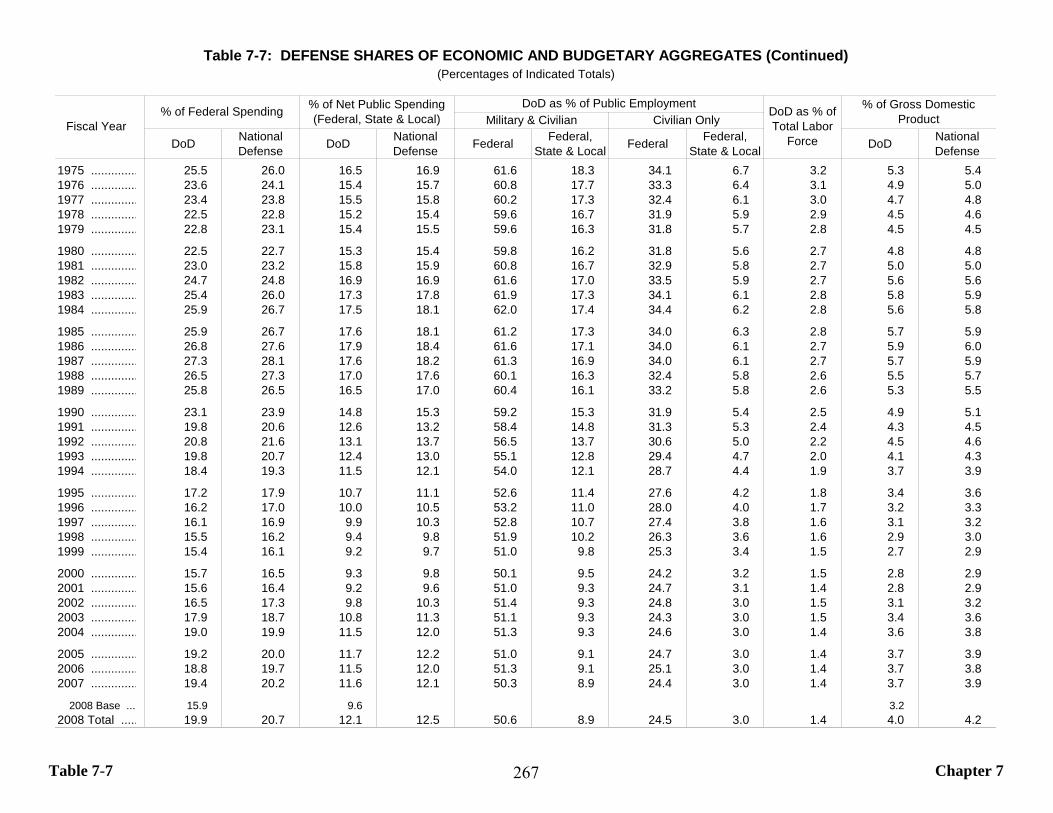
Table 7-7 Chapter 7
DoD National Defense DoD National
Defense Federal Federal, State & Local Federal Federal,
State & Local DoD National Defense
1975 .............. 25.5 26.0 16.5 16.9 61.6 18.3 34.1 6.7 3.2 5.3 5.41976 .............. 23.6 24.1 15.4 15.7 60.8 17.7 33.3 6.4 3.1 4.9 5.01977 .............. 23.4 23.8 15.5 15.8 60.2 17.3 32.4 6.1 3.0 4.7 4.81978 .............. 22.5 22.8 15.2 15.4 59.6 16.7 31.9 5.9 2.9 4.5 4.61979 .............. 22.8 23.1 15.4 15.5 59.6 16.3 31.8 5.7 2.8 4.5 4.5
1980 .............. 22.5 22.7 15.3 15.4 59.8 16.2 31.8 5.6 2.7 4.8 4.81981 .............. 23.0 23.2 15.8 15.9 60.8 16.7 32.9 5.8 2.7 5.0 5.01982 .............. 24.7 24.8 16.9 16.9 61.6 17.0 33.5 5.9 2.7 5.6 5.61983 .............. 25.4 26.0 17.3 17.8 61.9 17.3 34.1 6.1 2.8 5.8 5.91984 .............. 25.9 26.7 17.5 18.1 62.0 17.4 34.4 6.2 2.8 5.6 5.8
1985 .............. 25.9 26.7 17.6 18.1 61.2 17.3 34.0 6.3 2.8 5.7 5.91986 .............. 26.8 27.6 17.9 18.4 61.6 17.1 34.0 6.1 2.7 5.9 6.01987 .............. 27.3 28.1 17.6 18.2 61.3 16.9 34.0 6.1 2.7 5.7 5.91988 .............. 26.5 27.3 17.0 17.6 60.1 16.3 32.4 5.8 2.6 5.5 5.71989 .............. 25.8 26.5 16.5 17.0 60.4 16.1 33.2 5.8 2.6 5.3 5.5
1990 .............. 23.1 23.9 14.8 15.3 59.2 15.3 31.9 5.4 2.5 4.9 5.11991 .............. 19.8 20.6 12.6 13.2 58.4 14.8 31.3 5.3 2.4 4.3 4.51992 .............. 20.8 21.6 13.1 13.7 56.5 13.7 30.6 5.0 2.2 4.5 4.61993 .............. 19.8 20.7 12.4 13.0 55.1 12.8 29.4 4.7 2.0 4.1 4.31994 .............. 18.4 19.3 11.5 12.1 54.0 12.1 28.7 4.4 1.9 3.7 3.9
1995 .............. 17.2 17.9 10.7 11.1 52.6 11.4 27.6 4.2 1.8 3.4 3.61996 .............. 16.2 17.0 10.0 10.5 53.2 11.0 28.0 4.0 1.7 3.2 3.31997 .............. 16.1 16.9 9.9 10.3 52.8 10.7 27.4 3.8 1.6 3.1 3.21998 .............. 15.5 16.2 9.4 9.8 51.9 10.2 26.3 3.6 1.6 2.9 3.01999 .............. 15.4 16.1 9.2 9.7 51.0 9.8 25.3 3.4 1.5 2.7 2.9
2000 .............. 15.7 16.5 9.3 9.8 50.1 9.5 24.2 3.2 1.5 2.8 2.92001 .............. 15.6 16.4 9.2 9.6 51.0 9.3 24.7 3.1 1.4 2.8 2.92002 .............. 16.5 17.3 9.8 10.3 51.4 9.3 24.8 3.0 1.5 3.1 3.22003 .............. 17.9 18.7 10.8 11.3 51.1 9.3 24.3 3.0 1.5 3.4 3.62004 .............. 19.0 19.9 11.5 12.0 51.3 9.3 24.6 3.0 1.4 3.6 3.8
2005 .............. 19.2 20.0 11.7 12.2 51.0 9.1 24.7 3.0 1.4 3.7 3.92006 .............. 18.8 19.7 11.5 12.0 51.3 9.1 25.1 3.0 1.4 3.7 3.82007 .............. 19.4 20.2 11.6 12.1 50.3 8.9 24.4 3.0 1.4 3.7 3.9
2008 Base .... 15.9 9.6 3.22008 Total ..... 19.9 20.7 12.1 12.5 50.6 8.9 24.5 3.0 1.4 4.0 4.2
Table 7-7: DEFENSE SHARES OF ECONOMIC AND BUDGETARY AGGREGATES (Continued)(Percentages of Indicated Totals)
Fiscal Year% of Federal Spending % of Net Public Spending
(Federal, State & Local)DoD as % of Public Employment DoD as % of
Total Labor Force
% of Gross Domestic ProductMilitary & Civilian Civilian Only
267
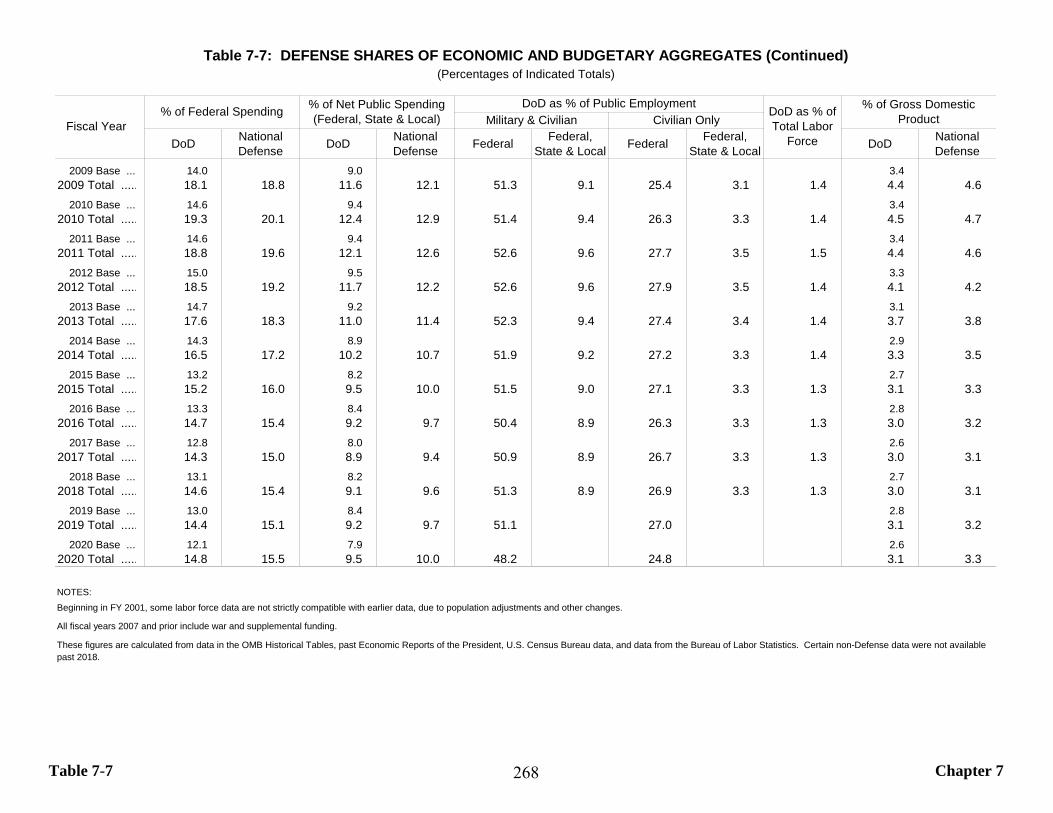
Table 7-7 Chapter 7
DoD National Defense DoD National
Defense Federal Federal, State & Local Federal Federal,
State & Local DoD National Defense
2009 Base .... 14.0 9.0 3.42009 Total ..... 18.1 18.8 11.6 12.1 51.3 9.1 25.4 3.1 1.4 4.4 4.6
2010 Base .... 14.6 9.4 3.42010 Total ..... 19.3 20.1 12.4 12.9 51.4 9.4 26.3 3.3 1.4 4.5 4.7
2011 Base .... 14.6 9.4 3.42011 Total ..... 18.8 19.6 12.1 12.6 52.6 9.6 27.7 3.5 1.5 4.4 4.6
2012 Base .... 15.0 9.5 3.32012 Total ..... 18.5 19.2 11.7 12.2 52.6 9.6 27.9 3.5 1.4 4.1 4.2
2013 Base .... 14.7 9.2 3.12013 Total ..... 17.6 18.3 11.0 11.4 52.3 9.4 27.4 3.4 1.4 3.7 3.8
2014 Base .... 14.3 8.9 2.92014 Total ..... 16.5 17.2 10.2 10.7 51.9 9.2 27.2 3.3 1.4 3.3 3.5
2015 Base .... 13.2 8.2 2.72015 Total ..... 15.2 16.0 9.5 10.0 51.5 9.0 27.1 3.3 1.3 3.1 3.3
2016 Base .... 13.3 8.4 2.82016 Total ..... 14.7 15.4 9.2 9.7 50.4 8.9 26.3 3.3 1.3 3.0 3.2
2017 Base .... 12.8 8.0 2.62017 Total ..... 14.3 15.0 8.9 9.4 50.9 8.9 26.7 3.3 1.3 3.0 3.1
2018 Base .... 13.1 8.2 2.72018 Total ..... 14.6 15.4 9.1 9.6 51.3 8.9 26.9 3.3 1.3 3.0 3.1
2019 Base .... 13.0 8.4 2.82019 Total ..... 14.4 15.1 9.2 9.7 51.1 27.0 3.1 3.2
2020 Base .... 12.1 7.9 2.62020 Total ..... 14.8 15.5 9.5 10.0 48.2 24.8 3.1 3.3
NOTES:Beginning in FY 2001, some labor force data are not strictly compatible with earlier data, due to population adjustments and other changes.
All fiscal years 2007 and prior include war and supplemental funding.
These figures are calculated from data in the OMB Historical Tables, past Economic Reports of the President, U.S. Census Bureau data, and data from the Bureau of Labor Statistics. Certain non-Defense data were not available past 2018.
Table 7-7: DEFENSE SHARES OF ECONOMIC AND BUDGETARY AGGREGATES (Continued)(Percentages of Indicated Totals)
Fiscal Year% of Federal Spending % of Net Public Spending
(Federal, State & Local)DoD as % of Public Employment DoD as % of
Total Labor Force
% of Gross Domestic ProductMilitary & Civilian Civilian Only
268
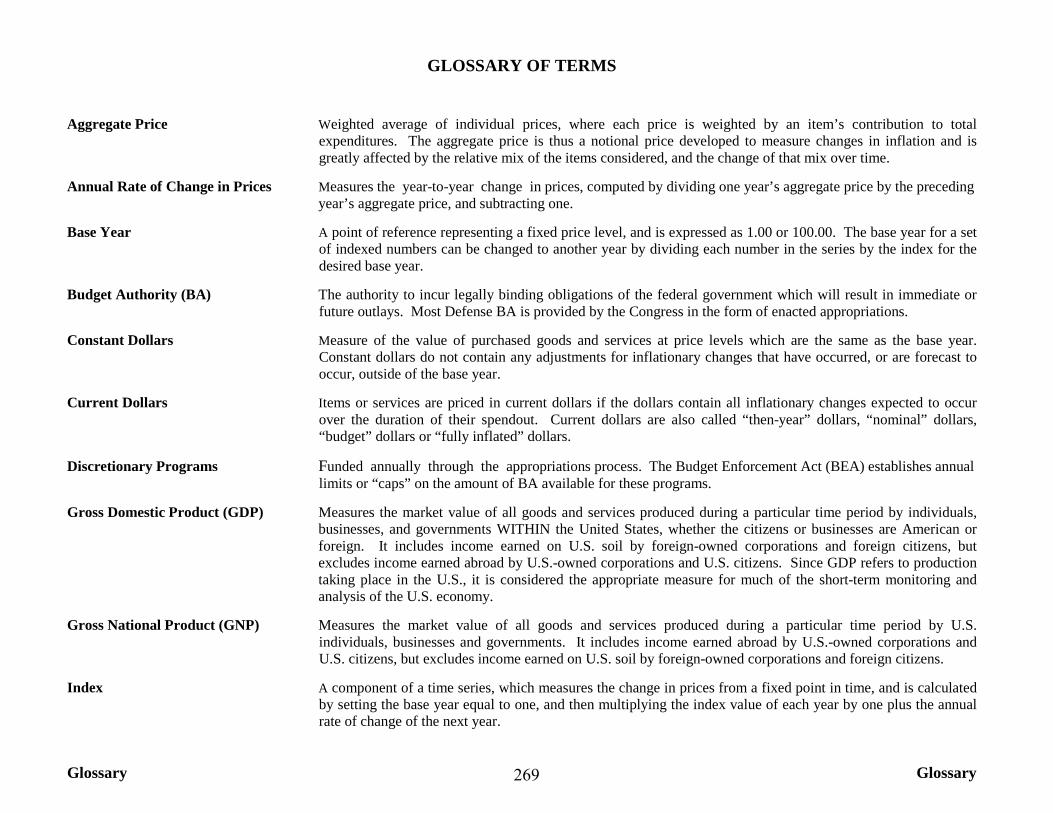
Glossary Glossary
GLOSSARY OF TERMS
Aggregate Price Weighted average of individual prices, where each price is weighted by an item’s contribution to total expenditures. The aggregate price is thus a notional price developed to measure changes in inflation and is greatly affected by the relative mix of the items considered, and the change of that mix over time.
Annual Rate of Change in Prices Measures the year-to-year change in prices, computed by dividing one year’s aggregate price by the preceding year’s aggregate price, and subtracting one.
Base Year A point of reference representing a fixed price level, and is expressed as 1.00 or 100.00. The base year for a set of indexed numbers can be changed to another year by dividing each number in the series by the index for the desired base year.
Budget Authority (BA) The authority to incur legally binding obligations of the federal government which will result in immediate or future outlays. Most Defense BA is provided by the Congress in the form of enacted appropriations.
Constant Dollars Measure of the value of purchased goods and services at price levels which are the same as the base year. Constant dollars do not contain any adjustments for inflationary changes that have occurred, or are forecast to occur, outside of the base year.
Current Dollars Items or services are priced in current dollars if the dollars contain all inflationary changes expected to occur over the duration of their spendout. Current dollars are also called “then-year” dollars, “nominal” dollars, “budget” dollars or “fully inflated” dollars.
Discretionary Programs Funded annually through the appropriations process. The Budget Enforcement Act (BEA) establishes annual limits or “caps” on the amount of BA available for these programs.
Gross Domestic Product (GDP) Measures the market value of all goods and services produced during a particular time period by individuals, businesses, and governments WITHIN the United States, whether the citizens or businesses are American or foreign. It includes income earned on U.S. soil by foreign-owned corporations and foreign citizens, but excludes income earned abroad by U.S.-owned corporations and U.S. citizens. Since GDP refers to production taking place in the U.S., it is considered the appropriate measure for much of the short-term monitoring and analysis of the U.S. economy.
Gross National Product (GNP) Measures the market value of all goods and services produced during a particular time period by U.S. individuals, businesses and governments. It includes income earned abroad by U.S.-owned corporations and U.S. citizens, but excludes income earned on U.S. soil by foreign-owned corporations and foreign citizens.
Index A component of a time series, which measures the change in prices from a fixed point in time, and is calculated by setting the base year equal to one, and then multiplying the index value of each year by one plus the annual rate of change of the next year.
269
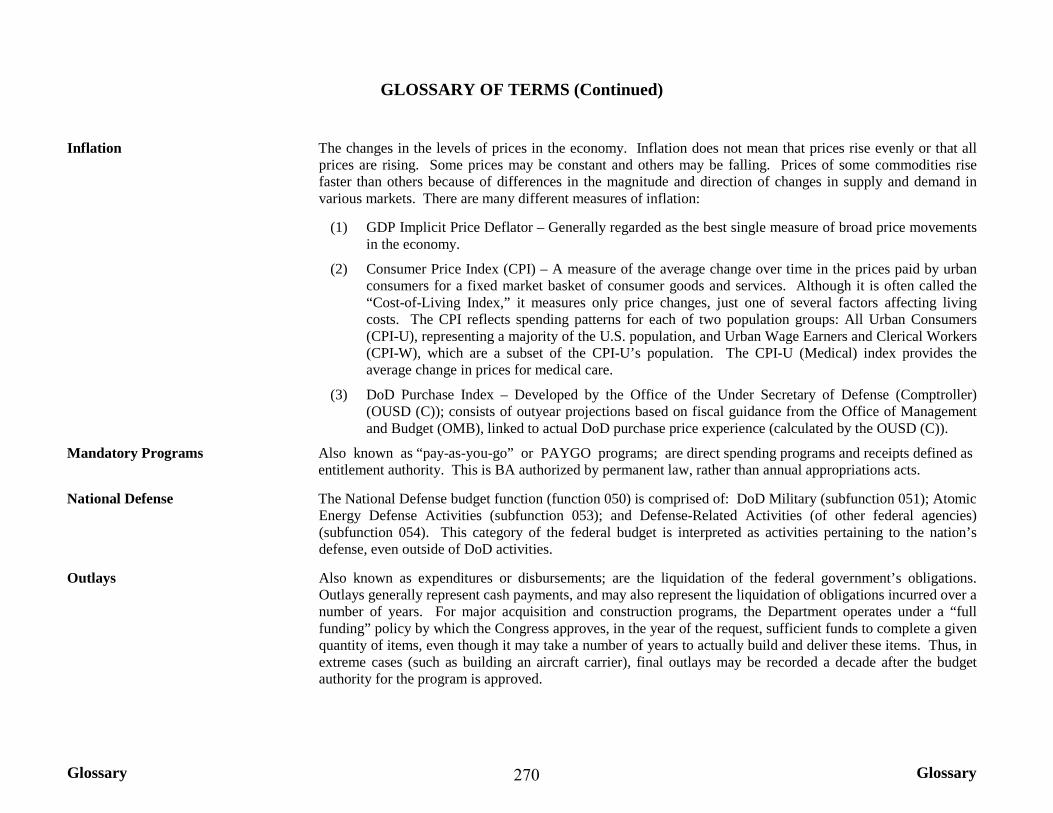
Glossary Glossary
GLOSSARY OF TERMS (Continued)
Inflation The changes in the levels of prices in the economy. Inflation does not mean that prices rise evenly or that all prices are rising. Some prices may be constant and others may be falling. Prices of some commodities rise faster than others because of differences in the magnitude and direction of changes in supply and demand in various markets. There are many different measures of inflation:
(1) GDP Implicit Price Deflator – Generally regarded as the best single measure of broad price movements in the economy.
(2) Consumer Price Index (CPI) – A measure of the average change over time in the prices paid by urban consumers for a fixed market basket of consumer goods and services. Although it is often called the “Cost-of-Living Index,” it measures only price changes, just one of several factors affecting living costs. The CPI reflects spending patterns for each of two population groups: All Urban Consumers (CPI-U), representing a majority of the U.S. population, and Urban Wage Earners and Clerical Workers (CPI-W), which are a subset of the CPI-U’s population. The CPI-U (Medical) index provides the average change in prices for medical care.
(3) DoD Purchase Index – Developed by the Office of the Under Secretary of Defense (Comptroller) (OUSD (C)); consists of outyear projections based on fiscal guidance from the Office of Management and Budget (OMB), linked to actual DoD purchase price experience (calculated by the OUSD (C)).
Mandatory Programs Also known as “pay-as-you-go” or PAYGO programs; are direct spending programs and receipts defined as entitlement authority. This is BA authorized by permanent law, rather than annual appropriations acts.
National Defense The National Defense budget function (function 050) is comprised of: DoD Military (subfunction 051); Atomic Energy Defense Activities (subfunction 053); and Defense-Related Activities (of other federal agencies) (subfunction 054). This category of the federal budget is interpreted as activities pertaining to the nation’s defense, even outside of DoD activities.
Outlays Also known as expenditures or disbursements; are the liquidation of the federal government’s obligations. Outlays generally represent cash payments, and may also represent the liquidation of obligations incurred over a number of years. For major acquisition and construction programs, the Department operates under a “full funding” policy by which the Congress approves, in the year of the request, sufficient funds to complete a given quantity of items, even though it may take a number of years to actually build and deliver these items. Thus, in extreme cases (such as building an aircraft carrier), final outlays may be recorded a decade after the budget authority for the program is approved.
270
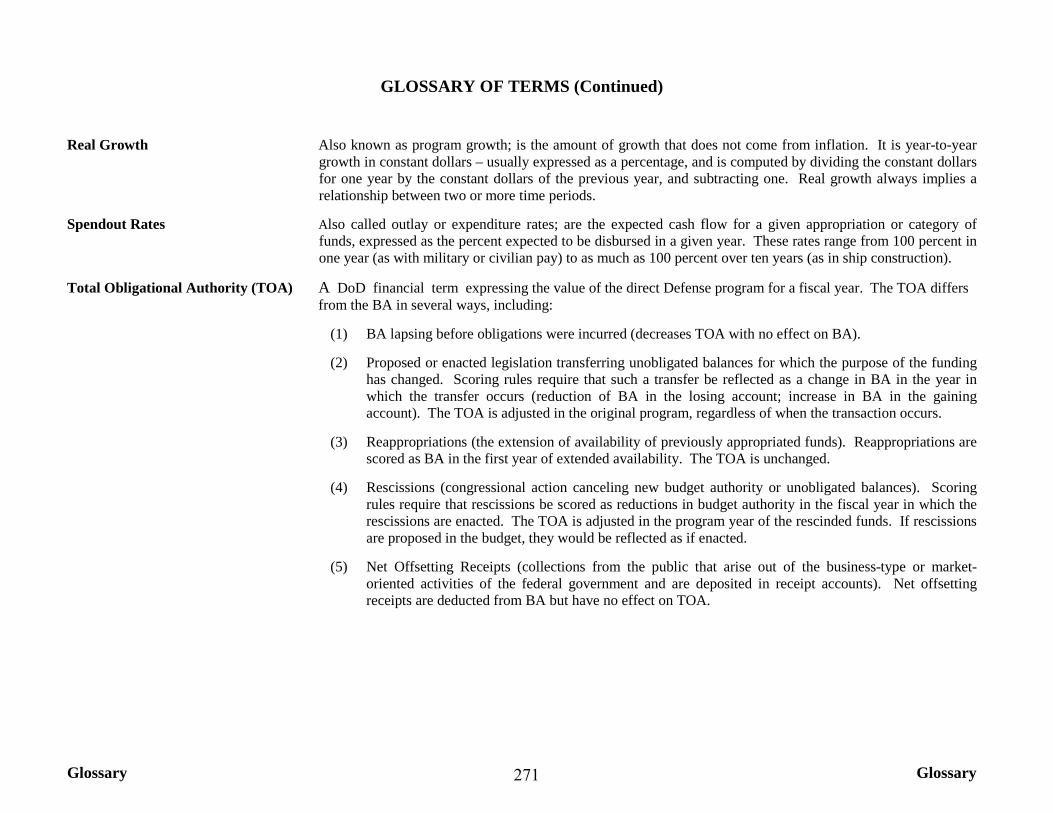
Glossary Glossary
GLOSSARY OF TERMS (Continued)
Real Growth Also known as program growth; is the amount of growth that does not come from inflation. It is year-to-year growth in constant dollars – usually expressed as a percentage, and is computed by dividing the constant dollars for one year by the constant dollars of the previous year, and subtracting one. Real growth always implies a relationship between two or more time periods.
Spendout Rates Also called outlay or expenditure rates; are the expected cash flow for a given appropriation or category of funds, expressed as the percent expected to be disbursed in a given year. These rates range from 100 percent in one year (as with military or civilian pay) to as much as 100 percent over ten years (as in ship construction).
Total Obligational Authority (TOA) A DoD financial term expressing the value of the direct Defense program for a fiscal year. The TOA differs from the BA in several ways, including:
(1) BA lapsing before obligations were incurred (decreases TOA with no effect on BA).
(2) Proposed or enacted legislation transferring unobligated balances for which the purpose of the funding has changed. Scoring rules require that such a transfer be reflected as a change in BA in the year in which the transfer occurs (reduction of BA in the losing account; increase in BA in the gaining account). The TOA is adjusted in the original program, regardless of when the transaction occurs.
(3) Reappropriations (the extension of availability of previously appropriated funds). Reappropriations are scored as BA in the first year of extended availability. The TOA is unchanged.
(4) Rescissions (congressional action canceling new budget authority or unobligated balances). Scoring rules require that rescissions be scored as reductions in budget authority in the fiscal year in which the rescissions are enacted. The TOA is adjusted in the program year of the rescinded funds. If rescissions are proposed in the budget, they would be reflected as if enacted.
(5) Net Offsetting Receipts (collections from the public that arise out of the business-type or market-oriented activities of the federal government and are deposited in receipt accounts). Net offsetting receipts are deducted from BA but have no effect on TOA.
271
This Page Intentionally Left Blank
272
Notes Notes
NOTES Civilian Pay The composition of civilian pay as displayed and used for calculating the figures in this book changes over the
fiscal years. Originally, the civilian pay figures consisted of everything: funding for all U.S. hires, foreign hires, direct and reimbursably-funded hires, and all personnel benefits. This is the case for the historical data, up through FY 2010.
The figures for FY 2011 and later are intended to represent the civilian pay dollars to which the civilian pay raise rates are applied. This excludes all foreign hire funding, civilian retirement benefits, and a small portion of other personnel benefits.
However, one exception to the above-mentioned parameters can be found in Table 6-14, “Department of Defense Civilian Pay” (and the corresponding Table 6-15, “Department of Defense Civilian Pay” – in constant dollars). For 2011 onward, these tables are designed to match the civilian pay reported in the Department’s OP-8 exhibit, “Total Civilian Personnel Costs,” as part of the annual submission of Defense budget justification material to the Congress.
Gross National Product In December 1991, U.S. National Income and Product Accounts (NIPAs) shifted emphasis from the Gross & Gross Domestic Product National Product (GNP) to the Gross Domestic Product (GDP). Both GNP and GDP measure output at market
prices, but in a slightly different manner. The distinction between GNP and GDP is not very great for the United States because relatively few U.S. citizens work abroad, and U.S. earnings on foreign investments are about the same as foreign earnings within the United States.
Change in Account Structure In FY 1992 and FY 1993, funds were appropriated in Defense accounts supporting domestic, rather than defense, programs. Using the rules and definitions of the Budget Enforcement Act, the OMB scored these appropriations in the correct domestic functions rather than in the DoD Military subfunction (051). Data in this book display the total DoD budget request and include these amounts.
Changes in Scorekeeping Rescissions: Before the amended FY 1989 budget was submitted, rescissions of prior year unobligated balances were reflected as adjustments only against TOA in the applicable program year. However, since then, both the Congressional Budget Office (CBO) and the OMB score such rescissions as reductions to current year BA with one large exception. Fifteen billion dollars were appropriated for the Persian Gulf Regional Defense Fund in FY 1991. Only $304 million was transferred to other defense accounts to offset Operation Desert Storm costs. The balance of $14.696 billion was rescinded, and FY 1991 BA was reduced rather than reducing BA in the current year.
273
Notes Notes
NOTES (Continued)
Changes in Scorekeeping (Cont.) Reappropriations were previously scored as new BA in the year of legislation. However, in presenting the amended FY 1989 budget, the CBO and the OMB directed scoring of reappropriations as BA in the first year of new availability (first year after original availability would lapse).
Retired Pay/Accrual In accrual-based financing, transactions are counted when the order is made or a service takes place, even if no cash has changed hands yet. Cash-based financing recognizes transactions only when cash is actually received or paid. For FY 1985, the OMB historical tables moved National Defense BA and outlays for the actual Military Retired Pay accounts (which were cash-based) from the DoD Military subfunction (051) to the Income Security function (600), and replaced it with an estimate for Military Retired Pay Accrual. So for FY 1948 through FY 1984, the DoD BA and outlay tables in this book reflect military retired pay on a CASH basis. After FY 1984, the BA and outlays reflect only the ACCRUAL cost of military retirement.
The FY 2003 budget shifted the costs of civilian and military health care from central accounts to which they had been charged, to the affected program accounts as accruals. For comparability, the OMB included imputed amounts for these shifts in their FY 2001 and FY 2002 data for the DoD Military subfunction (051). This book does not include the accrual costs of those transfers.
274