Embed Size (px)
DESCRIPTION
National Consultation with TNMC 3 May 2005, Bangkok WUP-FIN Phase II – Model development. Nam Songram watershed area. Area: 13 126 km2 Elevation: min 135 m amsl max 675 m amsl. Tools. 2D distributed hydrological model coupled with a 1D hydrodynamic river, reservoir and lake model - PowerPoint PPT Presentation
Citation preview
National Consultation with TNMC 3 May 2005, Bangkok
WUP-FIN Phase II – Model development
2
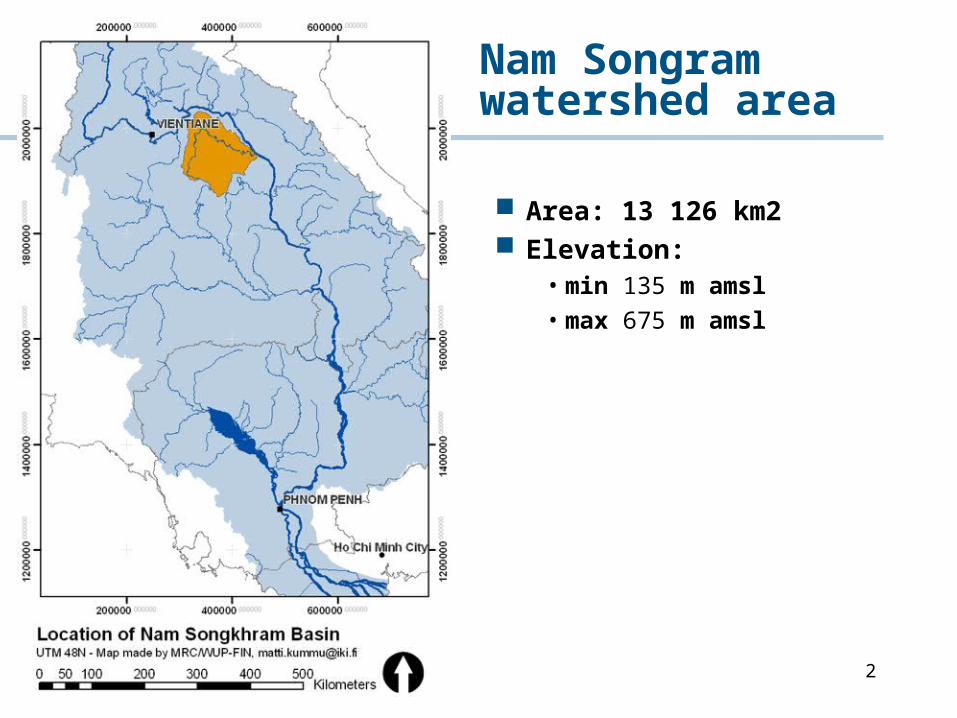
Nam Songram watershed area
Area: 13 126 km2 Elevation:
• min 135 m amsl• max 675 m amsl
3
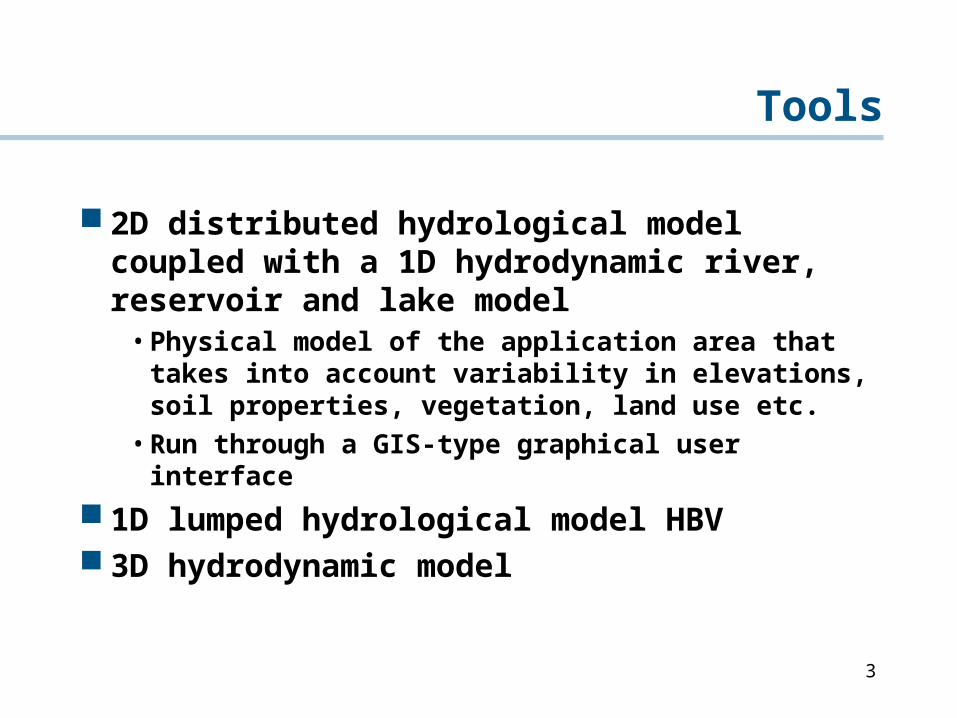
Tools
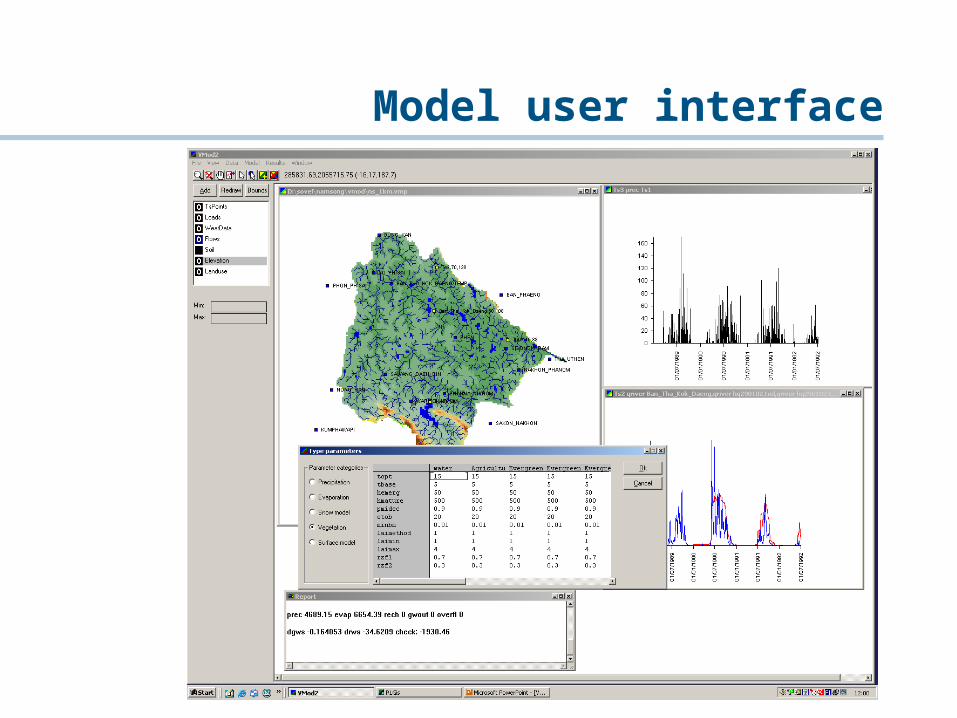
2D distributed hydrological model coupled with a 1D hydrodynamic river, reservoir and lake model• Physical model of the application area that takes into
account variability in elevations, soil properties, vegetation, land use etc.• Run through a GIS-type graphical user interface
1D lumped hydrological model HBV 3D hydrodynamic model
4
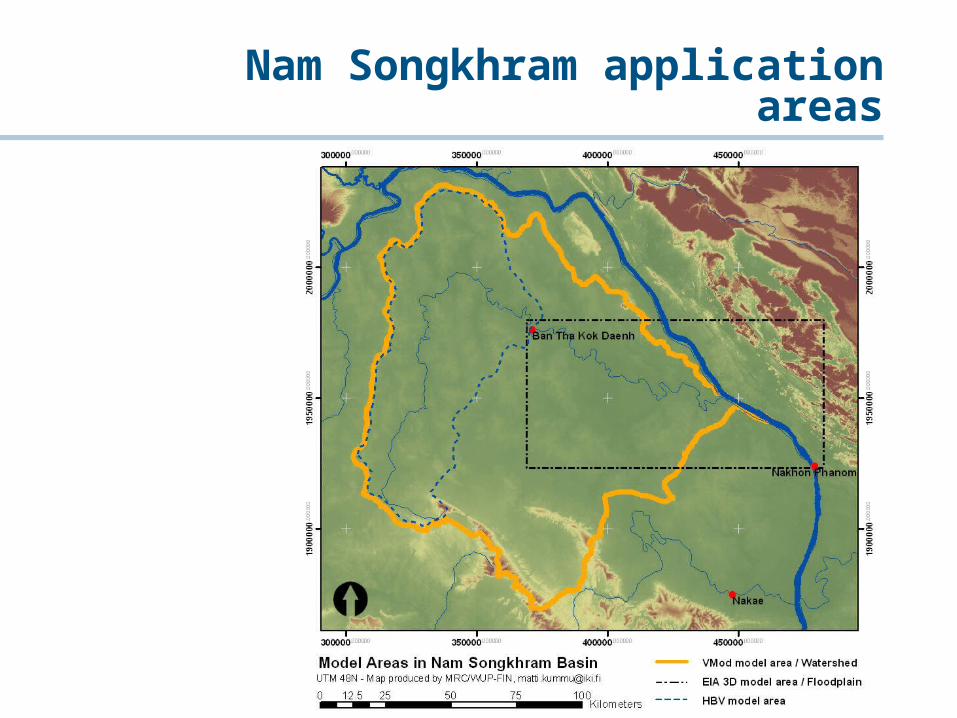
Nam Songkhram application areas
5
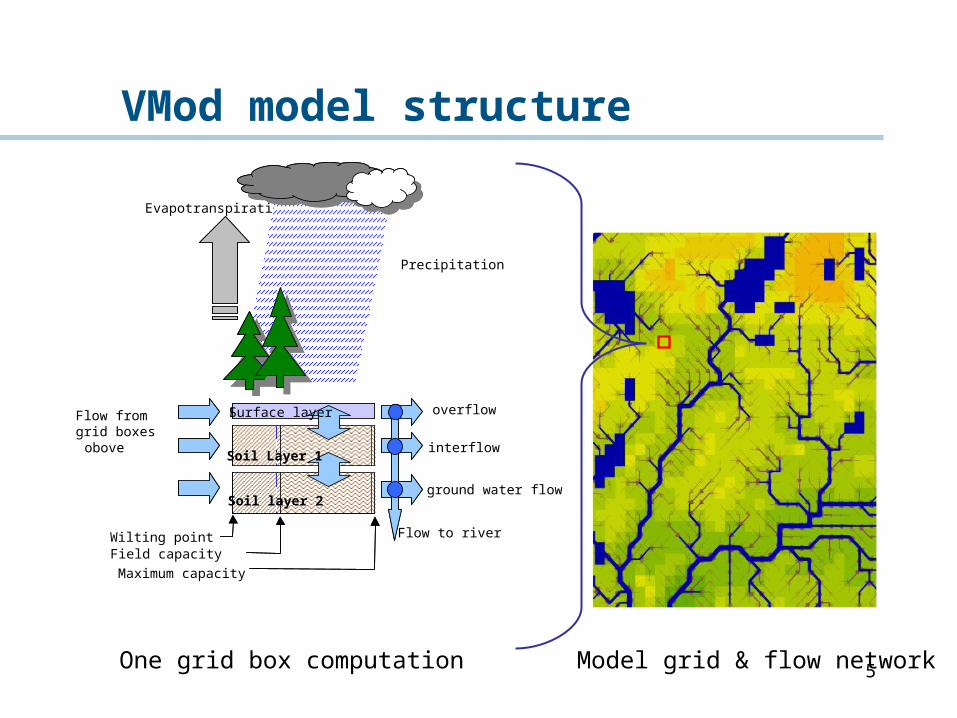
VMod model structure
Flow from grid boxesobove
overflow
interflow
kerros 2
kerros 1
Pintakerros
Evapotranspiration
ground water flow
Flow to river
Soil layer 2
Soil Layer 1
Surface layer
Wilting pointField capacity
Maximum capacity
Precipitation
One grid box computation Model grid & flow network
6
Data
Digital elevation map for the land area with 50 m resolution from old topographical maps and new SRTM elevation model with 90 m resolution (MRC)
Hydrographic atlas for Mekong mainstream, bathymetry of the river (MRC)
The older (1997) and new (year 2002) land use data (MRC).
Soil types (MRC) Location of river networks (MRC) Precipitation from 16 stations at or near the
watershed (MRC)
7
Data
Temperature (daily minimum and maximum temperatures) from one station at the watershed and a few further away (MRC)
Evaporation from three stations at or near the watershed and a few further away (MRC)
Discharge and water level observations form two points on the watershed: Ban Tha Kok Daeng and Nam Oon dam
Discharge and water levels from the Mekong mainstream river• Nakhon Phanom measured water levels and discharges• Discharge from DSF to 3D model upper boundary
condition in Mekong mainstream
8
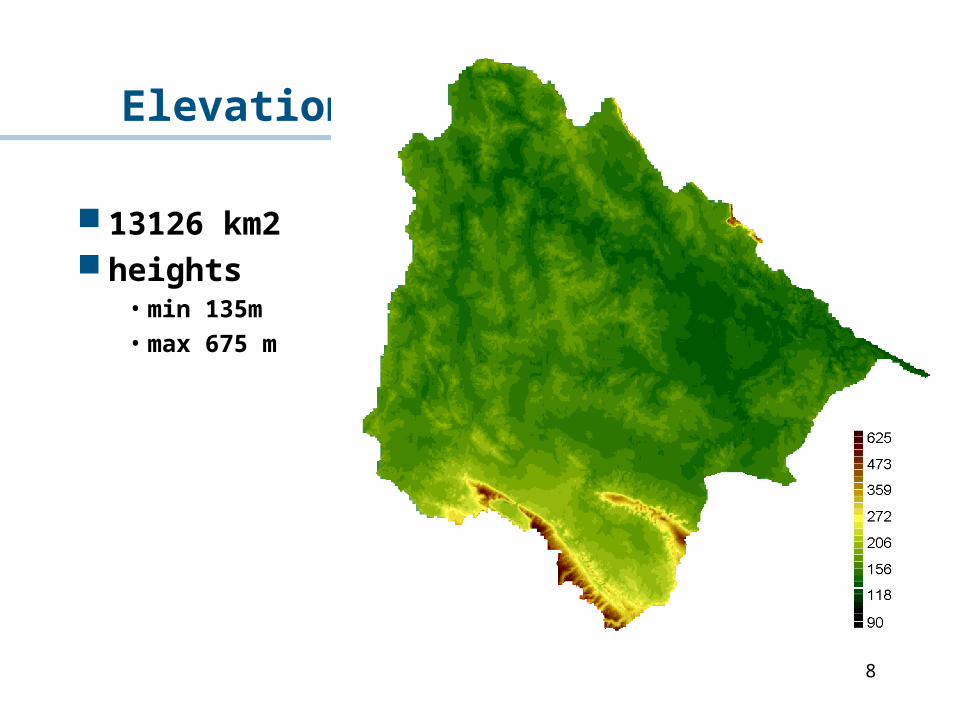
Elevation
13126 km2 heights
• min 135m• max 675 m
9
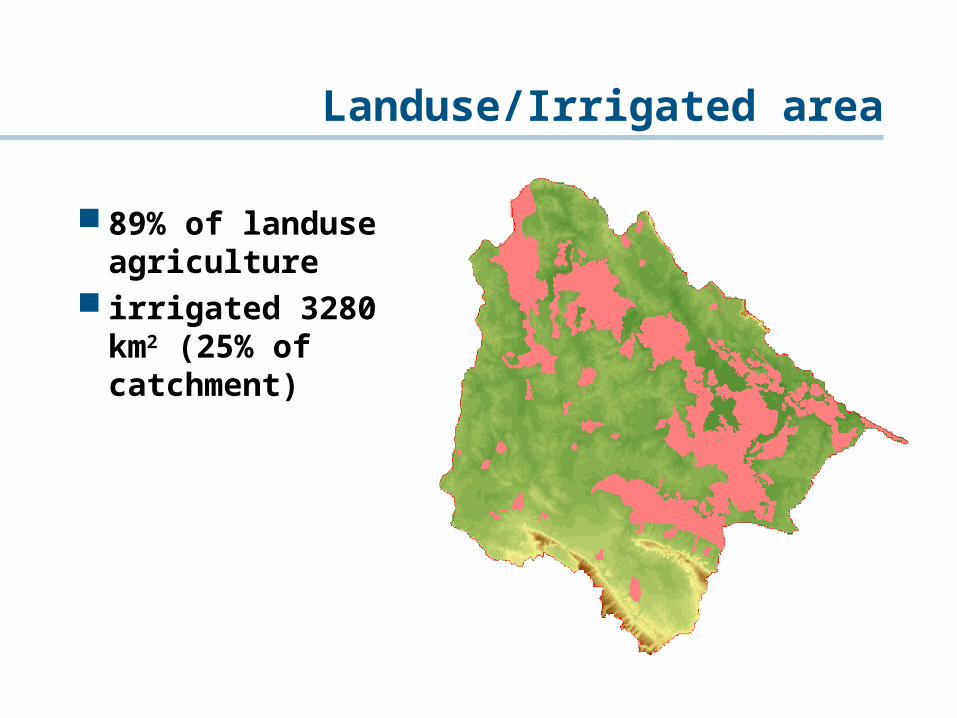
Landuse/Irrigated area
89% of landuse agriculture
irrigated 3280 km2 (25% of catchment)
10
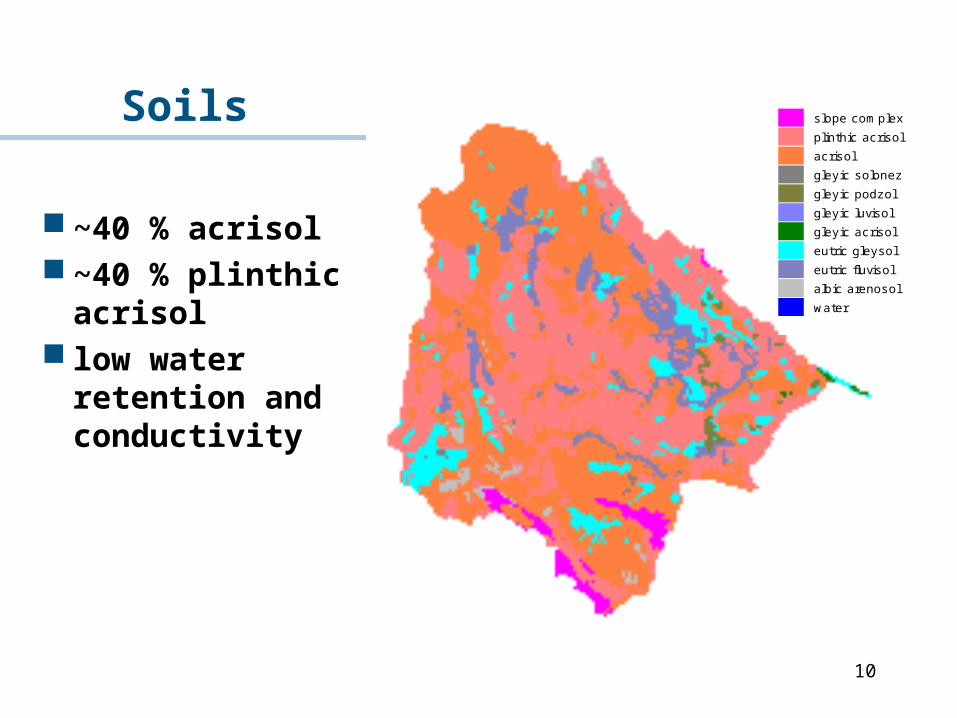
wateralbic arenosoleutric fluvisoleutric gleysolgleyic acrisolgleyic luvisolgleyic podzolgleyic solonezacrisolplinthic acrisolslope complexSoils
~40 % acrisol ~40 % plinthic
acrisol low water retention
and conductivity
11
SAHATSAKHAN
KUMPHAWAPI
NONG_HAN PHANNA_NIKHOM
SAWANG_DAEN_DIN
PHEN
WARITCHAPHUM
SAKON_NAKHON
THA_UTHEN NAKHON_PHANOM
SISONGKHRAM
BAN_PHAENG PHON_PHISAI
BUNG_KAN
BAN_THA_KOK_DAENG SO_PHISAI
BAN_THA_KOK_DAENG/TEMP
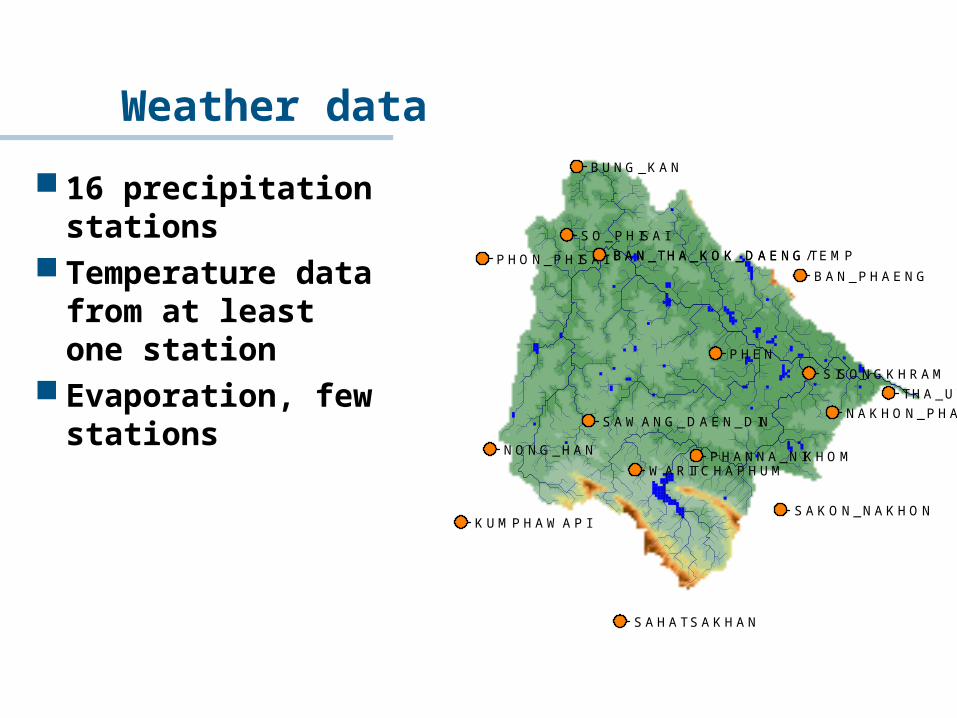
Weather data
16 precipitation stations
Temperature data from at least one station
Evaporation, few stations
12
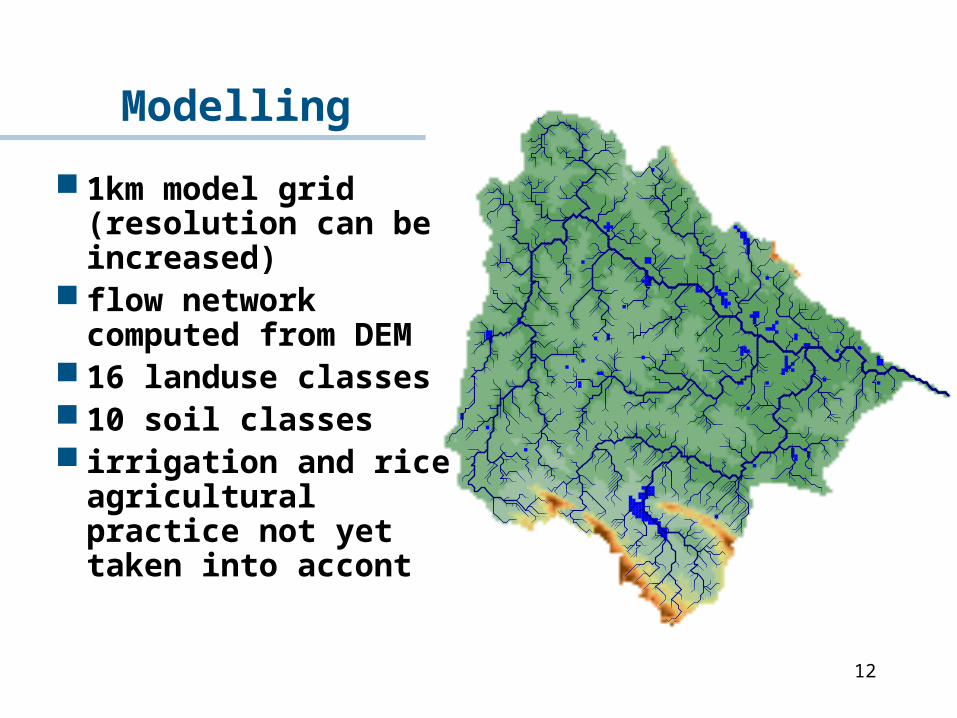
Modelling
1km model grid (resolution can be increased)
flow network computed from DEM
16 landuse classes 10 soil classes irrigation and rice
agricultural practice not yet taken into accont
13
Model user interface
14
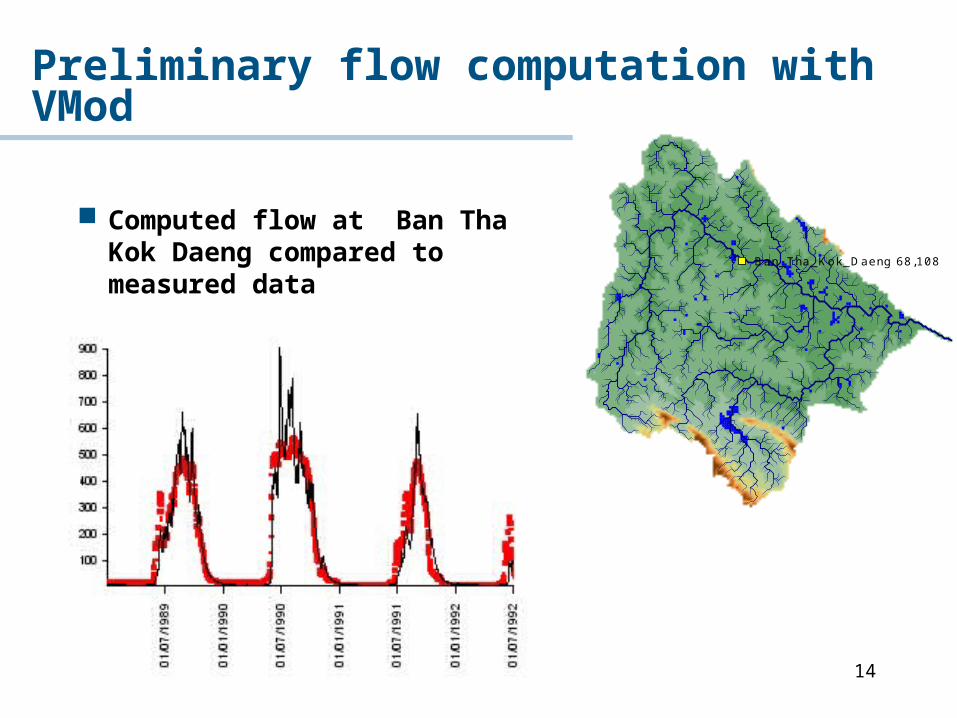
Computed flow at Ban Tha Kok Daeng compared to measured data Ban_Tha_Kok_Daeng 68,108
Preliminary flow computation with VMod
15
3D hydrodynamic and WQ application
3D hydrodynamic model coupled with a water quality model
3D hydrodynamics flood arrival time, duration and depth in different
locations of the modelled area, other flood characteristics
Water quality: sediment concentration, net-sedimentation, oxygen, etc
Run through a GIS-type graphical user interface
16
Input data for the 3D model
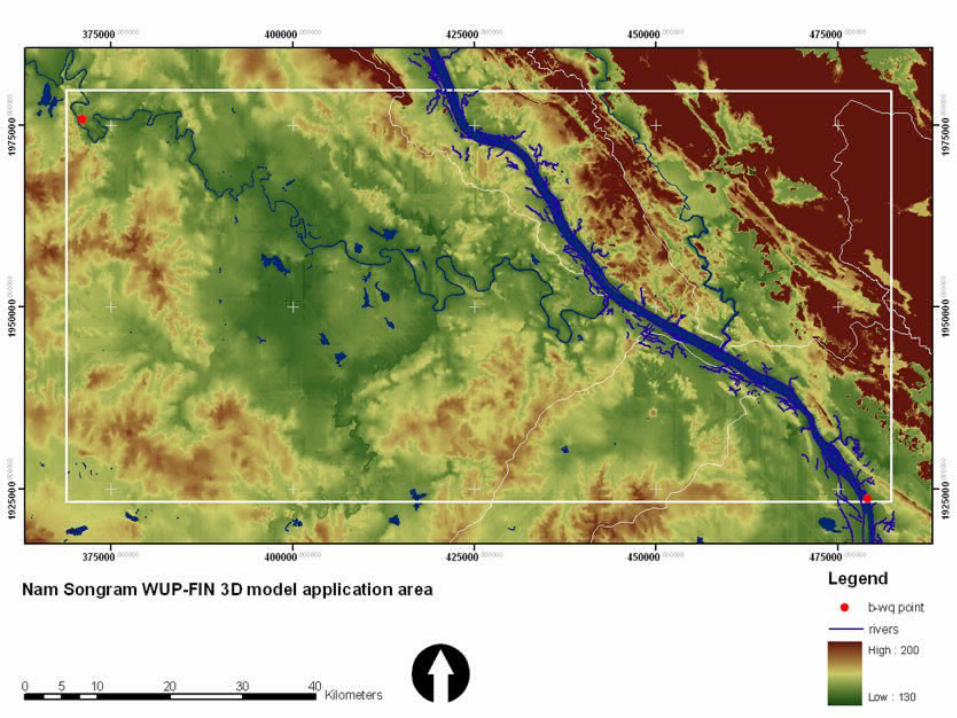
River and floodplain topography• Hydrographic atlas data • river cross-sections for Nam Songkhram • digital elevation map (DEM) for floodplain
Boundary conditions• Upstream discharge and water level in Mekong• Upstream dishcarge in Nam Songkhram• Downstream rating curve (in Mekong)
Landuse Wind (Precipitation)
17
Digital elevation model and model area
18
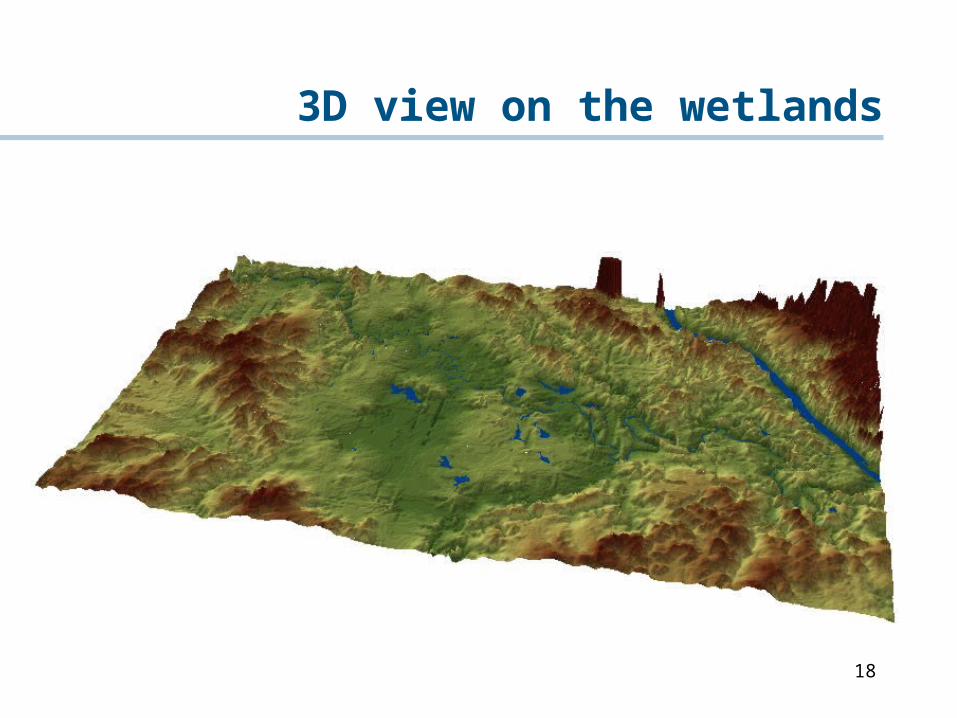
3D view on the wetlands
19
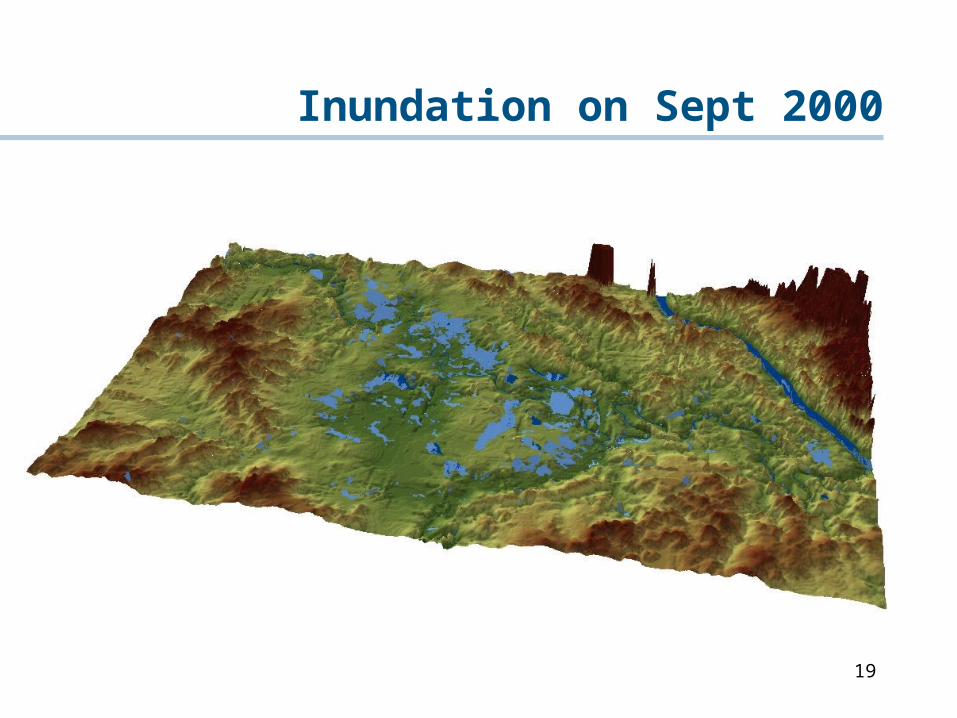
Inundation on Sept 2000
20
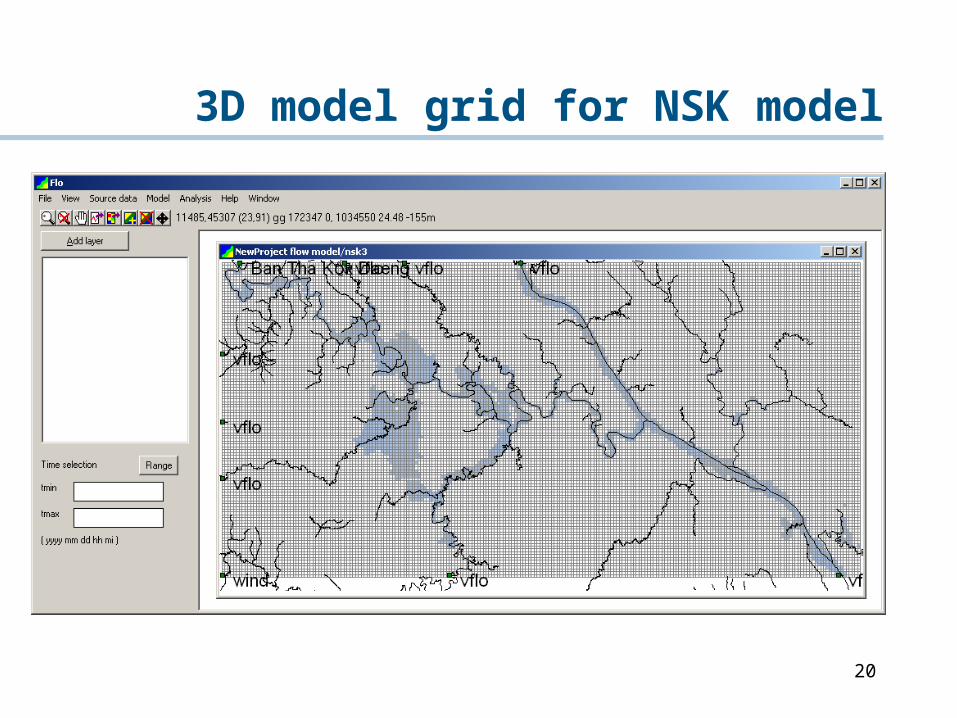
3D model grid for NSK model
21
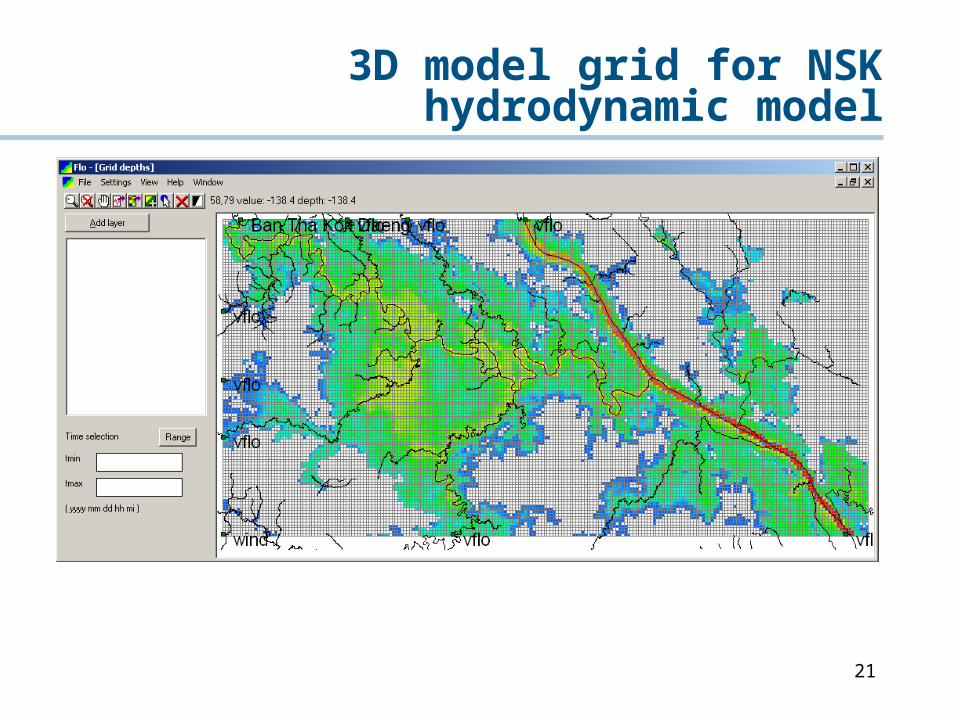
3D model grid for NSK hydrodynamic model
22
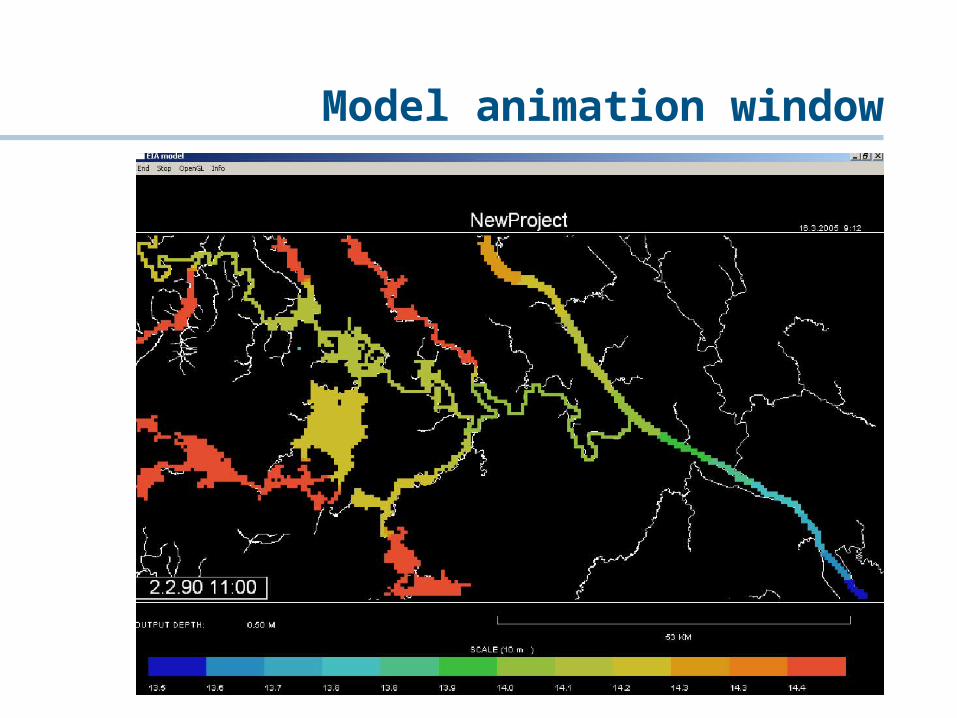
Model animation window
23
Output
Tool to understand the hydrology of the Nam Songkhram watershed
Scenarios• Landuse• Climate change• Irrigation development• Reservoir development
Floodplain dynamics with the 3D model application
Interaction between Nam Songkhram and Mekong
24
Requested data
Socio-Economic data Statistical or spatial district/commune level data
(preferably from many years to see trends) on • primary &secondary occupations, particularly on fish-
related livelihoods • population, including rural/urban population &migration• poverty.
+ info on other reports related to above mentioned issues.
25
Requested dataHydrological, hydrodynamic and water quality model data: Cross section data for Nam Songkhram and other tributaries
including areas from both banks and floodplain: survey by DEDP in 1993 or 1994
Water level and discharge data and rating curves from the Nam Songkhram basin:• Nam Songkhram at Ban Chai Buri and Ban Tha Huai Lua• Nam Oon at Ban Phok Yai, Pannanikom and Bang Nong Bua• Nam Yam at Akat Amnuai and Ban Khon Sai• Huai Khong at Ban Tha Sri Chomchun• Huai Hi at Ban Nong Yang• Nam Mao at Ban Kham Hai
Water level at stations measured by NEDECO in 1981-1982 with temporary gauges.
Irrigation data: irrigation practices, location of pumping stations, discharge of pumping in each station, project area and location, etc.
Ground water levels from as many wells as available Detailed data (height, storage capacity, bridge dimensions etc.)
from existing control structures (dams, weirs, dikes, bridges, road embankments, gates) in the basin.
26
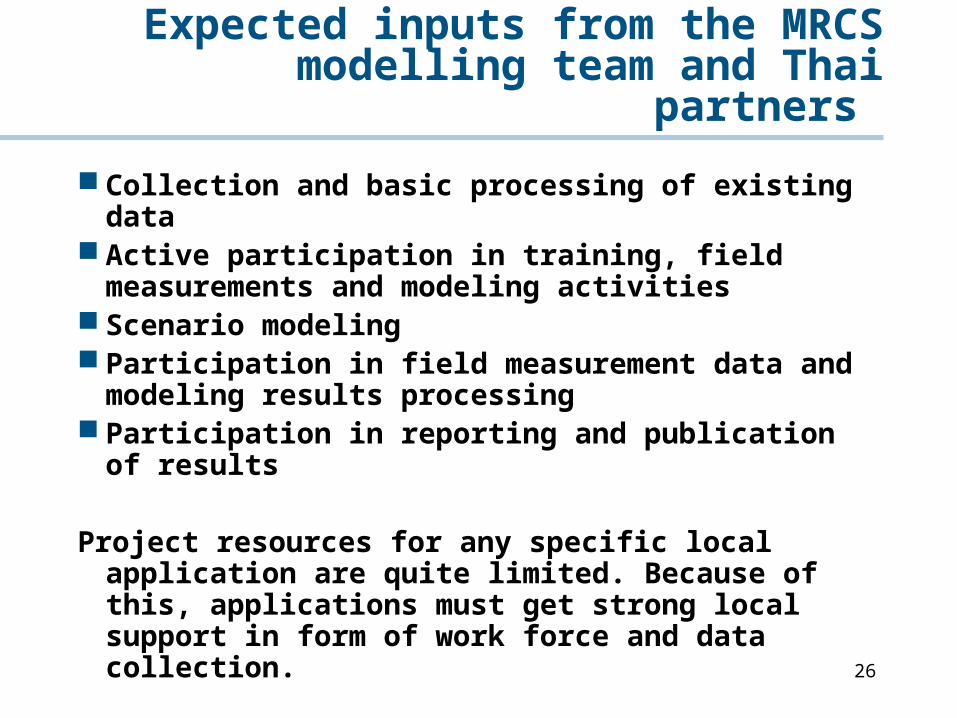
Expected inputs from the MRCS modelling team and Thai partners
Collection and basic processing of existing data Active participation in training, field
measurements and modeling activities Scenario modeling Participation in field measurement data and
modeling results processing Participation in reporting and publication of
results
Project resources for any specific local application are quite limited. Because of this, applications must get strong local support in form of work force and data collection.
27
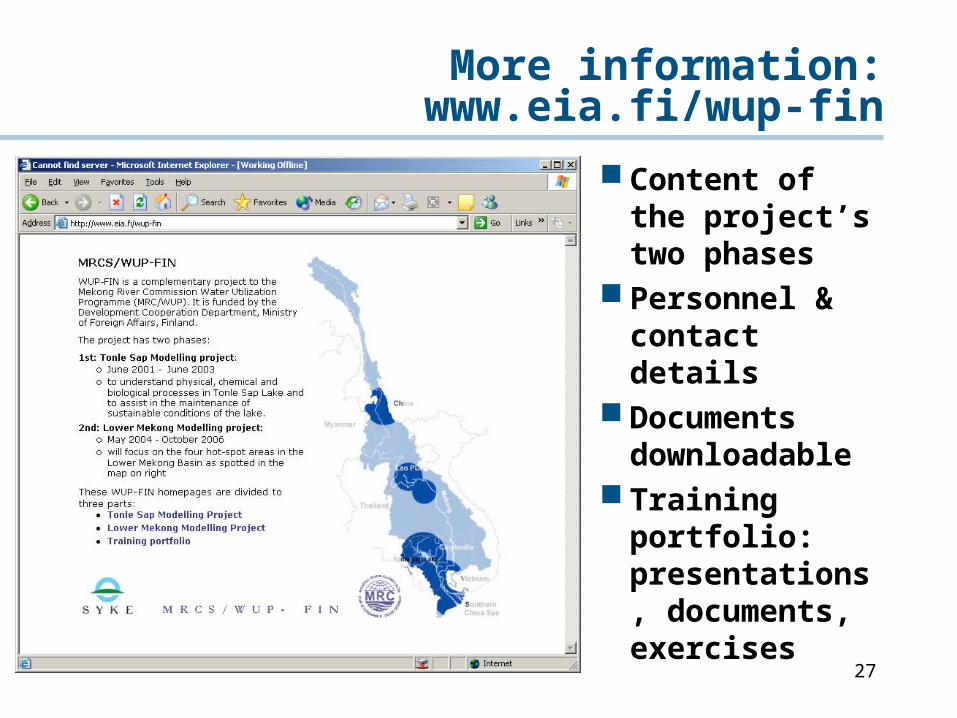
More information:www.eia.fi/wup-fin
Content of the project’s two phases
Personnel & contact details
Documents downloadable
Training portfolio: presentations, documents, exercises
MRCS/WUP-FINwww.eia.fi/wup-fin