Embed Size (px)
Citation preview

NATIONAL CONFERENCE OF STATE LEGISLATURES GAS PIPELINE SAFETY & EMISSIONS ARTHUR A. SHAPIRO, Energy Experts International
Dec . 9, 2014

“AGA and its members are dedicated to the continued
enhancement of pipeline safety.
As such, we are committed to proactively collaborating
with public officials, emergency responders, excavators,
consumers, safety advocates and members of the
public to continue to improve the industry’s longstanding
record of providing natural gas service safely and
effectively…”
From: AGA’s Commitment to Enhancing Safety
2

“RESOLVED, That the Board of Directors of the National
Association of Regulatory Utility Commissioners… encourages
regulators and industry to consider sensible programs aimed at
replacing the most vulnerable pipelines as quickly as possible
along with the adoption of rate recovery mechanisms that reflect
the financial realities of the particular utility in question; and be it
further.”
“RESOLVED, That State commissions should explore, examine,
and consider adopting alternative rate recovery mechanisms as
necessary to accelerate the modernization, replacement and
expansion of the nation’s natural gas pipeline systems…”
From: National Association of Regulatory Utility Commissioners
3

States with Accelerated Infrastructure
Replacement Programs

The Landscape
• Increasing public
concerns regarding
pipeline safety
• Increasing public interest
and passion regarding
climate change
• Increasing desire for
energy efficiency
• Abundance of domestic
natural gas supplies
Publicly available maps of methane emissions From: EDF.Org website
5

Infrastructure Replacement vs. Repair
Safety and emissions management require a mix of repair and replacement
Companies rely on IMP and DIMP plans to guide repair/replace decisions
Decisions are based upon risk management principles and compliance
Leak history is a major driver of replacement decisions
Multi-state companies must consider local priorities
Leak repairs are performed under O&M plans
Repairs focus on potentially hazardous leaks
Non-hazardous leaks are more common and monitored, rather than repaired
Regulations may change
Timely repair of non-hazardous leaks to reduce emissions may be required
Changing priorities requires supporting replacement of leak-prone materials
6

7
Pipeline Safety Act of 2011 and the next reauthorization
NTSB safety recommendations
AGA’s Commitment to Enhancing Safety
Distribution integrity management programs (DIMP)
Transmission integrity management programs (IMP and IMP2)
GAO and Inspector General studies
Mapping and communications enhancements
Emergency response enhancements
Automatic shutoff valves and remote control valves
Data quality and analysis improvements
Leak detection enhancement
Safety management systems
Legislation, Regulation & Recommendations

Let’s Look at the “Average” U.S. Utility
• These data taken from
utilities’ annual reports to
PHMSA
• The “Average” utility has
<900 miles of mains
• Not shown are
inventories of
transmission lines,
service lines, meter sets,
pressure reduction and
other equipment
Main Inventory
8
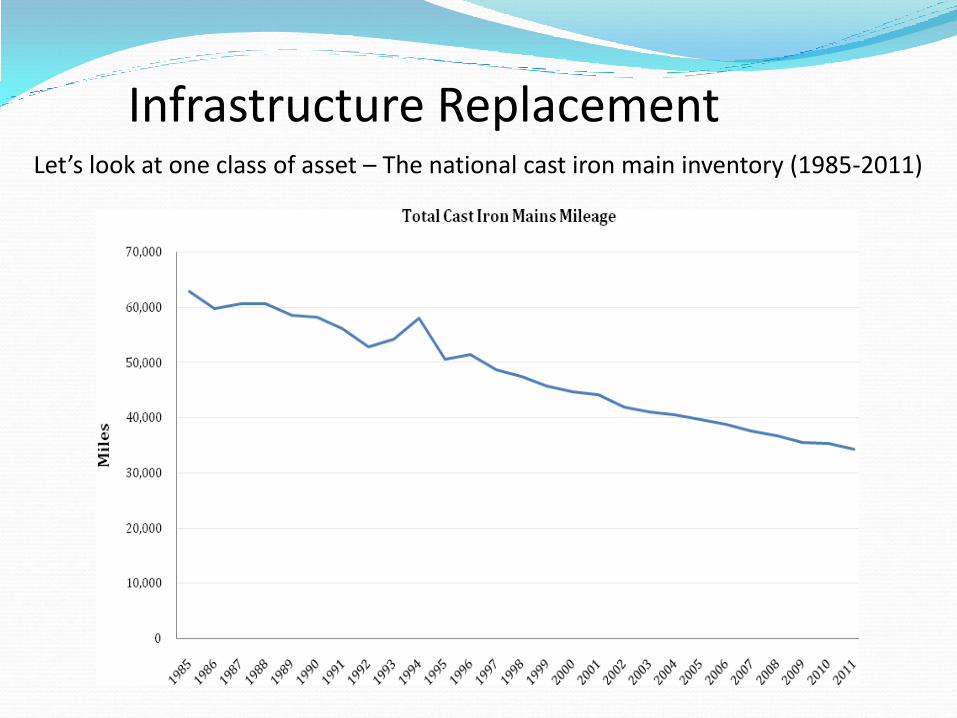
Infrastructure Replacement Let’s look at one class of asset – The national cast iron main inventory (1985-2011)

Infrastructure Replacement
What will it take to replace the remaining US cast iron main inventory?
Can the $83 Billion replacement of US cast iron main be spread over the 71 million US gas customers?
No - The cast iron inventory is not uniformly distributed about the country. From: Managing the Reduction of the Nation’s Cast Iron Inventory, AGA White Paper, 2013
Diameter Cost per mile Cast Iron Mains (Miles) Avg. Replacement cost
<4" $1,584,000 - $2,112,000 14,518 $26,764,075,800
4" to 12" $1,848,000 - $3,696,000 17,224 $47,740,104,720
>12" $3,696,000 - $5,016,000 1,877 $8,178,516,324
TOTAL 33,619 $82,682,696,844
National Cast Iron
Inventory (2011)
10
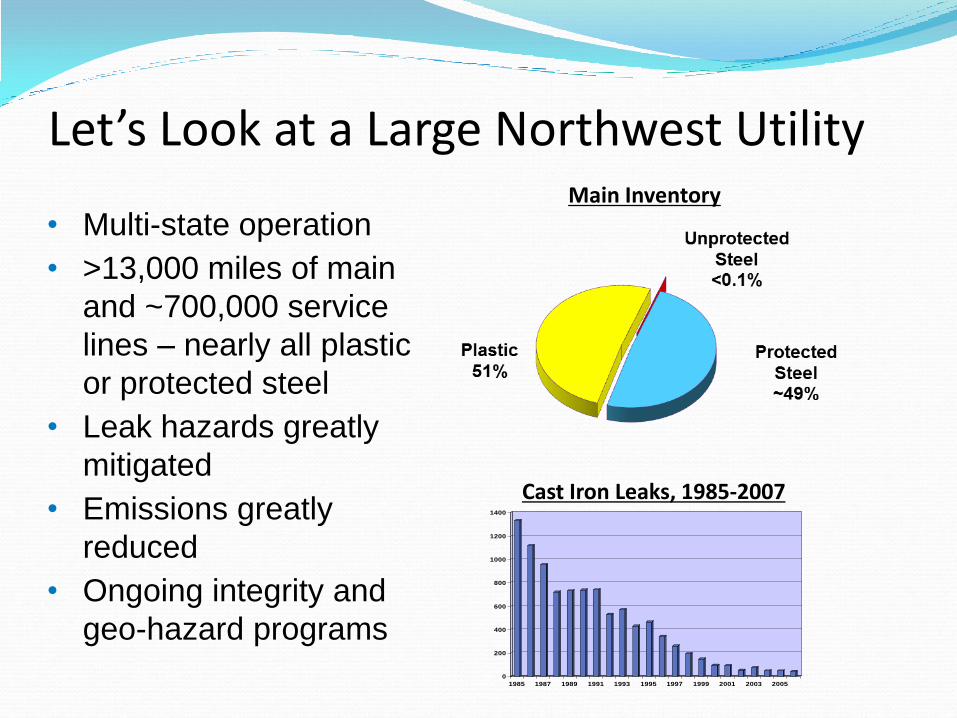
Let’s Look at a Large Northwest Utility
• Multi-state operation
• >13,000 miles of main
and ~700,000 service
lines – nearly all plastic
or protected steel
• Leak hazards greatly
mitigated
• Emissions greatly
reduced
• Ongoing integrity and
geo-hazard programs
Main Inventory
0
200
400
600
800
1000
1200
1400
1985 1987 1989 1991 1993 1995 1997 1999 2001 2003 2005
Cast Iron Leaks, 1985-2007

Let’s Look at a Northeast Mega-Utility
• Multi-state operation
• Millions of customers
• Old metro areas
• >11,000 miles cast
iron and unprotected
steel main
• 500 miles of gas
transmission lines
• >1800 pressure
regulating stations
Inventory
Leak Repairs
12

Replacement of Cast Iron Mains Three scenarios – Inventories and customer bases from three utilities
Cost to replace cast iron ranges from $1.3-$5.2 Billion, $569-$16,462/customer
From: Managing the Reduction of the Nation’s Cast Iron Inventory, AGA White Paper, 2013
Diameter Mileage Cost per mile Avg. Cost per mile Replacement Cost/Diameter
<=4" 759.21 $1,584,000 - $2,112,000 $1,848,000 $1,403,011,645
4" to 12" 1198.77 $1,848,000 - $3,696,000 $2,772,000 $3,323,002,883
>12" 109.80 $3,696,000 - $5,016,000 $4,356,000 $478,308,188
Total Replacement Cost $5,204,322,715
No. of Customers: 608,781
Cost/Customer $8,549
High Cast Iron
Inventory Operator
Diameter Mileage Cost per mile Avg. Cost per mile Total Cost
<=4" 481.00 $1,584,000 - $2,112,000 $1,848,000 $888,888,000
4" to 12" 345.00 $1,848,000 - $3,696,000 $2,772,000 $956,340,000
>12" 5.00 $3,696,000 - $5,016,000 $4,356,000 $21,780,000
Total Replacement Cost $1,867,008,000
No. of Customers: 3,281,746
Cost/Customer $569
Low Cast Iron
Inventory Operator
(High customer
number)
Diameter Mileage Cost per mile Avg. Cost per mile Total Cost
<=4" 172.35 $1,584,000 - $2,112,000 $1,848,000 $318,502,800
4" to 12" 307.99 $1,848,000 - $3,696,000 $2,772,000 $853,748,280
>12" 28.15 $3,696,000 - $5,016,000 $4,356,000 $122,621,400
Total Replacement Cost $1,294,872,480
No. of Customers: 78,660
Cost/Customer $16,462
Low Cast Iron
Inventory Operator
(Low customer
number)

Capital Spend at a Major Utility
Note: Includes proactive and reactive main/service replacements
Service Replacements Main Replacements

Challenges to Be Met Customers
Increasing rates and service disruptions
Inconveniences due to construction work
Questions regarding safety and priorities
Municipalities and Communities
Coordinating and permitting utility and municipal works projects
Public reaction to noise, debris, detours, and parking restrictions
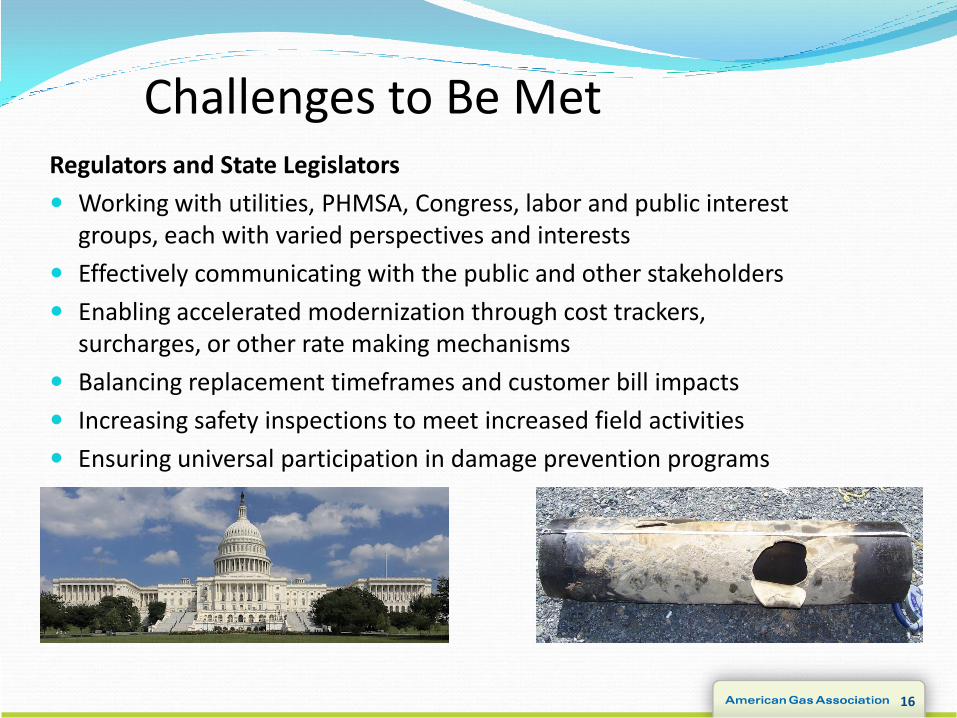
Challenges to Be Met Regulators and State Legislators
Working with utilities, PHMSA, Congress, labor and public interest groups, each with varied perspectives and interests
Effectively communicating with the public and other stakeholders
Enabling accelerated modernization through cost trackers, surcharges, or other rate making mechanisms
Balancing replacement timeframes and customer bill impacts
Increasing safety inspections to meet increased field activities
Ensuring universal participation in damage prevention programs
16

Challenges to Be Met Utilities
Managing existing infrastructure pending its replacement
Communicating effectively with all stakeholders
Prioritizing work on all assets based upon risk
Fixing or monitoring leaks as appropriate
Raising capital and working with regulators on appropriate program timeframes, cost recovery mechanisms and consumer impacts
Staffing up a skilled workforce and management team
Acquiring additional materials, equipment and vehicles
Coordinating with municipalities regarding work permitting, permit costs, and pavement restoration issues
17