Embed Size (px)
Citation preview
National Character and Traits 1
This is the manuscript version of an article that was published in: Science Magazine 310(5745):pp. 96-100. Copyright 2005 For access to the published version, see: http://www.sciencemag.org/cgi/reprint/310/5745/96.pdf or http://dx.doi.org/10.1126/science.1117199
National Character Does Not Reflect Mean Personality Trait Levels in 49 Cultures
A. Terracciano,1* A. M. Abdel-Khalek,2 N. Ádám,3 L. Adamovová,4 C.-k.Ahn,5 H.-n. Ahn,6 B.
M. Alansari,2 L. Alcalay,7 J. Allik,8 A. Angleitner,9 A. Avia,10 L. E. Ayearst,11 C. Barbaranelli,12
A. Beer,13 M. A. Borg-Cunen,14 D. Bratko,15 M. Brunner-Sciarra,16 L. Budzinski,17 N. Camart,18
D. Dahourou,19 F. De Fruyt,20 M. P. de Lima,21 G. E. H. del Pilar,22 E. Diener,23 R. Falzon,14 K.
Fernando,24 E. Ficková,4 R. Fischer,25 C. Flores-Mendoza,26 M. A. Ghayur,27 S. Gülgöz,28 B.
Hagburg,29 J. Halberstadt,24 M. S. Halim,30 M. Hebíková,31 J. Humrichouse,13 H. H. Jensen,32 D.
D. Jocic,33 F. H. Jónsson,34 B. Khoury,35 W. Klinkosz,36 G. Kne⟩evi ,37 M. A. Lauri,14 N.
Leibovich38 T. A. Martin,39 I. Marušić,15 K. A. Mastor,40 D. Matsumoto,41 M. McRorie,42 B.
Meshcheriakov,43 E. L. Mortensen,32 M. Munyae,44 J. Nagy,3 K. Nakazato,45 F. Nansubuga,46 S.
Oishi,47 A. O. Ojedokun,48 F. Ostendorf,9 D. L. Paulhus,49 S. Pelevin,43 J.-M. Petot,18 N.
Podobnik,50 J. L. Porrata,51 V. S. Pramila,52 G. Prentice,42 A. Realo,8 N. Reátegui,16 J.-P.
Rolland,53 J. Rossier,54 W. Ruch,55 V. S. Rus,56 M. L. Sánchez-Bernardos,10 V. Schmidt,38 S.
Sciculna-Calleja,14 A. Sekowski,36 J. Shakespeare-Finch,57 Y. Shimonaka¸58 F. Simonetti,7 T.
Sineshaw,59 J. Siuta,60 P. B. Smith,61 P. D. Trapnell,62 K. K. Trobst,11 L. Wang,63 M. Yik,64 A.
Zupani,65 R. R. McCrae1*
National Character and Traits 2
1National Institute on Aging, NIH, DHHS, Gerontology Research Center, 5600 Nathan Shock
Drive, Baltimore, MD 21224. 2Department of Psychology, Faculty of Social Sciences, University
of Kuwait, P.O. Box 68168, 71962, Kaifan, Kuwait. 3Faculty of Education and Psychology,
Lóránd Eötvös University, 1075 Budapest, Kazinczy u. 23-25, Hungary. 4Institute of
Experimental Psychology, Slovak Academy of Sciences, Dubravska cesta 9, Bratislava, Slovak
Republic, 813 64. 5Department of Education, Pusan National University, 30 Jangjeon-dong,
Geumjeong-gu, Busan 609-735, Republic of Korea. 6Department of Psychology, Pusan National
University, 30 Jangjeon-dong, Geumjeong-gu, Busan 609-735, Republic of Korea. 7Escuela de
Psicologia, Pontificia Universidad Catolica de Chile, Vicuna Mackenna 4860, Macul, Santiago,
Chile. 8Department of Psychology, University of Tartu, Tiigi 78, Tartu, Estonia, 50410.
9University of Bielefeld, Department of Psychology, P.O. Box 100131, Bielefeld, Germany, D-
33501. 10Facultad de Psicología, Universidad Complutense de Madrid, Madrid, Spain.
11Department of Psychology, York University, 4700 Keele Street, Toronto, ON, Canada, M3J
1P3. 12Department of Psychology, University of Rome “La Sapienza,” Via Dei Marsi 78, 00185
Rome, Italy. 13Department of Psychology, University of Iowa, E11 Seashore Hall, Iowa City, IA
52242-1407. 14Department of Psychology, University of Malta, Msida MSD 06 Malta. 15Odsjek
za Psihologiju, Filozofski Fakultet u Zagrebu, I. Lucica 3, Zagreb, Croatia, 10000. 16 Facultad de
Psicología, Universidad Peruana Cayetano Heredia, Av. Armendáriz 497 Miraflores, Lima, Perú.
17Department of Psychology, University of Melbourne, Parkville VIC, 3010, Australia.
18Laboratoire de Psychologie Clinique des Faits Culturels, Universite de Paris-X, 200, Avenue
de la Republique, Nanterre, France, 92001. 19Department of Psychology, University of
Ouagadougou, 03 B.P. 7021 Ouagadougou 03, Burkina Faso. 20Department of Psychology, H.
Dunantlaan, 2, Ghent, Belgium, B-9000. 21Faculdade de Psicologia, Ciencias da Educacao,
National Character and Traits 3
Universidade de Coimbra, Coimbra, Portugal. 22Department of Psychology, University of the
Philippines, Diliman, Quezon City, 1101, Philippines. 23Department of Psychology, University
of Illinois, 603 E. Daniel St., Champaign, IL, US, 61820. 24Department of Psychology,
University of Otago, PO Box 56, Dunedin, New Zealand. 25School of Psychology, PO Box
600,Victoria University of Wellington, Wellington, New Zealand. 26U Federal de Minas Gerais,
Dept de Psicologia, Sala 4042, Av. Antonio Carlos 6627, Belo Horizonte, Brazil. 27Al Akhawayn
University, Ifrane, Morocco; now at Department of Psychology, San Diego State University,
5500 Campanile Dr., San Diego, CA 92182-4611. 28KoΗ University, Sariyer 80910, Istanbul,
Turkey. 29Unit of Gerontology and Care for the Elderly, Lund University, Box 187, S-222 20
Lund, Sweden. 30Faculty of Psychology, Atma Jaya Indonesia Catholic University, Jl. Jenderal
Sudirman kav-51, Jakarta Selatan-12930, Indonesia. 31Academy of Sciences of the Czech
Republic, Vev⊆í 97, 602 00 Brno, Czech Republic. 32Department of Health Psychology,
Institute of Public Health, University of Copenhagen, Blegdamsvej 3, Copenhagen N, Denmark,
DK-2200. 33Institute for Psychiatry, Pasterova 2, Belgrade, Yugoslavia. 34University of Iceland,
Faculty of Social Science, Oddi, Sturlugata, 101 Reykjavík, Iceland. 35Department of Psychiatry,
American University of Beirut Medical Center, P.O.Box 11-0236, Riad El-Solh, Beirut 1107
2020 Lebanon. 36Catholic University of Lublin, Department of Psychology, A1. Raclawickie 14,
Lublin 20-950 Poland. 37Department of Psychology, University of Belgrade, Cika Ljubina 18-20,
11000 Belgrade, Yugoslavia. 38Faculty of Psychology, University of Buenos Aires, Buenos
Aires, Argentina. 39Department of Psychology, Susquehanna University, 514 University Avenue,
Selinsgrove, PA 17870. 40Center for General Studies, Universiti Kebangsaan Malaysia, Selangor
Darul Ehsan, Malaysia. 41Department of Psychology, San Francisco State University, 1600
Holloway Avenue, San Francisco, CA 94132. 42School of Psychology, Queen’s University
National Character and Traits 4
Belfast, Belfast BT7 1NN, Northern Ireland, UK. 43Department of Psychology, International
University "Dubna," 19, Universitetskaya str., Dubna, Moscow area, Russia, 141980. 44Center
for Continuing Education, University of Botswana, Private Bag UB 0022, Gaborone, Botswana.
45Department of Psychology, Iwate Prefectural University, 152-52 Sugo, Takizawa, Iwate, 020-
0193 Japan. 46Department of Organizational Psychology, Makerere University, P.O. Box 7062,
Kampala, Uganda. 47Department of Psychology, University of Virginia, P. O. Box 400400,
Charlottesville, VA 22904-4400. 48Department of Psychology, University of Ibadan, Ibadan,
Nigeria. 49Department of Psychology, The University of British Columbia, Vancouver, Canada
V6T 1Z4. 50Psychiatric Hospital of Idrija, Pot Sv. Antona 49 Idrija, 5280 Slovenia. 51Escuela
Graduada de Administracion Publica, Universidad de Puerto Rico, Rio Piedras, Puerto Rico.
52Department of Psychology, Andhra University, Visakhapatnam 530 003, Andhra Pradesh,
India. 53Universitϑ Paris 10, STAPS Dept, 200 Avenue de la Rϑpublique, Nanterre, France,
92001. 54Institute of Psychology, University of Lausanne, BFSH 2 Dorigny, Lausanne,
Switzerland, CH-1015. 55Psychologisches Institut, Zürichbergstrasse 43, 8044 Zürich,
Switzerland. 56Faculty of Arts, University of Ljubljana, Ljubljana, Slovenia. 57School of
Psychology & Counselling, Queensland University of Technology; now at School of Psychology,
University of Tasmania, Locked Bag 1342, Launceston, TAS, 7250 Australia. 58Department of
Psychology, Bunkyo Gakuin University, 1196, Kamekubo, Oi-machi, Iruma-gun, Saitama, 356-
8533 Japan. 59Department of Psychology, Ramapo College of New Jersey, 505 Ramapo Valley
Road, Mahwah, NJ 07430. 60Institute of Psychology, Jagiellonian University, Krakow, Poland.
61Department of Psychology, University of Sussex, Brighton, UK. 62Department of Psychology,
The University of Winnipeg, 515 Portage Ave, Winnipeg, Manitoba, Canada R3B 2E9.
63Department of Psychology, Peking University, Beijing, People’s Republic of China. 64Division
National Character and Traits 5
of Social Science, The Hong Kong University of Science and Technology, Clear Water Bay,
Kowloon, Hong Kong. 65Ministry for Health, Štefanova ulica 5, 1000 Ljubljana, Republic of
Slovenia.
*To whom correspondence should be addressed. E-mail: [email protected];
National Character and Traits 6
Abstract
Most people hold beliefs about personality characteristics typical of members of their
own and others' cultures. These perceptions of national character may be generalizations from
personal experience, stereotypes with a “kernel of truth," or inaccurate stereotypes. We obtained
national character ratings (N = 3,989) from 49 cultures and compared them to the average
personality scores of culture members assessed by observer ratings and self-reports. National
character ratings appeared to be reliable, but did not converge with assessed traits (Mdn r = .04).
Perceptions of national character thus appear to be unfounded stereotypes that may serve the
function of maintaining a national identity.
National Character and Traits 7
Beliefs about distinctive personality characteristics common to members of a culture are
referred to as national character (1) or national stereotypes (2-4). National stereotypes include
beliefs about social, physical, and mental characteristics, but the present article focuses on
personality traits. Several factors are thought to influence these beliefs. They may be
generalizations based on observations of the personality traits of individual culture members.
They may be inferences based on the national ethos, as revealed in socio-economic conditions,
history, customs, myths, legends, and values. They may be shaped by comparisons or contrasts
with geographically close or competing cultures. Stereotypes are oversimplified judgments, but
if they have some “kernel of truth,” (5) national character should reflect the average emotional,
interpersonal, experiential, attitudinal, and motivational styles of members of the culture.
There have been surprisingly few attempts to examine the accuracy of national
stereotypes (3, 5-7), perhaps because researchers lacked appropriate criteria. However, recent
advances in personality psychology and cross-cultural research make it possible to compare
perceived national character to aggregate personality data (that is, the means of a sample of
assessments of individuals) across a wide range of cultures.
Personality Traits and Aggregate Personality Profiles
National character may be a social construction, but personality traits are rooted in
biology. Most personality psychologists today agree that the dimensions of the Five-Factor
Model (FFM) of personality—Neuroticism versus Emotional Stability, Extraversion, Openness
to Experience, Agreeableness, and Conscientiousness—account for the covariation of most
personality traits (8), and behavioral genetics studies (9) have shown that traits from all five
factors are strongly heritable. As products (in part) of the human genome, traits are universal:
Cross-cultural research suggests that the structure and development of personality traits is very
National Character and Traits 8
similar in nations as dissimilar as India, Argentina, and Burkina Faso (10). In every culture
examined, the five factors are hierarchically related to lower-order traits or facets. For example,
the Extraversion factor in the Revised NEO Personality Inventory (NEO-PI-R) (11) is defined by
Warmth, Gregariousness, Assertiveness, Activity, Excitement Seeking, and Positive Emotions
facets.
Personality traits can be assessed with standardized instruments such as the NEO-PI-R,
using either self-reports or observer ratings from knowledgeable informants. The reliability and
validity of individual assessments made with the NEO-PI-R are well established (10, 11). Recent
cross-cultural data also indicate that aggregate (or mean) NEO-PI-R scores can be validly used to
describe cultures as a whole. In a study of self-report data from 36 cultures, culture-level scores
were generalizable across age groups and gender, and aggregate scores showed meaningful
patterns of convergent and discriminant validity with other culture-level variables such as
Individualism-Collectivism (12). Geographically and historically related cultures (such as
Germany and Austria or the United States and Canada) showed similar personality profiles (13).
Most of these findings were replicated in a subsequent study using observer ratings from 51
cultures (10, 14), and aggregate self-reports were significantly correlated with aggregate
observer ratings for most of the 30 NEO-PI-R facets. Assessed aggregate personality scores from
these two studies can thus be used in a multimethod evaluation of the accuracy of perceptions of
national character.
Accuracy of Stereotypes
There is a substantial literature on the evaluation of the accuracy of stereotypes (3),
showing that they may or may not reflect reality. For example, gender stereotypes depicting
women as warm and men as assertive are widely held around the world (15). Cross-cultural
National Character and Traits 9
studies using both self-reports and observer ratings have shown that women in fact score higher
on measures of Warmth, whereas men score higher on measures of Assertiveness (10, 16).
Assessed gender differences are small, but are largely consistent with gender stereotypes (17, 18),
so those views appear to have a basis in the characteristics of individuals.
The available literature provides less support for the accuracy of beliefs about national
character. The perceptions of a panel of experts in cross-cultural psychology did not match
beyond chance assessed characteristics in a sample of 26 cultures (19). Church and Katigbak
(20) identified raters who had lived in both the United States and the Philippines and asked them
to compare the typical American with the typical Filipino on traits that paralleled the 30 NEO-
PI-R facets. There was considerable consensus among the judges, but their judgments did not
correspond to differences observed when mean American self-reports were compared to mean
Filipino self-reports. Another study using the NEO-PI-R found no support for popular
stereotypes of Northern and Southern Italians (21).
Here we examine whether national character, as described by culture members
themselves (the in-group), are consistent with aggregate personality data. Aggregate scores from
self-report and observer ratings on the NEO-PI-R provide the criteria, but measurement of
perceived national character requires a new instrument.
Measuring National Character
We designed a short questionnaire, the National Character Survey (NCS), to describe the
typical member of a culture (22). The NCS consists of 30 bipolar scales with two or three
adjectives or phrases at each pole of the scale (see Appendix S1, on-line). For example, the first
item asks how likely it is that the typical member of a culture is anxious, nervous, worrying vs.
at ease, calm, relaxed. Each 5-point scale taps one of the 30 facets assessed by the NEO-PI-R,
National Character and Traits 10
with six items for each of the five major dimensions of personality traits. Internal consistency
and factor analysis of the NCS items (supporting online material) indicate that the scales have
acceptable psychometric properties and successfully define the dimensions of the FFM. To the
extent that the FFM is a comprehensive model of personality, the NCS should capture the
essential features of national character.
Data were gathered from 49 cultures or subcultures from six continents, using
translations into 27 languages from Indo-European, Hamito-Semitic, Sino-Tibetan, Uralic,
Malayo-Polynesian, and Altaic families. Most cultures corresponded to nations; however, where
subcultures could be identified on the basis of history (e.g., England vs. N. Ireland) or language
(e.g., French- vs. German-speaking Switzerland), they were treated as separate samples. In each
sample, we asked college students to complete the NCS to describe the typical member of their
culture or subculture, and then, as a common basis of comparison, the typical American.
Analyses of the NCS data in the full sample (N = 3,989) and in selected subsamples
supported the reliability, generalizability, and validity of the NCS as a measure of perceived
national character (supporting online text). Interjudge reliability between single raters showed
there is only modest agreement between individual judgments of national character, with
coefficients ranging from .09 to .30 (Mdn = .17). This is roughly half the size of typical
agreement between two judges on a single person they both know well (23). However, by
aggregating the judgments of an average of 81 raters per culture, highly reliable means were
obtained, with reliability coefficients ranging from .96 to .97 for the five factors, and from .89 to
.97 (Mdn = .94) for the 30 facets. These aggregate values correspond to the shared portion of
individuals' perceptions. Men and women provided essentially the same profile of the typical
member of their culture: When mean scores for female subsamples were correlated with mean
National Character and Traits 11
scores for male subsamples matched on culture, correlations for the five factors ranged from .80
to .90 (N = 49; all ps < .001).
Additional analyses comparing NCS profiles across groups used T-scores (M = 50, SD =
10) based on the grand means and standard deviations across all raters and samples for the 30
NCS items. Profile agreement is calculated as the intraclass correlation (ICC) across the 30
facets using the double-entry method (24). Intraclass correlations are similar to Pearson
correlations, but are sensitive to both the shapes of the profiles and differences in elevation, and
are thus an appropriate metric for assessing profile similarity. With 30 profile elements, ICCs
above .57 are significant at p < .001.
Several comparisons suggested that NCS means were robust. In Ethiopia and Italy,
samples of adults were used as raters in addition to college students and yielded similar profiles
(ICCs = .62 and .90, respectively). In some cultures student data from multiple sites were
available, and intraclass correlations between these different sites ranged from .76 to .94 (25).
This is illustrated by the dotted lines in Figure 1 (26).
____________________
Figure 1 about here
____________________
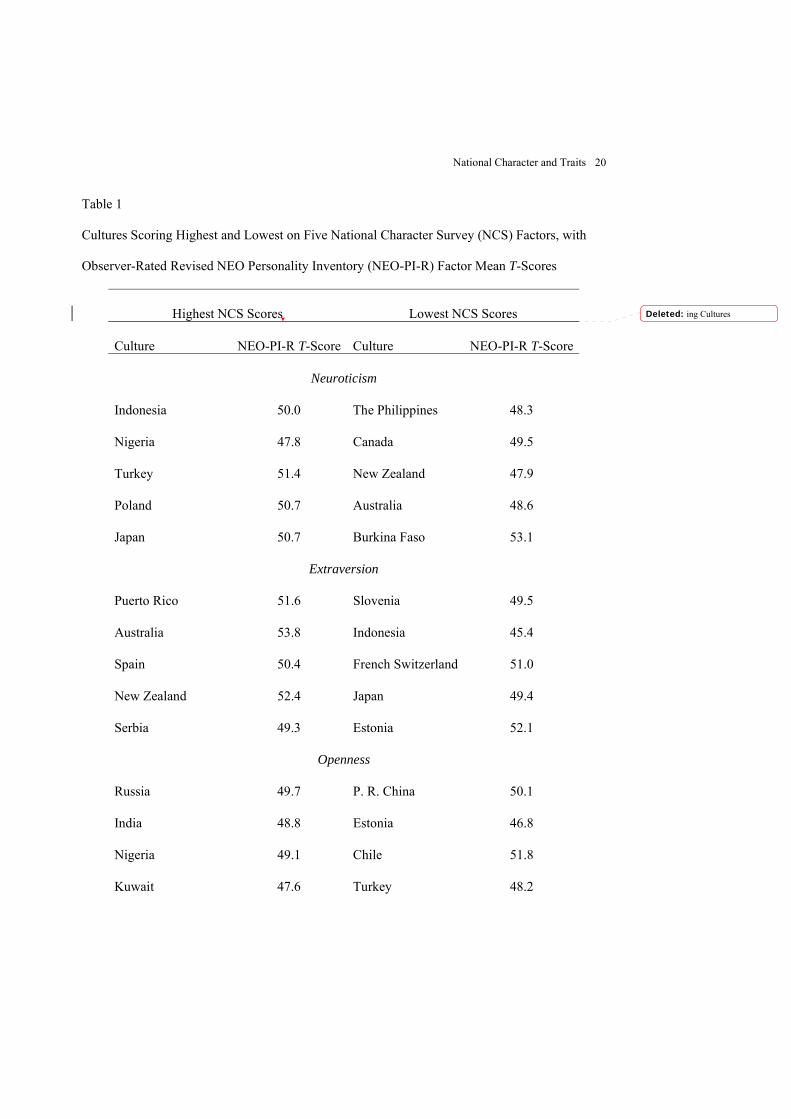
Mean NCS scores for the 49 cultures are available on-line, Table S1; the highest and
lowest scoring cultures for each factor are listed in Table 1. It is perhaps not surprising that
Australians see themselves as Extraverts, German Swiss believe they are typically high in
Conscientiousness, and Canadians describe themselves as Agreeable. But many of the other
entries are nations with which most readers are not familiar, and it is difficult to judge the
plausibility of these ratings. In any case, individual judgments of national character—including
National Character and Traits 12
the reader's—have low reliability. The data suggest that aggregate values accurately reflect the
way in-group members perceive the personality of the typical member of their culture.
________________________
Table 1 about here
_________________________
Comparing National Character and Aggregate Personality Traits
The primary question this study was designed to address is whether these in-group
perceptions of national character accurately reflect aggregate judgments of individual personality
traits. A first examination of the data shows one respect in which they are clearly different: There
is a much greater range of variation across cultures in perceived traits than in assessed traits. For
example, the typical German-speaking Swiss is thought to score 28 T-score points higher on
Conscientiousness than the typical Indonesian, but the largest difference on observer-rated
Conscientiousness between any two cultures was only 8 T-score points. Thus, if national
stereotypes are accurate at all, they clearly exaggerate real differences.
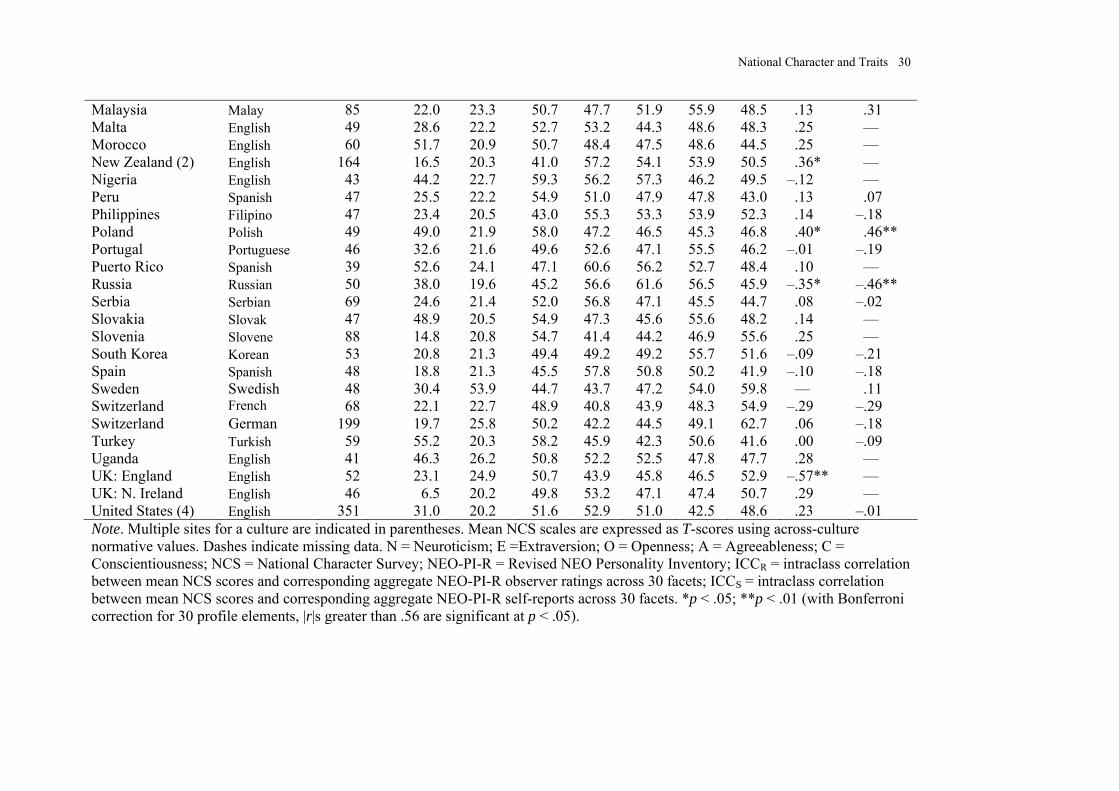
We first examined agreement of trait profiles within cultures, correlating NCS facet
scores with assessed mean facet values from NEO-PI-R observer ratings (N = 11,479) in 47
cultures (10) and self-reports (N = 25,732) in 30 cultures (12, 22). ICCs between NCS and the
NEO-PI-R observer rating profiles ranged from –.57 for England to .40 for Poland (Mdn = .00),
and there was a significant positive correlation in only four cultures (New Zealand, Australia,
Poland, and Lebanon). Examples of these findings are shown in Figure 1, in which the solid
lines, representing mean observer rated NEO-PI-R profiles, deviate markedly from the
perceptions of national character, especially with regard to Agreeableness facets. ICCs between
NCS and mean NEO-PI-R self-report profiles ranged from –.46 for Russia to .46 for Poland
National Character and Traits 13
(Mdn = –.02), and only Poland and Japan showed significant positive correlations (see Table S1,
on-line). Only for Poland were the observer rating findings replicated. Overall, there is little
support for the view that perceptions of national character profiles are accurate in any culture.
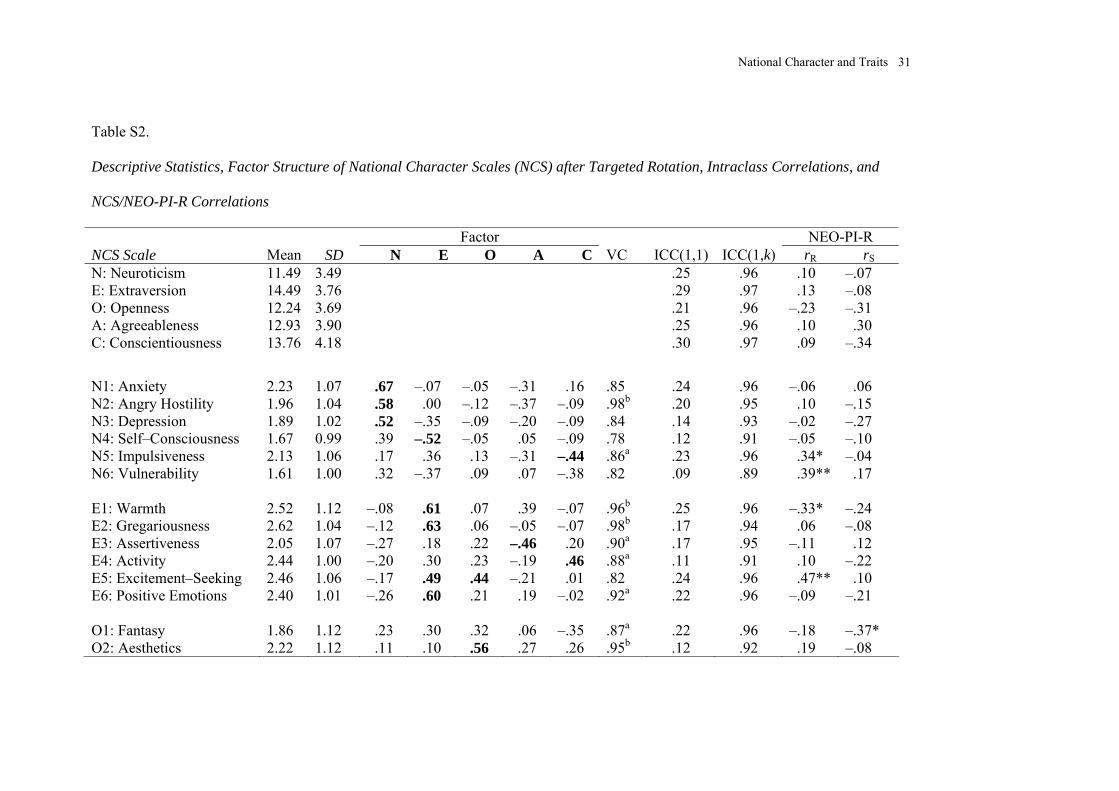
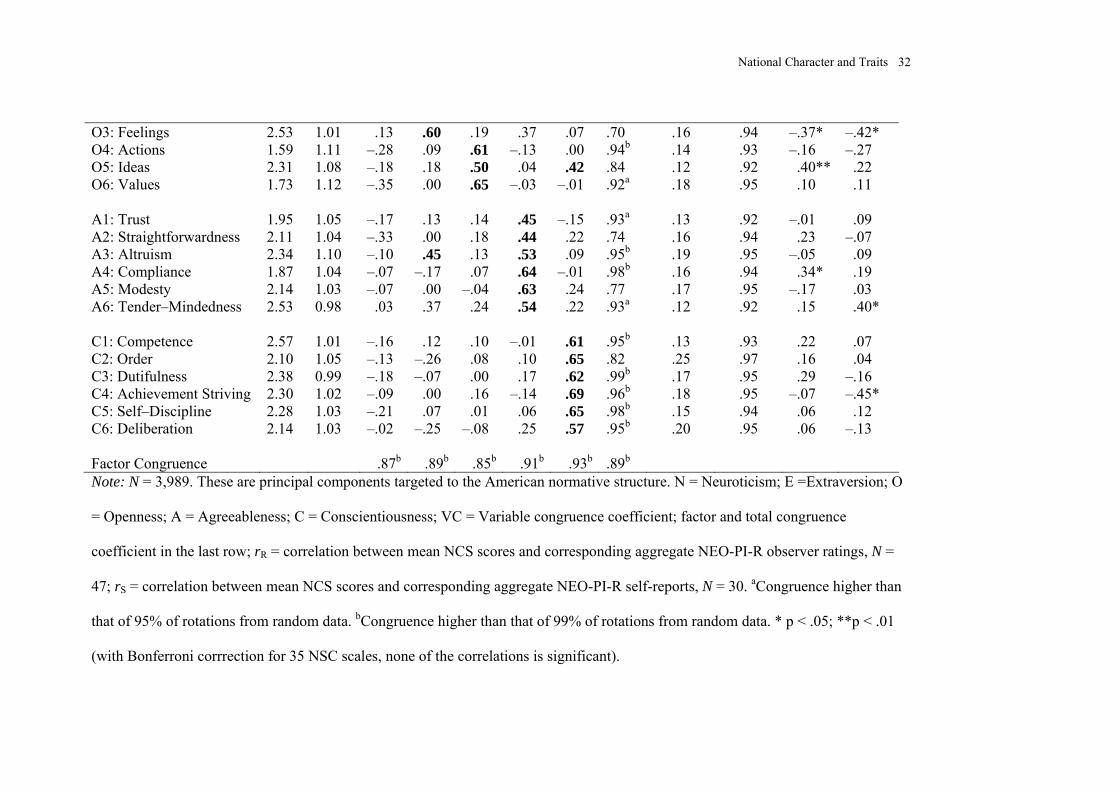
However, it is possible that agreement exists for some factors. To determine the degree of
agreement for each trait, NCS domain and facets scores were correlated with NEO-PI-R observer
rating and self-report across 47 and 30 cultures, respectively. For the five factors, correlations
with observer ratings ranged from –.23 to .13, and those with self-reports ranged from –.34 to .30
(Table S2, on-line), indicating that there is no relation between aggregate NEO-PI-R data and the
NCS on any of the five major dimensions. (This finding is illustrated in Table 1, where cultures
scoring high versus low on the five NCS factors do not differ systematically on mean NEO-PI-R
T-scores.) There are eleven significant correlations at the facet level, five of which are negative.
The median of the 70 correlations was .04. The only replicated effect is a significant negative
correlation with Openness to Feelings: In cultures where people have a sensitive and rich
emotional life, they perceive that their typical compatriot is emotionally impoverished. These
analyses, too, provide little reason to trust national stereotypes (27).
Discussion
Comparisons across cultures are always challenging, and several factors may have
limited the association between NCS and NEO-PI-R profiles, including problems in translation,
response biases such as acquiescence (a yea-saying tendency)(29), and the unfamiliarity of
respondents in some cultures with the use of rating scales (10). Comparisons would have been
more direct if the full NEO-PI-R had been used to assess national character. Yet the mean NCS
scores were reliable and generalizable across sites and types of rater and showed the
hypothesized factor structure. Future studies might use more representative raters, although
National Character and Traits 14
student and adult samples gave similar results when both were available.
In the case of gender differences, widely held stereotypes are consistent with—although
they may exaggerate—assessed personality differences between men and women (16-18). That
kernel-of-truth hypothesis does not appear to apply to national character. Correspondence
between perceived national character traits and the average levels of traits of individual members
of each culture was found neither within nor across cultures. Perceptions of national character
are not generalizations about personality traits based on accumulated observations of the people
with whom one lives; instead, they appear to be social constructions that may serve different
functions altogether. Correlations of NCS scores with culture-level variables might be
informative about these functions. Whatever their origins, stereotypes may be perpetuated by
information processing biases in attention/perception, encoding, and integration of information
(2, 30). They become cultural phenomena, transmitted through media, hearsay, education,
history, and jokes.
But national character also has a much darker side. When stereotypes of national or
ethnic groups are unfavorable they can lead to prejudice, discrimination, or persecution, of which
history and the world today are full of tragic examples. The classic analysis of stereotypes
depicted them as the product of authoritarian (31) or prejudiced personalities (32); more recent
approaches have considered them as the result of general cognitive processes (2). Though social
scientists have long been skeptical about the accuracy of national stereotypes, the present study
offers the best evidence to date that in-group perceptions of national character may be
informative about the culture, but they are not descriptive of the people themselves.
National Character and Traits 15
References
1. D. Peabody, National characteristics (Cambridge University Press, New York, 1985).
2. C. N. Macrae, C. Stangor, M. Hewstone, Stereotypes and stereotyping (The Guilford
Press, New York, 1996).
3. Y. T. Lee, L. Jussim, C. McCauley, Stereotype accuracy: Toward appreciating group
differences (American Psychological Association, Washington, DC, 1995).
4. S. Madon et al., Pers. Soc. Psychol. Bull. 27, 996 (2001).
5. J. C. Brigham, Psychol. Bull. 76, 15 (1971).
6. C. McCauley, C. L. Stitt, J. Pers. Soc. Psychol. 36, 929 (1978).
7. C. M. Judd, B. Park, Psychol. Rev. 100, 109 (1993).
8. J. M. Digman, Annu. Rev. Psychol. 41, 417 (1990).
9. T. J. Bouchard, Science 264, 1700 (1994).
10. R. R. McCrae et al., J. Pers. Soc. Psychol. 88, 547 (2005).
11. P. T. Costa, Jr., R. R. McCrae, Revised NEO Personality Inventory (NEO-PI-R) and NEO
Five-Factor Inventory (NEO-FFI) professional manual (Psychological Assessment
Resources, Odessa, FL, 1992).
12. R. R. McCrae, in The Five-Factor Model of Personality Across Cultures R. R. McCrae, J.
Allik, Eds. (Kluwer Academic, New York, 2002), pp. 105-125.
13. J. Allik, R. R. McCrae, Journal of Cross-Cultural Psychology 35, 13 (2004).
14. R. R. McCrae et al., J. Pers. Soc. Psychol. (in press).
15. J. E. Williams, D. E. Best, Measuring sex stereotypes: A thirty nation study (Sage,
Newbury Park, CA, 1982).
16. P. T. Costa, Jr., A. Terracciano, R. R. McCrae, J. Pers. Soc. Psychol. 81, 322 (2001).
National Character and Traits 16
17. C. L. Martin, J. Pers. Soc. Psychol. 52, 489 (1987).
18. J. K. Swim, J. Pers. Soc. Psychol. 66, 21 (1994).
19. R. R. McCrae, J. Pers. 69, 819 (2001).
20. A. T. Church, M. S. Katigbak, in The Five-Factor Model of personality across cultures R.
R. McCrae, J. Allik, Eds. (Kluwer Academic/Plenum Publishers, New York, 2002), pp.
129-154.
21. A. Terracciano, R. R. McCrae, in 113th Annual Convention of the American
Psychological Association. (Washington, DC, 2005).
22. Materials and methods are available as supporting material on Science Online
23. R. R. McCrae et al., Journal of Research in Personality 38, 179 (2004).
24. D. Griffin, R. Gonzalez, Psychol. Bull. 118, 430 (1995).
25. By contrast, distinct cultures within countries showed different profiles. In the UK, the
profiles of England and Northern Ireland showed no resemblance (ICC = –.01). Similarly,
in the PRC, the profiles of China and Hong Kong showed no resemblance (ICC = –.25).
There is some resemblance between Czech and Slovakian (ICC = .43, p < .05), and
Serbian and Croatian (ICC = .43, p < .05) profiles; the separation of those nations is
relatively recent.
26. Additionally, we compared NCS scores from the Philippines to ratings made by
bicultural raters in an earlier study (20). Because Church and Katigbak used comparative
judgments, we created new NCS scores by subtracting Filipino ratings of the typical
American from Filipino ratings of the typical Filipino. The correlation of these 30
difference scores with the Church and Katigbak ratings was .76, p < .001.
27. Different standards of evaluation across cultures might have affected the results—that is,
National Character and Traits 17
raters from some cultures may have been more generous or critical in their ratings than
raters from other cultures, distorting the comparison across cultures. On the assumption
that such biases would affect ratings both of one's own compatriots and of Americans, we
calculated difference scores by subtracting each judge's rating of the typical American
from his or her rating of the typical compatriot for each NCS item. Assuming that
cultures agree on the typical American, this procedure in effect subtracts the bias plus a
constant, and leaves a potentially better estimate of national character. We standardized
the differences as T-scores, using difference score normative values from the worldwide
sample, excluding the US. The difference scores were highly correlated with NCS scores
(rs =.65 to.91, p <.001), and provided essentially the same results. ICCs between
difference scores and NEO-PI-R observer ratings ranged from –.44 for England to.48 for
Lebanon (Mdn = .03). ICCs between differences scores and NEO-PI-R self-reports
ranged from –.47 for Russia to .53 for Poland (Mdn = .01). For the five factors,
correlations with observer ratings across cultures ranged from .08 to.23, and those with
self-reports ranged from –.37 to .23. These results suggest that the lack of correspondence
between NEO-PI-R and NCS profiles is not simply due to different standards of
evaluation in different cultures. A different issue concerns the reference-group effect (28),
according to which self-reports and observer ratings of individuals are implicitly made by
reference to the distribution of scores in the rater's culture. Such an effect would tend to
make aggregate personality scores uniform for all cultures, and the failure to find
correlations with NCS factors would be due to a lack of variation in aggregate NEO-PI-R
means. But NEO-PI-R means in fact vary systematically across cultures and show strong
correlations across methods and with other culture-level variables (12, 14). Thus, the
National Character and Traits 18
reference-group effect cannot explain the failure to find correlations with NCS scales.
28. S. J. Heine, D. R. Lehman, K. P. Peng, J. Greenholtz, J. Pers. Soc. Psychol. 82, 903
(2002)
29. F. van de Vijver, K. Leung, J. Pers. 69, 1007 (2001).
30. D. L. Hamilton, T. L. Rose, J. Pers. Soc. Psychol. 39, 832 (1980).
31. T. W. Adorno, E. Frenkel-Brunswik, D. J. Levinson, R. N. Sanford, The authoritarian
personality (Norton. (Original work published 1950), New York, 1969).
32. F. H. Allport, The nature of prejudice (Houghton Mifflin, New York, 1954).
33. Robert R. McCrae receives royalties from the Revised NEO Personality Inventory. This
research was supported in part by the Intramural Research Program of the NIH, National
Institute on Aging. Czech participation was supported by Grant 406/01/1507 from the
Grant Agency of the Czech Republic and is related to research plan AV AV0Z0250504
of the Institute of Psychology, Academy of Sciences of the Czech Republic. S. Gulgöz’s
participation was supported by the Turkish Academy of Sciences. Burkinabè and French
Swiss participation was supported by a grant from the Swiss National Science Foundation
to J. Rossier. The data collection in Hong Kong was supported by RGC Direct Allocation
Grants (DAG02/03.HSS14 and DAG03/04.HSS14) awarded to M. Yik. Data collection in
Malaysia was supported by UKM Fundamental Research Grant 11JD/015/2003 awarded
to Khairul A. Mastor. Portions of these data were presented at 113th Convention of the
American Psychological Association, August, 2005, Washington DC. For helpful
comments on the manuscript we thank Yip H. Poortinga; for their assistance on this
project we thank F. Abal, L. de Almeida, S. Baumann, H. Biggs, D. Bion, A. Butkovi ,
C.Y. Carrasquillo, H. W. Carvalho, S. Catty, C.-S. Chan, A. Curbelo, P. Duffill, L.
National Character and Traits 19
Etcheverry, L. Firpo, J. Gonzalez, A. Gramberg, H. Harrow, H. Imuta, R. Ismail, R.
Kamis, S. Kannan N. Messoulam, F. Molina, M. Montarroyos Calegaro, S. Mosquera, J.
C. Munene, V. Najzrova, C. Nathanson, D. Padilla, C. N. Scollon, S. B. Sigurdardottir, A.
da Silva Bez, M. Takayama, T. W. Teasdale, L. N. Van Heugten, F. Vera, and J. Villamil.
Supporting Online Material
Materials and Methods
References
Tables S1, S2
Appendix S1
National Character and Traits 20
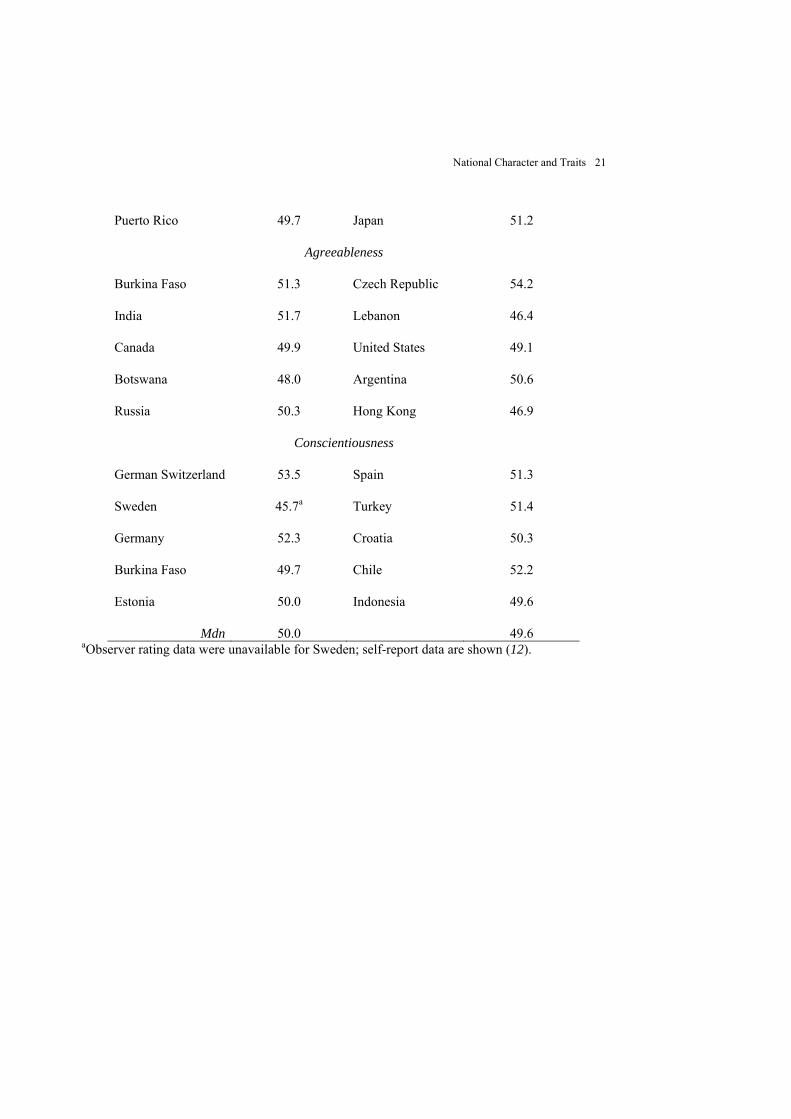
Table 1
Cultures Scoring Highest and Lowest on Five National Character Survey (NCS) Factors, with
Observer-Rated Revised NEO Personality Inventory (NEO-PI-R) Factor Mean T-Scores
Highest NCS Scores Lowest NCS Scores
Culture NEO-PI-R T-Score Culture NEO-PI-R T-Score
Neuroticism
Indonesia 50.0 The Philippines 48.3
Nigeria 47.8 Canada 49.5
Turkey 51.4 New Zealand 47.9
Poland 50.7 Australia 48.6
Japan 50.7 Burkina Faso 53.1
Extraversion
Puerto Rico 51.6 Slovenia 49.5
Australia 53.8 Indonesia 45.4
Spain 50.4 French Switzerland 51.0
New Zealand 52.4 Japan 49.4
Serbia 49.3 Estonia 52.1
Openness
Russia 49.7 P. R. China 50.1
India 48.8 Estonia 46.8
Nigeria 49.1 Chile 51.8
Kuwait 47.6 Turkey 48.2
Deleted: ing Cultures
National Character and Traits 21
Puerto Rico 49.7 Japan 51.2
Agreeableness
Burkina Faso 51.3 Czech Republic 54.2
India 51.7 Lebanon 46.4
Canada 49.9 United States 49.1
Botswana 48.0 Argentina 50.6
Russia 50.3 Hong Kong 46.9
Conscientiousness
German Switzerland 53.5 Spain 51.3
Sweden 45.7a Turkey 51.4
Germany 52.3 Croatia 50.3
Burkina Faso 49.7 Chile 52.2
Estonia 50.0 Indonesia 49.6
Mdn 50.0 49.6 aObserver rating data were unavailable for Sweden; self-report data are shown (12).
National Character and Traits 22
Figure 1.
T-scores for NCS and NEO-PI-R factor and facet scales. On the left the scores for the five factors
are plotted; toward the right are the 30 facets, grouped by the factor they define. Dotted lines
show the NCS profile of the typical Canadian (top panel) and American (bottom panel) as
perceived by students from three Canadian and four American sites, respectively. High profile
similarity can be observed among the Canadian sites (ICCs = .89 to .92) and among the
American sites (ICCs = .76 to .89), suggesting consensus on national character. Solid lines show
mean observer rated NEO-PI-R profiles. In both Canada (ICC = –.03) and the USA (ICC = .23),
in-group perceptions of national character across all sites do not reflect aggregate assessments of
individual personality traits. The distinction between national character and mean trait levels can
also be seen by comparing top and bottom panels: The NEO-PI-R profiles of the USA and
Canada are similar (ICC = .66), whereas there is no agreement between their national character
ratings (ICC = –.53). N = Neuroticism. E = Extraversion. O = Openness to Experience. A =
Agreeableness. C = Conscientiousness.
National Character and Traits 23
Supporting online material
Materials and Methods
Participants
Participation was voluntary and anonymous, and, as anonymous survey research, the
project was ruled exempt from IRB review. Across cultures, a total of 4,170 individuals
completed the NCS. Using exclusion criteria described below, 181 (4.3%) surveys were
excluded, leaving 3,989 valid assessments. Sample sizes for each culture ranged from 39 to 351
(see Table S1). The proportion of male respondents was higher in less affluent and lower among
European countries. With the exception of Sweden, the mean ages are within the range of college
student samples.
In most cultures participants were students, but in a few cases data from adults were also
collected. In Sweden and Hungary the samples were mixed. In Ethiopia a non-student sample
was recruited in addition to the student sample. In Italy one student sample and two adult
samples were recruited. In Brazil (n = 3), Canada (n = 3), New Zealand (n = 2), and the United
States (n = 4) we collected samples from multiple sites.
Aggregated NEO-PI-R assessments based on observer rating data were obtained from 51
cultures (1), 47 of which overlap with the cultures assessed using the NCS. Self-report data from
36 cultures (2) were supplemented by data provided by J. Rossier from Burkina Faso and
French-speaking Switzerland, and by J. Siuta from Poland; 30 of these 39 cultures were also
assessed using the NCS.
National Character Survey
National Character and Traits 24
The NCS consisted of 30 items (Appendix S1), each corresponding to a facet of the
NEO-PI-R. Item order was rotated through the five factors, and to control for acquiescence, half
the items for each factor had the positive pole on the right side, whereas the other half had the
positive pole on the left side. Scores for the five factors were the sum of the six relevant items
after reflecting negatively-keyed items.
The survey was translated from English into 26 other languages. Translations were made
by the co-authors into their native languages. Translators were instructed to choose words or
phrases that best conveyed the intended construct, using as a reference the description of the 30
facets from the NEO-PI-R Manual (3). Translators were instructed to find a bilingual colleague
to provide an independent back-translation into English. The first and senior authors
independently examined these back-translations, and any items that appeared problematic were
reconsidered by the co-authors/translators.
Procedure
In each culture respondents rated a typical member of their own culture or subculture and
the typical American. To reduce contrast effect biases, the survey was administered in two steps,
and raters were not aware that they would be asked about Americans until the first step was
completed. Respondents were tested in groups, and instructions stated that:
We are interested in your opinions on __________s. You are to judge
the likelihood of 30 characteristics for the typical _________. At each end of
the scale, a description is written. Your task is to place a mark on each scale to
describe _______s,
where blanks were filled in with the name of their culture's members.
When everyone in the group was finished, respondents from countries other than the
National Character and Traits 25
United States turned to the last page, and the administrator said:
“Now we would like to learn about your opinions of another group,
Americans. Have any of you visited or lived in the United States? If so, please
check yes on at the top of the page. If not, check no. Please write “Americans
are likely to be” at the top of the page. Then complete the survey just as you did
before. When you are finished, please turn the survey in. Please do not discuss
this survey with other students who may participate in the study later. Thank
you for your help.”
Separate analyses of raters who had (n = 942) and had not (n = 2,368) been in the United States
showed little difference. ICC between American profiles for the two groups was .91.
Protocol Validity
We assessed the validity of individual protocols using rules that paralleled those used for
the NEO-PI-R (3). We excluded as invalid questionnaires with more than five missing responses
to the 30 items describing the participant's own culture or which showed patterns of random,
repetitive responding, specifically, more than ten consecutive equally likely responses, or more
than five consecutive very unlikely, unlikely, likely, or very likely responses. Across samples,
seven cases were eliminated because of missing items and 174 were eliminated by the repetitive
responses criteria. Ratings of the typical American by other cultures' members were excluded
from the analysis involving such ratings when deemed invalid according to the same criteria.
Missing items in valid protocols were replaced with the neutral value.
Psychometric Evaluation of the NCS scales
Internal consistency. Analyses of the 3,989 individual responses from the worldwide
sample indicated that Cronbach’s alpha for the five factor scales were .58, .64, .57, .69, .77 for
National Character and Traits 26
Neuroticism, Extraversion, Openness, Agreeableness, and Conscientiousness, respectively.
These reliability coefficients are acceptable for six-item scales. None of the items showed
negative corrected item/total correlations, but six facets (N4: Self-Consciousness, N5:
Impulsiveness, N6: Vulnerability, E3: Assertiveness, O1: Fantasy, and O3: Feelings) showed
correlations lower than .30.
Analyses at the culture level using the means of all respondents in each culture (N = 49)
indicated that Cronbach’s alphas for the five factor scales were .77, .84, .75, .83, .93 for
Neuroticism, Extraversion, Openness, Agreeableness, and Conscientiousness, respectively. The
only facet with a corrected item/total correlation lower than .30 was N5: Impulsiveness.
Factor structure. A principal components analysis was conducted on the 30 items in the
entire sample of 3,989 subjects. The first six eigenvalues were 5.5, 3.5, 2.5, 1.3, 1.2, and .9, and
parallel analysis (4) indicated that five factors should be retained. The five-factor solution
explained 47% of the variance.
The NCS factor structure was rotated toward the American normative NEO-PI-R factor
structure to evaluate fit with the target structure (5). As indicated by the total and factor
congruence coefficients in Table S2, the NCS factor solution replicates the intended target,
according to Haven and ten Berge's .85 criterion (6). This is noteworthy given that only a single
item assesses each facet. The departures from the target structure are all consistent with salient
secondary loadings in the target structure; for example, N5: Impulsiveness shows a large (and
meaningful) negative secondary loading on the Conscientiousness factor in the target matrix.
Interjudge reliability. Intraclass correlation coefficients (7) for the five factors and the 30
facets are reported in Table S2. Intraclass correlations provide estimates of the reliability of
single raters [ICC(1,1) = BMS–WMS/BMS+(k–1)WMS] and of the culture–average ratings

National Character and Traits 27
[ICC(1,k) = (BMS – WMS)/BMS], where k is the mean number of raters per culture, BMS is the
between-subject mean square, and WMS is the within-subject mean square from an ANOVA
with cultures as the independent variable.
National Character and Traits 28
References
1. R. R. McCrae et al., Journal of Personality and Social Psychology (in press).
2. R. R. McCrae, in The Five-Factor Model of Personality Across Cultures R. R. McCrae, J.
Allik, Eds. (Kluwer Academic, New York, 2002) pp. 105-125.
3. P. T. Costa, Jr., R. R. McCrae, Revised NEO Personality Inventory (NEO-PI-R) and NEO
Five-Factor Inventory (NEO-FFI) professional manual (Psychological Assessment
Resources, Odessa, FL, 1992).
4. A. A. Cota, R. Longman, R. Stewart, R. R. Holden, G. C. Fekken, Educational and
Psychological Measurement 53, 865 (1993).
5. R. R. McCrae, A. B. Zonderman, P. T. Costa, Jr., M. H. Bond, S. V. Paunonen, Journal
of Personality and Social Psychology 70, 552 (1996).
6. S. Haven, J. M. F. ten Berge, Tucker's coefficient of congruence as a measure of factorial
invariance: An empirical study Tech. Report No. 290 EX (University of Groningen, 1977).
7. P. E. Shrout, J. L. Fleiss, Psychological Bulletin 86, 420 (1979).
National Character and Traits 29
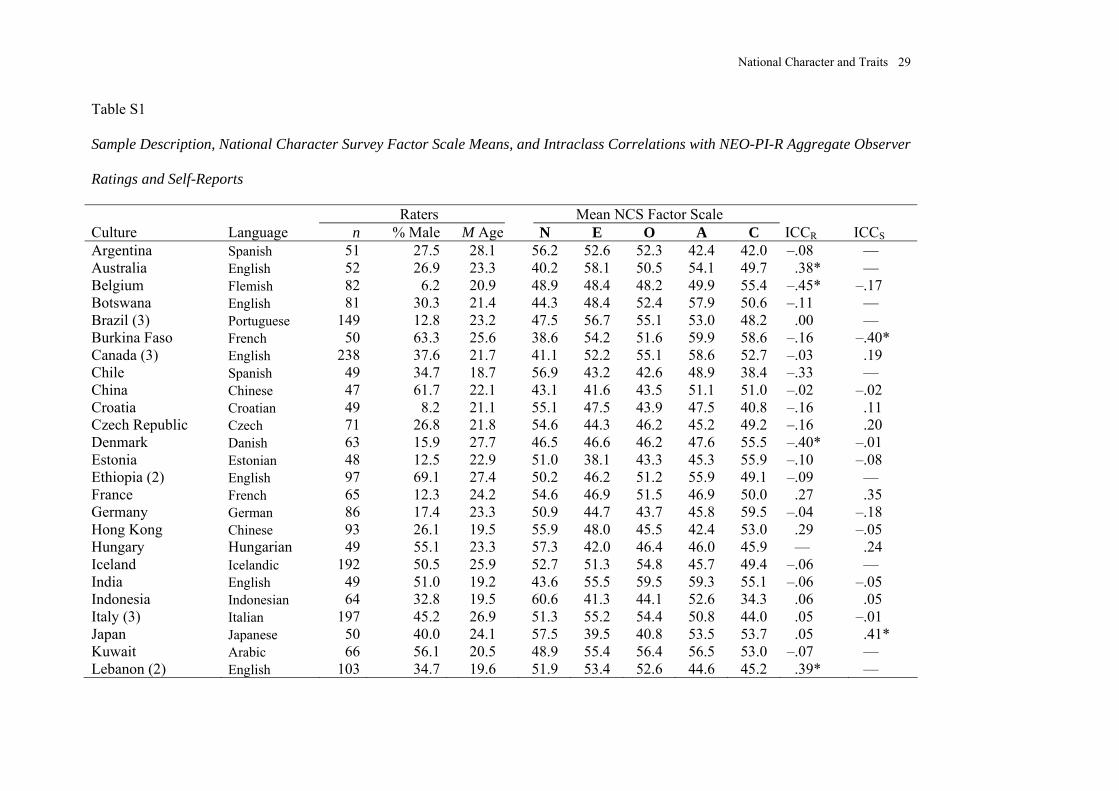
Table S1
Sample Description, National Character Survey Factor Scale Means, and Intraclass Correlations with NEO-PI-R Aggregate Observer
Ratings and Self-Reports
Raters Mean NCS Factor Scale Culture Language n % Male M Age N E O A C ICCR ICCS Argentina Spanish 51 27.5 28.1 56.2 52.6 52.3 42.4 42.0 –.08 — Australia English 52 26.9 23.3 40.2 58.1 50.5 54.1 49.7 .38* — Belgium Flemish 82 6.2 20.9 48.9 48.4 48.2 49.9 55.4 –.45* –.17 Botswana English 81 30.3 21.4 44.3 48.4 52.4 57.9 50.6 –.11 — Brazil (3) Portuguese 149 12.8 23.2 47.5 56.7 55.1 53.0 48.2 .00 — Burkina Faso French 50 63.3 25.6 38.6 54.2 51.6 59.9 58.6 –.16 –.40* Canada (3) English 238 37.6 21.7 41.1 52.2 55.1 58.6 52.7 –.03 .19 Chile Spanish 49 34.7 18.7 56.9 43.2 42.6 48.9 38.4 –.33 — China Chinese 47 61.7 22.1 43.1 41.6 43.5 51.1 51.0 –.02 –.02 Croatia Croatian 49 8.2 21.1 55.1 47.5 43.9 47.5 40.8 –.16 .11 Czech Republic Czech 71 26.8 21.8 54.6 44.3 46.2 45.2 49.2 –.16 .20 Denmark Danish 63 15.9 27.7 46.5 46.6 46.2 47.6 55.5 –.40* –.01 Estonia Estonian 48 12.5 22.9 51.0 38.1 43.3 45.3 55.9 –.10 –.08 Ethiopia (2) English 97 69.1 27.4 50.2 46.2 51.2 55.9 49.1 –.09 — France French 65 12.3 24.2 54.6 46.9 51.5 46.9 50.0 .27 .35 Germany German 86 17.4 23.3 50.9 44.7 43.7 45.8 59.5 –.04 –.18 Hong Kong Chinese 93 26.1 19.5 55.9 48.0 45.5 42.4 53.0 .29 –.05 Hungary Hungarian 49 55.1 23.3 57.3 42.0 46.4 46.0 45.9 — .24 Iceland Icelandic 192 50.5 25.9 52.7 51.3 54.8 45.7 49.4 –.06 — India English 49 51.0 19.2 43.6 55.5 59.5 59.3 55.1 –.06 –.05 Indonesia Indonesian 64 32.8 19.5 60.6 41.3 44.1 52.6 34.3 .06 .05 Italy (3) Italian 197 45.2 26.9 51.3 55.2 54.4 50.8 44.0 .05 –.01 Japan Japanese 50 40.0 24.1 57.5 39.5 40.8 53.5 53.7 .05 .41* Kuwait Arabic 66 56.1 20.5 48.9 55.4 56.4 56.5 53.0 –.07 — Lebanon (2) English 103 34.7 19.6 51.9 53.4 52.6 44.6 45.2 .39* —
National Character and Traits 30
Malaysia Malay 85 22.0 23.3 50.7 47.7 51.9 55.9 48.5 .13 .31 Malta English 49 28.6 22.2 52.7 53.2 44.3 48.6 48.3 .25 — Morocco English 60 51.7 20.9 50.7 48.4 47.5 48.6 44.5 .25 — New Zealand (2) English 164 16.5 20.3 41.0 57.2 54.1 53.9 50.5 .36* — Nigeria English 43 44.2 22.7 59.3 56.2 57.3 46.2 49.5 –.12 — Peru Spanish 47 25.5 22.2 54.9 51.0 47.9 47.8 43.0 .13 .07 Philippines Filipino 47 23.4 20.5 43.0 55.3 53.3 53.9 52.3 .14 –.18 Poland Polish 49 49.0 21.9 58.0 47.2 46.5 45.3 46.8 .40* .46** Portugal Portuguese 46 32.6 21.6 49.6 52.6 47.1 55.5 46.2 –.01 –.19 Puerto Rico Spanish 39 52.6 24.1 47.1 60.6 56.2 52.7 48.4 .10 — Russia Russian 50 38.0 19.6 45.2 56.6 61.6 56.5 45.9 –.35* –.46** Serbia Serbian 69 24.6 21.4 52.0 56.8 47.1 45.5 44.7 .08 –.02 Slovakia Slovak 47 48.9 20.5 54.9 47.3 45.6 55.6 48.2 .14 — Slovenia Slovene 88 14.8 20.8 54.7 41.4 44.2 46.9 55.6 .25 — South Korea Korean 53 20.8 21.3 49.4 49.2 49.2 55.7 51.6 –.09 –.21 Spain Spanish 48 18.8 21.3 45.5 57.8 50.8 50.2 41.9 –.10 –.18 Sweden Swedish 48 30.4 53.9 44.7 43.7 47.2 54.0 59.8 — .11 Switzerland French 68 22.1 22.7 48.9 40.8 43.9 48.3 54.9 –.29 –.29 Switzerland German 199 19.7 25.8 50.2 42.2 44.5 49.1 62.7 .06 –.18 Turkey Turkish 59 55.2 20.3 58.2 45.9 42.3 50.6 41.6 .00 –.09 Uganda English 41 46.3 26.2 50.8 52.2 52.5 47.8 47.7 .28 — UK: England English 52 23.1 24.9 50.7 43.9 45.8 46.5 52.9 –.57** — UK: N. Ireland English 46 6.5 20.2 49.8 53.2 47.1 47.4 50.7 .29 — United States (4) English 351 31.0 20.2 51.6 52.9 51.0 42.5 48.6 .23 –.01 Note. Multiple sites for a culture are indicated in parentheses. Mean NCS scales are expressed as T-scores using across-culture normative values. Dashes indicate missing data. N = Neuroticism; E =Extraversion; O = Openness; A = Agreeableness; C = Conscientiousness; NCS = National Character Survey; NEO-PI-R = Revised NEO Personality Inventory; ICCR = intraclass correlation between mean NCS scores and corresponding aggregate NEO-PI-R observer ratings across 30 facets; ICCS = intraclass correlation between mean NCS scores and corresponding aggregate NEO-PI-R self-reports across 30 facets. *p < .05; **p < .01 (with Bonferroni correction for 30 profile elements, |r|s greater than .56 are significant at p < .05).
National Character and Traits 31
Table S2.
Descriptive Statistics, Factor Structure of National Character Scales (NCS) after Targeted Rotation, Intraclass Correlations, and
NCS/NEO-PI-R Correlations
Factor NEO-PI-R NCS Scale Mean SD N E O A C VC ICC(1,1) ICC(1,k) rR rS N: Neuroticism 11.49 3.49 .25 .96 .10 –.07 E: Extraversion 14.49 3.76 .29 .97 .13 –.08 O: Openness 12.24 3.69 .21 .96 –.23 –.31 A: Agreeableness 12.93 3.90 .25 .96 .10 .30 C: Conscientiousness 13.76 4.18 .30 .97 .09 –.34
N1: Anxiety 2.23 1.07 .67 –.07 –.05 –.31 .16 .85 .24 .96 –.06 .06 N2: Angry Hostility 1.96 1.04 .58 .00 –.12 –.37 –.09 .98b .20 .95 .10 –.15 N3: Depression 1.89 1.02 .52 –.35 –.09 –.20 –.09 .84 .14 .93 –.02 –.27 N4: Self–Consciousness 1.67 0.99 .39 –.52 –.05 .05 –.09 .78 .12 .91 –.05 –.10 N5: Impulsiveness 2.13 1.06 .17 .36 .13 –.31 –.44 .86a .23 .96 .34* –.04 N6: Vulnerability 1.61 1.00 .32 –.37 .09 .07 –.38 .82 .09 .89 .39** .17 E1: Warmth 2.52 1.12 –.08 .61 .07 .39 –.07 .96b .25 .96 –.33* –.24 E2: Gregariousness 2.62 1.04 –.12 .63 .06 –.05 –.07 .98b .17 .94 .06 –.08 E3: Assertiveness 2.05 1.07 –.27 .18 .22 –.46 .20 .90a .17 .95 –.11 .12 E4: Activity 2.44 1.00 –.20 .30 .23 –.19 .46 .88a .11 .91 .10 –.22 E5: Excitement–Seeking 2.46 1.06 –.17 .49 .44 –.21 .01 .82 .24 .96 .47** .10 E6: Positive Emotions 2.40 1.01 –.26 .60 .21 .19 –.02 .92a .22 .96 –.09 –.21 O1: Fantasy 1.86 1.12 .23 .30 .32 .06 –.35 .87a .22 .96 –.18 –.37* O2: Aesthetics 2.22 1.12 .11 .10 .56 .27 .26 .95b .12 .92 .19 –.08
National Character and Traits 32
O3: Feelings 2.53 1.01 .13 .60 .19 .37 .07 .70 .16 .94 –.37* –.42* O4: Actions 1.59 1.11 –.28 .09 .61 –.13 .00 .94b .14 .93 –.16 –.27 O5: Ideas 2.31 1.08 –.18 .18 .50 .04 .42 .84 .12 .92 .40** .22 O6: Values 1.73 1.12 –.35 .00 .65 –.03 –.01 .92a .18 .95 .10 .11 A1: Trust 1.95 1.05 –.17 .13 .14 .45 –.15 .93a .13 .92 –.01 .09 A2: Straightforwardness 2.11 1.04 –.33 .00 .18 .44 .22 .74 .16 .94 .23 –.07 A3: Altruism 2.34 1.10 –.10 .45 .13 .53 .09 .95b .19 .95 –.05 .09 A4: Compliance 1.87 1.04 –.07 –.17 .07 .64 –.01 .98b .16 .94 .34* .19 A5: Modesty 2.14 1.03 –.07 .00 –.04 .63 .24 .77 .17 .95 –.17 .03 A6: Tender–Mindedness 2.53 0.98 .03 .37 .24 .54 .22 .93a .12 .92 .15 .40* C1: Competence 2.57 1.01 –.16 .12 .10 –.01 .61 .95b .13 .93 .22 .07 C2: Order 2.10 1.05 –.13 –.26 .08 .10 .65 .82 .25 .97 .16 .04 C3: Dutifulness 2.38 0.99 –.18 –.07 .00 .17 .62 .99b .17 .95 .29 –.16 C4: Achievement Striving 2.30 1.02 –.09 .00 .16 –.14 .69 .96b .18 .95 –.07 –.45* C5: Self–Discipline 2.28 1.03 –.21 .07 .01 .06 .65 .98b .15 .94 .06 .12 C6: Deliberation 2.14 1.03 –.02 –.25 –.08 .25 .57 .95b .20 .95 .06 –.13 Factor Congruence .87b .89b .85b .91b .93b .89b Note: N = 3,989. These are principal components targeted to the American normative structure. N = Neuroticism; E =Extraversion; O
= Openness; A = Agreeableness; C = Conscientiousness; VC = Variable congruence coefficient; factor and total congruence
coefficient in the last row; rR = correlation between mean NCS scores and corresponding aggregate NEO-PI-R observer ratings, N =
47; rS = correlation between mean NCS scores and corresponding aggregate NEO-PI-R self-reports, N = 30. aCongruence higher than
that of 95% of rotations from random data. bCongruence higher than that of 99% of rotations from random data. * p < .05; **p < .01
(with Bonferroni corrrection for 35 NSC scales, none of the correlations is significant).
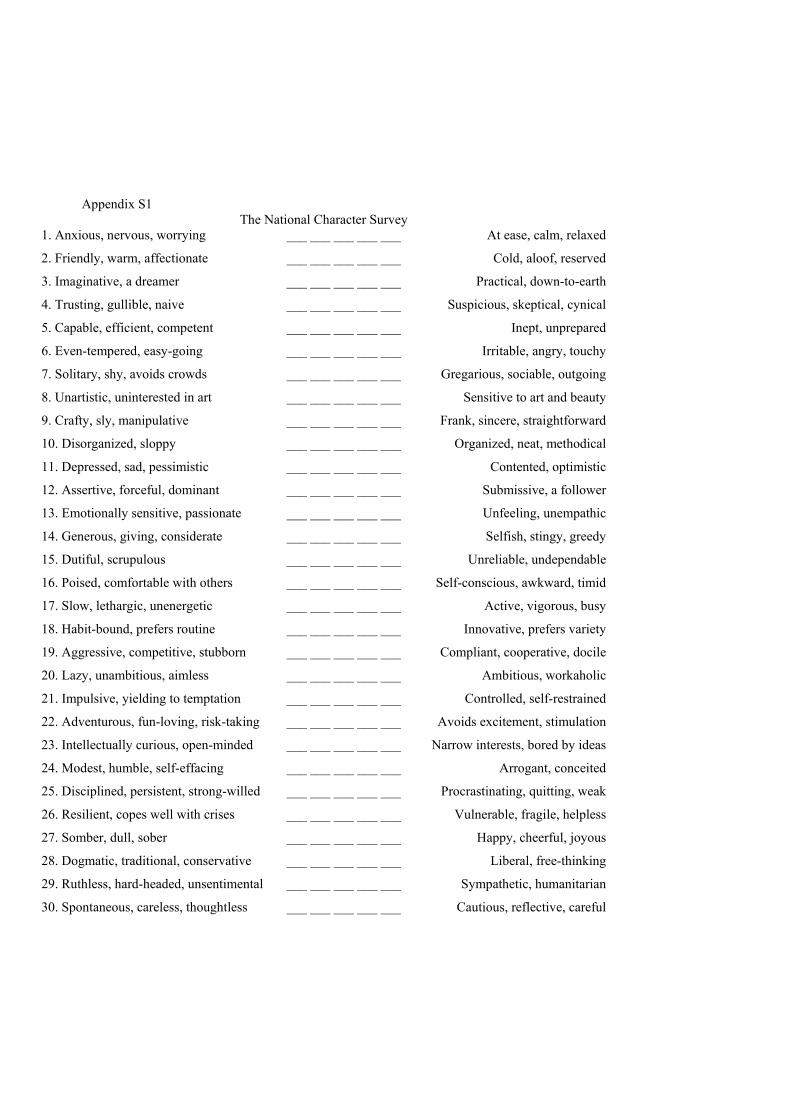
Appendix S1 The National Character Survey
1. Anxious, nervous, worrying
2. Friendly, warm, affectionate
3. Imaginative, a dreamer
4. Trusting, gullible, naive
5. Capable, efficient, competent
6. Even-tempered, easy-going
7. Solitary, shy, avoids crowds
8. Unartistic, uninterested in art
9. Crafty, sly, manipulative
10. Disorganized, sloppy
11. Depressed, sad, pessimistic
12. Assertive, forceful, dominant
13. Emotionally sensitive, passionate
14. Generous, giving, considerate
15. Dutiful, scrupulous
16. Poised, comfortable with others
17. Slow, lethargic, unenergetic
18. Habit-bound, prefers routine
19. Aggressive, competitive, stubborn
20. Lazy, unambitious, aimless
21. Impulsive, yielding to temptation
22. Adventurous, fun-loving, risk-taking
23. Intellectually curious, open-minded
24. Modest, humble, self-effacing
25. Disciplined, persistent, strong-willed
26. Resilient, copes well with crises
27. Somber, dull, sober
28. Dogmatic, traditional, conservative
29. Ruthless, hard-headed, unsentimental
30. Spontaneous, careless, thoughtless
___ ___ ___ ___ ___
___ ___ ___ ___ ___
___ ___ ___ ___ ___
___ ___ ___ ___ ___
___ ___ ___ ___ ___
___ ___ ___ ___ ___
___ ___ ___ ___ ___
___ ___ ___ ___ ___
___ ___ ___ ___ ___
___ ___ ___ ___ ___
___ ___ ___ ___ ___
___ ___ ___ ___ ___
___ ___ ___ ___ ___
___ ___ ___ ___ ___
___ ___ ___ ___ ___
___ ___ ___ ___ ___
___ ___ ___ ___ ___
___ ___ ___ ___ ___
___ ___ ___ ___ ___
___ ___ ___ ___ ___
___ ___ ___ ___ ___
___ ___ ___ ___ ___
___ ___ ___ ___ ___
___ ___ ___ ___ ___
___ ___ ___ ___ ___
___ ___ ___ ___ ___
___ ___ ___ ___ ___
___ ___ ___ ___ ___
___ ___ ___ ___ ___
___ ___ ___ ___ ___
At ease, calm, relaxed
Cold, aloof, reserved
Practical, down-to-earth
Suspicious, skeptical, cynical
Inept, unprepared
Irritable, angry, touchy
Gregarious, sociable, outgoing
Sensitive to art and beauty
Frank, sincere, straightforward
Organized, neat, methodical
Contented, optimistic
Submissive, a follower
Unfeeling, unempathic
Selfish, stingy, greedy
Unreliable, undependable
Self-conscious, awkward, timid
Active, vigorous, busy
Innovative, prefers variety
Compliant, cooperative, docile
Ambitious, workaholic
Controlled, self-restrained
Avoids excitement, stimulation
Narrow interests, bored by ideas
Arrogant, conceited
Procrastinating, quitting, weak
Vulnerable, fragile, helpless
Happy, cheerful, joyous
Liberal, free-thinking
Sympathetic, humanitarian
Cautious, reflective, careful