Embed Size (px)
Citation preview

© Commonwealth of Australia, (2006). 1
National Centre for Culture and Recreation Statistics Women�s participation in sport and physical activities The beneficial effects of regular participation in sport and physical activity have been widely supported by scientific evidence. Studies have shown that physical activity can significantly lower the risk for cardiovascular disease, stroke, hypertension, osteoporosis, non-insulin-dependent diabetes, depression and some forms of cancer (Pate et al., 1995; Glasgow et al., 1997). However, despite the prevalence of campaigns promoting the health benefits of physical activity, participation rates remain low in some groups. Numerous social and environmental factors affect participation. Gender, age, level of education are some of the variables identified that influence participation in sports and physical activity. This paper will present findings relating to the participation of women in sports and physical activity. The results are based on data from the Australian Bureau of Statistics 2002 General Social Survey and the 2003 Survey of Children�s Participation in Selected Cultural and Leisure Activities together with two papers presented at the 2005 National Physical Activity conference and the 2005 Sports Management Association of Australia and New Zealand annual conference. Women's Participation Rates: (Participation is defined as being a player, competitor or person who physical undertakes the activity. Involvement as coaches, umpires and club officials is not included.)
• In the 12 months prior to interview, 59.9% of females aged 18 years and older participated at least once in a sporting or physical activity. A lower proportion of females (38.7%) participated for 53 times or more for the same period.
• Some 2 million females (28.5%) aged 18 years and over participated in some sport and physical activities that were organised by a club, association or other organisations.
• Participation rates declined with increasing age. Females aged 25 - 34 years had the highest participation rate (68.0%) while females aged 65 years and over had the lowest (41.3%).
Participation Rates Compared to Men:
• More males (65.0%) participated in sport and physical activities than females (59.9%) at least once in the 12 months prior to interview. Similar proportions of males (38.7%) and females (38.6%) participated for 53 times or more during the same period.
• Males (34.3%) had a higher participation rate in organised sport than females (28.5%).
• Participation in sport and physical activity also declined with increasing age among males. Males aged 18-24 had the highest participation rate (77.6%) and were more likely to participate in sport and physical activity.

© Commonwealth of Australia, (2006). 2
Activities that Women Participated In:
• More females (2.4 million) than males (1.3 million) walked for exercise in the 12 months prior to interview. However, walking was the most popular physical activity for both males and females.
• The activities that had the highest participation rates among females included: Walking (32.9%); Aerobics/Fitness (13.0%); Swimming (11.8%); Tennis (6.1%); Netball (5.3%); Cycling (4.2%).
• Females also had higher participation rates than males in the following activities: aerobics (13.0%, 8.8%) swimming (11.8%, 9.9), netball (5.3%, 0.9%), yoga (3.6%, 0.6%), bushwalking (3.3%, 3.1%), dancing (2.8%, 0.7%), martial arts (1.6%, 1.4%), horse riding/equestrian (1.3%, 0.4%) and carpet bowls (0.8%, 0.3%).
• Females and males showed almost identical participation rates in badminton (0.6%, 0.5%) and Hockey-outdoor (0.5%, 0.4%). Males reported higher rates of participation in all other activities included in the survey.
• Organised activities commonly participated in by females included: aerobics/fitness; netball and yoga. Non-organised activities more commonly undertaken by females were walking for exercise, swimming and aerobics/fitness.
Employment Status:
• Employed females had a higher participation rate (68.2%) compared to the unemployed (60.3%) and retired (46.0%) respondents.
• There were no difference between the participation rates of females working full-time or part-time (both 68.2%).
• Males who were employed full-time and had a higher participation rate (70.1%) and those employed part-time had lower rates (66.2%) compared to females. Males who were retired also had higher participation rates (49.5%) compared to retired females.
Education
• Females with postgraduate degrees had the highest participation rates (80.4%) followed by those who have a bachelor's degree (79.9%) and those with graduate diplomas/certificates (78.5%). Females who finished Year 10 and below had the lowest rates at 46.7%.
• The same trend was observed in males with those who have a bachelor's degree having the highest participation rate (83.4%) and those finishing Year 10 and below having the lowest (46.0%).
Country of Birth
• Females who reported their country of birth to be North-West Europe had the highest participation rate (64.7%) while females whose country of birth is within the region of North Africa and the Middle East had the lowest (19.5%).
• Males who were born in North Africa and the Middles East had a higher participation rate (42.7%) compared to females born in the same region. Males born in Sub-Saharan Africa had the highest participation rate (72.0%).
• Participation rates for females born in "Other than Main English-Speaking" countries were lower (45.8%) when compared to females born in Australia (62.2%) and those born in "Main English-Speaking" countries (65.5%).

© Commonwealth of Australia, (2006). 3
Socio-Economic Index
• Participation rates increase according to socio-economic index. Females belonging to the highest 20% of the quintile also had the highest participation rates (73.4%) while females in the lowest 20% also had the lowest rates of participation (49.1%).
• The same trend is seen amongst males with those belonging to the highest 20% having the highest participation rate (71.7%) and males in the lowest 20% of the quintile also having the lowest rates of participation (51.6%).
Household Type
• Females living in group households had the highest participation rates (70.0%) and those living in two family households had the lowest (46.1%).
• Males showed similar results with those living in group households having the highest participation rates (76.6%) and males living in two-family households having the lowest (51.2%).
Marital Status
• Females whose registered marital status is never married showed the highest participation rates (66.2%) and those who are widowed had the lowest (38.3%).
• The same trend was also shown in males as those who were never married had the highest participation rates (73.2%) and those who are widowed had the lowest (45.8%).
Occupation
• Females working as professionals had the highest participation rates (78.9%) and those working as labourers had the lowest rates (44.8%).
• In comparison with females, males who worked as intermediate production and transport workers had the lowest participation rates (14.7%) while those working as professionals also had the highest (81.7%).
English Proficiency
• Females who reported their level of proficiency in spoken English as very well showed a participation rate 59.9% while the participation rates of females whose English proficiency was reported as well was 37.9%, not well 35.3 and those who did not speak English at all was 23.1%*.
• The same trend can be observed with males. The participation rates for those whose English proficiency was reported as well was 63.0%; well - 57.4%; not well - 35.2% and not at all - 2.4%*
* RSE greater than 50% and should be used with caution State of Residence
• There was very little difference between the participation rates of females living in capital cities and those living in the rest of the state (59.9% and 60.1% respectively).
• Females living in the ACT had the highest participation rate (73.4%) while those living in NSW had the lowest (56.6%). The participation rates across all states is shown in Fig 1.

© Commonwealth of Australia, (2006). 4
• Similarly, males living in the ACT had the highest participation rate (78.9%) however males from SA had the lowest (58.6).
• Data on the variables according to each state and territory is presented in Appendix 1.
Participation Rates Across States and Territories
56.660.2 59.0 56.8
73.0
57.4
70.973.4
59.962.5
65.963.4
58.6
76.9
63.3
70.4
78.9
65.0
0.0
10.0
20.0
30.0
40.0
50.0
60.0
70.0
80.0
90.0
NSW VIC QLD SA WA TAS NT ACT AUS
State and Territory
Parti
cipa
tion
Rat
e (%
)
Females Males
Children's Participation (Participation is defined as children aged 5 - 14 years involved in organised sport outside school hours during the 12 months prior to interview.)
• Participation rates for girls (54.2%) were lower compared to boys (68.6%) in organised sport outside of school hours in the 12 months prior to interview. The overall participation rate for children aged 5-14 years was 62%.
• There was a slight increase in the participation rate from 2000 to 2003. Participation rates for boys increased from 66.1% to 68.6% and girls increased from 52.3% to 54.2%. However, only the difference in the rates in boys was statistically significant.
• Girls aged from 9 - 11 years had the highest participation rates (61.1%) followed by 12 - 14 year olds (56.6%) and 5-8 year olds (46.9%). A similar trend is seen among boys with those aged 9-11 years having the highest participation rates (73.8%) followed by boys aged 12-14 years (70.3%) and boys aged 5-8 years (63.4%).
• Among girls, netball was the most popular (18%) followed by swimming (17%), tennis (8%) and basketball (7%). For boys, the most popular sports were outdoor soccer (22.0%), swimming (16.0%) and Australian Rules football (14.0%). Overall, swimming was the most popular sporting activity (17%) followed by outdoor soccer (13%).
• Girls who were born in Australia and main English speaking countries have high participation rates (55.1% and 57.1% respectively) compared to girls born in other countries (26.8%).
• Girls who are living in one-parent families have a lower participation rate (41.8%) compared to girls living in coupled families (57.5%).
• Girls from one-parent families whose parent was born in "other countries" had a lower participation rate (25.3%) compared to those whose parents were
© Commonwealth of Australia, (2006). 5
born in main English-speaking countries (44.7%) and those born in Australia (44.1%).
• Girls in couple families where both parents were born in "other countries" had a lower participation rate (32.4%) compared to those whose parents were born in main English-speaking countries (62.2%) and those born in Australia (62.6%).
• Girls who are living in one-parent families where the parent is not employed had a lower participation rate (31.1%) compared to girls whose parent was employed (53.6%).
• Girls in coupled families where both parents were not employed had the lowest participation rate (22.4%). Girls with one parent employed had a participation rate of 50.5% and where both parents were employed the participation rate was 65.1%.
Previous analysis of the 2002 GSS data showed that age, sex and health status had a consistent relationship with participation. Highest level of education and proficiency in English were also factors as were social contact with family and friends (Stratton et al. 20051).
• Males aged 18-24 years are more likely to participate in sport or physical activity. Females aged 36-44, 45-54 and 55-64 years are less likely to participate.
• Adults reporting poor or fair health are less likely to participate in sport or physical activity.
• Adults reporting quarterly contact and no contact with family or friends were less likely to participate in sport or physical activity.
• Those with degree/diploma qualifications or higher are more likely to participate; those who left school at Year 11 or earlier are less likely to participate.
• Adults in the highest socio-economic (SEIFA) quintile are more likely to participate. Those reporting weekly household incomes under $300 and $300 � 499 per week are less likely to participate.
• Those reporting poor proficiency in English were less likely to participate in sport and physical activity.
• Employed professionals or in advanced service occupations are more likely to participate. Those employed in labouring, transport related and trade occupations are likely to participate.
Previous analysis of data from 2003 Children's Participation in Selected Culture and Leisure Activities showed that birthplace and proficiency in speaking English had a consistent relationship with participation in children (Stratton et al. 20052).
• Children in the highest socio-economic quintile are more likely to participate and those in the lowest quintile are less likely to participate.
• Children aged 5-7 years are less likely to participate. • Girls are less likely to participate. • Children in a couple family with both parents employed are more likely to
participate. • Children in couple families where neither parents were employed are less
likely to participate. • Children born overseas are less likely to participate. • Children whose parents were born overseas in a non-English speaking
country are less likely to participate
© Commonwealth of Australia, (2006). 6
• Children who bike ride and skateboard or rollerblade for 1-4 hours in a two-week period are more likely to participate.
• Children who watch television or videos for more than 40 hours in a two-week period are less likely to participate.
• Children who do not use a computer or the Internet at home are less likely to participate. Children who play computer games 1-4 hours (within a two-week period) are more likely to participate.
Summary
• Age and sex are strongly related to levels of participation in sport or physical activity for both adults and children.
• Males/boys showed higher participation rates in organised sport than females/girls.
• Socio-economic status also has a clear association with participation in sport and physical activity by adults and children.
• Although screen based activities affect the level of participation in sport and physical activity in children, socio-economic characteristics have a more noticeable association with non-participation.
• English language proficiency is also a factor that affects participation by adults and children. Adults with poor proficiency in English as well as children whose parents were born in a non-English speaking country show low levels of participation. This is particularly noticeable for women and girls.
• In adults, irregular social contact is a factor associated with low levels of participation by women.
• Although reported health status in adults is a factor associated with participation in sport and physical activity, the decrease in participation with poorer levels of health is more pronounced for males. However there is no established causal relationship between the two variables.
References: ABS 2002, General Social Survey Summary Results, cat no 4159.0, ABS, Canberra. ABS 2003, Children�s Participation in Culture and Leisure Activities Summary Results, cat no. 4901.1, ABS, Canberra. Glasgow R, Ruggiero L, Eakin E et al. 1997, Quality of life and associated characteristics in a large sample of adults with diabetes. Diabetes Care, 20: 562-567. Pate RR, Pratt M, Blair SN, Haskell WL, Macera CA, Bouchard C et al. 1995, Physical activity and public health: A recommendation from the centers of disease control and the American College of Sports Medicine, JAMA 273: 402-407 Stratton M1, Conn L, Liaw C and Conolly L. (2005), Sport and Related Recreational Physical Activity - The Social Correlates of Participation and Non-Participation by Adults, Sport Management Association of Australia and New Zealand (SMAANZ). Eleventh Annual Conference, Canberra. Stratton M2, Conn L and Smallacombe T. (2005), The Young and the Restful (Re-Visited) - The Effects of Recreational Choices and Demographic Factors on Children's Participation in Sport, Fifth National Physical Activity Conference, Melbourne.

© Commonwealth of Australia, (2006). 7
Table 1. CHARACTERICTICS OF PARTICIPANTS � Sport and physical activities, New South Wales Male Female Persons ('000) % ('000) % ('000) % Participation Rate - Player 1516.4 62.5 1398.3 56.6 2914.7 59.5 Type of Participation Only participated in organised activities 283.9 11.7 283.5 11.7 567.4 23.4
Participated in both organised and non-organised activities 565.4 23.3 390.2 16.1 955.6 39.4 Only participated in non-organised activities 667.1 27.5 724.6 29.9 1391.7 57.4 Country of Birth Oceania and Antarctica 1136.5 64.3 1143.2 60.0 2279.6 62.1 North-West Europe 119.3 65.8 90.0 61.2 209.3 63.7 Southern and Eastern Europe 51.4 37.5 32.0 31.3 83.4 34.8 North Africa and the Middle East 20.7* 46.0 7.5* 12.7 28.2* 27.1 South-East Asia 52.1* 66.1 51.9* 53.7 104.0 59.3 North-East Asia 62.6 63.4 29.6* 51.4 92.3 59.1 Southern and Central Asia 42.6 66.7 14.8* 38.4 57.4 56.0 Americas 24.9* 66.8 14.3* 38.4 39.2 52.6 Sub-Saharan Africa 6.3** 40.9 15.1* 52.4 21.4* 48.4 Employment Status Employed 1196.8 68.5 889.1 63.9 2085.9 66.5 Unemployed 57.6* 58.5 46.7 57.6 104.3 58.1 Not in the labour force 262.0 45.2 462.5 46.2 724.5 45.8 Household Type One family household 1232.9 63.0 1191.6 58.5 2424.5 60.7 Two family household 39.9* 56.9 21.9* 37.4 61.7* 48.0
One family household with non-family members present 26.9 90.3 2.7 11.4 29.6 55.5 Lone person household 142.6* 54.4 139.8** 49.9 282.4* 52.1 Group household 74.1 72.8 42.3 57.9 116.5 66.6 Occupation Managers and Administrators 165.7 70.2 52.3 69.0 218.0 69.9 Professionals 251.8 78.7 254.7 75.4 506.5 77.0 Associate Professionals 194.9 80.2 98.6 68.1 293.4 75.6 Tradespersons and Related Workers 223.1 66.7 19.7* 51.3 242.7 65.1 Advanced Clerical and Service Workers 15.8* 88.4 88.9 68.3 104.6 70.6
Intermediate Clerical, Sales and Service Workers 107.3 78.7 229.9 61.5 337.1 66.1 Intermediate Production and Transport Workers 93.6 44.3 3.1 14.9 96.7 41.7 Elementary Clerical, Sales and Service Workers 58.8 56.3 110.9 58.1 169.7 57.5 Labourers and Related Workers 81.9 59.5 31.1 39.9 113.0 52.4 * estimate has relative standard of error between 25% - 50% and should be used with caution ** estimate has relative standard of error greater than 50% and is considered unreliable for general use

© Commonwealth of Australia, (2006). 8
Table 1. (cont) CHARACTERICTICS OF PARTICIPANTS � Sport and physical activities, New South Wales Male Female Persons ('000) % ('000) % ('000) % Education Level Postgraduate Degree 70.1 85.2 45.8 78.9 115.9 82.6 Graduate Diploma/Graduate Certificate 30.9* 85.8 48.3 79.7 79.2 81.9 Bachelor Degree 280.8 79.9 254.9 77.9 535.7 78.9 Advanced Diploma/Diploma 134.8 75.5 155.7 62.5 290.4 67.9 Certificates III/IV 387.8 64.0 73.1 49.5 460.9 61.2 Certificates I/II 21.7* 57.8 28.4* 59.6 50.1* 58.8 Certificate not further defined 3.9** 99.1 1.2** 49.0 5.2** 81.4 Year 12 265.6 67.9 231.8 54.6 497.5 61.0 Year 11 51.4 79.2 76.5 63.1 127.9 68.7 Year 10 or below 264.8 40.8 476.0 46.9 740.8 44.5
Never attended school and no non school qualification 0.0 0.0 0.0 0.0 0.0 0.0 Marital Status Never married 511.1 71.5 349.5 61.1 860.6 66.9 Widowed 21.3 35.9 68.1 33.9 89.4 34.4 Divorced 73.9 57.2 71.5 45.7 145.5 50.9 Separated 27.9 50.3 44.4 60.9 72.3 56.3 Married 882.2 60.2 864.7 58.8 1746.9 59.5 Socio Economic Index For Areas Lowest 20% 186.4 47.4 162.6 41.6 348.9 44.5 Second quintile 254.4 59.1 232.7 48.8 487.1 53.7 Third quintile 317.2 60.8 305.4 59.5 622.5 60.1 Fourth quintile 295.3 66.5 247.3 57.8 542.5 62.2 Highest 20% 463.2 72.9 450.4 67.9 913.6 70.4 * estimate has relative standard of error between 25% - 50% and should be used with caution ** estimate has relative standard of error greater than 50% and is considered unreliable for general use

© Commonwealth of Australia, (2006). 9
Table 2. CHARACTERICTICS OF PARTICIPANTS � Sport and physical activities, Victoria Male Female Persons ('000) % ('000) % ('000) % Participation Rate - Player 1189.7 65.9 1117.7 60.1 2307.4 63.0 Type of Participation Only participated in organised activities 235.1 13.0 204.8 11.0 439.9 12.0 Participated in both organised and non-organised activities 380.5 21.1 358.5 19.3 739.0 20.2 Only participated in non-organised activities 570.9 31.6 552.4 29.7 1123.3 30.7 Country of Birth Oceania and Antarctica 885.4 71.1 884.8 65.1 1770.2 68.0 North-West Europe 126.3 68.7 85.4 60.5 211.7 65.2 Southern and Eastern Europe 76.7 40.8 71.4 42.5 148.1 41.6 North Africa and the Middle East 11.9* 37.5 5.5** 21.9 17.4* 30.6 South-East Asia 25.6* 50.8 27.4* 39.9 52.9 44.5 North-East Asia 24.4* 66.1 13.1* 38.4 37.5 52.8 Southern and Central Asia 11.4* 41.0 12.0* 36.5 23.4* 38.6 Americas 6.4** 41.8 9.4* 60.3 15.8* 51.0 Sub-Saharan Africa 21.5* 83.3 8.7* 60.8 30.3 75.6 Employment Status Employed 902.0 69.2 719.6 68.7 1621.6 69.0 Unemployed 44.9 61.3 41.0 62.7 85.9 62.0 Not in the labour force 242.8 56.6 357.1 47.9 599.9 51.1 Household Type One family household 972.4 66.7 868.3 59.4 1840.7 63.1 Two family household 7.7* 24.8 23.9* 50.3 31.6* 40.0
One family household with non-family members present 19.4** 72.2 26.3* 86.1 45.7 81.4 Lone person household 122.3 60.5 155.4 59.1 277.7 59.9 Group household 67.9 77.1 43.8 76.9 111.7 77.0 1190.0 65.9 1118.0 60.2 2307.0 63.0 Occupation Managers and Administrators 118.8 69.5 41.0 58.9 159.7 66.4 Professionals 190.5 81.1 202.0 79.8 392.6 80.5 Associate Professionals 126.9 76.0 78.5 74.1 205.3 75.2 Tradespersons and Related Workers 192.1 72.1 15.7* 54.9 207.8 70.4 Advanced Clerical and Service Workers 9.9** 59.6 62.1 71.6 72.0 69.7
Intermediate Clerical, Sales and Service Workers 76.7 65.5 176.9 69.3 253.7 68.1
Intermediate Production and Transport Workers 90.3 56.9 15.3* 59.5 105.5 57.2
Elementary Clerical, Sales and Service Workers 55.8 79.7 92.0 65.3 147.8 70.1 Labourers and Related Workers 40.3 40.0 34.8 43.0 75.1 41.3 * estimate has relative standard of error between 25% - 50% and should be used with caution ** estimate has relative standard of error greater than 50% and is considered unreliable for general use

© Commonwealth of Australia, (2006). 10
Table 2 (cont). CHARACTERICTICS OF PARTICIPANTS � Sport and physical activities, Victoria Male Female Persons ('000) % ('000) % ('000) % Education Level Postgraduate Degree 34.6 67.9 19.1 77.0 53.7 70.9 Graduate Diploma/Graduate Certificate 28.6* 72.8 51.6 75.7 80.2 74.6 Bachelor Degree 180.0 84.2 179.9 79.8 359.9 82.0 Advanced Diploma/Diploma 95.9 73.2 122.0 69.8 217.9 71.2 Certificates III/IV 266.5 69.4 68.2 60.9 334.7 67.5 Certificates I/II 8.4* 51.2 27.6* 65.9 36.0 61.7 Certificate not further defined 1.4** 100.0 2.9** 78.3 4.3** 84.2 Year 12 243.9 70.8 232.2 63.2 476.1 66.9 Year 11 95.0 72.6 165.9 67.2 261.0 69.1 Year 10 or below 220.3 47.0 240.1 41.6 460.4 44.0
Never attended school and no non school qualification 0.0 0.0 0.8** 12.1 0.8* 12.1 Marital Status Never married 439.9 76.6 318.7 67.8 758.6 72.6 Widowed 29.8 53.1 80.1 43.1 109.9 45.4 Divorced 51.7 61.4 83.7 56.7 135.3 58.4 Separated 28.4* 57.9 42.0 49.7 70.4 52.7 Married 639.9 61.5 593.2 61.1 1233.2 61.3 1189.7 65.9 1117.7 60.2 2307.4 63.0 Socio Economic Index For Areas Lowest 20% 120.0 48.8 138.5 45.4 258.5 46.8 Second quintile 156.3 66.5 116.2 49.7 272.5 58.1 Third quintile 247.4 59.5 248.7 63.4 496.2 61.4 Fourth quintile 316.2 70.6 305.2 64.7 621.4 67.5 Highest 20% 349.8 76.0 309.1 68.1 658.9 72.1 * estimate has relative standard of error between 25% - 50% and should be used with caution ** estimate has relative standard of error greater than 50% and is considered unreliable for general use

© Commonwealth of Australia, (2006). 11
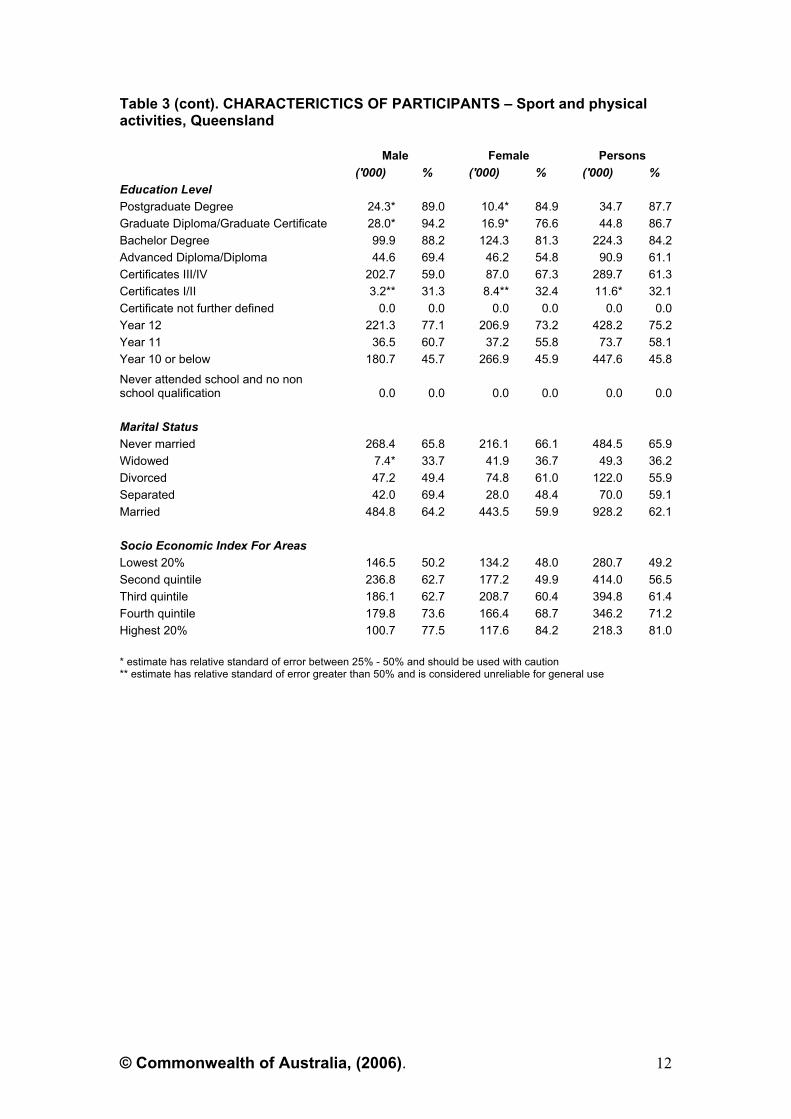
Table 3. CHARACTERICTICS OF PARTICIPANTS � Sport and physical activities, Queensland Male Female Persons ('000) % ('000) % ('000) % Participation Rate - Player 849.8 63.4 804.2 59.0 1654.1 61.2 Type of Participation Only participated in organised activities 194.9 14.5 159.2 11.7 354.1 13.1 Participated in both organised and non-organised activities 289.2 21.6 230.9 17.0 520.1 19.2 Only participated in non-organised activities 364.5 27.2 411.7 30.2 776.2 28.7 Country of Birth Oceania and Antarctica 725.8 63.8 690.2 59.0 1416.0 61.4 North-West Europe 75.6 66.8 64.7 66.7 140.2 66.7 Southern and Eastern Europe 12.5* 44.2 9.9* 36.1 22.4* 40.1 North Africa and the Middle East 1.6** 15.8 0.0 0.0 1.6** 15.8 South-East Asia 9.8** 65.8 12.7* 42.8 22.5* 50.3 North-East Asia 3.5** 53.0 12.6* 73.7 16.1* 68.2 Southern and Central Asia 2.3** 41.8 2.9** 50.9 5.2** 46.4 Americas 9.4** 77.7 9* 73.2 18.5* 76.1 Sub-Saharan Africa 9.4* 72.9 2.1** 100.0 11.5* 76.2 Employment Status Employed 644.6 68.6 537.6 68.9 1182.4 68.7 Unemployed 41.7 56.9 30.1 56.5 72.0 56.7 Not in the labour force 163.3 49.9 236.4 44.7 400.0 46.8 Household Type One family household 662.1 63.8 629.0 59.0 1291.1 61.4 Two family household 13.0** 65.3 16.8** 51.7 29.8** 56.7
One family household with non-family members present 22.0** 65.1 17.3** 63.0 39.2** 64.1 Lone person household 102.5 56.3 97.8 55.6 200.3 55.9 Group household 50.5 73.3 37.3 67.8 87.8 71.7 Occupation Managers and Administrators 52.2 61.9 18.5 53.9 70.7 59.6 Professionals 121.5 83.9 120.4 78.1 241.8 80.9 Associate Professionals 103.4 78.3 72.1 74.4 175.6 76.6 Tradespersons and Related Workers 149.7 68.3 22.5* 65.0 172.2 67.9 Advanced Clerical and Service Workers 2.7** 48.9 52.5 76.2 55.2 74.2
Intermediate Clerical, Sales and Service Workers 61.2 69.7 151.1 72.6 212.3 71.7
Intermediate Production and Transport Workers 81.2 56.7 14.8* 58.3 96.1 57.0
Elementary Clerical, Sales and Service Workers 24.7* 66.1 61.5 63.6 86.2 64.3 Labourers and Related Workers 48.0 55.9 24.3 39.3 72.3 49.0 * estimate has relative standard of error between 25% - 50% and should be used with caution ** estimate has relative standard of error greater than 50% and is considered unreliable for general use
© Commonwealth of Australia, (2006). 12
Table 3 (cont). CHARACTERICTICS OF PARTICIPANTS � Sport and physical activities, Queensland Male Female Persons ('000) % ('000) % ('000) % Education Level Postgraduate Degree 24.3* 89.0 10.4* 84.9 34.7 87.7 Graduate Diploma/Graduate Certificate 28.0* 94.2 16.9* 76.6 44.8 86.7 Bachelor Degree 99.9 88.2 124.3 81.3 224.3 84.2 Advanced Diploma/Diploma 44.6 69.4 46.2 54.8 90.9 61.1 Certificates III/IV 202.7 59.0 87.0 67.3 289.7 61.3 Certificates I/II 3.2** 31.3 8.4** 32.4 11.6* 32.1 Certificate not further defined 0.0 0.0 0.0 0.0 0.0 0.0 Year 12 221.3 77.1 206.9 73.2 428.2 75.2 Year 11 36.5 60.7 37.2 55.8 73.7 58.1 Year 10 or below 180.7 45.7 266.9 45.9 447.6 45.8
Never attended school and no non school qualification 0.0 0.0 0.0 0.0 0.0 0.0 Marital Status Never married 268.4 65.8 216.1 66.1 484.5 65.9 Widowed 7.4* 33.7 41.9 36.7 49.3 36.2 Divorced 47.2 49.4 74.8 61.0 122.0 55.9 Separated 42.0 69.4 28.0 48.4 70.0 59.1 Married 484.8 64.2 443.5 59.9 928.2 62.1 Socio Economic Index For Areas Lowest 20% 146.5 50.2 134.2 48.0 280.7 49.2 Second quintile 236.8 62.7 177.2 49.9 414.0 56.5 Third quintile 186.1 62.7 208.7 60.4 394.8 61.4 Fourth quintile 179.8 73.6 166.4 68.7 346.2 71.2 Highest 20% 100.7 77.5 117.6 84.2 218.3 81.0 * estimate has relative standard of error between 25% - 50% and should be used with caution ** estimate has relative standard of error greater than 50% and is considered unreliable for general use

© Commonwealth of Australia, (2006). 13
Table 4. CHARACTERICTICS OF PARTICIPANTS � Sport and physical activities, South Australia Male Female Persons ('000) % ('000) % ('000) % Participation Rate - Player 326.6 58.6 327.5 56.8 654.1 57.7 Type of Participation Only participated in organised activities 86.3 15.5 73.1 12.7 159.4 14.1 Participated in both organised and non-organised activities 102.5 18.4 86.0 14.9 188.4 16.6 Only participated in non-organised activities 137.8 24.7 168.4 29.2 306.2 27.0 Country of Birth Oceania and Antarctica 259.8 61.3 248.7 57.7 508.5 59.5 North-West Europe 39.7 56.2 45.8 55.0 85.5 55.5 Southern and Eastern Europe 15.9 37.6 17.0* 50.1 32.9 43.2 North Africa and the Middle East 1.0** 31.3 0.7** 21.2 1.7** 26.2 South-East Asia 4.7* 78.3 7.1* 71.0 11.8* 74.2 North-East Asia 1** 40.0 1.3** 28.3 2.3* 32.4 Southern and Central Asia 1.0** 25.6 0.7** 33.3 1.8** 30.0 Americas 0.9** 40.9 4.0** 76.9 4.9* 66.2 Sub-Saharan Africa 2.5* 86.2 2.1** 65.6 4.6* 76.7 Employment Status Employed 248.3 63.3 202.8 67.0 451.2 64.9 Unemployed 12.4* 66.0 11.8 60.8 24.2 63.4 Not in the labour force 65.8 45.0 112.9 44.4 178.7 44.6 Household Type One family household 257.6 57.0 265.4 58.3 523.0 57.7 Two family household 0.0 0.0 3.3** 33.7 3.3** 33.7
One family household with non-family members present 2.0** 62.5 4.7** 75.8 6.7** 71.3 Lone person household 45.9 60.1 42.6 46.1 88.5 52.4 Group household 21.1 81.5 11.5 88.5 32.6 83.6 Occupation Managers and Administrators 36.8 61.9 13.6 63.9 50.4 62.5 Professionals 45.0 78.1 51.4 75.3 96.4 76.6 Associate Professionals 27.7 60.2 30.9 71.4 58.6 65.6 Tradespersons and Related Workers 46.2 61.3 6.7* 64.8 52.9 61.7 Advanced Clerical and Service Workers 3.2* 100.0 11.3 58.6 14.4 64.4
Intermediate Clerical, Sales and Service Workers 23.7 71.8 43.1 67.2 66.8 68.7
Intermediate Production and Transport Workers 27.3 49.9 3.0* 42.2 30.2 49.1
Elementary Clerical, Sales and Service Workers 9.9 59.9 28.6 68.2 38.5 65.9 Labourers and Related Workers 28.5 61.3 14.0 52.0 42.4 57.9 * estimate has relative standard of error between 25% - 50% and should be used with caution ** estimate has relative standard of error greater than 50% and is considered unreliable for general use

© Commonwealth of Australia, (2006). 14
Table 4 (cont). CHARACTERICTICS OF PARTICIPANTS � Sport and physical activities, South Australia Male Female Persons ('000) % ('000) % ('000) % Education Level Postgraduate Degree 5.8* 75.2 8.1* 92.9 13.9 84.6 Graduate Diploma/Graduate Certificate 9.2* 68.0 10.8 68.0 20.0 68.0 Bachelor Degree 42.6 78.4 44.2 74.6 86.8 76.4 Advanced Diploma/Diploma 23.7 70.0 29.8 74.8 53.6 72.6 Certificates III/IV 86.9 57.7 30.3 62.4 117.2 58.8 Certificates I/II 6.8** 59.7 2.3** 39.9 9.1* 53.1 Certificate not further defined 0.0 0.0 0.8** 100.0 0.8** 100.0 Year 12 50.9 67.0 67.0 63.4 117.9 64.9 Year 11 36.7 60.0 45.4 49.6 82.1 53.8 Year 10 or below 63.0 43.9 85.1 43.5 148.1 43.7
Never attended school and no non school qualification 0.0 0.0 1.7** 67.6 1.7** 34.6 Marital Status Never married 117.2 73.7 95.1 65.6 212.2 69.8 Widowed 6.3* 51.5 17.9 32.1 24.2 35.6 Divorced 20.5 57.2 24.8 49.4 45.3 52.7 Separated 7.8 45.5 9.9 39.5 17.7 41.9 Married 174.9 52.5 179.8 59.8 354.7 56.0 Socio Economic Index For Areas Lowest 20% 78.3 56.2 63.1 42.7 141.4 49.2 Second quintile 59.8 53.2 77.7 61.5 137.6 57.6 Third quintile 56.7 56.2 55.4 58.1 112.1 57.1 Fourth quintile 76.3 60.3 73.9 61.9 150.2 61.1 Highest 20% 55.5 70.8 57.4 65.7 112.9 68.1 * estimate has relative standard of error between 25% - 50% and should be used with caution ** estimate has relative standard of error greater than 50% and is considered unreliable for general use

© Commonwealth of Australia, (2006). 15
Table 5. CHARACTERICTICS OF PARTICIPANTS � Sport and physical activities, Western Australia Male Female Persons ('000) % ('000) % ('000) % Participation Rate - Player 547.0 76.9 520.8 73.0 1067.8 74.9 Type of Participation Only participated in organised activities 69.84 9.82 62.38 8.75 132.22 9.28 Participated in both organised and non-organised activities 212.55 29.87 200.26 28.07 412.81 28.97 Only participated in non-organised activities 264.58 37.18 258.16 36.19 522.74 36.69 Country of Birth Oceania and Antarctica 364.1 78.6 368.3 74.4 732.4 76.4 North-West Europe 96.2 74.4 93.8 73.4 190.0 73.9 Southern and Eastern Europe 30.0 70.3 12.3* 47.7 42.3 61.8 North Africa and the Middle East 5.1* 100.0 3.3* 64.7 8.5* 83.3 South-East Asia 20.0* 63.1 19.2 69.1 39.2 65.9 North-East Asia 3.9* 73.6 5.7* 80.3 9.6* 77.4 Southern and Central Asia 12.0* 82.8 7.9* 87.8 19.9 84.7 Americas 6.0* 78.9 4.4* 62.9 10.4 71.2 Sub-Saharan Africa 9.7* 81.5 5.9* 70.2 15.6 76.8 Employment Status Employed 248.3 63.3 202.8 67.0 451.2 64.9 Unemployed 12.4* 66.0 11.8 60.8 24.2 63.4 Not in the labour force 65.8 45.0 112.9 44.4 178.7 44.6 326.6 58.6 327.5 56.8 654.1 57.7 Household Type One family household 431.3 76.7 422.9 73.9 854.2 75.3 Two family household 5.9** 64.3 10.2* 64.0 16.1* 64.1
One family household with non-family members present 11.7* 80.1 7.7* 100.0 19.4* 87.0 Lone person household 69.0 74.2 60.6 66.7 129.6 70.5 Group household 29.0 88.9 19.4 79.4 48.5 84.8 Occupation 51.0 87.2 12.2* 95.3 63.2 88.7 Managers and Administrators 78.0 92.7 73.0 93.0 151.0 92.8 Professionals 65.0 78.7 34.1 80.6 99.0 79.4 Associate Professionals 92.3* 74.3 11.8 62.5 104.2 72.7 Tradespersons and Related Workers 1.6 61.0 42.3 77.8 43.9 77.0 Advanced Clerical and Service Workers 33.0 76.2 83.9 78.6 116.9 77.9
Intermediate Clerical, Sales and Service Workers 40.8 69.1 7.5 66.4 48.2 68.6
Intermediate Production and Transport Workers 20.1 69.0 29.1* 66.6 49.1 67.6
Elementary Clerical, Sales and Service Workers 36.4 68.8 16.7 64.6 53.1 67.4 Labourers and Related Workers 418.2 78.0 310.5 78.7 728.6 78.3 * estimate has relative standard of error between 25% - 50% and should be used with caution ** estimate has relative standard of error greater than 50% and is considered unreliable for general use

© Commonwealth of Australia, (2006). 16
Table 5 (cont). CHARACTERICTICS OF PARTICIPANTS � Sport and physical activities, Western Australia Male Female Persons ('000) % ('000) % ('000) % Education Level Postgraduate Degree 8.5* 64.0 9.6 77.8 18.1 70.6 Graduate Diploma/Graduate Certificate 17.7 87.7 23.9 88.2 41.6 88.0 Bachelor Degree 79.1 91.6 69.2 87.0 148.3 89.4 Advanced Diploma/Diploma 44.5 83.0 63.3 82.3 107.9 82.6 Certificates III/IV 142.1 75.3 50.4 75.2 192.5 75.3 Certificates I/II 6.0* 82.6 6.6* 48.3 12.6* 60.1 Certificate not further defined 0.0 0.0 1.2** 100.0 1.2* 100.0 Year 12 105.2 84.0 109.5 79.9 214.7 81.9 Year 11 36.8 74.6 36.2 69.1 73.0 71.8 Year 10 or below 105.5 64.5 147.0 61.0 252.5 62.4
Never attended school and no non school qualification 0.0 0.0 0.6** 30.8 0.6* 21.5 Marital Status 117.2 73.7 95.1 65.6 212.2 69.8 Never married 6.3* 51.5 17.9 32.1 24.2 35.6 Widowed 20.5 57.2 24.8 49.4 45.3 52.7 Divorced 7.8 45.5 9.9 39.5 17.7 41.9 Separated 174.9 52.5 179.8 59.8 354.7 56.0 Married 326.6 58.6 327.5 56.8 654.1 57.7 Socio Economic Index For Areas Lowest 20% 78.3 56.2 63.1 42.7 141.4 49.2 Second quintile 59.8 53.2 77.7 61.5 137.6 57.6 Third quintile 56.7 56.2 55.4 58.1 112.1 57.1 Fourth quintile 76.3 60.3 73.9 61.9 150.2 61.1 Highest 20% 55.5 70.8 57.4 65.7 112.9 68.1 * estimate has relative standard of error between 25% - 50% and should be used with caution ** estimate has relative standard of error greater than 50% and is considered unreliable for general use
© Commonwealth of Australia, (2006). 17
Table 6. CHARACTERICTICS OF PARTICIPANTS � Sport and physical activities, Tasmania Male Female Persons ('000) % ('000) % ('000) % Participation Rate - Player 106.3 63.3 101.6 57.4 207.9 60.3 Type of Participation Only participated in organised activities 21.8 13.0 20.6 11.6 42.3 12.3 Participated in both organised and non-organised activities 39.8 23.7 29.1 16.4 68.9 20.0 Only participated in non-organised activities 44.0 26.2 52.0 29.3 96.0 27.8 Country of Birth Oceania and Antarctica 92.8 63.2 88.0 57.3 180.8 60.2 North-West Europe 11.8 67.4 8.9 57.4 20.8 63.0 Southern and Eastern Europe 0.7** 50.0 1.4* 66.7 2.0* 57.1 North Africa and the Middle East 0.3** 75.0 0.7** 70.0 1.0* 71.4 South-East Asia 0.0 0.0 0.7** 46.7 0.7** 36.8 North-East Asia 0.0 0.0 1.0* 71.4 1.0* 66.7 Southern and Central Asia 0.0 0.0 0.0 0.0 0.0 0.0 Americas 0.4** 57.1 0.8* 53.3 1.2* 54.5 Sub-Saharan Africa 0.4** 80.0 0.0 0.0 0.4** 44.4 Employment Status Employed 73.9 67.9 60.4 67.5 134.2 67.7 Unemployed 6.6 63.4 2.2* 54.2 8.8 60.8 Not in the labour force 25.8 53.0 39.0 46.7 64.9 49.0 Household Type One family household 87.3 64.8 82.1 58.7 169.4 61.7 Two family household 0.4** 100.0 0.5** 24.1 0.9** 36.5
One family household with non-family members present 2.3** 69.4 0.7** 62.0 3.0** 67.4 Lone person household 10.9 50.4 14.7 50.6 25.6 50.5 Group household 5.5 69.9 3.5 74.0 9.0 71.4 Occupation Managers and Administrators 7.9 60.0 3.7 64.0 11.6 61.2 Professionals 15.6 82.2 15.3 77.7 30.9 79.9 Associate Professionals 9.3 73.3 7.5 81.4 16.9 76.7 Tradespersons and Related Workers 14.9 67.1 1.8* 57.7 16.7 65.9 Advanced Clerical and Service Workers 0.01** 45.4 2.9* 70.7 3.0* 69.6
Intermediate Clerical, Sales and Service Workers 6.0 68.6 15.0 65.1 21.0 66.1
Intermediate Production and Transport Workers 9.1 57.2 0.8** 29.7 9.9 53.4
Elementary Clerical, Sales and Service Workers 3.8* 67.5 8.3 67.3 12.1 67.4 Labourers and Related Workers 6.1 60.5 5.1 55.0 11.2 57.8 * estimate has relative standard of error between 25% - 50% and should be used with caution ** estimate has relative standard of error greater than 50% and is considered unreliable for general use
© Commonwealth of Australia, (2006). 18
Table 6 (cont). CHARACTERICTICS OF PARTICIPANTS � Sport and physical activities, Tasmania Male Female Persons ('000) % ('000) % ('000) % Education Level Postgraduate Degree 2.6* 92.6 2.0* 82.3 4.6 87.8 Graduate Diploma/Graduate Certificate 1.8* 70.8 1.2* 72.4 3.1 71.4 Bachelor Degree 12.9 86.9 16.2 79.5 29.0 82.6 Advanced Diploma/Diploma 7.5 72.4 9.5 72.0 17.0 72.2 Certificates III/IV 25.9 63.2 7.8 60.4 33.7 62.5 Certificates I/II 0.7* 45.1 1.4* 47.9 2.2 46.9 Certificate not further defined 0.0 0.0 0.2** 22.3 0.2** 22.3 Year 12 20.9 80.2 17.0 69.8 38.0 75.1 Year 11 4.3 78.1 4.0 54.3 8.2 64.5 Year 10 or below 28.5 47.3 41.2 46.4 69.7 46.8
Never attended school and no non school qualification 0.4** 48.0 0.2** 35.8 0.6** 43.1 Marital Status Never married 30.4 62.9 24.1 62.7 54.5 62.8 Widowed 2.2* 49.8 7.7 42.9 9.9 44.3 Divorced 7.8 61.3 10.8 56.3 18.6 58.3 Separated 3.4 68.4 3.6 51.2 7.0 58.5 Married 62.5 64.1 55.5 58.7 118.0 61.4 Socio Economic Index For Areas Lowest 20% 21.7 53.0 19.0 42.5 40.6 47.5 Second quintile 23.9 58.2 21.0 51.2 45.0 54.7 Third quintile 21.0 61.2 19.7 57.1 40.6 59.2 Fourth quintile 15.0 70.4 17.5 73.0 32.5 71.8 Highest 20% 24.7 81.7 24.5 74.3 49.2 77.8

© Commonwealth of Australia, (2006). 19
Table 7. CHARACTERICTICS OF PARTICIPANTS � Sport and physical activities, Northern Territories Male Female Persons ('000) % ('000) % ('000) % Participation Rate - Player 38.8 70.3 35.7 70.8 74.5 70.6 Type of Participation Only participated in organised activities 9.5 17.2 6.6 13.2 16.1 15.3 Participated in both organised and non-organised activities 13.9 25.1 10.5 20.8 24.3 23.0 Only participated in non-organised activities 16.4 29.8 19.5 38.6 35.9 34.0 Country of Birth Oceania and Antarctica 32.3 71.9 29.1 72.9 61.5 72.5 North-West Europe 3.7 72.5 2.9 64.4 6.6 68.8 Southern and Eastern Europe 0.6* 50.0 0.3** 50.0 0.9* 50.0 North Africa and the Middle East 0.04** 100.0 0.1** 50.0 0.2** 100.0 South-East Asia 0.6* 33.3 1.9 59.4 2.5 49.0 North-East Asia 0.3* 100.0 0.4** 80.0 0.7* 77.8 Southern and Central Asia 0.4** 66.7 0.2** 66.7 0.6* 66.7 Americas 0.6** 75.0 0.4** 57.1 0.9** 64.3 Sub-Saharan Africa 0.3** 60.0 0.3* 75.0 0.6* 66.7 Employment Status Employed 34.4 74.5 27.2 74.4 61.6 74.5 Unemployed 1.6* 64.1 1.4 78.3 3.0 70.0 Not in the labour force 2.8 43.2 7.1 59.2 9.9 53.6 Household Type One family household 28.3 70.5 27.7 72.0 56.0 71.3 Two family household 0.0 0.0 0.4** 42.8 0.4** 33.0
One family household with non-family members present 1.9* 78.5 1.1* 62.1 3.0* 71.5 Lone person household 5.2 65.6 4.6 74.0 9.8 68.8 Group household 3.4 78.2 1.9 64.3 5.3 72.7 Occupation Managers and Administrators 3.0 73.1 1.4* 85.8 4.4 76.7 Professionals 6.6 80.6 6.9 87.0 13.4 83.7 Associate Professionals 7.2 82.2 3.4 63.1 10.6 74.9 Tradespersons and Related Workers 8.2 75.6 0.7* 71.0 8.9 75.2 Advanced Clerical and Service Workers 0.3** 100.0 2.3 84.4 2.6 85.8
Intermediate Clerical, Sales and Service Workers 2.7 72.5 8.4 76.6 11.1 75.6
Intermediate Production and Transport Workers 3.8 69.4 0.1** 46.8 3.9 68.8
Elementary Clerical, Sales and Service Workers 1.8 74.5 2.9 62.9 4.7 66.8 Labourers and Related Workers 1.0* 38.1 1.1* 52.3 2.1 44.4 * estimate has relative standard of error between 25% - 50% and should be used with caution ** estimate has relative standard of error greater than 50% and is considered unreliable for general use

© Commonwealth of Australia, (2006). 20
Table 7 (cont). CHARACTERICTICS OF PARTICIPANTS � Sport and physical activities, Northern Territories Male Female Persons ('000) % ('000) % ('000) % Education Level Postgraduate Degree 1.6 82.0 0.6* 88.5 2.2 83.7 Graduate Diploma/Graduate Certificate 1.2* 93.9 1.3 91.9 2.5 92.8 Bachelor Degree 4.7 75.9 7.3 87.2 11.9 82.4 Advanced Diploma/Diploma 4.6 94.1 2.4 65.0 7.0 81.4 Certificates III/IV 10.3 72.4 2.7 75.8 12.9 73.1 Certificates I/II 0.1** 64.4 0.2** 68.9 0.3* 67.7 Certificate not further defined 0.1** 50.5 0.03** 100.0 0.1** 58.6 Year 12 6.7 79.9 7.8 69.3 14.5 73.9 Year 11 3.1 65.7 3.9 62.4 7.0 63.8 Year 10 or below 6.4 48.9 9.3 64.0 15.7 56.9
Never attended school and no non school qualification 0.0 0.0 0.0 0.0 0.0 0.0 Marital Status Never married 15.2 73.3 13.3 77.0 28.5 75.0 Widowed 0.1** 21.7 1.2* 51.6 1.3* 47.5 Divorced 2.9 55.6 3.6 73.4 6.5 64.2 Separated 1.2 57.3 1.6 57.4 2.8 57.3 Married 19.4 72.7 15.9 69.4 35.4 71.2 Socio Economic Index For Areas Lowest 20% 1.5 53.9 1.9 62.2 3.4 58.2 Second quintile 5.1 71.8 3.4 62.6 8.4 67.8 Third quintile 13.2 62.5 12.9 66.8 26.1 64.5 Fourth quintile 11.3 85.3 10.5 77.7 21.8 81.4 Highest 20% 7.8 70.9 7.1 77.5 14.8 73.9 * estimate has relative standard of error between 25% - 50% and should be used with caution ** estimate has relative standard of error greater than 50% and is considered unreliable for general use

© Commonwealth of Australia, (2006). 21
Table 8. CHARACTERICTICS OF PARTICIPANTS � Sport and physical activities, Australian Capital Territory Male Female Persons ('000) % ('000) % ('000) % Participation Rate - Player 90.1 78.9 85.8 73.4 175.9 76.1 Type of Participation Only participated in organised activities 14.2 12.4 13.3 11.4 27.6 11.9 Participated in both organised and non-organised activities 36.3 31.7 30.6 26.2 66.9 28.9 Only participated in non-organised activities 39.5 34.5 41.7 35.7 81.1 35.1 Country of Birth Oceania and Antarctica 72.6 80.8 66.9 75.7 139.5 78.3 North-West Europe 8.8 77.2 7.1 68.9 16.0 74.1 Southern and Eastern Europe 1.8* 48.6 3.1 49.2 4.9 49.0 North Africa and the Middle East 0.4** 80.0 0.5** 55.6 0.9* 69.2 South-East Asia 1.2* 44.4 3.1* 73.8 4.4 62.9 North-East Asia 1.7* 94.4 1.6* 66.7 3.3* 78.6 Southern and Central Asia 1.5* 88.2 0.7* 53.8 2.2 73.3 Americas 1.3* 65.0 1.7* 81.0 3.0 73.2 Sub-Saharan Africa 0.7* 100.0 1.0* 100.0 1.7* 100.0 Employment Status Employed 73.1 80.3 62.8 78.7 135.9 79.5 Unemployed 1.2* 82.3 1.0* 64.2 2.3 73.0 Not in the labour force 15.8 72.7 21.9 61.9 37.7 66.0 Household Type One family household 70.7 78.7 67.3 73.3 138.0 76.0 Two family household 2.1* 84.0 1.1* 64.7 3.3* 78.6
One family household with non-family members present 1.7* 68.0 1.5* 57.7 3.2* 62.7 Lone person household 10.3 76.9 11.0 69.6 21.3 72.9 Group household 5.3 89.8 4.8 96.0 10.0 91.7 90.1 78.9 85.8 73.4 175.9 76.1 Occupation Managers and Administrators 14.1 82.8 6.1 87.3 20.2 84.1 Professionals 20.0 84.8 21.2 86.9 41.2 85.9 Associate Professionals 11.3 86.0 8.4 85.7 19.7 85.9 Tradespersons and Related Workers 9.8 68.2 0.9* 64.5 10.7 67.9 Advanced Clerical and Service Workers 0.6** 79.9 3.8 73.5 4.3 74.3
Intermediate Clerical, Sales and Service Workers 7.7 90.4 15.6 72.4 23.2 77.5
Intermediate Production and Transport Workers 4.2 67.0 0.4* 38.1 4.6 62.6
Elementary Clerical, Sales and Service Workers 3.1* 80.9 4.9 70.3 8.0 74.0 Labourers and Related Workers 2.3 73.7 1.5 61.2 3.9 68.2 * estimate has relative standard of error between 25% - 50% and should be used with caution ** estimate has relative standard of error greater than 50% and is considered unreliable for general use

© Commonwealth of Australia, (2006). 22
Table 8 (cont). CHARACTERICTICS OF PARTICIPANTS � Sport and physical activities, Australian Capital Territory Male Female Persons ('000) % ('000) % ('000) % Education Level Postgraduate Degree 7.4 87.8 4.1 85.2 11.5 86.8 Graduate Diploma/Graduate Certificate 5.2 95.4 5.9 86.3 11.1 90.4 Bachelor Degree 19.6 85.5 20.6 86.7 40.2 86.1 Advanced Diploma/Diploma 7.2 79.8 8.8 77.1 16.0 78.3 Certificates III/IV 16.2 73.2 5.6 73.1 21.8 73.2 Certificates I/II 0.3** 43.9 0.6** 52.7 0.9** 49.4 Certificate not further defined 0.0 0.0 0.0 0.0 0.0 0.0 Year 12 21.4 85.0 20.5 75.0 42.0 79.8 Year 11 2.8 77.6 3.6 76.2 6.5 76.8 Year 10 or below 9.2 58.2 15.4 54.2 24.6 55.6
Never attended school and no non school qualification 0.0 0.0 0.1** 100.0 0.1** 100.0 Marital Status Never married 29.1 84.2 25.0 81.6 54.1 83.0 Widowed 0.7* 50.0 3.8 58.7 4.5 57.1 Divorced 6.8 70.9 8.0 67.3 14.8 68.9 Separated 2.4 65.1 3.0 70.1 5.4 67.8 Married 51.2 78.6 46.0 72.3 97.1 75.5 Socio Economic Index For Areas Lowest 20% 1.5** 67.1 1.8** 76.6 3.4** 71.9 Second quintile 2.2* 71.6 2.1* 69.6 4.3* 70.6 Third quintile 6.3* 72.0 5.7* 70.6 12.0* 71.3 Fourth quintile 16.1 75.1 16.0 69.8 32.1 72.3 Highest 20% 64.0 81.3 60.1 74.7 124.1 78.0 * estimate has relative standard of error between 25% - 50% and should be used with caution ** estimate has relative standard of error greater than 50% and is considered unreliable for general use