Embed Size (px)
Citation preview
NATIONAL CENTER FOR EDUCATION STATISTICS
Statistics in Brief
Changes in Math ProficiencyBetween 8th and 10th Grades
Contact:Jeffrey Owings(202) 219-1777
Authors:Don RockEducational Testing
Service
Jeffrey OwingsRalph LeeNCES
Between eighth and tenth grades,1 many students are asked to make curriculum-relateddecisions that may ultimately influence their achievement in core academic subjects such asmathematics. For these decisions to have meaning to the student, they cannot be made inisolation of either past mathematics achievement or the student's aspirations for furthereducation. While past achievement often limits the level of courses available to a student,aspirations for postsecondary education ultimately detennine the level of mathematicsneeded to meet selected occupational or postsecondary education goals. Theinterrelationships between coursework,2 prior achievement, and aspirations can be seenwhen recent findings from an analysis of an NCES-sponsored longitudinal study areexamined. These findings include:
* As expected, students who take, higher level mathematics courses (i.e., Geometry, AlgebraII1, Trigonometry, Pre-calculus, Calculus) between 8th and 10th grades are more likely tobe classified as being proficient at higher levels of mathematics 3 than are students whodo not take higher levels of mathematics courses.
* Students who have fallen furthest behind by 8th grade are the ones who are most likelyto continue to fall behind 2 years later.
* Students who expect to go to college are classified at higher mathematics proficiencylevels at the 8th grade level.
This report presents findings regarding changes in mathematics proficiency levels4
experienced by students as they move from 8th to 10th grade. Data were obtained from thebase year and first follow-up surveys of the National Education Longitudinal Study of 1988(NELS:88) 5 . The scope of the NELS:88 sample used in this report is limited to the 16,659students who were attending school both at the time of the base year and first follow-up
6surveys
Eighth Grade Mathematics Proficiency Levels
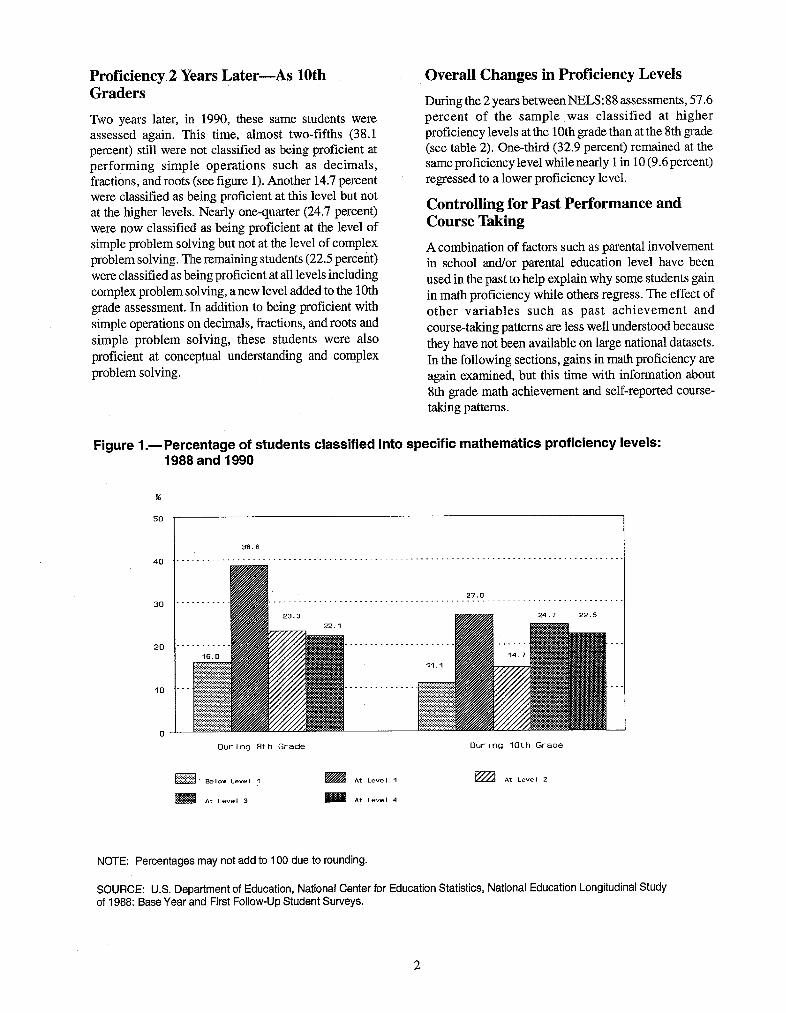
In 1988, more than half of the sampled 8th graders (54.6 percent) were classified as not beingproficient at performing simple mathematics operations such as decimals, fractions, androots7 (see figure 1). About one in five (23.3 percent) were classified as being proficient atsimple operations using decimals, fractions, and roots but not at "simple problem solving."The remaining students (22.1 percent) were classified as being proficient at simple problemsolving requiring conceptual understanding and/or the development of a solution strategy.
NCES 93-455
January 1994
U.S. Department of EducationOffice of Educational Research and Improvement
Proficiency. 2 Years Later-As 10thGraders
Two years later, in 1990, these same students wereassessed again. This time, almost two-fifths (38.1percent) still were not classified as being proficient atperforming simple operations such as decimals,ftactions, and roots (see figure 1). Another 14.7 percentwere classified as being proficient at this level but notat the higher levels. Nearly one-quarter (24.7 percent)were now classified as being proficient at the level ofsimple problem solving but not at the level of complexproblem solving. The remaining students (22.5 percent)were classified as being proficient at all levels includingcomplex problem solving, a new level added to the 10Othgrade assessment. In addition to being proficient withsimple operations on decimals, fractions, and roots andsimple problem solving, these students were alsoproficient at conceptual understanding and complexproblem solving.
Overall Changes in Proficiency Levels
During the 2 years between NELS :88 assessments, 57.6percent of the sample was classified at higherproficiency levels at the 10th grade than at the 8th grade(see table 2). One-third (32.9 percent) remained at thesame proficiency level while nearly Itin 10 (9.6 percent)regressed to a lower proficiency level.
Controlling for Past Performance andCourse Taking
A combination of factors such as parental involvementin school and/or parental education level have beenused in the past to help explain why some students gainin math proficiency while others regress. The effect ofother variables such as past achievement andcourse-taking patterns are less well understood becausethey have not been available on large national datasets.In the following sections, gains in math proficiency areagain examined, but this time with information about8th grade math achievement and self-reported course-taking patterns.
Figure 1.- Percentage of students classified into specific mathematics proficiency levels:1988 and 1990
38.6 ~ ~ ~ ~ ~~ -----------------
27.0
23.3 -//// 24 .7 22.5 ---
During 8th Grade
M At Levy I 1
MAt Level 4
During 10th Giade
MAt Le- l 2
NOTE: Percentages may not add to 1 00 due to rounding.
SOURCE: U.S. Department of Education, National Center for Education Statistics, National Education Longitudinal Studyof 1988: Base Year and First Follow-Up Student Surveys.
2
50
40
30
20
10I
M Bele- L-ve I
M At Leve 3
D I
Controlling for Eighth Grade MathProficiency
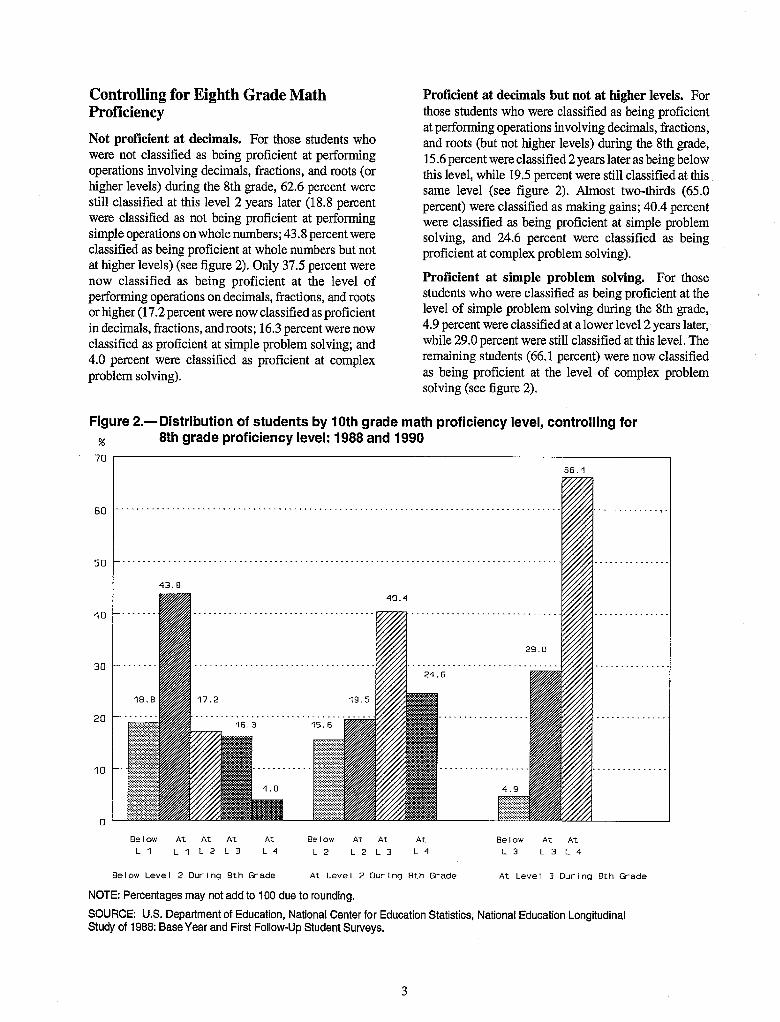
Not proficient at decimals. For those students whowere not classified as being proficient at performingoperations involving decimals, fractions, and roots (orhigher levels) during the 8th grade, 62.6 percent werestill classified at this level 2 years later (18.3 percentwere classified as not being proficient at performingsimple operations on whole numbers; 43.8 percent wereclassified as being proficient at whole numbers but notat higher levels) (see figure 2). Only 37.5 percent werenow classified as being proficient at the level ofperforming operations on decimals, fractions, and rootsor higher (17.2 percent were now classified as proficientin decimals, fractions, and roots; 16.3 percent were nowclassified as proficient at simple problem solving; and4.0 percent were classified as proficient at complexproblem solving).
Proficient at decimals but not at higher levels. Forthose students who were classified as being proficientat performing operations involving decimals, fractions,and roots (but not higher levels) during the 8th grade,15.6 percent were classified 2 years later as being belowthis level, while 19.5 percent were still classified at thissame level (see figure 2). Almost two-thirds (65.0percent) were classified as malcing gains; 40.4 percentwere classified as being proficient at simple problemsolving, and 24.6 percent were classified as beingproficient at complex problem solving).
Proficient at simple problem solving. For thosestudents who were classified as being proficient at thelevel of simple problem solving during the 8th grade,4.9 percent were classified at a lower level 2 years later,while 29.0 percent were still classified at this level. Theremaining students (66.1 percent) were now classifiedas being proficient at the level of complex problemsolving (see figure 2).
Figure 2.- Distribution of students by 10Oth grade math proficiency level, controlling for8 Eth grade proficiency level: 1988 and 1990
66.1
43.8
'10.1
29.0
24.6 v/rI,
16. 3 15. 6
BelIow At At At At BelIow At At AtLi1 Li1 L2 LB3 L I L 2 L 2 LB3 LI4
Below At AtLB3 LB3 LI
Below Level 2 During 8th Grade At Level 2 During 8th Grade At Level 3 During 8th Grade
NOTE: Percentages may not add to 1 00 due to rounding.SOURCE: U.S. Department of Education, National Center for Education Statistics, National Education LongitudinalStudy of 1988: Base Year and First Follow-Up Student Surveys.
3
70
60
5D
AD [
30 V
20
10
Controlling for Level of MathCourses Taken
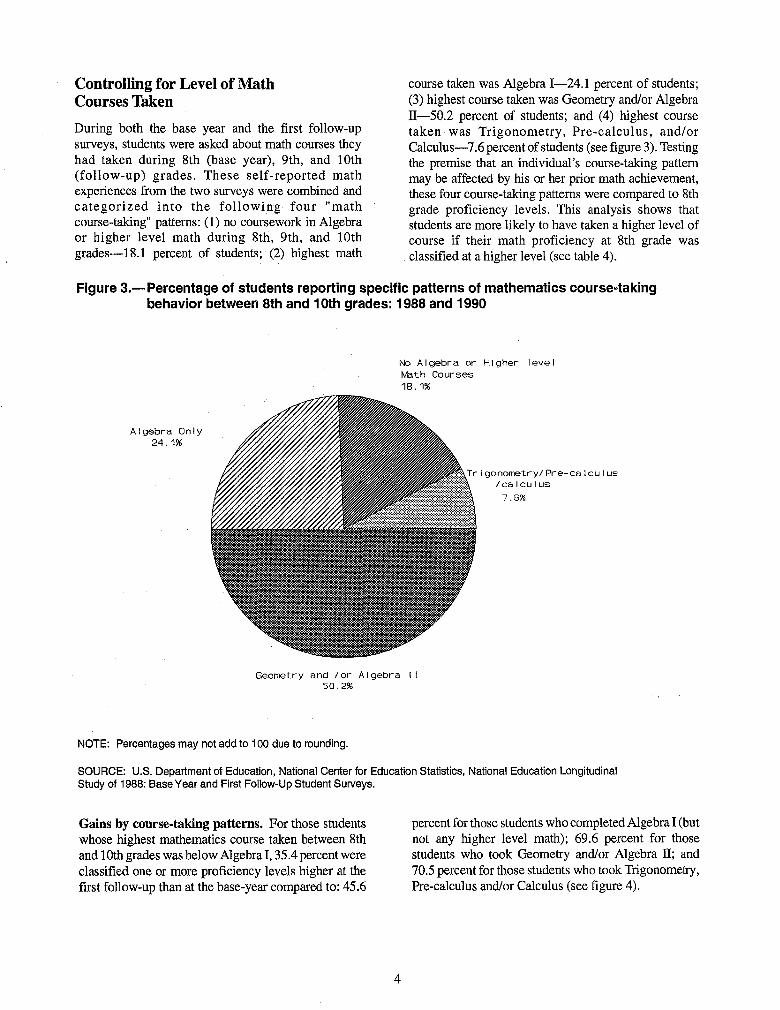
During both the base year and the first follow-upsurveys, students were asked about math courses theyhad taken during 8th (base year), 9th, and 10th(follow-up) grades. These self-reported mathexperiences from the two surveys were combined andcategorized into the following four "mathcourse-taking" patterns: (1) no coursework in Algebraor higher level math during 8th, 9th, and 10thgrades-i18.1 percent of students; (2) highest math
course taken was Algebra I-24.1 percent of students;(3) highest course taken was Geometry and/or Algebra11-50.2 percent of students; and (4) highest coursetaken was Trigonometry, Pre-calculus, and/orCalculus-7.6 percent of students (see figure 3). Testingthe premise that an individual's course-taking patternmay be affected by his or her prior math achievement,these four course-taking patterns were compared to 8thgrade proficiency levels. This analysis shows thatstudents are more likely to have taken a higher level ofcourse if their math proficiency at 8th grade wasclassified at a higher level (see table 4).
Figure 3.-Percentage of students reporting specific patterns of mathematics course-takingbehavior between 8th and 10Oth grades: 1988 and 1990
No Algebra or Higher levelMath Courses18.1%
Algebra Only241.1%
Ti gonometry! Pre-calculIus/calculIus
IN 7. 6%
Geometry and /or Algebra It
NOTE: Percentages may not add to 1 00 due to rounding.
SOURCE: U.S. Department of Education, National Center for Education Statistics, National Education LongitudinalStudy of 1988: Base Year and First Follow-Up Student Surveys.
Gains by course-taking patterns. For those studentswhose highest mathematics course taken between 8thand 10Oth grades was below Algebra I, 35.4 percent wereclassified one or more proficiency levels higher at thefirst follow-up than at the base-year compared to: 45.6
percent for those students who completed Algebra I (hutnot any higher level math); 69.6 percent for thosestudents who took Geometry and/or Algebra 111; and70.5 percent for those students who took Trigonometry,Pre-calculus and/or Calculus (see figure 4).
4

Figure 4.-Percentage of students who made progress in math proficiency between baseyear and first follow-up, by specific math course-taking pattern: 1988 and 1990
so0
EiO - - - - - - - - - - - - - - - - - - - - - -
'10I
70. 5
,15.56
35.4
20 h- -
Geometry and/orAlgebra 1I
Tr igonomnetry/pre-calIoulIusand/or calculus
SOURCE: U.S. Department of Education, National Center for Education Statistics, National Education LongitudinalStudy of 1988: Base Year and First Follow-Up Student Surveys.
Gains by Course-Taking Patterns andPrior Achievement
Proficiency level less than decimals. For thosestudents who were not classified as being proficient atthe level of decimals, fractions, and roots during the 8thgrade, 14.0 percent of those students not taking Al gebraI were now classified as being proficient at least at thelevel of decimals (1 1.2 percent at simple operations ondecimals, 2.5 percent at simple problem solving, and .3percent at complex problem solving) compared to: 34.1percent of those students who took Algebra I but nohigher (20.4 percent at simple operations on decimals,12.0 percent at simple problem solving, and 1.7 percentat complex problem solving); 62.0 percent of thosestudents who took Geometry and/or Algebra II1(20.0percent at simple operations on decimals, 32.9 percentat simple problem solving, and 9.1 percent at complexproblem solving); and 40.1 percent of those studentswho took Trigonometry/Pre-calculusfCalculus (13.1percent at simple operations on decimals, 18.3 percent
at simple problem Solving, and 8.2 percent at complexproblem solving) (see figure 5).
Proficient at decimals but not higher. For thosestudents who were classified as being proficient atperforming simple operations on decimals, fractions,and roots during 8th grade, 23.6 percent of thosestudents not taking Algebra I were now classified asbeing proficient at least at the level of simple problemsolving.(20.1 percent at simple problem solving and 3.5percent at complex problem solving) compared to: 40.5percent of those students who stopped at Algebra 1 (30.8percent at simple problem solving and 9.7 percent atcomplex problem solving); 76.2 percent of thosestudents taking Geometry and/or Algebra II1(45.1percent at simple problem solving and 31.1 percent atcomplex problem solving); and 72.6 percent of thosestudents who took Trigonometry, Pre-calculus, and/orCalculus (45.0 percent at simple problem solving and27.6 percent at complex problem solving) (see figure 6).
5
Lass thanAlgebra
AlIgebraOnlIy
0 1 1
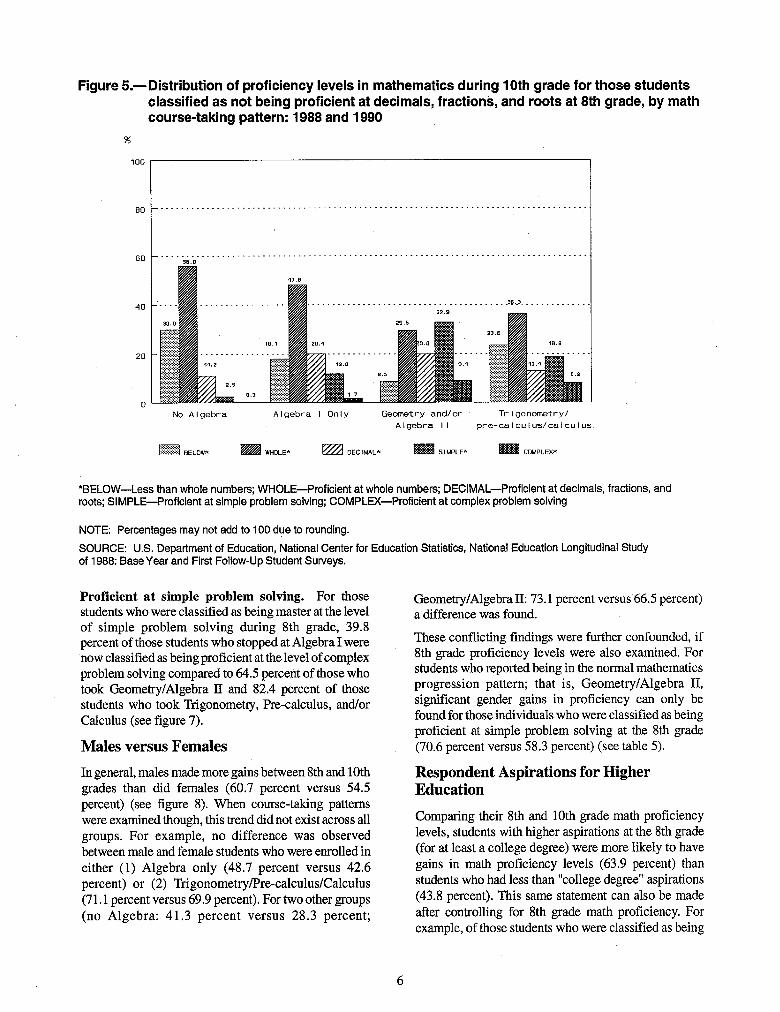
Figure 5.- Distribution of proficiency levels in mathematics during 10Oth grade for those studentsclassified as not being proficient at decimals, fractions, and roots at 8th grade, by mathcourse-taking pattern: 1988 and 1990
100
80 1. - - - - - - - - - - - - - - - - - - - - - - - - - - - - -- - - - - - - - - - - - - -
32.9 V/_ - ----_
i6.5
0.3
No Algebra Algebra I Only
M BELOW- = ~WHOLE2 DE
Geometry and/or Trigonometry/Algebra 11 pre-calculus/calculus.
EC IMAL* SIIA'LE" l COMPLEX'-
*BELOW-L.ess than whole numbers; WHOLE-Proficient at whole numbers; DECIMAL-Proficient at decimals, fractions, androots; SIMPLE-Proficient at simple problem solving; COMPLEX-Proficient at complex problem solving
NOTE: Percentages may not add to 1 00 due to rounding.SOURCE: U.S. Department of Education, National Center for Education Statistics, National Education Longitudinal Studyof 1988: Base Year and First Follow-Up Student Surveys.
Proficient at simple problem solving. For thosestudents who were classified as being master at the levelof simple problem solving during 8th grade, 39.8percent of those students who stopped at Algebra I werenow classified as being proficient at the level of complexproblem solving compared to 64.5 percent of those whotook Geometry/Algebra II and 82.4 percent of thosestudents who took Trigonometry, Pre-calculus, and/orCalculus (see figure 7).
Males versus Females
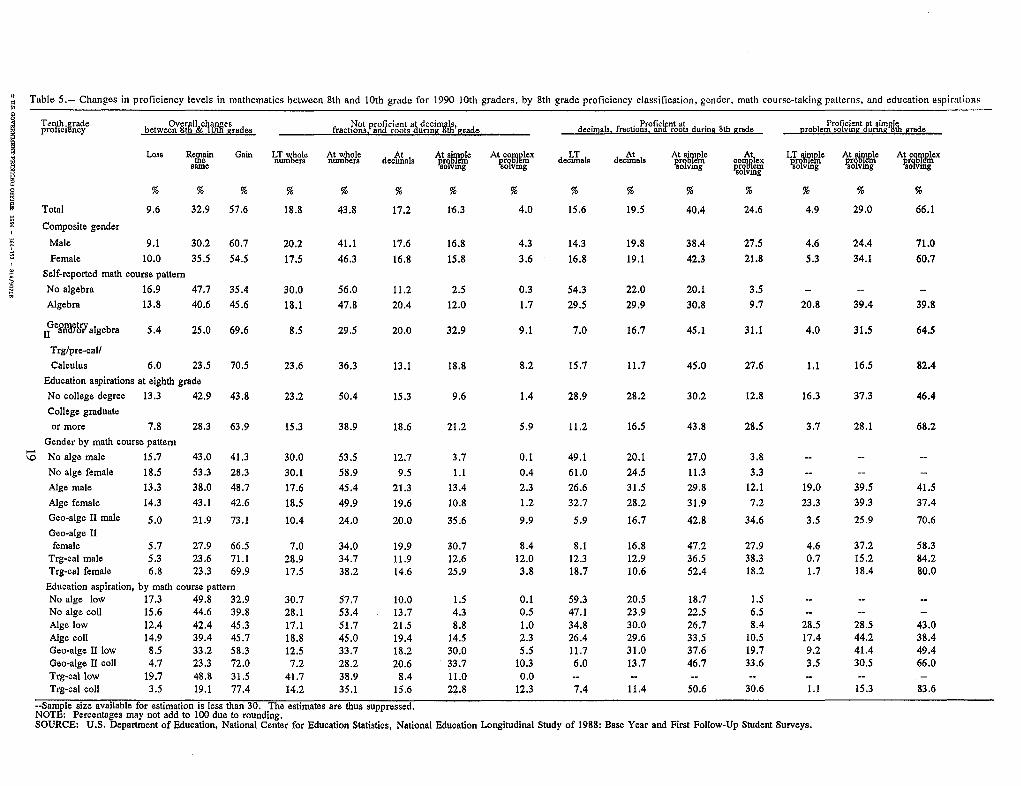
In general, males made more gains between 8th and 10thgrades than did females (60.7 percent versus 54.5percent) (see figure 8). When course-taking pattemnswere examined though, this trend did not exist across allgroups. For example, no difference was observedbetween male and female students who were enrolled ineither (1) Algebra only (48.7 percent versus 42.6percent) or (2) Trigonometry/Pre-calculus/Calculus(7 1.1 percent versus 69.9 percent). For two other groups(no Algebra: 41.3 percent versus 28.3 percent;
Geometry/Algebra 11: 73. 1 percent versus 66.5 percent)a difference was found.
These conflicting findings were further confounded, if8th grade proficiency levels were also examined. Forstudents who reported being in the normal mathematicsprogression pattern; that is, Geometry/Algebra II,significant gender gains in proficiency can only befound for those individuals who were classified as beingproficient at simple problem solving at the 8th grade(70.6 percent versus 58.3 percent) (see table 5).
Respondent Aspirations for HigherEducation
Comparing their 8th and 10th grade math proficiencylevels, students with higher aspirations at the 8th grade(for at least a college degree) were more likely to havegains in math proficiency levels (63.9 percent) thanstudents who had less than "college degree" aspirations(43.8 percent). Thbis same statement can also be madeafter controlling for 8th grade math proficiency. Forexample, of those students who were classified as being
6
so
20
0
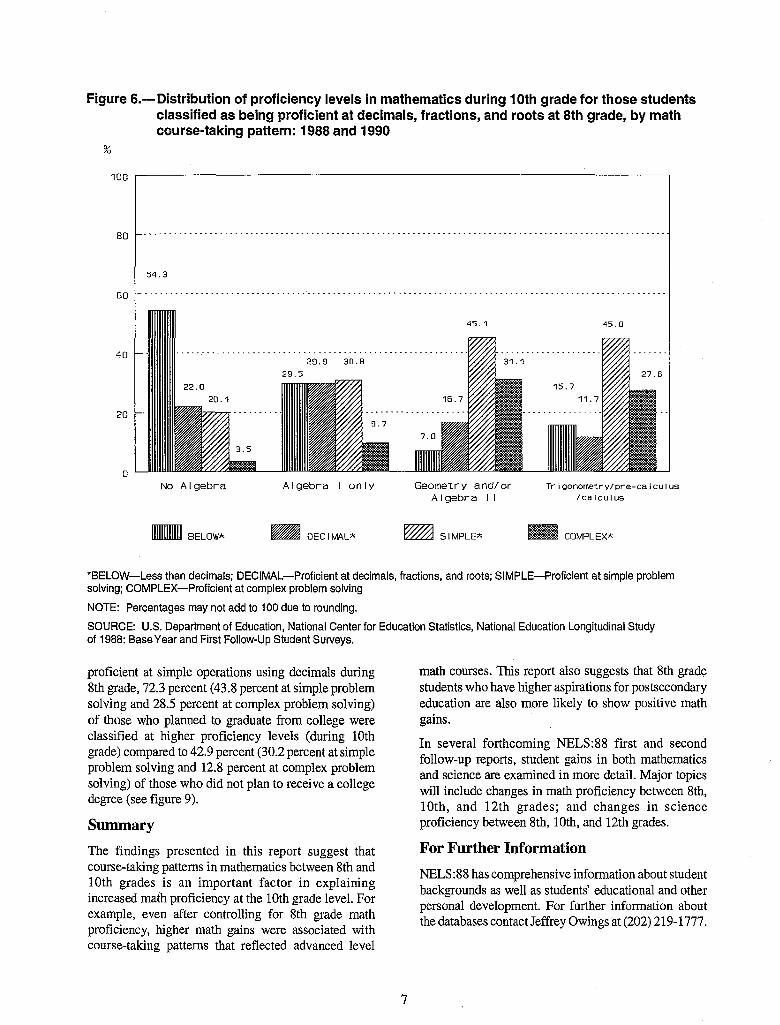
Figure 6.- Distribution of proficiency levels in mathematics during 10Oth grade for those studentsclassified as being proficient at decimals, fractions, and roots at 8th grade, by mathcourse-taking pattern: 1988 and 1990
look
29.9 30.B29.5
Algebra I only Geometry and/or Tr-igonometry/pre-calcuIlusAlIgebra I I /calculus
-m BELOWA = DEC IMALA MSIMPLE* COMPLEXA
*BELOW-Less than decimals; DECIMAL-Proficient at decimals, fractions, and roots; SIMPLE-Proficient at simple problemsolving; COMPLEX-Proficient at complex problem solvingNOTE: Percentages may not add to 1 00 due to rounding.SOURCE: U.S. Department of Education, National Center for Education Statistics, National Education Longitudinal Studyof 1988: Base Year and First Follow-Up Student Surveys.
proficient at simple operations using decimals during8th grade, 72.3 percent (43.8 percent at simple problemsolving and 28.5 percent at complex problem solving)of those who planned to graduate from college wereclassified at higher proficiency levels (during 10thgrade) compared to 42.9 percent (30.2 percent at simpleproblem solving and 12.8 percent at complex problemsolving) of those who did not plan to receive a collegedegree (see figure 9).
Summary
The findings presented in this report suggest thatcourse-taking patterns in mathematics between 8th and10th grades is an important factor in explainingincreased math proficiency at the 10th grade level. Forexample, even after controlling for 8th grade mathproficiency, higher math gains were associated withcourse-taking patterns that reflected advanced level
math courses. This report also suggests that 8th gradestudents who have higher aspirations for postsecondaryeducation are also more likely to show positive mathgains.
In several forthcoming NELS:88 first and secondfollow-up reports, student gains in both mathematicsand science are examined in more detail. Major topicswill include changes in math proficiency between 8th,10th, and 12th grades; and changes in scienceproficiency between 8th, 10th, and 12th grades.
For Further Information
NELS :88 has comprehensive information about studentbackgrounds as well as students' educational and otherpersonal development. For further information aboutthe databases contact Jeffrey Owings at (202) 219-1777.
7
54. 3
'In
45.1
20 V-
45. 0
0No Algebra
60 � --------------------------------------------------- I---------------------------------------------------I
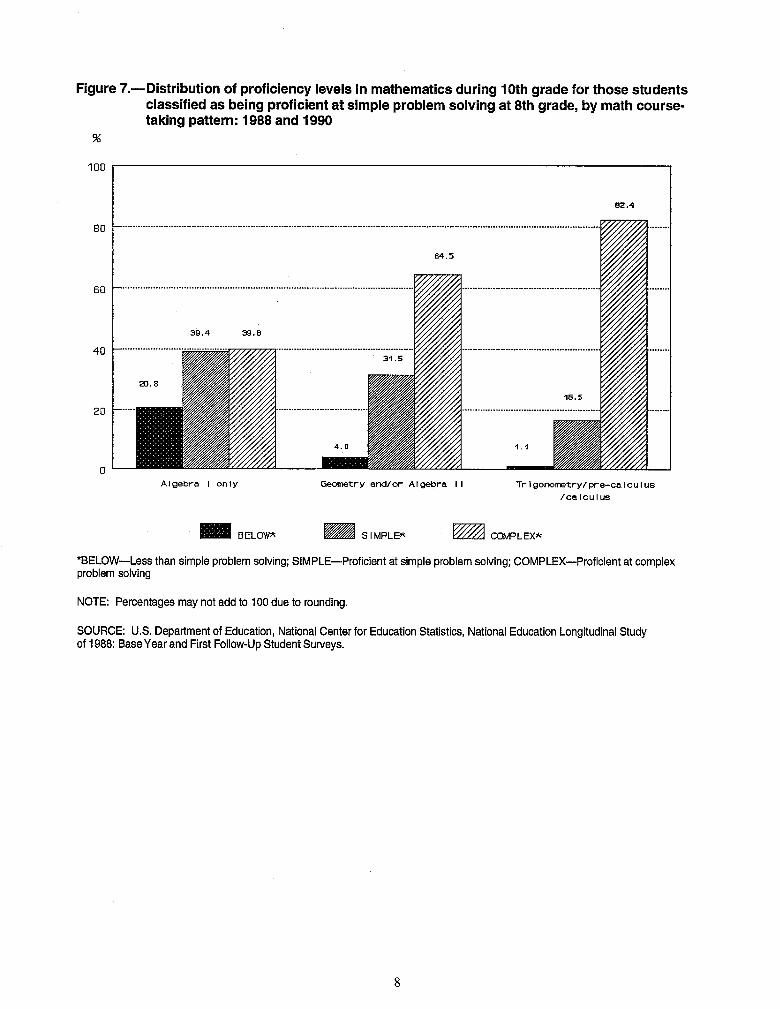
Figure 7.- Distribution of proficiency levels in mathematics during 10th grade for those studentsclassified as being proficient at simple problem solving at 8th grade, by math course-taking pattern: 1988 and 1990
100
82.4
39,4 39. B
Algebra I only
BELOW*~
Geometry and/or Algebra 11
MSI MPLE*
ITr 1gonormetry/pre-calculIus/ce ICu Ius
MCOtVPLEXk*BELOW-Less than simple problem solving; SIMPLE-Proficient at simple problem solving; COMPLEX-Proficient at complexproblem solving
NOTE: Peroentages may not add to 1 00 due to rounding.
SOURCE: U.S. Department of Education, National Center for Education Statistics, National Education Longitudinal Studyof 1988: Base Year and First Follow-Up Student Surveys.
8
60
60
40
20
0
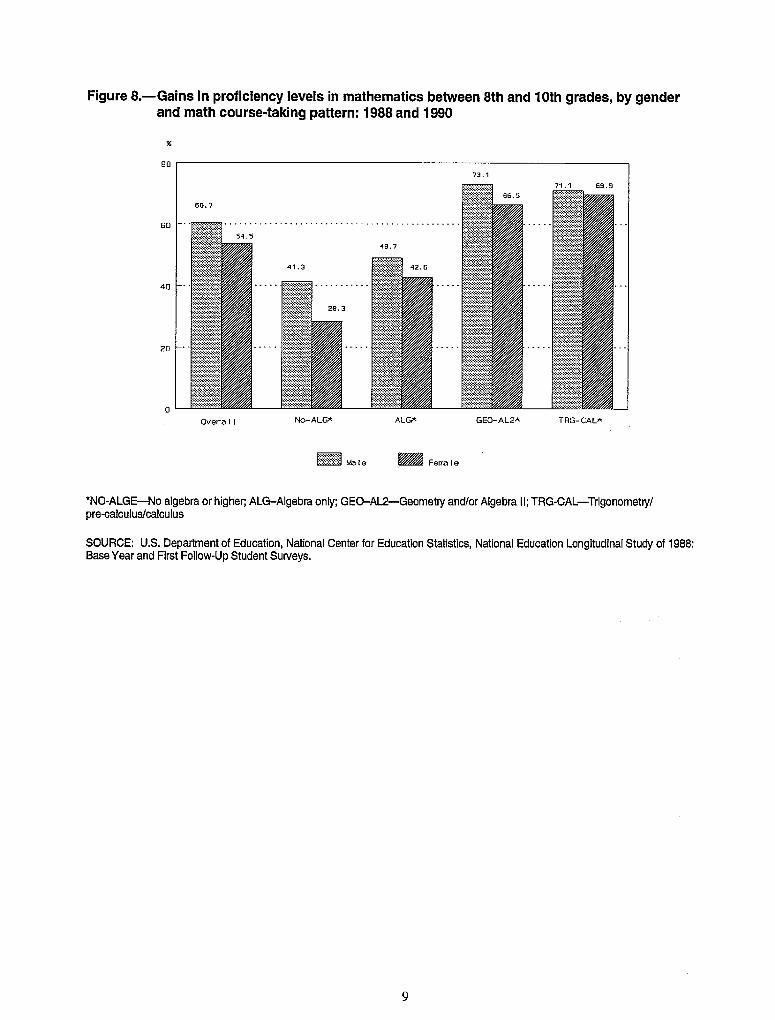
Figure 8.-Gains in proficiency levels In mathematics between 8th and 10th grades, by genderand math course-taking pattern: 1988 and 1990
s0
60 1--
73. 1
60.7
54.5W1111A ~~~~~~48. 7
40 V-
28.3
20 V-
Overall No-ALGA ALG* GEO-AL2"A TAG-CAL*
MalIe M Female
*NO..ALGE4,Jo algebra or higher; ALG-Algebra only; GEO-AL2-Geometry and/or Algebra 11; TRG-CAL-Trigonometrylpre-calculus/oalculus
SOURCE: U.S. Department of Education, National Center for Education Statistics, National Education Longitudinal Study of 1988:Base Year and First Follow-Up Student Surveys.
9
01
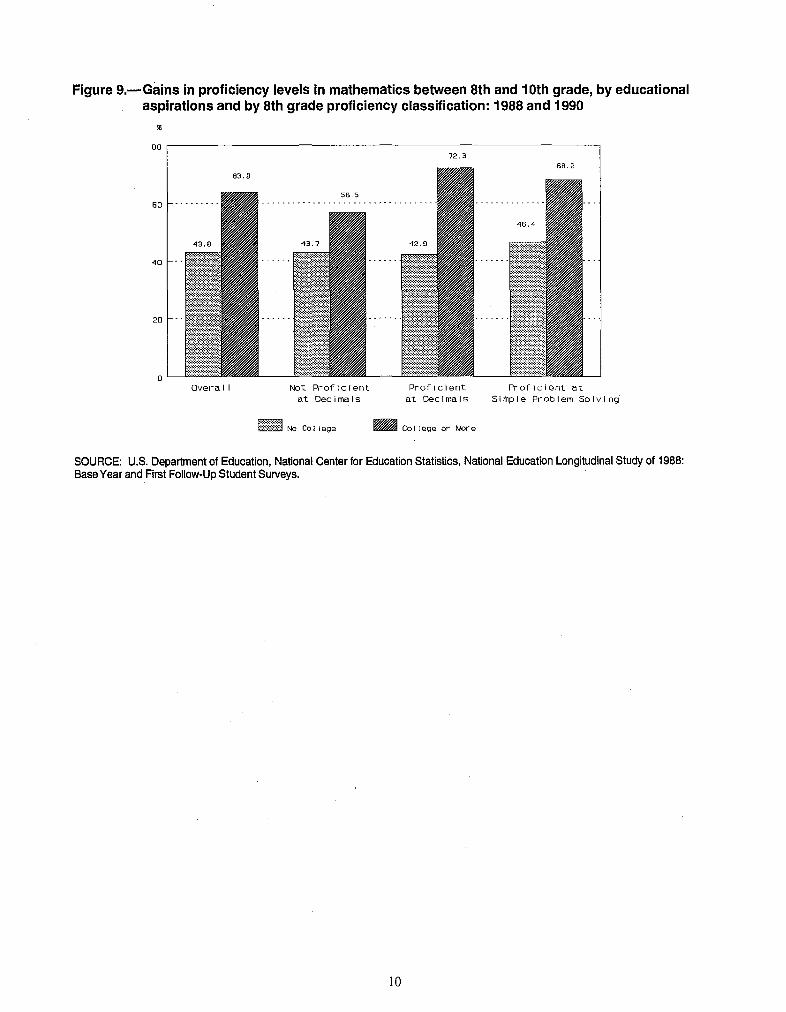
Figure 9.- Gains in proficiency levels in mathematics between 8th and 10Oth grade, by educationalaspirations and by 8th grade proficiency classification: 1988 and 1990
Bo0
60
40
20
72. 368. 2
62.8
56.5
Not Proficientat Decimals
M NoCollege
Proficient Proficient atat Decimals Simple Problem Solving
M College or More
SOURCE: U.S. Department of Education, National Center for Education Statistics, National Education Longitudinal Study of 1988:Base Year and First Follow-Up Student Surveys.
10
01Overall
References
Ingels, S5,1, L.A. Scott, J.T. Lindmark, M.R. Frankel,and S.L. Myers (1 992). NELS:&38 First Follow- UpStudent Component Data File User's Manual.Washington, DC: U.S. Department of Education,Office of Educational Research and Improvement.
Rock, Donald A. and Judith M. Pollack (1991).Psychometric Report for the NELS:88 Base YearTest Battery. Washington, DC: U.S. Department ofEducation, Office of Educational Research andImprovement.
Endnotes
'During the base year of NELS:88, 8th grade schoolsand students were sampled across the nation. Twvo yearslater (1990), these same students were resurveyed as partof the first follow-up. A majority (96.5 percent) of thesestudents who were still in school were then 10th graders.For purposes of this report, this transition period will bereferred to as 8th to 10th grade.
2During both the base year and first follow-up ofNELS:88, students were asked to report on the coursestaken in mathematics. The reliability of theseself-reports have been shown to be as high as .85 forgeometry and in the .60s for second-year algebra (.68),calculus (.67), and trigonometry (.63) in pastlongitudinal studies (e.g., H'igh School and Beyond)when self-reported courses are compared to high schooltranscripts. NELS:88 collected high school transcriptsas part of the second follow-up.
3 For this analysis, mathematics test performance at the8th and 10th grades was categorized into the followingproficiency levels: (1) not proficient at performingoperations involving decimals, fractions, and roots; (2)proficient at performing operations involving decimals,fractions, and roots but not higher levels; and (3)proficient at solving simple problemsolving tasks thatrequire conceptual understanding. At the 10th gradelevel, an additional category was added: proficient atperforming tasks at lower levels and also able tosuccessfully solve more complex problems.
4 See the appendix for a description of progression inmathematics (changes in proficiency levels) andreliability of proficiency levels.
5 Descriptions of the sampling design unit, itemnonresponse, and the variables included in this reportare included in the appendix.
6Responses for the in-scope sample whose mathproficiency levels were not available for either the baseyear or the first follow-up were treated as missing. A
descriptive comparison between "valid" and "missing"students reveals that the group with valid responses wasslightly more likely than the group with missingresponses to: (1) be classified at a higher proficiencylevel in 8th grade; (2) be classified at a higherproficiency level in 10th grade; (3) have taken higherlevels of math courses; and (4) have aspired to higherlevels of postsecondary education (see table 1).Because the missing students are less likely to beproficient at higher levels than the valid students in 8thgrade, this indicates that the distribution of the 8th grademath proficiency levels reported in this analysis isbiased upward. Similarly, the distribution of 10Oth grademathematics proficiency reported here is also biasedupward. Since 8th grade math proficiency, levels ofmathematics courses taken, and postsecondaryeducation aspirations have been observed in thisanalysis to be correlated positively to the individual'sgain in math, the above findings between valid andmissing groups suggest that the missing group wouldhave made smaller gains than the valid group. Thus, theestimates stated in this report may be biased upward.Additional information about this study is presented inthe appendix. A detailed discussion of the NELS:88math proficiency levels can be found in the reportentitled "Psychometric Report for the NELS:88 BaseYear Battery.
7 This group includes those students who were classifiedas either (1) not being proficient at performing simpleoperations on whole numbers (16.0 percent) or (2) beingproficient at performing simple operations on wholenumbers (38.6 percent).
8 About 11.1 percent of students were classified as notbeing proficient at performing simple operations onwhole numbers; 27.0 percent were classified as beingproficient at performning simple operations on wholenumbers.
Appendix: Technical Notes for NELS:88
The NELS:88 baseline comprised a national probabilitysample of all regular public and private 8th gradeschools in the 50 states and the District of Columbia inthe 1987-88 school year. During the base year datacollection, students, parents, teachers, and schooladministrators were selected to participate in the survey.The total 8th grade enrollment from 1,052 NELS:88sample schools was 202,996. During the listingprocedures (before 24-26 students were selected perschool), 5.35 percent of students were excluded becausethey were identified by school staff as being incapableof completing the NELS:88 instruments because oflimitations in their language proficiency or because ofmental or physical disabilities. Ultimately, 93 percent,
11
or 24,599, of the sample students participated in the baseyear survey in the spring of 1988.
The NELS:88 first follow-up survey was conductedduring the spring of 1990. Students, dropouts, teachers,and school administrators participated in the follow-up,with a successful data collection effort for 17,424individuals in the student survey. (Approximately 93percent' of the subsampled base year studentrespondents completed the survey instrument.) Inaddition, because the characteristics and educationoutcomes of the students excluded from the base yearsurvey may differ from those students who participatedin the base-year data collection, a special study wasinitiated to identify the enrollment of a representativesample of the base year ineligible (BYI) students. Forthe current report, data from base year ineligibles werenot used because measures that reflect math proficiencyfor two points in time (base year and first follow-up), anecessary requirement for detennining the progressionof math skills of students, are not available for thesestudents.
The scope of the cohort data presented in this report islimited to students who were sampled and attendingschools both during the base year and first follow-upsurveys. Excluded from this study are sampled 8thgraders who dropped out of school at the 9th or 10thgrades (765 cases). Also excluded from this analysis areBYI students and freshened (10th grade students in1990 who did not have the opportunity to participate in1988 for various reasons including not being in country)students who were not selected in the base year sample.Altogether, the in-scope sample consists of 16,659cases. Among them, 4,111 students did not completesufficient numbers of test items so that their mathproficiency could be determined in the base year and/orthe first follow-up. Due to the absence of mathproficiencies at two points in time, their responses (i.e.,change in math proficiency) are treated as missing. Inaddition, the responses of 16 students are also treated asmissing because their self-reported math coursework isregarded as questionable. Thus, 12,532 cases are usedfor this analysis, and 4,127 were treated as missing.Among the cases classified as missing, 2,382 weremissing first follow-up math proficiency scores, 1,402were missing base year math proficiency scores, and343 were missing both base year and first follow-upmath proficiency scores.
No weighting adjustment for valid or missing responseswas attempted for this analysis. Instead, descriptivesummaries were produced for key variables (see table
1). This table indicates that there are differencesbetween the two groups. For example, 22.1 percent(weighted) of students who were labeled as "valid" wereclassified as being at the level of simple problemsolving during 8th grade compared to 11.3 percent ofstudents who were labeled as "missing." Similarly, thevalid group is slightly more likely to have (1) takenhigher level math courses and (2) aspired to higherpostsecondary education levels than the missing group.Because of these differences, the estimates obtained forthe 8th/lOth grade panel may be biased slightly upward(see table 1). The weighted percent of the 8th/lOth gradepanel who were classified as being at the simpleproblem solving level during 8th grade is 20.2 percentif calculated from the entire sample (valid plus missing)compared to 22.1 percent if calculated from the validresponses only. Since 8th grade proficiency, levels ofmath courses taken, and postsecondary educationaspiration have been observed to be correlatedpositively to gains in math, the upward bias of thesedistributions (e.g., 8th grade proficiency) will likelycause upward bias for estimates of gains.
Sampling Errors
The data were weighted using the first follow-up panelweight (FlPNLWT) to reflect the sampling rates(probability of selection) and adjustments for unitnonresponse. The complex sample design was takeninto account when a Taylor series approximationprocedure was used to compute the standard errors inthis report. The standard error is a measure of thevariability of a sample estimate due to sampling. Itindicates, for a given sample size, how much valiancethere is in the population of possible estimates of aparameter. If all possible samples were selected undersimilar conditions, intervals of 1.96 standard errorsbelow to 1.96 standard errors above a particular statisticwould include the true population parameter beingestimated for about 95 percent of these samples (i.e., 95percent confidence interval). Comparisons noted in thisreport are significant at the 0.05 level and weredetermined using Bonferroni adjusted t-tests,
Standard errors for all of the estimates are presented intables 3 and 6. These standard errors can be used toproduce confidence intervals. For example, anestimated 57.6 percent of 8th grade students wereclassified at higher mathematics proficiency levels inthe 10th grade than at the 8th grade (see table 2). Thisfigure has an estimated standard error of 0.78 percent.Therefore, the estimated 95 percent confidence interval
12

for this statistic is approximately 56.0 percent to 59.2percent.
Variables Used in Analysis
Math proficiency (BYTXMPRO in base year andF1TXMIPRO in first follow-up). Four proficiencylevels in math achievement form ahierarchial scale witheach succeeding level characterized by increasedcomplexity. A proficiency at higher levels impliesproficiency at the lower level. The four levels aredefined as follows:
Level 1-Students are able to successfully carry outsimple arithmetic operations on wholenumbers.
Level 2- Students are proficient at performing alllevel 1 tasks as well as simple operationswith decimals, fractions, and roots.
Level 3- Students are proficient at performing thetwo lower proficiency levels and are ableto successfully solve simple problemsolving tasks that require conceptual under-standing and/or the development of asolution strategy.
Level 4- Students are proficient at performing alltasks of the lower three levels and are able tosuccessfully solve more complex problems.
Each proficiency level is marked by a block of fouritems that are relatively internally consi stent withrespect to the cognitive processes required. Forexample, level 1 "marker' items all deal with simplearithmetic operations on whole numbers.
Item # 1-Compare two quantities of moneyexpressed differently.
Item # 2-Compare two simple arithmeticexpressions involving division of integers.
Item # 3-Compare two simple arithmeticexpressions involving multiplication ofintegers.
Item # 4-Set up a simple equation involving additionor subtraction of integers that is the solutionto a word problem.
In addition to requiring the same cognitive operations,the items within a particular marker bldck exhibitsimilar item difficulty parameters. Since the underlyingcognitive demand model is assumed to be hierarchical,students who are proficient on the level 3 block ofmarker items should also demonstrate proficiency onthe level 2 and level 1 items. While four items may seemlike a relatively small number of items, it should be
remembered that all four are essentially parallelmeasures of the same content or processing skill. Thefour items are not a subscale that attempts todiscriminate individuals along a continuous dimensionbut are simply used to make a "go/no go" decision at acertain point referencing a specific skill. A fulldescription of the psychometric properties of theNELS:88 base year test battery is presented by Rock &Pollack (1991).
During the base year, four categories were used toclassify students' math proficiency: below Level 1, atLevel 1, at Level 2, and at Level 3. During the firstfollow-up, five categories were used to classify students:below Level 1, at Level 1, at Level 2, at Level 3, and atLevel 4.
Reliability of proficiency levels: The classicalreliability (coefficient alpha) estimates for each of thefour levels and more appropriately the classicalreliability estimate for 16 items involved in the criterionreferencing are:
Level 1 = .44Level 2 =.64Level 3 = .60Level 4 =.40
Sixteen items defining the hierarchical model = .80.
The coefficients for the separate levels are based on the"middle" ability sample, which would be relativelyappropriate for levels 2 and 3. The estimates for levels1 and 4 are somewhat underestimated since they aremost appropriate for students in the lower 25 percent(level 1) and the upper 25 percent (level 4), respectively.Information on the reliability of the lowest and highestlevels is more appropriately estimated from the ItemResponse Theory scaled information function since thistakes into consideration what ability level thediscrimination is designed for. For this report, decisionsabout proficiency levels are based on all 16 items sincethe pass-fail criterion referenced levels (0, 1 scores) areonly given for those who fit the full hierarchical model.A lower bound estimate of the traditional reliabilitycoefficient would be the .80 given above. This is a lowerbound estimate since it reflects the ability to consistentlyrank order individuals, rather than simply make adecision about whether a person is above or below somecutoff based on all 16 items. In addition, this reportincludes only analyses of group data which do notrequire the same accuracy as that required by proceduresthat rank order individuals. More precisely, the Guttmancoefficient of reproducibility of the hierarchical scalebased on the four 4-item parcel is 1.0. Another way oflooking at it is that to be at the highest level a studentnot only had to get at least 3 out of 4 correct on the
13
highest level parcel but also had to maintain at least thatlevel of performance on all the subordinate levels also.
Math coursework. During the base year, studentswere asked whether they had taken Algebra at 8th grade(BYS67C). During the first follow-up these samestudents were asked if they had taken or were taking thefollowing math courses (F1S22A to F1S22J) since 8thgrade:
* General Math
* Pre-algebra
* Algebra I
* Geometry
* Algebra II
* Trigonometry
• Pre-calculus
* Calculus
* Consumer/Business Math
• Other math
Based on students' responses to their math coursework,they were grouped into four categories according to thehighest math course they had taken:
* Students who never took Algebra or math courseshigher than Algebra.
* Students for whom the highest math course they hadtaken was Algebra I (between 8th and 10th grades).
• Students for whom the highest math course takenwas Geometry and/or Algebra HI.
* Students for whom the highest math course takenwas Trigonometry, Pre-calculus, and/or Calculus.
Sex of the student (FISEX): 1 = male; 2 = female
Respondent aspirations (BY-PSEPLN). Responses forthis variable (ranged from "won't finish high school" to"will attend a higher level of school after graduatingfrom college") were recategorized into a two-levelaspiration variable: (1) less-than-4-year college degreeaspirations (codes 1 to 4) and (2) at least 4-year degreeaspirations (codes 5 and 6).
14
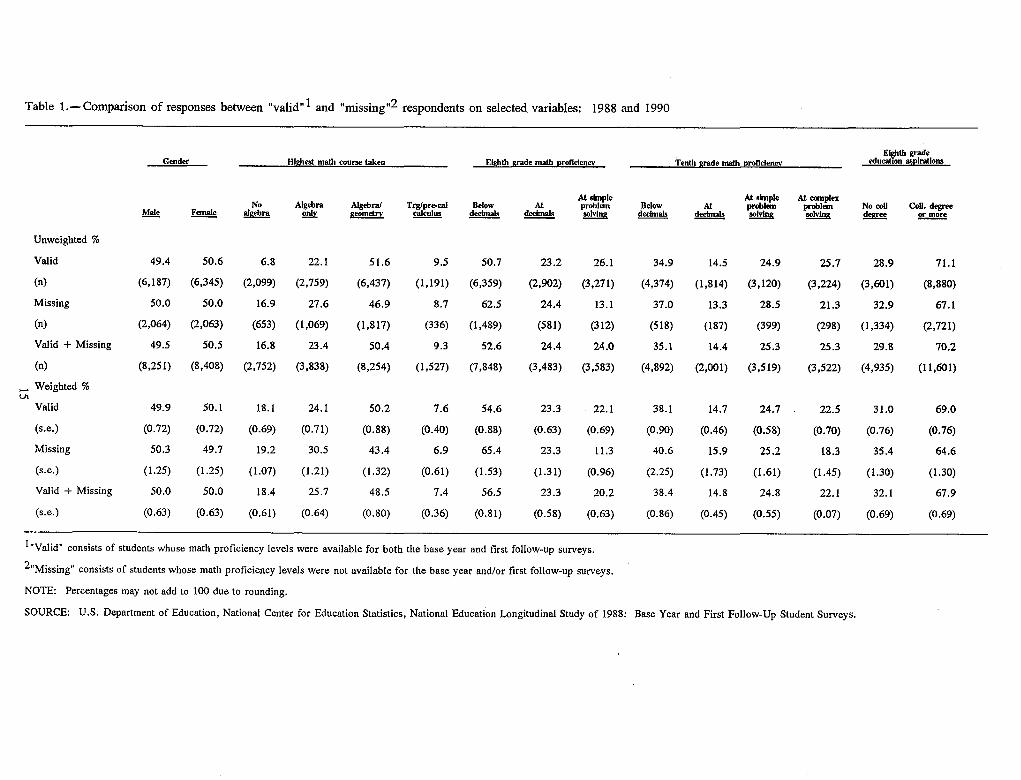
Table 1.- Comparison of responses between "valid"' and "missing",2 respondents on selected. variables: 1988 and 1990
Highest math course takenEl th rae
Eighth grade mallh Proficiency
NoMale Female algebra
Algebra Algebra/ Trglpre-cal Belowor&t geometry calculus decimals
At simpleAt problem
deelmals 8olvingt
At simple At complexBelow At problem problem No coll Coll. degree
decimals dechnals -MM WM 99M ormore
Ureweighted %
Valid
(n)
Missing
(n)
Valid + Missing
(n)
- Weighted %LA
Valid
(S.e.)
Missing
(S.C.)
Valid + Missing
(S.C.)
49.4 50.6 6.8 22.1
(6,187) (6,345) (2,099) (2,759)
50.0 50.0 16.9 27.6
(2,064) (2,063) (653) (1,069)
49.5 50.5 16.8 23.4
(8,251) (8,408) (2.752) (3,838)
49.9 50.1 18.1 24.1
(0.72) (0.72) (0.69) (0.71)
50.3 49.7 19.2 30.5
(1.25) (1.25) (1.07) (1.21)
50.0 50.0 18.4 25.7
(0.63) (0.63) (0.61) (0.64)
51.6
(6,437)
46.9
(1,817)
50.4
(8,254)
50.2
(0.88)
43.4
(1.32)
48.5
(0.80)
9.5 50.7
(1,191) (6,359)
8.7 62.5
(336) (1,489)
9.3 52.6
(1,527) (7,848)
7.6 54.6
(0.40) (0.88)
6.9 65.4
(0.61) (1.53)
7.4 56.5
(0.36) (0.81)
23.2 26.1
(2,902) (3,271)
24.4 13.1
(581) (312)
24.4 24.0
(3,483) (3,583)
23.3 22.1
(0.63) (0.69)
23.3 11.3
(1.31) (0.96)
23.3 20.2
(0.58) (0.63)
34.9 14.5 24.9
(4,374) (1,814) (3,120)
37.0 13.3 28.5
(518) (187) (399)
35.1 14.4 25.3
(4,892) (2,001) (3,519)
38.1 14.7 24.7
(0.90) (0.46) (0.58)
40.6 15.9 25.2
(2.25) (1.73) (1.61)
38.4 14.8 24.8
(0.86) (0.45) (0.55)
25.7 28.9
(3,224) (3,601)
21.3 32.9
(298) (1,334)
25.3 29.8
(3,522) (4,935)
22.5 31.0
(0.70) (0.76)
18.3 35.4
(1.45) (1.30)
22.1 32.1
(0.07) (0.69)
"'Valid" consists of students whose math proficiency levels were available for both the hase year and first follow-up surveys.
2 "Missing" consists of students whose math proficiency levels were not available for the base year and/or first follow-up surveys.I
NOTE: Percentages may not add to 100 due to rounding.
SOURCE: U.S. Department of Education, National Center for Education Statistics, National Education Longitudinal Study of 1988: Base Year and First Follow-Up Student Surveys.
Gender
71.1
(8,880)
67.1
(2.72 1)
70.2
(11,601)
69.0
(0.76)
64.6
(1.30)
67.9
(0.69)
Tenth grade math proficiency
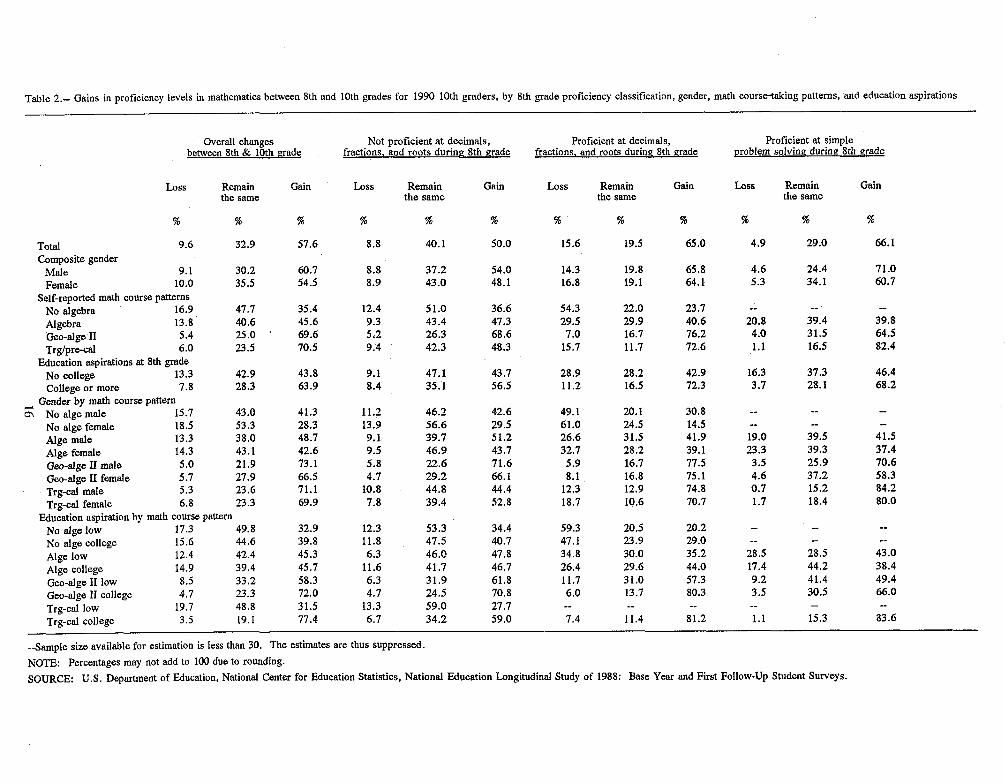
Table 2.-- Gains in proficiency levels in mathematics between 8th and 10th grades for 1990 10th graders, by 8th grade proficiency classification, gender, math course-taking patterns, and education aspirations
.Overall changesbetween 8th & 10th grade
Not proficient at decimals,fractions, and roots during 8th grade
Proficient at decimals,fractions, and roots during 8th grade
Proficient at simpleproblem solving during 8th grade
Loss Remainthe same
Gain Loss Remainthe same
Gain Loss Remainthe same
Gain Loss Remainthe same
Total 9.6Composite gender
Male 9.1Female 10.0
Self-reported math course patternsNo algebra 16.9Algebra 13.8Geo-alge, II 5.4Trgfpre-cal 6.0
Education aspirations at 8th gradeNo college 13.3College or more 7.8
Gender by math course, patternc7\ No alge male 15.7
No alge female 18.5Alge male 13.3Alge female 14.3Geo-alge II male 5.0Geo-alge II female 5.7Trg-cal male 5.3Trg-cal female 6.8
Education aspiration by math course patternNo alge lowNo alge collegeAlge lowAlge collegeGeo-alge II lowGeo-alge 1I collegeTrg-cal lowTrg-cal college
32.9
30.235.5
47.740.625.023.5
42.928.3
43.053.338.043.121.927.923.623.3
17.3 49.815.6 44.612.4 42.414.9 39.48.5 33.24.7 23.3
19.7 48.83.5 19.1
57.6
60.754.5
35.445.669.670.5
43.863.9
41.328.348.742.673.166.571.169.9
32.939.845.345.758.372.031.577.4
8.8 40.1 50.0
8.8 37.28.9 43.0
12.49.35.29.4
5 1.043.426.342.3
9.1 47.18.4 35.1
11.213.99.19.55.84.7
10.87.8
12.311.86.3
11.66.34.7
13.36.7
46.256.639.746.922.629.244.839.4
53.347.546.041.731.924.559.034.2
54. 048.1
36.647.368.648.3
43.756.5
42.629.551.243.771.666.144.452.8
34.440.747.846.761.870.827.759.0
15.6 19.5
14.3 19.816.8 19.1
54.329.5
7.015.7
28.911.2
49.161.026.632.75.98.1
12.318.7
59.347.134.826.411.76.0
7.4
22.029.916.711.7
28.216.5
20.124.531.528.216.716.812.910.6
20.523.930.029.631.013.7
11.4
65.0
65.864.1
23.740.676.272.6
42.972.3
30.814.541.939.177.575.174.870.7
20.229.035.244.057.380.3
81.2
4.9 29.0
4.6 24.45.3 34.1
20.84.01.1
16.33.7
19.023.33.54.60.71.7
28.517.49.23.5
1.1
39.431.516.5
37.328.1
39.539.325.937.215.218.4
28.544.241.430.5
15.3
Gain
66.1
71.060.7
39.864.582.4
46.468.2
41.537.470.658.384.280.0
43.038.449.466.0
83.6
--Sample size available for estimation is less than 30. The estimates are thus suppressed.
NOTE: Percentages may not add to 100 due to rounding.
SOURCE: U.S. Department of Education, National Center for Education Statistics, National Education Longitudinal Study of 1988: Base Year and First Follow-Up Student Surveys.
� I
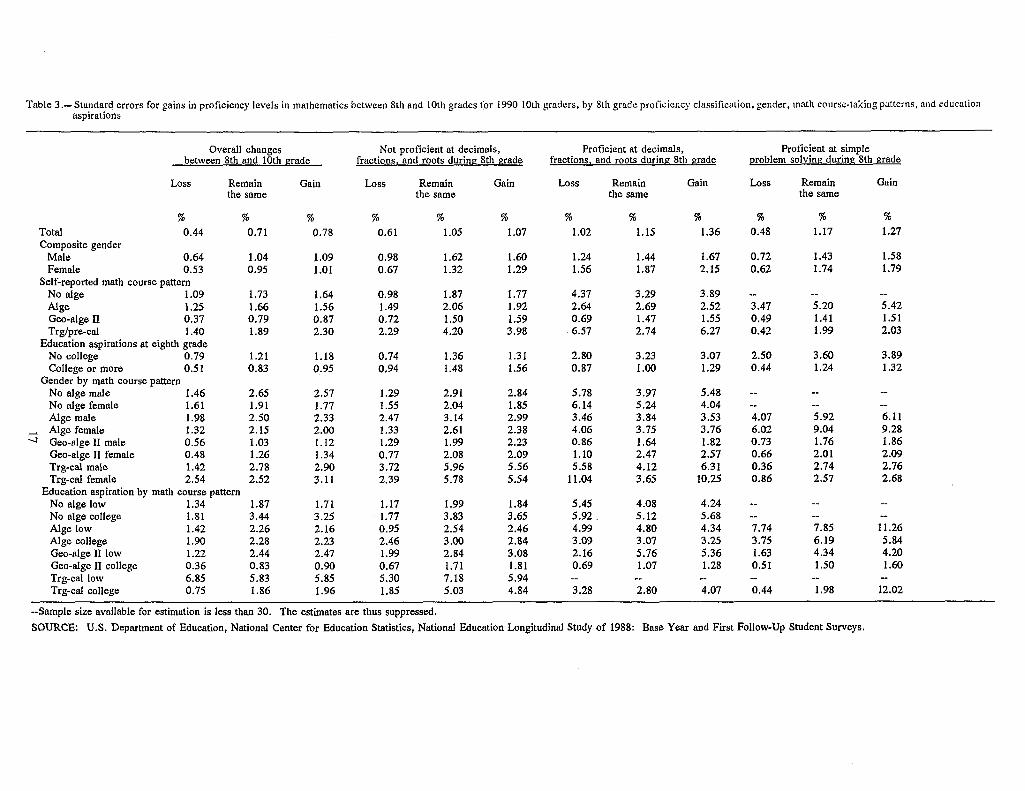
Table 3.- Standard errors for gains in proficiency levels in mathematics between 8th and 10th grades for 1990 I10th graders, by 8th grade pro fiCiency clasSificationi, gender, inath course-takingpattcrns, and educationaspirations
Overall changesbetween 8th and 10th grade
Not proficient at decimals,fractions, and roots during 8th gerade
Proficient at decimals,fractions, and roots during 8th grade
Proficient at simpleproblem solving during 8th grade
Loss Remainthe same
Gain Losas Remainthe same
Gain Loss Remainthe same
Gain Loss Remainthe same
Total 0.44 0.71Composite gender
Male 0.64 1.04Female 0.53 0.95
Self-reported math course patternNo alge 1.09 1.73Alge 1.25 1.66Geo-alge 11 0.37 0.79Trg/pre-cal 1.40 1.89
Education aspirations at eighth gradeNo college 0.79 1.21College or more 0.51 0.83
Gender by math course patternNo alge male 1.46 2.65No alge female 1.61 1.91Alge male 1.98 2.50
- Alge female 1.32 2.15Geo-alge 11 male 0.56 1.03Geo-alge II female 0.48 1.26Trg-cal male 1.42 2.78Trg-cal female 2.54 2.52
Education aspiration by math course patternNo alge low 1.34 1.87No alge college 1.81 3.44Alge low 1.42 2.26Alge college 1.90 2.28Geo-alge 111low 1.22 2.44Geo-alge 1I college 0.36 0.83Trg-cal low 6.85 5.83Trg-cal college 0.75 1.86
0.78
1.091.01
1.641.560.872.30
1.180.95
2.571.772.332.001.121.342.903.11
1.713.252.162.232.470.905.851.96
0.61
0.980.67
0.981.490.722.29
0.740.94
1.291.552.471.331.290.773.722.39
1.171.770.952.461.990.675.301.85
1.05
1.621.32
1.872.061.504.20
1.361.48
2.912.043.142.611.992.085.965.78
1.993.832.543.002.841.717.185.03
1.07 1.02
1.601.29
1.771.921.593.98
1.311.56
2.841.852.992.382.232.095.565.54
1.843.652.462.843.081.815.944.84
1.241.56
4.372.640.696.57
2.800.87
5.786.143.464.060.861.105.58
11.04
5.455.92 4.993.092.160.69
3.28
--Sample size available for estimation is less than 30. The estimates are thus suppressed.
SOURCE: U.S. Department of Education, National Center for Education Statistics, National Education Longitudinal Study of 1988: Base Year and First Follow-Up Student Surveys.
Gain
1.36 0.48
1.67 0.722.15 0.62
3.892.521.556.27
3.470.490.42
3.07 2.501.29 0.44
1.15
1.441.87
3.292.691.472.74
3.231.00
3.975.243.843.751.642.474.123.65
4.085.124.803.075.761.07
2.80
1.17
1.431.74
5.201.411.99
3.601.24
5.929.041.762.012.742.57
7.856.194.341.50
1.98
1.27
1.581.79
5.421.512.03
3.891.32
6.119.281.862.092.762.68
11.265.844.201.60
12.02
5.484.043.533.761.822.576.31
10.25
4.245.684.343.255.361.28
4.07
4.076.020.730.660.360.86
7.743.751.630.51
0.44

Table 4.- Percentage of students reporting specific patterns of mathematics course-taking behavior between8th and 10th grades, by 8th grade proficiency level: 1988 and 1990
Highest math courses taken
Eighth grade No algebra Algebra on-ly Algebra/geometry Trg/pre-cal.proficiency level
Below level 1 44.4 31.2 20.5 4.0
At level 1 23.5 34.2 38.1 4.3
At level 2 7.4 20.1 67.2 5.3
At level 3 1.2 5.6 74.8 18.3
NOTE: Percentages may not add to 100 due to rounding.
SOURCE: U.S. Department of Education, National Center for Education Statistics, National EducationLongitudinal Study of 1988: Base Year and First Follow-Up Student Surveys.
18
* Table 5.- Changes in proficiency levels in mathematics between 8th and 10th grade for 1990 10th graders, by 8th grade proficiency classification, gcnder, mnath course-taking patterns, and education aspirations
b etwee~ngv 1 1MM eirad esProfic nt Lit
decimals, fractions, Ln~ roots during 8th grade prob1J.o1%ejT.' M~ erade
Loss Rem in G ain LT whol At X hal At AtsP a oe At com plex 1fAtAti a etLT s m lAt m leAon l xrae numbers n~~~~ae~~ decunal pr se Proo edecim lsn als sp o l mCo mae pro lem prb10 W pc tlisam e s~olv in mov g solving Pr jweinr.-1 solving soaoving s a~
R Total 9.6
I Composite gender
Male 9.1I Female 10.0
Self-reported math course patternI No algebra 16.9
Algebra 13.8
32.9 57.6
30.2 60.7
35.5 54.5
47.7 35.4
40.6 45.6
18.8 43.8 17.2 16.3
20.2 41.1 17.6 16.8
17.5 46.3 16.8 15.8
30.0 56.0 11.2
18.1 47.8 20.4
2.512.0
4.0 15.6 19.5 40.4 24.6 4.9 29.0 66.1
4.3 14.3
3.6 16.8
0.3 54.3
1.7 29.5
19.8
19.1
22.0
29.9
38.4
42.3
27.5
21.8
4.6 24.4
5.3 34.1
20.1 3.5 - -
30.8 9.7 20.8 39.4
anuor balgebra 54 25.0 69.6
Trg/pre-cal/
Calculus 6.0 23.5 70.5
Education aspirations at eighth grade
No college degree 13.3 42.9 43.8
College graduateor more 7.8 28.3 63.9
Gender by math course pattern
~0 No alga male 15.7 43.0 41.3
No alge female 18.5 53.3 28.3Alga male 13.3 38.0 48.7
Alga female 14.3 43.1 42.6
Geo-alge II male s.o 21.9 73.1Geo-alge IIfemale 5.7 27.9 66.5
Trg-cal male 5.3 23.6 71.1Trg-cal female 6.8 23.3 69.9
Education aspiration, by math course patternNo alga low 17.3 49.8 32.9No alga coil 15.6 44.6 39.8Alga low 12.4 42.4 45.3Alga coil 14.9 39.4 45.7Gao-alga II low 8.5 33.2 58.3Geo-alge II coIl 4.7 23.3 72.0Trg-cal low 19.7 48.8 31.5Trg-cal coIl 3.5 19.1 77.4
8.5 29.5 20.0 32.9
23.6 36.3 13.1 18.8
9.1 7.0 16.7
8.2 15.7 11.7
23.2 50.4 15.3 9.6 1.4 28.9
15.3 38.9 18.6 21.2
30.0
30.1
17.6
18.5
10.4
53.5
58.9
45.4
49.9
24.0
12.7
9.5
21.3
19.6
20.0
3.7
1.1
13.410.8
35.6
7.0 34.0 19.9 30.728.9 34.7 11.9 12.617.5 38.2 14.6 25.9
30.728.117.118.812.57.2
41.714.2
57.753.451.745.033.7
28.238.935.1
10.013.721.519.418.220.6
8.4
1.54.38.8
14.530.033.711.0
15.6 22.8
28.2
5.9 11.2 16.5
0.1 49.1
0.4 61.0
2.3 26.6
1.2 32.7
9.9 5.9
8.4 8.112.0 12.33.8 18.7
0.1 59.30.5 47.11.0 34.82.3 26.45.5 11.7
10.3 6.00.0 -
12.3 7.4
20.1
24.5
31.5
28.2
16.7
45.1 31.1
45.0 27.6
30.2 12.8 16.3 37.3
43.8 28.5
27.0
11.329.8
31.9
42.8
16.8 47.212.9 36.510.6 52.4
20.523.930.029.631.013.7
11.4
18.722.526.733.537.646.7
50.6
3.8
3.3
12.1
7.2
34.6
27.938.318.2
1.56.58.4
10.519.733.6
30.6
Tehoihgrad
71.0
60.7
39.8
4.0 31.5
1.1 16.5
64.5
82.4
46.4
68.2
41.5
37.4
70.6
58.384.280.0
43.038.449.466.0
83.6
3.7 28.1
19.0 39.5
23.3 39.3
3.5 25.9
4.6 37.20.7 15.21.7 18.4
28 .5 28.517.4 44.29.2 41.43.5 30.5
1.1 15.3
--Sample size available for estimation is less than 30. The estimates are thus suppressed.NOTE: Percentages may not add to 100 due to rounding.SOURCE: U.S. Department of Education, National Center for Education Statistics, National Education Longitudinal Study of 1988: Base Year and First Follow-Up Student Surveys.
cient a� " " A"gradefracd.".'VLOO roots iieicU

Table 6.-. Standard errors for changes in proficiency levels in mathematics between 8th and 10th graders for 1990 10th graders, by eighth grade proficiency classification, gender, math course taking patterns, and
education aspirations
Overall changesbetween 8th & 10th gradeTenth grade
proficiency
Net proficient at decimals,fractions, and roots during 8th grade
Proficient atdecimals, fractions, and roots durnng 8th grade
Proficient at simpleproblem solving during 8th grade
Loss Remain Gain Less thin At whole At At simple At complex Less itha At At simple At Less tan At simple At
the same whole numbers decimals problem problem decimals decimals problem complex simple problem complex
number solving solving solving problem problem solving problemsolving solving solving
Total s.C. 0.44 0.71 0.78Composite gender
Male i.e. 0.64 1.04 1.09Female S.C. 0.53 0.95 1.01
Self-reported math course patternNo algebraAlgebra I
Geometry and/orAlgebra IITrg/pre-cal/calculus
S.C. 1.09 1.73 1.64S.C. 1.25 1.66 1.56
S.C. 0.37 0.79 0.87
S.C. 1.40 1.89 2.30Education aspirations at 8th grade
N)No collegedegreeCollege graduateor more
Gender by math course pS.e. 0.51 0.83 0.95
pattemn-__ -_No alge male S.C. 1.46 2.65 2.57No alge female S.C. 1.61 1.91 1.77Alge males S.C. 1.98 2.50 2.33Alge females S.C. 1.32 2.15 2.00Geo-alge II males S.C. 0.56 1.03 1.12
Geo-algc II S.C. 0.48 1.26 1.34femaleTrg-cal male i.e. 1.42 2.78 2.90Trg-cal female S.C. 2.54 2.52 3.11
Education aspiration by math course patternNo alge low S.C. 1.34 1.87 1.71No alge coll s.e. 1.81 3.44 3.25Alge low S.C. 1.42 2.26 2.16Alge coll S.C. 1.90 2.28 2.23Geo-alge II1low S.eC. 1.22 2.44 2.47Geo-alg 11 coll S.C. 0.36 0.83 0.90Trg-cal low S.C. 6.85 5.83 5.85Trg-cal coll S.C. 0.75 1.86 1.96
0.90 1.06 0.68 0.78
1.39 1.62 0.980.97 1.35 0.89
1.77 1.78 0.981.65 2.00 1.39
0.87 1.49 1.13
3.39 4.29 2.02
1.14 1.39 1.02
1.35 1.51
0.38
1.26 0.560.90 0.50
0.49 0.121.04 0.41
1.74 0.96
2.99
0.89
0.96 1.19
2.81 2.79 1.512.01 2.09 1.202.52 3.10 2.021.84 2.56 1.911.56 1.78 1.780.90 2.13 1.37
5.32 6.09 2.794.01 5.68 3.01
1.75 1.90 1.124.03 3.75 1.901.85 2.51 2.252.55 2.95 1.812.45 2.88 2.100.78 1.74 1.357.48 8.10 3.463.13 4.98 2.65
0.860.321.701.262.871.84
2.884.98
0.391.191.061.633.471.984.183.79
2.40
0.24
1.02 1.15 1.31
1.24 1.44 1.851.56 1.87 1.94
4.37 3.29 3.632.64 2.69 2.40
0.69 1.47 1.72
6.57 2.74 5.18
2.80 3.23 2.66
0.63 0.87 1.00
0.10 5.78 3.970.24 6.14 5.240.78 3.46 3.840.31 4.06 3.751.48 0.86 1.641.29 1.10 2.47
4.261.47
0.090.290.310.671.141.230.003.47
5.5811.04
5.455.924.993.092.160.69
3.28
1.24 0.48 1.17 1.27
1.50 0.72 1.43 1.581.94 0.62 1.74 1.79
1.28 - --
1.35 3.47 5. 20 5.42
1.72 0.49 1.41 1.51
4.34 0.42 1.99 2.03
1.50 2.50 3.60 3.89
1.51 1.49 0.44 1.24 1.32
5.413.363.253.642.452.51
1.921.672.151.622.192.64
4.12 6.37 6.453.65 8.50 5.15
4.08 4.14 1.125.12 4.97 2.614.80 4.08 1.833.07 3.16 1.925.76 4.67 2.991.07 1.84 1.87
2.80 4.72 4.40
4.07 5.92 6.116.02 9.04 9.280.73 1.76 1.860.66 2.01 2.09
0.36 2.74 2.760.86 2.57 2.68
7.74 7.85 11.263.75 6.19 5.841.63 4.34 4.200.51 1.50 1.60
0.44 1.98 2.02
--Sample size available for estimation is less than 30. The estimates are tout suppressed.
SOURCE: U.S. Department of Education, National Center for Education Statistics, National Education Longitudinal Study of 1988: Base Year and First Follow-Up Student Surveys.
- . . -I I - - I--- -- in �_ .- .11". -___-.A
) '70 1 1) I I IR