Embed Size (px)
Citation preview

National Cardiovascular Disease Database
Sticker No: SE / 04 / 233208
IC HEALTH
Supported by Ministry of Health & Family Welfare, Government of India
and World Health Organization
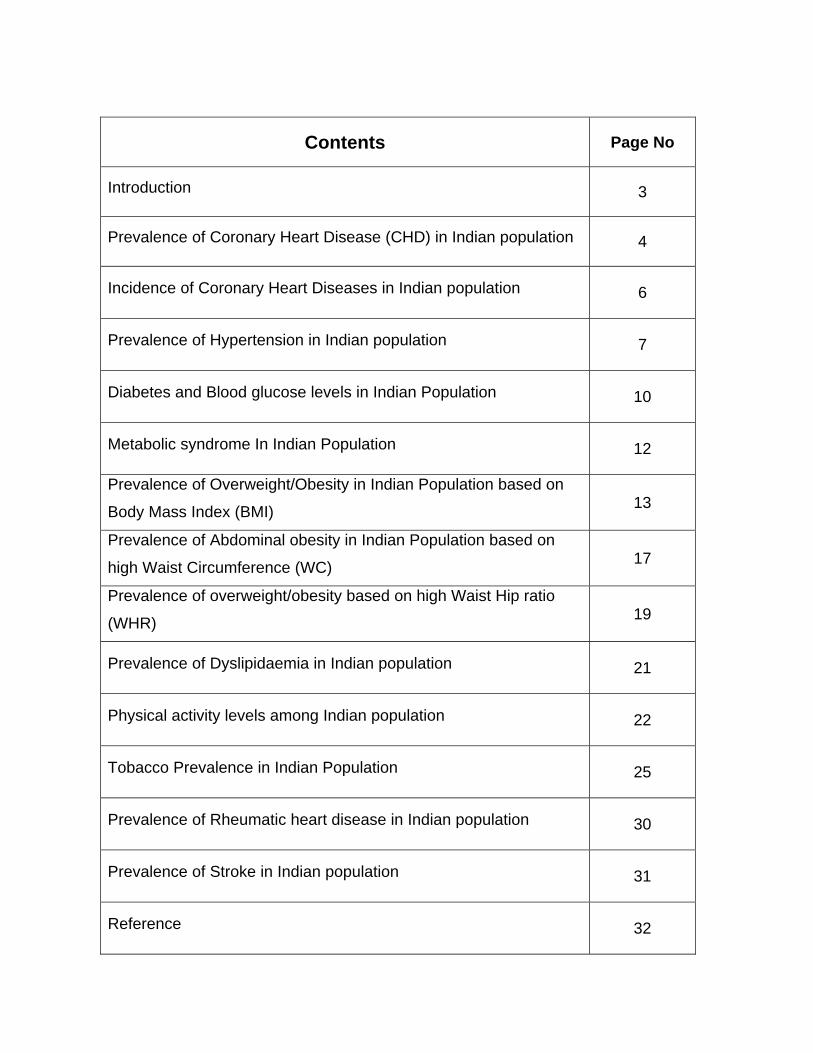
Contents Page No
Introduction 3
Prevalence of Coronary Heart Disease (CHD) in Indian population 4
Incidence of Coronary Heart Diseases in Indian population 6
Prevalence of Hypertension in Indian population 7
Diabetes and Blood glucose levels in Indian Population 10
Metabolic syndrome In Indian Population 12
Prevalence of Overweight/Obesity in Indian Population based on
Body Mass Index (BMI) 13
Prevalence of Abdominal obesity in Indian Population based on
high Waist Circumference (WC) 17
Prevalence of overweight/obesity based on high Waist Hip ratio
(WHR) 19
Prevalence of Dyslipidaemia in Indian population 21
Physical activity levels among Indian population 22
Tobacco Prevalence in Indian Population 25
Prevalence of Rheumatic heart disease in Indian population 30
Prevalence of Stroke in Indian population 31
Reference 32
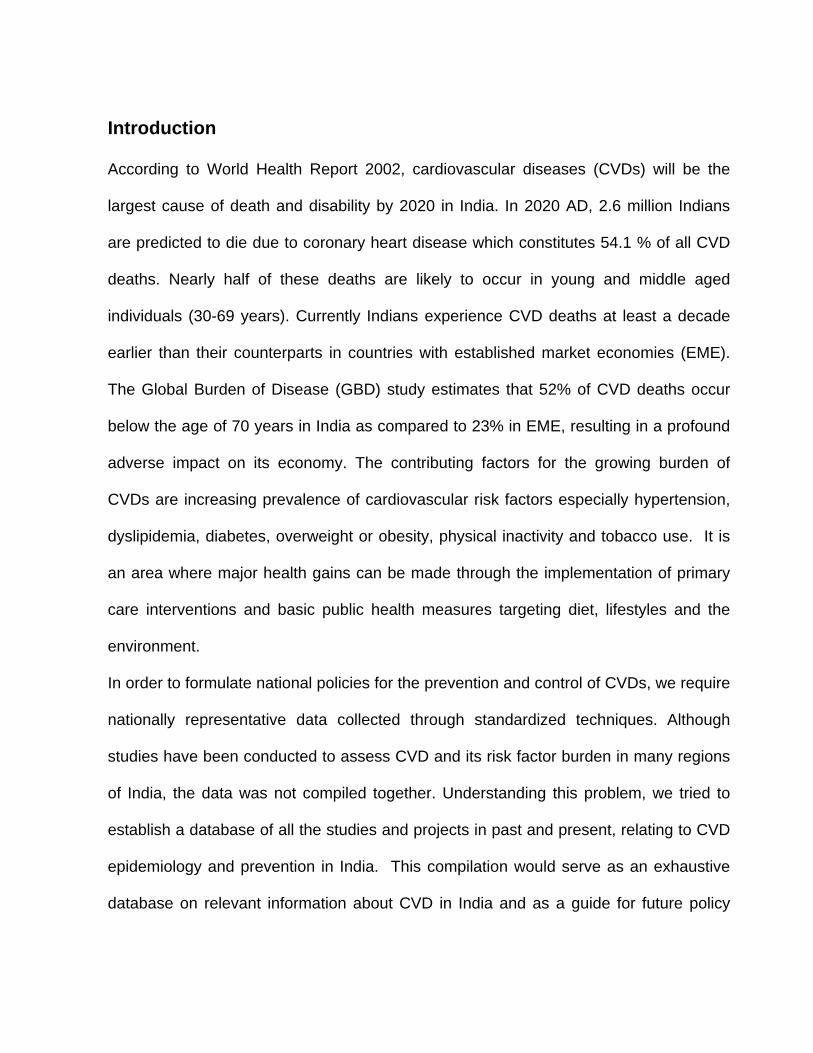
Introduction According to World Health Report 2002, cardiovascular diseases (CVDs) will be the
largest cause of death and disability by 2020 in India. In 2020 AD, 2.6 million Indians
are predicted to die due to coronary heart disease which constitutes 54.1 % of all CVD
deaths. Nearly half of these deaths are likely to occur in young and middle aged
individuals (30-69 years). Currently Indians experience CVD deaths at least a decade
earlier than their counterparts in countries with established market economies (EME).
The Global Burden of Disease (GBD) study estimates that 52% of CVD deaths occur
below the age of 70 years in India as compared to 23% in EME, resulting in a profound
adverse impact on its economy. The contributing factors for the growing burden of
CVDs are increasing prevalence of cardiovascular risk factors especially hypertension,
dyslipidemia, diabetes, overweight or obesity, physical inactivity and tobacco use. It is
an area where major health gains can be made through the implementation of primary
care interventions and basic public health measures targeting diet, lifestyles and the
environment.
In order to formulate national policies for the prevention and control of CVDs, we require
nationally representative data collected through standardized techniques. Although
studies have been conducted to assess CVD and its risk factor burden in many regions
of India, the data was not compiled together. Understanding this problem, we tried to
establish a database of all the studies and projects in past and present, relating to CVD
epidemiology and prevention in India. This compilation would serve as an exhaustive
database on relevant information about CVD in India and as a guide for future policy
and research. It will be made accessible to all major stakeholders. In this report we
have included prevalence data on
Coronary heart disease,
Diabetes mellitus,
stroke and risk factors like
High blood pressure,
Hypercholesterolemia,
Metabolic syndrome,
Hyper LDL-cholesterolemia,
Hypertriglyceridemia,
Low HDL-cholesterolemia,
Smoking,
Physical activity and
Overweight/Obesity based on high-BMI, high Waist-hip ratio and high Waist
circumference.
In addition, Mean values of anthropometric measurements and biochemical parameters
listed in various studies are also summarized.
Prevalence of Coronary Heart Disease (CHD) in Indian population
Estimates on prevalence of coronary artery disease obtained from cross sectional
surveys are summarised here. For comparison, age and sex-specific standardized rates
are provided wherever available. We searched the MEDLINE, EMBASE and INDMED
databases from 1950-2005, to obtain prevalence studies on Coronary Heart diseases.
The search terms used were “prevalence”, “coronary heart disease”, “myocardial
infarction”, “angina”, “heart” and “India”. This was supplemented by examining the
reference lists of each of the articles identified (both primary and review articles),
manual retrieval, consulting with experts in the subjects, and checking citations. Most
studies deal with information on prevalence and vary in time period of data collection,
location, definition used etc. Studies carried out after 1970 will be meaningful for any
comparison as the Minnesota code was published in 1969.
Characteristics of identified studies Using the above search techniques, we identified twenty-one epidemiological studies
published between 1950 and 2005. To qualify for inclusion the study had to have a
sample size (>150) and a reported CHD prevalence using defined criteria. For multiple
publications, from a single study, we chose the study with highest sample size unless
other articles dealt with special issues. All the studies identified were cross sectional in
nature.
Criteria for diagnosis of CHD included response to Rose Angina Questionnaire, ECG
criteria (Using Minnesota codes) and clinical history. Few studies have published
individual prevalence as well as combination of the above criteria’s. In case of multiple
prevalence, all the data based on multiple prevalence’s were included.
Table 1 (Refer Table 1-2 (CHD).xls) display the study location (urban vs. rural), period
of data collection, age and sex-stratified prevalence, prevalence of CHD in the total
group, men and women separately, sample size, criteria for diagnosis, study setting and
reference of all selected studies. The studies are arranged in a chronological order. If
the study period is not mentioned in the article, the publication date is adopted for
arranging the data.
Prevalence of CHD Dewan BD16 published the first Indian study using the Minnesota code in 1974, which
reported CHD prevalence of 2.28 % among males and 1.73% among females in rural
Maharashtra. Later during 1987-88 Chadha et al11 carried out a study in the rural areas
of Haryana and reported a lower prevalence of symptomatic CHD among men (0.74%)
and women (0.51%) while total prevalence was higher (2.71%) when silent CHD cases
were also included. The urban sample had a higher symptomatic CHD prevalence
(3.19%) compared to rural areas (0.59%).
ICMR Task force study43 carried out in 1991-94 reported 11% and 10% prevalence of
CHD among men and women respectively in urban Delhi. At the same time the rural
areas in Haryana had a lower prevalence (5.6% & 6.4%) than urban Delhi. Gupta R36,29
carried out serial epidemiological surveys in Jaipur during 1992-95 and 2001 and
presented almost similar prevalences among men (5.96% vs 6.18%) and women
(10.5% vs 10.1%). Although no major differences in total prevalence was reported, age
specific rates show a decline in males less than 40 years old. There was an increase in
CHD prevalence in those aged 40–59 years among men.
South Indian population in general had higher prevalence compared to north Indian
population. Ramchandran A105 reported 4% CHD prevalence in Chennai during 1994
while Mohan V61 documented a higher prevalence (11%) during 1996-97. Similarly,
Kutty VR51 carried out a study in the rural areas of Kerala and found 7.4 % prevalence
of CHD among twenty-five plus age group during 1990-91. Beegom R7 reported 13.9%
of CHD prevalence in 1995 in the urban areas of Trivandrum, Kerala.
Incidence of Coronary Heart Diseases in Indian population Through the systematic literature search, we could locate three incidence studies on
CHD in Indian population. The three incidence studies used different methods to attain
data and so are not directly comparable. Chadha et al121 carried out a prospective
cohort study while Gupta and Khetrapaul120 carried out a registry based study. The
earliest study was carried out by Gupta et al120 during 1977-78 reported the incidence of
CHD among men and women at 0.57% and 0.23% each. Trivedi et al121 followed a
cohort in Kheda, Gujrat from 1987 to 1992 and demonstrated the incidence of CHD at
0.252%. Chadha et al 122 conducted two repeat surveys in Delhi and documented the
incidence of CHD, during 3 year period after initial survey carried out during 1987-90, at
1.73% among men and 2.1% among women. The Details are shown in Table no 2
(Refer Table 1-2 (CHD).xls).
Prevalence of Hypertension in Indian population Methodology of Search We searched the MEDLINE, EMBASE and INDMED databases from 1940-2005, to
obtain prevalence studies on hypertension in Indian population. The search terms used
were “prevalence”, “hypertension”, “high blood pressure”, “coronary risk factors”, and
“India”.
Characteristics of identified articles Using the above literature search techniques, we identified fifty-two epidemiological
studies published between 1940 and 2005. All the studies identified were cross
sectional in nature. Table-3 shows the study location (urban vs rural), age group
studied, sample size, criteria for diagnosis of hypertension, prevalence of hypertension
in the total group, men and women separately. There were marked heterogeneity
among studies mostly due to the varying time periods of data collection and differing
definitions of hypertension. However, prevalence of hypertension based on JNC V
criteria was available from 22 studies across India.
Prevalence of Hypertension Dubey VD18 carried out one of the earliest study in India (1954), documented 4%
prevalence of hypertension (criteria:>160/95) amongst industrial workers of Kanpur. In
1984, Wasir HS et al101 reported 3% prevalence of hypertension (criteria :> 160/95) in
Delhi. During 1984-87 Gopinath and Chadha et al11,22 reported the prevalence of
hypertension in Delhi (criteria: >=160/90) to be 11% among males and 12% among
females in the urban areas and 4% and 3% respectively in rural areas. Another two
studies carried out in rural areas of Haryana54 (1994-95) demonstrated 4.5% prevalence
of hypertension (JNC V criteria) while urban areas of Delhi had a higher prevalence of
45% during 1996-972.
In the ICMR study43 in 1994 involving 5537 individuals (3050 urban residents and 2487
rural residents) demonstrated 25% and 29% prevalence of hypertension (Criteria:
>=140/90 mm of Hg) among males and females respectively in urban Delhi and 13%
and 10% in rural Haryana.
Further, Gupta R from Jaipur, through three serial epidemiological studies
(Criteria:>=140/90 mm of Hg) carried out during 199436, 200129 and 200337
demonstrated rising prevalence of hypertension (30%, 36%, and 51% respectively
among males and 34%, 38% and 51% among females).
From south India, Kutty VR51 carried out hypertension prevalence study (criteria:
>=160/95 mm of Hg) in rural Kerala during 1991 in the 20 plus age group and the
prevalence was found to be 18%. Later studies in Kerala (Criteria: JNC VI) reported
37% prevalence of hypertension among 30-64 age group52 in 1998 and 55% among 40-
60 age group103 during 2000. A higher prevalence of 69% and 55% was recorded
among elderly populations aged sixty and above in the urban and rural areas
respectively during 200042.
Few studies on prevalence on hypertension are available from eastern Indian
population. In 2002, Hazarika et al41 reported 61% prevalence (criteria: =JNC VI) among
man and women aged thirty and above in Assam.
The Sentinel Surveillance Project102, documented 28% overall prevalence of
hypertension (criteria: =JNC VI) from 10 regions of the country in the age group 20-69.
Another study123 carried out in 1998 among Industrial population in the Bharat
Electronics Limited (BEL), India using the same criteria illustrated a prevalence of 30%
among men.
Few studies were carried out comparing different socio economic groups. The initial
study from urban Chennai, Mohan et al62 reported 8.4% prevalence of hypertension
among men and women aged 20 years and above and belonging to the low socio
economic group (based on household income, occupation and dietary pattern).
Similarly, in the middle socio economic group had a higher prevalence (15%) during
1996-97. A study conducted in the urban areas of Chennai during 200073 (age
group>=40) reported a higher prevalence of hypertension (54%) among low income
group (monthly income < Rs 30000/annum and 40% prevalence among high-income
group (monthly income > Rs 60000/annum). Misra et al58 reported 12% prevalence of
hypertension in the slums of Delhi. The details are summarized in Table no 3 and 4.
(Refer Table 3-4 (Blood pressure).xls)
Diabetes and Blood glucose levels in Indian Population
Methodology of Search
Prevalence studies on Diabetes were identified as using the same methodology
described previously. The search terms used were “prevalence”, “diabetes”
“hypertension”, “coronary risk factors”, “glucose abnormalities”, “dysglycaemia”,
“coronary”, “insulin and metabolic syndrome” and “India”.
Characteristics of identified articles Using the above literature search techniques, we identified twenty-seven
epidemiological studies published between 1950 and 2005. All the studies identified
were cross sectional in nature. Table 5 shows the study location (urban Vs rural), age
group studied, sample size, criteria for diagnosis of diabetes, prevalence of diabetes in
the total group, men and women separately. There were marked heterogeneity among
studies mostly due to the varying time periods of data collection and differing definitions
of diabetes.
During 1972-75, ICMR3 carried out a large multicentric study in India, which
documented 2.6% and 1.5% prevalence of diabetes (criteria: FBS>5.6mmol/l or Post 1-
h glucose value>=7.8mmol/l or Post 2-h glucose value>=6.7mmol/l) among men and
women in the urban areas while in rural areas had a lower prevalence: 1.8% and 1.3%
respectively. Later, Gopinath and Chadha et al11,22 reported the prevalence of diabetes
(criteria: clinical history and documented evidence of medication) to be 1.6 % among
males and 1.6% among females in the urban areas and 0.5% and 0% respectively in
rural areas in Delhi during 1984-87. In 1994, ICMR Task force carried out a study
involving more than 5000 individuals (3050 urban residents and 2487 rural residents) as
part of the ICMR task force project,43 which demonstrated 14% prevalence of diabetes
(criteria: FBS>126mg% or history) urban Delhi and 3% in rural Haryana.
In 1994, Wander GS reported 5% prevalence of diabetes (criteria: random
venous blood glucose >180mg/dl or history) among a rural population in Ludhiana,
Punjab100. Further, Gupta R from Jaipur, through three epidemiological studies carried
out during 199436, 200129 and 200337 demonstrated rising trend rates of diabetes
(criteria: FBS>126mg/dl or history) 1%, 13%, and 18% respectively among males and
1%, 11% and 14% respectively among females.
Similar trends were observed in other parts of the country. Ramachandran A69
reported a prevalence of 8.2% during 1989 in urban Chennai. Subsequent studies from
urban Chennai reported the prevalence of diabetes at 11.6% in the year 199571 and
14% during 200070 (2-h post glucose value >=200mg/dl). Prevalence of diabetes
(criteria: 2-h post glucose>=11.1 mmol/l) in the rural areas of Tamil Nadu rose sharply
from 2.4% in 1989 to 6% in 200374.
Kutty VR53 carried out a study in Kerala during 1998-99 using the WHO criteria
and the prevalence of diabetes was found to be 5.9%. Joseph et al47 reported 16%
prevalence in the urban areas of Trivandrum in Kerala.
In 2000, a multi centric study70 involving six urban cities in India (Chennai,
Bangalore, Hyderabad, Mumbai, Culcutta and New Delhi) in the country among the age
group of 20 and above showed a prevalence of 14% among men and women (sample
size: 5288 men; 5928 women).
The Sentinel Surveillance Project102, documented 10% overall prevalence of
diabetes from 10 regions of the country using the criteria (FPG > 126 mg/dl or on
treatment) in the age group 20-69. Details of the prevalence studies and mean blood
glucose levels in Indian population are summarized in Table no 5 and 6. (Refer Table 5-
6 (Diabetes).xls)
Metabolic syndrome in Indian Population
The earliest study43 on prevalence of Metabolic Syndrome in India was done in
the urban areas of Delhi and rural Haryana and the prevalence was 30% and 11%
respectively during 1992-94 (criteria: ATP III). Later, Ramachandran et al72 (modified
ATP III criteria) documented a higher prevalence of metabolic syndrome (41%) in 1995
and Deepa et al124 reported 11.2% prevalence (criteria: European group for study of
insulin resistance-HOMA model) in urban Chennai during 1996-97. Gupta et al125
reported 25% prevalence (ATP III criteria) in Jaipur. The Sentinel surveillance project102
in Indian Industrial population illustrated 27% prevalence (ATP III criteria) during 2001-
03. Misra et al58 carried out a study among the urban slum population in Delhi, reported
30% prevalence (own criteria) of metabolic syndrome. The details of the studies are
given Table no 7. (Refer Table 7 (Met-syndrome).xls)
Prevalence of Overweight/Obesity in Indian population based on Body Mass Index (BMI)
We searched the MEDLINE, EMBASE and INDMED databases from 1950-2005,
to obtain prevalence studies of overweight & obesity. The search terms used were
“prevalence”, “overweight”, “obesity”, “body mass index”, “hypertension”, “high blood
pressure”, “glucose abnormalities”, “dysglycaemia”, “coronary”, “diabetes” “insulin and
metabolic syndrome” and “India”. This was supplemented by examining the reference
lists of each of the articles identified (both primary and review articles), manual retrieval,
consulting with experts in the subjects, and checking citations.
Characteristics of identified articles
Using the above search techniques, we identified thirty-two epidemiological
studies published between 1950 and 2005. To qualify for inclusion the study had to
have a sample size (>150) and a reported overweight/obesity prevalence using defined
criteria. For multiple publications, from a single study, we chose the study with highest
sample size.
All the studies identified were cross sectional in nature. Of the thirty-two studies
eleven studies address special issues like obesity among adolescents (five studies),
urban-rural differences (three studies), socio economic differences (three studies) and
slum vs. non-slum differences (two studies). Three studies were multi centric in nature.
Table 8 shows the study location (urban vs rural), age group studied, sample size,
criteria for diagnosis of overweight/obesity, prevalence of overweight/obesity in the
overall group, men and women separately.
Most studies mentioned the prevalence of overweight/obesity as ancillary
information and hence age-wise distribution of prevalence was lacking. There were
marked heterogeneity among studies mostly due to the varying time periods of data
collection and differing definitions of obesity. However, prevalence of overweight/obesity
based on NHANES III criteria was available from 16 studies across India.
Prevalence of Overweight/Obesity
One of The earliest study was carried out by Gopinath and Chadha et al11,22 in
Delhi during 1984-87. They reported 27% prevalence of overweight/obesity in the urban
areas and 10% in rural areas. In 1994, ICMR task force43 carried out a study involving
more than 5000 individuals (3050 urban residents and 2487 rural residents)
demonstrated 43% prevalence of overweight in urban Delhi and 12% in rural Haryana.
Two other studies from north India published during 1994 and 2000 showed a
prevalence of 17% (Ludhiana)100 and 15 % (Kashmir)104 respectively. Further, Gupta R
from Jaipur, through three epidemiological studies carried out during 199436, 200129 and
200337 demonstrated rising trend rates of 20%, 36%, and 62% respectively.
Similar trends are observed in other parts of the country. The earliest study from
the south Indian population reported a prevalence of 27% during 198969 in urban
Chennai and 2% in rural Tamil Nadu. Subsequent studies from urban Chennai reported
the prevalence of overweight/obesity at 23% in the year 199571 and 30% during 200070.
Prevalence in the rural areas of Tamil Nadu rose sharply from 2% in 1989 to 17% in
200374. Kutty VR51 carried out a study in rural Kerala during 1991 using the criteria
(BMI>27) and the prevalence was found to be 5.8%. Later studies in Kerala reported
49% prevalence of overweight among 30-64 age group52 in 1998 and 41% among 40-
60 age group103 during 2000. A higher prevalence of 54% (criteria: BMI>22.25) was
recorded among elderly populations (age group: >=60) during 200042.
The “Sentinel Surveillance Systems for CVD in Indian Industrial Populations”102,
involving ten centres from different parts of the country (survey period 2001-2003). The
population studied included industrial employees and their family members aged 10-69
years. Overall prevalence of overweight/obesity from 10 regions of the country using
the criteria (BMI>=25) in the age group 20-69 was 31%. Dibrugarh in Assam had the
lowest prevalence (0.5%) while Hyderabad in Andhra Pradesh had the highest (50%).
North Indian populations in Delhi, Lucknow in Uttar Pradesh and Ludhiana in Punjab
had prevalences of 41%, 37% and 15% respectively. Central Indian populations in
Nagpur and Pune in Maharashtra had prevalences of 20% and 36% respectively. South
Indian populations from Bangalore in Karnataka, Trivandrum in Kerala and Coimbatore
in Tamil Nadu had a prevalence of 47%, 38% and 27% respectively. Another study123
carried out in 1998 among Industrial population in the Bharat Electronics Limited (BEL),
Delhi, India illustrated a prevalence of 35% among males. The prevalence of
overweight/obesity had risen from 35% to 41% over a period of five years in BEL,
The urban cities in the country are facing high prevalence of obesity. In 2000, a
multi centric study126 involving seven urban cities (Chennai, Bangalore, Hyderabad,
Mumbai, Culcutta and New Delhi) in India among the age group of 20-40 and >=40 age
group showed a prevalence of 31% and 38% respectively (sample size: 5288 men;
5928 women). Similarly, Shukla et al85 conducted a large study in Mumbai, Maharastra
during 1994 and reported a prevalence of 26% among above 35 age group.
Few studies were carried out comparing different socio economic groups. In
urban Chennai, Mohan et al62 reported 20% prevalence of overweight/obesity among
men and women aged 20 years and above and belonging to the low socio economic
group (based on household income, occupation and dietary pattern) while, the middle
socio economic group had a higher prevalence (35%) during 1996-97. A study
conducted in the urban areas of Chennai during 200073 (age group>=40) reported a
higher prevalence of 33% among low income group (monthly income < Rs
30000/annum and 44% prevalence among high-income group (monthly income > Rs
60000/annum).
Some studies addressed the gradients of obesity among slum /non-slum groups.
ICMR Task force study43 among dwellers of urban slum in Delhi showed a prevalence of
20%, as compared to urban and rural prevalence of 48% and 12% respectively. Misra et
al59 reported 25% prevalence of obesity in the slums of Delhi.
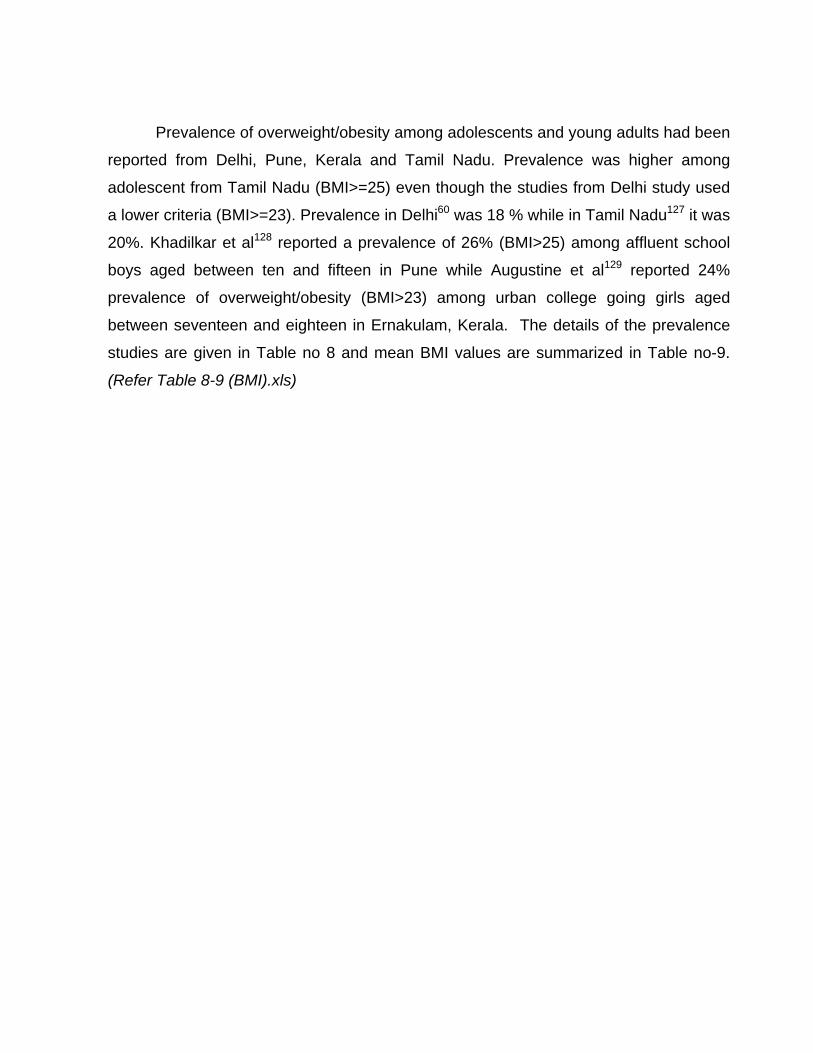
Prevalence of overweight/obesity among adolescents and young adults had been
reported from Delhi, Pune, Kerala and Tamil Nadu. Prevalence was higher among
adolescent from Tamil Nadu (BMI>=25) even though the studies from Delhi study used
a lower criteria (BMI>=23). Prevalence in Delhi60 was 18 % while in Tamil Nadu127 it was
20%. Khadilkar et al128 reported a prevalence of 26% (BMI>25) among affluent school
boys aged between ten and fifteen in Pune while Augustine et al129 reported 24%
prevalence of overweight/obesity (BMI>23) among urban college going girls aged
between seventeen and eighteen in Ernakulam, Kerala. The details of the prevalence
studies are given in Table no 8 and mean BMI values are summarized in Table no-9.
(Refer Table 8-9 (BMI).xls)
Prevalence of Abdominal obesity in Indian population based on high Waist Circumference (WC)
Methodology of Search
Prevalence studies on Abdominal Obesity were identified as using the same
methodology described previously. The search terms used were “prevalence”,
“overweight”, “obesity”, “waist circumference”, “coronary”, “hypertension”, “high blood
pressure”, “glucose abnormalities”, “dysglycaemia”, “diabetes”, “insulin and metabolic
syndrome” and “India”.
Characteristics of identified articles Using the above literature search techniques, we identified seven
epidemiological studies published between 1950 and 2005. All the studies identified
were cross sectional in nature. Of the seven studies two were multi-centric, two studies
address the issue of obesity among adolescents, one study compared slum vs. non-
slum differences and two studies were conducted among industrial population.
Table 10 shows the study location (urban vs rural), age group studied, sample
size, criteria for diagnosis of abdominal obesity, prevalence of abdominal obesity in the
total group, men and women separately. Mean waist circumference levels are
summarized in Table no 11. (Refer Table 10-11 (Waist Circumference).xls)
Prevalence
Similar to data on BMI, most studies provided the prevalence of abdominal
obesity as ancillary information and hence age-wise distribution of prevalence was
lacking. There were marked heterogeneity among studies mostly due to the varying
time periods of data collection and differing definitions of abdominal obesity. Prevalence
of abdominal obesity based on Adult Treatment Protocol III was available with three
studies and two studies used the modified ATP III recommendations for Indian
population as their criteria. Remaining studies greatly varied in their definition for
abdominal obesity.
Studies were mostly carried out among north Indian populations. Gupta et al
reported a prevalence of abdominal obesity in Rajasthan from 33.2% during 200129 to
45% during 200337 among adults using the ATP III criteria (WC: Males->102cm,
Females->88 cm). ICMR Task force Project study43 (1994) reported a higher
prevalence in urban Delhi (31%) and a lower prevalence in rural Haryana (8%) using
the criteria (WC: >94cm among men and >88 cm among women). The urban slum
group in the above study had a prevalence of 12%. Misra et al59 reported a prevalence
of 17% among adults belonging to lower socio economic groups in Delhi using ATP III
criteria.
A study from Chennai reported a high prevalence of abdominal obesity among
adults during 199572 (31%) using modified ATP III criteria (WC: >=90cm among men
and >=85 cm among women).
The Sentinel surveillance on CVD in Indian industrial population102 (2001-03),
using modified ATP III criteria for Asians (WC: >90cm among men and >85 cm among
women) reported an overall prevalence of abdominal obesity at 32%. Dibrugarh in
Assam had the lowest prevalence (0.7%) while Hyderabad in Andhra Pradesh had the
highest (52%). North Indian population in Delhi, Lucknow in Uttar Pradesh and
Ludhiana in Punjab had a prevalence of 42%, 34% and 17% respectively. Central
Indian populations in Nagpur and Pune in Maharashtra had a prevalence of 24% and
34% each. South Indian populations from Bangalore in Karnataka, Trivandrum in Kerala
and Coimbatore in Tamil Nadu had a prevalence of 45%, 32% and 41% respectively.
Another study123 among Industrial population in the Bharat Electronics Limited, Delhi
showed a prevalence of 43% among males.
Among adolescents and young adults in Delhi, Misra et al60 and Vikram et al98
reported a prevalence of 17% (age group 14-18) and 14% (age group 14-25) using the
criteria of WC >79cm among males and >76 cm among females.
Prevalence of overweight/obesity based on high Waist Hip ratio (WHR) Methodology of Search
Prevalence studies on high waist hip ratio were identified as using the same
methodology described previously. The search terms used were “prevalence”,
“overweight”, “obesity”, “waist-hip ratio”, “coronary”, “hypertension”, “high blood
pressure”, “glucose abnormalities”, “dysglycaemia”, “diabetes”, “insulin and metabolic
syndrome” and “India”.
Characteristics of identified articles Using the above literature search techniques described earlier, we identified
eleven epidemiological studies published between 1993 and 2005. All the studies
identified were cross sectional in nature. Of the eleven studies, one study was multi-
centric and another one addressed the issue of obesity among adolescents.
Comparison of obesity among different socio economic, urban-rural differences and
slum vs. non-slum differences were available with one study each.
Various definitions were used in these studies to define overweight/obesity. In these
studies the most common definition used was of WHR among males >0.9 and females
>0.8. Other definitions used were males >0.95, females > 0.8; males >0.86, females
>0.84; males >=0.87, females >=0.85 and males >0.9, females >0.85. These studies
were predominantly done in urban areas. Table 12 and 13 shows data on prevalence of
high WHR and mean WHR respectively with data on study location (urban vs rural), age
group studied, sample size, criteria for diagnosis of high waist-hip ratio, prevalence of
high WHR in the total group, men and women separately. (Refer Table 12-13
(WHR).xls)
Prevalence: The ICMR Task force project43 reported 65% prevalence of high waist hip ratio in
urban Delhi and 52% in rural Haryana in 1994 using the criteria (WHR: M->0.9, F->0.8).
Serial epidemiological surveys in urban Rajasthan had shown the prevalence at 60%
during 199436, 63% during 200129 and 79% during 200337 using the criteria (WHR:
male->0.9, female->0.8). During 199328, rural Rajasthan had a prevalence of 21%
(WHR: male->0.93). In 2002, Reddy NK77 reported 74% prevalence of high waist hip
ratio among workers of a political party in Andhra Pradesh.
Vikram et al99 reported 34 % (WHR: male->0.95, female->0.8) prevalence among
urban slum dwellers in Delhi during 2000. In Chennai, Mohan et al62 demonstrated the
prevalence of high waist hip ratio (criteria: WHR: M->0.9, F->0.85) higher among middle
income groups (29%) compared to low income group (23%). It also showed the
prevalence of overweight-obesity to be almost twice among males compared to females
in low-income groups whereas in middle-income groups it was almost the same among
males and females.
Studies among industrial population (Bharat Electronics Limited, Delhi) shows a
very high prevalence (67%) of high waist hip ratio (criteria: WHR: male->0.95)123.
Recent studies done in Delhi60 during 2002, among adolescents show a high rate of
overweight-obesity (19%) using the criteria (WHR: male->=0.87, female->=0.85).
Prevalence of Dyslipidaemia in Indian population
High serum lipid levels are major risk factors of coronary heart diseases that are
influenced by lifestyle transition and urbanization. Limited information exists regarding
the changing time-trends in lipid levels and the prevalence of dyslipidaemia in Indian
subjects. In 1961 Padmavati et al63 reported mean levels of total cholesterol levels
across different socio economic groups in Delhi. Later Chadha et al11 Reported 44%
prevalence of hypercholesterolemia among men and 50% prevalence among women in
urban Delhi during 1984-87. ICMR study reported 36.8% and 39.8% prevalence of
hypercholesterolemia in the urban Delhi and rural Haryana respectively during 1991-94.
Rural areas of Rajasthan had prevalence of 22% during 1991-9334 while repeat cross-
sectional surveys among urban subjects in Jaipur showed 37% vs 43% prevalence
among men and women during 200129 and 33% vs 29% during 2002-0337. Mohan et
al62 carried out a study in the urban population of Chennai in south India during 1996-97
and the prevalence of hypercholesterolemia among low-income group was 14.2% while
middle income group had a prevalence of 24.2%. A study in urban Kerala47 reported
32% prevalence (criteria: >239mg%) during 1999. Two studies from Andhra Pradesh
published in 2002 reported 18.5%76 and 31%77 prevalence of hypercholesterolemia
respectively. The prevalence of hypercholesterolemia and mean levels of cholesterol
levels Indian population are summarised in Table no 14 and 15. Prevalence of high
LDL-Cholesterolemia, low HDL-Cholesterolemia and Hypertriglyceridemia are
summarized in Table no 16, 18 and 20. Studies on their mean levels in Indian
population are shown in Table no 17, 19 and 21. (Refer Table 14-15 (Cholesterol).xls) &
(Refer Table 16-21 (Lipid levels).xls)
Physical activity levels among Indian population Methodology of Search Studies on Physical activity levels among Indian population were identified using a
systematic medline search strategy from 1990 to 2005 as above. The search terms
used were “physical inactivity”, “leisure-time exercise”, “sedentary life style”,
“prevalence”, “coronary heart disease”, and “India”.
Characteristics of identified articles Using literature search techniques described earlier, we identified three cross
sectional studies and one case control studies published between 1993 and 2005. The
population groups involved in the cross sectional studies were industrial employees,
and working population (employees of bank, public sector undertakings, software
companies, factories, schools and colleges, executives, engineers)
Cross-sectional studies Few studies have estimated the physical activity levels in Indian population so
far. Vaz et al130 assessed the total and occupational physical activity status of school
and college teachers in Bangalore, South India using a validated physical activity
questionnaire among a convenient sample of 198 school and college teachers (females
=173). The physical activity questionnaire provided information on estimated 24-hour
energy expenditure (kJ/day) and Physical activity levels (PALs): a composite index of
physical activity computed as estimated 24-hour energy expenditure (24h EE)/estimated
basal metabolic rate (BMR). The specific cut-offs used for classification of physical
activity levels using PALs were: <=1.4 for sedentary; >1.4–<1.55 for mild activity;
>=1.55–<=1.6 for moderate activity; >1.6–<=1.75 for moderately heavy activity; and
>1.75 for heavy activity. Table-22 shows the Distribution of estimated daily energy
expenditure (kJ + SD) across various physical activity domains in male and female
teachers and table-23 describes Physical activity pattern among teachers based on
Physical Activity Levels (PAL) index. Majority of the individuals indulged in either a
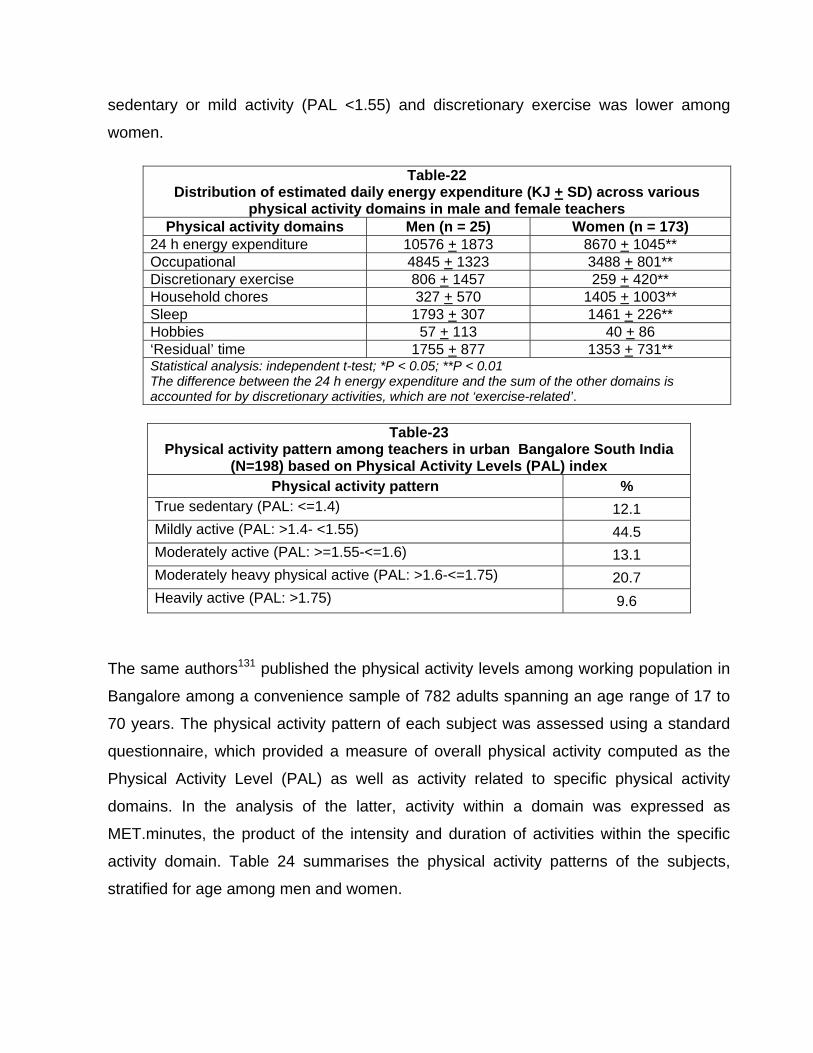
sedentary or mild activity (PAL <1.55) and discretionary exercise was lower among
women.
Table-22 Distribution of estimated daily energy expenditure (KJ + SD) across various
physical activity domains in male and female teachers Physical activity domains Men (n = 25) Women (n = 173)
24 h energy expenditure 10576 + 1873 8670 + 1045** Occupational 4845 + 1323 3488 + 801** Discretionary exercise 806 + 1457 259 + 420** Household chores 327 + 570 1405 + 1003** Sleep 1793 + 307 1461 + 226** Hobbies 57 + 113 40 + 86 ‘Residual’ time 1755 + 877 1353 + 731** Statistical analysis: independent t-test; *P < 0.05; **P < 0.01 The difference between the 24 h energy expenditure and the sum of the other domains is accounted for by discretionary activities, which are not ‘exercise-related’.
Table-23
Physical activity pattern among teachers in urban Bangalore South India (N=198) based on Physical Activity Levels (PAL) index
Physical activity pattern % True sedentary (PAL: <=1.4) 12.1 Mildly active (PAL: >1.4- <1.55) 44.5 Moderately active (PAL: >=1.55-<=1.6) 13.1 Moderately heavy physical active (PAL: >1.6-<=1.75) 20.7 Heavily active (PAL: >1.75) 9.6
The same authors131 published the physical activity levels among working population in
Bangalore among a convenience sample of 782 adults spanning an age range of 17 to
70 years. The physical activity pattern of each subject was assessed using a standard
questionnaire, which provided a measure of overall physical activity computed as the
Physical Activity Level (PAL) as well as activity related to specific physical activity
domains. In the analysis of the latter, activity within a domain was expressed as
MET.minutes, the product of the intensity and duration of activities within the specific
activity domain. Table 24 summarises the physical activity patterns of the subjects,
stratified for age among men and women.
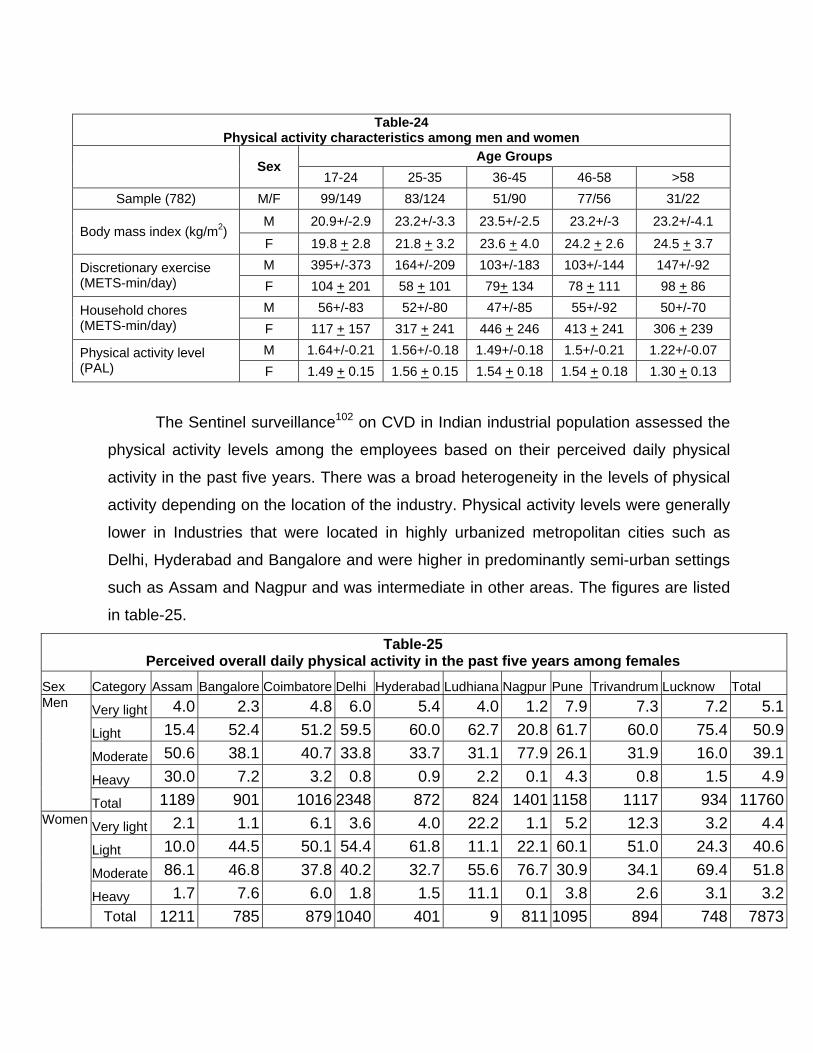
Table-24
Physical activity characteristics among men and women Age Groups
Sex 17-24 25-35 36-45 46-58 >58
Sample (782) M/F 99/149 83/124 51/90 77/56 31/22
M 20.9+/-2.9 23.2+/-3.3 23.5+/-2.5 23.2+/-3 23.2+/-4.1 Body mass index (kg/m2)
F 19.8 + 2.8 21.8 + 3.2 23.6 + 4.0 24.2 + 2.6 24.5 + 3.7 M 395+/-373 164+/-209 103+/-183 103+/-144 147+/-92 Discretionary exercise
(METS-min/day) F 104 + 201 58 + 101 79+ 134 78 + 111 98 + 86 M 56+/-83 52+/-80 47+/-85 55+/-92 50+/-70 Household chores
(METS-min/day) F 117 + 157 317 + 241 446 + 246 413 + 241 306 + 239 M 1.64+/-0.21 1.56+/-0.18 1.49+/-0.18 1.5+/-0.21 1.22+/-0.07 Physical activity level
(PAL) F 1.49 + 0.15 1.56 + 0.15 1.54 + 0.18 1.54 + 0.18 1.30 + 0.13
The Sentinel surveillance102 on CVD in Indian industrial population assessed the
physical activity levels among the employees based on their perceived daily physical
activity in the past five years. There was a broad heterogeneity in the levels of physical
activity depending on the location of the industry. Physical activity levels were generally
lower in Industries that were located in highly urbanized metropolitan cities such as
Delhi, Hyderabad and Bangalore and were higher in predominantly semi-urban settings
such as Assam and Nagpur and was intermediate in other areas. The figures are listed
in table-25.
Table-25 Perceived overall daily physical activity in the past five years among females
Sex Category Assam Bangalore Coimbatore Delhi Hyderabad Ludhiana Nagpur Pune Trivandrum Lucknow Total
Very light 4.0 2.3 4.8 6.0 5.4 4.0 1.2 7.9 7.3 7.2 5.1Light 15.4 52.4 51.2 59.5 60.0 62.7 20.8 61.7 60.0 75.4 50.9Moderate 50.6 38.1 40.7 33.8 33.7 31.1 77.9 26.1 31.9 16.0 39.1Heavy 30.0 7.2 3.2 0.8 0.9 2.2 0.1 4.3 0.8 1.5 4.9
Men
Total 1189 901 1016 2348 872 824 1401 1158 1117 934 11760Very light 2.1 1.1 6.1 3.6 4.0 22.2 1.1 5.2 12.3 3.2 4.4Light 10.0 44.5 50.1 54.4 61.8 11.1 22.1 60.1 51.0 24.3 40.6Moderate 86.1 46.8 37.8 40.2 32.7 55.6 76.7 30.9 34.1 69.4 51.8Heavy 1.7 7.6 6.0 1.8 1.5 11.1 0.1 3.8 2.6 3.1 3.2
Women
Total 1211 785 879 1040 401 9 811 1095 894 748 7873
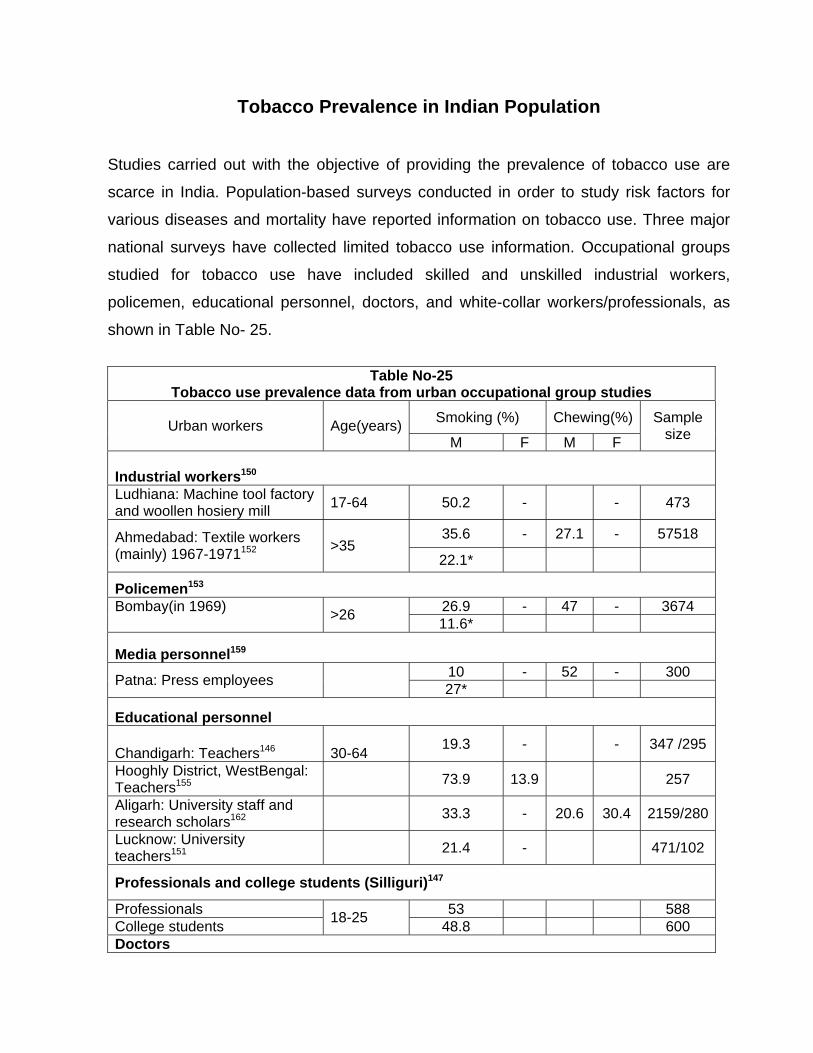
Tobacco Prevalence in Indian Population
Studies carried out with the objective of providing the prevalence of tobacco use are
scarce in India. Population-based surveys conducted in order to study risk factors for
various diseases and mortality have reported information on tobacco use. Three major
national surveys have collected limited tobacco use information. Occupational groups
studied for tobacco use have included skilled and unskilled industrial workers,
policemen, educational personnel, doctors, and white-collar workers/professionals, as
shown in Table No- 25.
Table No-25
Tobacco use prevalence data from urban occupational group studies Smoking (%) Chewing(%) Urban workers Age(years)
M F M F
Sample size
Industrial workers150
Ludhiana: Machine tool factory and woollen hosiery mill 17-64 50.2 - - 473
35.6 - 27.1 - 57518 Ahmedabad: Textile workers (mainly) 1967-1971152 >35
22.1*
Policemen153
26.9 - 47 - 3674 Bombay(in 1969) >26 11.6*
Media personnel159
10 - 52 - 300 Patna: Press employees 27*
Educational personnel
Chandigarh: Teachers146 30-64 19.3 - - 347 /295
Hooghly District, WestBengal: Teachers155 73.9 13.9 257
Aligarh: University staff and research scholars162 33.3 - 20.6 30.4 2159/280
Lucknow: University teachers151 21.4 - 471/102
Professionals and college students (Silliguri)147
Professionals 53 588 College students 18-25 48.8 600 Doctors
31.6 current - - 218 Chandigarh157 23.3 former
10 current 0 8 8 102/18 9 occasional All-India meeting161
14 former All-India meeting24 26-70 2.3 0 221/35 *smoking + chewing; M: male; F: female
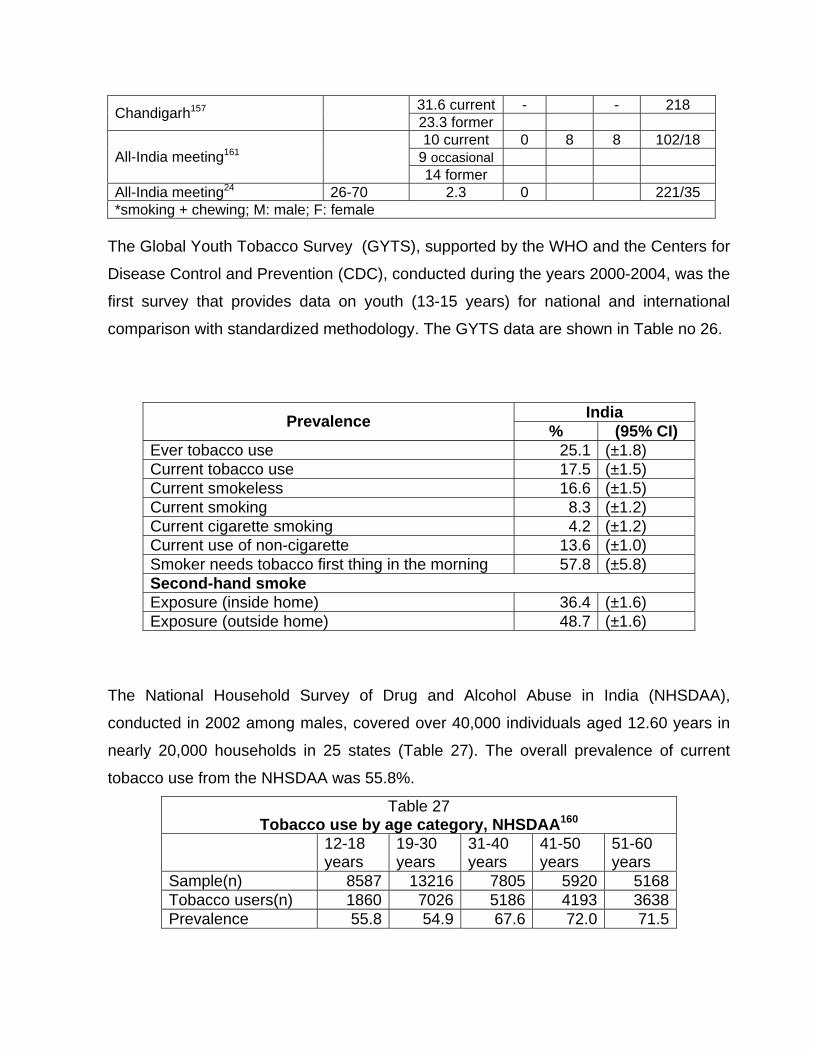
The Global Youth Tobacco Survey (GYTS), supported by the WHO and the Centers for
Disease Control and Prevention (CDC), conducted during the years 2000-2004, was the
first survey that provides data on youth (13-15 years) for national and international
comparison with standardized methodology. The GYTS data are shown in Table no 26.
India Prevalence % (95% CI) Ever tobacco use 25.1 (±1.8) Current tobacco use 17.5 (±1.5) Current smokeless 16.6 (±1.5) Current smoking 8.3 (±1.2) Current cigarette smoking 4.2 (±1.2) Current use of non-cigarette 13.6 (±1.0) Smoker needs tobacco first thing in the morning 57.8 (±5.8) Second-hand smoke Exposure (inside home) 36.4 (±1.6) Exposure (outside home) 48.7 (±1.6)
The National Household Survey of Drug and Alcohol Abuse in India (NHSDAA),
conducted in 2002 among males, covered over 40,000 individuals aged 12.60 years in
nearly 20,000 households in 25 states (Table 27). The overall prevalence of current
tobacco use from the NHSDAA was 55.8%.
Table 27 Tobacco use by age category, NHSDAA160
12-18 years
19-30 years
31-40 years
41-50 years
51-60 years
Sample(n) 8587 13216 7805 5920 5168Tobacco users(n) 1860 7026 5186 4193 3638Prevalence 55.8 54.9 67.6 72.0 71.5
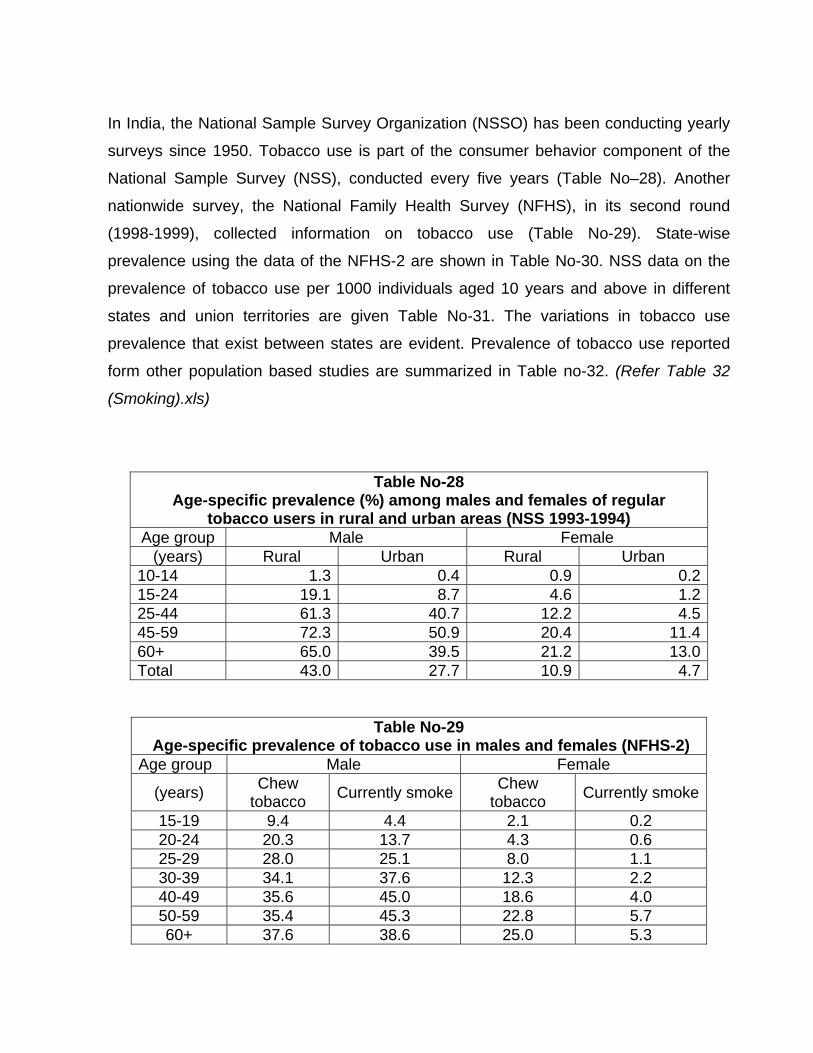
In India, the National Sample Survey Organization (NSSO) has been conducting yearly
surveys since 1950. Tobacco use is part of the consumer behavior component of the
National Sample Survey (NSS), conducted every five years (Table No–28). Another
nationwide survey, the National Family Health Survey (NFHS), in its second round
(1998-1999), collected information on tobacco use (Table No-29). State-wise
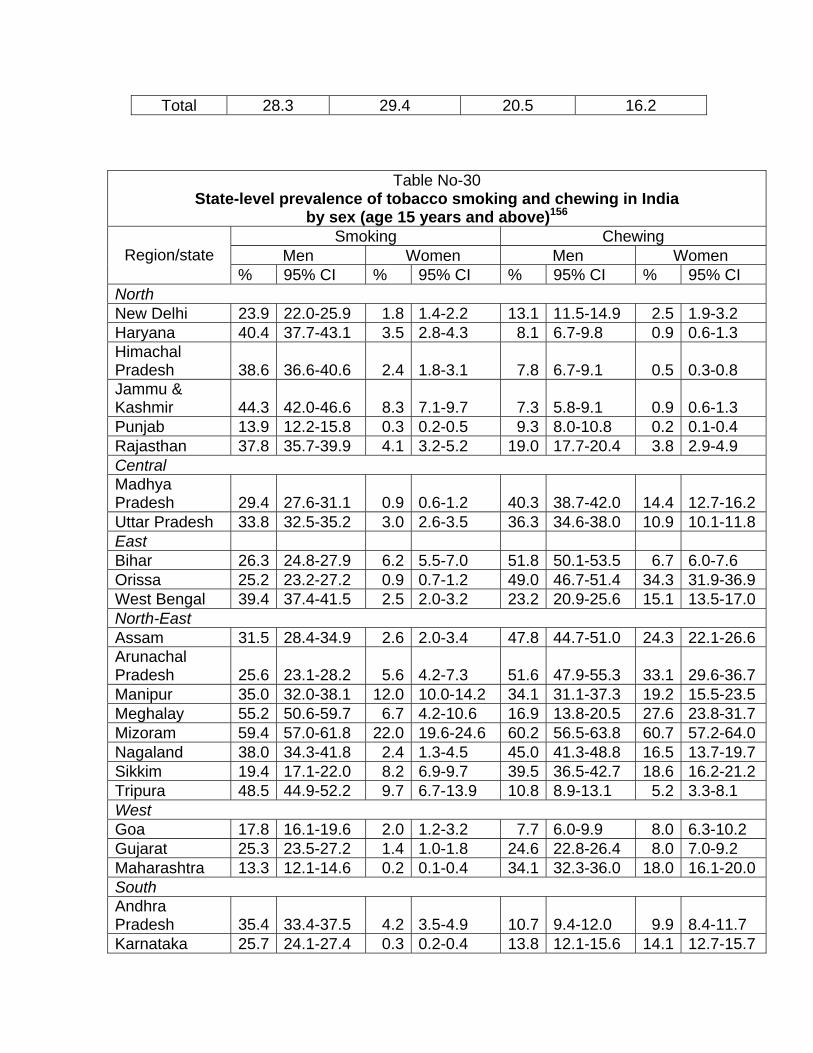
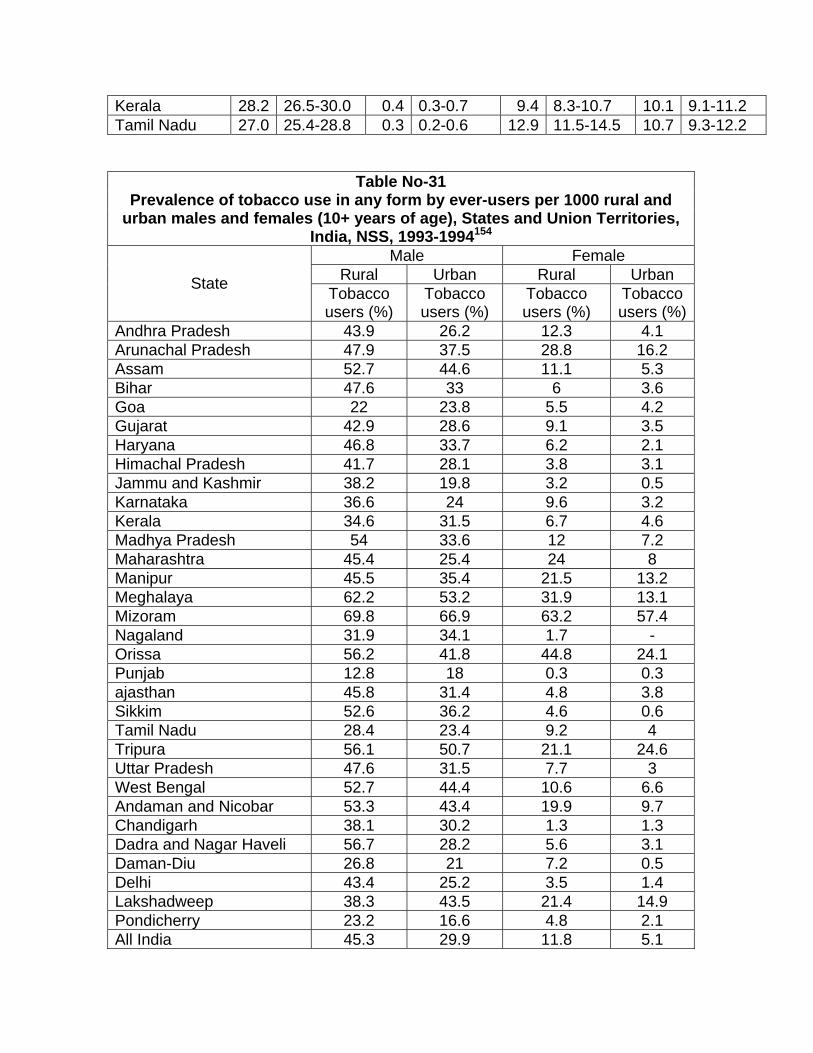
prevalence using the data of the NFHS-2 are shown in Table No-30. NSS data on the
prevalence of tobacco use per 1000 individuals aged 10 years and above in different
states and union territories are given Table No-31. The variations in tobacco use
prevalence that exist between states are evident. Prevalence of tobacco use reported
form other population based studies are summarized in Table no-32. (Refer Table 32
(Smoking).xls)
Table No-28 Age-specific prevalence (%) among males and females of regular
tobacco users in rural and urban areas (NSS 1993-1994) Age group Male Female
(years) Rural Urban Rural Urban 10-14 1.3 0.4 0.9 0.215-24 19.1 8.7 4.6 1.225-44 61.3 40.7 12.2 4.545-59 72.3 50.9 20.4 11.460+ 65.0 39.5 21.2 13.0Total 43.0 27.7 10.9 4.7
Table No-29 Age-specific prevalence of tobacco use in males and females (NFHS-2)
Age group Male Female
(years) Chew tobacco Currently smoke Chew
tobacco Currently smoke
15-19 9.4 4.4 2.1 0.2 20-24 20.3 13.7 4.3 0.6 25-29 28.0 25.1 8.0 1.1 30-39 34.1 37.6 12.3 2.2 40-49 35.6 45.0 18.6 4.0 50-59 35.4 45.3 22.8 5.7 60+ 37.6 38.6 25.0 5.3
Total 28.3 29.4 20.5 16.2
Table No-30 State-level prevalence of tobacco smoking and chewing in India
by sex (age 15 years and above)156
Smoking Chewing Men Women Men Women Region/state
% 95% CI % 95% CI % 95% CI % 95% CI North New Delhi 23.9 22.0-25.9 1.8 1.4-2.2 13.1 11.5-14.9 2.5 1.9-3.2 Haryana 40.4 37.7-43.1 3.5 2.8-4.3 8.1 6.7-9.8 0.9 0.6-1.3 Himachal Pradesh 38.6 36.6-40.6 2.4 1.8-3.1 7.8 6.7-9.1 0.5 0.3-0.8 Jammu & Kashmir 44.3 42.0-46.6 8.3 7.1-9.7 7.3 5.8-9.1 0.9 0.6-1.3 Punjab 13.9 12.2-15.8 0.3 0.2-0.5 9.3 8.0-10.8 0.2 0.1-0.4 Rajasthan 37.8 35.7-39.9 4.1 3.2-5.2 19.0 17.7-20.4 3.8 2.9-4.9 Central Madhya Pradesh 29.4 27.6-31.1 0.9 0.6-1.2 40.3 38.7-42.0 14.4 12.7-16.2 Uttar Pradesh 33.8 32.5-35.2 3.0 2.6-3.5 36.3 34.6-38.0 10.9 10.1-11.8 East Bihar 26.3 24.8-27.9 6.2 5.5-7.0 51.8 50.1-53.5 6.7 6.0-7.6 Orissa 25.2 23.2-27.2 0.9 0.7-1.2 49.0 46.7-51.4 34.3 31.9-36.9 West Bengal 39.4 37.4-41.5 2.5 2.0-3.2 23.2 20.9-25.6 15.1 13.5-17.0 North-East Assam 31.5 28.4-34.9 2.6 2.0-3.4 47.8 44.7-51.0 24.3 22.1-26.6 Arunachal Pradesh 25.6 23.1-28.2 5.6 4.2-7.3 51.6 47.9-55.3 33.1 29.6-36.7 Manipur 35.0 32.0-38.1 12.0 10.0-14.2 34.1 31.1-37.3 19.2 15.5-23.5 Meghalay 55.2 50.6-59.7 6.7 4.2-10.6 16.9 13.8-20.5 27.6 23.8-31.7 Mizoram 59.4 57.0-61.8 22.0 19.6-24.6 60.2 56.5-63.8 60.7 57.2-64.0 Nagaland 38.0 34.3-41.8 2.4 1.3-4.5 45.0 41.3-48.8 16.5 13.7-19.7 Sikkim 19.4 17.1-22.0 8.2 6.9-9.7 39.5 36.5-42.7 18.6 16.2-21.2 Tripura 48.5 44.9-52.2 9.7 6.7-13.9 10.8 8.9-13.1 5.2 3.3-8.1 West Goa 17.8 16.1-19.6 2.0 1.2-3.2 7.7 6.0-9.9 8.0 6.3-10.2 Gujarat 25.3 23.5-27.2 1.4 1.0-1.8 24.6 22.8-26.4 8.0 7.0-9.2 Maharashtra 13.3 12.1-14.6 0.2 0.1-0.4 34.1 32.3-36.0 18.0 16.1-20.0 South Andhra Pradesh 35.4 33.4-37.5 4.2 3.5-4.9 10.7 9.4-12.0 9.9 8.4-11.7 Karnataka 25.7 24.1-27.4 0.3 0.2-0.4 13.8 12.1-15.6 14.1 12.7-15.7
Kerala 28.2 26.5-30.0 0.4 0.3-0.7 9.4 8.3-10.7 10.1 9.1-11.2 Tamil Nadu 27.0 25.4-28.8 0.3 0.2-0.6 12.9 11.5-14.5 10.7 9.3-12.2
Table No-31 Prevalence of tobacco use in any form by ever-users per 1000 rural and
urban males and females (10+ years of age), States and Union Territories, India, NSS, 1993-1994154
Male Female Rural Urban Rural Urban State Tobacco
users (%) Tobacco users (%)
Tobacco users (%)
Tobacco users (%)
Andhra Pradesh 43.9 26.2 12.3 4.1 Arunachal Pradesh 47.9 37.5 28.8 16.2 Assam 52.7 44.6 11.1 5.3 Bihar 47.6 33 6 3.6 Goa 22 23.8 5.5 4.2 Gujarat 42.9 28.6 9.1 3.5 Haryana 46.8 33.7 6.2 2.1 Himachal Pradesh 41.7 28.1 3.8 3.1 Jammu and Kashmir 38.2 19.8 3.2 0.5 Karnataka 36.6 24 9.6 3.2 Kerala 34.6 31.5 6.7 4.6 Madhya Pradesh 54 33.6 12 7.2 Maharashtra 45.4 25.4 24 8 Manipur 45.5 35.4 21.5 13.2 Meghalaya 62.2 53.2 31.9 13.1 Mizoram 69.8 66.9 63.2 57.4 Nagaland 31.9 34.1 1.7 - Orissa 56.2 41.8 44.8 24.1 Punjab 12.8 18 0.3 0.3 ajasthan 45.8 31.4 4.8 3.8 Sikkim 52.6 36.2 4.6 0.6 Tamil Nadu 28.4 23.4 9.2 4 Tripura 56.1 50.7 21.1 24.6 Uttar Pradesh 47.6 31.5 7.7 3 West Bengal 52.7 44.4 10.6 6.6 Andaman and Nicobar 53.3 43.4 19.9 9.7 Chandigarh 38.1 30.2 1.3 1.3 Dadra and Nagar Haveli 56.7 28.2 5.6 3.1 Daman-Diu 26.8 21 7.2 0.5 Delhi 43.4 25.2 3.5 1.4 Lakshadweep 38.3 43.5 21.4 14.9 Pondicherry 23.2 16.6 4.8 2.1 All India 45.3 29.9 11.8 5.1
Prevalence of Rheumatic heart disease in Indian population
Rheumatic heart disease (RHD) is a common cardiovascular ailment, affecting children
and young adults. The prevalence of RHD has declined in the developed countries; but
continues to be an important cause of cardiovascular morbidity and mortality in India
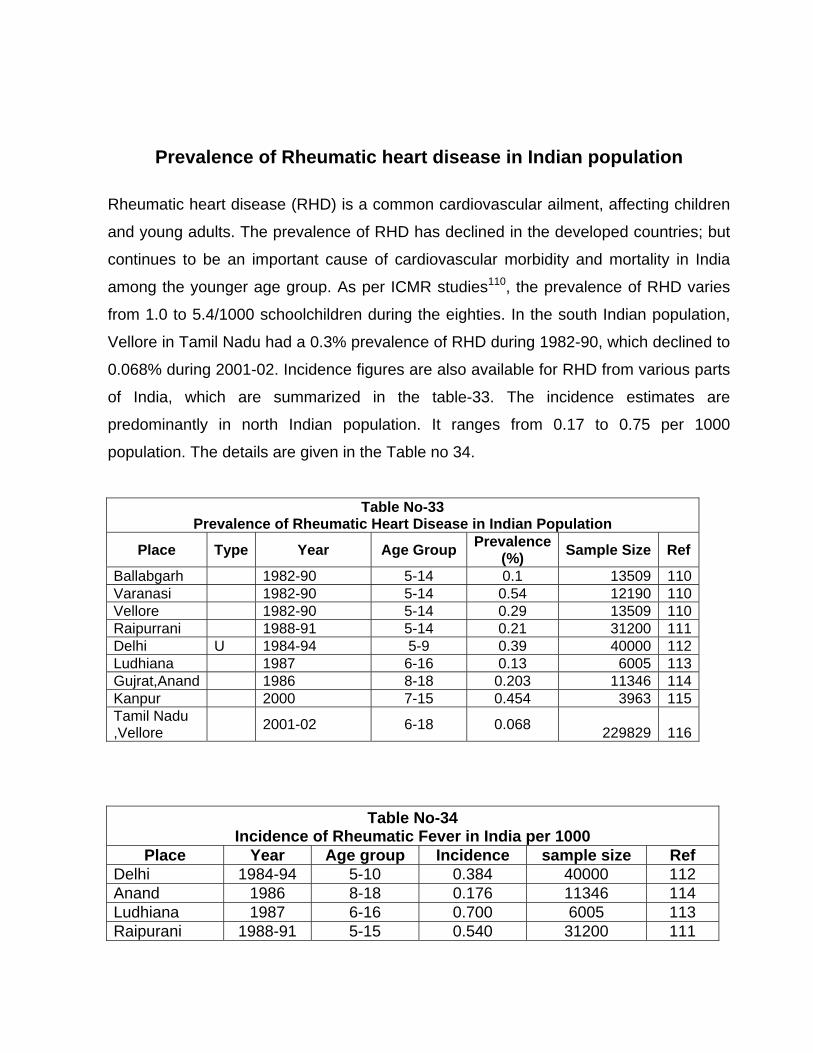
among the younger age group. As per ICMR studies110, the prevalence of RHD varies
from 1.0 to 5.4/1000 schoolchildren during the eighties. In the south Indian population,
Vellore in Tamil Nadu had a 0.3% prevalence of RHD during 1982-90, which declined to
0.068% during 2001-02. Incidence figures are also available for RHD from various parts
of India, which are summarized in the table-33. The incidence estimates are
predominantly in north Indian population. It ranges from 0.17 to 0.75 per 1000
population. The details are given in the Table no 34.
Table No-33 Prevalence of Rheumatic Heart Disease in Indian Population
Place Type Year Age Group Prevalence(%) Sample Size Ref
Ballabgarh 1982-90 5-14 0.1 13509 110Varanasi 1982-90 5-14 0.54 12190 110Vellore 1982-90 5-14 0.29 13509 110Raipurrani 1988-91 5-14 0.21 31200 111Delhi U 1984-94 5-9 0.39 40000 112Ludhiana 1987 6-16 0.13 6005 113Gujrat,Anand 1986 8-18 0.203 11346 114Kanpur 2000 7-15 0.454 3963 115Tamil Nadu ,Vellore 2001-02 6-18 0.068 229829 116
Table No-34 Incidence of Rheumatic Fever in India per 1000
Place Year Age group Incidence sample size Ref Delhi 1984-94 5-10 0.384 40000 112 Anand 1986 8-18 0.176 11346 114 Ludhiana 1987 6-16 0.700 6005 113 Raipurani 1988-91 5-15 0.540 31200 111
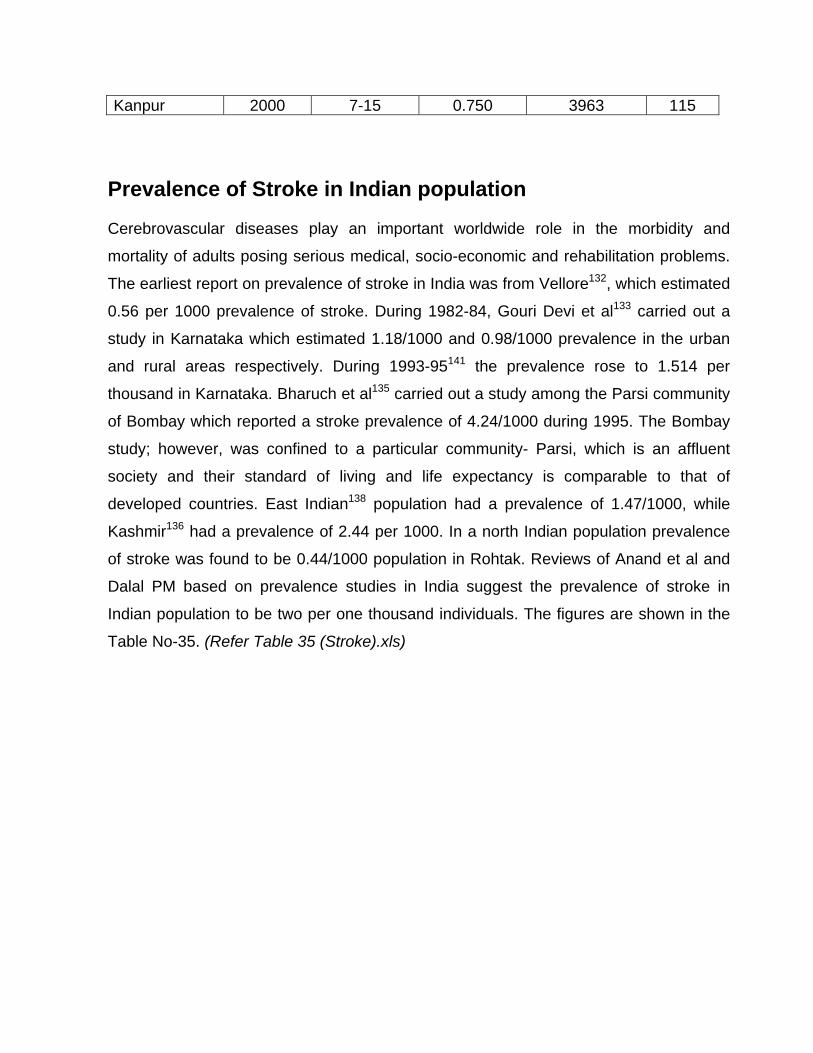
Kanpur 2000 7-15 0.750 3963 115 Prevalence of Stroke in Indian population Cerebrovascular diseases play an important worldwide role in the morbidity and
mortality of adults posing serious medical, socio-economic and rehabilitation problems.
The earliest report on prevalence of stroke in India was from Vellore132, which estimated
0.56 per 1000 prevalence of stroke. During 1982-84, Gouri Devi et al133 carried out a
study in Karnataka which estimated 1.18/1000 and 0.98/1000 prevalence in the urban
and rural areas respectively. During 1993-95141 the prevalence rose to 1.514 per
thousand in Karnataka. Bharuch et al135 carried out a study among the Parsi community
of Bombay which reported a stroke prevalence of 4.24/1000 during 1995. The Bombay
study; however, was confined to a particular community- Parsi, which is an affluent
society and their standard of living and life expectancy is comparable to that of
developed countries. East Indian138 population had a prevalence of 1.47/1000, while
Kashmir136 had a prevalence of 2.44 per 1000. In a north Indian population prevalence
of stroke was found to be 0.44/1000 population in Rohtak. Reviews of Anand et al and
Dalal PM based on prevalence studies in India suggest the prevalence of stroke in
Indian population to be two per one thousand individuals. The figures are shown in the
Table No-35. (Refer Table 35 (Stroke).xls)
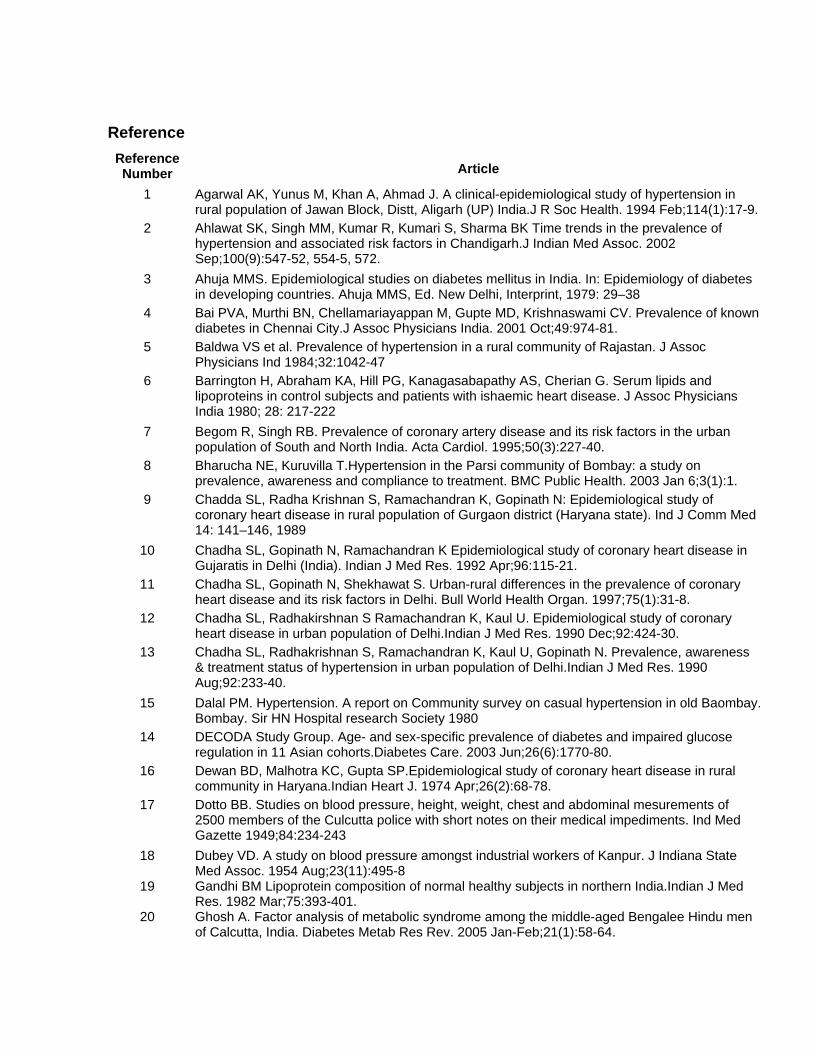
Reference Reference Number Article
1 Agarwal AK, Yunus M, Khan A, Ahmad J. A clinical-epidemiological study of hypertension in rural population of Jawan Block, Distt, Aligarh (UP) India.J R Soc Health. 1994 Feb;114(1):17-9.
2 Ahlawat SK, Singh MM, Kumar R, Kumari S, Sharma BK Time trends in the prevalence of hypertension and associated risk factors in Chandigarh.J Indian Med Assoc. 2002 Sep;100(9):547-52, 554-5, 572.
3 Ahuja MMS. Epidemiological studies on diabetes mellitus in India. In: Epidemiology of diabetes in developing countries. Ahuja MMS, Ed. New Delhi, Interprint, 1979: 29–38
4 Bai PVA, Murthi BN, Chellamariayappan M, Gupte MD, Krishnaswami CV. Prevalence of known diabetes in Chennai City.J Assoc Physicians India. 2001 Oct;49:974-81.
5 Baldwa VS et al. Prevalence of hypertension in a rural community of Rajastan. J Assoc Physicians Ind 1984;32:1042-47
6 Barrington H, Abraham KA, Hill PG, Kanagasabapathy AS, Cherian G. Serum lipids and lipoproteins in control subjects and patients with ishaemic heart disease. J Assoc Physicians India 1980; 28: 217-222
7 Begom R, Singh RB. Prevalence of coronary artery disease and its risk factors in the urban population of South and North India. Acta Cardiol. 1995;50(3):227-40.
8 Bharucha NE, Kuruvilla T.Hypertension in the Parsi community of Bombay: a study on prevalence, awareness and compliance to treatment. BMC Public Health. 2003 Jan 6;3(1):1.
9 Chadda SL, Radha Krishnan S, Ramachandran K, Gopinath N: Epidemiological study of coronary heart disease in rural population of Gurgaon district (Haryana state). Ind J Comm Med 14: 141–146, 1989
10 Chadha SL, Gopinath N, Ramachandran K Epidemiological study of coronary heart disease in Gujaratis in Delhi (India). Indian J Med Res. 1992 Apr;96:115-21.
11 Chadha SL, Gopinath N, Shekhawat S. Urban-rural differences in the prevalence of coronary heart disease and its risk factors in Delhi. Bull World Health Organ. 1997;75(1):31-8.
12 Chadha SL, Radhakirshnan S Ramachandran K, Kaul U. Epidemiological study of coronary heart disease in urban population of Delhi.Indian J Med Res. 1990 Dec;92:424-30.
13 Chadha SL, Radhakrishnan S, Ramachandran K, Kaul U, Gopinath N. Prevalence, awareness & treatment status of hypertension in urban population of Delhi.Indian J Med Res. 1990 Aug;92:233-40.
15 Dalal PM. Hypertension. A report on Community survey on casual hypertension in old Baombay. Bombay. Sir HN Hospital research Society 1980
14 DECODA Study Group. Age- and sex-specific prevalence of diabetes and impaired glucose regulation in 11 Asian cohorts.Diabetes Care. 2003 Jun;26(6):1770-80.
16 Dewan BD, Malhotra KC, Gupta SP.Epidemiological study of coronary heart disease in rural community in Haryana.Indian Heart J. 1974 Apr;26(2):68-78.
17 Dotto BB. Studies on blood pressure, height, weight, chest and abdominal mesurements of 2500 members of the Culcutta police with short notes on their medical impediments. Ind Med Gazette 1949;84:234-243
18 Dubey VD. A study on blood pressure amongst industrial workers of Kanpur. J Indiana State Med Assoc. 1954 Aug;23(11):495-8
19 Gandhi BM Lipoprotein composition of normal healthy subjects in northern India.Indian J Med Res. 1982 Mar;75:393-401.
20 Ghosh A. Factor analysis of metabolic syndrome among the middle-aged Bengalee Hindu men of Calcutta, India. Diabetes Metab Res Rev. 2005 Jan-Feb;21(1):58-64.
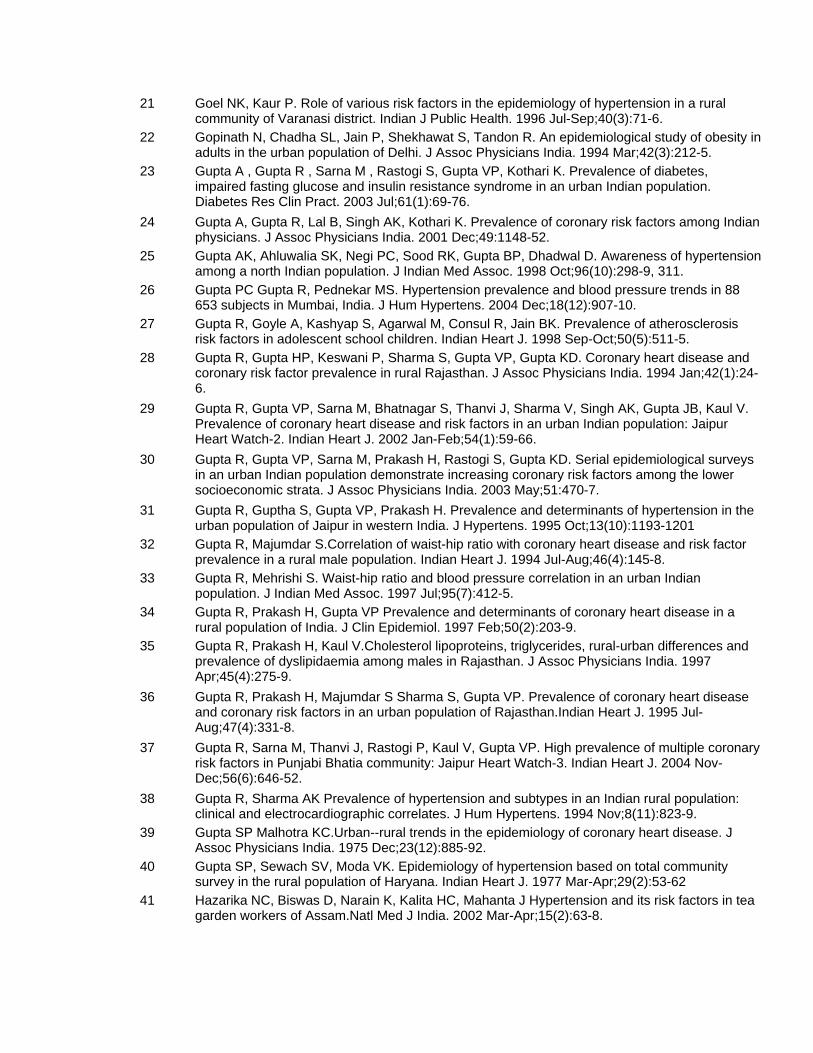
21 Goel NK, Kaur P. Role of various risk factors in the epidemiology of hypertension in a rural community of Varanasi district. Indian J Public Health. 1996 Jul-Sep;40(3):71-6.
22 Gopinath N, Chadha SL, Jain P, Shekhawat S, Tandon R. An epidemiological study of obesity in adults in the urban population of Delhi. J Assoc Physicians India. 1994 Mar;42(3):212-5.
23 Gupta A , Gupta R , Sarna M , Rastogi S, Gupta VP, Kothari K. Prevalence of diabetes, impaired fasting glucose and insulin resistance syndrome in an urban Indian population. Diabetes Res Clin Pract. 2003 Jul;61(1):69-76.
24 Gupta A, Gupta R, Lal B, Singh AK, Kothari K. Prevalence of coronary risk factors among Indian physicians. J Assoc Physicians India. 2001 Dec;49:1148-52.
25 Gupta AK, Ahluwalia SK, Negi PC, Sood RK, Gupta BP, Dhadwal D. Awareness of hypertension among a north Indian population. J Indian Med Assoc. 1998 Oct;96(10):298-9, 311.
26 Gupta PC Gupta R, Pednekar MS. Hypertension prevalence and blood pressure trends in 88 653 subjects in Mumbai, India. J Hum Hypertens. 2004 Dec;18(12):907-10.
27 Gupta R, Goyle A, Kashyap S, Agarwal M, Consul R, Jain BK. Prevalence of atherosclerosis risk factors in adolescent school children. Indian Heart J. 1998 Sep-Oct;50(5):511-5.
28 Gupta R, Gupta HP, Keswani P, Sharma S, Gupta VP, Gupta KD. Coronary heart disease and coronary risk factor prevalence in rural Rajasthan. J Assoc Physicians India. 1994 Jan;42(1):24-6.
29 Gupta R, Gupta VP, Sarna M, Bhatnagar S, Thanvi J, Sharma V, Singh AK, Gupta JB, Kaul V. Prevalence of coronary heart disease and risk factors in an urban Indian population: Jaipur Heart Watch-2. Indian Heart J. 2002 Jan-Feb;54(1):59-66.
30 Gupta R, Gupta VP, Sarna M, Prakash H, Rastogi S, Gupta KD. Serial epidemiological surveys in an urban Indian population demonstrate increasing coronary risk factors among the lower socioeconomic strata. J Assoc Physicians India. 2003 May;51:470-7.
31 Gupta R, Guptha S, Gupta VP, Prakash H. Prevalence and determinants of hypertension in the urban population of Jaipur in western India. J Hypertens. 1995 Oct;13(10):1193-1201
32 Gupta R, Majumdar S.Correlation of waist-hip ratio with coronary heart disease and risk factor prevalence in a rural male population. Indian Heart J. 1994 Jul-Aug;46(4):145-8.
33 Gupta R, Mehrishi S. Waist-hip ratio and blood pressure correlation in an urban Indian population. J Indian Med Assoc. 1997 Jul;95(7):412-5.
34 Gupta R, Prakash H, Gupta VP Prevalence and determinants of coronary heart disease in a rural population of India. J Clin Epidemiol. 1997 Feb;50(2):203-9.
35 Gupta R, Prakash H, Kaul V.Cholesterol lipoproteins, triglycerides, rural-urban differences and prevalence of dyslipidaemia among males in Rajasthan. J Assoc Physicians India. 1997 Apr;45(4):275-9.
36 Gupta R, Prakash H, Majumdar S Sharma S, Gupta VP. Prevalence of coronary heart disease and coronary risk factors in an urban population of Rajasthan.Indian Heart J. 1995 Jul-Aug;47(4):331-8.
37 Gupta R, Sarna M, Thanvi J, Rastogi P, Kaul V, Gupta VP. High prevalence of multiple coronary risk factors in Punjabi Bhatia community: Jaipur Heart Watch-3. Indian Heart J. 2004 Nov-Dec;56(6):646-52.
38 Gupta R, Sharma AK Prevalence of hypertension and subtypes in an Indian rural population: clinical and electrocardiographic correlates. J Hum Hypertens. 1994 Nov;8(11):823-9.
39 Gupta SP Malhotra KC.Urban--rural trends in the epidemiology of coronary heart disease. J Assoc Physicians India. 1975 Dec;23(12):885-92.
40 Gupta SP, Sewach SV, Moda VK. Epidemiology of hypertension based on total community survey in the rural population of Haryana. Indian Heart J. 1977 Mar-Apr;29(2):53-62
41 Hazarika NC, Biswas D, Narain K, Kalita HC, Mahanta J Hypertension and its risk factors in tea garden workers of Assam.Natl Med J India. 2002 Mar-Apr;15(2):63-8.
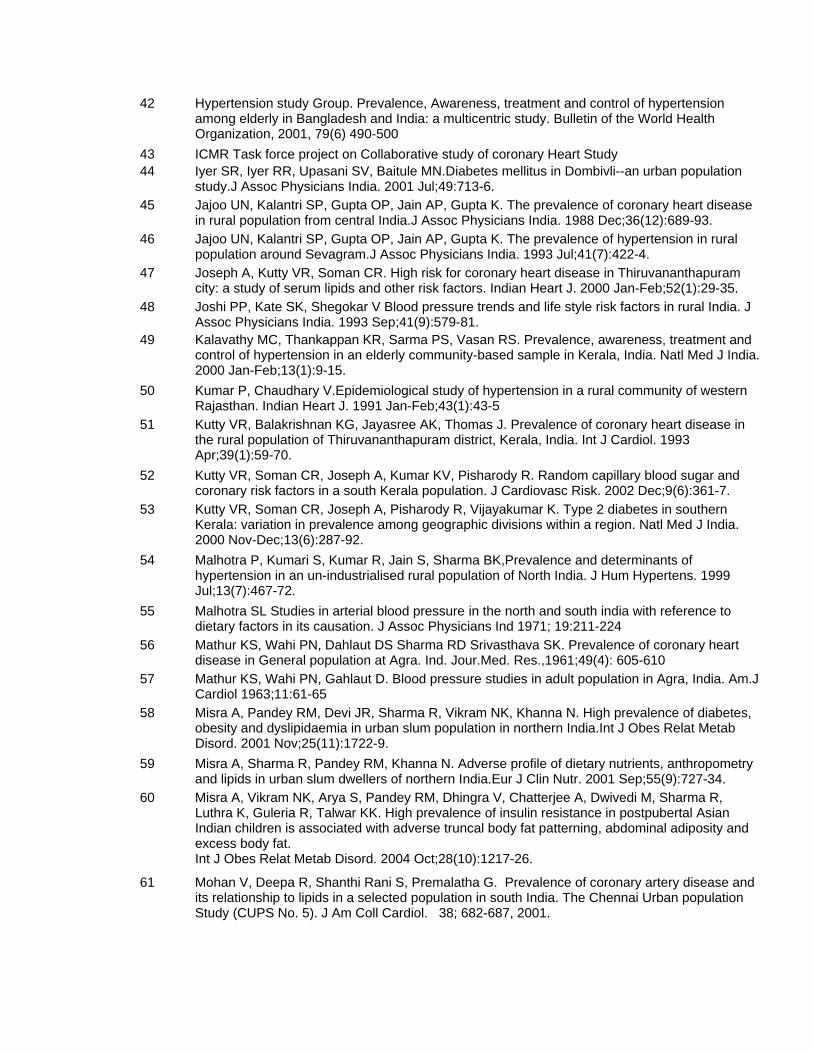
42 Hypertension study Group. Prevalence, Awareness, treatment and control of hypertension among elderly in Bangladesh and India: a multicentric study. Bulletin of the World Health Organization, 2001, 79(6) 490-500
43 ICMR Task force project on Collaborative study of coronary Heart Study 44 Iyer SR, Iyer RR, Upasani SV, Baitule MN.Diabetes mellitus in Dombivli--an urban population
study.J Assoc Physicians India. 2001 Jul;49:713-6. 45 Jajoo UN, Kalantri SP, Gupta OP, Jain AP, Gupta K. The prevalence of coronary heart disease
in rural population from central India.J Assoc Physicians India. 1988 Dec;36(12):689-93. 46 Jajoo UN, Kalantri SP, Gupta OP, Jain AP, Gupta K. The prevalence of hypertension in rural
population around Sevagram.J Assoc Physicians India. 1993 Jul;41(7):422-4. 47 Joseph A, Kutty VR, Soman CR. High risk for coronary heart disease in Thiruvananthapuram
city: a study of serum lipids and other risk factors. Indian Heart J. 2000 Jan-Feb;52(1):29-35. 48 Joshi PP, Kate SK, Shegokar V Blood pressure trends and life style risk factors in rural India. J
Assoc Physicians India. 1993 Sep;41(9):579-81. 49 Kalavathy MC, Thankappan KR, Sarma PS, Vasan RS. Prevalence, awareness, treatment and
control of hypertension in an elderly community-based sample in Kerala, India. Natl Med J India. 2000 Jan-Feb;13(1):9-15.
50 Kumar P, Chaudhary V.Epidemiological study of hypertension in a rural community of western Rajasthan. Indian Heart J. 1991 Jan-Feb;43(1):43-5
51 Kutty VR, Balakrishnan KG, Jayasree AK, Thomas J. Prevalence of coronary heart disease in the rural population of Thiruvananthapuram district, Kerala, India. Int J Cardiol. 1993 Apr;39(1):59-70.
52 Kutty VR, Soman CR, Joseph A, Kumar KV, Pisharody R. Random capillary blood sugar and coronary risk factors in a south Kerala population. J Cardiovasc Risk. 2002 Dec;9(6):361-7.
53 Kutty VR, Soman CR, Joseph A, Pisharody R, Vijayakumar K. Type 2 diabetes in southern Kerala: variation in prevalence among geographic divisions within a region. Natl Med J India. 2000 Nov-Dec;13(6):287-92.
54 Malhotra P, Kumari S, Kumar R, Jain S, Sharma BK,Prevalence and determinants of hypertension in an un-industrialised rural population of North India. J Hum Hypertens. 1999 Jul;13(7):467-72.
55 Malhotra SL Studies in arterial blood pressure in the north and south india with reference to dietary factors in its causation. J Assoc Physicians Ind 1971; 19:211-224
56 Mathur KS, Wahi PN, Dahlaut DS Sharma RD Srivasthava SK. Prevalence of coronary heart disease in General population at Agra. Ind. Jour.Med. Res.,1961;49(4): 605-610
57 Mathur KS, Wahi PN, Gahlaut D. Blood pressure studies in adult population in Agra, India. Am.J Cardiol 1963;11:61-65
58 Misra A, Pandey RM, Devi JR, Sharma R, Vikram NK, Khanna N. High prevalence of diabetes, obesity and dyslipidaemia in urban slum population in northern India.Int J Obes Relat Metab Disord. 2001 Nov;25(11):1722-9.
59 Misra A, Sharma R, Pandey RM, Khanna N. Adverse profile of dietary nutrients, anthropometry and lipids in urban slum dwellers of northern India.Eur J Clin Nutr. 2001 Sep;55(9):727-34.
60 Misra A, Vikram NK, Arya S, Pandey RM, Dhingra V, Chatterjee A, Dwivedi M, Sharma R, Luthra K, Guleria R, Talwar KK. High prevalence of insulin resistance in postpubertal Asian Indian children is associated with adverse truncal body fat patterning, abdominal adiposity and excess body fat. Int J Obes Relat Metab Disord. 2004 Oct;28(10):1217-26.
61 Mohan V, Deepa R, Shanthi Rani S, Premalatha G. Prevalence of coronary artery disease and its relationship to lipids in a selected population in south India. The Chennai Urban population Study (CUPS No. 5). J Am Coll Cardiol. 38; 682-687, 2001.
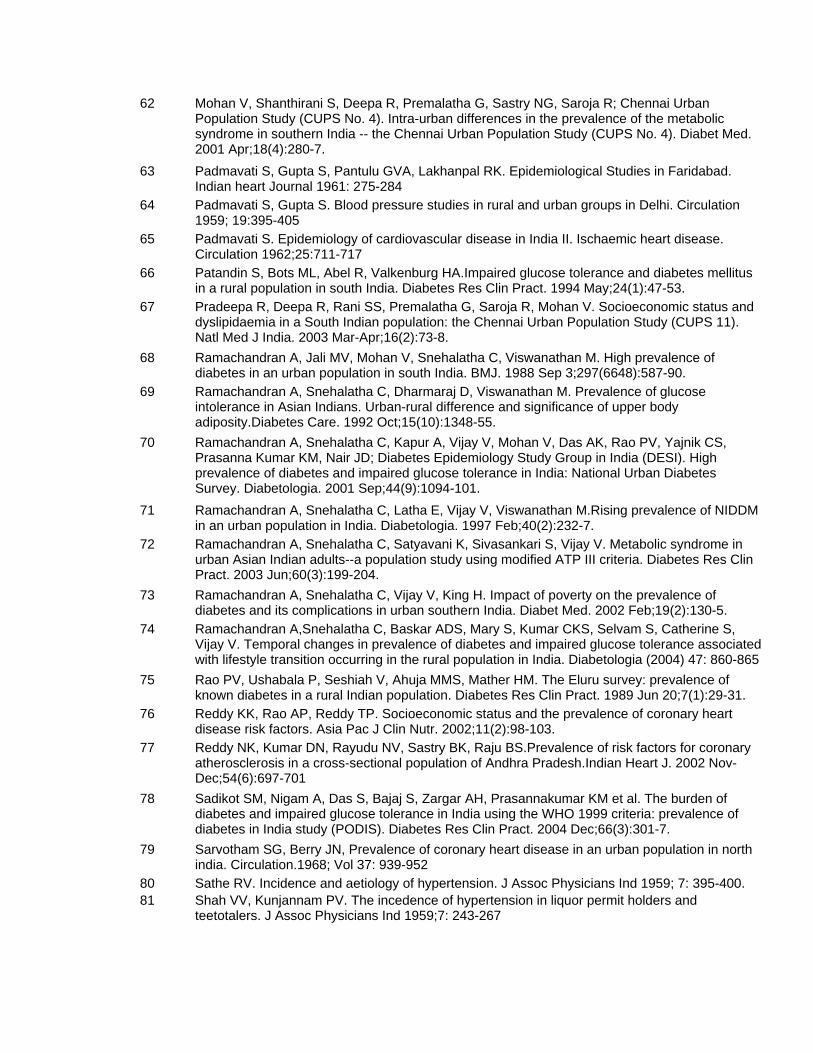
62 Mohan V, Shanthirani S, Deepa R, Premalatha G, Sastry NG, Saroja R; Chennai Urban Population Study (CUPS No. 4). Intra-urban differences in the prevalence of the metabolic syndrome in southern India -- the Chennai Urban Population Study (CUPS No. 4). Diabet Med. 2001 Apr;18(4):280-7.
63 Padmavati S, Gupta S, Pantulu GVA, Lakhanpal RK. Epidemiological Studies in Faridabad. Indian heart Journal 1961: 275-284
64 Padmavati S, Gupta S. Blood pressure studies in rural and urban groups in Delhi. Circulation 1959; 19:395-405
65 Padmavati S. Epidemiology of cardiovascular disease in India II. Ischaemic heart disease. Circulation 1962;25:711-717
66 Patandin S, Bots ML, Abel R, Valkenburg HA.Impaired glucose tolerance and diabetes mellitus in a rural population in south India. Diabetes Res Clin Pract. 1994 May;24(1):47-53.
67 Pradeepa R, Deepa R, Rani SS, Premalatha G, Saroja R, Mohan V. Socioeconomic status and dyslipidaemia in a South Indian population: the Chennai Urban Population Study (CUPS 11). Natl Med J India. 2003 Mar-Apr;16(2):73-8.
68 Ramachandran A, Jali MV, Mohan V, Snehalatha C, Viswanathan M. High prevalence of diabetes in an urban population in south India. BMJ. 1988 Sep 3;297(6648):587-90.
69 Ramachandran A, Snehalatha C, Dharmaraj D, Viswanathan M. Prevalence of glucose intolerance in Asian Indians. Urban-rural difference and significance of upper body adiposity.Diabetes Care. 1992 Oct;15(10):1348-55.
70 Ramachandran A, Snehalatha C, Kapur A, Vijay V, Mohan V, Das AK, Rao PV, Yajnik CS, Prasanna Kumar KM, Nair JD; Diabetes Epidemiology Study Group in India (DESI). High prevalence of diabetes and impaired glucose tolerance in India: National Urban Diabetes Survey. Diabetologia. 2001 Sep;44(9):1094-101.
71 Ramachandran A, Snehalatha C, Latha E, Vijay V, Viswanathan M.Rising prevalence of NIDDM in an urban population in India. Diabetologia. 1997 Feb;40(2):232-7.
72 Ramachandran A, Snehalatha C, Satyavani K, Sivasankari S, Vijay V. Metabolic syndrome in urban Asian Indian adults--a population study using modified ATP III criteria. Diabetes Res Clin Pract. 2003 Jun;60(3):199-204.
73 Ramachandran A, Snehalatha C, Vijay V, King H. Impact of poverty on the prevalence of diabetes and its complications in urban southern India. Diabet Med. 2002 Feb;19(2):130-5.
74 Ramachandran A,Snehalatha C, Baskar ADS, Mary S, Kumar CKS, Selvam S, Catherine S, Vijay V. Temporal changes in prevalence of diabetes and impaired glucose tolerance associated with lifestyle transition occurring in the rural population in India. Diabetologia (2004) 47: 860-865
75 Rao PV, Ushabala P, Seshiah V, Ahuja MMS, Mather HM. The Eluru survey: prevalence of known diabetes in a rural Indian population. Diabetes Res Clin Pract. 1989 Jun 20;7(1):29-31.
76 Reddy KK, Rao AP, Reddy TP. Socioeconomic status and the prevalence of coronary heart disease risk factors. Asia Pac J Clin Nutr. 2002;11(2):98-103.
77 Reddy NK, Kumar DN, Rayudu NV, Sastry BK, Raju BS.Prevalence of risk factors for coronary atherosclerosis in a cross-sectional population of Andhra Pradesh.Indian Heart J. 2002 Nov-Dec;54(6):697-701
78 Sadikot SM, Nigam A, Das S, Bajaj S, Zargar AH, Prasannakumar KM et al. The burden of diabetes and impaired glucose tolerance in India using the WHO 1999 criteria: prevalence of diabetes in India study (PODIS). Diabetes Res Clin Pract. 2004 Dec;66(3):301-7.
79 Sarvotham SG, Berry JN, Prevalence of coronary heart disease in an urban population in north india. Circulation.1968; Vol 37: 939-952
80 Sathe RV. Incidence and aetiology of hypertension. J Assoc Physicians Ind 1959; 7: 395-400. 81 Shah VV, Kunjannam PV. The incedence of hypertension in liquor permit holders and
teetotalers. J Assoc Physicians Ind 1959;7: 243-267
82 Shanthirani CS, Pradeepa R, Deepa R, Premalatha G, Saroja R, Mohan V. Prevalence and risk factors of hypertension in a selected South Indian population--the Chennai Urban Population Study. J Assoc Physicians India. 2003 Jan;51:20-7.
83 Sharma BK et al Hypertension among the industrial workers and professional classes in Ludhiana, Punjab, Ind. Heart J. 1985; 37:380-85
84 Sharma S. Clinical, biochemical, electrocardiographic and noninvasive hemodynamic assessment of cardiovascular status in natives at high to extreme altitudes (3000m-5500m) of the Himalayan region. Indian Heart J. 1990 Sep-Oct;42(5):375-9.
85 Shukla HC, Gupta PC, Mehta HC, Hebert JR. Descriptive epidemiology of body mass index of an urban adult population in western India.J Epidemiol Community Health. 2002 Nov;56(11):876-80.
86 Singh RB, Bajaj S Niaz MA, Rastogi SS Moshiri M. Prevalence of type 2 diabetes mellitus and risk of hypertension and coronary artery disease in rural and urban population with low rates of obesity. Int J Cardiol. 1998 Sep 1;66(1):65-72.
87 Singh RB, Beegom R, Mehta AS, Niaz MA, De AK, Haque M. Prevalence and risk factors of hypertension and age-specific blood pressures in five cities: a study of Indian women. NKP Salve Institute of Medical Sciences, Nagpur, India. Five City Study Group. Int J Cardiol. 1998 Jan 31;63(2):165-73.
88 Singh RB, Niaz MA, Ghosh S, Beegom R, Agarwal P, Nangia S, Moshiri M, Janus ED. Low fat intake and coronary artery disease in a population with higher prevalence of coronary artery disease: the Indian paradox. J Am Coll Nutr. 1998 Aug;17(4):342-50.
89 Singh RB, Niaz MA, Ghosh S, Beegom R, Chibo H, Agarwal P et al. Epidemiological study of coronary artery disease and its risk factors in an elderly urban population of north India. J Am Coll Nutr. 1995 Dec;14(6):628-34.
90 Singh RB, Sharma JP, Rastogi V, Niaz MA, Singh NK. Prevalence and determinants of hypertension in the Indian social class and heart survey. J Hum Hypertens. 1997 Jan;11(1):51-6.
91 Singh RB, Sharma JP, Rastogi V, Raghuvanshi RS, Moshiri M, Verma SP, Janus ED. Prevalence of coronary artery disease and coronary risk factors in rural and urban populations of north India. Eur Heart J. 1997 Nov;18(11):1728-35
92 Sinha PR, Gaur SD , Somani PN. Prevalence of Coronary heart disease in an urban community of Varanasi Indian J Comm.Med. 1990; Vol 15. No.2: 182-185
93 Snehalatha C, Ramchandran A, Kapur A, Vijay V. Age-specific prevalence and risk associations for impaired glucose tolerance in urban southern Indian population. J Assoc Physicians India. 2003 Aug;51:766-9.
94 Snehalatha C, Viswanathan V, Ramachandran A. Cutoff values for normal anthropometric variables in asian Indian adults.Diabetes Care. 2003 May;26(5):1380-4.
95 Thakur K, Malhotra P, Walia I, Kumar R. Health awareness and treatment compliance of high blood pressure among women in a peri-urban colony of Chandigarh, India. J Indian Med Assoc. 1999 Jun;97(6):217-9.
96 Vasisth S Narula J, Awtade A, Tandon R, Srivasthava LM. Lipids and Lipoproteins in normal controls and clinically documented coronary heart disease Ann Natl Acad Med Sci 1990;26:57-66
97 Verma NP, Mehta SP, Madhu S, Mather HM, Keen H. Prevalence of known diabetes in an urban Indian environment: the Darya Ganj diabetes survey. Br Med J (Clin Res Ed). 1986 Aug 16;293(6544):423-4.
98 Vikram NK, Misra A, Dwivedi M, Sharma R, Pandey RM, Luthra K, Chatterjee A, Dhingra V, Jailkhani BL, Talwar KK, Guleria R. Correlations of C-reactive protein levels with anthropometric profile, percentage of body fat and lipids in healthy adolescents and young adults in urban North India. Atherosclerosis. 2003 Jun;168(2):305-13.
99 Vikram NK, Pandey RM, Misra A, Sharma R, Devi JR, Khanna N. Non-obese (body mass index < 25 kg/m2) Asian Indians with normal waist circumference have high cardiovascular risk.Nutrition Vol 19 No 6, 2003:503-509
100 Wander GS, Khurana SB, Gulati R, Sachar RK, Gupta RK, Khurana S, Anand IS. Epidemiology of coronary heart disease in a rural Punjab population--prevalence and correlation with various risk factors. Indian Heart J. 1994 Nov-Dec;46(6):319-23.
101 Wasir HS, Ramachandran R, Nath LM. Prevalence of hypertension in a closed urban community. Ind Heart J 1984;36: 250-53
102 WHO-Project on sentinel surveillance of Indian Industrial population 103 Zachariah MG, Thankappan KR, Alex SC, Sarma PS, Vasan RS. Prevalence, correlates,
awareness, treatment, and control of hypertension in a middle-aged urban population in Kerala. Indian Heart J. 2003 May-Jun;55(3):245-51.
104 Zargar AH, Masoodi SR, Laway BA, Khan AK, Wani AI, Bashir MI, Akhtar S. Prevalence of obesity in adults--an epidemiological study from Kashmir Valley of Indian Subcontinent. J Assoc Physicians India. 2000 Dec;48(12):1170-4.
105 Ramachandran A, Snehalatha C, Latha E, Satyavani K, Vijay V. Clustering of cardiovascular risk factors in urban Asian Indians. Diabetes Care. 1998 Jun;21(6):967-71.
106 Swami HM, Bhatia V, Gupta M, Bhatia SP, Sood A. Population based study of hypertension among the elderly in northern India. Public Health. 2002 Jan;116(1):45-9.
107 Kumar P Desai VK Kosambia JK. Prevalence of Hypertension amongst the employees of a mega industry of south Gujrat. Indian Journal of Community Medicine 2002 Jan-Mar;27(1):19-25.
108 Anand MP. Prevalence of hypertension amongst Mumbai executives.J Assoc Physicians India. 2000 Dec;48(12):1200-1.
109 Swami HM, Bhatia V, Gupta M, Bhatia SP, Sood A. Population based study of hypertension among the elderly in northern India. Public Health. 2002 Jan;116(1):45-9.
110 Community control of rheumatic fever and rheumatic heart disease. Report of ICMR task force study. ICMR, 1994, Pilot study on the feasibility of utilizing the existing school health services in Delhi for the control of RF/RHD. ICMR final report, 1990.
111 Grover A, Dhawan A, Iyengar SD, Anand IS, Wahi PL, Ganguly NK. Epidemiology of rheumatic fever and rheumatic heart disease in a rural community in northern India. Bull World Health Organ 1993; 71: 59–66
112 Padmavati S. Present status of rheumatic fever and rheumatic heart disease in India. Indian Heart J 1995; 47: 395–398
113 Avasthi G, Singh D, Singh C, Aggarwal SP, Bidwai PS, Avasthi R.Prevalence survey of rheumatic fever (RF) and rheumatic heart disease (RHD) in urban and rural school children in Ludhiana. Indian Heart J 1987; 39: 26–28
114 Patel DC, Patel NI, Patel JD, Patel SD. Rheumatic fever and rheumatic heart disease in school children of Anand. J Assoc Physicians India 1986; 34: 837–839
115 Lalchandani A, Kumar HRP, Alam SM. Prevalence of rheumatic fever and rheumatic heart disease in rural and urban school children of district Kanpur [Abstr]. Indian Heart 2000; 52: 672
116 Jose VJ, Gomathi M. Declining Prevalence of Rheumatic Heart Disease in Rural Schoolchildren in India: 2001–2002. Indian Heart J 2003; 55: 158–160
117 Deshpande J, Vaideeswar P, Amonkar G, Vasandani S. Rheumatic heart disease in the past decade: an autopsy analysis. Indian Heart J. 2002 Nov-Dec;54(6):676-80.
118 Routray SN. Has the Prevalence of Rheumatic Fever/Rheumatic Heart Disease Really Changed? A Hospital-Based Study. Indian Heart J 2003; 55: 152–157
119 Grover A, Vijayvergiya R, Thingam ST. Burden of Rheumatic and Congenital Heart Disease in India: Lowest Estimate Based on the 2001 Census. Indian Heart J 2002; 54: 104–107
120 Gupta SP, Khetrapaul NK. Incidence of acute myocardial infarction and sudden coronary death in Rohtak City. J Assoc Physicians India. 1981 May;29(5):365-72.
121 Trivedi DH, Sharma V, Pandya H, Arya RK, Mehta R, Bansal RK, Sharma A, Gandhi SP.Longitudinal epidemiological study of coronary heart disease in a rural population of Kheda district, Gujarat, India. Soz Praventivmed. 1996;41(6):373-9.
122 Chadha SL, Ramachandran K, Shekhawat S, Tandon R, Gopinath N. A 3-year follow-up study of coronary heart disease in Delhi.Bull World Health Organ. 1993;71(1):67-72.
123 Prabhakaran D, Shah P, Chaturvedi V, Ramakrishnan L, Manhapra A , Reddy KS. Cardiovascular risk factor prevalence among men in a large industry of North India. In press
124 Deepa R, Shanthirani CS, Premalatha G, Sastry NG, Mohan V. Prevalence of insulin resistance syndrome in a selected south Indian population--the Chennai urban population study-7 [CUPS-7].Indian J Med Res. 2002 Mar;115:118-27.
125 Gupta R, Deedwania PC, Gupta A, Rastogi S, Panwar RB, Kothari K. Prevalence of metabolic syndrome in an Indian urban population. Int J Cardiol. 2004 Nov;97(2):257-61.
126 Snehalatha C, Ramchandran A, Kapur A, Vijay V. Age-specific prevalence and risk associations for impaired glucose tolerance in urban southern Indian population. J Assoc Physicians India. 2003 Aug;51:766-9.
127 Ramachandran A, Snehalatha C, Vinitha R, Thayyil M, Kumar CK, Sheeba L, Joseph S, Vijay V. Prevalence of overweight in urban Indian adolescent school children. Diabetes Res Clin Pract. 2002 Sep;57(3):185-90.
128 Khadilkar VV, Khadilkar AV. Prevalence of obesity in affluent school boys in Pune. Indian Pediatr. 2004 Aug;41(8):857-8.
129 Augustine LF, Poojara RH. Prevalence of obesity, weight perceptions and weight control practices among urban college going girls. Indian Journal of Community Medicine Vol. XXVIII, No.4, Oct.-Dec, 2003: 187-190.
130 Vaz M, Bharathi AV. How sedentary are people in "sedentary" occupations? The physical activity of teachers in urban South India. Occup Med (Lond). 2004 Sep;54(6):369-72. Epub 2004 Sep 3.
131 Vaz M, Bharathi AV. Perceptions of the intensity of specific physical activities in Bangalore, South India: implications for exercise prescription. J Assoc Physicians India. 2004 Jul;52:541-4.
132 Abraham J, Rao PS, Inbaraj SG, Shetty G, Jose CJ. An epidemiological study of hemiplegia due to stroke in South India. Stroke. 1970 Nov-Dec;1(6):477-81
133 Gourie Devi. Neuroepidemiological study in semiurban and rural areas in South India. Oxford IBU Publishing Co 1987; 10-21
134 Kapoor SK Banerjee AK. Prevalence of common neurological diseases in a rural community of India. Ind J Comm Med 1989; 14:171-176
135 Bharucha NE, Bharucha EP, Bharucha AE, Bhise AV, Schoenberg BS.Prevalence of stroke in the Parsi community of Bombay. Stroke. 1988 Jan;19(1):60-2.
136 Kaul R, Motta A, Razdan S. Epidemiology of young strokes in rural Kashmir, India. Acta.Neuro.Scand. 1990;Vol.82:1-3
137 Razdan S, Kaul RL, Motta A, Kaul S, Bhatt RK. Prevalence and pattern of major neurological disorders in rural Kashmir (India) in 1986. Neuroepidemiology. 1994;13(3):113-9.
138 BanerjeeTK, Mukherjee CS, Sarkhel A. Stroke in the urban population of Calcutta--an epidemiological study. Neuroepidemiology. 2001 Aug;20(3):201-7.
139 Das SK, Sanyal K. Neuroepidemiology of major neurological disorders in rural Bengal. Neurology India 1996;44:47-58
140 Dhamija RK; Mittal S; Bansal BC. Trends in clinico-epidemiological correlates of stroke in the community Journal, Indian Academy of Clinical Medicine. 2000 Mar; 5(1): 27-31
141 Gourie-Devi M, Gururaj G, Satishchandra P, Subbakrishna DK. Prevalence of neurological disorders in Bangalore, India: a community-based study with a comparison between urban and rural areas. Neuroepidemiology. 2004 Nov-Dec;23(6):261-268
142 Dalal PM. Stroke in young and elderly. Risk factors and strategies for stroke prevention. JAPI 1997;45:125-31
143 Dalal PM.Strokes in the elderly: prevalence, risk factors & the strategies for prevention. Indian J Med Res. 1997 Oct;106:325-32.
144 Dhamija RK, Dhamija SB. Prevalence of stroke in rural community--an overview of Indian experience. J Assoc Physicians India. 1998 Apr;46(4):351-4.
145 Anand K, Chowdhury D, Singh KB, Pandav CS, Kapoor SK. Estimation of mortality and morbidity due to strokes in India. Neuroepidemiology. 2001 Aug;20(3):208-11.
146 Behera D, Malik SK. Chronic respiratory disease in Chandigarh teachers. Indian Journal of Chest Diseases and Allied Sciences 1987;29:25-8.
147 Ghosal AG, Ghosh A, Debnath NB, Saha AK. Smoking habits and respiratory symptoms: Observations among college students and professionals. Journal of the Indian Medical Association 1996;94:55-7.
148 Global Youth Tobacco Survey (GYTS) Country Factsheets, India (by year of completion and state). Centers for Disease Control and Prevention, Atlanta. Available from URL: http://www.cdc.gov/tobacco/global/GYTS.htm (GYTS/factsheets/pdf_files/india)(accessed on 30 September 2004).
149 International Institute for Population Sciences (IIPS).National Family Health Survey 1998-1999 (NFHS-2). Mumbai, India: IIPS; 2000.
150 Joshi RC, Madan RN, Brash AA. Prevalence of chronic bronchitis in an industrial population in North India. Thorax 1975;30:617.
151 Kumar A, Mohan U, Jain VC. Influence of some socio-demographic factors on smoking status of academicians. Indian Journal of Chest Diseases and Allied Sciences 1997;39:5-12.
152 Malaowalla AM, Silverman S, Mani NJ, Bilimoria KF,Smith LW. Oral cancer in 57,518 industrial workers of Gujarat, India. A prevalence and follow-up survey.Cancer 1976;37:1882-6.
153 Mehta FS, Shroff BC, Gupta PC, Daftary DK. Oral leukoplakia in relation to tobacco habits. Oral Surgery, Oral Medicine, Oral Pathology, Oral Radiology 1972;34:426-33.
154 National Sample Survey Organization (NSSO). A note on consumption of tobacco in India: NSS 50th Round, 1993-94. Sarvekshana 1998 January-March; New Delhi: Department of Statistics, Ministry of Planning, Government of India; 1998:76-89.
155 Pandey GK, Raut DK, Hazra S, Vajpayee A, Pandey A, Chatterjee P. Patterns of tobacco use amongst school teachers. Indian Journal of Public Health 2001;45:82-7.
156 Rani M, Bonu S, Jha P, Nguyen SN, Jamjoum L. Tobacco use in India: Prevalence and predictors of smoking and chewing in a national cross-sectional household survey. Tobacco Control 2003;12:e4. Available from URL: http://wwwtobaccocontrol.com/cgi/content/full/12/4/e4 (accessed on 17 August 2004).
157 Sarkar D, Dhand R, Malhotra A, Malhotra S, Sharma BK. Perceptions and attitude towards tobacco smoking among doctors in Chandigarh. Indian Journal of Chest Diseases and Allied Sciences 1990;32:1-9.
158 Sinha DN, Gupta PC, Pednekar MS. Tobacco use among school personnel in eight north-eastern states of India. Indian Journal of Cancer 2003;40:3-14.
159 Sinha DN, Gupta PC. Tobacco use among media personnel in Patna. Lifeline WHO-SEARO Newsletter 2000;8:5-6.

160 Srivastava A, Pal H, Dwivedi SN, Pandey A, Pande JN. National Household Survey of drug and alcohol abuse in India (NHSDAA). New Delhi: Report accepted by the Ministry of Social Justice and Empowerment, Government of India and UN Office for Drug and Crime, Regional Office of South Asia; 2004.
161 Stanley K, Stjernsward J. A survey on the control of oral cancer in India. Indian Journal of Cancer 1986;23:105-11.
162 Yunus M, Khan Z. A baseline study of tobacco use among the staff of Aligarh Muslim University, Aligarh, India. Journal of the Royal Society of Health 1997;17:359-65.

Manuscripts developed at the Scientific Secretariat of IC Health, New Delhi.
Contributors:
V.S.Ajay, Ruby Gupta, Jeemon Panniyammakkal, Vivek Chaturvedi, Dorairaj Prabhakaran, K Srinath Reddy.
With support from Ministry of Health and Family Welfare, Government of India and World Health Organization


![Cardiovascular disease [autosaved]](https://img.pdfslide.us/doc/110x75/554b2ab7b4c905d3088b4ab0/cardiovascular-disease-autosaved.jpg)