Embed Size (px)
Citation preview

NATIONAL BUREAU OF STANDARDS REPORT
1x659
VISUAL RANGES OF FOUR OBSTRUCTION LIGHTS
by
F. C. BreckenridgeRobert T. Vaughan
NBS Test 21A-2/S6
to
Airways Sigineering DivisionOffice of Federal Airways
Civil Aeronautics AdministrationDepartment of Commerce
U. S. DEPARTMENT OF COMMERCE
NATIONAL BUREAU OF STANDARDS

U. S. DEPARTMENT OF COMMERCESinclair Weeks, Secretary
NATIONAL BUREAU OF STANDARDSA. V. Astin, Director
THE NATIONAL BUREAU OF STANDARDS
The scope of activities of the National Bureau of Standards is suggested in the following listing
of the divisions and sections engaged in technical work. In general, each section is engaged in
specialized research, development, and engineering in the field indicated by its title. A brief
description of the activities, and of the resultant reports and publications, appears on the inside
of the back cover of this report.
Electricity and Electronics. Resistance and Reactance. Electron Tubes. Electrical Instru-
ments. Magnetic Measurements. Process Technology. Engineering Electronics. Electronic
Instrumentation. Electrochemistry.
Optics and Metrology. Photometry and Colorimetry. Optical Instruments. Photographic
Technology. Length. Engineering Metrology.
Heat and Power. Temperature Measurements. Thermodynamics. Cryogenic Physics.
Engines and Lubrication. Engine Fuels.
Atomic and Radiation Physics. Spectroscopy. Radiometry. Mass Spectrometry. Solid
State Physics. Electron Physics. Atomic Physics. Nuclear Physics. Radioactivity. X-rays.
Betatron. Nucleonic Instrumentation. Radiological Equipment. AEC Radiation Instruments.
Chemistry. Organic Coatings. Surface Chemistry. Organic Chemistry. Analytical Chemistry.
Inorganic Chemistry. Electrodeposition. Gas Chemistry. Physical Chemistry. Thermo-
chemistry. Spectrochemistry. Pure Substances.
Mechanics. Sound. Mechanical Instruments. Fluid Mechanics. Engineering Mechanics.
Mass and Scale. Capacity, Density, and Fluid Meters. Combustion Controls.
Organic and Fibrous Materials. Rubber. Textiles. Paper. Leather. Testing and Specifica-
tions. Polymer Structure. Organic Plastics. Dental Research.
Metallurgy. Thermal Metallurgy. Chemical Metallurgy. Mechanical Metallurgy. Corrosion.
Mineral Products. Porcelain and Pottery. Glass. Refractories. Enameled Metals. Con-
creting Materials. Constitution and Microstructure.
Building Technology. Structural Engineering. Fire Protection. Heating and Air Con-
ditioning. Floor, Roof, and Wall Coverings. Codes and Specifications.
Applied Mathematics. Numerical Analysis. Computation. Statistical Engineering. Mathe-
matical Physics.
Data Processing Systems. Components and Techniques. Digital Circuitry. Digital Systems.
Analogue Systems.
Cryogenic Engineering. Cryogenic Equipment. Cryogenic Processes. Properties of Materials.
Gas Liquefaction.
Radio Propagation Physics. Upper Atmosphere Research. Ionospheric Research. RegularPropagation Services.
Radio Propagation Engineering. Frequency Utilization Research. Tropospheric PropagationResearch.
Radio Standards. High Frequency Standards. Microwave Standards.
• Office of Basic Instrumentation # Office of Weights and Measures

NATIONAL BUREAU OF STANDARDS REPORTNBS PROJECT NBS REPORT
0201-30-2328 April 1956 Ii659
VISUAL RANGES OF FOUR OBSTRUCTION LIGHTS
by
F. C. BreckenridgeRobert T. Vaughan
NBS Test 21A-2/56
to
Airways Engineering DivisionOffice of Federal Airways
Civil Aeronautics AdministrationDepartment of Commerce
<NBS>
U. S. DEPARTMENT OF COMMERCE
NATIONAL BUREAU OF STANDARDS
The publication, reprinting, or reproduction of this report in any form, either in whole or in part, is prohibited
unless permission Is obtained in writing from theOffice of theDirector, National Bureau of Standards, Washington
25, D, C. Such permission is not needed, however, by a Government agency for which a report has been specifi-
cally prepared if that agency wishes to reproduce additional copies of that particular report for its own use,


Visual Ranges of Four Obstruction Lights
F. Co BreckenridgeRobert To Tfeughan
SCOPE
This report gives the results of a comparative study of the visualranges of two catenary neon obstruction lights, a neon light operated bya transformer, and a conventional incandescent obstruction light. Thecandlepower values used for this study are those presented in two previousreports
:
NBS Report hhh1, Performance Characteristics of Three WashingtonState College Neon Obstruction Lights.
NBS Report h5h2, Candlepower and Color Characteristics of a DoubleObstruction Light.
The study has been limited to nighttime use because it has already beenshown in Report khhl that the large catenary unit even at its full in-tensity is seen no better than the transmission line in the daytime.
COMPUTATION OF VISUAL RANGES
The conversion of the candlepower values into visual range values hasbeen carried out in accordance with the conventionally accepted formulaknown as Allard* s law:
e0 = ii^/d2 (1)
E0 = Threshold illuminanceI = Candlepower toward observerT = Transmissivity of the atmosphereD = Distance of light from observer
The righthand member of this equation, if all its constituentqualities are known, gives the density of light flux, that is, the il-luminance, at the observer* s position. This member may be derived mathe-matically from the inverse square law, the definition of transmissivity,and the assumption that the atmosphere is uniform. While the last isnever strictly true, it is the only assumption practicable and it leadsto calculated values which approximate conditions in service. Allardfound that the illuminance, E, at which lights became just visible atnight was substantially constant. Later studies have found it to increasewith background brightness and decrease as the dark adaptation of theobserver improves. For the case of an airplane pilot, allowance mustalso be made for the limited attention a pilot can concentrate on hislookout for obstruction lights. The value used for these computations is:
E0 = 0.5 mile candles for night conditions.

>
-2-
This value was proposed by Toulmin-Smith and Green (Aircraft Engineering
3, 12, 1931) as a practical threshold for the background brightness anddark adaptation representative of a pilot*s situation. The tests made bythis Bureau for the C.A.A. at Nantucket indicated this value was reason-able (illuminating Engineering UO, 8l6, 19h$)» Although the value variesgreatly with the conditions prevailing, the exact value used for -the com-putations does not seriously affect the relative distances to which theseveral obstruction lights can be seen.
To carry out the computations it is also necessary to select valuesof T but since it is customary in regulations to express the transparencyof the atmosphere in terms of meteorological visibility, rather thantransmissivity, it is desirable to base our selection of T on typicalvalues of meteorological visibility. The values of T used in this studyhave been calculated from (1) with the following as sump ticns
:
D-j_ = 10 miles, typical of clear weather.
D2 = 3 miles, minimum visibility for visual flight rules.
« 1 mile, a somewhat restricted visibility.
I = 2$ candles.
E0 = 0.1 mile candles, threshold for meteorological observer.
It will be noted that the value of Eq the weather observer islower than the value used for the pilot. This is because of the betterdark adaptation and opportunity for concentration of the meteorologist.
When the values given above are substituted in (1), the followingvalues of T are obtained:
Tx = 0.9121*
t2 = 0.3302
T3 = 0.00U0
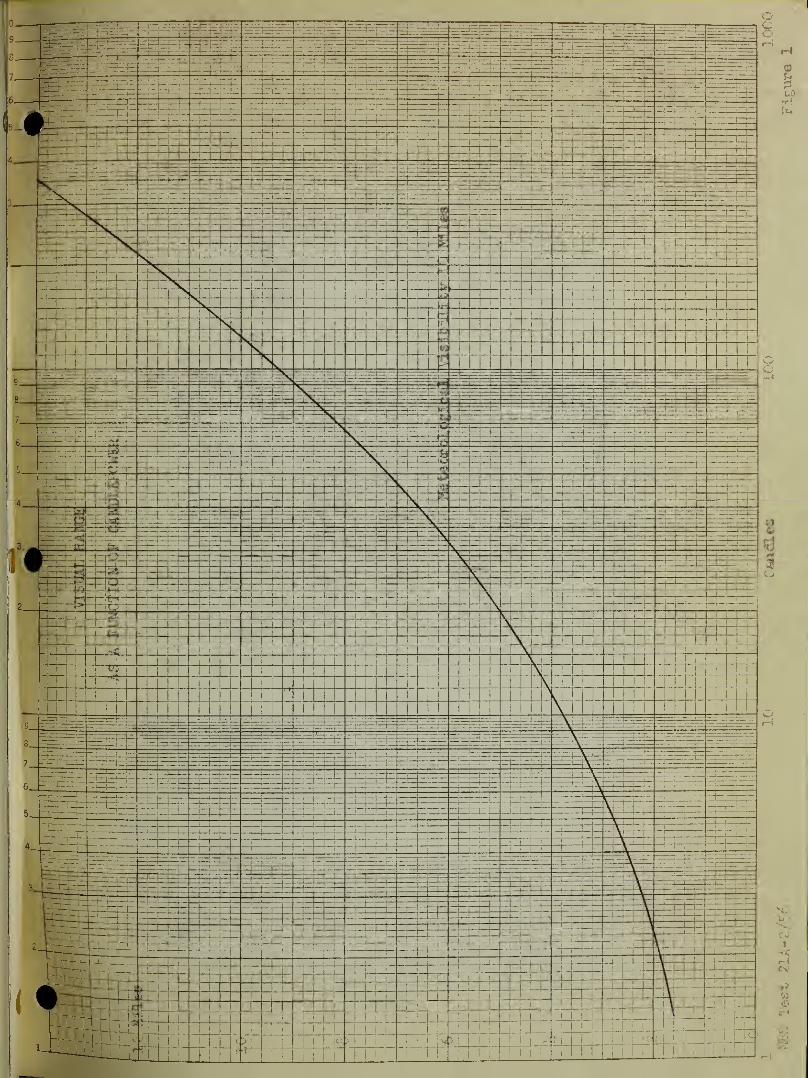
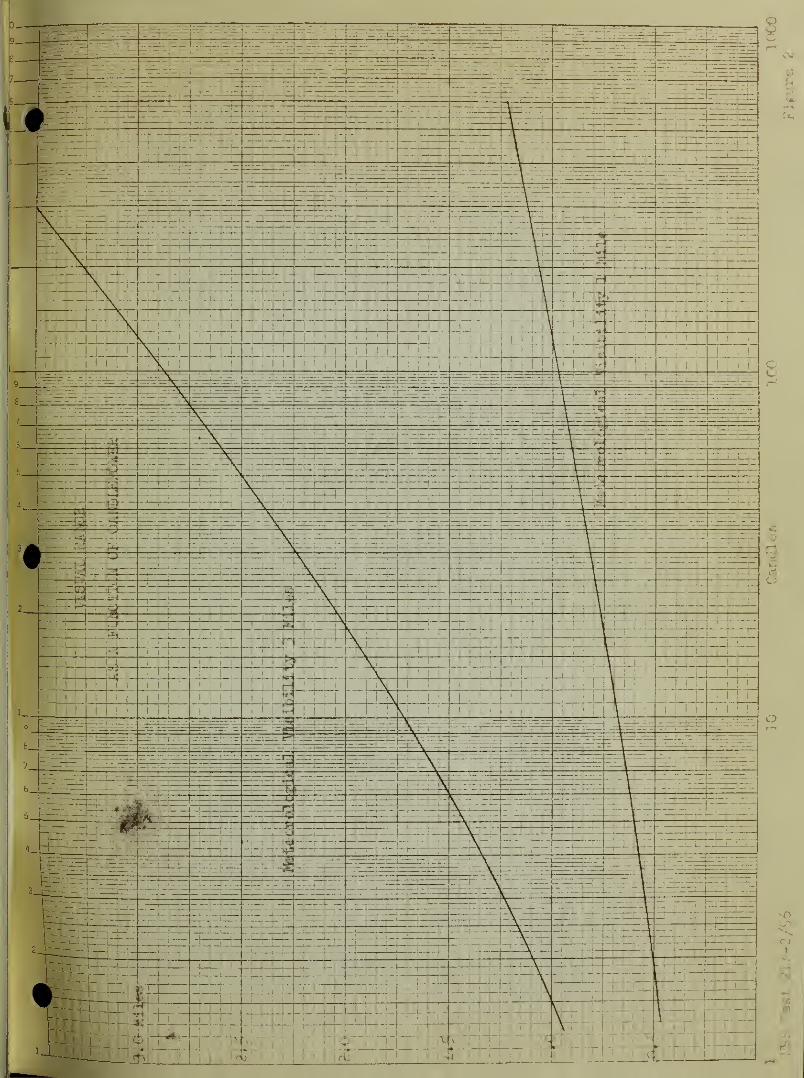
The laboratory measurements of candlepower give the values of I fordifferent directions so that with the values of T and E0 selected as statedabove the values of D for each direction are determined. There is, however,no simple method of solving (1) for D. This difficulty is overcome by pre-paring curves showing I as a function of D for the values of T listed abovesince the value of I may be readily computed for assumed values of D and T.
These curves are then used to read the values of D corresponding to thevalues of I taken from the previous reports. The curves used for this
conversion are given in Figures 1 and 2.

H|B

-3-
SCOPE OF COMPARISONS
A number of -variants affect the visual ranges of both the neon andincandescent lights. The ones listed below are included in the presentcomparison
:
Variation in candlepower in both azimuth and vertical angles
;
affects all units.Variation of atmospheric transmissivity ; affects all units.Variation with transmission line current; affects both catenary unitsbut measured values are available for the large catenary unit only.
Variation from lamp to lamp; affects all units, information availablefor two large catenary lamps and three incandescent lamps.
Variation with type of lens; affects incandescent unit only, valuesavailable for two -types of lenses.
Variation with color; affects incandescent unit only, limits indic-ated
by the color specifications; see discussion in Report NBS h5k2.
It is not feasible to prepare visual-range curves for all combinationsof these variants. It has, therefore, been necessary to select cases in sucha way as to give as good a comparison as practicable of the average visualranges of the neon and incandescent lights. Since different variants affectthe four -types of lights, it has been necessary to be somewhat arbitrary inthe selection of variants to be included in each figure.
The general plan has been to compare first the azimuthal and verticalvariations of the visual ranges for all the lights for favorable conditionssuch as 10-mile visibility with the maximum line currents for the catenaryunits and pale-limit glassware for the incandescent unit. Average curveshave then been developed from the same candlepower values to serve as abasis for comparing the visual ranges of the lights for less favorableconditions.
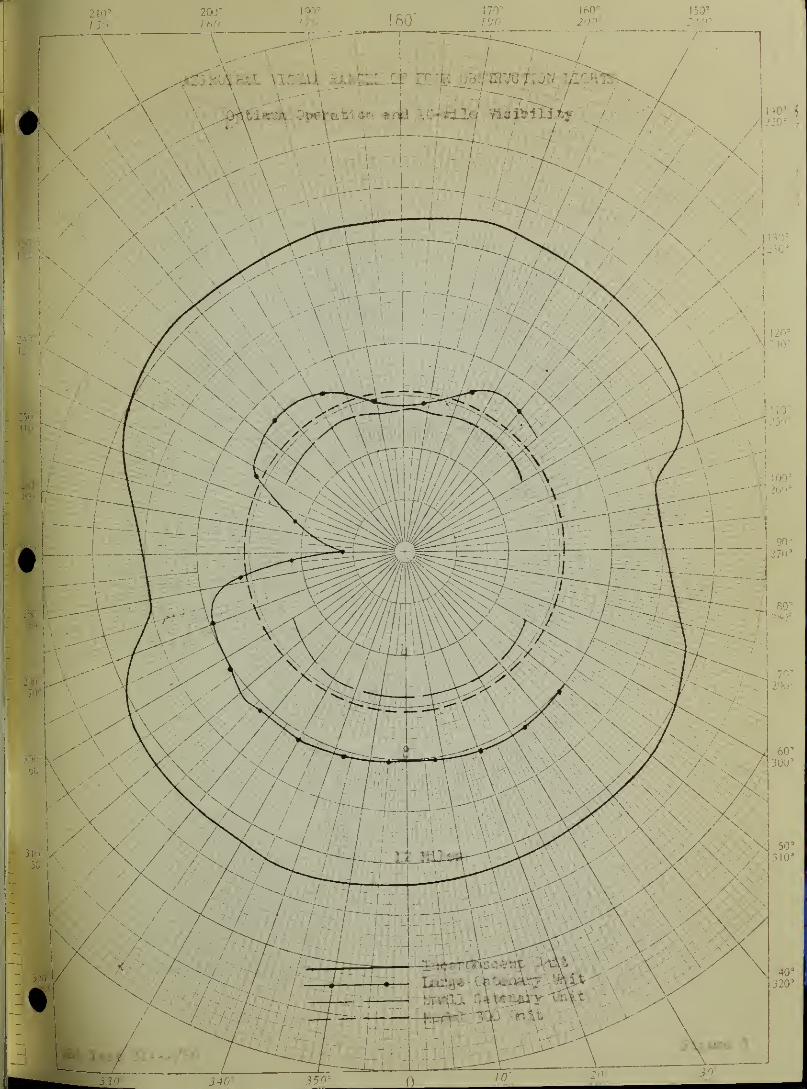
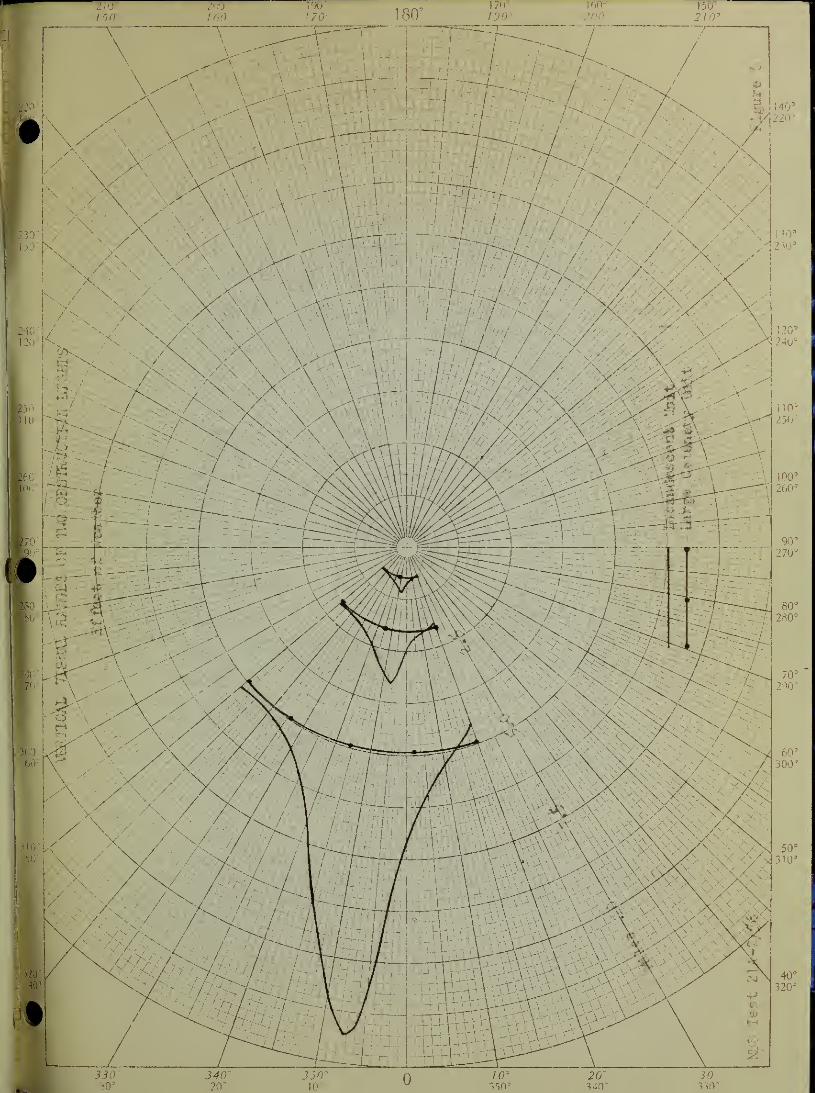
AZIMUTHAL LIMITS OF VISUAL RANGE
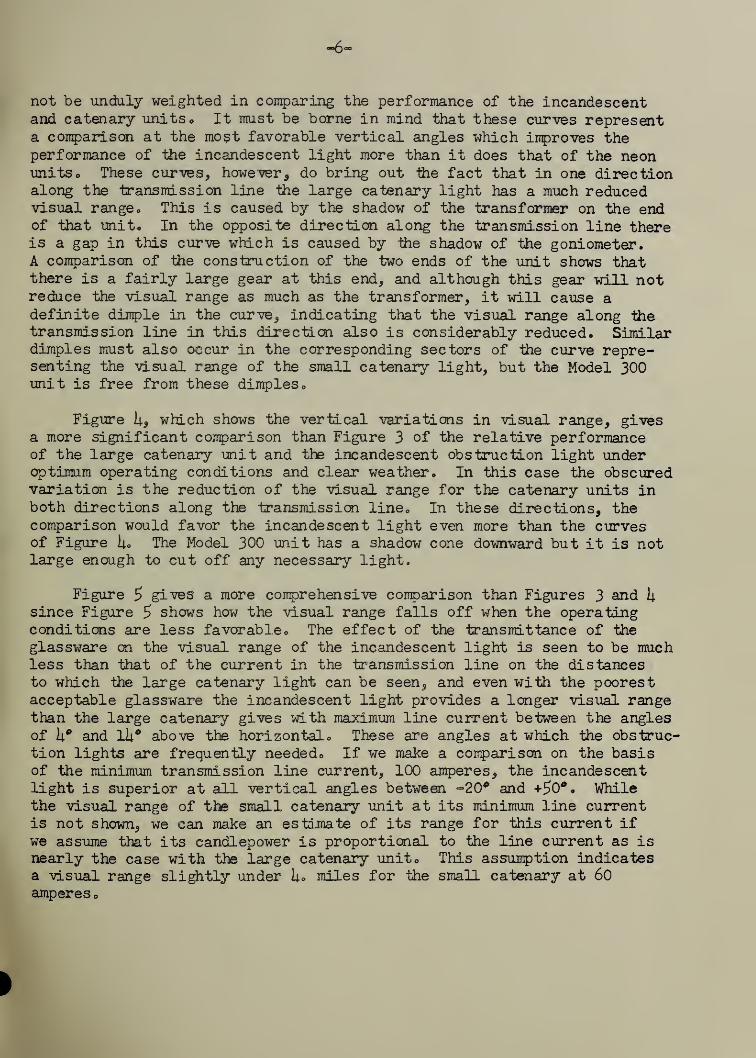
The first comparison (Figure 3) shows how the visual ranges of each ofthe lights varies with azimuth under optimum conditions. These assume, as
stated above, an atmosphere having 10-mile visibility, a current of 1000amperes In the transmission line for the large catenary unit and 1?0 amperesfor the small catenary unit, and pale-limit glassware on the incandescentlight. The curves far the two catenary units have been oriented as if thetransmission line extended horizontally across the center of the figure.It happened in the case of the large catenary unit that lamp A has longerranges than lamp B when seen from the unobstructed side and shorter rangesthan B when seen from the obstructed side. The two half curves for lamp Ahave, therefore, been used to represent the variations of visual range ofthis unit as seen from different directions under optimum conditions andthese have been shown in the figure on the near and far sides of the axis.In the case of the incandescent light, which has two lenses, lens A gave

, = 1 1 I I
,
.
I
.
-It-
the better values but even these intensities do not represent optimmoperation. It has been necessary to multiply them by the ratio 5/3* toobtain the intensity to be expected with pale-limit glassware which hasbeen taken as the nearest equivalent to operation with a maximum trans-mission line current. Since this unit uses two lamps and two lenses,
each of which is blocked off by the other at certain angles, the distri-bution of visual ranges for this light has been based upon a candlepowercurve obtained by adding the measured distribution values to the valuesfor the same curve rotated 180®. This rotation simulates the second lenswhich has its shadow in the opposite direction from the first.
Figure 3 also shows the horizontal limits of visual range for thesmall catenary light and the Model 300 neon light which is the transformeroperated neon unit. The curve for the Model 300 unit corresponds to opera-tion at 117 volts. In the case of the small catenary unit the design is
symmetrical, neither side being obstructed more than the other. The candle-power of the Model 300 unit is uniform except for a small periodic varia-tion caused by shadows of the rods in the guard. When the candlepower valueswere converted to visual ranges, the departure of the shadows from the
average was approximately 1% at its maximum. This was considered unimportant.
VERTICAL LIMITS OF VISUAL RANGE
For the determination of the vertical limits of visual range, onlythose angles between -20* and +50° were considered of importance. Exceptfor helicopters there can be little utility in seeing obstruction lightsoutside of these angles since airplanes under control do not glide downat angles greater than 50* nor climb at angles greater than 20°.
The second comparison. Figure U, shows the vertical limits of visualrange under the same conditions as were assumed in preparing Figure 3* Asin the case of the horizontal limits, the minimum and maximum curves forthe large catenary light are both based on the measurements for lamp Aand represent the obstructed and unobstructed sides respectively. For theincandescent light, the vertical minimum and maximum curves are based oninterior and exterior envelopes of the set of vertical curves shown inFigure 17 of Report NBS U5U2. In this case no attempt was made to allowfor the shadow but the candlepower curves were corrected to correspond topale-limit glassware and doubled to take account of the two lenses. Sincethe large variations in candlepower with azimuth which necessitate the twocurves for the large catenary and incandescent unit are not present in thecase of the smaller neon lights, these units are each represented by asingle curve and these two curves have been turned away from those for thelarge catenary light to avoid confusion with the minimum curve for thisunit.
* See Report NBS h5h2
.

-5-
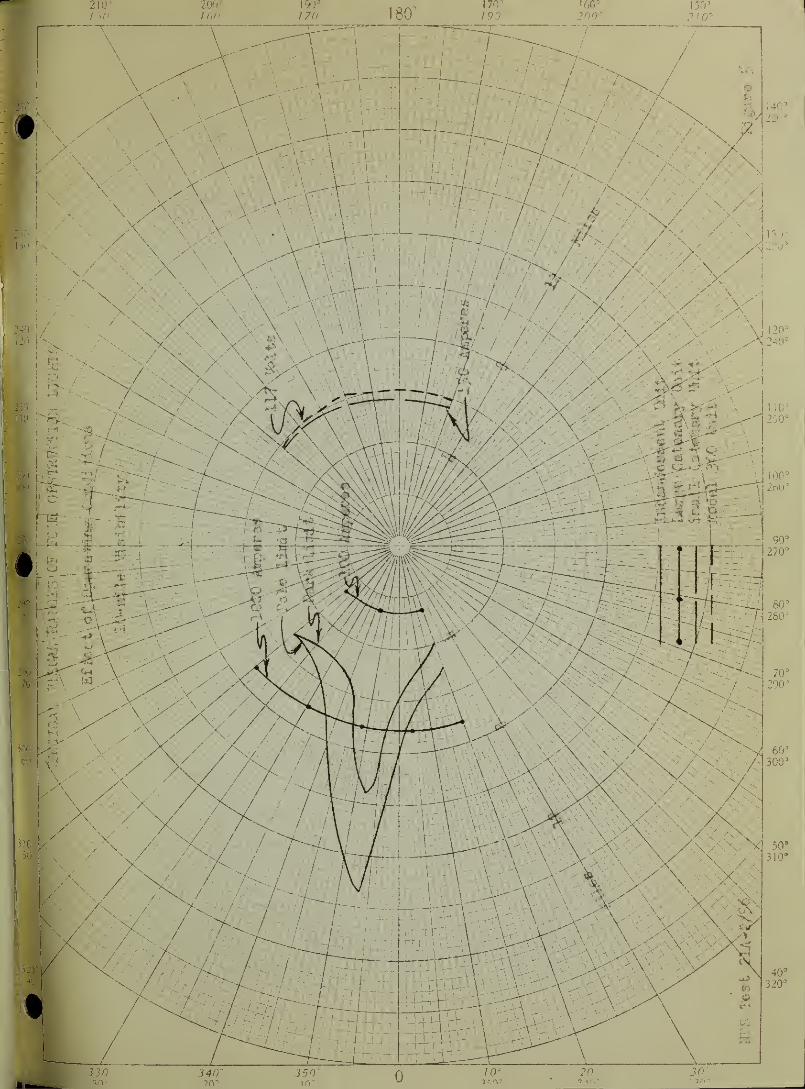
OPERATIONAL VARIATIONS
Figure 5 has been prepared to show the effects of operational varia-tions# It is based upon the candlepower "values used for Figure k but showsthe effect of -varying the current in the case of the large catenary lightand varying the glassware transmittance in the case of the incandescentlight# The curves for the most favorable operating conditions in this
figure are based on an average of the minimum and maximum candlepower valuesused for the same angles in the curves of Figure U# These represent theoperation of the large catenary unit on a transmission line carrying 1000amperes and the incandescent unit fitted with pale-limit glassware. Torepresent the other extreme of operating conditions, the candlepower valuesunderlying the curves for favorable operating conditions have been multipliedby suitable factors# In the case of the catenary unit, the factor wasselected to give candlepawers corresponding to operation of the catenarylight on a transmission line carrying only 100 amperes# For the incandes-cent light the minimum operating condition has been based on lens (B), whichwas considered as typical of minimum transmittance glassware. The values forlens B were multiplied by 2 to allow for a second lens# The intersectionof this curve with the curve for lens A at +5>0° is caused by differencesin their distributions. The curves included in this figure for the smallcatenary light and the Model 300 unit are identical with those in Figure Usince no measurements are available as to how these are affected by trans-mission line current.
EFFECTS OF HEATHER
The final comparison. Figure 6, shows the effects of the weather.These curves again are based on average operating conditions. For the largecatenary unit this was considered to be operation on a transmission line
carrying U00 amperes# For the incandescent light an arithmetical averageof the candlepower used for the minimum and maximum range curves in Figure 5was taken as the basis for the visual ranges# The maximum curves in thisfigure represent weather characterized by 10-mile meteorological visibility,
as do all the curves of Figures 3, U* and 5# The other curves of Figure 6
are derived from the curves for the 10-mile visibility by multiplying the
candlepower values by factors to allow for the difference in transmissivitybetween 10-mile visibility and 3-mile and 1-mLle visibility, respectively.In the case of the large catenary light, it was also necessary to make asmall reduction amounting to approximately .1 mile in the visual rangevalues for 1-mile visibility in order to allow for the size of the unitwhich is large enough so that the light is not as effective as if it camefrom a point source#
COMPARISON OF VISUAL RANGES
The azimuthal distribution of visual ranges shown in Figure 3 should

I; £f_t,'i taw e«U r
*6“
not be unduly weighted in comparing the performance of the incandescentand catenary units o It must be borne in mind that these curves representa con^arison at the mo^t favorable vertical angles which improves theperformance of the incandescent light more than it does that of the neonunits o These curves, however* do bring out the fact that in one directionalong the transmission line the large catenary light has a much reducedvisual range o This is caused by the shadow of the transformer on the endof that unit. In the opposite direction along the transmission line thereis a gap in this curve which is caused by the shadow of the goniometer.A comparison of the construction of the two ends of the unit shows thatthere is a fairly large gear at this end, and although this gear will notreduce the visual range as much as the transformer, it will cause adefinite dimple in the curve, indicating that the visual range along thetransmission line in this direction also is considerably reduced. Similardimples must also occur in the corresponding sectors of the curve repre-senting the visual range of the small catenary light, but the Model 300unit is free from these dimples.
Figure U, which shows the vertical variations in visual range, givesa more significant comparison than Figure 3 of the relative performanceof the large catenary unit and the incandescent obstruction light underoptimum operating conditions and clear weather. In this case the obscuredvariation is the reduction of the visual range for the catenary units inboth directions along the transmission line. In these directions, thecomparison would favor the incandescent light even more than the curvesof Figure The Model 300 unit has a shadow cone downward but it is notlarge enough to cut off any necessary light.
Figure 5 gives a more comprehensive comparison than Figures 3 and bsince Figure 5 shows how the visual range falls off when the operatingconditions are less favorable. The effect of the transmittance of the
glassware on the visual range of the incandescent light is seen to be muchless than that of the current in the transmission line on the distancesto which the large catenary light can be seen, and even with the poorestacceptable glassware the incandescent light provides a longer visual rangethan the large catenary gives with maximum line current between the anglesof k° and lU° above the horizontal. These are angles at which the obstruc-tion lights are frequently needed. If we make a comparison on the basisof the minimum transmission line current, 100 amperes, the incandescentlight is superior at all vertical angles between -20* and +50*. Whilethe visual range of the small catenary unit at its minimum line currentis not shown, we can make an estimate of its range for this current ifwe assume that its candlepower is proportional to the line current as isnearly the case with the large catenary unit. This assumption indicatesa visual range slightly under U. miles for the small catenary at 60amperes
.


-7-
The final comparisons of Figure 6, which are based upon as nearlynormal operating conditions as we could select, show that in all weathersthe incandescent light is superior at all angles from -lli® to +50®. Asalready pointed out, except for helicopters, aircraft under control do
not approach obstructions at angles outside of these limits. Figure 6
also shows how rapidly the visual ranges are reduced as the weather deteri-orates •
All the comparisons indicate that, if there is a choice as regardsthe obstruction lights to be used for airplanes, the incandescent unitswill afford a greater protection than any of the neon units. Since, however,
an incandescent light cannot be used on the catenary of a transmission line,
the use of one of the catenary neon lights will give some protection eventhough it is somewhat less than that provided by the incandescent lights.Their use for this purpose, therefore, appears to warrant considerationfrom the standpoint of visibility. The Model 300 unit appears to havemerit for use in locations where helicopters are landing and taking off.
The small catenary light gives better candlepowers in proportion toits size and line current than the large one. This is partly due to the
smaller range of currents for which it is designed. However, this suggeststhat a larger unit similar to the small one might give high candlepowervalues than either of them. Since a helical tube could not be installedconcentric with a transmission line without opening the line, such a unitmight be designed with the transformer concentric with the line and the
tube supported below it. This construction would also have the advantagethat the ends could be less obscured than they are in either of the presentdesigns. This type of unit could also be designed for two or three con-centric tubes with separate secondary windings.

-&1K


340 = 3509
170°
/ 90 ®
16015
200°
60®
300®
80®
280®
no®,230 ®
\ 1 20c
/N 240=
140®
/1 220®
230®


200 =
160190
°
170150
°
210210
’
150° 180’ 170° 160 °
1 90 r> 2000
!40 3
220 3
130°
2 3 O'5
120’
240 ’
no 5
250°
1 00°
280 ’
90’
270 3
80°
280°
70’
290’
60 ’
300°
50°
310’

210 ’ 200 = 190 °,
170 160 ° 150*
J50'‘ 100 170 loU 190° 200c 210•
I40 3
130=
230’
120°
240°
100°
260 3
330w-
340 ’
?n°350c
in 2
2O'1 Ift?
30'
—I 5Oa
200'
! 60!f.0
3
200 °150
210
X 50‘
> 310‘
330 3 340 ° 350° n /0° 20° 30 0
30° 20- IQ3 v 330’ 340° 3X0°


THE NATIONAL BUREAU OF STANDARDS
Functions and Activities
The functions of the National Bureau of Standards are set forth in the Act of Congress, March
3, 1901, as amended by Congress in Public Law 619, 1950. These include the development and
maintenance of the national standards of measurement and the provision of means and methods
for making measurements consistent with these standards; the determination of physical constants
and properties of materials; the development of methods and instruments for testing materials,
devices, and structures; advisory services to Government Agencies on scientific and technical
problems; invention and development of devices to serve special needs of the Government; and the
development of standard practices, codes, and specifications. The work includes basic and applied
research, development, engineering, instrumentation, testing, evaluation, calibration services, and
various consultation and information services. A major portion of the Bureau’s work is performed
for other Government Agencies, particularly the Department of Defense and the Atomic Energy
Commission. The scope of activities is suggested by the listing of divisions and sections on the
inside of the front cover.
Reports and Publications
The results of the Bureau’s work take the form of either actual equipment and devices or
published papers and reports. Reports are issued to the sponsoring agency of a particular project
or program. Published papers appear either in the Bureau’s own series of publications or in the
journals of professional and scientific societies. The Bureau itself publishes three monthly peri-
odicals, available from the Government Printing Office: The Journal of Research, which presents
complete papers reporting technical investigations; the Technical News Bulletin, which presents
summary and preliminary reports on work in progress; and Basic Radio Propagation Predictions,
which provides data for determining the best frequencies to use for radio communications throughout
the world. There are also five series of nonperiodical publications: The Applied Mathematics
Series, Circulars, Handbooks, Building Materials and Structures Reports, and Miscellaneous
Publications.
Information on the Bureau’s publications can be found in NBS Circular 460, Publications of
the National Bureau of Standards ($1.25) and its Supplement ($0.75), available from the Superin-
tendent of Documents, Government Printing Office. Inquiries regarding the Bureau’s reports and
publications should be addressed to the Office of Scientific Publications, National Bureau of
Standards, Washington 25, D. C.

NBS