Embed Size (px)
Citation preview
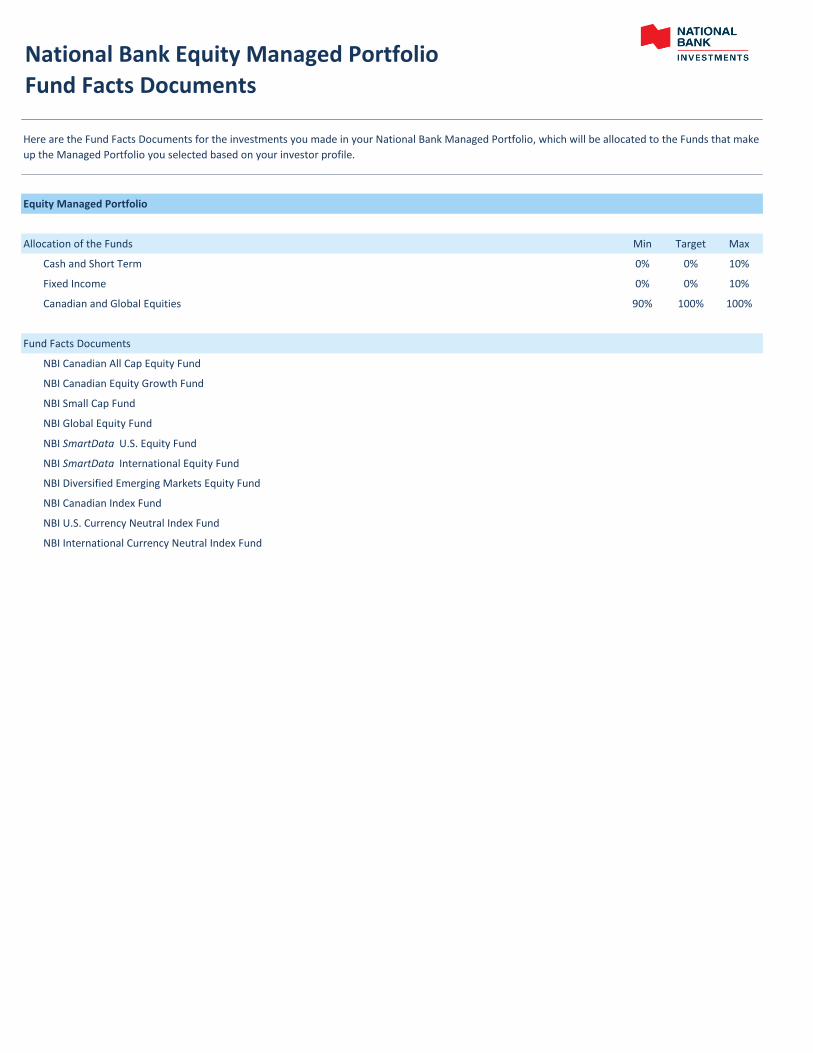
National Bank Equity Managed Portfolio
Fund Facts Documents
Equity Managed Portfolio
Allocation of the Funds Min Target Max
Cash and Short Term 0% 0% 10%
Fixed Income 0% 0% 10%
Canadian and Global Equities 90% 100% 100%
Fund Facts Documents
NBI Canadian All Cap Equity Fund
NBI Canadian Equity Growth Fund
NBI Small Cap Fund
NBI Global Equity Fund
NBI SmartData U.S. Equity Fund
NBI SmartData International Equity Fund
NBI Diversified Emerging Markets Equity Fund
NBI Canadian Index Fund
NBI U.S. Currency Neutral Index Fund
NBI International Currency Neutral Index Fund
Here are the Fund Facts Documents for the investments you made in your National Bank Managed Portfolio, which will be allocated to the Funds that make
up the Managed Portfolio you selected based on your investor profile.
FUND FACTSMay 14, 2019
NBI Canadian All Cap Equity FundInvestor SeriesThis document contains key information you should know about the NBI Canadian All Cap Equity Fund. You can find more detailed information in the fund’ssimplified prospectus. Ask your representative for a copy, contact the manager, National Bank Investments Inc. ("NBI"), at 1-888-270-3941 or send an email [email protected] or visit our website at www.nbinvestments.ca.Before you invest in any fund, consider how the fund would work with your other investments and your tolerance for risk.
Quick factsFund code: NBC885
Date series started: October 15, 2001
Total value of fund on March 31, 2019: $657.1 million
Management expense ratio (MER): 2.50%
Fund manager: National Bank Investments Inc. ("NBI")
Portfolio manager: CI Investments Inc.
Distribution: Net income and net realized capital gains for the year,December (automatically reinvested in additional securities,
unless the investor chooses differently).
Minimum investment: $500 (initial), $50 (additional), $25 (systematic)
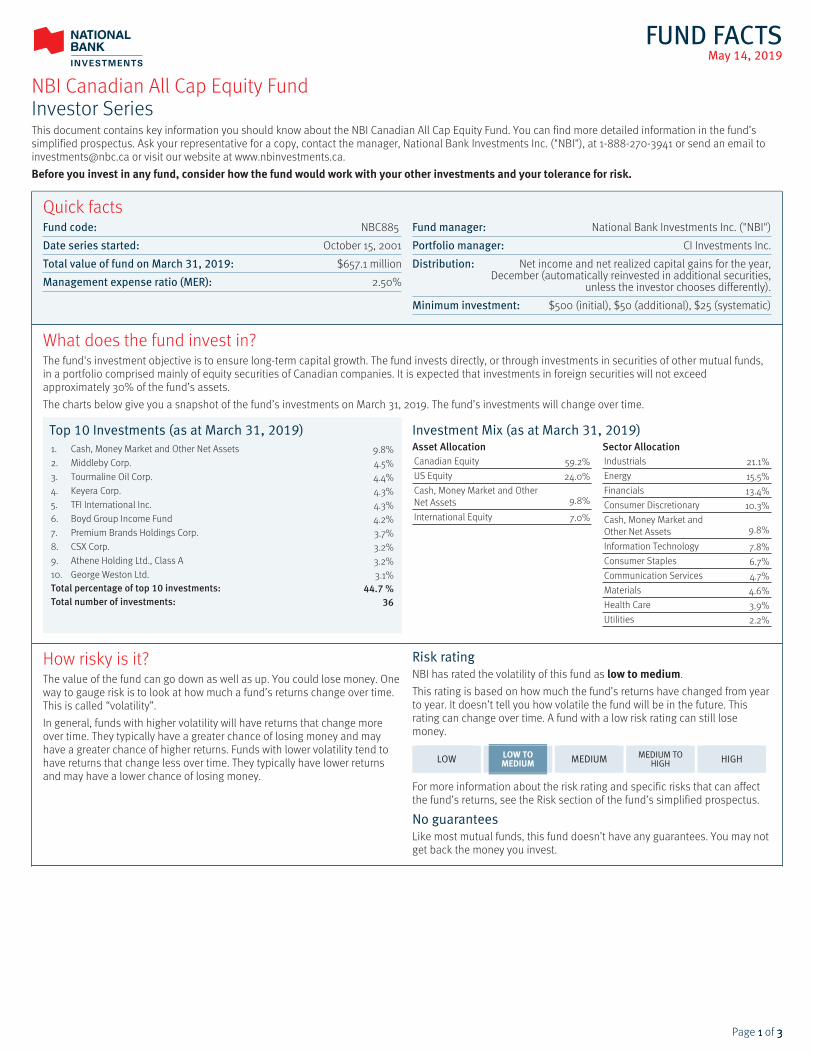
What does the fund invest in?The fund's investment objective is to ensure long-term capital growth. The fund invests directly, or through investments in securities of other mutual funds,in a portfolio comprised mainly of equity securities of Canadian companies. It is expected that investments in foreign securities will not exceedapproximately 30% of the fund’s assets.The charts below give you a snapshot of the fund’s investments on March 31, 2019. The fund’s investments will change over time.
Top 10 Investments (as at March 31, 2019)1. Cash, Money Market and Other Net Assets 9.8%2. Middleby Corp. 4.5%3. Tourmaline Oil Corp. 4.4%4. Keyera Corp. 4.3%5. TFI International Inc. 4.3%6. Boyd Group Income Fund 4.2%7. Premium Brands Holdings Corp. 3.7%8. CSX Corp. 3.2%9. Athene Holding Ltd., Class A 3.2%10. George Weston Ltd. 3.1%Total percentage of top 10 investments: 44.7 %Total number of investments: 36
Investment Mix (as at March 31, 2019)Asset AllocationCanadian Equity 59.2%US Equity 24.0%Cash, Money Market and OtherNet Assets 9.8%
International Equity 7.0%
Sector AllocationIndustrials 21.1%Energy 15.5%Financials 13.4%Consumer Discretionary 10.3%Cash, Money Market andOther Net Assets 9.8%
Information Technology 7.8%Consumer Staples 6.7%Communication Services 4.7%Materials 4.6%Health Care 3.9%Utilities 2.2%
How risky is it?The value of the fund can go down as well as up. You could lose money. Oneway to gauge risk is to look at how much a fund’s returns change over time.This is called “volatility”.In general, funds with higher volatility will have returns that change moreover time. They typically have a greater chance of losing money and mayhave a greater chance of higher returns. Funds with lower volatility tend tohave returns that change less over time. They typically have lower returnsand may have a lower chance of losing money.
Risk ratingNBI has rated the volatility of this fund as low to medium.This rating is based on how much the fund’s returns have changed from yearto year. It doesn’t tell you how volatile the fund will be in the future. Thisrating can change over time. A fund with a low risk rating can still losemoney.
LOW LOW TOMEDIUM MEDIUM MEDIUM TO
HIGH HIGH
For more information about the risk rating and specific risks that can affectthe fund’s returns, see the Risk section of the fund’s simplified prospectus.
No guaranteesLike most mutual funds, this fund doesn’t have any guarantees. You may notget back the money you invest.
Page 1111 of 3333
NBI Canadian All Cap Equity FundInvestor Series
How has the fund performed?This section tells you how Investor Series securities of the fund have performed over the past 10 years. Returns are after expenses have been deducted.These expenses reduce the funds' returns.
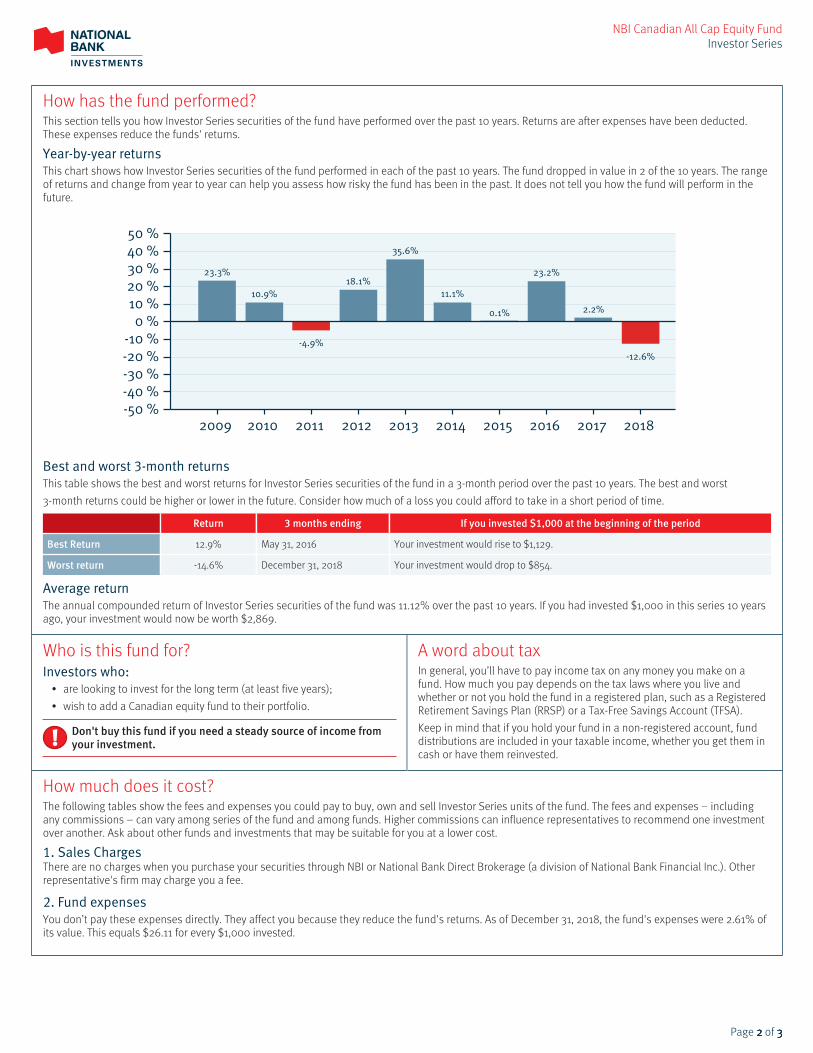
Year-by-year returnsThis chart shows how Investor Series securities of the fund performed in each of the past 10 years. The fund dropped in value in 2 of the 10 years. The rangeof returns and change from year to year can help you assess how risky the fund has been in the past. It does not tell you how the fund will perform in thefuture.
23.3%
10.9%
-4.9%
18.1%
35.6%
11.1%
0.1%
23.2%
2.2%
-12.6%
-50 % -40 % -30 % -20 % -10 %
0 % 10 % 20 % 30 % 40 % 50 %
2009 2010 2011 2012 2013 2014 2015 2016 2017 2018
Best and worst 3-month returnsThis table shows the best and worst returns for Investor Series securities of the fund in a 3-month period over the past 10 years. The best and worst3-month returns could be higher or lower in the future. Consider how much of a loss you could afford to take in a short period of time.
Return 3 months ending If you invested $1,000 at the beginning of the period
Best Return 12.9% May 31, 2016 Your investment would rise to $1,129.
Worst return -14.6% December 31, 2018 Your investment would drop to $854.
Average returnThe annual compounded return of Investor Series securities of the fund was 11.12% over the past 10 years. If you had invested $1,000 in this series 10 yearsago, your investment would now be worth $2,869.
Who is this fund for?Investors who:
• are looking to invest for the long term (at least five years);• wish to add a Canadian equity fund to their portfolio.
Don't buy this fund if you need a steady source of income fromyour investment.
A word about taxIn general, you’ll have to pay income tax on any money you make on afund. How much you pay depends on the tax laws where you live andwhether or not you hold the fund in a registered plan, such as a RegisteredRetirement Savings Plan (RRSP) or a Tax-Free Savings Account (TFSA).Keep in mind that if you hold your fund in a non-registered account, funddistributions are included in your taxable income, whether you get them incash or have them reinvested.
How much does it cost?The following tables show the fees and expenses you could pay to buy, own and sell Investor Series units of the fund. The fees and expenses – includingany commissions – can vary among series of the fund and among funds. Higher commissions can influence representatives to recommend one investmentover another. Ask about other funds and investments that may be suitable for you at a lower cost.
1. Sales ChargesThere are no charges when you purchase your securities through NBI or National Bank Direct Brokerage (a division of National Bank Financial Inc.). Otherrepresentative's firm may charge you a fee.
2. Fund expensesYou don’t pay these expenses directly. They affect you because they reduce the fund's returns. As of December 31, 2018, the fund's expenses were 2.61% ofits value. This equals $26.11 for every $1,000 invested.
Page 2222 of 3333

NBI Canadian All Cap Equity FundInvestor Series
How much does it cost? (cont’d)
Annual rate (as a % of the fund’s value)
Management expense ratio (MER)This is the total of the fund’s management fee (including the trailing commission) and operating expenses (includingfixed rate administration fee). NBI waived some of the fund's expenses. If it had not done so, the MER would have beenhigher.
2.50%
Trading expense ratio (TER)These are the fund's trading costs.
0.11%
Fund Expenses 2.61%
More about the trailing commissionThe trailing commission is an ongoing commission. It is paid for as long as you own the fund. It is for the services and/or advice that your representativeand their firm provide to you.NBI pays the trailing commission to your representative’s firm. It is paid from the fund’s management fee and is based on the value of your investment. Therate for this series of the fund is up to 1.00% of the value of your investment each year. This equals $10.00 each year for every $1,000 invested.
3. Other feesYou may have to pay other fees when you buy, hold, sell, switch or convert securities of the fund.
Fee What you pay
Short-term trading fee 2% of the value of the securities you redeem or switch within 30 days of purchase may be charged by NBI. This fee goes to the fund.
Other fees Registered Account termination fee, only if the registered investment account is with NBI. $100
What if I change my mind?Under the securities law in some provinces and territories, you have theright to:
• withdraw from an agreement to buy mutual fund securities within twobusiness days after you receive a simplified prospectus or Fund Factsdocument; or
• cancel your purchase within 48 hours after you receive confirmation ofthe purchase.
In some provinces and territories, you also have the right to cancel apurchase, or in some jurisdictions, claim damages, if the simplifiedprospectus, annual information form, Fund Facts document or financialstatements contain a misrepresentation. You must act within the time limitset by the securities law in your province or territory.For more information, see the securities law of your province or territory orask a lawyer.
For more informationContact your representative or NBI for a copy of the fund’s simplifiedprospectus and other disclosure documents. These documents and theFund Facts make up the fund’s legal documents.
National Bank Investments Inc.1155 Metcalfe Street, 5th floorMontreal, QuebecH3B 4S9
Phone: 514-871-2082Toll-free: 1-888-270-3941Email: investments@nbc.cawww.nbinvestments.cawww.nbinvestments.cawww.nbinvestments.ca
To learn more about investing in mutual funds, see the brochureUnderstanding mutual funds, which is available on the website of theCanadian Securities Administrators atwww.securities-administrators.ca.
Page 3333 of 3333
FUND FACTSMay 14, 2019
NBI Canadian Equity Growth FundInvestor SeriesThis document contains key information you should know about the NBI Canadian Equity Growth Fund. You can find more detailed information in the fund’ssimplified prospectus. Ask your representative for a copy, contact the manager, National Bank Investments Inc. ("NBI"), at 1-888-270-3941 or send an email [email protected] or visit our website at www.nbinvestments.ca.Before you invest in any fund, consider how the fund would work with your other investments and your tolerance for risk.
Quick factsFund code: NBC887
Date series started: September 30, 1987
Total value of fund on March 31, 2019: $906.5 million
Management expense ratio (MER): 2.47%
Fund manager: National Bank Investments Inc. ("NBI")
Portfolio manager: Mackenzie Financial Corporation
Distribution: Net income and net realized capital gains for the year,December (automatically reinvested in additional securities,
unless the investor chooses differently).
Minimum investment: $500 (initial), $50 (additional), $25 (systematic)
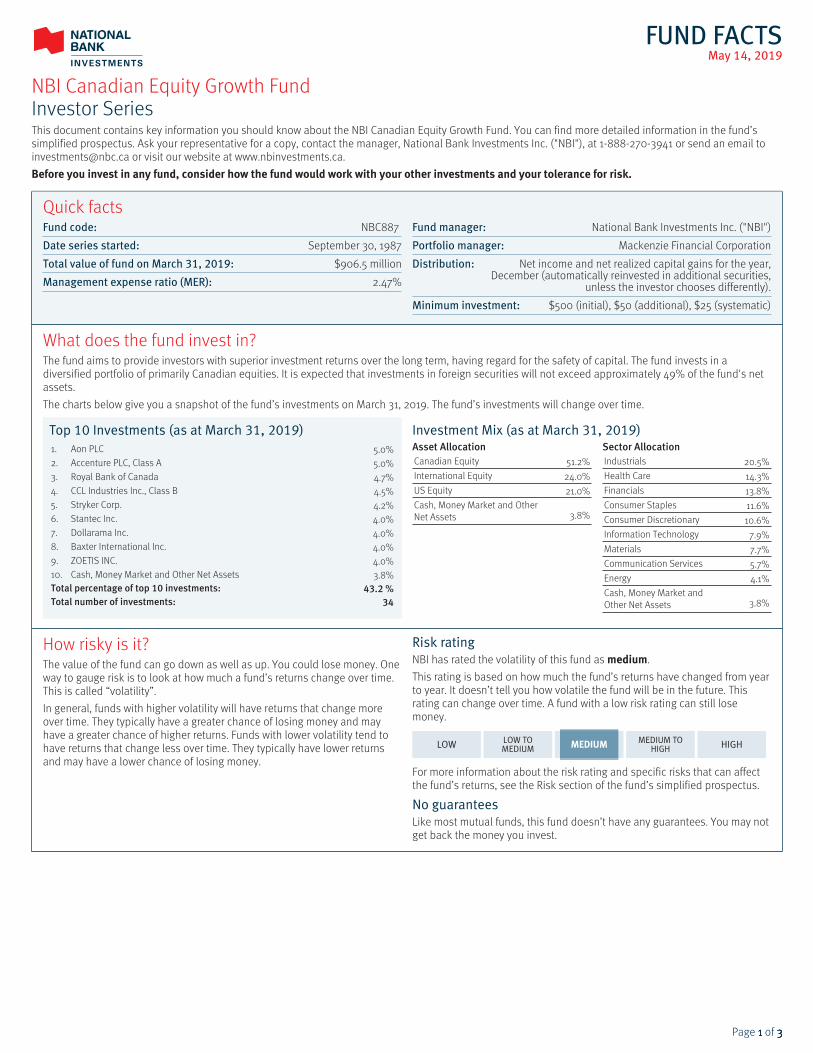
What does the fund invest in?The fund aims to provide investors with superior investment returns over the long term, having regard for the safety of capital. The fund invests in adiversified portfolio of primarily Canadian equities. It is expected that investments in foreign securities will not exceed approximately 49% of the fund's netassets.The charts below give you a snapshot of the fund’s investments on March 31, 2019. The fund’s investments will change over time.
Top 10 Investments (as at March 31, 2019)1. Aon PLC 5.0%2. Accenture PLC, Class A 5.0%3. Royal Bank of Canada 4.7%4. CCL Industries Inc., Class B 4.5%5. Stryker Corp. 4.2%6. Stantec Inc. 4.0%7. Dollarama Inc. 4.0%8. Baxter International Inc. 4.0%9. ZOETIS INC. 4.0%10. Cash, Money Market and Other Net Assets 3.8%Total percentage of top 10 investments: 43.2 %Total number of investments: 34
Investment Mix (as at March 31, 2019)Asset AllocationCanadian Equity 51.2%International Equity 24.0%US Equity 21.0%Cash, Money Market and OtherNet Assets 3.8%
Sector AllocationIndustrials 20.5%Health Care 14.3%Financials 13.8%Consumer Staples 11.6%Consumer Discretionary 10.6%Information Technology 7.9%Materials 7.7%Communication Services 5.7%Energy 4.1%Cash, Money Market andOther Net Assets 3.8%
How risky is it?The value of the fund can go down as well as up. You could lose money. Oneway to gauge risk is to look at how much a fund’s returns change over time.This is called “volatility”.In general, funds with higher volatility will have returns that change moreover time. They typically have a greater chance of losing money and mayhave a greater chance of higher returns. Funds with lower volatility tend tohave returns that change less over time. They typically have lower returnsand may have a lower chance of losing money.
Risk ratingNBI has rated the volatility of this fund as medium.This rating is based on how much the fund’s returns have changed from yearto year. It doesn’t tell you how volatile the fund will be in the future. Thisrating can change over time. A fund with a low risk rating can still losemoney.
LOW LOW TOMEDIUM MEDIUM MEDIUM TO
HIGH HIGH
For more information about the risk rating and specific risks that can affectthe fund’s returns, see the Risk section of the fund’s simplified prospectus.
No guaranteesLike most mutual funds, this fund doesn’t have any guarantees. You may notget back the money you invest.
Page 1111 of 3333
NBI Canadian Equity Growth FundInvestor Series
How has the fund performed?This section tells you how Investor Series securities of the fund have performed over the past 10 years. Returns are after expenses have been deducted.These expenses reduce the funds' returns.
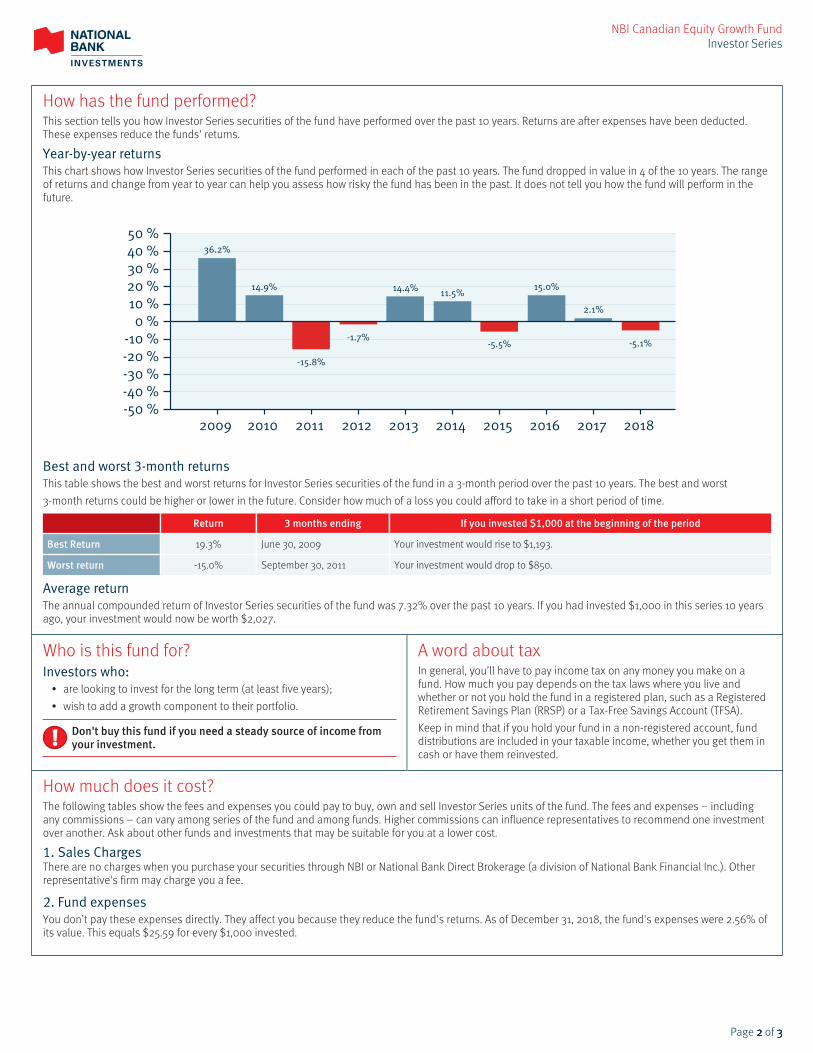
Year-by-year returnsThis chart shows how Investor Series securities of the fund performed in each of the past 10 years. The fund dropped in value in 4 of the 10 years. The rangeof returns and change from year to year can help you assess how risky the fund has been in the past. It does not tell you how the fund will perform in thefuture.
36.2%
14.9%
-15.8%
-1.7%
14.4% 11.5%
-5.5%
15.0%
2.1%
-5.1%
-50 % -40 % -30 % -20 % -10 %
0 % 10 % 20 % 30 % 40 % 50 %
2009 2010 2011 2012 2013 2014 2015 2016 2017 2018
Best and worst 3-month returnsThis table shows the best and worst returns for Investor Series securities of the fund in a 3-month period over the past 10 years. The best and worst3-month returns could be higher or lower in the future. Consider how much of a loss you could afford to take in a short period of time.
Return 3 months ending If you invested $1,000 at the beginning of the period
Best Return 19.3% June 30, 2009 Your investment would rise to $1,193.
Worst return -15.0% September 30, 2011 Your investment would drop to $850.
Average returnThe annual compounded return of Investor Series securities of the fund was 7.32% over the past 10 years. If you had invested $1,000 in this series 10 yearsago, your investment would now be worth $2,027.
Who is this fund for?Investors who:
• are looking to invest for the long term (at least five years);• wish to add a growth component to their portfolio.
Don't buy this fund if you need a steady source of income fromyour investment.
A word about taxIn general, you’ll have to pay income tax on any money you make on afund. How much you pay depends on the tax laws where you live andwhether or not you hold the fund in a registered plan, such as a RegisteredRetirement Savings Plan (RRSP) or a Tax-Free Savings Account (TFSA).Keep in mind that if you hold your fund in a non-registered account, funddistributions are included in your taxable income, whether you get them incash or have them reinvested.
How much does it cost?The following tables show the fees and expenses you could pay to buy, own and sell Investor Series units of the fund. The fees and expenses – includingany commissions – can vary among series of the fund and among funds. Higher commissions can influence representatives to recommend one investmentover another. Ask about other funds and investments that may be suitable for you at a lower cost.
1. Sales ChargesThere are no charges when you purchase your securities through NBI or National Bank Direct Brokerage (a division of National Bank Financial Inc.). Otherrepresentative's firm may charge you a fee.
2. Fund expensesYou don’t pay these expenses directly. They affect you because they reduce the fund's returns. As of December 31, 2018, the fund's expenses were 2.56% ofits value. This equals $25.59 for every $1,000 invested.
Page 2222 of 3333

NBI Canadian Equity Growth FundInvestor Series
How much does it cost? (cont’d)
Annual rate (as a % of the fund’s value)
Management expense ratio (MER)This is the total of the fund’s management fee (including the trailing commission) and operating expenses (includingfixed rate administration fee). NBI waived some of the fund's expenses. If it had not done so, the MER would have beenhigher.
2.47%
Trading expense ratio (TER)These are the fund's trading costs.
0.09%
Fund Expenses 2.56%
More about the trailing commissionThe trailing commission is an ongoing commission. It is paid for as long as you own the fund. It is for the services and/or advice that your representativeand their firm provide to you.NBI pays the trailing commission to your representative’s firm. It is paid from the fund’s management fee and is based on the value of your investment. Therate for this series of the fund is up to 1.25% of the value of your investment each year. This equals $12.50 each year for every $1,000 invested.
3. Other feesYou may have to pay other fees when you buy, hold, sell, switch or convert securities of the fund.
Fee What you pay
Short-term trading fee 2% of the value of the securities you redeem or switch within 30 days of purchase may be charged by NBI. This fee goes to the fund.
Other fees Registered Account termination fee, only if the registered investment account is with NBI. $100
What if I change my mind?Under the securities law in some provinces and territories, you have theright to:
• withdraw from an agreement to buy mutual fund securities within twobusiness days after you receive a simplified prospectus or Fund Factsdocument; or
• cancel your purchase within 48 hours after you receive confirmation ofthe purchase.
In some provinces and territories, you also have the right to cancel apurchase, or in some jurisdictions, claim damages, if the simplifiedprospectus, annual information form, Fund Facts document or financialstatements contain a misrepresentation. You must act within the time limitset by the securities law in your province or territory.For more information, see the securities law of your province or territory orask a lawyer.
For more informationContact your representative or NBI for a copy of the fund’s simplifiedprospectus and other disclosure documents. These documents and theFund Facts make up the fund’s legal documents.
National Bank Investments Inc.1155 Metcalfe Street, 5th floorMontreal, QuebecH3B 4S9
Phone: 514-871-2082Toll-free: 1-888-270-3941Email: investments@nbc.cawww.nbinvestments.cawww.nbinvestments.cawww.nbinvestments.ca
To learn more about investing in mutual funds, see the brochureUnderstanding mutual funds, which is available on the website of theCanadian Securities Administrators atwww.securities-administrators.ca.
Page 3333 of 3333
FUND FACTSMay 14, 2019
NBI Small Cap FundInvestor SeriesThis document contains key information you should know about the NBI Small Cap Fund. You can find more detailed information in the fund’s simplifiedprospectus. Ask your representative for a copy, contact the manager, National Bank Investments Inc. ("NBI"), at 1-888-270-3941 or send an email [email protected] or visit our website at www.nbinvestments.ca.Before you invest in any fund, consider how the fund would work with your other investments and your tolerance for risk.
Quick factsFund code: NBC841
Date series started: February 25, 1988
Total value of fund on March 31, 2019: $935.4 million
Management expense ratio (MER): 2.53%
Fund manager: National Bank Investments Inc. ("NBI")
Portfolio manager: Fiera Capital Corporation
Distribution: Net income and net realized capital gains for the year,December (automatically reinvested in additional securities,
unless the investor chooses differently).
Minimum investment: $500 (initial), $50 (additional), $25 (systematic)
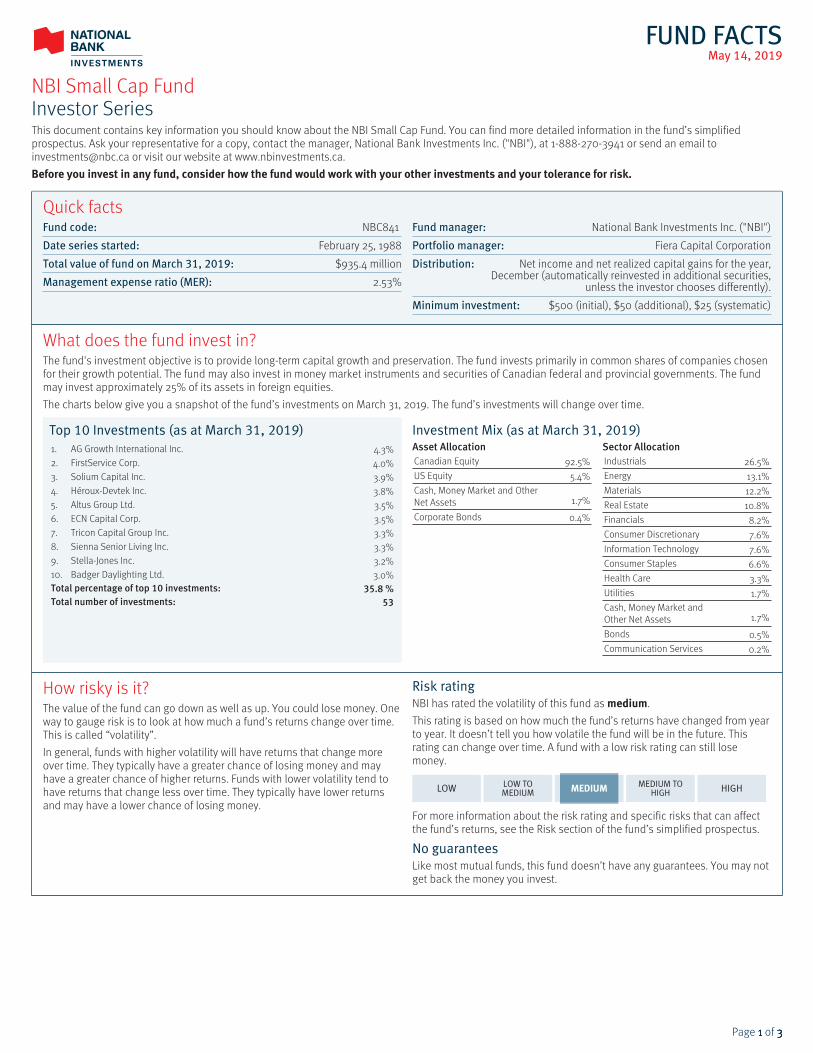
What does the fund invest in?The fund's investment objective is to provide long-term capital growth and preservation. The fund invests primarily in common shares of companies chosenfor their growth potential. The fund may also invest in money market instruments and securities of Canadian federal and provincial governments. The fundmay invest approximately 25% of its assets in foreign equities.The charts below give you a snapshot of the fund’s investments on March 31, 2019. The fund’s investments will change over time.
Top 10 Investments (as at March 31, 2019)1. AG Growth International Inc. 4.3%2. FirstService Corp. 4.0%3. Solium Capital Inc. 3.9%4. Héroux-Devtek Inc. 3.8%5. Altus Group Ltd. 3.5%6. ECN Capital Corp. 3.5%7. Tricon Capital Group Inc. 3.3%8. Sienna Senior Living Inc. 3.3%9. Stella-Jones Inc. 3.2%10. Badger Daylighting Ltd. 3.0%Total percentage of top 10 investments: 35.8 %Total number of investments: 53
Investment Mix (as at March 31, 2019)Asset AllocationCanadian Equity 92.5%US Equity 5.4%Cash, Money Market and OtherNet Assets 1.7%
Corporate Bonds 0.4%
Sector AllocationIndustrials 26.5%Energy 13.1%Materials 12.2%Real Estate 10.8%Financials 8.2%Consumer Discretionary 7.6%Information Technology 7.6%Consumer Staples 6.6%Health Care 3.3%Utilities 1.7%Cash, Money Market andOther Net Assets 1.7%
Bonds 0.5%Communication Services 0.2%
How risky is it?The value of the fund can go down as well as up. You could lose money. Oneway to gauge risk is to look at how much a fund’s returns change over time.This is called “volatility”.In general, funds with higher volatility will have returns that change moreover time. They typically have a greater chance of losing money and mayhave a greater chance of higher returns. Funds with lower volatility tend tohave returns that change less over time. They typically have lower returnsand may have a lower chance of losing money.
Risk ratingNBI has rated the volatility of this fund as medium.This rating is based on how much the fund’s returns have changed from yearto year. It doesn’t tell you how volatile the fund will be in the future. Thisrating can change over time. A fund with a low risk rating can still losemoney.
LOW LOW TOMEDIUM MEDIUM MEDIUM TO
HIGH HIGH
For more information about the risk rating and specific risks that can affectthe fund’s returns, see the Risk section of the fund’s simplified prospectus.
No guaranteesLike most mutual funds, this fund doesn’t have any guarantees. You may notget back the money you invest.
Page 1111 of 3333
NBI Small Cap FundInvestor Series
How has the fund performed?This section tells you how Investor Series securities of the fund have performed over the past 10 years. Returns are after expenses have been deducted.These expenses reduce the funds' returns.
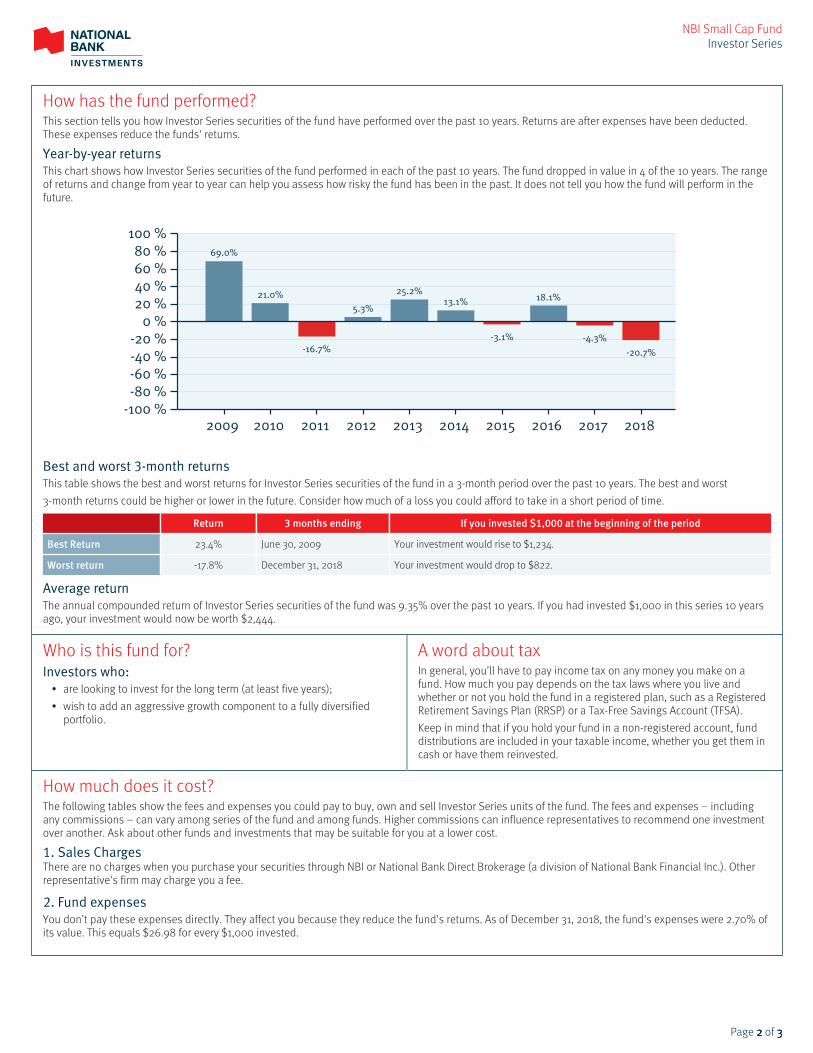
Year-by-year returnsThis chart shows how Investor Series securities of the fund performed in each of the past 10 years. The fund dropped in value in 4 of the 10 years. The rangeof returns and change from year to year can help you assess how risky the fund has been in the past. It does not tell you how the fund will perform in thefuture.
69.0%
21.0%
-16.7%
5.3%
25.2%13.1%
-3.1%
18.1%
-4.3%
-20.7%
-100 % -80 % -60 % -40 % -20 %
0 % 20 % 40 % 60 % 80 %
100 %
2009 2010 2011 2012 2013 2014 2015 2016 2017 2018
Best and worst 3-month returnsThis table shows the best and worst returns for Investor Series securities of the fund in a 3-month period over the past 10 years. The best and worst3-month returns could be higher or lower in the future. Consider how much of a loss you could afford to take in a short period of time.
Return 3 months ending If you invested $1,000 at the beginning of the period
Best Return 23.4% June 30, 2009 Your investment would rise to $1,234.
Worst return -17.8% December 31, 2018 Your investment would drop to $822.
Average returnThe annual compounded return of Investor Series securities of the fund was 9.35% over the past 10 years. If you had invested $1,000 in this series 10 yearsago, your investment would now be worth $2,444.
Who is this fund for?Investors who:
• are looking to invest for the long term (at least five years);• wish to add an aggressive growth component to a fully diversified
portfolio.
A word about taxIn general, you’ll have to pay income tax on any money you make on afund. How much you pay depends on the tax laws where you live andwhether or not you hold the fund in a registered plan, such as a RegisteredRetirement Savings Plan (RRSP) or a Tax-Free Savings Account (TFSA).Keep in mind that if you hold your fund in a non-registered account, funddistributions are included in your taxable income, whether you get them incash or have them reinvested.
How much does it cost?The following tables show the fees and expenses you could pay to buy, own and sell Investor Series units of the fund. The fees and expenses – includingany commissions – can vary among series of the fund and among funds. Higher commissions can influence representatives to recommend one investmentover another. Ask about other funds and investments that may be suitable for you at a lower cost.
1. Sales ChargesThere are no charges when you purchase your securities through NBI or National Bank Direct Brokerage (a division of National Bank Financial Inc.). Otherrepresentative's firm may charge you a fee.
2. Fund expensesYou don’t pay these expenses directly. They affect you because they reduce the fund's returns. As of December 31, 2018, the fund's expenses were 2.70% ofits value. This equals $26.98 for every $1,000 invested.
Page 2222 of 3333

NBI Small Cap FundInvestor Series
How much does it cost? (cont’d)
Annual rate (as a % of the fund’s value)
Management expense ratio (MER)This is the total of the fund’s management fee (including the trailing commission) and operating expenses (includingfixed rate administration fee). NBI waived some of the fund's expenses. If it had not done so, the MER would have beenhigher.
2.53%
Trading expense ratio (TER)These are the fund's trading costs.
0.17%
Fund Expenses 2.70%
More about the trailing commissionThe trailing commission is an ongoing commission. It is paid for as long as you own the fund. It is for the services and/or advice that your representativeand their firm provide to you.NBI pays the trailing commission to your representative’s firm. It is paid from the fund’s management fee and is based on the value of your investment. Therate for this series of the fund is up to 1.25% of the value of your investment each year. This equals $12.50 each year for every $1,000 invested.
3. Other feesYou may have to pay other fees when you buy, hold, sell, switch or convert securities of the fund.
Fee What you pay
Short-term trading fee 2% of the value of the securities you redeem or switch within 30 days of purchase may be charged by NBI. This fee goes to the fund.
Other fees Registered Account termination fee, only if the registered investment account is with NBI. $100
What if I change my mind?Under the securities law in some provinces and territories, you have theright to:
• withdraw from an agreement to buy mutual fund securities within twobusiness days after you receive a simplified prospectus or Fund Factsdocument; or
• cancel your purchase within 48 hours after you receive confirmation ofthe purchase.
In some provinces and territories, you also have the right to cancel apurchase, or in some jurisdictions, claim damages, if the simplifiedprospectus, annual information form, Fund Facts document or financialstatements contain a misrepresentation. You must act within the time limitset by the securities law in your province or territory.For more information, see the securities law of your province or territory orask a lawyer.
For more informationContact your representative or NBI for a copy of the fund’s simplifiedprospectus and other disclosure documents. These documents and theFund Facts make up the fund’s legal documents.
National Bank Investments Inc.1155 Metcalfe Street, 5th floorMontreal, QuebecH3B 4S9
Phone: 514-871-2082Toll-free: 1-888-270-3941Email: investments@nbc.cawww.nbinvestments.cawww.nbinvestments.cawww.nbinvestments.ca
To learn more about investing in mutual funds, see the brochureUnderstanding mutual funds, which is available on the website of theCanadian Securities Administrators atwww.securities-administrators.ca.
Page 3333 of 3333
FUND FACTSMay 14, 2019
NBI Global Equity FundInvestor SeriesThis document contains key information you should know about the NBI Global Equity Fund. You can find more detailed information in the fund’s simplifiedprospectus. Ask your representative for a copy, contact the manager, National Bank Investments Inc. ("NBI"), at 1-888-270-3941 or send an email [email protected] or visit our website at www.nbinvestments.ca.Before you invest in any fund, consider how the fund would work with your other investments and your tolerance for risk.
Quick factsFund code: NBC867
Date series started: January 28, 2000
Total value of fund on March 31, 2019: $1,943.0 million
Management expense ratio (MER): 2.85%
Fund manager: National Bank Investments Inc. ("NBI")
Portfolio manager: Fiera Capital Corporation
Distribution: Net income and net realized capital gains for the year,December (automatically reinvested in additional securities,
unless the investor chooses differently).
Minimum investment: $500 (initial), $50 (additional), $25 (systematic)
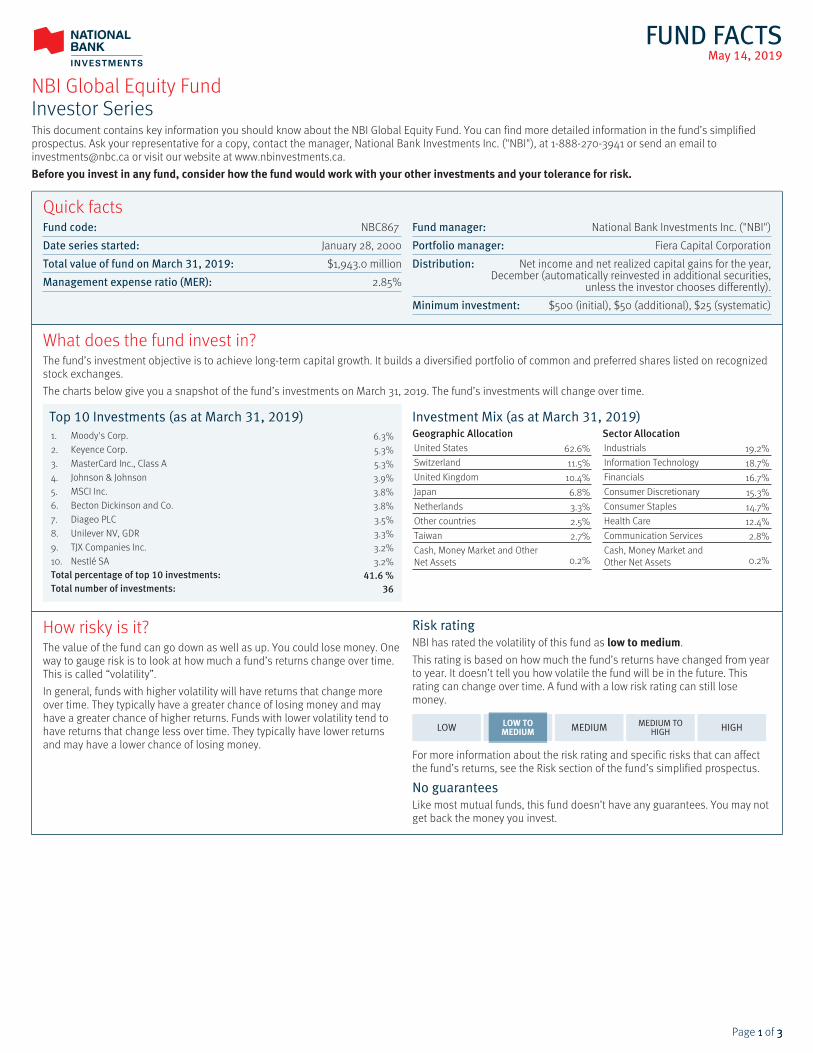
What does the fund invest in?The fund’s investment objective is to achieve long-term capital growth. It builds a diversified portfolio of common and preferred shares listed on recognizedstock exchanges.The charts below give you a snapshot of the fund’s investments on March 31, 2019. The fund’s investments will change over time.
Top 10 Investments (as at March 31, 2019)1. Moody's Corp. 6.3%2. Keyence Corp. 5.3%3. MasterCard Inc., Class A 5.3%4. Johnson & Johnson 3.9%5. MSCI Inc. 3.8%6. Becton Dickinson and Co. 3.8%7. Diageo PLC 3.5%8. Unilever NV, GDR 3.3%9. TJX Companies Inc. 3.2%10. Nestlé SA 3.2%Total percentage of top 10 investments: 41.6 %Total number of investments: 36
Investment Mix (as at March 31, 2019)Geographic AllocationUnited States 62.6%Switzerland 11.5%United Kingdom 10.4%Japan 6.8%Netherlands 3.3%Other countries 2.5%Taiwan 2.7%Cash, Money Market and OtherNet Assets 0.2%
Sector AllocationIndustrials 19.2%Information Technology 18.7%Financials 16.7%Consumer Discretionary 15.3%Consumer Staples 14.7%Health Care 12.4%Communication Services 2.8%Cash, Money Market andOther Net Assets 0.2%
How risky is it?The value of the fund can go down as well as up. You could lose money. Oneway to gauge risk is to look at how much a fund’s returns change over time.This is called “volatility”.In general, funds with higher volatility will have returns that change moreover time. They typically have a greater chance of losing money and mayhave a greater chance of higher returns. Funds with lower volatility tend tohave returns that change less over time. They typically have lower returnsand may have a lower chance of losing money.
Risk ratingNBI has rated the volatility of this fund as low to medium.This rating is based on how much the fund’s returns have changed from yearto year. It doesn’t tell you how volatile the fund will be in the future. Thisrating can change over time. A fund with a low risk rating can still losemoney.
LOW LOW TOMEDIUM MEDIUM MEDIUM TO
HIGH HIGH
For more information about the risk rating and specific risks that can affectthe fund’s returns, see the Risk section of the fund’s simplified prospectus.
No guaranteesLike most mutual funds, this fund doesn’t have any guarantees. You may notget back the money you invest.
Page 1111 of 3333
NBI Global Equity FundInvestor Series
How has the fund performed?This section tells you how Investor Series securities of the fund have performed over the past 10 years. Returns are after expenses have been deducted.These expenses reduce the funds' returns.
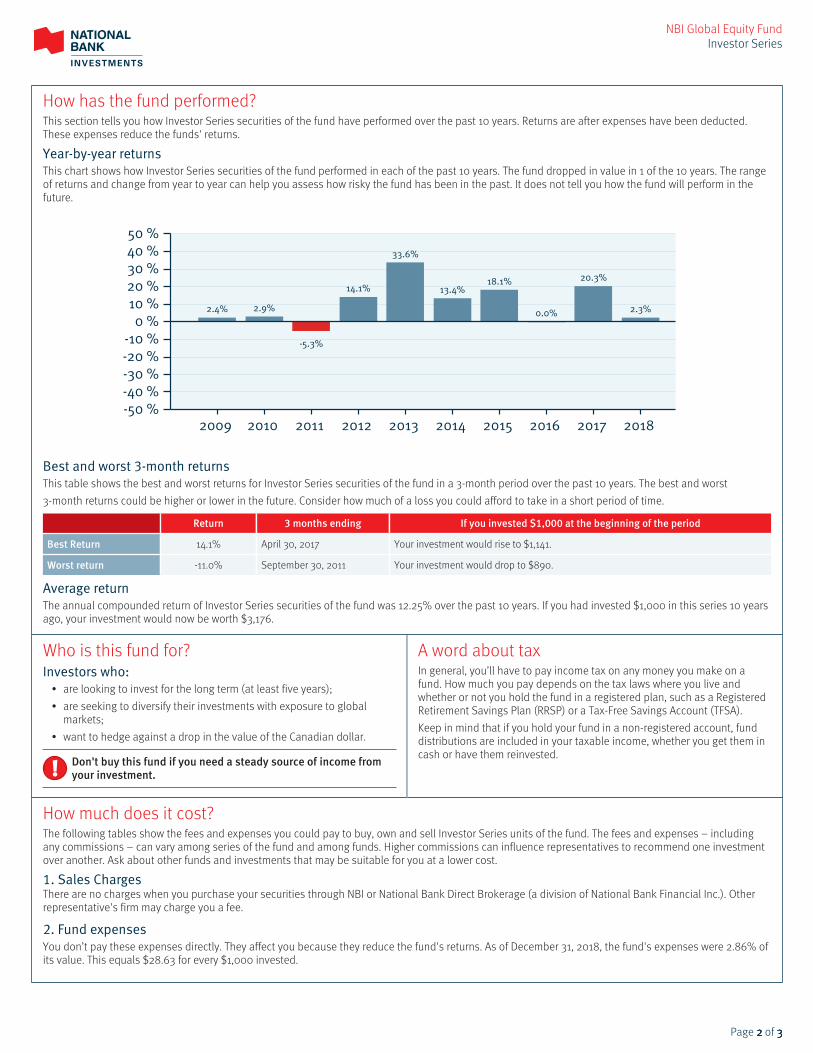
Year-by-year returnsThis chart shows how Investor Series securities of the fund performed in each of the past 10 years. The fund dropped in value in 1 of the 10 years. The rangeof returns and change from year to year can help you assess how risky the fund has been in the past. It does not tell you how the fund will perform in thefuture.
2.4% 2.9%
-5.3%
14.1%
33.6%
13.4%18.1%
0.0%
20.3%
2.3%
-50 % -40 % -30 % -20 % -10 %
0 % 10 % 20 % 30 % 40 % 50 %
2009 2010 2011 2012 2013 2014 2015 2016 2017 2018
Best and worst 3-month returnsThis table shows the best and worst returns for Investor Series securities of the fund in a 3-month period over the past 10 years. The best and worst3-month returns could be higher or lower in the future. Consider how much of a loss you could afford to take in a short period of time.
Return 3 months ending If you invested $1,000 at the beginning of the period
Best Return 14.1% April 30, 2017 Your investment would rise to $1,141.
Worst return -11.0% September 30, 2011 Your investment would drop to $890.
Average returnThe annual compounded return of Investor Series securities of the fund was 12.25% over the past 10 years. If you had invested $1,000 in this series 10 yearsago, your investment would now be worth $3,176.
Who is this fund for?Investors who:
• are looking to invest for the long term (at least five years);• are seeking to diversify their investments with exposure to global
markets;• want to hedge against a drop in the value of the Canadian dollar.
Don't buy this fund if you need a steady source of income fromyour investment.
A word about taxIn general, you’ll have to pay income tax on any money you make on afund. How much you pay depends on the tax laws where you live andwhether or not you hold the fund in a registered plan, such as a RegisteredRetirement Savings Plan (RRSP) or a Tax-Free Savings Account (TFSA).Keep in mind that if you hold your fund in a non-registered account, funddistributions are included in your taxable income, whether you get them incash or have them reinvested.
How much does it cost?The following tables show the fees and expenses you could pay to buy, own and sell Investor Series units of the fund. The fees and expenses – includingany commissions – can vary among series of the fund and among funds. Higher commissions can influence representatives to recommend one investmentover another. Ask about other funds and investments that may be suitable for you at a lower cost.
1. Sales ChargesThere are no charges when you purchase your securities through NBI or National Bank Direct Brokerage (a division of National Bank Financial Inc.). Otherrepresentative's firm may charge you a fee.
2. Fund expensesYou don’t pay these expenses directly. They affect you because they reduce the fund's returns. As of December 31, 2018, the fund's expenses were 2.86% ofits value. This equals $28.63 for every $1,000 invested.
Page 2222 of 3333
NBI Global Equity FundInvestor Series
How much does it cost? (cont’d)
Annual rate (as a % of the fund’s value)
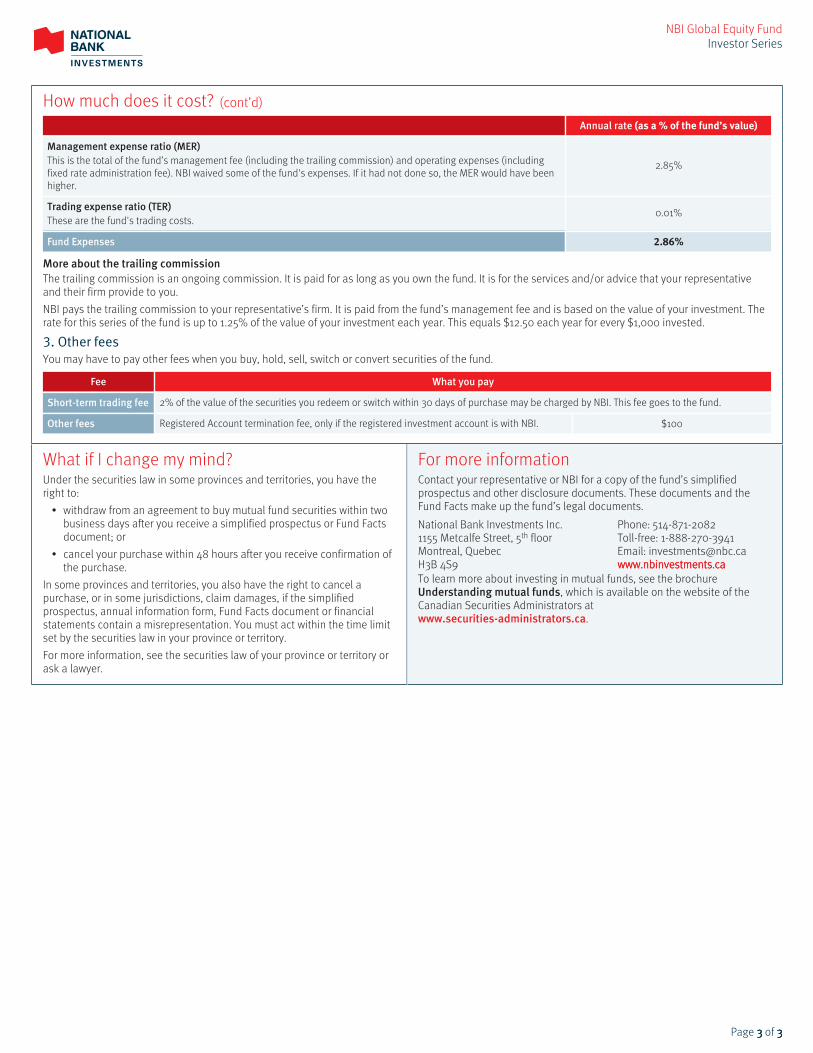
Management expense ratio (MER)This is the total of the fund’s management fee (including the trailing commission) and operating expenses (includingfixed rate administration fee). NBI waived some of the fund's expenses. If it had not done so, the MER would have beenhigher.
2.85%
Trading expense ratio (TER)These are the fund's trading costs.
0.01%
Fund Expenses 2.86%
More about the trailing commissionThe trailing commission is an ongoing commission. It is paid for as long as you own the fund. It is for the services and/or advice that your representativeand their firm provide to you.NBI pays the trailing commission to your representative’s firm. It is paid from the fund’s management fee and is based on the value of your investment. Therate for this series of the fund is up to 1.25% of the value of your investment each year. This equals $12.50 each year for every $1,000 invested.
3. Other feesYou may have to pay other fees when you buy, hold, sell, switch or convert securities of the fund.
Fee What you pay
Short-term trading fee 2% of the value of the securities you redeem or switch within 30 days of purchase may be charged by NBI. This fee goes to the fund.
Other fees Registered Account termination fee, only if the registered investment account is with NBI. $100
What if I change my mind?Under the securities law in some provinces and territories, you have theright to:
• withdraw from an agreement to buy mutual fund securities within twobusiness days after you receive a simplified prospectus or Fund Factsdocument; or
• cancel your purchase within 48 hours after you receive confirmation ofthe purchase.
In some provinces and territories, you also have the right to cancel apurchase, or in some jurisdictions, claim damages, if the simplifiedprospectus, annual information form, Fund Facts document or financialstatements contain a misrepresentation. You must act within the time limitset by the securities law in your province or territory.For more information, see the securities law of your province or territory orask a lawyer.
For more informationContact your representative or NBI for a copy of the fund’s simplifiedprospectus and other disclosure documents. These documents and theFund Facts make up the fund’s legal documents.
National Bank Investments Inc.1155 Metcalfe Street, 5th floorMontreal, QuebecH3B 4S9
Phone: 514-871-2082Toll-free: 1-888-270-3941Email: investments@nbc.cawww.nbinvestments.cawww.nbinvestments.cawww.nbinvestments.ca
To learn more about investing in mutual funds, see the brochureUnderstanding mutual funds, which is available on the website of theCanadian Securities Administrators atwww.securities-administrators.ca.
Page 3333 of 3333
FUND FACTSMay 14, 2019
NBI SmartData U.S. Equity FundAdvisor SeriesThis document contains key information you should know about the NBI SmartData U.S. Equity Fund. You can find more detailed information in the fund’ssimplified prospectus. Ask your representative for a copy, contact the manager, National Bank Investments Inc. ("NBI"), at 1-888-270-3941 or send an email [email protected] or visit our website at www.nbinvestments.ca.Before you invest in any fund, consider how the fund would work with your other investments and your tolerance for risk.
Quick factsFund code: ISC: NBC490 DSC: NBC590 LSC: NBC690
Date series started: November 22, 2007
Total value of fund on March 31, 2019: $1,051.9 million
Management expense ratio (MER): 2.16%
Fund manager: National Bank Investments Inc. ("NBI")
Portfolio manager: Goldman Sachs Asset Management, L.P.
Distribution: Net income and net realized capital gains for the year,December (automatically reinvested in additional securities,
unless the investor chooses differently).
Minimum investment: $500 (initial), $50 (additional), $25 (systematic)
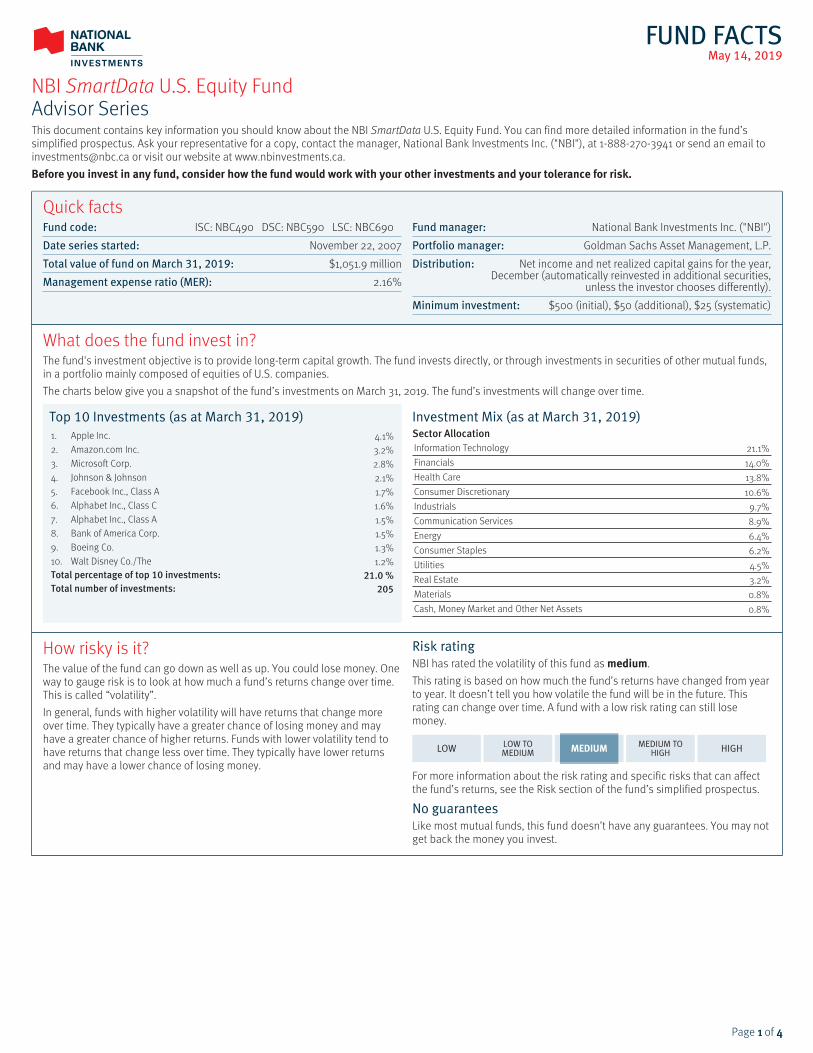
What does the fund invest in?The fund's investment objective is to provide long-term capital growth. The fund invests directly, or through investments in securities of other mutual funds,in a portfolio mainly composed of equities of U.S. companies.The charts below give you a snapshot of the fund’s investments on March 31, 2019. The fund’s investments will change over time.
Top 10 Investments (as at March 31, 2019)1. Apple Inc. 4.1%2. Amazon.com Inc. 3.2%3. Microsoft Corp. 2.8%4. Johnson & Johnson 2.1%5. Facebook Inc., Class A 1.7%6. Alphabet Inc., Class C 1.6%7. Alphabet Inc., Class A 1.5%8. Bank of America Corp. 1.5%9. Boeing Co. 1.3%10. Walt Disney Co./The 1.2%Total percentage of top 10 investments: 21.0 %Total number of investments: 205
Investment Mix (as at March 31, 2019)Sector AllocationInformation Technology 21.1%Financials 14.0%Health Care 13.8%Consumer Discretionary 10.6%Industrials 9.7%Communication Services 8.9%Energy 6.4%Consumer Staples 6.2%Utilities 4.5%Real Estate 3.2%Materials 0.8%Cash, Money Market and Other Net Assets 0.8%
How risky is it?The value of the fund can go down as well as up. You could lose money. Oneway to gauge risk is to look at how much a fund’s returns change over time.This is called “volatility”.In general, funds with higher volatility will have returns that change moreover time. They typically have a greater chance of losing money and mayhave a greater chance of higher returns. Funds with lower volatility tend tohave returns that change less over time. They typically have lower returnsand may have a lower chance of losing money.
Risk ratingNBI has rated the volatility of this fund as medium.This rating is based on how much the fund’s returns have changed from yearto year. It doesn’t tell you how volatile the fund will be in the future. Thisrating can change over time. A fund with a low risk rating can still losemoney.
LOW LOW TOMEDIUM MEDIUM MEDIUM TO
HIGH HIGH
For more information about the risk rating and specific risks that can affectthe fund’s returns, see the Risk section of the fund’s simplified prospectus.
No guaranteesLike most mutual funds, this fund doesn’t have any guarantees. You may notget back the money you invest.
Page 1111 of 4444
NBI SmartData U.S. Equity FundAdvisor Series
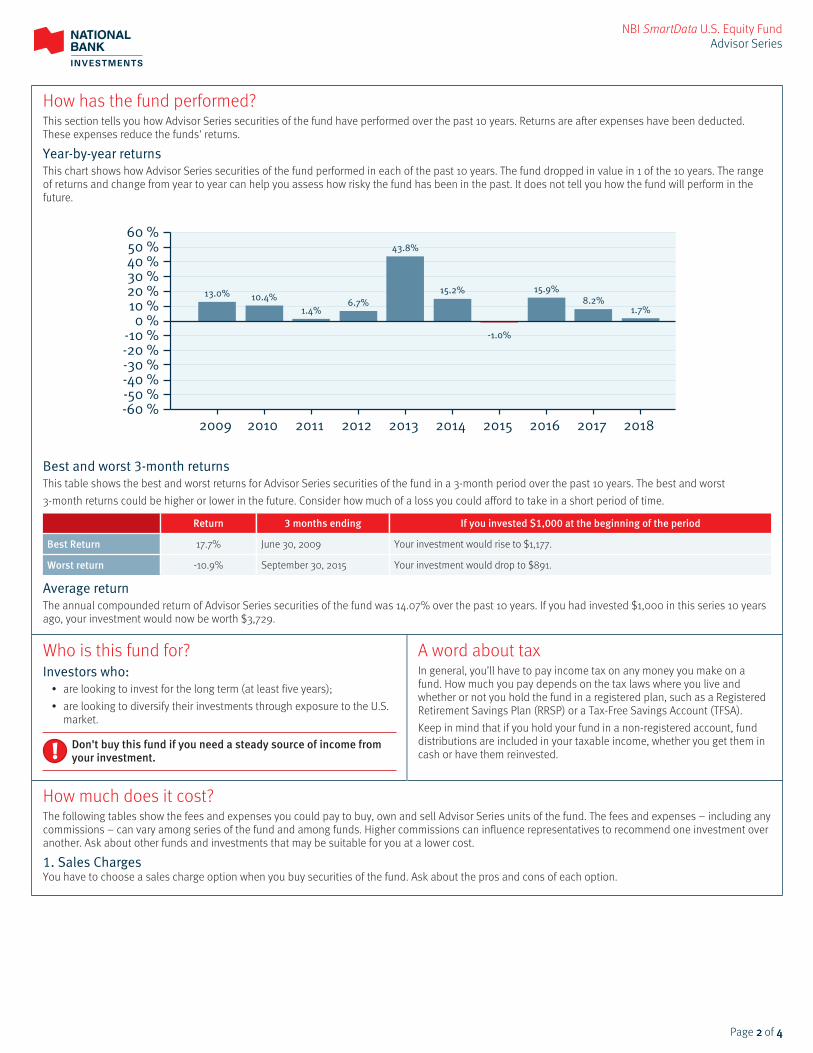
How has the fund performed?This section tells you how Advisor Series securities of the fund have performed over the past 10 years. Returns are after expenses have been deducted.These expenses reduce the funds' returns.
Year-by-year returnsThis chart shows how Advisor Series securities of the fund performed in each of the past 10 years. The fund dropped in value in 1 of the 10 years. The rangeof returns and change from year to year can help you assess how risky the fund has been in the past. It does not tell you how the fund will perform in thefuture.
13.0% 10.4%1.4%
6.7%
43.8%
15.2%
-1.0%
15.9%8.2%
1.7%
-60 % -50 % -40 % -30 % -20 % -10 %
0 % 10 % 20 % 30 % 40 % 50 % 60 %
2009 2010 2011 2012 2013 2014 2015 2016 2017 2018
Best and worst 3-month returnsThis table shows the best and worst returns for Advisor Series securities of the fund in a 3-month period over the past 10 years. The best and worst3-month returns could be higher or lower in the future. Consider how much of a loss you could afford to take in a short period of time.
Return 3 months ending If you invested $1,000 at the beginning of the period
Best Return 17.7% June 30, 2009 Your investment would rise to $1,177.
Worst return -10.9% September 30, 2015 Your investment would drop to $891.
Average returnThe annual compounded return of Advisor Series securities of the fund was 14.07% over the past 10 years. If you had invested $1,000 in this series 10 yearsago, your investment would now be worth $3,729.
Who is this fund for?Investors who:
• are looking to invest for the long term (at least five years);• are looking to diversify their investments through exposure to the U.S.
market.
Don't buy this fund if you need a steady source of income fromyour investment.
A word about taxIn general, you’ll have to pay income tax on any money you make on afund. How much you pay depends on the tax laws where you live andwhether or not you hold the fund in a registered plan, such as a RegisteredRetirement Savings Plan (RRSP) or a Tax-Free Savings Account (TFSA).Keep in mind that if you hold your fund in a non-registered account, funddistributions are included in your taxable income, whether you get them incash or have them reinvested.
How much does it cost?The following tables show the fees and expenses you could pay to buy, own and sell Advisor Series units of the fund. The fees and expenses – including anycommissions – can vary among series of the fund and among funds. Higher commissions can influence representatives to recommend one investment overanother. Ask about other funds and investments that may be suitable for you at a lower cost.
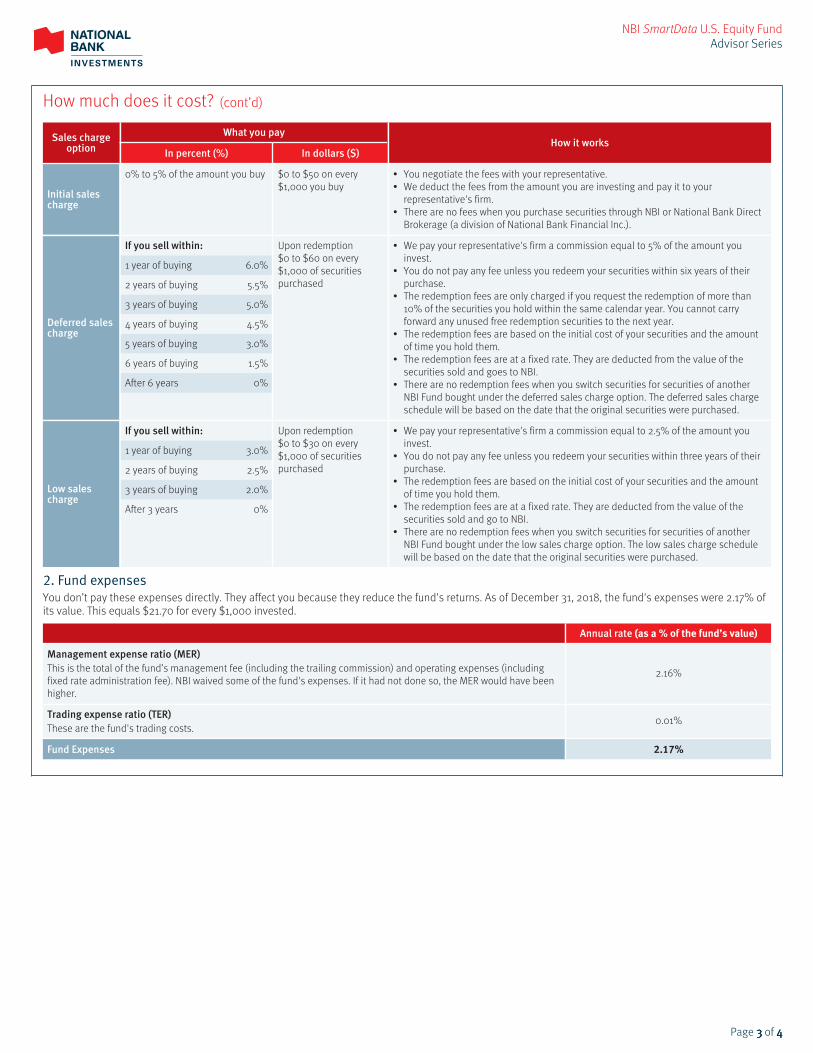
1. Sales ChargesYou have to choose a sales charge option when you buy securities of the fund. Ask about the pros and cons of each option.
Page 2222 of 4444
NBI SmartData U.S. Equity FundAdvisor Series
How much does it cost? (cont’d)
Sales chargeoption
What you pay
In percent (%) In dollars ($)How it works
Initial salescharge
0% to 5% of the amount you buy $0 to $50 on every$1,000 you buy
• You negotiate the fees with your representative.• We deduct the fees from the amount you are investing and pay it to your
representative's firm.• There are no fees when you purchase securities through NBI or National Bank Direct
Brokerage (a division of National Bank Financial Inc.).
Deferred salescharge
If you sell within:
1 year of buying 6.0%
2 years of buying 5.5%
3 years of buying 5.0%
4 years of buying 4.5%
5 years of buying 3.0%
6 years of buying 1.5%
After 6 years 0%
Upon redemption$0 to $60 on every$1,000 of securitiespurchased
• We pay your representative's firm a commission equal to 5% of the amount youinvest.
• You do not pay any fee unless you redeem your securities within six years of theirpurchase.
• The redemption fees are only charged if you request the redemption of more than10% of the securities you hold within the same calendar year. You cannot carryforward any unused free redemption securities to the next year.
• The redemption fees are based on the initial cost of your securities and the amountof time you hold them.
• The redemption fees are at a fixed rate. They are deducted from the value of thesecurities sold and goes to NBI.
• There are no redemption fees when you switch securities for securities of anotherNBI Fund bought under the deferred sales charge option. The deferred sales chargeschedule will be based on the date that the original securities were purchased.
Low salescharge
If you sell within:
1 year of buying 3.0%
2 years of buying 2.5%
3 years of buying 2.0%
After 3 years 0%
Upon redemption$0 to $30 on every$1,000 of securitiespurchased
• We pay your representative's firm a commission equal to 2.5% of the amount youinvest.
• You do not pay any fee unless you redeem your securities within three years of theirpurchase.
• The redemption fees are based on the initial cost of your securities and the amountof time you hold them.
• The redemption fees are at a fixed rate. They are deducted from the value of thesecurities sold and go to NBI.
• There are no redemption fees when you switch securities for securities of anotherNBI Fund bought under the low sales charge option. The low sales charge schedulewill be based on the date that the original securities were purchased.
2. Fund expensesYou don’t pay these expenses directly. They affect you because they reduce the fund's returns. As of December 31, 2018, the fund's expenses were 2.17% ofits value. This equals $21.70 for every $1,000 invested.
Annual rate (as a % of the fund’s value)
Management expense ratio (MER)This is the total of the fund’s management fee (including the trailing commission) and operating expenses (includingfixed rate administration fee). NBI waived some of the fund's expenses. If it had not done so, the MER would have beenhigher.
2.16%
Trading expense ratio (TER)These are the fund's trading costs.
0.01%
Fund Expenses 2.17%
Page 3333 of 4444

NBI SmartData U.S. Equity FundAdvisor Series
How much does it cost? (cont’d)More about the trailing commissionThe trailing commission is an ongoing commission. It is paid for as long as you own the fund. It is for the services and/or advice that your representativeand their firm provide to you.NBI pays the trailing commission to your representative’s firm. It is paid from the fund’s management fee and is based on the value of your investment. Therate depends on the sales charge option you choose.
Sales charge optionAmount of trailing commission
In percent (%) In dollars ($)
Initial sales chargeUp to 1.00% of the value of your investment each year. Maximum of $10.00 each year on every
$1,000 invested.
Deferred sales charge
Up to 0.50% of the value of your investment each year within the first six years.
Up to 1.00% of the value of your investment each year for the following years for newpurchase after May 14, 2015, excluding securities purchased under a systematicinvestment plan started before May 14, 2015 and reinvested distributions. Forswitches, the trailing commission schedule applicable is the one in force at the timeof the initial purchase.
Maximum of $5.00 each year on every$1,000 invested.
Maximum of $10.00 each year on every$1,000 invested.
Low sales charge
Up to 0.50% of the value of your investment each year within the first three years.
Up to 1.00% of the value of your investment each year for the following years.
Maximum of $5.00 each year on every$1,000 invested.
Maximum of $10.00 each year on every$1,000 invested.
3. Other feesYou may have to pay other fees when you buy, hold, sell, switch or convert securities of the fund.
Fee What you pay
Short-term trading fee 2% of the value of the securities you redeem or switch within 30 days of purchase may be charged by NBI. This fee goes to the fund.
Switch feeThere are no fees when you switch securities through NBI or National Bank Direct Brokerage (a division of National Bank Financial Inc.). If youswitch securities through another representative's firm, you may have to pay fees of up to 2% of the value of the securities. You negotiatethese fees with your representative.
Conversion feeThere are no fees when you convert securities through NBI or National Bank Direct Brokerage (a division of National Bank Financial Inc.). If youconvert securities through another representative's firm, you may have to pay fees of up to 2% of the value of the securities. You negotiatethese fees with your representative.
Other fees Registered Account termination fee, only if the registered investment account is with NBI. $100
What if I change my mind?Under the securities law in some provinces and territories, you have theright to:
• withdraw from an agreement to buy mutual fund securities within twobusiness days after you receive a simplified prospectus or Fund Factsdocument; or
• cancel your purchase within 48 hours after you receive confirmation ofthe purchase.
In some provinces and territories, you also have the right to cancel apurchase, or in some jurisdictions, claim damages, if the simplifiedprospectus, annual information form, Fund Facts document or financialstatements contain a misrepresentation. You must act within the time limitset by the securities law in your province or territory.For more information, see the securities law of your province or territory orask a lawyer.
For more informationContact your representative or NBI for a copy of the fund’s simplifiedprospectus and other disclosure documents. These documents and theFund Facts make up the fund’s legal documents.
National Bank Investments Inc.1155 Metcalfe Street, 5th floorMontreal, QuebecH3B 4S9
Phone: 514-871-2082Toll-free: 1-888-270-3941Email: investments@nbc.cawww.nbinvestments.cawww.nbinvestments.cawww.nbinvestments.ca
To learn more about investing in mutual funds, see the brochureUnderstanding mutual funds, which is available on the website of theCanadian Securities Administrators atwww.securities-administrators.ca.
Page 4444 of 4444
FUND FACTSMay 14, 2019
NBI SmartData International Equity FundAdvisor SeriesThis document contains key information you should know about the NBI SmartData International Equity Fund. You can find more detailed information in thefund’s simplified prospectus. Ask your representative for a copy, contact the manager, National Bank Investments Inc. ("NBI"), at 1-888-270-3941 or send anemail to [email protected] or visit our website at www.nbinvestments.ca.Before you invest in any fund, consider how the fund would work with your other investments and your tolerance for risk.
Quick factsFund code: ISC: NBC491 DSC: NBC591 LSC: NBC691
Date series started: November 22, 2007
Total value of fund on March 31, 2019: $520.4 million
Management expense ratio (MER): 2.15%
Fund manager: National Bank Investments Inc. ("NBI")
Portfolio manager: Goldman Sachs Asset Management, L.P.
Distribution: Net income and net realized capital gains for the year,December (automatically reinvested in additional securities,
unless the investor chooses differently).
Minimum investment: $500 (initial), $50 (additional), $25 (systematic)
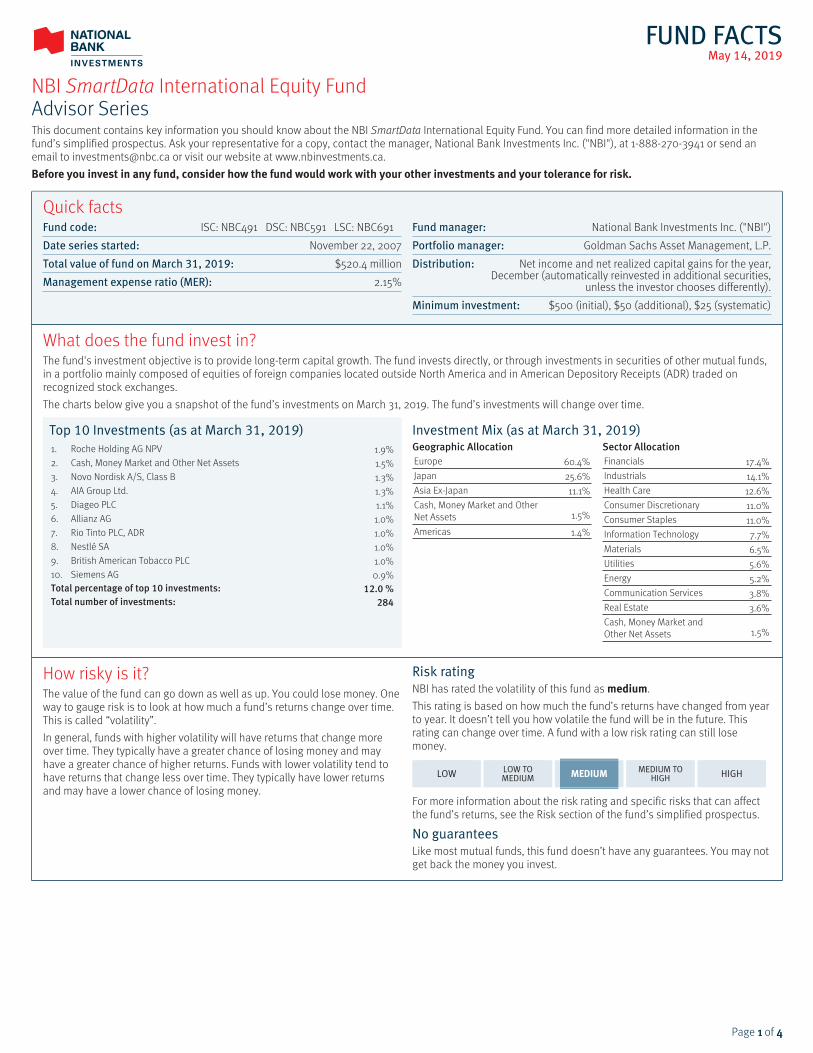
What does the fund invest in?The fund's investment objective is to provide long-term capital growth. The fund invests directly, or through investments in securities of other mutual funds,in a portfolio mainly composed of equities of foreign companies located outside North America and in American Depository Receipts (ADR) traded onrecognized stock exchanges.The charts below give you a snapshot of the fund’s investments on March 31, 2019. The fund’s investments will change over time.
Top 10 Investments (as at March 31, 2019)1. Roche Holding AG NPV 1.9%2. Cash, Money Market and Other Net Assets 1.5%3. Novo Nordisk A/S, Class B 1.3%4. AIA Group Ltd. 1.3%5. Diageo PLC 1.1%6. Allianz AG 1.0%7. Rio Tinto PLC, ADR 1.0%8. Nestlé SA 1.0%9. British American Tobacco PLC 1.0%10. Siemens AG 0.9%Total percentage of top 10 investments: 12.0 %Total number of investments: 284
Investment Mix (as at March 31, 2019)Geographic AllocationEurope 60.4%Japan 25.6%Asia Ex-Japan 11.1%Cash, Money Market and OtherNet Assets 1.5%
Americas 1.4%
Sector AllocationFinancials 17.4%Industrials 14.1%Health Care 12.6%Consumer Discretionary 11.0%Consumer Staples 11.0%Information Technology 7.7%Materials 6.5%Utilities 5.6%Energy 5.2%Communication Services 3.8%Real Estate 3.6%Cash, Money Market andOther Net Assets 1.5%
How risky is it?The value of the fund can go down as well as up. You could lose money. Oneway to gauge risk is to look at how much a fund’s returns change over time.This is called “volatility”.In general, funds with higher volatility will have returns that change moreover time. They typically have a greater chance of losing money and mayhave a greater chance of higher returns. Funds with lower volatility tend tohave returns that change less over time. They typically have lower returnsand may have a lower chance of losing money.
Risk ratingNBI has rated the volatility of this fund as medium.This rating is based on how much the fund’s returns have changed from yearto year. It doesn’t tell you how volatile the fund will be in the future. Thisrating can change over time. A fund with a low risk rating can still losemoney.
LOW LOW TOMEDIUM MEDIUM MEDIUM TO
HIGH HIGH
For more information about the risk rating and specific risks that can affectthe fund’s returns, see the Risk section of the fund’s simplified prospectus.
No guaranteesLike most mutual funds, this fund doesn’t have any guarantees. You may notget back the money you invest.
Page 1111 of 4444
NBI SmartData International Equity FundAdvisor Series
How has the fund performed?This section tells you how Advisor Series securities of the fund have performed over the past 10 years. Returns are after expenses have been deducted.These expenses reduce the funds' returns.
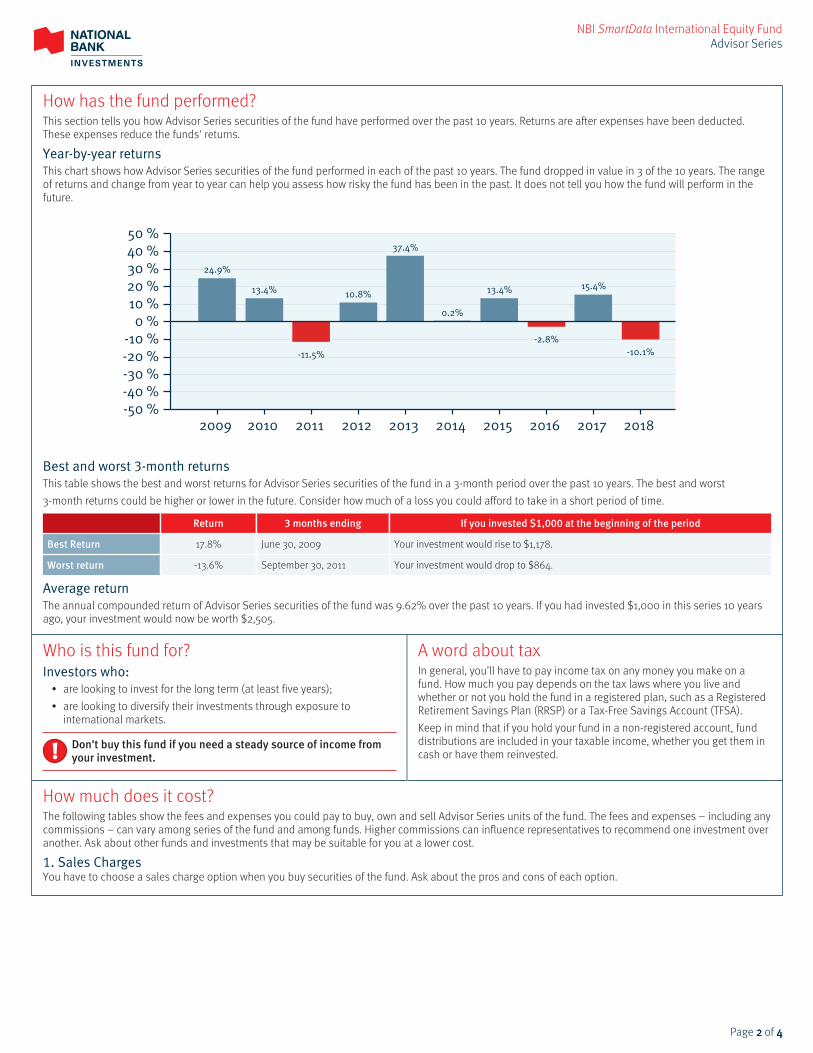
Year-by-year returnsThis chart shows how Advisor Series securities of the fund performed in each of the past 10 years. The fund dropped in value in 3 of the 10 years. The rangeof returns and change from year to year can help you assess how risky the fund has been in the past. It does not tell you how the fund will perform in thefuture.
24.9%
13.4%
-11.5%
10.8%
37.4%
0.2%
13.4%
-2.8%
15.4%
-10.1%
-50 % -40 % -30 % -20 % -10 %
0 % 10 % 20 % 30 % 40 % 50 %
2009 2010 2011 2012 2013 2014 2015 2016 2017 2018
Best and worst 3-month returnsThis table shows the best and worst returns for Advisor Series securities of the fund in a 3-month period over the past 10 years. The best and worst3-month returns could be higher or lower in the future. Consider how much of a loss you could afford to take in a short period of time.
Return 3 months ending If you invested $1,000 at the beginning of the period
Best Return 17.8% June 30, 2009 Your investment would rise to $1,178.
Worst return -13.6% September 30, 2011 Your investment would drop to $864.
Average returnThe annual compounded return of Advisor Series securities of the fund was 9.62% over the past 10 years. If you had invested $1,000 in this series 10 yearsago, your investment would now be worth $2,505.
Who is this fund for?Investors who:
• are looking to invest for the long term (at least five years);• are looking to diversify their investments through exposure to
international markets.
Don't buy this fund if you need a steady source of income fromyour investment.
A word about taxIn general, you’ll have to pay income tax on any money you make on afund. How much you pay depends on the tax laws where you live andwhether or not you hold the fund in a registered plan, such as a RegisteredRetirement Savings Plan (RRSP) or a Tax-Free Savings Account (TFSA).Keep in mind that if you hold your fund in a non-registered account, funddistributions are included in your taxable income, whether you get them incash or have them reinvested.
How much does it cost?The following tables show the fees and expenses you could pay to buy, own and sell Advisor Series units of the fund. The fees and expenses – including anycommissions – can vary among series of the fund and among funds. Higher commissions can influence representatives to recommend one investment overanother. Ask about other funds and investments that may be suitable for you at a lower cost.
1. Sales ChargesYou have to choose a sales charge option when you buy securities of the fund. Ask about the pros and cons of each option.
Page 2222 of 4444

NBI SmartData International Equity FundAdvisor Series
How much does it cost? (cont’d)
Sales chargeoption
What you pay
In percent (%) In dollars ($)How it works
Initial salescharge
0% to 5% of the amount you buy $0 to $50 on every$1,000 you buy
• You negotiate the fees with your representative.• We deduct the fees from the amount you are investing and pay it to your
representative's firm.• There are no fees when you purchase securities through NBI or National Bank Direct
Brokerage (a division of National Bank Financial Inc.).
Deferred salescharge
If you sell within:
1 year of buying 6.0%
2 years of buying 5.5%
3 years of buying 5.0%
4 years of buying 4.5%
5 years of buying 3.0%
6 years of buying 1.5%
After 6 years 0%
Upon redemption$0 to $60 on every$1,000 of securitiespurchased
• We pay your representative's firm a commission equal to 5% of the amount youinvest.
• You do not pay any fee unless you redeem your securities within six years of theirpurchase.
• The redemption fees are only charged if you request the redemption of more than10% of the securities you hold within the same calendar year. You cannot carryforward any unused free redemption securities to the next year.
• The redemption fees are based on the initial cost of your securities and the amountof time you hold them.
• The redemption fees are at a fixed rate. They are deducted from the value of thesecurities sold and goes to NBI.
• There are no redemption fees when you switch securities for securities of anotherNBI Fund bought under the deferred sales charge option. The deferred sales chargeschedule will be based on the date that the original securities were purchased.
Low salescharge
If you sell within:
1 year of buying 3.0%
2 years of buying 2.5%
3 years of buying 2.0%
After 3 years 0%
Upon redemption$0 to $30 on every$1,000 of securitiespurchased
• We pay your representative's firm a commission equal to 2.5% of the amount youinvest.
• You do not pay any fee unless you redeem your securities within three years of theirpurchase.
• The redemption fees are based on the initial cost of your securities and the amountof time you hold them.
• The redemption fees are at a fixed rate. They are deducted from the value of thesecurities sold and go to NBI.
• There are no redemption fees when you switch securities for securities of anotherNBI Fund bought under the low sales charge option. The low sales charge schedulewill be based on the date that the original securities were purchased.
2. Fund expensesYou don’t pay these expenses directly. They affect you because they reduce the fund's returns. As of December 31, 2018, the fund's expenses were 2.16% ofits value. This equals $21.60 for every $1,000 invested.
Annual rate (as a % of the fund’s value)
Management expense ratio (MER)This is the total of the fund’s management fee (including the trailing commission) and operating expenses (includingfixed rate administration fee). NBI waived some of the fund's expenses. If it had not done so, the MER would have beenhigher.
2.15%
Trading expense ratio (TER)These are the fund's trading costs.
0.01%
Fund Expenses 2.16%
Page 3333 of 4444
NBI SmartData International Equity FundAdvisor Series
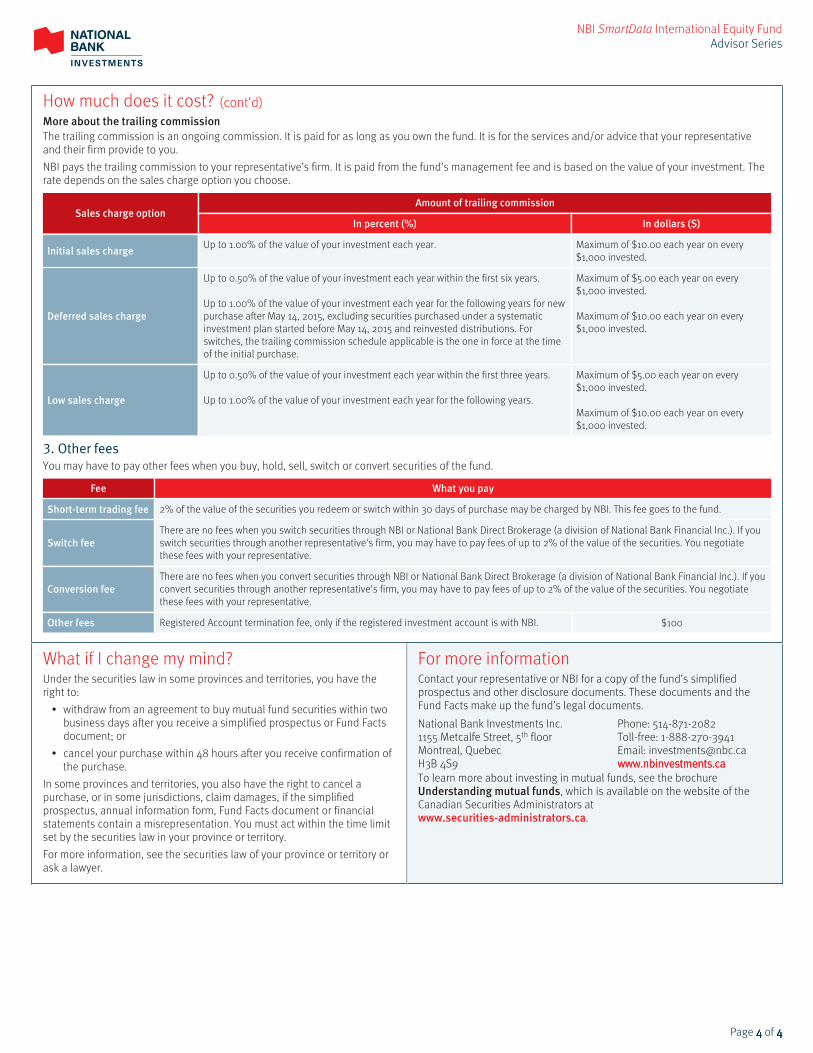
How much does it cost? (cont’d)More about the trailing commissionThe trailing commission is an ongoing commission. It is paid for as long as you own the fund. It is for the services and/or advice that your representativeand their firm provide to you.NBI pays the trailing commission to your representative’s firm. It is paid from the fund’s management fee and is based on the value of your investment. Therate depends on the sales charge option you choose.
Sales charge optionAmount of trailing commission
In percent (%) In dollars ($)
Initial sales chargeUp to 1.00% of the value of your investment each year. Maximum of $10.00 each year on every
$1,000 invested.
Deferred sales charge
Up to 0.50% of the value of your investment each year within the first six years.
Up to 1.00% of the value of your investment each year for the following years for newpurchase after May 14, 2015, excluding securities purchased under a systematicinvestment plan started before May 14, 2015 and reinvested distributions. Forswitches, the trailing commission schedule applicable is the one in force at the timeof the initial purchase.
Maximum of $5.00 each year on every$1,000 invested.
Maximum of $10.00 each year on every$1,000 invested.
Low sales charge
Up to 0.50% of the value of your investment each year within the first three years.
Up to 1.00% of the value of your investment each year for the following years.
Maximum of $5.00 each year on every$1,000 invested.
Maximum of $10.00 each year on every$1,000 invested.
3. Other feesYou may have to pay other fees when you buy, hold, sell, switch or convert securities of the fund.
Fee What you pay
Short-term trading fee 2% of the value of the securities you redeem or switch within 30 days of purchase may be charged by NBI. This fee goes to the fund.
Switch feeThere are no fees when you switch securities through NBI or National Bank Direct Brokerage (a division of National Bank Financial Inc.). If youswitch securities through another representative's firm, you may have to pay fees of up to 2% of the value of the securities. You negotiatethese fees with your representative.
Conversion feeThere are no fees when you convert securities through NBI or National Bank Direct Brokerage (a division of National Bank Financial Inc.). If youconvert securities through another representative's firm, you may have to pay fees of up to 2% of the value of the securities. You negotiatethese fees with your representative.
Other fees Registered Account termination fee, only if the registered investment account is with NBI. $100
What if I change my mind?Under the securities law in some provinces and territories, you have theright to:
• withdraw from an agreement to buy mutual fund securities within twobusiness days after you receive a simplified prospectus or Fund Factsdocument; or
• cancel your purchase within 48 hours after you receive confirmation ofthe purchase.
In some provinces and territories, you also have the right to cancel apurchase, or in some jurisdictions, claim damages, if the simplifiedprospectus, annual information form, Fund Facts document or financialstatements contain a misrepresentation. You must act within the time limitset by the securities law in your province or territory.For more information, see the securities law of your province or territory orask a lawyer.
For more informationContact your representative or NBI for a copy of the fund’s simplifiedprospectus and other disclosure documents. These documents and theFund Facts make up the fund’s legal documents.
National Bank Investments Inc.1155 Metcalfe Street, 5th floorMontreal, QuebecH3B 4S9
Phone: 514-871-2082Toll-free: 1-888-270-3941Email: investments@nbc.cawww.nbinvestments.cawww.nbinvestments.cawww.nbinvestments.ca
To learn more about investing in mutual funds, see the brochureUnderstanding mutual funds, which is available on the website of theCanadian Securities Administrators atwww.securities-administrators.ca.
Page 4444 of 4444
FUND FACTSMay 14, 2019
NBI Diversified Emerging Markets Equity Fund (formerly NBI Emerging Markets EquityPrivate Portfolio)Advisor SeriesThis document contains key information you should know about the NBI Diversified Emerging Markets Equity Fund. You can find more detailed information in thefund’s simplified prospectus. Ask your representative for a copy, contact the manager, National Bank Investments Inc. ("NBI"), at 1-888-270-3941 or send anemail to [email protected] or visit our website at www.nbinvestments.ca.Before you invest in any fund, consider how the fund would work with your other investments and your tolerance for risk.
Quick factsFund code: C$ ISC: NBC473 DSC: NBC573 LSC: NBC673
US$ ISC: NBC474 DSC: NBC574 LSC: NBC674
Date series started: December 10, 2018
Total value of fund on March 31, 2019: $1,225.7 million
Management expense ratio (MER): 2.32%
Fund manager: National Bank Investments Inc. ("NBI")
Portfolio manager: National Bank Trust Inc.
Portfolio sub-advisor: Goldman Sachs Asset Management L.P., NewtonInvestment Management (North America) Limited.
Distribution: Net income, end of each month and net realized capital gainsfor the year, December (automatically reinvested in additional
securities, unless the investor chooses differently).
Minimum investment: $500 (initial), $50 (additional), $25 (systematic)
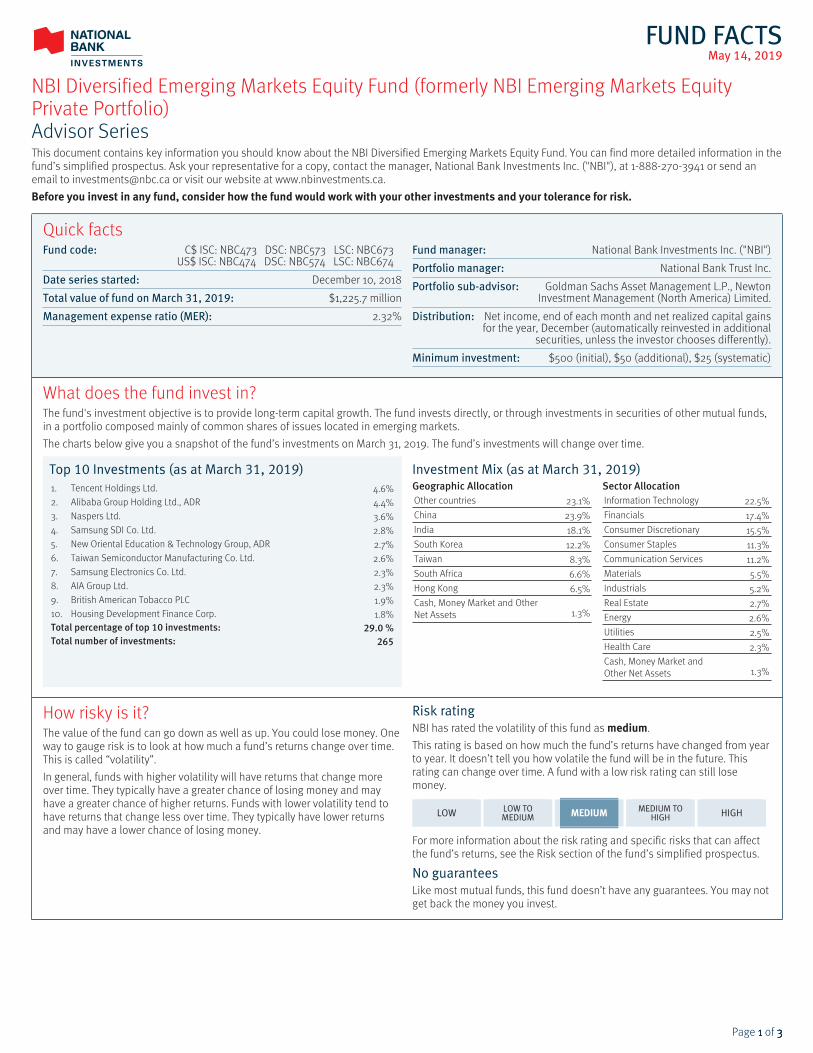
What does the fund invest in?The fund's investment objective is to provide long-term capital growth. The fund invests directly, or through investments in securities of other mutual funds,in a portfolio composed mainly of common shares of issues located in emerging markets.The charts below give you a snapshot of the fund’s investments on March 31, 2019. The fund’s investments will change over time.
Top 10 Investments (as at March 31, 2019)1. Tencent Holdings Ltd. 4.6%2. Alibaba Group Holding Ltd., ADR 4.4%3. Naspers Ltd. 3.6%4. Samsung SDI Co. Ltd. 2.8%5. New Oriental Education & Technology Group, ADR 2.7%6. Taiwan Semiconductor Manufacturing Co. Ltd. 2.6%7. Samsung Electronics Co. Ltd. 2.3%8. AIA Group Ltd. 2.3%9. British American Tobacco PLC 1.9%10. Housing Development Finance Corp. 1.8%Total percentage of top 10 investments: 29.0 %Total number of investments: 265
Investment Mix (as at March 31, 2019)Geographic AllocationOther countries 23.1%China 23.9%India 18.1%South Korea 12.2%Taiwan 8.3%South Africa 6.6%Hong Kong 6.5%Cash, Money Market and OtherNet Assets 1.3%
Sector AllocationInformation Technology 22.5%Financials 17.4%Consumer Discretionary 15.5%Consumer Staples 11.3%Communication Services 11.2%Materials 5.5%Industrials 5.2%Real Estate 2.7%Energy 2.6%Utilities 2.5%Health Care 2.3%Cash, Money Market andOther Net Assets 1.3%
How risky is it?The value of the fund can go down as well as up. You could lose money. Oneway to gauge risk is to look at how much a fund’s returns change over time.This is called “volatility”.In general, funds with higher volatility will have returns that change moreover time. They typically have a greater chance of losing money and mayhave a greater chance of higher returns. Funds with lower volatility tend tohave returns that change less over time. They typically have lower returnsand may have a lower chance of losing money.
Risk ratingNBI has rated the volatility of this fund as medium.This rating is based on how much the fund’s returns have changed from yearto year. It doesn’t tell you how volatile the fund will be in the future. Thisrating can change over time. A fund with a low risk rating can still losemoney.
LOW LOW TOMEDIUM MEDIUM MEDIUM TO
HIGH HIGH
For more information about the risk rating and specific risks that can affectthe fund’s returns, see the Risk section of the fund’s simplified prospectus.
No guaranteesLike most mutual funds, this fund doesn’t have any guarantees. You may notget back the money you invest.
Page 1111 of 3333
NBI Diversified Emerging Markets Equity Fund (formerly NBI Emerging Markets Equity Private Portfolio)Advisor Series
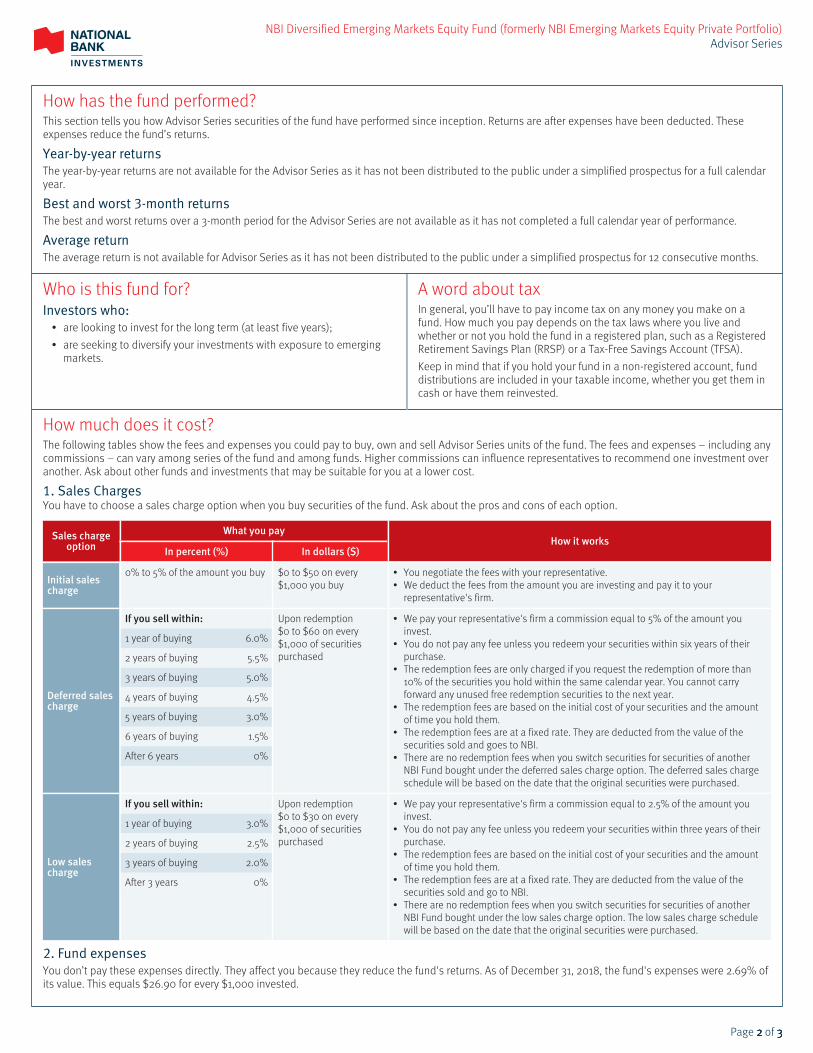
How has the fund performed?This section tells you how Advisor Series securities of the fund have performed since inception. Returns are after expenses have been deducted. Theseexpenses reduce the fund’s returns.
Year-by-year returnsThe year-by-year returns are not available for the Advisor Series as it has not been distributed to the public under a simplified prospectus for a full calendaryear.
Best and worst 3-month returnsThe best and worst returns over a 3-month period for the Advisor Series are not available as it has not completed a full calendar year of performance.
Average returnThe average return is not available for Advisor Series as it has not been distributed to the public under a simplified prospectus for 12 consecutive months.
Who is this fund for?Investors who:
• are looking to invest for the long term (at least five years);• are seeking to diversify your investments with exposure to emerging
markets.
A word about taxIn general, you’ll have to pay income tax on any money you make on afund. How much you pay depends on the tax laws where you live andwhether or not you hold the fund in a registered plan, such as a RegisteredRetirement Savings Plan (RRSP) or a Tax-Free Savings Account (TFSA).Keep in mind that if you hold your fund in a non-registered account, funddistributions are included in your taxable income, whether you get them incash or have them reinvested.
How much does it cost?The following tables show the fees and expenses you could pay to buy, own and sell Advisor Series units of the fund. The fees and expenses – including anycommissions – can vary among series of the fund and among funds. Higher commissions can influence representatives to recommend one investment overanother. Ask about other funds and investments that may be suitable for you at a lower cost.
1. Sales ChargesYou have to choose a sales charge option when you buy securities of the fund. Ask about the pros and cons of each option.
Sales chargeoption
What you pay
In percent (%) In dollars ($)How it works
Initial salescharge
0% to 5% of the amount you buy $0 to $50 on every$1,000 you buy
• You negotiate the fees with your representative.• We deduct the fees from the amount you are investing and pay it to your
representative's firm.
Deferred salescharge
If you sell within:
1 year of buying 6.0%
2 years of buying 5.5%
3 years of buying 5.0%
4 years of buying 4.5%
5 years of buying 3.0%
6 years of buying 1.5%
After 6 years 0%
Upon redemption$0 to $60 on every$1,000 of securitiespurchased
• We pay your representative's firm a commission equal to 5% of the amount youinvest.
• You do not pay any fee unless you redeem your securities within six years of theirpurchase.
• The redemption fees are only charged if you request the redemption of more than10% of the securities you hold within the same calendar year. You cannot carryforward any unused free redemption securities to the next year.
• The redemption fees are based on the initial cost of your securities and the amountof time you hold them.
• The redemption fees are at a fixed rate. They are deducted from the value of thesecurities sold and goes to NBI.
• There are no redemption fees when you switch securities for securities of anotherNBI Fund bought under the deferred sales charge option. The deferred sales chargeschedule will be based on the date that the original securities were purchased.
Low salescharge
If you sell within:
1 year of buying 3.0%
2 years of buying 2.5%
3 years of buying 2.0%
After 3 years 0%
Upon redemption$0 to $30 on every$1,000 of securitiespurchased
• We pay your representative's firm a commission equal to 2.5% of the amount youinvest.
• You do not pay any fee unless you redeem your securities within three years of theirpurchase.
• The redemption fees are based on the initial cost of your securities and the amountof time you hold them.
• The redemption fees are at a fixed rate. They are deducted from the value of thesecurities sold and go to NBI.
• There are no redemption fees when you switch securities for securities of anotherNBI Fund bought under the low sales charge option. The low sales charge schedulewill be based on the date that the original securities were purchased.
2. Fund expensesYou don’t pay these expenses directly. They affect you because they reduce the fund's returns. As of December 31, 2018, the fund's expenses were 2.69% ofits value. This equals $26.90 for every $1,000 invested.
Page 2222 of 3333
NBI Diversified Emerging Markets Equity Fund (formerly NBI Emerging Markets Equity Private Portfolio)Advisor Series
How much does it cost? (cont’d)
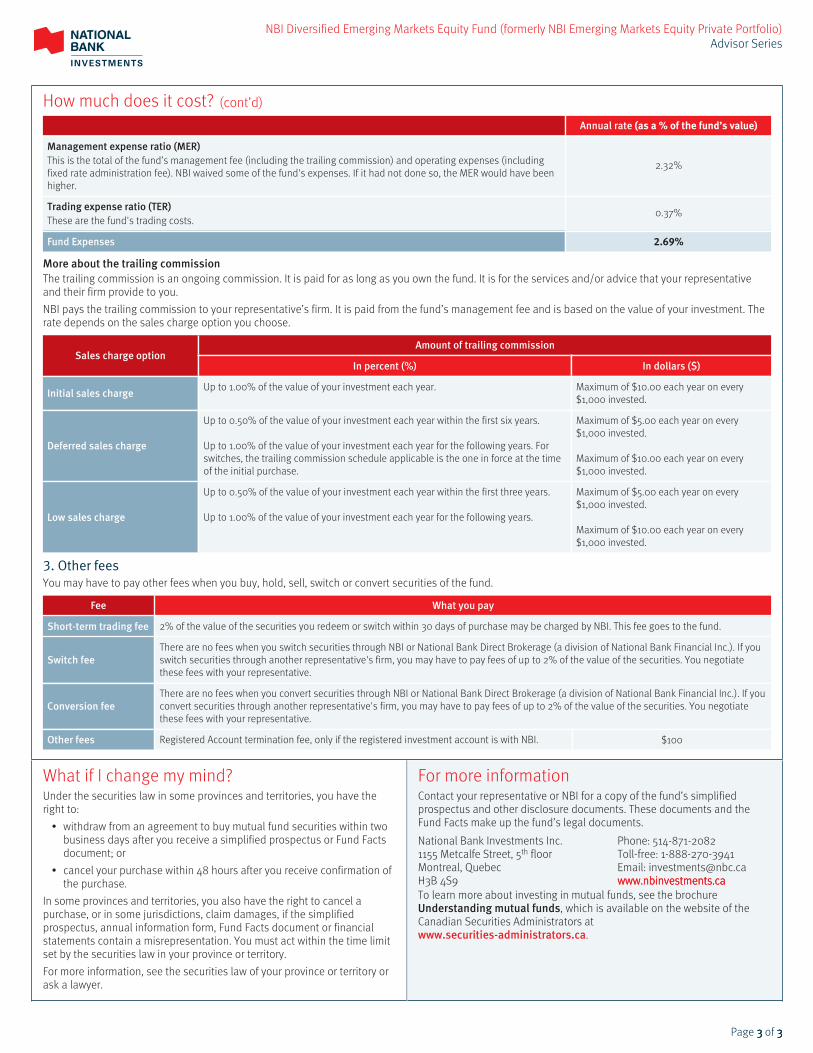
Annual rate (as a % of the fund’s value)
Management expense ratio (MER)This is the total of the fund’s management fee (including the trailing commission) and operating expenses (includingfixed rate administration fee). NBI waived some of the fund's expenses. If it had not done so, the MER would have beenhigher.
2.32%
Trading expense ratio (TER)These are the fund's trading costs.
0.37%
Fund Expenses 2.69%
More about the trailing commissionThe trailing commission is an ongoing commission. It is paid for as long as you own the fund. It is for the services and/or advice that your representativeand their firm provide to you.NBI pays the trailing commission to your representative’s firm. It is paid from the fund’s management fee and is based on the value of your investment. Therate depends on the sales charge option you choose.
Sales charge optionAmount of trailing commission
In percent (%) In dollars ($)
Initial sales chargeUp to 1.00% of the value of your investment each year. Maximum of $10.00 each year on every
$1,000 invested.
Deferred sales charge
Up to 0.50% of the value of your investment each year within the first six years.
Up to 1.00% of the value of your investment each year for the following years. Forswitches, the trailing commission schedule applicable is the one in force at the timeof the initial purchase.
Maximum of $5.00 each year on every$1,000 invested.
Maximum of $10.00 each year on every$1,000 invested.
Low sales charge
Up to 0.50% of the value of your investment each year within the first three years.
Up to 1.00% of the value of your investment each year for the following years.
Maximum of $5.00 each year on every$1,000 invested.
Maximum of $10.00 each year on every$1,000 invested.
3. Other feesYou may have to pay other fees when you buy, hold, sell, switch or convert securities of the fund.
Fee What you pay
Short-term trading fee 2% of the value of the securities you redeem or switch within 30 days of purchase may be charged by NBI. This fee goes to the fund.
Switch feeThere are no fees when you switch securities through NBI or National Bank Direct Brokerage (a division of National Bank Financial Inc.). If youswitch securities through another representative's firm, you may have to pay fees of up to 2% of the value of the securities. You negotiatethese fees with your representative.
Conversion feeThere are no fees when you convert securities through NBI or National Bank Direct Brokerage (a division of National Bank Financial Inc.). If youconvert securities through another representative's firm, you may have to pay fees of up to 2% of the value of the securities. You negotiatethese fees with your representative.
Other fees Registered Account termination fee, only if the registered investment account is with NBI. $100
What if I change my mind?Under the securities law in some provinces and territories, you have theright to:
• withdraw from an agreement to buy mutual fund securities within twobusiness days after you receive a simplified prospectus or Fund Factsdocument; or
• cancel your purchase within 48 hours after you receive confirmation ofthe purchase.
In some provinces and territories, you also have the right to cancel apurchase, or in some jurisdictions, claim damages, if the simplifiedprospectus, annual information form, Fund Facts document or financialstatements contain a misrepresentation. You must act within the time limitset by the securities law in your province or territory.For more information, see the securities law of your province or territory orask a lawyer.
For more informationContact your representative or NBI for a copy of the fund’s simplifiedprospectus and other disclosure documents. These documents and theFund Facts make up the fund’s legal documents.
National Bank Investments Inc.1155 Metcalfe Street, 5th floorMontreal, QuebecH3B 4S9
Phone: 514-871-2082Toll-free: 1-888-270-3941Email: investments@nbc.cawww.nbinvestments.cawww.nbinvestments.cawww.nbinvestments.ca
To learn more about investing in mutual funds, see the brochureUnderstanding mutual funds, which is available on the website of theCanadian Securities Administrators atwww.securities-administrators.ca.
Page 3333 of 3333
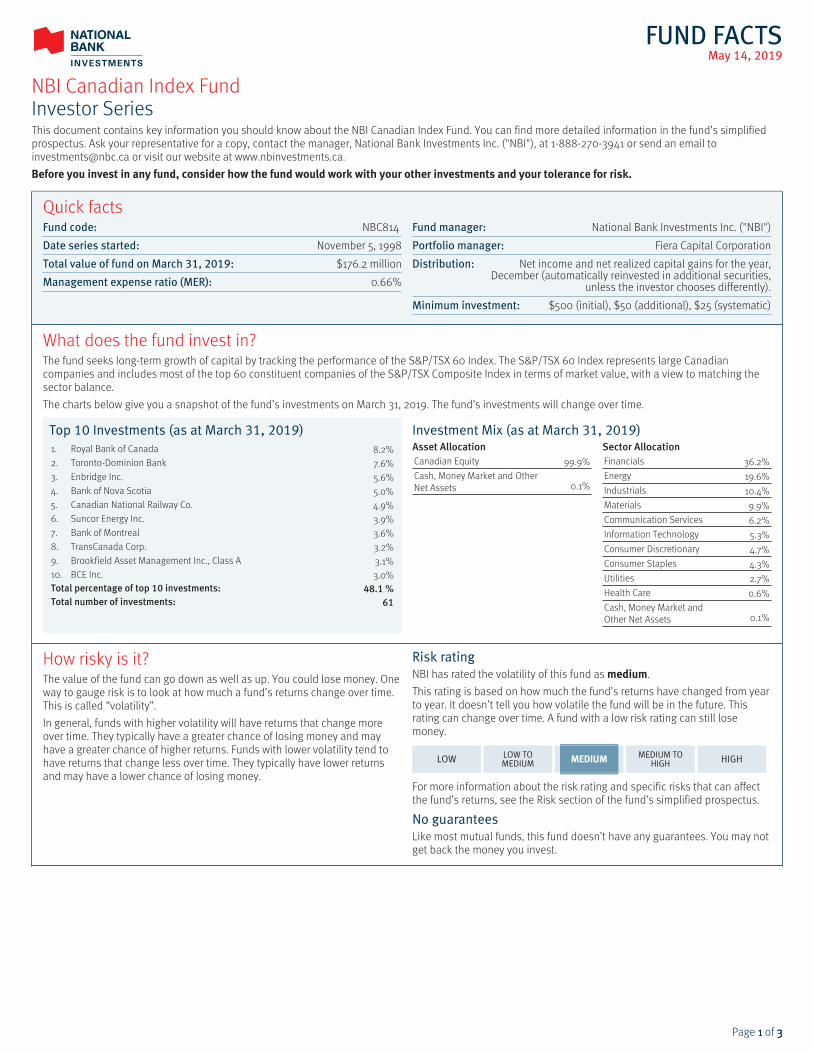
FUND FACTSMay 14, 2019
NBI Canadian Index FundInvestor SeriesThis document contains key information you should know about the NBI Canadian Index Fund. You can find more detailed information in the fund’s simplifiedprospectus. Ask your representative for a copy, contact the manager, National Bank Investments Inc. ("NBI"), at 1-888-270-3941 or send an email [email protected] or visit our website at www.nbinvestments.ca.Before you invest in any fund, consider how the fund would work with your other investments and your tolerance for risk.
Quick factsFund code: NBC814
Date series started: November 5, 1998
Total value of fund on March 31, 2019: $176.2 million
Management expense ratio (MER): 0.66%
Fund manager: National Bank Investments Inc. ("NBI")
Portfolio manager: Fiera Capital Corporation
Distribution: Net income and net realized capital gains for the year,December (automatically reinvested in additional securities,
unless the investor chooses differently).
Minimum investment: $500 (initial), $50 (additional), $25 (systematic)
What does the fund invest in?The fund seeks long-term growth of capital by tracking the performance of the S&P/TSX 60 Index. The S&P/TSX 60 Index represents large Canadiancompanies and includes most of the top 60 constituent companies of the S&P/TSX Composite Index in terms of market value, with a view to matching thesector balance.The charts below give you a snapshot of the fund’s investments on March 31, 2019. The fund’s investments will change over time.
Top 10 Investments (as at March 31, 2019)1. Royal Bank of Canada 8.2%2. Toronto-Dominion Bank 7.6%3. Enbridge Inc. 5.6%4. Bank of Nova Scotia 5.0%5. Canadian National Railway Co. 4.9%6. Suncor Energy Inc. 3.9%7. Bank of Montreal 3.6%8. TransCanada Corp. 3.2%9. Brookfield Asset Management Inc., Class A 3.1%10. BCE Inc. 3.0%Total percentage of top 10 investments: 48.1 %Total number of investments: 61
Investment Mix (as at March 31, 2019)Asset AllocationCanadian Equity 99.9%Cash, Money Market and OtherNet Assets 0.1%
Sector AllocationFinancials 36.2%Energy 19.6%Industrials 10.4%Materials 9.9%Communication Services 6.2%Information Technology 5.3%Consumer Discretionary 4.7%Consumer Staples 4.3%Utilities 2.7%Health Care 0.6%Cash, Money Market andOther Net Assets 0.1%
How risky is it?The value of the fund can go down as well as up. You could lose money. Oneway to gauge risk is to look at how much a fund’s returns change over time.This is called “volatility”.In general, funds with higher volatility will have returns that change moreover time. They typically have a greater chance of losing money and mayhave a greater chance of higher returns. Funds with lower volatility tend tohave returns that change less over time. They typically have lower returnsand may have a lower chance of losing money.
Risk ratingNBI has rated the volatility of this fund as medium.This rating is based on how much the fund’s returns have changed from yearto year. It doesn’t tell you how volatile the fund will be in the future. Thisrating can change over time. A fund with a low risk rating can still losemoney.
LOW LOW TOMEDIUM MEDIUM MEDIUM TO
HIGH HIGH
For more information about the risk rating and specific risks that can affectthe fund’s returns, see the Risk section of the fund’s simplified prospectus.
No guaranteesLike most mutual funds, this fund doesn’t have any guarantees. You may notget back the money you invest.
Page 1111 of 3333
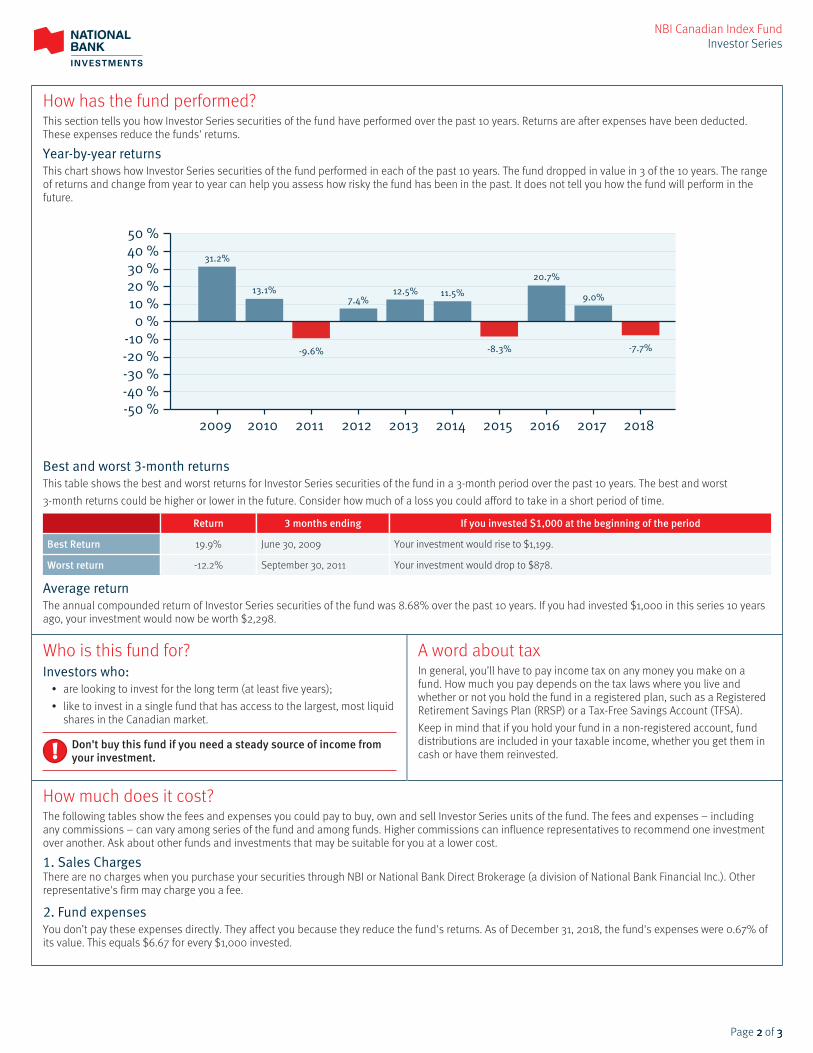
NBI Canadian Index FundInvestor Series
How has the fund performed?This section tells you how Investor Series securities of the fund have performed over the past 10 years. Returns are after expenses have been deducted.These expenses reduce the funds' returns.
Year-by-year returnsThis chart shows how Investor Series securities of the fund performed in each of the past 10 years. The fund dropped in value in 3 of the 10 years. The rangeof returns and change from year to year can help you assess how risky the fund has been in the past. It does not tell you how the fund will perform in thefuture.
31.2%
13.1%
-9.6%
7.4%12.5% 11.5%
-8.3%
20.7%
9.0%
-7.7%
-50 % -40 % -30 % -20 % -10 %
0 % 10 % 20 % 30 % 40 % 50 %
2009 2010 2011 2012 2013 2014 2015 2016 2017 2018
Best and worst 3-month returnsThis table shows the best and worst returns for Investor Series securities of the fund in a 3-month period over the past 10 years. The best and worst3-month returns could be higher or lower in the future. Consider how much of a loss you could afford to take in a short period of time.
Return 3 months ending If you invested $1,000 at the beginning of the period
Best Return 19.9% June 30, 2009 Your investment would rise to $1,199.
Worst return -12.2% September 30, 2011 Your investment would drop to $878.
Average returnThe annual compounded return of Investor Series securities of the fund was 8.68% over the past 10 years. If you had invested $1,000 in this series 10 yearsago, your investment would now be worth $2,298.
Who is this fund for?Investors who:
• are looking to invest for the long term (at least five years);• like to invest in a single fund that has access to the largest, most liquid
shares in the Canadian market.
Don't buy this fund if you need a steady source of income fromyour investment.
A word about taxIn general, you’ll have to pay income tax on any money you make on afund. How much you pay depends on the tax laws where you live andwhether or not you hold the fund in a registered plan, such as a RegisteredRetirement Savings Plan (RRSP) or a Tax-Free Savings Account (TFSA).Keep in mind that if you hold your fund in a non-registered account, funddistributions are included in your taxable income, whether you get them incash or have them reinvested.
How much does it cost?The following tables show the fees and expenses you could pay to buy, own and sell Investor Series units of the fund. The fees and expenses – includingany commissions – can vary among series of the fund and among funds. Higher commissions can influence representatives to recommend one investmentover another. Ask about other funds and investments that may be suitable for you at a lower cost.
1. Sales ChargesThere are no charges when you purchase your securities through NBI or National Bank Direct Brokerage (a division of National Bank Financial Inc.). Otherrepresentative's firm may charge you a fee.
2. Fund expensesYou don’t pay these expenses directly. They affect you because they reduce the fund's returns. As of December 31, 2018, the fund's expenses were 0.67% ofits value. This equals $6.67 for every $1,000 invested.
Page 2222 of 3333

NBI Canadian Index FundInvestor Series
How much does it cost? (cont’d)
Annual rate (as a % of the fund’s value)
Management expense ratio (MER)This is the total of the fund’s management fee (including the trailing commission) and operating expenses (includingfixed rate administration fee). NBI waived some of the fund's expenses. If it had not done so, the MER would have beenhigher.
0.66%
Trading expense ratio (TER)These are the fund's trading costs.
0.01%
Fund Expenses 0.67%
More about the trailing commissionThe trailing commission is an ongoing commission. It is paid for as long as you own the fund. It is for the services and/or advice that your representativeand their firm provide to you.NBI pays the trailing commission to your representative’s firm. It is paid from the fund’s management fee and is based on the value of your investment. Therate for this series of the fund is up to 0.25% of the value of your investment each year. This equals $2.50 each year for every $1,000 invested.
3. Other feesYou may have to pay other fees when you buy, hold, sell, switch or convert securities of the fund.
Fee What you pay
Short-term trading fee 2% of the value of the securities you redeem or switch within 30 days of purchase may be charged by NBI. This fee goes to the fund.
Other fees Registered Account termination fee, only if the registered investment account is with NBI. $100
What if I change my mind?Under the securities law in some provinces and territories, you have theright to:
• withdraw from an agreement to buy mutual fund securities within twobusiness days after you receive a simplified prospectus or Fund Factsdocument; or
• cancel your purchase within 48 hours after you receive confirmation ofthe purchase.
In some provinces and territories, you also have the right to cancel apurchase, or in some jurisdictions, claim damages, if the simplifiedprospectus, annual information form, Fund Facts document or financialstatements contain a misrepresentation. You must act within the time limitset by the securities law in your province or territory.For more information, see the securities law of your province or territory orask a lawyer.
For more informationContact your representative or NBI for a copy of the fund’s simplifiedprospectus and other disclosure documents. These documents and theFund Facts make up the fund’s legal documents.
National Bank Investments Inc.1155 Metcalfe Street, 5th floorMontreal, QuebecH3B 4S9
Phone: 514-871-2082Toll-free: 1-888-270-3941Email: investments@nbc.cawww.nbinvestments.cawww.nbinvestments.cawww.nbinvestments.ca
To learn more about investing in mutual funds, see the brochureUnderstanding mutual funds, which is available on the website of theCanadian Securities Administrators atwww.securities-administrators.ca.
Page 3333 of 3333
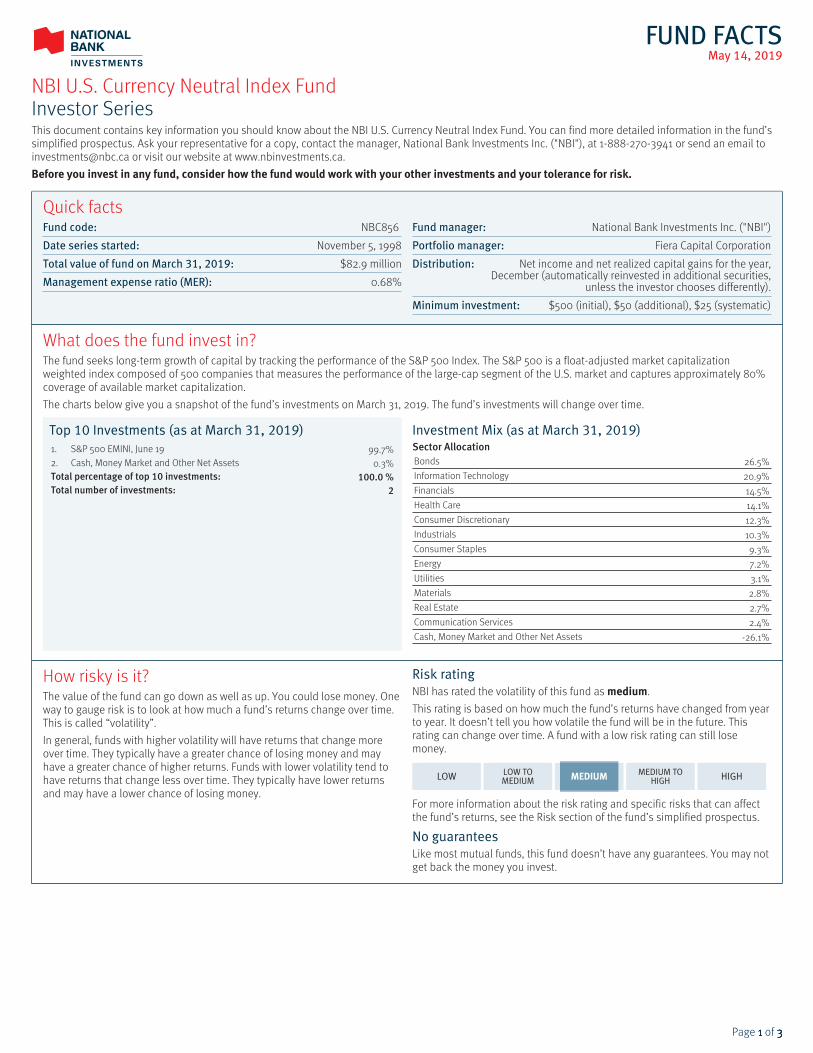
FUND FACTSMay 14, 2019
NBI U.S. Currency Neutral Index FundInvestor SeriesThis document contains key information you should know about the NBI U.S. Currency Neutral Index Fund. You can find more detailed information in the fund’ssimplified prospectus. Ask your representative for a copy, contact the manager, National Bank Investments Inc. ("NBI"), at 1-888-270-3941 or send an email [email protected] or visit our website at www.nbinvestments.ca.Before you invest in any fund, consider how the fund would work with your other investments and your tolerance for risk.
Quick factsFund code: NBC856
Date series started: November 5, 1998
Total value of fund on March 31, 2019: $82.9 million
Management expense ratio (MER): 0.68%
Fund manager: National Bank Investments Inc. ("NBI")
Portfolio manager: Fiera Capital Corporation
Distribution: Net income and net realized capital gains for the year,December (automatically reinvested in additional securities,
unless the investor chooses differently).
Minimum investment: $500 (initial), $50 (additional), $25 (systematic)
What does the fund invest in?The fund seeks long-term growth of capital by tracking the performance of the S&P 500 Index. The S&P 500 is a float-adjusted market capitalizationweighted index composed of 500 companies that measures the performance of the large-cap segment of the U.S. market and captures approximately 80%coverage of available market capitalization.The charts below give you a snapshot of the fund’s investments on March 31, 2019. The fund’s investments will change over time.
Top 10 Investments (as at March 31, 2019)1. S&P 500 EMINI, June 19 99.7%2. Cash, Money Market and Other Net Assets 0.3%Total percentage of top 10 investments: 100.0 %Total number of investments: 2
Investment Mix (as at March 31, 2019)Sector AllocationBonds 26.5%Information Technology 20.9%Financials 14.5%Health Care 14.1%Consumer Discretionary 12.3%Industrials 10.3%Consumer Staples 9.3%Energy 7.2%Utilities 3.1%Materials 2.8%Real Estate 2.7%Communication Services 2.4%Cash, Money Market and Other Net Assets -26.1%
How risky is it?The value of the fund can go down as well as up. You could lose money. Oneway to gauge risk is to look at how much a fund’s returns change over time.This is called “volatility”.In general, funds with higher volatility will have returns that change moreover time. They typically have a greater chance of losing money and mayhave a greater chance of higher returns. Funds with lower volatility tend tohave returns that change less over time. They typically have lower returnsand may have a lower chance of losing money.
Risk ratingNBI has rated the volatility of this fund as medium.This rating is based on how much the fund’s returns have changed from yearto year. It doesn’t tell you how volatile the fund will be in the future. Thisrating can change over time. A fund with a low risk rating can still losemoney.
LOW LOW TOMEDIUM MEDIUM MEDIUM TO
HIGH HIGH
For more information about the risk rating and specific risks that can affectthe fund’s returns, see the Risk section of the fund’s simplified prospectus.
No guaranteesLike most mutual funds, this fund doesn’t have any guarantees. You may notget back the money you invest.
Page 1111 of 3333
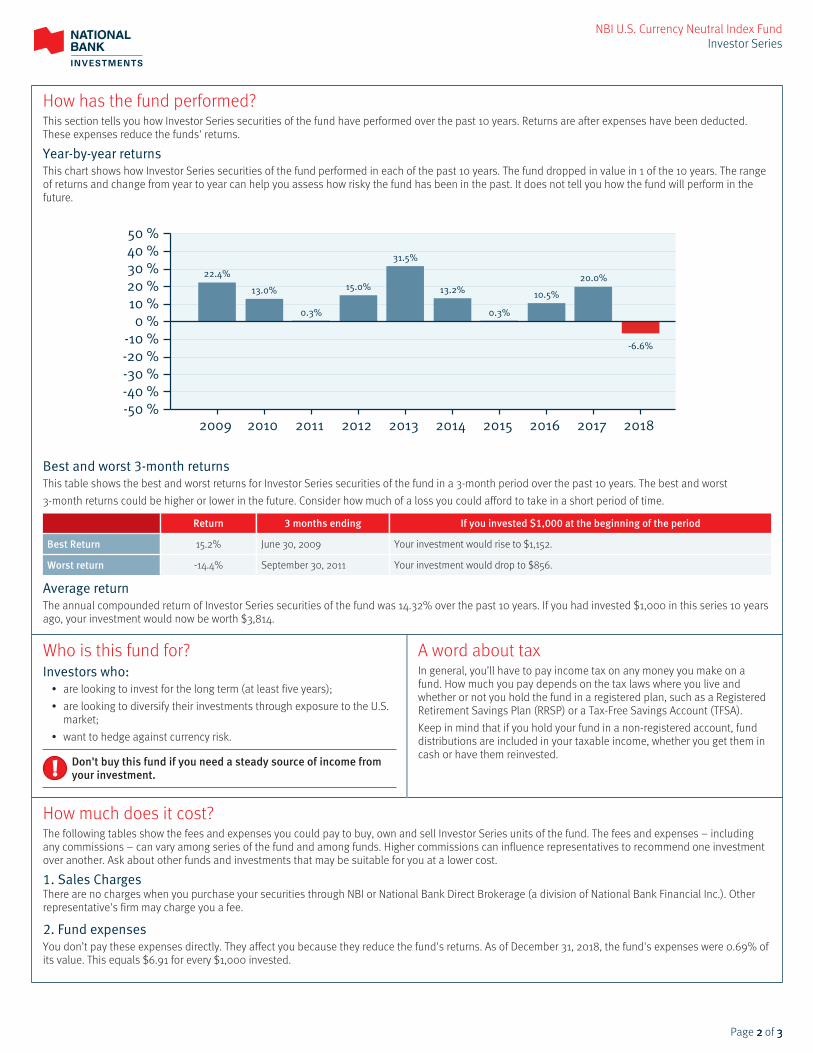
NBI U.S. Currency Neutral Index FundInvestor Series
How has the fund performed?This section tells you how Investor Series securities of the fund have performed over the past 10 years. Returns are after expenses have been deducted.These expenses reduce the funds' returns.
Year-by-year returnsThis chart shows how Investor Series securities of the fund performed in each of the past 10 years. The fund dropped in value in 1 of the 10 years. The rangeof returns and change from year to year can help you assess how risky the fund has been in the past. It does not tell you how the fund will perform in thefuture.
22.4%
13.0%
0.3%
15.0%
31.5%
13.2%
0.3%
10.5%
20.0%
-6.6%
-50 % -40 % -30 % -20 % -10 %
0 % 10 % 20 % 30 % 40 % 50 %
2009 2010 2011 2012 2013 2014 2015 2016 2017 2018
Best and worst 3-month returnsThis table shows the best and worst returns for Investor Series securities of the fund in a 3-month period over the past 10 years. The best and worst3-month returns could be higher or lower in the future. Consider how much of a loss you could afford to take in a short period of time.
Return 3 months ending If you invested $1,000 at the beginning of the period
Best Return 15.2% June 30, 2009 Your investment would rise to $1,152.
Worst return -14.4% September 30, 2011 Your investment would drop to $856.
Average returnThe annual compounded return of Investor Series securities of the fund was 14.32% over the past 10 years. If you had invested $1,000 in this series 10 yearsago, your investment would now be worth $3,814.
Who is this fund for?Investors who:
• are looking to invest for the long term (at least five years);• are looking to diversify their investments through exposure to the U.S.
market;• want to hedge against currency risk.
Don't buy this fund if you need a steady source of income fromyour investment.
A word about taxIn general, you’ll have to pay income tax on any money you make on afund. How much you pay depends on the tax laws where you live andwhether or not you hold the fund in a registered plan, such as a RegisteredRetirement Savings Plan (RRSP) or a Tax-Free Savings Account (TFSA).Keep in mind that if you hold your fund in a non-registered account, funddistributions are included in your taxable income, whether you get them incash or have them reinvested.
How much does it cost?The following tables show the fees and expenses you could pay to buy, own and sell Investor Series units of the fund. The fees and expenses – includingany commissions – can vary among series of the fund and among funds. Higher commissions can influence representatives to recommend one investmentover another. Ask about other funds and investments that may be suitable for you at a lower cost.
1. Sales ChargesThere are no charges when you purchase your securities through NBI or National Bank Direct Brokerage (a division of National Bank Financial Inc.). Otherrepresentative's firm may charge you a fee.
2. Fund expensesYou don’t pay these expenses directly. They affect you because they reduce the fund's returns. As of December 31, 2018, the fund's expenses were 0.69% ofits value. This equals $6.91 for every $1,000 invested.
Page 2222 of 3333

NBI U.S. Currency Neutral Index FundInvestor Series
How much does it cost? (cont’d)
Annual rate (as a % of the fund’s value)
Management expense ratio (MER)This is the total of the fund’s management fee (including the trailing commission) and operating expenses (includingfixed rate administration fee). NBI waived some of the fund's expenses. If it had not done so, the MER would have beenhigher.
0.68%
Trading expense ratio (TER)These are the fund's trading costs.
0.01%
Fund Expenses 0.69%
More about the trailing commissionThe trailing commission is an ongoing commission. It is paid for as long as you own the fund. It is for the services and/or advice that your representativeand their firm provide to you.NBI pays the trailing commission to your representative’s firm. It is paid from the fund’s management fee and is based on the value of your investment. Therate for this series of the fund is up to 0.25% of the value of your investment each year. This equals $2.50 each year for every $1,000 invested.
3. Other feesYou may have to pay other fees when you buy, hold, sell, switch or convert securities of the fund.
Fee What you pay
Short-term trading fee 2% of the value of the securities you redeem or switch within 30 days of purchase may be charged by NBI. This fee goes to the fund.
Other fees Registered Account termination fee, only if the registered investment account is with NBI. $100
What if I change my mind?Under the securities law in some provinces and territories, you have theright to:
• withdraw from an agreement to buy mutual fund securities within twobusiness days after you receive a simplified prospectus or Fund Factsdocument; or
• cancel your purchase within 48 hours after you receive confirmation ofthe purchase.
In some provinces and territories, you also have the right to cancel apurchase, or in some jurisdictions, claim damages, if the simplifiedprospectus, annual information form, Fund Facts document or financialstatements contain a misrepresentation. You must act within the time limitset by the securities law in your province or territory.For more information, see the securities law of your province or territory orask a lawyer.
For more informationContact your representative or NBI for a copy of the fund’s simplifiedprospectus and other disclosure documents. These documents and theFund Facts make up the fund’s legal documents.
National Bank Investments Inc.1155 Metcalfe Street, 5th floorMontreal, QuebecH3B 4S9
Phone: 514-871-2082Toll-free: 1-888-270-3941Email: investments@nbc.cawww.nbinvestments.cawww.nbinvestments.cawww.nbinvestments.ca
To learn more about investing in mutual funds, see the brochureUnderstanding mutual funds, which is available on the website of theCanadian Securities Administrators atwww.securities-administrators.ca.
Page 3333 of 3333
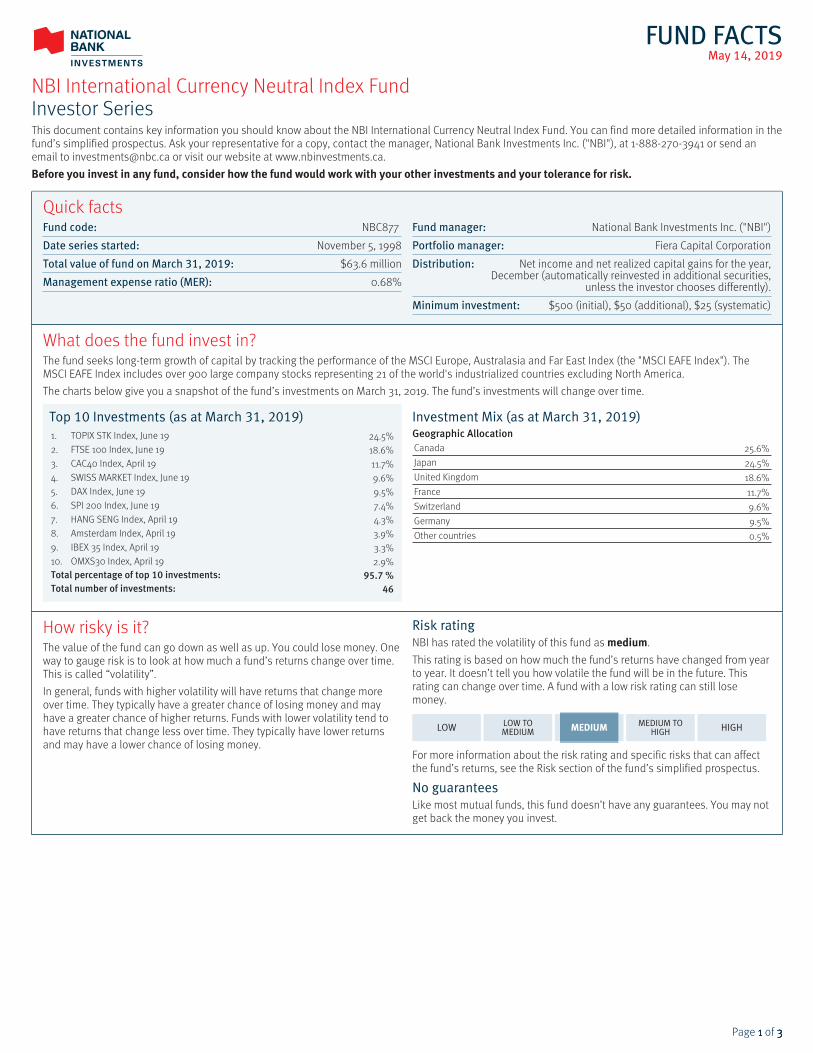
FUND FACTSMay 14, 2019
NBI International Currency Neutral Index FundInvestor SeriesThis document contains key information you should know about the NBI International Currency Neutral Index Fund. You can find more detailed information in thefund’s simplified prospectus. Ask your representative for a copy, contact the manager, National Bank Investments Inc. ("NBI"), at 1-888-270-3941 or send anemail to [email protected] or visit our website at www.nbinvestments.ca.Before you invest in any fund, consider how the fund would work with your other investments and your tolerance for risk.
Quick factsFund code: NBC877
Date series started: November 5, 1998
Total value of fund on March 31, 2019: $63.6 million
Management expense ratio (MER): 0.68%
Fund manager: National Bank Investments Inc. ("NBI")
Portfolio manager: Fiera Capital Corporation
Distribution: Net income and net realized capital gains for the year,December (automatically reinvested in additional securities,
unless the investor chooses differently).
Minimum investment: $500 (initial), $50 (additional), $25 (systematic)
What does the fund invest in?The fund seeks long-term growth of capital by tracking the performance of the MSCI Europe, Australasia and Far East Index (the "MSCI EAFE Index"). TheMSCI EAFE Index includes over 900 large company stocks representing 21 of the world's industrialized countries excluding North America.The charts below give you a snapshot of the fund’s investments on March 31, 2019. The fund’s investments will change over time.
Top 10 Investments (as at March 31, 2019)1. TOPIX STK Index, June 19 24.5%2. FTSE 100 Index, June 19 18.6%3. CAC40 Index, April 19 11.7%4. SWISS MARKET Index, June 19 9.6%5. DAX Index, June 19 9.5%6. SPI 200 Index, June 19 7.4%7. HANG SENG Index, April 19 4.3%8. Amsterdam Index, April 19 3.9%9. IBEX 35 Index, April 19 3.3%10. OMXS30 Index, April 19 2.9%Total percentage of top 10 investments: 95.7 %Total number of investments: 46
Investment Mix (as at March 31, 2019)Geographic AllocationCanada 25.6%Japan 24.5%United Kingdom 18.6%France 11.7%Switzerland 9.6%Germany 9.5%Other countries 0.5%
How risky is it?The value of the fund can go down as well as up. You could lose money. Oneway to gauge risk is to look at how much a fund’s returns change over time.This is called “volatility”.In general, funds with higher volatility will have returns that change moreover time. They typically have a greater chance of losing money and mayhave a greater chance of higher returns. Funds with lower volatility tend tohave returns that change less over time. They typically have lower returnsand may have a lower chance of losing money.
Risk ratingNBI has rated the volatility of this fund as medium.This rating is based on how much the fund’s returns have changed from yearto year. It doesn’t tell you how volatile the fund will be in the future. Thisrating can change over time. A fund with a low risk rating can still losemoney.
LOW LOW TOMEDIUM MEDIUM MEDIUM TO
HIGH HIGH
For more information about the risk rating and specific risks that can affectthe fund’s returns, see the Risk section of the fund’s simplified prospectus.
No guaranteesLike most mutual funds, this fund doesn’t have any guarantees. You may notget back the money you invest.
Page 1111 of 3333
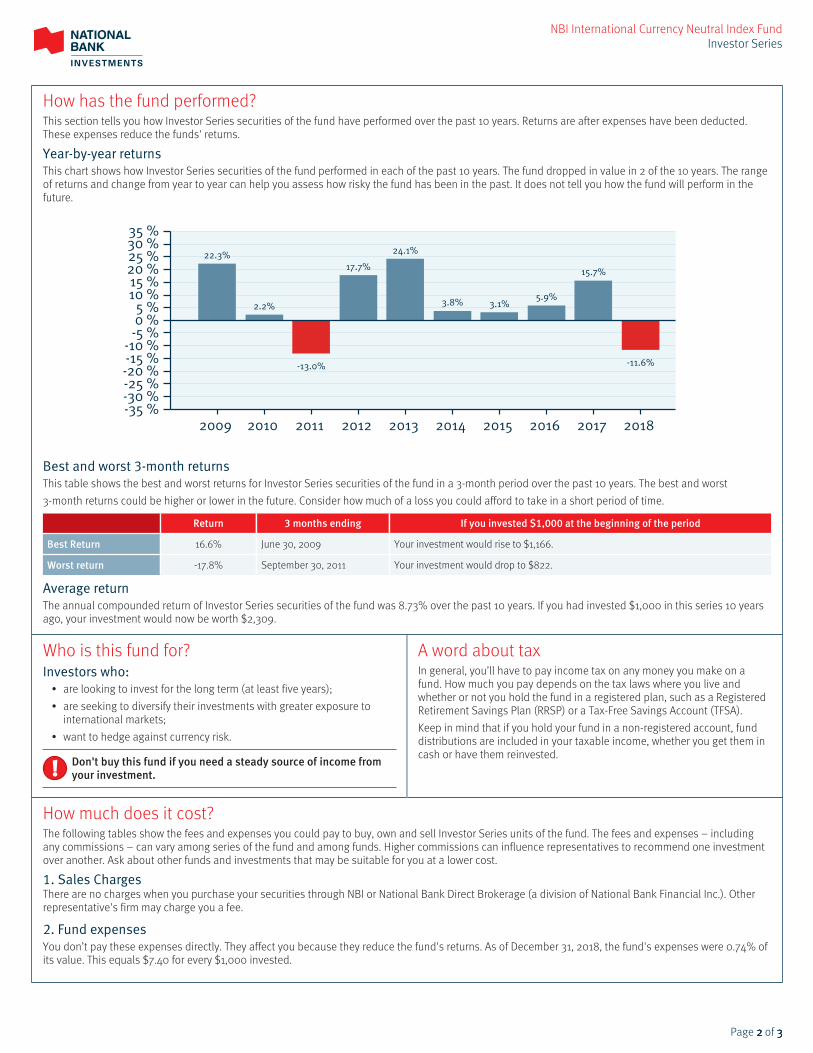
NBI International Currency Neutral Index FundInvestor Series
How has the fund performed?This section tells you how Investor Series securities of the fund have performed over the past 10 years. Returns are after expenses have been deducted.These expenses reduce the funds' returns.
Year-by-year returnsThis chart shows how Investor Series securities of the fund performed in each of the past 10 years. The fund dropped in value in 2 of the 10 years. The rangeof returns and change from year to year can help you assess how risky the fund has been in the past. It does not tell you how the fund will perform in thefuture.
22.3%
2.2%
-13.0%
17.7%
24.1%
3.8% 3.1%5.9%
15.7%
-11.6%
-35 % -30 % -25 % -20 % -15 % -10 %
-5 % 0 % 5 %
10 % 15 % 20 % 25 % 30 % 35 %
2009 2010 2011 2012 2013 2014 2015 2016 2017 2018
Best and worst 3-month returnsThis table shows the best and worst returns for Investor Series securities of the fund in a 3-month period over the past 10 years. The best and worst3-month returns could be higher or lower in the future. Consider how much of a loss you could afford to take in a short period of time.
Return 3 months ending If you invested $1,000 at the beginning of the period
Best Return 16.6% June 30, 2009 Your investment would rise to $1,166.
Worst return -17.8% September 30, 2011 Your investment would drop to $822.
Average returnThe annual compounded return of Investor Series securities of the fund was 8.73% over the past 10 years. If you had invested $1,000 in this series 10 yearsago, your investment would now be worth $2,309.
Who is this fund for?Investors who:
• are looking to invest for the long term (at least five years);• are seeking to diversify their investments with greater exposure to
international markets;• want to hedge against currency risk.
Don't buy this fund if you need a steady source of income fromyour investment.
A word about taxIn general, you’ll have to pay income tax on any money you make on afund. How much you pay depends on the tax laws where you live andwhether or not you hold the fund in a registered plan, such as a RegisteredRetirement Savings Plan (RRSP) or a Tax-Free Savings Account (TFSA).Keep in mind that if you hold your fund in a non-registered account, funddistributions are included in your taxable income, whether you get them incash or have them reinvested.
How much does it cost?The following tables show the fees and expenses you could pay to buy, own and sell Investor Series units of the fund. The fees and expenses – includingany commissions – can vary among series of the fund and among funds. Higher commissions can influence representatives to recommend one investmentover another. Ask about other funds and investments that may be suitable for you at a lower cost.
1. Sales ChargesThere are no charges when you purchase your securities through NBI or National Bank Direct Brokerage (a division of National Bank Financial Inc.). Otherrepresentative's firm may charge you a fee.
2. Fund expensesYou don’t pay these expenses directly. They affect you because they reduce the fund's returns. As of December 31, 2018, the fund's expenses were 0.74% ofits value. This equals $7.40 for every $1,000 invested.
Page 2222 of 3333

NBI International Currency Neutral Index FundInvestor Series
How much does it cost? (cont’d)
Annual rate (as a % of the fund’s value)
Management expense ratio (MER)This is the total of the fund’s management fee (including the trailing commission) and operating expenses (includingfixed rate administration fee). NBI waived some of the fund's expenses. If it had not done so, the MER would have beenhigher.
0.68%
Trading expense ratio (TER)These are the fund's trading costs.
0.06%
Fund Expenses 0.74%
More about the trailing commissionThe trailing commission is an ongoing commission. It is paid for as long as you own the fund. It is for the services and/or advice that your representativeand their firm provide to you.NBI pays the trailing commission to your representative’s firm. It is paid from the fund’s management fee and is based on the value of your investment. Therate for this series of the fund is up to 0.25% of the value of your investment each year. This equals $2.50 each year for every $1,000 invested.
3. Other feesYou may have to pay other fees when you buy, hold, sell, switch or convert securities of the fund.
Fee What you pay
Short-term trading fee 2% of the value of the securities you redeem or switch within 30 days of purchase may be charged by NBI. This fee goes to the fund.
Other fees Registered Account termination fee, only if the registered investment account is with NBI. $100
What if I change my mind?Under the securities law in some provinces and territories, you have theright to:
• withdraw from an agreement to buy mutual fund securities within twobusiness days after you receive a simplified prospectus or Fund Factsdocument; or
• cancel your purchase within 48 hours after you receive confirmation ofthe purchase.
In some provinces and territories, you also have the right to cancel apurchase, or in some jurisdictions, claim damages, if the simplifiedprospectus, annual information form, Fund Facts document or financialstatements contain a misrepresentation. You must act within the time limitset by the securities law in your province or territory.For more information, see the securities law of your province or territory orask a lawyer.
For more informationContact your representative or NBI for a copy of the fund’s simplifiedprospectus and other disclosure documents. These documents and theFund Facts make up the fund’s legal documents.
National Bank Investments Inc.1155 Metcalfe Street, 5th floorMontreal, QuebecH3B 4S9
Phone: 514-871-2082Toll-free: 1-888-270-3941Email: investments@nbc.cawww.nbinvestments.cawww.nbinvestments.cawww.nbinvestments.ca
To learn more about investing in mutual funds, see the brochureUnderstanding mutual funds, which is available on the website of theCanadian Securities Administrators atwww.securities-administrators.ca.
Page 3333 of 3333