Embed Size (px)
Citation preview

National Association of REALTORS® Research Group
April, 2019

2019 NAR Leadership Team
JOHN SMABY, CRB, GRIPresident
VINCE MALTA President-Elect
CHARLIE OPPLERFirst Vice President
JOHN FLOR, ABR, CRS, GRI, EPRO Treasurer
ELIZABETH MENDENHALL, ABR, ABRM, CIPS, CRB, GRI, PMN, EPROImmediate Past President
BRIAN COPELAND, CIPS, CRS, GRI, EPROVice President of Association Affairs
TRACY KASPER, CRS, GRI, SFRVice President of Advocacy
BOB GOLDBERGChief Executive Officer
22019 NAR Home Buyer and Seller Generational Trends

NAR Research Staff
3
Lawrence Yun, Ph.D.Chief Economist and Senior Vice President
Jessica Lautz, DrRealEstVice President, Demographics and Behavioral Insights
Brandi SnowdenDirector, Member and Consumer Survey Research
Amanda RiggsResearch Survey Analyst
Brian HorowitzResearch Survey Analyst
Anna SchnerreResearch Assistant
2019 NAR Home Buyer and Seller Generational Trends

Table of Contents
4
Introduction 5
Chapter 1: Characteristics of Home Buyers 10
Chapter 2: Characteristics of Homes Purchased 27
Chapter 3: The Home Search Process 46
Chapter 4: Home Buying and Real Estate Professionals 60
Chapter 5: Financing the Home Purchase 77
Chapter 6: Home Sellers and Their Selling Experience 93
Chapter 7: Home Selling and Real Estate Professionals 120
Methodology 134
2019 NAR Home Buyer and Seller Generational Trends

Introduction
52019 NAR Home Buyer and Seller Generational Trends

AGE OF HOME BUYERS
Silent Generation1925-1945
Older Boomers1946-1954
Younger Boomers1955-1964
1920
Gen X1965-1979
Younger Gen Y / Millennials
1990-1998
Older Gen Y / Millennials:
1980-1989
62019 NAR Home Buyer and Seller Generational Trends
2019
Gen Z1999 to Present

SHARE OF BUYERS AND SELLERS BY GENERAITON
72019 NAR Home Buyer and Seller Generational Trends
12%
22%
21%
25%
18%
2%
*
7%
14%
18%
24%
26%
11%
*
% 5% 10% 15% 20% 25% 30%
Silent Generation:
Older Boomers:
Younger Boomers:
Gen Xers:
Older Gen Y/Millennials:
Younger Gen Y/Millennials:
Gen Zers:
Buyers Sellers
*Less than 1 percent

IntroductionSince 2013, the National Association of REALTORS® has written the Home Buyers and Sellers Generational Trends Report. This report provides insights into differences and similarities across generations of home buyers and sellers. The home buyer and seller data is taken from the annual Profile of Home Buyers and Sellers.
New in this year’s report is the segmentation of the Millennial generation: buyers 21 to 28 years (Younger Millennials/Gen Yers) and buyers 29 to 38 years (Older Millennials/Gen Yers). Millennials still made up the largest share of home buyers at 37 percent. Older Millennials at 26 percent and Younger Millennials at 11 percent of the share of home buyers. Eighty-six percent of Younger Millennials and 52 percent of Older Millennials were first-time home buyers, more than other age groups. The largest cohort in America is growing up and becoming more traditional in their buying habits. Older Millennials had the largest buyer share of married couples (69 percent) and were the most likely to have children under the age of 18 living at home (58 percent). Commuting costs were most important to both Millennials groups and they purchased their homes closest to their previous residence. They were also the most likely to make compromises on their home purchase and had the shortest expected tenure in the home at 10 years.
Buyers 39 to 53 (Gen Xers) consisted of 24 percent of recent home buyers. They were consistent with their buying trends and demographics from last year. This group continued to be in their peak earning years and had the
highest median income at $111,100 in 2017, an increase from $104,700 in 2016. Correspondingly, buyers 39 to 53 purchased the most expensive homes at a median home price of $277,800, an increase over $266,400 in the previous year. They also bought the largest homes in size at a median of 2,100 square feet. They came in as a close second behind Older Millennials as the next largest share of buyers likely to be married and have children under the age of 18 in their home. Buyers 39 to 53 years were the mostly likely to purchase a multi-generational home. Notably, they were also the most racially and ethnically diverse population of home buyers, with 25 percent identifying they were a race other than White/Caucasian.
For the report, buyers 54 to 63 (Younger Baby Boomers) and buyers 64 to 72 (Older Baby Boomers) were broken into two separate categories as they have differing demographics and buying behaviors. Buyers 54 to 63 consisted of 18 percent of recent buyers and buyers 64 to 72 consisted of 14 percent of recent buyers, the same as last year. Buyers 54 to 63 had higher median household incomes and were more likely to be married couples. Buyers 54 to 63 purchased for an array of reasons such as the desire to own a home of their own, a job-relocation, and the desire to be closer to friends and family. Buyers 64 to 72 also projected the length of time they would live in their home at 20 years, longer than other age groups. They often moved due to a household member’s health or stated they were never moving and found their forever home. Buyers 64 to 72 typically moved the longest distance at a median of 30 miles and were less likely to make compromises on their home purchase.
82019 NAR Home Buyer and Seller Generational Trends
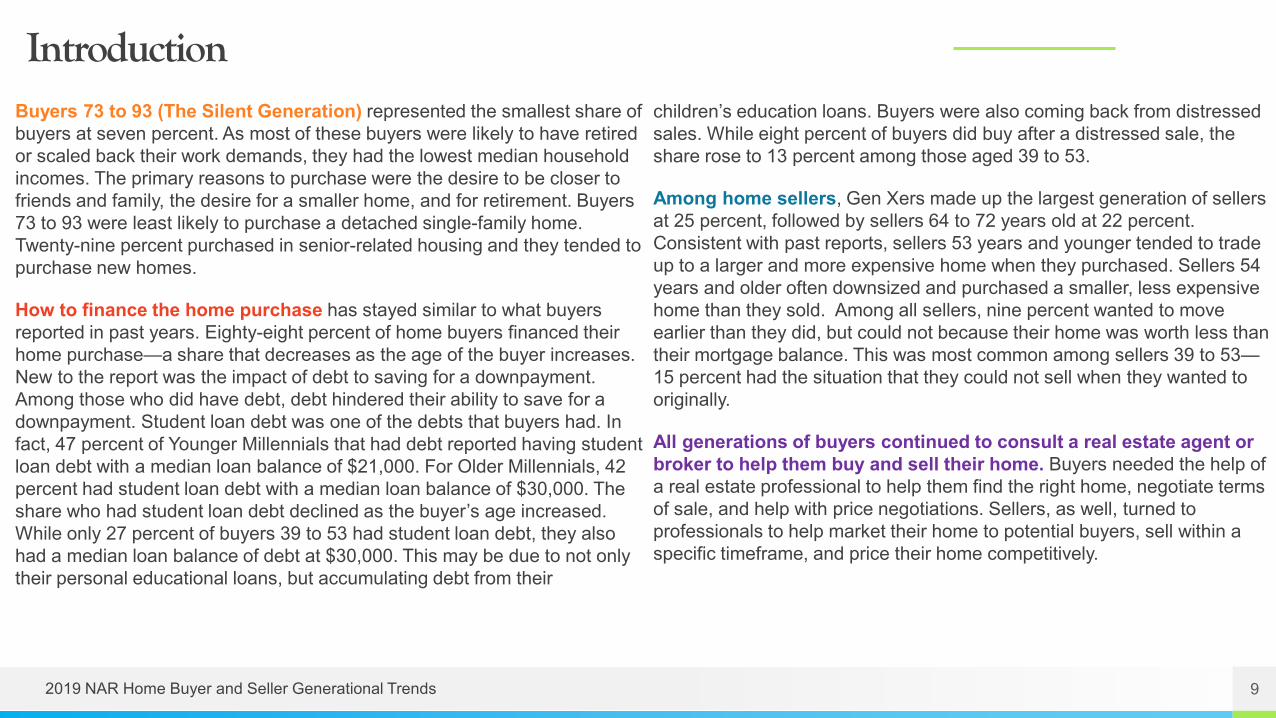
IntroductionBuyers 73 to 93 (The Silent Generation) represented the smallest share of buyers at seven percent. As most of these buyers were likely to have retired or scaled back their work demands, they had the lowest median household incomes. The primary reasons to purchase were the desire to be closer to friends and family, the desire for a smaller home, and for retirement. Buyers 73 to 93 were least likely to purchase a detached single-family home. Twenty-nine percent purchased in senior-related housing and they tended to purchase new homes.
How to finance the home purchase has stayed similar to what buyers reported in past years. Eighty-eight percent of home buyers financed their home purchase—a share that decreases as the age of the buyer increases. New to the report was the impact of debt to saving for a downpayment. Among those who did have debt, debt hindered their ability to save for a downpayment. Student loan debt was one of the debts that buyers had. In fact, 47 percent of Younger Millennials that had debt reported having student loan debt with a median loan balance of $21,000. For Older Millennials, 42 percent had student loan debt with a median loan balance of $30,000. The share who had student loan debt declined as the buyer’s age increased. While only 27 percent of buyers 39 to 53 had student loan debt, they also had a median loan balance of debt at $30,000. This may be due to not only their personal educational loans, but accumulating debt from their
children’s education loans. Buyers were also coming back from distressed sales. While eight percent of buyers did buy after a distressed sale, the share rose to 13 percent among those aged 39 to 53.
Among home sellers, Gen Xers made up the largest generation of sellers at 25 percent, followed by sellers 64 to 72 years old at 22 percent. Consistent with past reports, sellers 53 years and younger tended to trade up to a larger and more expensive home when they purchased. Sellers 54 years and older often downsized and purchased a smaller, less expensive home than they sold. Among all sellers, nine percent wanted to move earlier than they did, but could not because their home was worth less than their mortgage balance. This was most common among sellers 39 to 53—15 percent had the situation that they could not sell when they wanted to originally.
All generations of buyers continued to consult a real estate agent or broker to help them buy and sell their home. Buyers needed the help of a real estate professional to help them find the right home, negotiate terms of sale, and help with price negotiations. Sellers, as well, turned to professionals to help market their home to potential buyers, sell within a specific timeframe, and price their home competitively.
92019 NAR Home Buyer and Seller Generational Trends

Chapter 1Characteristics of Home Buyers
102019 NAR Home Buyer and Seller Generational Trends

Characteristics of Home Buyers
○ First-time buyers made up 33 percent of all home buyers, a decrease from last year at 34 percent. Fifty-two percent of buyers 29 to 38 years and 86 percent of buyers 28 years and younger were first-time home buyers. Following, 24 percent of buyers 39 to 53 years were also first-time home buyers.
○ At 26 percent, buyers 29 to 38 continue to be the largest generational group of buyers with a median age of 34, followed by buyers 39 to 53 at 24 percent with a median age of 45.
○ Buyers between the ages of 39 to 53 had the highest household incomes of any generation at $111,100 in 2017, followed by buyers between 54 to 63 that had a median income of $102,300.
○ Sixty-three percent of recent buyers were married couples, 18 percent were single females, nine percent were single males, and eight percent were unmarried couples. The highest percentage of single female buyers was found in the 54 to 63 years and 73 and older age group. The highest share of unmarried couples were found in the 28 and younger age group.
○ Thirty-seven percent of all buyers had children under the age of 18 living at home.
○ Fifty-eight percent of buyers between 29 to 38 years had at least one child under the age of 18 residing in the home.
○ Twelve percent of home buyers purchased a multi-generational home to take care of aging parents, for cost savings, and because children over the age of 18 were moving back. Sixteen percent of buyers aged 39 to 53 purchased a multi-generational home. Buyers 54 to 63 years comprised the second largest share at 15 percent.
○ The 39 to 53 age group showed to be the most racially diverse group of buyers in 2018. Twenty-two percent of this group of buyers identified as Hispanic / Latino, Black / African American, or Asian / Pacific Islander.
○ The most common reasons for recently purchasing a home differed between the generations. For all three groups under the age of 63 years, the main reason for purchasing was the desire to own a home of their own. Among the 63 and older age groups, the desire to be closer to friends and family was the top reason to purchase. Buyers between 73 and 93 years also purchased for the desire for a smaller home and retirement.
112019 NAR Home Buyer and Seller Generational Trends

Characteristics of Home Buyers
122019 NAR Home Buyer and Seller Generational Trends
Exhibit 1-1 • AGE OF HOME BUYERS
Exhibit 1-2 • HOUSEHOLD INCOME OF HOME BUYERS
Exhibit 1-3 • ADULT COMPOSITION OF HOME BUYER HOUSEHOLDS
Exhibit 1-4 • NUMBER OF CHILDREN UNDER THE AGE OF 18 RESIDING IN HOUSEHOLD
Exhibit 1-5 • HOME PURCHASED WAS A MULTI-GENERATIONAL HOME (WILL HOME ADULT SIBLINGS, ADULT CHILDREN, PARENTS, AND/OR GRANDPARENTS)
Exhibit 1-6 • HOME BUYER SEXUAL ORIENTATION
Exhibit 1-7 • RACE/ETHNICITY OF HOME BUYERS
Exhibit 1-8 • PRIMARY LANGUAGE SPOKEN IN HOME BUYER HOUSEHOLD
Exhibit 1-9 • NATIONAL ORIGIN OF HOME BUYERS
Exhibit 1-10 • FIRST-TIME HOME BUYERS IN AGE GROUP
Exhibit 1-11 • PRIOR LIVING ARRANGEMENT
Exhibit 1-12 • PRIMARY REASON FOR PURCHASING A HOME
Exhibit 1-13 • PRIMARY REASON FOR THE TIMING OF HOME PURCHASE
Exhibit 1-14 • OTHER HOMES OWNED

AGE OF HOME BUYERS
2019 NAR Home Buyer and Seller Generational Trends 13
Exhibit 1-1 (Percentage Distribution)
*Less than 1 percent
7%
14%
18%
24%
26%
11%
*
% 5% 10% 15% 20% 25% 30%
Silent Generation: 73 to 93 years
Older Boomers: 64 to 72 years
Younger Boomers: 54 to 63 years
Gen Xers: 39 to 53 years
Older Gen Y/Millennials: 29 to 38 years
Younger Gen Y/Millennials: 21 to 28 years
Gen Zers: 20 years and younger
Median Age in Group
20
26
34
45
59
68
76

HOUSEHOLD INCOME OF HOME BUYERS
2019 NAR Home Buyer and Seller Generational Trends 14
Exhibit 1-2 (Percentage Distribution)
AGE OF HOME BUYER
All Buyers 28 and younger 29 to 38 39 to 53 54 to 63 64 to 72 73 to 93
Less than $25,000 2% 3% 1% 1% 4% 3% 7%
$25,000 to $34,999 5 5 3 2 4 7 14
$35,000 to $44,999 6 9 4 5 6 8 11
$45,000 to $54,999 8 12 5 6 7 9 12
$55,000 to $64,999 8 16 7 4 8 9 9
$65,000 to $74,999 9 13 9 6 7 9 9
$75,000 to $84,999 8 12 8 8 6 9 7
$85,000 to $99,999 11 9 13 10 10 14 10
$100,000 to $124,999 15 10 16 18 16 11 9
$125,000 to $149,999 9 5 11 12 9 7 6
$150,000 to $174,999 6 3 8 8 5 4 3
$175,000 to $199,999 4 1 5 7 4 3 3
$200,000 or more 9 2 9 13 14 7 3
Median income (2017) $91,600 $71,200 $101,200 $111,100 $102,300 $83,200 $69,600

ADULT COMPOSITION OF HOME BUYER HOUSEHOLDS
2019 NAR Home Buyer and Seller Generational Trends 15
Exhibit 1-3 (Percentage Distribution)
63%
54%
69%65%
58%
65%
59%
18%15%
11%
17%
25%20%
25%
9% 11%6%
9% 10% 9% 9%8%
20%
13%8%
4% 4% 3%2% * 1% 2% 2% 2%5%
0%
20%
40%
60%
80%
All Buyers 28 and younger 29 to 38 39 to 53 54 to 63 64 to 72 73 to 93
Married couple Single female Single male Unmarried couple Other
*Less than 1 percent

NUMBER OF CHILDREN UNDER THE AGE OF 18 RESIDING IN HOUSEHOLD
2019 NAR Home Buyer and Seller Generational Trends 16
Exhibit 1-4 (Percentage Distribution of Households)
*Less than 1 percent
66%72%
42% 44%
89%
97% 96%
15% 18%23% 22%
7%2% 3%
13%8%
22% 23%
3% 1% *6%
2%
13% 11%
1% 1% 1%0%
20%
40%
60%
80%
100%
All Buyers 28 and younger 29 to 38 39 to 53 54 to 63 64 to 72 73 to 93
None One Two Three or more

HOME PURCHASED WAS A MULTI-GENERATIONAL HOME (WILL HOME ADULT SIBLINGS, ADULT CHILDREN, PARENTS, AND/OR GRANDPARENTS)
2019 NAR Home Buyer and Seller Generational Trends 17
Exhibit 1-5 (Percent of Respondents) AGE OF HOME BUYER
All Buyers 28 and younger 29 to 38 39 to 53 54 to 63 64 to 72 73 to 93
Multi-generational household 12% 6% 9% 16% 15% 13% 13%
Reasons for purchase:
Health/Caretaking of aging parents 26% 25% 33% 28% 24% 19% 13%
Cost Savings 22 34 28 16 11 16 14Children/relatives over 18 moving back into the house 18 18 6 25 31 28 19
Children/relatives over 18 never left home 17 5 3 27 15 4 10
To spend more time with aging parents 14 32 30 21 13 4 3
Wanted a larger home that multiple incomes could afford together 10 20 11 10 8 7 8
None of the above 25 27 26 12 23 34 51
Other 7 * 8 9 6 5 6
*Less than 1 percent

HOME BUYER SEXUAL ORIENTATION
2019 NAR Home Buyer and Seller Generational Trends 18
Exhibit 1-6 (Percentage Distribution)
AGE OF HOME BUYER
All Buyers 28 and younger 29 to 38 39 to 53 54 to 63 64 to 72 73 to 93
Heterosexual or straight 89% 90% 90% 90% 89% 87% 87%
Gay or lesbian 4 5 4 4 4 3 1
Bisexual 1 3 1 1 1 * 1
Prefer not to answer 7 3 6 5 6 11 11
*Less than 1 percent

RACE / ETHNICITY OF HOME BUYERS
2019 NAR Home Buyer and Seller Generational Trends 19
Exhibit 1-7 (Percent of Respondents)
AGE OF HOME BUYER
All Buyers 28 and younger 29 to 38 39 to 53 54 to 63 64 to 72 73 to 93
White/Caucasian 85% 87% 83% 79% 89% 92% 90%
Hispanic/Latino 6 8 7 9 4 3 6
Black/African-American 5 3 6 9 5 3 1
Asian/Pacific Islander 4 4 8 4 2 1 1
Other 3 1 3 3 2 2 3
Note: Respondents were permitted to select as many races and ethnicities as they felt applicable. The percentage distribution may therefore sum to more than 100 percent.

PRIMARY LANGUAGE SPOKEN IN HOME BUYER HOUSEHOLD
2019 NAR Home Buyer and Seller Generational Trends 20
Exhibit 1-8 (Percentage Distribution)
96% 97% 95% 94%98% 99% 97%
4% 3% 5% 6%2% 1% 3%
0%
20%
40%
60%
80%
100%
All Buyers 28 and younger 29 to 38 39 to 53 54 to 63 64 to 72 73 to 93
English Other

NATIONAL ORIGIN OF HOME BUYERS
2019 NAR Home Buyer and Seller Generational Trends 21
Exhibit 1-9 (Percentage Distribution)
91% 93%89% 88%
93%96% 96%
9% 7%11% 12%
7%4% 4%
0%
20%
40%
60%
80%
100%
All Buyers 28 and younger 29 to 38 39 to 53 54 to 63 64 to 72 73 to 93
Born in U.S. Not born in U.S.

FIRST-TIME HOME BUYERS IN AGE GROUP
2019 NAR Home Buyer and Seller Generational Trends 22
Exhibit 1-10 (Percent of all Home Buyers)
33%
86%
52%
24%
12%5% 4%
0%
20%
40%
60%
80%
100%
All Buyers 28 and younger 29 to 38 39 to 53 54 to 63 64 to 72 73 to 93

PRIOR LIVING ARRANGEMENT
2019 NAR Home Buyer and Seller Generational Trends 23
Exhibit 1-11 (Percentage Distribution)
AGE OF HOME BUYER
All Buyers 28 and younger 29 to 38 39 to 53 54 to 63 64 to 72 73 to 93
Owned previous home 49% 11% 35% 49% 65% 77% 82%
Rented an apartment or house 37 58 48 40 28 16 13
Lived with parents/relatives/friends, paid rent 6 13 7 4 3 3 2
Lived with parents/relatives/friends, did not pay rent 6 17 7 4 3 3 2
Rented the home ultimately purchased 2 * 2 3 1 2 *
*Less than 1 percent
Note: After selling their previous home, buyers may have rented a home or apartment before purchasing their next home. A first-time buyer could have acquired ownership of their previous home (as an inheritance or gift, for example) without having been the buyer of the home. Thus, a first-time buyer could have owned a home prior to their first home purchase.

PRIMARY REASON FOR PURCHASING A HOME
2019 NAR Home Buyer and Seller Generational Trends 24
Exhibit 1-12 (Percentage Distribution)
AGE OF HOME BUYER
All Buyers 28 and younger 29 to 38 39 to 53 54 to 63 64 to 72 73 to 93
Desire to own a home of my own 29% 60% 42% 27% 17% 7% 5%Desire for larger home 9 6 15 11 5 4 3Desire to be closer to family/friends/relatives 8 1 2 4 10 22 27Job-related relocation or move 8 3 9 12 12 2 1Change in family situation (e.g. marriage, birth of child, divorce, etc.) 7 9 7 9 7 6 6
Desire for a home in a better area 7 2 6 9 7 6 6Desire for smaller home 5 * * 3 9 13 17Retirement 5 * * 1 9 19 13Desire to be closer to job/school/transit 3 4 3 6 4 1 1Financial security 2 3 3 2 2 1 2Affordability of homes 2 3 2 2 2 2 2Establish a household 2 4 3 1 1 * *Desire for a newly built or custom-built home 2 * 1 2 3 3 *Desire for better home for pet(s) 1 1 2 1 1 1 1Tax benefits 1 * * 1 1 1 1Purchased home for family member or relative 1 * * * 1 1 2Greater number of homes on the market for sale/better choice * * * * * * *
Other 7 2 5 6 9 11 11*Less than 1 percent

PRIMARY REASON FOR THE TIMING OF HOME PURCHASE
2019 NAR Home Buyer and Seller Generational Trends 25
Exhibit 1-13 (Percentage Distribution)
AGE OF HOME BUYER
All Buyers 28 and younger 29 to 38 39 to 53 54 to 63 64 to 72 73 to 93
It was just the right time, was ready to buy a home 49% 62% 53% 46% 47% 45% 39%
Did not have much choice, had to purchase when did 17 10 17 19 20 15 16
It was the best time for because of availability of homes for sale 11 9 9 12 10 14 14
It was the best time for because of mortgage financing options available 6 6 6 7 5 4 4
It was the best time for because of improved affordability of homes 6 6 6 6 5 5 5
Wish had waited 2 3 2 2 2 1 2
Other 10 4 7 8 10 16 20
*Less than 1 percent

OTHER HOMES OWNED
2019 NAR Home Buyer and Seller Generational Trends 26
Exhibit 1-14 (Percent of Respondents)
*Less than 1 percent
AGE OF HOME BUYER
All Buyers 28 and younger 29 to 38 39 to 53 54 to 63 64 to 72 73 to 93
Recently purchased home only 83% 94% 88% 80% 78% 75% 76%
One or more investment properties 9 2 8 11 11 10 7
Previous homes that buyer is trying to sell 3 * 1 3 5 7 6
Primary residence 3 3 3 3 3 4 5
One or more vacation homes 3 * 1 3 5 7 6
Other 2 * 1 2 2 2 4

Chapter 2Characteristics of Homes Purchased
272019 NAR Home Buyer and Seller Generational Trends

Characteristics of Homes Purchased
○ Buyers of new homes made up a 14 percent share and buyers of previously owned homes made up 86 percent. Nineteen percent of buyers 64 to 72 years bought new homes, followed by buyers 54 to 63 years at 18 percent.
○ Most recent buyers who purchased new homes were looking to avoid renovations and problems with plumbing or electricity at 38 percent. Buyers who purchased previously owned homes were most often considering a better price at 32 percent. For buyers 29 to 38 years, 51 percent bought new homes to avoid renovations and problems compared to 27 percent of buyers 64 to 72 years.
○ The most common type of home purchase continued to be the detached single-family home, which made up 82 percent of all homes bought. It was most common among all generations. Buyers over 73 purchased townhomes and other options at higher shares.
○ Senior-related housing accounted for 13 percent of buyers over the age of 50; that number was eight percent for buyers 54 to 63 years and 29 percent for buyers 73 years and older.
○ There was only a median of 15 miles from the homes that recent buyers previously resided in and the homes that they purchased. For buyers 64 years and older, the median distance was 30 miles. For
buyers 38 and younger, the median was 10 miles.
○ The typical home recently purchased was 1,900 square feet, had three bedrooms and two bathrooms, and was built in 1991. The size of homes for buyers 39 to 53 years was typically larger homes at 2,100 square feet, compared to buyers 28 years and younger at 1,600 and 73 years and older that purchased homes at a median of 1,700. For buyers 29 to 38 years, the median home was built in 1984; for ages 54 and older, the median was 1996 or newer.
○ Heating and cooling costs were the most important environmental features for recent home buyers, with 33 percent finding these features very important.
○ For buyers 38 years and younger, commuting costs were very important at 39 percent. Compared to buyers 54 to 63, windows, doors, and siding were also very important at 35 percent.
○ Overall, buyers expected to live in their homes for a median of 15 years, while 19 percent said that they were never moving. For buyers 38 years and younger, the expected length of time was only 10 years compared to 20 years for buyers 54 to 72 years.
282019 NAR Home Buyer and Seller Generational Trends

Characteristics of Homes Purchased
292019 NAR Home Buyer and Seller Generational Trends
Exhibit 2-1 • NEW AND PREVIOUSLY OWNED HOMES PURCHASED
Exhibit 2-2 • WHY NEW AND PREVIOUSLY OWNED HOMES PURCHASED
Exhibit 2-3 • TYPE OF HOME PURCHASED
Exhibit 2-4 • LOCATION OF HOME PURCHASED
Exhibit 2-5 • SENIOR-RELATED HOUSING BY TYPE OF HOME PURCHASED AND LOCATION
Exhibit 2-6 • DISTANCE BETWEEN HOME PURCHASED AND PREVIOUS RESIDENCE
Exhibit 2-7 • FACTORS INFLUENCING NEIGHBORHOOD CHOICE
Exhibit 2-8 • PRICE OF HOME PURCHASED
Exhibit 2-9 • PURCHASE PRICE COMPARED WITH ASKING PRICE
Exhibit 2-10 • SIZE OF HOME PURCHASED
Exhibit 2-11 • NUMBER OF BEDROOMS AND BATHROOMS
Exhibit 2-12 • YEAR HOME BUILT
Exhibit 2-13 • ENVIRONMENTALLY FRIENDLY FEATURES CONSIDERED "VERY IMPORTANT"
Exhibit 2-14 • CHARACTERISTICS OF HOME ON WHICH BUYER COMPROMISED
Exhibit 2-15 • EXPECTED LENGTH OF TENURE IN HOME PURCHASED
Exhibit 2-16 • FACTORS THAT COULD CAUSE BUYER TO MOVE

NEW AND PREVIOUSLY OWNED HOMES PURCHASED
2019 NAR Home Buyer and Seller Generational Trends 30
Exhibit 2-1 (Percentage Distribution)
14%
6%12%
15%18% 19%
14%
86%
94%88%
85%82% 81%
86%
0%
20%
40%
60%
80%
100%
All Buyers 28 and younger 29 to 38 39 to 53 54 to 63 64 to 72 73 to 93
New Previously Owned

WHY NEW AND PREVIOUSLY OWNED HOMES PURCHASED
2019 NAR Home Buyer and Seller Generational Trends 31
Exhibit 2-2 (Percent of Respondents)
AGE OF HOME BUYER
All Buyers 28 and younger 29 to 38 39 to 53 54 to 63 64 to 72 73 to 93
New Home: Avoid renovations or problems with plumbing or electricity 38% 74% 51% 39% 30% 27% 29%
Ability to choose and customize design features 31 29% 36 36 31 36 13
Amenities of new home construction communities 21 16 22 23 18 25 23
Green/energy efficiency 15 24 18 20 9 14 10Lack of inventory of previously owned home 13 11 22 14 9 5 11
Smart home features 4 3 3 8 3 3 8Other 14 14 13 11 30 14 21Previously Owned Home:Better price 32% 52% 37% 30% 24% 24% 24%Better overall value 31 30 36 32 29 29 29More charm and character 21 21 25 23 21 18 15Lack of inventory of new homes 11 12 14 12 10 9 7Other 20 10 17 23 24 26 27

TYPE OF HOME PURCHASED
2019 NAR Home Buyer and Seller Generational Trends 32
Exhibit 2-3 (Percentage Distribution)
82% 81%86% 88%
81%76%
66%
8% 10%7% 6% 7% 6%
10%
1% 1% 1% * 2% 2% 3%3% 2% 1% 2% 4%8% 9%6% 6% 5% 4% 6% 7%
13%
0%
20%
40%
60%
80%
100%
All Buyers 28 and younger 29 to 38 39 to 53 54 to 63 64 to 72 73 to 93
Detached single-family home Townhouse/row houseApartment/condo in building with 5 or more units Duplex/apartment/condo in 2 to 4 unit buildingOther
*Less than 1 percent

LOCATION OF HOME PURCHASED
2019 NAR Home Buyer and Seller Generational Trends 33
Exhibit 2-4 (Percentage Distribution)
*Less than 1 percent
51%49%
53%56%
49%47% 46%
20%
13%11% 12%
16%14%
12%14%
17% 17%13%
10% 9%11%13%
21%18% 18%
21%25%
23%
2%* 1% 1%
4% 5%7%
0%
20%
40%
60%
All Buyers 28 and younger 29 to 38 39 to 53 54 to 63 64 to 72 73 to 93
Suburb/Subdivision Small town Urban area/Central city Rural area Resort/Recreation area

SENIOR-RELATED HOUSING BY TYPE OF HOME PURCHASED AND LOCATION
2019 NAR Home Buyer and Seller Generational Trends 34
Exhibit 2-5 (Percentage Distribution)
AGE OF HOME BUYER
All buyers over 50 54 to 63 64 to 72 73 to 93
Share who purchased a home in senior-related housing 13% 8% 16% 29%
Buyers over 50 who purchased senior-related housing:
Type of home purchased
Detached single-family home 61% 81% 76% 66%
Townhouse/row house 11 7 6 10
Duplex/apartment/condo in 2 to 4 unit building 14 8 8 9
Apartment/condo in building with 5 or more units 4 2 2 3
Other 10 6 7 13
Location
Suburb/ Subdivision 46% 49% 47% 47%
Small town 22 16 14 12
Resort/ Recreation area 13 10 9 11
Urban/ Central city 8 21 25 24
Rural area 11 4 5 7

DISTANCE BETWEEN HOME PURCHASED AND PREVIOUS RESIDENCE
2019 NAR Home Buyer and Seller Generational Trends 35
Exhibit 2-6 (Median Miles)
15
10 10 11
20
30 30
0
20
40
All Buyers 28 and younger 29 to 38 39 to 53 54 to 63 64 to 72 73 to 93

FACTORS INFLUENCING NEIGHBORHOOD CHOICE
2019 NAR Home Buyer and Seller Generational Trends 36
Exhibit 2-7 (Percent of Respondents)
AGE OF HOME BUYER
All Buyers 28 and younger 29 to 38 39 to 53 54 to 63 64 to 72 73 to 93
Quality of the neighborhood 58% 57% 63% 60% 56% 52% 45%Convenient to job 44 71 61 48 36 9 3Overall affordability of homes 41 57 44 36 35 35 33Convenient to friends/family 39 45 42 30 32 45 47Quality of the school district 24 27 43 33 10 4 3Design of neighborhood 25 22 24 24 23 30 27Convenient to shopping 25 17 23 23 26 29 34Convenient to schools 21 21 36 30 5 3 2Convenient to entertainment/leisure activities 21 22 26 19 17 19 14
Convenient to parks/recreational facilities 19 17 25 20 14 18 11Availability of larger lots or acreage 17 16 20 19 18 13 7Home in a planned community 8 4 5 6 7 12 18Convenient to airport 7 2 6 7 9 8 5Convenient to public transportation 5 4 9 4 2 3 3Convenient to vet/outdoor space for pet 15 27 16 13 15 12 7Convenient to health facilities 11 3 5 7 12 23 31Other 7 3 4 7 9 9 9
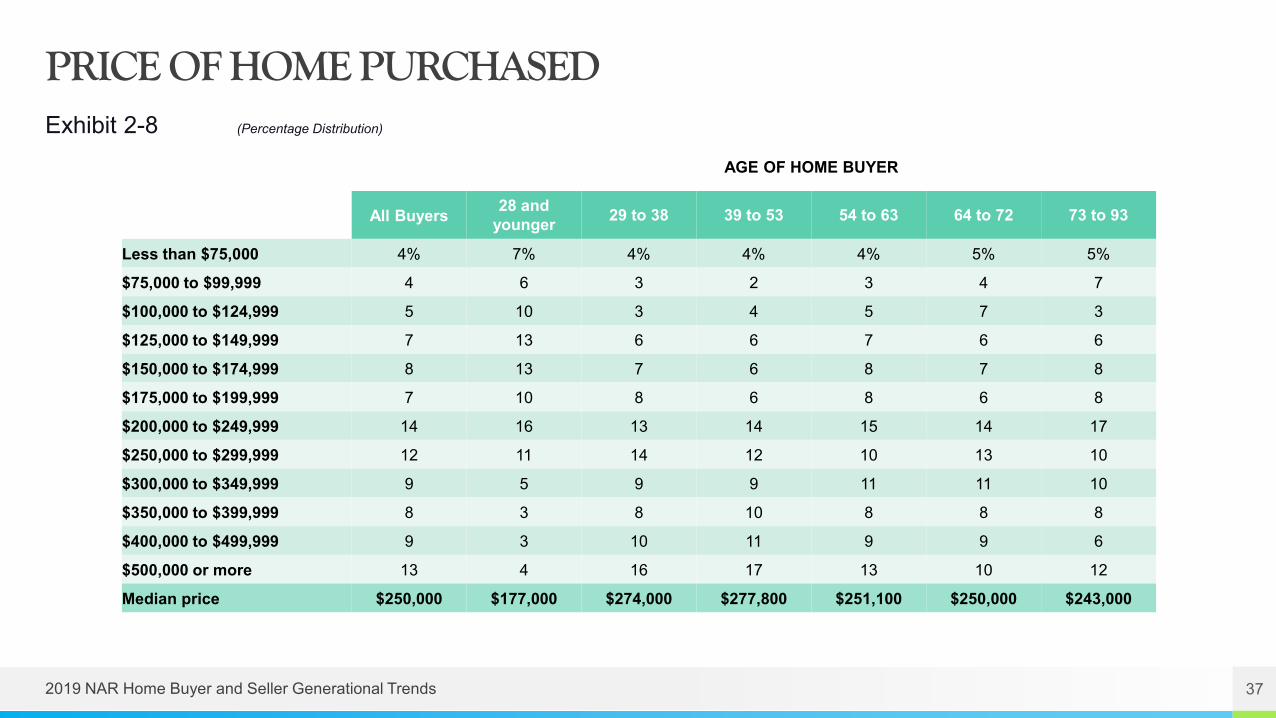
PRICE OF HOME PURCHASED
2019 NAR Home Buyer and Seller Generational Trends 37
Exhibit 2-8 (Percentage Distribution)
AGE OF HOME BUYER
All Buyers 28 and younger 29 to 38 39 to 53 54 to 63 64 to 72 73 to 93
Less than $75,000 4% 7% 4% 4% 4% 5% 5%
$75,000 to $99,999 4 6 3 2 3 4 7
$100,000 to $124,999 5 10 3 4 5 7 3
$125,000 to $149,999 7 13 6 6 7 6 6
$150,000 to $174,999 8 13 7 6 8 7 8
$175,000 to $199,999 7 10 8 6 8 6 8
$200,000 to $249,999 14 16 13 14 15 14 17
$250,000 to $299,999 12 11 14 12 10 13 10
$300,000 to $349,999 9 5 9 9 11 11 10
$350,000 to $399,999 8 3 8 10 8 8 8
$400,000 to $499,999 9 3 10 11 9 9 6
$500,000 or more 13 4 16 17 13 10 12
Median price $250,000 $177,000 $274,000 $277,800 $251,100 $250,000 $243,000

PURCHASE PRICE COMPARED WITH ASKING PRICE
2019 NAR Home Buyer and Seller Generational Trends 38
Exhibit 2-9 (Percentage Distribution)
AGE OF HOME BUYER
Percent of asking price: All Buyers 28 and younger 29 to 38 39 to 53 54 to 63 64 to 72 73 to 93
Less than 90% 9% 7% 7% 7% 10% 11% 10%
90% to 94% 13 13 12 13 16 14 12
95% to 99% 35 32 36 37 35 36 37
100% 29 28 29 29 28 30 29
101% to 110% 12 18 14 13 10 7 10
More than 110% 2 2 2 2 1 2 2
Median (purchase price as a percent of asking price) 99% 99% 99% 99% 98% 98% 98%

SIZE OF HOME PURCHASED
2019 NAR Home Buyer and Seller Generational Trends 39
Exhibit 2-10 (Percentage Distribution)
*Less than 1 percent
AGE OF HOME BUYER
All Buyers 28 and younger 29 to 38 39 to 53 54 to 63 64 to 72 73 to 93
1,000 sq ft or less * 1% * * * * *
1,001 to 1,500 sq ft 14 21 12 10 14 14 20
1,501 to 2,000 sq ft 28 40 29 22 25 27 33
2,001 to 2,500 sq ft 26 26 25 26 25 30 26
2,501 to 3,000 sq ft 14 8 15 17 14 14 9
3,001 to 3,500 sq ft 9 2 10 12 11 9 8
3,501 sq ft or more 9 3 9 13 10 6 4
Median (sq ft) 1,900 1,600 1,900 2,100 1,900 1,900 1,700

NUMBER OF BEDROOMS AND BATHROOMS
2019 NAR Home Buyer and Seller Generational Trends 40
Exhibit 2-11 (Percentage Distribution)
*Less than 1 percent
AGE OF HOME BUYER
All Buyers 28 and younger 29 to 38 39 to 53 54 to 63 64 to 72 73 to 93
One bedroom * * * * * * 1%
Two bedrooms 15 15 8 7 19 21 32
Three bedrooms or more 85 84 92 92 80 78 67
Median number of bedrooms 3 3 3 3 3 3 3
One full bathroom 16 29 19 11 16 13 12
Two full bathrooms 61 64 55 58 60 66 71
Three full bathrooms or more 23 7 26 30 24 22 17
Median number of full bathrooms 2 2 2 2 2 2 2

YEAR HOME BUILT
2019 NAR Home Buyer and Seller Generational Trends 41
Exhibit 2-12 (Median)
AGE OF HOME BUYER
All Buyers 28 and younger 29 to 38 39 to 53 54 to 63 64 to 72 73 to 93
2018 4% 2% 3% 4% 4% 5% 5%
2017 through 2012 14 6 14 15 16 17 14
2011 through 2008 4 4 3 4 4 4 3
2007 through 2003 11 10 9 11 13 15 12
2002 through 1988 21 18 18 22 24 22 29
1987 through 1962 24 28 25 23 22 23 27
1961 through 1914 18 26 24 18 14 12 9
1913 and older 3 5 4 2 3 1 *
Median 1991 1980 1984 1993 1996 1998 1996
*Less than 1 percent

ENVIRONMENTALLY FRIENDLY FEATURES CONSIDERED “ VERY IMPORTANT ”
2019 NAR Home Buyer and Seller Generational Trends 42
Exhibit 2-13 (Percent of Respondents)
33% 34%
29%
34% 35%32%
28%29%26% 25%
29%31% 32% 33%
30%
40% 39%
32%
28%
10%13%
21%
17% 18%
22%24%
21%24%23%
17%
22%24%
27%24%
19%
10%
6% 7%10% 11% 12%
10%11%
7% 8%10%
12% 13%16%
3%1%
3% 3% 4% 3% 2%
0%
20%
40%
All Buyers 28 and younger 29 to 38 39 to 53 54 to 63 64 to 72 73 to 93
Heating and cooling costs Windows/Doors/Siding (Installation) Commuting CostsEnergy efficient appliances Energy efficient lighting Landscaping for energy conservationEnvironmentally friendly community features Solar panels installed on home

CHARACTERISTICS OF HOME ON WHICH BUYER COMPROMISED
2019 NAR Home Buyer and Seller Generational Trends 43
Exhibit 2-14 (Percent of Respondents)
*Less than 1 percent
AGE OF HOME BUYER
All Buyers 28 and younger 29 to 38 39 to 53 54 to 63 64 to 72 73 to 93
Price of home 22% 28% 25% 21% 19% 18% 20%
Condition of home 20 25 22 18 20 17 16
Size of home 17 21 18 15 16 15 17
Lot size 14 16 19 14 8 9 11
Style of home 14 19 16 15 12 9 10
Distance from job 14 20 20 15 11 3 *
Distance from friends or family 7 10 8 5 6 6 10
Quality of the neighborhood 6 9 7 6 3 3 6
Quality of the schools 4 7 8 3 1 1 *
Distance from school 2 2 2 3 * * 1
None - Made no compromises 34 21 25 32 40 49 52
Other compromises not listed 8 6 7 9 9 5 7

EXPECTED LENGTH OF TENURE IN HOME PURCHASED
2019 NAR Home Buyer and Seller Generational Trends 44
Exhibit 2-15 (Percentage Distribution)
AGE OF HOME BUYER
All Buyers 28 and younger 29 to 38 39 to 53 54 to 63 64 to 72 73 to 93
1 year or less 1% * * 1% 1% 1% 4%
2 to 3 years 5 6 5 4 4 5 3
4 to 5 years 14 28 17 11 10 6 10
6 to 7 years 4 9 4 4 3 2 1
8 to 10 years 22 22 25 22 20 17 34
11 to 15 years 10 9 9 11 9 14 15
16 or more years 43 24 40 46 52 54 32
Don't Know 1 1 1 1 1 1 2
Median 15 10 10 15 20 20 10
*Less than 1 percent

FACTORS THAT COULD CAUSE BUYER TO MOVE
2019 NAR Home Buyer and Seller Generational Trends 45
Exhibit 2-16 (Percentage Distribution)
AGE OF HOME BUYER
All Buyers 28 and younger 29 to 38 39 to 53 54 to 63 64 to 72 73 to 93
Move with life changes (addition to family, marriage, children move out, retirement, etc.)
27% 33% 27% 32% 27% 18% 15%
Never moving-forever home 19 6 12 16 27 33 34Move with job or career change 12 18 20 17 6 * *Want a larger home 8 22 13 4 2 2 1Downsize/smaller house 9 1 5 12 16 9 7Household member's health 8 * 1 2 11 24 28
Want nicer home/added features 6 9 9 6 4 3 3
May desire better area/neighborhood 5 5 6 4 2 5 3
Will flip home 1 2 2 1 1 1 *Other 6 3 4 6 5 6 9
*Less than 1 percent

Chapter 3The Home Search Process
462019 NAR Home Buyer and Seller Generational Trends

The Home Search Process
○ Among all generations of home buyers, the first step taken in the home search process was to look online for properties. For buyers 73 years and older, they contacted a real estate agent as often as they looked online.
○ Buyers typically searched for 10 weeks and looked at a median of 10 homes. The length of the home search was the longest for buyers 54 to 63 years at 12 weeks and shortest for buyers 73 years and older at eight weeks. Buyers 29 to 72 viewed a median of 10 homes last year, just seven homes for buyers 28 years and younger and six homes of buyers 73 years and older.
○ When looking during the home search process, buyers 28 and younger were the most likely generation to consider purchasing a home that was in foreclosure.
○ As a result of an internet home search, buyers most often walked through the home that they viewed online. All generations saw the exterior of homes because of searching online for properties. The most important website feature was photos for nine in 10 buyers under the age of 63. Real estate agent contact information was most important to buyers aged 73 years and older.
○ Buyers of all generations were overall very satisfied with their home buying process. Buyer satisfaction increased with age.
472019 NAR Home Buyer and Seller Generational Trends

The Home Search Process
482019 NAR Home Buyer and Seller Generational Trends
Exhibit 3-1 • FIRST STEP TAKEN DURING THE HOME BUYING PROCESS
Exhibit 3-2 • INFORMATION SOURCES USED IN HOME SEARCH
Exhibit 3-3 • LENGTH OF SEARCH
Exhibit 3-4 • WHERE BUYER FOUND THE HOME THEY PURCHASED
Exhibit 3-5 • BUYER INTEREST IN PURCHASING A HOME IN FORECLOSURE
Exhibit 3-6 • MOST DIFFICULT STEPS OF HOME BUYING PROCESS
Exhibit 3-7 • USE OF INTERNET TO SEARCH FOR HOMES
Exhibit 3-8 • ACTIONS TAKEN AS A RESULT OF INTERNET HOME SEARCH
Exhibit 3-09 • VALUE OF WEBSITE FEATURES
Exhibit 3-10 • MOBILE SEARCH
Exhibit 3-11 • SATISFACTION IN BUYING PROCESS

FIRST STEP TAKEN DURING THE HOME BUYING PROCESS
2019 NAR Home Buyer and Seller Generational Trends 49
Exhibit 3-1 (Percentage Distribution)
*Less than 1 percent
AGE OF HOME BUYER
All Buyers 28 and younger 29 to 38 39 to 53 54 to 63 64 to 72 73 to 93
Looked online for properties for sale 44% 43% 46% 47% 46% 44% 31%Contacted a real estate agent 17 13 12 15 19 23 29Looked online for information about the home buying process 11 17 14 9 8 6 5
Contacted a bank or mortgage lender 7 8 8 8 5 4 4Drove-by homes/neighborhoods 6 3 4 6 8 5 8Talked with a friend or relative about home buying process 6 12 6 3 2 5 8
Visited open houses 4 1 4 4 4 4 5Looked up information about different neightborhoods or areas (schools, local lifestyle/nightlife, parks, public transportation
1 1 1 2 1 2 *
Contacted builder/visited builder models 1 * 1 1 2 3 2Attended a home buying seminar 1 * 1 1 * *Contacted a home seller directly 1 * 1 1 1 1 2Looked in newspapers, magazines, or home buying guides 1 1 * * 1 1 3
Other 2 1 1 2 3 1 2

INFORMATION SOURCES USED IN HOME SEARCH
2019 NAR Home Buyer and Seller Generational Trends 50
Exhibit 3-2 (Percent of Respondents)
*Less than 1 percent
AGE OF HOME BUYER
All Buyers 28 and younger 29 to 38 39 to 53 54 to 63 64 to 72 73 to 93
Online website 93% 97% 98% 95% 93% 89% 72%Real estate agent 86 87 84 85 89 87 86Mobile or tablet search device 73 85 84 78 65 56 34
Open house 53 46 57 57 50 47 46
Yard sign 46 45 44 47 47 42 48
Online video site 37 32 29 34 45 49 41Home builder 18 12 16 19 18 23 16Print newspaper advertisement 13 9 9 10 17 17 21Home book or magazine 10 7 7 9 13 12 13Billboard 5 3 5 5 5 4 2
Relocation company 3 2 4 3 3 2 1
Television 3 2 2 2 3 3 2

LENGTH OF SEARCH
2019 NAR Home Buyer and Seller Generational Trends 51
Exhibit 3-3 (Medians)
AGE OF HOME BUYER
All Buyers 28 and younger 29 to 38 39 to 53 54 to 63 64 to 72 73 to 93
Number of Weeks Searched 10 10 10 10 12 10 8
Number of Weeks Searched Before Contacting an Agent 3 3 3 2 3 3 2
Number of homes viewed 10 7 10 10 10 10 6

WHERE BUYER FOUND THE HOME THEY PURCHASED
2019 NAR Home Buyer and Seller Generational Trends 52
Exhibit 3-4 (Percentage Distribution)
*Less than 1 percent
AGE OF HOME BUYER
All Buyers 28 and younger 29 to 38 39 to 53 54 to 63 64 to 72 73 to 93
Internet 50% 62% 62% 52% 46% 36% 30%
Real estate agent 28 27 20 26 33 35 38
Yard sign/open house sign 7 3 5 7 7 10 11
Friend, relative or neighbor 7 5 6 6 5 8 12
Home builder or their agent 5 2 4 5 6 7 6Directly from sellers/Knew the sellers 3 2 3 3 2 2 2
Print newspaper advertisement 1 * * * 1 1 2
Home book or magazine * * * * * * *
Other * * * * * * *

BUYER INTEREST IN PURCHASING A HOME IN FORECLOSURE
2019 NAR Home Buyer and Seller Generational Trends 53
Exhibit 3-5 (Percent of Respondents)
*Less than 1 percent
AGE OF HOME BUYER
All Buyers 28 and younger 29 to 38 39 to 53 54 to 63 64 to 72 73 to 93
Did not consider purchasing a home in foreclosure 69% 58% 62% 66% 74% 80% 85%Considered purchasing a home in foreclosure, but did not:
Could not find the right home 18 23 22 19 15 11 10
The process was too difficult or complex 8 11 9 11 7 4 4
The home was in poor condition 7 12 8 7 6 4 2
The home price was too high 3 3 3 3 2 1 *
The neighborhood was undesirable 3 3 4 2 3 2 *
Financing options were not attractive 3 7 4 3 1 2 *

MOST DIFFICULT STEPS OF HOME BUYING PROCESS
2019 NAR Home Buyer and Seller Generational Trends 54
Exhibit 3-6 (Percent of Respondents)
AGE OF HOME BUYER
All Buyers 28 and younger 29 to 38 39 to 53 54 to 63 64 to 72 73 to 93
Finding the right property 56% 59% 60% 54% 58% 51% 42%
Paperwork 20 27 22 17 18 14 18
Understanding the process and steps 16 38 22 12 9 8 14
Saving for the down payment 13 26 23 12 4 1 1
Getting a mortgage 8 11 9 10 6 5 5
Appraisal of the property 5 8 6 5 4 3 2
No difficult steps 19 8 11 19 21 31 35
Other 5 3 5 5 6 4 4

USE OF INTERNET TO SEARCH FOR HOMES
2019 NAR Home Buyer and Seller Generational Trends 55
Exhibit 3-7 (Percent of Respondents)
98%92% 92%
89%
80%
72%
50%
10%5% 6% 6%
13%16%
22%
0%
20%
40%
60%
80%
100%
All Buyers 28 and younger 29 to 38 39 to 53 54 to 63 64 to 72 73 to 93
Frequently Occasionally
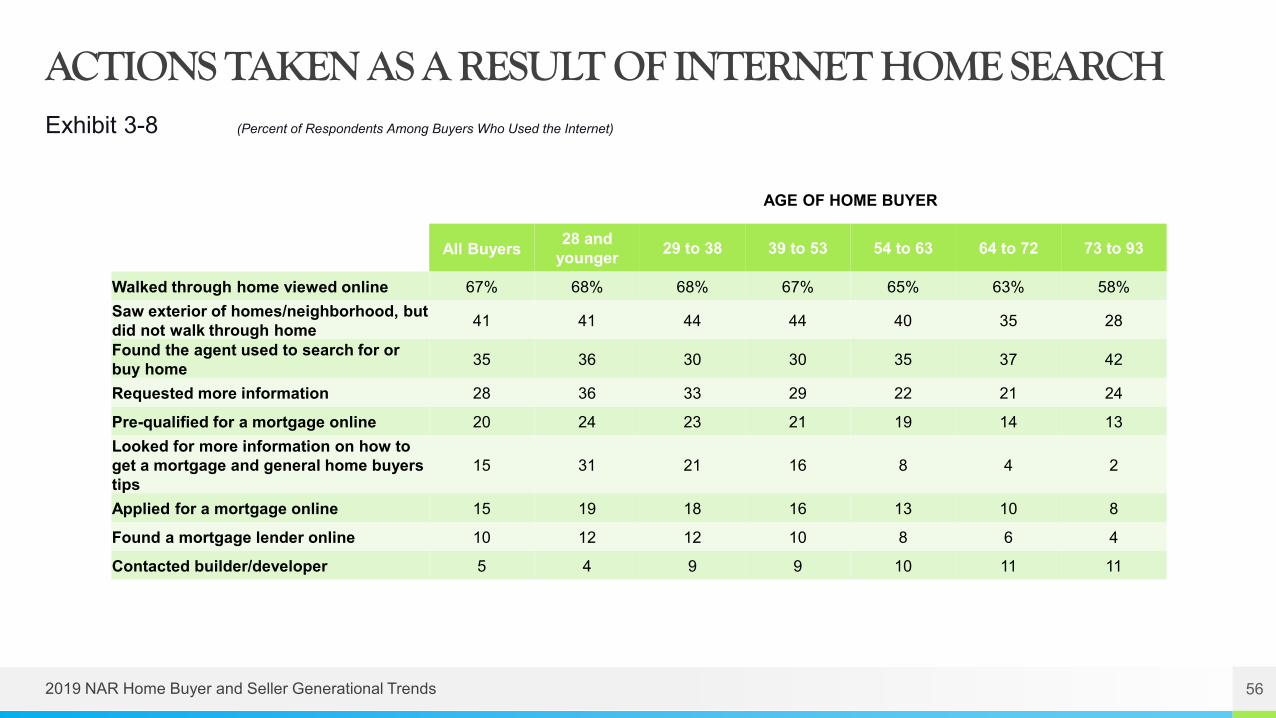
ACTIONS TAKEN AS A RESULT OF INTERNET HOME SEARCH
2019 NAR Home Buyer and Seller Generational Trends 56
Exhibit 3-8 (Percent of Respondents Among Buyers Who Used the Internet)
AGE OF HOME BUYER
All Buyers 28 and younger 29 to 38 39 to 53 54 to 63 64 to 72 73 to 93
Walked through home viewed online 67% 68% 68% 67% 65% 63% 58%Saw exterior of homes/neighborhood, but did not walk through home 41 41 44 44 40 35 28
Found the agent used to search for or buy home 35 36 30 30 35 37 42
Requested more information 28 36 33 29 22 21 24
Pre-qualified for a mortgage online 20 24 23 21 19 14 13Looked for more information on how to get a mortgage and general home buyers tips
15 31 21 16 8 4 2
Applied for a mortgage online 15 19 18 16 13 10 8
Found a mortgage lender online 10 12 12 10 8 6 4
Contacted builder/developer 5 4 9 9 10 11 11

VALUE OF WEBSITE FEATURES
2019 NAR Home Buyer and Seller Generational Trends 57
Exhibit 3-9 (Percentage Ranking Feature "Very Useful" Among Buyers Who Used the Internet)
AGE OF HOME BUYER
All Buyers 28 and younger 29 to 38 39 to 53 54 to 63 64 to 72 73 to 93
Photos 87% 90% 91% 91% 88% 80% 67%
Detailed information about properties for sale 85 83 85 91 85 82 73
Floor Plans 52 49 52 56 52 52 44
Virtual tours 46 41 44 48 48 45 39
Real estate agent contact information 42 39 37 41 45 48 57Detailed information about recently sold properties 41 37 45 47 40 32 21
Neighborhood information 39 36 43 44 34 33 29
Interactive maps 37 43 40 43 33 30 16
Pending sales/contract status 36 43 41 42 30 24 18
Videos 25 25 23 26 27 21 25
Information about upcoming open houses 27 27 31 32 21 20 12
Real estate news or articles 8 8 8 9 6 7 5

MOBILE SEARCH
2019 NAR Home Buyer and Seller Generational Trends 58
Exhibit 3-10 (Percent of Respondents Among those Who Used Mobile Search)
76%80% 81% 78%
68%
58%54%
17%23%
16% 15% 15% 16%20%
%
20%
40%
60%
80%
100%
All Buyers 28 and younger 29 to 38 39 to 53 54 to 63 64 to 72 73 to 93
Found my home with a mobile application Found my agent with a mobile application

SATISFACTION IN BUYING PROCESS
2019 NAR Home Buyer and Seller Generational Trends 59
Exhibit 3-11 (Percentage Distribution)
62% 60% 58%61%
64%67%
72%
30%34% 35%
32%28% 27%
19%
5% 4% 6% 5% 4% 5% 5%2% 1% 2% 2% 3% 1%
4%
0%
20%
40%
60%
80%
All Buyers 28 and younger 29 to 38 39 to 53 54 to 63 64 to 72 73 to 93
Very Satisfied Somewhat Satisfied Somewhat Dissatisfied Very Dissatisfied

Chapter 4Home Buying and Real Estate Professionals
602019 NAR Home Buyer and Seller Generational Trends
Home Buying and Real Estate Professionals
○ Eighty-seven percent of all buyers purchased their home through an agent, as did 92 percent of buyers 28 years and younger and 84 percent of buyers 64 years and older. Seven percent of buyers 29 to 38 years and 73 and older purchased their homes directly from the previous owner.
○ Buyers from all generations primarily wanted their agent’s help to find the right home to purchase at 52 percent. Buyers were also looking for help to negotiate the terms of sale and to help with price negotiations.
○ Help understanding the purchase process was most beneficial to buyers 28 years and younger at 87 percent and for buyers 29 to 38 years at 72 percent.
○ Referrals continue to be the way that most buyers found their real estate agent. Referrals by friends, neighbors, or relatives were higher among younger buyers such as 28 years and younger (52 percent) and 29 to 38 (50 percent) compared to older generations.
○ When choosing an agent to work with, working with an agent that was honest and trustworthy was the most important factor for buyers.
○ Seven in 10 buyers interviewed only one real estate agent during their home search.
○ Ninety percent of buyers would use their agent again or recommend their agent to others, also consistent across all generations.
612019 NAR Home Buyer and Seller Generational Trends

Home Buying and Real Estate Professionals
622019 NAR Home Buyer and Seller Generational Trends
Exhibit 4-1 • METHOD OF HOME PURCHASEExhibit 4-2 • AGENT REPRESENTATION DISCLOSUREExhibit 4-3 • BUYER REPRESENTATIVE ARRANGEMENT WITH AGENTExhibit 4-4 • WHAT BUYERS WANT MOST FROM REAL ESTATE AGENTS
Exhibit 4-5 • BENEFITS PROVIDED BY REAL ESTATE AGENT DURING HOME PURCHASE PROCESS
Exhibit 4-6 • HOW BUYER FOUND REAL ESTATE AGENT
Exhibit 4-7 • HOW TIMES CONTACTED AGENT BEFORE RECEIVED RESPONSE AND ORIGINAL FORM OF CONTACT
Exhibit 4-8 • NUMBER OF REAL ESTATE AGENTS INTERVIEWEDExhibit 4-9 • MOST IMPORTANT FACTORS WHEN CHOOSING AN AGENTExhibit 4-10 • AGENT SKILLS AND QUALITIES CONSIDERED 'VERY IMPORTANT'Exhibit 4-11 • IMPORTANCE OF AGENT COMMUNICATIONSExhibit 4-12 • SATISFACTION WITH REAL ESTATE AGENT SKILLS AND QUALITIESExhibit 4-13 • WOULD BUYER USE REAL ESTATE AGENT AGAIN OR RECOMMEND TO OTHERSExhibit 4-14 • HOW MANY TIMES BUYER RECOMMENDED TYPICAL AGENT

METHOD OF HOME PURCHASE
2019 NAR Home Buyer and Seller Generational Trends 63
Exhibit 4-1 (Percentage Distribution)
AGE OF HOME BUYER
All Buyers 28 and younger 29 to 38 39 to 53 54 to 63 64 to 72 73 to 93
Through a real estate agent or broker 87% 92% 87% 88% 87% 84% 83%
Directly from builder or builder's agent 6 2 5 5 6 9 8
Directly from the previous owner 7 6 7 6 6 6 7
Knew previous owner 4 3 4 4 3 2 4
Did not know previous owner 3 3 2 3 2 4 4

AGENT REPRESENTATION DISCLOSURE
2019 NAR Home Buyer and Seller Generational Trends 64
Exhibit 4-2 (Percentage Distribution)
AGE OF HOME BUYER
Disclosure Statement Signed All Buyers 28 and younger 29 to 38 39 to 53 54 to 63 64 to 72 73 to 93
Yes, at first meeting 26% 18% 23% 28% 30% 28% 29%
Yes, when contract was written 23 20 24 23 22 24 20
Yes, at some other time 11 8 11 14 11 8 7
No 23 27 23 18 22 23 28
Don’t know 18 28 19 17 15 16 16

BUYER REPRESENTATIVE ARRANGEMENT WITH AGENT
2019 NAR Home Buyer and Seller Generational Trends 65
Exhibit 4-3 (Percentage Distribution)
AGE OF HOME BUYER
All Buyers 28 and younger 29 to 38 39 to 53 54 to 63 64 to 72 73 to 93
Yes, a written arrangement 40% 16% 13% 13% 16% 16% 24%
Yes, an oral arrangement 16 30 39 42 43 40 32
No 31 33 30 30 31 35 33
Don't know 14 21 18 15 10 9 12

WHAT BUYERS WANT MOST FROM REAL ESTATE AGENTS
2019 NAR Home Buyer and Seller Generational Trends 66
Exhibit 4-4 (Percentage Distribution)
AGE OF HOME BUYER
All Buyers 28 and younger 29 to 38 39 to 53 54 to 63 64 to 72 73 to 93
Help find the right home to purchase 52% 51% 48% 49% 54% 58% 57%
Help buyer negotiate the terms of sale 14 16 16 14 12 12 13
Help with the price negotiations 11 8 12 12 11 8 8Determine what comparable homes were selling for 6 6 7 6 7 5 5
Help with paperwork 6 9 7 7 6 8 6
Help determining how much home buyer can afford 4 6 5 3 4 2 4
Help find and arrange financing 2 2 2 4 1 3 3
Help teach buyer more about neighborhood or area (restaurants, parks, public transportation)
1 1 1 2 2 2 1
Other 2 1 2 3 3 3 2

BENEFITS PROVIDED BY REAL ESTATE AGENT DURING HOME PURCHASE PROCESS
2019 NAR Home Buyer and Seller Generational Trends 67
Exhibit 4-5 (Percent of Respondents) AGE OF HOME BUYER
All Buyers 28 and younger 29 to 38 39 to 53 54 to 63 64 to 72 73 to 93
Helped buyer understand the process 60% 87% 72% 57% 50% 48% 42%Pointed out unnoticed features/faults with property 56 69 58 54 53 54 49
Negotiated better sales contract terms 47 51 49 46 41 40 35Provided a better list of service providers (e.g. home inspector) 46 46 49 41 43 46 42
Improved buyer's knowledge of search areas 44 50 41 39 42 46 41
Negotiated a better price 38 38 35 36 34 33 32
Shortened buyer's home search 29 35 26 26 28 31 35
Provided better list of mortgage lenders 22 26 25 23 17 13 13
Expanded buyer's search area 20 20 18 18 24 24 20
Narrowed buyer's search area 15 14 14 15 17 15 16
None of the above 7 1 5 6 8 6 9
Other 2 1 2 3 4 2 2

HOW BUYER FOUND REAL ESTATE AGENT
2019 NAR Home Buyer and Seller Generational Trends 68
Exhibit 4-6 (Percentage Distribution)
*Less than 1 percent
AGE OF HOME BUYER
All Buyers
28 and younger 29 to 38 39 to 53 54 to 63 64 to 72 73 to 93
Referred by (or is) a friend, neighbor or relative 41% 52% 50% 38% 33% 32% 39%Used agent previously to buy or sell a home 12 6 9 14 14 12 19Inquired about specific property viewed online 7 6 8 7 7 7 4Website (without a specific reference) 6 9 6 6 6 6 4Referred by another real estate agent/broker 5 3 4 6 6 6 4Visited an open house and met agent 5 4 2 3 4 5 4Saw contact information on For Sale/Open House sign 4 4 4 5 5 8 6Personal contact by agent (telephone, e-mail, etc.) 3 2 2 3 4 6 3Referred through employer or relocation company 2 * 2 2 2 1 *Walked into or called office and agent was on duty 1 1 1 2 2 3 3Mobile or tablet application 1 1 1 1 2 1 *
Direct mail (newsletter, flyer, postcard, etc.) 1 1 * * * * *
Saw the agent's social media page without a connection 1 * * 1 * * 1
Newspaper, Yellow Pages or home book ad * * * * *Advertising specialty (calendar, magnet, etc.) * * * 1 * * *Crowdsourcing through social media/knew the person through social media * * 1 * 1 * *
Other 11 * 12 14 12 11 11
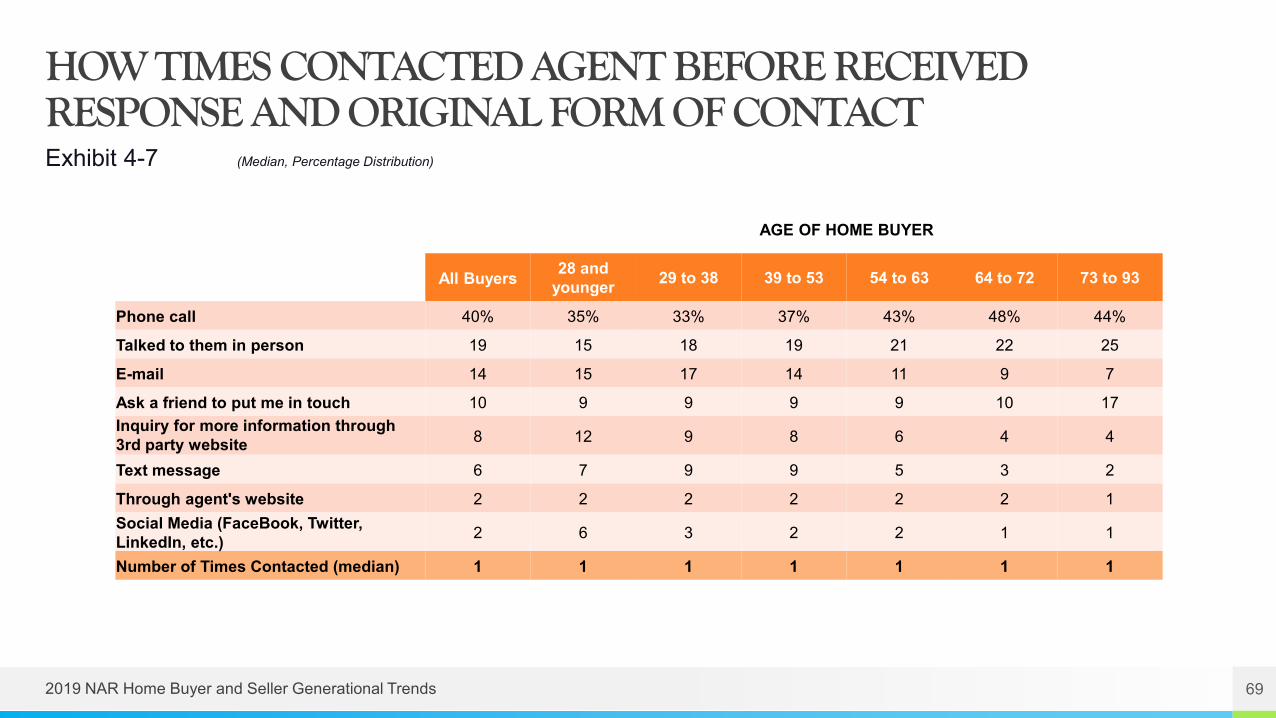
HOW TIMES CONTACTED AGENT BEFORE RECEIVED RESPONSE AND ORIGINAL FORM OF CONTACT
2019 NAR Home Buyer and Seller Generational Trends 69
Exhibit 4-7 (Median, Percentage Distribution)
AGE OF HOME BUYER
All Buyers 28 and younger 29 to 38 39 to 53 54 to 63 64 to 72 73 to 93
Phone call 40% 35% 33% 37% 43% 48% 44%
Talked to them in person 19 15 18 19 21 22 25
E-mail 14 15 17 14 11 9 7
Ask a friend to put me in touch 10 9 9 9 9 10 17Inquiry for more information through 3rd party website 8 12 9 8 6 4 4
Text message 6 7 9 9 5 3 2
Through agent's website 2 2 2 2 2 2 1Social Media (FaceBook, Twitter, LinkedIn, etc.) 2 6 3 2 2 1 1
Number of Times Contacted (median) 1 1 1 1 1 1 1

NUMBER OF REAL ESTATE AGENTS INTERVIEWED
2019 NAR Home Buyer and Seller Generational Trends 70
Exhibit 4-8 (Percentage Distribution)
*Less than 1 percent
68% 70% 68% 70% 69% 69%73%
20% 21% 19% 18% 19% 19%16%
8%5%
8% 8% 8% 7% 8%5% 3% 5% 4% 4% 6% 4%
0%
20%
40%
60%
80%
All Buyers 28 and younger 29 to 38 39 to 53 54 to 63 64 to 72 73 to 93
One Two Three Four or more

MOST IMPORTANT FACTORS WHEN CHOOSING AN AGENT
2019 NAR Home Buyer and Seller Generational Trends 71
Exhibit 4-9 (Percentage Distribution)
*Less than 1 percent
AGE OF HOME BUYER
All Buyers 28 and younger 29 to 38 39 to 53 54 to 63 64 to 72 73 to 93
Agent is honest and trustworthy 19% 28% 22% 21% 15% 14% 15%
Agent's experience 16 13 16 18 15 18 15
Reputation of agent 16 15 16 15 14 16 16
Agent is friend or family member 14 18 16 13 14 15 16
Agent's knowledge of the neighborhood 8 5 7 7 12 8 12Agent has caring personality/good listener 8 10 7 8 11 8 5
Agent is timely with responses 6 6 7 6 6 7 4Agent seems 100% accessible because of use of technology like tablet or smart phone
5 2 4 5 6 7 6
Agent's association with a particular firm 2 1 1 2 2 2 4
Active in local community/volunteerism 1 1 * * 1 1 1
Professional designations held by agent 1 1 * 1 1 * 1
Other 4 1 4 5 4 5 5

AGENT SKILLS AND QUALITIES CONSIDERED 'VERY IMPORTANT'
2019 NAR Home Buyer and Seller Generational Trends 72
Exhibit 4-10 (Percent of Respondents)
AGE OF HOME BUYER
All Buyers 28 and younger 29 to 38 39 to 53 54 to 63 64 to 72 73 to 93
Honesty and integrity 97% 96% 96% 98% 98% 97% 94%Knowledge of purchase process 94 95 94 92 90 88 85Responsiveness 92 94 94 94 95 94 89Knowledge of real estate market 91 88 92 92 92 91 83Communication skills 87 89 88 87 86 86 77
Negotiation skills 84 82 87 85 83 79 77
People skills 79 79 77 79 81 81 74
Knowledge of local area 76 66 72 76 80 80 80
Skills with technology 44 40 40 46 45 47 49

IMPORTANCE OF AGENT COMMUNICATIONS
2019 NAR Home Buyer and Seller Generational Trends 73
Exhibit 4-11 (Percent of Respondents)
AGE OF HOME BUYER
All Buyers 28 and younger 29 to 38 39 to 53 54 to 63 64 to 72 73 to 93
Calls personally to inform me of activities 74% 71% 67% 75% 76% 81% 79%Sends me postings as soon as a property is listed/the price changes/under contract 69 73 70 70 71 67 60
Sends me property info and communicates via text message 65 76 69 65 64 60 49
Sends me emails about my specific needs 54 58 55 52 54 55 47Can send market reports on recent listings and sales 52 48 53 54 53 53 43
Has a website 29 26 27 28 31 37 34
Has a mobile site to show properties 29 25 26 30 29 32 33
Active in local community/volunteerism 12 10 10 11 12 17 16
Is active on social media 12 14 13 14 10 10 11
Sends me an email newsletter 8 9 7 6 9 9 11
Advertises in newspapers 4 2 1 2 4 8 12
Has a blog 1 1 1 1 2 2 2

SATISFACTION WITH REAL ESTATE AGENT SKILLS AND QUALITIES
2019 NAR Home Buyer and Seller Generational Trends 74
Exhibit 4-12 (Percent Ranking 'Very Satisfied')
AGE OF HOME BUYER
All Buyers 28 and younger 29 to 38 39 to 53 54 to 63 64 to 72 73 to 93
Knowledge of purchase process 90% 90% 89% 88% 89% 91% 90%
Honesty and integrity 90 89 89 89 89 93 89
Knowledge of real estate market 87 86 85 87 88 90 85
Responsiveness 88 85 87 87 88 91 87
People skills 86 89 84 86 87 89 82
Communication skills 84 84 83 83 86 87 82
Knowledge of local area 82 80 79 82 85 85 83
Skills with technology 81 84 80 82 78 82 75
Negotiation skills 76 76 73 75 75 80 79

WOULD BUYER USE REAL ESTATE AGENT AGAIN OR RECOMMEND TO OTHERS
2019 NAR Home Buyer and Seller Generational Trends 75
Exhibit 4-13 (Percentage Distribution)
74% 72% 70%73% 75% 76% 76%
16%20% 19%
15% 14% 15% 13%
5% 5% 5% 6% 6%3% 4%4% 3% 4% 4% 5% 4% 6%4%
1% 1% 2% 1% 1% 2%0%
20%
40%
60%
80%
All Buyers 28 and younger 29 to 38 39 to 53 54 to 63 64 to 72 73 to 93
Definitely Probably Probably Not Definitely Not Don't Know

HOW MANY TIMES BUYER RECOMMENDED TYPICAL AGENT
2019 NAR Home Buyer and Seller Generational Trends 76
Exhibit 4-14 (Percentage Distribution)
AGE OF HOME BUYER
All Buyers 28 and younger 29 to 38 39 to 53 54 to 63 64 to 72 73 to 93
None 35% 39% 32% 34% 34% 41% 43%
One time 17 13 19 17 18 14 16
Two times 19 17 20 18 19 20 18
Three times 11 12 12 10 8 8 10
Four or more times 18 19 17 21 21 17 17
Times recommended since buying (median) 1 1 1 1 1 1 1

Chapter 5Financing the Home Purchase
772019 NAR Home Buyer and Seller Generational Trends

Financing the Home Purchase
○ Eighty-eight percent of recent buyers financed their home purchase. Ninety-seven percent of buyers 38 years and younger financed, whereas only 70 percent of buyers aged 64 to 72 years financed their home, and 64 percent for buyers 73 years and older.
○ For 58 percent of buyers, their downpayment came from their savings and 39 percent from the proceeds from the sale of a primary residence. Seventy-three percent of buyers 29 to 38 years and 87 percent for buyers 28 years and younger used savings for their downpayment, compared to only 45 percent of buyers 54 to 63 years. Buyers 73 years and older used proceeds from a previous sale more than any other generation at 60 percent.
○ Thirteen percent of all buyers cited that saving for a downpayment was the most difficult step in the home buying process. For buyers 28 years and younger, this was 26 percent compared to only one
percent of buyers 64 years and older.
○ Twenty-four percent of all buyers reported having student loan debt with a median amount of $28,000. For buyers 29 to 38 years, 42 percent had student debt with a median amount of $30,000 compared to just four percent for buyers 64 to 72 years. Buyers aged 39 to 53 also had the highest amount of debt at $30,000.
○ Sixty-one percent of all buyers used conventional loans to finance their home. Only 50 percent of buyers 28 years and younger used a conventional loan compared to 67 percent of buyers 64 to 72 years.
○ Eighty-four percent of all buyers reported they viewed a home purchase as a good investment. Eighty-eight percent of buyers 29 to 38 years said owning a home was a good financial investment.
782019 NAR Home Buyer and Seller Generational Trends

Financing the Home Purchase
792019 NAR Home Buyer and Seller Generational Trends
Exhibit 5-1 • BUYERS WHO FINANCED THEIR HOME PURCHASEExhibit 5-2 • PERCENT OF HOME FINANCEDExhibit 5-3 • SOURCES OF DOWNPAYMENT
Exhibit 5-4 • YEARS DEBT DELAYED HOME BUYERS FROM SAVING FOR A DOWNPAYMENT OR BUYING A HOME
Exhibit 5-5 • EXPENSES THAT DELAYED SAVING FOR A DOWNPAYMENT OR SAVING FOR A HOME PURCHASE, BY AGE
Exhibit 5-6 • SACRIFICES MADE TO PURCHASE HOMEExhibit 5-7 • DIFFICULTY OF MORTGAGE APPLICATION AND APPROVAL PROCESS
Exhibit 5-8 • BUYER MORTGAGE APPLICATION HAD BEEN REJECTED FROM MORTGAGE LENDER
Exhibit 5-9 • BUYER PREVIOUSLY SOLD A DISTRESSED PROPERTY (SHORT SALE OR FORECLOSURE)
Exhibit 5-10 • BUYERS WHO HAVE STUDENT LOAN DEBTExhibit 5-11 • TYPE OF MORTGAGEExhibit 5-12 • TYPE OF LOANExhibit 5-13 • BUYERS' VIEW OF HOMES AS A FINANCIAL INVESTMENT

BUYERS WHO FINANCED THEIR HOME PURCHASE
2019 NAR Home Buyer and Seller Generational Trends 80
Exhibit 5-1 (Percent of Respondents)
88%
97% 97% 95%
83%
70%64%
0%
20%
40%
60%
80%
100%
All Buyers 28 and younger 29 to 38 39 to 53 54 to 63 64 to 72 73 to 93

PERCENT OF HOME FINANCED
2019 NAR Home Buyer and Seller Generational Trends 81
Exhibit 5-2 (Percentage Distribution)
*Less than 1 percent
AGE OF HOME BUYER
All Buyers 28 and younger 29 to 38 39 to 53 54 to 63 64 to 72 73 to 93
Less than 50% 11% 7% 5% 7% 16% 23% 25%
50% to 59% 4 * 2 3 5 8 8
60% to 69% 5 3 3 4 9 9 10
71% to 79% 13 9 12 15 14 12 13
80% to 89% 23 17 26 26 20 19 20
90% to 94% 14 17 19 14 12 8 5
95% to 99% 17 31 22 17 11 8 5100% – Financed the entire purchase price with a mortgage 14 16 12 14 11 13 13
Median percent financed 87% 94% 91% 88% 83% 87% 89%

SOURCES OF DOWNPAYMENT
2019 NAR Home Buyer and Seller Generational Trends 82
Exhibit 5-3 (Percent of Respondents Among those who Made a Downpayment)
*Less than 1 percent
AGE OF HOME BUYER
All Buyers 28 and younger 29 to 38 39 to 53 54 to 63 64 to 72 73 to 93
Savings 58% 87% 73% 57% 45% 46% 41%Proceeds from sale of primary residence 39 7 27 41 51 54 60Gift from relative or friend 12 28 21 11 5 3 3401k/pension fund including a loan 7 2 8 10 8 4 1Sale of stocks or bonds 7 8 9 7 4 6 6Inheritance 4 4 3 3 4 3 2Tax Refund 3 5 5 4 1 1 *Individual Retirement Account (IRA) 3 1 2 2 3 5 5Loan from relative or friend 3 6 5 2 1 2 *Proceeds from sale of real estate other than primary residence 3 1 1 2 4 4 6
Equity from primary residence buyer continue to own 2 * 1 2 2 3 5
Loan or financial assistance from source other than employer 1 2 1 1 1 * 1
Loan from financial institution other than a mortgage 1 1 * 1 * * 1
Loan or financial assistance through employer * * * 1 1 * *
Other 4 4 3 4 4 3 3

YEARS DEBT DELAYED HOME BUYERS FROM SAVING FOR A DOWNPAYMENT OR BUYING A HOME
2019 NAR Home Buyer and Seller Generational Trends 83
Exhibit 5-4 (Percentage Distribution)
*Less than 1 percent
AGE OF HOME BUYER
All Buyers 28 and younger 29 to 38 39 to 53 54 to 63 64 to 72 73 to 93
One year 18% 43% 17% 12% 18% 20% 18%
Two years 20 31 21 14 16 18 23
Three years 14 15 15 13 12 16 *
Four years 6 4 7 7 3 2 14
Five years 18 5 18 24 19 13 *
More than five years 24 3 22 30 32 32 45
Median 3 2 3 5 5 3 4

EXPENSES THAT DELAYED SAVING FOR A DOWNPAYMENT OR SAVING FOR A HOME PURCHASE, BY AGE
2019 NAR Home Buyer and Seller Generational Trends 84
Exhibit 5-5 (Percent of Respondents Who Reported Saving for a Down Payment was Difficult)
*Less than 1 percent
AGE OF HOME BUYER
All Buyers 28 and younger 29 to 38 39 to 53 54 to 63 64 to 72 73 to 93
Share Saving for Downpayment was Most Difficult Task in Buying Process: 13% 26% 24% 13% 4% 1% 1%
Debt that Delayed Saving:Student Loans 50% 61% 59% 36% 22% 8% *
Credit card debt 37 27 35 46 53 67 20
Car loan 35 43 35 32 28 * *
Child care expenses 17 7 18 21 15 * *
Health care costs 13 7 11 14 23 36 20
Other 17 18 17 15 27 17 80Median Years Debt Delayed Home Purchase Among Those Who Had Difficulty Saving
2 2 4 5 5 3 4

SACRIFICES MADE TO PURCHASE HOME
2019 NAR Home Buyer and Seller Generational Trends 85
Exhibit 5-6 (Percent of Respondents)
AGE OF HOME BUYER
All Buyers 28 and younger 29 to 38 39 to 53 54 to 63 64 to 72 73 to 93
Cut spending on luxury items or non-essential items 25% 44% 36% 27% 15% 9% 11%
Cut spending on entertainment 18 31 27 19 10 6 7
Cut spending on clothes 14 27 21 14 8 5 5
Canceled vacation plans 8 5 9 13 7 3 4Paid minimum payments on bills 8 12 11 10 5 3 3
Earned extra income through a second job 5 10 8 5 3 2 1
Sold a vehicle or decided not to purchase a vehicle 4 5 5 4 2 2 2
Other 4 3 4 3 6 6 4
Did not need to make any sacrifices 62 46 50 59 72 81 82

DIFFICULTY OF MORTGAGE APPLICATION AND APPROVAL PROCESS
2019 NAR Home Buyer and Seller Generational Trends 86
Exhibit 5-7 (Percentage Distribution Among those who Financed their Home Purchase)
8%
8%
9%
10%
10%
14%
9%
32%
23%
21%
20%
19%
22%
22%
39%
49%
48%
49%
48%
45%
47%
21%
21%
21%
21%
23%
19%
22%
0% 20% 40% 60% 80% 100%
73 to 93
64 to 72
54 to 63
39 to 53
29 to 38
28 and younger
All Buyers
Much more difficult than expected Somewhat more difficult than expected Not difficult/No more difficult than expected Easier than expected
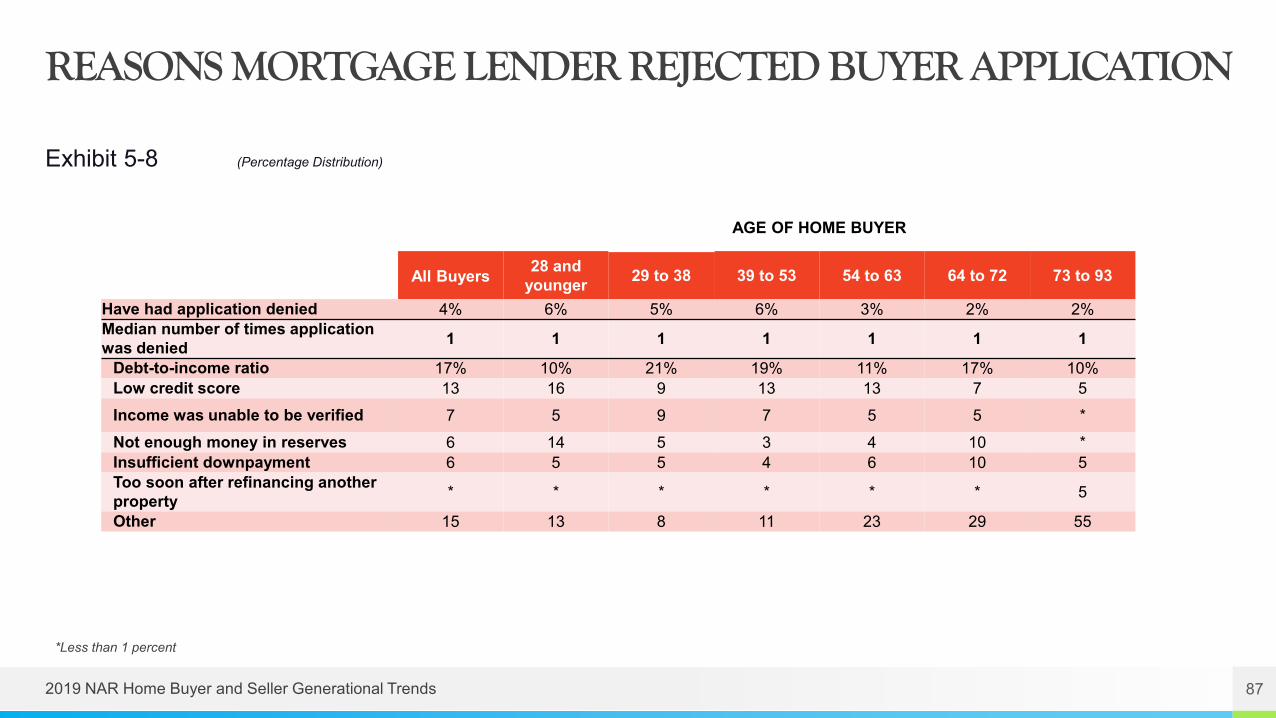
REASONS MORTGAGE LENDER REJECTED BUYER APPLICATION
2019 NAR Home Buyer and Seller Generational Trends 87
Exhibit 5-8 (Percentage Distribution)
*Less than 1 percent
AGE OF HOME BUYER
All Buyers 28 and younger 29 to 38 39 to 53 54 to 63 64 to 72 73 to 93
Have had application denied 4% 6% 5% 6% 3% 2% 2%Median number of times application was denied 1 1 1 1 1 1 1
Debt-to-income ratio 17% 10% 21% 19% 11% 17% 10%Low credit score 13 16 9 13 13 7 5Income was unable to be verified 7 5 9 7 5 5 *Not enough money in reserves 6 14 5 3 4 10 *Insufficient downpayment 6 5 5 4 6 10 5Too soon after refinancing another property * * * * * * 5
Other 15 13 8 11 23 29 55

BUYER PREVIOUSLY SOLD A DISTRESSED PROPERTY (SHORT SALE OR FORECLOSURE)
2019 NAR Home Buyer and Seller Generational Trends 88
Exhibit 5-9 (Percentage Distribution)
AGE OF HOME BUYER
All Buyers 28 and younger 29 to 38 39 to 53 54 to 63 64 to 72 73 to 93
Sold distressed property 8% 2% 4% 13% 11% 6% 6%
Year sold distressed property (median) 2011 2014 2012 2011 2011 2010 2014
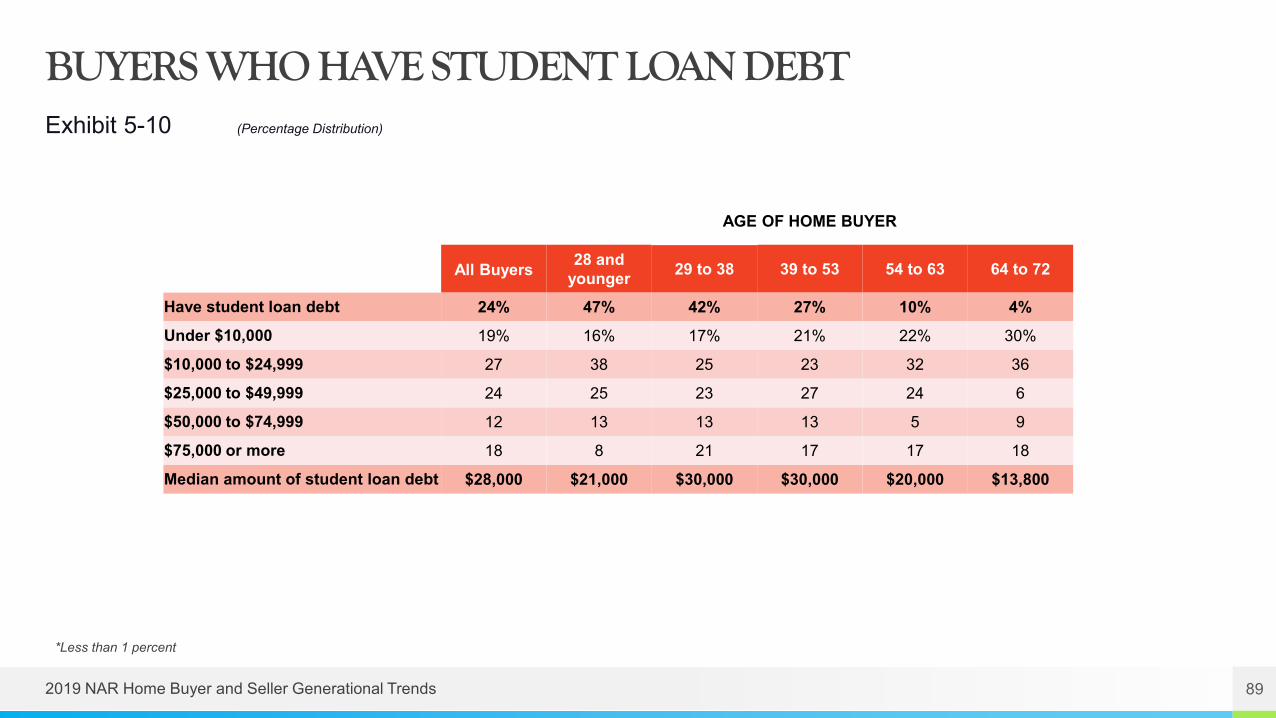
BUYERS WHO HAVE STUDENT LOAN DEBT
2019 NAR Home Buyer and Seller Generational Trends 89
Exhibit 5-10 (Percentage Distribution)
*Less than 1 percent
AGE OF HOME BUYER
All Buyers 28 and younger 29 to 38 39 to 53 54 to 63 64 to 72
Have student loan debt 24% 47% 42% 27% 10% 4%Under $10,000 19% 16% 17% 21% 22% 30%
$10,000 to $24,999 27 38 25 23 32 36
$25,000 to $49,999 24 25 23 27 24 6
$50,000 to $74,999 12 13 13 13 5 9
$75,000 or more 18 8 21 17 17 18
Median amount of student loan debt $28,000 $21,000 $30,000 $30,000 $20,000 $13,800

TYPE OF MORTGAGE
2019 NAR Home Buyer and Seller Generational Trends 90
Exhibit 5-11 (Percentage Distribution Among those who Financed their Home Purchase)
*Less than 1 percent
90% 91% 91% 92% 90%86%
76%
3% 2% 3% 4% 4% 4% 5%2% 1% 2% 2% 2% 3% 2%3%
7%3% 1% 1% 1%
6%3%
* 1% 1% 3%7%
11%
0%
20%
40%
60%
80%
100%
All Buyers 28 and younger 29 to 38 39 to 53 54 to 63 64 to 72 73 to 93
Fixed-rate mortgage Fixed-then adjustable rate mortgage Adjustable-rate mortgage Don't know Other

TYPE OF LOAN
2019 NAR Home Buyer and Seller Generational Trends 91
Exhibit 5-12 (Percentage Distribution Among those who Financed their Home Purchase)
61%
50%
64%60%
63%67% 65%
17%
27%
17% 19% 18%
8% 8%13% 11% 9%
15% 13%
19% 18%
4%9%
6% 4% 2% 1% 3%4% 3% 3% 2% 3% 5% 6%
0%
20%
40%
60%
80%
All Buyers 28 and younger 29 to 38 39 to 53 54 to 63 64 to 72 73 to 93
Conventional FHA VA Don't Know Other

BUYERS' VIEW OF HOMES AS A FINANCIAL INVESTMENT
2019 NAR Home Buyer and Seller Generational Trends 92
Exhibit 5-13 (Percentage Distribution)
AGE OF HOME BUYER
All Buyers 28 and younger 29 to 38 39 to 53 54 to 63 64 to 72 73 to 93
Good financial investment 84% 87% 88% 85% 83% 82% 77%
Better than stocks 42 44 41 40 42 43 45
About as good as stocks 30 30 33 32 30 29 24
Not as good as stocks 12 13 14 13 11 10 8
Not a good financial investment 4 1 3 3 5 6 6
Don't know 12 11 10 11 12 11 16

Chapter 6Home Sellers and Their Selling Experience
932019 NAR Home Buyer and Seller Generational Trends

Home Sellers and Their Selling Experience
○ Sellers 39 to 53 years made up the largest share of home sellers at 25 percent, had a median age of 45 years, and the highest median income at $123,600. Sellers 64 to 72 made up the second largest share of sellers at 22 percent with a median age of 68 years. Sellers 73 years and older had the lowest incomes.
○ Seventy-one percent of sellers were married couples. Married couples were the highest for sellers between 29 to 38 years at 84 percent.
○ Seventy percent of all sellers moved within the same state. For sellers 29 to 38 years, 77 percent purchased in the same state compared to 62 percent of sellers 64 to 72 years.
○ For all sellers, the most commonly cited reason for selling their home was that it was too small (15 percent), followed by the desire to move closer to friends and family (14 percent), and a job relocation (13 percent).
○ Sellers typically lived in their home for nine years before selling. Sellers 29 to 38 years stayed in their home for five years compared to 17 years for sellers 73 years and older.
○ Nine in 10 home sellers worked with a real estate agent to sell their
home, which was consistent across all age groups.
○ For recently sold homes, the final sales price was a median 99 percent of the final listing price. Sellers 29 to 38 years, the final sales price was 100 percent of the listing price.
○ Recently sold homes were on the market for a median of three weeks. For sellers 54 to 63 years, time on market was a median of four weeks and a median of two weeks for sellers 29 to 38 years.
○ Thirty-four percent of all sellers offered incentives to attract buyers. This varied across age groups where it was less likely for sellers 73 years and over to offer incentives and more likely for sellers 29 to 38 years.
○ This year, home sellers cited that they sold their homes for a median of $55,000 more than they purchased it. Sellers 29 to 53 years gained the least at $40,000 in equity compared to sellers 73 years and over that gained $86,000 in equity as they likely had lived in their homes for a longer period of time.
○ Sixty-four percent of sellers were ‘very satisfied’ with the selling process, consistent with the year prior and across all age groups.
942019 NAR Home Buyer and Seller Generational Trends

Home Sellers and Their Selling Experience
952019 NAR Home Buyer and Seller Generational Trends
Exhibit 6-1 • AGE OF HOME SELLERSExhibit 6-2 • HOUSEHOLD INCOME OF HOME SELLERSExhibit 6-3 • ADULT COMPOSITION OF HOME SELLER HOUSEHOLDSExhibit 6-4 • NUMBER OF CHILDREN UNDER THE AGE OF 18 RESIDING IN HOME SELLER HOUSEHOLDExhibit 6-5 • RACE/ETHNICITY OF HOME SELLERSExhibit 6-6 • PRIMARY LANGUAGE SPOKEN IN HOME SELLER HOUSEHOLDExhibit 6-7 • FIRST-TIME OR REPEAT SELLERExhibit 6-8 • PROXIMITY OF HOME SOLD TO HOME PURCHASEDExhibit 6-9 • LOCATION OF HOME SOLDExhibit 6-10 • TYPE OF HOME SOLDExhibit 6-11 • SIZE OF HOME PURCHASED COMPARED TO HOME RECENTLY SOLDExhibit 6-12 • NUMBER OF BEDROOMS AND BATHROOMSExhibit 6-13 • PRICE OF HOME PURCHASED COMPARED TO HOME RECENTLY SOLDExhibit 6-14 • PRIMARY REASON FOR SELLING PREVIOUS HOME
Exhibit 6-15 • SELLER WANTED TO SELL EARLIER BUT WAITED OR STALLED BECAUSE HOME WAS WORTH LESS THAN MORTGAGE
Exhibit 6-16 • TENURE IN PREVIOUS HOMEExhibit 6-17 • DISTANCE BETWEEN HOME PURCHASED AND HOME RECENTLY SOLDExhibit 6-18 • METHOD USED TO SELL HOMEExhibit 6-19 • SALES PRICE COMPARED WITH LISTING PRICEExhibit 6-20 • NUMBER OF WEEKS RECENTLY SOLD HOME WAS ON THE MARKETExhibit 6-21 • NUMBER OF TIMES ASKING PRICE WAS REDUCED
Exhibit 6-22 • INCENTIVES OFFERED TO ATTRACT BUYERS, BY NUMBER OF WEEKS HOME WAS ON THE MARKET
Exhibit 6-23 • SATISFACTION WITH THE SELLING PROCESS

AGE OF HOME SELLERS
2019 NAR Home Buyer and Seller Generational Trends 96
Exhibit 6-1 (Percentage Distribution)
*Less than 1 percent
12%
22%
21%
25%
18%
2%
*
% 5% 10% 15% 20% 25% 30%
Silent Generation: 73 to 93 years
Older Boomers: 64 to 72 years
Younger Boomers: 54 to 63 years
Gen Xers: 39 to 53 years
Older Gen Y/Millennials: 29 to 38 years
Younger Gen Y/Millennials: 21 to 28 years
Gen Zers: 20 years and younger
Median Age in Group
20
26
34
45
59
68
76
Note: Sellers 28 years and younger only made up two percent of the share of all sellers. They were not included in chapters 6 or 7 on home sellers due to the low number of responses for analysis.

HOUSEHOLD INCOME OF HOME SELLERS
2019 NAR Home Buyer and Seller Generational Trends 97
Exhibit 6-2 (Percentage Distribution)
*Less than 1 percent
AGE OF HOME SELLER
All Sellers 29 to 38 39 to 53 54 to 63 64 to 72 73 to 93
Less than $25,000 3% * 1% 3% 4% 6%
$25,000 to $34,999 4 2 1 3 6 13
$35,000 to $44,999 5 1 2 5 8 11
$45,000 to $54,999 6 5 3 7 8 10
$55,000 to $64,999 6 5 4 7 7 9
$65,000 to $74,999 7 4 5 7 11 7
$75,000 to $84,999 8 8 6 7 9 8
$85,000 to $99,999 12 15 11 9 14 12
$100,000 to $124,999 15 17 18 15 11 10
$125,000 to $149,999 9 14 13 8 7 5
$150,000 to $174,999 8 11 10 8 4 2
$175,000 to $199,999 5 7 9 5 3 2
$200,000 or more 12 9 17 15 8 4
Median income (2017) $98,800 $114,700 $123,600 $103,300 $81,700 $66,400

ADULT COMPOSITION OF HOME SELLER HOUSEHOLDS
2019 NAR Home Buyer and Seller Generational Trends 98
Exhibit 6-3 (Percentage Distribution)
*Less than 1 percent
71%
84%
76%
66% 67%62%
17%
6%13%
20% 21%27%
6% 4% 5% 7% 7% 8%4% 6% 5% 4% 3% 1%2% * 2% 2% 2% 2%
0%
20%
40%
60%
80%
100%
All Sellers 29 to 38 39 to 53 54 to 63 64 to 72 73 to 93
Married couple Single female Single male Unmarried couple Other

NUMBER OF CHILDREN UNDER THE AGE OF 18 RESIDING IN HOME SELLER HOUSEHOLD
2019 NAR Home Buyer and Seller Generational Trends 99
Exhibit 6-4 (Percentage Distribution of Home Seller Households)
*Less than 1 percent
68% 66%
29%
38%
90%97% 98%
11%19% 22% 20%
7%2% 2%
14% 15%
33%28%
3% 1% *7%
*
16% 14%
* * *0%
20%
40%
60%
80%
100%
All Sellers 28 and younger 29 to 38 39 to 53 54 to 63 64 to 72 73 to 93
None One Two Three or more

RACE/ETHNICITY OF HOME SELLERS
2019 NAR Home Buyer and Seller Generational Trends 100
Exhibit 6-5 (Percent of Respondents)
Note: Respondents were permitted to select as many races and ethnicities as they felt applicable. The percentage distribution may therefore sum to more than 100 percent.
AGE OF HOME SELLER
All Sellers 29 to 38 39 to 53 54 to 63 64 to 72 73 to 93
White/Caucasian 91% 82% 80% 88% 91% 91%
Hispanic/Latino 4 7 9 4 3 6
Asian/Pacific Islander 2 8 5 2 1 1
Black/African-American 3 5 9 5 4 1
Other 2 3 3 2 3 2

PRIMARY LANGUAGE SPOKEN IN HOME SELLER HOUSEHOLD
2019 NAR Home Buyer and Seller Generational Trends 101
Exhibit 6-6 (Percentage Distribution)
*Less than 1 percent
98% 99%96%
99% 98% 98%
2% 1%4%
1% 2% 2%0%
20%
40%
60%
80%
100%
All Sellers 29 to 38 39 to 53 54 to 63 64 to 72 73 to 93
English Other
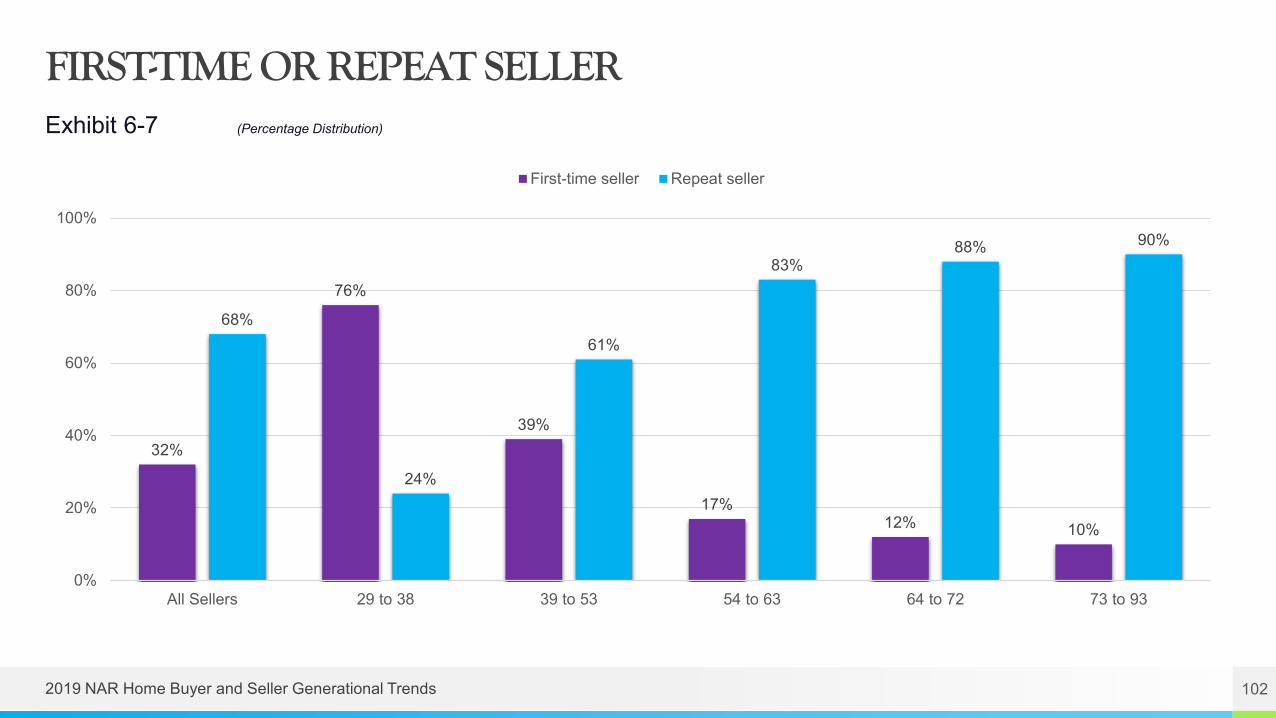
FIRST-TIME OR REPEAT SELLER
2019 NAR Home Buyer and Seller Generational Trends 102
Exhibit 6-7 (Percentage Distribution)
32%
76%
39%
17%12% 10%
68%
24%
61%
83%88% 90%
0%
20%
40%
60%
80%
100%
All Sellers 29 to 38 39 to 53 54 to 63 64 to 72 73 to 93
First-time seller Repeat seller

PROXIMITY OF HOME SOLD TO HOME PURCHASED
2019 NAR Home Buyer and Seller Generational Trends 103
Exhibit 6-8 (Percentage Distribution)
70%77% 75%
66%62%
66%
14% 13%10%
15%18% 20%
16%10%
15%19% 20%
14%
0%
20%
40%
60%
80%
100%
All Sellers 29 to 38 39 to 53 54 to 63 64 to 72 73 to 93
Same state Same region Other region

LOCATION OF HOME SOLD
2019 NAR Home Buyer and Seller Generational Trends 104
Exhibit 6-9 (Percentage Distribution)
*Less than 1 percent
AGE OF HOME SELLER
All Sellers 29 to 38 39 to 53 54 to 63 64 to 72 73 to 93
Suburb/Subdivision 52% 55% 57% 53% 47% 41%
Small town 16 17 15 13 17 18
Urban area/Central city 16 20 14 16 16 11
Rural area 14 8 12 15 15 24
Resort/Recreation area 2 * * 2 4 5

TYPE OF HOME SOLD
2019 NAR Home Buyer and Seller Generational Trends 105
Exhibit 6-10 (Percentage Distribution)
AGE OF HOME SELLER
All Sellers 29 to 38 39 to 53 54 to 63 64 to 72 73 to 93
Detached single-family home 80% 74% 84% 81% 80% 79%
Townhouse/row house 7 11 7 7 5 5Apartment/condo in a building with 5 or more units 4 6 3 3 4 3
Duplex/apartment/condo in 2 to 4 unit building 4 5 2 3 4 3
Other 6 4 3 6 7 10

SIZE OF HOME PURCHASED COMPARED TO HOME RECENTLY SOLD
2019 NAR Home Buyer and Seller Generational Trends 106
Exhibit 6-11 (Median Square Feet)
Size of home sold Size of home purchased
Difference in Square Feet
All Sellers 1,900 1,900 0
29 to 38 1,600 1,880 280
39 to 53 1,870 2,100 230
54 to 63 2,100 1,900 -200
64 to 72 2,000 1,900 -100
73 to 93 2,000 1,740 -260

NUMBER OF BEDROOMS AND BATHROOMS
2019 NAR Home Buyer and Seller Generational Trends 107
Exhibit 6-12 (Percentage Distribution)
*Less than 1 percent
AGE OF HOME SELLER
All Sellers 29 to 38 39 to 53 54 to 63 64 to 72 73 to 93
One bedroom 1% 2% 1% 1% 1% *
Two bedrooms 14 17 12 10 17 17
Three bedrooms or more 85 81 87 89 82 83
Median number of bedrooms 3 3 3 3 3 3
One full bathroom 16 21 18 12 15 8
Two full bathrooms 59 64 56 55 58 66
Three full bathrooms or more 26 15 26 34 27 26
Median number of full bathrooms 2 2 2 2 2 2

PRICE OF HOME PURCHASED COMPARED TO HOME RECENTLY SOLD
2019 NAR Home Buyer and Seller Generational Trends 108
Exhibit 6-13 (Median)
Price of home sold Price of home purchased Difference in Price
All Sellers $255,000 $250,000 -$5,000
29 to 38 $224,300 $261,000 $36,700
39 to 53 $250,000 $287,000 $37,000
54 to 63 $275,000 $255,000 -$20,000
64 to 72 $265,000 $249,000 -$16,000
73 to 93 $281,200 $244,000 -$37,200

PRIMARY REASON FOR SELLING PREVIOUS HOME
2019 NAR Home Buyer and Seller Generational Trends 109
Exhibit 6-14 (Percentage Distribution)
*Less than 1 percent
AGE OF HOME SELLER
All Sellers 29 to 38 39 to 53 54 to 63 64 to 72 73 to 93
Home is too small 15% 35% 20% 6% 4% 3%
Want to move closer to friends or family 14 6 6 12 26 30
Job relocation 13 19 19 17 4 1
Neighborhood has become less desirable 9 10 10 10 9 6Change in family situation (e.g., marriage, birth of a child, divorce) 8 9 12 7 5 6
Home is too large 10 1 6 11 14 20
Moving due to retirement 7 * 1 9 16 7
Want to move closer to current job 5 8 6 6 1 1Upkeep of home is too difficult due to health or financial limitations 4 1 2 4 4 10
Schools became less desirable 2 3 4 1 * *Can not afford the mortgage and other expenses of owning home 2 * 2 2 2 2
Other 13 9 13 15 14 15
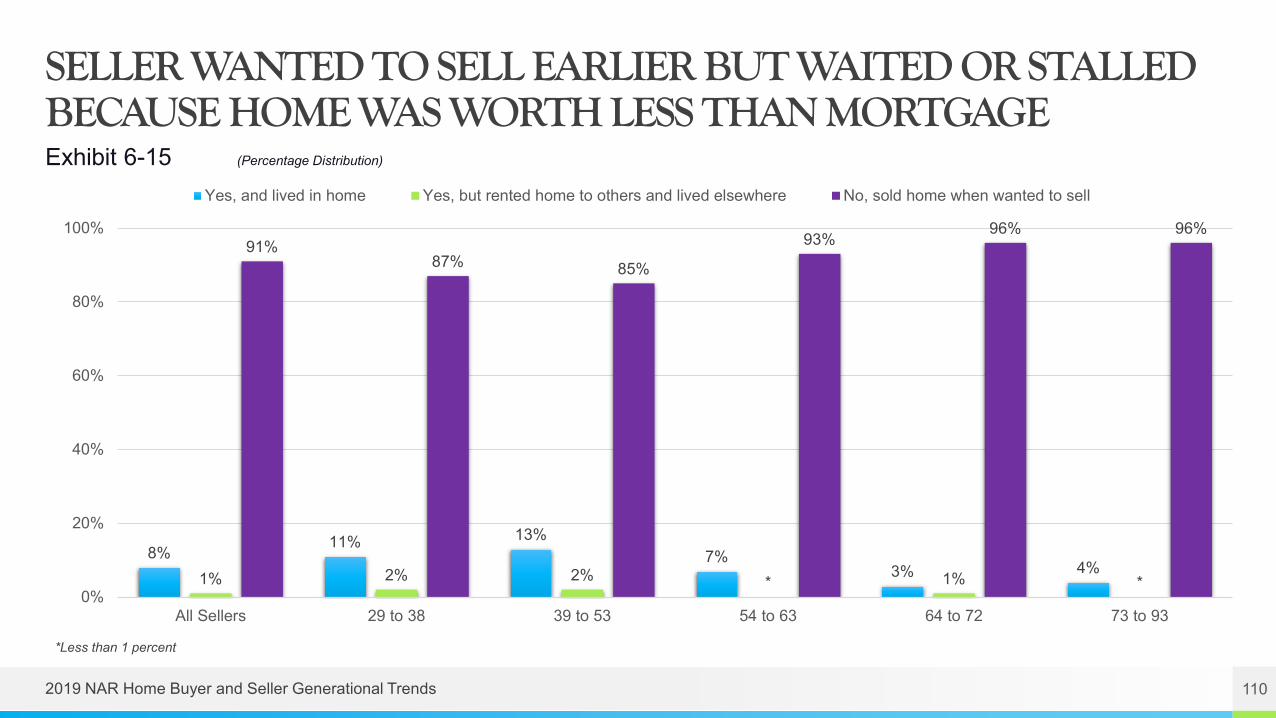
SELLER WANTED TO SELL EARLIER BUT WAITED OR STALLED BECAUSE HOME WAS WORTH LESS THAN MORTGAGE
2019 NAR Home Buyer and Seller Generational Trends 110
Exhibit 6-15 (Percentage Distribution)
*Less than 1 percent
8%11% 13%
7%3% 4%
1% 2% 2% * 1% *
91%87% 85%
93%96% 96%
0%
20%
40%
60%
80%
100%
All Sellers 29 to 38 39 to 53 54 to 63 64 to 72 73 to 93
Yes, and lived in home Yes, but rented home to others and lived elsewhere No, sold home when wanted to sell

TENURE IN PREVIOUS HOME
2019 NAR Home Buyer and Seller Generational Trends 111
Exhibit 6-16 (Percentage Distribution)
*Less than 1 percent
AGE OF HOME SELLER
All Sellers 29 to 38 39 to 53 54 to 63 64 to 72 73 to 93
1 year or less 9% 10% 8% 8% 8% 6%
2 to 3 years 15 28 16 12 11 6
4 to 5 years 12 22 12 12 7 4
6 to 7 years 8 16 9 7 5 5
8 to 10 years 12 17 18 8 7 6
11 to 15 years 17 6 26 17 18 18
16 to 20 years 11 1 8 17 12 18
21 years or more 16 * 3 20 31 36
Median 9 5 9 12 14 17
NA=Not applicable

DISTANCE BETWEEN HOME PURCHASED AND HOME RECENTLY SOLD
2019 NAR Home Buyer and Seller Generational Trends 112
Exhibit 6-17 (Median Miles)
20
15 14
27
50
27
0
20
40
60
All Sellers 29 to 38 39 to 53 54 to 63 64 to 72 73 to 93

METHOD USED TO SELL HOME
2019 NAR Home Buyer and Seller Generational Trends 113
Exhibit 6-18 (Percentage Distribution)
*Less than 1 percent
AGE OF HOME SELLER
All Sellers 29 to 38 39 to 53 54 to 63 64 to 72 73 to 93
Sold home using an agent or broker 92% 90% 91% 89% 88% 88%
Seller used agent/broker only 90 88 90 87 86 87Seller first tried to sell it themselves, but then used an agent 2 2 1 2 2 1
For-sale-by-owner (FSBO) 7 6 7 11 10 10Seller sold home without using a real estate agent or broker 6 6 6 6 7 8
First listed with an agent, but then sold home themselves 1 * 1 * 1 1
Sold home to a homebuying company 1 2 1 * 1 1
Other 1 2 1 * 1 1

SALES PRICE COMPARED WITH LISTING PRICE
2019 NAR Home Buyer and Seller Generational Trends 114
Exhibit 6-19 (Percentage Distribution of Sales Price as a Percent of List Price)
*Less than 1 percent
AGE OF HOME SELLER
All Sellers 29 to 38 39 to 53 54 to 63 64 to 72 73 to 93
Less than 90% 7% 3% 6% 9% 6% 7%
90% to 94% 13 12 13 13 12 14
95% to 99% 35 32 34 36 40 38
100% 26 26 26 25 25 29
101% to 110% 16 24 18 13 13 8
More than 110% 4 3 3 4 4 4Median (sales price as a percent of listing price) 99% 100% 99% 99% 99% 99%

NUMBER OF WEEKS RECENTLY SOLD HOME WAS ON THE MARKET
2019 NAR Home Buyer and Seller Generational Trends 115
Exhibit 6-20 (Percentage Distribution)
*Less than 1 percent
AGE OF HOME SELLER
All Sellers 29 to 38 39 to 53 54 to 63 64 to 72 73 to 93
Less than 1 week 10% 12% 8% 10% 11% 10%
1 to 2 weeks 37 42 42 33 37 32
3 to 4 weeks 13 16 12 13 11 15
5 to 6 weeks 6 7 7 6 7 3
7 to 8 weeks 6 6 6 7 5 8
9 to 10 weeks 3 2 3 3 3 4
11 to 12 weeks 7 5 7 5 8 11
13 to 16 weeks 4 2 5 6 4 4
17 to 24 weeks 5 3 5 6 7 4
25 to 37 weeks 3 3 3 3 3 4
38 to 53 weeks 3 2 2 5 4 3
53 or more weeks 2 * 1 2 3 3
Median weeks 3 2 2 4 3 3

NUMBER OF TIMES ASKING PRICE WAS REDUCED
2019 NAR Home Buyer and Seller Generational Trends 116
Exhibit 6-21 (Percentage Distribution)
*Less than 1 percent
AGE OF HOME SELLER
All Sellers 29 to 38 39 to 53 54 to 63 64 to 72 73 to 93
None, did not reduce the asking price 60% 71% 62% 55% 55% 55%
One 23 16 23 24 27 28
Two 10 9 7 11 10 12
Three 5 2 4 6 5 4
Four or more 3 1 4 4 3 1

INCENTIVES OFFERED TO ATTRACT BUYERS, BY NUMBER OF WEEKS HOME WAS ON THE MARKET
2019 NAR Home Buyer and Seller Generational Trends 117
Exhibit 6-22 (Percent of Respondents)
*Less than 1 percent
AGE OF HOME SELLER
All Sellers 29 to 38 39 to 53 54 to 63 64 to 72 73 to 93
None 66% 63% 67% 67% 65% 70%
Home warranty policies 18 18 19 19 19 11
Assistance with closing costs 13 20 14 12 10 10
Credit toward remodeling or repairs 7 9 6 9 5 5Other incentives, such as a car, flat screen TV, etc. 4 2 3 4 4 4
Assistance with condo association fees * * * * 1 *
Other 4 4 3 4 6 7

SATISFACTION WITH THE SELLING PROCESS
2019 NAR Home Buyer and Seller Generational Trends 118
Exhibit 6-23 (Percentage Distribution)
64%67%
63%58%
67% 66%
25% 24% 26% 27%22% 24%
8% 7% 8% 9% 7% 5%4% 3% 4% 6%3% 5%
0%
20%
40%
60%
80%
All Sellers 29 to 38 39 to 53 54 to 63 64 to 72 73 to 93
Very Satisfied Somewhat Satisfied Somewhat Dissatisfied Very Dissatisfied
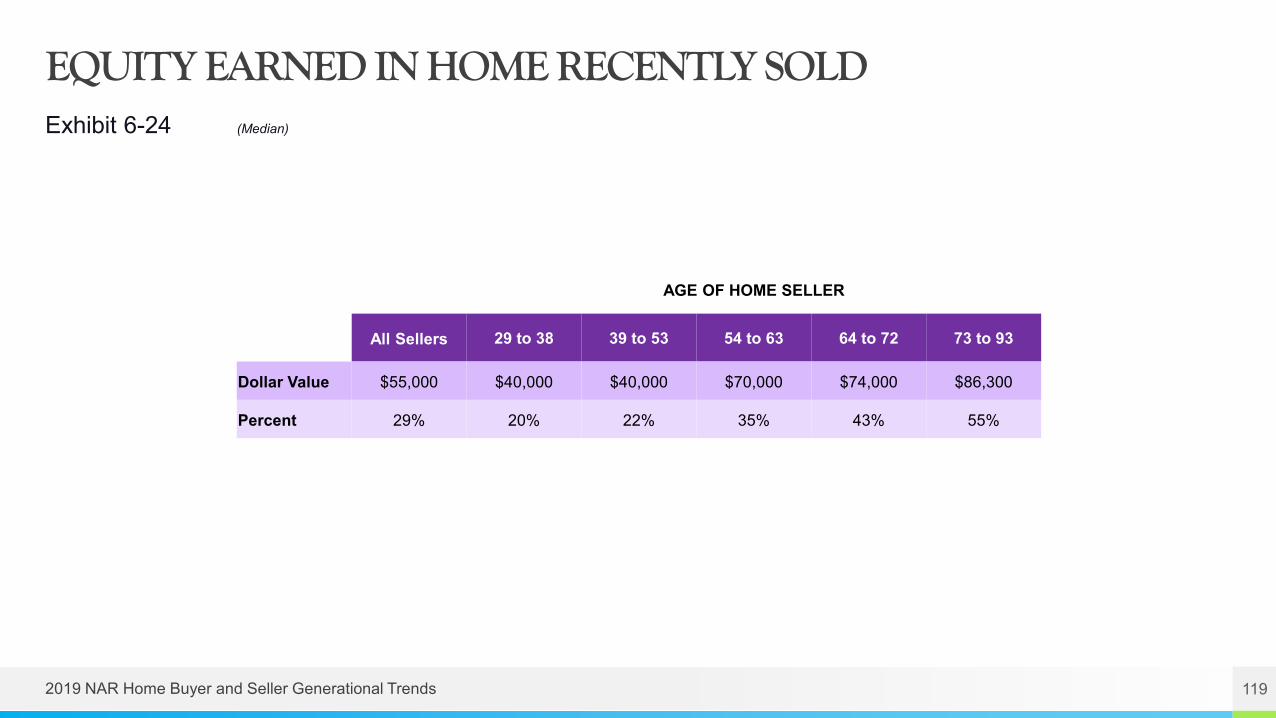
EQUITY EARNED IN HOME RECENTLY SOLD
2019 NAR Home Buyer and Seller Generational Trends 119
Exhibit 6-24 (Median)
AGE OF HOME SELLER
All Sellers 29 to 38 39 to 53 54 to 63 64 to 72 73 to 93
Dollar Value $55,000 $40,000 $40,000 $70,000 $74,000 $86,300
Percent 29% 20% 22% 35% 43% 55%

Chapter 7Home Selling and Real Estate Professionals
1202019 NAR Home Buyer and Seller Generational Trends

Home Selling and Real Estate Professionals
○ Sixty-three percent of recent home sellers used a referral or the same real estate agent they had worked with in the past. That number jumped to 68 percent for home sellers aged 29 to 38 years.
○ Fifty-three percent of sellers used the same agent to buy and sell their homes. As distance and age increased, using the same agent declined.
○ Nine in ten sellers listed their homes on the Multiple Listing Service (MLS), which was the number one source for sellers to list their home.
○ The typical seller has recommended their agent once since selling their home, and twice for sellers 29 to 53 years and 64 to 72 years. Thirty-two percent of sellers recommended their agent three or more times since selling their home. That number jumped to 36 percent for sellers 39 to 53 years.
○ Eighty-six percent said that they would definitely (69 percent) or probably (17 percent) recommend their agent for future services. Sellers 64 to 72 years were the most likely to definitely recommend their agent (72 percent).
1212019 NAR Home Buyer and Seller Generational Trends

Home Selling and Real Estate Professionals
1222019 NAR Home Buyer and Seller Generational Trends
Exhibit 7-1 • METHOD USED TO FIND REAL ESTATE AGENT
Exhibit 7-2 • NUMBER OF AGENTS CONTACTED BEFORE SELECTING ONE TO ASSIST WITH SALE OF HOME
Exhibit 7-3 • DID SELLER USE THE SAME REAL ESTATE AGENT FOR THEIR HOME PURCHASE?
Exhibit 7-4 • HOME LISTED ON MULTIPLE LISTING SERVICE
Exhibit 7-5 • LEVEL OF SERVICE PROVIDED BY THE REAL ESTATE AGENT
Exhibit 7-6 • WHAT SELLERS MOST WANT FROM REAL ESTATE AGENTS, BY LEVEL OF SERVICE PROVIDED BY THE AGENT
Exhibit 7-7 • MOST IMPORTANT FACTOR IN CHOOSING A REAL ESTATE AGENT TO SELL HOME, BY LEVEL OF SERVICE PROVIDED BY THE AGENT
Exhibit 7-8 • METHODS REAL ESTATE AGENT USED TO MARKET HOME
Exhibit 7-9 • NEGOTIATING THE COMMISSION RATE OR FEE WITH THE REAL ESTATE AGENT
Exhibit 7-10 • WOULD SELLER USE REAL ESTATE AGENT AGAIN OR RECOMMEND TO OTHERS
Exhibit 7-11 • HOW MANY TIMES SELLER RECOMMENDED TYPICAL AGENT

METHOD USED TO FIND REAL ESTATE AGENT
2019 NAR Home Buyer and Seller Generational Trends 123
Exhibit 7-1 (Percentage Distribution)
*Less than 1 percent
AGE OF HOME BUYER
All Sellers 29 to 38 39 to 53 54 to 63 64 to 72 73 to 93
Referred by (or is) a friend, neighbor or relative 39% 40% 41% 38% 36% 37%
Used agent previously to buy or sell a home 24 28 25 24 24 19
Personal contact by agent (telephone, email, etc.) 5 4 4 6 6 7
Internet website (without a specific reference) 4 4 4 4 5 2
Visited an open house and met agent 4 3 3 4 3 5
Referred by another real estate or broker 3 3 2 2 3 5
Saw contact information on For Sale/Open House sign 2 2 3 2 1 2
Referred through employer or relocation company 2 4 2 2 1 1
Direct mail (newsletter, flyer, postcard, etc.) 2 1 2 1 2 3
Walked into or called office and agent was on duty 2 1 1 1 3 4
Newspaper, Yellow pages or home book ad 1 * * 1 1 3
Advertising specialty (calendar, magnet, etc.) * * 1 * * 1Crowdsourcing through social media/knew the person through social media 1 1 * 1 * *
Saw the person's social media page without a connection * * * * 1 *
Other 12 8 10 13 15 12

NUMBER OF AGENTS CONTACTED BEFORE SELECTING ONE TO ASSIST WITH SALE OF HOME
2019 NAR Home Buyer and Seller Generational Trends 124
Exhibit 7-2 (Percentage Distribution)
*Less than 1 percent
AGE OF HOME BUYER
All Sellers 29 to 38 39 to 53 54 to 63 64 to 72 73 to 93
One 75% 84% 78% 74% 71% 67%
Two 13 10 12 14 15 20
Three 8 5 8 8 11 9
Four 2 1 1 2 2 3
Five or more 1 * 1 2 1 1

DID SELLER USE THE SAME REAL ESTATE AGENT FOR THEIR HOME PURCHASE?
2019 NAR Home Buyer and Seller Generational Trends 125
Exhibit 7-3 (Median)
*Less than 1 percent
53%
65%
58%
47%42%
50%47%
35%
42%
53%58%
50%
0%
20%
40%
60%
80%
All Sellers 29 to 38 39 to 53 54 to 63 64 to 72 73 to 93
Used same agent Used new agent

HOME LISTED ON MULTIPLE LISTING SERVICE
2019 NAR Home Buyer and Seller Generational Trends 126
Exhibit 7-4 (Percentage Distribution)
*Less than 1 percent
*
90% 89% 92% 93%
84% 83%
4% 3% 4% 3%8% 7%6% 9%
4% 4%8% 9%
0%
20%
40%
60%
80%
100%
All Sellers 29 to 38 39 to 53 54 to 63 64 to 72 73 to 93
Listed on MLS Did not list on MLS Don't know

LEVEL OF SERVICE PROVIDED BY THE REAL ESTATE AGENT
2019 NAR Home Buyer and Seller Generational Trends 127
Exhibit 7-5 (Percentage Distribution)
AGE OF HOME BUYER
All Sellers 29 to 38 39 to 53 54 to 63 64 to 72 73 to 93
A broad range of services and management of most aspects of the home 83% 86% 86% 82% 83% 80%
A limited set of services as requested by the seller 9 8 6 9 9 10
The agent listed the home on the MLS and performed few if any additional services 8 6 8 10 8 10

WHAT SELLERS MOST WANT FROM REAL ESTATE AGENTS, BY LEVEL OF SERVICE PROVIDED BY THE AGENT
2019 NAR Home Buyer and Seller Generational Trends 128
Exhibit 7-6 (Percentage Distribution)
*Less than 1 percent
AGE OF HOME BUYER
All Sellers 29 to 38 39 to 53 54 to 63 64 to 72 73 to 93
Help seller market home to potential buyers 20% 18% 19% 19% 22% 19%
Help sell the home within specific timeframe 20 18 17 21 19 17
Help price home competitively 19 24 22 18 18 18
Help find a buyer for home 14 11 12 14 14 23
Help seller find ways to fix up home to sell it for more 14 15 18 13 13 9
Help with negotiation and dealing with buyers 6 8 6 7 4 5
Help with paperwork/inspections/preparing for settlement 4 3 3 4 5 4
Help seller see homes available to purchase 2 2 1 1 3 1
Help create and post videos to provide tour of my home 1 * * 1 1 1
Other 1 1 1 2 1 3

MOST IMPORTANT FACTOR IN CHOOSING A REAL ESTATE AGENT TO SELL HOME, BY LEVEL OF SERVICE PROVIDED BY THE AGENT
2019 NAR Home Buyer and Seller Generational Trends 129
Exhibit 7-7 (Percentage Distribution)
*Less than 1 percent
AGE OF HOME BUYER
All Sellers 29 to 38 39 to 53 54 to 63 64 to 72 73 to 93
Reputation of agent 31% 28% 29% 35% 33% 32%
Agent is honest and trustworthy 19 27 24 17 14 14
Agent is friend or family member 15 19 15 14 15 11
Agent’s knowledge of the neighborhood 13 8 11 14 14 17
Agent has caring personality/good listener 4 3 3 5 5 4
Agent's commission 4 4 5 3 4 2
Agent’s association with a particular firm 4 2 4 3 4 4Agent seems 100% accessible because of use of technology like tablet or smartphone 3 2 2 2 3 5
Professional designations held by agent 1 1 1 1 1 2
Other 6 7 6 6 6 8

METHODS REAL ESTATE AGENT USED TO MARKET HOME
2019 NAR Home Buyer and Seller Generational Trends 130
Exhibit 7-8 (Percent of Respondents Among Sellers Who Used an Agent)
*Less than 1 percent
AGE OF HOME BUYER
All Sellers 29 to 38 39 to 53 54 to 63 64 to 72 73 to 93
Multiple Listing (MLS) website 87% 87% 88% 90% 83% 83%Yard sign 66 63 68 66 64 63Realtor.com 53 54 57 56 47 35Open house 52 56 51 54 52 53Real estate agent website 50 47 53 51 49 42Real estate company website 47 42 47 45 48 39Third party aggregators 45 60 53 44 39 29Social networking websites (e.g. Facebook,Twitter, etc.) 20 30 28 18 10 7
Video 10 8 9 14 10 10Print newspaper advertisement 10 4 4 8 9 12Direct mail (flyers, postcards, etc.) 7 9 11 12 11 7Online classified ads 7 5 4 9 8 6Other websites with real estate listings 6 5 5 6 6 4Real estate magazine website 6 4 5 5 7 3Real estate magazine 5 2 5 6 9 6Video hosting websites 2 2 2 3 1 3Television 1 1 * * 1 *Other 3 3 3 3 6 5

NEGOTIATING THE COMMISSION RATE OR FEE WITH THE REAL ESTATE AGENT
2019 NAR Home Buyer and Seller Generational Trends 131
Exhibit 7-9 (Percentage Distribution)
*Less than 1 percent
AGE OF HOME BUYER
All Sellers 29 to 38 39 to 53 54 to 63 64 to 72 73 to 93
Real estate agent initiated discussion of compensation 47% 46% 45% 47% 52% 48%
Client brought up the topic and the real estate agent was able and willing to negotiate their commission or fee
21 16 20 27 21 21
Client brought up the topic and the real estate agent was unwilling or unable to negotiate their commission or fee
6 2 5 6 7 8
Client did know commissions and fees could be negotiated but did not bring up the topic 11 16 10 9 9 9
Client did not know commissions and fees could be negotiated 15 20 20 11 12 14

WOULD SELLER USE REAL ESTATE AGENT AGAIN OR RECOMMEND TO OTHERS
2019 NAR Home Buyer and Seller Generational Trends 132
Exhibit 7-10 (Percentage Distribution)
*Less than 1 percent
*
69% 70% 69%65%
72%67%
17% 17% 17% 18% 16% 16%
6% 5% 7% 9%4% 6%7% 7% 5%
8% 6%9%
1% 1% 1% 1% 2% 2%0%
20%
40%
60%
80%
All Sellers 29 to 38 39 to 53 54 to 63 64 to 72 73 to 93
Definitely Probably Probably Not Definitely Not Don't Know/ Not Sure

HOW MANY TIMES SELLER RECOMMENDED TYPICAL AGENT
2019 NAR Home Buyer and Seller Generational Trends 133
Exhibit 7-11 (Percentage Distribution)
AGE OF HOME BUYER
All Sellers 29 to 38 39 to 53 54 to 63 64 to 72 73 to 93
None 35% 29% 33% 35% 36% 42%
One time 16 20 16 16 14 14
Two times 17 18 15 17 19 15
Three times 11 11 13 8 10 12
Four or more times 21 22 23 24 21 17
Times recommended since buying (median) 1 2 2 1 2 1

Methodology
1342019 NAR Home Buyer and Seller Generational Trends
In July 2018, NAR mailed out a 129-question survey using a random sample weighted to be representative of sales on a geographic basis to 155,250 recent home buyers. The recent home buyers had to have purchased a primary residence home between July of 2017 and June of 2018. A total of 7,191 responses were received from primary residence buyers. After accounting for undeliverable questionnaires, the survey had an adjusted response rate of 4.6 percent.
Respondents had the option to fill out the survey via hard copy or online. The online survey was available in English and Spanish.
Consumer names and addresses were obtained from Experian, a firm that maintains an extensive database of recent home buyers derived from county records. Information about sellers comes from those buyers who also sold a home.
All information in this Profile is characteristic of the 12-month period ending June 2018, with the exception of income data, which are reported for 2017. In some sections comparisons are also given for results obtained in previous surveys. Not all results are directly comparable due to changes in questionnaire design and sample size.

NATIONAL ASSOCIATION OF REALTORS®Some results are presented for the four U.S. Census regions: Northeast, Midwest, South, and West. The median is the primary statistical measure used throughout this report. Due to rounding and omissions for space, percentage distributions may not add to 100 percent.
Data gathered in the report is based on primary residence home buyers. The definitions of the generations used to distinguish home buyers and sellers were based on a study published in the REALTOR® University’s Center for Real Estate Studies journal article titled, Generational Trends in Homeownership: An Era of Renters? by Glenn E. Crellin. Additional splitting of older baby boomer age groups and younger baby boomer age groups was modeled on research from the Pew Research Center, Generations 2010.
1352019 NAR Home Buyer and Seller Generational Trends
Year Born: Age in 2019:
Gen Zers:1991 and after
20 years & younger
Younger Gen Y/Millennials: 1990-1998 21 to 28
Older Gen Y/Millennials: 1980-1989 29 to 38
Gen Xers: 1965-1979 39 to 53
Younger Boomers: 1955-1964 54 to 63
Older Boomers: 1946-1954 64 to 72
Silent Generation: 1925-1945 73 to 93