Embed Size (px)
Citation preview
National and Subnational REDD+ in Brazil: challenges and recomendations
Mariano C. Cenamo Senior Researcher and Deputy Executive Director
E-mail: [email protected]
Workshop on Linking Local REDD+ Projects to
National REDD+ Strategies in Africa
April 29 – May 1, 2013, Hawassa, Ethiopia
Outline
• General context of REDD+ in Brazil
• A nested approach proposal for the Amazon
• The Amazonas State REDD+ Program
• Lessons learned and recommendations
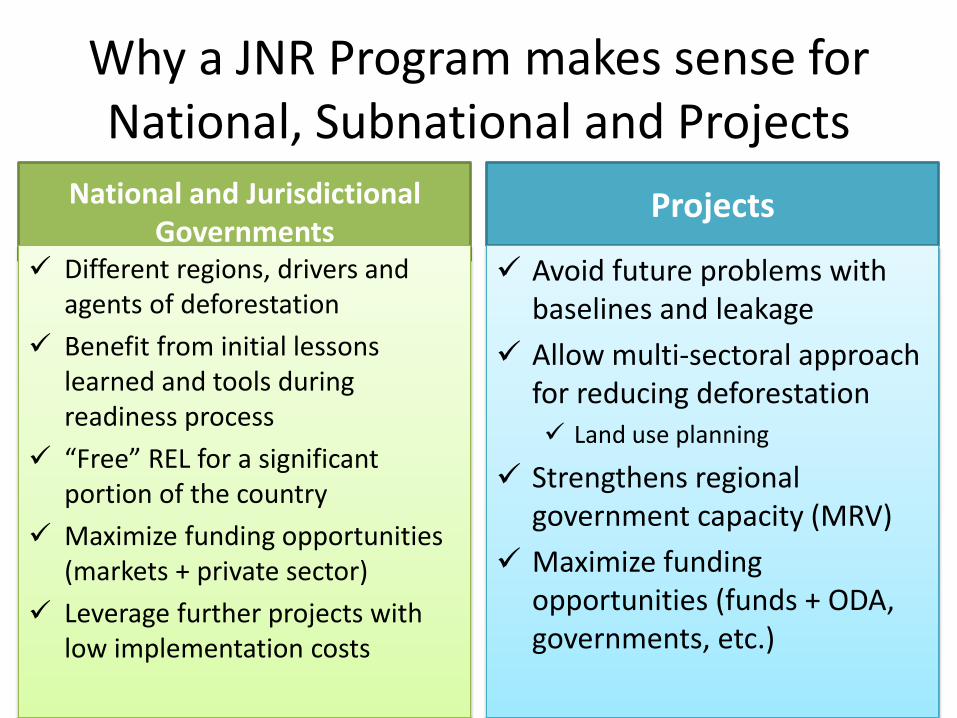
Why a JNR Program makes sense for National, Subnational and Projects
National and Jurisdictional Governments
Different regions, drivers and agents of deforestation
Benefit from initial lessons learned and tools during readiness process
“Free” REL for a significant portion of the country
Maximize funding opportunities (markets + private sector)
Leverage further projects with low implementation costs
Projects
Avoid future problems with baselines and leakage
Allow multi-sectoral approach for reducing deforestation Land use planning
Strengthens regional government capacity (MRV)
Maximize funding opportunities (funds + ODA, governments, etc.)
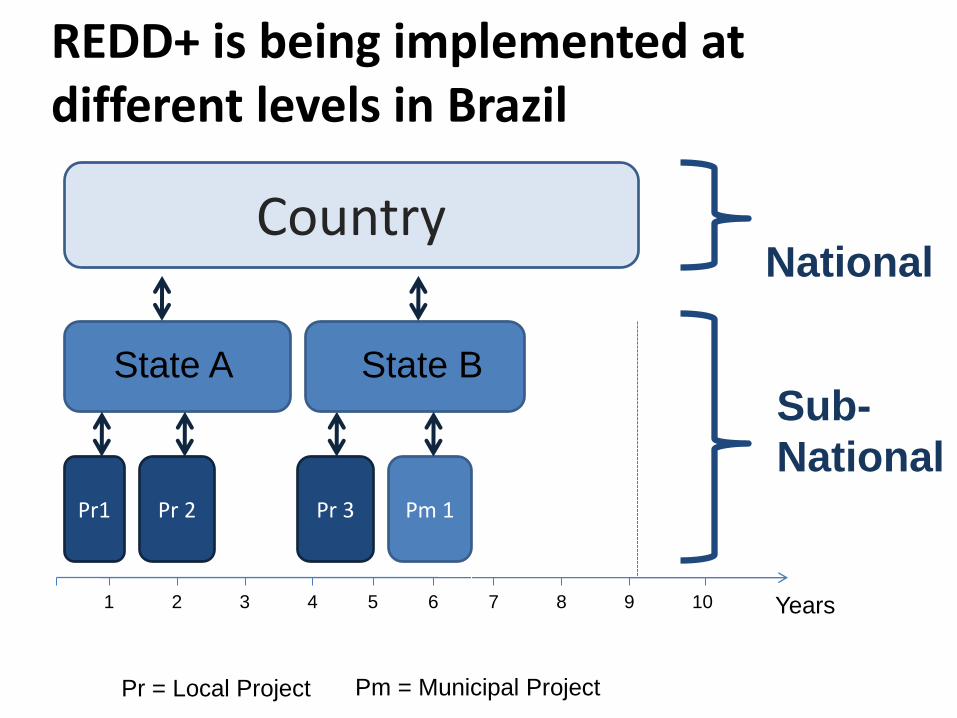
REDD+ is being implemented at different levels in Brazil
Pr1 Pr 2 Pr 3
State A
Pr = Local Project Pm = Municipal Project
Years 1 2 3 4 5 6 7 8 9 10
Country National
Sub-
National
State B
Pm 1
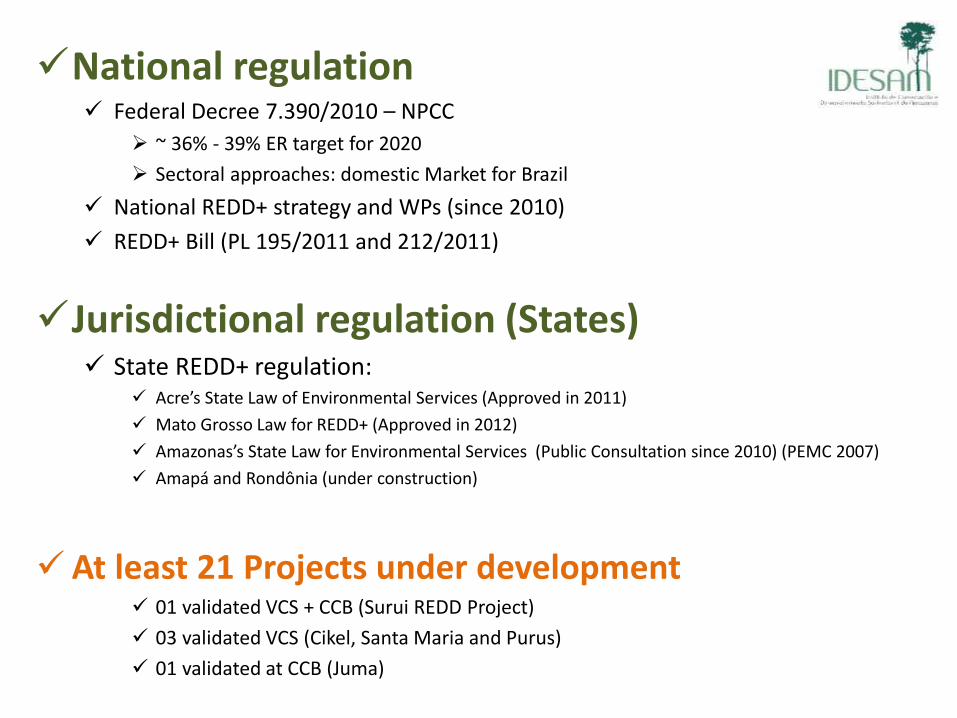
National regulation Federal Decree 7.390/2010 – NPCC
~ 36% - 39% ER target for 2020
Sectoral approaches: domestic Market for Brazil
National REDD+ strategy and WPs (since 2010)
REDD+ Bill (PL 195/2011 and 212/2011)
Jurisdictional regulation (States) State REDD+ regulation:
Acre’s State Law of Environmental Services (Approved in 2011)
Mato Grosso Law for REDD+ (Approved in 2012)
Amazonas’s State Law for Environmental Services (Public Consultation since 2010) (PEMC 2007)
Amapá and Rondônia (under construction)
At least 21 Projects under development 01 validated VCS + CCB (Surui REDD Project)
03 validated VCS (Cikel, Santa Maria and Purus)
01 validated at CCB (Juma)
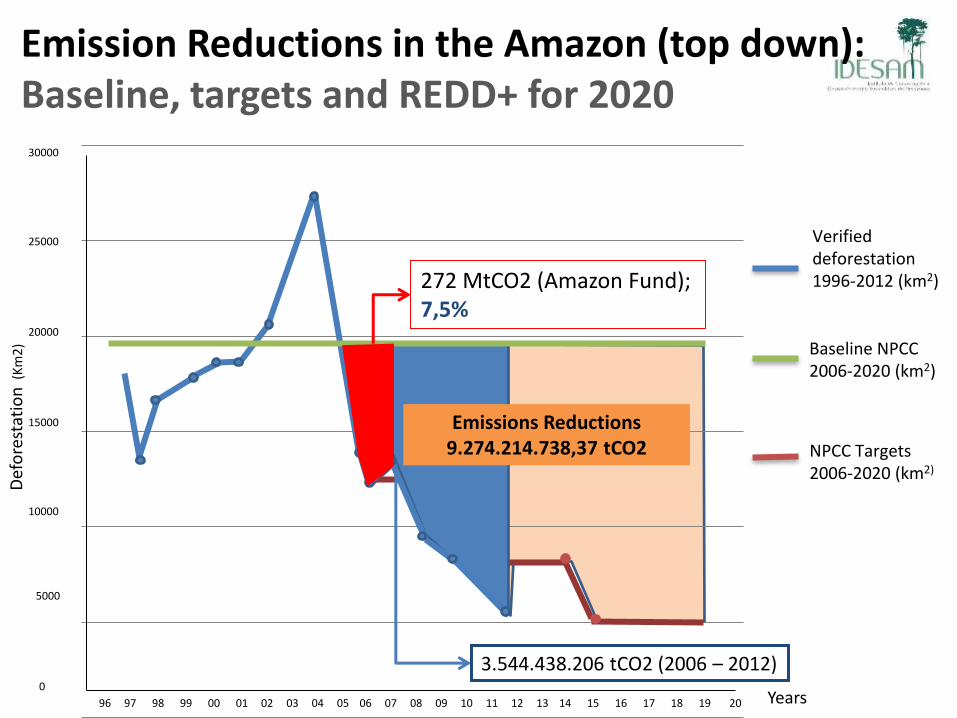
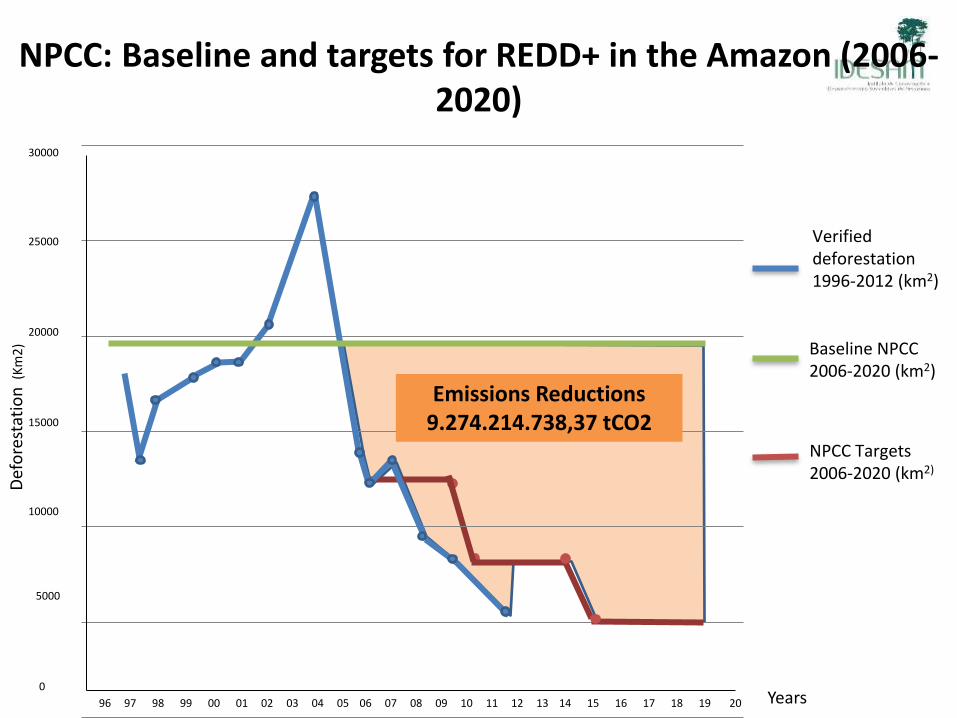
Verified deforestation 1996-2012 (km2)
Baseline NPCC 2006-2020 (km2)
NPCC Targets 2006-2020 (km2)
96 97 98 99 00 01 02 03 04 05 06 07 08 09 10 11 12 13 14 15 16 17 18 19 20
5000
10000
15000
20000
25000
0
30000
Emission Reductions in the Amazon (top down): Baseline, targets and REDD+ for 2020
Years
Def
ore
stat
ion
(K
m2
)
3.544.438.206 tCO2 (2006 – 2012)
Emissions Reductions 9.274.214.738,37 tCO2
272 MtCO2 (Amazon Fund); 7,5%
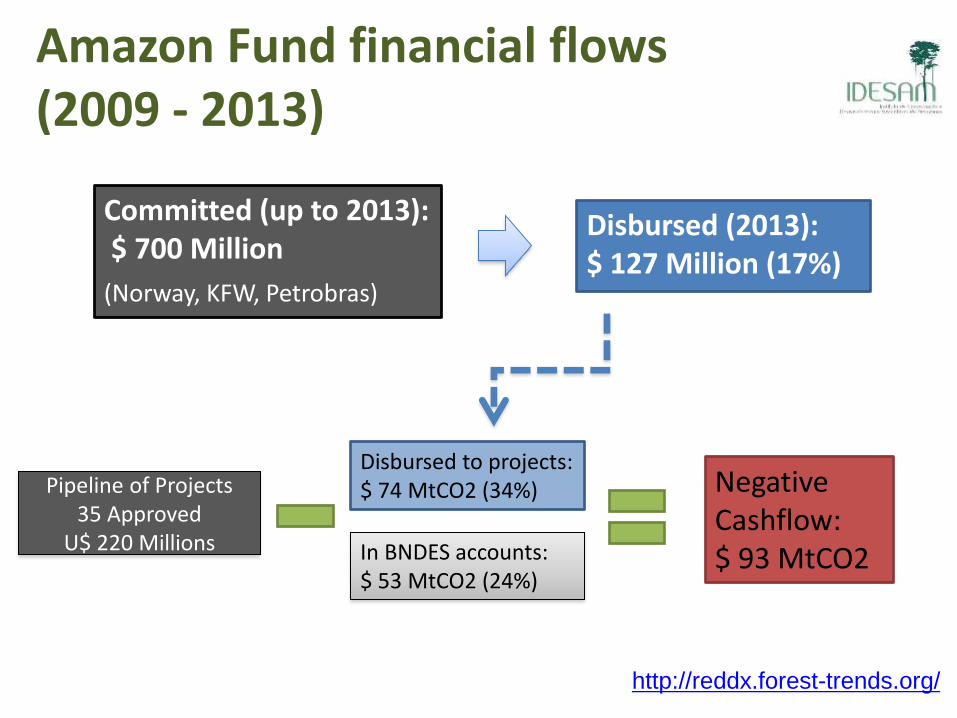
Amazon Fund financial flows (2009 - 2013)
Disbursed (2013): $ 127 Million (17%)
Committed (up to 2013): $ 700 Million
(Norway, KFW, Petrobras)
Pipeline of Projects 35 Approved
U$ 220 Millions In BNDES accounts: $ 53 MtCO2 (24%)
Disbursed to projects: $ 74 MtCO2 (34%) Negative
Cashflow: $ 93 MtCO2
http://reddx.forest-trends.org/
Verified deforestation 1996-2012 (km2)
Baseline NPCC 2006-2020 (km2)
NPCC Targets 2006-2020 (km2)
96 97 98 99 00 01 02 03 04 05 06 07 08 09 10 11 12 13 14 15 16 17 18 19 20
5000
10000
15000
20000
25000
0
30000
NPCC: Baseline and targets for REDD+ in the Amazon (2006-2020)
Years
Def
ore
stat
ion
(K
m2
)
Emissions Reductions 9.274.214.738,37 tCO2
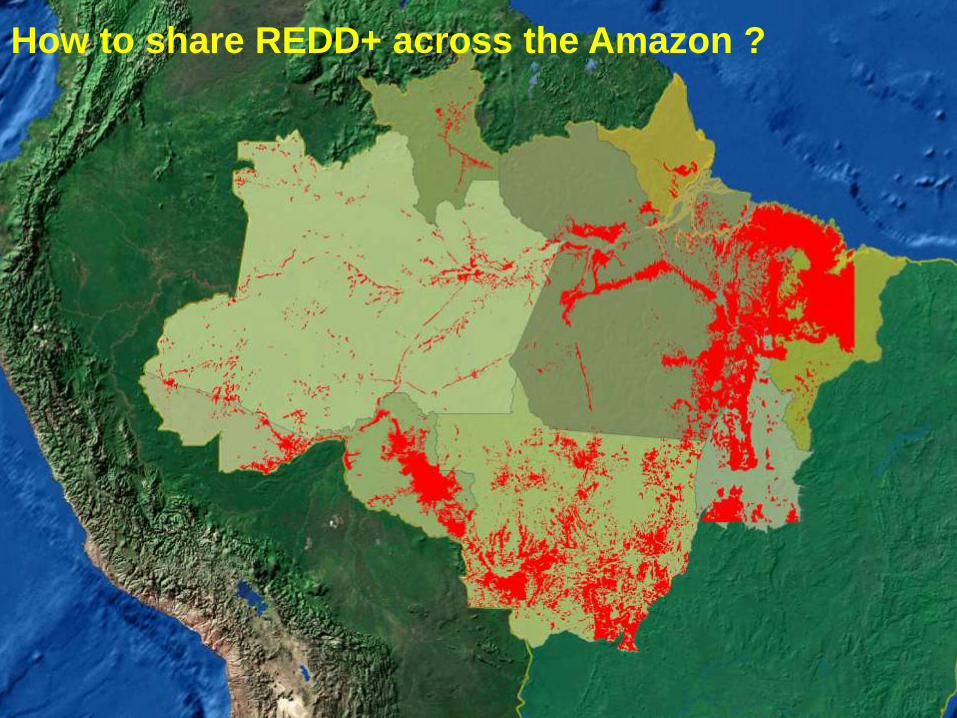
How to share REDD+ across the Amazon ?
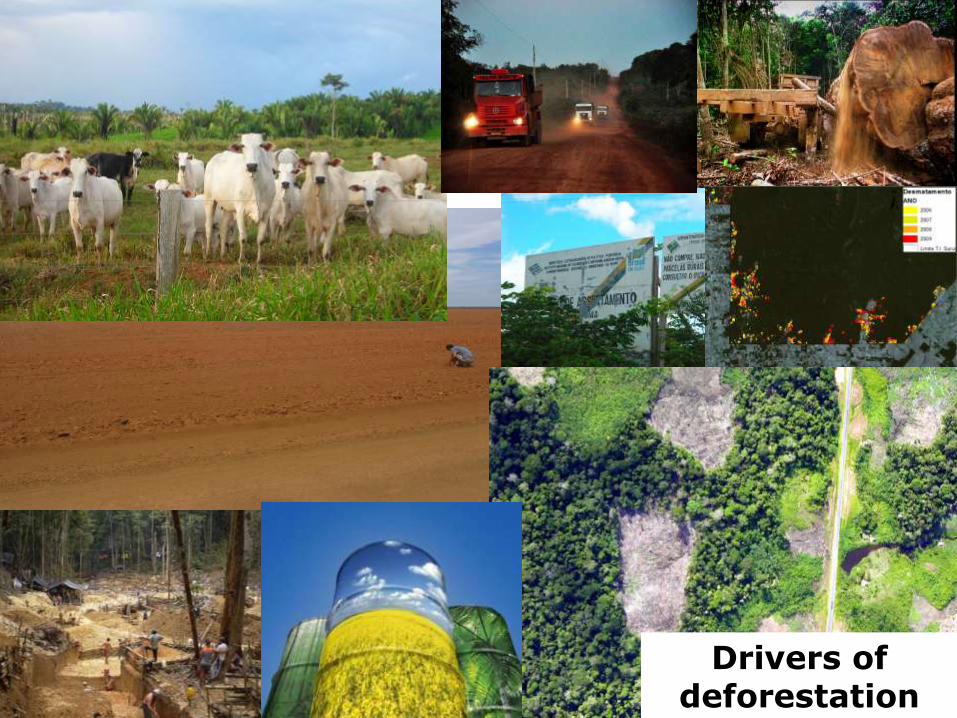
Drivers of deforestation
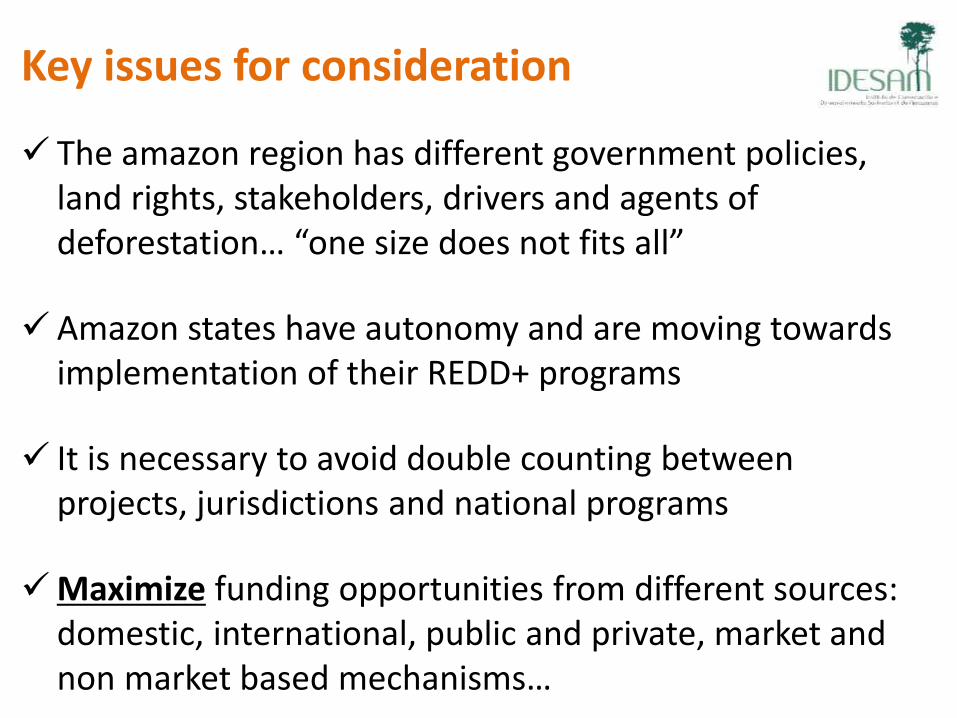
Key issues for consideration
The amazon region has different government policies, land rights, stakeholders, drivers and agents of deforestation… “one size does not fits all”
Amazon states have autonomy and are moving towards implementation of their REDD+ programs
It is necessary to avoid double counting between projects, jurisdictions and national programs
Maximize funding opportunities from different sources: domestic, international, public and private, market and non market based mechanisms…
A Nested Approach for REDD+ in
the Amazon
A proposal from the Brazilian GCF States (Acre, Amazonas, Pará, Mato
Grosso and Tocantins)
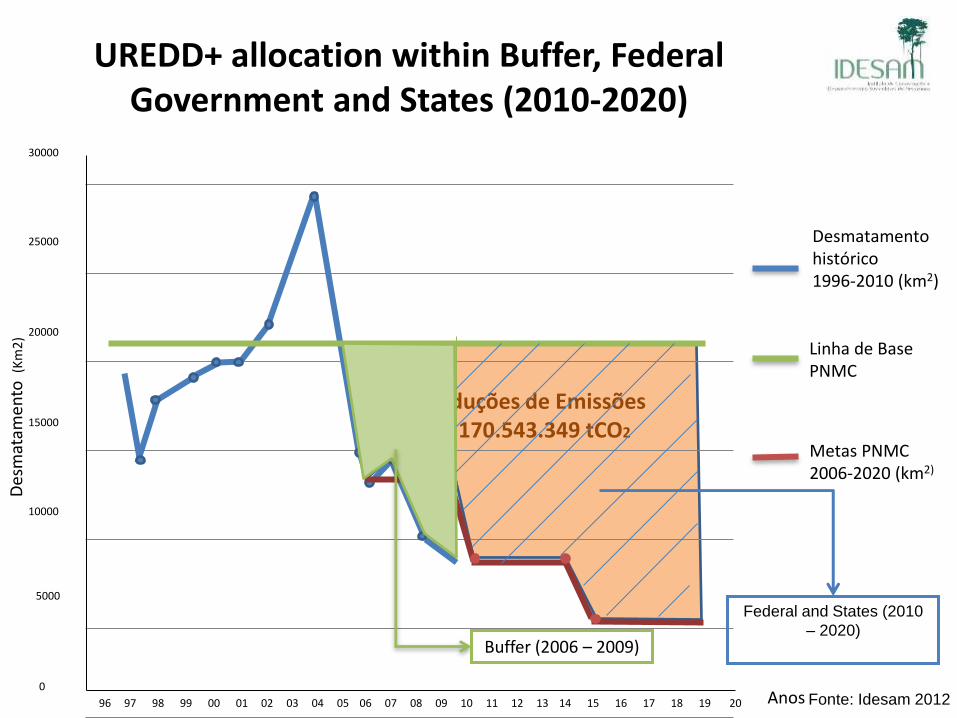
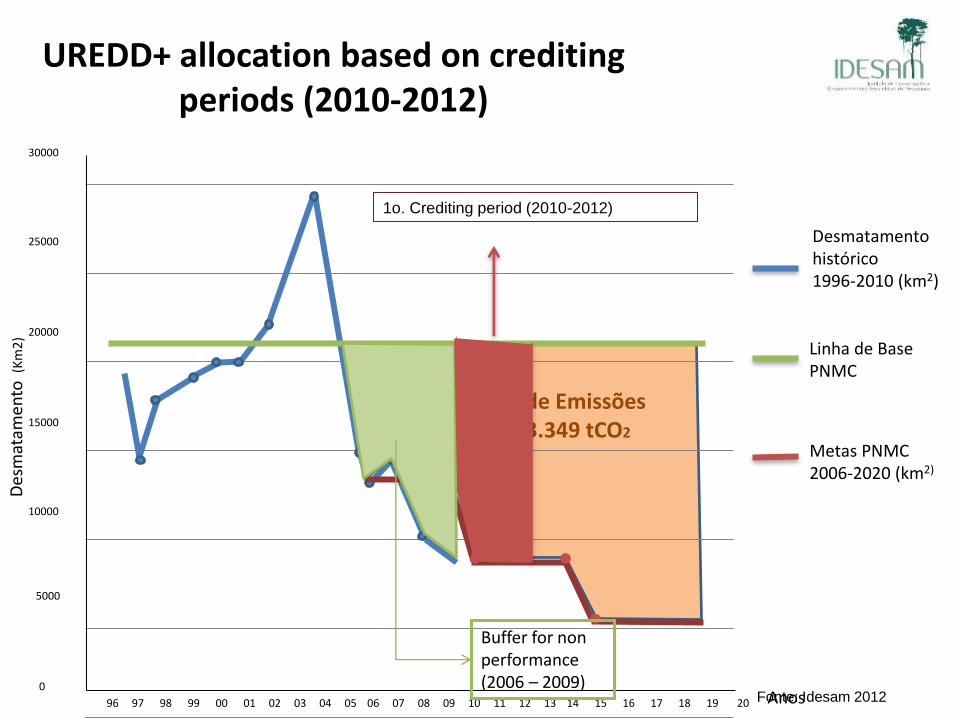
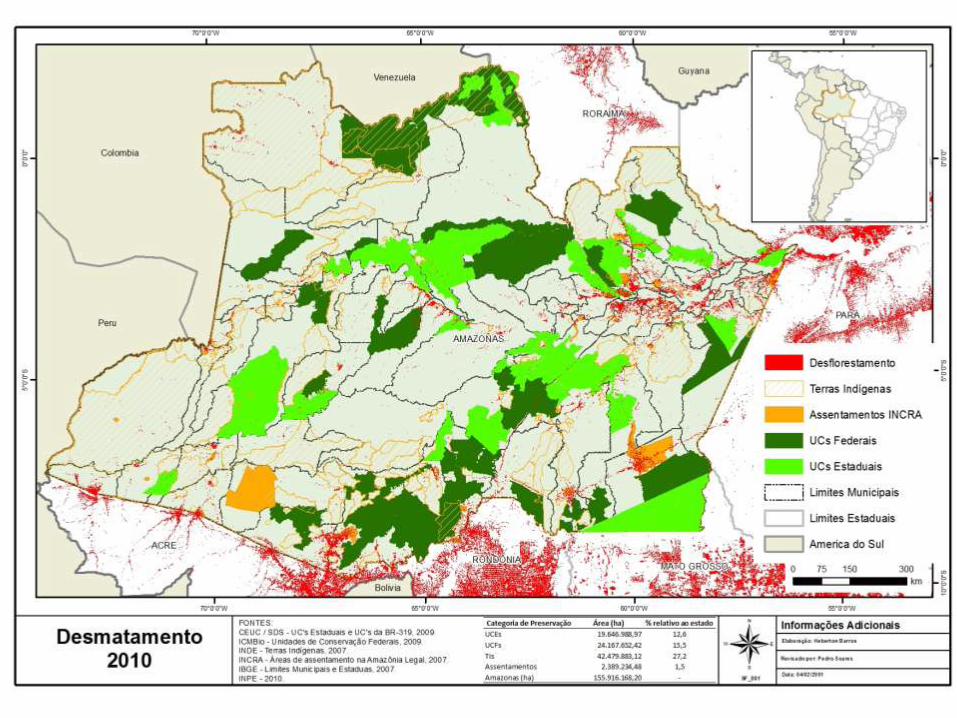
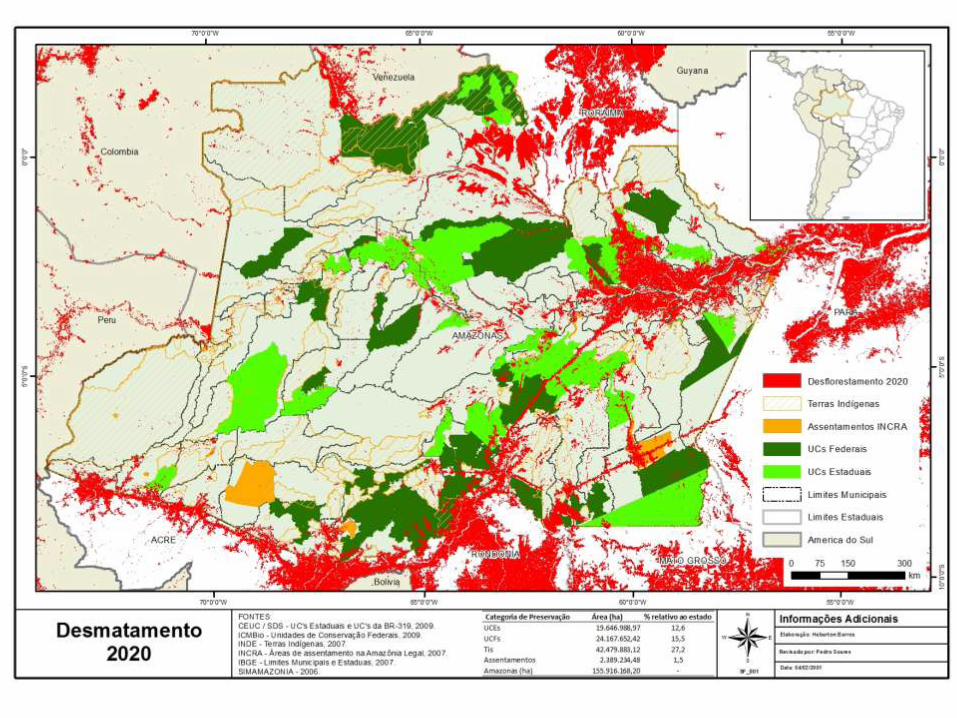
Desmatamento histórico 1996-2010 (km2)
Linha de Base PNMC
Metas PNMC 2006-2020 (km2)
96 97 98 99 00 01 02 03 04 05 06 07 08 09 10 11 12 13 14 15 16 17 18 19 20
Reduções de Emissões 9.170.543.349 tCO2
5000
10000
15000
20000
25000
0
30000
UREDD+ allocation within Buffer, Federal Government and States (2010-2020)
Anos
Des
mat
amen
to (
Km
2)
Buffer (2006 – 2009)
Federal and States (2010
– 2020)
Fonte: Idesam 2012
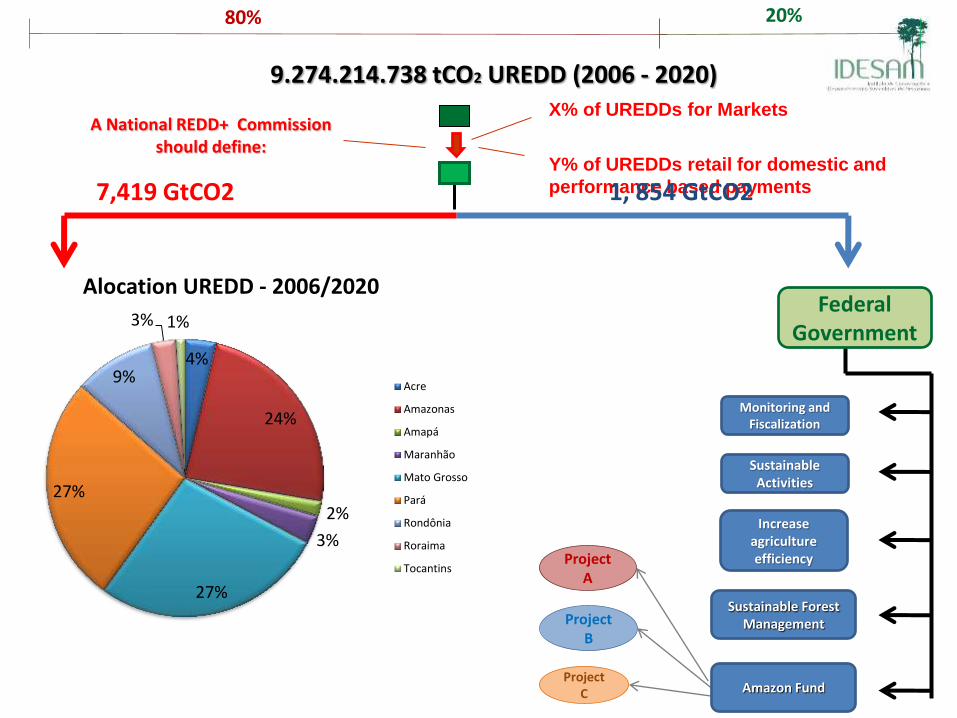
A National REDD+ Commission should define:
ProjectA
Project B
Project C
20% 80%
Monitoring and Fiscalization
Sustainable Activities
Increase agriculture efficiency
Sustainable Forest Management
Federal Government
4%
24%
2%
3%
27%
27%
9%
3% 1%
Alocation UREDD - 2006/2020
Acre
Amazonas
Amapá
Maranhão
Mato Grosso
Pará
Rondônia
Roraima
Tocantins
X% of UREDDs for Markets
Y% of UREDDs retail for domestic and
performance based payments
Amazon Fund
1, 854 GtCO2
9.274.214.738 tCO2 UREDD (2006 - 2020)
7,419 GtCO2
Forest C Stocks
(km2)
Forest C Stocks
(%)
Reduced
Deforestatioin
(km2)
Reduced
Deforestation in
relation to
Reduced
deforestation of
Brazilian Amazon
(%)
CREDD (%)
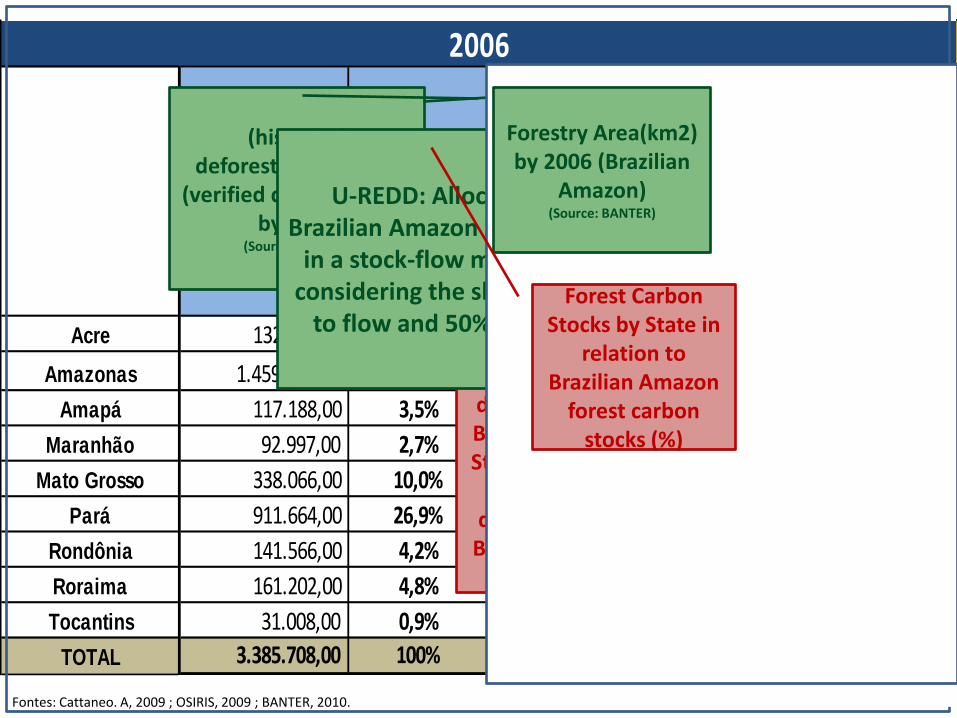
Acre 132.048,00 3,9% 203,52 3,8% 3,8%
Amazonas 1.459.969,00 43,1% 81,82 1,5% 22,3%
Amapá 117.188,00 3,5% - 7,29 -0,1% 1,7%
Maranhão 92.997,00 2,7% 290,93 5,4% 4,1%
Mato Grosso 338.066,00 10,0% 3.324,13 61,9% 36,0%
Pará 911.664,00 26,9% 656,81 12,2% 19,6%
Rondônia 141.566,00 4,2% 726,32 13,5% 8,9%
Roraima 161.202,00 4,8% 9,64 0,2% 2,5%
Tocantins 31.008,00 0,9% 82,56 1,5% 1,2%
TOTAL 3.385.708,00 100% 5.368,44 100% 100%
2006
(historical deforestation rate) –
(verified deforestation) by 2006
(Source: PRODES)
UREDD
Reduced deforestation by Brazilian Amazon States, in relation
to reduced deforestation of
Brazilian Amazon (%)
U-REDD: Allocation by Brazilian Amazon State, based
in a stock-flow mechanism, considering the share of 50%
to flow and 50% to stocks
Fontes: Cattaneo. A, 2009 ; OSIRIS, 2009 ; BANTER, 2010.
Forestry Area(km2) by 2006 (Brazilian
Amazon) (Source: BANTER)
Forest Carbon Stocks by State in
relation to Brazilian Amazon
forest carbon stocks (%)
Desmatamento histórico 1996-2010 (km2)
Linha de Base PNMC
Metas PNMC 2006-2020 (km2)
Fonte: Idesam 2012 96 97 98 99 00 01 02 03 04 05 06 07 08 09 10 11 12 13 14 15 16 17 18 19 20
Reduções de Emissões 9.170.543.349 tCO2
5000
10000
15000
20000
25000
0
30000
Anos
Des
mat
amen
to (
Km
2)
Buffer for non performance (2006 – 2009)
1o. Crediting period (2010-2012)
UREDD+ allocation based on crediting periods (2010-2012)
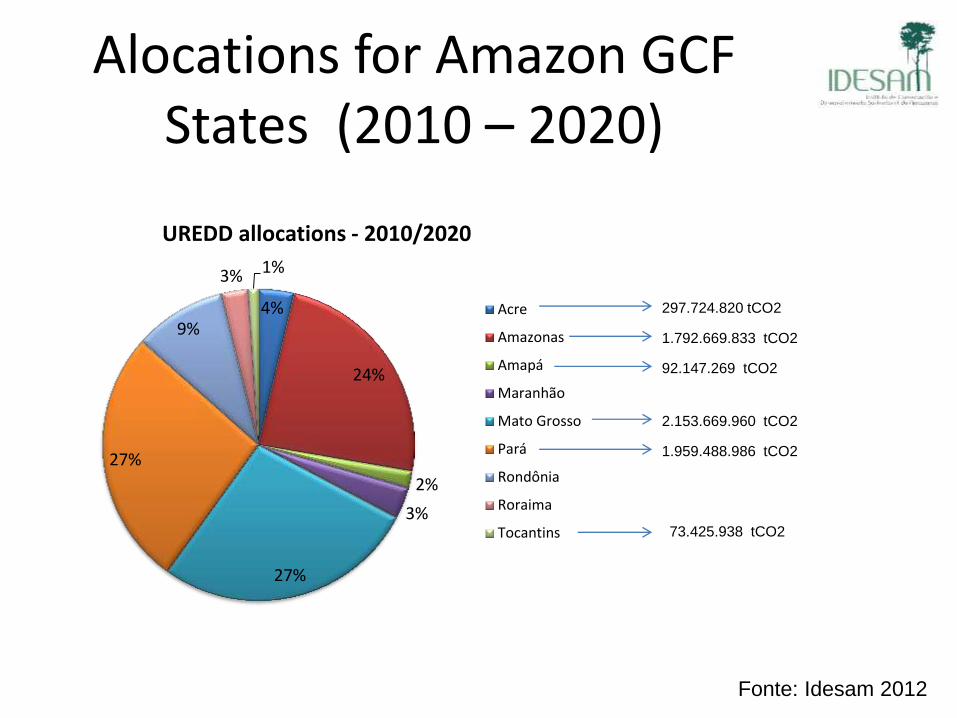
Alocations for Amazon GCF States (2010 – 2020)
4%
24%
2%
3%
27%
27%
9%
3% 1%
UREDD allocations - 2010/2020
Acre
Amazonas
Amapá
Maranhão
Mato Grosso
Pará
Rondônia
Roraima
Tocantins
297.724.820 tCO2
1.792.669.833 tCO2
92.147.269 tCO2
2.153.669.960 tCO2
1.959.488.986 tCO2
73.425.938 tCO2
Fonte: Idesam 2012
The State of Amazonas Environmental Services and REDD+ Proposal
The Amazonas State REDD+ System: a nested approach proposal for the Amazon
Apoio financeiro:
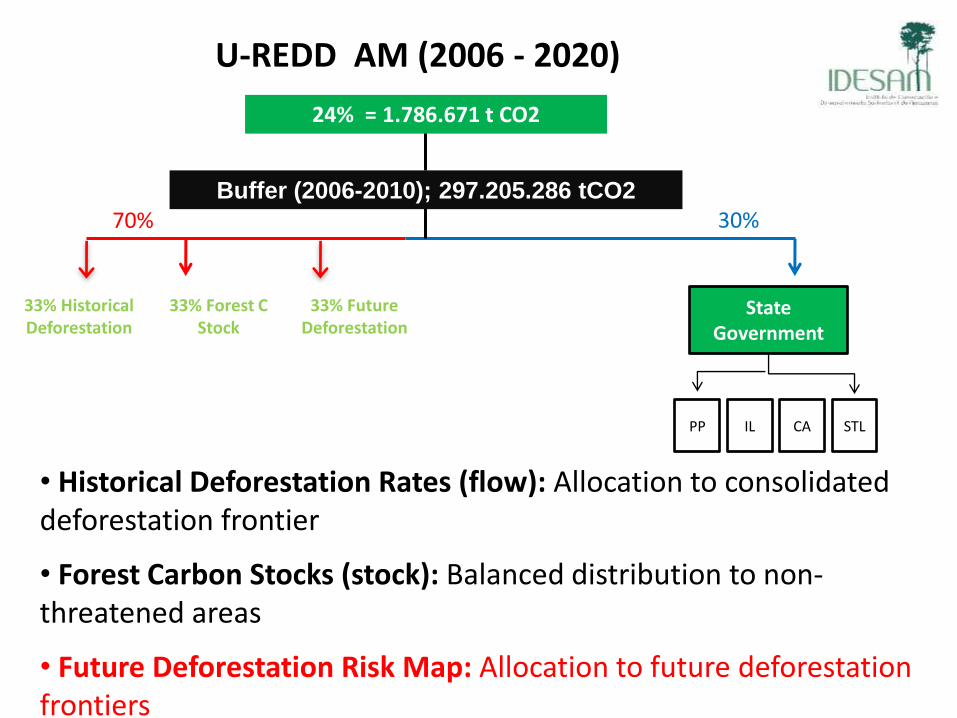
U-REDD AM (2006 - 2020)
• Historical Deforestation Rates (flow): Allocation to consolidated deforestation frontier
• Forest Carbon Stocks (stock): Balanced distribution to non-threatened areas
• Future Deforestation Risk Map: Allocation to future deforestation frontiers
State Government
PP CA IL STL
30%
24%
24% = 1.786.671 t CO2
33% Historical Deforestation
33% Forest C Stock
33% Future Deforestation
70% Buffer (2006-2010); 297.205.286 tCO2
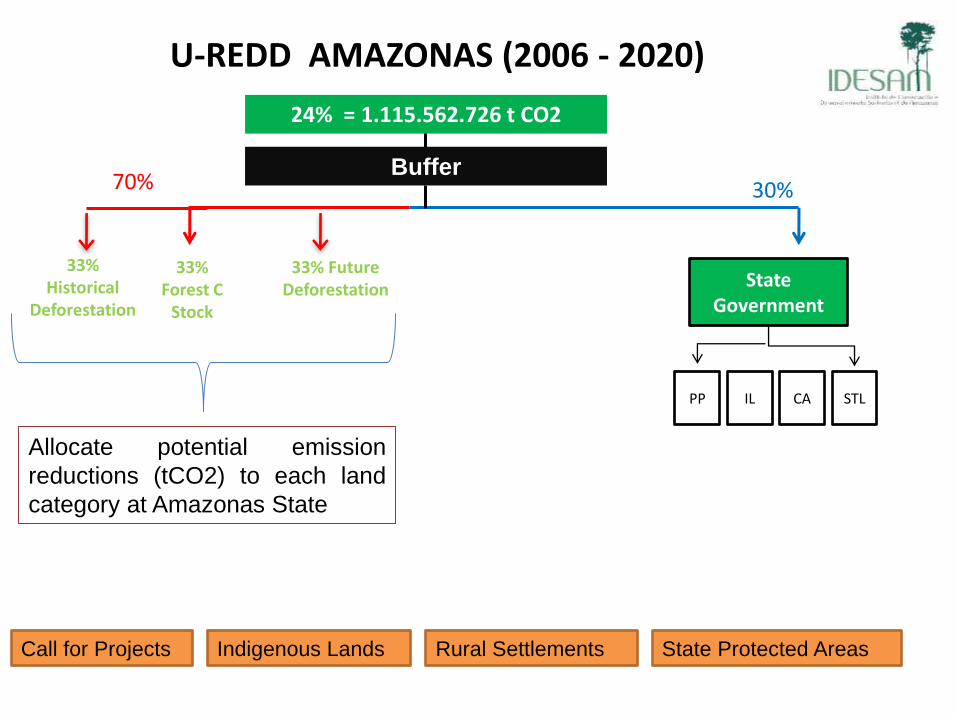
U-REDD AMAZONAS (2006 - 2020)
State Government
PP CA IL STL
30%
24% = 1.115.562.726 t CO2
33% Historical
Deforestation
33% Forest C
Stock
33% Future Deforestation
70% Buffer
Allocate potential emission
reductions (tCO2) to each land
category at Amazonas State
Call for Projects Indigenous Lands Rural Settlements State Protected Areas
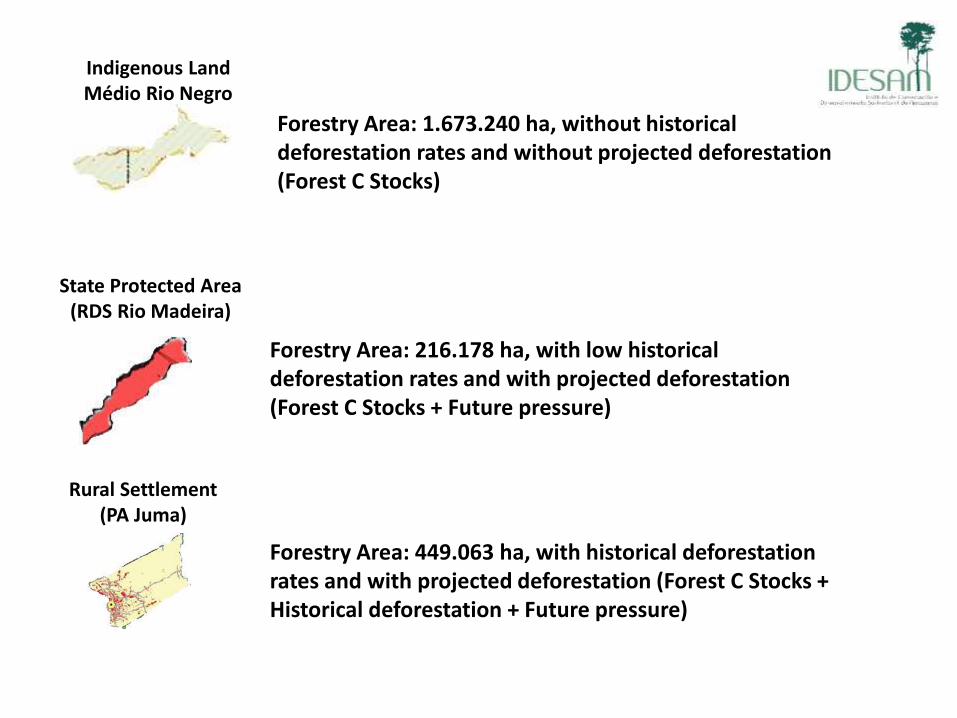
State Protected Area (RDS Rio Madeira)
Forestry Area: 216.178 ha, with low historical deforestation rates and with projected deforestation (Forest C Stocks + Future pressure)
Rural Settlement (PA Juma)
Forestry Area: 449.063 ha, with historical deforestation rates and with projected deforestation (Forest C Stocks + Historical deforestation + Future pressure)
Indigenous Land Médio Rio Negro
Forestry Area: 1.673.240 ha, without historical deforestation rates and without projected deforestation (Forest C Stocks)
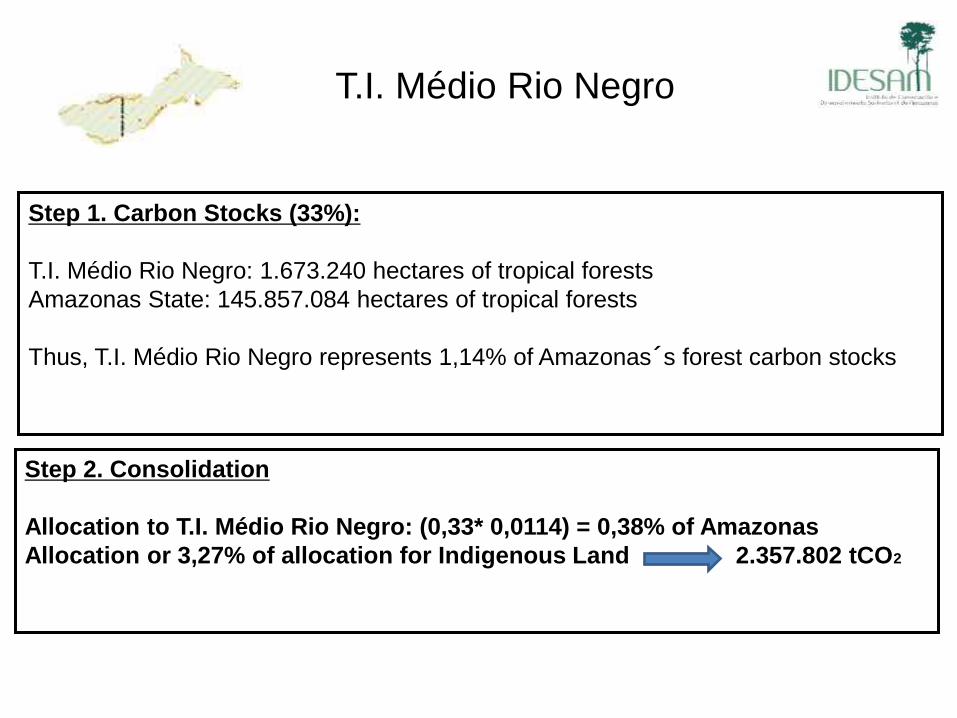
T.I. Médio Rio Negro
Step 1. Carbon Stocks (33%):
T.I. Médio Rio Negro: 1.673.240 hectares of tropical forests
Amazonas State: 145.857.084 hectares of tropical forests
Thus, T.I. Médio Rio Negro represents 1,14% of Amazonas´s forest carbon stocks
Step 2. Consolidation
Allocation to T.I. Médio Rio Negro: (0,33* 0,0114) = 0,38% of Amazonas
Allocation or 3,27% of allocation for Indigenous Land 2.357.802 tCO2
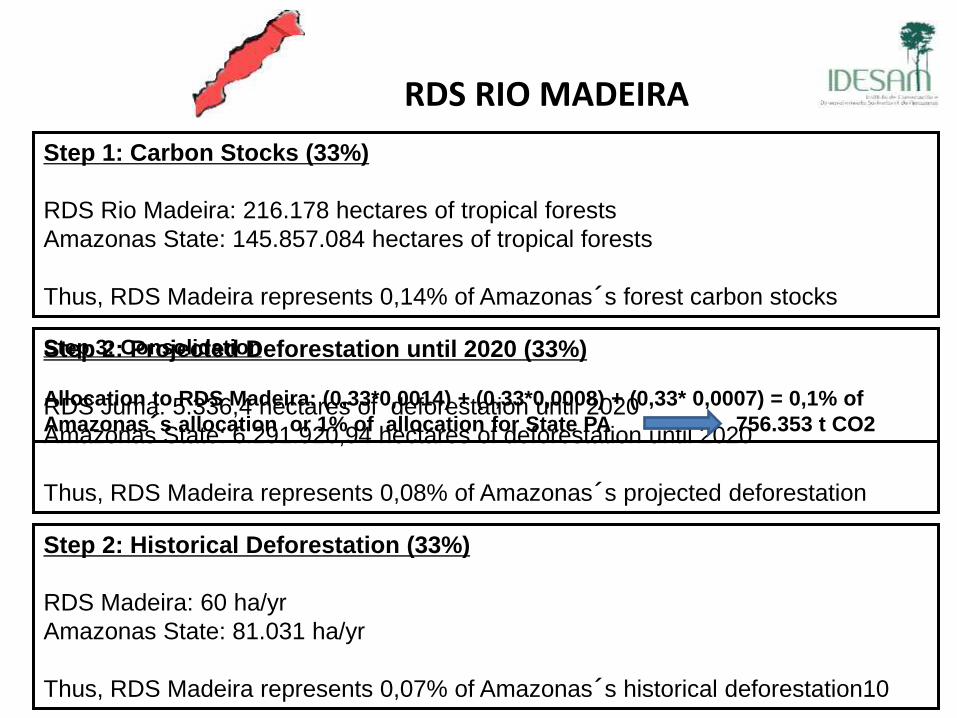
RDS RIO MADEIRA
Step 1: Carbon Stocks (33%)
RDS Rio Madeira: 216.178 hectares of tropical forests
Amazonas State: 145.857.084 hectares of tropical forests
Thus, RDS Madeira represents 0,14% of Amazonas´s forest carbon stocks
Step 2: Projected Deforestation until 2020 (33%)
RDS Juma: 5.336,4 hectares of deforestation until 2020
Amazonas State: 6.291.920,94 hectares of deforestation until 2020
Thus, RDS Madeira represents 0,08% of Amazonas´s projected deforestation
Step 3: Consolidation
Allocation to RDS Madeira: (0,33*0,0014) + (0,33*0,0008) + (0,33* 0,0007) = 0,1% of
Amazonas´s allocation or 1% of allocation for State PA 756.353 t CO2
Step 2: Historical Deforestation (33%)
RDS Madeira: 60 ha/yr
Amazonas State: 81.031 ha/yr
Thus, RDS Madeira represents 0,07% of Amazonas´s historical deforestation10
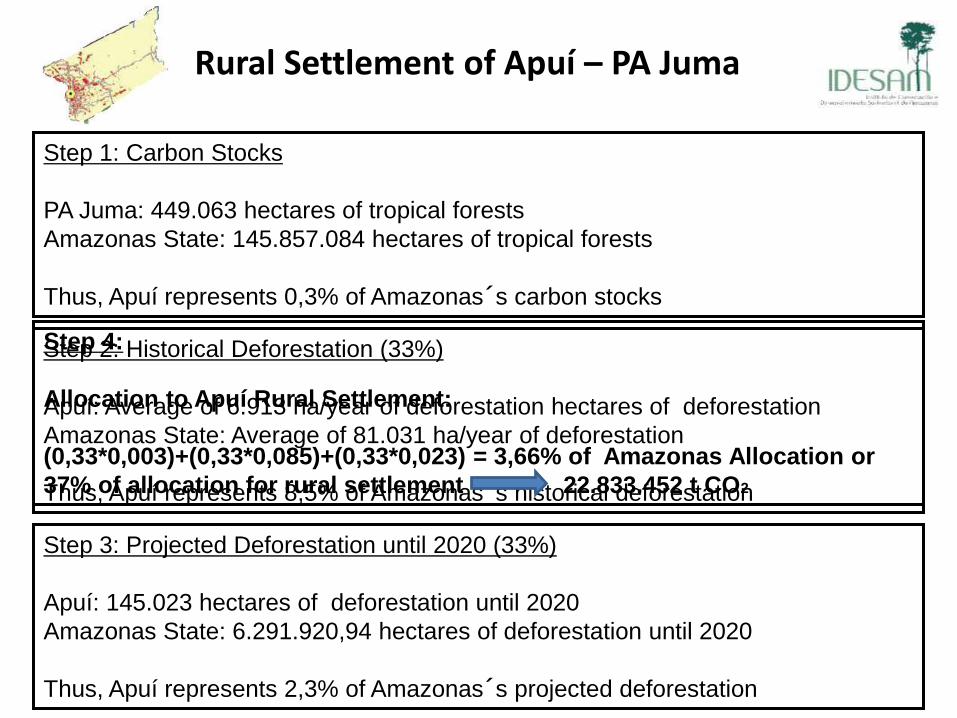
Step 1: Carbon Stocks
PA Juma: 449.063 hectares of tropical forests
Amazonas State: 145.857.084 hectares of tropical forests
Thus, Apuí represents 0,3% of Amazonas´s carbon stocks
Rural Settlement of Apuí – PA Juma
Step 3: Projected Deforestation until 2020 (33%)
Apuí: 145.023 hectares of deforestation until 2020
Amazonas State: 6.291.920,94 hectares of deforestation until 2020
Thus, Apuí represents 2,3% of Amazonas´s projected deforestation
Step 2: Historical Deforestation (33%)
Apuí: Average of 6.913 ha/year of deforestation hectares of deforestation
Amazonas State: Average of 81.031 ha/year of deforestation
Thus, Apuí represents 8,5% of Amazonas´s historical deforestation
Step 4:
Allocation to Apuí Rural Settlement:
(0,33*0,003)+(0,33*0,085)+(0,33*0,023) = 3,66% of Amazonas Allocation or
37% of allocation for rural settlement 22.833.452 t CO2
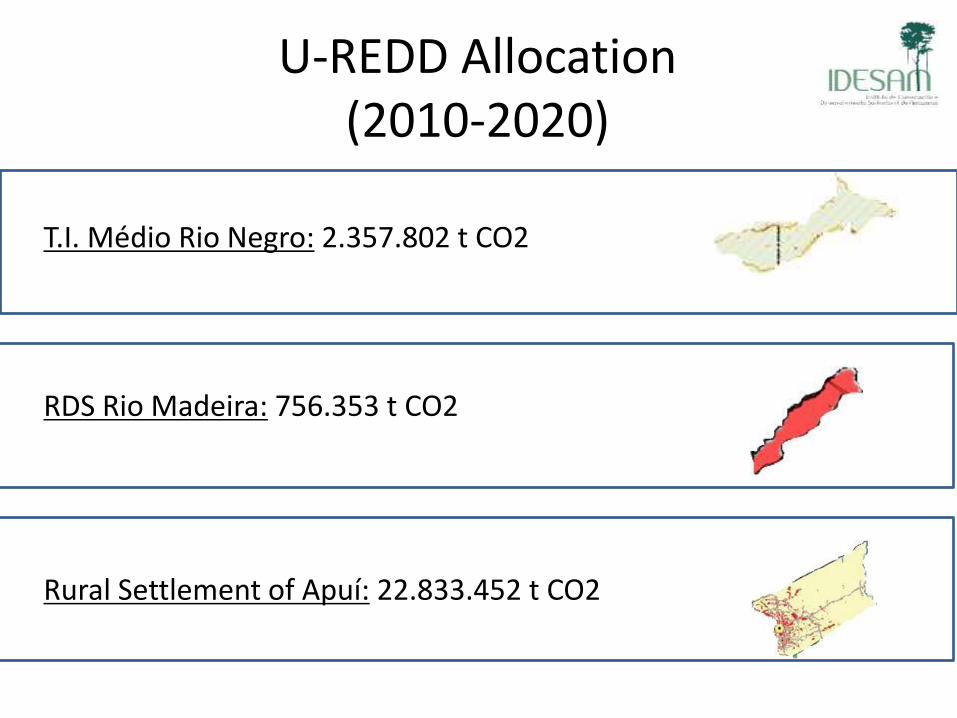
U-REDD Allocation (2010-2020)
T.I. Médio Rio Negro: 2.357.802 t CO2
RDS Rio Madeira: 756.353 t CO2
Rural Settlement of Apuí: 22.833.452 t CO2
Buffer
Amazonas
State
Government
Municipal
Governments
Amazon States
80%
Federal
Government
20%
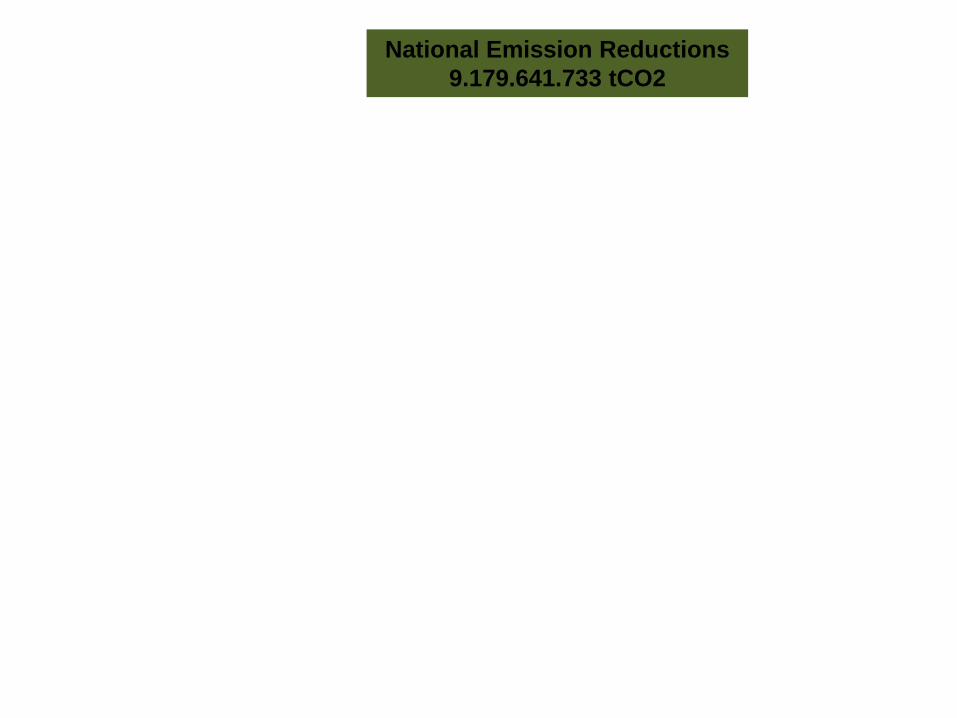
National Emission Reductions
9.179.641.733 tCO2
Amazonas State
24% Other States
76%
State Protected Areas
Rural Settlements
Indigenous Lands
Public Notices
(other land use
categories)
Questions and lessons learned
Preliminary baselines + targets are an important step for early moving, but should be flexible for future changes
Subnational is important to channel funds for readiness and jurisdictional programatic activities Should be efficient, transparent and multi-stakeholder
Amazon, SISA Company, FAS
Target: reducing deforestation and improving livelihoods What is the best implementation arrangement?
Importance of learning lessons with pilots

Amesegenalew!