Embed Size (px)
Citation preview

National and Regional Economic Impacts of Engineering Research Centers: A Pilot Study
Summary Report
October 2008
SRI Project P16906
Submitted to the Engineering Education and Centers Division, National Science Foundation, under Govt. Prime Contract No. GS10F0554N/SIN 874-1, Contract No. D050513

Acknowledgements Many thoughtful and busy people have contributed to this study, and we wish to thank all of them and acknowledge their contributions. Foremost among them are our NSF colleagues and clients, Lynn Preston and Linda Parker, whose foresight led to the initiation of the project, and whose flexibility, understanding, and unflagging support in the face of unexpected difficulties are greatly appreciated. Second, we acknowledge with deep gratitude the cooperation, openness, hospitality, and substantial assistance we have received from the many ERC faculty and staff whom we contacted and worked with to develop the data for the study. It has been a pleasure to meet such dedicated, accomplished, and delightful people, from whom we have learned much . Third, we wish to thank the many people in industry and academia we interviewed for the study. Their candor, willingness to talk with us, and commitment of their valuable time to help us are very much appreciated. Finally, thanks to the talented SRI staff who contributed their time, expertise, and understanding to this long and complex project: Quindi Franco, Sushanta Mohapatra, Jennifer Ozawa, Lynne Manrique, Jongwon Park, Kamau Bobb, Robin Auger, and Erika Sellers. David Roessner Principal Investigator
Disclaimer
Any opinions, findings, and conclusions expressed in this report are those of the project team and do not necessarily express those of the National Science Foundation.
3
SUMMARY REPORT
Table of Contents
I. INTRODUCTION AND BACKGROUND ............................................................................ 4
Original Objective of Pilot Study ............................................................................................................. 5
Initial Plan for the Pilot Study .................................................................................................................. 5
Initial Framework for Analyzing the Economic Impact of ERCs .............................................................. 6
II. INITIAL DATA COLLECTION EFFORTS AND SUBSEQUENT REVISION OF STUDY DESIGN ................................................................................................................................ 7
Changes in Study Conceptual Structure and Data Collection Emphasis Resulting from Case Study Experiences ............................................................................................................................................ 9
III. RESULTS FROM SITE VISITS AND INTERVIEWS ...................................................... 10
Caltech’s Center for Neuromorphic Systems Engineering ................................................................... 10
Regional Economic Impacts of the CNSE ............................................................................................ 12 National Economic Impact of the CNSE...................................................................................... 12 Other Impacts of the CNSE ......................................................................................................... 14 Conclusions and Observations .................................................................................................... 15
Virginia Tech’s Center for Power Electronics Systems ......................................................................... 15 Regional Economic Impact of CPES ........................................................................................... 16 National Economic Impact of CPES ............................................................................................ 17 Other Impacts of CPES ............................................................................................................... 18 Conclusions and Observations .................................................................................................... 19
University of Michigan’s Center for Wireless Integrated Microsystems ................................................ 20 Regional Economic Impact of WIMS ........................................................................................... 20 National Economic Impacts of WIMS .......................................................................................... 21 Other Impacts of WIMS ............................................................................................................... 22 Conclusions and Observations .................................................................................................... 23
Johns Hopkins Center for Computer-Integrated Surgical Systems and Technology (CISST) ............. 24 Regional econo ............................................................................................................................ 24 mic impact of CISST .................................................................................................................... 24 National impact of CISST ............................................................................................................ 25 Conclusions and observations ............................................................................................ 25
Georgia Tech/Emory Center for the Engineering of Living Tissue ....................................................... 27 Economic impact of GTEC on Georgia ....................................................................................... 27 National economic impacts of GTEC .......................................................................................... 28 Conclusions and observations .................................................................................................... 29
IV. SUMMARY AND IMPLICATIONS ................................................................................. 31
Quantifiable Regional and National Economic Impacts of ERCs ......................................................... 31
Other Economically Significant Impacts of ERCs ................................................................................. 35
Lessons Learned: Identifying and Measuring the Economic Impacts of ERCs .................................... 37
Implications for Economic Impact Studies Generally ............................................................................ 38

4
I. INTRODUCTION AND BACKGROUND
The NSF’s Engineering Research Centers (ERC) Program was initiated in
1985 as a government-university-industry partnership with advancing U.S.
industrial competitiveness as one of its objectives. In a limited effort to
exemplify one aspect of the program’s merit, in 2004, SRI International
conducted a study of the regional economic impact of the Microsystems
Packaging Research Center at the Georgia Institute of Technology (Georgia
Tech), an NSF Engineering Research Center in its tenth year of NSF support.
The study, supported by the Georgia Research Alliance, was the first and
only quantitative economic impact study of any single ERC or of the ERC
program as a whole. The results of this study, when used to calculate a
―return on investment‖ figure, suggested that Georgia received a 10 to 1
return on its investment through economic impacts at the state level.1 These
results suggested to NSF the potential value of conducting additional impact
studies--not just of the regional economic impact of selected ERCs but of
their national impact as well. Consequently, NSF requested that SRI apply an
appropriately modified version of the approach used for the Georgia Tech
study to cover the national and regional (state) economic impacts for three
other centers in the ERC class of 1994-5. This was to be a pilot study to
explore the feasibility of obtaining economic impact estimates from ERCs that
were at or near their transition from NSF ERC Program support, with the
hope that the results of the study would clearly illustrate the Program’s
economic benefits.
This document summarizes the results obtained following a number of
unexpected changes in the original study, which called for case studies of the
quantifiable regional and national economic impacts of three ERCs. The
major changes were substitution of other ERCs for two of the three originally
selected for study due to data collection problems, revisions to the study’s
data collection strategy and analytic approach, and the additional of two more
cases. The details of the reasons for these changes, the revised study
design, and the complete results are contained in the full final report to NSF’s
Engineering Education and Centers Division.
1 There are numerous qualifications and caveats that apply to a ―return on investment‖ interpretation of the
Georgia study results. Despite these limitations, the Georgia client asked for such an estimate and SRI agreed to calculate the ROI despite our reservations about using results of input-output modeling for this purpose. Generally, such models are designed to estimate the anticipated payoff from targeted investment attraction efforts and traditional economic development projects. In general, ROI is an inappropriate approach for estimating the economic impact of long-term investments in research and education programs.

5
Original Objective of Pilot Study
The original objective of the pilot study was to estimate the quantifiable
national and regional (state) economic impacts of three specific ERCs
following or near the end of their full award period, 1994-95 to 2004-2005.
The three ERCs initially planned for study were the Biotechnology Process
Engineering Center (BPEC) at MIT (second funding award only), the Center
for Neuromorphic Systems Engineering (CNSE) at Caltech, and the Particle
Engineering Center at the University of Florida (PERC). The assessment
was to be retrospective, i.e., document and analyze the already realized
economic impacts of the ERCs’ activities, rather than estimate the potential
future economic impact of ERC activities and outputs to date.
The initial study emphasis was on developing quantitative estimates of
economic impact. Recent SRI studies of the impact of ERCs on industry, as
well as related literature on the economic impact of academic research
activities, indicate that often the value of long-term, less tangible benefits to
firms may exceed the value of more easily quantifiable economic benefits.
However, it has proven difficult and expensive to obtain reliable estimates of
these less tangible benefits, so the initial study design focused on quantifiable
economic impacts, recognizing that by doing so we would almost certainly
underestimate the full economic impacts of ERCs. We sought estimates of
both regional and national economic impacts of each ERC studied.
Initial Plan for the Pilot Study
In developing the plan for the pilot study of both national and regional
economic impacts of the ERCs, NSF and SRI agreed that several criteria
were important in selecting which centers to study:
Selected centers should be in the class of 1994-95 so that the
impacts of the full eleven years of NSF support would be included;
The centers should have no out-of-state partner institutions, which
would complicate data collection and the regional impact analysis;
and
A range of types of centers should be included to reflect a variety
of technical fields, relative start-up activity, and incremental vs.
transformational stage of technology development.
Furthermore, the data collection strategy would follow that used in the
Georgia Tech study, which relied upon the extensive support, activity, and
output data reported annually to NSF and contained in center annual reports;
6
center records; interviews with center staff, especially the Industrial Liaison
Officer and Education Director; interviews with representatives of spin-off
start-up companies; and interviews with companies whose interactions with
the center had resulted in significant, already realized economic impacts (i.e.,
in NSF parlance, a subset of technology transfer ―nuggets‖). The last
category of data would provide the primary basis for the national economic
impact analysis.
The initial plan called for detailed development of the conceptual model for
measuring and analyzing national impacts by late 2005, collection of data
from the three selected ERCs during 2006, and data analysis and reporting
during the first half of 2007. The following section of this summary report
describes modifications to the design and project timeline that reflected our
experience with efforts to collect data from the original three sites.
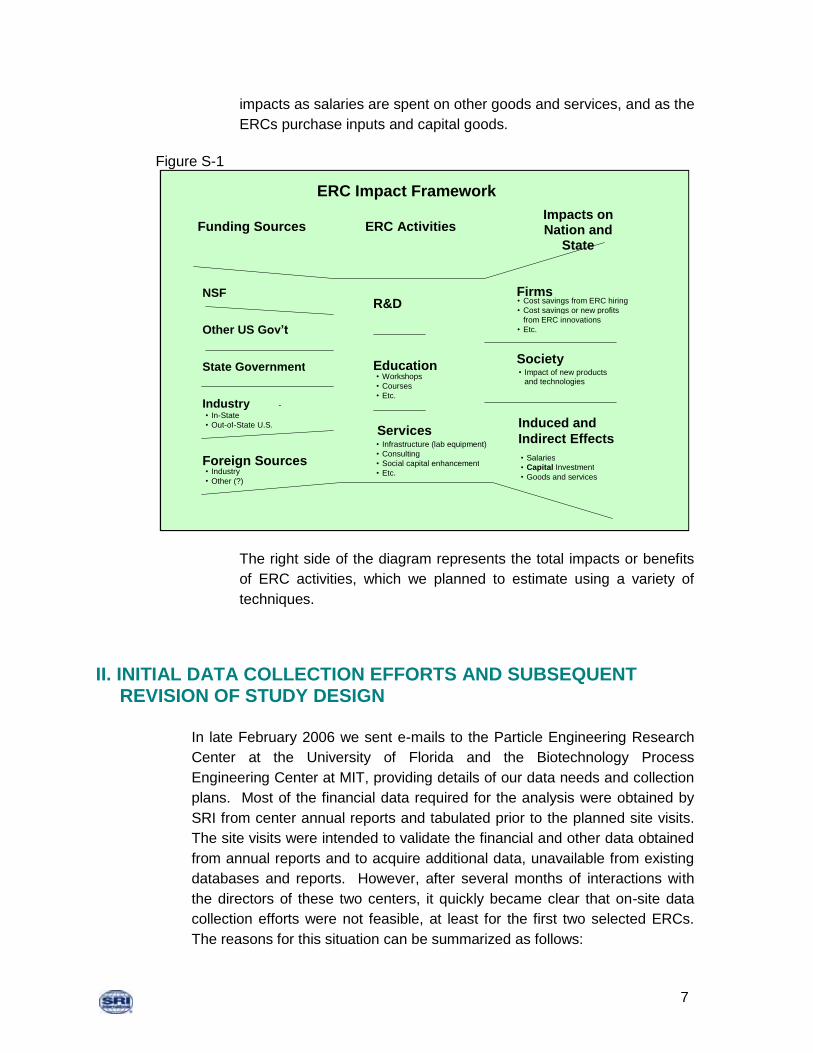
Initial Framework for Analyzing the Economic Impact of ERCs
Figure S-1, below, illustrates the general logic flow of how ERCs use funding
from a variety of sources to carry out their research and development,
educational, and services activities, which ultimately impact the local and
national economies. Benefits experienced by private firms and by society in
general, including the increased spending in the economy that the ERCs
stimulate, include:
Benefits to Industry – Private firms benefit from ERC activities through
the reduced mentoring costs from hiring ERC graduates, having
access to ERC intellectual resources and skills, new production
techniques, etc.
Benefits to Society – ERCs both generate the basis for fundamentally
new products and educate new generations of engineers. These
activities produce benefits that go beyond those accruing to individual
firms, which are captured above.
Induced and Indirect Benefits – ERCs, as international centers of
excellence, attract funding that pays for research, education and
operations (staff salaries, capital investments, etc.) to augment NSF
funds. Spending on activities is not generally considered to be an
impact. However, ERCs often attract resources from outside the
region (state or nation), and these are clearly new resources flowing
into the region that may not have occurred without 0the ERC. The
activities that this out-of-region funding supports themselves have
7
impacts as salaries are spent on other goods and services, and as the
ERCs purchase inputs and capital goods.
Figure S-1
The right side of the diagram represents the total impacts or benefits
of ERC activities, which we planned to estimate using a variety of
techniques.
II. INITIAL DATA COLLECTION EFFORTS AND SUBSEQUENT REVISION OF STUDY DESIGN
In late February 2006 we sent e-mails to the Particle Engineering Research
Center at the University of Florida and the Biotechnology Process
Engineering Center at MIT, providing details of our data needs and collection
plans. Most of the financial data required for the analysis were obtained by
SRI from center annual reports and tabulated prior to the planned site visits.
The site visits were intended to validate the financial and other data obtained
from annual reports and to acquire additional data, unavailable from existing
databases and reports. However, after several months of interactions with
the directors of these two centers, it quickly became clear that on-site data
collection efforts were not feasible, at least for the first two selected ERCs.
The reasons for this situation can be summarized as follows:
Induced and
Indirect Effects
ERC Impact Framework
Impacts on Nation and
State
ERC Activities Funding Sources
NSF
Other US Gov’t
State Government
Industry - • In - State • Out - of - State U.S.
Foreign Sources • Industry • Other (?)
R&D
Services • Infrastructure (lab equipment) • Consulting • Social capital enhancement • Etc.
Education • Workshops • Courses • Etc.
• Salaries • Capital Investment • Goods and services
Society • Impact of new products
and technologies
Firms • Cost savings from ERC hiring • Cost savings or new profits
from ERC innovations • Etc.
8
By the spring of 2006, the centers at both MIT and University of Florida
(UFL) had basically shut down, at least as ERCs; staff familiar with
records had left; and records in many cases were unavailable. Center
Directors and ILOs were very helpful in informing us about difficulties
involved with providing the data we sought (primarily data involving the
geographic location of sources of support for the center—in-state, out-of-
state U.S., and foreign), but going beyond explanation of the difficulties
presented insurmountable barriers.
Discussions with center directors revealed clearly that the planned study’s
emphasis on realized, national economic impacts, even if the necessary
data could be obtained, would vastly underestimate the actual impact of
ERCs, for at least three reasons. First, even in mature and more
incremental centers, there are very few center technologies that have
been commercialized to the extent that significant sales or cost savings
have occurred, either in start-ups or member firms. Second, for most
ERCs, the primary output is new knowledge, often embodied in
graduating students, and there is no feasible way to quantify the
economic impact of either this knowledge or the economic value of the
social capital generated. Third, ERC staff emphasized that it is very
difficult to untangle the role that NSF/ERC activity has played, relative to
other sources of support, in those ideas or technologies that have actually
generated economic impact in industry. Each case is unique and would
require extensive consideration by those intimately acquainted with the
case, and we found that such people often were no longer involved in the
centers and/or were unresponsive to requests for interviews.
A successful site visit to CalTech in September, as well as careful reading
of numerous ERC annual reports, confirmed our expectations that only a
small number—two to three--of high-impact ―nuggets‖ would need to be
identified and studied to obtain a reasonable estimate of the total
economic impact of an ERC. But the CNSE case also revealed how
difficult it is to obtain the necessary information from either start-ups or
member firms to meet the requirements of our simple models for
estimating the economic impact of ERC-based innovations. With few
exceptions, such data were considered proprietary or were simply not
available.
SRI met with NSF/EEC staff in December 2006 to consider options for
continuing the study. This discussion led to mutual agreement to replace the
case studies planned for MIT and UFL with studies of ERCs at Virginia Tech
9
(Center for Power Electronic Systems, or CPES) and the University of
Michigan (Wireless Integrated Microsystems, or WIMS). Both of these
centers were still active (in their 8th and 6th years, respectively, as of 2006),
had strong and close industry ties, and their technical foci were of interest
primarily to relatively well-established industries. The assumption was that
these features would make data collection on-site much easier, and would
increase the likelihood that quantifiable economic impacts on industry would
have been realized and could be estimated reliably.
Changes in Study Conceptual Structure and Data Collection Emphasis Resulting from Case Study Experiences
Experience with data collection efforts in 2006, especially the lessons learned
during the Caltech site visit and industry interviews, led us to reconsider the
relative emphasis placed on collecting data at the regional vs. national levels,
and to expand the range of impacts to be examined. Specifically, as it
became apparent that the great bulk of national economic impacts of ERCs
would be generated via spillovers from the innovating firm to the markets
realizing benefits (e.g., cost savings) from the innovation, we focused greater
attention on the literature on social returns to innovation and the data
requirements for using net social benefit models. And, as the relative value
to industry of ERC of longer term, less tangible center outputs (e.g., new
ideas, new ways of thinking, specially trained graduates) continued to be
stressed by our respondents, increasing the size of the ―net‖ of impacts to be
documented was pursued. Finally, as our initial impressions that a ten-year
time frame was too short for most ERCs to generate considerable amounts of
quantifiable, realized economic impacts on industry continued to be
confirmed, our data collection net grew even more to include center impacts
on research, students and faculty, ERC host institutions, and diversity.
Indeed, it is accurate to say that our impact categories broadened in several
steps as we learned more from each round of case studies: first from CNSE,
next from CPES and WIMS, and finally from the most recent cases added to
the study, the Center for Integrated Surgical Systems and Technology at
Johns Hopkins University (CISST) and the Georgia Tech/Emory Center for
the Engineering of Living Tissue (GTEC).
The two sources that guided our Caltech data collection for the national part
of the impact were Edwin Mansfield's use of consumer surplus calculations,
as described in Ruegg and Feller, A Toolkit for Evaluating Public R&D
Investment, NIST GCR 03-857, pp. 104 ff., and an Australian evaluation
study, Economic Impacts of Cooperative Research Centers in Australia by
the Allen Consulting Group, 2005, pp. 20 ff. Basically, the consumer surplus
approach defines the social benefits of innovation as the sum of the profits to

10
the innovator and the benefits to consumers who purchase it (i.e., spillover
benefits). In the simplest terms, total social benefits (returns to innovation)
equal the sum of profits to the innovating firm plus the cost savings to users.
In its simplest form, the social benefits model can be illustrated as follows
(Figure S-2).
Figure S-2
Private and Social Returns to R&D: Pure Market Spillover
The practical implications for data collection were that we would place greater
emphasis on identifying high-impact ―nuggets‖ of technology transfer to
industry and on collecting data that could be used to estimate the private and
social returns to the innovating firms involved in these high-impact examples.
III. RESULTS FROM SITE VISITS AND INTERVIEWS
Caltech’s Center for Neuromorphic Systems Engineering
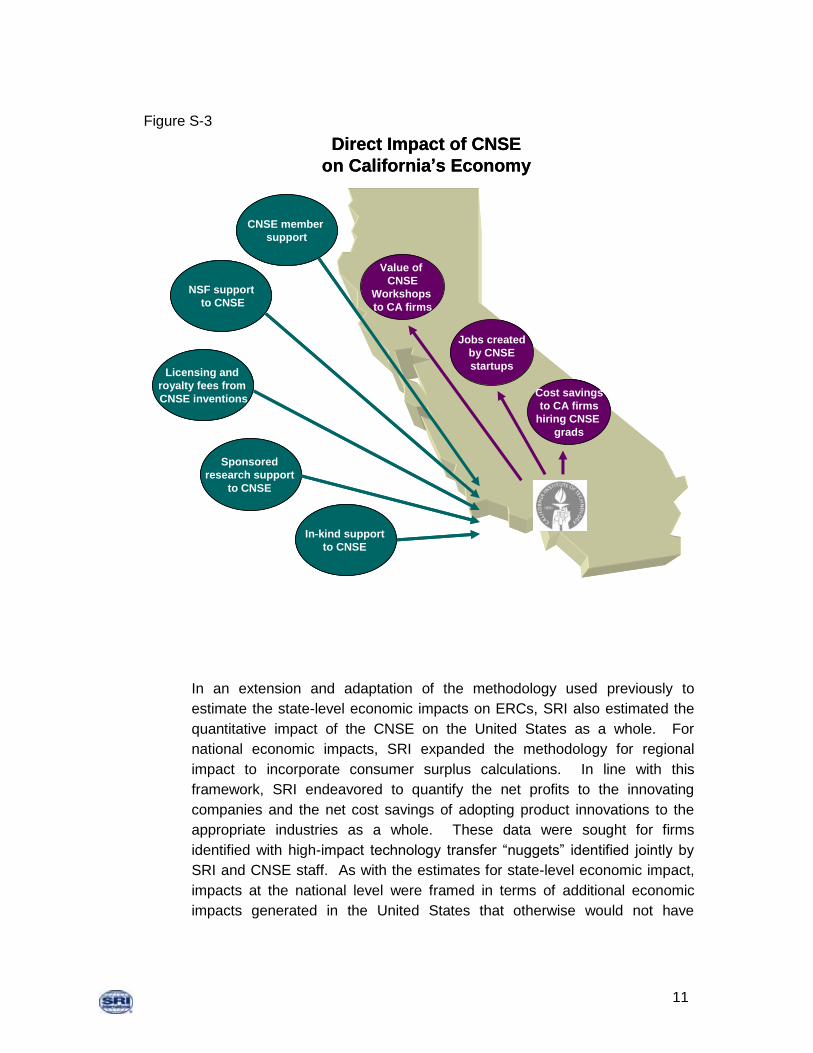
To assess the economic impact on California of state, NSF, and industry
investments in the CNSE, SRI employed the approach used in its study of the
economic impact of state investment in Georgia Tech’s PRC. This approach
identified the external (to California) support that the CNSE generated; the
direct and indirect economic impact of spending by the CNSE and its faculty,
students, and visitors; cost savings and other benefits to CNSE industrial
collaborators; the impact of university licensing of CNSE technology; the
value of CNSE-generated employment; the value of CNSE graduates hired
by California companies; and the value to companies (in terms of improved
technical skills of workers) of the CNSE’s industry workshops. See Figure S-
3, below, for a visual representation of these impacts and their sources.
11
Figure S-3
In an extension and adaptation of the methodology used previously to
estimate the state-level economic impacts on ERCs, SRI also estimated the
quantitative impact of the CNSE on the United States as a whole. For
national economic impacts, SRI expanded the methodology for regional
impact to incorporate consumer surplus calculations. In line with this
framework, SRI endeavored to quantify the net profits to the innovating
companies and the net cost savings of adopting product innovations to the
appropriate industries as a whole. These data were sought for firms
identified with high-impact technology transfer ―nuggets‖ identified jointly by
SRI and CNSE staff. As with the estimates for state-level economic impact,
impacts at the national level were framed in terms of additional economic
impacts generated in the United States that otherwise would not have
Value of
CNSE
Workshops
to CA firms
NSF support
to CNSE
Licensing and
royalty fees from
CNSE inventions
Sponsored
research support
to CNSE
In-kind support
to CNSE
CNSE member
support
Jobs created
by CNSE
startups
Cost savings
to CA firms
hiring CNSE
grads
Direct Impact of CNSE
on California’s Economy
12
occurred, and/or additional value to the country that otherwise would not have
occurred, in the absence of the CNSE.
Regional Economic Impacts of the CNSE
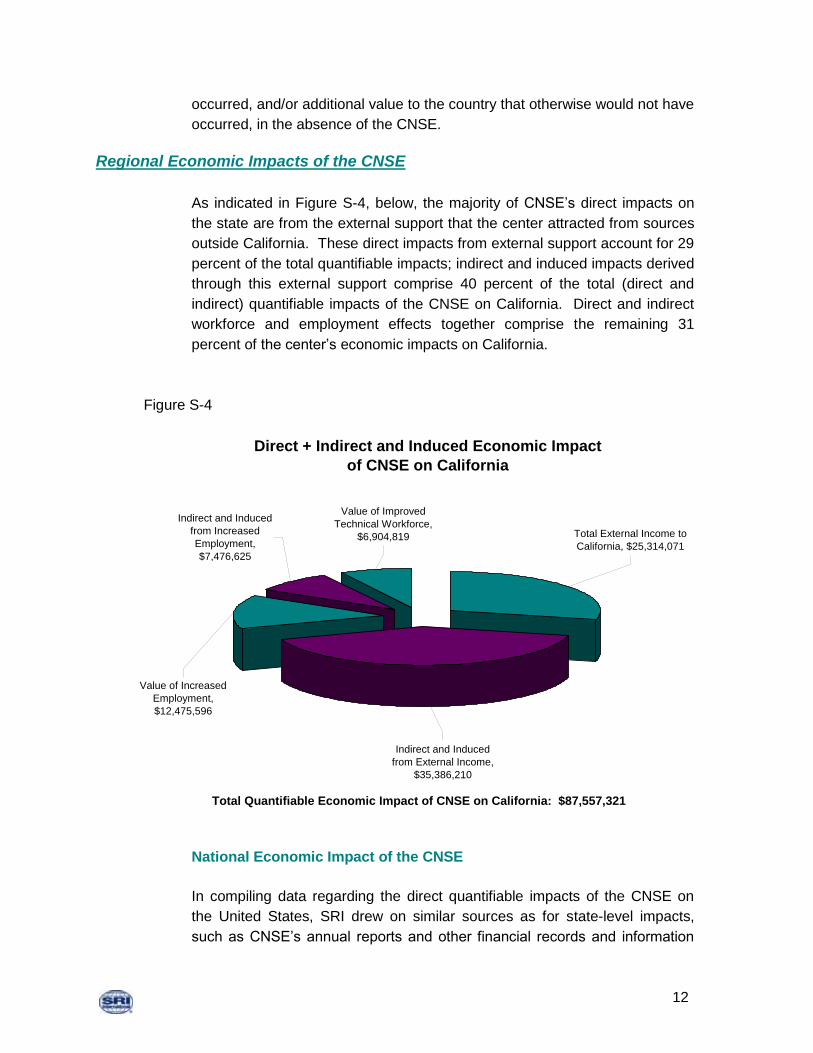
As indicated in Figure S-4, below, the majority of CNSE’s direct impacts on
the state are from the external support that the center attracted from sources
outside California. These direct impacts from external support account for 29
percent of the total quantifiable impacts; indirect and induced impacts derived
through this external support comprise 40 percent of the total (direct and
indirect) quantifiable impacts of the CNSE on California. Direct and indirect
workforce and employment effects together comprise the remaining 31
percent of the center’s economic impacts on California.
Figure S-4
National Economic Impact of the CNSE
In compiling data regarding the direct quantifiable impacts of the CNSE on
the United States, SRI drew on similar sources as for state-level impacts,
such as CNSE’s annual reports and other financial records and information
Indirect and Induced
from Increased
Employment,
$7,476,625
Value of Increased
Employment,
$12,475,596
Indirect and Induced
from External Income,
$35,386,210
Total External Income to
California, $25,314,071
Value of Improved
Technical Workforce,
$6,904,819
Total Quantifiable Economic Impact of CNSE on California: $87,557,321
Direct + Indirect and Induced Economic Impact
of CNSE on California

13
gathered through interviews. Interviews with selected industry partners,
initiated during the SRI team’s site visit to CNSE and in several cases
augmented via subsequent telephone and email communications, proved
essential for acquiring data on estimated cost savings to U.S. industry
resulting from CNSE-derived products and on net profits to firms
incorporating CNSE research into new products. Whenever required, SRI
also used standard economic data such as the Economic Census published
by the U.S. Census Bureau in our estimation of quantifiable impacts.
The total quantifiable economic impacts of the CNSE’s activities on the
United States are the direct impacts plus indirect and induced impacts. The
CNSE has had a direct impact on the U.S. economy of $165,599,927, with
secondary impacts of $7,568,698, for a total economic impact of
$173,168,625 over ten years (Figure S-5). As implied, the vast majority of
impacts on the United States are direct impacts – of which net cost savings to
industry comprise 82 percent of the total quantifiable impact; indirect and
induced impacts comprise less than one-half of one percent of the total
quantifiable impacts. The very large (relatively speaking) direct national
impacts were the result of just two examples of industry cost savings
attributable to CNSE ideas and technology. One involved a member
company’s (IRIS, Inc.) new product line that embodied CNSE ideas and
resulted in substantial cost savings to purchasers, and the other involved a
highly successful start-up, DigitalPersona, whose major product was
incorporated in Microsoft software operating systems.

14
Figure S-5
Other Impacts of the CNSE
The site visit to CNSE, as well as our initial communications with BPEC and
PERC staff, confirmed that it is important in impact studies such as this to
describe the magnitude and variety of non-quantifiable impacts of centers.
Examples of non-quantifiable impacts include effects of centers on firm
competitiveness at both the firm and national economic levels, as well as a
wide range of specific benefits that have positive but difficult-to-quantify
economic implications for firms, including access to new ideas and know-
how, access to facilities, improved information for suppliers and customers,
and information that influences the firm’s R&D agenda.
In the case of CNSE, several of these types of non-quantifiable impacts were
identified by member firms, CNSE startups, and center staff. With regard to
the hiring of CNSE graduates, a significant but difficult to quantify impact may
be the reduction in time from concept to commercialization in the company’s
products, due to the advanced knowledge and R&D techniques derived from
center research and experience. CNSE staff likewise commented on the
importance of human capacity building efforts at the center, noting that over
one-third of the Ph.D. graduates from CNSE went on to become faculty
members at other universities, thereby extending the center’s
multidisciplinary approach in this new field to additional students and in
External Income to the U.S., $65,500
Indirect and Induced from
External Income, $92,073
Value of Increased Employment, $12,475,596
Indirect and Induced from
Increased Employment, $7,476,625
Value of Improved Technical
Workforce, $7,348,831
Net cost savings to industry,
$145,710,000
Total Quantifiable Economic Impact of CNSE on California: $173,168,625
Direct + Indirect and Induced Economic Impact of CNSE on the U.S.
15
different academic environments. More broadly, CNSE staff emphasized
that, with NSF support, the center has succeeded in establishing an entirely
new field – neuromorphic systems engineering – that has implications and
applications for many industries and products. In this sense, CNSE’s R&D
supports the overall competitiveness and leadership of California and the
United States in the science and technology arena and, in particular, in this
emerging field.
Conclusions and Observations
The process of documenting and analyzing the CNSE’s quantifiable impacts
at the state and national levels led to two key conclusions and observations.
First, the investment of NSF funding in the CNSE yielded substantial returns
at both the state and national levels, especially when one considers these
returns in light of the conservative assumptions that we used to measure
realized impacts and the lack of data for some types of direct impact (e.g.,
industry sponsored research). Second, CNSE, despite operating as an ERC
for nearly a full 11 years, focuses on upstream or transformational ideas and
technologies, and so a long time horizon might be expected before
widespread applications of its R&D and other tangible indications of
economic impact occur. Given this focus, it is somewhat surprising that, at
the national level, SRI was able to document nearly $146 million in cost
savings to industry from the application of just two CNSE-derived ideas. The
sizeable economic impact of these ―nuggets‖ provides a suggestion of the
potential scale of the still incompletely realized and unknown impacts that
may be generated by additional CNSE outputs as well as from other ERCs
conducting transformational research.
Virginia Tech’s Center for Power Electronics Systems
The CPES case was the first example of a broadened range of impacts to be
examined that would include impacts that have obvious economic value to
industry and academia, but that cannot easily be quantified or expressed in
monetary terms. The initial stage of this evolution in data collection focused
more extensively on documenting the broader impacts on industry (where
economic value of ERCs is more directly realized than, say, in academia) of
ERC ideas, technology, and graduates. This entailed efforts to obtain
examples from the next two target ERCs (CPES and WIMS) of the most
significant impacts on industry of center outputs, regardless of whether the
impacts could be expressed in quantifiable economic terms. Thus, at CPES
and WIMS, we asked center staff to identify for us companies that had hired
16
significant numbers of center graduates, that had realized significant benefits
from one or a small number of graduates, and/or that had (as in the previous
design) benefited economically from center ideas and technology. We
continued to ask firms whether they could estimate the cost savings to
industry from ERC-based technology embodied in the firm’s products.
Regional Economic Impact of CPES
Unlike the two other ERCs studied during this first phase of the pilot study,
CPES has partner institutions in states other than Virginia. (CNSE had no
partner institutions, and WIMS partners all were located in Michigan.) In
principle, this greatly complicates the calculation of the regional economic
impact of CPES because, strictly speaking, each partner institution’s
economically relevant inputs and outputs and their impacts on each state
should be treated separately. It was immediately obvious that this was not
feasible given our project resources and the burden it would have placed on
CPES staff, nor was it necessary for the primary purposes of this study. We
asked CPES staff to break the data we required for our regional economic
analysis into three locational categories: sources/impacts within the five
partner states (VA, NY, WI, PR, NC), within the U.S., and foreign. This was
not greatly burdensome for most of our support and impact categories, since
CPES industry workshops were held at VT; visiting researchers came to VT;
and the location of members of the CPES industrial consortium, the location
of sources of sponsored research support for CPES, the location of
companies that had hired CPES students, and the location of start-up
companies all were known by CPES staff.
The total quantifiable economic impacts of CPES’ activities on the five partner
states are the direct impacts plus indirect and induced impacts. CPES has
had a direct impact on member states of $62,911,303, with secondary
impacts of $57,942,247, for a total economic impact of $120,853,550 over
nine years. As indicated in Figure S-6, the majority of the direct impacts are
from the external support that CPES has received from external sources.
These direct impacts from external support account for 48 percent of the total
quantifiable impacts, and indirect and induced impacts derived through this
external support comprise 48 percent of the total (direct and indirect)
quantifiable impacts of CPES on partner states. Direct and indirect workforce
and employment effects together comprise the remaining 4 percent of
economic impacts on the region.

17
Figure S-6
National Economic Impact of CPES
The national societal benefit of investment in efforts such as NSF’s ERC
program is equal to the sum of profits to the innovating firm and the cost
savings to users (whether individuals or companies). Accordingly, to quantify
impact at the national level, SRI sought to estimate both profits and cost
savings. Obtaining data for either element of societal impact has proven
difficult, and in the case of CPES it was especially difficult. Although our
interviews with a number of companies that have been members of, and/or
hired graduates of, CPES (including Intel, General Electric, International
Rectifier, DRS Power and Control Technologies, and Monolithic Power
Systems), our interviewees were unable to provide us with verifiable
estimates of additional profits or the total cost savings to their company or to
industry attributable to CPES technology. Nevertheless, our industry
interviews did yield some impressive, general estimates of the economic
impact that CPES research and technology has had on the power electronics
industry. One of our interviews estimated that the CPES modular power
supply concept, initially developed for PC applications, has resulted in $1.5
billion of economic impact on several U.S. industries.
Value of Improved
Technical Workforce,
$4,513,238
Indirect and Induced
Impact from Increased
Employment, $65,637
Value of Increased
Employment, $181,770
Indirect and Induced
Impact from External
Income, $57,876,609
Total External Income to
Five Partner States,
$58,216,295
Direct + Indirect and Induced Economic Impact
of CPES on Five Partner States
Total Quantifiable Economic Impact of CPES on Five Partner States: $120,853,550

18
To date, CPES has had a direct impact on the U.S. economy of $19,284,391,
with secondary impacts of $2,010,583, for a total economic impact of
$21,294,974 over nine years. As implied, the vast majority of impacts on the
United States are direct impacts, in CPES’s case almost all of which are
comprised of employment and workforce effects. These workforce effects,
which do not generate indirect or induced effects, account for more than 80
percent of CPES’ total quantifiable national impact (Figure S-7).
Figure S-7
Other Impacts of CPES
In the case of CPES, several types of important but non-quantifiable effects
became readily apparent through SRI’s interviews with member companies,
notably access to specially-trained students and new ideas or ways of
thinking. While our industry interviewees generally did not provide
quantitative estimates of the economic impact of CPES technology or ideas,
they spoke enthusiastically about the importance that CPES training and new
hires had for company growth, and in a general way about the impact that
CPES ideas and technology had on their company and on the relevant
industries.
Total External Income $1,828,264
Indirect and Induced Impact from External Income, $1,944,946
Value of Increased Employment, $181,770
Indirect and Induced Impact from Increased Employment, $65,637
Value of Improved Technical Workforce,
$17,274,357
Direct + Indirect and Induced National Impact of CPES
Total Quantifiable National Impact of CPES: $21,294,974

19
Conclusions and Observations
The context of an ERC’s research activity—the stage of development of its
technical focus, the dynamism of the industry or industries with which it is
associated—greatly influence the profile of its output and the time frame of its
directly realized impacts on education and industry. As a ―incremental‖ ERC
(that is, one relatively downstream in the innovation process with a specific
target industry or market), one might expect CPES’ outputs and impacts to
reflect a strong technological focus and relatively ―hard‖ examples of
technology transfer evidenced via licenses to industry. Yet even in this
context, casting a broader view of the center’s impact on industry shows that
ideas and students, not technology per se, are cited by industry as the areas
in which both individual firms and the industry benefit most from the center’s
existence.
In its regional economic impacts, CPES follows a pattern shown by such
disparate ERCs as Georgia Tech’s Packaging Research Center and
Caltech’s CNSE—sizeable direct and indirect economic impacts, of the
magnitude of hundreds of millions of dollars—deriving substantially from the
Center’s ability to attract large amounts of financial support from external
sources, primarily federal funding agencies and industry. But the quantifiable
national impact profiles of CNSE and CPES are strikingly different, in some
perhaps unexpected ways. CNSE, a transformational center far upstream in
the innovation process and potentially relevant to a wide range of industries,
nonetheless shows substantial direct, quantifiable economic effects on the
national level from just two examples of technology transfer to industry: one
in the form of a highly successful start-up company that generated both
considerable internal profits as well as cost savings to its customers, and the
other in the form of a member company that incorporated CNSE research in
a new product line that also resulted in substantial savings to its customers.
CPES’ quantifiable national impact is quite modest by comparison, but our
interviews indicated that the actual impact of its central concept, modular
integrated power systems for a variety of applications, almost certainly has
amounted to multi-billion dollar benefits for the national economy. It is
equally clear that CPES students have had very substantial economic
impacts on the companies they work for, especially companies that have
hired more than just a few of them. Those impacts, again according to our
interviews, are attributable to the unique training they received at CPES,
notably involving systems thinking, multidisciplinary perspectives, and
sensitivity to the industry context.

20
This is not to say that CPES outputs will not generate significant, quantifiable
national economic impacts in the future. In the power electronics industry,
the time from new ideas to new products is relatively long—10 to 20 years.
For CPES, the path to these future impacts is not through licensed
technology or center-based start-ups, but rather through informal center-
industry interactions and, especially, through center graduates who bring new
ideas and new ways of thinking to the companies that hire them. It seems
highly likely that we are now seeing just the early manifestations of CPES’
national economic impact, the bulk of which will be realized well after CPES
ceases to receive NSF support.
University of Michigan’s Center for Wireless Integrated Microsystems
Regional Economic Impact of WIMS
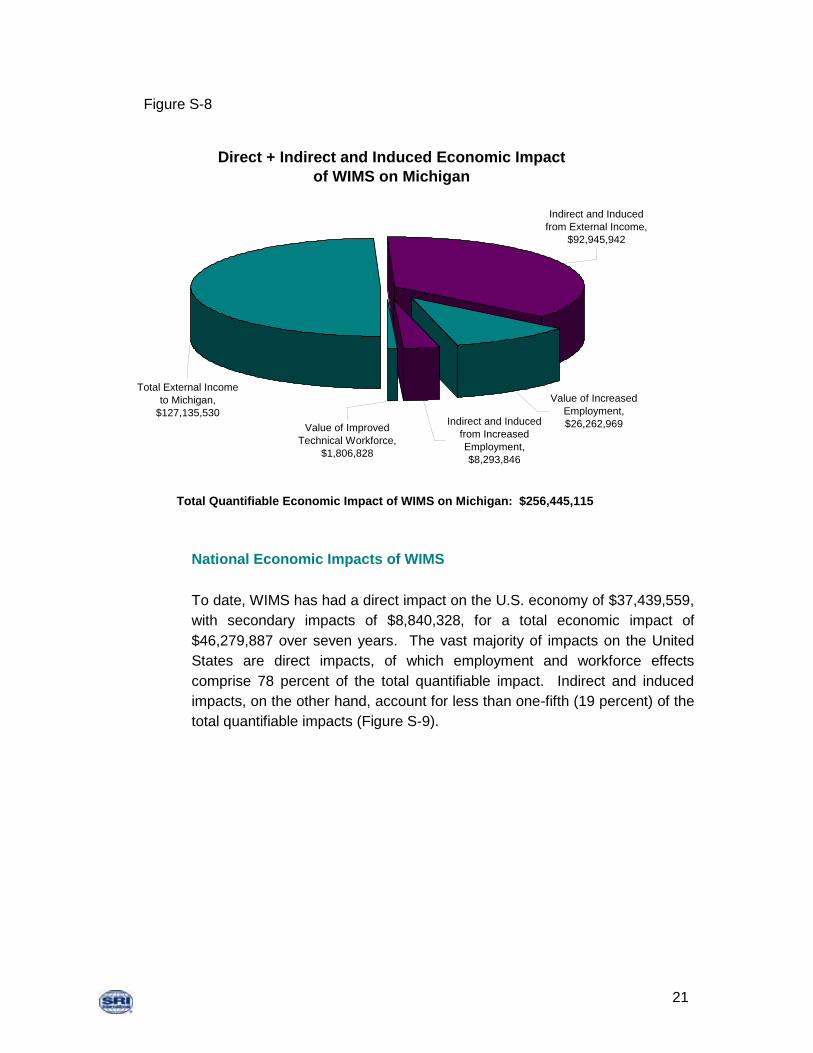
WIMS has had a direct impact on the Michigan economy of $155,205,327,
with secondary impacts of $101,239,787, for a total economic impact of
$256,445,115 over seven years. As indicated in Figure S-8, the majority of
the direct impacts are from the external support that WIMS has received from
non-Michigan sources. These direct impacts from external support account
for 50 percent of the total quantifiable impacts, and indirect and induced
impacts derived through this external support comprise 36 percent of the total
(direct and indirect) quantifiable impacts of WIMS on Michigan. Direct and
indirect workforce and employment effects together comprise the remaining
14 percent of economic impacts on Michigan.
21
Figure S-8
National Economic Impacts of WIMS
To date, WIMS has had a direct impact on the U.S. economy of $37,439,559,
with secondary impacts of $8,840,328, for a total economic impact of
$46,279,887 over seven years. The vast majority of impacts on the United
States are direct impacts, of which employment and workforce effects
comprise 78 percent of the total quantifiable impact. Indirect and induced
impacts, on the other hand, account for less than one-fifth (19 percent) of the
total quantifiable impacts (Figure S-9).
Value of Improved
Technical Workforce,
$1,806,828
Indirect and Induced
from Increased
Employment,
$8,293,846
Value of Increased
Employment,
$26,262,969
Indirect and Induced
from External Income,
$92,945,942
Total External Income
to Michigan,
$127,135,530
Direct + Indirect and Induced Economic Impact
of WIMS on Michigan
Total Quantifiable Economic Impact of WIMS on Michigan: $256,445,115

22
Figure S-9
Other Impacts of WIMS
In interviews with SRI, WIMS member companies repeatedly emphasized the
positive qualitative differences that WIMS students bring to their companies
as new hires. From the perspectives of member companies, WIMS
graduates possess not only outstanding research skills (which would be
expected of all Ph.D. graduates) but also many attributes that differentiate
WIMS graduates from other hires, such as:
Teamwork skills;
Experience resolving implementation issues;
Focus on directing research toward a commercially-feasible product;
Ability to contribute beyond the narrow range of expertise typically held by
a new Ph.D. hire; and
Understanding or awareness of both business and technical issues.
Several companies indicated that WIMS graduates had been and continue to
be pivotal elements of the companies’ success.
According to SRI’s interviews, WIMS brings together companies that would
not otherwise interact, and this convening role facilitates companies’
External Income to the U.S., $848,152
Indirect and Induced from
External Income, $546,482
Value of Increased
Employment, $26,262,969
Indirect and Induced from
Increased Employment, $8,293,846
Value of Improved Technical
Workforce, $10,042,438
Net Cost Savings to Industry, $286,000
Total Quantifiable National Economic Impact of WIMS: $46,279,887
Direct + Indirect and Induced Economic Impact of WIMS on the U.S.

23
identification of potential new customers, suppliers, partnerships, and
investors. WIMS’ role in helping to forge linkages between small and large
companies was described as particularly significant. The mixture of
researchers, industry, financiers (especially venture capitalists), faculty
members, and students that characterizes WIMS events also was mentioned
as providing fertile ground for idea sharing, identifying new technologies, and
learning from peers. Likewise, investment partnerships, both actual and
potential, are perceived as a benefit of the WIMS network.
Conclusions and Observations
Three central observations emerge from this case study of WIMS’ regional
and national economic impacts. First, it is clear that NSF investment in
WIMS has resulted in significant economic impact on the state of Michigan.
The impact of NSF funding at the national level is, to date, less dramatic than
the regional impact. However, the question of what represents a realistic
timeframe for observing measurable national impacts from the leading edge
research conducted at ERCs is again raised through the WIMS case. In its
seventh year as an ERC, WIMS has generated seven startups, which in turn
have operated for as many as seven years and as few as one year. Despite
the startups’ relatively short periods of existence, one company – Discera –
has already introduced to the market a product (based on center technology)
that has resulted in industry cost savings of $286,000 and has the potential to
save industry millions of dollars. In light of this example of emerging impact
from ERC inventions, the potential for significant future effects appears great.
Another observation related to WIMS concerns the importance of qualitative
as well as quantitative impacts. The qualitative effects that WIMS’ industry
partners report receiving from interaction with WIMS are, in the view of the
company representatives, as important as quantitative results. Though the
precise value is not amenable to estimation, companies place great emphasis
on the access WIMS provides to students; new ideas and technologies;
sophisticated facilities; and networks of faculty, peers, potential customers,
suppliers and investors. Accordingly, although adequate measures of
qualitative effects are not currently available, such effects should not be
ignored or excluded from overall assessments of ERC impact.
24
Johns Hopkins Center for Computer-Integrated Surgical Systems and Technology (CISST)
Regional economic impact of CISST
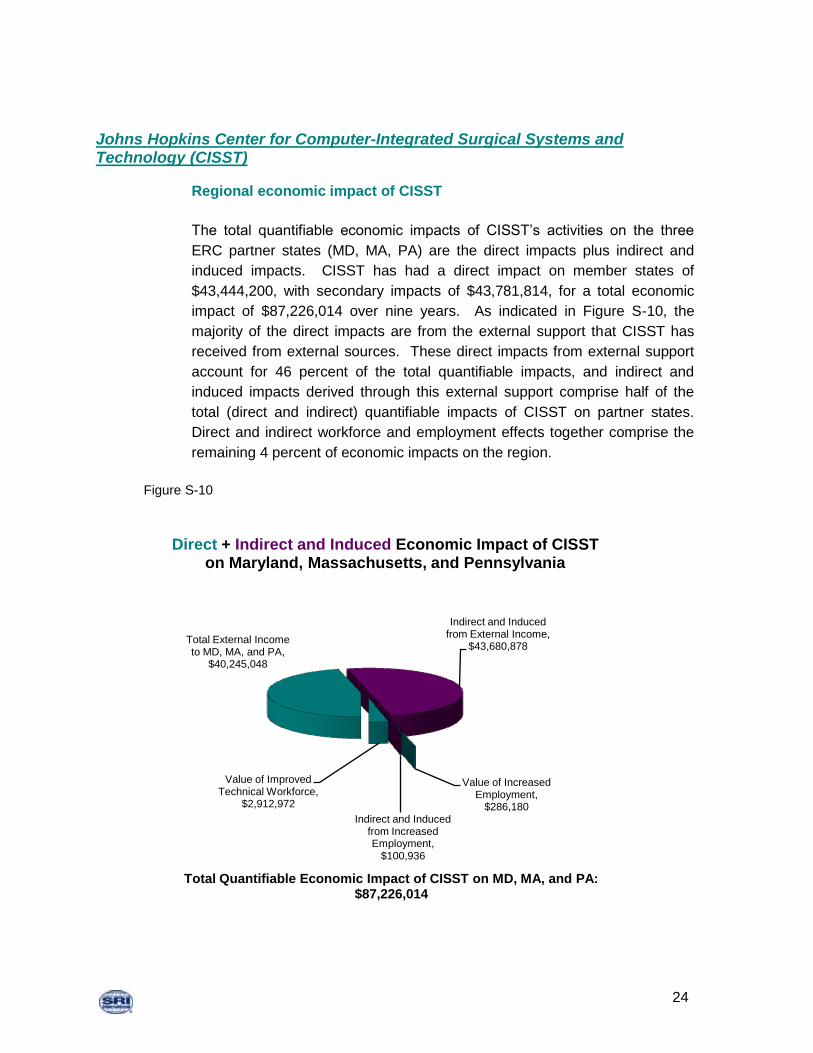
The total quantifiable economic impacts of CISST’s activities on the three
ERC partner states (MD, MA, PA) are the direct impacts plus indirect and
induced impacts. CISST has had a direct impact on member states of
$43,444,200, with secondary impacts of $43,781,814, for a total economic
impact of $87,226,014 over nine years. As indicated in Figure S-10, the
majority of the direct impacts are from the external support that CISST has
received from external sources. These direct impacts from external support
account for 46 percent of the total quantifiable impacts, and indirect and
induced impacts derived through this external support comprise half of the
total (direct and indirect) quantifiable impacts of CISST on partner states.
Direct and indirect workforce and employment effects together comprise the
remaining 4 percent of economic impacts on the region.
Figure S-10
Total External Income to MD, MA, and PA,
$40,245,048
Indirect and Induced from External Income,
$43,680,878
Value of Increased Employment,
$286,180Indirect and Induced
from Increased Employment,
$100,936
Value of Improved Technical Workforce,
$2,912,972
Direct + Indirect and Induced Economic Impact of CISST on Maryland, Massachusetts, and Pennsylvania
Total Quantifiable Economic Impact of CISST on MD, MA, and PA: $87,226,014

25
National impact of CISST
CISST’s total quantifiable economic impacts on the United States are defined
as direct impacts plus indirect and induced impacts. To date, CISST has had
a direct impact on the U.S. economy of $3,208,235, with secondary impacts
of $101,719 for a total economic impact of $3,309,954 over nine years. As
with most of our other cases, for which ―hard‖ estimates of the societal impact
of new product innovation were not available, the vast majority of impacts on
the United States are direct impacts, in CISST’s case almost all of which are
comprised of employment and workforce effects. These workforce effects,
which do not generate indirect or induced effects, account for 88 percent of
CISST’s total quantifiable national impact (Figure S-11).
Figure S-11
Conclusions and observations
For the last two case studies in the ERC economic impact project, CISST and
the Georgia Tech/Emory Center for the Engineering of Living Tissue, we cast
the net of ―economic impacts‖ even more widely than in the previous cases.
In particular, we wished to see what kinds of impacts with economic
implications, broadly defined, could be included and for which reliable data
Total External Income , $828 Indirect and Induced
Impact from External Income, $783
Value of Increased Employment,
$286,180
Indirect and Induced Impact from
Increased Employment,
$100,936
Value of Improved Technical Workforce,
$2,921,227
Direct + Indirect and Induced National Impact of CISST
Total Quantifiable National Impact of CISST: $3,309,954

26
could be obtained. We wanted to explore categories of impact that might
have indirect or quite long-term economic implications, including impacts on
the academic community (in particular, on the careers of graduated CISST
students who chose academic careers, and on the universities that hired
them), and on the center’s host, Johns Hopkins University. In addition to
industry representatives and ERC staff, we also interviewed selected Ph.D.
graduates, post-docs, and center faculty, identified by center managers as
outstanding contributors to research and academia. And finally, we
interviewed non-center faculty and administrators at Georgia Tech and JHU
to obtain details of significant institutional impacts the ERC may have had.
Both the magnitude and profile of CISST’s quantifiable economic impacts,
especially on the national level, reflect two key characteristics of the Center’s
research: its goals are relevant to an emerging industry, one that barely
existed when the Center was formed, and it focuses on medical technology,
which requires FDA approval before market introduction can occur. The
CISST case seems to be a good example of modest quantifiable economic
impacts but major less-readily-quantified economic as well as other impacts
that are significant but not quantifiable. The Center was a key influence on
the growth of the medical robotics industry and the retention of its core in the
U.S. Although the evidence is indirect, our interviews made it clear that
company affiliates of the Center benefited considerably in multiple ways from
their collaborations. In several instances, small and medium-sized
companies appear to owe their very survival to the Center, but we were
unable to obtain estimates for the possible market value of these effects.
One of our industry interviewees gave CISST considerable credit for the
remarkable growth of an affiliate, Intuitive Surgical, from its inception in 1995
to its current size of 930 employees and annual revenues of more than $600
million. The company licensed the CISST ―snake‖ robot, which provides a
high level of dexterity in very small spaces such as the throat and upper
airway.
The nature of the regulated market that is the target for commercializing
Center ideas and technology and the nascent stage of development of the
medical robotics industry combine to greatly restrict the likelihood that the
Center could spawn successful start-ups or generate commercially
successful products, even after ten years of existence. Even if private firms
had been able to commercialize new products attributable largely to Center
ideas or technology, the consumer surplus approach could not be used to
estimate the economic benefits to society because in most cases we learned
about, innovations did not result in cost savings but rather enabled new
things to be done that could not have been done before. Until a model is

27
developed that can be used to estimate the public benefits of innovations that
are entirely new to the economy rather than substitutes for existing products
and processes, the value of a large proportion of ERC outputs cannot be
quantified.
As graduates and post-docs who studied and conducted research at the
Center moved on to other academic posts, they took with them the systems
perspective that shaped much of the medical robotics work at the Center.
The value of engineering-medical school collaboration in the form of
interdisciplinary project teams is diffusing widely and is becoming more
institutionalized at Hopkins. One important part of the legacy of CISST
appears to be a case of the (relatively) tiny engineering school having an
enormous impact on the huge Hopkins medical school (the JHU Department
of Radiology and Radiological Science alone has more than 1,000
employees). A multi-divisional initiative, Integrating Imaging, Intervention,
and Informatics in Medicine (I4M), now the top priority of the Medical School,
probably would not exist in the absence of CISST.
Finally, the institutionalization of center diversity and outreach initiatives,
while not an ―economic‖ impact, deserves inclusion as an appropriate
outcome category in any ERC impact study. The Whiting Engineering
School’s Center for Educational Outreach takes lessons learned from the
practices of CISST’s Education, Outreach and Diversity Committee and
seeks to implement them department-wide. Similarly, adding a Diversity and
Climate criterion to the performance evaluation criteria for engineering faculty
represents an important first step in formalizing diversity incentives in the
School of Engineering. Although these categories of impacts apply to all
ERCs, we documented them because they will survive the termination of NSF
support.
Georgia Tech/Emory Center for the Engineering of Living Tissue
Economic impact of GTEC on Georgia
The total quantifiable economic impacts of GTEC’s activities on Georgia are
the direct impacts plus indirect and induced impacts. GTEC has had a direct
impact on Georgia of $78,467,149 with secondary impacts of $98,679,414,
for a total economic impact of $177,146,563 over nine years. As indicated in
Figure S-12, the majority of the direct impacts are from the external support
that GTEC has received from external sources. These direct impacts from
external support account for 41 percent of the total quantifiable impacts, and

28
indirect and induced impacts derived through this external support comprise
55 percent of the total (direct and indirect) quantifiable impacts of GTEC on
partner states. Direct and indirect workforce and employment effects
together comprise the remaining 4 percent of economic impacts on the
region.
Figure S-12
National economic impacts of GTEC
GTEC’s total quantifiable economic impacts on the United States are defined
as direct impacts plus indirect and induced impacts. To date, GTEC has had
a direct impact on the U.S. economy of $6,584,524, with secondary impacts
of $2,207,301, for a total economic impact of $8,791,825 over nine years. As
implied, the vast majority of impacts on the United States are direct impacts.
In GTEC’s case the relatively high proportion of graduates who opted for
academic posts rather than industrial positions limits both the direct and
indirect impact on the value of employment created by GTEC graduates. The
employment and workforce value estimates do not capture the direct impact
of Center graduates in academic settings. The proportion of direct plus
indirect and induced effects on the United States is presented in Figure S-13.
Direct + Indirect and Induced Impacts of GTEC on
Georgia
Total External
Income to GA,
$73,035,395
Value of
Increased
Employment in
GA, $1,859,220
Value of
Improved
Technical
Workforce,
$3,572,535
Indirect and
Induced Impact
from Increased
Employment,
$1,072,398Indirect and
Induced Impact
from External
Income,
$97,607,016
Total Quantifiable Impacts of GTEC on GA: $177,146,563

29
Figure S-13
Conclusions and observations
The magnitude and profile of GTEC’s quantifiable economic impacts reflect
the relevance of the Center’s research to an industry that matured in parallel
with the Center’s evolution. The limited magnitude of directly quantifiable
impacts in the form of license fees and profitable start-up companies is
probably a consequence of the early stage of development of the industry.
Several start-ups are in their nascent stages and their full economic impact
will likely be realized over the next few years. One of the Center’s major but
less readily quantified impacts has been its service as a platform for industry
discussion and collaboration in tissue engineering. The quality of the work
conducted at Georgia Tech and the determined effort of the Center directors
to close the gap between academic research and industry applications has
been a lasting impact of the center. The combination of industry meetings
hosted at GTEC and industry participation through membership has placed
GTEC at the nexus of industry-university collaboration in tissue engineering
in the United States.
As with CISST, GTEC is linked to an emerging segment of a regulated
industry. The clinical trials process introduces substantial, though necessary,
hurdles for commercializing new technology. The likelihood that ERCs such
as GTEC will spawn successful start-ups or generate successful commercial
Direct + Indirect and Induced Impacts of GTEC on
United States
Value of
Increased
Employment in
United States,
$1,859,220
Total External
Income to
United States,
$854,662
Indirect and
Induced Impact
from Increased
Employment,
$1,072,398 Indirect and
Induced Impact
from External
Income,
$1,134,903
Value of
Improved
Technical
Workforce,
$3,870,642
Total Quantifiable Impacts of GTEC on the United States: $8,791,825

30
applications during its ten-year existence is not high, and such fully realized
impacts would be quite rare.
As the graduates and post-docs who studied and conducted research at the
Center moved on to academic and industry posts, they took with them the
fusion of bioscience and engineering that has opened a new line of thinking in
tissue engineering. The value of that mode of thinking is reflected in the
number of companies seeking membership in GTEC as well as the number of
universities that seek not only collaboration, but placement of GTEC grads
into their tissue engineering and bioengineering departments.
Another important feature of GTEC, reflected in other ERCs as well, is the
strength of its Director. Several members of the faculty as well as current
and former students alluded to the personal conviction of Bob Nerem as
being instrumental in specific factors accounting for the Center’s success.
Among those is the articulated plan to develop young talent. At GTEC,
several faculty members associated with the Center were recruited in part
because they were relatively young, highly talented, and demonstrated an
appreciation for and willingness to conduct collaborative work in a highly fluid
and interdisciplinary environment. Indeed, the tremendous impact of the
diversity efforts was born of the determination of the Center Director to raise
those efforts to a level where they could not be treated trivially within the
Center. That legitimacy and backing likely played a role in the institutional
impacts that were eventually realized. Through the several interviews SRI
conducted with people affiliated with GTEC, it is clear that the scope of the
Center’s impact is enormously influenced by the vision and personal
conviction of its Director.
Finally, the institutionalization of center diversity and outreach initiatives,
while not an ―economic‖ impact, deserves inclusion as an appropriate
outcome category in any ERC impact study. The College of Engineering at
Georgia Tech takes lessons learned from the practices of GTEC’s diversity
initiatives and seeks to implement them college-wide. This is another
indication of the substantial institutional impact the Center has had on the
broader institution.
31
IV. SUMMARY AND IMPLICATIONS
Quantifiable Regional and National Economic Impacts of ERCs
Reading across the results of our efforts to identify and quantify the regional
and national economic impacts of five ERCs shows how strikingly different
the impacts are if a narrowly conceived notion of economic impacts is used—
and the data collection limitations associated with that conception are kept in
mind. Moreover, the estimated quantifiable impacts do not vary in ways that
are readily explained by the obvious characteristics of the ERCs involved
such as size, technical field, level of industrial support, dynamism of
associated industries, incremental or pre-incremental stage of technological
focus. Digging below the surface of the data we collected, it becomes clear
that only some of the differences can be explained by the characteristics of
these ERCs. Rather, most differences in measurable economic impact are
primarily the result of the vagaries of the data that could be obtained from the
centers involved and the companies they work with, not the result of the
center’s characteristics or the degree to which they have achieved their
intended goals.2
Figures S-14 through S-17 summarize the available quantifiable data. Let us
begin with a discussion of the regional impact data, Figures S-14 and S-15.
Quantifiable regional impacts vary widely, from about $90 million to just over
$250 million. Almost all of this variation is attributable to differing amounts of
external income to the centers and the indirect and induced effects of that
income. External income itself varies from about $25 million to $125 million
across the five ERCs, so ignoring the indirect and induced effects makes the
disparities a bit less drastic. In the case of CNSE, the considerable income to
the center from sponsored research, which typically amounts to at least as
much as the amount of NSF Program support, could not be included because
CalTech’s accounting system does not distinguish ERC-related sponsored
research projects from projects attracted by other units of the Institute. In
addition, although CNSE emphasizes start-ups as the most effective way of
transferring knowledge and technology, and has been quite successful in this,
data on the amount of venture capital generated by the center’s nine start-
ups—which was obtained for WIMS’ eight start-ups and was sizeable
($42M)—was not available. To complicate comparison further, even if
venture capital figures for CNSE had been available, they would probably not
2 Obviously we have made no effort in this study to assess the performance or productivity of ERCs
with respect to either their own specific objectives or NSF’s mandated program goals. Nonperforming ERCs are quickly identified at an early stage in their history and either terminated or reorganized so that, by the end of their period of NSF support, it can be assumed that all ERCs are performing at a high level and achieving their research, education, and knowledge transfer goals.

32
have ―counted‖ in the calculations of regional impact because presumably
most of the funding would have been invested by California venture capital
firms, and thus would not represent external funding entering the state. Note,
too, that only WIMS and CNSE have spawned start-ups with significant
employment impacts on the region. CPES presumably has not had the
opportunity to do this given the mature industry that it serves, nor has CISST
or GTEC, both of which serve small, emerging industries that have very long
commercialization time frames due to FDA approval requirements for new
medical products.
Figure S-14
$0
$50,000,000
$100,000,000
$150,000,000
$200,000,000
$250,000,000
$300,000,000
CNSE CPES WIMS CISST GTEC
Total Amount and Composition of Quantifiable Regional Economic Impact for Five ERCs
Indirect and Induced
Increased Employment
Improved Technical Workforce
External Income

33
Figure S-15
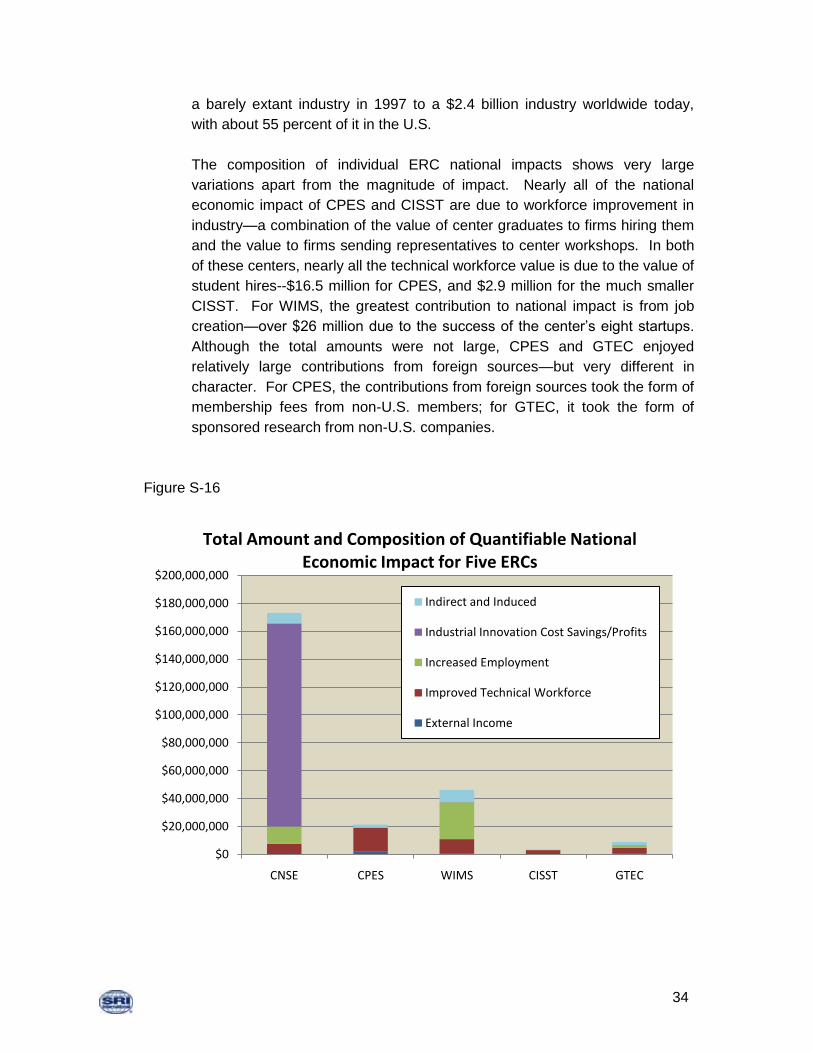
Figures S-16 and S-17, below, show the total quantifiable national economic
impact of the five ERCs and the composition of the impact for each center.
Disparities in both total impact and composition are much greater than was
the case for regional impacts. Because two companies associated with
CalTech, one a start-up and one a center industrial member, were willing and
able to share estimates of the profits and cost savings to their customers for
products attributable to CNSE technology, the total national impact of CNSE
dwarfs that of the other four ERCs studied. But as we know from the
interview data, this probably underestimates the economic impact of CNSE
on industry. Further, there is a very strong possibility that the other ERCs
studied had this much or more national economic impact, which could not be
estimated reliably using the consumer surplus approach to measuring the
impact of industrial innovation. Some examples are the multi-billion dollar
impact that CPES’ concept of modular integrated power systems appears to
have had on the national economy, the impact of CISST technology on the
survival of numerous SME’s in the medical devices business, and the
influence that GTEC knowledge and technology has had on moving what was
0%
10%
20%
30%
40%
50%
60%
70%
80%
90%
100%
CNSE CPES WIMS CISST GTEC
Indirect and Induced
Increased Employment
Improved Technical WorkforceExternal Income
Composition of Quantifiable Regional Economic Impact for Five ERCS
34
a barely extant industry in 1997 to a $2.4 billion industry worldwide today,
with about 55 percent of it in the U.S.
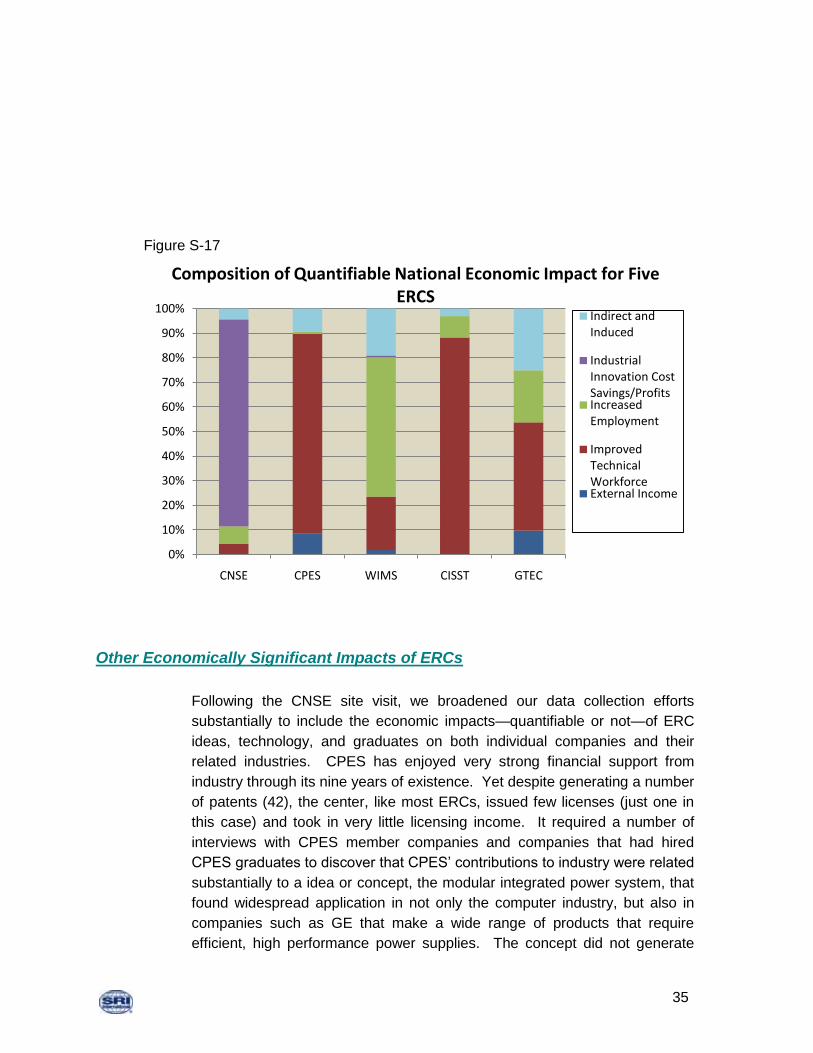
The composition of individual ERC national impacts shows very large
variations apart from the magnitude of impact. Nearly all of the national
economic impact of CPES and CISST are due to workforce improvement in
industry—a combination of the value of center graduates to firms hiring them
and the value to firms sending representatives to center workshops. In both
of these centers, nearly all the technical workforce value is due to the value of
student hires--$16.5 million for CPES, and $2.9 million for the much smaller
CISST. For WIMS, the greatest contribution to national impact is from job
creation—over $26 million due to the success of the center’s eight startups.
Although the total amounts were not large, CPES and GTEC enjoyed
relatively large contributions from foreign sources—but very different in
character. For CPES, the contributions from foreign sources took the form of
membership fees from non-U.S. members; for GTEC, it took the form of
sponsored research from non-U.S. companies.
Figure S-16
$0
$20,000,000
$40,000,000
$60,000,000
$80,000,000
$100,000,000
$120,000,000
$140,000,000
$160,000,000
$180,000,000
$200,000,000
CNSE CPES WIMS CISST GTEC
Indirect and Induced
Industrial Innovation Cost Savings/Profits
Increased Employment
Improved Technical Workforce
External Income
Total Amount and Composition of Quantifiable National Economic Impact for Five ERCs
35
Figure S-17
Other Economically Significant Impacts of ERCs
Following the CNSE site visit, we broadened our data collection efforts
substantially to include the economic impacts—quantifiable or not—of ERC
ideas, technology, and graduates on both individual companies and their
related industries. CPES has enjoyed very strong financial support from
industry through its nine years of existence. Yet despite generating a number
of patents (42), the center, like most ERCs, issued few licenses (just one in
this case) and took in very little licensing income. It required a number of
interviews with CPES member companies and companies that had hired
CPES graduates to discover that CPES’ contributions to industry were related
substantially to a idea or concept, the modular integrated power system, that
found widespread application in not only the computer industry, but also in
companies such as GE that make a wide range of products that require
efficient, high performance power supplies. The concept did not generate
0%
10%
20%
30%
40%
50%
60%
70%
80%
90%
100%
CNSE CPES WIMS CISST GTEC
Indirect and Induced
Industrial Innovation Cost Savings/ProfitsIncreased Employment
Improved Technical WorkforceExternal Income
Composition of Quantifiable National Economic Impact for Five ERCS
36
intellectual property, and indeed CPES has deliberately moved toward an IP
policy favoring non-exclusive, royalty-free licensing to member companies.
And, the interviews clearly showed the very strong impact that CPES
students have had on individual companies (e.g., as in the case of GE,
leading new product development groups) and on their related industries—
impacts that clearly had very high economic value but could not be reliably
measured. Rough estimates, however, from several companies would put
the national economic impact of CPES in the range of billions of dollars.
WIMS’ regional impact was nicely augmented by the large amount of venture
capital its start-ups attracted, data that were not available for other ERCs
studied. Like CPES, however, our industry interviews showed that WIMS
graduates have very substantial (but not readily quantifiable) economic
impact on individual companies, impacts that were not experienced in the
case of other hires. In addition, companies mentioned the value of WIMS
ideas, access to facilities (e.g., a dry etch tool), and contacts among
companies that facilitated identification of new customers, suppliers,
partnerships, and investors. In all cases, no dollar figures could be attached
to these impacts, but there was no doubt in the interviewees’ minds that they
were substantial.
The CPES, CISST, and GTEC cases represent relatively modest quantifiable
national impact but substantial economic impact estimates obtained from
industry sources. The CPES situation is summarized above: a combination
of a new concept that yielded performance improvements and reduced
energy consumption in power supplies for computers and a wide variety of
other applications. CISST and GTEC, both transformational centers focusing
on newly emerging industries or industry segments, evidently played major
roles in the growth of their associated industries, including the survival of
several firms (CISST and GTEC) and the retention of the core industry in the
U.S. (again, CISST and GTEC). Specific impact estimates were not
available, but clearly the economic value of both centers for the nation has
been substantial.
The last two cases, CISST and GTEC, with a wider web of impact categories
cast, also illustrates what can be lost if a narrowly-conceived, quantitative
conception of ―economic‖ impact is used in evaluation studies. How does
one estimate the impact on innovation in the medical devices industry of an
institutionalized collaboration between the Johns Hopkins School of Medicine
and the Whiting School of Engineering, an example closely watched by other
major universities? Similarly, the collaboration between the Emory Medical
School and Georgia Tech, institutionalized in GTEC, has shown the value of
37
transdisciplinary collaborations in fostering breakthroughs in research and
new ways of thinking. At both Hopkins and Georgia Tech, ERC efforts at
increasing diversity in science and engineering human capital were highly
successful, so much so that institutionalization of their programs took root.
Again, how does one estimate the value to the U.S. science and engineering
enterprise of increased numbers of talented, diverse graduates into the
technical workforce?
Lessons Learned: Identifying and Measuring the Economic Impacts of ERCs
Although a pilot effort, this study has already resulted in a number of
important ―lessons learned‖ that are pertinent to future efforts to identify and
estimate the economic impacts of ERCs—or, for that matter, similar
university-based centers with multiple goals that span research, education,
and technology transfer. First, despite the apparent value of waiting as long
as possible in the history of an ERC before attempting to measure its
economic impact, it is clear that such efforts should be made well before
termination of NSF ERC Program support. The staff resources and records
necessary to develop impact data, certainly of the quantifiable economic sort,
are unlikely to exist following a center’s graduation.
Second, there probably is no optimum time to attempt to measure ERC
impacts. Each choice has its shortcomings. Given the long time for ERC
economic impacts to be realized in industry, even at the ten-year milestone
comprehensive impact studies are premature. This is especially the case for
ERCs engaged in research on medical technology such as CISST and
GTEC. More feasible and meaningful would be to measure the impact that
center graduates and ideas have had in industry, seeking data that are in
principle verifiable but in most instances will not be quantifiable. As we
demonstrated in the latter phases of this study, it is feasible to document the
impact that center graduates have had on both academia and industry.
Third, the economic (and probably other) impacts of ERCs should not be
compared across ERCs or against ―standard‖ performance measures. Not
only do ERCs differ from one another in formal, readily identifiable ways (e.g.,
size, technical focus, industry support, type of industry involvement, industry
dynamism), they also differ widely in the timing and composition of the
outputs that generate impact. Even the most conscientious and costly data
collection efforts would be unlikely to yield comparable data across centers,
because the accessibility of key data, especially proprietary data, will differ
unpredictably from center to center.

38
Fourth, centers whose technologies target nascent segments of regulated
markets such as medical robotics and tissue engineering are unlikely to
spawn successful start-ups or generate commercially successful products,
even after ten years of existence. The time to market is very long and the
risks confronting start-ups are very high. The CISST and GTEC cases also
suggest that, because many emerging innovations do not result in cost
savings but rather enabled new things to be done that could not have been
done before, the value of a large proportion of ERC outputs cannot be
quantified—at least by applying the consumer surplus model.
And finally, in ERC impact studies, focusing on narrowly-conceived,
quantifiable economic impact data alone should be avoided. To do so
distorts the amount and character of actual impacts, many of which—perhaps
most of which--cannot feasibly be converted to economic terms. The results
of this pilot study suggest that such a narrow focus will greatly underestimate
the impact of ERC-like centers, masking the much broader and, based on our
findings, larger and more significant impacts on society.
Implications for Economic Impact Studies Generally
Although the methods available for capturing accurately the quantitative
national economic impact of ERCs are limited, this is not to say that the
impact measurement tool kit is nearly empty. The problem is that available
methods have stringent requirements for data and context. In principle,
consumer surplus approaches are appropriate for capturing quantitatively the
economic impact of ERC-based innovations that offer cost savings to
purchasers. It would be very expensive, very difficult, and very invasive--but
not impossible--to obtain much of the necessary data from the innovating
firms whose products were derived from ERC licenses or technology. Also,
as far as we are aware, existing methods cannot capture quantitatively the
economic impact of innovations that enable things to be done that could not
be done before--and often do not have obvious cost savings associated with
them. To the extent that many ERC-based innovations are of this type, then
their quantitative impact is probably beyond existing methods. And of course,
focusing narrowly on relatively short-term (less than ten years, say)
quantitative economic impacts will miss perhaps the most significant ERC
economic impacts.
If one wanted to justify the public investments in ERCs using a benefit-cost
(B/C) framework and required that the analysis be limited to quantifiable
economic benefits, then using the "nuggets" approach to capture the top, say,

39
10% of ERC-based innovations that have generated new product sales with
cost savings associated with them would be an appropriate and credible
approach. We have no doubts that the results would show a highly positive
outcome. Of course, getting the data would be expensive, invasive, and
almost certainly yield incomplete results, but in principle the method is
appropriate. But even so this would greatly understate the actual B/C ratio
for reasons illustrated throughout this report.
Following good program evaluation practice, mixed and varied methods and
measures are best equipped to best capture valid estimates of the full range
of ERC impacts, economic and beyond. Broadening the evaluation scope to
include less quantifiable impacts with economic implications, as well as
estimates of impact, is certainly appropriate and, basically, what we did in this
pilot study. We showed that there ways to estimate the economic impact of
ERCs, as well as ways that substantially underestimate and, indeed, distort
the amount and profile of these impacts. We also showed that the time limits
on an ERC’s existence as an NSF-supported organization--ten years--make
it very difficult (but not necessarily impossible) to identify longer term but
sizable impacts 15-20 years after an ERC is initiated and attribute a portion of
those impacts to the ERC.
In sum, there are methodologies available to reveal very useful data and
information related to the economic impact of ERCs and similar programs, if
such methodologies are used appropriately and with necessary caveats.