Embed Size (px)
Citation preview
National and Global Forest Products Market Trends
Matt Bumgardner U.S. Forest Service
Northern Research Station
2014 Ohio SAF Summer Meeting July 15th, 2014
Outline • Domestic Trends Update
• Export and Import Trend Updates
• Continuing influences of globalization on
hardwood markets
• Put it in perspective – What is the “big picture”?
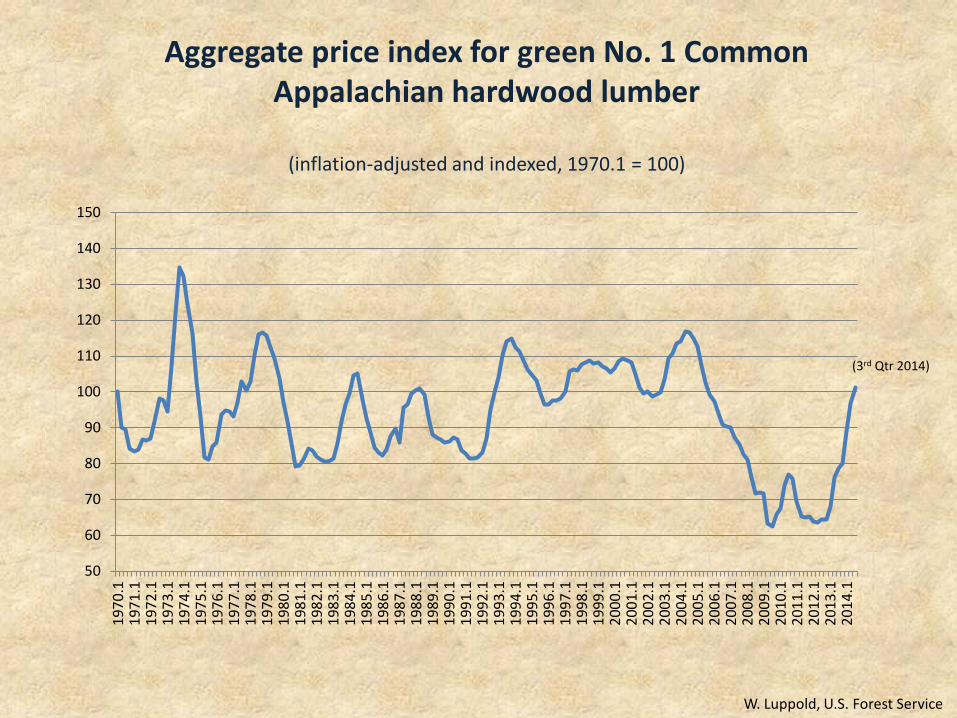
Aggregate price index for green No. 1 Common Appalachian hardwood lumber
(inflation-adjusted and indexed, 1970.1 = 100)
W. Luppold, U.S. Forest Service
50
60
70
80
90
100
110
120
130
140
150
1970
.119
71.1
1972
.119
73.1
1974
.119
75.1
1976
.119
77.1
1978
.119
79.1
1980
.119
81.1
1982
.119
83.1
1984
.119
85.1
1986
.119
87.1
1988
.119
89.1
1990
.119
91.1
1992
.119
93.1
1994
.119
95.1
1996
.119
97.1
1998
.119
99.1
2000
.120
01.1
2002
.120
03.1
2004
.120
05.1
2006
.120
07.1
2008
.120
09.1
2010
.120
11.1
2012
.120
13.1
2014
.1
(3rd Qtr 2014)
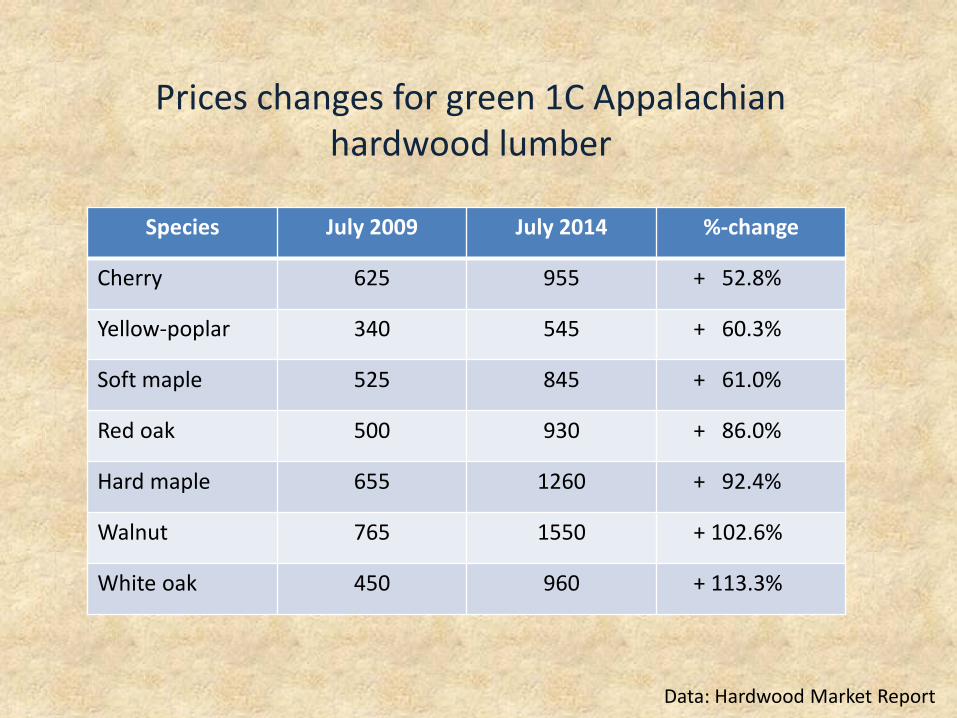
Prices changes for green 1C Appalachian hardwood lumber
Species July 2009 July 2014 %-change
Cherry 625 955 + 52.8%
Yellow-poplar 340 545 + 60.3%
Soft maple 525 845 + 61.0%
Red oak 500 930 + 86.0%
Hard maple 655 1260 + 92.4%
Walnut 765 1550 + 102.6%
White oak 450 960 + 113.3%
Data: Hardwood Market Report
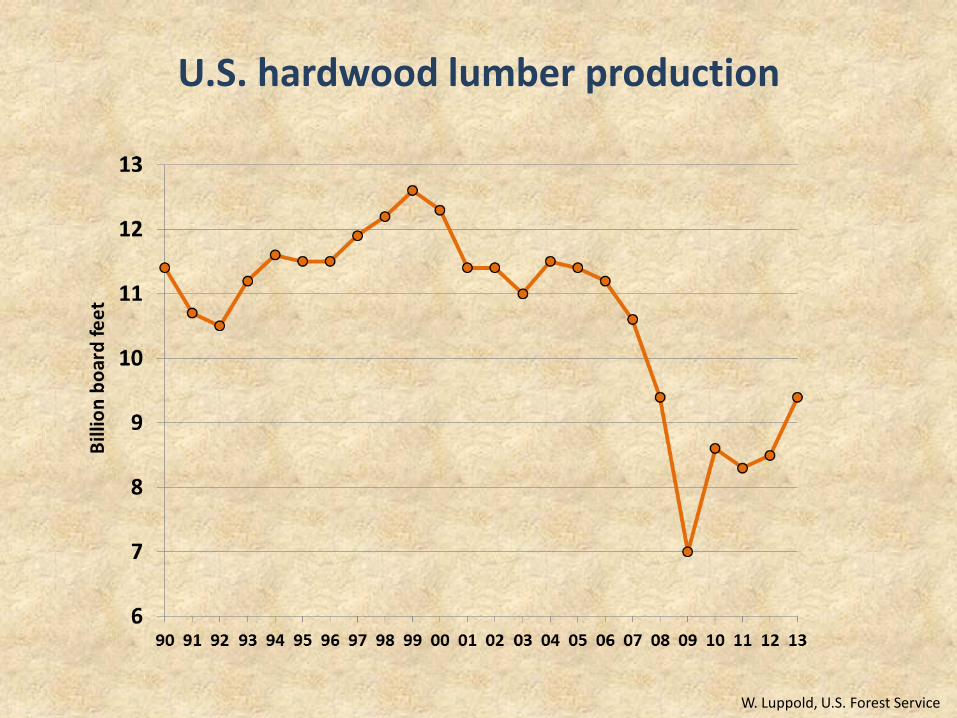
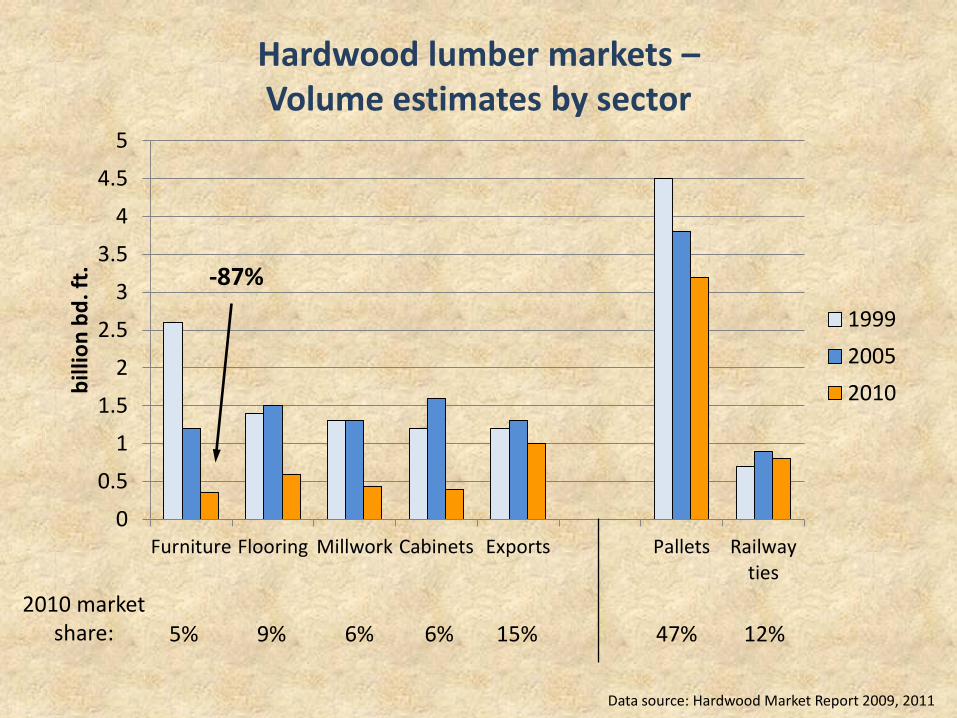
U.S. hardwood lumber production
W. Luppold, U.S. Forest Service
0
0.5
1
1.5
2
2.5
3
3.5
4
4.5
5
Furniture Flooring Millwork Cabinets Exports Pallets Railwayties
billi
on b
d. ft
.
199920052010
Hardwood lumber markets – Volume estimates by sector
-87%
5% 9% 6% 6% 15% 47% 12% 2010 market
share:
Data source: Hardwood Market Report 2009, 2011
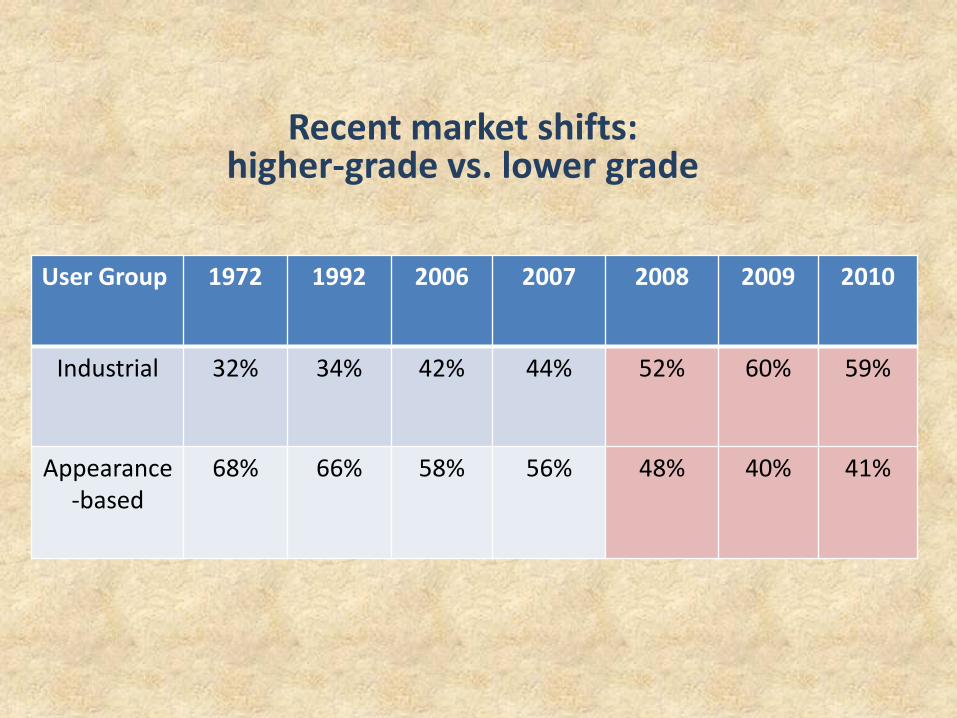
User Group 1972 1992 2006 2007 2008 2009 2010
Industrial 32% 34% 42% 44% 52% 60% 59%
Appearance-based
68% 66% 58% 56% 48% 40% 41%
Recent market shifts: higher-grade vs. lower grade
0%
10%
20%
30%
40%
50%
60%
70%
1992
1993
1994
1995
1996
1997
1998
1999
2000
2001
2002
2003
2004
2005
2006
2007
2008
2009
2010
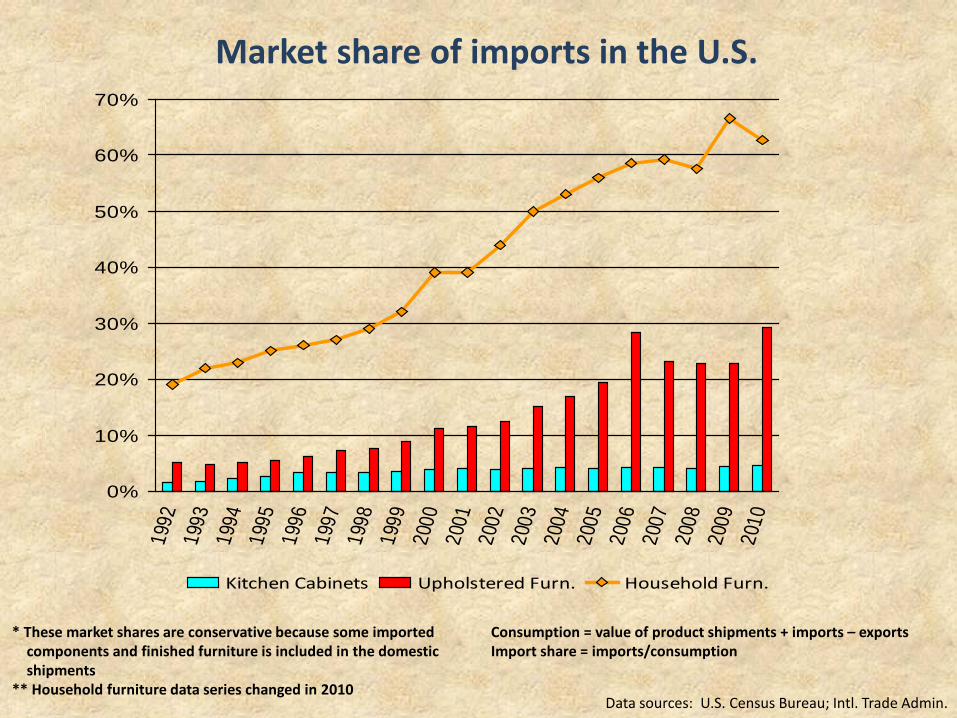
Kitchen Cabinets Upholstered Furn. Household Furn.
* These market shares are conservative because some imported components and finished furniture is included in the domestic shipments ** Household furniture data series changed in 2010
Data sources: U.S. Census Bureau; Intl. Trade Admin.
Market share of imports in the U.S.
Consumption = value of product shipments + imports – exports Import share = imports/consumption
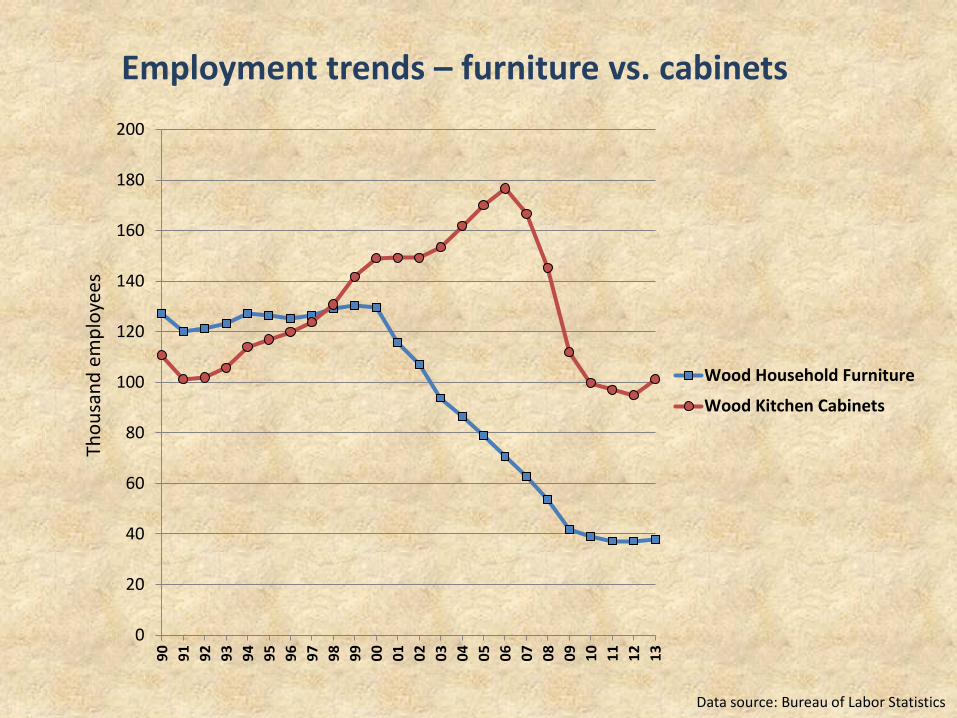
Employment trends – furniture vs. cabinets
Data source: Bureau of Labor Statistics
0
20
40
60
80
100
120
140
160
180
200
90 91 92 93 94 95 96 97 98 99 00 01 02 03 04 05 06 07 08 09 10 11 12 13
Thou
sand
em
ploy
ees
Wood Household Furniture
Wood Kitchen Cabinets
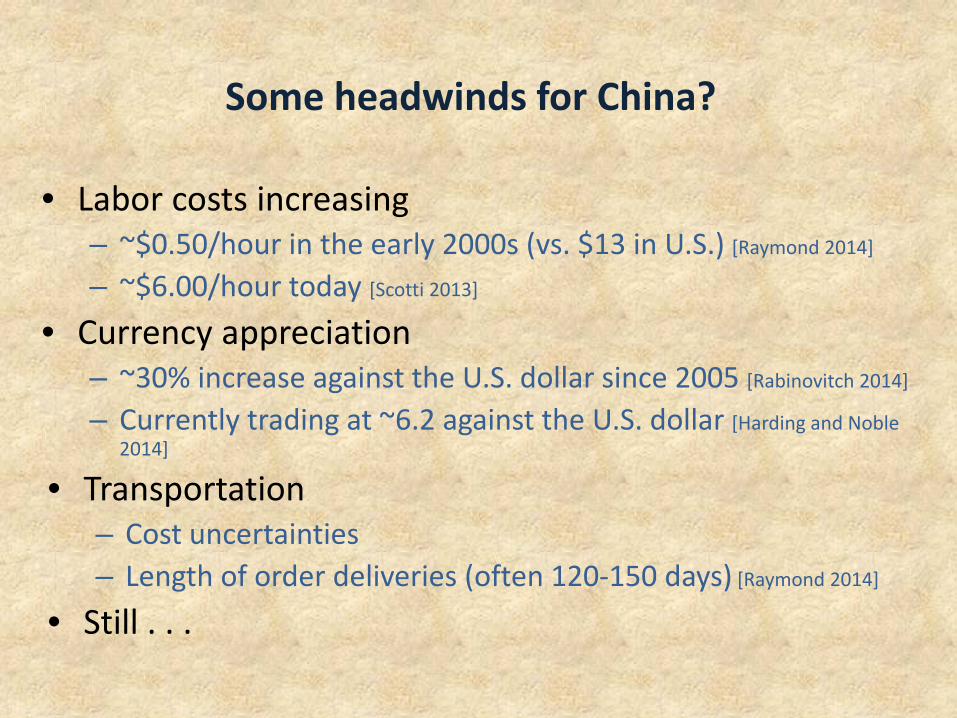
Some headwinds for China?
• Labor costs increasing – ~$0.50/hour in the early 2000s (vs. $13 in U.S.) [Raymond 2014]
– ~$6.00/hour today [Scotti 2013]
• Currency appreciation – ~30% increase against the U.S. dollar since 2005 [Rabinovitch 2014]
– Currently trading at ~6.2 against the U.S. dollar [Harding and Noble 2014]
• Transportation – Cost uncertainties – Length of order deliveries (often 120-150 days) [Raymond 2014]
• Still . . .
0
2
4
6
8
10
12
14
16
18
20
22
24
Billi
on $
China
Vietnam
Canada
Mexico
Total
61%
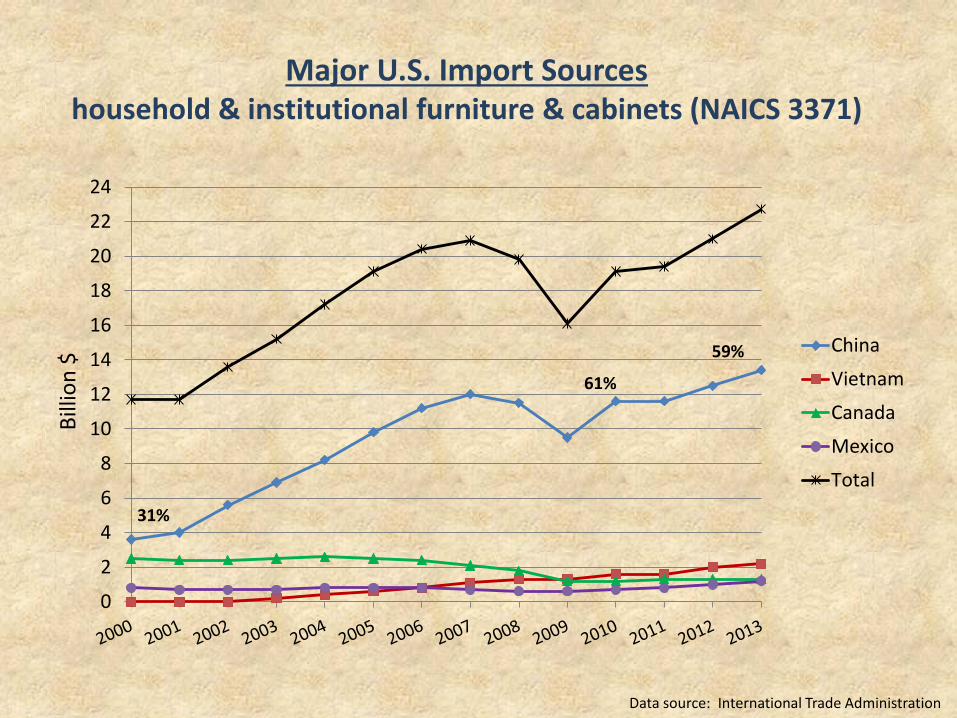
59%
Major U.S. Import Sources
household & institutional furniture & cabinets (NAICS 3371)
Data source: International Trade Administration
31%
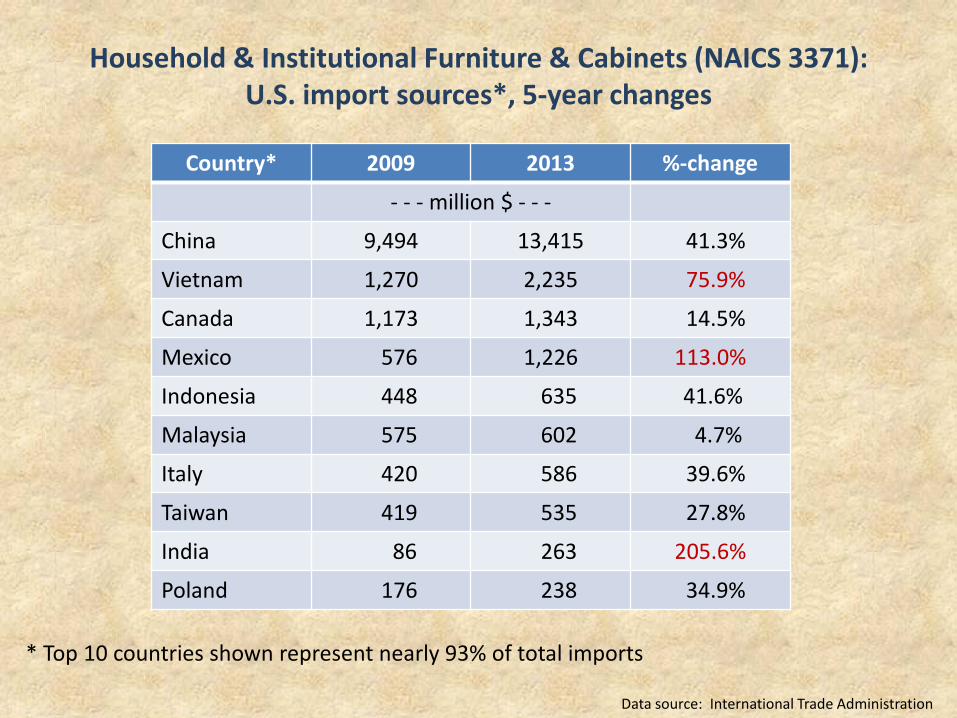
Household & Institutional Furniture & Cabinets (NAICS 3371): U.S. import sources*, 5-year changes
Country* 2009 2013 %-change
- - - million $ - - -
China 9,494 13,415 41.3%
Vietnam 1,270 2,235 75.9%
Canada 1,173 1,343 14.5%
Mexico 576 1,226 113.0%
Indonesia 448 635 41.6%
Malaysia 575 602 4.7%
Italy 420 586 39.6%
Taiwan 419 535 27.8%
India 86 263 205.6%
Poland 176 238 34.9%
* Top 10 countries shown represent nearly 93% of total imports
Data source: International Trade Administration
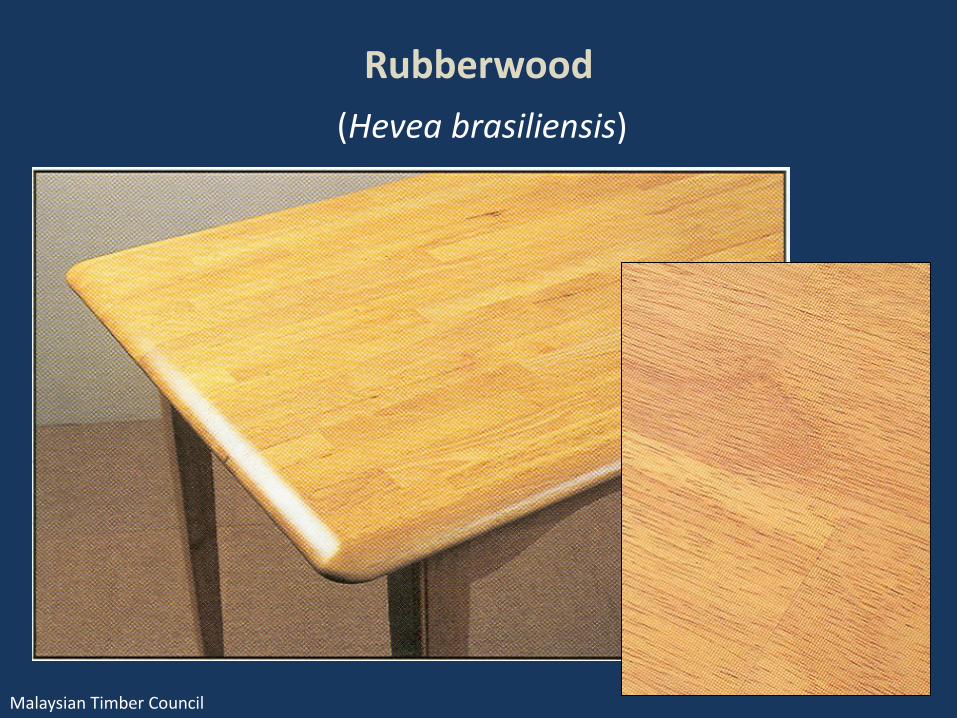
Rubberwood (Hevea brasiliensis)
Malaysian Timber Council
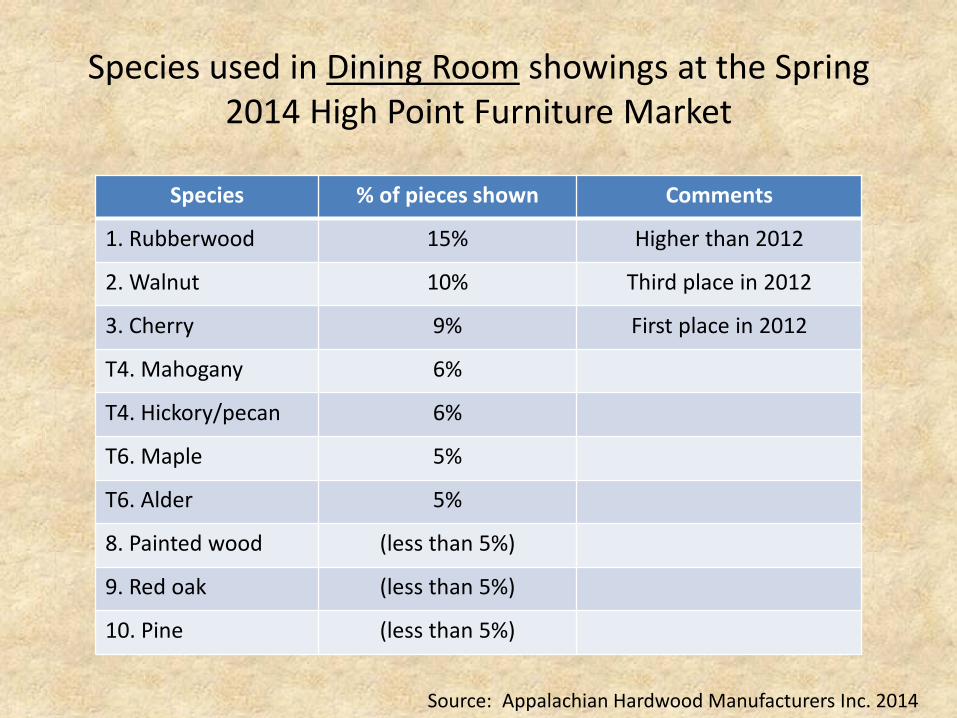
Species used in Dining Room showings at the Spring 2014 High Point Furniture Market
Species % of pieces shown Comments
1. Rubberwood 15% Higher than 2012
2. Walnut 10% Third place in 2012
3. Cherry 9% First place in 2012
T4. Mahogany 6%
T4. Hickory/pecan 6%
T6. Maple 5%
T6. Alder 5%
8. Painted wood (less than 5%)
9. Red oak (less than 5%)
10. Pine (less than 5%)
Source: Appalachian Hardwood Manufacturers Inc. 2014
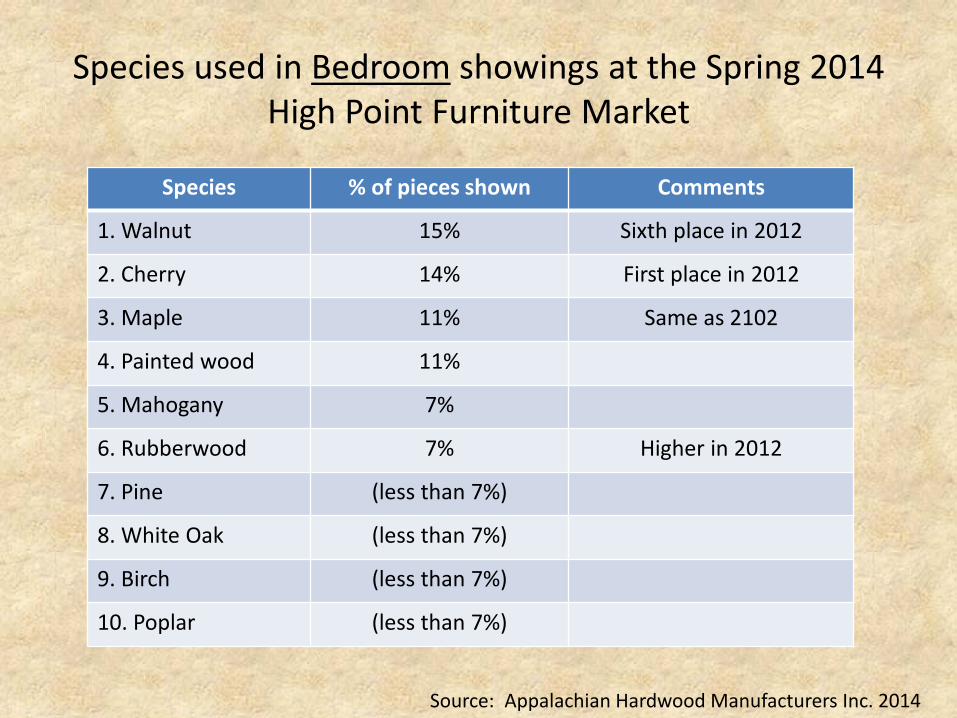
Species used in Bedroom showings at the Spring 2014 High Point Furniture Market
Species % of pieces shown Comments
1. Walnut 15% Sixth place in 2012
2. Cherry 14% First place in 2012
3. Maple 11% Same as 2102
4. Painted wood 11%
5. Mahogany 7%
6. Rubberwood 7% Higher in 2012
7. Pine (less than 7%)
8. White Oak (less than 7%)
9. Birch (less than 7%)
10. Poplar (less than 7%)
Source: Appalachian Hardwood Manufacturers Inc. 2014
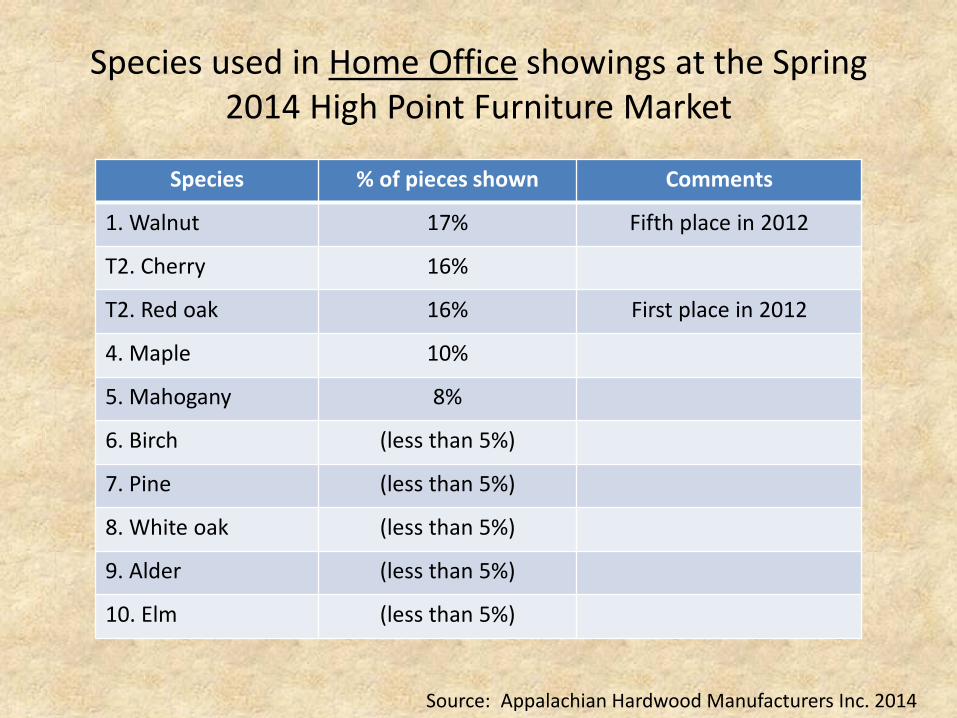
Species used in Home Office showings at the Spring 2014 High Point Furniture Market
Species % of pieces shown Comments
1. Walnut 17% Fifth place in 2012
T2. Cherry 16%
T2. Red oak 16% First place in 2012
4. Maple 10%
5. Mahogany 8%
6. Birch (less than 5%)
7. Pine (less than 5%)
8. White oak (less than 5%)
9. Alder (less than 5%)
10. Elm (less than 5%)
Source: Appalachian Hardwood Manufacturers Inc. 2014
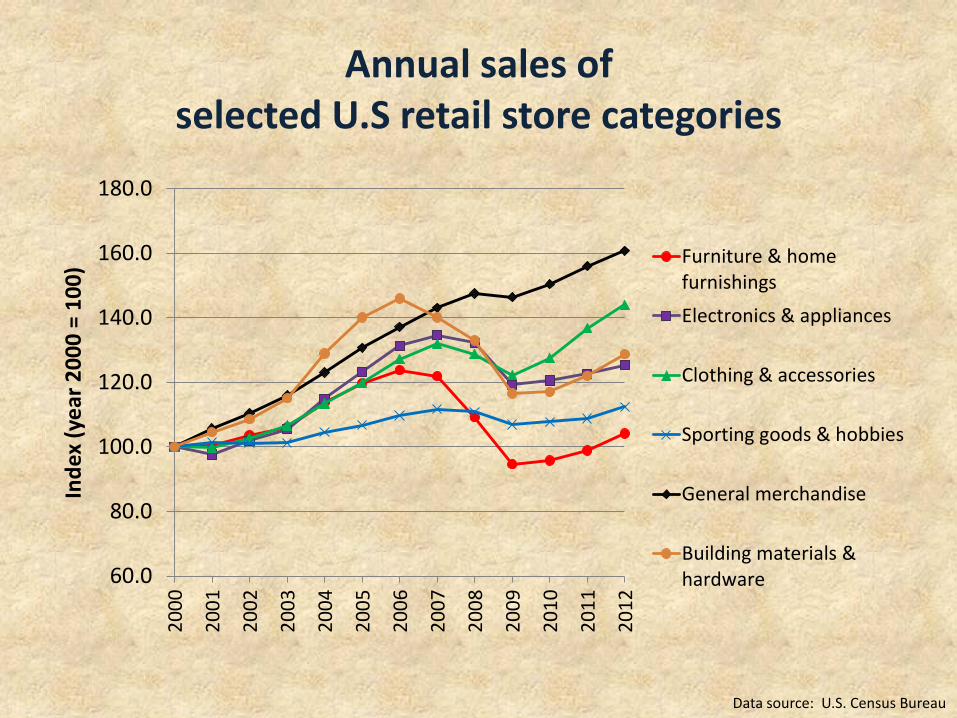
Annual sales of selected U.S retail store categories
60.0
80.0
100.0
120.0
140.0
160.0
180.020
00
2001
2002
2003
2004
2005
2006
2007
2008
2009
2010
2011
2012
Inde
x (y
ear 2
000
= 10
0) Furniture & home
furnishingsElectronics & appliances
Clothing & accessories
Sporting goods & hobbies
General merchandise
Building materials &hardware
Data source: U.S. Census Bureau
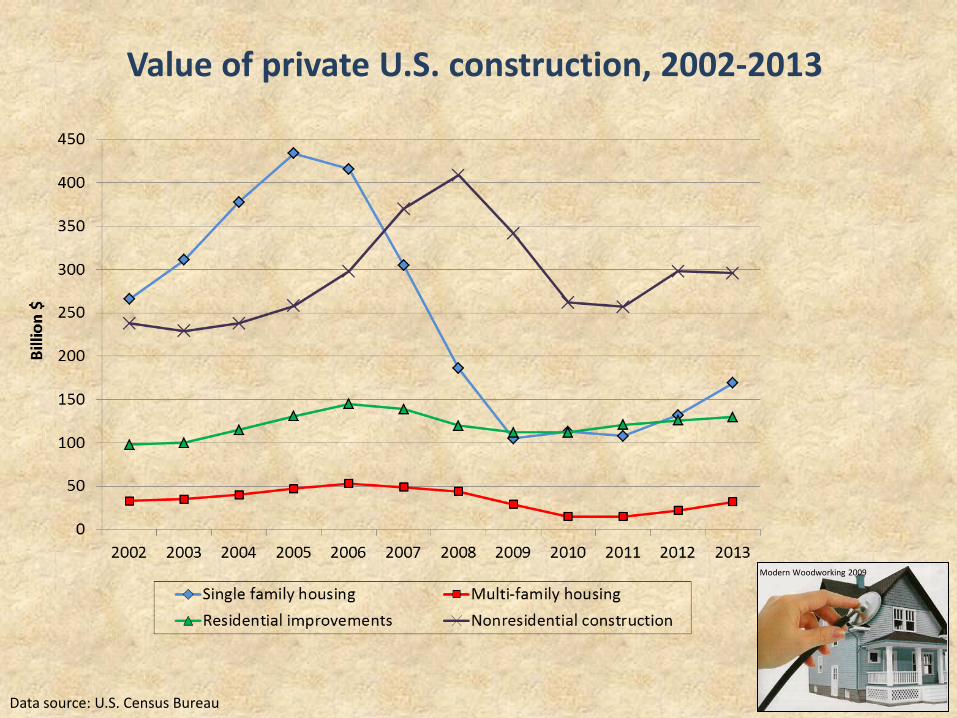
Value of private U.S. construction, 2002-2013
Data source: U.S. Census Bureau
Modern Woodworking 2009
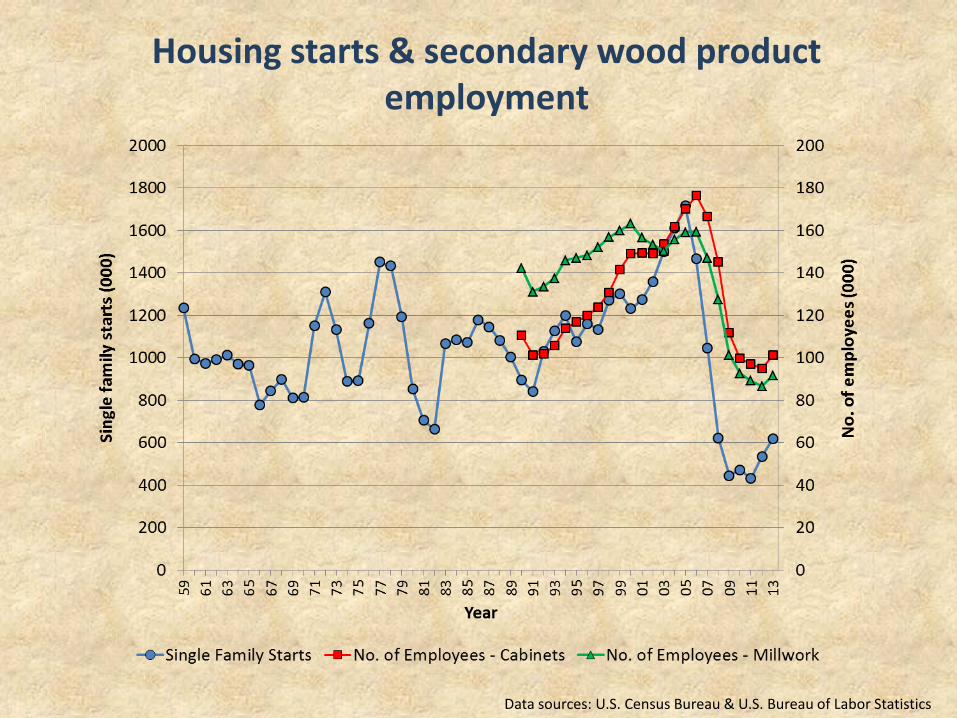
Housing starts & secondary wood product employment
Data sources: U.S. Census Bureau & U.S. Bureau of Labor Statistics
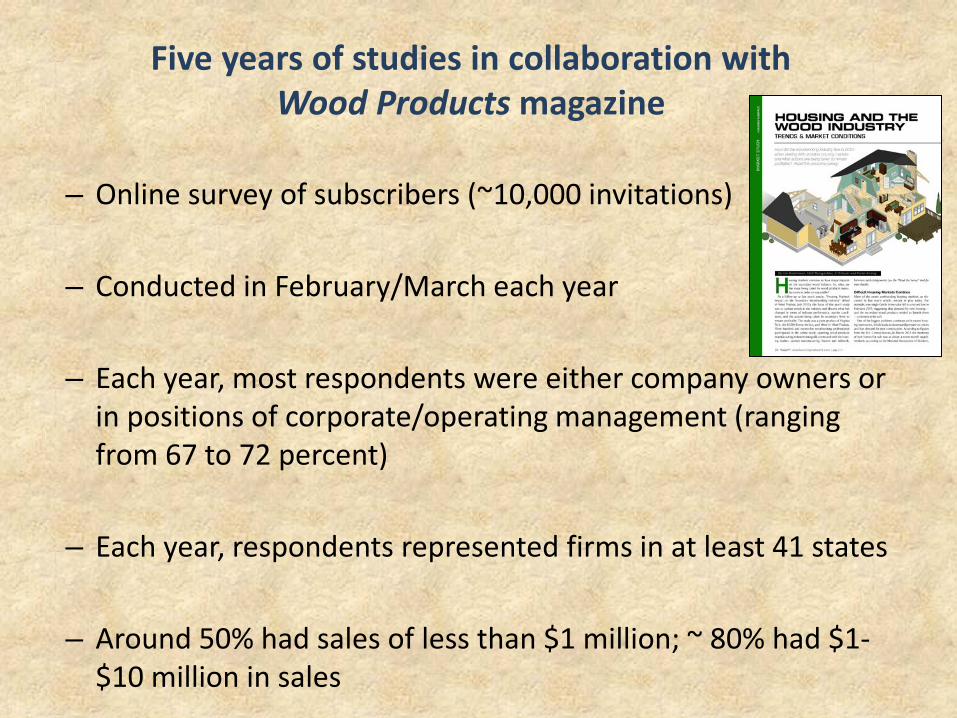
Five years of studies in collaboration with Wood Products magazine
– Online survey of subscribers (~10,000 invitations)
– Conducted in February/March each year
– Each year, most respondents were either company owners or in positions of corporate/operating management (ranging from 67 to 72 percent)
– Each year, respondents represented firms in at least 41 states
– Around 50% had sales of less than $1 million; ~ 80% had $1-$10 million in sales
0
10
20
30
40
50
60
70
Muchworse
Somewhatworse
Slightlyworse
Slightlybetter
Somewhatbetter
Muchbetter
Unchanged
Perc
ent
2009 2010 2011 2012 2013
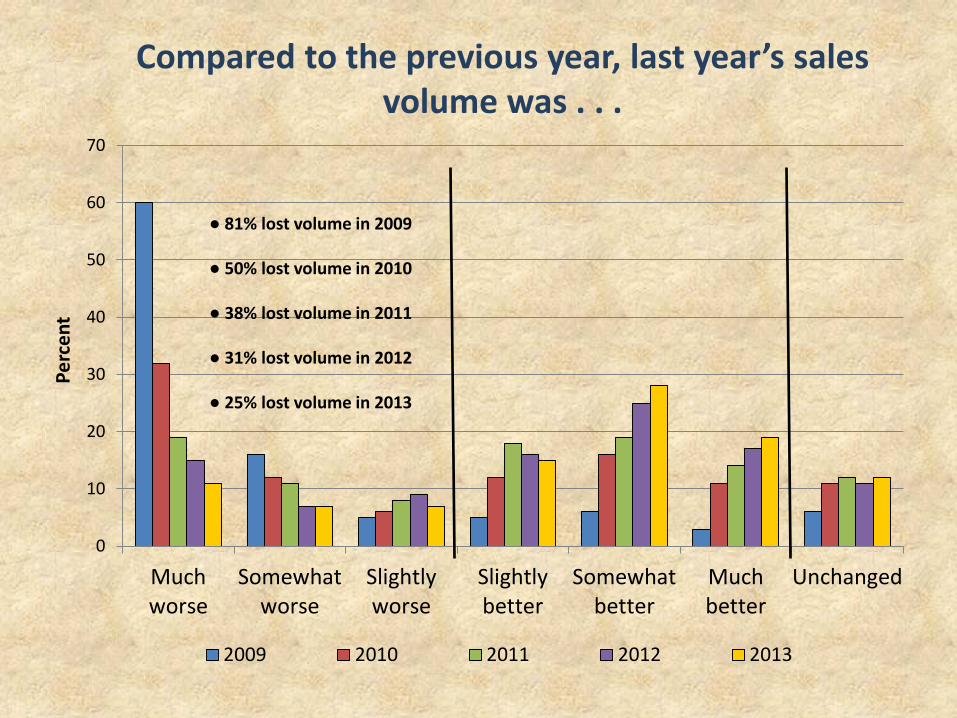
Compared to the previous year, last year’s sales volume was . . .
● 81% lost volume in 2009 ● 50% lost volume in 2010 ● 38% lost volume in 2011 ● 31% lost volume in 2012 ● 25% lost volume in 2013
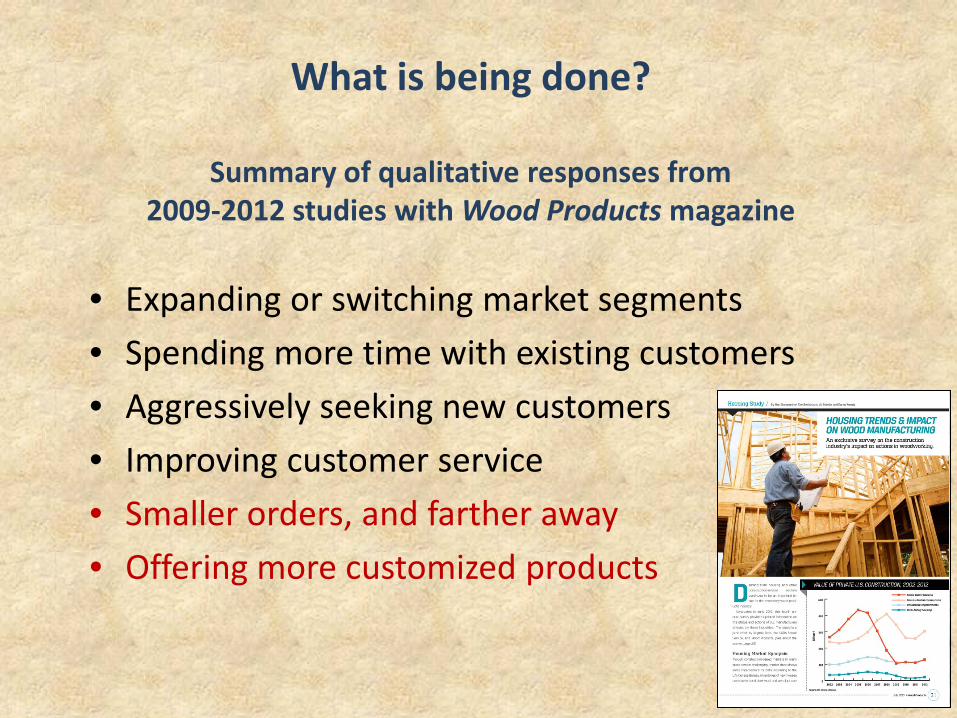
What is being done?
Summary of qualitative responses from 2009-2012 studies with Wood Products magazine
• Expanding or switching market segments • Spending more time with existing customers • Aggressively seeking new customers • Improving customer service • Smaller orders, and farther away • Offering more customized products
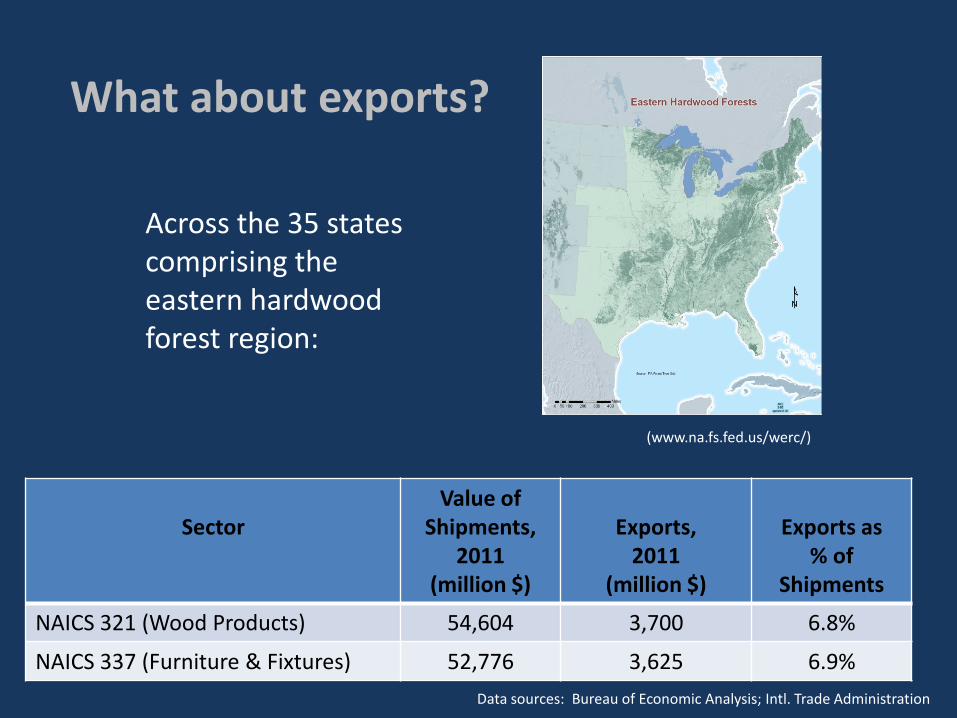
What about exports?
Across the 35 states comprising the eastern hardwood forest region:
Sector
Value of Shipments,
2011 (million $)
Exports,
2011 (million $)
Exports as
% of Shipments
NAICS 321 (Wood Products) 54,604 3,700 6.8%
NAICS 337 (Furniture & Fixtures) 52,776 3,625 6.9%
(www.na.fs.fed.us/werc/)
Data sources: Bureau of Economic Analysis; Intl. Trade Administration
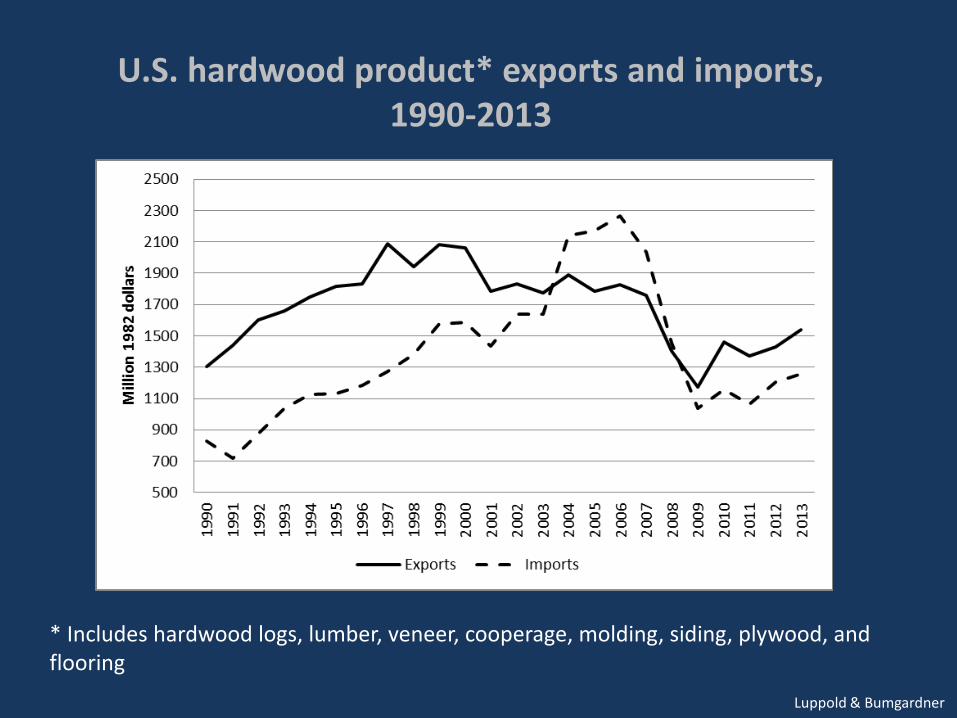
U.S. hardwood product* exports and imports, 1990-2013
* Includes hardwood logs, lumber, veneer, cooperage, molding, siding, plywood, and flooring
Luppold & Bumgardner
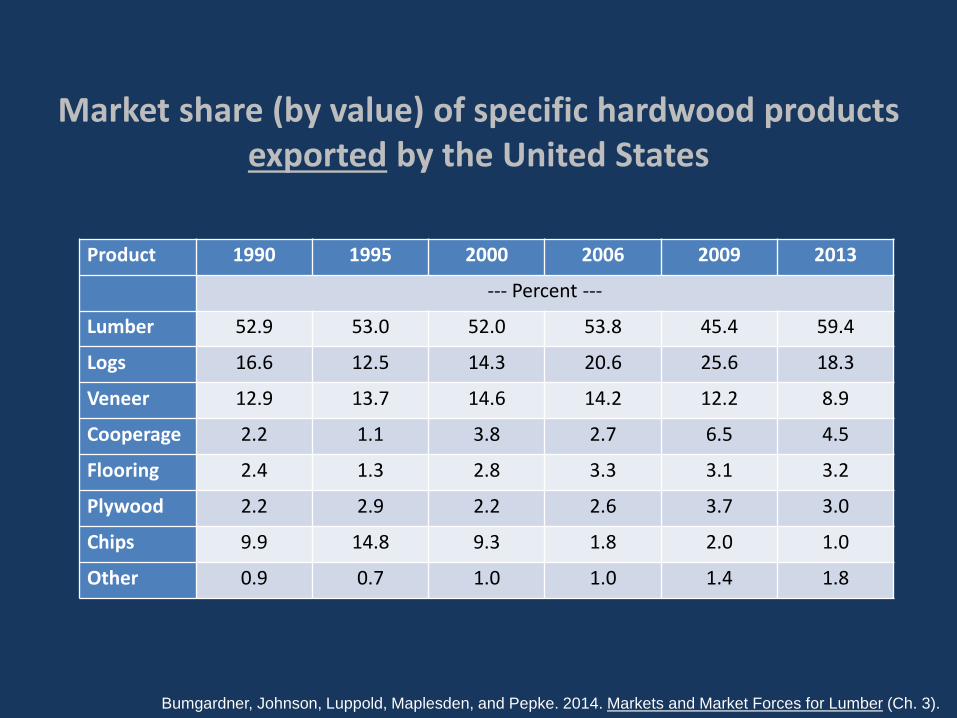
Market share (by value) of specific hardwood products exported by the United States
Product 1990 1995 2000 2006 2009 2013
--- Percent ---
Lumber 52.9 53.0 52.0 53.8 45.4 59.4
Logs 16.6 12.5 14.3 20.6 25.6 18.3
Veneer 12.9 13.7 14.6 14.2 12.2 8.9
Cooperage 2.2 1.1 3.8 2.7 6.5 4.5
Flooring 2.4 1.3 2.8 3.3 3.1 3.2
Plywood 2.2 2.9 2.2 2.6 3.7 3.0
Chips 9.9 14.8 9.3 1.8 2.0 1.0
Other 0.9 0.7 1.0 1.0 1.4 1.8
Bumgardner, Johnson, Luppold, Maplesden, and Pepke. 2014. Markets and Market Forces for Lumber (Ch. 3).
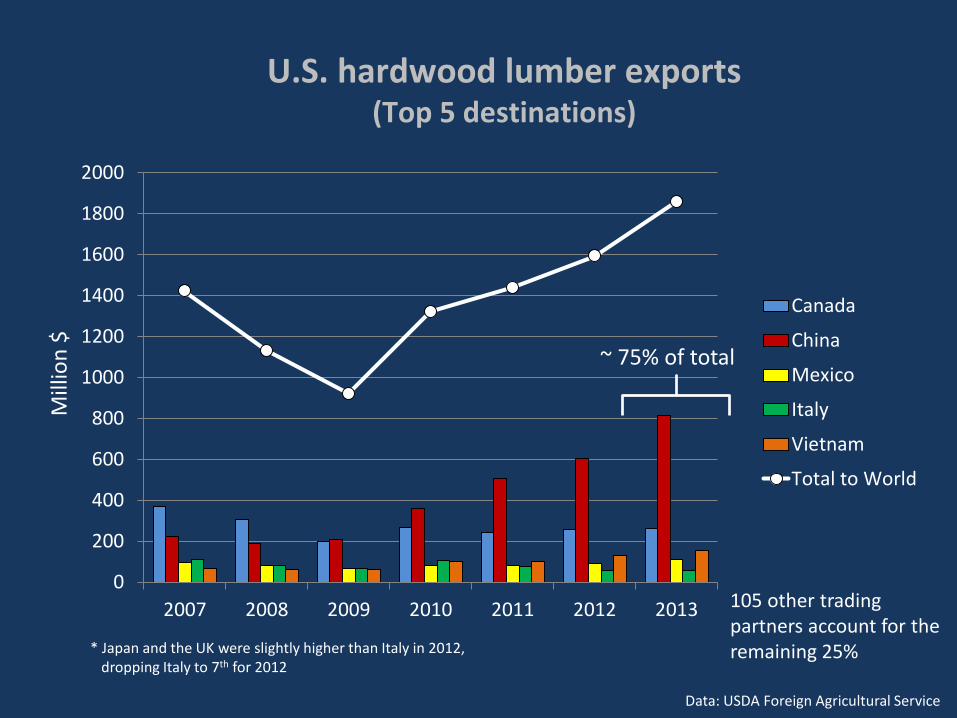
U.S. hardwood lumber exports (Top 5 destinations)
0
200
400
600
800
1000
1200
1400
1600
1800
2000
2007 2008 2009 2010 2011 2012 2013
Mill
ion
$
Canada
China
Mexico
Italy
Vietnam
Total to World
~ 75% of total
105 other trading partners account for the remaining 25% * Japan and the UK were slightly higher than Italy in 2012,
dropping Italy to 7th for 2012
Data: USDA Foreign Agricultural Service
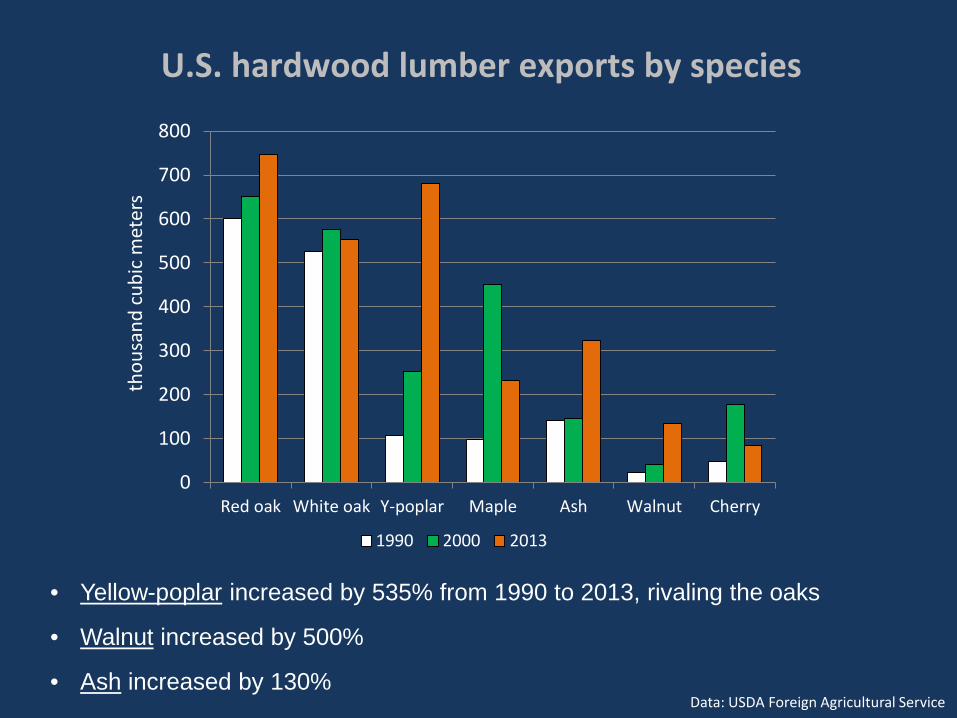
U.S. hardwood lumber exports by species
• Yellow-poplar increased by 535% from 1990 to 2013, rivaling the oaks
• Walnut increased by 500%
• Ash increased by 130% Data: USDA Foreign Agricultural Service
0
100
200
300
400
500
600
700
800
Red oak White oak Y-poplar Maple Ash Walnut Cherry
thou
sand
cub
ic m
eter
s
1990 2000 2013
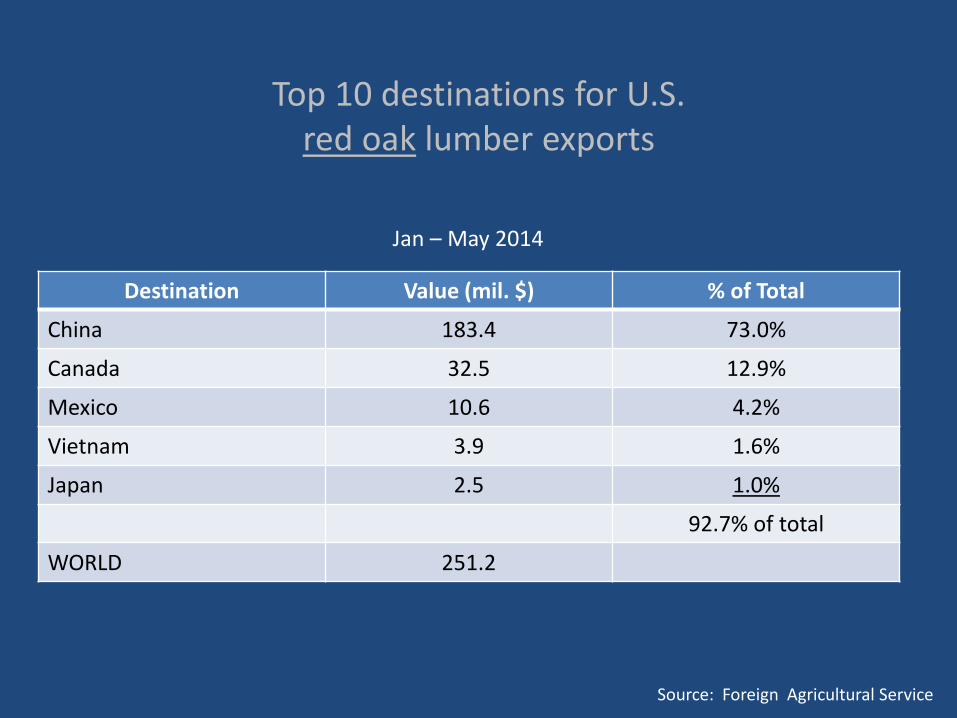
Top 10 destinations for U.S. red oak lumber exports
Destination Value (mil. $) % of Total
China 183.4 73.0%
Canada 32.5 12.9%
Mexico 10.6 4.2%
Vietnam 3.9 1.6%
Japan 2.5 1.0%
92.7% of total
WORLD 251.2
Jan – May 2014
Source: Foreign Agricultural Service
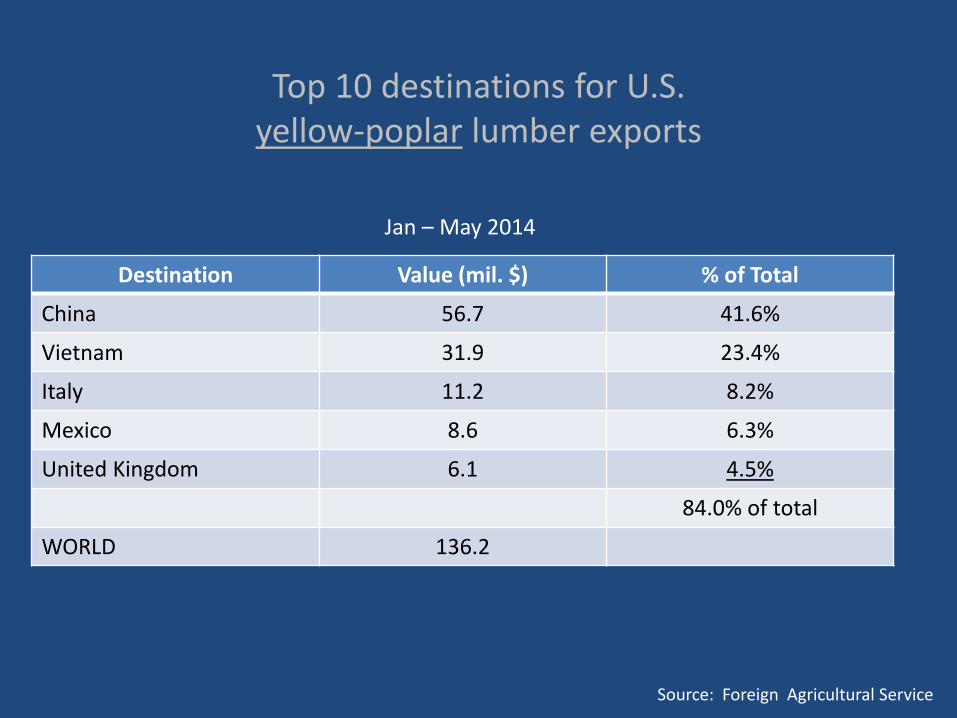
Top 10 destinations for U.S. yellow-poplar lumber exports
Destination Value (mil. $) % of Total
China 56.7 41.6%
Vietnam 31.9 23.4%
Italy 11.2 8.2%
Mexico 8.6 6.3%
United Kingdom 6.1 4.5%
84.0% of total
WORLD 136.2
Jan – May 2014
Source: Foreign Agricultural Service
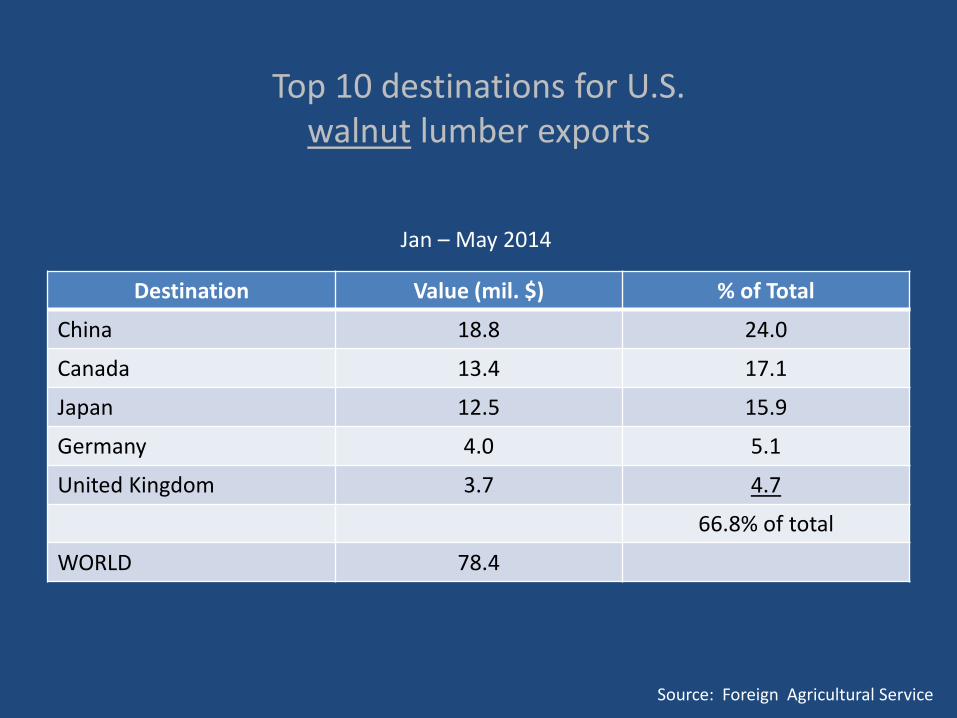
Top 10 destinations for U.S. walnut lumber exports
Destination Value (mil. $) % of Total
China 18.8 24.0
Canada 13.4 17.1
Japan 12.5 15.9
Germany 4.0 5.1
United Kingdom 3.7 4.7
66.8% of total
WORLD 78.4
Jan – May 2014
Source: Foreign Agricultural Service
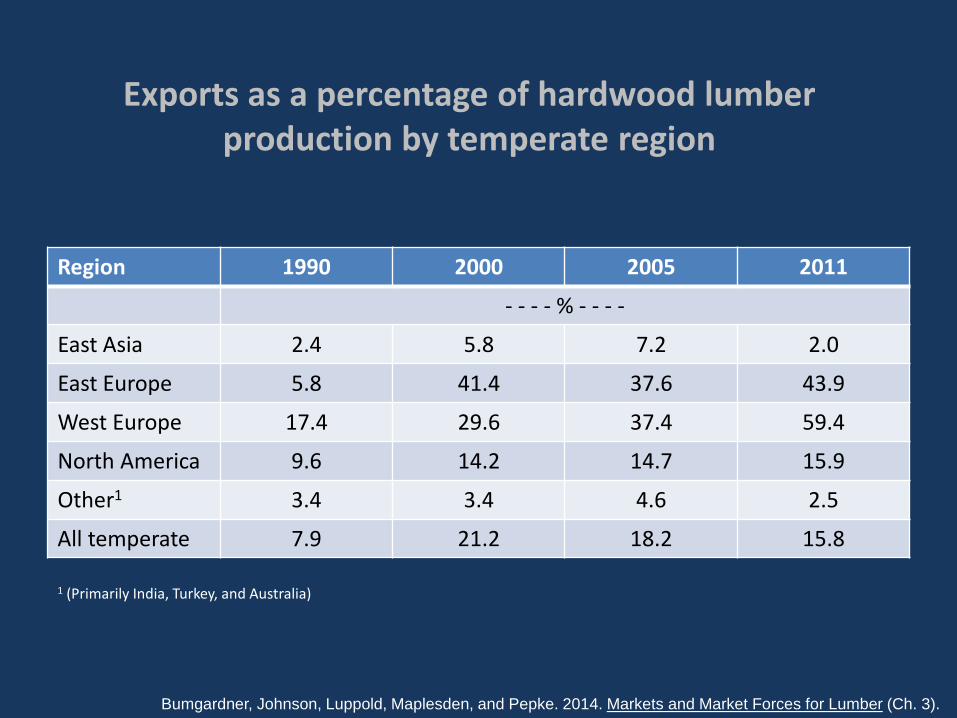
Exports as a percentage of hardwood lumber production by temperate region
Region 1990 2000 2005 2011
- - - - % - - - -
East Asia 2.4 5.8 7.2 2.0
East Europe 5.8 41.4 37.6 43.9
West Europe 17.4 29.6 37.4 59.4
North America 9.6 14.2 14.7 15.9
Other1 3.4 3.4 4.6 2.5
All temperate 7.9 21.2 18.2 15.8
1 (Primarily India, Turkey, and Australia)
Bumgardner, Johnson, Luppold, Maplesden, and Pepke. 2014. Markets and Market Forces for Lumber (Ch. 3).
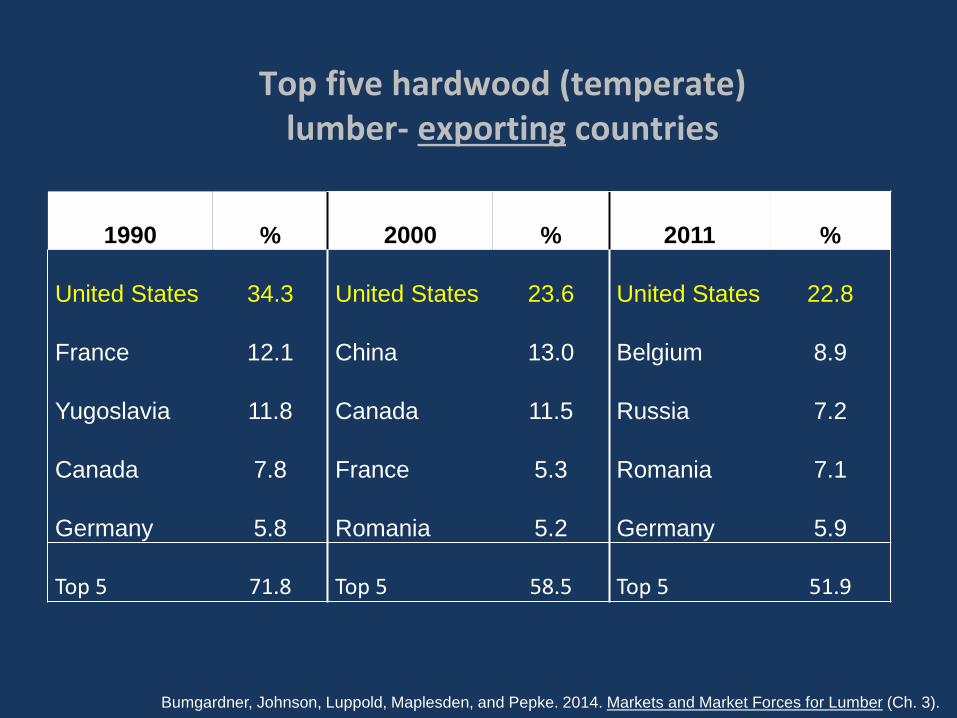
Top five hardwood (temperate) lumber- exporting countries
1990
%
2000
%
2011
%
United States
34.3
United States
23.6
United States
22.8
France
12.1
China
13.0
Belgium
8.9
Yugoslavia
11.8
Canada
11.5
Russia
7.2
Canada
7.8
France
5.3
Romania
7.1
Germany
5.8
Romania
5.2
Germany
5.9
Top 5
71.8
Top 5
58.5
Top 5
51.9
Bumgardner, Johnson, Luppold, Maplesden, and Pepke. 2014. Markets and Market Forces for Lumber (Ch. 3).
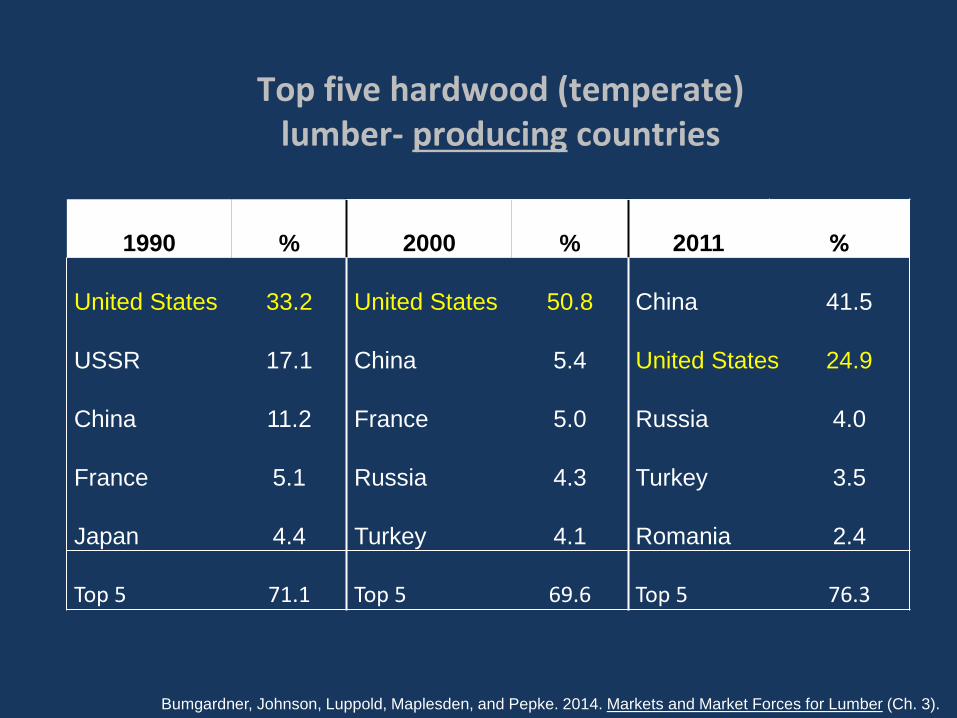
Top five hardwood (temperate) lumber- producing countries
1990
%
2000
%
2011
%
United States
33.2
United States
50.8
China
41.5
USSR
17.1
China
5.4
United States
24.9
China
11.2
France
5.0
Russia
4.0
France
5.1
Russia
4.3
Turkey
3.5
Japan
4.4
Turkey
4.1
Romania
2.4
Top 5
71.1
Top 5
69.6
Top 5
76.3
Bumgardner, Johnson, Luppold, Maplesden, and Pepke. 2014. Markets and Market Forces for Lumber (Ch. 3).
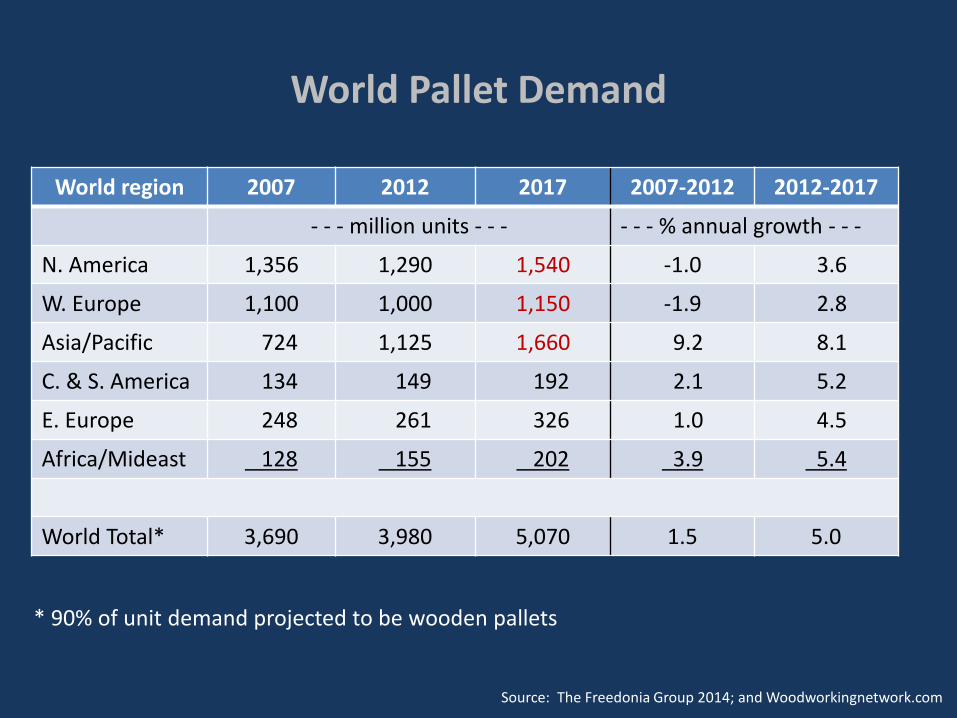
World Pallet Demand
World region 2007 2012 2017 2007-2012 2012-2017
- - - million units - - - - - - % annual growth - - -
N. America 1,356 1,290 1,540 -1.0 3.6
W. Europe 1,100 1,000 1,150 -1.9 2.8
Asia/Pacific 724 1,125 1,660 9.2 8.1
C. & S. America 134 149 192 2.1 5.2
E. Europe 248 261 326 1.0 4.5
Africa/Mideast 128 155 202 3.9 5.4
World Total* 3,690 3,980 5,070 1.5 5.0
Source: The Freedonia Group 2014; and Woodworkingnetwork.com
* 90% of unit demand projected to be wooden pallets
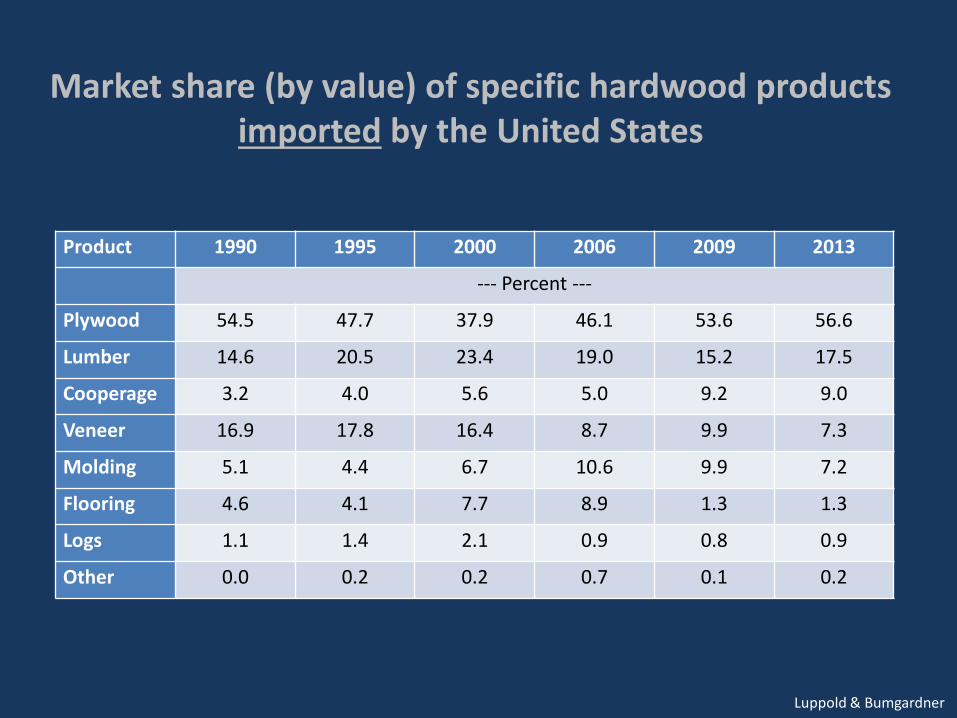
Market share (by value) of specific hardwood products imported by the United States
Product 1990 1995 2000 2006 2009 2013
--- Percent ---
Plywood 54.5 47.7 37.9 46.1 53.6 56.6
Lumber 14.6 20.5 23.4 19.0 15.2 17.5
Cooperage 3.2 4.0 5.6 5.0 9.2 9.0
Veneer 16.9 17.8 16.4 8.7 9.9 7.3
Molding 5.1 4.4 6.7 10.6 9.9 7.2
Flooring 4.6 4.1 7.7 8.9 1.3 1.3
Logs 1.1 1.4 2.1 0.9 0.8 0.9
Other 0.0 0.2 0.2 0.7 0.1 0.2
Luppold & Bumgardner
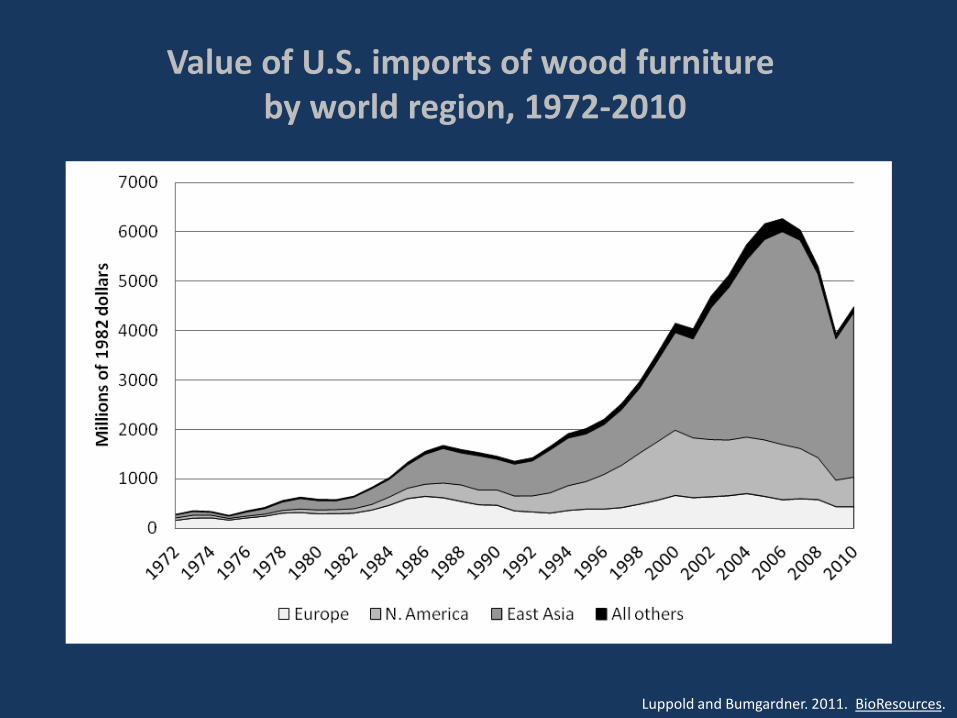
Value of U.S. imports of wood furniture by world region, 1972-2010
Luppold and Bumgardner. 2011. BioResources.
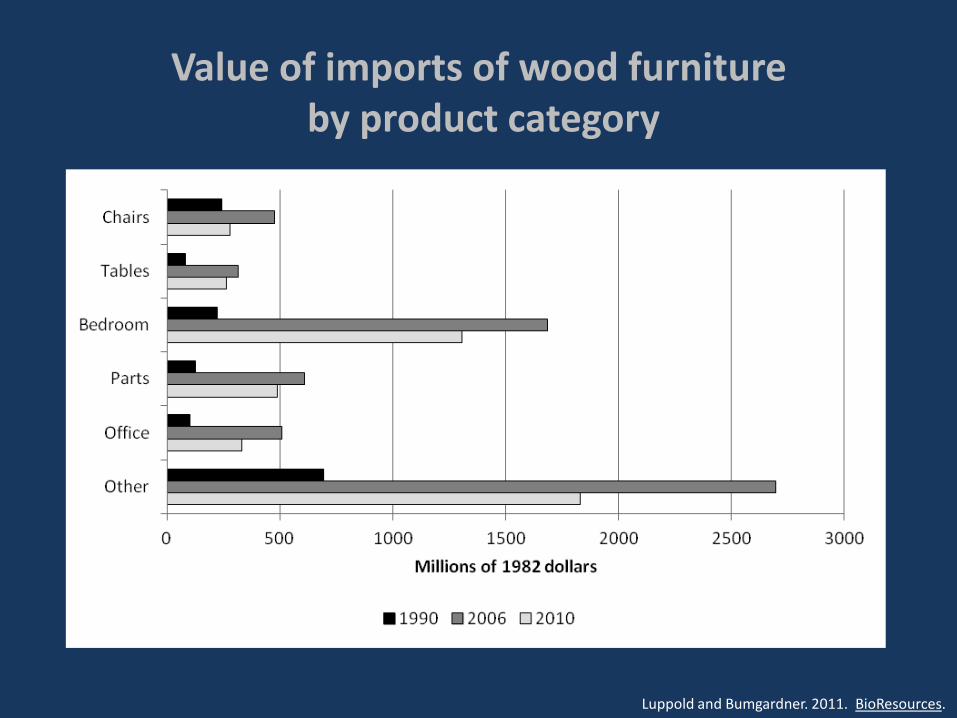
Value of imports of wood furniture by product category
Luppold and Bumgardner. 2011. BioResources.
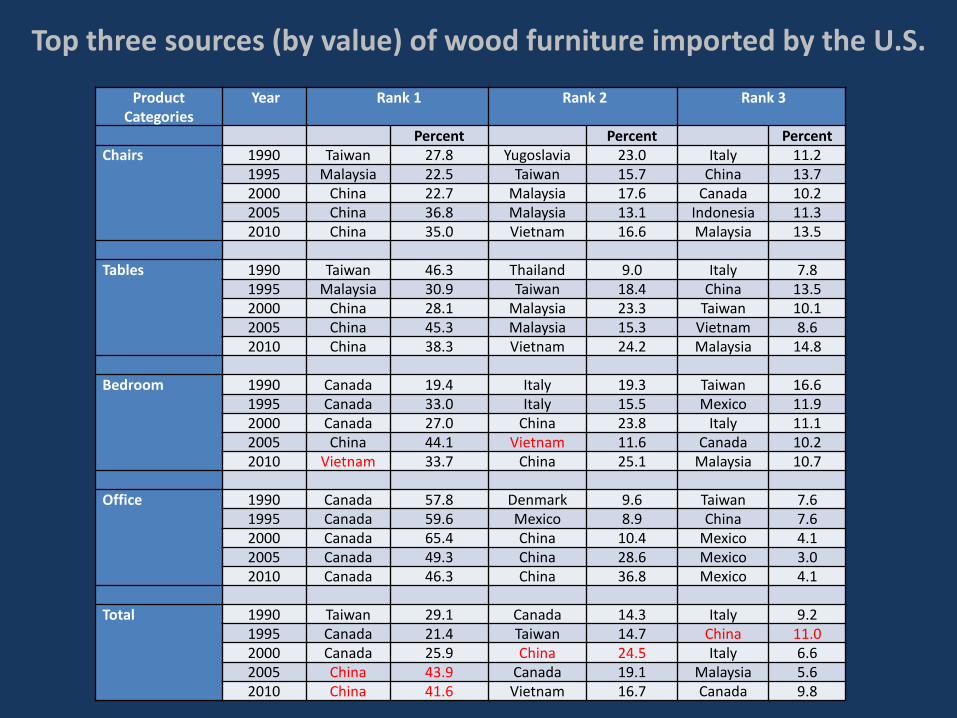
Top three sources (by value) of wood furniture imported by the U.S.
Product Categories
Year Rank 1 Rank 2 Rank 3
Percent Percent Percent Chairs 1990 Taiwan 27.8 Yugoslavia 23.0 Italy 11.2
1995 Malaysia 22.5 Taiwan 15.7 China 13.7 2000 China 22.7 Malaysia 17.6 Canada 10.2 2005 China 36.8 Malaysia 13.1 Indonesia 11.3 2010 China 35.0 Vietnam 16.6 Malaysia 13.5
Tables 1990 Taiwan 46.3 Thailand 9.0 Italy 7.8
1995 Malaysia 30.9 Taiwan 18.4 China 13.5 2000 China 28.1 Malaysia 23.3 Taiwan 10.1 2005 China 45.3 Malaysia 15.3 Vietnam 8.6 2010 China 38.3 Vietnam 24.2 Malaysia 14.8
Bedroom 1990 Canada 19.4 Italy 19.3 Taiwan 16.6
1995 Canada 33.0 Italy 15.5 Mexico 11.9 2000 Canada 27.0 China 23.8 Italy 11.1 2005 China 44.1 Vietnam 11.6 Canada 10.2 2010 Vietnam 33.7 China 25.1 Malaysia 10.7
Office 1990 Canada 57.8 Denmark 9.6 Taiwan 7.6 1995 Canada 59.6 Mexico 8.9 China 7.6 2000 Canada 65.4 China 10.4 Mexico 4.1 2005 Canada 49.3 China 28.6 Mexico 3.0 2010 Canada 46.3 China 36.8 Mexico 4.1
Total 1990 Taiwan 29.1 Canada 14.3 Italy 9.2
1995 Canada 21.4 Taiwan 14.7 China 11.0 2000 Canada 25.9 China 24.5 Italy 6.6 2005 China 43.9 Canada 19.1 Malaysia 5.6 2010 China 41.6 Vietnam 16.7 Canada 9.8
Summary • U.S. cabinet manufacturing remains globally
competitive but closely tied to housing markets • U.S. hardwood lumber exports remain strong
(especially to Asia) • U.S. maintaining a positive hardwood trade balance
(excluding furniture) • U.S. furniture imports continue to increase (especially
from China) relative to production • Hardwood lumber production increasing rapidly in
China

Questions?