Embed Size (px)
Citation preview

National Airspace System Capital Investment PlanFY 2013–2017
2011-AJG • Produced by ATO Communications

(Page Intentionally Left Blank)
i
1 INTRODUCTION ................................................................................... 1
1.1 The Capital Investment Plan ............................................................................................1
1.2 Strategic Planning and the CIP ........................................................................................1
1.3 Management Process for Selecting Modernization Programs .......................................2
1.4 Important Factors Affecting Planning for the Future....................................................4 1.4.1 Economic Considerations ...........................................................................................4 1.4.2 Air Travel Demand .....................................................................................................5 1.4.3 Growth in Operations ..................................................................................................7
2 KEY CONSIDERATIONS IN CAPITAL PLANNING ............................ 8
2.1 Sustaining Current System Performance ........................................................................8
2.2 NextGen Investments .........................................................................................................8
3 NEXT GENERATION AIR TRANSPORTATION SYSTEM (NEXTGEN)10
3.1 Initiate Trajectory Based Operations ............................................................................11
3.2 Increase Arrivals and Departures at High Density Airports .......................................15
3.3 Increase Flexibility in the Terminal Environment .......................................................18
3.4 Improve Collaborative Air Traffic Management (CATM) .........................................22
3.5 Reduce Weather Impact: ................................................................................................25
3.6 Increase Safety, Security, and Environmental Performance .......................................27
3.7 Transform Facilities .........................................................................................................32
4 ENTERPRISE ARCHITECTURE ROADMAPS .................................. 35
4.1 Automation Roadmap .....................................................................................................36
4.2 Communications Roadmaps ...........................................................................................43
4.3 Surveillance ......................................................................................................................49
4.4 Navigation Roadmaps ......................................................................................................54
4.5 Weather Systems ..............................................................................................................59
ii
4.6 Facilities ............................................................................................................................65
4.7 Support Contracts and Automated Management Tools and Processes ......................66
5 CONCLUSION .................................................................................... 68
6 APPENDICES ..................................................................................... 69
Appendix A Relationship of Programs to Strategic Plan Goals………...................................A-1 Appendix B Detailed Program Plan Data……………………………...…………...………...B-1 Appendix C Estimated Expenditures by Budget Line Item...……………...………………...C-1 Appendix D Response to GAO Report..……………………………………………………..D-1 Appendix E Acronyms and Abbreviations……………………...….…...…....……................E-1
Figure 1 Aviation Percent of State Gross Domestic Product ....................................................5 Figure 2 Air Travel Demand Growth Compared to Growth in GDP ........................................6 Figure 3 NextGen Portfolio Relative to the Total Capital Request ...........................................9 Figure 4 Service Roadmap Legend .........................................................................................11 Figure 5 Trajectory Based Operations (1) ...............................................................................12 Figure 6 Trajectory Based Operations (2) ...............................................................................14 Figure 7 Increase Arrivals/Departures at High Density Airports ............................................16 Figure 8 Increase Flexibility in the Terminal Environment (1) ..............................................19 Figure 9 Increase Flexibility in the Terminal Environment (2) ..............................................21 Figure 10 Improve Collaborative ATM ....................................................................................23 Figure 11 Reduce Weather Impact ............................................................................................26 Figure 12 Increase Safety ..........................................................................................................28 Figure 13 Improve Security .......................................................................................................30 Figure 14 Improve Environmental Performance .......................................................................31 Figure 15 Transform Facilities ..................................................................................................33 Figure 16 Roadmap Legend ......................................................................................................36 Figure 17 Automation Roadmap (1 of 2) ..................................................................................37 Figure 18 Automation Roadmap (2 of 2) ..................................................................................40 Figure 19 Expenditures in the Automation Functional Area ....................................................42 Figure 20 Communications Roadmap (1 of 4) ..........................................................................43 Figure 21 Communications Roadmap (2 of 4) ..........................................................................45 Figure 22 Communications Roadmap (3 of 4) ..........................................................................47 Figure 23 Communications Roadmap (4 of 4) ..........................................................................48 Figure 24 Expenditures in the Communications Functional Area ............................................49 Figure 25 Surveillance Roadmap (1 of 2) .................................................................................50 Figure 26 Surveillance Roadmap (2 of 2) .................................................................................51 Figure 27 Expenditures in the Surveillance Functional Area ....................................................53 Figure 28 Navigation Roadmap (1 of 2) ...................................................................................55 Figure 29 Navigation Roadmap (2 of 2) ...................................................................................57 Figure 30 Expenditures in the Navigation Functional Area ......................................................59 Figure 31 Weather Sensor Roadmap .........................................................................................60

iii
Figure 32 Weather Dissemination, Processing, and Display Roadmap ....................................62 Figure 33 Expenditures in the Weather Functional Area ..........................................................64 Figure 34 Expenditures in the Facilities Functional Area .........................................................66 Figure 35 Expenditures in the Mission Support Functional Area .............................................67

(Page Intentionally Left Blank)

1
Federal Aviation Administration National Airspace System Capital Investment Plan for Fiscal Years 2013–2017
1 Introduction
1.1 The Capital Investment Plan The Federal Aviation Administration (FAA) Capital Investment Plan (CIP) describes the planned investments in the National Airspace System (NAS) for the next 5 years. A provision in annual appropriations laws requires submission of a comprehensive capital investment plan for the FAA which includes funding for each budget line item (BLI) for Fiscal Years (FY) 2013 through 2017.
1.2 Strategic Planning and the CIP FAA’s capital programs support the Agency’s Strategic Plan (Destination 2025) Goals, Outcomes and Performance Metrics. The Strategic Plan articulates the most important goals for improving performance in the delivery of aviation services. These goals guide the Agency in upgrading NAS systems and operating procedures to meet the demands of future growth. Outcomes and Strategies have been developed with Performance Metrics to track progress towards accomplishment of the Strategic Goals. These Outcomes and Strategies determine the actions (including capital investments) needed to meet the goals. Actual performance is then compared to the Performance Metrics to determine whether the actions are successful and, if not, adjustments can be made to improve performance. The FAA strategic plan (Destination 2025) covers five goal areas:
Move to the Next Level of Safety — By achieving the lowest possible accident rate and always improving safety, all users of our aviation system can arrive safely at their destinations. We will advance aviation safety worldwide.
Workplace of Choice — We will create a workplace of choice marked by integrity, fairness, diversity, accountability, safety and innovation. Our workforce will have the skills, abilities, and support systems required to achieve and sustain NextGen.
Delivering Aviation Access through Innovation — Enhance the flying experience of the traveling public and other users by improved access to and increased capacity of the nation’s aviation system. Ensure airport and airspace capacity are more efficient, predictable, cost-effective and matched to public needs.
Sustaining our Future — To develop and operate an aviation system that reduces aviation’s environmental and energy impacts to a level that does not constrain growth and is a model for sustainability.
Improved Global Performance through Collaboration — Achieve enhanced safety, efficiency, and sustainability of aviation around the world. Provide leadership in collaborative standard setting and creation of a seamless global aviation system.
2
Each capital investment program summary identifies the primary Goal, Outcome and Performance Metric it supports. Many FAA programs will contribute to more than one Goal, Outcome or Performance Metric; however, the program linkage in the CIP (appendices A and B) is for the program’s most significant contribution. In the summary tables in appendix A, several programs may appear under each performance measure because many programs are interdependent; one program may not be successful in meeting a performance metric without completing other supporting programs. Also, in the complex system used for air traffic control, system improvements must address several different operating conditions to reach the overall performance target, and often it takes multiple programs to address each of the variables, which individually contribute to overall system improvements. To better explain how a program contributes to a strategic goal, a section titled “Relationship of Program to FAA Performance Metric” in Appendix B gives more specific information about how each program helps meet a Strategic Plan Performance Metric.
1.3 Management Process for Selecting Modernization Programs The first AMS decision, concept and requirements definition readiness decision (CRD), is the point that separates problem definition and solution identification and implementation. A CRD readiness decision is management’s recognition that there is a problem expressed as a capability shortfall that needs attention and solution identification activity. Following investment analysis which focuses on identifying alternatives to satisfy the capability shortfall, the Investment Decision Authority (IDA) approves the initiation of the modernization program to proceed to solution implementation with the selected alternative. FAA management then uses a disciplined and rigorous process for determining funding amounts for modernization programs. Each year, every program is required to submit a request for funding with justification and details concerning cost, schedule and benefits. Programs must be consistent with the NAS Architecture and with any approved baselines. A Capital Investment Team composed of representatives from budget and finance, and, as appropriate, representatives of Air Traffic Organization (ATO) vice-presidents and other FAA organizations, reviews these requests to determine whether the program should be funded. The consolidated budget request is then reviewed and approved by the Joint Resources Council (JRC) prior to submittal to the Office of the Secretary of Transportation (OST), OMB and finally Congress as part of the President’s budget request. Investment Types have been defined to facilitate the establishment of Acquisition Categories. Acquisition Categories (ACATs) ensure the appropriate level of oversight and documentation are applied to each FAA modernization program. ACATs apply to all FAA organizations, all appropriations, and all modernization programs. This includes all capital investments in the NAS and FAA administrative and mission support systems. Programs will be assigned to the highest level ACAT (e.g. starting with ACAT 1) in which they meet one or more of the designation criteria. Designation criteria includes factors such as total F&E costs, single year F&E costs, Operations and Maintenance (O&M) costs, and factors such
3
as complexity, risk, political sensitivity, safety and security. During CRD, the sponsoring service organization recommends an ACAT to the FAA Acquisition Executive Board, which makes the categorization decision and notifies the Joint Resource Council (JRC). The ACAT categorization is finalized at the Investment Analysis Readiness Decision (IARD). At the Final Investment Decision (FID) the IDA approves the investment program for solution implementation. At this point the investments Acquisition Program Baseline is established and marks the initiation of acquisition baseline performance measurement. The Acquisition Management System approval process can be found at http://fast.faa.gov. Appendix D reflects ACAT 1, 2, and 3 programs that have completed FID and are being measured against the established APBs. Appendix D provides a status of those programs that have experienced baseline changes and describes the impact of those changes. There are several reasons for changes to a program’s baseline. The most common reason is unforeseen technical problems that require additional engineering design or software development and testing. Occasionally, requirements for the program may have to be adjusted to meet new unforeseen operational needs. Siting issues relating to permits or environmental impacts can also delay completion of a program within its schedule parameters. If authorized funding is below the established baseline, work may have to be deferred to a later period which may introduce cost or schedule variances. The Federal Aviation Reauthorization Act of 1996, Title II, subtitle B, Section 252, “Air Traffic control Modernization Reviews”, dated October 9, 1996 (Public Law 104-264) requires the FAA to report program baseline breaches and to consider terminating a program when substantial actual or projected variances from its program baselines occur. To manage programs within the established baselines, program oversight continues after the initial approval at FID. The JRC conducts acquisition program quarterly reviews of programs performance against a series of performance metrics. Cost, schedule and technical performance is reviewed to determine the program’s potential to deliver the planned capabilities within the planned baseline parameters. Included in the CIP Introduction are NextGen Service and Infrastructure roadmaps which have schedule information with a longer time horizon than the 5 year window of the CIP. The roadmaps are an integral part of planning for the future and indicate that modernization of the air traffic control system will continue well into the future. The Service Roadmaps in Section 3 show the schedule for implementing Next Generation Air Transportation System (NextGen) operational improvements and system upgrades that are planned now through 2025. Section 4 contains the infrastructure roadmaps that system engineers have developed to show the hardware and software changes needed to operate the NAS and implement those improvements. These roadmaps are an essential part of the Enterprise Architecture and ensure that modernization efforts are integrated and coordinated.
4
1.4 Important Factors Affecting Planning for the Future 1.4.1 Economic Considerations
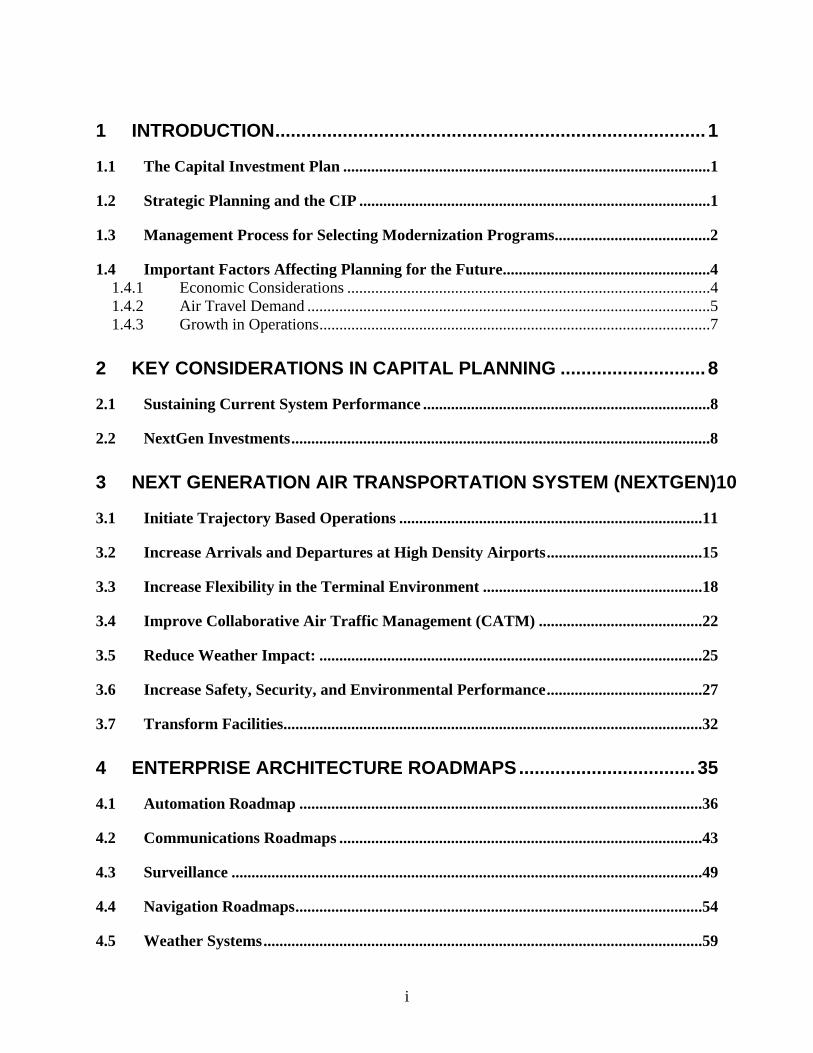
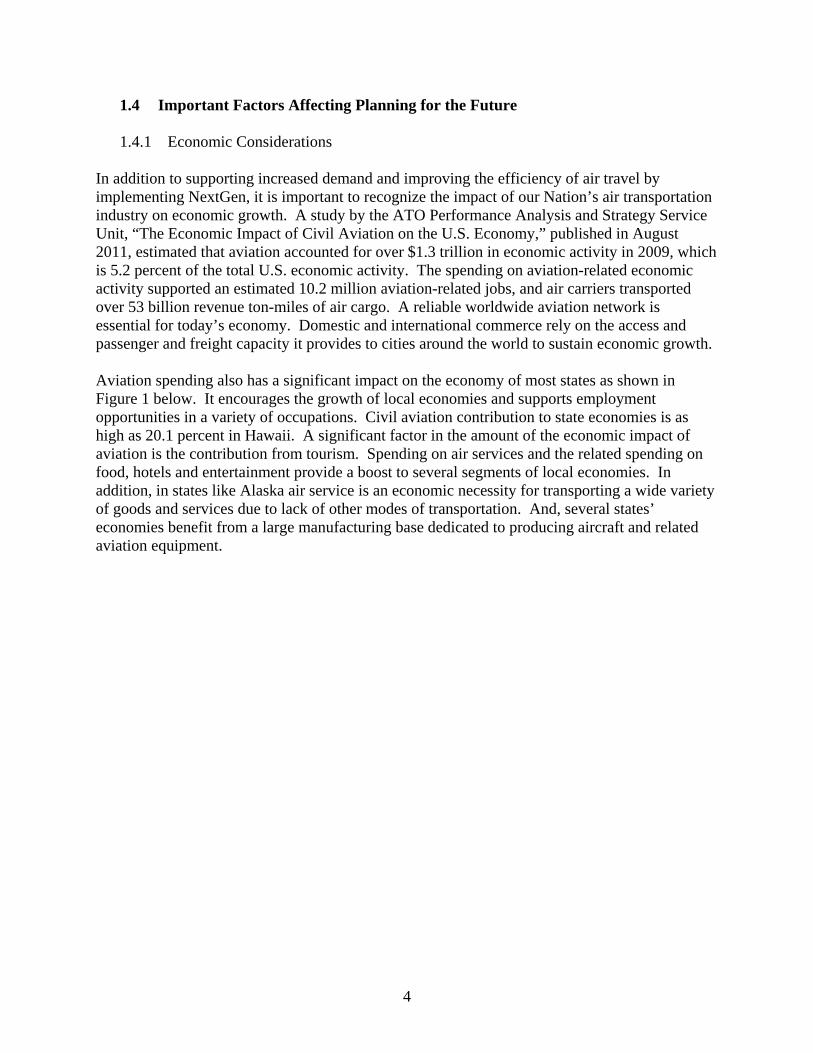
In addition to supporting increased demand and improving the efficiency of air travel by implementing NextGen, it is important to recognize the impact of our Nation’s air transportation industry on economic growth. A study by the ATO Performance Analysis and Strategy Service Unit, “The Economic Impact of Civil Aviation on the U.S. Economy,” published in August 2011, estimated that aviation accounted for over $1.3 trillion in economic activity in 2009, which is 5.2 percent of the total U.S. economic activity. The spending on aviation-related economic activity supported an estimated 10.2 million aviation-related jobs, and air carriers transported over 53 billion revenue ton-miles of air cargo. A reliable worldwide aviation network is essential for today’s economy. Domestic and international commerce rely on the access and passenger and freight capacity it provides to cities around the world to sustain economic growth. Aviation spending also has a significant impact on the economy of most states as shown in Figure 1 below. It encourages the growth of local economies and supports employment opportunities in a variety of occupations. Civil aviation contribution to state economies is as high as 20.1 percent in Hawaii. A significant factor in the amount of the economic impact of aviation is the contribution from tourism. Spending on air services and the related spending on food, hotels and entertainment provide a boost to several segments of local economies. In addition, in states like Alaska air service is an economic necessity for transporting a wide variety of goods and services due to lack of other modes of transportation. And, several states’ economies benefit from a large manufacturing base dedicated to producing aircraft and related aviation equipment.
5
Figure 1 Aviation Percent of State Gross Domestic Product1
1.4.2 Air Travel Demand
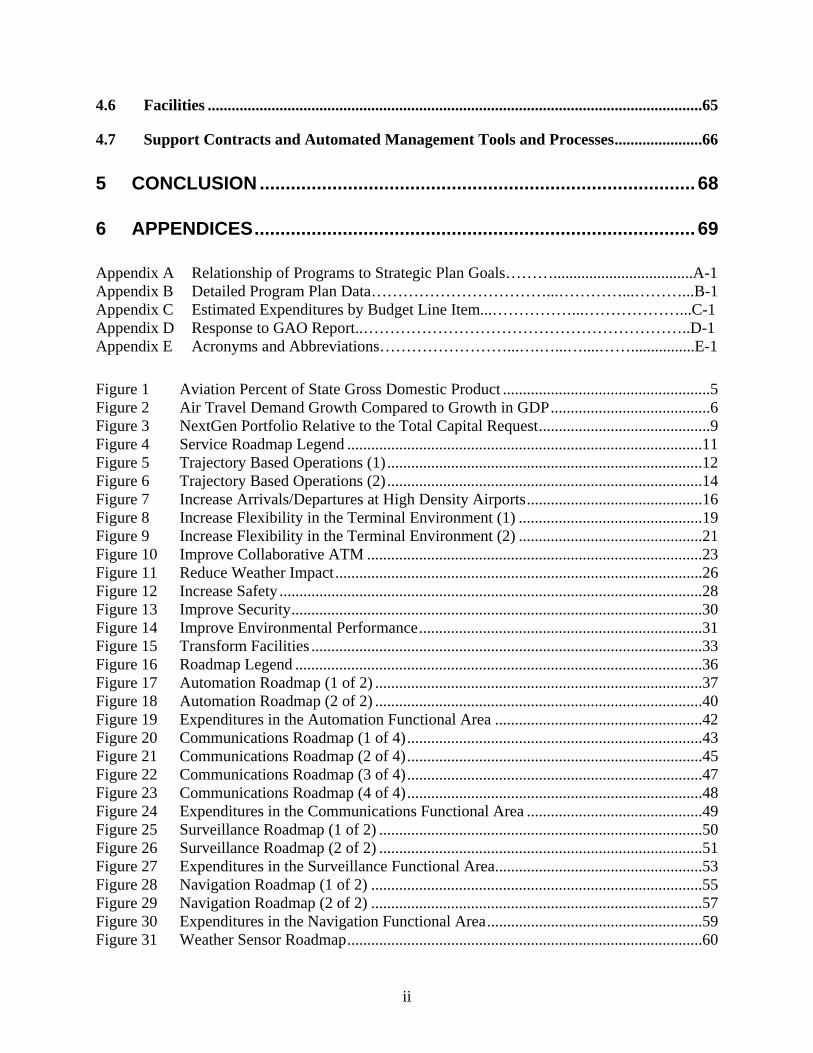
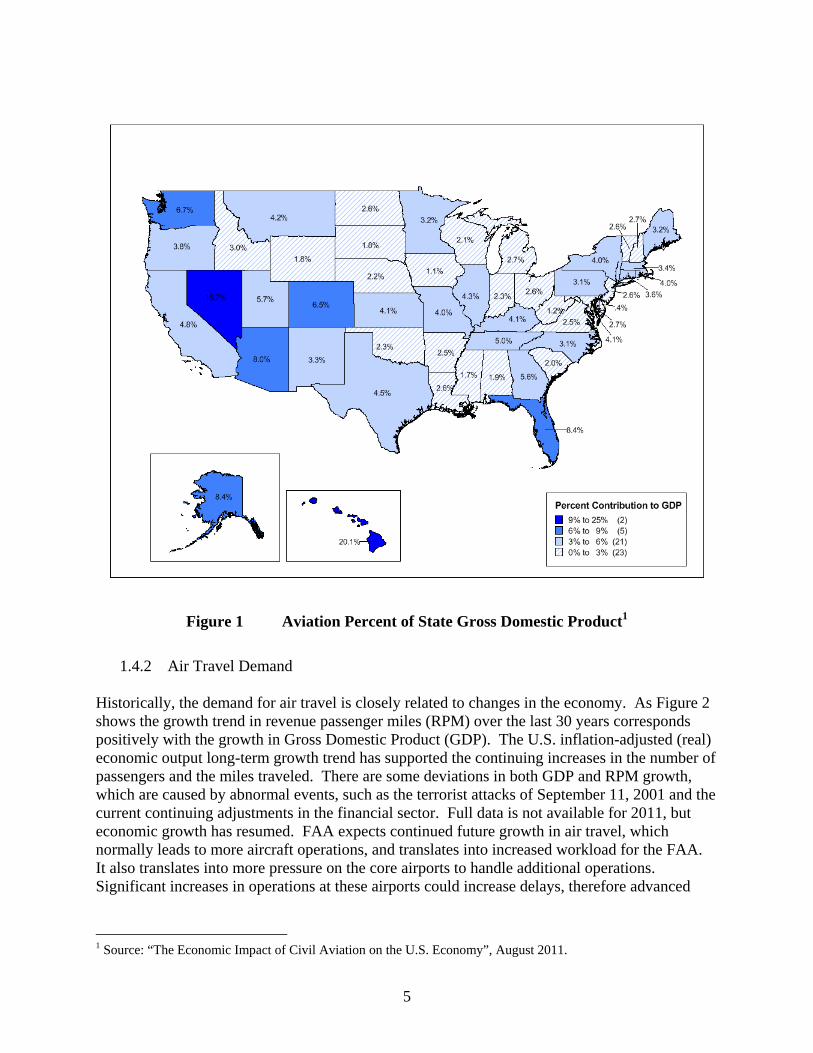
Historically, the demand for air travel is closely related to changes in the economy. As Figure 2 shows the growth trend in revenue passenger miles (RPM) over the last 30 years corresponds positively with the growth in Gross Domestic Product (GDP). The U.S. inflation-adjusted (real) economic output long-term growth trend has supported the continuing increases in the number of passengers and the miles traveled. There are some deviations in both GDP and RPM growth, which are caused by abnormal events, such as the terrorist attacks of September 11, 2001 and the current continuing adjustments in the financial sector. Full data is not available for 2011, but economic growth has resumed. FAA expects continued future growth in air travel, which normally leads to more aircraft operations, and translates into increased workload for the FAA. It also translates into more pressure on the core airports to handle additional operations. Significant increases in operations at these airports could increase delays, therefore advanced
1 Source: “The Economic Impact of Civil Aviation on the U.S. Economy”, August 2011.
6
NextGen capabilities to provide the improved services must be implemented to handle this growth.
Figure 2 Air Travel Demand Growth Compared to Growth in GDP
A study by the National Center of Excellence for Aviation Operations Research (NEXTOR) Universities estimated the total cost of delay in the current national aerospace system and the potential for increases in future costs. The direct cost of delay in 2007 for domestic airlines and passengers was estimated at $28.9 billion. The indirect cost of delay measured by reduced efficiency and productivity of the U.S. economy was estimated to be nearly $4 billion. The research concludes that, “One can certainly expect that new aviation technologies and procedures, including those associated with Next Generation Air Transportation System (NextGen), coupled with appropriate government policies and infrastructure investments have the potential to reduce the identified costs [of delays] by a very large percentage.”

7
1.4.3 Growth in Operations
Preliminary data show that 2011 airport operations are down slightly from 2010 due to increased cost of fuel and air carriers’ adjusting their level of service to enhance profitability. Once carriers have exhausted their ability to absorb demand with increased load factors and larger aircraft, operations are expected to increase. Congestion and delays will increase if modernization is not completed in time to use airspace capacity more efficiently in future years. An ongoing effort to increase airport capacity also affects the need for capital investment, especially at the congested airports, which are experiencing significant delays. There are four active projects to extend runways: Anchorage, Atlanta, Ft Lauderdale, and San Antonio. Chicago O’Hare and Philadelphia airports have major airfield reconfiguration projects underway to improve efficiency of operations. Increasing capacity at large, delay-prone airports is critical to overall NAS performance because these airports handle very large numbers of connecting passengers who may miss connections, and these delays at the large airports may propagate to other airports where passengers are waiting for incoming flights. The 29 large hub airports handle about 60% of airline enplanements. The combined total of 65 large and medium hubs supports about 88% of all U.S. passenger enplanements. When local airport authorities build new runways or otherwise expand capacity, the FAA, depending on the size of the airport, must add supporting equipment and develop procedures to make that capacity fully usable. New or relocated runways often require that airspace around the airports be reconfigured to accommodate new approach and departure patterns. This frequently requires installing new navigational aids and precision landing systems to help pilots in the approach patterns for the runways. To achieve the full benefits of precision approach guidance systems, approach lights must be installed and visibility sensors positioned along the runway so that precision guidance can be used down to the lowest visibility approved for that airport. Some airports need new surveillance systems to cover expanded departure and approach patterns. Capital investment may also be needed to expand or relocate air traffic control facilities. In cases where significant increases in demand occur, additional controller positions may be needed.
8
2 Key Considerations in Capital Planning Capital investments normally require extensive planning and development time. They often take several years to implement because the systems being purchased are technologically complex and require development of both new software and hardware. New systems require extensive testing to ensure that they meet the reliability standards to be used for air traffic control. Additionally, program managers must plan for the operational requirements for many years into the future. To help program managers assess the future operating environment, the FAA annually prepares a detailed forecast of future aviation activity (FAA Aerospace Forecast). Capital planning requires balancing investing so that adequate funding is provided to sustain the performance of the current air traffic control system while providing funds for developing a more capable system to handle future growth. Current operational facilities and equipment must continue to deliver reliable and accurate services until investments in new technology are ready to deliver the operational improvements which will provide increased capacity and efficiency.
2.1 Sustaining Current System Performance The air traffic control system requires very high reliability and availability. Once an aircraft is airborne in controlled airspace, maintaining its separation from other aircraft for the entire flight from takeoff to landing depends on reliable operation of communication, navigation and surveillance systems. Each system in the NAS has a high level of redundancy to support system reliability and to minimize service disruptions. Equipment must be replaced regularly to reduce the potential for system failures and prevent deterioration in system performance.
There are nearly 60,000 NAS operational facilities and over 500 large buildings that house major Air Traffic Control (ATC) functions. The FAA currently allocates a significant portion of the Facilities and Equipment (F&E) appropriation to upgrade and replace buildings and systems that have degraded over time. Uncorrected problems with buildings or the systems inside can cause expensive and unsafe disruptions in air traffic control. Equipment is also replaced to reduce costs for maintenance and operation. When equipment becomes expensive to maintain due to outmoded hardware or software, the payback period to replace it can be as short as 1 or 2 years.
2.2 NextGen Investments NextGen is an umbrella term for the ongoing, wide-ranging transformation of the United States' national airspace system (NAS) to ensure that future safety, capacity and environmental needs are met. NextGen will fundamentally change the way air traffic is managed by combining new technologies for surveillance, navigation, and communications with workforce training, procedural changes, and airfield development. The FY 2013 budget includes $516 million to deploy transformational programs including Automatic Dependent Surveillance - Broadcast (ADS-B), Data Communications (DataComm),
9
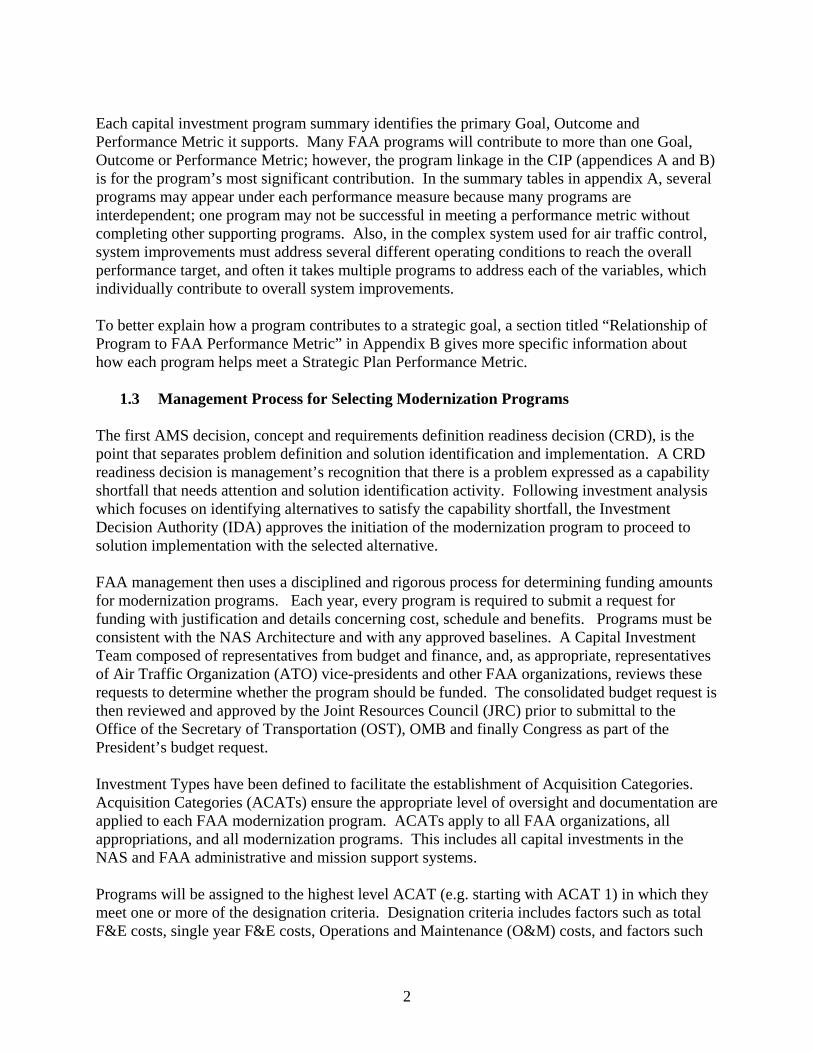
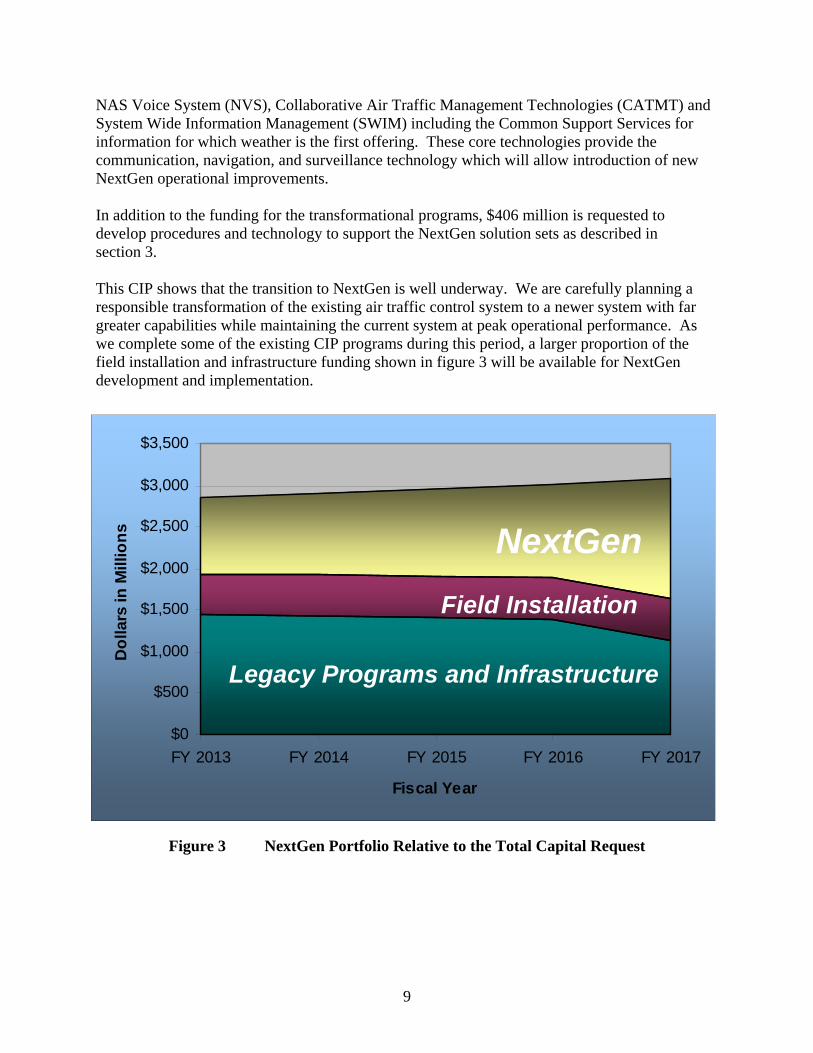
NAS Voice System (NVS), Collaborative Air Traffic Management Technologies (CATMT) and System Wide Information Management (SWIM) including the Common Support Services for information for which weather is the first offering. These core technologies provide the communication, navigation, and surveillance technology which will allow introduction of new NextGen operational improvements. In addition to the funding for the transformational programs, $406 million is requested to develop procedures and technology to support the NextGen solution sets as described in section 3. This CIP shows that the transition to NextGen is well underway. We are carefully planning a responsible transformation of the existing air traffic control system to a newer system with far greater capabilities while maintaining the current system at peak operational performance. As we complete some of the existing CIP programs during this period, a larger proportion of the field installation and infrastructure funding shown in figure 3 will be available for NextGen development and implementation.
$0
$500
$1,000
$1,500
$2,000
$2,500
$3,000
$3,500
FY 2013 FY 2014 FY 2015 FY 2016 FY 2017
Fiscal Year
Do
llars
in M
illio
ns
NextGen
Field Installation
Legacy Programs and Infrastructure
Figure 3 NextGen Portfolio Relative to the Total Capital Request

10
3 Next Generation Air Transportation System (NextGen) The NextGen Program is evaluating and demonstrating improvements to the existing air traffic control system to meet current and future demand. The program contains 6 transformational programs and 50 operational improvement programs. The transformational programs are:
ADS-B – Automatic Dependent Surveillance-Broadcast Provides improved surveillance data,
DataComm – Provides data communications between controller and pilot, NVS – NAS Voice System provides a digital nationwide network of voice switches for
terminal and en route air traffic facilities, which will provide voice switch configuration flexibility required to support NextGen operational improvements,
CATMT – Collaborative Air Traffic Management Technologies Provides improvements to the traffic flow management functions required to support NextGen operational improvements, and
SWIM – System Wide Information Management provides the standards and software to enable information management and data sharing required to support NextGen operational improvements.
o Common Support Services – Weather. In conjunction with the deployment of the SWIM Enterprise Service a common information dissemination capability will be deployed for which the dissemination of weather is the first offering. This subsumes the major functions ascribed to NextGen Networked Enabled Weather (NNEW) and will over time include additional information types – aeronautical information, flight information - as these move to new information protocols and formats.
NextGen operational improvement programs are grouped into 7 Solution Sets:
Trajectory Based Operations (TBO), Reduce Weather Impact (RWI), Arrival/Departures at High Density Airports (HD), Collaborative Air Traffic Management (CATM), Flexible Terminal Environment (FLEX), Safety Security and Environment (SSE), and Transform Facilities (FAC).
NextGen Benefits
NextGen will provide benefits across many aspects of the NAS. Safety will be increased by improving pilot situational awareness, reducing runway incursions, improving controller awareness of conditions in the airspace and better communications via data messages. Environmental impacts will be reduced by demonstrations that lead to the adoption of advanced aircraft technologies, deployment of commercial aviation alternative fuels and improved efficiency of flight operations which result in lower emissions, noise and fuel burn. System capacity will be increased by reduced separation, improved weather information, and more efficient en route and terminal routing. Operators will see benefits from collaborative efforts in
11
flight planning to reduce unnecessary delays by adjusting trajectories and departure and arrival times. FAA facilities will be more flexible to adjust to changing demands resulting in more efficient operation. See the NextGen Implementation Plan for more information on NextGen benefits.
Solution Set Descriptions
In this section, the mid term (through 2018) operational improvements (OIs) included in each NextGen solution set are identified and briefly described. The capital improvements and their timelines necessary for implementation of these improvements have been identified and are shown in the Enterprise Architecture roadmaps in Section 4.
•(Initial Operating Capability targeted
within the box)
•(Initial Operating Capability targeted
within the box)
Key•NAS EA Service / NIP Function
•JPDO is Office of Primary Responsibility
•Far
•Mid
Term Capability
Term Capability
•Near-Term Commitment
•Far
•Mid
Term Capability
Term Capability
•Near-Term Commitment
Term Capability
Term Capability
•Near-Term Commitment
•Delivery
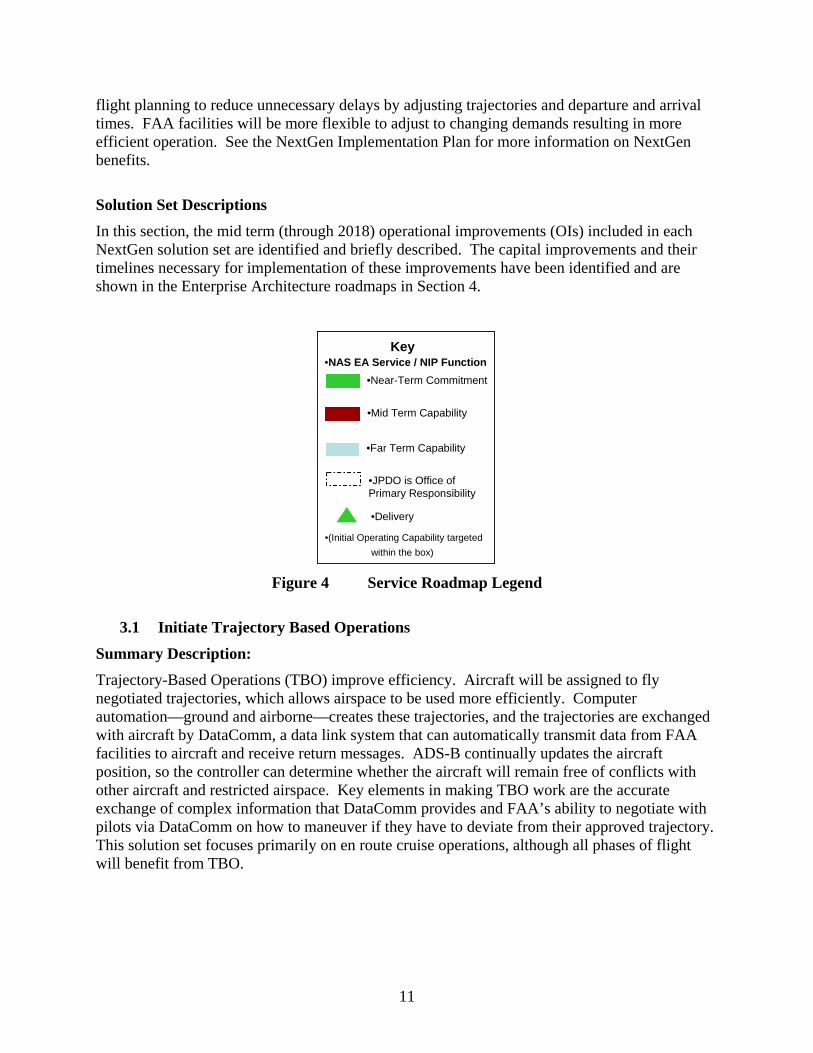
Figure 4 Service Roadmap Legend
3.1 Initiate Trajectory Based Operations
Summary Description:
Trajectory-Based Operations (TBO) improve efficiency. Aircraft will be assigned to fly negotiated trajectories, which allows airspace to be used more efficiently. Computer automation—ground and airborne—creates these trajectories, and the trajectories are exchanged with aircraft by DataComm, a data link system that can automatically transmit data from FAA facilities to aircraft and receive return messages. ADS-B continually updates the aircraft position, so the controller can determine whether the aircraft will remain free of conflicts with other aircraft and restricted airspace. Key elements in making TBO work are the accurate exchange of complex information that DataComm provides and FAA’s ability to negotiate with pilots via DataComm on how to maneuver if they have to deviate from their approved trajectory. This solution set focuses primarily on en route cruise operations, although all phases of flight will benefit from TBO.
12
Timeline:
2004 FY
Automation Support for Separation Management 102137
ATC Separation Assurance / Separation Management
Self Separation Airspace-Oceanic 102147
Self-Separation Airspace Operations 102148
TM Synchronization / Trajectory Management
Trajectory Based Management Gate-to-Gate 104126
2009 2011 2012 20132010 2014 2015 2016 2017 2018 2019 2020 2021 202420232022 2025+2009 2011 2012 20132010 2014 2015 2016 2017 2018 2019 2020 2021 2024202320222009 2011 2012 20132010 2014 2015 2016 2017 2018 2019 2020 2021 202420232022 2025+
ADS-B Separation 102123ADS-B Separation 102123
June 10, 2011 Version 5.0
Initiate Trajectory-Based Operations (1 of 2)
Delegated Responsibility for In-Trail Separation 102118Delegated Responsibility for In-Trail Separation 102118
Oceanic In-trail Climb and Descent 102108Oceanic In-trail Climb and Descent 102108
Automated Negotiation/Separation Management 104121
Automated Negotiation/Separation Management 104121
Reduce Horizontal Separation Standards, En Route - 3 Miles 102117Reduce Horizontal Separation Standards, En Route - 3 Miles 102117
Reduced Oceanic Separation and Enhanced Procedures 102136Reduced Oceanic Separation and Enhanced Procedures 102136
Flexible Routing 102146Flexible Routing 102146
Initial Conflict Resolution Advisories 102114Initial Conflict Resolution Advisories 102114
Flexible Entry Times for Oceanic Tracks 104102Flexible Entry Times for Oceanic Tracks 104102
Point-in-Space Metering 104120Point-in-Space Metering 104120
Automation Support for Trajectory Negotiation 104105Automation Support for Trajectory Negotiation 104105
Automation Support for Conflict Resolution 104127 Automation Support for Conflict Resolution 104127
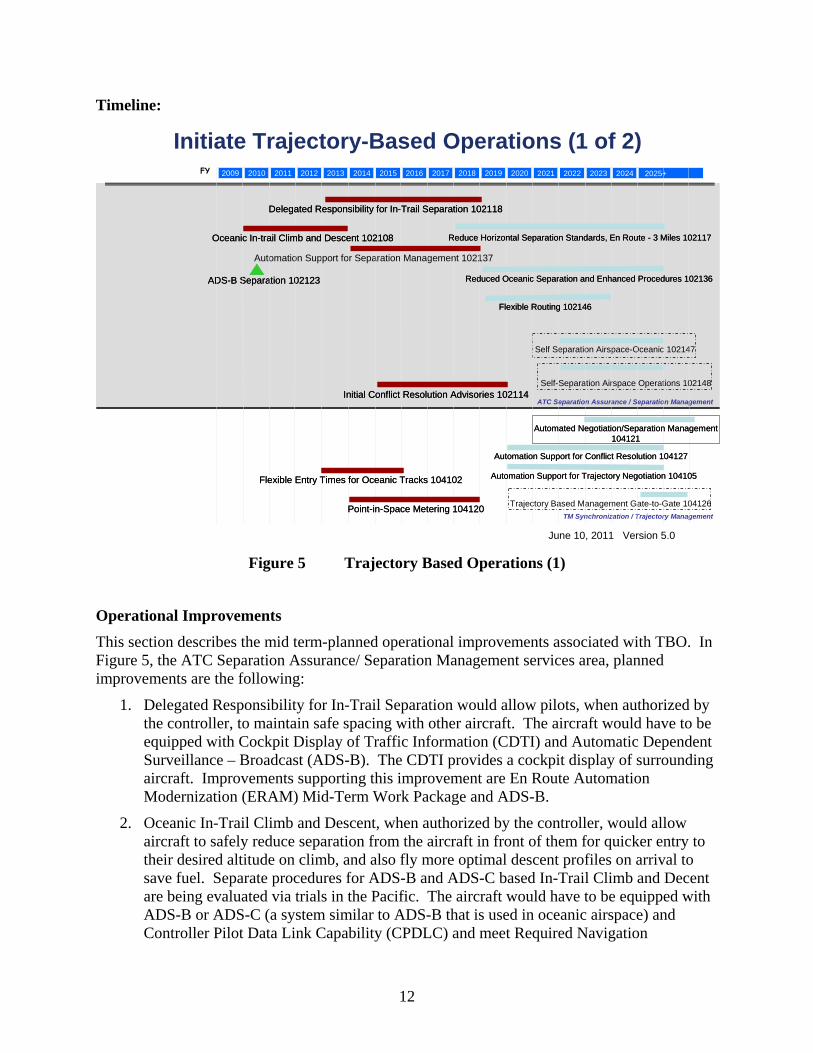
Figure 5 Trajectory Based Operations (1)
Operational Improvements
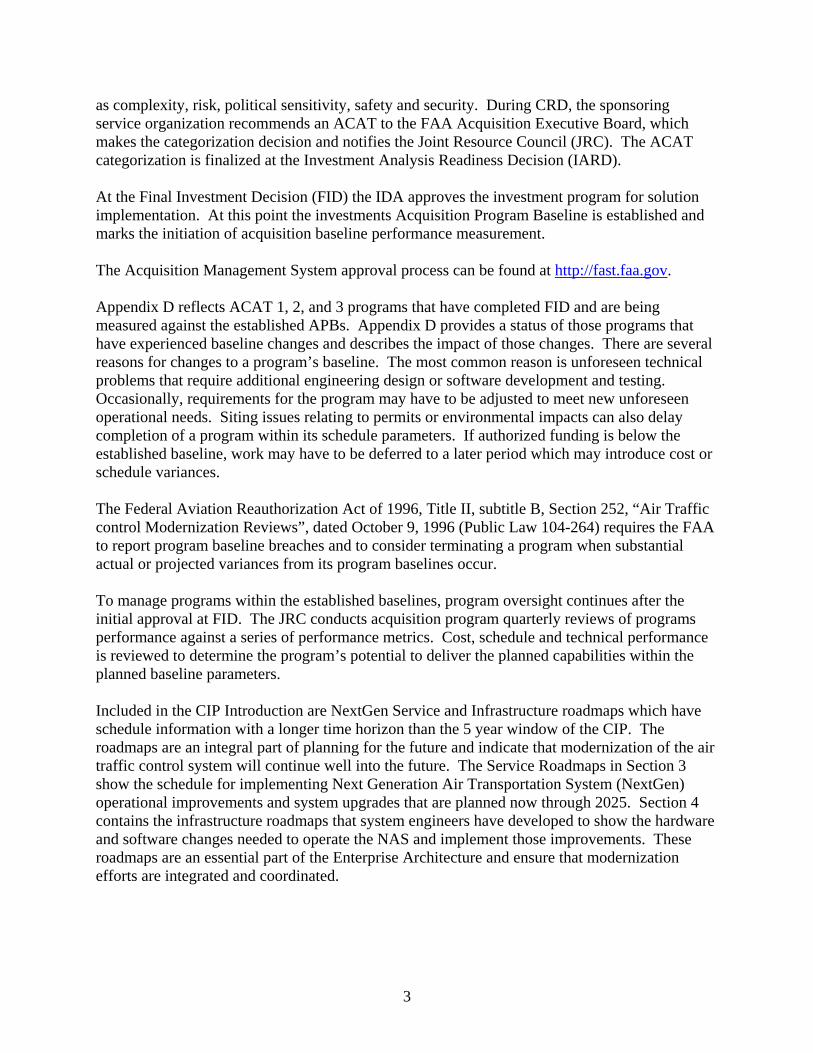
This section describes the mid term-planned operational improvements associated with TBO. In Figure 5, the ATC Separation Assurance/ Separation Management services area, planned improvements are the following:
1. Delegated Responsibility for In-Trail Separation would allow pilots, when authorized by the controller, to maintain safe spacing with other aircraft. The aircraft would have to be equipped with Cockpit Display of Traffic Information (CDTI) and Automatic Dependent Surveillance – Broadcast (ADS-B). The CDTI provides a cockpit display of surrounding aircraft. Improvements supporting this improvement are En Route Automation Modernization (ERAM) Mid-Term Work Package and ADS-B.
2. Oceanic In-Trail Climb and Descent, when authorized by the controller, would allow aircraft to safely reduce separation from the aircraft in front of them for quicker entry to their desired altitude on climb, and also fly more optimal descent profiles on arrival to save fuel. Separate procedures for ADS-B and ADS-C based In-Trail Climb and Decent are being evaluated via trials in the Pacific. The aircraft would have to be equipped with ADS-B or ADS-C (a system similar to ADS-B that is used in oceanic airspace) and Controller Pilot Data Link Capability (CPDLC) and meet Required Navigation

13
Performance 4 (RNP 4). FAA investments would include upgrades to ATOP (an oceanic air traffic automation system).
3. Automation Support for Separation Management would provide controllers with the tools to manage aircraft with differing navigation capabilities and provide safe separation when following aircraft are affected by the wake turbulence of an aircraft in front of them. Investments supporting this improvement are ERAM D-Position Upgrade and System Enhancements and Terminal Automation Modernization Replacement (TAMR).
4. Initial Conflict Resolution Advisories are an enhancement to the existing conflict probe software to provide rank-ordered advisories to the controller to better accommodate pilot requests for trajectory changes. The investment supporting this improvement is ERAM Mid Term Work Package.
In the TM Synchronization/Trajectory Management services area the planned improvements are the following:
1. Flexible Entry Times for Oceanic Tracks will allow aircraft to reach their preferred trajectories sooner, which will minimize fuel burn. The investments supporting this improvement are Time Based Flow Management (TBFM), Dynamic Ocean Track System (DOTS) or 4D Oceanic Trajectory Management (OTM4D) system and the accelerated Terminal Data Link System (TDLS). DOTS analyzes weather data and calculates the most efficient tracks for oceanic flights, and the TDLS provides automated departure clearances to aircraft.
2. Point-in-Space Metering uses scheduling tools to ensure smooth flow of traffic and efficient use of airspace. Pilots are assigned a specific trajectory and scheduled times to reach specific points on the assigned trajectory. This maximizes use of airspace by reducing the need to alter aircraft flight paths to maintain separation. Investments supporting this improvement are Collaborative Air Traffic Management Technologies (CATMT); ERAM D-Position Upgrade and System Enhancements; System Wide Information Management (SWIM) and the TBFM tool.
14
Timeline:
Initiate Trajectory-Based Operations (2 of 2)2004 FY
Airspace Management / Capacity Management (Airspace)
ATC-Advisory & Flight Planning, Emergency and Alerting, Infrastructure-Information Management / Flight and State Data Management
Flow Corridors – Level 1 Static 108105
Flow Corridors – Level 2 Dynamic 108106
2009 2011 2012 20132010 2014 2015 2016 2017 2018 2019 2020 2021 202420232022 2025+2009 2011 2012 20132010 2014 2015 2016 2017 2018 2019 2020 2021 2024202320222009 2011 2012 20132010 2014 2015 2016 2017 2018 2019 2020 2021 202420232022 2025+
June 10, 2011 Version 5.0
TM Strategic Flow / Flow Contingency Management (Strategic Flow)
Increase Capacity and Efficiency Using RNAV and RNP 108209Increase Capacity and Efficiency Using RNAV and RNP 108209
Flexible Airspace Management 108206Flexible Airspace Management 108206
Provide Interactive Flight Planning from Anywhere 101103Provide Interactive Flight Planning from Anywhere 101103
Dynamic Airspace Performance Designation 108213Dynamic Airspace Performance Designation 108213
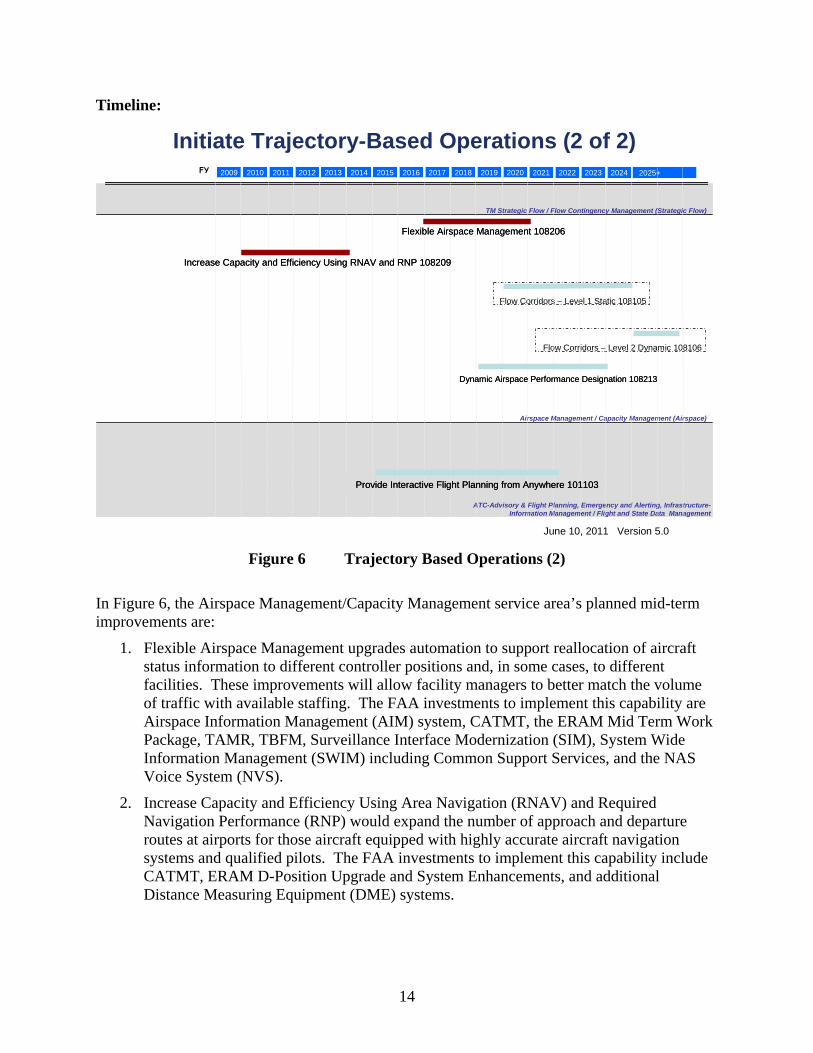
Figure 6 Trajectory Based Operations (2)
In Figure 6, the Airspace Management/Capacity Management service area’s planned mid-term improvements are:
1. Flexible Airspace Management upgrades automation to support reallocation of aircraft status information to different controller positions and, in some cases, to different facilities. These improvements will allow facility managers to better match the volume of traffic with available staffing. The FAA investments to implement this capability are Airspace Information Management (AIM) system, CATMT, the ERAM Mid Term Work Package, TAMR, TBFM, Surveillance Interface Modernization (SIM), System Wide Information Management (SWIM) including Common Support Services, and the NAS Voice System (NVS).
2. Increase Capacity and Efficiency Using Area Navigation (RNAV) and Required Navigation Performance (RNP) would expand the number of approach and departure routes at airports for those aircraft equipped with highly accurate aircraft navigation systems and qualified pilots. The FAA investments to implement this capability include CATMT, ERAM D-Position Upgrade and System Enhancements, and additional Distance Measuring Equipment (DME) systems.
15
3.2 Increase Arrivals and Departures at High Density Airports
Summary Description:
This solution set addresses improving use of available capacity at airports: With large numbers of operations; That have multiple runways with both airspace and taxiing interactions; and In close proximity to other airports that have the potential for airspace interference.
Operational issues make it difficult for an airport to achieve its maximum arrival or departure capacity. If the arrival stream to an airport contains a mixture of small and large aircraft, maximizing use of runway capacity is not possible. Differences in aircraft arrival speed or the effect of wake turbulence from heavy category aircraft require increased separation between aircraft. Wake turbulence from a heavy category aircraft requires controllers to increase separation to 5 miles or more between the two aircraft when a small aircraft is following a heavy category aircraft. Multiple runways at an airport can also complicate movement of aircraft on the ground and create restrictions on the number of takeoffs from available runways. In major metropolitan areas, multiple major hub airports that have overlapping terminal airspace must share that airspace, and significant restrictions on terminal operations result, when winds dictate that an approach path used for the active runways at one of the airports limits the use of approach paths for certain runways at nearby airports. Operational improvements in this solution set address some of these limitations in order to make more efficient use of the available runways.
16
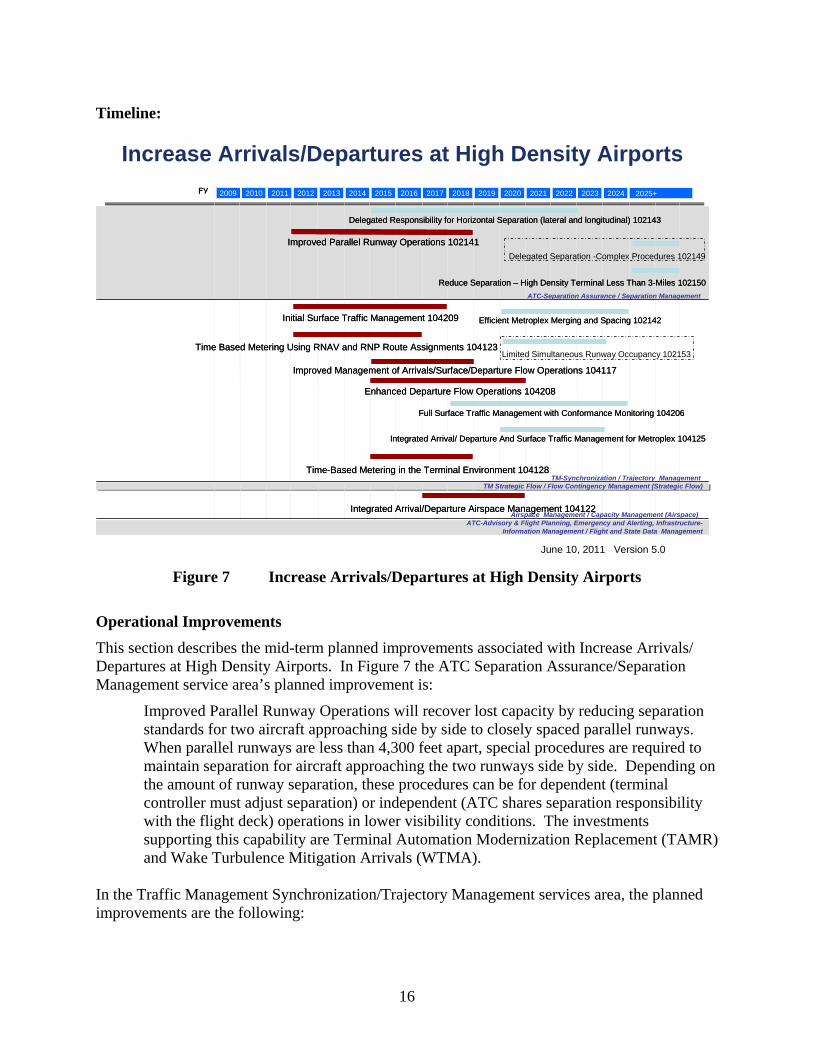
Timeline:
Increase Arrivals/Departures at High Density Airports
20042005 FY
Delegated Responsibility for Horizontal Separation (lateral and longitudinal) 102143Delegated Responsibility for Horizontal Separation (lateral and longitudinal) 102143
Improved Parallel Runway Operations 102141Improved Parallel Runway Operations 102141
Efficient Metroplex Merging and Spacing 102142Efficient Metroplex Merging and Spacing 102142
Time Based Metering Using RNAV and RNP Route Assignments 104123Time Based Metering Using RNAV and RNP Route Assignments 104123
Initial Surface Traffic Management 104209Initial Surface Traffic Management 104209
Improved Management of Arrivals/Surface/Departure Flow Operations 104117Improved Management of Arrivals/Surface/Departure Flow Operations 104117
Enhanced Departure Flow Operations 104208Enhanced Departure Flow Operations 104208
Full Surface Traffic Management with Conformance Monitoring 104206Full Surface Traffic Management with Conformance Monitoring 104206
TM-Synchronization / Trajectory Management
Airspace Management / Capacity Management (Airspace)
TM Strategic Flow / Flow Contingency Management (Strategic Flow)
Integrated Arrival/Departure Airspace Management 104122Integrated Arrival/Departure Airspace Management 104122
ATC-Advisory & Flight Planning, Emergency and Alerting, Infrastructure-Information Management / Flight and State Data Management
ATC-Separation Assurance / Separation Management
Delegated Separation -Complex Procedures 102149
Reduce Separation – High Density Terminal Less Than 3-Miles 102150Reduce Separation – High Density Terminal Less Than 3-Miles 102150
Integrated Arrival/ Departure And Surface Traffic Management for Metroplex 104125Integrated Arrival/ Departure And Surface Traffic Management for Metroplex 104125
Limited Simultaneous Runway Occupancy 102153
2009 2011 2012 20132010 2014 2015 2016 2017 2018 2019 2020 2021 202420232022 2025+2009 2011 2012 20132010 2014 2015 2016 2017 2018 2019 2020 2021 2024202320222009 2011 2012 20132010 2014 2015 2016 2017 2018 2019 2020 2021 202420232022 2025+
Time-Based Metering in the Terminal Environment 104128Time-Based Metering in the Terminal Environment 104128
June 10, 2011 Version 5.0
Figure 7 Increase Arrivals/Departures at High Density Airports
Operational Improvements
This section describes the mid-term planned improvements associated with Increase Arrivals/ Departures at High Density Airports. In Figure 7 the ATC Separation Assurance/Separation Management service area’s planned improvement is:
Improved Parallel Runway Operations will recover lost capacity by reducing separation standards for two aircraft approaching side by side to closely spaced parallel runways. When parallel runways are less than 4,300 feet apart, special procedures are required to maintain separation for aircraft approaching the two runways side by side. Depending on the amount of runway separation, these procedures can be for dependent (terminal controller must adjust separation) or independent (ATC shares separation responsibility with the flight deck) operations in lower visibility conditions. The investments supporting this capability are Terminal Automation Modernization Replacement (TAMR) and Wake Turbulence Mitigation Arrivals (WTMA).
In the Traffic Management Synchronization/Trajectory Management services area, the planned improvements are the following:
17
1. Initial Surface Traffic Management uses automation tools for departure scheduling to improve flow of surface traffic at high-density airports. Automation provides surface sequencing and staging lists for departures and predicts departure delays. By better scheduling departures from the gate, the time between leaving the gate and takeoff is reduced resulting in fuel and time savings. Investments that support this improvement are Time Based Flow Management (TBFM), Tower Flight Data Manager (TFDM), Airport Surface Detection Equipment (ASDE), and the System Wide Information Management (SWIM).
2. Time Based Metering Using RNAV and RNP Route Assignments allows more efficient use of runways and airspace in high-density airport environments. For those aircraft that are equipped to fly more precise routes and conform to time metering, arrival and departure paths are shortened to save fuel and minimize delays. Investments that support this improvement include the ERAM Mid Term Work Package, TBFM, and Distance Measuring Equipment (DME).
3. Improved Management of Arrivals/Surface Departure Flow Operations integrates advanced arrival and departure flow management with advanced surface operations to improve overall airport capacity and efficiency. Arrival and departure scheduling tools and 4D trajectory agreements are used to make collaborative real-time adjustments to aircraft sequencing to optimize use of airport capacity. Investments that support this improvement are Collaborative Air Traffic Management Technologies (CATMT), TFDM, SWIM and DataComm.
4. Enhanced Departure Flow Operations incorporate taxi instructions, surface movement information, and aircraft wake category in decision support tools. Clearances are developed, delivered, monitored and provided in digital data or textual format to the flight deck display. Surface decision support and management systems use ground and airborne surveillance and a scheduling and sequencing system to develop and maintain schedules of departing aircraft to optimize runway use and facilitate transmission of other operational information.
5. Time Based Metering in the Terminal Environment optimizes use of terminal airspace and surface capacity. Automation develops trajectories and allocates time-based slots for various points within the terminal environment, using RNAV routes, enhanced surveillance, and data communications. It extends current metering capabilities into the terminal environment and supports end-to-end metering and trajectory-based operations. It also supports capabilities designed to expand the use of terminal separation standards in transition airspace, and builds the foundation for future advanced airborne-based applications that will use ground-based automation to maintain the sequence of aircraft into and out of high density terminal locations.
In the Airspace Management/Capacity Management services area, the planned improvement is the following:
Integrated Arrival/Departure Airspace Management to take advantage of terminal procedures and separation standards in adjacent en route airspace to increase flow and introduce additional routes and flexibility. Investments that support this improvement are
18
CATMT, ERAM Mid Term Work Package, TBFM, TAMR, TFDM, DME, SWIM, and Surveillance Interface Modernization (SIM).
3.3 Increase Flexibility in the Terminal Environment
Summary Description:
This solution set concentrates on improvements in the access, situational awareness, and separation services at airports. Unlike the high-density solution set that focuses on increased sophistication of traffic management to manage demand at large airports, this solution set reflects the common needs that all airports have: precision landing guidance, surface situational awareness, and improved management of flight data. Flexible terminal operations will serve a mix of Instrument Flight Rules (IFR)/Visual Flight Rules (VFR) traffic, with aircraft types ranging from airline transport to small general aviation aircraft. Airports can be towered or non-towered, depending on traffic demand. Some satellite airports will experience higher traffic demand due to migration of aircraft with less sophisticated avionics to these smaller airports to avoid traffic congestion. These airports can serve an important role by handling the potential increase in use of personal aircraft for pleasure and business.

19
Timeline:
Increase Flexibility in the Terminal Environment (1 of 2)
2004 FY
ATC-Separation Assurance / Separation Management
TM-Synchronization / Trajectory ManagementExpanded Low Visibility Operations using Lower RVR Minima 107119
Single Runway Arrival Wake Mitigation 102145
Single Runway Departure Wake Mitigation 102151
Dynamic, Pairwise Wake Turbulence Separation 102152
2009 2011 2012 20132010 2014 2015 2016 2017 2018 2019 2020 2021 202420232022 2025+2009 2011 2012 20132010 2014 2015 2016 2017 2018 2019 2020 2021 2024202320222009 2011 2012 20132010 2014 2015 2016 2017 2018 2019 2020 2021 202420232022 2025+
June 10, 2011 Version 5.0
Low Visibility/Ceiling Approach Operations 107117Low Visibility/Ceiling Approach Operations 107117
Low Visibility/Ceiling Landing Operations 107118Low Visibility/Ceiling Landing Operations 107118
Low Visibility Surface Operations 107202Low Visibility Surface Operations 107202
Low Visibility/Ceiling Takeoff Operations 107115Low Visibility/Ceiling Takeoff Operations 107115
Low Visibility/Ceiling Departure Operations 107116Low Visibility/Ceiling Departure Operations 107116
Use Optimized Profile Descent 104124Use Optimized Profile Descent 104124
Ground Based Augmentation System (GBAS) Precision Approaches 107107Ground Based Augmentation System (GBAS) Precision Approaches 107107
Wake Turbulence Mitigation for Departures (WTMD): Wind-Based Wake Procedures 102140Wake Turbulence Mitigation for Departures (WTMD): Wind-Based Wake Procedures 102140
Wake Turbulence Mitigation for Arrivals: CSPRs 102144Wake Turbulence Mitigation for Arrivals: CSPRs 102144
Expanded Radar-Like Services to Secondary Airports 102138Expanded Radar-Like Services to Secondary Airports 102138
Provide Surface Situation to Pilots, Service Providers and Vehicle Operators for Near-Zero-Visibility Surface Operations 102409Provide Surface Situation to Pilots, Service Providers and Vehicle Operators for Near-Zero-Visibility Surface Operations 102409
Wake Re-Categorization 102154Wake Re-Categorization 102154
Figure 8 Increase Flexibility in the Terminal Environment (1)
Operational Improvements
This section describes the mid-term planned improvements associated with Increase Flexibility in the Terminal Environment. In Figure 8 the ATC Separation Assurance/Separation Management services area planned improvements are the following:
1. Wake Turbulence Mitigation for Departures (WTMD): Based on wind measurements, wake turbulence separation standards can be adjusted quickly to allow more departure operations on an airport’s Closely Spaced Parallel Runways (CSPR), which would improve use of runway capacity. Observed and forecasted airport wind information can be processed and displayed in the tower to indicate which runways can be used for immediate departures after a heavy category aircraft departs on an adjacent CSPR. The WTMD system measures and forecasts runway crosswinds to determine when there will be sufficient crosswind to prevent the wake from a departing aircraft from moving into the takeoff corridor of an aircraft departing on an adjacent runway. Using WTMD during periods of favorable crosswinds will allow controllers to maximize the departure capacity of an airport’s CSPR.
2. Ground Based Augmentation System (GBAS) Precision Approaches rely on installing GPS augmentation capability at an airport to support precision approaches to Category I

20
and eventually Category II/III minimums for properly equipped runways. GBAS can support curved precision approaches and high-integrity surface movement requirements. This is an economical way to increase the number of runways with instrument approaches that allow operations in low-visibility conditions. Investment in GBAS supports this improvement.
3. Expanded Radar-Like Services to Secondary Airports will be available in Instrument Meteorological Conditions (IMC) at secondary airports. Equipped aircraft will automatically receive airborne broadcast traffic information and, at select airports, surface traffic information. Enhanced surveillance coverage will also be available in areas of mountainous terrain where radar coverage is limited.
4. Wake Turbulence Mitigation for Arrivals (WTMA) allows controllers to reduce the instrument flight rules wake mitigation dependent staggered separation for two aircraft landing on an airport’s adjacent CSPR. When crosswinds are stable and strong enough so that the wake of the lead aircraft landing on one runway can not be transported into the path of the following aircraft, controllers can reduce wake mitigation separations. Observed and forecasted airport wind information will be processed and provided to controller displays to show the minimum diagonal separation between approaching aircraft. Investments that support this improvement are: Terminal Automation Modernization Replacement (TAMR), WTMA, and Integrated Terminal Weather System (ITWS).
5. Wake Re-Categorization - Legacy world-wide air traffic control wake mitigation separation standards are updated based on data collected and subsequent analysis of aircraft wake generation, wake decay, and wake encounter effects for representative aircraft. The updated standards will allow more efficient use of existing airport runways. As more automation and information sharing NextGen capabilities are enabled, even more efficient wake separation standards can be established that consider real-time atmospheric and aircraft configuration information.
The Traffic Management Synchronization/ Trajectory Management service area (shown in Figure 8) planned improvements are the following:
1. Use Optimized Profile Descent permits aircraft to minimize power settings during descent to an airport to save fuel. These descent profiles have been tested, and they save significant fuel. Investments that support this improvement include ERAM D-Position Upgrade and System Enhancements and TAMR.
2. Low Visibility Surface Operations will use ground surveillance systems to inform controllers of surface movements and runway status lights will alert pilots when it is unsafe to enter or cross a runway. Investments that support this improvement are: TFDM, Automatic Dependent Surveillance – Broadcast (ADS-B), GBAS, Airport Surface Detection Equipment (ASDE 3 and ASDE-X), and Runway Status Lights (RWSL).
3. Low Visibility/Ceiling Approach Operations improves the ability of aircraft to complete approaches in low visibility/ceiling conditions. Investments that support this improvement are GBAS and SWIM Common Support Services.
21
4. Low Visibility/Ceiling Landing Operations permit aircraft to land in low visibility/ceiling conditions when equipped with augmented Global Positioning System (GPS), Instrument Landing System (ILS) or combinations of cockpit technologies and ground infrastructure. GBAS supports this improvement.
5. Low Visibility/Ceiling Takeoff Operations allows aircraft to takeoff when visibility is very limited. The aircraft must have advanced vision capabilities such as a heads up display, synthetic vision system, or an enhanced flight vision system.
6. Low Visibility/Ceiling Departure Operations allows appropriately equipped aircraft to depart in low visibility conditions. Investments that support this improvement are SWIM Common Support Services and GBAS.
Increase Flexibility in the Terminal Environment (2 of 2)
2004 FY
ATC-Advisory & Flight Planning, Emergency and Alerting, Infrastructure-Information Management / Flight and State Data Management
TM-Strategic Flow / Flow Contingency Management (Strategic Flow
Airspace Management / Capacity Management (Airspace)
2009 2011 2012 20132010 2014 2015 2016 2017 2018 2019 2020 2021 202420232022 2025+2009 2011 2012 20132010 2014 2015 2016 2017 2018 2019 2020 2021 2024202320222009 2011 2012 20132010 2014 2015 2016 2017 2018 2019 2020 2021 202420232022 2025+
June 10, 2011 Version 5.0
Provide Full Surface Situation Information 102406Provide Full Surface Situation Information 102406
Enhanced Surface Traffic Operations 104207Enhanced Surface Traffic Operations 104207
Improved Runway Safety Situational Awareness for Controllers 103207Improved Runway Safety Situational Awareness for Controllers 103207
Improve Runway Safety Situational Awareness for Pilots 103208Improve Runway Safety Situational Awareness for Pilots 103208
Expanded Traffic Advisory Services Using Digital Traffic Data 103206Expanded Traffic Advisory Services Using Digital Traffic Data 103206
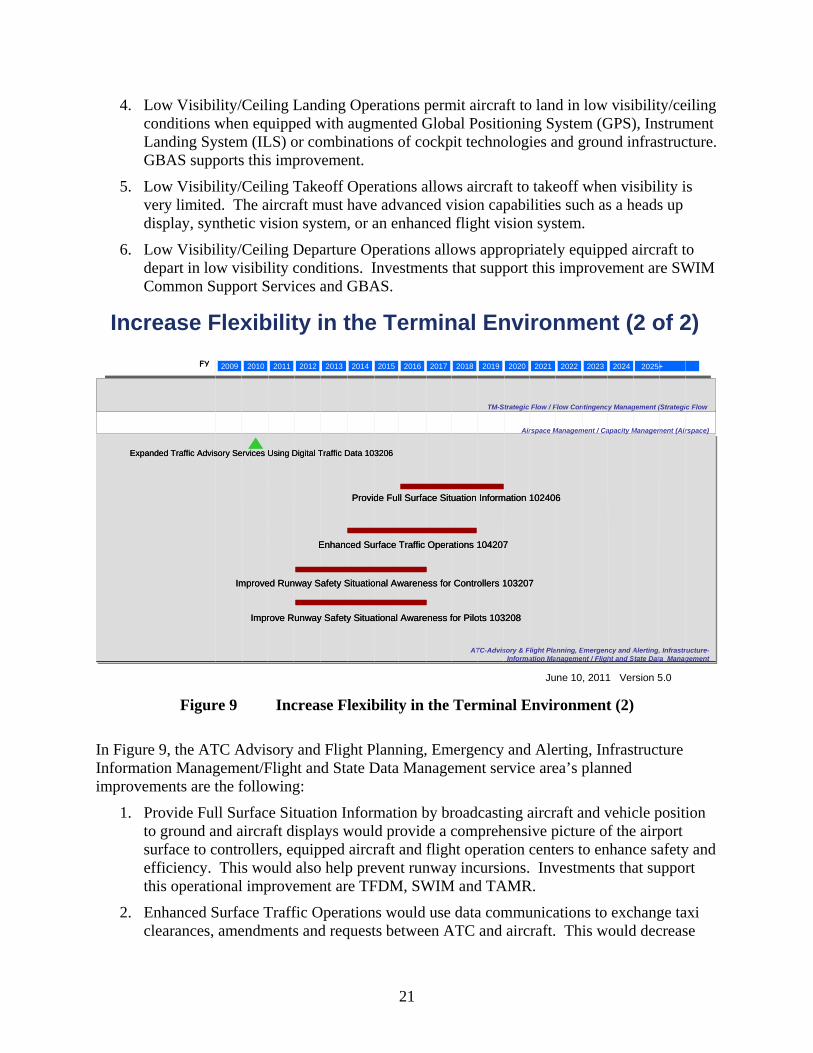
Figure 9 Increase Flexibility in the Terminal Environment (2)
In Figure 9, the ATC Advisory and Flight Planning, Emergency and Alerting, Infrastructure Information Management/Flight and State Data Management service area’s planned improvements are the following:
1. Provide Full Surface Situation Information by broadcasting aircraft and vehicle position to ground and aircraft displays would provide a comprehensive picture of the airport surface to controllers, equipped aircraft and flight operation centers to enhance safety and efficiency. This would also help prevent runway incursions. Investments that support this operational improvement are TFDM, SWIM and TAMR.
2. Enhanced Surface Traffic Operations would use data communications to exchange taxi clearances, amendments and requests between ATC and aircraft. This would decrease
22
the time to provide clearances to aircraft and potentially decrease taxi and takeoff delays. Investments that support this improvement are DataComm, TFDM, and Future Flight Service Program (FFSP).
3. Improved Runway Safety Situational Awareness for Controllers will improve runway safety. Additional ground based capabilities will be developed including improved runway markings and initial controller taxi monitoring capabilities. All of these improvements will increase the controller’s awareness of the location of surface traffic. Investments that support this improvement are TFDM and ASDE.
4. Improved Runway Safety Situational Awareness for Pilots improves pilot awareness of their location on the airport surface. Equipped aircraft will have a surface moving map to display their position and in future enhancements it will show the location of other aircraft near them. Investments that support this improvement are TFDM, ASDE, ADS-B, and Runway Status Lights (RWSL).
3.4 Improve Collaborative Air Traffic Management (CATM)
Summary Description:
This solution set covers strategic and tactical air traffic flow management, including interactions with operators to guide choices when the FAA cannot accommodate the desired route of flight. CATM includes flow programs and collaboration on procedures that will shift flights to alternate routings, altitudes, or times when there is severe weather affecting operators’ planned routes, or when demand for certain routes exceeds capacity. CATM also includes development of systems to distribute and manage aeronautical information, manage airspace reservations, and manage flight information from preflight to post flight analysis. Existing ATM tools for managing system demand and capacity imbalances are relatively coarse. Optimal solutions would minimize the extent to which flights are either over-constrained or under-constrained. Flight restrictions can unnecessarily interfere with optimizing operator efficiency and increase the cost of travel. Restrictions also inhibit operators from specifying a preferred alternative and constrain their involvement in resolving imbalance issues. The overall philosophy driving delivery of CATM services in NextGen is to accommodate flight operator preferences as much as possible. Restrictions should be imposed only when a real operational need exists. If restrictions are required, the goal is to maximize opportunity for aircraft operators to maintain operating efficiency based on their priorities while complying with the restrictions.

23
Timeline:
Improve Collaborative ATM20042005 FY
ATC-Separation Assurance / Separation ManagementTM-Synchronization / Trajectory Management
TM-Strategic Flow / Flow Contingency Management (Strategic Flow)
Improved Management of Special Activity Airspace 108212
Airspace Management / Capacity Management (Airspace)
ATC-Advisory & Flight Planning, Emergency and Alerting, Infrastructure-Information Management / Flight and State Data Management
2009 2011 2012 20132010 2014 2015 2016 2017 2018 2019 2020 2021 202420232022 2025+2009 2011 2012 20132010 2014 2015 2016 2017 2018 2019 2020 2021 2024202320222009 2011 2012 20132010 2014 2015 2016 2017 2018 2019 2020 2021 202420232022 2025+
June 10, 2011 Version 5.0
Continuous Flight Day Evaluation 105302Continuous Flight Day Evaluation 105302
Traffic Management Initiatives with Flight Specific Trajectories 105208Traffic Management Initiatives with Flight Specific Trajectories 105208
Full Collaborative Decision Making 105207Full Collaborative Decision Making 105207
Provide Full Flight Plan Constraint Evaluation with Feedback 101102Provide Full Flight Plan Constraint Evaluation with Feedback 101102
On-Demand NAS Information 103305On-Demand NAS Information 103305
Figure 10 Improve Collaborative ATM
Operational Improvements
This section describes the mid-term planned improvements associated with Improve Collaborative Air Traffic Management. In Figure 10, the Traffic Management Strategic Flow/Flow Contingency Management service area’s planned improvements are the following:
1. Continuous Flight Day Evaluation involves both real-time NAS performance and post-event analysis of traffic management initiatives. Real-time constraints are transmitted to the ATC Command Center to help determine whether ground stops need to be implemented or other air traffic constraints are required. Real-time information minimizes the delays associated with flow restrictions and continuous evaluation of past performance improves future decisions about when they should be used. Investments that support this improvement are the Aeronautical Information Management (AIM), CATM, and System Wide Information Management (SWIM).
2. Traffic Management Initiatives with Flight Specific Trajectories will generate and send flight specific trajectory changes for aircraft to FAA facilities for approval when these

24
initiatives are implemented. This capability will increase the ability to adjust and respond to dynamically changing conditions such as severe weather, air traffic congestion, and system outages. Investments that support this improvement are CATM, ERAM D-position upgrade and system enhancements, and SWIM.
In the Airspace Management/Capacity Management service area the planned improvement is the following:
Improved Management of Special Use Airspace calls for upgrading the automated links used to transfer information concerning status of airspace reserved for special purposes such as military operations. Status changes are transmitted to the flight deck via voice or DataComm. Trajectory planning can then be managed dynamically based on real-time information. The ability to use special use airspace can shorten route lengths and avoid the congestion caused by forcing aircraft into narrow paths between restricted areas. This improvement builds on existing systems with the important upgrade of almost instantaneous information transfer regarding when it is safe to use this airspace. Investments that support this improvement are Aeronautical Information Management (AIM), Collaborative Air Traffic Management Technologies CATMT, ERAM D-position upgrade and system enhancements, ADS-B and SWIM.
In the ATC - Advisory & Flight Planning, Emergency and Alerting, Infrastructure Information Management/Flight and State Data Management service area, the planned improvements are the following:
1. Provide Full Flight Plan Constraint Evaluation with Feedback incorporates constraint information into FAA automation systems and makes this information available to users for pre-departure flight planning. The constraint information includes equipment outages, air traffic congestion, status of special use airspace, and significant weather information. Providing this information will allow selection of the most efficient flight path and avoid adjustments while in flight that increase flight time and fuel burn. Investments that support this improvement are Future Flight Service Program (FFSP), AIM, ERAM D-position upgrade and system enhancements, CATMT and SWIM including Common Support Services.
2. On-Demand NAS Information will provide NAS status and aeronautical information to authorized users and equipped aircraft on demand. This will allow pilots to make informed decisions on routes and conditions at departure and destination airports. Investments that support this improvement include FFSP, AIM, CATMT, ERAM D-position upgrade and system enhancements, ADS-B, and SWIM including Common Support Services.
25
3.5 Reduce Weather Impact:
Summary Description:
Currently, NAS weather data is not well integrated into either manual procedures or automated decision-support systems. Moreover, data is not readily available to the full spectrum of decision makers, and forecast weather is not sufficiently accurate. To support the predicted volume of future air traffic operations, improvements are needed. Unpredicted changes in weather are of prime concern because of the significant impact and disruption they create throughout the entire NAS. The current system does not respond well to unpredicted weather situations or to weather systems that evolve differently than expected. This solution set will improve weather predictions to support proactive planning operations rather than adjusting for impacts after the weather has changed. Improvements include providing accurate, consistent, and integrated weather information to Air Traffic Management Specialists, other air traffic control facilities, airline flight operations centers (FOC), and the flight deck to support both tactical and strategic operational decision-making tools. Other refinements will be developed that improve weather observations, upgrade forecasts, and disseminate weather information to mitigate the severity of weather impacts. Improved forecasts will incorporate a better characterization of uncertainty and assist operators in safely planning and conducting four dimensional, gate-to-gate, trajectory-based operations to not only avoid storm hazards and provide comfortable flight conditions, but also to increase overall efficiency by improving routing/rerouting decision making. Decision support systems will directly incorporate weather data to aid decision makers in developing the best response to potential weather-related operational effects, thus minimizing the level of traffic restrictions required in 0–8 hours planning horizons. The FAA will deploy a Common Data Distribution capability as part of its enterprise solution for information management in conjunction with the SWIM Segment 2 Enterprise Solution. The Common Data Distribution capability will provide as its first products weather information in for the dissemination of weather information to support both real-time operations as well as strategic planning products to enhance collaborative and dynamic NAS decision making. It will provide network access to weather information from many different sources.
26
Timeline:
Reduce Weather Impact20042005 FY
Full Improved Weather Information and Dissemination 103121 Full Improved Weather Information and Dissemination 103121
Initial Improved Weather Information from Non-Ground Based Sensors 103116 Initial Improved Weather Information from Non-Ground Based Sensors 103116
Initial Integration of Weather Information into NAS Automation and Decision Making 103119Initial Integration of Weather Information into NAS Automation and Decision Making 103119
ATC Separation Assurance / Separation Management
TM Synchronization / Trajectory Management
TM Strategic Flow / Flow Contingency Management (Strategic Flow)
Airspace Management / Capacity Management (Airspace)
Deploy FIS-B Nationally 103104Deploy FIS-B Nationally 103104
ATC-Advisory & Flight Planning, Emergency and Alerting, Infrastructure-Information Management / Flight and State Data Management
Full Improved Weather Sensor Network 103122Full Improved Weather Sensor Network 103122
Full Integration of Weather Information into NAS Automation and Decision Making 103123Full Integration of Weather Information into NAS Automation and Decision Making 103123
2009 2011 2012 20132010 2014 2015 2016 2017 2018 2019 2020 2021 202420232022 2025+2009 2011 2012 20132010 2014 2015 2016 2017 2018 2019 2020 2021 2024202320222009 2011 2012 20132010 2014 2015 2016 2017 2018 2019 2020 2021 202420232022 2025+
June 10, 2011 Version 5.0
Figure 11 Reduce Weather Impact
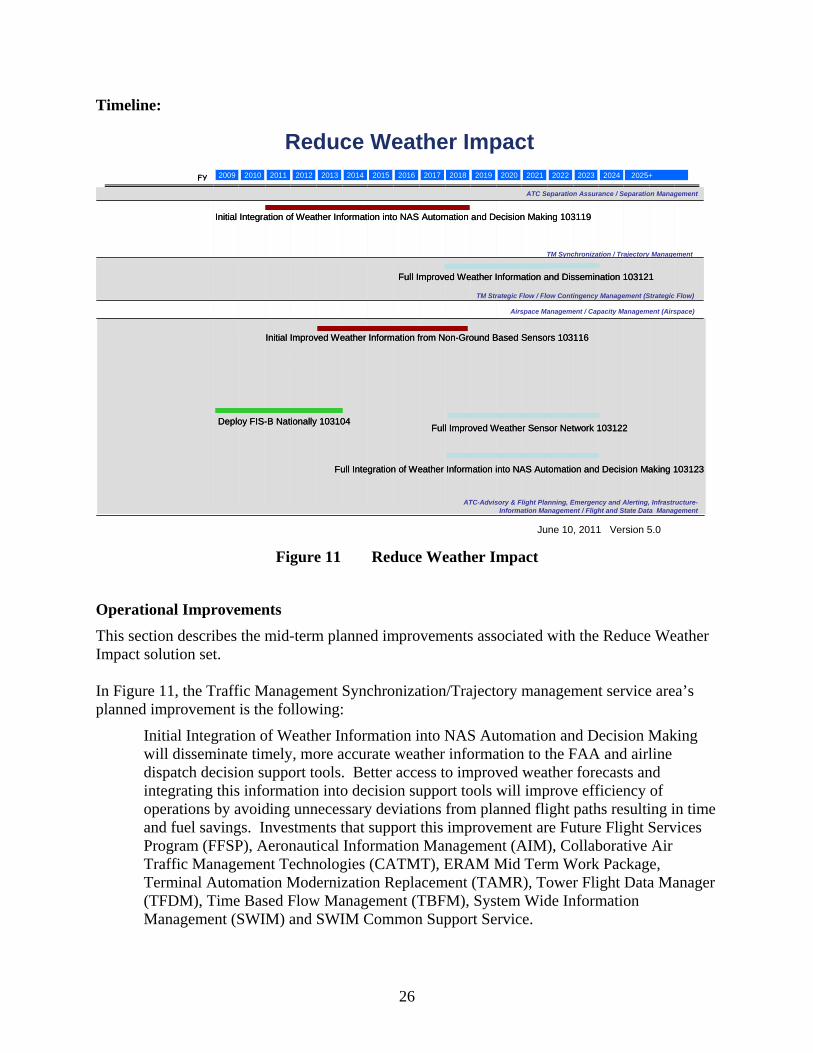
Operational Improvements
This section describes the mid-term planned improvements associated with the Reduce Weather Impact solution set. In Figure 11, the Traffic Management Synchronization/Trajectory management service area’s planned improvement is the following:
Initial Integration of Weather Information into NAS Automation and Decision Making will disseminate timely, more accurate weather information to the FAA and airline dispatch decision support tools. Better access to improved weather forecasts and integrating this information into decision support tools will improve efficiency of operations by avoiding unnecessary deviations from planned flight paths resulting in time and fuel savings. Investments that support this improvement are Future Flight Services Program (FFSP), Aeronautical Information Management (AIM), Collaborative Air Traffic Management Technologies (CATMT), ERAM Mid Term Work Package, Terminal Automation Modernization Replacement (TAMR), Tower Flight Data Manager (TFDM), Time Based Flow Management (TBFM), System Wide Information Management (SWIM) and SWIM Common Support Service.
27
The ATC Advisory & Flight Planning, Emergency and Alerting, Infrastructure Information Management/Flight and State Data Management service area’s planned improvement is the following:
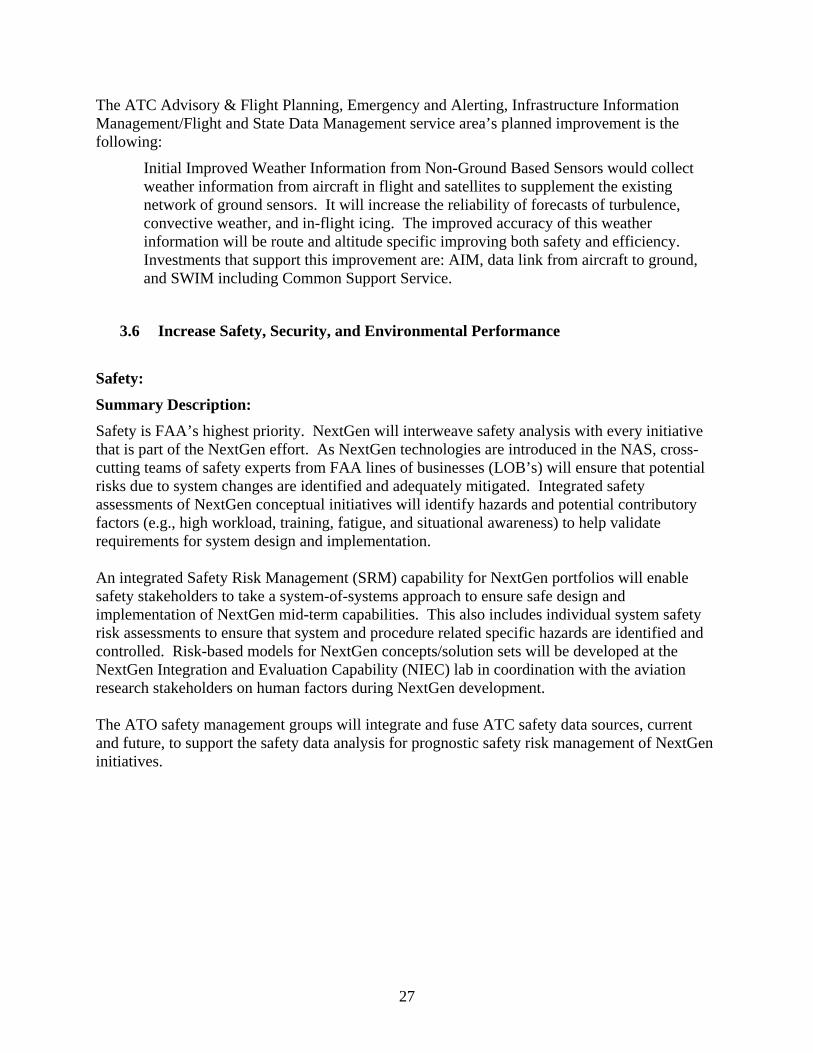
Initial Improved Weather Information from Non-Ground Based Sensors would collect weather information from aircraft in flight and satellites to supplement the existing network of ground sensors. It will increase the reliability of forecasts of turbulence, convective weather, and in-flight icing. The improved accuracy of this weather information will be route and altitude specific improving both safety and efficiency. Investments that support this improvement are: AIM, data link from aircraft to ground, and SWIM including Common Support Service.
3.6 Increase Safety, Security, and Environmental Performance
Safety:
Summary Description:
Safety is FAA’s highest priority. NextGen will interweave safety analysis with every initiative that is part of the NextGen effort. As NextGen technologies are introduced in the NAS, cross-cutting teams of safety experts from FAA lines of businesses (LOB’s) will ensure that potential risks due to system changes are identified and adequately mitigated. Integrated safety assessments of NextGen conceptual initiatives will identify hazards and potential contributory factors (e.g., high workload, training, fatigue, and situational awareness) to help validate requirements for system design and implementation. An integrated Safety Risk Management (SRM) capability for NextGen portfolios will enable safety stakeholders to take a system-of-systems approach to ensure safe design and implementation of NextGen mid-term capabilities. This also includes individual system safety risk assessments to ensure that system and procedure related specific hazards are identified and controlled. Risk-based models for NextGen concepts/solution sets will be developed at the NextGen Integration and Evaluation Capability (NIEC) lab in coordination with the aviation research stakeholders on human factors during NextGen development. The ATO safety management groups will integrate and fuse ATC safety data sources, current and future, to support the safety data analysis for prognostic safety risk management of NextGen initiatives.
28
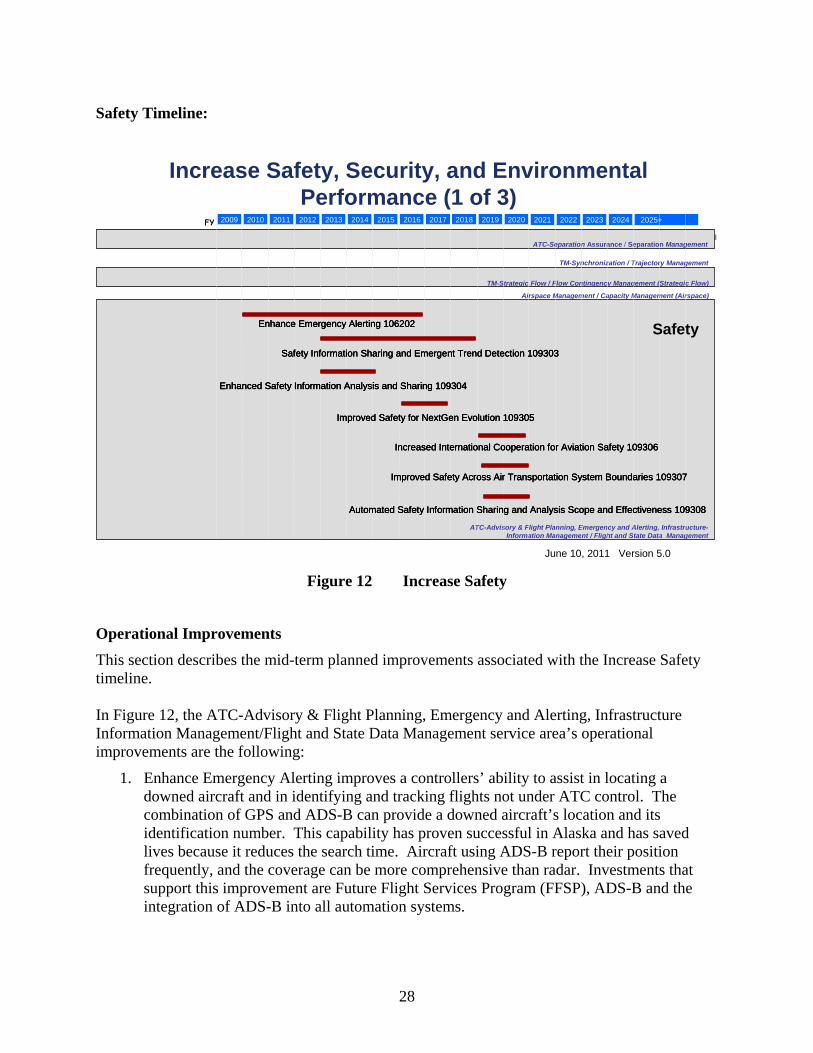
Safety Timeline:
Increase Safety, Security, and Environmental Performance (1 of 3)
20042005 FY
ATC-Separation Assurance / Separation Management
TM-Synchronization / Trajectory Management
TM-Strategic Flow / Flow Contingency Management (Strategic Flow)
Airspace Management / Capacity Management (Airspace)
ATC-Advisory & Flight Planning, Emergency and Alerting, Infrastructure-Information Management / Flight and State Data Management
Airspace Management / Capacity Management (Airspace)
2009 2011 2012 20132010 2014 2015 2016 2017 2018 2019 2020 2021 202420232022 2025+2009 2011 2012 20132010 2014 2015 2016 2017 2018 2019 2020 2021 2024202320222009 2011 2012 20132010 2014 2015 2016 2017 2018 2019 2020 2021 202420232022 2025+
June 10, 2011 Version 5.0
Enhance Emergency Alerting 106202
Safety Information Sharing and Emergent Trend Detection 109303
Enhanced Safety Information Analysis and Sharing 109304
Improved Safety for NextGen Evolution 109305
Increased International Cooperation for Aviation Safety 109306
Improved Safety Across Air Transportation System Boundaries 109307
Automated Safety Information Sharing and Analysis Scope and Effectiveness 109308
Enhance Emergency Alerting 106202Enhance Emergency Alerting 106202
Safety Information Sharing and Emergent Trend Detection 109303Safety Information Sharing and Emergent Trend Detection 109303
Enhanced Safety Information Analysis and Sharing 109304Enhanced Safety Information Analysis and Sharing 109304
Improved Safety for NextGen Evolution 109305Improved Safety for NextGen Evolution 109305
Increased International Cooperation for Aviation Safety 109306Increased International Cooperation for Aviation Safety 109306
Improved Safety Across Air Transportation System Boundaries 109307Improved Safety Across Air Transportation System Boundaries 109307
Automated Safety Information Sharing and Analysis Scope and Effectiveness 109308Automated Safety Information Sharing and Analysis Scope and Effectiveness 109308
Safety
Figure 12 Increase Safety
Operational Improvements
This section describes the mid-term planned improvements associated with the Increase Safety timeline. In Figure 12, the ATC-Advisory & Flight Planning, Emergency and Alerting, Infrastructure Information Management/Flight and State Data Management service area’s operational improvements are the following:
1. Enhance Emergency Alerting improves a controllers’ ability to assist in locating a downed aircraft and in identifying and tracking flights not under ATC control. The combination of GPS and ADS-B can provide a downed aircraft’s location and its identification number. This capability has proven successful in Alaska and has saved lives because it reduces the search time. Aircraft using ADS-B report their position frequently, and the coverage can be more comprehensive than radar. Investments that support this improvement are Future Flight Services Program (FFSP), ADS-B and the integration of ADS-B into all automation systems.
29
2. Safety Information Sharing and Emergent Trend Detection. The System Safety Management Transformation and the Aviation Safety and Information Analysis and Sharing (ASIAS) activities will integrate, evaluate and share high-quality, relevant, and timely safety information that is critical to the success of the Safety Management System (SMS). These activities directly support safety promotion and safety assurance initiatives with analytical results such as baseline information and trends. They also support safety risk management through identifying issues and providing tools for analysis of hazards. Investments that support this improvement are Aeronautical Information Management (AIM), ADS-B, ERAM D-position upgrade and system enhancements, Remote Monitoring and Logging System (RMLS), DataComm, NAS Voice System (NVS), and System Wide Information Management (SWIM).
3. Enhanced Aviation Safety Information and Analysis and Sharing will improve system-wide risk identification, integrated risk analysis and modeling, and implementation of risk management. Investments that support this improvement are the same as those listed in item 2 above.
4. Improved Safety for NextGen Evolution mitigates the safety risk associated with changes to the air transportation system. This improvement provides: advanced capabilities for an integrated and predictive safety assessment of new equipment and procedures; an improved validation and verification process for certification of new equipment; an enhanced focus on developing safe operational procedures; and enhanced training concepts for promoting safe system operation. Investments that support this improvement are DataComm, NVS, Performance Data Analysis and Reporting System (PDARS), Integrated Reporting Information System (IRIS), System Safety Management Transformation, implementation of SMS, Independent Operational Test and Evaluation (IOT&E) and ASIAS.
5. Increased International Cooperation for Aviation Safety will reduce safety risk associated with international operations by harmonizing standards, regulations and procedures. A special focus will be on the handling of dangerous goods
6. Improved Safety Across Air Transportation Boundaries will address similar issues to item 5 above.
7. Automated Safety Information Sharing and Analysis Scope and Effectiveness will automate risk identification and notification processes. This capability will be expanded to include additional data sources and enhanced by actions that improve data security, quality and scope. Investment required for this operational improvement is ASIAS.
Security:
Summary Description:
NAS operations require facility and information security. Facility security deals with protecting air traffic control, communication, and navigation facilities. Information security protects the data within the NAS and is a baseline requirement of each new and existing NAS program. Continuous upgrades are provided as information security technology and best practices improve.

30
Security Timeline:
FY
ATC-Separation Assurance / Separation Management
TM-Synchronization / Trajectory Management
TM-Strategic Flow / Flow Contingency Management (Strategic Flow)
Operational Security Capability for Threat Detection and Tracking, NAS Impact Analysis and Risk-Based Assessment 109302
Operational Security Capability for Threat Detection and Tracking, NAS Impact Analysis and Risk-Based Assessment 109302
Airspace Management / Capacity Management (Airspace)
ATC-Advisory & Flight Planning, Emergency and Alerting, Infrastructure-Information Management / Flight and State Data Management
Operational Security Capability with Dynamic Flight Risk Assessment for Improved Security Airspace Planning and Management 109317
2009 2011 2012 20132010 2014 2015 2016 2017 2018 2019 2020 2021 202420232022 2025+2009 2011 2012 20132010 2014 2015 2016 2017 2018 2019 2020 2021 2024202320222009 2011 2012 20132010 2014 2015 2016 2017 2018 2019 2020 2021 202420232022 2025+
Increase Safety, Security, and Environmental Performance (2 of 3)
June 10, 2011 Version 5.0
Security
Figure 13 Improve Security
Operational Improvements
This section describes the mid-term planned improvements associated with the Improve Security timeline. In Figure 13 the ATC-Advisory & Flight Planning, Emergency and Alerting, Infrastructure Information Management/Flight and State Data Management service area’s operational improvement is the following:
Operational Security Capability for Threat Detection and Tracking, NAS Impact Analysis and Risk Based Assessment address NAS airborne security threats with more effective and efficient prevention, protection, response and recovery based on a net-enabled shared situational awareness and a risk-informed decision-making capability.
Environment:
Summary Description:
Increased attention is being directed at aviation’s impact on the environment — not only regarding longstanding noise and air quality impacts, but also in global climate change and energy consumption. Although aviation has been a relatively small source of emissions and has made significant strides in lessening its environmental “footprint,” the anticipated growth in air transportation demand will increase pressure on aviation to reduce emissions and fuel consumption. NextGen planning must consider and minimize environmental consequences of emissions and noise caused by NextGen operational improvements while improving energy efficiency.
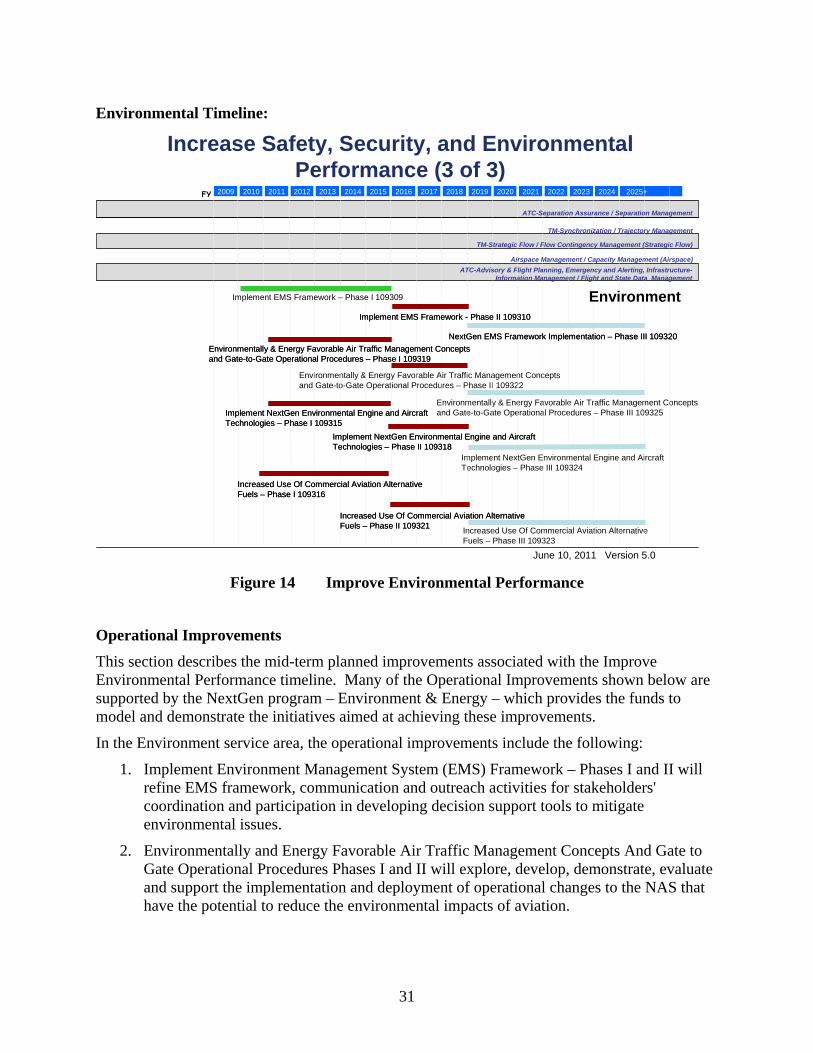
31
Environmental Timeline:
20042005 FY
Environmental
2009 2011 2012 20132010 2014 2015 2016 2017 2018 2019 2020 2021 202420232022 2025+2009 2011 2012 20132010 2014 2015 2016 2017 2018 2019 2020 2021 2024202320222009 2011 2012 20132010 2014 2015 2016 2017 2018 2019 2020 2021 202420232022 2025+
Environmentally & Energy Favorable Air Traffic Management Concepts and Gate-to-Gate Operational Procedures – Phase II 109322
Environmentally & Energy Favorable Air Traffic Management Concepts and Gate-to-Gate Operational Procedures – Phase III 109325
Implement NextGen Environmental Engine and Aircraft Technologies – Phase III 109324
Increased Use Of Commercial Aviation Alternative Fuels – Phase III 109323
Increase Safety, Security, and Environmental Performance (3 of 3)
June 10, 2011 Version 5.0
Increased Use Of Commercial Aviation Alternative Fuels – Phase I 109316Increased Use Of Commercial Aviation Alternative Fuels – Phase I 109316
Implement NextGen Environmental Engine and Aircraft Technologies – Phase I 109315Implement NextGen Environmental Engine and Aircraft Technologies – Phase I 109315
Implement EMS Framework – Phase I 109309
Environmentally & Energy Favorable Air Traffic Management Concepts and Gate-to-Gate Operational Procedures – Phase I 109319Environmentally & Energy Favorable Air Traffic Management Concepts and Gate-to-Gate Operational Procedures – Phase I 109319
NextGen EMS Framework Implementation – Phase III 109320NextGen EMS Framework Implementation – Phase III 109320
Implement NextGen Environmental Engine and Aircraft Technologies – Phase II 109318Implement NextGen Environmental Engine and Aircraft Technologies – Phase II 109318
Increased Use Of Commercial Aviation Alternative Fuels – Phase II 109321Increased Use Of Commercial Aviation Alternative Fuels – Phase II 109321
Implement EMS Framework - Phase II 109310Implement EMS Framework - Phase II 109310
Environment
ATC-Separation Assurance / Separation Management
TM-Synchronization / Trajectory Management
TM-Strategic Flow / Flow Contingency Management (Strategic Flow)
Airspace Management / Capacity Management (Airspace)
ATC-Advisory & Flight Planning, Emergency and Alerting, Infrastructure-Information Management / Flight and State Data Management
Figure 14 Improve Environmental Performance
Operational Improvements
This section describes the mid-term planned improvements associated with the Improve Environmental Performance timeline. Many of the Operational Improvements shown below are supported by the NextGen program – Environment & Energy – which provides the funds to model and demonstrate the initiatives aimed at achieving these improvements.
In the Environment service area, the operational improvements include the following:
1. Implement Environment Management System (EMS) Framework – Phases I and II will refine EMS framework, communication and outreach activities for stakeholders' coordination and participation in developing decision support tools to mitigate environmental issues.
2. Environmentally and Energy Favorable Air Traffic Management Concepts And Gate to Gate Operational Procedures Phases I and II will explore, develop, demonstrate, evaluate and support the implementation and deployment of operational changes to the NAS that have the potential to reduce the environmental impacts of aviation.
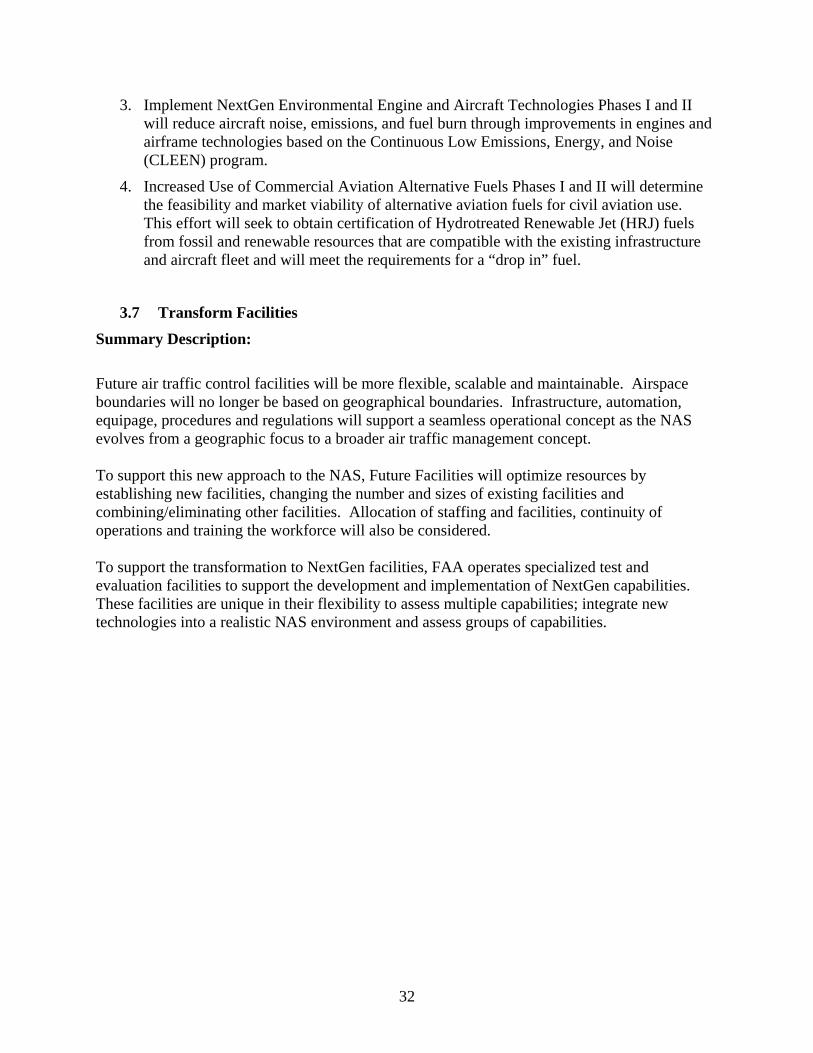
32
3. Implement NextGen Environmental Engine and Aircraft Technologies Phases I and II will reduce aircraft noise, emissions, and fuel burn through improvements in engines and airframe technologies based on the Continuous Low Emissions, Energy, and Noise (CLEEN) program.
4. Increased Use of Commercial Aviation Alternative Fuels Phases I and II will determine the feasibility and market viability of alternative aviation fuels for civil aviation use. This effort will seek to obtain certification of Hydrotreated Renewable Jet (HRJ) fuels from fossil and renewable resources that are compatible with the existing infrastructure and aircraft fleet and will meet the requirements for a “drop in” fuel.
3.7 Transform Facilities
Summary Description:
Future air traffic control facilities will be more flexible, scalable and maintainable. Airspace boundaries will no longer be based on geographical boundaries. Infrastructure, automation, equipage, procedures and regulations will support a seamless operational concept as the NAS evolves from a geographic focus to a broader air traffic management concept. To support this new approach to the NAS, Future Facilities will optimize resources by establishing new facilities, changing the number and sizes of existing facilities and combining/eliminating other facilities. Allocation of staffing and facilities, continuity of operations and training the workforce will also be considered. To support the transformation to NextGen facilities, FAA operates specialized test and evaluation facilities to support the development and implementation of NextGen capabilities. These facilities are unique in their flexibility to assess multiple capabilities; integrate new technologies into a realistic NAS environment and assess groups of capabilities.
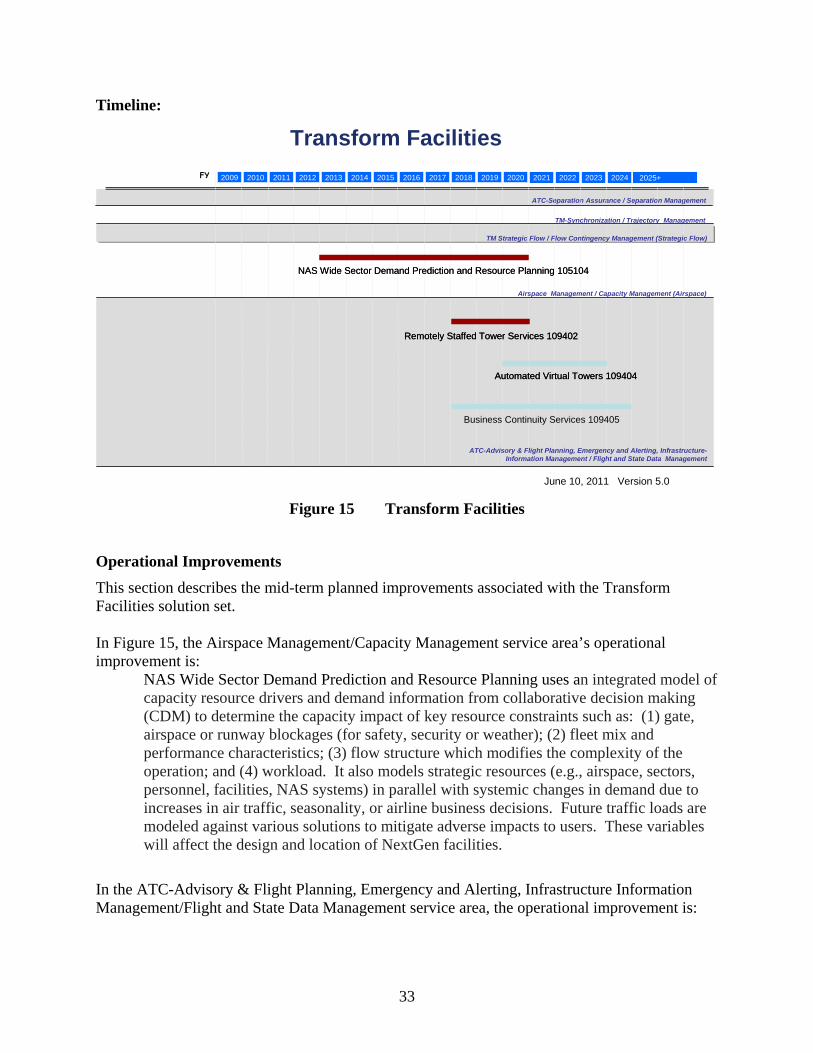
33
Timeline:
ATC-Separation Assurance / Separation Management
Transform Facilities
FY
TM-Synchronization / Trajectory Management
Airspace Management / Capacity Management (Airspace)
TM Strategic Flow / Flow Contingency Management (Strategic Flow)
Remotely Staffed Tower Services 109402Remotely Staffed Tower Services 109402
NAS Wide Sector Demand Prediction and Resource Planning 105104NAS Wide Sector Demand Prediction and Resource Planning 105104
ATC-Advisory & Flight Planning, Emergency and Alerting, Infrastructure-Information Management / Flight and State Data Management
Automated Virtual Towers 109404Automated Virtual Towers 109404
2009 2011 2012 20132010 2014 2015 2016 2017 2018 2019 2020 2021 202420232022 2025+2009 2011 2012 20132010 2014 2015 2016 2017 2018 2019 2020 2021 2024202320222009 2011 2012 20132010 2014 2015 2016 2017 2018 2019 2020 2021 202420232022 2025+
Business Continuity Services 109405
June 10, 2011 Version 5.0
Figure 15 Transform Facilities
Operational Improvements
This section describes the mid-term planned improvements associated with the Transform Facilities solution set. In Figure 15, the Airspace Management/Capacity Management service area’s operational improvement is:
NAS Wide Sector Demand Prediction and Resource Planning uses an integrated model of capacity resource drivers and demand information from collaborative decision making (CDM) to determine the capacity impact of key resource constraints such as: (1) gate, airspace or runway blockages (for safety, security or weather); (2) fleet mix and performance characteristics; (3) flow structure which modifies the complexity of the operation; and (4) workload. It also models strategic resources (e.g., airspace, sectors, personnel, facilities, NAS systems) in parallel with systemic changes in demand due to increases in air traffic, seasonality, or airline business decisions. Future traffic loads are modeled against various solutions to mitigate adverse impacts to users. These variables will affect the design and location of NextGen facilities.
In the ATC-Advisory & Flight Planning, Emergency and Alerting, Infrastructure Information Management/Flight and State Data Management service area, the operational improvement is:

34
Remotely Staffed Tower Services to provide ATM services for operations into and out of selected airports without constructing, equipping and/or sustaining tower facilities at these airports. Investments that support this improvement are Terminal Automation Modernization Replacement (TAMR), Tower Flight Data Manager (TFDM), DataComm, NAS Voice System (NVS), ADS-B, Runway Status Lights (RWSL), Airport Surface Detection Equipment (ASDE), Runway Incursion Reduction Program (RIRP), NextGen Facilities and System Wide Information Management (SWIM).
35
4 Enterprise Architecture Roadmaps The detailed roadmaps appearing in the following subsections are an integral part of the NAS Enterprise Architecture to show progression from the present system to NextGen. The roadmaps show planned activities that extend beyond the 5-year financial horizon covered in the CIP, because the transition to NextGen capabilities will occur incrementally stretching beyond the five year timeframe of the CIP. The roadmaps are the plan for an achievable transition to the sophisticated capabilities needed in order to meet expected future growth in an organized and timely manner. They also help to ensure that the interim steps taken to modernize the existing system are consistent with the future system. Transition to NextGen requires detailed engineering design and testing of both new equipment and operational changes. Many changes will also require aviation users to add equipment to their aircraft and adopt new procedures so the roadmaps serve to inform them of the schedule they should expect for changes to their equipment and crew training. These roadmaps are updated annually to reflect results of studies, demonstration projects, and economic analysis related to projects; however, the roadmaps are and should be reasonably stable from year-to-year. The funding tables at the end of each roadmap section contain both programs that are shown in the roadmap and those that are included in an overall FAA Enterprise Architecture. Some programs that support safety are not directly related to air traffic control equipment, so they are in the funding tables but not in the roadmaps. All programs with estimated funding anytime within the next 5 years (except Activity 5 Personnel Compensation, Benefits and Travel) are described in appendix B. For more detailed information on the roadmaps, view the Enterprise Architecture and Roadmaps at: https://nasea.faa.gov Figure 16 shows and defines the symbols used in the roadmaps. The dashed lines indicate that a system may be drawn down after economic and operational analysis determines that it is no longer necessary. The solid lines indicate either the continued operation of an existing system or the progression from a current system to a more capable or modernized system. The boxes with names identify systems, which are either described in the text or, when they are not described, their acronyms are defined in appendix E.
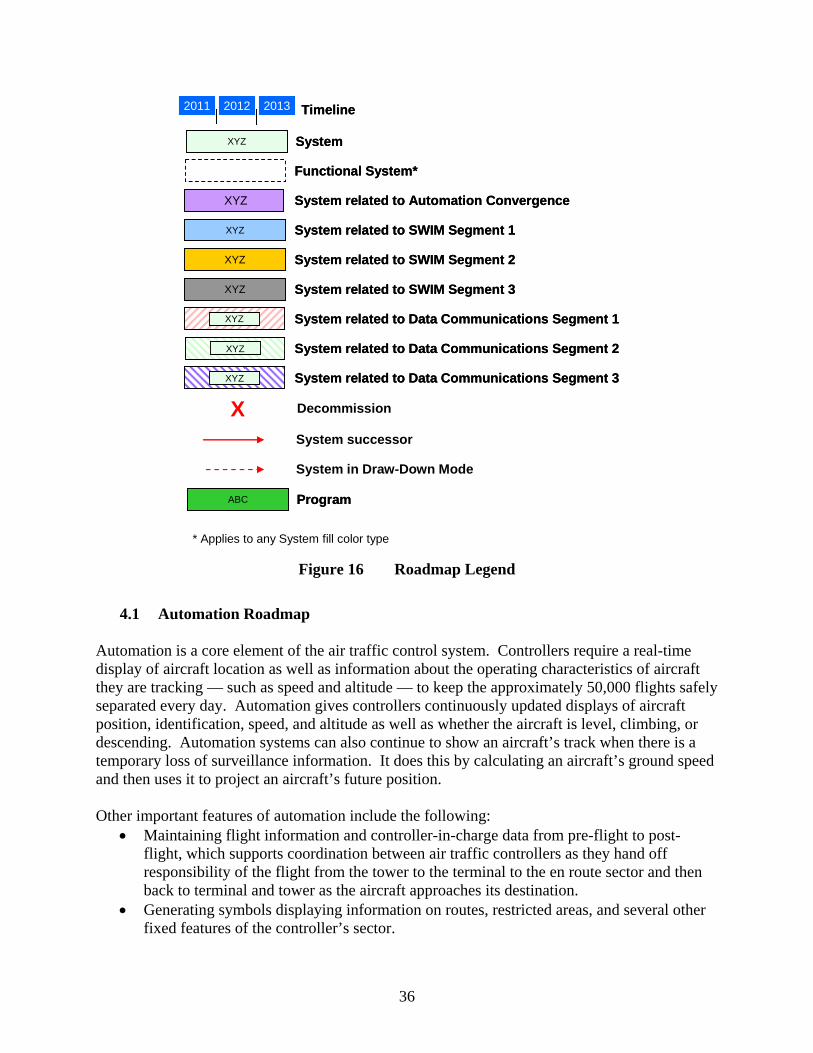
36
XYZ SystemXYZ System
System successor
System in Draw-Down Mode
Decommission X
Timeline2011 2012 2013 Timeline2011 2012 20132011 2012 20132011 2012 2013
XYZ System related to SWIM Segment 1XYZ System related to SWIM Segment 1
XYZ System related to SWIM Segment 2XYZ System related to SWIM Segment 2
XYZ System related to SWIM Segment 3XYZ System related to SWIM Segment 3
* Applies to any System fill color type
XYZ System related to Automation ConvergenceXYZ System related to Automation Convergence
Functional System*Functional System*
System related to Data Communications Segment 1XYZ System related to Data Communications Segment 1XYZXYZ
System related to Data Communications Segment 2XYZ System related to Data Communications Segment 2XYZXYZ
System related to Data Communications Segment 3XYZ System related to Data Communications Segment 3XYZXYZ
ABC ProgramABC Program
Figure 16 Roadmap Legend
4.1 Automation Roadmap
Automation is a core element of the air traffic control system. Controllers require a real-time display of aircraft location as well as information about the operating characteristics of aircraft they are tracking — such as speed and altitude — to keep the approximately 50,000 flights safely separated every day. Automation gives controllers continuously updated displays of aircraft position, identification, speed, and altitude as well as whether the aircraft is level, climbing, or descending. Automation systems can also continue to show an aircraft’s track when there is a temporary loss of surveillance information. It does this by calculating an aircraft’s ground speed and then uses it to project an aircraft’s future position. Other important features of automation include the following:
Maintaining flight information and controller-in-charge data from pre-flight to post-flight, which supports coordination between air traffic controllers as they hand off responsibility of the flight from the tower to the terminal to the en route sector and then back to terminal and tower as the aircraft approaches its destination.
Generating symbols displaying information on routes, restricted areas, and several other fixed features of the controller’s sector.
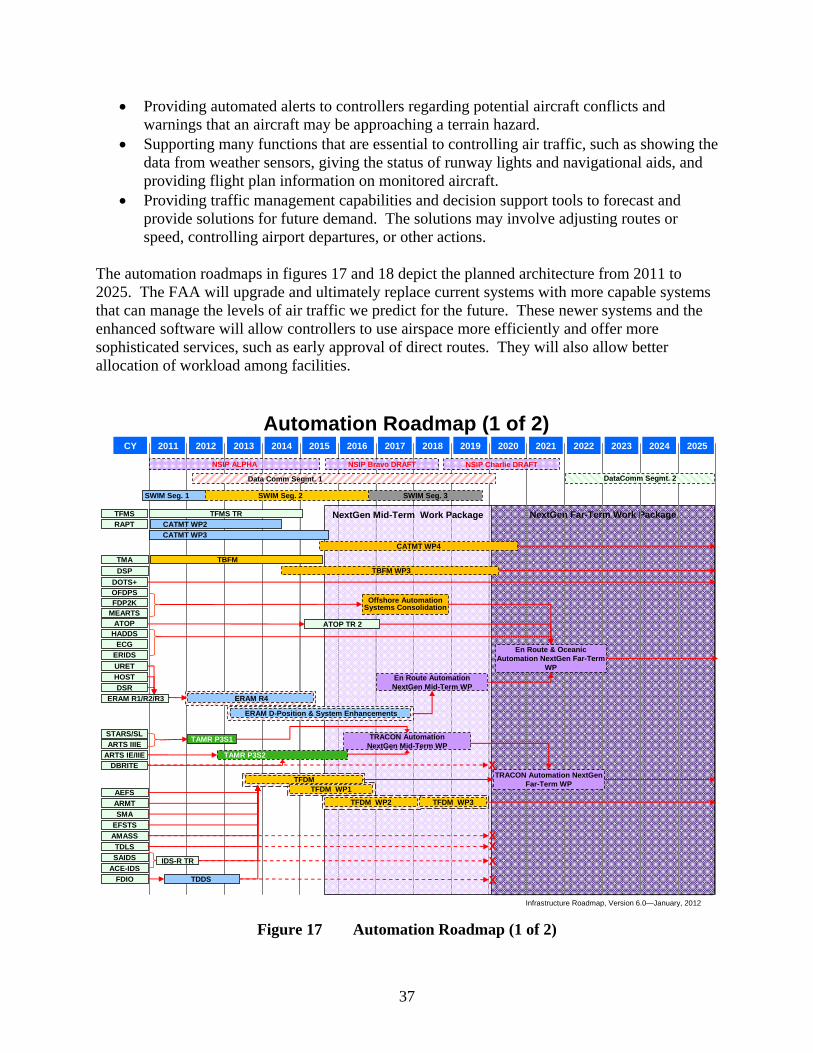
37
Providing automated alerts to controllers regarding potential aircraft conflicts and warnings that an aircraft may be approaching a terrain hazard.
Supporting many functions that are essential to controlling air traffic, such as showing the data from weather sensors, giving the status of runway lights and navigational aids, and providing flight plan information on monitored aircraft.
Providing traffic management capabilities and decision support tools to forecast and provide solutions for future demand. The solutions may involve adjusting routes or speed, controlling airport departures, or other actions.
The automation roadmaps in figures 17 and 18 depict the planned architecture from 2011 to 2025. The FAA will upgrade and ultimately replace current systems with more capable systems that can manage the levels of air traffic we predict for the future. These newer systems and the enhanced software will allow controllers to use airspace more efficiently and offer more sophisticated services, such as early approval of direct routes. They will also allow better allocation of workload among facilities.
NextGen Far-Term Work Package
CY 2011 2013 2014 20152012 2016 2017 2018 2019 2020 2021 2022 2023 2024 2025CY 2011 2013 2014 20152012 2016 2017 2018 2019 2020 2021 2022 2023 2024 2025
NSIP Charlie DRAFT
NextGen Mid-Term Work Package
NSIP Bravo DRAFT
Automation Roadmap (1 of 2)
FDIO
TFDM WP1TFDM
X
TDLS
TDDS
ACE-IDS
SAIDS
ARMT
EFSTS
SMA
AMASS
AEFS
ATOPMEARTS
HOST
URET
DSR
FDP2KOFDPS
ARTS IE/IIE
STARS/SL
ARTS IIIE
Offshore Automation Systems Consolidation
ATOP TR 2
TAMR P3S1
ERAM R4
ERAM D-Position & System Enhancements
TFDM WP2
TRACON Automation NextGen Mid-Term WP
IDS-R TR X
XX
HADDS
ERIDS
ECG
Data Comm Segmt. 1
NSIP ALPHA
DataComm Segmt. 2
En Route Automation NextGen Mid-Term WP
En Route & Oceanic Automation NextGen Far-Term
WP
DOTS+
TFMS TFMS TR
CATMT WP2
CATMT WP4
TMA
DSP
TBFM
RAPT
CATMT WP3
TBFM WP3
TRACON Automation NextGen Far-Term WP
DBRITE X
SWIM Seg. 1 SWIM Seg. 3SWIM Seg. 2
ERAM R1/R2/R3
TAMR P3S2
TFDM WP3
Infrastructure Roadmap, Version 6.0—January, 2012
Figure 17 Automation Roadmap (1 of 2)

38
At the top of the roadmap are the symbols for the various stages of the NextGen System Implementation Plan (NSIP). As NextGen becomes operational, the plans will reflect current capabilities and next steps for further improvements. Two of the enabling technologies for NextGen appear at the top of the automation roadmaps: Data Communications (DataComm) Segments 1 & 2 and System-Wide Information Management (SWIM) Segments 1, 2, & 3. These systems are central to the concept of NextGen which relies on collecting and sharing information to improve operational efficiency. They transmit and receive critical information to support air traffic control in both the en route and terminal environments. DataComm and SWIM will allow improved data sharing that will minimize adjustments to planned trajectories and make more efficient use of airspace capacity. The first four systems on the left side of the roadmap contain the systems used for traffic management, such as the Traffic Flow Management System (TFMS), Route Availability Planning Tool (RAPT), Traffic Management Advisor (TMA) and Departure Spacing Program (DSP). These systems are installed at the Air Traffic Control System Command Center (ATCSCC), en route centers, and busy terminal control facilities. They are used to analyze future demand for en route and terminal services and to strategically plan for how to best accommodate that demand. These systems use real-time displays both of aircraft in flight and of weather affecting aviation to assess which routes are best and to prevent severe congestion at airports. The FAA will continue to improve these functions as described in the Collaborative Air Traffic Management (CATM) NextGen solution set, by expanding collaboration to individual pilots and by improving information exchanged between the FAA and airline dispatch offices. The next group of five programs on the left side comprises the oceanic control programs. The DOTS+ system uses weather information to determine the most fuel-efficient routes based on wind velocity and direction. It will continue in operation through the timeframe of the roadmap. The oceanic automation systems (OFDPS, FDP2K, ATOP, and MEARTS) process data regarding the position of aircraft on oceanic and offshore flights to aid controllers in separating flights in FAA controlled airspace. The FAA plans to establish a program to replace the San Juan, Honolulu, Guam and Anchorage automation systems in 2015 and deploy the replacement automation systems in the 2020 timeframe. The next seven blocks on the left side are components of the en route control system. The En Route Automation Modernization (ERAM) program replaces five of the component pieces with new hardware and revised ATC software, but the ECG, which formats data for ERAM, remains a separate program. ERAM is needed to replace the aging legacy automation infrastructure that is not supportable over the long term, as well as provide a foundation for the agency's transition to NextGen. This new system will have the capacity and expansion potential to support the introduction of Next Gen operational improvements. Improvements to ERAM will be added with a series of releases to take advantage of new capabilities it offers. The ERAM D-position upgrade and system enhancements will build in new software to fully support Trajectory Based Operations.
39
The next three systems (STARS/S L, ARTS 1E/IIE, and ARTS IIIE) are different terminal automation models that the FAA will maintain as separate systems, until the Terminal Automation Modernization and Replacement Phase 3 (TAMR P3) upgrades or replaces them. TAMR Phase 3 Segment 1 (TAMR P3 S1) will initially update 11 larger ARTS systems and TAMR Phase 3 Segment 2 will replace all the current ARTS systems and upgrade the existing Standard Terminal Automation Replacement System (STARS) so they can process position information from the ADS-B system along with information from terminal radars. DBRITE is a tower display that allows tower controllers to determine the location of approaching traffic before it becomes visible to them. The Tower Flight Data Management (TFDM) system supports a phased implementation of a new terminal local area network (LAN)-based infrastructure to reduce redundant displays and integrate flight data functions. TFDM will provide System Wide Information Management (SWIM)-enabled flight data exchanges with other NAS subsystems. TFDM Phase 1 is the initial capability that will integrate data from existing systems. Flight Data Input/Output (FDIO) provides flight plan and other data to operational facilities. The Terminal Data Display System (TDDS) is a project within the SWIM Program to provide publish/subscribe capability for a limited amount of Terminal Data. The Advanced Electronic Flight Strip (AEFS) and Electronic Flight Strip Transfer System (EFSTS) provide printed flight plan information to controllers. The Airport Resource Management Tool (ARMT) provides an assessment of available airport capacity. The Surface Movement Advisor (SMA) provides the status of aircraft moving from the gates to the runways and improves taxiing efficiency. The Airport Movement Area Safety System (AMASS) provides automated warnings of potential runway incursions. The Tower Data Link Services (TDLS) function provides datalink clearances to pilots preparing to depart an airport. The Automated Surface Observing System (ASOS) Controller Equipment-Information Display System (ACE-IDS), and the System Atlanta Information Display System (SAIDS) provide weather and other information to tower controllers.

40
CY 2011 2013 2014 20152012 2016 2017 2018 2019 2020 2021 2022 2023 2024 2025CY 2011 2013 2014 20152012 2016 2017 2018 2019 2020 2021 2022 2023 2024 2025
NextGen Far-Term Work PackageNextGen Mid-Term Work Package
Automation Roadmap (2 of 2)
NASE
NASR
TFR Bldr
AISR
OEAAA
SDAT
CARF
AGIS
USNS
SAMS
GPS RAIM
RMLS
AMMS WP1AMMS Far- Term
RMLS TR
AMMS WP2
RMMS TR
DUAT(S)
OASIS
AFSS CONUS
OASIS TR
DataComm Segmt. 2Data Comm Segmt. 1
X
AIM Segment 2
FNS
Security Integrated Tool Suite
NSIP Charlie DRAFTNSIP Bravo DRAFTNSIP ALPHA
NOP
PDARS
IRIS
CTS
SWIM Seg. 1 SWIM Seg. 3SWIM Seg. 2
Infrastructure Roadmap, Version 6.0—January, 2012
Future Flight Services Program (FFSP)
AIM Segment 1
AIM Segment 3
Figure 18 Automation Roadmap (2 of 2)
The first four systems on the left side of figure 18 are automation tools that gather information on airspace and airport conditions and approved routes and approaches:
OEAAA — Obstruction Evaluation/Airport Airspace Analysis, AISR – Aeronautical Information System Replacement, GPS RAIM — Global Positioning System Receiver Autonomous Integrity Monitor, and USNS — United States NOTAM (Notice to Airmen) System.
The GPS RAIM determines whether there are enough GPS satellites in view during a planned flight for an aircraft navigation receiver to determine if any of the satellites are producing inaccurate or inconsistent navigation data. Aircraft can only use GPS for primary navigation if they can receive signals from a sufficient number of satellites so that their navigation receiver can detect and reject information from a malfunctioning satellite. NOTAMs are notices of temporary changes, such as temporary flight restrictions and runway closures for construction. The next 7 systems (see following bullets) mainly provide status information on airports, airspace, and navigation facilities, but the FAA uses some of them to evaluate airspace. These individual systems will be replaced in three segments with a modernized and consolidated
41
Aeronautical Information Management (AIM) system including the FNS (Federal NOTAM System) supporting Aeronautical Common Services.
CARF — Central Altitude Reservation Function, TFR Bldr — Temporary Flight Restriction Builder, SAMS — Special Airspace Management System, SDAT — Sector Design and Analysis Tool, AGIS – Airport Geographic Information System, NASR — National Airspace System Resources, and NASE — NAS Adaptation Services Environment.
SAMS and CARF inform controllers when airspace ordinarily reserved for military use is available for civilian use. The other systems contain more detailed information about NAS infrastructure and its status or less frequently changed information such as charts and airspace regulations. The AIM program will establish a standard format and a user-friendly interface for finding the information related to a specific route of flight. The Remote Maintenance Logging System (RMLS) serves two functions. It allows the maintenance staff to monitor equipment performance electronically from a central location, and it provides software for management of workforce hours and maintenance actions. The existing system is undergoing a technical refresh. AFSS CONUS, DUATS and OASIS support flight services. Flight services are mostly used by general aviation pilots and include weather briefings and flight plan filings. The Direct User Access Terminals (DUATS) currently allow pilots to file flight plans and obtain weather information for their planned routes from flight service station automation systems. The FAA has contracted for flight services in the lower 48 States, Hawaii and Puerto Rico, and flight service specialists use Automated Flight Service Systems (AFSS CONUS) to record flight plans and provide weather briefings to pilots. Future Flight Service Program (FFSP) is developing alternatives and acquisition strategy for the automation platform for all FSS facilities. Options include integrating graphical and text-based weather products and other aeronautical information for use in pilot briefings; integrating aeronautical data updates with NOTAM and flight plan data into FFSP; and the development of a web portal that will provide both FAA users and aviation community users with access to the same data, improving access to consistent and accurate flight service information. The Security Integrated Tool Set (SITS) is a security system that validates the identity and legitimacy of aircraft within or entering the NAS. There are three systems used to analyze traffic flows and controller actions to determine the most effective ways to handle air traffic. The National Offload Program (NOP) allows FAA to download radar information from en route automation systems for analysis and review. The Performance Data and Analysis System (PDARS) has the same function for terminal systems. The Integrated Reporting Information System (IRIS) works in conjunction with NOP for analysis of en route data.

42
The Coded Time Source (CTS) program seeks to standardize the official source of time that synchronizes the information flows in the air traffic control equipment. It will also determine an appropriate backup to the primary source that can be used in case the primary source fails. Figure 19 shows projected CIP expenditures on automation roadmap programs. Expenditures are in Millions of Dollars.
BLI Number Program Name FY
2013FY
2014FY
2015FY
2016FY
2017
Automation Functional Area $773.6 $701.8 $833.7 $899.5 $809.41A06 Next Generation Air Transportation System (NextGen) - Demonstrations and
Infrastructure Development$24.6 $24.6 $24.6 $24.6 $27.0
1A07 Next Generation Air Transportation System (NextGen) - System Development $61.0 $61.5 $65.5 $65.5 $74.01A08 Next Generation Air Transportation System (NextGen) - Trajectory Based
Operations (TBO)$16.5 $18.0 $18.0 $33.0 $46.0
1A10 Next Generation Air Transportation System (NextGen) - Arrivals/Departures at High Density Airports
$11.0 $8.0 $28.4 $42.4 $37.0
1A11 Next Generation Air Transportation System (NextGen) - Collaborative Air Traffic Management (CATM)
$24.2 $34.0 $36.0 $32.0 $34.0
1A12 Next Generation Air Transportation System (NextGen) - Flexible Terminal Environment
$30.5 $30.5 $25.5 $15.5 $30.5
2A01 En Route Automation Modernization (ERAM) $144.0 $25.6 $0.0 $0.0 $0.02A02 En Route Automation Modernization (ERAM) - D-Position Upgrade and System
Enhancements$10.0 $70.0 $204.0 $165.0 $220.0
2A03 En Route Communications Gateway (ECG) $3.1 $4.8 $4.9 $5.1 $0.02A06 Air Traffic Management (ATM) $21.7 $8.1 $1.9 $0.0 $0.02A10 Oceanic Automation System $4.0 $4.8 $2.0 $0.0 $0.02A12 System-Wide Information Management (SWIM) $57.2 $53.0 $69.3 $71.7 $59.22A15 Collaborative Air Traffic Management Technologies (CATMT) $34.4 $29.4 $3.3 $15.6 $25.02A17 Tactical Flow Time Based Flow Management (TBFM) $12.9 $10.5 $0.5 $3.6 $1.82B03 Standard Terminal Automation Replacement System (STARS) (TAMR Phase 1) $34.5 $42.5 $56.7 $82.3 $55.02B04 Terminal Automation Modernization/ Replacement Program (TAMR Phase 3) $153.0 $136.2 $143.6 $144.8 $25.72B05 Terminal Automation Program $2.5 $2.6 $2.6 $2.7 $2.72B14 Integrated Display System (IDS) $4.2 $8.2 $6.9 $2.3 $1.32B18 Terminal Flight Data Manager (TFDM) $37.6 $40.0 $42.0 $83.3 $117.12C01 Future Flight Services Program (FFSP) - formerly referred to as Flight Service
Automation Modernization (FSAM)$8.0 $25.0 $30.0 $37.0 $8.0
2D08 Instrument Flight Procedures Automation (IFPA) $7.1 $4.5 $2.4 $3.0 $2.03A02 Aviation Safety Analysis System (ASAS) $15.8 $12.7 $11.9 $20.2 $11.33A07 System Approach for Safety Oversight (SASO) $23.0 $11.5 $10.5 $9.5 $9.53A08 Aviation Safety Knowledge Management Environment (ASKME) $12.8 $12.2 $10.2 $7.5 $4.23A11 Aviation Safety Information Analysis and Sharing (ASIAS) $15.0 $15.0 $15.0 $15.0 $15.03A14 Aerospace Medicine Safety Information System (AMSIS) $3.0 $1.9 $3.0 $3.0 $3.14A09 Aeronautical Information Management Program $2.0 $6.7 $15.0 $15.0 $0.0
Figure 19 Expenditures in the Automation Functional Area2
Figure 19 lists funding for systems appearing in the roadmaps as well as the following systems that are part of the overall FAA Enterprise Architecture and support the FAA safety functions:
Aviation Safety Analysis System – Regulation and Certification Infrastructure System Safety (ASAS-RCISS),
System Approach for Safety Oversight (SASO), Aviation Safety Knowledge Management Environment (ASKME), Aviation Safety Information Analysis and Sharing (ASIAS), and
2 * BLI numbers with X represent outyear programs not requested in the FY 2013 President's Budget. FY 2014 – 2017 Out-year funding amounts are estimates.
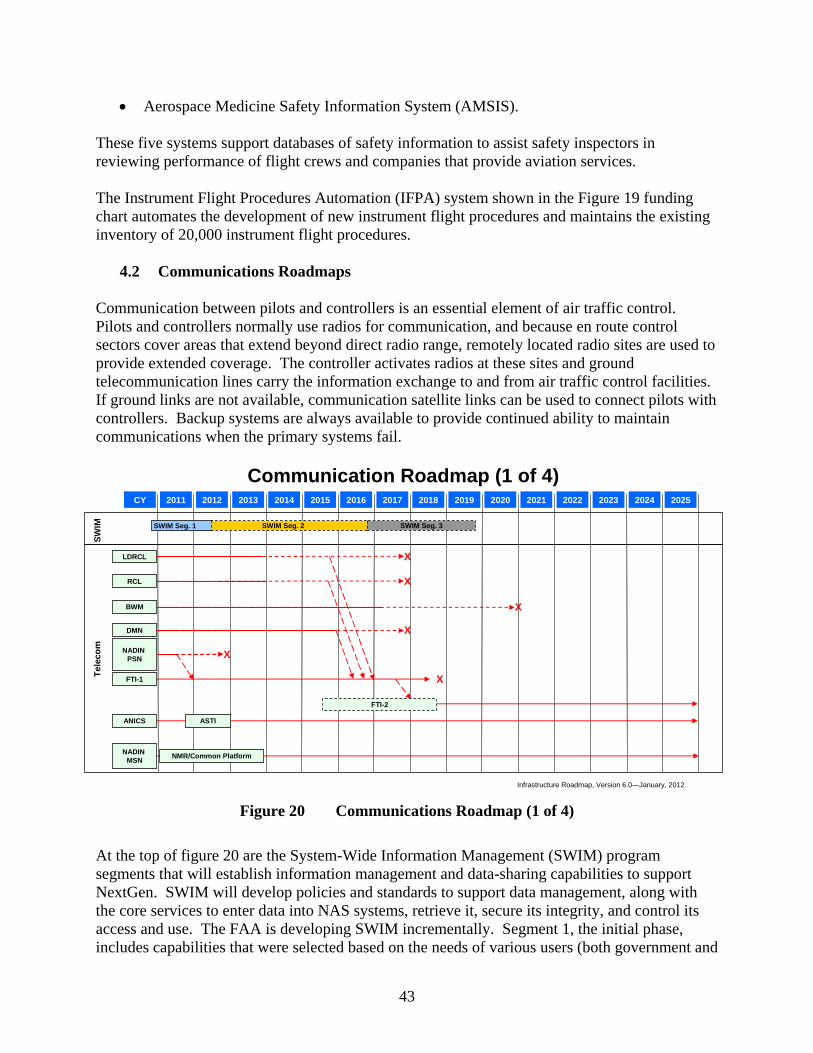
43
Aerospace Medicine Safety Information System (AMSIS). These five systems support databases of safety information to assist safety inspectors in reviewing performance of flight crews and companies that provide aviation services. The Instrument Flight Procedures Automation (IFPA) system shown in the Figure 19 funding chart automates the development of new instrument flight procedures and maintains the existing inventory of 20,000 instrument flight procedures.
4.2 Communications Roadmaps Communication between pilots and controllers is an essential element of air traffic control. Pilots and controllers normally use radios for communication, and because en route control sectors cover areas that extend beyond direct radio range, remotely located radio sites are used to provide extended coverage. The controller activates radios at these sites and ground telecommunication lines carry the information exchange to and from air traffic control facilities. If ground links are not available, communication satellite links can be used to connect pilots with controllers. Backup systems are always available to provide continued ability to maintain communications when the primary systems fail.
CY 2011 2013 2014 20152012 2016 2017 2018 2019 2020 2021 2022 2023 2024 2025
Communication Roadmap (1 of 4)
SW
IM
FTI-1
ANICS
LDRCL
BWM
DMN
NADIN MSN
X
X
X
XTe
lec
om
ASTI
NMR/Common Platform
X
X
FTI-2
SWIM Seg. 1 SWIM Seg. 3SWIM Seg. 2
Infrastructure Roadmap, Version 6.0—January, 2012
RCL
NADIN PSN
Figure 20 Communications Roadmap (1 of 4)
At the top of figure 20 are the System-Wide Information Management (SWIM) program segments that will establish information management and data-sharing capabilities to support NextGen. SWIM will develop policies and standards to support data management, along with the core services to enter data into NAS systems, retrieve it, secure its integrity, and control its access and use. The FAA is developing SWIM incrementally. Segment 1, the initial phase, includes capabilities that were selected based on the needs of various users (both government and
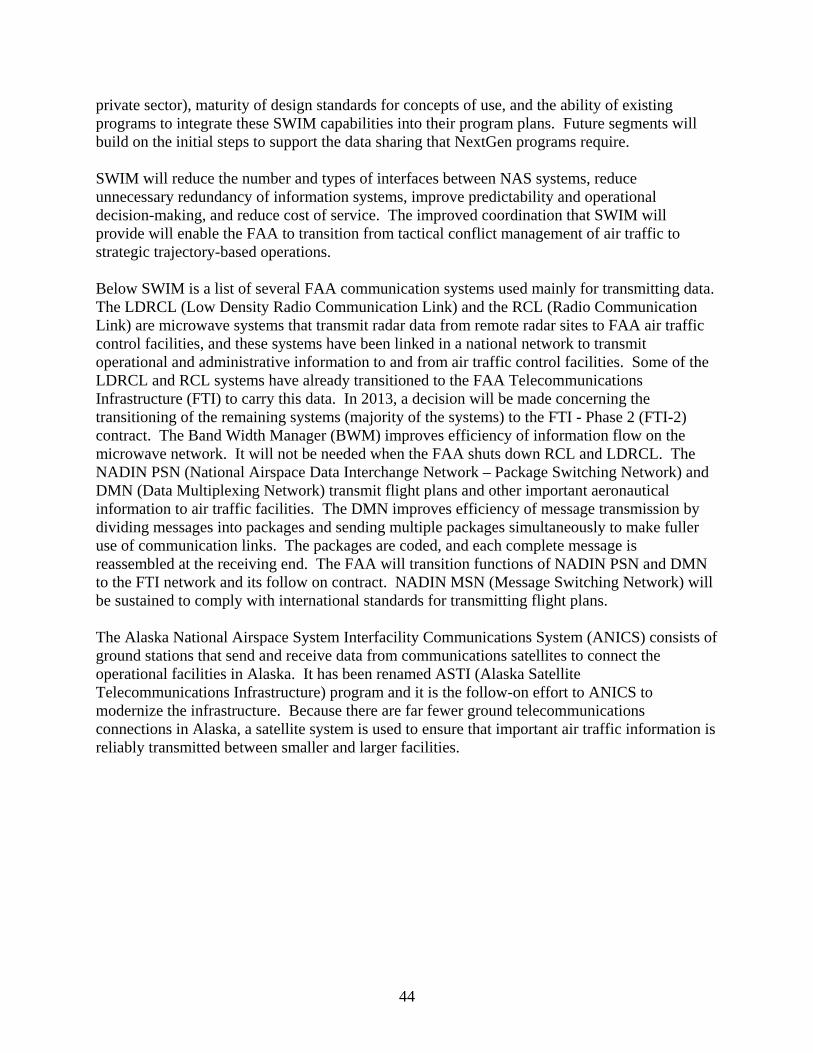
44
private sector), maturity of design standards for concepts of use, and the ability of existing programs to integrate these SWIM capabilities into their program plans. Future segments will build on the initial steps to support the data sharing that NextGen programs require. SWIM will reduce the number and types of interfaces between NAS systems, reduce unnecessary redundancy of information systems, improve predictability and operational decision-making, and reduce cost of service. The improved coordination that SWIM will provide will enable the FAA to transition from tactical conflict management of air traffic to strategic trajectory-based operations. Below SWIM is a list of several FAA communication systems used mainly for transmitting data. The LDRCL (Low Density Radio Communication Link) and the RCL (Radio Communication Link) are microwave systems that transmit radar data from remote radar sites to FAA air traffic control facilities, and these systems have been linked in a national network to transmit operational and administrative information to and from air traffic control facilities. Some of the LDRCL and RCL systems have already transitioned to the FAA Telecommunications Infrastructure (FTI) to carry this data. In 2013, a decision will be made concerning the transitioning of the remaining systems (majority of the systems) to the FTI - Phase 2 (FTI-2) contract. The Band Width Manager (BWM) improves efficiency of information flow on the microwave network. It will not be needed when the FAA shuts down RCL and LDRCL. The NADIN PSN (National Airspace Data Interchange Network – Package Switching Network) and DMN (Data Multiplexing Network) transmit flight plans and other important aeronautical information to air traffic facilities. The DMN improves efficiency of message transmission by dividing messages into packages and sending multiple packages simultaneously to make fuller use of communication links. The packages are coded, and each complete message is reassembled at the receiving end. The FAA will transition functions of NADIN PSN and DMN to the FTI network and its follow on contract. NADIN MSN (Message Switching Network) will be sustained to comply with international standards for transmitting flight plans. The Alaska National Airspace System Interfacility Communications System (ANICS) consists of ground stations that send and receive data from communications satellites to connect the operational facilities in Alaska. It has been renamed ASTI (Alaska Satellite Telecommunications Infrastructure) program and it is the follow-on effort to ANICS to modernize the infrastructure. Because there are far fewer ground telecommunications connections in Alaska, a satellite system is used to ensure that important air traffic information is reliably transmitted between smaller and larger facilities.
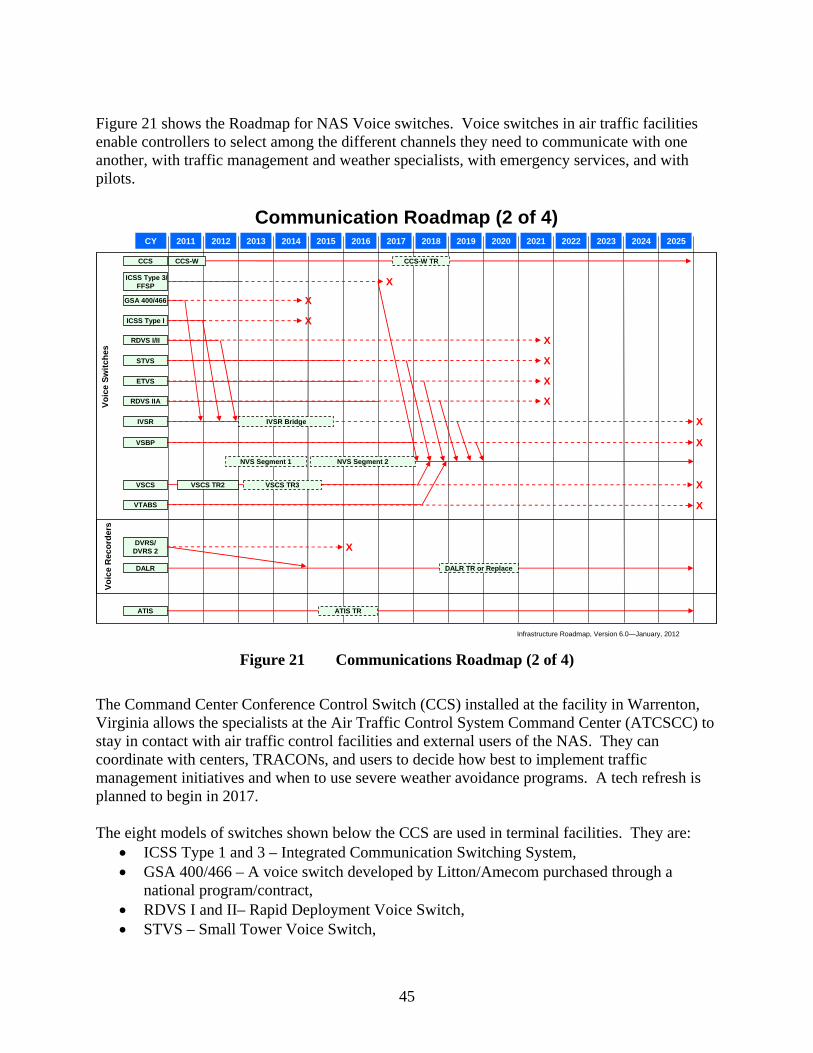
45
Figure 21 shows the Roadmap for NAS Voice switches. Voice switches in air traffic facilities enable controllers to select among the different channels they need to communicate with one another, with traffic management and weather specialists, with emergency services, and with pilots.
CY 2011 2013 2014 20152012 2016 2017 2018 2019 2020 2021 2022 2023 2024 2025
Communication Roadmap (2 of 4)
Vo
ice
Sw
itch
es
CCS
GSA 400/466
ICSS Type I
ICSS Type 3/FFSP
VSCS
RDVS I/II
ETVS
RDVS IIA
STVS
IVSR
NVS Segment 2
CCS-W
X
X
X
X
X
X
X
DVRS/DVRS 2
DALR
X
NVS Segment 1
X
X
CCS-W TR
ATIS TR
DALR TR or Replace
VSBP X
VSCS TR3VSCS TR2
IVSR Bridge
VTABS X
Infrastructure Roadmap, Version 6.0—January, 2012
Vo
ice
Rec
ord
ers
ATIS
Figure 21 Communications Roadmap (2 of 4)
The Command Center Conference Control Switch (CCS) installed at the facility in Warrenton, Virginia allows the specialists at the Air Traffic Control System Command Center (ATCSCC) to stay in contact with air traffic control facilities and external users of the NAS. They can coordinate with centers, TRACONs, and users to decide how best to implement traffic management initiatives and when to use severe weather avoidance programs. A tech refresh is planned to begin in 2017. The eight models of switches shown below the CCS are used in terminal facilities. They are:
ICSS Type 1 and 3 – Integrated Communication Switching System, GSA 400/466 – A voice switch developed by Litton/Amecom purchased through a
national program/contract, RDVS I and II– Rapid Deployment Voice Switch, STVS – Small Tower Voice Switch,
46
ETVS – Enhanced Terminal Voice Switch, and IVSR – Interim Voice Switch Replacement.
The ETVS program is replacing terminal voice switches at the rate of about 10 per year, as well as installing voice switches in newly constructed airport traffic control towers. The VSBP (Voice Switch By Pass) is a backup voice switch that terminal controllers can use to stay in communication with pilots if there is a failure in the primary voice switch installed in their facility. The Voice Switching and Communications System (VSCS) is the voice switch used in ARTCCs. The FAA is upgrading the VSCS with a technical refresh to replace components that have a high failure rate. The VTABS (VSCS Training and Backup Switch) will maintain critical air-to-ground and ground-to-ground communications if the main communications system becomes inoperable as a result of a power outage, a catastrophic system failure, or during system maintenance or upgrade activities. The FAA has begun developing requirements for the NAS Voice System (NVS). The NVS program will include voice switches, air/ground (A/G) radio control equipment, and the associated transmission services. The NVS will provide flexible networking for voice switch-to-voice switch connectivity as well as for voice switch to A/G radio connectivity. This architecture will facilitate meeting NextGen requirements for ATC workload sharing, unmanned aircraft system (UAS) operations, virtual tower operations, and business continuity. NVS will replace ARTCC and TRACON voice switches. Depending on the results of further analysis, NVS may replace some or all of the ATCT switches.
The Digital Voice Recorder System Replacement (DVRS) program is upgrading the digital recorders that keep a record of controller voice messages that can be used for safety analysis and when approved the Digital Audio Legal Recorder (DALR) program will replace these recorders. The Automated Terminal Information System (ATIS) broadcasts weather and other pertinent information to pilots as they approach an airport. We will maintain the ATIS functions during the entire timeframe of the roadmap, and a technical refreshment of ATIS is scheduled in 2013.
47
CY 2011 2013 2014 20152012 2016 2017 2018 2019 2020 2021 2022 2023 2024 2025
Communication Roadmap (3 of 4)
NEXCOM Seg. 2
A/G
Vo
ice
UHF RadiosReplacement
UHF GroundRadios
VHF GroundRadios
ETR UHF/VHFTransceivers
VHFHandheld
RFI ELIM
BUEC
RCE
Interference Detection
Location & Mitigation
X
Oc
ean
ic
Air
-Gro
un
d
Infrastructure Roadmap, Version 6.0—January, 2012
Oceanic HFVoice Service
Airport Cable Loop
NEXCOM Seg. 1A
MDR VHFGround Radios
Oceanic SatelliteData link Service
Figure 22 Communications Roadmap (3 of 4)
The third communications roadmap (figure 22) shows the programs that improve the radios used for air-ground communications and some of the supporting services to sustain NAS operations. The Next Generation Air/Ground Communications (NEXCOM) program is upgrading Very High Frequency (VHF) radios used by civil users and Ultra High Frequency (UHF) radios used by military aircraft. NEXCOM Segment 1A will replace the radios used for high and ultrahigh en route sectors. Segment 2 will replace the radios that terminal facilities use and will be a combined contract for both VHF and UHF radios. It will also upgrade emergency backup radios (ETR) used if the primary radios are not working. The Back Up Emergency Communication (BUEC) program replaced the radios installed at remote sites that back up the primary radios that controllers use. The Radio Control Equipment (RCE) program is ongoing, and it modernizes the electronic equipment that allows controllers to control the radios they use at remote sites. The Airport Cable Loop program replaces the communications cables that control and report the condition of equipment necessary for airport operations such as the Airport Surveillance Radar. FAA is replacing copper wires with fiber optics and adding dual path operations so that a break in the cable does not stop the flow of information.
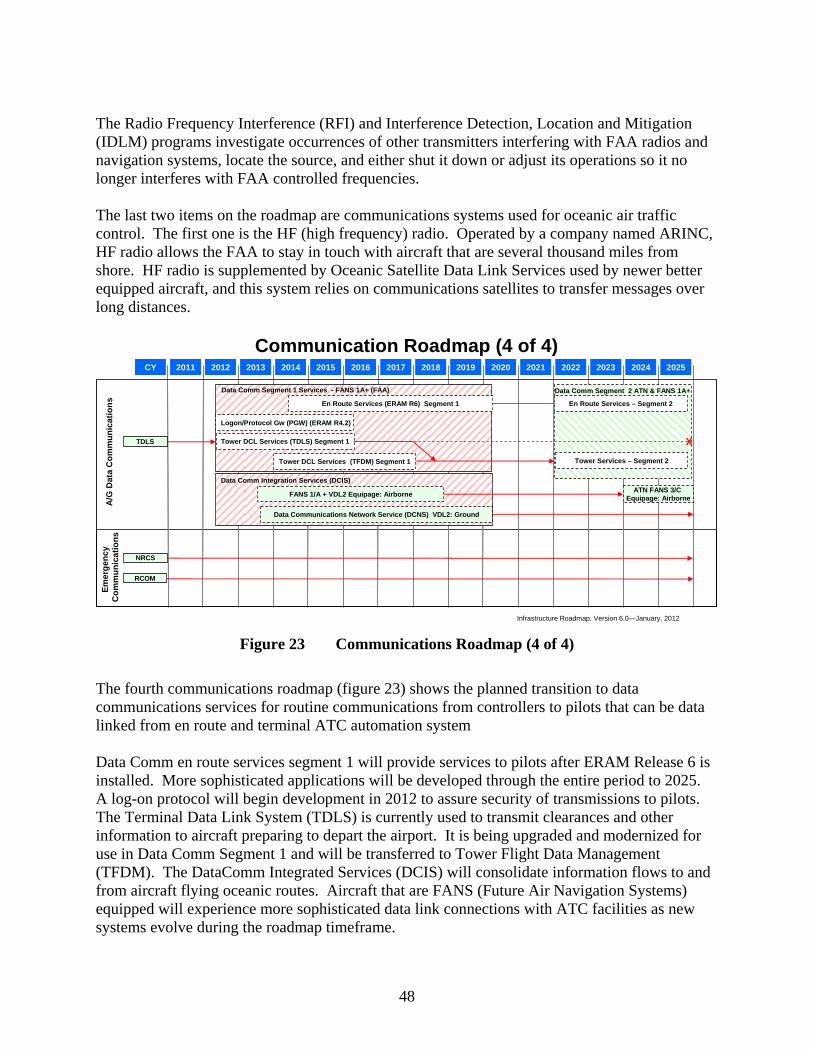
48
The Radio Frequency Interference (RFI) and Interference Detection, Location and Mitigation (IDLM) programs investigate occurrences of other transmitters interfering with FAA radios and navigation systems, locate the source, and either shut it down or adjust its operations so it no longer interferes with FAA controlled frequencies. The last two items on the roadmap are communications systems used for oceanic air traffic control. The first one is the HF (high frequency) radio. Operated by a company named ARINC, HF radio allows the FAA to stay in touch with aircraft that are several thousand miles from shore. HF radio is supplemented by Oceanic Satellite Data Link Services used by newer better equipped aircraft, and this system relies on communications satellites to transfer messages over long distances.
Em
erg
ency
C
om
mu
nic
ati
on
s
CY 2011 2013 2014 20152012 2016 2017 2018 2019 2020 2021 2022 2023 2024 2025
A/G
Dat
a C
om
mu
nic
ati
on
s
ATN FANS 3/C Equipage: Airborne
En Route Services (ERAM R6) Segment 1
Data Comm Segment 2 ATN & FANS 1A+
Communication Roadmap (4 of 4)
Data Comm Segment 1 Services - FANS 1A+ (FAA)
Tower DCL Services (TFDM) Segment 1
Tower DCL Services (TDLS) Segment 1
Tower Services – Segment 2
En Route Services – Segment 2
RCOM
X
Infrastructure Roadmap, Version 6.0—January, 2012
NRCS
Logon/Protocol Gw (PGW) (ERAM R4.2)
TDLS
Data Communications Network Service (DCNS) VDL2: Ground
Data Comm Integration Services (DCIS)
FANS 1/A + VDL2 Equipage: Airborne
Figure 23 Communications Roadmap (4 of 4)
The fourth communications roadmap (figure 23) shows the planned transition to data communications services for routine communications from controllers to pilots that can be data linked from en route and terminal ATC automation system Data Comm en route services segment 1 will provide services to pilots after ERAM Release 6 is installed. More sophisticated applications will be developed through the entire period to 2025. A log-on protocol will begin development in 2012 to assure security of transmissions to pilots. The Terminal Data Link System (TDLS) is currently used to transmit clearances and other information to aircraft preparing to depart the airport. It is being upgraded and modernized for use in Data Comm Segment 1 and will be transferred to Tower Flight Data Management (TFDM). The DataComm Integrated Services (DCIS) will consolidate information flows to and from aircraft flying oceanic routes. Aircraft that are FANS (Future Air Navigation Systems) equipped will experience more sophisticated data link connections with ATC facilities as new systems evolve during the roadmap timeframe.
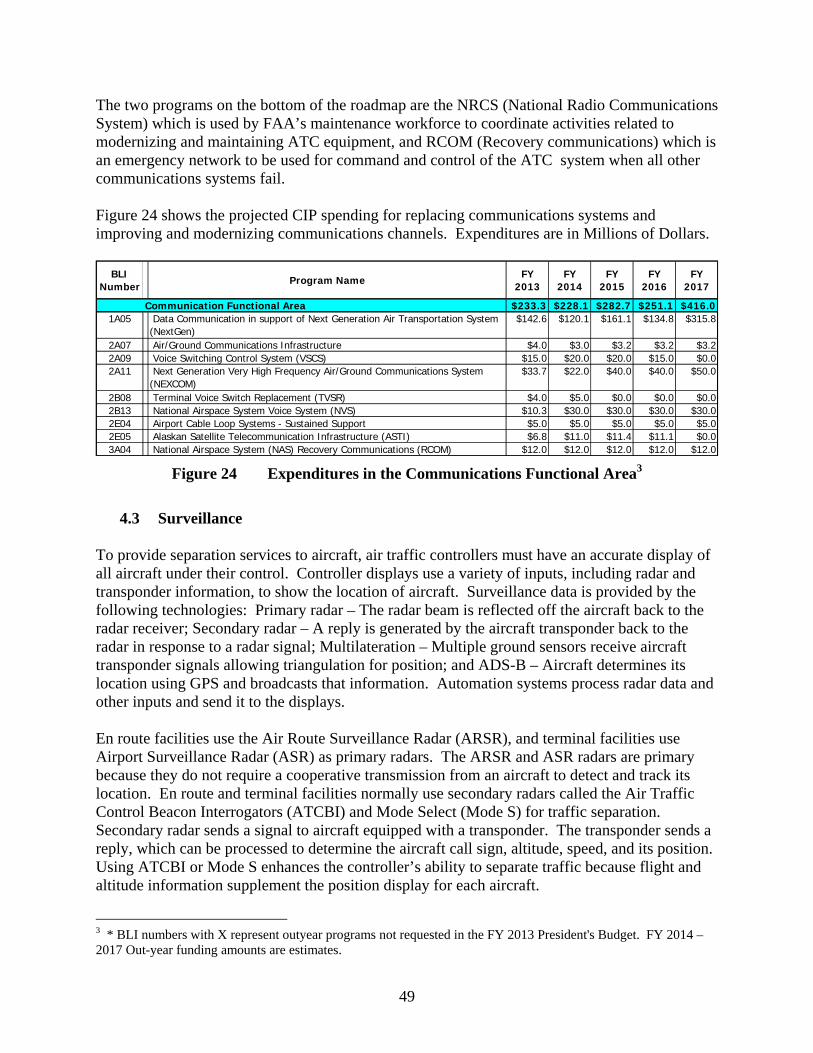
49
The two programs on the bottom of the roadmap are the NRCS (National Radio Communications System) which is used by FAA’s maintenance workforce to coordinate activities related to modernizing and maintaining ATC equipment, and RCOM (Recovery communications) which is an emergency network to be used for command and control of the ATC system when all other communications systems fail. Figure 24 shows the projected CIP spending for replacing communications systems and improving and modernizing communications channels. Expenditures are in Millions of Dollars.
BLI
NumberProgram Name
FY 2013
FY 2014
FY 2015
FY 2016
FY 2017
Communication Functional Area $233.3 $228.1 $282.7 $251.1 $416.01A05 Data Communication in support of Next Generation Air Transportation System
(NextGen)$142.6 $120.1 $161.1 $134.8 $315.8
2A07 Air/Ground Communications Infrastructure $4.0 $3.0 $3.2 $3.2 $3.22A09 Voice Switching Control System (VSCS) $15.0 $20.0 $20.0 $15.0 $0.02A11 Next Generation Very High Frequency Air/Ground Communications System
(NEXCOM)$33.7 $22.0 $40.0 $40.0 $50.0
2B08 Terminal Voice Switch Replacement (TVSR) $4.0 $5.0 $0.0 $0.0 $0.02B13 National Airspace System Voice System (NVS) $10.3 $30.0 $30.0 $30.0 $30.02E04 Airport Cable Loop Systems - Sustained Support $5.0 $5.0 $5.0 $5.0 $5.02E05 Alaskan Satellite Telecommunication Infrastructure (ASTI) $6.8 $11.0 $11.4 $11.1 $0.03A04 National Airspace System (NAS) Recovery Communications (RCOM) $12.0 $12.0 $12.0 $12.0 $12.0
Figure 24 Expenditures in the Communications Functional Area3
4.3 Surveillance
To provide separation services to aircraft, air traffic controllers must have an accurate display of all aircraft under their control. Controller displays use a variety of inputs, including radar and transponder information, to show the location of aircraft. Surveillance data is provided by the following technologies: Primary radar – The radar beam is reflected off the aircraft back to the radar receiver; Secondary radar – A reply is generated by the aircraft transponder back to the radar in response to a radar signal; Multilateration – Multiple ground sensors receive aircraft transponder signals allowing triangulation for position; and ADS-B – Aircraft determines its location using GPS and broadcasts that information. Automation systems process radar data and other inputs and send it to the displays. En route facilities use the Air Route Surveillance Radar (ARSR), and terminal facilities use Airport Surveillance Radar (ASR) as primary radars. The ARSR and ASR radars are primary because they do not require a cooperative transmission from an aircraft to detect and track its location. En route and terminal facilities normally use secondary radars called the Air Traffic Control Beacon Interrogators (ATCBI) and Mode Select (Mode S) for traffic separation. Secondary radar sends a signal to aircraft equipped with a transponder. The transponder sends a reply, which can be processed to determine the aircraft call sign, altitude, speed, and its position. Using ATCBI or Mode S enhances the controller’s ability to separate traffic because flight and altitude information supplement the position display for each aircraft.
3 * BLI numbers with X represent outyear programs not requested in the FY 2013 President's Budget. FY 2014 – 2017 Out-year funding amounts are estimates.
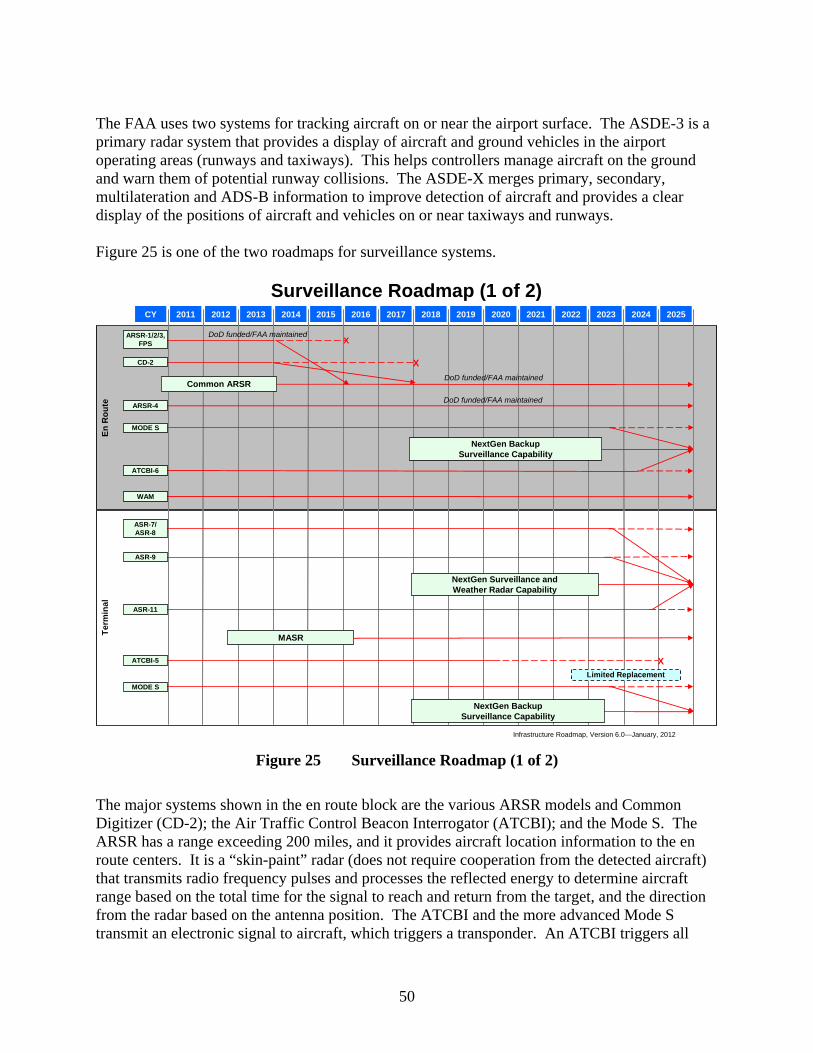
50
The FAA uses two systems for tracking aircraft on or near the airport surface. The ASDE-3 is a primary radar system that provides a display of aircraft and ground vehicles in the airport operating areas (runways and taxiways). This helps controllers manage aircraft on the ground and warn them of potential runway collisions. The ASDE-X merges primary, secondary, multilateration and ADS-B information to improve detection of aircraft and provides a clear display of the positions of aircraft and vehicles on or near taxiways and runways. Figure 25 is one of the two roadmaps for surveillance systems.
Surveillance Roadmap (1 of 2)
Ter
min
alE
n R
ou
te
CY 2011 2013 2014 20152012 2016 2017 2018 2019 2020 2021 2022 2023 2024 2025CY 2011 2013 2014 20152012 2016 2017 2018 2019 2020 2021 2022 2023 2024 2025
DoD funded/FAA maintained
ARSR-1/2/3, FPS X
DoD funded/FAA maintained
CD-2
ARSR-4
MODE S
ATCBI-6
WAM
DoD funded/FAA maintained
Common ARSR
NextGen BackupSurveillance Capability
X
X
ASR-7/ASR-8
ASR-9
ASR-11
ATCBI-5
MODE S
NextGen Surveillance andWeather Radar Capability
Limited Replacement
NextGen BackupSurveillance Capability
MASR
Infrastructure Roadmap, Version 6.0—January, 2012
Figure 25 Surveillance Roadmap (1 of 2)
The major systems shown in the en route block are the various ARSR models and Common Digitizer (CD-2); the Air Traffic Control Beacon Interrogator (ATCBI); and the Mode S. The ARSR has a range exceeding 200 miles, and it provides aircraft location information to the en route centers. It is a “skin-paint” radar (does not require cooperation from the detected aircraft) that transmits radio frequency pulses and processes the reflected energy to determine aircraft range based on the total time for the signal to reach and return from the target, and the direction from the radar based on the antenna position. The ATCBI and the more advanced Mode S transmit an electronic signal to aircraft, which triggers a transponder. An ATCBI triggers all
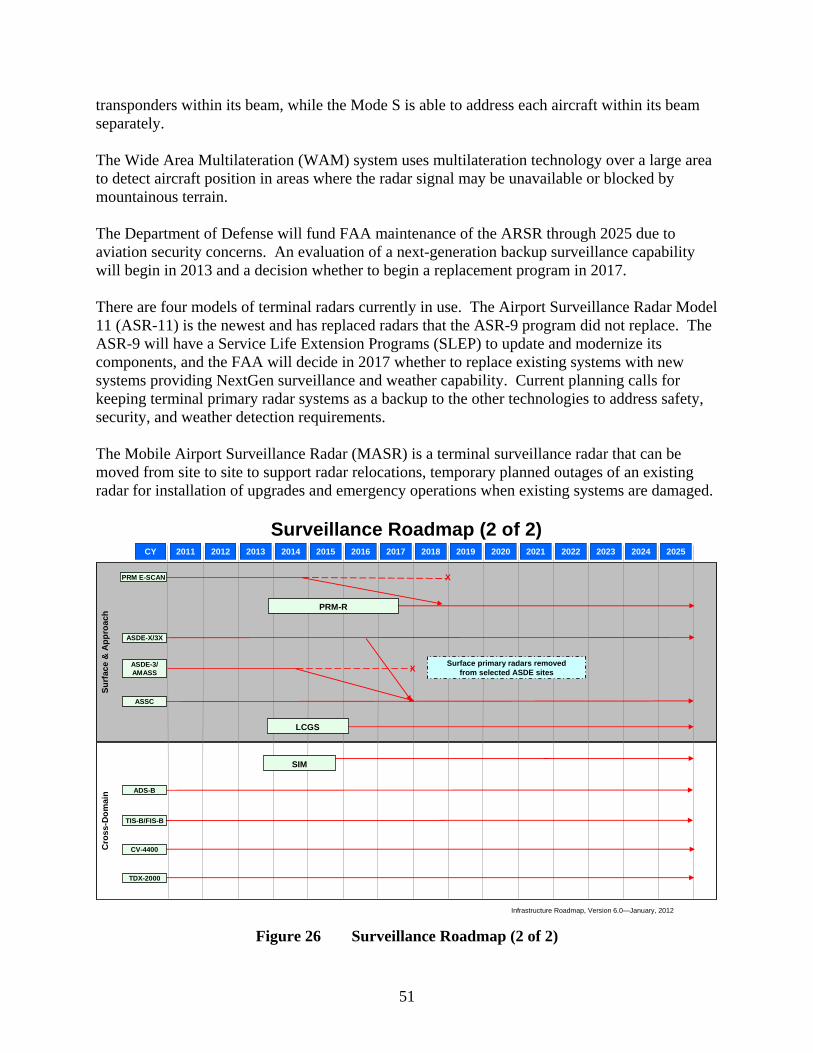
51
transponders within its beam, while the Mode S is able to address each aircraft within its beam separately. The Wide Area Multilateration (WAM) system uses multilateration technology over a large area to detect aircraft position in areas where the radar signal may be unavailable or blocked by mountainous terrain. The Department of Defense will fund FAA maintenance of the ARSR through 2025 due to aviation security concerns. An evaluation of a next-generation backup surveillance capability will begin in 2013 and a decision whether to begin a replacement program in 2017. There are four models of terminal radars currently in use. The Airport Surveillance Radar Model 11 (ASR-11) is the newest and has replaced radars that the ASR-9 program did not replace. The ASR-9 will have a Service Life Extension Programs (SLEP) to update and modernize its components, and the FAA will decide in 2017 whether to replace existing systems with new systems providing NextGen surveillance and weather capability. Current planning calls for keeping terminal primary radar systems as a backup to the other technologies to address safety, security, and weather detection requirements. The Mobile Airport Surveillance Radar (MASR) is a terminal surveillance radar that can be moved from site to site to support radar relocations, temporary planned outages of an existing radar for installation of upgrades and emergency operations when existing systems are damaged.
Cro
ss-
Do
mai
nS
urf
ace
& A
pp
roac
h
CY 2011 2013 2014 20152012 2016 2017 2018 2019 2020 2021 2022 2023 2024 2025CY 2011 2013 2014 20152012 2016 2017 2018 2019 2020 2021 2022 2023 2024 2025
Surveillance Roadmap (2 of 2)
X
X
PRM E-SCAN
ASDE-X/3X
ASDE-3/AMASS
ASSC
ADS-B
TIS-B/FIS-B
CV-4400
TDX-2000
PRM-R
Surface primary radars removedfrom selected ASDE sites
LCGS
SIM
Infrastructure Roadmap, Version 6.0—January, 2012
Figure 26 Surveillance Roadmap (2 of 2)
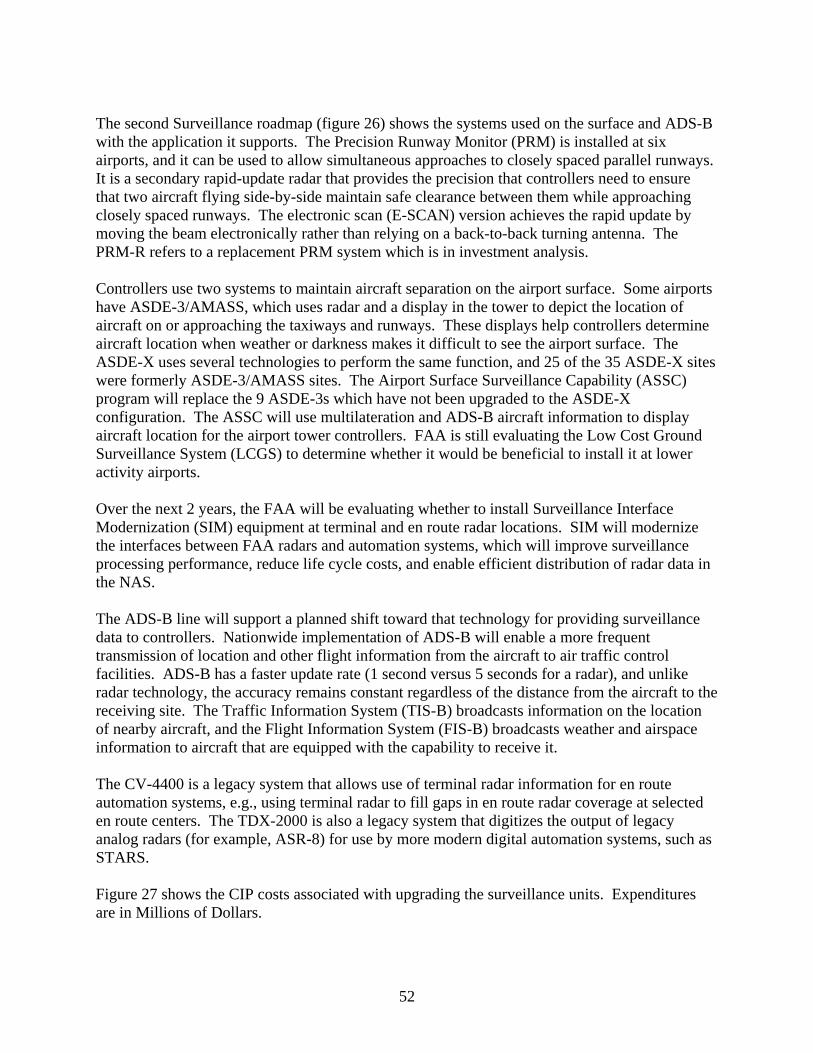
52
The second Surveillance roadmap (figure 26) shows the systems used on the surface and ADS-B with the application it supports. The Precision Runway Monitor (PRM) is installed at six airports, and it can be used to allow simultaneous approaches to closely spaced parallel runways. It is a secondary rapid-update radar that provides the precision that controllers need to ensure that two aircraft flying side-by-side maintain safe clearance between them while approaching closely spaced runways. The electronic scan (E-SCAN) version achieves the rapid update by moving the beam electronically rather than relying on a back-to-back turning antenna. The PRM-R refers to a replacement PRM system which is in investment analysis. Controllers use two systems to maintain aircraft separation on the airport surface. Some airports have ASDE-3/AMASS, which uses radar and a display in the tower to depict the location of aircraft on or approaching the taxiways and runways. These displays help controllers determine aircraft location when weather or darkness makes it difficult to see the airport surface. The ASDE-X uses several technologies to perform the same function, and 25 of the 35 ASDE-X sites were formerly ASDE-3/AMASS sites. The Airport Surface Surveillance Capability (ASSC) program will replace the 9 ASDE-3s which have not been upgraded to the ASDE-X configuration. The ASSC will use multilateration and ADS-B aircraft information to display aircraft location for the airport tower controllers. FAA is still evaluating the Low Cost Ground Surveillance System (LCGS) to determine whether it would be beneficial to install it at lower activity airports. Over the next 2 years, the FAA will be evaluating whether to install Surveillance Interface Modernization (SIM) equipment at terminal and en route radar locations. SIM will modernize the interfaces between FAA radars and automation systems, which will improve surveillance processing performance, reduce life cycle costs, and enable efficient distribution of radar data in the NAS. The ADS-B line will support a planned shift toward that technology for providing surveillance data to controllers. Nationwide implementation of ADS-B will enable a more frequent transmission of location and other flight information from the aircraft to air traffic control facilities. ADS-B has a faster update rate (1 second versus 5 seconds for a radar), and unlike radar technology, the accuracy remains constant regardless of the distance from the aircraft to the receiving site. The Traffic Information System (TIS-B) broadcasts information on the location of nearby aircraft, and the Flight Information System (FIS-B) broadcasts weather and airspace information to aircraft that are equipped with the capability to receive it. The CV-4400 is a legacy system that allows use of terminal radar information for en route automation systems, e.g., using terminal radar to fill gaps in en route radar coverage at selected en route centers. The TDX-2000 is also a legacy system that digitizes the output of legacy analog radars (for example, ASR-8) for use by more modern digital automation systems, such as STARS. Figure 27 shows the CIP costs associated with upgrading the surveillance units. Expenditures are in Millions of Dollars.
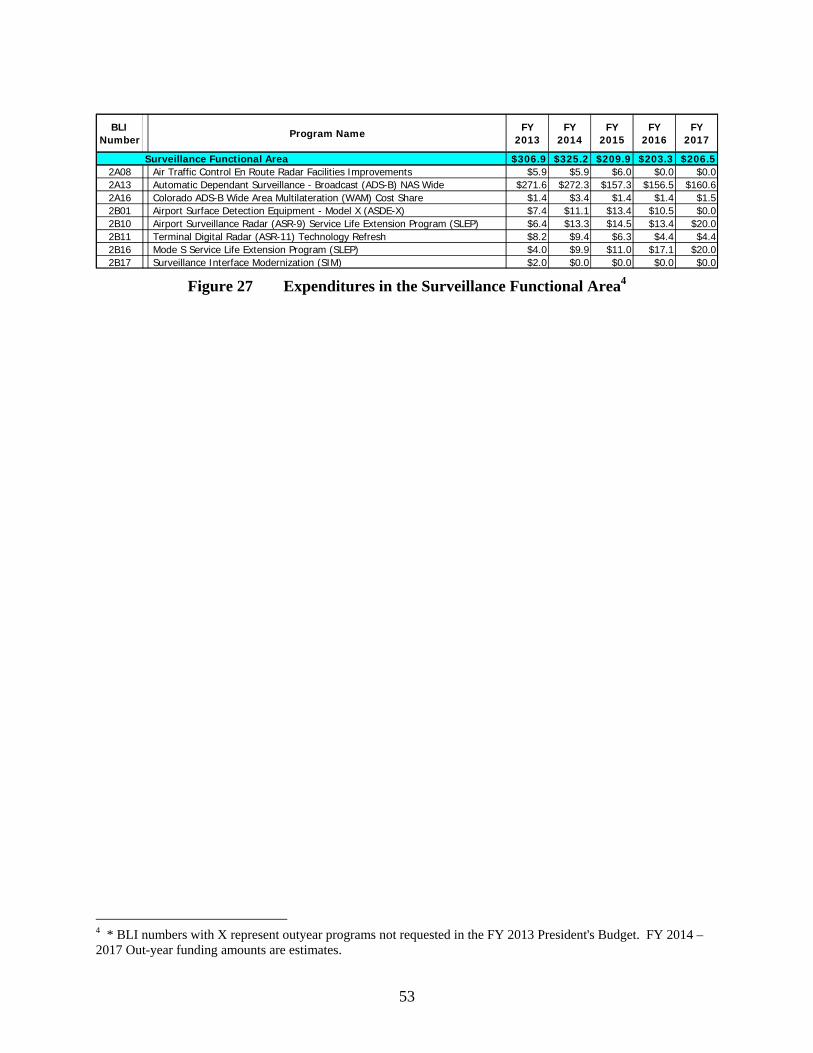
53
BLI
NumberProgram Name
FY 2013
FY 2014
FY 2015
FY 2016
FY 2017
Surveillance Functional Area $306.9 $325.2 $209.9 $203.3 $206.52A08 Air Traffic Control En Route Radar Facilities Improvements $5.9 $5.9 $6.0 $0.0 $0.02A13 Automatic Dependant Surveillance - Broadcast (ADS-B) NAS Wide $271.6 $272.3 $157.3 $156.5 $160.62A16 Colorado ADS-B Wide Area Multilateration (WAM) Cost Share $1.4 $3.4 $1.4 $1.4 $1.52B01 Airport Surface Detection Equipment - Model X (ASDE-X) $7.4 $11.1 $13.4 $10.5 $0.02B10 Airport Surveillance Radar (ASR-9) Service Life Extension Program (SLEP) $6.4 $13.3 $14.5 $13.4 $20.02B11 Terminal Digital Radar (ASR-11) Technology Refresh $8.2 $9.4 $6.3 $4.4 $4.42B16 Mode S Service Life Extension Program (SLEP) $4.0 $9.9 $11.0 $17.1 $20.02B17 Surveillance Interface Modernization (SIM) $2.0 $0.0 $0.0 $0.0 $0.0
Figure 27 Expenditures in the Surveillance Functional Area4
4 * BLI numbers with X represent outyear programs not requested in the FY 2013 President's Budget. FY 2014 – 2017 Out-year funding amounts are estimates.

54
4.4 Navigation Roadmaps
There are two major types of navigational aids: those used for en route navigation, and those used for precision approach and landing guidance. The en route aids have traditionally been radio transmitters that provide pilots direction and/or distance from their location. The ground-based system commonly used for en route navigation is the Very High Frequency Omnidirectional Range with Distance Measuring Equipment (VOR with DME). There are more than 1,000 VORs spread across the United States. They enable pilots to determine an accurate position and also define the Victor and Jet airways, which are published routes based on straight lines from VOR to VOR. Airways simplify route planning and provide predictability for air traffic controllers who often must project an aircraft’s future position to avoid conflicts. Pilots use VOR/DME to follow their planned routes accurately under all visibility conditions. As NextGen is implemented and more aircraft are equipped, the Global Positioning System (GPS) satellite navigation system will be more widely used for en route navigation. Using GPS will support more direct routing because pilots will be able to program and fly routes defined by geographic coordinates rather than flying from VOR to VOR. The ADS-B capability also allows GPS receivers in the aircraft to report an aircraft’s position. Precision landing guidance systems and associated equipment support low-visibility operations by providing radio signals and approach lights to help pilots land safely in limited visibility. The current most widely-used precision landing aids are Instrument Landing Systems (ILS) that guide pilots to runway ends using a pair of radio beams – one for lateral guidance and the other for vertical guidance - to define the approach glidepath - so that pilots can follow it to the runway using cockpit instrumentation. There are more than 1,200 ILSs installed in the United States. They are essential to airlines for maintaining schedule reliability during adverse weather conditions. Augmented GPS satellite signals also provide precision landing guidance. There are two augmentation systems that will be used for this purpose. The Space Based Augmentation System (SBAS) is the FAA’s Wide Area Augmentation System (WAAS) that uses a network of 38 ground monitors to calculate corrections to the GPS signals and broadcast those corrections from telecommunications satellites. WAAS-equipped aircraft can use the information to fly a precision approach to a runway in low-visibility conditions. There are currently more than 1,300 WAAS precision approach procedures referred to as Localizer Performance with Vertical Guidance (LPV) that use GPS augmented by WAAS for both horizontal and vertical guidance.

55
Figures 28 and 29 show the roadmaps for navigation aids.
CY 2011 2013 2014 20152012 2016 2017 2018 2019 2020 2021 2022 2023 2024 2025
Navigation Roadmap (1 of 2)C
AT
I o
r E
qu
ival
ent
SBAS/LPV
Pre
cis
ion
Ap
pro
ach
/Su
rfa
ce
Nav
iga
tio
n
RVR
ALS (I)
ILS (I)
LP DME
Saf
ety
& E
nh
anc
emen
ts
ALSIP -NTSB
RSA
CA
T I
I/II
I
ALS (II/III)
ILS (II/III)
MB
RVR
DME/PAPI CAST
LP DME
ELVO
RWSL
Phase III Phase IV (2014-2028)
RID
Infrastructure Roadmap, Version 6.0—January, 2012
Phase II Phase III (2015-2025)
Figure 28 Navigation Roadmap (1 of 2)
There are three categories of precision approach. Category I is the most common. It guides the pilot to the runway end, but it requires that the pilot be able to see the runway when the aircraft is no less than 200 feet above the field elevation, and the horizontal visibility is one-half mile or more. The Category II and III approaches allow aircraft to descend to lower minimums (i.e., less vertical and horizontal visibility is required). Currently, ILS is the primary system used for precision approaches. Category II and III ILS have redundancy and reliability levels that reduce the risk of equipment failures and allow lower minimums. An alternative for precision approach guidance is the SBAS LPV. As this alternative comes into broader use, the FAA can consider decommissioning ILS. The FAA plans to make an initial decision in 2014 whether to begin a drawdown of Category I ILS, and a decision in 2020 whether to decommission all remaining Category I ILSs. The Low Power DME (LPDME) is being installed to support advanced procedures requiring performance based navigation equipage and specially trained pilots to minimize approach paths and, as discussed below, to replace marker beacons. In both Category I and II/III sections of the roadmap the Approach Light System (ALS) and the Runway Visual Range (RVR) systems are shown. The ALS helps the pilot see the end of the
56
runway and transition from instrument to visual flight for landing before reaching runway minimums. The RVR informs the tower of the measured visibility so that controllers can inform the pilot whether the runway visibility is above or below minimums. In the Category II section the existing MB (Marker Beacon) installations are being evaluated to determine how many of these existing systems can be replaced by DMEs. The FAA is testing use of light-emitting diodes (LED) to replace the incandescent lamps currently in use in ALS to reduce both maintenance and operating costs. The approach lights and visibility sensors will need to be sustained and remain in operation for precision approach guidance regardless of any decision on decommissioning ILSs. The Safety Enhancements section of the roadmap shows several systems designed to assist pilots to operate safely. They are:
ELVO – Enhanced Low Visibility Operations which is a technology to help pilots see the runways in very limited visibility conditions,
DME/PAPI CAST – Additional DME are installed to improve navigation and to meet the recommendations of the Civil Aviation Safety Task Force (CAST). The number of Precision Approach Path Indicators (PAPI) is increased to improve visual guidance to pilots as they approach a runway,
RWSL – Runway Status Lights are designed to give pilots a stop signal if it is dangerous to enter or cross a runway,
RID – Runway Incursion Devices are various pieces of equipment to warn aircraft and other vehicles of potential runway incursions,
ALSIP/NTSB – The Airport Lighting System Improvement program is a response to the National Transportation Safety Board recommendation to replace steel airport light supports with breakable structures to minimize damage to aircraft that descend below the glidepath, and
RSA – Runway Safety Area is a program to replace all structures in the safety area surrounding a runway with low impact supports to minimize damage to aircraft that veer off the runway.
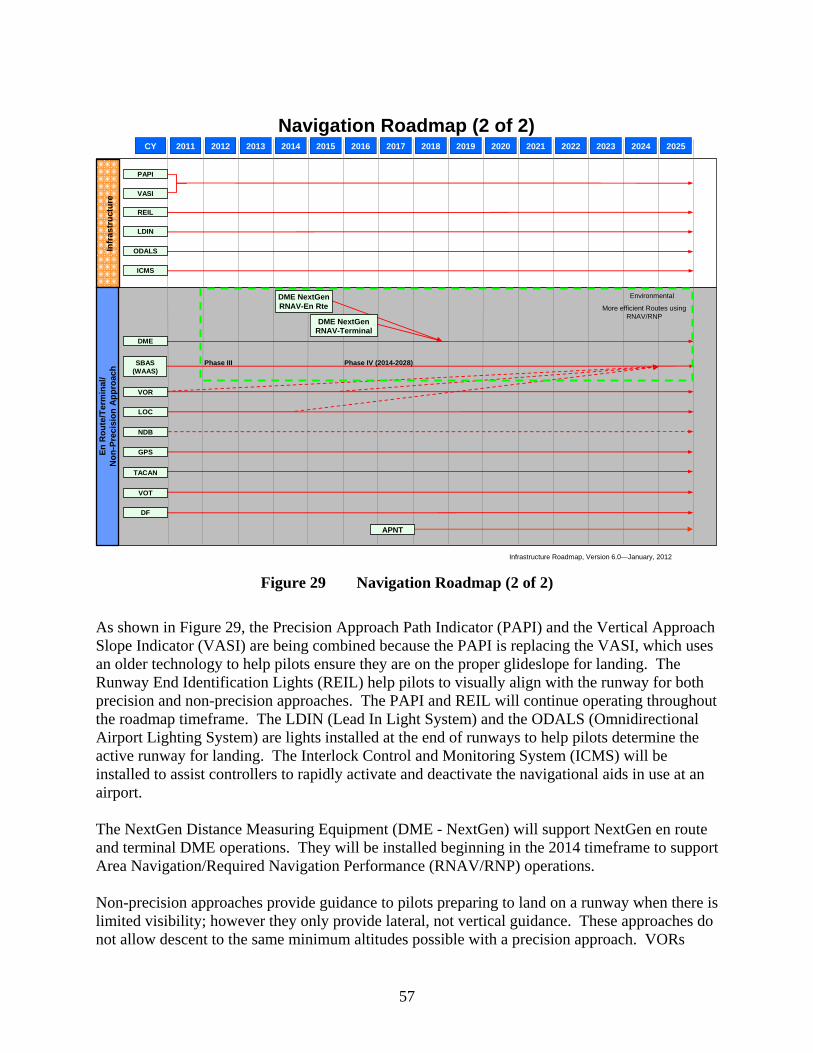
57
CY 2011 2013 2014 20152012 2016 2017 2018 2019 2020 2021 2022 2023 2024 2025CY 2011 2013 2014 20152012 2016 2017 2018 2019 2020 2021 2022 2023 2024 2025
Navigation Roadmap (2 of 2)In
fras
tru
ctu
re
PAPI
VASI
NDB
LOC
En
Ro
ute
/Ter
min
al/
N
on
-Pre
cisi
on
Ap
pro
ach
DME NextGen RNAV-Terminal
More efficient Routes using RNAV/RNP
Environmental
REIL
SBAS (WAAS)
DF
VOT
DME
ICMS
ODALS
LDIN
TACAN
GPS
Phase III Phase IV (2014-2028)
Infrastructure Roadmap, Version 6.0—January, 2012
APNT
DME NextGen RNAV-En Rte
VOR
Figure 29 Navigation Roadmap (2 of 2)
As shown in Figure 29, the Precision Approach Path Indicator (PAPI) and the Vertical Approach Slope Indicator (VASI) are being combined because the PAPI is replacing the VASI, which uses an older technology to help pilots ensure they are on the proper glideslope for landing. The Runway End Identification Lights (REIL) help pilots to visually align with the runway for both precision and non-precision approaches. The PAPI and REIL will continue operating throughout the roadmap timeframe. The LDIN (Lead In Light System) and the ODALS (Omnidirectional Airport Lighting System) are lights installed at the end of runways to help pilots determine the active runway for landing. The Interlock Control and Monitoring System (ICMS) will be installed to assist controllers to rapidly activate and deactivate the navigational aids in use at an airport. The NextGen Distance Measuring Equipment (DME - NextGen) will support NextGen en route and terminal DME operations. They will be installed beginning in the 2014 timeframe to support Area Navigation/Required Navigation Performance (RNAV/RNP) operations. Non-precision approaches provide guidance to pilots preparing to land on a runway when there is limited visibility; however they only provide lateral, not vertical guidance. These approaches do not allow descent to the same minimum altitudes possible with a precision approach. VORs
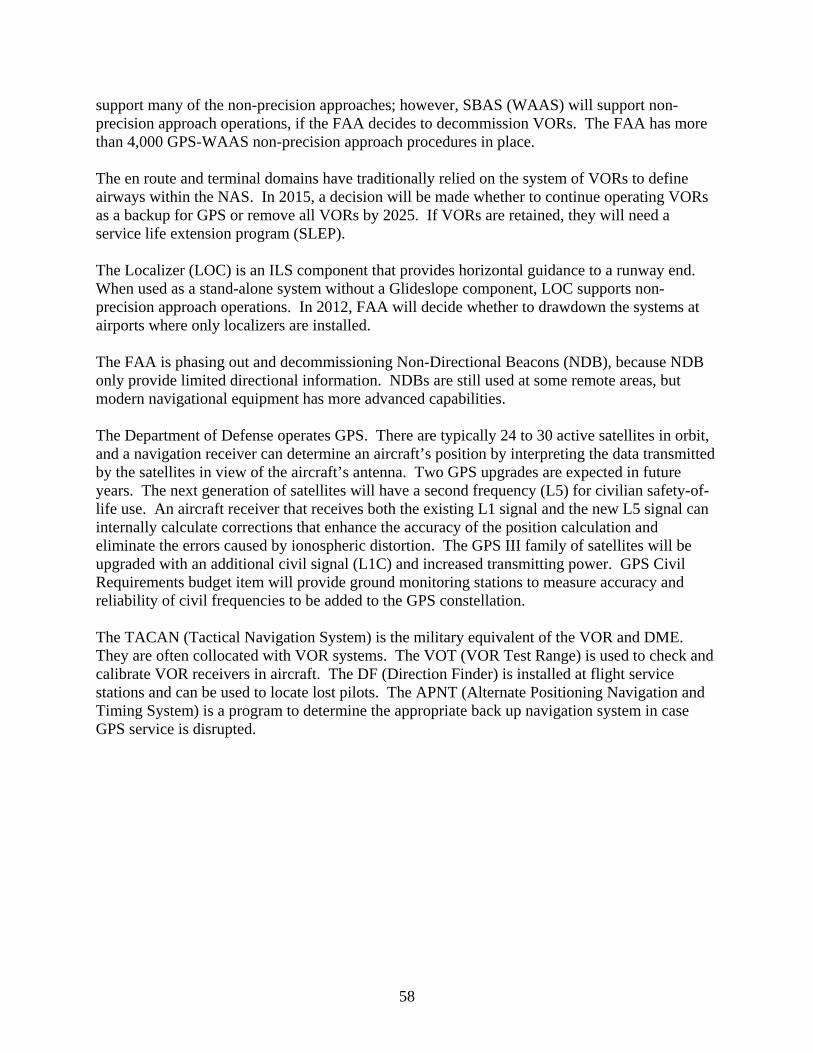
58
support many of the non-precision approaches; however, SBAS (WAAS) will support non-precision approach operations, if the FAA decides to decommission VORs. The FAA has more than 4,000 GPS-WAAS non-precision approach procedures in place. The en route and terminal domains have traditionally relied on the system of VORs to define airways within the NAS. In 2015, a decision will be made whether to continue operating VORs as a backup for GPS or remove all VORs by 2025. If VORs are retained, they will need a service life extension program (SLEP). The Localizer (LOC) is an ILS component that provides horizontal guidance to a runway end. When used as a stand-alone system without a Glideslope component, LOC supports non-precision approach operations. In 2012, FAA will decide whether to drawdown the systems at airports where only localizers are installed. The FAA is phasing out and decommissioning Non-Directional Beacons (NDB), because NDB only provide limited directional information. NDBs are still used at some remote areas, but modern navigational equipment has more advanced capabilities. The Department of Defense operates GPS. There are typically 24 to 30 active satellites in orbit, and a navigation receiver can determine an aircraft’s position by interpreting the data transmitted by the satellites in view of the aircraft’s antenna. Two GPS upgrades are expected in future years. The next generation of satellites will have a second frequency (L5) for civilian safety-of-life use. An aircraft receiver that receives both the existing L1 signal and the new L5 signal can internally calculate corrections that enhance the accuracy of the position calculation and eliminate the errors caused by ionospheric distortion. The GPS III family of satellites will be upgraded with an additional civil signal (L1C) and increased transmitting power. GPS Civil Requirements budget item will provide ground monitoring stations to measure accuracy and reliability of civil frequencies to be added to the GPS constellation. The TACAN (Tactical Navigation System) is the military equivalent of the VOR and DME. They are often collocated with VOR systems. The VOT (VOR Test Range) is used to check and calibrate VOR receivers in aircraft. The DF (Direction Finder) is installed at flight service stations and can be used to locate lost pilots. The APNT (Alternate Positioning Navigation and Timing System) is a program to determine the appropriate back up navigation system in case GPS service is disrupted.
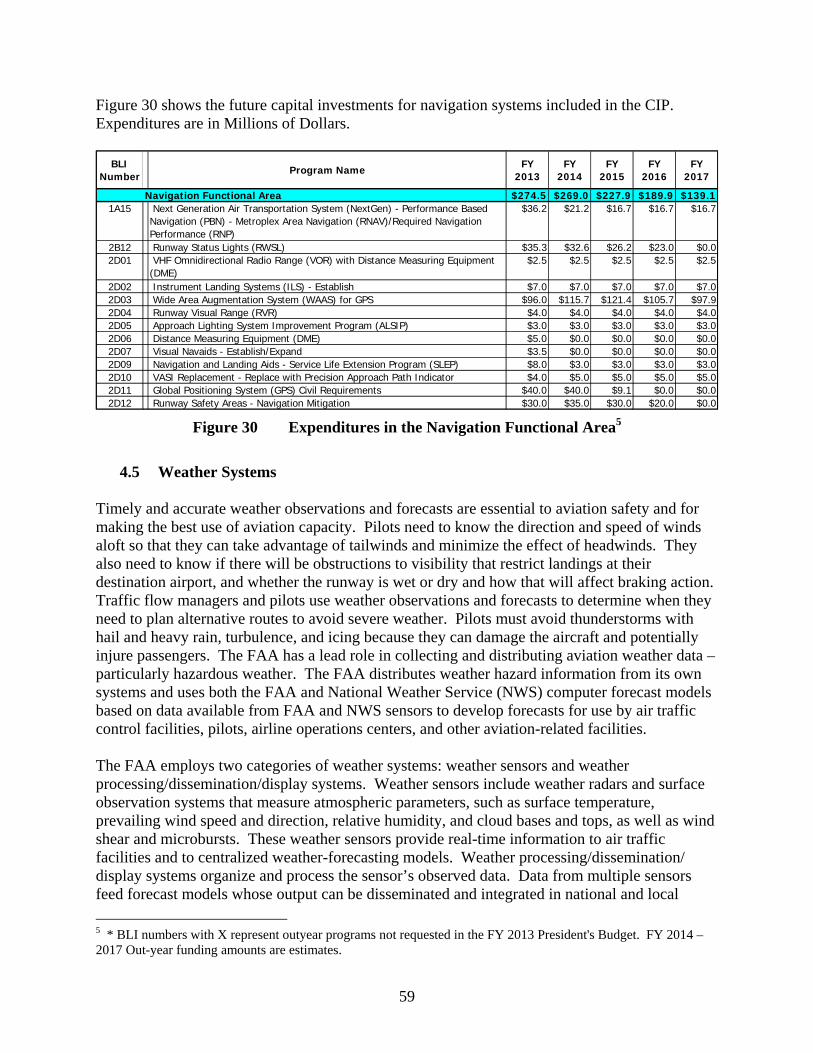
59
Figure 30 shows the future capital investments for navigation systems included in the CIP. Expenditures are in Millions of Dollars.
BLI
NumberProgram Name FY
2013FY
2014FY
2015FY
2016FY
2017
Navigation Functional Area $274.5 $269.0 $227.9 $189.9 $139.11A15 Next Generation Air Transportation System (NextGen) - Performance Based
Navigation (PBN) - Metroplex Area Navigation (RNAV)/Required Navigation Performance (RNP)
$36.2 $21.2 $16.7 $16.7 $16.7
2B12 Runway Status Lights (RWSL) $35.3 $32.6 $26.2 $23.0 $0.02D01 VHF Omnidirectional Radio Range (VOR) with Distance Measuring Equipment
(DME)$2.5 $2.5 $2.5 $2.5 $2.5
2D02 Instrument Landing Systems (ILS) - Establish $7.0 $7.0 $7.0 $7.0 $7.02D03 Wide Area Augmentation System (WAAS) for GPS $96.0 $115.7 $121.4 $105.7 $97.92D04 Runway Visual Range (RVR) $4.0 $4.0 $4.0 $4.0 $4.02D05 Approach Lighting System Improvement Program (ALSIP) $3.0 $3.0 $3.0 $3.0 $3.02D06 Distance Measuring Equipment (DME) $5.0 $0.0 $0.0 $0.0 $0.02D07 Visual Navaids - Establish/Expand $3.5 $0.0 $0.0 $0.0 $0.02D09 Navigation and Landing Aids - Service Life Extension Program (SLEP) $8.0 $3.0 $3.0 $3.0 $3.02D10 VASI Replacement - Replace with Precision Approach Path Indicator $4.0 $5.0 $5.0 $5.0 $5.02D11 Global Positioning System (GPS) Civil Requirements $40.0 $40.0 $9.1 $0.0 $0.02D12 Runway Safety Areas - Navigation Mitigation $30.0 $35.0 $30.0 $20.0 $0.0
Figure 30 Expenditures in the Navigation Functional Area5
4.5 Weather Systems
Timely and accurate weather observations and forecasts are essential to aviation safety and for making the best use of aviation capacity. Pilots need to know the direction and speed of winds aloft so that they can take advantage of tailwinds and minimize the effect of headwinds. They also need to know if there will be obstructions to visibility that restrict landings at their destination airport, and whether the runway is wet or dry and how that will affect braking action. Traffic flow managers and pilots use weather observations and forecasts to determine when they need to plan alternative routes to avoid severe weather. Pilots must avoid thunderstorms with hail and heavy rain, turbulence, and icing because they can damage the aircraft and potentially injure passengers. The FAA has a lead role in collecting and distributing aviation weather data – particularly hazardous weather. The FAA distributes weather hazard information from its own systems and uses both the FAA and National Weather Service (NWS) computer forecast models based on data available from FAA and NWS sensors to develop forecasts for use by air traffic control facilities, pilots, airline operations centers, and other aviation-related facilities. The FAA employs two categories of weather systems: weather sensors and weather processing/dissemination/display systems. Weather sensors include weather radars and surface observation systems that measure atmospheric parameters, such as surface temperature, prevailing wind speed and direction, relative humidity, and cloud bases and tops, as well as wind shear and microbursts. These weather sensors provide real-time information to air traffic facilities and to centralized weather-forecasting models. Weather processing/dissemination/ display systems organize and process the sensor’s observed data. Data from multiple sensors feed forecast models whose output can be disseminated and integrated in national and local
5 * BLI numbers with X represent outyear programs not requested in the FY 2013 President's Budget. FY 2014 – 2017 Out-year funding amounts are estimates.

60
processing and display systems to interpret broad weather trends affecting aviation operations. This information can then be sent to air traffic controllers, traffic flow managers, dispatchers, and pilots.
No
n-F
AA
Sen
so
rs
CY 2011 2013 2014 20152012 2016 2017 2018 2019 2020 2021 2022 2023 2024 2025CY 2011 2013 2014 20152012 2016 2017 2018 2019 2020 2021 2022 2023 2024 2025
Weather Roadmap (1 of 2)
NEXRAD Product Improvement
& Dual Polarization
NextGen RWI Solution Set
NEXRAD
ASWON Portfolio
FA
AS
enso
rs
NextGen Reduced Wx Impact Observations
Win
d S
hea
r S
ervi
ce
Su
rfac
e W
eath
er
Ob
serv
ing
Ser
vic
e
PIREPS
LightningData
AWOS, AWSS, ASOS, SAWS,
DASI, F420
1st Consolidated System
Last Consolidated System
Begin SensorIntegration
JAWS
Non-FedAWOS
WSDS Work Package 2(NextGen Instantiation) Expansion
Add’l LIDAR, New Reqm’ts
NextGen Surface Observing Capability(Sensors, Terminal Architecture & Processing)
Deployment( ~ 900 sites)
NEXRAD SLEP & Algorithm Tuning
JAWS TR
WSDS Work Package 1(Legacy Sustain)
(WSP TR 2/3, LLWAS SLEP), NY TDWR Site Acq
X
X
X
X
Infrastructure Roadmap, Version 6.0—January, 2012
TDWR SLEP 1 TDWR SLEP 2 (Legacy Sustain)
NextGen Surveillance and Wx Radar Capability
TDWR SLEP 3 &NY TDWR Relocate
ASR-8/9/11WX Channel
ACFT WxSensors
ASWON TR(Limited Processor)
Auto PIREP Entry EnRoute Automation NG Mid-Term WP
ASOS TR P3I
Wind Shear DetectionService
Portfolio
ASR-WSP
LIDAR / NEXRAD
Expansion
LLWAS
TDWR
Figure 31 Weather Sensor Roadmap
Figure 31 shows the current and planned status of weather sensors. The Wind Shear Detection Services Portfolio includes: the Airport Surveillance Radar – Weather System Processor (ASR-WSP); the Terminal Doppler Weather Radar (TDWR); and the Low Level Wind Shear Alerting System (LLWAS). These systems detect wind shear conditions near the runways and approach areas of airport to alert controllers, who can then warn pilots of gust fronts and wind shear in the vicinity of the airport. The Light Detection and Ranging (LIDAR) system uses lasers to detect dry microbursts and gust fronts that radar systems such as TDWR may not detect. Evaluation of LIDAR is underway at airports located in dry high plains or mountain environments, where wind shear is not always accompanied by sufficient precipitation for the TDWR to detect with 90 percent reliability. The most sophisticated wind shear detection system is the TDWR. There are 46 operational TDWR sites on or near the largest airports with the most risk of wind shear. Using Doppler technology, the radars can detect the rapid changes in wind speed and direction that indicate existence of wind shear hazards for an aircraft approaching or departing a runway. Airports with significant wind shear risk that have a lower volume of air traffic are served by a lower cost alternative, the ASR-WSP which processes the six-channel weather from the two dimensional Doppler search radar signals of the ASR-9 to detect wind shear and approximate the output of the TDWR.

61
LLWAS supplements these radar systems, and it consists of wind sensors located at 6 to 29 points around the runway thresholds to measure surface wind direction and velocity. The LLWAS computer systems compare the wind velocity and direction detected by these sensors at different locations to determine whether wind shear events are occurring at or near the runways. The sensors can only measure surface winds and do not detect wind shear in the approach or departure paths as a radar would. LLWAS both serves airports that do not have a TDWR or WSP, and at several locations, the system supplements the weather radars with point-specific wind measurements to verify the presence and location of wind shear. The ASR-8/9/11 Weather Channel and the Next Generation Weather Radar (NEXRAD) detect precipitation, wind, and thunderstorms that affect aircraft in flight. Replacing the weather information that the ASR-8/9 radars generate will be necessary only if these radars do not remain in operation. The FAA plans to decide in 2017 whether to combine these functions into a NextGen weather radar replacement. Development of the currently operating Next Generation Weather Radar (NEXRAD) occurred under a joint program of the Department of Commerce National Weather Service, Department of Defense, and FAA. These systems are Doppler weather radars that detect and produce over 100 different long-range and high-altitude weather observations and products, including areas of precipitation, winds, thunderstorms, turbulence, and icing. The NEXRAD radars are essential for forecasting future weather. In the short term, upgrades such as Dual Polarization (Dual Pol) and software improvements are being funded. Dual Pol is an important addition to NEXRAD that improves detection of in-flight icing and is expected to improve the forecasting of areas where in-flight icing will occur. Working with the partner agencies, a decision will be made by 2018 whether to incorporate planned long-range NEXRAD capabilities into the combined NextGen weather and surveillance radar system that will have intermediate range gap-filler capabilities. The Automated Surface Weather Observation Network (ASWON) Portfolio includes several surface sensors (AWOS/ASOS/AWSS/SAWS/DASI/F-420) that measure weather parameters on the surface and report conditions to air traffic facilities and pilots. The data they collect is important to pilots and dispatchers as they prepare and file flight plans, and it is vital for weather forecasting. The Automated Surface Observing Systems (ASOS) and other variants — such as the Automated Weather Observing System (AWOS); the Automated Weather Sensor Systems (AWSS); and the Stand Alone Weather Sensing (SAWS) system — have up to 14 sensors that measure surface weather data, including temperature, barometric pressure, humidity, type and amount of precipitation, and cloud bases and amount of sky cover. These systems feed data directly to air traffic control facilities and support automated broadcast of weather information to pilots. They also provide regular updates for the forecast models that predict future weather conditions including adverse weather. A technical refresh is underway to keep these systems operating reliably until a decision is made to implement the NextGen Surface Observing Capability. The Digital Altimeter Setting Indicator (DASI) shows tower controllers the current altimeter setting so they can inform pilots of the proper setting so the aircraft’s altimeter will read the correct runway elevation at touchdown. The F-420 is an indicator that shows the wind on the runways.
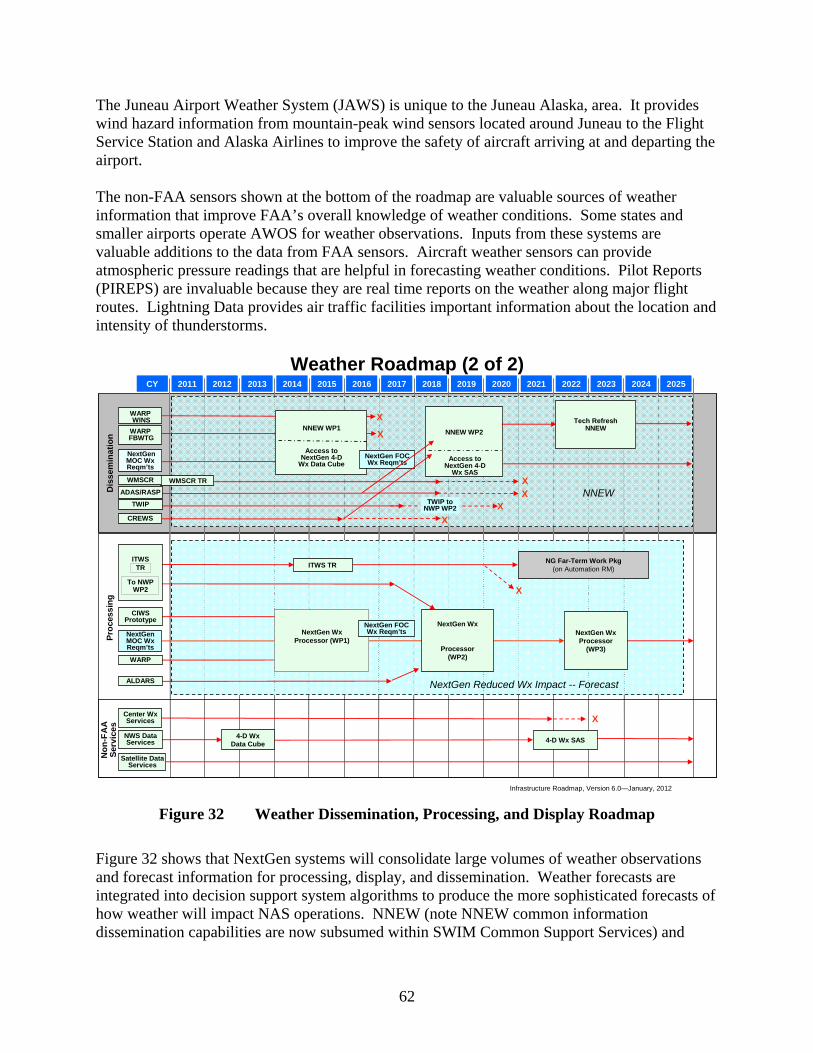
62
The Juneau Airport Weather System (JAWS) is unique to the Juneau Alaska, area. It provides wind hazard information from mountain-peak wind sensors located around Juneau to the Flight Service Station and Alaska Airlines to improve the safety of aircraft arriving at and departing the airport. The non-FAA sensors shown at the bottom of the roadmap are valuable sources of weather information that improve FAA’s overall knowledge of weather conditions. Some states and smaller airports operate AWOS for weather observations. Inputs from these systems are valuable additions to the data from FAA sensors. Aircraft weather sensors can provide atmospheric pressure readings that are helpful in forecasting weather conditions. Pilot Reports (PIREPS) are invaluable because they are real time reports on the weather along major flight routes. Lightning Data provides air traffic facilities important information about the location and intensity of thunderstorms.
Dis
sem
ina
tio
nP
roce
ssin
g
Weather Roadmap (2 of 2)
WMSCR TR
X
X
NG Far-Term Work Pkg(on Automation RM)
NextGen WxProcessor
(WP3)
NextGen Reduced Wx Impact -- Forecast
NextGen Wx
Processor(WP2)
XNNEWADAS/RASP
WARPWINS
WARPFBWTG
TWIP
Access to NextGen 4-D
Wx Data Cube
NNEW WP1
X
Center Wx Services
No
n-F
AA
Ser
vic
es
X
ITWS TR
X
ALDARS
NextGen WxProcessor (WP1)
NextGen FOC Wx Reqm’ts
CREWS
Satellite DataServices
NextGen FOC Wx Reqm’ts
X
XTWIP to
NWP WP2
WMSCR
ITWS
CIWS Prototype
NextGen MOC Wx Reqm’ts
TR
To NWP WP2
NWS DataServices
Infrastructure Roadmap, Version 6.0—January, 2012
4-D Wx SAS4-D Wx
Data Cube
WARP
NextGen MOC Wx Reqm’ts
Access toNextGen 4-D
Wx SAS
NNEW WP2
Tech RefreshNNEW
CY 2011 2013 2014 20152012 2016 2017 2018 2019 2020 2021 2022 2023 2024 2025CY 2011 2013 2014 20152012 2016 2017 2018 2019 2020 2021 2022 2023 2024 2025
Figure 32 Weather Dissemination, Processing, and Display Roadmap
Figure 32 shows that NextGen systems will consolidate large volumes of weather observations and forecast information for processing, display, and dissemination. Weather forecasts are integrated into decision support system algorithms to produce the more sophisticated forecasts of how weather will impact NAS operations. NNEW (note NNEW common information dissemination capabilities are now subsumed within SWIM Common Support Services) and
63
interconnections with the NextGen 4-D Weather Cube is being developed to enhance the collection and dissemination of weather information and provide access to all users throughout the NAS. Currently, the Weather and Radar Processor Weather Information Network Server (WARP WINS) stores data from multiple NEXRAD radars for en route control facilities to use. WARP compiles information from a number of sources for interpretation by the Center Weather Service Unit forecasting stations. WARP also provides NEXRAD precipitation intensity data to controllers’ displays. The WARP FBWTG (FAA Bulk Weather Communications Gateway) provides National Weather service data to the center weather service units to aid in their forecast of weather conditions in the center’s airspace. The roadmap shows the efforts to define NextGen mid-term and long-term operational capabilities (MOC and FOC) preceding the implementation of the SWIM Common Support Services (NNEW). The FAA-operated Weather Message Switching Center Replacement (WMSCR) is a network with distribution nodes in Salt Lake City and Atlanta that collects and distributes nationwide weather information. The FAA will decide during 2014 whether to migrate WMSCR functionality into the SWIM Common Support Services (NNEW) for weather information distribution. The Automated Weather Observation System Data Acquisition System/Regional ADAS Service Processor (ADAS/RASP) is a communications link that transmits AWOS/ASOS/AWSS data to air traffic facilities. ADAS also correlates lightning groundstroke information to AWOS/ASOS/AWSS data to better determine the location of nearby thunderstorm activity. The Terminal Weather Information for Pilots (TWIP) system transfers TDWR weather imagery to airline dispatchers via an airline’s communication provider for uplink to pilots for use in analyzing terminal weather conditions at major airports. The CTAS Remote Weather System (CREWS) transmits weather data to the Center TRACON Automation System (CTAS) so the traffic management units that meter air traffic transitioning from en route to terminal airspace have the benefit of wind information to improve their efficiency in optimal spacing of the aircraft as they approach terminal airspace. The Integrated Terminal Weather System (ITWS) consolidates weather information from automated sensors and surrounding radars (TDWR and NEXRAD) to provide real-time weather information for terminal control facilities. The system also projects movement of thunderstorms and gust fronts up to 20 minutes into the future. Tower and Terminal Radar Approach Control (TRACON) controllers use the information to make more precise estimates of when runways should be closed and subsequently reopened. They also use the information to plan for a switch in terminal arrival patterns to avoid inefficient maneuvering to accommodate a runway change as aircraft approach an airport. ITWS has been installed at 23 airports. ITWS will receive technical refresh in the near term, and we will incorporate its weather inputs and processing power into the NextGen Weather Processor by 2018. The Corridor Integrated Weather System (CIWS) gathers weather information along the busiest air traffic corridors to help air traffic specialists select the most efficient routes when they must divert traffic to avoid severe weather conditions. The CIWS prototype tested a predictive
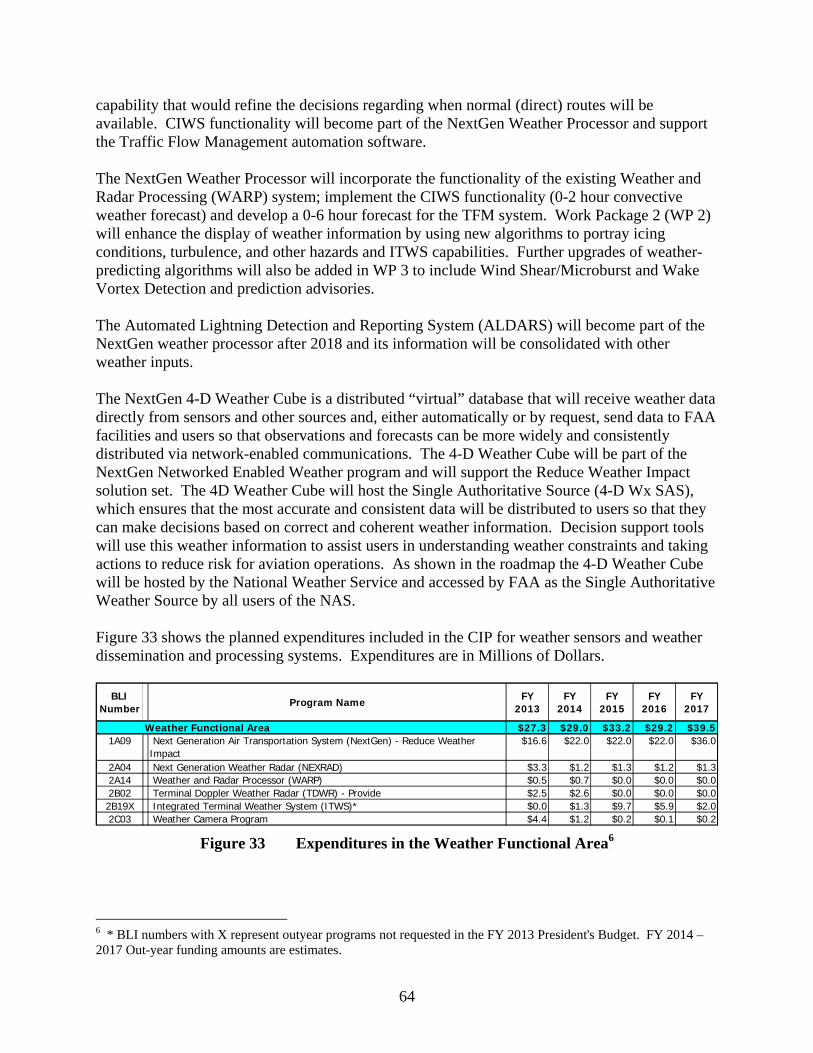
64
capability that would refine the decisions regarding when normal (direct) routes will be available. CIWS functionality will become part of the NextGen Weather Processor and support the Traffic Flow Management automation software. The NextGen Weather Processor will incorporate the functionality of the existing Weather and Radar Processing (WARP) system; implement the CIWS functionality (0-2 hour convective weather forecast) and develop a 0-6 hour forecast for the TFM system. Work Package 2 (WP 2) will enhance the display of weather information by using new algorithms to portray icing conditions, turbulence, and other hazards and ITWS capabilities. Further upgrades of weather-predicting algorithms will also be added in WP 3 to include Wind Shear/Microburst and Wake Vortex Detection and prediction advisories. The Automated Lightning Detection and Reporting System (ALDARS) will become part of the NextGen weather processor after 2018 and its information will be consolidated with other weather inputs. The NextGen 4-D Weather Cube is a distributed “virtual” database that will receive weather data directly from sensors and other sources and, either automatically or by request, send data to FAA facilities and users so that observations and forecasts can be more widely and consistently distributed via network-enabled communications. The 4-D Weather Cube will be part of the NextGen Networked Enabled Weather program and will support the Reduce Weather Impact solution set. The 4D Weather Cube will host the Single Authoritative Source (4-D Wx SAS), which ensures that the most accurate and consistent data will be distributed to users so that they can make decisions based on correct and coherent weather information. Decision support tools will use this weather information to assist users in understanding weather constraints and taking actions to reduce risk for aviation operations. As shown in the roadmap the 4-D Weather Cube will be hosted by the National Weather Service and accessed by FAA as the Single Authoritative Weather Source by all users of the NAS. Figure 33 shows the planned expenditures included in the CIP for weather sensors and weather dissemination and processing systems. Expenditures are in Millions of Dollars.
BLI
NumberProgram Name
FY 2013
FY 2014
FY 2015
FY 2016
FY 2017
Weather Functional Area $27.3 $29.0 $33.2 $29.2 $39.51A09 Next Generation Air Transportation System (NextGen) - Reduce Weather
Impact$16.6 $22.0 $22.0 $22.0 $36.0
2A04 Next Generation Weather Radar (NEXRAD) $3.3 $1.2 $1.3 $1.2 $1.32A14 Weather and Radar Processor (WARP) $0.5 $0.7 $0.0 $0.0 $0.02B02 Terminal Doppler Weather Radar (TDWR) - Provide $2.5 $2.6 $0.0 $0.0 $0.02B19X Integrated Terminal Weather System (ITWS)* $0.0 $1.3 $9.7 $5.9 $2.02C03 Weather Camera Program $4.4 $1.2 $0.2 $0.1 $0.2
Figure 33 Expenditures in the Weather Functional Area6
6 * BLI numbers with X represent outyear programs not requested in the FY 2013 President's Budget. FY 2014 – 2017 Out-year funding amounts are estimates.

65
4.6 Facilities
The Air Traffic Organization maintains and operates thousands of staffed and unstaffed operational facilities that we must regularly upgrade and modernize. The largest facilities are the 21 en route centers, that house hundreds of employees and the equipment they use to control aircraft flying in the en route airspace. The other operational facilities with significant staffing are the more than 500 towers and 167 TRACON facilities that control traffic departing and arriving at airports. There are also more than 16,000 unstaffed facilities—many in very remote locations—supporting communications, navigation, and surveillance equipment and weather sensors. Much of this equipment is housed in shelters and buildings that have exceeded their service lives and need renovation. Many have deteriorating steel towers and foundations. Some newer unstaffed buildings and structures frequently need renovation because they are in remote and/or hostile locations near the ocean or on mountaintops. Replacing roofing, electric power generators, heating/cooling, and structural and security components of these structures is essential to successful operation of the NAS. The William J. Hughes Technical Center (WJHTC) in Atlantic City, NJ, and the Mike Monroney Aeronautical Center (MMAC) in Oklahoma City, OK, each have many buildings. Each year, these complexes receive funds to both sustain and replace infrastructure and to improve and modernize buildings to support training, logistics, research, and management functions. The MMAC operates under a lease from the Oklahoma City Airport Trust, and funds are requested to pay the annual lease costs. The MMAC also receives infrastructure funding for building renovation and updated infrastructure. The WJHTC supports research programs to determine the feasibility of NextGen concepts, and it also supports the testing of new equipment that will be installed in the NAS. The FAA has requested funding for 2013 and beyond to upgrade buildings and infrastructure such as roads. Annual funding is provided to reconfigure the research laboratories to accommodate acceptance testing for new equipment and to test modifications to existing equipment. There are two budget line items for tower and TRACON investments, which have significant funding. The first is the Terminal Air Traffic Control Facilities – Replace program, which includes funding for both airport traffic control towers (ATCT) and TRACON facilities. This line item funds replacement of existing towers and TRACONs and construction of towers for new airports. In most years, there are between 10 and 20 projects in progress to replace towers that are either too small to handle the traffic growth that has occurred since they were built or have inadequate visibility. The second line item is the Terminal Air Traffic Control Facilities – Modernize program. It replaces specific exterior or interior components of existing towers, such as elevators; heating ventilation and cooling equipment; roofs; or other infrastructure that the FAA must upgrade to keep towers functioning. The FAA upgrades and improves Air Route Traffic Control Center (ARTCC) facilities by replacing heating and cooling systems, upgrading electrical power distribution systems and providing other facility needs to meet mission requirements.
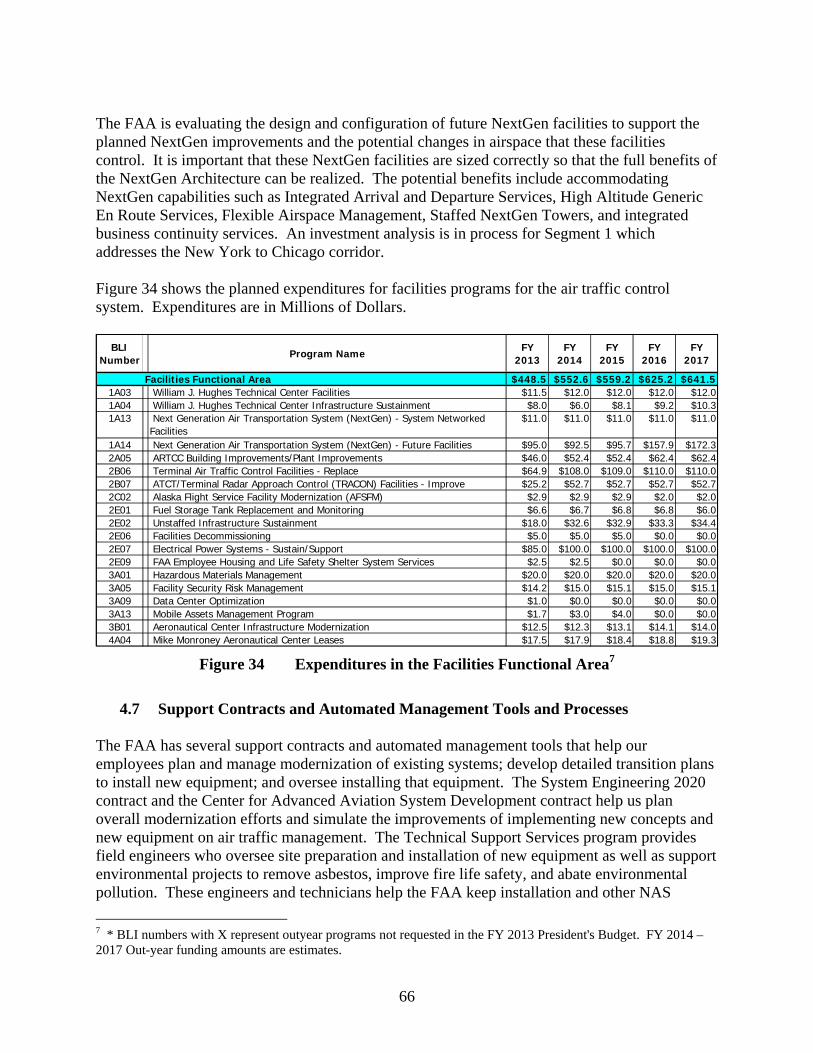
66
The FAA is evaluating the design and configuration of future NextGen facilities to support the planned NextGen improvements and the potential changes in airspace that these facilities control. It is important that these NextGen facilities are sized correctly so that the full benefits of the NextGen Architecture can be realized. The potential benefits include accommodating NextGen capabilities such as Integrated Arrival and Departure Services, High Altitude Generic En Route Services, Flexible Airspace Management, Staffed NextGen Towers, and integrated business continuity services. An investment analysis is in process for Segment 1 which addresses the New York to Chicago corridor. Figure 34 shows the planned expenditures for facilities programs for the air traffic control system. Expenditures are in Millions of Dollars.
BLI
NumberProgram Name FY
2013FY
2014FY
2015FY
2016FY
2017
Facilities Functional Area $448.5 $552.6 $559.2 $625.2 $641.51A03 William J. Hughes Technical Center Facilities $11.5 $12.0 $12.0 $12.0 $12.01A04 William J. Hughes Technical Center Infrastructure Sustainment $8.0 $6.0 $8.1 $9.2 $10.31A13 Next Generation Air Transportation System (NextGen) - System Networked
Facilities$11.0 $11.0 $11.0 $11.0 $11.0
1A14 Next Generation Air Transportation System (NextGen) - Future Facilities $95.0 $92.5 $95.7 $157.9 $172.32A05 ARTCC Building Improvements/Plant Improvements $46.0 $52.4 $52.4 $62.4 $62.42B06 Terminal Air Traffic Control Facilities - Replace $64.9 $108.0 $109.0 $110.0 $110.02B07 ATCT/Terminal Radar Approach Control (TRACON) Facilities - Improve $25.2 $52.7 $52.7 $52.7 $52.72C02 Alaska Flight Service Facility Modernization (AFSFM) $2.9 $2.9 $2.9 $2.0 $2.02E01 Fuel Storage Tank Replacement and Monitoring $6.6 $6.7 $6.8 $6.8 $6.02E02 Unstaffed Infrastructure Sustainment $18.0 $32.6 $32.9 $33.3 $34.42E06 Facilities Decommissioning $5.0 $5.0 $5.0 $0.0 $0.02E07 Electrical Power Systems - Sustain/Support $85.0 $100.0 $100.0 $100.0 $100.02E09 FAA Employee Housing and Life Safety Shelter System Services $2.5 $2.5 $0.0 $0.0 $0.03A01 Hazardous Materials Management $20.0 $20.0 $20.0 $20.0 $20.03A05 Facility Security Risk Management $14.2 $15.0 $15.1 $15.0 $15.13A09 Data Center Optimization $1.0 $0.0 $0.0 $0.0 $0.03A13 Mobile Assets Management Program $1.7 $3.0 $4.0 $0.0 $0.03B01 Aeronautical Center Infrastructure Modernization $12.5 $12.3 $13.1 $14.1 $14.04A04 Mike Monroney Aeronautical Center Leases $17.5 $17.9 $18.4 $18.8 $19.3
Figure 34 Expenditures in the Facilities Functional Area7
4.7 Support Contracts and Automated Management Tools and Processes
The FAA has several support contracts and automated management tools that help our employees plan and manage modernization of existing systems; develop detailed transition plans to install new equipment; and oversee installing that equipment. The System Engineering 2020 contract and the Center for Advanced Aviation System Development contract help us plan overall modernization efforts and simulate the improvements of implementing new concepts and new equipment on air traffic management. The Technical Support Services program provides field engineers who oversee site preparation and installation of new equipment as well as support environmental projects to remove asbestos, improve fire life safety, and abate environmental pollution. These engineers and technicians help the FAA keep installation and other NAS
7 * BLI numbers with X represent outyear programs not requested in the FY 2013 President's Budget. FY 2014 – 2017 Out-year funding amounts are estimates.
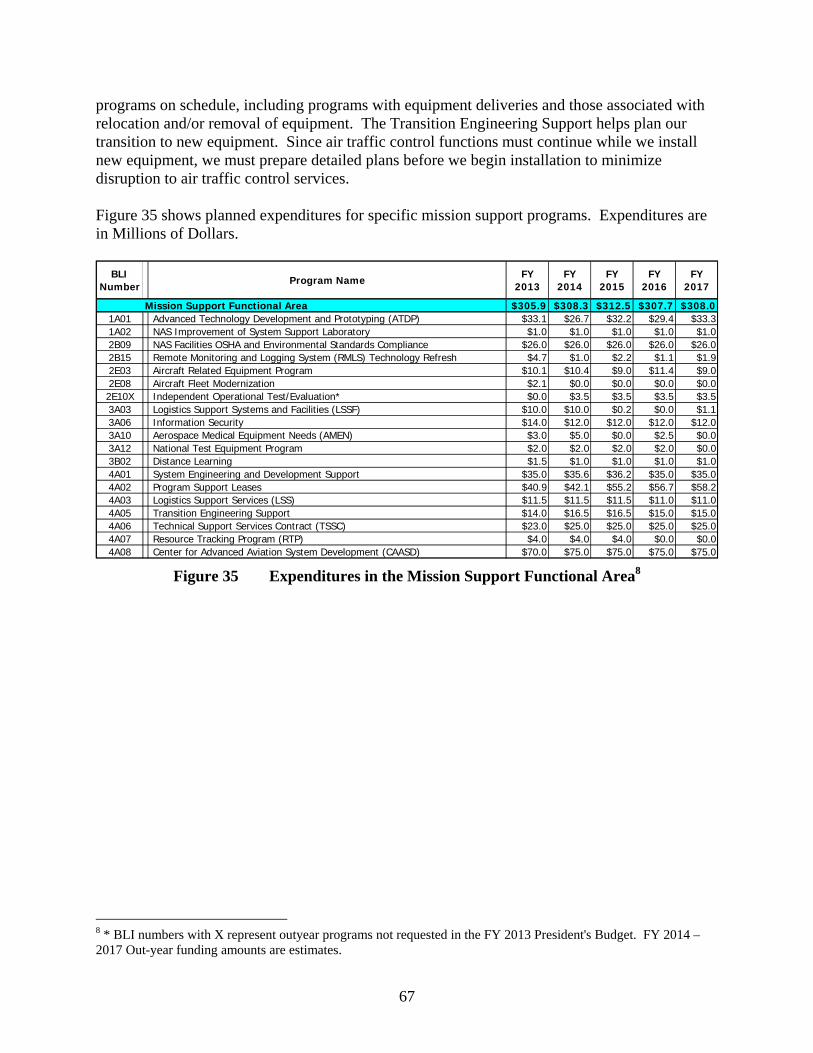
67
programs on schedule, including programs with equipment deliveries and those associated with relocation and/or removal of equipment. The Transition Engineering Support helps plan our transition to new equipment. Since air traffic control functions must continue while we install new equipment, we must prepare detailed plans before we begin installation to minimize disruption to air traffic control services. Figure 35 shows planned expenditures for specific mission support programs. Expenditures are in Millions of Dollars.
BLI
Number Program Name FY 2013
FY 2014
FY 2015
FY 2016
FY 2017
Mission Support Functional Area $305.9 $308.3 $312.5 $307.7 $308.01A01 Advanced Technology Development and Prototyping (ATDP) $33.1 $26.7 $32.2 $29.4 $33.31A02 NAS Improvement of System Support Laboratory $1.0 $1.0 $1.0 $1.0 $1.02B09 NAS Facilities OSHA and Environmental Standards Compliance $26.0 $26.0 $26.0 $26.0 $26.02B15 Remote Monitoring and Logging System (RMLS) Technology Refresh $4.7 $1.0 $2.2 $1.1 $1.92E03 Aircraft Related Equipment Program $10.1 $10.4 $9.0 $11.4 $9.02E08 Aircraft Fleet Modernization $2.1 $0.0 $0.0 $0.0 $0.02E10X Independent Operational Test/Evaluation* $0.0 $3.5 $3.5 $3.5 $3.53A03 Logistics Support Systems and Facilities (LSSF) $10.0 $10.0 $0.2 $0.0 $1.13A06 Information Security $14.0 $12.0 $12.0 $12.0 $12.03A10 Aerospace Medical Equipment Needs (AMEN) $3.0 $5.0 $0.0 $2.5 $0.03A12 National Test Equipment Program $2.0 $2.0 $2.0 $2.0 $0.03B02 Distance Learning $1.5 $1.0 $1.0 $1.0 $1.04A01 System Engineering and Development Support $35.0 $35.6 $36.2 $35.0 $35.04A02 Program Support Leases $40.9 $42.1 $55.2 $56.7 $58.24A03 Logistics Support Services (LSS) $11.5 $11.5 $11.5 $11.0 $11.04A05 Transition Engineering Support $14.0 $16.5 $16.5 $15.0 $15.04A06 Technical Support Services Contract (TSSC) $23.0 $25.0 $25.0 $25.0 $25.04A07 Resource Tracking Program (RTP) $4.0 $4.0 $4.0 $0.0 $0.04A08 Center for Advanced Aviation System Development (CAASD) $70.0 $75.0 $75.0 $75.0 $75.0
Figure 35 Expenditures in the Mission Support Functional Area8
8 * BLI numbers with X represent outyear programs not requested in the FY 2013 President's Budget. FY 2014 – 2017 Out-year funding amounts are estimates.

68
5 Conclusion The airline industry is still adjusting to economic conditions beyond its control, but travel demand growth is expected. Average yield is increasing and additional fees appear to have returned the industry to profitability. Flight operations increased only marginally in 2010 and decreased slightly in 2011. The decrease was caused by airline adjustments in the service offered; however, demand is expected to increase and the ability to absorb it with higher load factors and larger aircraft may soon reach its limits. Economic growth appears to be on an up-trend. Increased air travel has always followed economic recovery, and the FAA must assume that operations will increase and is planning to handle 30-40 percent more flights by 2025. The near-term leveling in operations may suggest that we could defer system modernization, but there are several reasons why that course of action would be detrimental. Operational improvements that rely on capital investment often lag several years behind the appropriation of funding to carry out the supporting investment, because the complex equipment necessary to support changes in operational improvements takes time to develop, build, install, test and then train controllers in its use. Capital investment must anticipate future growth. In addition, flight delays are still occurring on a regular basis at the Nation’s largest airports; so regardless of when future growth occurs, the need for additional capacity and improved efficiency and reduced environmental impact exists today. In addition to operational considerations, we must deal with normal obsolescence. The computer systems and other technology that we use for air traffic control have an estimated life of 10 to 20 years. Regardless of whether there is growth or decline in air travel, we will have to replace several system components in the next 10 years. We are committed to modernizing the existing air traffic control system, and we will be doing that continuously into the future. The NextGen transition to air traffic management introduces another significant pressure in capital planning. As the operational improvements to expand capacity become more complex, more time needs to be devoted to developing air traffic procedures and demonstrating the new technologies that enable more intense use of the NAS. Achieving all the planned operational improvements for NextGen including more efficiency, improved safety, reduced environmental impact and better use of available capacity will require consistent levels of investment over several years.

69
6 Appendices The CIP contains five appendices. Appendix A
Lists FAA strategic goals, outcomes, and performance metrics. Associates CIP programs with strategic outcomes and performance metrics.
Appendix B
Provides CIP program descriptions and the relationship of programs to strategic goals. Describes the programs contribution to meeting the performance metric. Lists performance output goals for FY 2013–2017. Shows system implementation schedules.
Appendix C Provides estimated expenditures from FY 2013 through FY 2017 by Budget Line Item
(BLI). Expenditures are in Millions of Dollars. Appendix D
Response to GAO Report 08-42 - Identifies programs with baseline changes and explains the causes of those changes.
Appendix E
Defines acronyms and abbreviations.

(Page Intentionally Left Blank)