Embed Size (px)
Citation preview


Environmental Management BureauDepartment of Environment and Natural Resources
DENR Compound, Visayas Avenue, Quezon CityTel. No. 928-44-30 Telefax No. 426-23-32
http://www.emb.gov.ph
National Air QualityStatus Report(2005-2007)


PrefaceThis publication is a comprehensive technical report of the air quality situation of the country. It coversdiscussion on best practices, challenges, efforts on public awareness and environmental education,and recommendations towards improvement of air quality. It also presents the initiatives of the differ-ent stakeholders – various national government agencies, the private sector, the civil society, the localgovernment units, and the international development community on their contributions for the better-ment of our environment. The report was written solely by the EMB-DENR staff based on the ‘Guide-lines for the Preparation of Harmonized Regional and National State of Brown Environment Report’developed in 2007. It is therefore a pilot work. Effort has been made to stick to the Guidelines eventhough several constraints were faced during its writing. First and foremost is the availability of datapertaining to the environment. While it is recognized that such data abound, these are scattered,some are outdated, and come in different formats. Second, time was limited to produce the firstreport that would faithfully adhere to the outline of the Guidelines. To overcome such constraints, theEMB-DENR staff had to undergo capability building through seminar-workshops on the rigors of dataanalysis and technical report writing. Truly, this report is a product the EMB-DENR staff could beproud of.
The report is a fact book that monitors air quality over the last three years. It is hoped to be useful forpolicy and decision makers, planners, researchers, etc. It will also provide valuable information to thegeneral public.
Comprehensive as it is, being a pilot work however, not all information desired could be contained inthe report due to the constraints cited earlier. Several lessons have been learned with regard tokeeping of an efficient database that would help in providing valuable data for the writing of futurereports. Partnership with other government agencies, the civil society, the LGUs and other stakehold-ers is necessary for ease in the exchange of data.
It is hoped that this report would contribute to better understanding of our environment. We are alwaysreminded by the old maxim – ‘what gets measured gets managed’. Some may argue with this asser-tion. But as far as the environment is concerned, it is always true.
i

ii
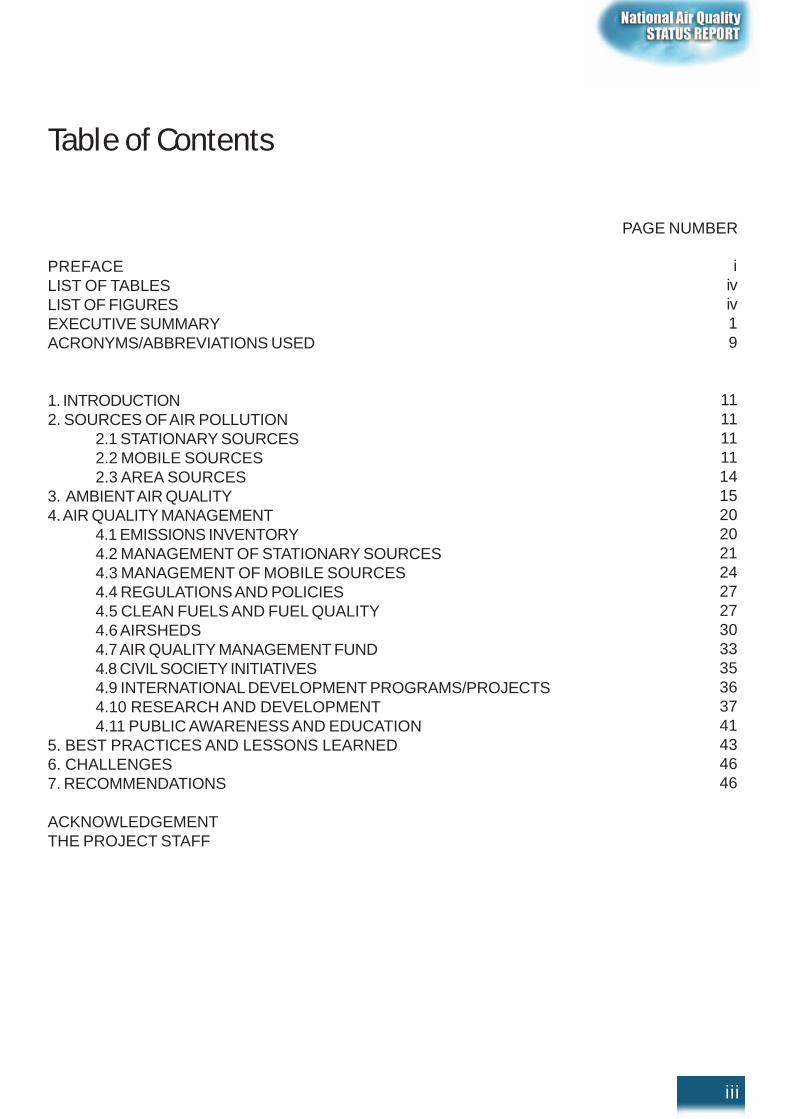
Table of Contents
PAGE NUMBER
PREFACELIST OF TABLESLIST OF FIGURESEXECUTIVE SUMMARYACRONYMS/ABBREVIATIONS USED
1. INTRODUCTION2. SOURCES OF AIR POLLUTION
2.1 STATIONARY SOURCES2.2 MOBILE SOURCES2.3 AREA SOURCES
3. AMBIENT AIR QUALITY4. AIR QUALITY MANAGEMENT
4.1 EMISSIONS INVENTORY4.2 MANAGEMENT OF STATIONARY SOURCES4.3 MANAGEMENT OF MOBILE SOURCES4.4 REGULATIONS AND POLICIES4.5 CLEAN FUELS AND FUEL QUALITY4.6 AIRSHEDS4.7 AIR QUALITY MANAGEMENT FUND4.8 CIVIL SOCIETY INITIATIVES4.9 INTERNATIONAL DEVELOPMENT PROGRAMS/PROJECTS4.10 RESEARCH AND DEVELOPMENT4.11 PUBLIC AWARENESS AND EDUCATION
5. BEST PRACTICES AND LESSONS LEARNED6. CHALLENGES7. RECOMMENDATIONS
ACKNOWLEDGEMENTTHE PROJECT STAFF
iii
iiviv19
111111111415202021242727303335363741434646
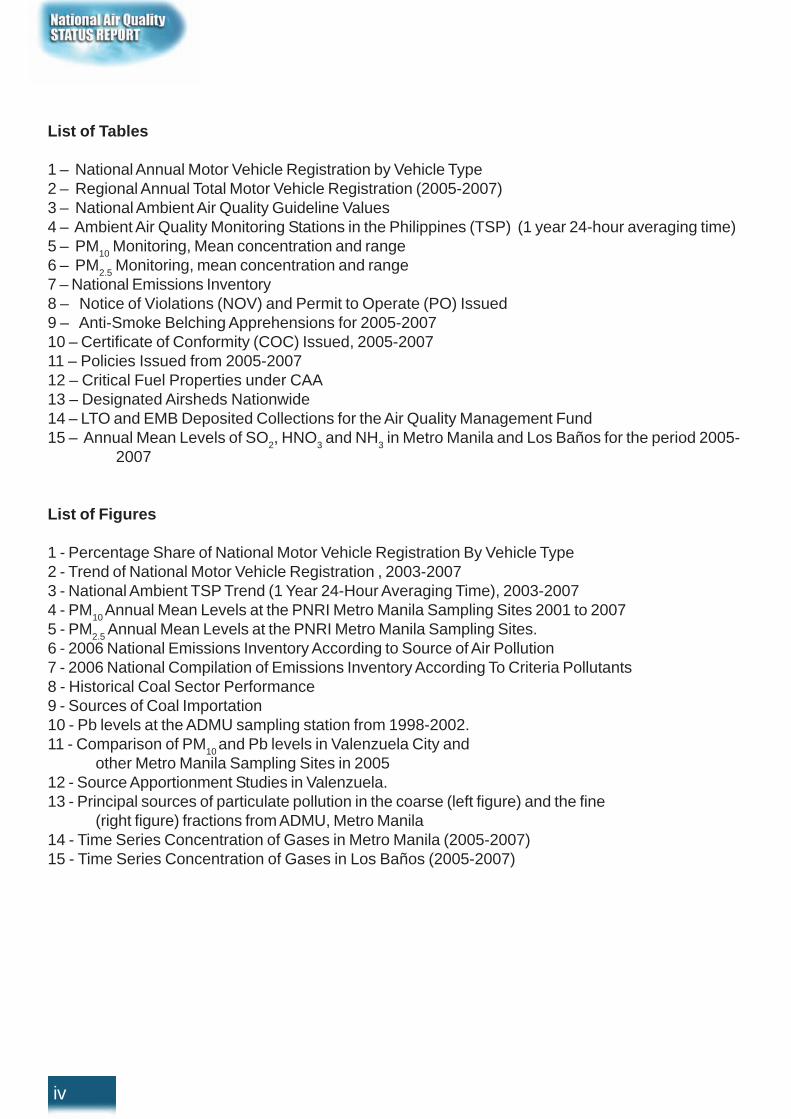
List of Tables
1 – National Annual Motor Vehicle Registration by Vehicle Type2 – Regional Annual Total Motor Vehicle Registration (2005-2007)3 – National Ambient Air Quality Guideline Values4 – Ambient Air Quality Monitoring Stations in the Philippines (TSP) (1 year 24-hour averaging time)5 – PM10 Monitoring, Mean concentration and range6 – PM2.5 Monitoring, mean concentration and range7 – National Emissions Inventory8 – Notice of Violations (NOV) and Permit to Operate (PO) Issued9 – Anti-Smoke Belching Apprehensions for 2005-200710 – Certificate of Conformity (COC) Issued, 2005-200711 – Policies Issued from 2005-200712 – Critical Fuel Properties under CAA13 – Designated Airsheds Nationwide14 – LTO and EMB Deposited Collections for the Air Quality Management Fund15 – Annual Mean Levels of SO2, HNO3 and NH3 in Metro Manila and Los Baños for the period 2005- 2007
List of Figures
1 - Percentage Share of National Motor Vehicle Registration By Vehicle Type2 - Trend of National Motor Vehicle Registration , 2003-20073 - National Ambient TSP Trend (1 Year 24-Hour Averaging Time), 2003-20074 - PM10 Annual Mean Levels at the PNRI Metro Manila Sampling Sites 2001 to 20075 - PM2.5 Annual Mean Levels at the PNRI Metro Manila Sampling Sites.6 - 2006 National Emissions Inventory According to Source of Air Pollution7 - 2006 National Compilation of Emissions Inventory According To Criteria Pollutants8 - Historical Coal Sector Performance9 - Sources of Coal Importation10 - Pb levels at the ADMU sampling station from 1998-2002.11 - Comparison of PM10 and Pb levels in Valenzuela City and
other Metro Manila Sampling Sites in 200512 - Source Apportionment Studies in Valenzuela.13 - Principal sources of particulate pollution in the coarse (left figure) and the fine
(right figure) fractions from ADMU, Metro Manila14 - Time Series Concentration of Gases in Metro Manila (2005-2007)15 - Time Series Concentration of Gases in Los Baños (2005-2007)
iv

1
Source PM
(mg/Ncm)
SOx
(mg/Ncm) NOx
(mg/Ncm
CO
(mg/Ncm)
VOC Total %
Stationary 110,023 598,634 326,219 360,620 67,859 1,463,385 21
Mobile 244,764 14,309 405,033 2,988,616 914,996 4,567,719 65
Area 423,615. 1,963 327,261 165,647 63,855 982,340 14
Total 778,402 614,937 1,058,514 3,514,883 1,046,710 7,013,444 100% 11 9 15 50 15 100
Executive SummarExecutive SummarExecutive SummarExecutive SummarExecutive Summaryyyyy
Air Quality
Sources of Air Pollution
The sources of air pollution are classified into:
a. Stationary source - any building or immobile structure, facility or installation which emits or may emitany air pollutant.b. Mobile source - any vehicle/machine propelled by or through oxidation or reduction reactions includingcombustion of carbon-based or other fuel, constructed and operated principally for the conveyance ofpersons or the transportation of property or goods that emit air pollutants as a reaction product.c. Area source - relatively large areas of specific activities that generate significant amounts of airpollutants.
Based on the 2006 National Emission Inventory, majority of the regions in the country point to the transportsector as the major source of air pollution. As shown in Figure AQ-1, it was estimated that 21% of thepollutants came from stationary sources, 65% from mobile sources, and the remaining 14% from areasources.
Figure AQ-1 – 2006 National Emissions Inventory According to Criteria Pollutant
Table AQ-1 shows that CO has the biggest pollution load contribution of 50%. CO emission is relativelycaused by the increasing population of gasoline-fed vehicles which include cars (13.58%) and MC/TC(47.88%). Other pollutants’ contribution are as follows: NOx – (15%), SOx – (9%), PM-(11%), VOC-(15%).
Source: EMB

Ambient Air Quality
Figure AQ-2 shows the national total suspended particulate (TSP) monitoring from 2003 to 2007. Asignificant 33% improvement was observed with concentrations decreasing from 144 to 97 microgramper normal cubic meter (µg/Ncu.m.) Although trends are decreasing, TSP geometric mean concentrationsare still above the 90 µg/Ncu.m. annual mean TSP guideline value for one year averaging time. As such,more efforts are needed to comply with the guideline by 2010 as provided in the General Plan of Actionfor Air Quality Management.
Source: EMB
Figure AQ-2 – National Ambient TSP Trend (1 year 24-hour averaging time), 2003-2007
Management of Stationary Sources
The EMB through its regional offices is in charge of monitoring industrial firms and issuing notices ofviolations (NOVs) and permit-to-operate (POs). From 2005-2007, a total of 18,697 firms were monitored.Also, a total of 1,676 NOVs and 24,391 POs were issued within the three-year period.
Management of Mobile Sources
The LTO enforces compliance with emission standards for motor vehicles pursuant to pertinent provisionsof the CAA of 1999 and its Implementing Rules and Regulations (IRR).
Under the IRR of the CAA, all private in-use motor vehicles and vehicles with updated/enhanced engineswhose chassis are pre-registered with the LTO will only be allowed renewal of annual registration uponinspection by the LTO or other authorized private motor vehicle inspection center. The MVIS projectinvolves the construction of motor vehicle inspection system to cover all types and classifications ofmotor vehicles all over the country. The MVIS centers shall be equipped with the state-of-the-art equipmentand shall be fully computerized.
2

Management of Area Sources
The Philippine Clean Air Act of 1999 (RA 8749) and its IRR defines an airshed as “areas with similarclimate, weather, meteorology and topography which affect the interchange and diffusion of pollutantsin the atmosphere.” The whole country has been divided into airsheds. These airsheds are to bemanaged by multi-sectoral governing boards which are tasked to formulate policies and standards aswell as action plans to effectively manage the air quality situation within their respective areas.
Regulations and Policy
From 2005-2007, the DENR-EMB issued policies on air quality management as shown in Table AQ-2.These directives were issued to further strengthen the implementation of air quality management effortsin the country.
Table AQ-2 Policies Issued from 2005-2007
Source: EMB
Alternative and Clean Fuels
As a substitute to petroleum, alternative fuels are expected to yield significant energy security andenvironmental benefits to its consumers. Methanol, denatured ethanol, and other alcohols blended withgasoline, diesel or other fuels are alternative fuels. Those that act as substitutes to petroleum, such asnatural gas, liquefied petroleum gas, hydrogen, and coal-derived liquid fuels are also considered asalternative fuels, as are fuels derived from biological materials and electricity.
The Alternative Fuels Program is one of the five key components of the Arroyo Administration’s EnergyIndependence Agenda, which outlines the roadmap that will lead to the country’s attainment of 60%energy self-sufficiency by 2010.
3
DENR Administrative
Order (DAO) Number
Policy Title Date of Issuance
y
DENR- DTI- DOTC Joint
Adminstrative Order No. 1
Series of 2007
Amended Guidelines and Procedures for
the Monitoring of Accredited and
Authorized Private Emission Testing
Centers (PETC) and Land Transportation
Office (LTO) Emission testing Activities
December 2007
DAO 2007-27 Revised Emission Standards for Motor
Vehicles Equipped with Compression-
Ignition and Spark-Ignition Engines
31 July 2007
DAO 2007-25 Guidelines for DENR Accreditation of
Third Party Source Emission Testing Firms
31 July 2007
DAO 2007-22 Guidelines on the Requirements for
Continuous Emission Monitoring Systems
(CEMS) and other Accepted Protocols .
thereby Modifying and Clarifying Certain
Provisions
31 July 2007

The Program has four major subprograms, namely Biodiesel Program, Bioethanol Program, NaturalGas Vehicle Program for Public Transport (NGVPPT), and Autogas Program. Other technologiesadvocated under the program are hybrid, fuel cell, hydrogen, and electric vehicles.RA 9367 otherwise known as The Bio-fuels Act of 2006 “An Act to Direct the Use of Bio-fuels, Establishingfor this Purpose the Biofuels Program, Appropriating Funds therefor, and for other Purposes” was signedinto law by the President on January 12, 2007 and became effective on February 6, 2007. Biofuel refersto fuels made from biomass and primarily used for automotive, thermal and power generation, withquality specifications in accordance with the Philippine National Standards (PNS). The “Bio-fuels Policy”seeks to achieve energy independence and fuel diversification while meeting environmental challengesthrough the utilization of agricultural-based feed stocks thus increasing economic activity, especially incountry side.
As mandated in the Act, bio-diesel blend of 1% by volume is available in all gas/pump stations nationwidesince May 2007 (no more 100% conventional diesel). Likewise, 10% bio-ethanol blend (E10) by volumeinto all gasoline fuel is distributed and sold by all oil companies/dealers in the country. The biofuel andtheir blends are either manufactured/imported/sold conforming to the Philippine National Standards.
Public Awareness and Education on Air Quality Management
For a couple of years, the EMB-DENR has undertaken various activities focused on public awarenessand education on air quality management under the Linis Hangin program of the DENR.
The various activities are in cooperation with different multi-stakeholder partners such as academicinstitutions, business, local government units, national government agencies, non-governmentorganization, private sector, and even individuals advocating the fight for clean air.
There are several undertakings of the EMB-DENR in this direction from 2005 to 2007. Among them are:
Bantay Tambutso sa Eskwela – The program aimed at (1) involving academic institutions inpromoting clean air and (2) increasing and strengthening the advocacy for clean air, especially inthe attainment of emission standard for vehicles within school campuses nationwide.
Bantay Tambutso sa Malls – The said program targets mall and business establishmentsnationwide with the aim of encouraging public and private sector cooperation by conducting freevehicle emission testing in malls and commercial establishments for FX taxi, jeepneys andother public utility vehicles
Bantay Sunog Basura –The said program partners with local government units and encouragesthem to practice a more ecological way of dealing with solid wastes through issuance of localordinances that ban open burning of wastes in their localities.
Bantay Tsimneya – This is also a program under the Linis Hangin program that targets industriesand encourages them to reduce emissions in their smoke stacks.
4

Best Practices and Lessons Learned
National Capital Region
Marikina City
The city government of Marikina is a strong advocate of clean air and non-motorized transport. This wasmanifested through the Marikina Bikeways Project, which aims to promote low cost and environment-friendly transport.
The bikeways program of Marikina City is a holistic social and advocacy campaign that promotes cyclingas an alternative public transport. It is holistic in the sense that it involves not only creating the physicalrequirements for the adoption of bicycling, but also providing an opportunity to own bicycles, educatingthe public on the social dimension and safety of riding the bike, and putting in place policies that makethis program a sustainable one.
Makati’s Project Hangin
Healthy Air In Good Indoor Environment (HANGIN) Project, was initiated by the City Government ofMakati through the Department of Environmental Services in collaboration with Makati Health Department,Liga ng mga Barangay, Department of Health (DOH), DENR-NCR and the University of the Philippines(UP) College of Public Health. The project officially started on March 12, 2007 through a Memorandumof Agreement that was entered into by the concerned parties.
Cordillera Administrative Region
Efforts of the region is focused more on advocacy for strengthened air quality protection. The advocacyis geared towards increased cooperation and willingness of the people, academe and the youth sectorto participate in environmental programs.
Region 1
City of San Fernando, La Union
In 2006, the City of San Fernando enacted its Environment Code. One of its main components is theTricycle Conversion Program that targeted the conversion of the City’s three-wheeler public transport(tricycles) from 2-stroke to 4-stroke engine motorcycles.
Region 2
Region 2 government agencies, private sectors, LGUs, civil society and communities support the missionof improving air the quality and protecting the environment as shown in their advocacy.
The Department of Agriculture (DA) in Quirino Province has intensified its campaign against burning ofagricultural waste/debris. Interpretative signs were installed along the national road to strategic locationswhich read “Dayami ay huwag sunugin, i-decompose para pataba pagyamanin”.
Penalties are imposed to residents caught burning their agricultural wastes. Positive results were recorded.A high level of awareness among the residents was recorded with no incidence of burning.
5

Region 3
The DOST Region 3, has, since 1999, been promoting technologies that help minimize air pollution.The program aims to assist Small and Medium-Scale Enterprises to comply with environmental qualitystandards through reduction of waste generation. The implementation of cleaner production strategiesserve as a preparatory stage for the implementation of Environmental Management System (ISO 14000standards) within the companies’ manufacturing operations.
Region 4-A
The Local Government of Cavite prepared the Cavite Environment Code under Provincial OrdinanceNo. 43-S-2008. Among the salient features of the code are articles on forest, mineral and water resources,waste management, marine and coastal resources, air and noise pollution management, ecotourism,environmental impact assessment and land use planning.
Region 4-B
The local government units of Region 4-B support the air quality management programs of the EMB. Aspart of their procedure in the renewal of business permits of firms and industries operating in theirrespective jurisdiction, the local government units require copies of Permit to Operate Air PollutionSource and Control Installation issued to them by the EMB Region 4-B to verify if the firms operatingare in compliance with the provisions of the CAA. The local government units are also giving support forthe maintenance of the air quality monitoring stations established by EMB Region 4-B.
Region 5
The local government of Legazpi City has passed an ordinance banning smoking in public places andconveyances. Also, Naga City and Iriga City have intensified their campaign against smoke belchers bycreating Anti-Smoke Belching Units which will provide assistance to LTO and EMB Region 5 deputizedagents in the conduct of random roadside vehicle emission testing. The issuance of ordinance by otherLGUs regarding ban on open burning also helps in improving air quality in the region.
Region 6
Iloilo City has undertaken activities against open burning. The city has likewise actively participated inDENR’s Green Philippine Highways Program and continues to implement other urban greening activi-ties.
Region 7
Cebu City
Cebu City takes pride of its comprehensive planning for transport and land use. The city has embarkedon a variety of initiatives in traffic management. It has already installed a computerized traffic signalsystem called SCATS (Sydney Coordinated Adaptive Traffic System) in 1993, the first in the country. Inrecent years, the city government has been active in its anti-smoke belching efforts and the promotion ofthe Bus Rapid Transit (BRT) as a mass transit system for the city.
6
Region 8
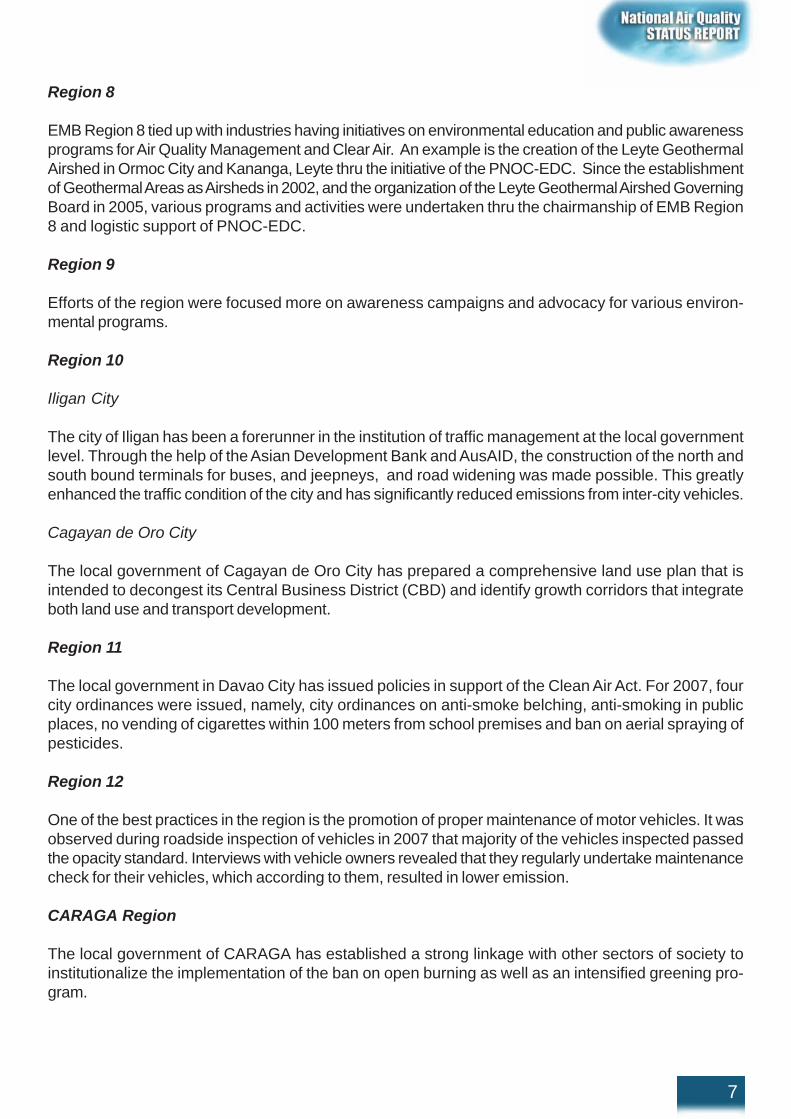
EMB Region 8 tied up with industries having initiatives on environmental education and public awarenessprograms for Air Quality Management and Clear Air. An example is the creation of the Leyte GeothermalAirshed in Ormoc City and Kananga, Leyte thru the initiative of the PNOC-EDC. Since the establishmentof Geothermal Areas as Airsheds in 2002, and the organization of the Leyte Geothermal Airshed GoverningBoard in 2005, various programs and activities were undertaken thru the chairmanship of EMB Region8 and logistic support of PNOC-EDC.
Region 9
Efforts of the region were focused more on awareness campaigns and advocacy for various environ-mental programs.
Region 10
Iligan City
The city of Iligan has been a forerunner in the institution of traffic management at the local governmentlevel. Through the help of the Asian Development Bank and AusAID, the construction of the north andsouth bound terminals for buses, and jeepneys, and road widening was made possible. This greatlyenhanced the traffic condition of the city and has significantly reduced emissions from inter-city vehicles.
Cagayan de Oro City
The local government of Cagayan de Oro City has prepared a comprehensive land use plan that isintended to decongest its Central Business District (CBD) and identify growth corridors that integrateboth land use and transport development.
Region 11
The local government in Davao City has issued policies in support of the Clean Air Act. For 2007, fourcity ordinances were issued, namely, city ordinances on anti-smoke belching, anti-smoking in publicplaces, no vending of cigarettes within 100 meters from school premises and ban on aerial spraying ofpesticides.
Region 12
One of the best practices in the region is the promotion of proper maintenance of motor vehicles. It wasobserved during roadside inspection of vehicles in 2007 that majority of the vehicles inspected passedthe opacity standard. Interviews with vehicle owners revealed that they regularly undertake maintenancecheck for their vehicles, which according to them, resulted in lower emission.
CARAGA Region
The local government of CARAGA has established a strong linkage with other sectors of society toinstitutionalize the implementation of the ban on open burning as well as an intensified greening pro-gram.
7

Recommendations for Necessary Executive and Legislative Action
The government should re-direct its effort of controlling and/or minimizing emissions coming from mobilesources. Programs and activities of DENR aimed at improving the air quality of Metro Manila shallcontinue to be of minimal effect unless other government agencies implement their respective mandatesvigorously as provided in the CAA.
To further improve air quality monitoring and assessment, the following are recommended:
• Strengthen industry self-regulation programs;• Fast track the nationwide implementation of the MVIS;• Strengthen monitoring of compliance on fuel specifications by oil companies;• For LGUs to strengthen its programs in prohibition of open burning of wastes;• Strengthen air-related researches;• Intensify public awareness and education on air pollution prevention among all stakeholders;• Strengthen anti-smoke belching operations by LGUs;• Results of air quality monitoring should be made known to the LGUs concerned particularly those
which frequently exceed the guideline values; and• Encourage the active participation of civil society in the monitoring of the implementation of the
Clean Air Act.
8

Acronyms/Abbreviations Used
ADB - Asian Development BankAusAID - Australian Agency for International DevelopmentBTr - Bureau of TreasuryCAA - Clean Air ActCAI-Asia – Clean Air Initiative for Asian CitiesCAR - Cordillera Administrative RegionCEC - Certificate of Emission ComplianceCFC - ChlorofluorocarbonCO - Carbon MonoxideC.O. - Central OfficeCOC - Certificate of ConformityCOCAP – Concerned Citizens Against PollutionCRAVE - Champion for Reduction of Air Pollution from Motor Vehicle EmissionDA - Department of AgricultureDAO - DENR Administrative OrderDENR - Department of Environment and Natural ResourcesDILG - Department of Interior and Local GovernmentDILG-BLGS - DILG-Bureau of Local Government and SupervisionDOE - Department of EnergyDOH - Department of HealthDOST - Department of Science and TechnologyDOTC - Department of Transportation and CommunicationsDOTC-RTAS - DOTC-Regional Traffic Adjudication ServiceDTI - Department of Trade and IndustryEANET - Acid Deposition Monitoring in East AsiaEMB - Environmental Management BureauEMS - Environmental Management SystemsFMB - Forest Management BureauHANGIN - Healthy Air In Good Indoor EnvironmentIPFI - Infinite Progression Foundation, Inc.LTO - Land Transportation OfficeLGUs - Local Government UnitsMAC - Mobile Air ConditioningMMT - Thousand Metric TonsMMMT - Million Metric TonsMMDA - Metro Manila Development AuthorityMC/TC - Motorcycles/TricyclesMVECT - Motor Vehicle Emission Control TechnicianMVIS - Motor Vehicle Inspection SystemNOV - Notice of Violationµg/Ncu.m. – Microgram per normal cubic meterNCPP- National CFC Phase-Out PlanNCR - National Capital RegionNGVPPT - Natural Gas Vehicle Program for Public TransportNOx - Oxides of NitrogenPM - Particulate MatterPEP - Philippine Energy Plan
9

PETCs - Private Emission Testing CentersPNRI - Philippine Nuclear Research InstitutePNOC-EDC - Philippine National Oil Company- Energy Development CorporationPNS – Philippine National StandardsPO - Permit to OperatePUV - Public Utility VehicleRA - Republic ActSCATS - Sydney Coordinated Adaptive Traffic SystemSMC - Semirara Mining CorporationSMR - Self-Monitoring ReportSOx - Sulfur OxidesSUVs - Sports Utility VehiclesTESDA - Technical Education and Skills Development AuthorityTOGs - Total Organic GasesTSP - Total Suspended ParticulatesUP - University of the PhilippinesUSAID - United States Agency for International DevelopmentUSAID-ECAP - USAID-Energy and Clean Air ProjectUSEPA - United States Environmental Protection AgencyUVs - Utility VehiclesVOC - Volatile Organic Compounds
10

1. Introduction
Clean air is essential for all life on earth. When the air is unhealthy, a host of complications arise thataffects both human health and the state of the country’s ecological wealth.
2. Sources of Air Pollution
2.1 Stationary sources
Stationary source is defined by the Clean Air Act (CAA) as “any building or immobile structure, facility orinstallation which emits or may emit any air pollutant.” Stationary source examples include electricitygenerating plants, processing plants, manufacturing plants, mills, chemical industries, and other indus-trial plants. Specifically, these include manufacturing of food and related products, tobacco manufactur-ing, textile mill products, lumber and wood products, paper and allied products, printing and publishing,chemical and allied products, petroleum and coal products, rubber and miscellaneous plastic products,stone, clay, and glass products, primary metal industries, fabricated metal products, machinery except,electrical and electronic equipment, miscellaneous manufacturing industries.
2.2 Mobile sources
Mobile sources of air pollution are any vehicle/machine propelled by or through oxidation or reductionreactions including combustion of carbon-based or other fuel, constructed and operated principally forthe conveyance of persons or the transportation of property or goods that emit air pollutants as a reac-tion product. These engines are either gasoline, diesel-powered, compressed natural gas (CNG), liq-uefied petroleum gas (LPG) or other alternative fuels, each contributing a characteristic set of pollutantsinto the air. These mobile sources are further categorized into cars, utility vehicles (UVs), trucks, buses,motorcycles/tricycles (MC/TC), aircraft and marine vessels. Table 1 shows the annual motor vehicleregistration from 2005 to 2007. Note that since 2005, the fastest average annual increase has been withMC/TC (10.77%), most of which have two-stroke engines, followed by sport utility vehicles (SUVs)(10.55%) and trucks (2.75%). Likewise, cars continue to increase by 2.35% annually on the average.
11

As shown in Figure 1, MC/TC comprised the largest group (47.88 %), followed by UVs (29.98 %), cars(13.58 %), trucks (5.09 %), SUVs (3.49%), buses (0.55 %), and trailers (0.44 %). Figure 2 further showsthat, in general, the number of motor vehicles has increased by more than 100% from 2003 to 2007. Theincrease of motor vehicle registration from 2003 to 2004 had been attributed to the high number ofmotorcycle registration.
Source: LTO
Table 1. National Annual Motor Vehicle Registration by Vehicle Type 2005-2007
MV Type
CAR
UV
SUV
TRUCK
BUS
MC/TC
TRAILER
Sub-total
Grand Total
Modeof Registration
NewRenewalSub-TotalNewRenewalSub-TotalNewRenewalSub-TotalNewRenewalSub-TotalNewRenewalSub-TotalNewRenewalSub-TotalNewRenewalSub-TotalNewRenewal
2005
41,175747,233788,408
93,9591,593,8971,633,856
21,554136,384157,938
15,245251,670266,915
1,73829,23930,977
585,4821,572,2552,157,737
1,42722,49523,922
760,5804,299,173
5,059,753
2006
40,763751,610792,373
88,9501,529,1511,618,101
25,491147,303172,794
16,896269,005285,901
2,00827,13629,144
605,0381,804,3252,409,363
2,59521,30323,898
781,7414,549,833
5,331,574
2007
46,183704,909751,092
91,5181,511,1011,602,619
27,503165,488192,991
18,439262,822281,261
2,51827,64130,159
671,5881,975,9862,647,574
1,78922,56724,356
859,5384,670,514
5,530,052
12

Source: LTO
Figure 1. Percentage Share of National Motor Vehicle Registration By Vehicle Type
Source: LTO
Figure 2. Trend of National Motor Vehicle Registration , 2003-2007
Table 2 gives the distribution of motor vehicles by region. The NCR has 29% of the total vehicles regis-tered nationwide. Both Regions III and IV-A have about the same share of 13% of the total.
13
2003-2007 NATIONAL TREND OF MV REGISTRATION

Table 2 Regional Annual Total Motor Vehicle Registration (2005-2007)
Source: LTO
2.3 Area Sources
Area sources are relatively large areas of specific activities that generate significant amounts of airpollutants. These include busy roads and hubs, construction sites, aircraft operations, forest fires or theburning of wastes, residential sites, and similar dispersed sources. Areas sources which may emitrelatively small amounts of pollutants when taken individually, but whose combined emissions add sig-nificantly to the air pollution in the area. Examples of these area sources of air pollution include:
• The open burning of solid wastes widely practiced in most urban centers including Metro Manila• The continuing destruction of forests by fire thru kaingin and natural causes• The burning of agricultural biomass after harvest, including rice, corn, and sugarcane stalks• The aerial spraying of pesticides
14

3. Ambient Air Quality
Figure 3 shows the national total suspended particulate (TSP) monitoring from 2003 to 2007. A signifi-cant 33% improvement was observed with concentrations decreasing from 144 to 97 microgram pernormal cubic meter (µg/Ncu.m.) Although trends are decreasing, TSP geometric mean concentrationsare still above the 90 µg/Ncu.m. annual mean TSP guideline value for one year averaging time (Table 3).As such, more efforts are needed to comply with the guideline by 2010 as provided in the General Planof Action for Air Quality Management. The locations of the ambient (roadside and general area) airquality monitoring stations in the different regions of the Philippines and the corresponding TSP con-centrations (1 year 24-hour averaging time) are shown in Table 4.
Source: EMB
Figure 3. National Ambient TSP Trend (1 Year 24-Hour Averaging Time), 2003-2007
Table 3 – National Ambient Air Quality Guideline Values
a - Maximum limits represented by ninety-eight percentile (98%) values not to exceed more than once a year.b- Aritmetic mean.c - SO2 and suspended particulate matter are sampled once every six days when using the manual methods. A minimun of twelvesampling days per quarter or forty-eight sampling days each year is required for these methods. Daily sampling may be done in thefuutre once continuous analyzers are procured and become available.d - Limits for Total Suspended Particulate Matter with mass median diameter less than 25-50 pm.e - Annual Geometric Mean.
15

Table 4 – Ambient Air Quality Monitoring Stations in the Philippines (TSP) (1 Year24 hour averaging)
16
National
TSP
Trending
2003 2004 2005 2006 2007
REGION STATIONS CONCENTRATION (ug/Ncm)
National Capital Region (NCR
NCR-Makati NCR-Valenzuela NCR-Congressional Ave. NCR-East Ave. NCR-EDSA NPO Q.C. NCR-Ateneo NCR-Mandaluyong NCR-Manila NCR-Pasig NCR-Las Piñas NCR-Pasay NCR-EDSA MMDA NCR-EDSA MRT
198 247 225 179 157 83 136 180 101 37 178
211 206 275 170 164 105 133 134 109 135 226 236
183 152 129 163 87 124 138 106 134 213 323
153 157 104 138 72 121 111 90 159 159 316
146 146 102 125 65 134 110 92 140 257
Cordillera Autonomous Region
CAR-Plaza Garden 204 229 170 155 201
Region 1 Lingsat, City of San Fernando, La Union
Laoag City (in front of Heroes Bldg.) Alaminos City San Fernando City
130
312 183
141 179
153 155
159 148
Region 2 Cagayan Valley
Tug. Station Brgy. 10 Tuguegarao City
198
59
102
84
98
Region 3 San Fernando
SM Elegant-San Fernando Iba Station Saluysoy Station Cabanatuan Bocaue, Bulacan Meycauayan, Bulacan MEL-VI Bldg., OG Road City of San Fernando Intercity Ind’l Subd. Wakas
117 101 141
190 84
309 103 370 309
186 195
116 215 457
Region 4A Mainland Provinces
Cavite
79
84
62
59 46
Region 4B MIMAROPA
Batangas Oriental Mindoro
127
144 217
140 86
46 110
49
Region 5 Legaspi City
Barriada, Legaspi City San Nicolas, Iriga City Panganiban Drive, Diversion Road, Naga City
110 110 106
72 108 84
72 88 83
125 95 101
84 76 105

Source: EMB
The Philippine Nuclear Research Institute (PNRI) continued to monitor particular matter in the PM10range using the Gent sampler at three sites in Metro Manila with two stations co-located with those ofthe Environmental Management Bureau. The monitoring is being done to identify the major sources ofair pollution and to estimate the contribution of these sources to air pollution. Tables 5 and 6 representthe PM10 and PM 2.5 monitoring from year 2001 to 2007. Data show the minimum and maximum concen-tration of particulates in ug/Ncu.m.
Table 4 – Ambient Air Quality Monitoring Stations in the Philippines (TSP) (1 Year24 hour averaging)
17
National TSP Trending 2003 2004 2005 2006 2007
REGION STATIONS CONCENTRATION (ug/Ncm)
Region 6 – Iloilo City
Jaro Police Station Compound Lapaz Plaza
177 92
182 104
141 81
68 87
67 110
Region 7 – Cebu City
Oportos Residence Baricuatros residence Canos Residence MEPZI (PM10) Mandaue Foam-H. Cortes St., Mandaue City Valuerich, Sudlon, Mandaue City Wilson Foods, Mandaue City Banilad, Mandaue City N. Gupuit Res., Boundary Inuburan & Langtad, Naga, Cebu City
72 117 93 36
56 64 89
88 24.18 42 88
87 159
80 137
Region 8-Tacloban City
P&M Bldg. DENR Cpd., Sto. Niño Extn., Tacloban City
73
45
Region 9-Zamboanga City
Station 1 Station 2 Station 3
237 226 227
220 209 218
154 161 170
155 149 126
128 105 110
Region 11-Davao City
Station 1 (5) Station 2 (6) Station 3 (7) Station 4 (8) Station 5 (9) Station 6 (10)
90 42 182 249 335 39
56 64 91 89
44 63 66 66
44 63 66 66
87 63 36 40
Region 12-Cotabato City
Station 1 in front of Palomolog, South Cotabato Station 2 in front of Mun. Hall Suralla, Cotabato city Station 3 in front of Mun. Hall, Isulan Sultan Kudarat
99 93 95
135 91.94 90.56
81 80 78
85.5 85.57 85.37
90.17 87.31 86.82
Region 13-
Butuan City
New Asia, Butuan City 96 83 81 70 71

Table 5. 2001 to 2007 PM10 Annual Mean Levels and Concentration Ranges at the PNRI MetroManila Sampling Sites
Source: PNRI
Table 6. 2001 to 2007 PM2.5 Annual Mean Levels and Concentration Ranges at the PNRI MetroManila Sampling Sites
Source: PNRI
18
Year Concentration in ug/cu.m. (range)
ADMU NAMRIA POVEDA VALENZUELA
2001 50.4
(23.3-78.9)
2002 50.3
(21.7-95.0)
36.4
(52-72.3)
2003 44.0
(17.3-80.3)
44.8
(16.7-92.8)
2004 47.0
(16.9-82.2)
41.5
(21.0-67.6)
42.6
(16.3-75.0)
45.7
(22.8-81.8)
2005 49.5
(18.5-179.0)
48.3
(19.0-78.4)
52.2
(24.8-89.4)
58.5
(19.7-104.3)
2006 42.5
(13.0-84.1)
51.6
(18.9-61.8)
64.0
(20.9-157.3)
2007 45.7
(22.2-84.0)
43.3
(19.2-85.5)
52.8
(18.0-113.0)
Year Concentration in ug/cu.m. (range)
ADMU NAMRIA POVEDA VALENZUELA
2001 27.9
(10.1-49.1)
2002 27.7
(13.0-50.5)
15.8
(1.1-32.1)
2003 26.0
(2.8-49.8)
18.5
(3.2-39.0)
2004 28.0
(11.8-51.4)
15.8
(4.8-33.2)
15.0
(4.3-35.0)
20.1
(9.4-32.6)
2005 30.0
(9.9-113.0)
22.0
(7.8-48.0)
19.6
(9.0-44.0)
25.0
(10.0-63.3)
2006 25.8
(8.2-42.1)
21.7
(8.27-25.3)
29.2
(9.2-68.8)
2007 25.9
(10.6-43.3)
16.8
(2.3-48.0)
19.8
(8.9-39.6)

Source: PNRI
Figure 4. PM10 Annual Mean Levels at the PNRI Metro Manila Sampling Sites 2001 to 2007
Furthermore, PM10 annual mean levels in all the PNRI Metro Manila sampling sites are in compliancewith the Annual Ambient Air Quality long term guideline value of 60 µg/m3 except for Valenzuela in 2006and are in general showing decreasing trends in 2007 compared to 2006.
Source: PNRI
Figure 5. PM2.5 Annual Mean Levels at the PNRI Metro Manila Sampling Sites
Also, PM2.5 annual mean levels in all the PNRI Metro Manila sampling sites, although showing a generaldecreasing trend in 2007 compared with 2006, have consistently been in exceedance of the US EPAlong term guideline value of 15 µg/m3 indicating a need to address fine particulate pollution.
19
0
20
40
60
80
2001 2002 2003 2004 2005 2006 2007
P M10 L evels , μg /m3
A DMU NA MR IA P OV E DA V A L E NZUE L A
Philippine 1-year
guideline value
0
20
40
60
80
2001 2002 2003 2004 2005 2006 2007
P M2.5 L evels , μg /m3
ADMU NA MR IA P OV E DA V AL E NZUE L A
US EPA 1-year
guideline value

4. Air Quality Management
4.1 Emissions Inventory
Emission Inventory is an estimation of the sources, extent, and future trends of air pollutants in a givenarea. Although inventories are merely approximations, results serve as basis in the prioritization of airquality regulations. The conduct of emission inventory is required by the CAA of 1999 or RA 8749 onceevery three years. Emissions inventories use information submitted by companies as part of their selfmonitoring and permitting requirements. The previous emissions inventory was conducted in 1990 andwas updated in 2001-2004, and continuously three years thereafter. The Philippine emissions inventorycovers criteria pollutants which include PM, sulfur oxide, nitrogen oxide, carbon monoxide, volatile or-ganic compounds, and total organic gases from mobile sources.
Emission inventory in the Philippines utilizes emission factors. These are numerical values relating thequantity of pollutants released from a source to some activity associated with those emissions. It is anexcellent tool in conducting emission inventories used in quantifying and identifying the extent of airpollution emitted by a certain source. With regards to motor vehicles, local emission factors were devel-oped under the 1992 vehicular emission control program funded by the Asian Development Bank. Forstationary sources, the USEPA AP-42 is used.
Based on the 2006 National Emission Inventory, majority of the regions in the country point to the trans-port sector as the major source of air pollution. As shown in Figure 6, it was estimated that 65% of thepollutants came from mobile sources, 21% came from stationary sources, and the remaining 14% fromarea sources.
Figure 6. 2006 National Emissions Inventory According to Source of Air Pollution
20

Table 7 shows that CO has the biggest pollution load contribution of 50%. CO emission is relativelycaused by the increasing population of gasoline-fed vehicles which include MC/TC (47.88%) and cars(13.58%). Other pollutants contributions are as follows: NOx – (15%), VOC-(15%), PM-(11%), SOx –(9%).(see Figure 7).
Table 7– 2006 National Emissions Inventory (in tons/year)
Source: EMB
Source: EMB
Figure 7. 2006 National Compilation of Emissions Inventory According To Criteria Pollutants
4.2 Management of Stationary Sources
The EMB, through its regional offices, is in-charge of monitoring industrial firms. For complying indus-tries, permit to operate (PO) are issued with a maximum of five years. For companies found to violateenvironmental laws, notices of violations (NOVs) are issued and for non-complying companies a Ceaseand Desist Order (CDO) will be issued by the Pollution Adjudication Board (PAB).
21
Source PM SOx NOx CO VOC Total %
Stationary 110,023 598,634 326,219 360,620 67,859 1,463,385 21
Mobile 244,764 14,309 405,033 9,988,616 914,996 4,567,719 65
Area 423,615 1,963 327,261 165,647 63,855 982,340 14
Total 778,402 614,937 1,058,514 3,514,883 1,046,710 7,013,444 100
% 11 9 15 50 15 100

From 2005-2007, a total of 18,697 firms were monitored. Also, a total of 1,676 NOVs and 24,391 POswere issued within the three-year period. The breakdown of NOVs and POs for all regions is shown inTable 8. Compared to the other regions, the NCR has the most number of NOVs issued annually. Region4-a, where most of the industries are located, has the highest number of POs.
Establishments that emit air pollutants are required to submit to EMB a self monitoring report (SMR) thatdemonstrates their compliance with environmental regulations, including the CAA. The SMR, which issubmitted on a quarterly basis, contains among others, concentration and flow rate of air pollutantsemitted by the establishment.
The EMB, through its regional offices, validates compliance of establishments with CAA through stacksampling.
Major industrial facilities such as power plants and cement plants are required to install continuousemissions monitoring systems.
Table 8 - Notice of Violations (NOV) and Permit to Operate (PO) Issued, 2005-2007
Source: EMB
22
Region
2005 2006 2007
NOV PO NOV PO NOV PO
NCR 216 1,795 209 907 218 727
CAR - 264 10 168 11 132
1 23 510 - 475 40 353
2 37 330 40 458 - 308
3 52 673 36 584 46 644
4a - 2,438 5 1,281 11 1,727
4b - 379 20 321 48 285
5 41 416 71 655 70 800
6 148 608 33 541 16 458
7 20 687 50 698 31 662
8 - 217 5 224 6 280
9 3 139 - 145 - 180
10 16 535 10 233 1 334
11 46 364 30 400 21 223
12 8 184 8 80 9 93
13 1 120 5 171 5 185
Total 611 9,659 532 7,341 533 7,391

Accreditation of Third Party Source Emission Testing Firm
Accreditation of Source Emission Testing Firm aims to provide assurance to stakeholders, regulatorsand the public of the reliability of source emission test results; and to ensure that accredited firms arefully capable of conducting source emission tests in accordance with the Implementing Rules and Regu-lations (IRR) of RA 8749 DENR Administrative Order (DAO) 2000-81. There are six accredited firmsthat provide source emission testing services to demonstrate compliance with the CAA IRR standards.The firms have undergone performance test that include oral and written examination and on-site dem-onstration.
The CEMS consists of a probe installed in a smoke stack (photo at left) which is connected to ananalyzer (photo at right) to continuously measure the concentration of air pollutants.
Continuous Emission Monitoring Systems
Continuous Emission Monitoring Systems (CEMS) “means the total equipment required under the CleanAir Act’s Implementing Rules and Regulations or as directed by the EMB, used to sample and condition(if applicable), analyze, and provide a permanent record of emissions or process parameters. Suchrecord shall be the basis of the firm’s compliance with the emission standards. Further, it may be anapproved monitoring system for continuously measuring the emission of a pollutant from an affectedsource or facility and as such, may be used in computing annual emission fees.”
EMB technical personnel doing stack sampling work
23

Stationary sources with actual emissions per year of 750 tons per regulated pollutant are reqiured toinstall CEMS to monitor and report compliance to emission standards.
4.3 Management of Mobile Sources
The LTO enforces compliance with emission standards for motor vehicles pursuant to pertinent provi-sions of the CAA of 1999 and its Implementing Rules and Regulations.
Motor Vehicle Inspection System (MVIS) Project
Under the IRR of the CAA, all private in-use motor vehicles and vehicles with updated/enhanced en-gines whose chassis are pre-registered with the LTO will only be allowed renewal of annual registrationupon inspection by the LTO or other authorized private motor vehicle inspection center.
The MVIS project involves the construction of motor vehicle inspection centers to cover all types andclassifications of motor vehicles all over the country. The centers shall be situated in areas with highmotor vehicle density such as the National Capital Region (NCR), Metro Davao, and Metro Cebu, and inurban areas with satellite city/townships as clusters. The MVIS centers shall be equipped with the state-of-the-art equipment and shall be fully computerized. The IRR of the Clean Air Act directed the LTO toestablish MVIS in Metro Manila by 2003 and nationwide implementation shall follow in 12 to 18 monthsthereafter. Upgrading and rehabilitation shall be given priority in the existing six LTO MVIS (NCR-Northand South, Regions III, IV-A, VII and XI).
Private Emission Testing Center (PETC) Program
A PETC is a privately – owned facility for determining the level of opacity and testing the gaseouscontent of motor vehicle emissions. Its job is to determine if the vehicle emissions conform to the stan-dards set by the DENR under the CAA.
The Department of Trade and Industry (DTI) and the Department of Transportation and Communications(DOTC) issued a Joint Administrative Order (JAO) setting the guidelines for the accreditation of PETCsfor motor vehicles. There are currently 575 PETCs nationwide.
Certified technicians perform emission tests on vehicles
24

Compliance with emission standards of all motor vehicles has been started in January 2003 in a nation-wide scope through the operationalization of PETCs. The DOTC through the LTO authorizes PETCsthat have been previously accredited with the DTI. The DENR, on the other hand, is responsible forregulating the specifications of the emission testing equipment by PETCs.
Renewal of vehicle registration as well as retrieval of confiscated licensed plates due to smoke belchingrequires the presentation of Certificate of Emission Compliance (CEC) to LTO. Activities involved inthis program are the interconnectivity between the LTO and the PETCs for real time monitoring andvalidation of data prior to motor registration; and strict monitoring of PETC operations via decentralizedsetup with the LTO regional offices directly responsible for PETCs operating within their respectiveareas of responsibility.
The Technical Education and Skills Development Authority (TESDA) is in charge of implementing theassessment and certification program for the Motor Vehicle Emission Control Technician (MVECT). Allcertificates relating to the national trade skills testing and certification system shall be issued by theauthority through the TESDA Secretariat. In addition, the Secretary of Labor and Employment shalldetermine the occupational trades for mandatory certification.
Private industry groups and trade associations are accredited to conduct approved trade tests, and thelocal government units to promote such trade testing activities in accordance with the guidelines to beset by the Authority. Accreditation of technicians that is provided by MVECT is a requirement of thePETC program. With the issuance of the DENR-DTI-DOTC Joint Administrative Order No.1 series of2007 or the Amended Guidelines and Procedures for the Monitoring of Accredited and Authorized Pri-vate Emission Testing Centers (PETC) and LTO emission testing activities, the compliance with theprovisions of the Philippine Clean Air Act is monitored and ensured.
Roadside Smoke Emission Apprehension and Testing
Vehicles observed to be emitting excessive smoke while operating in any public highway may be sub-jected to an emission test by properly-equipped law enforcers and other deputized agents from the
Table 9 – Anti-Smoke Belching Apprehensions for 2005-2007
Source: LTO 25
REGIONS Apprehensions
2005 2006 2007
I 18 4 11
II 65 8 867
III 7 469 499
IV-A 199 704 285
IV-B 2
V 64 189
VI 67 127 118
VII 966 331 754
VIII 294 284 228
IX 10 103 8
X 27 14 58
XI 2 7 3
XII
CAR 1,279 1,051 32
CARAGA
C.O. 12,922 12,110 8,504
TOTAL 15,858 15,276 11,556

DOTC-LTO, Metro Manila Development Authority (MMDA), and local government units in strategic pointsin Metro Manila.
Table 9 shows the total number of apprehensions of smoke belching vehicles. For 2005, a total of 15,858apprehensions were made by the LTO. Meanwhile, for 2006, a total of 15,276 vehicles were appre-hended. For 2007, apprehensions reached a total of 11,556.
Under the “Bantay Tambutso” program, the DENR-EMB-NCR intensified its anti-smoke belching cam-paign through roadside apprehension along the stretch of EDSA and other high traffic density areas inMetro Manila. Some of the anti-smoke belching activities conducted were held in the cities of Caloocan,Quezon, Mandaluyong, Makati, Pasay, Mandaluyong and Muntinlupa.
As of December 2007, the DENR-EMB-NCR Anti-Smoke Belching Unit (ASBU) Team, inspected atotal of 15,238 vehicles and apprehended a total of 12,497 vehicles for failing the emission standards.This was made possible through the combined efforts of the DENR ASBU Team, local government unitsand non-government organizations.
Emission Control for Motor Vehicles• Emission Limits for Type Approval and In-use Emission Standards
The adoption of EURO 2 type approval standards for new motor vehicles was signed in 2007 to takeeffect in 2008, pursuant to DENR Administrative Order 2007-27. In-use vehicles shall comply with strin-gent emission standards for vehicles registered after 31 December 2007.
• Certificate of ConformityA COC is issued by the DENR, through EMB, to a motor vehicle manufacturer, assembler, or importercertifying that a motor vehicle type complies with the numerical emission standards stipulated in DAO2000-81 and DAO 2007-27, using the relevant Economic Council for Europe (ECE) test procedures ortheir equivalent as approved by the DENR. No new motor vehicle is allowed initial registration unless avalid COC is issued by the Department through the Bureau.
Table 10 shows the total number of COC issued for passenger vehicles, light commercial vehicles,heavy duty vehicles and motorcycles for the period 2005-2007. In 2005, a total of 96 COCs were issuedfor passenger vehicles and light commercial vehicles, nine COCs for heavy duty vehicles and 38 COCsfor motorcycles. In 2006, a total of 125 COCs were issued for passenger vehicles and light commercialvehicles, 31 COCs for heavy duty vehicles and 23s COC for motorcycles. Finally, in 2007, a remarkableincrease in the number of COCs issued was recorded, with a total of 343 COCs for passenger vehiclesand light commercial vehicles, 81 COCs for heavy duty vehicles and 171s COC for motorcycles. This islargely attributed to the computerization of LTO’s registration process.
Table 10. Certificate of Conformity (COC) Issued, 2005-2007
Source: EMB
26
Class/Type of Motor Vehicles No. of COCs Issued
PASSENGER VEHICLES/LIGHT COMMERCIAL
VEHICLES (M1, N1)
564
HEAVY DUTY VEHICLES 121
MOTORCYCLES 232

4.4 Regulations and Policies
From 2005-2007, the DENR-EMB issued policies on air quality management as shown in Table 11.These directives were issued to further strengthen the implementation of air quality efforts in the country.
Table 11. Policies Issued from 2005-2007
4.5 Clean Fuels and Fuel Quality
As mandated, the Department of Energy (DOE) and the Department of Environment and Natural Re-sources (DENR) co-chair the Technical Committee on Petroleum Products and Additives (TCPPA) whichsets specifications of all types of fuel and fuel-related products to improve fuel composition for increasedefficiency and reduced emissions. Aside from DOE and DENR, the TCPPA is composed of represen-tatives of DTI-Bureau of Product Standards (BPS), the Department of Science and Technology (DOST),the fuel and automotive industries, academe and the consumers. Specifications of all types of fuel areadopted by the BPS as Philippine National Standards (PNS).
Likewise, the DOE, specifically the Oil Industry Management Bureau, is mandated to monitor the com-pliance of the oil companies/dealers nationwide.
RA 9367 otherwise known as the Bio-fuels Act of 2006 “An Act to Direct the Use of Bio-fuels, Establish-ing for this Purpose the Biofuels Program, Appropriating Funds therefore, and for other Purposes” wassigned into law by the President on January 12, 2007 and became effective on February 6, 2007. The“Bio-fuels Policy” aims to achieve energy independence and fuel diversification while meeting environ-mental challenges through the utilization of agricultural-based feed stocks thus increasing economicactivity, especially in country side. A National Biofuel Board was established as an advisory body toDOE. Biofuel refers to fuels made from biomass and primarily used for automotive, thermal and powergeneration, with quality specifications in accordance with the Philippine National Standards (PNS).
Source: EMB
27
DENR Administrative
Order (DAO) Number
Policy Title Date of Issuance
DENR- DTI- DOTC Joint
Adminstrative Order No. 1
Series of 2007
Amended Guidelines and Procedures for
the Monitoring of Accredited and
Authorized Private Emission Testing
Centers (PETC) and Land Transportation
Office (LTO) Emission testing Activities
December 2007
DAO 2007-27 Revised Emission Standards for Motor
Vehicles Equipped with Compression-
Ignition and Spark-Ignition Engines
31 July 2007
DAO 2007-25 Guidelines for DENR Accreditation of
Third Party Source Emission Testing Firms
31 July 2007
DAO 2007-22 Guidelines on the Requirements for
Continuous Emission Monitoring Systems
(CEMS) and other Accepted Protocols .
thereby Modifying and Clarifying Certain
Provisions
31 July 2007

As mandated in the Act, bio-diesel blend of 1% (B1) by volume is available in all gas/pump stationsnationwide since May 2007 (no more 100% conventional diesel). Likewise, bio-ethanol blend of 10%(E10) is distributed and sold by some oil companies/dealers in the country. The biofuel and their blendsare either manufactured/imported/sold conforming to the Philippine National Standards.
Table 12 shows the fuel properties critical under CAA and closely monitored by the DOE.. The level ofcompliance of oil industry players nationwide with the benzene and aromatics standard for gasoline was100%, while that for sulfur in automotive diesel oil was 97%.
Table 12. Critical Fuel Properties under CAA
Source: CAA
Coal Consumption and Importation
Coal is a black or brownish black, solid combustible rock used mainly in the generation of electricity andmanufacture of cement. Currently, coal-fired thermal power plants remain as the number one producerof electricity and account for a total of 3,967 MW or 25% of the country’s total installed powered gener-ating capacity.
Coal deposits are scattered over the Philippines but the largest deposit is located in Semirara Island,Antique. The country’s largest coal producer is Semirara Mining Corporation (SMC), which contributesabout 92% of the local coal production. Coal mines are also located in Cebu, Zamboanga Sibuguey,Albay, Surigao and Negros Provinces.
Based on the 2006 Update of the Philippine Energy Plan (PEP), coal production in 2004 surpassed the2003 level by 34 percent from 2.0 MMMT in 2003 to 2.7 MMMT in 2004. Improved coal production of bigmining companies such as the Semirara Mining Corporation (SMC) as well as good weather conditionscontributed to this positive development. SMC produced a total of 10.09 MMBFOE of coal from itsPanian Pit on Semirara Island, Antique, increasing by 1.39 MMBFOE from its 2004 production level.
28
Figure 8. Historical Coal Sector Performance
Fuel Parameter Level
Gasoline
aromatics 35% by vol. (maximum)
benzene 2 % by vol. (maximum)
AKI 87.5 (minimum)
Reid Vapor
Pressure 9 psi (maximum)
Automotive Diesel sulfur 0.05% by wt. (maximum)
Cetane index 48 (minimum)

The local coal consumption for 2006 as of December 12 was 9.5 MMT, 73% of which was for powergeneration, 22.5 % for cement production, and 3.75% for other industrial operations. In 2005, local coalproduction reached 3.1 MMMT, an increase of 16% from the 2004 level. Domestic coal production isestimated to yield a 12.5% increase in the next 10 years from 3.1 MMMT in 2005 to 6.6 MMMT in 2014at 10,000 BTU/lb. Coal production in 2006 was 2.5 MMMT run-of-min, 2.5% of which came from small-scale coal mining operations. With the cement industry, power generating plants and process industryas major coal users, coal consumption for the year 2005 reached 36.22 MMBFOE or 4.80 percenthigher than the 2004 consumption of 34.56 MMBFOE. Coal consumption of the industrial sector reached32.91 MMBFOE in 2005, 18.69 percent higher than the 2004 level of 27.75 MMBFOE. This is primarilydue to the increased consumption of some of the local cement factories and coal-fired power plants.
The country’s coal requirements are sourced from domestic production and importation. For 2005, totalimportation reached 7.0 MMMT, 49% of which came from Indonesia, 32% from China, 10% fromAustralia and 7% from Vietnam (Figure 9).
29
Figure 9. Sources of Coal Importation

Clean Coal TechnologiesThe combustion of coal and other fossil fuels emits oxides of Sulfur (SOX) and Nitrogen (NOx) as well asCarbon dioxide (CO2) to the atmosphere. However, these are minimized or eliminated through the useof clean coal technologies such as fluidized bed combustion, flue gas de-sulfurization and electrostaticprecipitation.
To address environmental concerns, the DOE encourages the operation of coal power plants that utilizeclean coal technologies. Efforts to educate the public are likewise intensified to better inform them ofsuch clean coal technologies.
Alternative Fuels ProgramAlternative fuels are fuels that are not composed substantially of petroleum and thus, are alternatives topetroleum. As a substitute to this “traditional” fuel, it is expected to yield significant energy security andenvironmental benefits to its consumers. Methanol, denatured ethanol, and other alcohols blended withgasoline, diesel or other fuels are alternative fuels. Those that act as substitutes to petroleum, such asnatural gas, liquefied petroleum gas, hydrogen, and coal-derived liquid fuels are also considered asalternative fuels, as are fuels derived from biological materials and electricity.
The Alternative Fuels Program is one of the five key components of the Arroyo Administration’s EnergyIndependence Agenda, which outlines the roadmap that will lead to the country’s attainment of 60%energy self-sufficiency by 2010.
The Program has four major subprograms, namely Biodiesel Program, Bioethanol Program, NaturalGas Vehicle Program for Public Transport (NGVPPT), and Autogas Program. Other technologies advo-cated under the program are hybrid, fuel cell, hydrogen, and electric vehicles. As of 2007, twenty two(22) commercial buses have been utilized under the NGVPPT.
The Department of Energy (DOE) is implementing a long-term Alternative Fuels Program to reduce thecountry’s dependence on imported oil and provide cheaper and more environment-friendly alternativesto fossil fuels. Through the said program, the DOE intends to tap the country’s domestic produce asviable sources of energy. The goal is to develop indigenous and renewable energy fuels for long termenergy security, which will be a pillar for our country’s sustainable growth.
4.6 Airsheds
An airshed is a part of the atmosphere that behaves in a coherent way with respect to the dispersion ofatmospheric emissions. The Philippine Clean Air Act of 1999 (RA 8749) and its Implementing Rulesand Regulations defines an airshed as “areas with similar climate, weather, meteorology and topogra-phy which affect the interchange and diffusion of pollutants in the atmosphere.” Table 11 provides the listof designated airsheds nationwide.
From 2005 to 2007, two (2) airsheds were additionally designated. These are the Metropolitan IloiloAirshed (Region 6) designated in 2005 which covers the areas of Oton, Pavia, Leganes, San Migueland Iloilo City, and the Baco-Naujan-Calapan (Region 4-B) Airshed designated in 2006 which coversthe municipalities of Baco and Naujan as well as the entire Calapan City. Airsheds are to be managedby multi-sectoral governing boards which are tasked to formulate policies and standards as well asaction plans to effectively manage the air quality situation within their respective areas.
30

Table 13. Designated Airsheds Nationwide
Name of Airshed
Metro Manila Airshed
BLIST Airshed
Northeastern Pangasinan
Metro Tuguegarao (PIESTTA)
Airshed
Baco-Naujain-Calapan Airshed
Naga City Airshed
Bacon-Manito Geothermal
Airshed
Metropolitan Iloilo Airshed
Region
NCR,
3 and 4A
CAR
1
2
4B
5
5
6
MC No. and date signed
DAO No.2002-05 datedJanuary 23, 2002
MC No. 2002-03 dated
February 12, 2003
DAO No. 07 Series of 2004
dated March 23, 2004
DAO No. 05 Series of 2004
dated March 23, 2004
DAO No. 02 Series of 2006
dated January 16, 2006
published January 19,
2006
DAO No. 2003-33 dated
July 14, 2003
DAO No. 11 Series of 2004
dated May 18, 2004
DAO No. 2005-11 dated
June 10, 2005
Coverage
17 cities and municipalities in Metro
Manila. Part of Region 3 (Bataan,
Bulacan and Pampanga) and part of
Region IV (Cavite, Laguna, Rizal and
part of Quezon Province)
City of Baguio and Municipalities of La
Trinidad, Itogon, Tuba and Sabang
Binmaley, San Fabian, Lingayen, Laoac,
San Jacinto, Calasiao, Mangaldan,
Manaoag, Binalonan, Malasiqui,
Mapandan, Pozorrubio, San Carlos City,
Sison, Sta. Barbara, Urdaneta City,
Dagupan City, San Manuel
Peñablanca, Iguig, Enrile, Solana,
Tuguegarao City, Tuao, Amulong
Baco, Naujan municipalities and
Calapan City
Abella, Balatas, Bagumbayan Norte,
Lerma, Liboton, Bagumbayan Sur,
Pacol, Sta. Cruz, Concepcion, Pequeña,
Sabang, San Isidro, Dayangdang,
Dinaga, Triangulo, Del Rosario,
Tabuco, Cararayan, Panicuason,
Tinago, Igualdad Peñafrancia, Calauag,
San Felipe and San Francisco
Ranges: Latitude 12059"58.0897-
1304"37.2524 Long: 123051"41.1827-
123059"32.0355
Oton, Pavia, Leganes, San Miguel, Iloilo
City
31
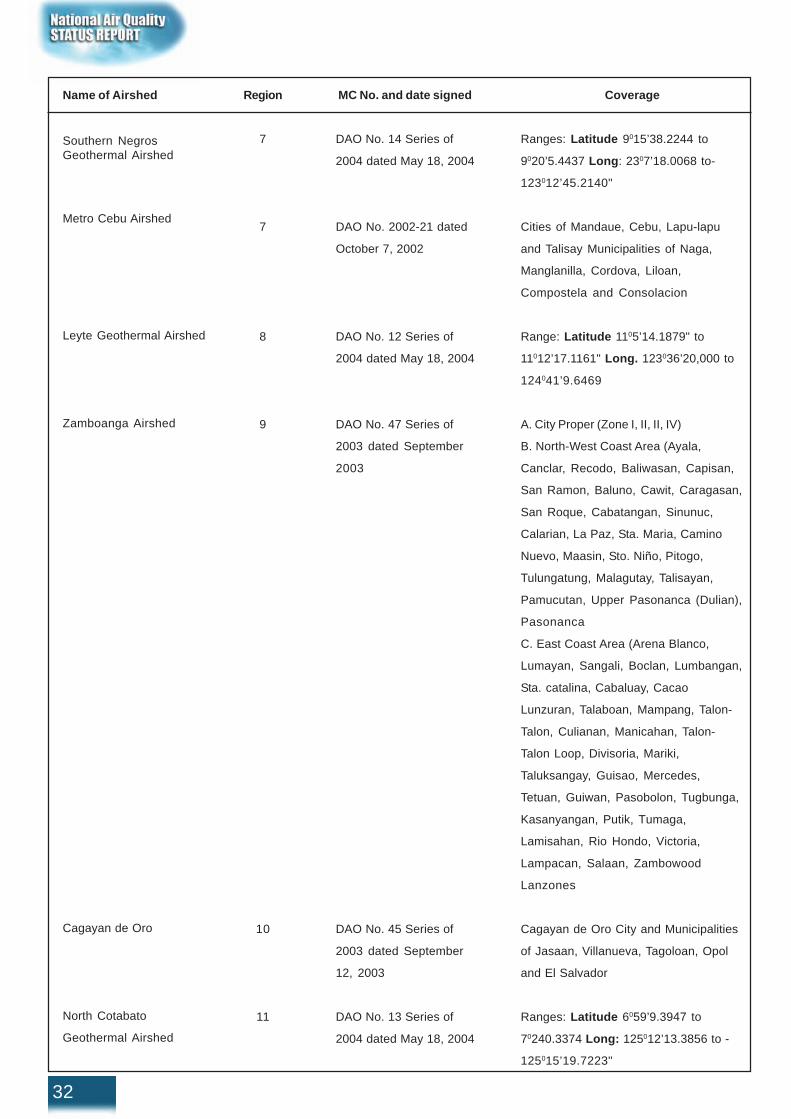
Name of Airshed
Southern NegrosGeothermal Airshed
Metro Cebu Airshed
Leyte Geothermal Airshed
Zamboanga Airshed
Cagayan de Oro
North Cotabato
Geothermal Airshed
Region
7
7
8
9
10
11
MC No. and date signed
DAO No. 14 Series of
2004 dated May 18, 2004
DAO No. 2002-21 dated
October 7, 2002
DAO No. 12 Series of
2004 dated May 18, 2004
DAO No. 47 Series of
2003 dated September
2003
DAO No. 45 Series of
2003 dated September
12, 2003
DAO No. 13 Series of
2004 dated May 18, 2004
Coverage
Ranges: Latitude 9015’38.2244 to
9020’5.4437 Long: 2307’18.0068 to-
123012’45.2140"
Cities of Mandaue, Cebu, Lapu-lapu
and Talisay Municipalities of Naga,
Manglanilla, Cordova, Liloan,
Compostela and Consolacion
Range: Latitude 1105’14.1879" to
11012’17.1161" Long. 123036’20,000 to
124041’9.6469
A. City Proper (Zone I, II, II, IV)
B. North-West Coast Area (Ayala,
Canclar, Recodo, Baliwasan, Capisan,
San Ramon, Baluno, Cawit, Caragasan,
San Roque, Cabatangan, Sinunuc,
Calarian, La Paz, Sta. Maria, Camino
Nuevo, Maasin, Sto. Niño, Pitogo,
Tulungatung, Malagutay, Talisayan,
Pamucutan, Upper Pasonanca (Dulian),
Pasonanca
C. East Coast Area (Arena Blanco,
Lumayan, Sangali, Boclan, Lumbangan,
Sta. catalina, Cabaluay, Cacao
Lunzuran, Talaboan, Mampang, Talon-
Talon, Culianan, Manicahan, Talon-
Talon Loop, Divisoria, Mariki,
Taluksangay, Guisao, Mercedes,
Tetuan, Guiwan, Pasobolon, Tugbunga,
Kasanyangan, Putik, Tumaga,
Lamisahan, Rio Hondo, Victoria,
Lampacan, Salaan, Zambowood
Lanzones
Cagayan de Oro City and Municipalities
of Jasaan, Villanueva, Tagoloan, Opol
and El Salvador
Ranges: Latitude 6059’9.3947 to
70240.3374 Long: 125012’13.3856 to -
125015’19.7223"
32

4.7 Air Quality Management Fund
The Air Quality Management Fund (AQMF) was established as a special account in the National Trea-sury to be administered by the DENR to finance containment, removal, and clean-up operations of theGovernment in air pollution cases; guarantee restoration of ecosystems and rehabilitate areas affectedby the acts of CAA violators; and support research, enforcement, monitoring activities and capabilitiesof the relevant agencies pursuant to Section 14 of the Philippine Clean Air Act of 1999. The AQMF canalso be used by the Airshed Governing Boards. The AQMF was assigned Fund Code 155 by theNational Bureau of Treasury (BTr) in April 2004.
Sources of the Fund include the following: 1) air emission charges from industrial and mobile sources;2) fines and penalties for non-compliance with environmental standards; 3) grants, donations and en-dowments from both private sector and donor organizations; 4) fees collected from the processing ofpermit; and 5) fines and penalties for violation of the other provisions of the Act and its ImplementingRules and Regulations. So far, only the Environmental Management Bureau of the Department of Envi-ronment and Natural Resources (EMB-DENR) and the Land Transportation Office of the Department ofTransportation and Communications (LTO-DOTC) have been remitting to the Fund. The latter’s collec-tion of fines largely comes from the Anti-Smoke Belching operations.
In addition to the DENR-DBM Joint Memorandum Circular (JMC) No. 2004-01 dated November 8,2004 on the operational guidelines of the AQMF, the “Criteria in the Selection and Implementation ofQualified or Eligible Project and Activities to be Supported pursuant to Rule XVI, Section 4 of DAO2000-81 or the Implementing Rules and Regulations of the CAA” was established on 15 July 2005 in theDENR Memorandum Circular No. 2005-010 dated on July 15, 2005. Likewise, a Special Review Com-mittee (SRC) composed of EMB officials was created pursuant to DENR Special Order No. 867 on 15December 2004 to review, evaluate, and recommend such eligible and qualified projects/activities us-ing the criteria set forth under MC 2005-10.
Coverage
Gen. Santos City, Koronadal City, Tupi,
Polomolok, Tampakan, Tantangan,
Banga, Surallah, Norala, Sto. Niño, T’boli,
Lake Sebu
Butuan City, Buenavista, Cabadbaran,
Carmen, Jabonga, Kitcharao, Las
Nieves, Magallanes, Nasipit, Santiago,
Tubay, and Remedios T. Romualdez
Bulacan, 16 Municipalities & 1 City:
Pampanga-one-Eco Zone, 1 city & 20
municipalities; Bataan – 10
municipalities; Cavite-21 municipalities
& 1 City; Laguna-4 municipalities & a
City; Rizal-14 municipalities and a City;
NCR- 17 cities
Name of Airshed
South Cotabato Airshed
Agusan del Norte Airshed
Metro Manila Airshed –
revising the Initial Area
Coverage of Metro Manila
Airshed
Region
12
CARAGA
NCR,
R4-A, R3
MC No. and date signed
DAO No. 2004-22 dated
August 3, 2004
DAO No. 2003-16 dated
June 6, 2003
DAO No. 07, Series of
2007
33

p Q y g
Regional
Office
L T O E M B
DEPOSITS
BTr
CERTIFIED DEPOSITS
BTr
CERTIFIED
CO
94,556,370.00
17,797,095.00
57,350.00
-
NCR
25,326,500.00
- 18,355,499.00 10,248,986.00
Region 1
37,000.00
3,000.00
5,941,662.00
5,527,387.00
Region 2
941,000.00
9,000.00
522,770.00
44,010.00
Region 3
802,680.00
9,680.00
4,495,664.50
2,953,527.50
Region 4-A
1,519,115.00
65,115.00
9,655,577.50
9,566,352.50
Region 4-B
2,000.00
-
248,232.50
-
Region 5
117,095.00
12,000.00
940,376.50
383,687.50
Region 6
-
-
602,249.53
129,864.25
Region 7
2,523,059.00
51,925.00
8,258,638.79
8,258,638.79
Region 8
1,260,935.00
10,000.00
889,898.00
626,143.50
Region 9
143,225.00
8,000.00
532,881.10
407,415.10
Region 10
115,900.00
9,900.00
169,862.50
-
Region 11
14,000.00
2,000.00
1,446,718.20
1,073,294.20
Region 12
-
-
1,095,400.00
1,095,400.00
CAR
2,402,285.50
-
926,555.00
926,555.00
CARAGA
209,281.00
-
884,338.00
884,338.00
TOTAL 129,970,445.50 17,977,715.00 55,023,673.12 42,125,599.34
Total Deposited 184,994,118.62
Total Btr
Certified 60,103,314.34
The first request for fund release was made in July 2005 but no release was effected as of December31, 2007.
Table 14 shows the total amount of Php 184,994,118.00 deposited to the BTr under the AQMF as ofDecember 2007. Of this amount, Php 60,103,314.00 has been certified by the BTr.
Table 14. LTO and EMB Deposited Collections for the Air Quality Management Fund
34

4.8 Civil Society Initiatives
Bantay Kalinisan Task Force, Inc.
The Bantay Kalinisan Task Force, Inc., an organization of concerned volunteers, was conceptualizedand initiated by the DENR EMB-Cordillera Administrative Region (CAR) during the middle part of 2005.Using the precept of volunteerism, the group conducts on-the-spot vehicle emission testing and road-side apprehensions during surprised but planned “operations” at identified major roads and entry pointsto the City of Baguio.
In its operation on August 1, 2005 until September 8, 2005, the group reported 632 apprehensions ofsmoke belching vehicles; 475 (76.37%) of which were already settled with a total fines of PhP 493,000.00collected by DOTC-Regional Traffic Adjudication Services (RTAS); fines still to be collected amountedto PhP 157,000.00. For year 2006, there were 942 vehicles flagged down and tested 709 (75.27%) ofwhich failed the standard emission level. The simultaneous roadside apprehensions conducted by fiveteams of the Task Force did not only help improve the air quality in the City but have caused warning tooto the transport group, and even owners of private motor vehicles, that indeed, violators are appre-hended and penalized.
Concerned Citizens Against Polllution (COCAP)
COCAP, a non-government organization, has initiated public awareness projects with various transportorganizations in Metro Manila. These projects include information campaigns on the shift from two-stroke to four-stroke engines, health and economic benefits of clean engines, and of using bio 2T ontwo-stroke engines.
In addition, COCAP has likewise conducted workshops on coconut methyl ester (CME) production fromused cooking oil and 2T oil production using CME. These workshops were coupled with actual monitor-ing of emissions on test vehicles to illustrate the effectiveness of using CME.
MIRIAM P.E.A.C.E. (Public Education and Awareness Campaign for Environment)
Technology Options for 2-Stroke Powered Tricycles is a quasi participatory research conducted last2006 by Miriam P.E.A.C.E. It studied the effectiveness of four current technologies namely: a) Alterna-tive fuel (Ethanol 10), b) Bio 2T oil (CME-blended), c) Air Bleed Technology (Cyclos) and d) RetrofitTechnology (Direct Injection). The project is made up of three components namely Market Scan andInformation Dissemination, Technology Verification and Social Benefit-Cost Analysis. It was sponsoredby Peace and Equity Foundation (PEF) and undertaken mainly by academic institutions, headed by theEnvironmental Studies Institute (ESI) of Miriam College in collaboration with National Center for Trans-port Studies (UP-NCTS), Technological University of the Philippines (TUP), Don Bosco Technical Col-lege (DBTC) and the SKY Group (Suzuki, Kawasaki and Yamaha). In conclusion, the study showed thatthe four technologies –Direct Injection, Air Bleed, Bio 2T and E10 - brought about improvement onspecific parameters in varying degrees, with Direct Injection technology topping positive changes in allparameters. However, it is recommended that a large scale pilot testing should be undertaken to en-sure that technical problems resulting to long-term use are addressed and costing can be refined. TheSocial Benefit-Cost Analyses also showed remarkable benefits to the general public as well as to thetricycle operators.
Another project undertaken is Air Care: A Community-Based Air Quality Management Program. It aimedto improve local ambient air by involving academe in air quality monitoring, the tricycle sector in regular
35
preventive maintenance practices and community leaders in clean air policies/projects. Severalcollaterals have been produced through the project: Manual for Schools, posters and video on Preven-tive Maintenance, etc. The project was implemented in the Katipunan, UP, Balara corridor of QuezonCity.
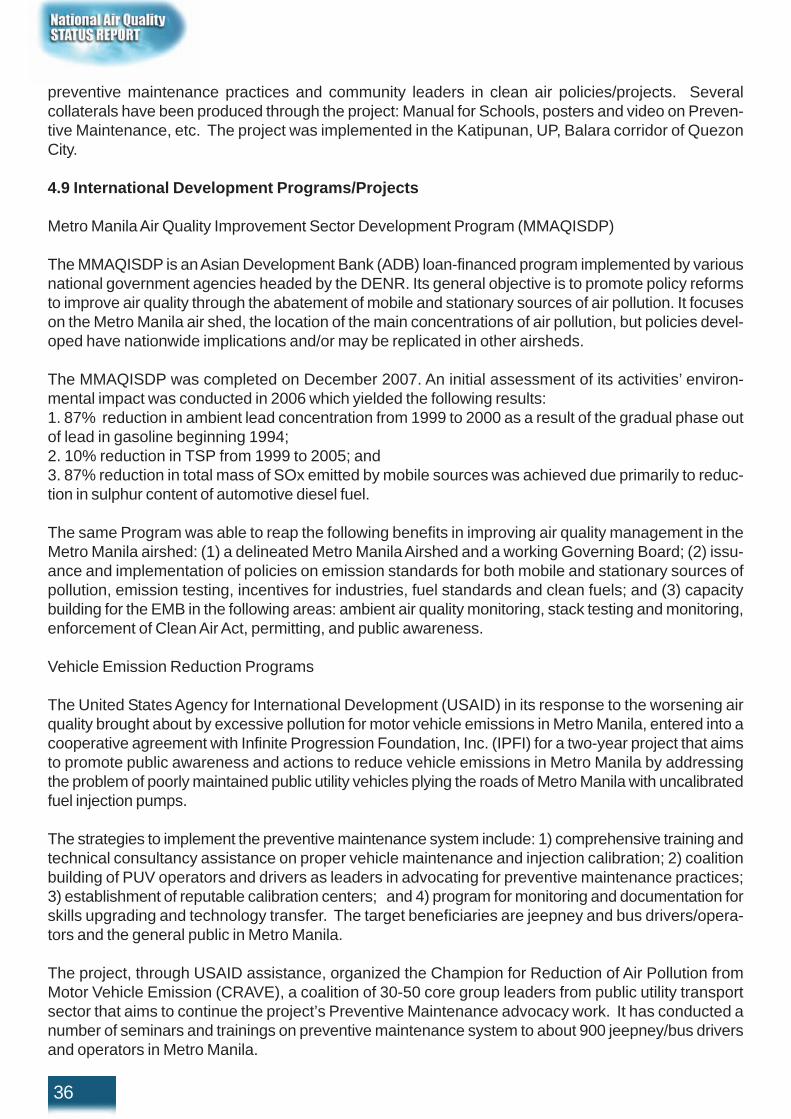
4.9 International Development Programs/Projects
Metro Manila Air Quality Improvement Sector Development Program (MMAQISDP)
The MMAQISDP is an Asian Development Bank (ADB) loan-financed program implemented by variousnational government agencies headed by the DENR. Its general objective is to promote policy reformsto improve air quality through the abatement of mobile and stationary sources of air pollution. It focuseson the Metro Manila air shed, the location of the main concentrations of air pollution, but policies devel-oped have nationwide implications and/or may be replicated in other airsheds.
The MMAQISDP was completed on December 2007. An initial assessment of its activities’ environ-mental impact was conducted in 2006 which yielded the following results:1. 87% reduction in ambient lead concentration from 1999 to 2000 as a result of the gradual phase outof lead in gasoline beginning 1994;2. 10% reduction in TSP from 1999 to 2005; and3. 87% reduction in total mass of SOx emitted by mobile sources was achieved due primarily to reduc-tion in sulphur content of automotive diesel fuel.
The same Program was able to reap the following benefits in improving air quality management in theMetro Manila airshed: (1) a delineated Metro Manila Airshed and a working Governing Board; (2) issu-ance and implementation of policies on emission standards for both mobile and stationary sources ofpollution, emission testing, incentives for industries, fuel standards and clean fuels; and (3) capacitybuilding for the EMB in the following areas: ambient air quality monitoring, stack testing and monitoring,enforcement of Clean Air Act, permitting, and public awareness.
Vehicle Emission Reduction Programs
The United States Agency for International Development (USAID) in its response to the worsening airquality brought about by excessive pollution for motor vehicle emissions in Metro Manila, entered into acooperative agreement with Infinite Progression Foundation, Inc. (IPFI) for a two-year project that aimsto promote public awareness and actions to reduce vehicle emissions in Metro Manila by addressingthe problem of poorly maintained public utility vehicles plying the roads of Metro Manila with uncalibratedfuel injection pumps.
The strategies to implement the preventive maintenance system include: 1) comprehensive training andtechnical consultancy assistance on proper vehicle maintenance and injection calibration; 2) coalitionbuilding of PUV operators and drivers as leaders in advocating for preventive maintenance practices;3) establishment of reputable calibration centers; and 4) program for monitoring and documentation forskills upgrading and technology transfer. The target beneficiaries are jeepney and bus drivers/opera-tors and the general public in Metro Manila.
The project, through USAID assistance, organized the Champion for Reduction of Air Pollution fromMotor Vehicle Emission (CRAVE), a coalition of 30-50 core group leaders from public utility transportsector that aims to continue the project’s Preventive Maintenance advocacy work. It has conducted anumber of seminars and trainings on preventive maintenance system to about 900 jeepney/bus driversand operators in Metro Manila.
36

USAID-Energy and Clean Air Project (ECAP)
The USAID-ECAP is a four-year project which started last October 2004. The project provided technicalassistance to government agencies and selected civil society partners that are working on power sectorreforms and cleaner air. ECAP operates in four project sites, namely: Metro Manila, Baguio, Cebu andDavao by partnering with key academic institutions as ECAP’s project offices. Some of its initiativesinclude strengthening local governance for clean air; strengthening motor vehicle inspection and main-tenance; enabling public utility transport sector compliance with emission standards in the Clean Air Act;and sustaining constituencies for clean air and power sector reforms.
4.10 Research and Development
Characterization and Source Identification of Ambient Air PM10 in Metro Manila by Nuclear and RelatedAnalytical Techniques
The Philippine Nuclear Research Institute (PNRI) has continued research to generate information on thesources of particulate pollution and their contribution through the use of nuclear and related analyticaltechniques. Data for PM10 and PM2.5 (Figures 4 and 5, Tables 5 and 6 shown in Section 3 on Ambient AirQuality)., black carbon and elemental concentrations such as that of Pb are also generated.
Air pollutants at receptor sites, anthropogenic and/or natural origin, may be in different mixed-up forms.With the use of nuclear and related analytical techniques such as the X-ray Fluorescence Spectrometry(XRF) to generate multi-element data for receptor modeling, the research aimed to address the follow-ing questions:
WHAT are the sources of air pollutants?HOW MUCH is the contribution of each?WHERE? From which direction/s are these coming from?
Phase-out of the use of leaded-gasoline has been very effective in reducing Pb levels in ambient air asshown in the decreasing trend of Pb levels at the ADMU sampling station (Figure 10). Continuousmonitoring is helpful in documenting the impact of government policies such as that seen in ADMUwhere the reduction of Pb levels coincided with the phase-out of leaded-gasoline.
Figure 10 shows decreasing Pb levels in the fine fraction coinciding with the introduction of unleaded-gasoline and the eventual phase-out of the use of leaded-gasoline.
Figure 10. Pb levels at the ADMU sampling station from 1998-2002
37
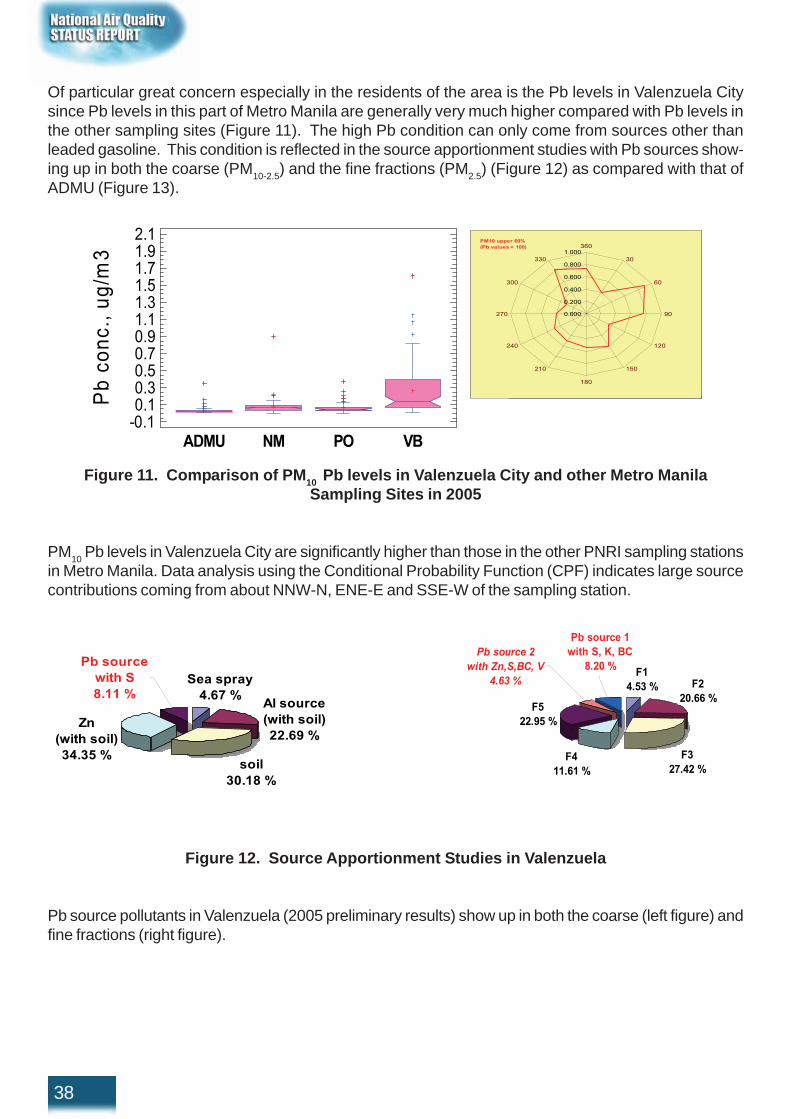
Sea spray
4.67 %
Pb source
with S
8.11 %Al source
(with soil)
22.69 %Zn
(with soil)
34.35 %soil
30.18 %
F5
22.95 %
F4
11.61 %
Pb source 2
with Zn,S,BC, V
4.63 %
Pb source 1
with S, K, BC
8.20 %F1
4.53 % F2
20.66 %
F3
27.42 %
Of particular great concern especially in the residents of the area is the Pb levels in Valenzuela Citysince Pb levels in this part of Metro Manila are generally very much higher compared with Pb levels inthe other sampling sites (Figure 11). The high Pb condition can only come from sources other thanleaded gasoline. This condition is reflected in the source apportionment studies with Pb sources show-ing up in both the coarse (PM10-2.5) and the fine fractions (PM2.5) (Figure 12) as compared with that ofADMU (Figure 13).
Figure 11. Comparison of PM10 Pb levels in Valenzuela City and other Metro ManilaSampling Sites in 2005
PM10 Pb levels in Valenzuela City are significantly higher than those in the other PNRI sampling stationsin Metro Manila. Data analysis using the Conditional Probability Function (CPF) indicates large sourcecontributions coming from about NNW-N, ENE-E and SSE-W of the sampling station.
Figure 12. Source Apportionment Studies in Valenzuela
Pb source pollutants in Valenzuela (2005 preliminary results) show up in both the coarse (left figure) andfine fractions (right figure).
38
Pb
co
nc
., u
g/m
3
ADMU NM PO VB-0.10.10.30.50.70.91.11.31.51.71.92.1
0.000
0.200
0.400
0.600
0.800
1.000360
30
60
90
120
150
180
210
240
270
300
330
PM10 upper 60%
(Pb values > 100)
Pb
co
nc
., u
g/m
3
ADMU NM PO VB-0.10.10.30.50.70.91.11.31.51.71.92.1
0.000
0.200
0.400
0.600
0.800
1.000360
30
60
90
120
150
180
210
240
270
300
330
PM10 upper 60%
(Pb values > 100)

Sea spray
13%
Soil
55%
Aged salt
13%
Vehiclar
emission
19%
Biomass
burning
41%Heavy oil
burning
34%Vehicular 1
6%
Vehicular 2
4%
Sea spray
8% Soil
7%
Figure 13. Principal sources of particulate pollution in the coarse (left figure) and the fine(right figure) fractions from ADMU, Metro Manila
Of particular great concern especially in the residents of the area is the Pb levels in Valenzuela Citysince Pb levels in this part of Metro Manila are generally very much higher compared with Pb levels in theother sampling sites (Figure 10). The high Pb condition can only come from other sources other thanleaded gasoline. This condition is reflected in the source apportionment studies with Pb sources show-ing up in both the coarse (PM10-2.5) and the fine fractions (PM2.5) (Figure 12) as compared with that ofADMU (Figure 13).
Figure 11 shows comparison of PM10 Pb levels in Valenzuela City and other Metro Manila SamplingSites in 2005.
PM10 Pb levels in Valenzuela City are significantly higher than those in the other PNRI sampling stationsin Metro Manila. Data analysis using the Conditional Probability Function (CPF) indicates large sourcecontributions coming from about NNW-N, ENE-E and SSE-W of the sampling station.
Figure 12 refers to Source Apportionment Studies in Valenzuela.
Pb source pollutants in Valenzuela (2005 preliminary results) show up in both the coarse (left figure) andfine fractions (right figure).
Figure 13 shows principal sources of particulate pollution in the coarse (left figure) and the fine (rightfigure) fractions from ADMU, Metro Manila.
The project resulted in a better understanding of the sources of particulate pollution in Metro Manila, inaddition to generating basic data for air quality management.Results show that continuous monitoring is helpful in documenting impact of government policies suchas that seen in the ADMU data showing reduction of Pb levels in the fine fraction coinciding with thephase-out of leaded-gasoline. Results in Valenzuela City indicate the need to do a more comprehen-sive evaluation of the area to determine the sources of Pb and formulate measures to bring down itsambient levels.
Dry Deposition Monitoring in Metro Manila and Los Baños, Laguna (Acid Deposition Monitoring Net-work in East Asia)
The Philippines is a participatory country to the Acid Deposition Monitoring Network in East Asia (EANET).Since 2001, the EMB being the country’s National Center for the EANET is conducting dry depositionmonitoring to study the concentration levels of SO2, HNO3, HCl, and NH3 in gases in Metro Manila andLos Baños, Laguna.
39

Dry deposition samples are collected using the filter pack method on a weekly basis. Samples areanalyzed by ion chromatography method for SO4
2-, NO3-, and Cl- while NH3 is measured using the colo-
rimetry method. HNO3, HCl, and NH4+ are calculated from their respective ion concentrations. Table 1shows the annual mean levels of the gas species in the two stations during the period 2005 – 2007.
During the 2005-2007 monitoring activities, all the measured gas species in the urban site (representedby Metro Manila) had higher concentration levels than those in the rural site (represented by Los Baños).SO2 had the highest concentration level in the urban site while NH3 had the highest concentration level inthe rural site. In both sites, HNO3 had the least concentration level followed by HCl. Comparing theoverall mean values, Metro Manila’s SO2 concentration level was almost eight times more than that theconcentration level in Los Baños. HNO3 concentration level in Metro Manila was almost four times theLos Baños level, while NH3 and HCl were twice the concentration levels in Los Baños.
Figures 14 and 15 show the time series concentration of gases in Metro Manila and Los Baños. A cleartrend is yet to be determined for the gas concentration levels in both stations.
Table 15 - Annual Mean Levels of SO2, HNO3, HCl and NH3 in Metro Manila and Los Baños forthe period 2005-2007
Source: EMB
40
Station
Year
Concentration in ug/m3
SO2 HNO3 HCl NH3
Metro Manila
2005 8.40 1.23 1.44 7.94
2006 5.77 0.710 0.808 2.74
2007 7.28 1.02 1.05 4.63
Overall Mean 7.15 0.987 1.10 5.10
Los Baños
2005 0.663 0.162 0.489 2.92
2006 0.683 0.163 0.427 1.43
2007 1.34 0.462 1.40 2.14
Overall Mean 0.895 0.262 0.772 2.16

Figure 15 - Time Series Concentration of Gases in Los Baños (2005-2007)
4.11 Public Awareness and Education on Air Quality Management
For a couple of years, the EMB-DENR has undertaken various activities focused on public awarenessand education on air quality management under the Linis Hangin program of the DENR.
Figure 14 - Time Series Concentration of Gases in Metro Manila (2005-2007)
Source: EMB
Source: EMB
NH3
HCI
SO2
HNO3
NH3
HCIHNO3
SO2
41
0
10
20
30
40
50
60
1/6
/05
3/6
/05
5/6
/05
7/6
/05
9/6
/05
11/6
/05
1/6
/06
3/6
/06
5/6
/06
7/6
/06
9/6
/06
11/6
/06
1/6
/07
3/6
/07
5/6
/07
7/6
/07
9/6
/07
11/6
/07
ug
/m3
NH3
HCl
HNO3
SO2
0
3
6
9
12
15
1/5
/05
3/5
/05
5/5
/05
7/5
/05
9/5
/05
11/5
/05
1/5
/06
3/5
/06
5/5
/06
7/5
/06
9/5
/06
11/5
/06
1/5
/07
3/5
/07
5/5
/07
7/5
/07
9/5
/07
11/5
/07
ug/m
3
SO2
HNO3
HCl
NH3

The various activities are in cooperation with different multi-stakeholder partners such as academicinstitutions, business, local government units, national government agencies, non-government organi-zations, private sector, and even individuals advocating the fight for clean air.
The campaign is done on a year-round basis but highlighted mostly every November of each year asthis is declared as the National Clean Air Month by virtue of Presidential Proclamation No. 1109 issuedin 1997. The declaration aimed at involving the public on initiatives for cleaner air.
There are several undertakings of the EMB-DENR in this direction from 2005 to 2007. Among them are:
Bantay Tambutso sa Eskwela – This program was formally launched in November 2005 under theLinis Hangin Program. The program aimed at (1) involving academic institutions in promoting clean airand (2) increasing and strengthening the advocacy for clean air, especially in the attainment of emissionstandard for vehicles within school campuses nationwide.
There had been a move also under the program to encourage schools nationwide to adopt the programyearly by writing heads of the schools nationwide through partnership with the Department of Education,Catholic Educational Association of the Philippines, Philippine Association of Tertiary Level Educa-tional Institutions in Environmental Protection, Commission on Higher Education and Technical Educa-tion and Skills Development Authority.
To date, about 100 universities and colleges nationwide vowed to support the program, and close to 50universities and colleges nationwide had already participated in the one-day nationwide banning ofentry of smoke-belching vehicles within their campus premises in a particular day in November.
Bantay Tambutso sa Malls – One of the programs under the Linis Hangin is the Bantay Tambutso saMalls. This program is geared towards intensifying the government’s anti-smoke belching campaign inorder to reduce total suspended particulate emissions and safeguard the health of the public consistentwith the mandates of the Philippine Clean Air Act of 1999.
The said program targets mall and business establishments nationwide with the aim of encouragingpublic and private sector cooperation by conducting free vehicle emission testing in malls and commer-cial establishments for FX taxi, jeepneys and other public utility vehicles
To date, there are several big business establishments that have supported the program such as the SMSupermalls and other prominent commercial establishments nationwide.
Bantay Sunog Basura – This is also under the Linis Hangin Program which aims to address the openburning of wastes nationwide.
The said program partners with local government units and encourages them to practice a more eco-logical way of dealing with solid wastes through issuance of local ordinances that ban open burning ofwastes in their localities.
Bantay Tsimneya – This is also a program under the Linis Hangin program that targets industries andencourages them to reduce emissions in their smoke stacks.
Under the program, EMB Regional Offices conduct visual monitoring and testing of smoke stack emis-sions of industries using the Opacity Testing Methodology. This program also allows the EMB to checkthe efficiency of the air pollution control installations of these industries vis-à-vis their compliance to theregulations set under the Philippine Clean Air Act.
42

The Environmental Education and Information Division (EEID) of the EMB Central Office, with its EMBRegional Environmental Education and Information Sections support the heightened information andeducation campaign for the popularization of the Clean Air Act.
Since the passage of the Act in 1999, the EMB has produced quite a number of information materials toincrease awareness on the salient features of the Act. The EMB Central and Regional Offices haveconducted several seminars, fora, and trainings for their stakeholders such as the industries, transportoperators, drivers, local government units, the academic sector, among others.
5. Best Practices and Lessons Learned
National Capital Region
Marikina City
The city government of Marikina is a strong advocate of clean air and non-motorized transport. This wasmanifested through the Marikina Bikeways Project, which aims to promote low cost and environment-friendly transport.
The bikeways program of Marikina City is a holistic social and advocacy campaign that promotes cy-cling as an alternative public transport. It is holistic in the sense that it involves not only creating thephysical requirements for the adoption of bicycling, but also providing an opportunity to own bicycles,educating the public on the social dimension and safety of riding the bike, and putting in place policiesthat make this program a sustainable one.
Marikina City has constructed 32 km of bikeways (out of the 50-km target) which connects residentialareas to major transport terminals, markets, schools, commercial and industrial establishments.
The Bikeways program is funded by the World Bank with a grant of USD 1.1 million. Aside from con-struction of bikeways, the program also offers activities focusing on safe cycling education, bicycle loanand lending program, bicycle ownership survey, Marikina cycling festival, cyclists organization, bicycleclinic, and creating ordinance mandating the use of bicycle lanes.
Makati’s Project Hangin
Healthy Air In Good Indoor Environment (HANGIN) Project was initiated by the City Government of Makatithrough the Department of Environmental Services in collaboration with Makati Health Department, Ligang mga Barangay, Department of Health (DOH), DENR-NCR and the University of the Philippines (UP)College of Public Health. The project officially started on March 12, 2007 through a Memorandum ofAgreement that was entered into by the concerned parties.
The project is an offshoot of the study conducted by the DOH in collaboration with the ADB and theWorld Health Organization Eastern Pacific Region entitled “Public Health Monitoring: a Study under theMetro Manila Ambient Air Quality Improvement Sector Development Program”, which aims at filling thegaps that limit the identification of relationship between severity of air pollution and health effects ofexposed communities in Metro Manila.
Five monitoring stations were identified/established within the locality of Makati. Sources of particulatematter monitored are from the motor vehicles and area sources as the sampling stations were situatedon the road side. However, due to limited resources, only one sampling equipment could be utilized andthis is being transferred to another station after a week of sampling in a particular site.
43
Cordillera Administrative Region
Efforts of the regions are focused more on advocacy for strengthened air quality protection. The advo-cacy is geared towards increased cooperation and willingness of the people, academe and the youthsector to participate in environmental programs.
Region 1
In 2006, the City of San Fernando enacted its Environment Code. One of its main components is theTricycle Conversion Program that targeted the conversion of the City’s three-wheeler public transport(tricycles) from two-stroke to four-stroke engine motorcycles.
Region 2
Region 2 government agencies, private sector, LGUs, civil society and communities support the mis-sion of improving air quality and protecting the environment as shown in their advocacy.
The Department of Agriculture (DA) in Quirino Province has intensified its campaign against burning ofagricultural waste/debris.
Interpretative signs were installed along the national road to strategic locations which read “Dayami ayhuwag sunugin, i-decompose para pataba pagyamanin”.
Region 3
The DOST Region 3, has, since 1999, been promoting technologies that help minimize air pollution.The program aims to assist Small and Medium-Scale Enterprises to comply with environmental qualitystandards through reduction of waste generation. The implementation of cleaner production strategiesserve as a preparatory stage for the implementation of Environmental Management System (ISO 14000standards) within the companies’ manufacturing operations.
Region 4-A
The Local Government of Cavite prepared the Cavite Environment Code under Provincial OrdinanceNo. 43-S-2008. Among the salient features of the code are articles on forest, mineral and water re-sources, waste management, marine and coastal resources, air and noise pollution management,ecotourism, environmental impact assessment and land use planning.
Region 4-B
The local government units of Region 4-B support the air quality management programs of the EMB. Aspart of their procedure in the renewal of business permits of firms and industries operating in theirrespective jurisdiction, the local government units require copies of Permit to Operate Air Pollution Sourceand Control Installation issued to them by the EMB Region 4-B to verify if the firms operating are incompliance with the provisions of the CAA. The local government units are also giving support for themaintenance of the air quality monitoring stations established by EMB Region 4-B. The establishmentof the new monitoring station in Baco, Oriental Mindoro was made possible with the signing of theMemorandum of Agreement by the Municipal Government of Baco.
Region 5
The local government of Legazpi City has passed an ordinance banning smoking in public places and
44

conveyances. Also, Naga City and Iriga City have intensified their campaign against smoke belchers bycreating Anti-Smoke Belching Units which will provide assistance to LTO and EMB Region 5 deputizedagents in the conduct of random roadside vehicle emission testing. The issuance of ordinance by otherLGUs regarding ban on open burning also helps in improving air quality in the region.
Region 6
Iloilo City has undertaken activities against open burning. The city has likewise actively participated inDENR’s Green Philippine Highways Program and continues to implement other urban greening activi-ties.
Region 7
Cebu City takes pride of its comprehensive planning for transport and land use. The city has embarkedon a variety of initiatives in traffic management. It has already installed a computerized traffic signalsystem called SCATS (Sydney Coordinated Adaptive Traffic System) in 1993, the first in the country. Inrecent years. The city government has been active in its anti-smoke belching efforts and the promotionof the Bus Rapid Transit (BRT) as a mass transit system for the city.
Region 8
EMB Region 8 tied up with industries having initiatives on environmental education and public aware-ness programs for Air Quality Management and Clear Air. An example is the creation of the LeyteGeothermal Airshed in Ormoc City and Kananga, Leyte thru the initiative of the PNOC-EDC. Since theestablishment of Geothermal Areas as Airsheds in 2002, and the organization of the Leyte GeothermalAirshed Governing Board in 2005, various programs and activities were undertaken thru the chairman-ship of EMB Region 8 and logistical support of PNOC-EDC.
Region 9
Efforts of the region were focused more on awareness campaigns and advocacy for various environ-mental programs.
Region 10
Iligan City
The city of Iligan has been a forerunner in the institution of traffic management at the local governmentlevel. Through the help of the Asian Development Bank and AusAID, the construction of the north andsouth bound terminals for buses, and jeepneys, and road widening was made possible. This greatlyenhanced the traffic condition of the city and has significantly reduced emissions from inter-city vehicles.
Cagayan de Oro City
The local government of Cagayan de Oro City has prepared a comprehensive land use plan that isintended to decongest its Central Business District (CBD) and identify growth corridors that integrateboth land use and transport development.
Region 11
The local government in Davao City has issued policies in support of the Clean Air Act. For 2007, fourcity ordinances were issued, namely, city ordinances on anti-smoke belching, anti-smoking in public
45
places, no vending of cigarettes within 100 meters from school premises and ban on aerial spraying ofpesticides.
Region 12
One of the best practices in the region is the promotion of proper maintenance of motor vehicles. It wasobserved during roadside inspection of vehicles in 2007 that majority of the vehicles inspected passedthe opacity standard. Interviews with vehicle owners revealed that they regularly undertake maintenancecheck for their vehicles, which according to them, resulted in lower emission.
CARAGA Region
The local government of CARAGA has established a strong linkage with other sectors of society toinstitutionalize the implementation of the ban on open burning as well as an intensified greening pro-gram.
6. Challenges
The contribution of the transport sector to the worsening air pollution requires immediate attentioninasmuch as mobile sources account for the bigger percentage of the pollutants present in the airparticularly in Metro Manila, not to mention its effects to the health of the city dwellers. It is also areality that there is a direct correlation between the worsening traffic situation and increasing emis-sion of pollutants. Unsustainable urbanization leads to growing traffic congestion necessitating costlytransport planning and management.
The aspect of air quality monitoring and assessment still needs improvement as most of the monitor-ing stations are traffic-exposed. The practice of computing the annual average TSP level of all moni-toring stations needs to be reassessed as it is being construed as the air quality of any given region.
7. Recommendations
The government should re-direct its effort of controlling and/or minimizing emissions coming frommobile sources. Programs and activities of DENR aimed at improving the air quality of Metro Manilashall continue to be of minimal effect unless other government agencies implement their respectivemandates vigorously as provided in the CAA.
To further improve air quality monitoring and assessment, the following are recommended:
• Strengthen industry self-regulation programs;• Fast track the nationwide implementation of the MVIS;• Strengthen monitoring of compliance on fuel specifications by oil companies;• For LGUs to strengthen their programs in prohibition of open burning of wastes;• Strengthen air-related researches;• Intensify public awareness and education on air pollution prevention among all stakeholders;• Strengthen anti-smoke belching operations by LGUs;• Results of air quality monitoring should be made known to the LGUs concerned particularly those which frequently exceed the guideline values; and• Encourage the active participation of civil society in the monitoring of the implementation of the Clean Air Act.
46

Acknowledgement
This report was prepared by the Environmental Management Bureau (EMB) of the Department ofEnvironment and Natural Resources (DENR), with technical assistance from the United NationsDevelopment Programme (UNDP)-assisted DENR ENR CORE Programme, and with support fromthe Air Quality Management Fund.
The invaluable assistance of the following institutions and individuals who provided data, photo-graphs, reviewed manuscripts, and/or extended other forms of assistance towards the completion ofthe Report, is hereby acknowledged:
Clean Air Initiative-Asia- May Ajero- Atty. Glynda Bathan- Mike Co
Concerned Citizens Against Pollution- Rene Pineda
Department of Energy- Director Zenaida Monsada- Ricardo Infante
DENR-ENR CORE Programme- Asst. Secretary Analiza Teh- Cristina Regunay- Elma Eleria- Alma Segui
Department of Interior and Local Government - BLGS- Jimmy Sevalla
EMB Central Office - DENR
* Environmental Quality Division (EQD)- Renato Cruz
* Air Quality Management Section - EQD- Jean Rosete-Teresita Peralta- Petra Aguilar- Jundy del Socorro- Edna Barlis
* Environmental Education and Information Division- Elenida Basug- Noel Castelo- Vilma Elpa- Karen Pacpaco- Velma Lim- Virgilio Santos- Iva Joy Borja
*Environmental Policy and Planning Division- Ma. Victoria Abrera- Ross Ian Avino
* Research and Development Division- Roberto Bernal- Aracely Viernes
EMB Regional Offices - DENR
- Director Roberto Sheen - NCR- Director Ramon Aguilar - former EMB-NCR Director- Diosdado Doctor - formerly with NCR- Director Paquito Moreno - CAR- Director Joel Salvador - Region 1- Atty. Gil Aromin - former EMB Region 2 Director- Director Oscar Cabanayan - former EMB Region 3 Director- Director Lormelyn Claudio - former EMB Region 3 Director- Director Allan Leuterio -Region 4A- Edwin Concepcion - formerly with Region 4-A- Director Sixto Tolentino - Region 4B- Director Reynaldo Villafuerte - former EMB Region 4B Director- Dan Goodwin Borja - Region 4B- Director Gilbert Gonzales - Region 5- Director Bienvenido Lipayon - former EMB Region 6 Director- Atty. Rolando Luego – Region 7- Director Letecia Maceda – Region 8- Director Alan de Gala – Region 9- Director Sabdullah Abubacar – Region 10- Director Metudio Turbella – Region 11- Director Datu Tungko Saikol – Region 12- Director Ester Olavides – Region 13
Metro Manila Development Authority- Ramon Santiago
Miriam P.E.A.C.E.- Teresa Oliva
Partnership for Clean Air- Victoria Segovia
Philippine Nuclear Research Institute - DOST- Flora Santos- Preciosa Corazon Pabroa
Public Affairs Office - DENR- Director Marissa Cruz
United Nations Development Programme- Amelia Supetran- Morito Francisco
United States Agency for International Development - Energy and Clean Air Project- Jose Dulce- Josephine Manguila
University of the Philippines -Diliman- Dr. Ricardo Sigua
While we hope the foregoing has completedly listed the names of persons we are indebted to for thisReport, we apologize for the rest who may have been inadvertently missed.
The Project Staff

THE PROJECT STAFF
Engr. Julian AmadorDirector, EMB
Atty. Jonas LeonesAssistant Director, EMB
Dr. Ricardo Sigua, Lead Editor-MentorDepartment of Environmental Engineering
University of the Philippines - Diliman
Air Quality Management Section - EMBEngr. Jean Rosete
Engr. Teresita PeraltaMs. Petra Aguilar
Engr. Jundy del SocorroMs. Edna Barlis
Mr. Steve Serafica
Environmental Education and Information Division - EMBMs. Elenida BasugMr. Noel CasteloMs. Vilma Elpa
Ms. Karen PacpacoMs. Velma Lim
Mr. Virgilio SantosMs. Iva Joy Borja
Ms. Bernadita BondocMs. Alona ArrezaMr. Nino Pinalva