Embed Size (px)
Citation preview
——E5
1,
1
~gE=-
Em!= -a~g=”!aEEE p=g~$ .
ENATIONAL ADVISORY COMMITTEE ‘~~ :===FOR AERONAUTICS E
TECHNICAL NOTE
No. 1295
WIND-TUNNEL INVESTIGATION OF THE AIR LOAD DISTRIBUTION
ON TWO COMBINATIONS OF LIFTING SURFACE AND FUSELAGE
By Carl A. Sandahl and Samuel D. Vollo
Langley Memorial Aeronautical LaboratoryLangley Field, Va.
..__
TECHLIBRARYKAiB,-NM – ‘&
.,.. I!llllllllllllllllllllltllllllllEOi4~”bOb ~
“NA~XOIMLAWX30RYCOMMIti F~ AERONAtlTICS
,-- .,..-.
TECRIKCCALN@l’ENO. 1293 ‘
WIND-’i’UNNELINVESTIGATION OF THE AIR LOAD MSTR313UTION
ON TWO COM6INATIONS OF LIFTING SURFACE AND FUSELAGE
By Carl A. Sardahl and Samuel D. Vollo
suMmRY
Wind-tunnel measurements have been made of the air loaddistribution on a canard-type model. Two combinations oflifting surface and fuselage, representing appreciable variationof lifting-surface span relative to fuselage diameter, wereobtained by removing separately the wing &nd stabilizer of themodel. The tests also included measurements of lift, drag, “
-—
and pitching moment for several configurations. The results :;:shw that, for the confi~rations tested, the spanwise loadings -‘“on the combinations agreed fairly well with the londings calcu-lated by Lennertz’s method.
IN’IROIXJCTION
A theoretical approach to the problem of lifting-sutiace-fuselage Interference is given in reference 1 in which the span-wise loading is obtained for a lifting line intersecting thecenter line of an infinitely long circular cylinder. misanalysis predicts a decrease in the span~~se loading over thefuselage aid a reduction in total lift as compared wi~h ‘tli6”spanwi.seloading and lift of the wing alone at the same angIeattack. Measurements of the lift of a large number of @Ang-fuselage combinations (reference 2) indicate, however, that
of
the lift of the wing-fuselage conibin,ationis-more nearly equalto the lift of the wing alone, Over-all lift.measurements orwings szldwing-fuselage combinations, however,,do not defiii~”*hq 8y3nwise load curve. The purpose of the present investigationia to-present data relating b the measured erdqalculated span-wise loadings on two co@inations of lifting surface qnd fuselage
.
havingappreciable variation of spsn relative to fu@age diameter.—— —. _.
The tests included measurements of’pressure disttiibtit~on,lift,dxagj &nd pitchin@ mcyaetitfa several model configuwtions overa rangeof angles of attack at s~veral yaw emgles.
.—

NACA TN No. 1295
P (“)P “ Pqpressure cwfficient
~
d(lV/qO).—.
Qeection load derivative for horizontal surfaces ‘
no-l-force coefficient (N/9.0S)
lift coefficient (L/qoS)
total drag coefficient (D/qoS)
proffle-drag coefficient (Do/~S)
dxag coefficient based on st+bi.l~zerarea (D/qoSS)
lift coefficient based onBtabil.izez*area (L/c@s}
pitching-mcmeri~coefficient (M/qoS;) ‘
local static premure ‘
free-stream static yreeaure
free-stream dynamic pressure “--
normal force
llfb
..total bag .;1,”
., TrofiLe &zag
wing.area (19.86 Sq ft) L -
sta.b~lizerarea (4.o6 ~q ft)
.win~ mean aerodynamic chord (1.87 ft)
local wtng chord
wing Spm (11.00 ft) . ‘“
~tabilizer span (4.62 ft).
—
—
—==. ., .,
.-..
. ....
?_
.,

. NACA TN No, 1297 3
. A aspect ratio
7. ~ fusekge length (15.98 ft}
a angle of attack, degrees
?f engle of yaw, positive when nose isdisplaced tcright, degrees
$ aqgulat positim ,ofgeneratrix of fuse~43e bodY ofrevolution, measured from the vertical plane ofsymmetry, “degree~ ,, ..
.,
d- fusela&e diameter at quarter chord,of wing
d~ fuselage diameter a? quarter @oral of stabilizer
x longitadimal coordinate parallel to fuselage centerline ., ,..,
.,
Y lateral coordinate perpendicular to plane of sjmm~try
z vertical coordinate perpendicular t-ox,y plane
The testfinished to a
APPARATUS AND TESTS
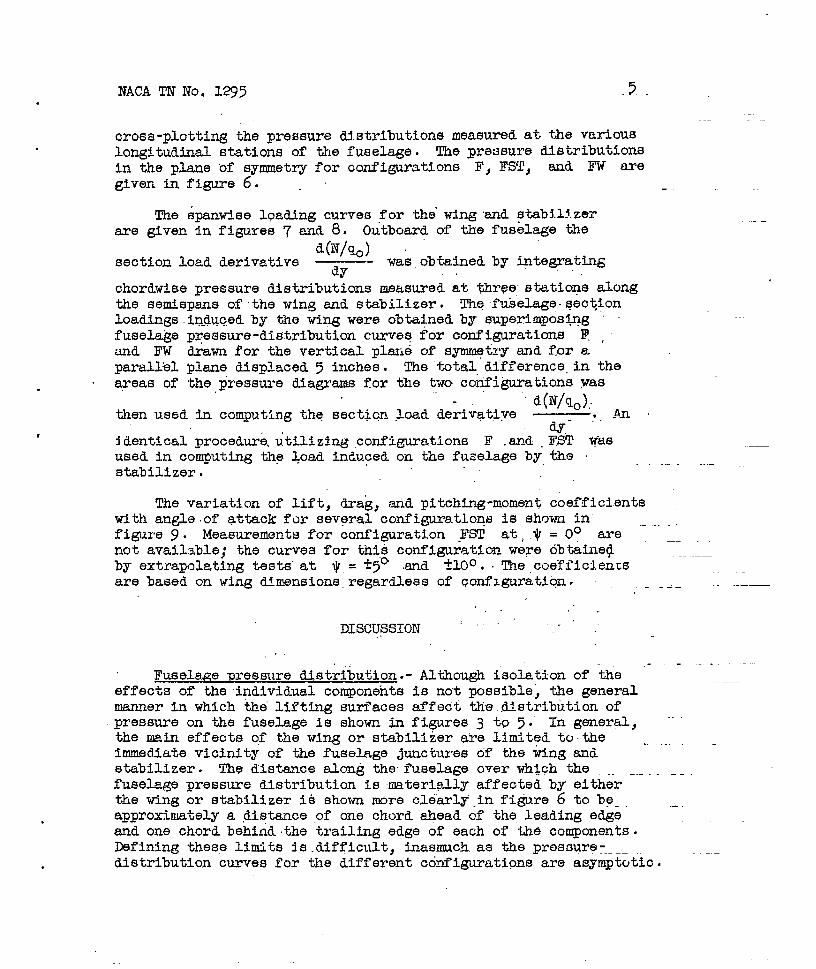
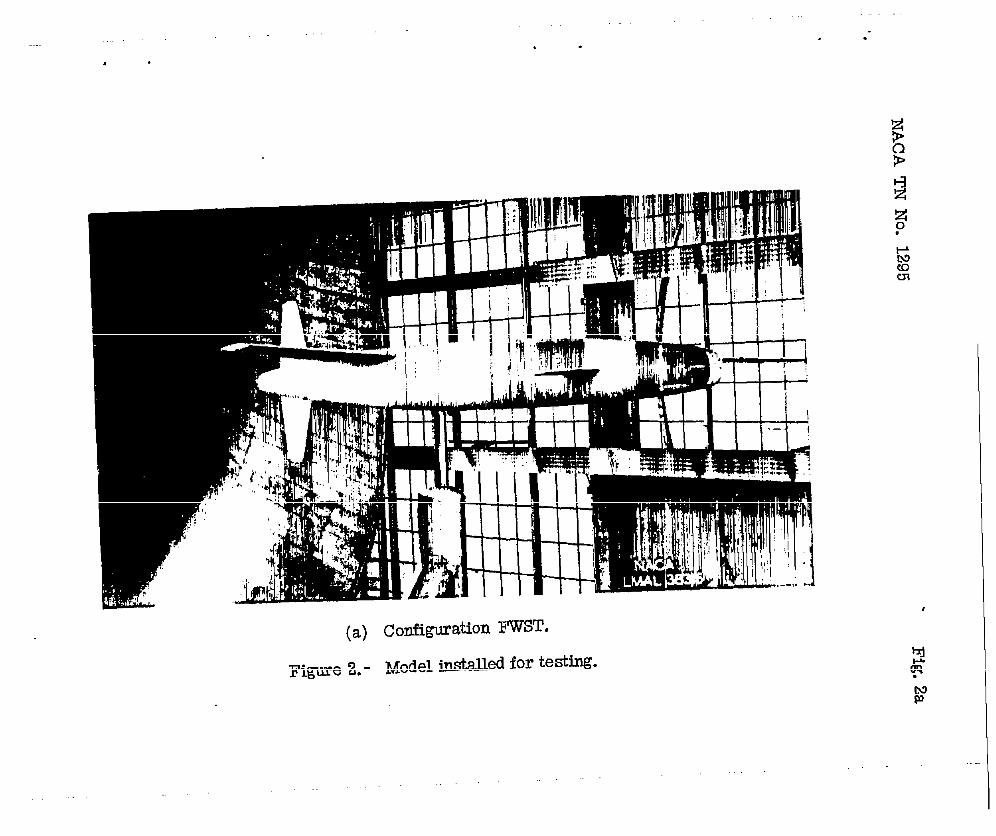
model used was constructed of plwood end wasfair aercd.ynaml.csurface. The general arrange-
ment of the model is sho~ in figure 1, The ;ing, “stabilizer,and vertical tail were removable from the fuselage, which wasa body of revolution. AX. control surfaces were set at neutralend the gaps were sealed for this investigation.
The model wes mounted in the Zsngley propeller-researchtunnel on the six-ccmponent-lkd..ancesystem’as shown in figure 2.The model was attached at the center of gravity to a singlesupport strut by means of a.universal flttlng which.permtttedthe setting of pitch and yaw angles. Motion in pitch wasrestrained by a “nose” wire, the lower end of which was attachedto a balance to allow the measurement of pitching nmmnts. Thetunnel ?xalsncesystemwas used to”measure lift and drag,
,,
The pressure distribution onthe fuselage waso%tained byorifices flush with the surf&ce and arranged as shcwn in figure 1.Chordwise prassur~ distributions on the right wing.’paneland the
-.
. ..
. .
.$ mm m NO, M95
left stabilizer panel were measured hy means of pressure %elts.On the basis of the results reported In references 3 andk, thebelt method of pressure-distributionmeasurement is consideredto be of sufficient accuracy for the present investigation.
The investigation consisted of measurements of lift, drag,pitching moment, and pressure distributions over a range ofangles of attack from -2° to 16° and at angles of yaw of ~10°,t~”, and OO. The unsymmetric distribution of fuselage orificesnecessitated tests at equal positive and negative angles of yawin order to obtain complete fuselage .presauredistributions.At zero yaw, the pressures at points at equal angular .displace-ment from the vertical plane of symmet~ are considered to beequal. The following configurationswere tested and tiredeflig-nated herein as follows: —
Configuration Designation
Fuselage with wing, stabilizer, and vertical tail FWST
Fuselage with wing and vertical tail FWT
Fuselage with wing F’w
Fuselage with stabilizer end vertical tall FST
Fuselage alone F
.
,
,
The test velocity was varied from 80 to 100 miles per ho r8corresponding to a Reynolds number range from 1.4 to 1.7 X 10
baaed on the wing mean aerodynamic chord of 1.8’j’feet.
RESULTS
The results are presented in figures 3 to 10. Ccmrectioneforand
Jet-boundary effe~ts have been applied-to the angle of attackthe drag coefficient. The tare drag wae estimated and has
been applied to the measured drag.
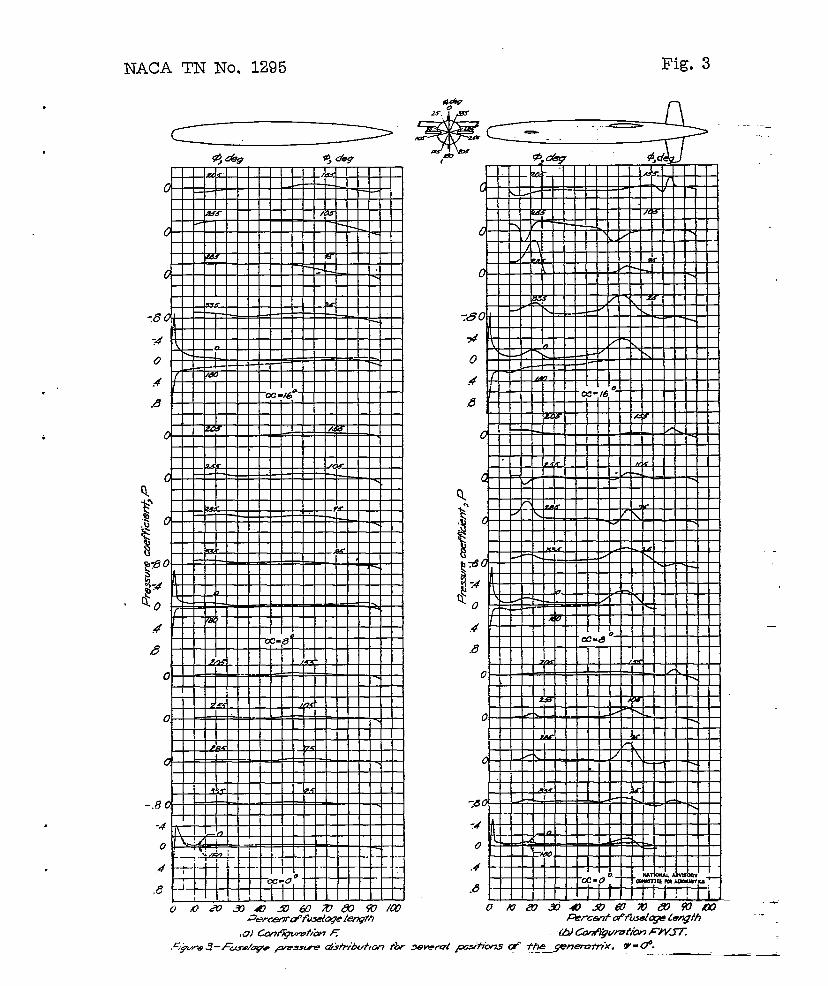
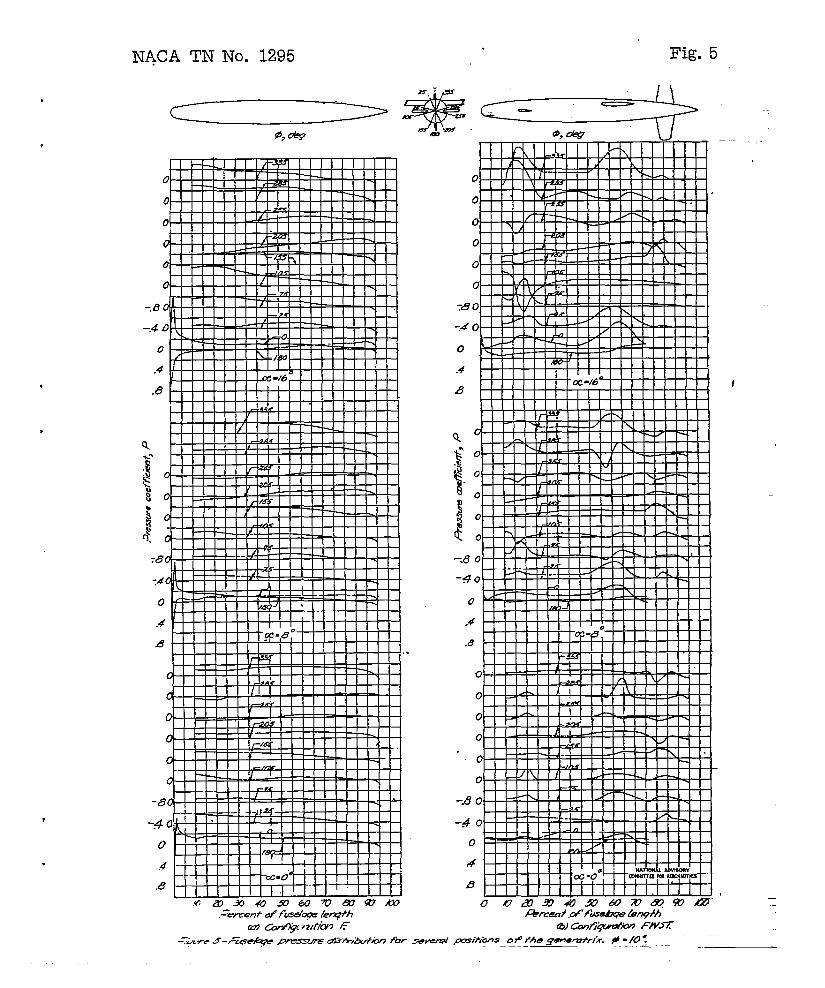
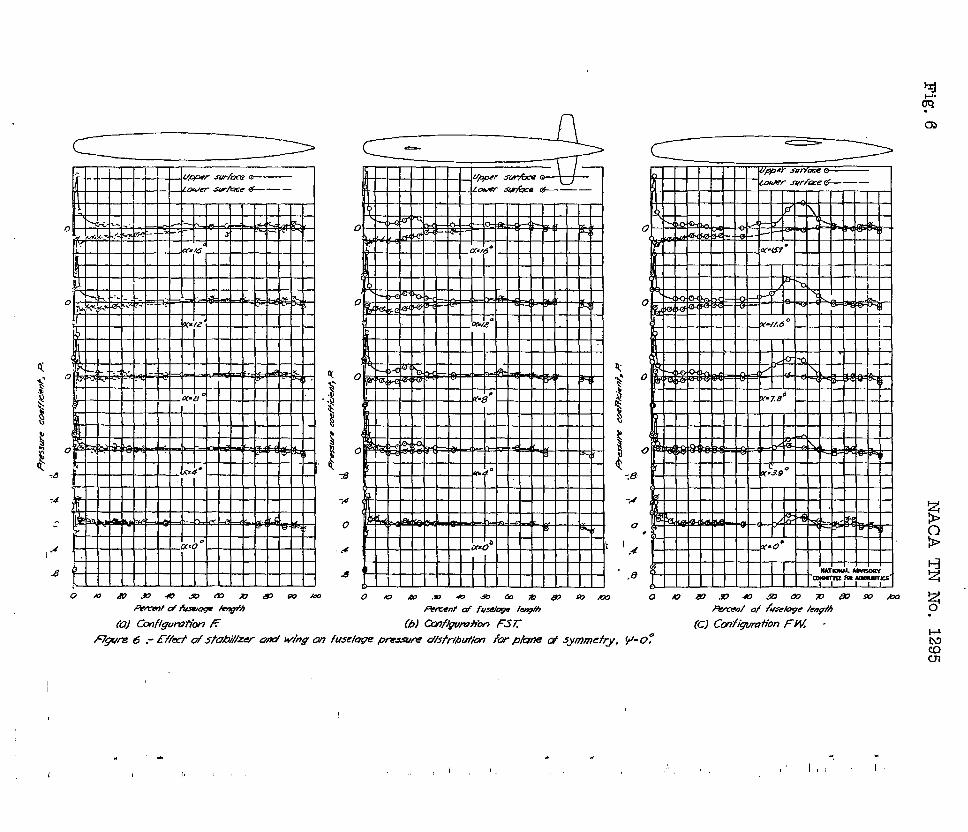
The fuselage pressure distribution for different angles ofattack and yaw for configurations F and FWST are shown Infigures 3 to ~. The pressure distributions for the variousyositions of the generatrix of the fuselage were obtainedby
NACA TN No, 1295 .5.
.-
cross-plotting the pressure distributions measured at the variouslongitudinal stations of the fuselage. The yressure distributionsin the plane of symmetry for configurations F, FSY’, and FW aregiven in figure 6. -
The @nwise loading curves for the”wing ‘zmdstab3.lfl.zerare given in figures 7 and 8. O~tbctardof the f%s&.ge the
—
d(N/~)section load derivative —-
mwas,obtained by integrating
,.chordwiae pressure distributions measured at three stations alongthe semispsns of the wing aud stabilizers T@ fuSelage.8ec?~onloadings.induc.edby the wing were obt+ed by superiorpos~gfuselage pressure-distribution curveq for configurations l?.,and FW drawn for the vertical plan6 of symmqtry and for aparallel plane displaced ~ inches. me ~-tal difference-in theareas of the premmre diagrams for the txo cotii&.u?ationaWas
.,“@’f/!lo).’ An
then used in computing the sectiw load derivative ‘*Q- ““
~dentical procedure,utilizing,configurations E’ and .F5”T wasused in computing thp >oad induced on the fuselage by tiestabilizer.
The variation of lift, drag, szidpitching-moment coefficientswith angle.of attack for several configurations is shown infigure 9. Measurements for configuration .FST at,.v = 0° are “-not available; the curves for this conflg.zrationwere o%taineqby extrapolating testi”at ~= t~” and ~loo. me coefficlencsare based on wing dimension. regardl.essof ~onflgur&tlgn.
.—
..— —-
--
,.
DISCUSSION.“
Fuselage pressure distribution.- Although isolation of ‘tie.-. .
effects of the individual components is not possiblej the generalmsm.nerin which the lifting surfaces affect the..distrtbutionofpressure on the fuselage is showm j.nfigures 3 to 7. In general,the main effects of the wing or stabilizer are limited tothe - ..immediate vicinity of the fuselage junctures of’the wing andstabilizer. The distance along the fuselage over which thefuselage pressure distribution is materi~ly affected by eith~r “-the wing or stabilizer ie shown more cbhrl~,in fi@re 6 to be_ ..approximately a ,distance.ofone chord aQead cf the leading edge.and one chord behind the trailing edge of each of Ll@ components.Defining these limits is.dif$icult, inasmzch as the presDUr9_____
● distribution curves for the differ&t configurations are asymptotic.
6
loadload
NACA ~ No,
Spanwise loadlngf.- The measured and calculated spanwisedistributions are shown in figures 7 and.8. The spanwisedistributions predicted by the theory (reference1) are In
agreement with the measured spanwise load distributions. Theagreement was particularly good for”the configuration FST,for which the conditions assumed in deriving the theory weremore nearly fulfi.lled. In deriving the theory, the fuselageis assumed-to be infinite in lengt~ and at ze~~ angle of a%mk, .the wing axis and fuselage axis are assumed to intersect, andthe loading is considered to be such that the induced drag isa minimum. In addition, the wing chord should be comparativelysmall wfth respect to the span and the fuselage diameter shouldnot be small in comparison with the wiingchord. It has beensuggested from theoretical considerations that the loss in loadover the llftlng-surface in the vicinity of the fuselage wouldbe regained on the fueehge, where it is tapered to f~n~te length;however, no suah increase in load over the rear of’the fuselagewas measured i.nthese tests, probably because of fuselage bmuxiary-layer effects. Evidence of appreciable fuselage bouudary layeris indlcatedby the pressure-distribution curves of conf’igumti.onF(fig. 6(a)), which show that almost nonegattve lift Is developedover the ~’earof the fuselage. This lack of negative lift overthe rear of the fuselage probably accounts, in part, for the lackof agreement between the calculated and measured pitching-momentcoefficients of figure 9. The calculatedpitchhg-mome~~t coef-ficients in this figure for configuration F were made by themethod of reference 5.
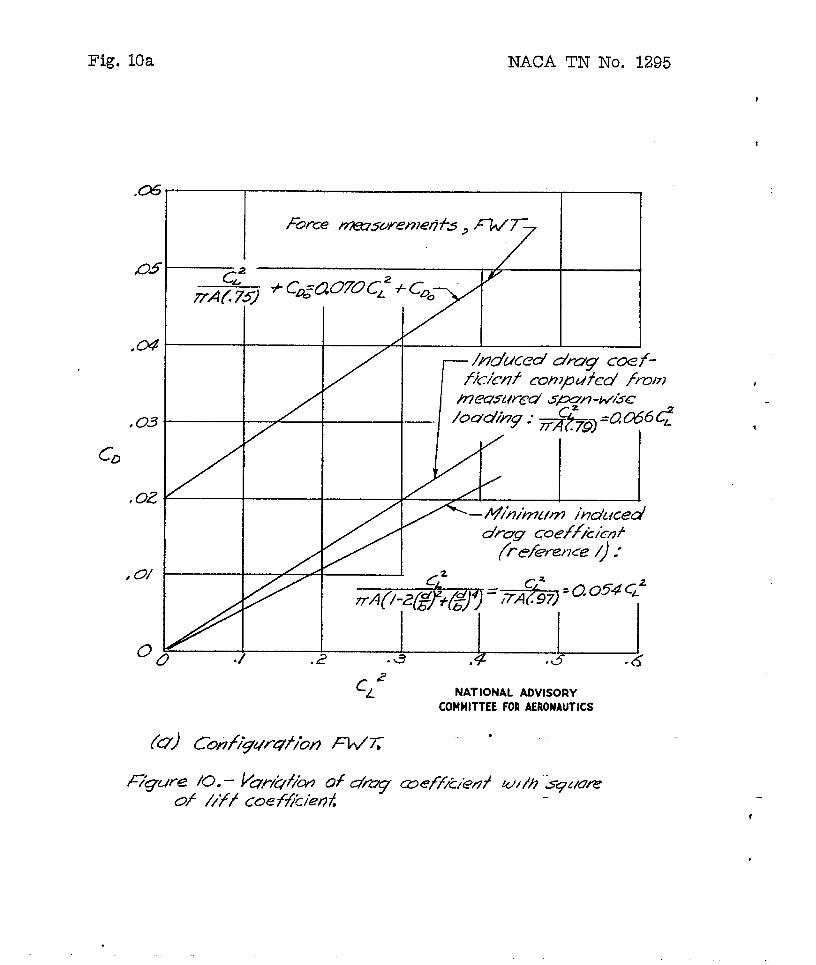
~nduced draq.- The Induced-drag coefficients associated withthe measured spanwise loadings on the wing and stabilizer werecoqputed by the method of reference 6 and are shown in figure’10.Substantially the same induced-drag coefficients were obtained .from a 6-point and a lo-point Fourier series determination; thus,a sufficient number of points were indicated to have been utilized.in the analysis.
A comparison (fig. 10(a)) of the induced-drag coefficientcomputed from the measured spanwise loadings on the wing-fuselagecombination and the minimum induced-drag coefficient for thecombination oomputed from the method of reference 1 indicatesa reduction in effective aspect ratio of 19 percent as a resultof distortion of the measured spszmise load distribution fromthe idea~ load distribution for the combination. Good agreementexists betwem the induced-drag coefficient obtained from theforce tests and from the measured spanwlse loadlngs.
A similar comparison (fig. 10(b)) for the stabiMzer-fuselage combination indicates exact agreement between the ‘
.
,

NAG(ITN No. 1295. 7
. induced-drag coefficient computed from the measured spanwiseloadin~s md. computed from reference 1. The exact a@eementfor this configuration results from the good agreement betweenthe measurea and cslculatea spanwise loaa distributicms.,,
CONCLUSIONS.
Results of an experimental investigation to aetermine thespanwise loatins for several [email protected] fuselage”end “lifting surface showetireasonable agreement between the measurealoadings ana the calculated loadings obtained by Lennertzts method.
. . .-
Langley Memorial AeronauticeJ ktoratoryNational Advisory Committee for Aeronautics
Lemgl.eyField, Vs., February 19, 1947 ‘
-—.——
8
REFERENCES,, ’...--
..-
1. Lenne>tz, J.: Influence of the Airplane Body on the W&a.Vol. IV of Aerodynamic Theory, div. K, ohs 111, sec. Lt
W. F. Lwand, cd., Julius Springer (Berlin}, 1935, w. 152-157 ●
2. Jacobs, Eastman N. ‘, and Ward, Kenneth E.: Intetierence ofWing and Fuselage from Tests of X)9 Combinations in the
., I?.A.C.A.Variable-Density Tunnel. NACA Rep. No, 540, 2935.;.
3 ● ,COrQO~,Blake W., ‘Jr,.:The Belt Method.for Measuring PressureDistribution.., NACARB, Feb. 1943. . . ~ ..,
4 i Zalovcik, John A ., and Daum, Fred L.: Flight Investigation atHigh Mach Ihuibersof Several Methods of Measnr5ng Static .,Pressure on an Airplane Wing. NACA @ UO . Lbaoa, 1944.
5. Munk,Max M.: The Aerodynamic Forces “onAirship Hulls, ‘NACA Rep. No. 184, 1924.
6. Glaert, H.: The Elements of Aerofoil and AirScrew Theory.Cambridge Univ. Press, 1926, pp. 139-140.
.
,
@
529%-U- P#J7-
,
S2#m //ho
5t7f/Ons # no
&.r&e
1’
Lmqmxdctq) l_!d-.1
c/zd rertkd hzv
NK4 66, 2-0/2
/&%
:27-g T
m,pc
,’
i“”II
,,’
1
“w’’&?%%rsJ(A%x-ws%%ciiw L?m nI I
.
..
(a) CofiWation FWST.
Figure 2.- Model installedfor testing.

, ..
(b) Cotiiffuration I?’W.
Figure 2.- C~~cl~e&
NACA TN ~0* 1295 Fig. 3
%...2 Slaf n
.
‘=%$= “- “—> --.——
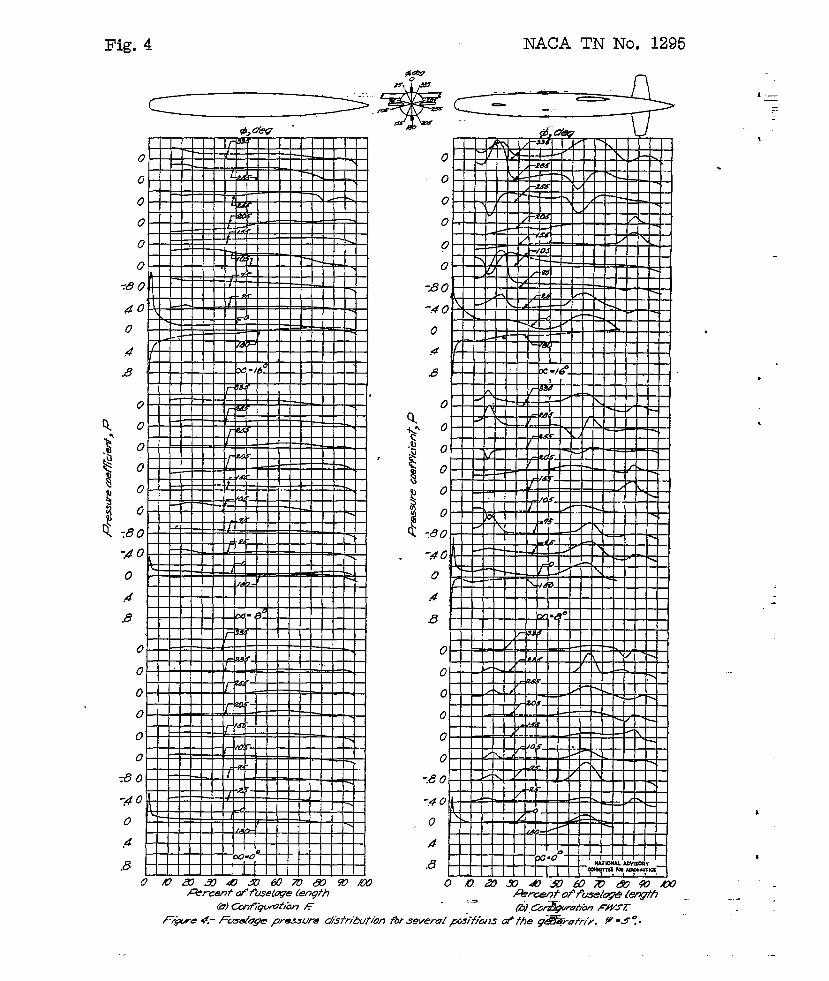
Fig. 4 NACA TN No. 1295
.
-B
-.4
0.4
.8
:8
-4
0
.4
&
:8
-,4
0
.4
.8
o.0a9m4-lz @mm $VmA1-E@ OffmlC@ f%?m .h &?wfkw /=x0-Z-
1.—
—-.
,
.
,
,
..-
F{@e +?-fidu~ ,.uressunsdWritit/onfbrseveralp&f/=aISc/fheqwafrl>. Y-5:.
NACA TN No. 1295 Fig. 5
6-*
.>*,.y+
.
--
. ,--=
lr-T I I ( I 1
..
r, t I 1 1[ I LI I I I I1 I [.,-
1 I I I I I Ii 1 ! t t I I I
0 I I I I I
I!I I III I.4
k-i
(0) Cmflgun?htiF (b)-f@mhh FS77 (c) Cb@wution FM .
I
. .1,’,,: ,. t
.1’ 1,:-’ I

NACA TN
[6’
/2
.8
.4
NO. 1295 Fig. 7-.
/.6
.
t
.5-b i?J-?
.4
0B c =3.t9’~.–. ._= ~..
/ 1 c~=oz$.4 (%-
-...
0.4
II -.~Z~i “- GI
(‘T’
.-=o
.-0 ./ .2 .3 .4 .5 .6 .7 .8 J? M ._” -
, & NATIONAL ADVISORY.- -—
0 COMMITTEE ~ AfROHAU7KS .>
Figure 7. – Comporimn of +heoniiwl ond experimental wing span
loading. +=0”; configwafion FWT. —.—

Fig. 8 NACA TN No. 1295
a= A?O”
c~=am--—----—
----___
==8.0”
C@oo$
(z=4.0°.4
0
n
G7=o” .Emnmmfd
.—————.C/v@o/
-/0 7$ +3 77 76 75
Y NATIONAL ADVISORY. ..-—
b\2COMMITTEE FOR AERONAUTS
—
F@re 8. – Compwkon of +heodicd ad mperimdol skbilker spun
Iouding. #= 00, configurdion FST.
,
8
.c–
r

NACA TN No. 1295 Fig. 9
.
.6
.5
.4
o-4 (1 4 8 /2 /6
Angle ofultuck,R, iieg NATIONAL ADVISORYCONNITTEE Fa AEROHUJTKS
F@re 9’. - VariOkWOf/..fLdiwj’,cwd ~kt}i -LWZW77~.mfjlcitints with m@e ofdluckfcr.%wai em q~kfl%tbm.#.+.&.
-.
.-— ——.
.-
NACA TN No. 1295
I
t
as
/55
#c@
#03
, (2Z
,0/
0(
G’/
+ C&=amuCL=vA6 75)
+
.) .,
7
/
/
r /2z7ffced G’!/g coef-f}ck..fcon~pw%d fmm
CL2
(0) Coi’f;gwa..;oti AA/K
FZgure /0. – k&-xiv%v9of u.$wg0/ //F/ Coefficka?i
NATIONAL ADVISORYCOMMITTEE FOR AERONAUTICS
w effk/”@r7+
4
-.
f

NACA TN No. 1295 Fig. 10b
,a%
●OZ
./ .2NATIONAL ADVISORY
CL 2 COMMITTEE FOR AERONAUTICSs
F5Z
X&w-e /0.- Concluded,