Embed Size (px)
Citation preview

GR
AD
UA
TE
S
NATIONAL EMPLOYABILITY REPORTGRADUATES
Annual Report 2013
spiring Minds is India’s leading employability solutions company, headquartered in Gurgaon.
Aspiring Minds offers scientific assessments with an innovative large-scale sourcing model Aanalogous to a GRE-for-job concept. The state-of-the-art assessment tools developed by
Aspiring Minds have been used across industry verticals to help recruit the right people, develop profile-
wise employability benchmarks and assess workforce health.
Aspiring Minds’ intelligent adaptive assessments span across Language, Cognitive skills, Domain
knowledge and Personality. A strong in-house research and development team with alumni from IITs and
MIT form the development backbone of the patent pending assessment tools.
AMCAT® - the flagship product is India’s Largest Employability Test. Conducted across the country
throughout the year, AMCAT has been taken by over 1,000,000 candidates in 1700+ campuses, spread
across 23 states. Tens of thousands of candidates secure their dream jobs every year through AMCAT.
Powered by a highly dedicated management team of over 220 full-time employees, drawn from the IITs
and IIMs and a pan-India operational presence, Aspiring Minds has helped leading brands across
verticals to improve their recruitment process efficiency and the quality of talent they hire. Aspiring
Minds’ products and solutions have been adopted by more than 300 clients in sectors as diverse as BFSI,
IT, ITeS, Hospitality, Retail, etc.
The client list comprises Daimler, Tally, Axis Bank, L&T Finance, SBI Life, Genpact, Stock Holding
Corporation of India, Future Generali, HDFC Asset Management, Citibank, Bharti AXA Life,
Ixigo - Gurgaon, Investors Clinic - Noida, Exciting Holidays - Surat, Housing Co In - Mumbai, HCL,
Microsoft, Tata Motors, MphasiS, ZS Associates and more.
www.aspiringminds.in
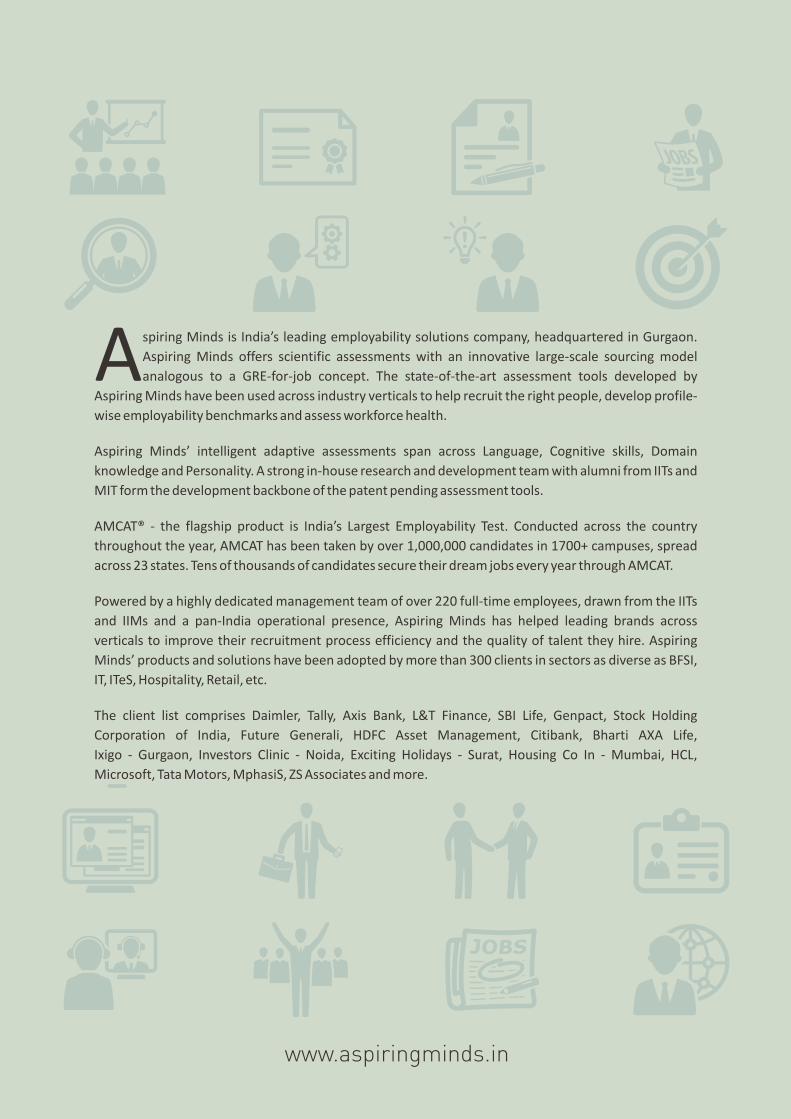
TABLE OF CONTENTS
INTRODUCTION 5
EXECUTIVE SUMMARY 7
METHODOLOGY 9
1. EMPLOYABILITY BY SECTORS 11
a. Business Functions 12
b. Analytics and Communication 13
c. IT and ITeS Industry 13
d. Accounting Roles 14
e. Teaching 14
2. EMPLOYABILITY BY GENDER 16
a. Gender Ratio across Graduation Colleges in India 16
b. Gender Distribution across Graduation Streams 16
c. Employability by Gender 17
3. EMPLOYABILITY BY CAMPUS LOCATION 19
a. Employability by Tier of Cities 19
b. Employability in Metros vs. Non-Metros 22
4. EMPLOYABILITY BY SPECIALIZATION 25
5. EMPLOYABILITY BY CAMPUS QUALITY 28
a. Accounting 28
b. Analyst 29
c. Sales and Business Development 29
d. IT Services 30
e. Teaching 31
6. LEARNING LEVELS OF GRADUATES 33
a. Computer Fundamental: Learning Levels 33
b. Finance and Accounts: Learning Levels 36
APPENDIX 39
a. States Included in Each Region 39
b. Employability by Campus Quality 39
c. Aspiring Minds’ Personality Inventory 42
d. English, Quantitative Aptitude (Non-Technical) & Logical Ability Syllabi 44

NATIONALEMPLOYABILITY
REPORT
INTRODUCTION
INTRODUCTION
India graduates more than five million graduates every year. Engineers comprise a small (but significant)
part of it at around six hundred thousand, whereas the rest take up a variety of three or four year bachelor
degree programs. Whereas, these were conventionally limited to Arts, Commerce and Science, a number of
new programs have come up in areas of business management, hospitality, fine arts and biotechnology.
Conventionally and currently, higher studies have been considered a path to a respectful and meaningful
employment. As we continue to expand capacity and diversity of courses, it is important to understand what
proportion of graduates graduating every year are actually employable in India’s knowledge economy.
Aspiring Minds is in its third year of assessing non-professional graduates across the nation on standardized
multi-dimensional assessments and matching them to an array of
different industrial sectors and profiles. We, today, have amassed
substantial learning – both conceptual and empirical – with regard to
what makes someone employable in a certain sector in a particular
profile. With these learning gathered from a large set of students and
corporations, we embark upon doing a national audit of employability
of 3-year bachelor’s degree graduates. This is in line with our 1 commitment of reviewing higher education, similar to what we did for engineering and management
sectors. We attempt to gain a clear understanding of exactly what percentages of graduates are employable
for different job profiles available for the fresh non-professional graduates. If the employability is low for
certain profile, which skill gaps render them inefficient? Are the students studying in Tier-2 and Tier-3 cities
disadvantaged? What are the learning levels of these graduates in their domain-specific subjects? How do
they perform in the English and Computer Knowledge sections, which find minimum space in the general
graduate curriculum?
Defining employability of simple graduates for different roles has been a tedious task, considering the fact
that these are non-professional graduates and have not been trained specifically on industry skills, and
hence the industry expectations from them are quite different than those from professional engineers and
management graduates. The ‘National Employability Report:
Graduates, Annual Report 2013’ quantifies their employability and
answers the above questions along with many others.
We sincerely believe this report will be a useful tool in the hands of
educationists, policy makers and corporations and make them reflect
upon and implement the right interventions to bridge the gaps. We, at
our end, will continuously strive towards providing a yearly report card
on non-professional graduate education in India, and help students
across the nation by providing feedback on their skill gaps and
connecting them to matching jobs.
With commitment to fostering a healthy education-employment eco-system in India...
Varun Aggarwal
Co-founder and CTO, Aspiring Minds
2
India graduates more
than five million graduates
every year.
We, today, have amassed
substantial learning – both
conceptual and empirical –
with regard to what makes
someone employable in
a certain sector in a
particular profile.
1. National Employability Report- Engineering graduates 2011
2. National Employability Report- MBA graduates 2012
Aspiring Minds’ National Employability Report-Graduates 2013 5
47% graduates not employable in any sector of the knowledge economy
The employability of graduates varies from 2.59% in functional roles such as accounting, to 15.88% in sales
related roles and 21.37% for roles in the business process outsourcing (BPO/ITeS) sector. A significant
proportion of graduates, nearly 47%, were found not employable in any sector, given their English language
and cognitive skills. Since a graduation degree is considered a pathway to a job in the knowledge economy,
substantive intervention at school and college level is needed to improve basic skills of students. Next, a
renewed focus on vocational training is timely now and should be re-emphasized.
Less females are pursuing three-year graduate degrees and show similar or higher employability
to males
There are 109 males to every 100 females in three-year degree programs. This is in contrast to the male-
female ratio of 1.96 for engineering graduates. Among the streams, arts stream has the highest proportion
of females followed by commerce, while science accounts for the lowest proportion. Females are found to
be equally or more employable in all sectors, however they lag in basic computer skills. There is a
requirement of intervention to improve computer programming skills among female students from early
formative years.
English and Computer Skills dampening smaller town employability prospects significantly
For students residing or studying in smaller towns and cities (tier 2/tier 3), the maximum gap is observed in
English and Computer skills. Since both these skills are rated as enablers and useful skills in knowledge
sector jobs, they demand early intervention. It was observed that even after moving to metros for
education, graduates are not able to bridge the gap in their computer skills. This is despite the fact that they
are equivalent, with respect to all other skills, to candidates permanently residing in metros. Despite the
positive sentiment of the IT revolution, it is found that more than 50% graduates do not know how to
perform simple functions like copy-pasting text nor are they able to differentiate between hardware and
software. This calls for greater as well as targeted intervention in areas of Computer and English skills.
Education system promoting rote learning in place of actual application of concepts
Not more than 25% of the graduating students could apply concepts to solve a real-world problem in
the domain of Finance and Accounting. On the other hand, on average, 50% graduates are able to answer
definition-based/theoretical questions based on the same concept. This shows that even though students
have got exposure to the concepts, they really do not understand them or know how to apply them.
Thus, our higher education system needs to lay greater stress on application of concepts and discourage
rote learning.
Over 40% employable graduates beyond the top 30% colleges have no way to signal their employability to
potential recruiters
41% of graduates employable in accounting roles hail from colleges beyond the top 30% colleges, whereas
for the IT services sector this percentage is 36%. Despite being employable, these students have no way to
signal their employability to recruiters who end up recruiting only from reputed colleges and universities.
Not only does this beget economic inefficiency, but brings in unfairness for the student. The need of the
hour is to develop effective means to 'discover' employable students easily across the nation. Employability
Certification such as AMCAT is one such proven scalable mechanism.
EXECUTIVE SUMMARY
Aspiring Minds’ National Employability Report-Graduates 2013 7
METHODOLOGY
METHODOLOGY
This report is based on AMCAT (Aspiring Minds Computer Adaptive Test) tests conducted on a sample of
more than 60,000 graduation students from numerous colleges across multiple states in India. All these 3
graduates shall graduate in 2013 . The analysis and findings of this report are based on the performance
of these students in different modules of AMCAT, India’s largest and only standardized employability test.
The syllabus for the modules is attached in the appendix. The modules are adaptive and their scoring is
based on Item Response Theory, a globally recognized statistical technique for assessing high stake exams.
The test was conducted under a proctored and credible environment ensured by Aspiring Minds.
While designing the AMCAT module for these graduates, our instrument design team developed a
competency framework to incorporate majority of the crucial domain and non-specialized skills required
from graduates for entry-level jobs. Based on this competency framework, items (questions) for the test 4were designed. Special care was taken to ensure that items had good psychometric properties . The
competency allocation for each item was verified through a consensus by experts. After expert review on
various parameters, the items were sampled on actual graduate test-takers. Items with irrelevant statistical
properties were weeded out and item response models for the test were developed. These were then
delivered adaptively using Aspiring Minds’ proprietary item selection and delivery algorithm. The final
assessment test showed reliability comparable to global standards.
In this report, our research team studied how non-professional graduates performed on each competency,
based on the response data on different items. For each item tagged within a particular competency, the
percentage correct response rates were determined. The consensus response rate of the items was
considered as the actual performance of the graduates on the given competencies. Items showing
consensus and those acting as outliers were studied by experts to understand their respective behavior. The
validity of a minority of items was found to be influenced by biases such as elimination strategy; such items
were not included in developing an estimate of the performance of graduates on each competency.
The employability has been quantified by Aspiring Minds, based on benchmarking studies conducted at
various companies across different sectors, defined by a theoretical understanding and empirical validation
of the knowledge, cognitive skills and domain expertise required. Performance of simple graduates in
generalized competencies was thus found and reported along with various demographic details captured by
our testing platform. This has helped us to present a comprehensive and meaningful data-analysis, provided
in this report.
3. The sample was statistically balanced across various parameters to be representative of the true non-professional graduate population. A carefully chosen stratified sample was used for the study
4. http://www.aspiringminds.in/researchcell/articles/how_to_create_test_blueprint.html
Aspiring Minds’ National Employability Report-Graduates 2013 9
1EMPLOYABILITY BY SECTORS
Graduates take up jobs and perform a variety of functions in various industry verticals. In this study, major
sectors that employ graduates were identified and studied to determine the percentage of employable
graduates across the nation. Graduates include candidates who complete 3-year bachelor’s degree
programs in areas such as science, commerce, arts, business management, etc. The study basically covers
candidates who complete full-time program in these areas.
The criteria for employability are based on validation studies conducted by Aspiring Minds with
corporations across different sectors. Their current employees in various profiles were benchmarked
through our flagship assessment product, AMCAT and establishing feedback through on-job performance
data. These benchmarks serve as a standard for several large-sized companies across the nation.
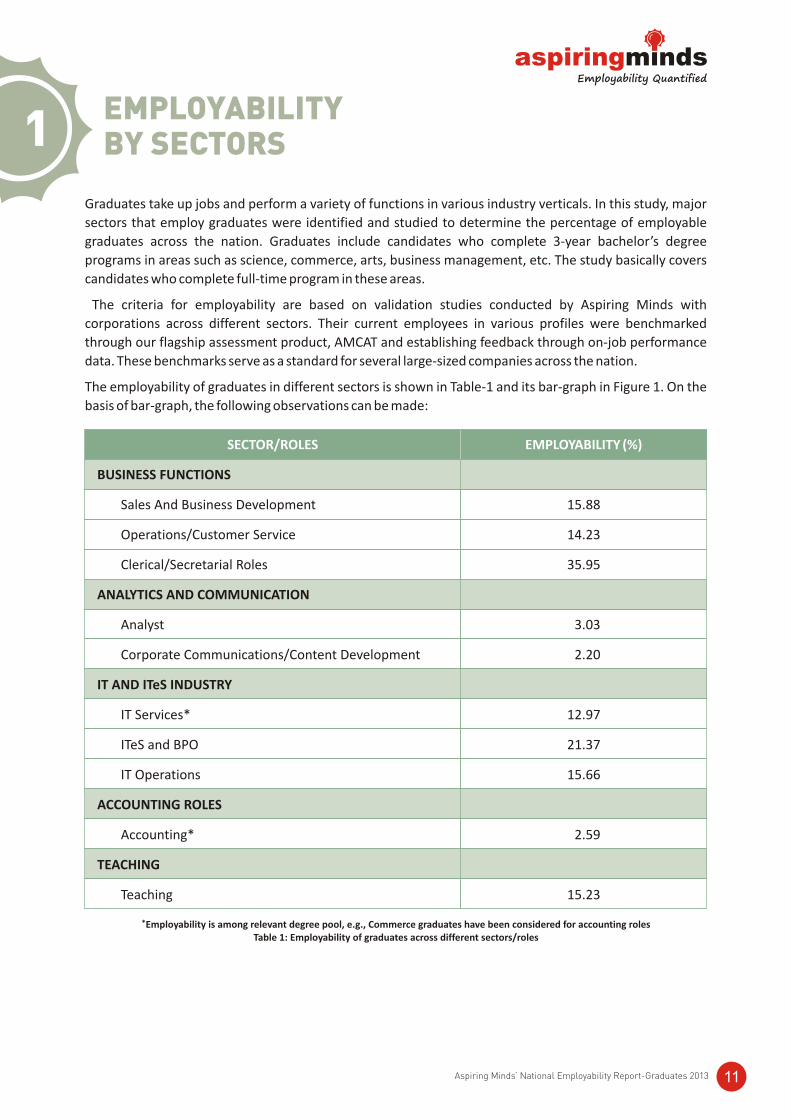
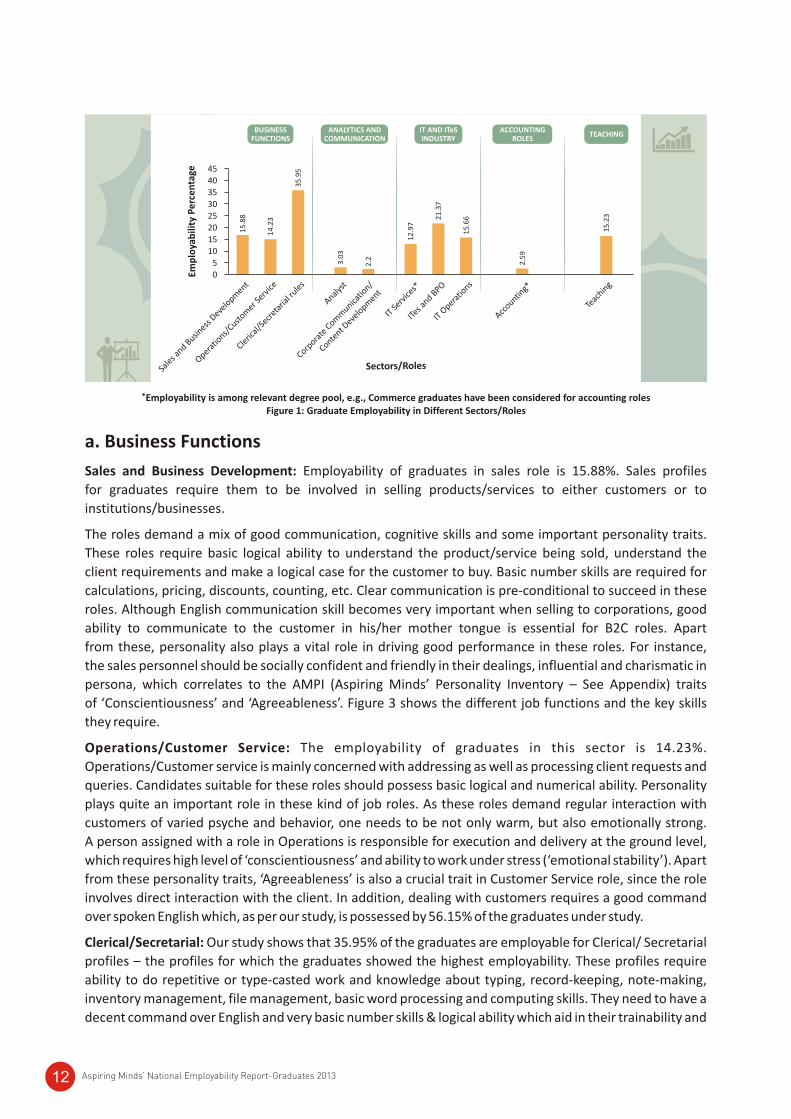
The employability of graduates in different sectors is shown in Table-1 and its bar-graph in Figure 1. On the
basis of bar-graph, the following observations can be made:
*Employability is among relevant degree pool, e.g., Commerce graduates have been considered for accounting rolesTable 1: Employability of graduates across different sectors/roles
SECTOR/ROLES EMPLOYABILITY (%)
BUSINESS FUNCTIONS
Sales And Business Development 15.88
Operations/Customer Service 14.23
Clerical/Secretarial Roles 35.95
ANALYTICS AND COMMUNICATION
Analyst 3.03
Corporate Communications/Content Development 2.20
IT AND ITeS INDUSTRY
IT Services* 12.97
ITeS and BPO 21.37
IT Operations 15.66
ACCOUNTING ROLES
Accounting* 2.59
TEACHING
Teaching 15.23
Aspiring Minds’ National Employability Report-Graduates 2013 11
a. Business Functions
Sales and Business Development: Employability of graduates in sales role is 15.88%. Sales profiles
for graduates require them to be involved in selling products/services to either customers or to
institutions/businesses.
The roles demand a mix of good communication, cognitive skills and some important personality traits.
These roles require basic logical ability to understand the product/service being sold, understand the
client requirements and make a logical case for the customer to buy. Basic number skills are required for
calculations, pricing, discounts, counting, etc. Clear communication is pre-conditional to succeed in these
roles. Although English communication skill becomes very important when selling to corporations, good
ability to communicate to the customer in his/her mother tongue is essential for B2C roles. Apart
from these, personality also plays a vital role in driving good performance in these roles. For instance,
the sales personnel should be socially confident and friendly in their dealings, influential and charismatic in
persona, which correlates to the AMPI (Aspiring Minds’ Personality Inventory – See Appendix) traits
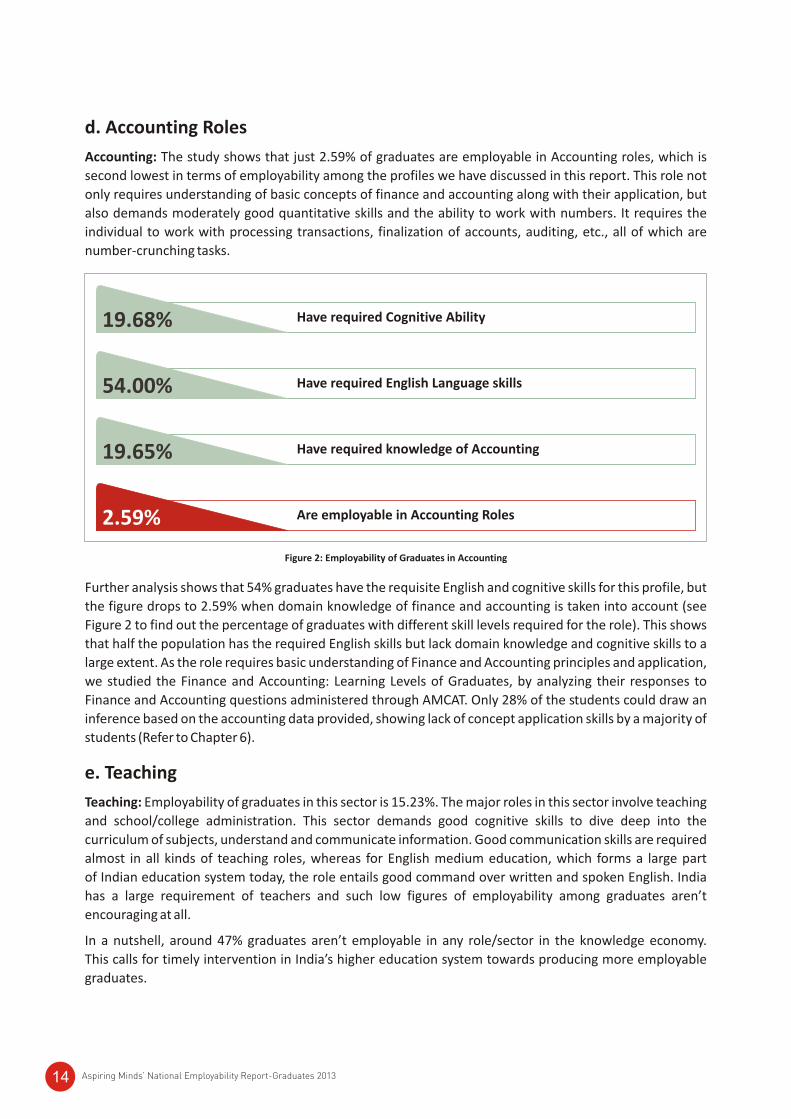
of ‘Conscientiousness’ and ‘Agreeableness’. Figure 3 shows the different job functions and the key skills
they require.
Operations/Customer Service: The employability of graduates in this sector is 14.23%.
Operations/Customer service is mainly concerned with addressing as well as processing client requests and
queries. Candidates suitable for these roles should possess basic logical and numerical ability. Personality
plays quite an important role in these kind of job roles. As these roles demand regular interaction with
customers of varied psyche and behavior, one needs to be not only warm, but also emotionally strong.
A person assigned with a role in Operations is responsible for execution and delivery at the ground level,
which requires high level of ‘conscientiousness’ and ability to work under stress (‘emotional stability’). Apart
from these personality traits, ‘Agreeableness’ is also a crucial trait in Customer Service role, since the role
involves direct interaction with the client. In addition, dealing with customers requires a good command
over spoken English which, as per our study, is possessed by 56.15% of the graduates under study.
Clerical/Secretarial: Our study shows that 35.95% of the graduates are employable for Clerical/ Secretarial
profiles – the profiles for which the graduates showed the highest employability. These profiles require
ability to do repetitive or type-casted work and knowledge about typing, record-keeping, note-making,
inventory management, file management, basic word processing and computing skills. They need to have a
decent command over English and very basic number skills & logical ability which aid in their trainability and
*Employability is among relevant degree pool, e.g., Commerce graduates have been considered for accounting rolesFigure 1: Graduate Employability in Different Sectors/Roles
Sectors/Roles
0
45
40
35
30
25
20
15
10
5
Sale
s and B
usiness
Deve
lopm
ent
Operatio
ns/Custo
mer S
ervice
Cleric
al/S
ecreta
rial r
ules
Analys
t
Emp
loya
bili
ty P
erc
en
tage
IT Se
rvice
s*
ITes a
nd BPO
IT O
peratio
ns
Accountin
g*
Teac
hing
Corpora
te C
omm
unicatio
n/
Content D
evelo
pment
15
.88
14
.23
35
.95
3.0
3
2.2
12
.97
21
.37
15
.66
2.5
9
15
.23
BUSINESS FUNCTIONS
ANALYTICS AND COMMUNICATION
IT AND ITeS INDUSTRY
ACCOUNTING ROLES
TEACHING
Aspiring Minds’ National Employability Report-Graduates 201312
learnability. The candidates opting for such profile should have a good level of ‘conscientiousness’ as the
person needs to be disciplined and organized in the tasks assigned to him/her. Even with these lax
requirements, it is alarming to note that only 36% graduates are found to be employable for such roles.
b. Analytics and Communication
Analyst: Employability of graduates is found to be exceptionally low (3.03%) in the Analyst role. A role in
analytics demands strong numerical and data analysis skills. The candidate should be able to analyze a new
problem, question assumptions, deduce meaning and also be able to generalize from specific information.
Along with this, they require well-developed written English communication skills. The study found that
graduates mostly lack the skills required for this role. Around 84% graduates do not exhibit the required
competence in cognitive ability, whereas 90% lack the required competence when it comes to English
communication ability – both skills considered crucial for this role. The overlapped criteria pulled the figures
of employable graduates to as low as 3%.
Corporate Communications/Content Development: Employability of graduates for this sector is found to
be the lowest and touches a meagre 2.20%. Content Development is all about developing good content in
presentable and lucid form which requires a person to have exceptional command over written English with
basic analytical skills. These may include analytical reports, press release or highly important survey reports
for presentation to prospective/existing clients and hence must maintain certain standards and should be
recognizable internationally. Significantly, only 4.59% graduates are found to be competent in English to the
level required for Corporate Communications/Content Development.
c. IT and ITeS Industry
IT Services: The employability of graduates in this sector is 12.97%. It should be noted that this has been
calculated as per the current hiring philosophy of IT service companies, where the candidate is not expected
to already possess the required software skills or soft skills, but is imparted the training over a period of
3 to 6 months. The hiring criterion for this industry, thus, is that the candidate should be trainable in areas of
technical and soft skills within a short period of time. As per the findings of various studies conducted by
Aspiring Minds, this requires a basic command over both language and cognitive skills and a basic exposure
to technology.
ITeS and BPO: The employability in this sector is 21.37%, which is higher than both IT Services and IT
Operations. This is as per expected lines, since the ITeS and BPO sectors don’t require very basic skills.
ITeS/BPO roles demand good spoken English skills for day-to-day conversations with customers and
colleagues, and basic logical skills to understand the problems while dealing with customers and to
effectively overcome them. Despite these liberal requirements, only 21.37% graduates are found employable 2in these roles as compared to 40.69% engineers who qualified for this profile .
IT Operations: The employability of graduates in the IT Operations sector is found to be 15.66%. This role
requires the graduates to have basic understanding of computers – both hardware and software - and they
should also exhibit a problem-solving approach with basic communication skills. These profiles require
graduates to manage computer hardware and networks within an organization or do troubleshooting for
customers. One may note that only 18.59% graduates are familiar with the fundamentals of computers.
As the role requires understanding/use of computers, we studied the Computer Fundamentals: Learning
Levels of Graduates by analyzing their responses to Computer Fundamentals questions administered
through AMCAT. It was found that 44% graduates failed to answer even basic questions like the ‘paste
command’ (For more details, refer to Chapter 6). It may also be noted that the National Employability 3Report for Engineers by Aspiring Minds reports that 36.57% Engineering graduates are employable for
IT Operations profiles. However, in case of graduates, the employability records a steep fall to reach just
15.66%; the reason being Engineers are better exposed to the understanding of hardware and software in
their curriculum than the graduates.
Aspiring Minds’ National Employability Report-Graduates 2013 13
d. Accounting Roles
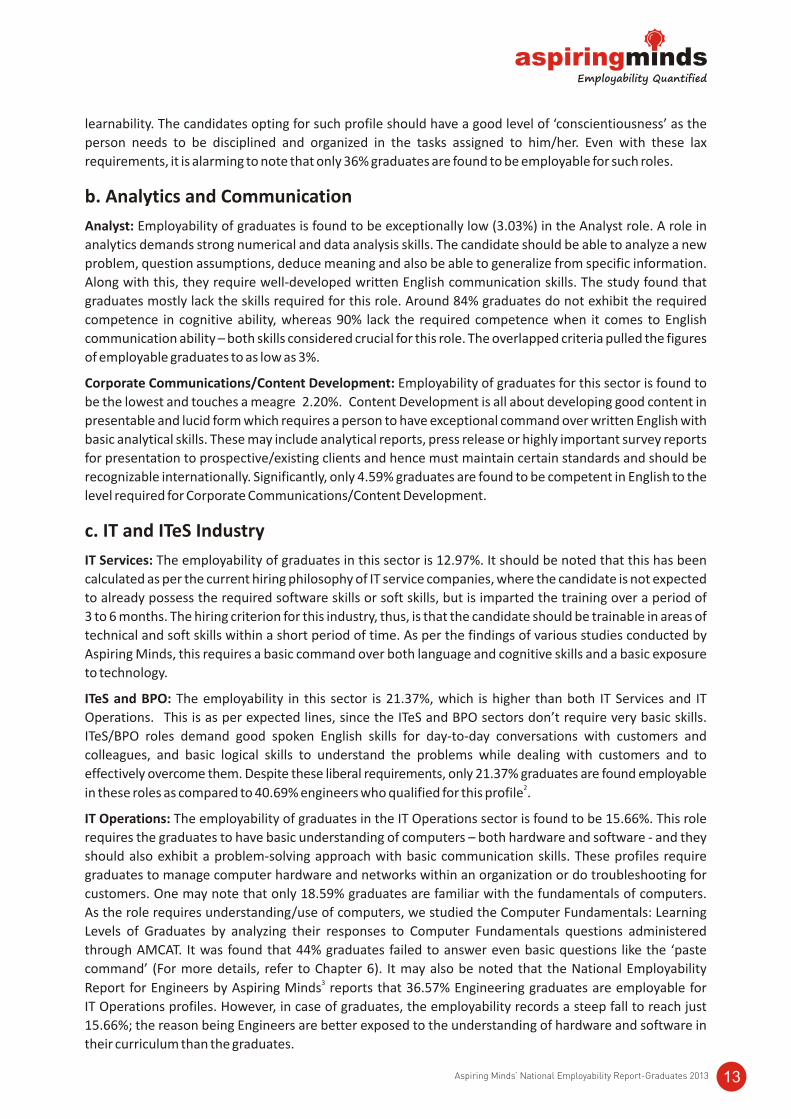
Accounting: The study shows that just 2.59% of graduates are employable in Accounting roles, which is
second lowest in terms of employability among the profiles we have discussed in this report. This role not
only requires understanding of basic concepts of finance and accounting along with their application, but
also demands moderately good quantitative skills and the ability to work with numbers. It requires the
individual to work with processing transactions, finalization of accounts, auditing, etc., all of which are
number-crunching tasks.
Figure 2: Employability of Graduates in Accounting
Further analysis shows that 54% graduates have the requisite English and cognitive skills for this profile, but
the figure drops to 2.59% when domain knowledge of finance and accounting is taken into account (see
Figure 2 to find out the percentage of graduates with different skill levels required for the role). This shows
that half the population has the required English skills but lack domain knowledge and cognitive skills to a
large extent. As the role requires basic understanding of Finance and Accounting principles and application,
we studied the Finance and Accounting: Learning Levels of Graduates, by analyzing their responses to
Finance and Accounting questions administered through AMCAT. Only 28% of the students could draw an
inference based on the accounting data provided, showing lack of concept application skills by a majority of
students (Refer to Chapter 6).
e. Teaching
Teaching: Employability of graduates in this sector is 15.23%. The major roles in this sector involve teaching
and school/college administration. This sector demands good cognitive skills to dive deep into the
curriculum of subjects, understand and communicate information. Good communication skills are required
almost in all kinds of teaching roles, whereas for English medium education, which forms a large part
of Indian education system today, the role entails good command over written and spoken English. India
has a large requirement of teachers and such low figures of employability among graduates aren’t
encouraging at all.
In a nutshell, around 47% graduates aren’t employable in any role/sector in the knowledge economy.
This calls for timely intervention in India’s higher education system towards producing more employable
graduates.
19.68% Have required Cognitive Ability
Have required English Language skills
Have required knowledge of Accounting
Are employable in Accounting Roles
54.00%
19.65%
2.59%
Aspiring Minds’ National Employability Report-Graduates 201314
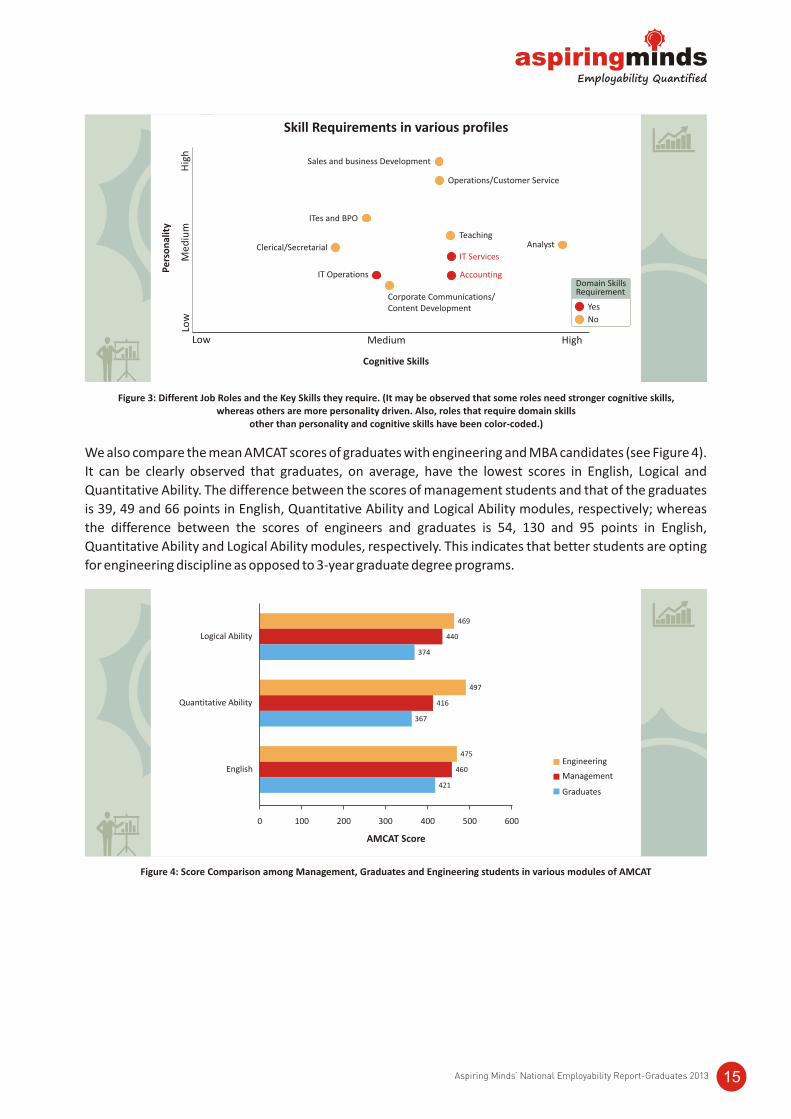
We also compare the mean AMCAT scores of graduates with engineering and MBA candidates (see Figure 4).
It can be clearly observed that graduates, on average, have the lowest scores in English, Logical and
Quantitative Ability. The difference between the scores of management students and that of the graduates
is 39, 49 and 66 points in English, Quantitative Ability and Logical Ability modules, respectively; whereas
the difference between the scores of engineers and graduates is 54, 130 and 95 points in English,
Quantitative Ability and Logical Ability modules, respectively. This indicates that better students are opting
for engineering discipline as opposed to 3-year graduate degree programs.
Figure 3: Different Job Roles and the Key Skills they require. (It may be observed that some roles need stronger cognitive skills, whereas others are more personality driven. Also, roles that require domain skills
other than personality and cognitive skills have been color-coded.)
Skill Requirements in various profiles
Cognitive Skills
Low Medium High
Low
Med
ium
Hig
h
Pe
rso
nal
ity
Sales and business Development
Operations/Customer Service
ITes and BPO
Clerical/Secretarial
IT Operations
Teaching
IT Services
Accounting
Analyst
Corporate Communications/Content Development Yes
No
Domain Skills Requirement
Figure 4: Score Comparison among Management, Graduates and Engineering students in various modules of AMCAT
AMCAT Score
0 100 200 400 500 600300
English
Quantitative Ability
Logical Ability
Engineering
Management
Graduates421
367
374
460
416
440
475
497
469
Aspiring Minds’ National Employability Report-Graduates 2013 15
2The increase in female employment rate around the world has been an important driving force of growth in
the past couple of decades. This makes it imperative to study the position of women with a graduate degree
in non-professional courses, in the employment sector. This report examines whether the aforementioned
trend has also affected India, in order to find few answers:
• Is employability really affected by gender?
• How does the employability of both genders vary in different sectors?
• What kind of skills do females possess as compared to males?
• Do men and women show preference to particular sectors or work areas?
a. Gender Ratio across Graduation Colleges in India
The population ratio of males to females (MFR) in India is 1.06, whereas in case of graduates, the ratio
of males to females is 1.09. Thus, when compared to the national MFR, the MFR of graduates is higher.
This indicates that a higher proportion of females take up graduation as their career path as compared
to males. But it should not be inferred from this that a higher number of females pursue higher education
in India. Areas of higher education such as engineering show an MFR of 1.96 and post-graduate degrees
such as MBA an MFR of 1.64. This indicates that the gender ratio in graduation is evenly skewed in favor of
females, as compared to that in engineering or MBA courses. This is in line with national findings that more 5
females opt for graduation than Engineering and MBA , which will be discussed later in this section.
b. Gender Distribution across Graduation Streams
EMPLOYABILITY BY GENDER
5. http://www.ias.ac.in/womeninscience/INSA_56-67.pdf
6. http://www.indianexpress.com/news/less-women-more-men-opt-for-higher-edu/935608/
Table 2: Male-Female Ratio (MFR) across Graduation Streams
While studying the MFR across graduation streams, we observe that it’s more inclined towards Females
amongst graduates pursuing Arts. There are 80 males per 100 females in the Arts stream compared to
115 males per 100 females in Science and 91 males per 100 females in commerce (See Table 2).
These ratios may result from a combined effect of preference and ability of males vs. females. The study
of this is beyond the scope of the current report. Media reports suggest that the possible reason for such
distribution could be natural inclination of females towards non-technological fields, since these fields 6are easier to pursue .
STREAMS MFR(NET - 1.09)
SCIENCE 1.15
COMMERCE 0.91
ARTS 0.80
Aspiring Minds’ National Employability Report-Graduates 201316
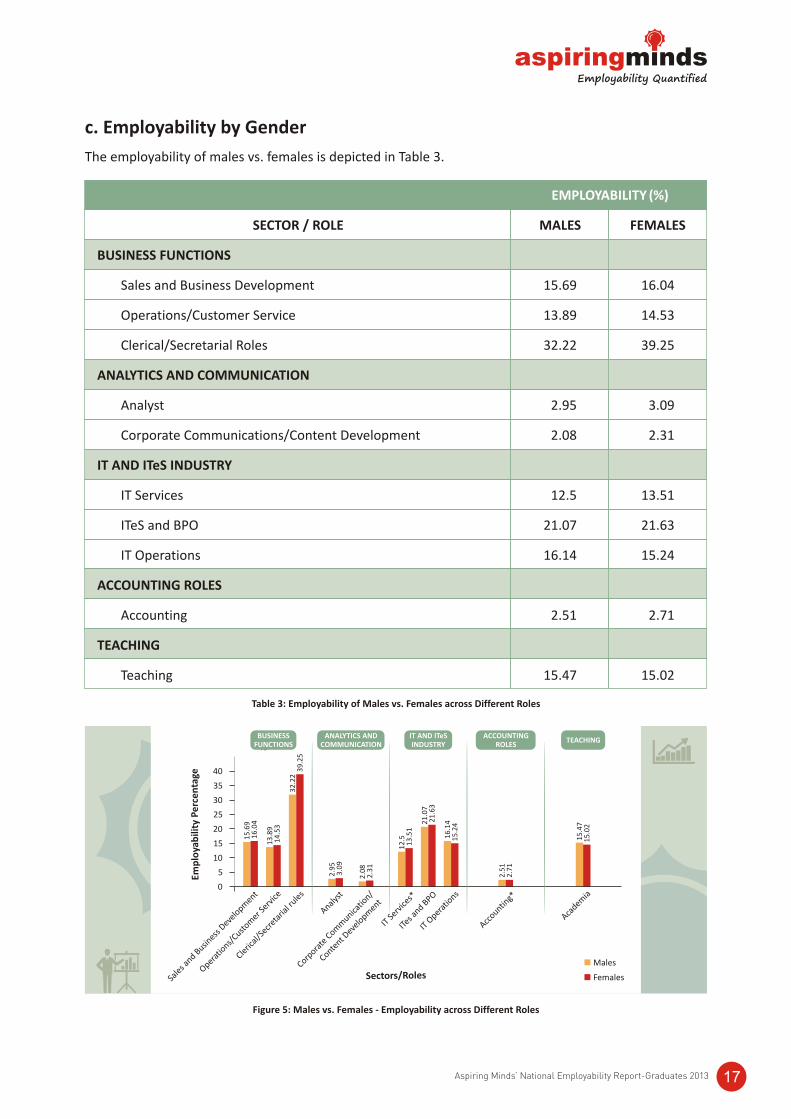
c. Employability by Gender
The employability of males vs. females is depicted in Table 3.
EMPLOYABILITY (%)
SECTOR / ROLE MALES FEMALES
BUSINESS FUNCTIONS
Sales and Business Development 15.69 16.04
Operations/Customer Service 13.89 14.53
Clerical/Secretarial Roles 32.22 39.25
ANALYTICS AND COMMUNICATION
Analyst 2.95 3.09
Corporate Communications/Content Development 2.08 2.31
IT AND ITeS INDUSTRY
IT Services 12.5 13.51
ITeS and BPO 21.07 21.63
IT Operations 16.14 15.24
ACCOUNTING ROLES
Accounting 2.51 2.71
TEACHING
Teaching 15.47 15.02
Table 3: Employability of Males vs. Females across Different Roles
Figure 5: Males vs. Females - Employability across Different Roles
40
35
30
25
20
15
10
5
0
Sale
s and B
usiness
Deve
lopm
ent
Operatio
ns/Custo
mer S
ervice
Cleric
al/S
ecreta
rial r
ules
Analys
t
IT Se
rvice
s*
ITes a
nd BPO
IT O
peratio
ns
Accountin
g*
Academ
ia
Corpora
te C
omm
unicatio
n/
Content D
evelo
pment
Emp
loya
bili
ty P
erc
en
tage
Sectors/RolesMales
Females
15
.69
16
.04
13
.89
14
.53
32
.22
39
.25
2.9
53
.09
2.0
82
.31
12
.51
3.5
1
21
.07
21
.63
16
.14
15
.24
2.5
12
.71
15
.47
15
.02
45
BUSINESS FUNCTIONS
ANALYTICS AND COMMUNICATION
IT AND ITeS INDUSTRY
ACCOUNTING ROLES
TEACHING
Aspiring Minds’ National Employability Report-Graduates 2013 17
7. http://coweb.cc.gatech.edu/mediaComp-teach/uploads/16/Townsend_Loyd.pdf
8. http://www.psychologicalscience.org/journals/pspi/pspi_8_1_article.pdf
9. http://articles.timesofindia.indiatimes.com/2003-06-01/thiruvananthapuram/27194635_1_computer-literacy-open-centres-akshaya-project
10. http://www.telegraph.co.uk/education/primaryeducation/8734967/No-male-teachers-at-4500-primary-schools-figures-show.html
11. http://www.dailymail.co.uk/news/article-2234250/1-5-boys-primaries-male-teachers-entire-education-one.html
12. http://www.sociology.vt.edu/course/work/Readings/ReskinSexSegregationAbbrev.doc
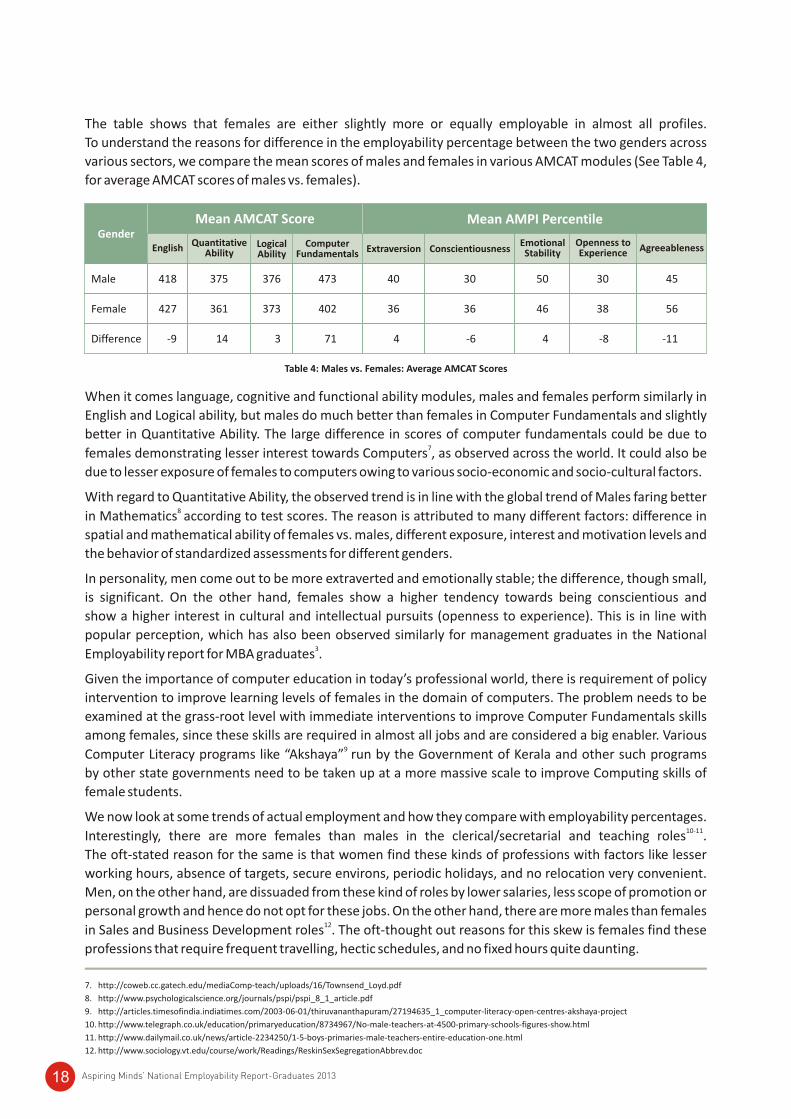
The table shows that females are either slightly more or equally employable in almost all profiles.
To understand the reasons for difference in the employability percentage between the two genders across
various sectors, we compare the mean scores of males and females in various AMCAT modules (See Table 4,
for average AMCAT scores of males vs. females).
When it comes language, cognitive and functional ability modules, males and females perform similarly in
English and Logical ability, but males do much better than females in Computer Fundamentals and slightly
better in Quantitative Ability. The large difference in scores of computer fundamentals could be due to 7females demonstrating lesser interest towards Computers , as observed across the world. It could also be
due to lesser exposure of females to computers owing to various socio-economic and socio-cultural factors.
With regard to Quantitative Ability, the observed trend is in line with the global trend of Males faring better 8 in Mathematics according to test scores. The reason is attributed to many different factors: difference in
spatial and mathematical ability of females vs. males, different exposure, interest and motivation levels and
the behavior of standardized assessments for different genders.
In personality, men come out to be more extraverted and emotionally stable; the difference, though small,
is significant. On the other hand, females show a higher tendency towards being conscientious and
show a higher interest in cultural and intellectual pursuits (openness to experience). This is in line with
popular perception, which has also been observed similarly for management graduates in the National 3
Employability report for MBA graduates .
Given the importance of computer education in today’s professional world, there is requirement of policy
intervention to improve learning levels of females in the domain of computers. The problem needs to be
examined at the grass-root level with immediate interventions to improve Computer Fundamentals skills
among females, since these skills are required in almost all jobs and are considered a big enabler. Various 9 Computer Literacy programs like “Akshaya” run by the Government of Kerala and other such programs
by other state governments need to be taken up at a more massive scale to improve Computing skills of
female students.
We now look at some trends of actual employment and how they compare with employability percentages. 10-11
Interestingly, there are more females than males in the clerical/secretarial and teaching roles .
The oft-stated reason for the same is that women find these kinds of professions with factors like lesser
working hours, absence of targets, secure environs, periodic holidays, and no relocation very convenient.
Men, on the other hand, are dissuaded from these kind of roles by lower salaries, less scope of promotion or
personal growth and hence do not opt for these jobs. On the other hand, there are more males than females 12in Sales and Business Development roles . The oft-thought out reasons for this skew is females find these
professions that require frequent travelling, hectic schedules, and no fixed hours quite daunting.
Table 4: Males vs. Females: Average AMCAT Scores
Mean AMCAT Score Mean AMPI PercentileGender
Male 418 375 376 473 40 30 50 30 45
Female 427 361 373 402 36 36 46 38 56
Difference -9 14 3 71 4 -6 4 -8 -11
English QuantitativeAbility
LogicalAbility
ComputerFundamentals Extraversion Conscientiousness
EmotionalStability
Openness toExperience Agreeableness
Aspiring Minds’ National Employability Report-Graduates 201318
3It is very important to understand how employability varies from region to region. On discussing this, one is
13likely to juggle with a few questions. Do the demographic factors of a region influence its employability ?
Do certain cities exhibit very different employability patterns than their region? The present section looks
at the employability percentages by grouping campuses (and the students’ permanent address) by their
region. In cases where significant differences emerge in employability, an attempt has been made to explore
the possible causes leading to such difference. We hope our observations will prompt other studies to
explore the causes for these differences, leading to proposals of intervention. Here, we study the
employability by tier of college city, tier of permanent city (residence) and metros and non-metros.
a. Employability by Tier of Cities
Among students and parents alike, there is a preference for colleges in Tier I cities, given the general belief 14that colleges located in Tier I cities offer better exposure to students . The reasons for this exposure are
likely to be the presence of multinational companies, global media, infrastructural advancements,
government inventories, etc. How feasible or affordable it is for students from Tier II and Tier III cities to
move to Tier I cities is another question, but at least for Tier I students, colleges in Tier I cities are high on the
preference list.
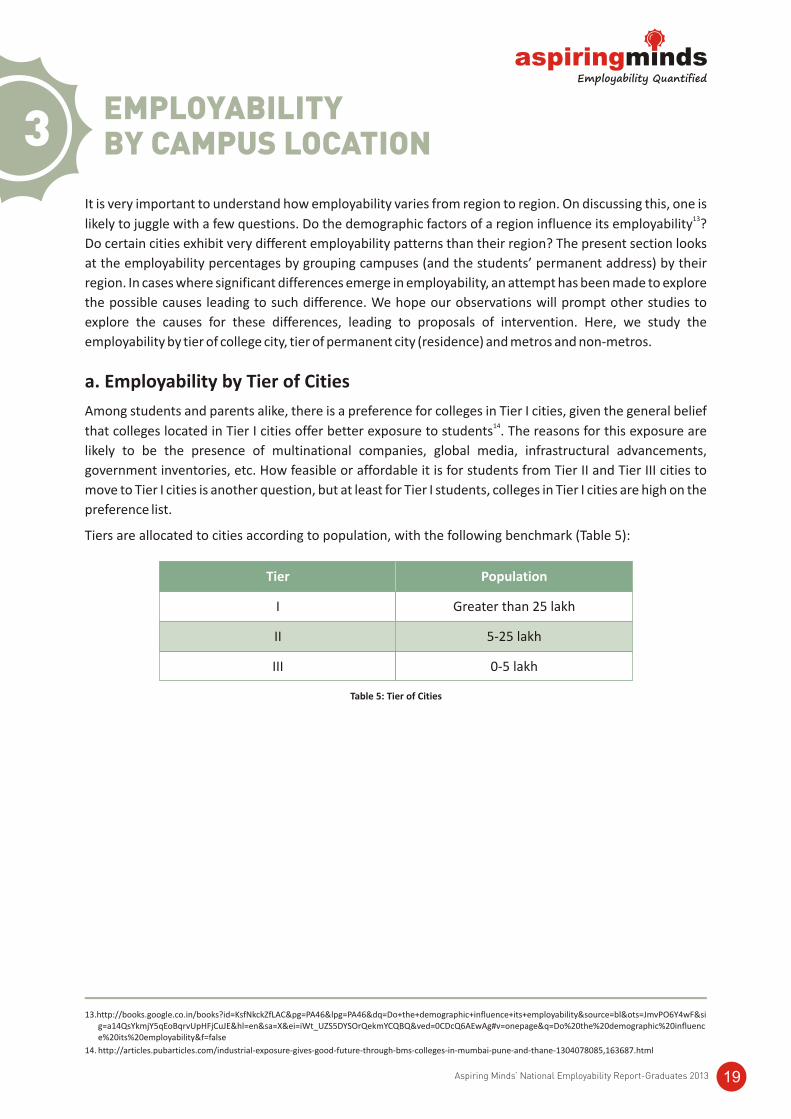
Tiers are allocated to cities according to population, with the following benchmark (Table 5):
EMPLOYABILITY BY CAMPUS LOCATION
Tier Population
I Greater than 25 lakh
II 5-25 lakh
III 0-5 lakh
Table 5: Tier of Cities
13.http://books.google.co.in/books?id=KsfNkckZfLAC&pg=PA46&lpg=PA46&dq=Do+the+demographic+influence+its+employability&source=bl&ots=JmvPO6Y4wF&sig=a14QsYkmjY5qEoBqrvUpHFjCuJE&hl=en&sa=X&ei=iWt_UZS5DYSOrQekmYCQBQ&ved=0CDcQ6AEwAg#v=onepage&q=Do%20the%20demographic%20influence%20its%20employability&f=false
14. http://articles.pubarticles.com/industrial-exposure-gives-good-future-through-bms-colleges-in-mumbai-pune-and-thane-1304078085,163687.html
Aspiring Minds’ National Employability Report-Graduates 2013 19
Aspiring Minds’ National Employability Report-Graduates 201320
TierI
TierII
TierIII
Tier(T I to T II)
Tier(T II to T III)
EMPLOYABILITY (%)
BUSINESS FUNCTIONS
Sales and Business Development 19.81 11.88 8.34 40.05 29.78
Operations/Customer Service 17.48 10.69 8.37 38.82 21.73
Clerical/Secretarial Roles 38.98 31.45 31.64 19.32 -0.59
ANALYTICS AND COMMUNICATION
Analyst 4.61 0.98 0.57 78.81 41.68
Corporate Communications/ 3.32 0.68 0.57 79.42 16.52Content Development
IT INDUSTRY
IT Services 16.50 09.52 5.28 42.29 44.61
ITeS and BPO 26.13 15.92 13.06 39.07 17.99
IT Operations 19.53 11.26 8.87 42.33 21.29
ACCOUNTING ROLES
Accounting 3.01 2.05 2.19 31.97 -6.93
TEACHING
Teaching 19.51 10.49 7.60 46.24 27.56
SECTOR / ROLE
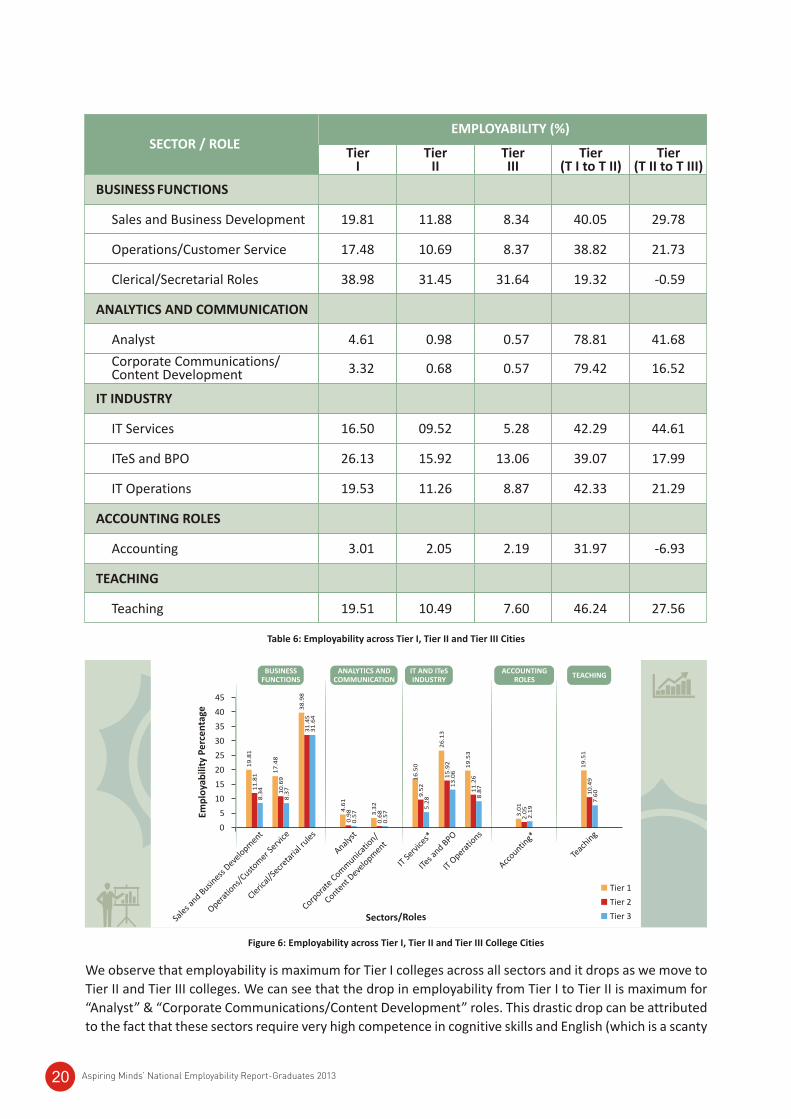
We observe that employability is maximum for Tier I colleges across all sectors and it drops as we move to
Tier II and Tier III colleges. We can see that the drop in employability from Tier I to Tier II is maximum for
“Analyst” & “Corporate Communications/Content Development” roles. This drastic drop can be attributed
to the fact that these sectors require very high competence in cognitive skills and English (which is a scanty
Table 6: Employability across Tier I, Tier II and Tier III Cities
Figure 6: Employability across Tier I, Tier II and Tier III College Cities
45
40
35
30
25
20
15
10
5
0
Sale
s and B
usiness
Deve
lopm
ent
Operatio
ns/Custo
mer S
ervice
Cleric
al/S
ecreta
rial r
ules
Analys
t
IT Se
rvice
s*
ITes a
nd BPO
IT O
peratio
ns
Accountin
g*
Teac
hing
Corpora
te C
omm
unicatio
n/
Content D
evelo
pment
Emp
loya
bili
ty P
erc
en
tage
19
.81
11
.81
8.3
4
17
.48
10
.69
8.3
7
38
.98
31
.45
31
.64
4.6
10
.98
0.5
7 3.3
20
.68
0.5
7
16
.50
9.5
25
.28
26
.13
15
.92
13
.06
19
.53
11
.26
8.8
7
3.0
12
.05
2.1
9
19
.51
10
.49
7.6
0
ANALYTICS AND COMMUNICATION
IT AND ITeS INDUSTRY
ACCOUNTING ROLES
TEACHINGBUSINESS
FUNCTIONS
Sectors/Roles
Tier 1
Tier 2
Tier 3
Aspiring Minds’ National Employability Report-Graduates 2013 21
skill among students in Tier II and Tier III cities). The drop in employability from Tier I to Tier II is observed
to be minimum for Clerical/Secretarial roles (which does not require any specialist skills or, for that matter,
high cognitive skills). This shows a similar trend as observed in other employability studies conducted by
Aspiring Minds: As the threshold of “skillset” for a job increases, the employability gap between Tier I & II
and Tier II & III increases. The higher/more the competencies required, the wider the employability gap (see
Figure 7). On the other hand, if basic skills are required, the difference in employability (as it is in the clerical
sector) gets moderated and is much lesser.
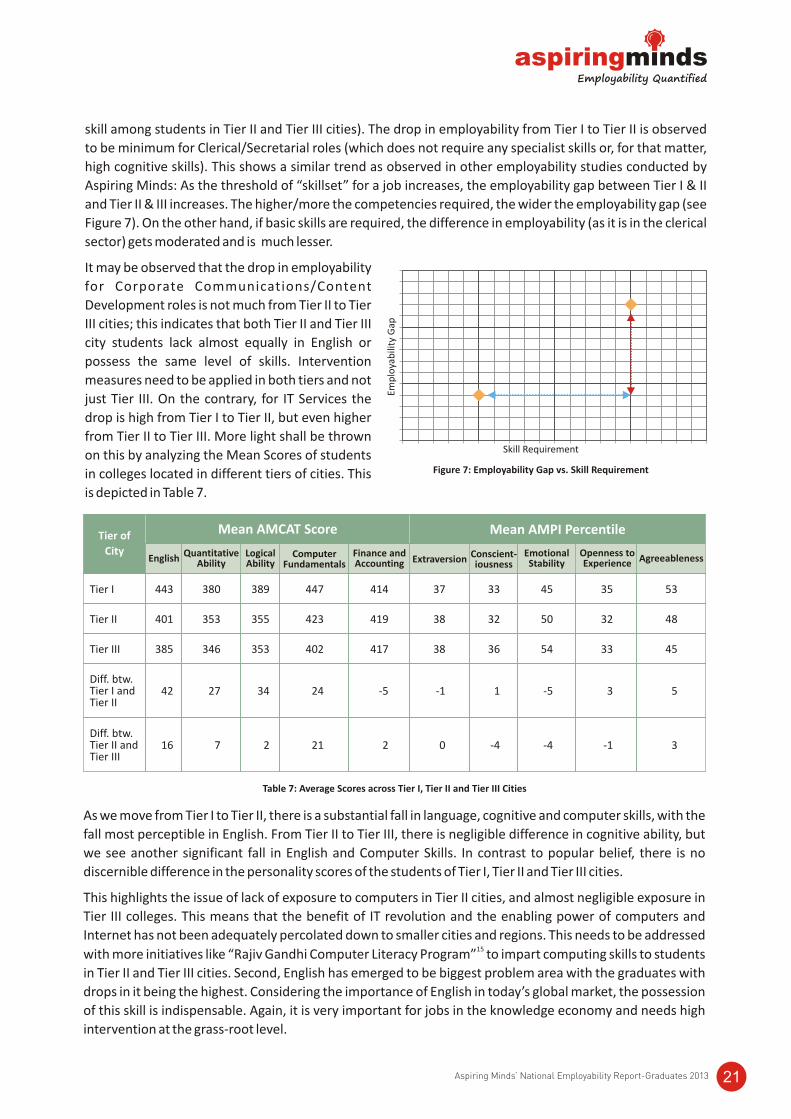
It may be observed that the drop in employability
for Corporate Communications/Content
Development roles is not much from Tier II to Tier
III cities; this indicates that both Tier II and Tier III
city students lack almost equally in English or
possess the same level of skills. Intervention
measures need to be applied in both tiers and not
just Tier III. On the contrary, for IT Services the
drop is high from Tier I to Tier II, but even higher
from Tier II to Tier III. More light shall be thrown
on this by analyzing the Mean Scores of students
in colleges located in different tiers of cities. This
is depicted in Table 7.
Mean AMCAT Score Mean AMPI PercentileTier of
City
Tier I 443 380 389 447 414 37 33 45 35 53
Tier II 401 353 355 423 419 38 32 50 32 48
Tier III 385 346 353 402 417 38 36 54 33 45
Diff. btw. Tier I and 42 27 34 24 -5 -1 1 -5 3 5Tier II
Diff. btw. Tier II and 16 7 2 21 2 0 -4 -4 -1 3Tier III
English QuantitativeAbility
LogicalAbility
ComputerFundamentals
Finance andAccounting Extraversion Conscient-
iousnessEmotionalStability
Openness toExperience Agreeableness
Table 7: Average Scores across Tier I, Tier II and Tier III Cities
As we move from Tier I to Tier II, there is a substantial fall in language, cognitive and computer skills, with the
fall most perceptible in English. From Tier II to Tier III, there is negligible difference in cognitive ability, but
we see another significant fall in English and Computer Skills. In contrast to popular belief, there is no
discernible difference in the personality scores of the students of Tier I, Tier II and Tier III cities.
This highlights the issue of lack of exposure to computers in Tier II cities, and almost negligible exposure in
Tier III colleges. This means that the benefit of IT revolution and the enabling power of computers and
Internet has not been adequately percolated down to smaller cities and regions. This needs to be addressed 15
with more initiatives like “Rajiv Gandhi Computer Literacy Program” to impart computing skills to students
in Tier II and Tier III cities. Second, English has emerged to be biggest problem area with the graduates with
drops in it being the highest. Considering the importance of English in today’s global market, the possession
of this skill is indispensable. Again, it is very important for jobs in the knowledge economy and needs high
intervention at the grass-root level.
Emp
loya
bili
ty G
ap
Skill Requirement
Figure 7: Employability Gap vs. Skill Requirement
15. http://rgclp.in/
2On comparing the mean score drop of graduates from Tier I to Tier II with that drop of Engineers and
3Management students, it is revealed that the drop in scores in English, Quantitative Ability and Logical
Ability is maximum in the case of graduates, followed by management students and then engineers. But it is
also worth mentioning that the steepest drop for Graduates, Engineers and Management Students occurs in
English. If one observes the drop in skills from Tier II to Tier III cities, one will notice the drop in Cognitive
skills is the highest among Management and Engineering students, whereas for graduates, English recorded
the maximum drop.
b. Employability in Metros vs. Non-Metros
Metro/Non-Metro by Location of Colleges: In this section, we analyze the employability of graduates
from colleges in metro cities, compared to the employability of those from colleges in non-metro cities.
The popular belief is that colleges in metros produce more employable graduates due to better exposure
and education, which explains why parents often prefer colleges in metros as opposed to those in non-
metros while making an admission decision. But does it really affect a student’s employability? And if it
does, then to what degree? This section attempts to answer some of these knotty questions.
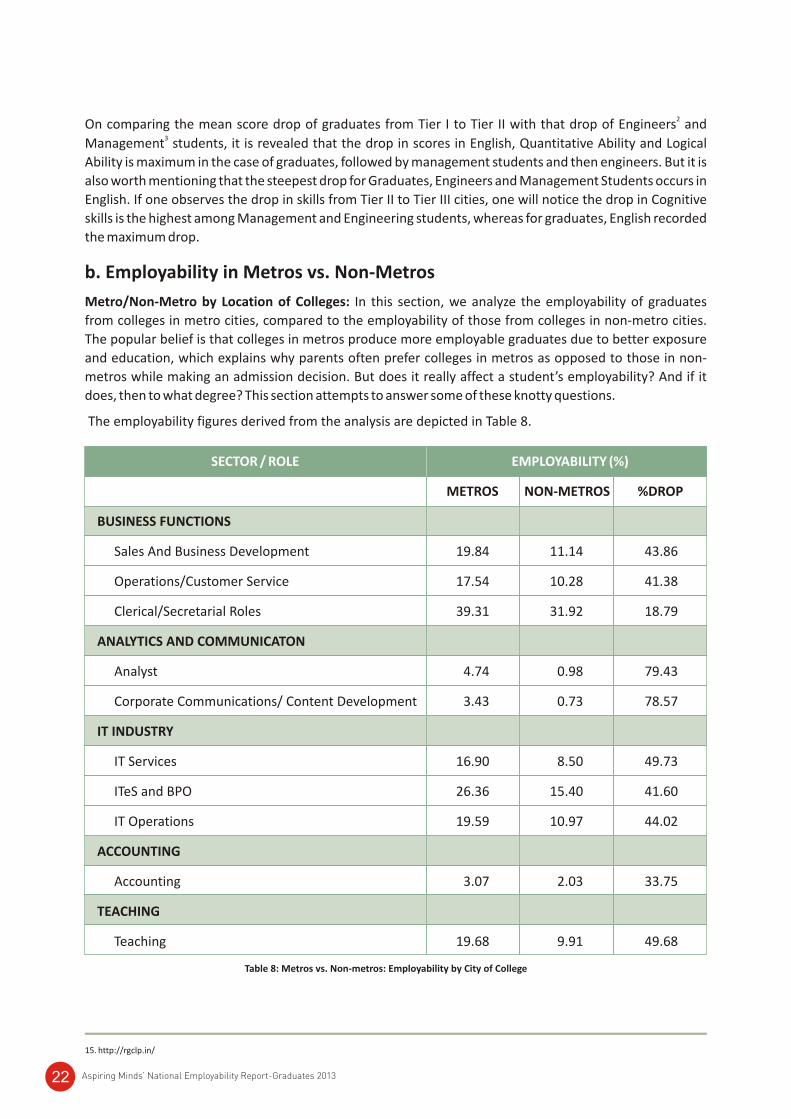
The employability figures derived from the analysis are depicted in Table 8.
SECTOR / ROLE EMPLOYABILITY (%)
METROS NON-METROS %DROP
BUSINESS FUNCTIONS
Sales And Business Development 19.84 11.14 43.86
Operations/Customer Service 17.54 10.28 41.38
Clerical/Secretarial Roles 39.31 31.92 18.79
ANALYTICS AND COMMUNICATON
Analyst 4.74 0.98 79.43
Corporate Communications/ Content Development 3.43 0.73 78.57
IT INDUSTRY
IT Services 16.90 8.50 49.73
ITeS and BPO 26.36 15.40 41.60
IT Operations 19.59 10.97 44.02
ACCOUNTING
Accounting 3.07 2.03 33.75
TEACHING
Teaching 19.68 9.91 49.68
Table 8: Metros vs. Non-metros: Employability by City of College
Aspiring Minds’ National Employability Report-Graduates 201322
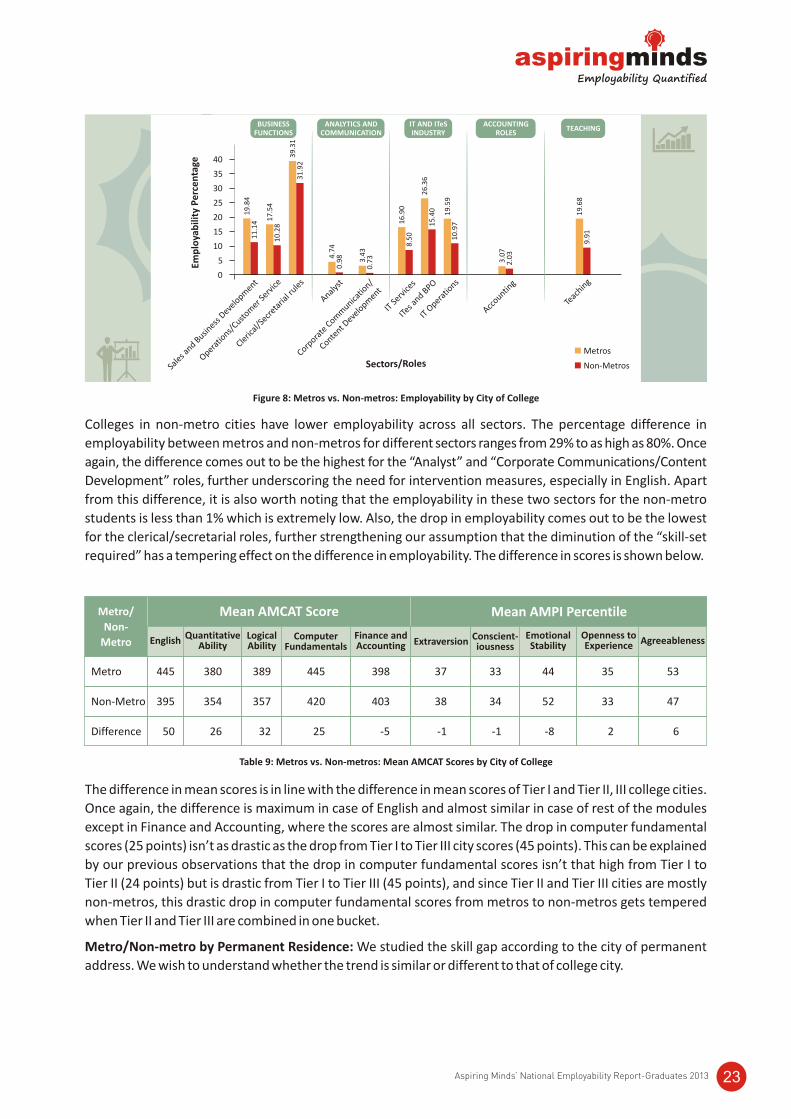
Colleges in non-metro cities have lower employability across all sectors. The percentage difference in
employability between metros and non-metros for different sectors ranges from 29% to as high as 80%. Once
again, the difference comes out to be the highest for the “Analyst” and “Corporate Communications/Content
Development” roles, further underscoring the need for intervention measures, especially in English. Apart
from this difference, it is also worth noting that the employability in these two sectors for the non-metro
students is less than 1% which is extremely low. Also, the drop in employability comes out to be the lowest
for the clerical/secretarial roles, further strengthening our assumption that the diminution of the “skill-set
required” has a tempering effect on the difference in employability. The difference in scores is shown below.
Mean AMCAT Score Mean AMPI PercentileMetro/
Non-
Metro
Metro 445 380 389 445 398 37 33 44 35 53
Non-Metro 395 354 357 420 403 38 34 52 33 47
Difference 50 26 32 25 -5 -1 -1 -8 2 6
English QuantitativeAbility
LogicalAbility
ComputerFundamentals
Finance andAccounting Extraversion Conscient-
iousnessEmotionalStability
Openness toExperience Agreeableness
Table 9: Metros vs. Non-metros: Mean AMCAT Scores by City of College
The difference in mean scores is in line with the difference in mean scores of Tier I and Tier II, III college cities.
Once again, the difference is maximum in case of English and almost similar in case of rest of the modules
except in Finance and Accounting, where the scores are almost similar. The drop in computer fundamental
scores (25 points) isn’t as drastic as the drop from Tier I to Tier III city scores (45 points). This can be explained
by our previous observations that the drop in computer fundamental scores isn’t that high from Tier I to
Tier II (24 points) but is drastic from Tier I to Tier III (45 points), and since Tier II and Tier III cities are mostly
non-metros, this drastic drop in computer fundamental scores from metros to non-metros gets tempered
when Tier II and Tier III are combined in one bucket.
Metro/Non-metro by Permanent Residence: We studied the skill gap according to the city of permanent
address. We wish to understand whether the trend is similar or different to that of college city.
40
35
30
25
20
15
10
5
0
Sale
s and B
usiness
Deve
lopm
ent
Operatio
ns/Custo
mer S
ervice
Cleric
al/S
ecreta
rial r
ules
Analys
t
IT Se
rvice
s
ITes a
nd BPO
IT O
peratio
ns
Accountin
g
Teac
hing
Corpora
te C
omm
unicatio
n/
Content D
evelo
pment
Emp
loya
bili
ty P
erc
en
tage
Sectors/RolesMetros
Non-Metros
19
.84
11
.14 1
7.5
41
0.2
8
39
.31
31
.92
4.7
40
.98 3.4
30
.73
16
.90
8.5
0
26
.36
15
.40 19
.59
10
.97
3.0
72
.03
19
.68
9.9
1
BUSINESS FUNCTIONS
ANALYTICS AND COMMUNICATION
IT AND ITeS INDUSTRY
ACCOUNTING ROLES
TEACHING
Figure 8: Metros vs. Non-metros: Employability by City of College
Aspiring Minds’ National Employability Report-Graduates 2013 23
Mean AMCAT Score Mean AMPI PercentileMetro/
Non-
Metro
Metro 461 390 395 473 410 37 33 47 36 55
Non-Metro 437 388 393 464 415 39 36 52 34 53
Difference 24 2 2 9 -5 -2 -3 -5 2 2
English QuantitativeAbility
LogicalAbility
ComputerFundamentals
Finance andAccounting Extraversion Conscient-
iousnessEmotionalStability
Openness toExperience Agreeableness
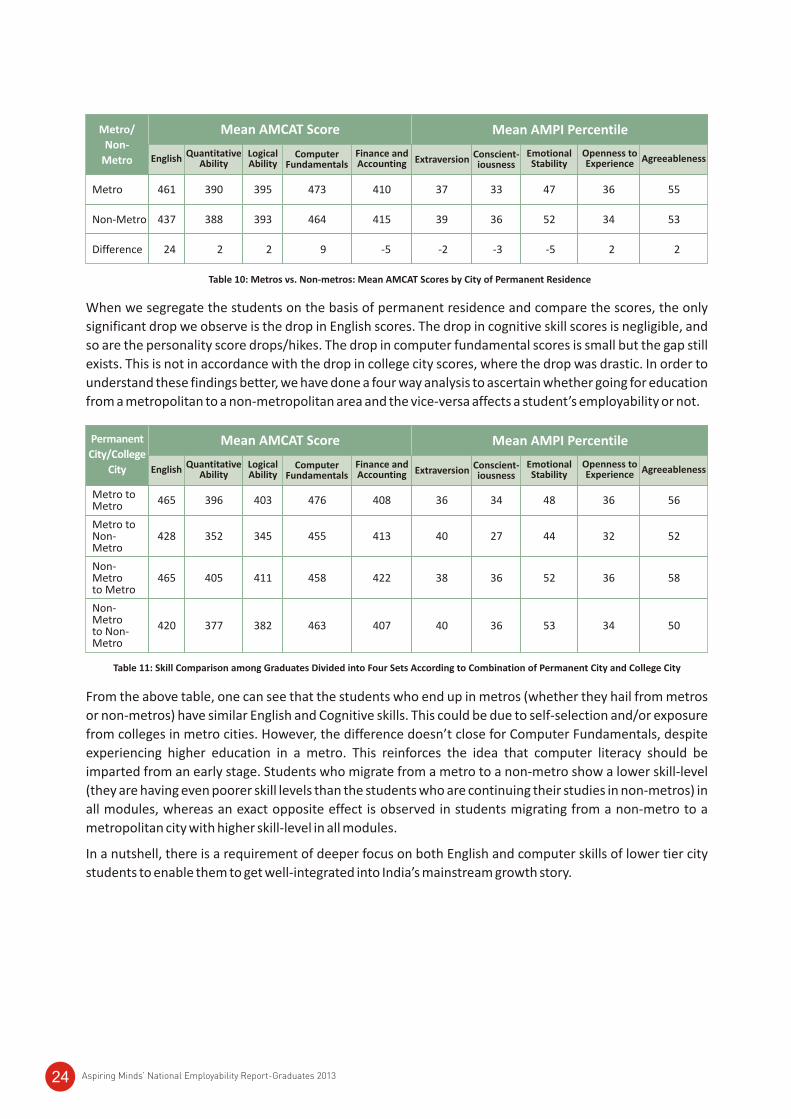
Table 10: Metros vs. Non-metros: Mean AMCAT Scores by City of Permanent Residence
Mean AMCAT Score Mean AMPI PercentilePermanent
City/College
City
Metro to 465 396 403 476 408 36 34 48 36 56Metro
Metro to Non- 428 352 345 455 413 40 27 44 32 52Metro
Non-Metro 465 405 411 458 422 38 36 52 36 58to Metro
Non-Metro 420 377 382 463 407 40 36 53 34 50to Non-Metro
English QuantitativeAbility
LogicalAbility
ComputerFundamentals
Finance andAccounting Extraversion Conscient-
iousnessEmotionalStability
Openness toExperience Agreeableness
Table 11: Skill Comparison among Graduates Divided into Four Sets According to Combination of Permanent City and College City
From the above table, one can see that the students who end up in metros (whether they hail from metros
or non-metros) have similar English and Cognitive skills. This could be due to self-selection and/or exposure
from colleges in metro cities. However, the difference doesn’t close for Computer Fundamentals, despite
experiencing higher education in a metro. This reinforces the idea that computer literacy should be
imparted from an early stage. Students who migrate from a metro to a non-metro show a lower skill-level
(they are having even poorer skill levels than the students who are continuing their studies in non-metros) in
all modules, whereas an exact opposite effect is observed in students migrating from a non-metro to a
metropolitan city with higher skill-level in all modules.
In a nutshell, there is a requirement of deeper focus on both English and computer skills of lower tier city
students to enable them to get well-integrated into India’s mainstream growth story.
When we segregate the students on the basis of permanent residence and compare the scores, the only
significant drop we observe is the drop in English scores. The drop in cognitive skill scores is negligible, and
so are the personality score drops/hikes. The drop in computer fundamental scores is small but the gap still
exists. This is not in accordance with the drop in college city scores, where the drop was drastic. In order to
understand these findings better, we have done a four way analysis to ascertain whether going for education
from a metropolitan to a non-metropolitan area and the vice-versa affects a student’s employability or not.
Aspiring Minds’ National Employability Report-Graduates 201324
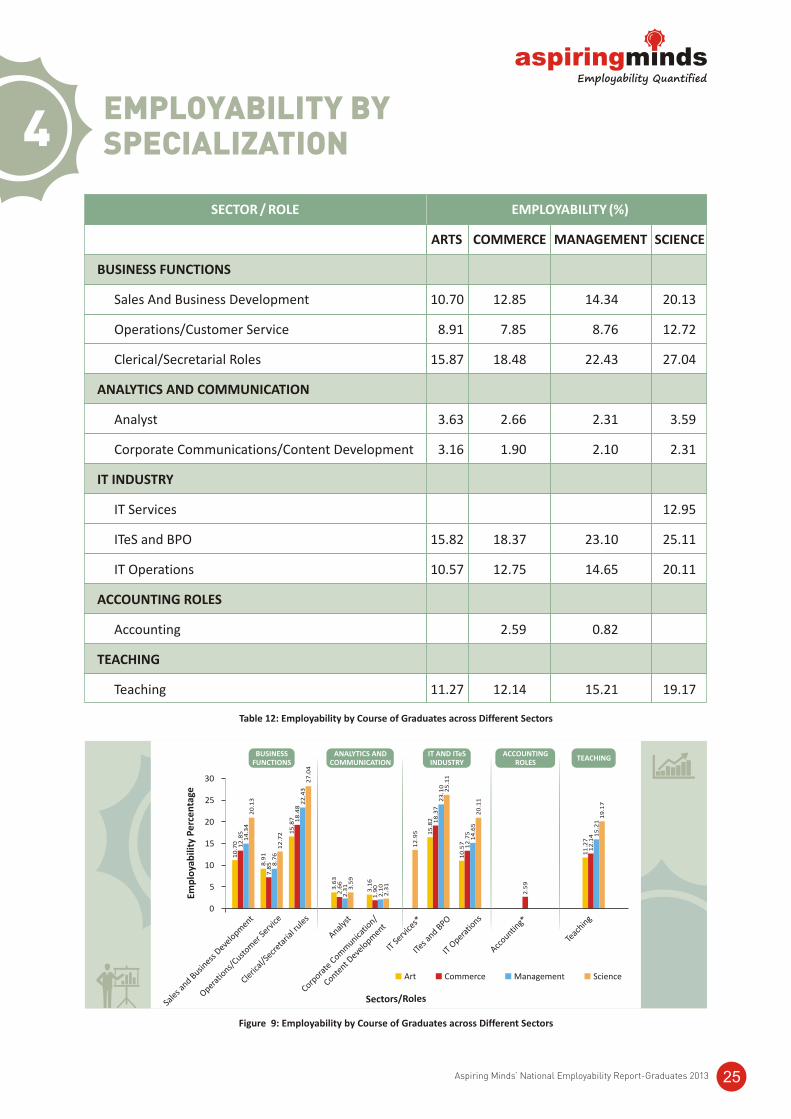
4EMPLOYABILITY BY SPECIALIZATION
SECTOR / ROLE EMPLOYABILITY (%)
ARTS COMMERCE MANAGEMENT SCIENCE
BUSINESS FUNCTIONS
Sales And Business Development 10.70 12.85 14.34 20.13
Operations/Customer Service 8.91 7.85 8.76 12.72
Clerical/Secretarial Roles 15.87 18.48 22.43 27.04
ANALYTICS AND COMMUNICATION
Analyst 3.63 2.66 2.31 3.59
Corporate Communications/Content Development 3.16 1.90 2.10 2.31
IT INDUSTRY
IT Services 12.95
ITeS and BPO 15.82 18.37 23.10 25.11
IT Operations 10.57 12.75 14.65 20.11
ACCOUNTING ROLES
Accounting 2.59 0.82
TEACHING
Teaching 11.27 12.14 15.21 19.17
Table 12: Employability by Course of Graduates across Different Sectors
Figure 9: Employability by Course of Graduates across Different Sectors
11
.27
12
.14 1
5.2
11
9.1
7
2.5
9
10
.57 12
.75
14
.65
20
.11
15
.82 18
.37
23
.10
25
.11
12
.95
3.1
61
.90
2.1
02
.313.6
32
.66
2.3
1 3.5
9
15
.87 18
.48
22
.43
27
.04
8.9
17
.85 8
.76
12
.72
10
.70 12
.85
14
.34
20
.13
30
25
20
15
10
5
0
Sale
s and B
usiness
Deve
lopm
ent
Operatio
ns/Custo
mer S
ervice
Cleric
al/S
ecreta
rial r
ules
Analys
t
IT Se
rvice
s*
ITes a
nd BPO
IT O
peratio
ns
Accountin
g*
Teac
hing
Corpora
te C
omm
unicatio
n/
Content D
evelo
pment
Emp
loya
bili
ty P
erc
en
tage
ANALYTICS AND COMMUNICATION
IT AND ITeS INDUSTRY
ACCOUNTING ROLES
TEACHINGBUSINESS
FUNCTIONS
Art Commerce Management Science
Sectors/Roles
Aspiring Minds’ National Employability Report-Graduates 2013 25
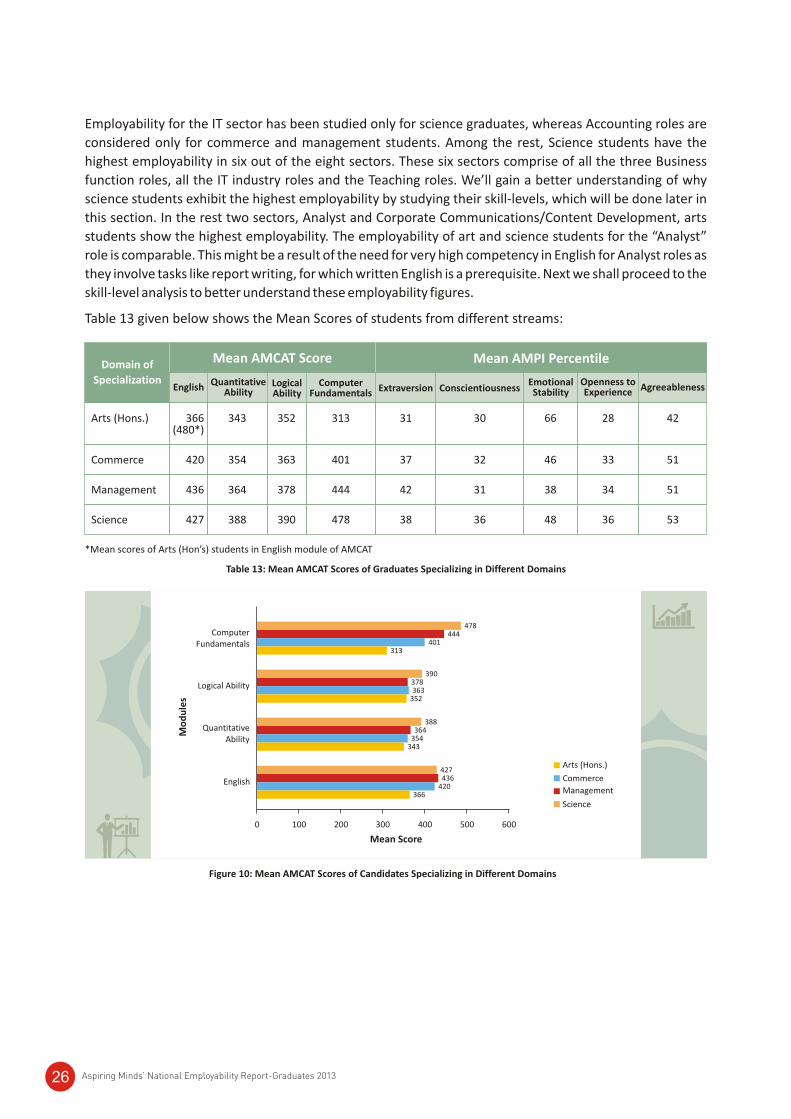
Table 13: Mean AMCAT Scores of Graduates Specializing in Different Domains
Employability for the IT sector has been studied only for science graduates, whereas Accounting roles are
considered only for commerce and management students. Among the rest, Science students have the
highest employability in six out of the eight sectors. These six sectors comprise of all the three Business
function roles, all the IT industry roles and the Teaching roles. We’ll gain a better understanding of why
science students exhibit the highest employability by studying their skill-levels, which will be done later in
this section. In the rest two sectors, Analyst and Corporate Communications/Content Development, arts
students show the highest employability. The employability of art and science students for the “Analyst”
role is comparable. This might be a result of the need for very high competency in English for Analyst roles as
they involve tasks like report writing, for which written English is a prerequisite. Next we shall proceed to the
skill-level analysis to better understand these employability figures.
Table 13 given below shows the Mean Scores of students from different streams:
Mean AMCAT Score Mean AMPI PercentileDomain of
Specialization
Arts (Hons.) 366 343 352 313 31 30 66 28 42(480*)
Commerce 420 354 363 401 37 32 46 33 51
Management 436 364 378 444 42 31 38 34 51
Science 427 388 390 478 38 36 48 36 53
English QuantitativeAbility
LogicalAbility
ComputerFundamentals Extraversion Conscientiousness
EmotionalStability
Openness toExperience Agreeableness
*Mean scores of Arts (Hon’s) students in English module of AMCAT
Figure 10: Mean AMCAT Scores of Candidates Specializing in Different Domains
Mean Score
Arts (Hons.)
Commerce
Management
Science
0 100 200 400 500 600300
English
Quantitative Ability
Logical Ability
Computer Fundamentals
Mo
du
les
366420436427
343354364
388
352363378
390
313401
444478
Aspiring Minds’ National Employability Report-Graduates 201326
In all the modules, Science > Management > Commerce > Arts, with the only exception being the English
module where management students scored better than Science students. However, the skill-gap in English
between different courses (Arts being an exception) is narrow. More important, the Arts students have the
lowest scores in English which is surprising considering the extensive reading and writing undertakings
involved in their curriculum. Further probe into this anomalous result reveals that there exists a very wide
skill-gap within the Arts field itself, with the Honors students having a mean score of 480 AMCAT points –
almost 80 AMCAT points higher than the standard Arts course students. The comparatively good
performance of science students in all other cognitive modules could be attributed to self-selection or the
amount of mathematics and analysis involved in their curriculum. The science students are closely followed
by the management students, with commerce and arts lagging behind.
It must also be observed that the computer fundamentals score of science students is remarkably higher
than the mean scores of management, commerce and arts students, which is understandable – once again,
owing to the kind of computer-exposure the science courses offer, especially B.Sc (IT) and other computer
science courses. But a serious concern that emerges from the analysis is the significantly lower computer
fundamental scores of arts students as compared to the commerce and management students. This is a
huge concern, since use of computers these days is prevalent not only in the fields of computer science,
accounting, and management but also in areas such as content writing and journalism – fields primarily
employing arts students. Therefore this gap needs to be bridged at the school level itself, or at least (and
latest) at the graduation level.
Our skill-gap analysis is in agreement with our employability analysis. The highest employability exhibited
by the science graduates in six out of the eight sectors can be explained by their higher scores in three out of
four modules. The trend observed in employability-gap – science (highest), followed by management,
commerce and then arts – is reflected in the skill-gap analysis too – science, followed by management,
commerce and arts. One disagreement that stems out of these two analyses is the higher employability of
arts students in Analyst and Corporate Communications/Content Development roles (both English-
intensive functions) despite having the lowest scores in English. Further probes revealed that 90% of the
total pool of arts students employable in these two sectors comprised of B.A (Hons.) students who clearly
have the highest scores in English than any other course’s students.
Aspiring Minds’ National Employability Report-Graduates 2013 27
5For a study dealing with employability, it is crucial to compare the colleges across the nation since it’s very
well known that the quality of intake, education and outcomes varies dramatically across thousands of
campuses in India. It will be very intriguing to examine the trend of this variation. Are these colleges,
imparting non-professional degrees, have the similar quality, with few outliers, or is there significantly large
variance amongst them? This section makes an in-depth study of employability in numerous colleges across
the country. The employability of each college for the various functions across sectors has been arranged in
order of its rank.
a. Accounting
EMPLOYABILITY BY CAMPUS QUALITY
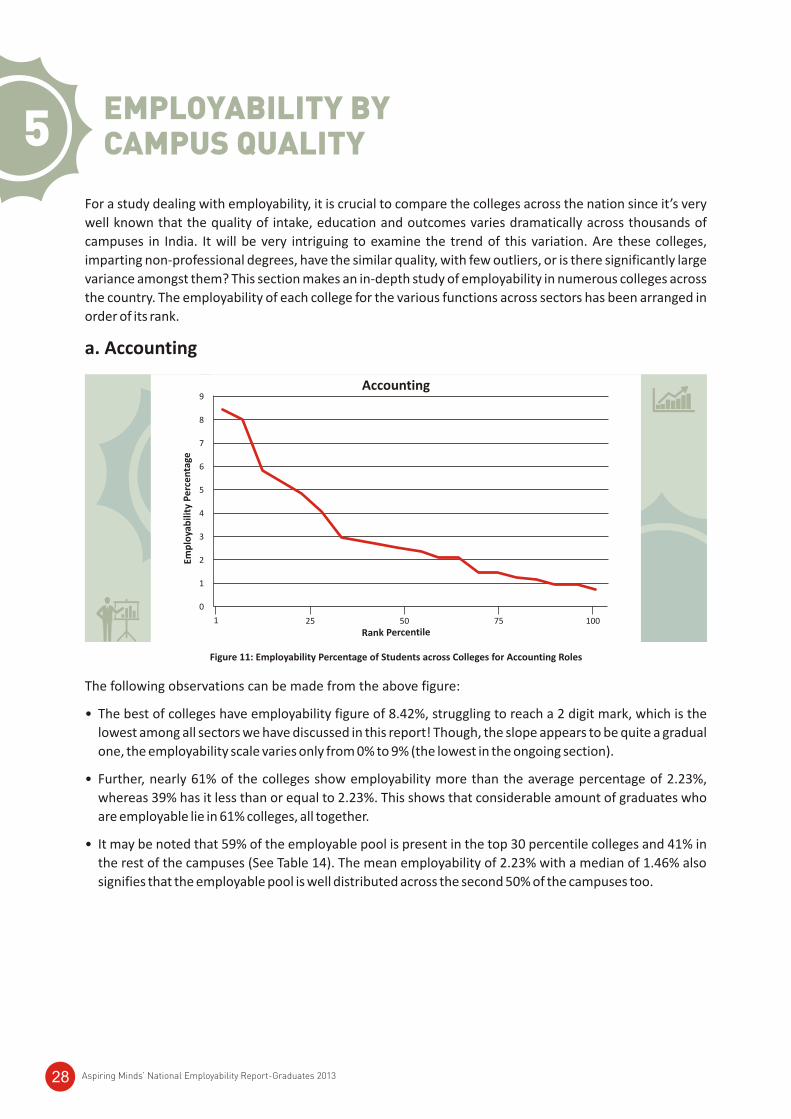
Figure 11: Employability Percentage of Students across Colleges for Accounting Roles
The following observations can be made from the above figure:
• The best of colleges have employability figure of 8.42%, struggling to reach a 2 digit mark, which is the
lowest among all sectors we have discussed in this report! Though, the slope appears to be quite a gradual
one, the employability scale varies only from 0% to 9% (the lowest in the ongoing section).
• Further, nearly 61% of the colleges show employability more than the average percentage of 2.23%,
whereas 39% has it less than or equal to 2.23%. This shows that considerable amount of graduates who
are employable lie in 61% colleges, all together.
• It may be noted that 59% of the employable pool is present in the top 30 percentile colleges and 41% in
the rest of the campuses (See Table 14). The mean employability of 2.23% with a median of 1.46% also
signifies that the employable pool is well distributed across the second 50% of the campuses too.
Aspiring Minds’ National Employability Report-Graduates 201328
Accounting
1 50 7525 100
0
1
2
3
4
5
6
7
8
9
Emp
loya
bili
ty P
erc
en
tage
Rank Percentile
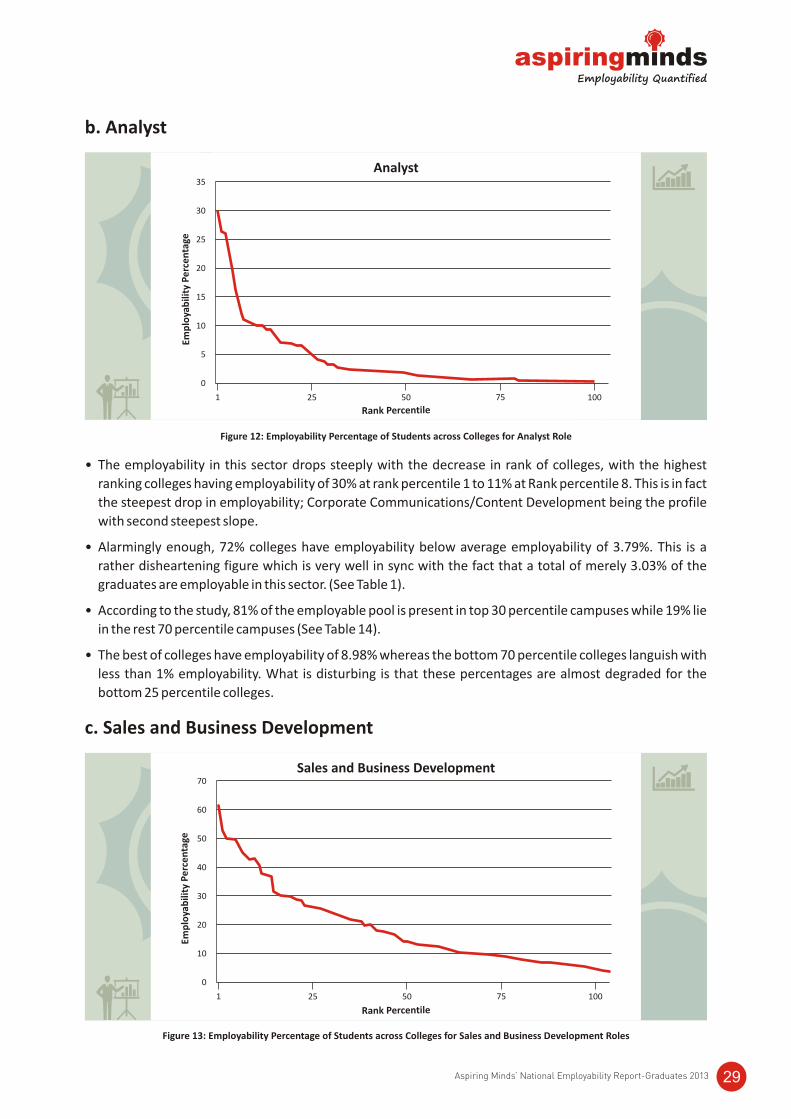
Figure 12: Employability Percentage of Students across Colleges for Analyst Role
b. Analyst
• The employability in this sector drops steeply with the decrease in rank of colleges, with the highest
ranking colleges having employability of 30% at rank percentile 1 to 11% at Rank percentile 8. This is in fact
the steepest drop in employability; Corporate Communications/Content Development being the profile
with second steepest slope.
• Alarmingly enough, 72% colleges have employability below average employability of 3.79%. This is a
rather disheartening figure which is very well in sync with the fact that a total of merely 3.03% of the
graduates are employable in this sector. (See Table 1).
• According to the study, 81% of the employable pool is present in top 30 percentile campuses while 19% lie
in the rest 70 percentile campuses (See Table 14).
• The best of colleges have employability of 8.98% whereas the bottom 70 percentile colleges languish with
less than 1% employability. What is disturbing is that these percentages are almost degraded for the
bottom 25 percentile colleges.
c. Sales and Business Development
Figure 13: Employability Percentage of Students across Colleges for Sales and Business Development Roles
Aspiring Minds’ National Employability Report-Graduates 2013 29
Analyst
Rank Percentile1 50 7525 100
0
5
10
15
20
25
30
35Em
plo
yab
ility
Pe
rce
nta
ge
Sales and Business Development
Rank Percentile
1 50 7525 100
0
10
20
30
40
50
60
70
Emp
loya
bili
ty P
erc
en
tage
• The trend in this sector is somewhat appeasing than the Analyst roles. The only difference is that here, the
employability is as high as 61.29% in the top most colleges, the highest among all sectors, which drops to
23.86% at Rank 30 which makes it even more significant.
• Nearly 60% colleges have employability less than the average figure of 18.63%. This is a pressing problem,
since there is a wider requirement for this profile in organizations cutting across sectors. Hence this calls
for immediate academic redressal.
• In the top 30 percentile colleges, lie 53% of the employable pool, while a significant 47% lie in the bottom
70% pool, remaining invisible to companies hiring students only from the top 30 percentile campuses (See
Table 14).
d. IT Services
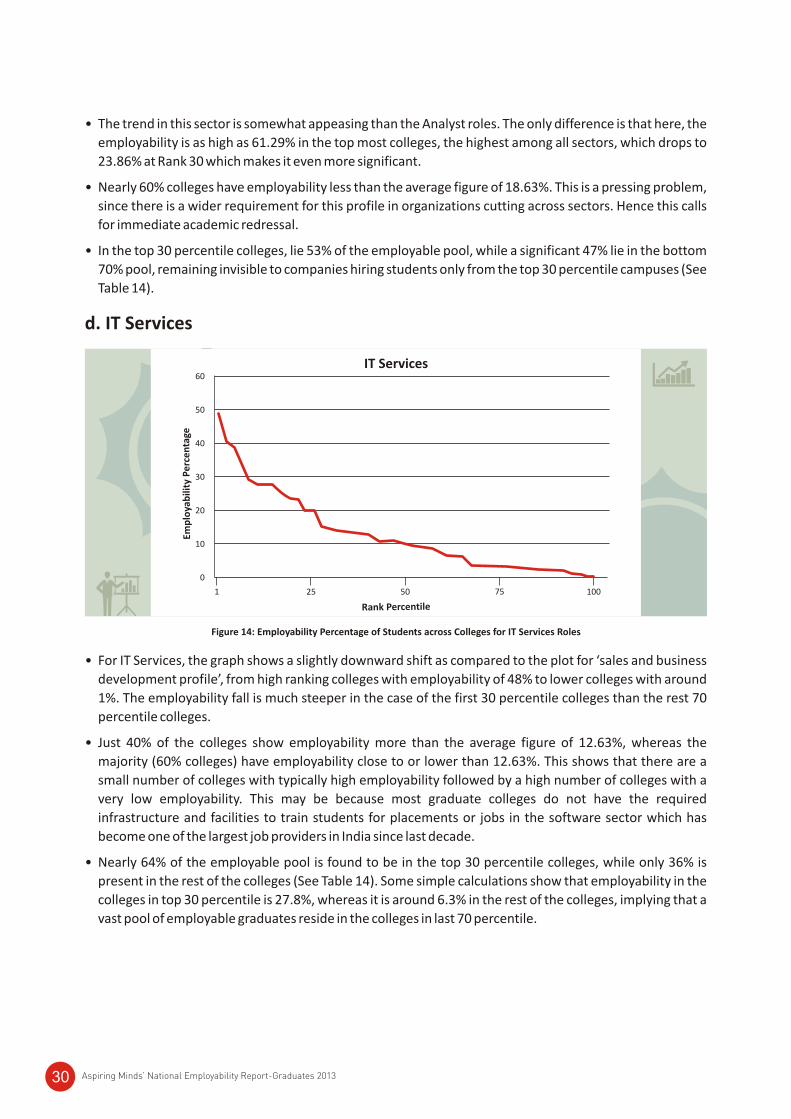
Figure 14: Employability Percentage of Students across Colleges for IT Services Roles
• For IT Services, the graph shows a slightly downward shift as compared to the plot for ‘sales and business
development profile’, from high ranking colleges with employability of 48% to lower colleges with around
1%. The employability fall is much steeper in the case of the first 30 percentile colleges than the rest 70
percentile colleges.
• Just 40% of the colleges show employability more than the average figure of 12.63%, whereas the
majority (60% colleges) have employability close to or lower than 12.63%. This shows that there are a
small number of colleges with typically high employability followed by a high number of colleges with a
very low employability. This may be because most graduate colleges do not have the required
infrastructure and facilities to train students for placements or jobs in the software sector which has
become one of the largest job providers in India since last decade.
• Nearly 64% of the employable pool is found to be in the top 30 percentile colleges, while only 36% is
present in the rest of the colleges (See Table 14). Some simple calculations show that employability in the
colleges in top 30 percentile is 27.8%, whereas it is around 6.3% in the rest of the colleges, implying that a
vast pool of employable graduates reside in the colleges in last 70 percentile.
Aspiring Minds’ National Employability Report-Graduates 201330
IT Services
1 50 7525 100
0
10
20
30
40
50
60
Emp
loya
bili
ty P
erc
en
tage
Rank Percentile
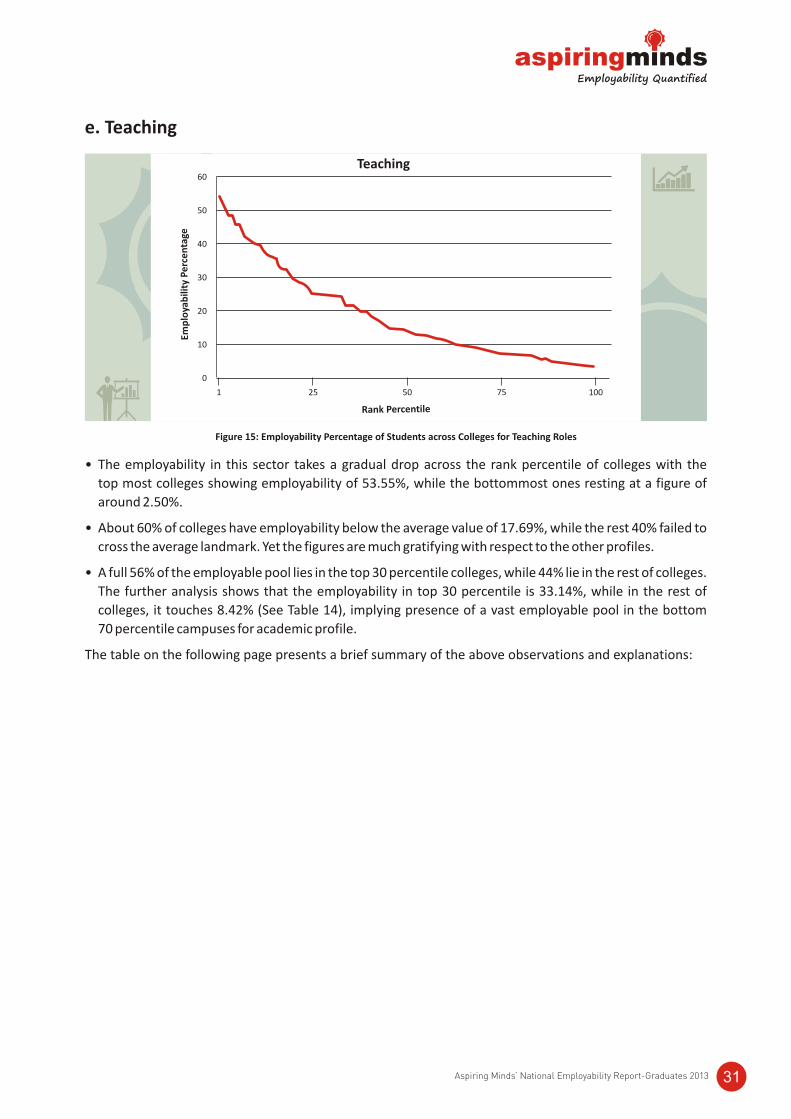
Figure 15: Employability Percentage of Students across Colleges for Teaching Roles
e. Teaching
• The employability in this sector takes a gradual drop across the rank percentile of colleges with the
top most colleges showing employability of 53.55%, while the bottommost ones resting at a figure of
around 2.50%.
• About 60% of colleges have employability below the average value of 17.69%, while the rest 40% failed to
cross the average landmark. Yet the figures are much gratifying with respect to the other profiles.
• A full 56% of the employable pool lies in the top 30 percentile colleges, while 44% lie in the rest of colleges.
The further analysis shows that the employability in top 30 percentile is 33.14%, while in the rest of
colleges, it touches 8.42% (See Table 14), implying presence of a vast employable pool in the bottom
70 percentile campuses for academic profile.
The table on the following page presents a brief summary of the above observations and explanations:
Aspiring Minds’ National Employability Report-Graduates 2013 31
Teaching
1 50 7525 100
0
10
20
30
40
50
60Em
plo
yab
ility
Pe
rce
nta
ge
Rank Percentile
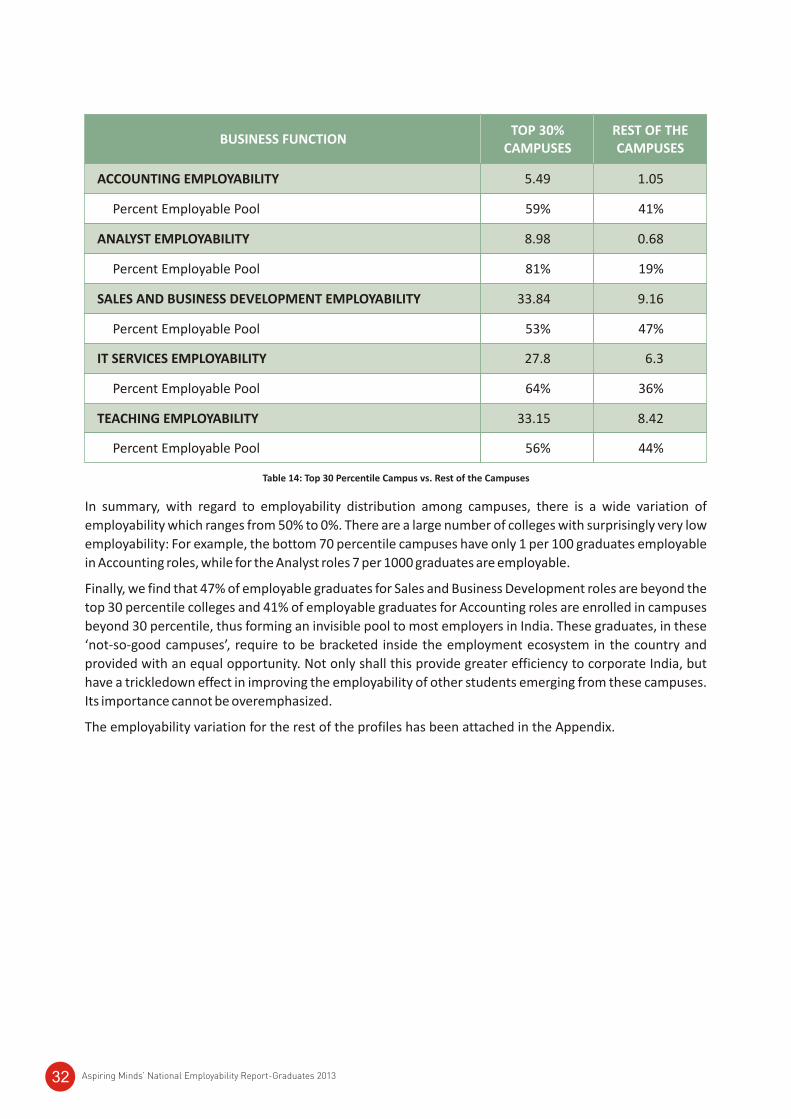
Table 14: Top 30 Percentile Campus vs. Rest of the Campuses
In summary, with regard to employability distribution among campuses, there is a wide variation of
employability which ranges from 50% to 0%. There are a large number of colleges with surprisingly very low
employability: For example, the bottom 70 percentile campuses have only 1 per 100 graduates employable
in Accounting roles, while for the Analyst roles 7 per 1000 graduates are employable.
Finally, we find that 47% of employable graduates for Sales and Business Development roles are beyond the
top 30 percentile colleges and 41% of employable graduates for Accounting roles are enrolled in campuses
beyond 30 percentile, thus forming an invisible pool to most employers in India. These graduates, in these
‘not-so-good campuses’, require to be bracketed inside the employment ecosystem in the country and
provided with an equal opportunity. Not only shall this provide greater efficiency to corporate India, but
have a trickledown effect in improving the employability of other students emerging from these campuses.
Its importance cannot be overemphasized.
The employability variation for the rest of the profiles has been attached in the Appendix.
TOP 30% REST OF THECAMPUSES CAMPUSES
ACCOUNTING EMPLOYABILITY 5.49 1.05
Percent Employable Pool 59% 41%
ANALYST EMPLOYABILITY 8.98 0.68
Percent Employable Pool 81% 19%
SALES AND BUSINESS DEVELOPMENT EMPLOYABILITY 33.84 9.16
Percent Employable Pool 53% 47%
IT SERVICES EMPLOYABILITY 27.8 6.3
Percent Employable Pool 64% 36%
TEACHING EMPLOYABILITY 33.15 8.42
Percent Employable Pool 56% 44%
BUSINESS FUNCTION
Aspiring Minds’ National Employability Report-Graduates 201332
6This section attempts to gain insights into the learning levels of the non-professional graduates in two
important functional skills: Computer Fundamentals and Finance & Accounting. We ended up selecting
these two subjects to analyze the learning levels of the graduates after taking a few major points into
consideration. First, the knowledge of Computer Fundamentals is indispensable irrespective of the streams
or domains of graduation because in every field of employment, the use of computers has become
inevitable today. Second, we wanted to analyze the learning levels of graduates in any specialized domain of
graduation, which is taught during the course of study and also important for employability. This helps audit
how are the learning levels in a subject being delivered for several decades in the Indian education system.
Has it been efficient?
a. Computer Fundamental: Learning Levels
This section intends to understand the knowledge level of graduates in the “Computer Fundamentals”
module. Based on the percentage graduates who correctly answered questions of varying difficulty in the
module, we attempt to understand certain important aspects such as:
• What percentage of graduates are strong in fundamental computer knowledge?
• What percentage of graduates face difficulty in answering direct concept based questions?
• What percentage of graduates are proficient in basics and how many can apply them to a real-world
problem?
To answer these questions, we analyze the responses of graduates to questions, each pertaining to different
levels of difficulty and concepts of computers. The questions are selected on the basis of different skill levels
they test. They are divided under two categories, ‘Basics of computer usage’ and ‘Basics of hardware and
debugging’, keeping in mind that they shall have to use computers in their work places on a regular basis due
to rapid rate of computerization.
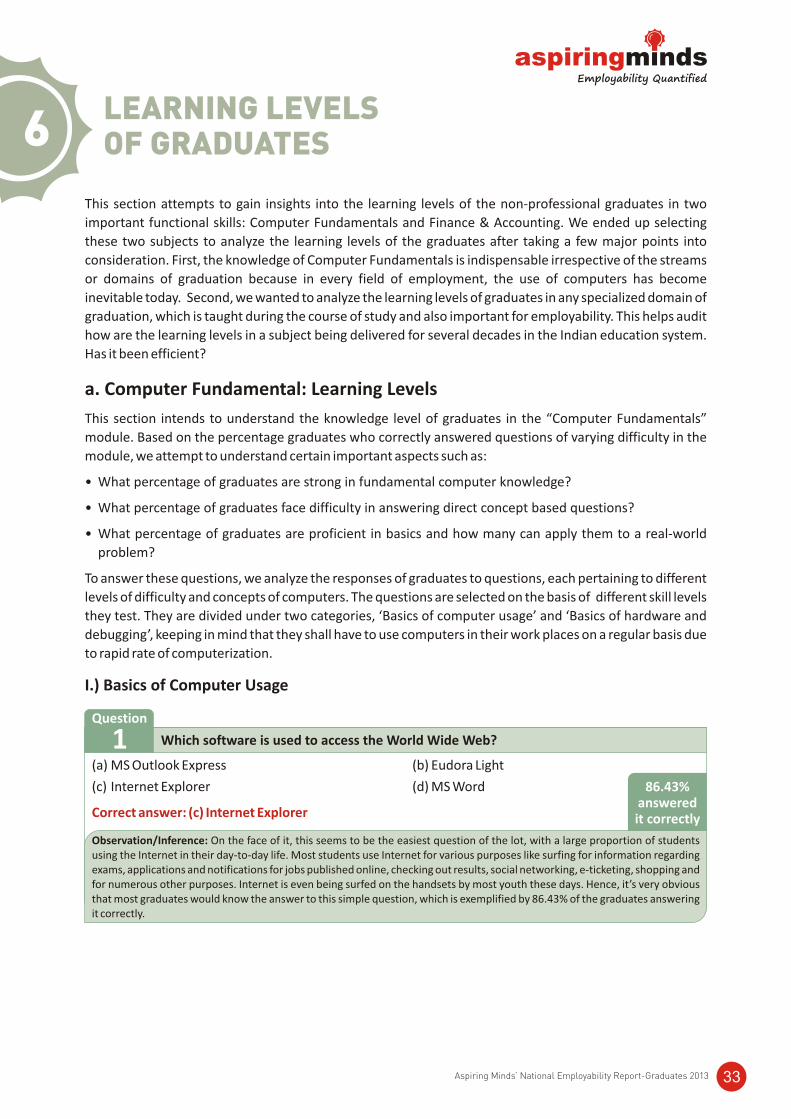
I.) Basics of Computer Usage
LEARNING LEVELS OF GRADUATES
86.43% answered it correctly
Which software is used to access the World Wide Web?
(a) MS Outlook Express (b) Eudora Light
(c) Internet Explorer (d) MS Word
Correct answer: (c) Internet Explorer
Question
1
Observation/Inference: On the face of it, this seems to be the easiest question of the lot, with a large proportion of students using the Internet in their day-to-day life. Most students use Internet for various purposes like surfing for information regarding exams, applications and notifications for jobs published online, checking out results, social networking, e-ticketing, shopping and for numerous other purposes. Internet is even being surfed on the handsets by most youth these days. Hence, it’s very obvious that most graduates would know the answer to this simple question, which is exemplified by 86.43% of the graduates answering it correctly.
Aspiring Minds’ National Employability Report-Graduates 2013 33
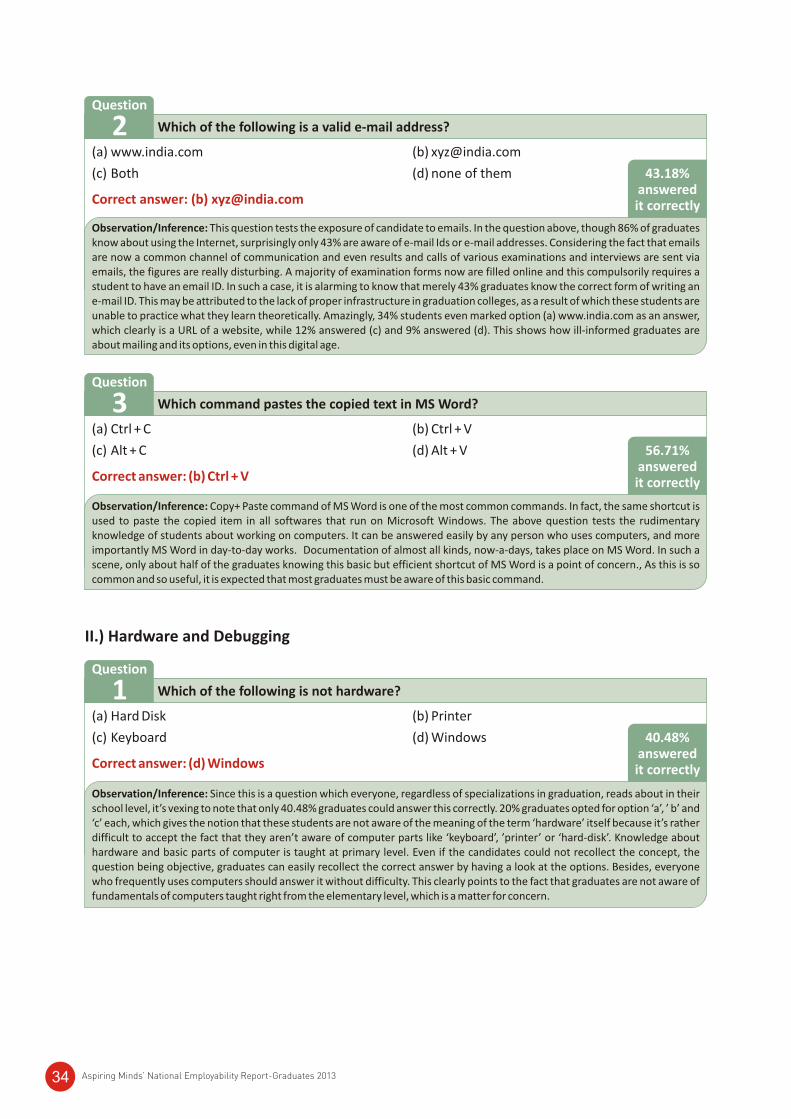
43.18% answered it correctly
Which of the following is a valid e-mail address?
(a) www.india.com (b) [email protected]
(c) Both (d) none of them
Correct answer: (b) [email protected]
Question
2
Observation/Inference: This question tests the exposure of candidate to emails. In the question above, though 86% of graduates know about using the Internet, surprisingly only 43% are aware of e-mail Ids or e-mail addresses. Considering the fact that emails are now a common channel of communication and even results and calls of various examinations and interviews are sent via emails, the figures are really disturbing. A majority of examination forms now are filled online and this compulsorily requires a student to have an email ID. In such a case, it is alarming to know that merely 43% graduates know the correct form of writing an e-mail ID. This may be attributed to the lack of proper infrastructure in graduation colleges, as a result of which these students are unable to practice what they learn theoretically. Amazingly, 34% students even marked option (a) www.india.com as an answer, which clearly is a URL of a website, while 12% answered (c) and 9% answered (d). This shows how ill-informed graduates are about mailing and its options, even in this digital age.
56.71% answered it correctly
Which command pastes the copied text in MS Word?
(a) Ctrl + C (b) Ctrl + V
(c) Alt + C (d) Alt + V
Correct answer: (b) Ctrl + V
Question
3
Observation/Inference: Copy+ Paste command of MS Word is one of the most common commands. In fact, the same shortcut is used to paste the copied item in all softwares that run on Microsoft Windows. The above question tests the rudimentary knowledge of students about working on computers. It can be answered easily by any person who uses computers, and more importantly MS Word in day-to-day works. Documentation of almost all kinds, now-a-days, takes place on MS Word. In such a scene, only about half of the graduates knowing this basic but efficient shortcut of MS Word is a point of concern., As this is so common and so useful, it is expected that most graduates must be aware of this basic command.
II.) Hardware and Debugging
40.48% answered it correctly
Which of the following is not hardware?
(a) Hard Disk (b) Printer
(c) Keyboard (d) Windows
Correct answer: (d) Windows
Question
1
Observation/Inference: Since this is a question which everyone, regardless of specializations in graduation, reads about in their school level, it’s vexing to note that only 40.48% graduates could answer this correctly. 20% graduates opted for option ‘a’, ’ b’ and ‘c’ each, which gives the notion that these students are not aware of the meaning of the term ‘hardware’ itself because it’s rather difficult to accept the fact that they aren’t aware of computer parts like ‘keyboard’, ’printer’ or ‘hard-disk’. Knowledge about hardware and basic parts of computer is taught at primary level. Even if the candidates could not recollect the concept, the question being objective, graduates can easily recollect the correct answer by having a look at the options. Besides, everyone who frequently uses computers should answer it without difficulty. This clearly points to the fact that graduates are not aware of fundamentals of computers taught right from the elementary level, which is a matter for concern.
Aspiring Minds’ National Employability Report-Graduates 201334
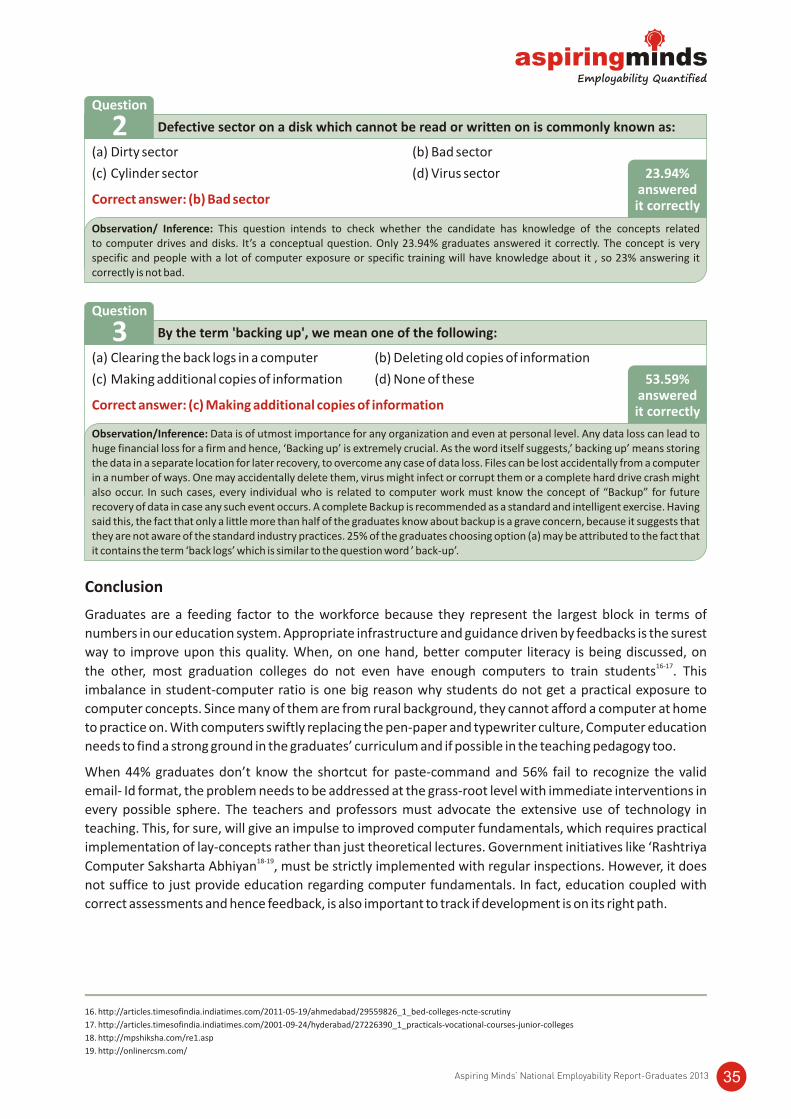
23.94% answered it correctly
Defective sector on a disk which cannot be read or written on is commonly known as:
(a) Dirty sector (b) Bad sector
(c) Cylinder sector (d) Virus sector
Correct answer: (b) Bad sector
Question
2
Observation/ Inference: This question intends to check whether the candidate has knowledge of the concepts related to computer drives and disks. It’s a conceptual question. Only 23.94% graduates answered it correctly. The concept is very specific and people with a lot of computer exposure or specific training will have knowledge about it , so 23% answering it correctly is not bad.
53.59% answered it correctly
By the term 'backing up', we mean one of the following:
(a) Clearing the back logs in a computer (b) Deleting old copies of information
(c) Making additional copies of information (d) None of these
Correct answer: (c) Making additional copies of information
Question
3
Observation/Inference: Data is of utmost importance for any organization and even at personal level. Any data loss can lead to huge financial loss for a firm and hence, ‘Backing up’ is extremely crucial. As the word itself suggests,’ backing up’ means storing the data in a separate location for later recovery, to overcome any case of data loss. Files can be lost accidentally from a computer in a number of ways. One may accidentally delete them, virus might infect or corrupt them or a complete hard drive crash might also occur. In such cases, every individual who is related to computer work must know the concept of “Backup” for future recovery of data in case any such event occurs. A complete Backup is recommended as a standard and intelligent exercise. Having said this, the fact that only a little more than half of the graduates know about backup is a grave concern, because it suggests that they are not aware of the standard industry practices. 25% of the graduates choosing option (a) may be attributed to the fact that it contains the term ‘back logs’ which is similar to the question word ’ back-up’.
Conclusion
Graduates are a feeding factor to the workforce because they represent the largest block in terms of
numbers in our education system. Appropriate infrastructure and guidance driven by feedbacks is the surest
way to improve upon this quality. When, on one hand, better computer literacy is being discussed, on 16-17
the other, most graduation colleges do not even have enough computers to train students . This
imbalance in student-computer ratio is one big reason why students do not get a practical exposure to
computer concepts. Since many of them are from rural background, they cannot afford a computer at home
to practice on. With computers swiftly replacing the pen-paper and typewriter culture, Computer education
needs to find a strong ground in the graduates’ curriculum and if possible in the teaching pedagogy too.
When 44% graduates don’t know the shortcut for paste-command and 56% fail to recognize the valid
email- Id format, the problem needs to be addressed at the grass-root level with immediate interventions in
every possible sphere. The teachers and professors must advocate the extensive use of technology in
teaching. This, for sure, will give an impulse to improved computer fundamentals, which requires practical
implementation of lay-concepts rather than just theoretical lectures. Government initiatives like ‘Rashtriya 18-19
Computer Saksharta Abhiyan , must be strictly implemented with regular inspections. However, it does
not suffice to just provide education regarding computer fundamentals. In fact, education coupled with
correct assessments and hence feedback, is also important to track if development is on its right path.
16. http://articles.timesofindia.indiatimes.com/2011-05-19/ahmedabad/29559826_1_bed-colleges-ncte-scrutiny
17. http://articles.timesofindia.indiatimes.com/2001-09-24/hyderabad/27226390_1_practicals-vocational-courses-junior-colleges
18. http://mpshiksha.com/re1.asp
19. http://onlinercsm.com/
Aspiring Minds’ National Employability Report-Graduates 2013 35
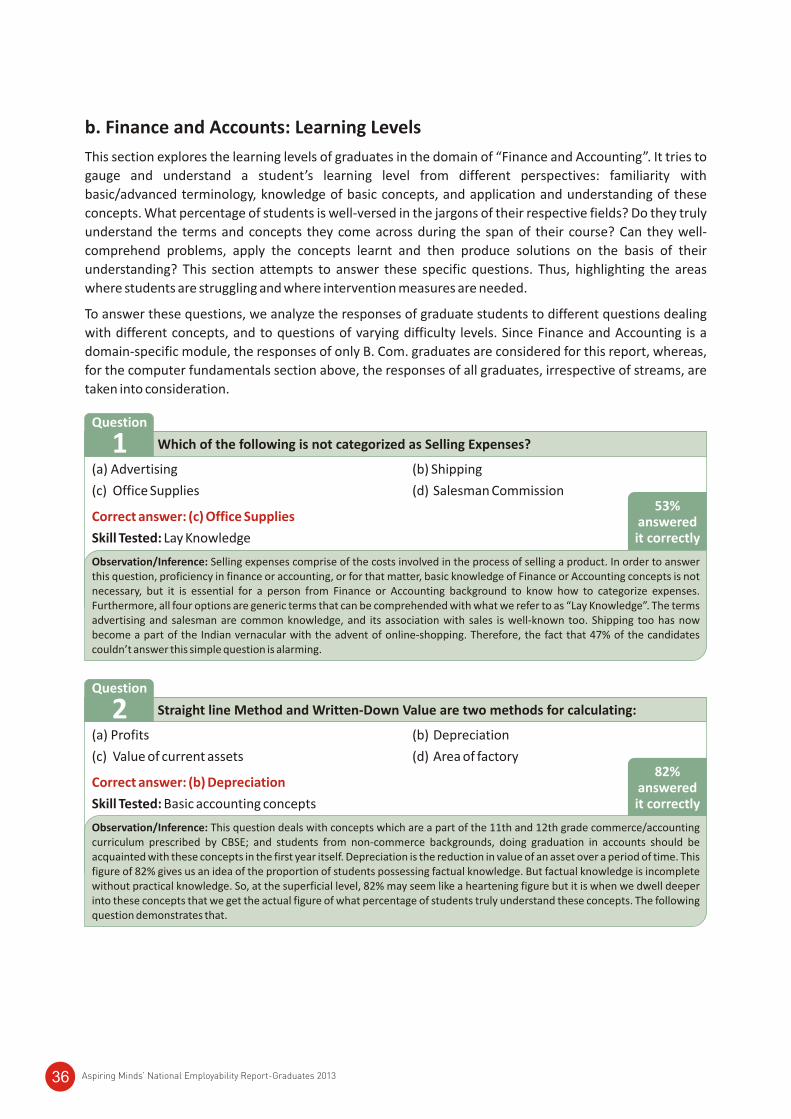
b. Finance and Accounts: Learning Levels
This section explores the learning levels of graduates in the domain of “Finance and Accounting”. It tries to
gauge and understand a student’s learning level from different perspectives: familiarity with
basic/advanced terminology, knowledge of basic concepts, and application and understanding of these
concepts. What percentage of students is well-versed in the jargons of their respective fields? Do they truly
understand the terms and concepts they come across during the span of their course? Can they well-
comprehend problems, apply the concepts learnt and then produce solutions on the basis of their
understanding? This section attempts to answer these specific questions. Thus, highlighting the areas
where students are struggling and where intervention measures are needed.
To answer these questions, we analyze the responses of graduate students to different questions dealing
with different concepts, and to questions of varying difficulty levels. Since Finance and Accounting is a
domain-specific module, the responses of only B. Com. graduates are considered for this report, whereas,
for the computer fundamentals section above, the responses of all graduates, irrespective of streams, are
taken into consideration.
53% answered it correctly
Which of the following is not categorized as Selling Expenses?
(a) Advertising (b) Shipping
(c) Office Supplies (d) Salesman Commission
Skill Tested: Lay Knowledge
Correct answer: (c) Office Supplies
Question
1
Observation/Inference: Selling expenses comprise of the costs involved in the process of selling a product. In order to answer this question, proficiency in finance or accounting, or for that matter, basic knowledge of Finance or Accounting concepts is not necessary, but it is essential for a person from Finance or Accounting background to know how to categorize expenses. Furthermore, all four options are generic terms that can be comprehended with what we refer to as “Lay Knowledge”. The terms advertising and salesman are common knowledge, and its association with sales is well-known too. Shipping too has now become a part of the Indian vernacular with the advent of online-shopping. Therefore, the fact that 47% of the candidates couldn’t answer this simple question is alarming.
82% answered it correctly
Straight line Method and Written-Down Value are two methods for calculating:
(a) Profits (b) Depreciation
(c) Value of current assets (d) Area of factory
Skill Tested: Basic accounting concepts
Correct answer: (b) Depreciation
Question
2
Observation/Inference: This question deals with concepts which are a part of the 11th and 12th grade commerce/accounting curriculum prescribed by CBSE; and students from non-commerce backgrounds, doing graduation in accounts should be acquainted with these concepts in the first year itself. Depreciation is the reduction in value of an asset over a period of time. This figure of 82% gives us an idea of the proportion of students possessing factual knowledge. But factual knowledge is incomplete without practical knowledge. So, at the superficial level, 82% may seem like a heartening figure but it is when we dwell deeper into these concepts that we get the actual figure of what percentage of students truly understand these concepts. The following question demonstrates that.
Aspiring Minds’ National Employability Report-Graduates 201336
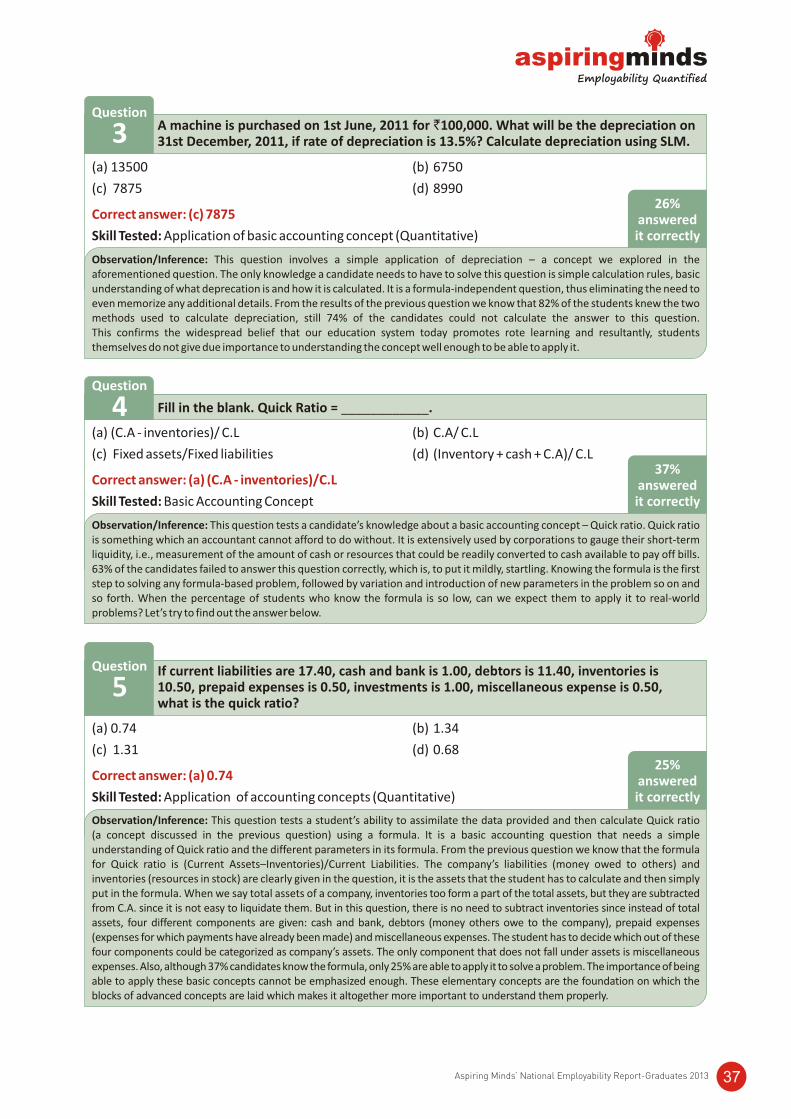
26% answered it correctly
A machine is purchased on 1st June, 2011 for `100,000. What will be the depreciation on 31st December, 2011, if rate of depreciation is 13.5%? Calculate depreciation using SLM.
(a) 13500 (b) 6750
(c) 7875 (d) 8990
Skill Tested: Application of basic accounting concept (Quantitative)
Correct answer: (c) 7875
Question
3
Observation/Inference: This question involves a simple application of depreciation – a concept we explored in the aforementioned question. The only knowledge a candidate needs to have to solve this question is simple calculation rules, basic understanding of what deprecation is and how it is calculated. It is a formula-independent question, thus eliminating the need to even memorize any additional details. From the results of the previous question we know that 82% of the students knew the two methods used to calculate depreciation, still 74% of the candidates could not calculate the answer to this question. This confirms the widespread belief that our education system today promotes rote learning and resultantly, students themselves do not give due importance to understanding the concept well enough to be able to apply it.
37% answered it correctly
Fill in the blank. Quick Ratio = ____________.
(a) (C.A - inventories)/ C.L (b) C.A/ C.L
(c) Fixed assets/Fixed liabilities (d) (Inventory + cash + C.A)/ C.L
Skill Tested: Basic Accounting Concept
Correct answer: (a) (C.A - inventories)/C.L
Question
4
Observation/Inference: This question tests a candidate’s knowledge about a basic accounting concept – Quick ratio. Quick ratio is something which an accountant cannot afford to do without. It is extensively used by corporations to gauge their short-term liquidity, i.e., measurement of the amount of cash or resources that could be readily converted to cash available to pay off bills. 63% of the candidates failed to answer this question correctly, which is, to put it mildly, startling. Knowing the formula is the first step to solving any formula-based problem, followed by variation and introduction of new parameters in the problem so on and so forth. When the percentage of students who know the formula is so low, can we expect them to apply it to real-world problems? Let’s try to find out the answer below.
25% answered it correctly
If current liabilities are 17.40, cash and bank is 1.00, debtors is 11.40, inventories is 10.50, prepaid expenses is 0.50, investments is 1.00, miscellaneous expense is 0.50, what is the quick ratio?
(a) 0.74 (b) 1.34
(c) 1.31 (d) 0.68
Skill Tested: Application of accounting concepts (Quantitative)
Correct answer: (a) 0.74
Question
5
Observation/Inference: This question tests a student’s ability to assimilate the data provided and then calculate Quick ratio (a concept discussed in the previous question) using a formula. It is a basic accounting question that needs a simple understanding of Quick ratio and the different parameters in its formula. From the previous question we know that the formula for Quick ratio is (Current Assets–Inventories)/Current Liabilities. The company’s liabilities (money owed to others) and inventories (resources in stock) are clearly given in the question, it is the assets that the student has to calculate and then simply put in the formula. When we say total assets of a company, inventories too form a part of the total assets, but they are subtracted from C.A. since it is not easy to liquidate them. But in this question, there is no need to subtract inventories since instead of total assets, four different components are given: cash and bank, debtors (money others owe to the company), prepaid expenses (expenses for which payments have already been made) and miscellaneous expenses. The student has to decide which out of these four components could be categorized as company’s assets. The only component that does not fall under assets is miscellaneous expenses. Also, although 37% candidates know the formula, only 25% are able to apply it to solve a problem. The importance of being able to apply these basic concepts cannot be emphasized enough. These elementary concepts are the foundation on which theblocks of advanced concepts are laid which makes it altogether more important to understand them properly.
Aspiring Minds’ National Employability Report-Graduates 2013 37
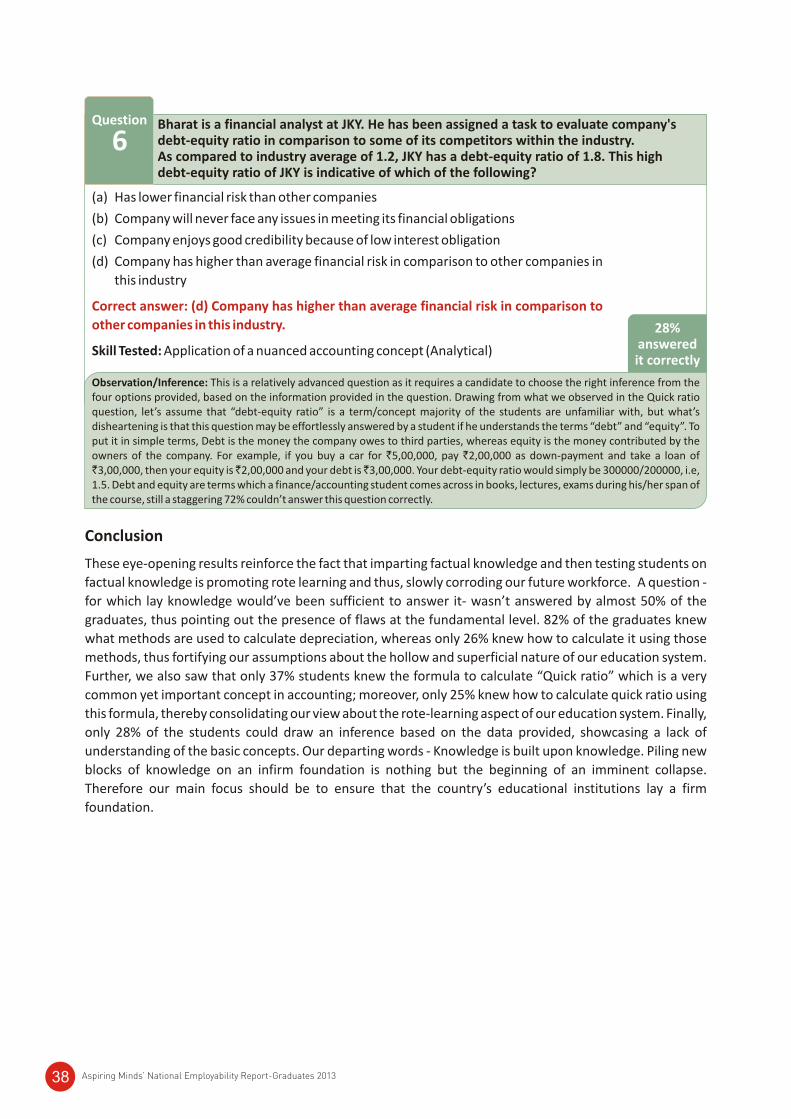
28% answered it correctly
Bharat is a financial analyst at JKY. He has been assigned a task to evaluate company's debt-equity ratio in comparison to some of its competitors within the industry. As compared to industry average of 1.2, JKY has a debt-equity ratio of 1.8. This high debt-equity ratio of JKY is indicative of which of the following?
Question
6
Observation/Inference: This is a relatively advanced question as it requires a candidate to choose the right inference from the four options provided, based on the information provided in the question. Drawing from what we observed in the Quick ratio question, let’s assume that “debt-equity ratio” is a term/concept majority of the students are unfamiliar with, but what’s disheartening is that this question may be effortlessly answered by a student if he understands the terms “debt” and “equity”. To put it in simple terms, Debt is the money the company owes to third parties, whereas equity is the money contributed by the owners of the company. For example, if you buy a car for `5,00,000, pay `2,00,000 as down-payment and take a loan of `3,00,000, then your equity is ̀ 2,00,000 and your debt is ̀ 3,00,000. Your debt-equity ratio would simply be 300000/200000, i.e, 1.5. Debt and equity are terms which a finance/accounting student comes across in books, lectures, exams during his/her span of the course, still a staggering 72% couldn’t answer this question correctly.
(a) Has lower financial risk than other companies
(b) Company will never face any issues in meeting its financial obligations
(c) Company enjoys good credibility because of low interest obligation
(d) Company has higher than average financial risk in comparison to other companies in
this industry
Skill Tested: Application of a nuanced accounting concept (Analytical)
Correct answer: (d) Company has higher than average financial risk in comparison to
other companies in this industry.
Conclusion
These eye-opening results reinforce the fact that imparting factual knowledge and then testing students on
factual knowledge is promoting rote learning and thus, slowly corroding our future workforce. A question -
for which lay knowledge would’ve been sufficient to answer it- wasn’t answered by almost 50% of the
graduates, thus pointing out the presence of flaws at the fundamental level. 82% of the graduates knew
what methods are used to calculate depreciation, whereas only 26% knew how to calculate it using those
methods, thus fortifying our assumptions about the hollow and superficial nature of our education system.
Further, we also saw that only 37% students knew the formula to calculate “Quick ratio” which is a very
common yet important concept in accounting; moreover, only 25% knew how to calculate quick ratio using
this formula, thereby consolidating our view about the rote-learning aspect of our education system. Finally,
only 28% of the students could draw an inference based on the data provided, showcasing a lack of
understanding of the basic concepts. Our departing words - Knowledge is built upon knowledge. Piling new
blocks of knowledge on an infirm foundation is nothing but the beginning of an imminent collapse.
Therefore our main focus should be to ensure that the country’s educational institutions lay a firm
foundation.
Aspiring Minds’ National Employability Report-Graduates 201338
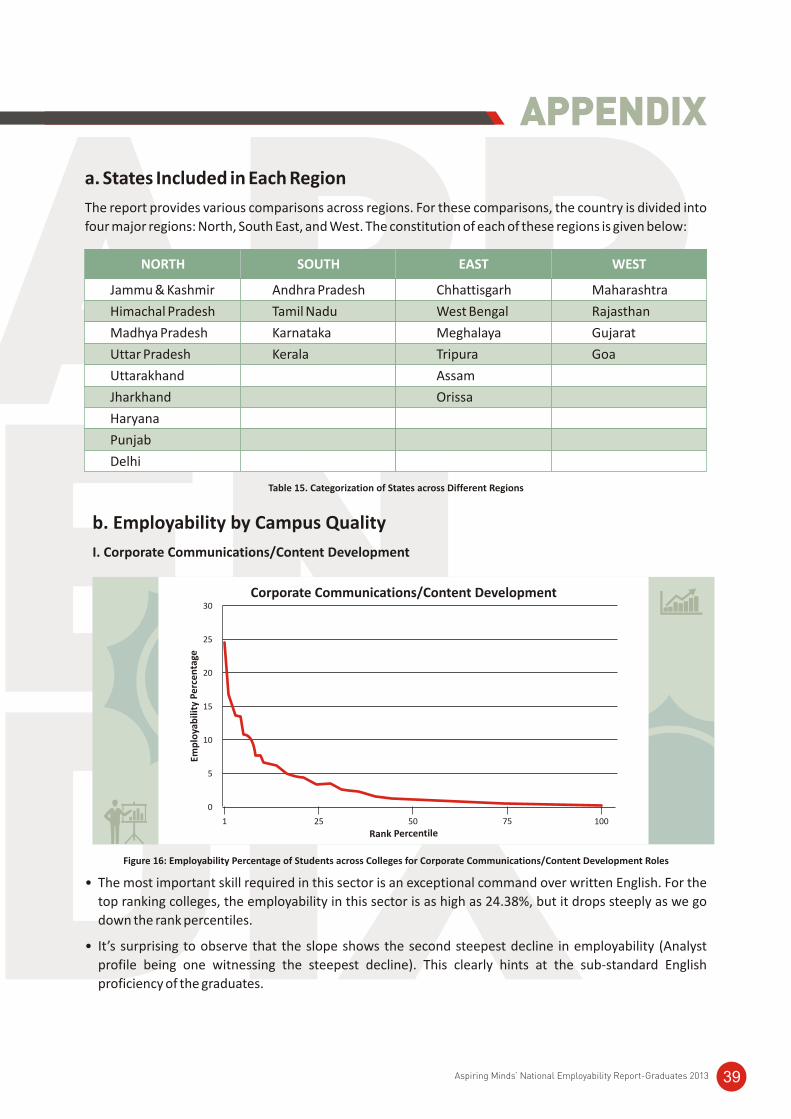
APPENDIX
APPENDIX
a. States Included in Each Region
The report provides various comparisons across regions. For these comparisons, the country is divided into
four major regions: North, South East, and West. The constitution of each of these regions is given below:
NORTH WESTSOUTH EAST
Jammu & Kashmir Andhra Pradesh Chhattisgarh Maharashtra
Himachal Pradesh Tamil Nadu West Bengal Rajasthan
Madhya Pradesh Karnataka Meghalaya Gujarat
Uttar Pradesh Kerala Tripura Goa
Uttarakhand Assam
Jharkhand Orissa
Haryana
Punjab
Delhi
Table 15. Categorization of States across Different Regions
b. Employability by Campus Quality
I. Corporate Communications/Content Development
Figure 16: Employability Percentage of Students across Colleges for Corporate Communications/Content Development Roles
• The most important skill required in this sector is an exceptional command over written English. For the
top ranking colleges, the employability in this sector is as high as 24.38%, but it drops steeply as we go
down the rank percentiles.
• It’s surprising to observe that the slope shows the second steepest decline in employability (Analyst
profile being one witnessing the steepest decline). This clearly hints at the sub-standard English
proficiency of the graduates.
Aspiring Minds’ National Employability Report-Graduates 2013 39
Corporate Communications/Content Development
1 50 7525 100
0
5
10
15
20
25
30
Emp
loya
bili
ty P
erc
en
tage
Rank Percentile
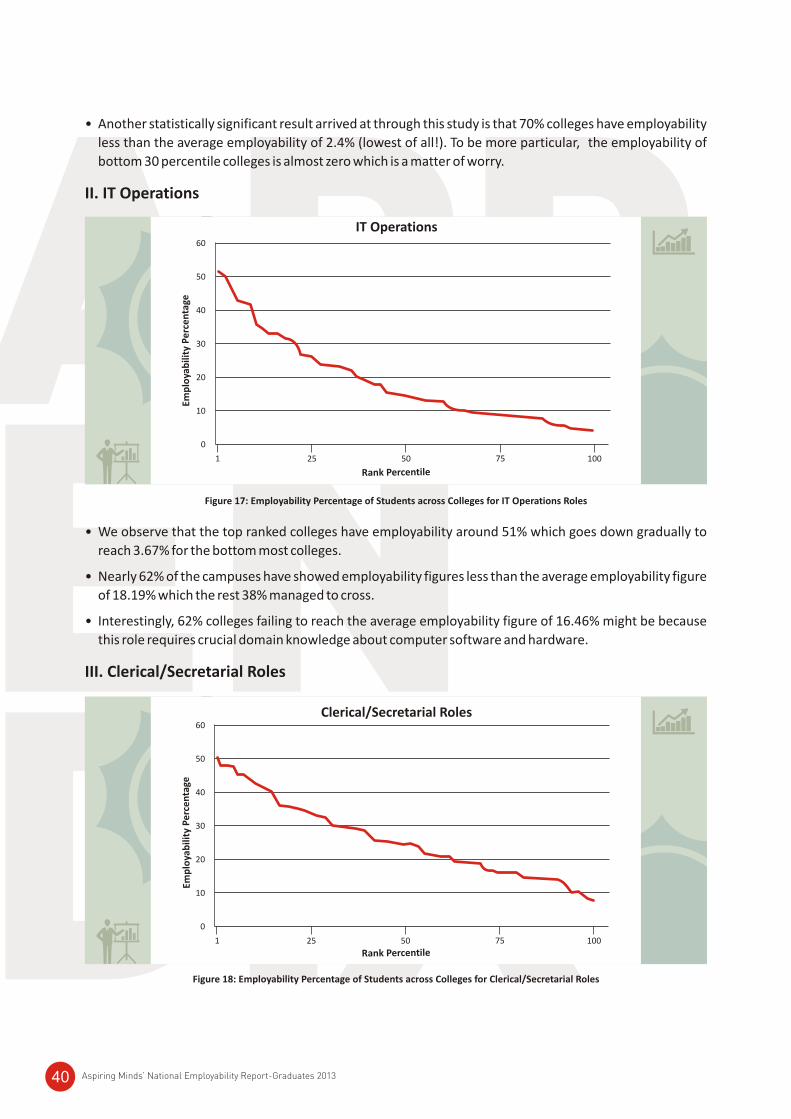
APPENDIX
• Another statistically significant result arrived at through this study is that 70% colleges have employability
less than the average employability of 2.4% (lowest of all!). To be more particular, the employability of
bottom 30 percentile colleges is almost zero which is a matter of worry.
II. IT Operations
Figure 17: Employability Percentage of Students across Colleges for IT Operations Roles
• We observe that the top ranked colleges have employability around 51% which goes down gradually to
reach 3.67% for the bottom most colleges.
• Nearly 62% of the campuses have showed employability figures less than the average employability figure
of 18.19% which the rest 38% managed to cross.
• Interestingly, 62% colleges failing to reach the average employability figure of 16.46% might be because
this role requires crucial domain knowledge about computer software and hardware.
III. Clerical/Secretarial Roles
Figure 18: Employability Percentage of Students across Colleges for Clerical/Secretarial Roles
Aspiring Minds’ National Employability Report-Graduates 201340
IT Operations
1 50 7525 100
0
10
20
30
40
50
60
Emp
loya
bili
ty P
erc
en
tage
Rank Percentile
Clerical/Secretarial Roles
Rank Percentile1 50 7525 100
10
20
30
40
50
60
0
Emp
loya
bili
ty P
erc
en
tage
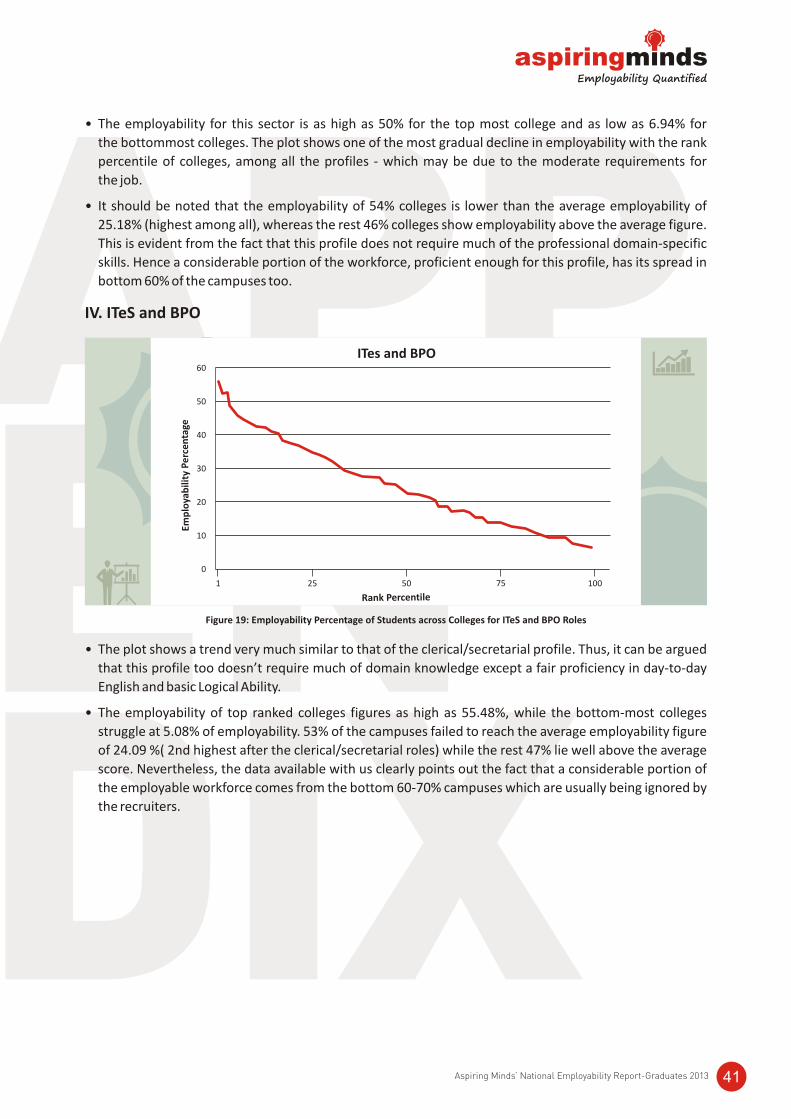
APPENDIX
• The employability for this sector is as high as 50% for the top most college and as low as 6.94% for
the bottommost colleges. The plot shows one of the most gradual decline in employability with the rank
percentile of colleges, among all the profiles - which may be due to the moderate requirements for
the job.
• It should be noted that the employability of 54% colleges is lower than the average employability of
25.18% (highest among all), whereas the rest 46% colleges show employability above the average figure.
This is evident from the fact that this profile does not require much of the professional domain-specific
skills. Hence a considerable portion of the workforce, proficient enough for this profile, has its spread in
bottom 60% of the campuses too.
IV. ITeS and BPO
Figure 19: Employability Percentage of Students across Colleges for ITeS and BPO Roles
• The plot shows a trend very much similar to that of the clerical/secretarial profile. Thus, it can be argued
that this profile too doesn’t require much of domain knowledge except a fair proficiency in day-to-day
English and basic Logical Ability.
• The employability of top ranked colleges figures as high as 55.48%, while the bottom-most colleges
struggle at 5.08% of employability. 53% of the campuses failed to reach the average employability figure
of 24.09 %( 2nd highest after the clerical/secretarial roles) while the rest 47% lie well above the average
score. Nevertheless, the data available with us clearly points out the fact that a considerable portion of
the employable workforce comes from the bottom 60-70% campuses which are usually being ignored by
the recruiters.
Aspiring Minds’ National Employability Report-Graduates 2013 41
ITes and BPO
Rank Percentile
1 50 7525 100
10
20
30
40
50
60
0
Emp
loya
bili
ty P
erc
en
tage
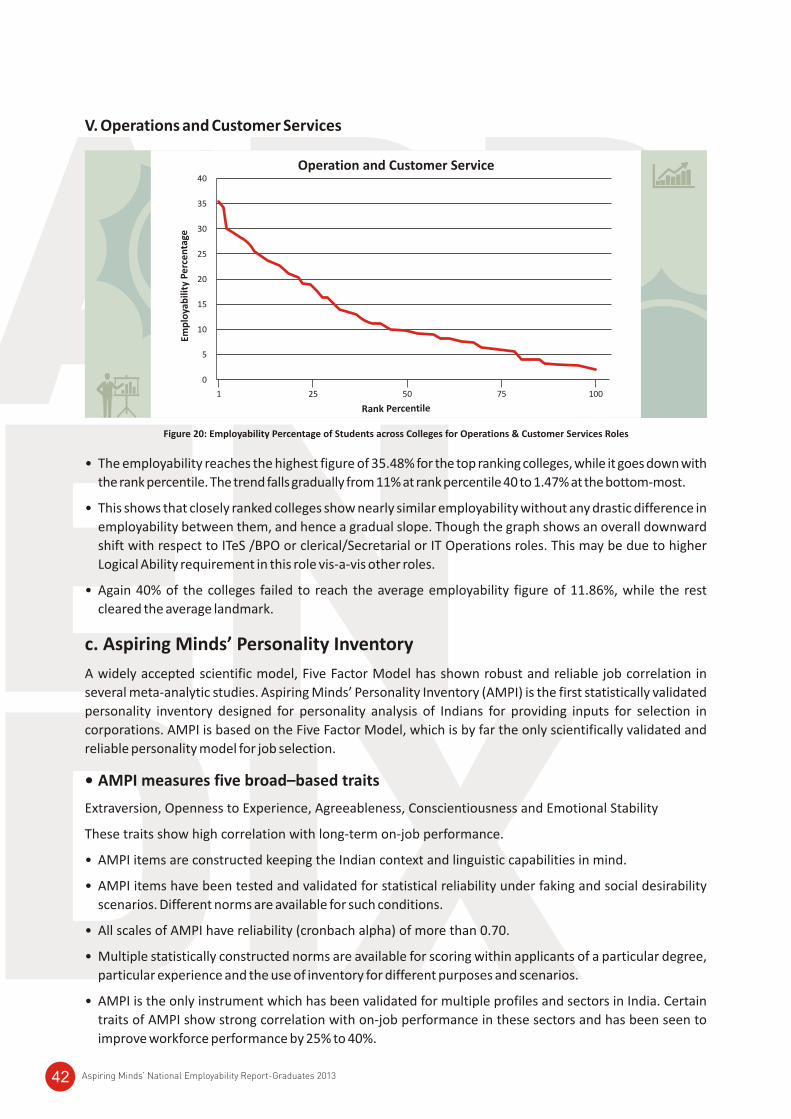
APPENDIX
• The employability reaches the highest figure of 35.48% for the top ranking colleges, while it goes down with
the rank percentile. The trend falls gradually from 11% at rank percentile 40 to 1.47% at the bottom-most.
• This shows that closely ranked colleges show nearly similar employability without any drastic difference in
employability between them, and hence a gradual slope. Though the graph shows an overall downward
shift with respect to ITeS /BPO or clerical/Secretarial or IT Operations roles. This may be due to higher
Logical Ability requirement in this role vis-a-vis other roles.
• Again 40% of the colleges failed to reach the average employability figure of 11.86%, while the rest
cleared the average landmark.
c. Aspiring Minds’ Personality Inventory
A widely accepted scientific model, Five Factor Model has shown robust and reliable job correlation in
several meta-analytic studies. Aspiring Minds’ Personality Inventory (AMPI) is the first statistically validated
personality inventory designed for personality analysis of Indians for providing inputs for selection in
corporations. AMPI is based on the Five Factor Model, which is by far the only scientifically validated and
reliable personality model for job selection.
• AMPI measures five broad–based traits
Extraversion, Openness to Experience, Agreeableness, Conscientiousness and Emotional Stability
These traits show high correlation with long-term on-job performance.
• AMPI items are constructed keeping the Indian context and linguistic capabilities in mind.
• AMPI items have been tested and validated for statistical reliability under faking and social desirability
scenarios. Different norms are available for such conditions.
• All scales of AMPI have reliability (cronbach alpha) of more than 0.70.
• Multiple statistically constructed norms are available for scoring within applicants of a particular degree,
particular experience and the use of inventory for different purposes and scenarios.
• AMPI is the only instrument which has been validated for multiple profiles and sectors in India. Certain
traits of AMPI show strong correlation with on-job performance in these sectors and has been seen to
improve workforce performance by 25% to 40%.
Figure 20: Employability Percentage of Students across Colleges for Operations & Customer Services Roles
V. Operations and Customer Services
Aspiring Minds’ National Employability Report-Graduates 201342
Operation and Customer Service
1 50 7525 100
0
10
15
20
25
30
35
40
5
Emp
loya
bili
ty P
erc
en
tage
Rank Percentile
APPENDIX
Major Traits Analyzed by AMPI
Sub Traits: Gregariousness, Assertiveness, Activity, Excitement Seeking, Positive Emotion
Trait Description
Extraversion, on the one hand, corresponds to sociability, i.e., people who have a liking for people and
gathering. Additionally, extraverts are talkative, active and assertive. They are excitement-seeking people.
Hogan, in 1986, interpreted extraversion as a trait having two major components, i.e., sociability and
ambition. Both intuitively and empirically, extraversion correlates to high performance in sales profiles and
other enterprising occupations.
Common Job Correlates
• Sales Job
• Enterprising Occupations
Sample Statements
• I really enjoy taking rides in amusement parks.
• I like to play games at parties.
Sub Traits: Competence, Order, Dutifulness, Achievement Striving, Self Discipline, Deliberation
Trait Description
According to some psychologists (e.g., Digman, 1989), Conscientiousness is ‘the Will to Achieve’. It is
generally seen to have two components: one is achievement striving and the other being dependability. The
latter is characterized by being thorough, organized, responsible and planful. The former is related to
volitional variables such as hardworking, persevering and being achievement oriented. From the point of
view of job success, conscientiousness emerges as the strongest and most consistent correlating trait.
Common Job Correlates
• All Jobs
Sample Statements
• I keep monthly account of the amount I spend.
• I like to follow strict schedules.
Sub Traits: Reassurance, Calm Friendliness, Cheerfulness, Self-confident, Deliberation, Invincibility
Trait Description
Emotional Stability is associated with traits such as calm, happy, proud, undisturbed and confident.
Emotionally stable people are even tempered and relaxed. They can face stressful situations without getting
upset.
Common Job Correlates
• Low Emotional Stability is an elimination criterion for most jobs
Sample Statements
• I am very stressed at times.
• I will walk out of a discussion, if I do not agree.
I. Extraversion (E)
II. Conscientiousness (C)
III. Emotional Stability (ES)
Aspiring Minds’ National Employability Report-Graduates 2013 43
APPENDIX
IV. Openness to Experience (OE)
V. Agreeableness (A)
Sub Traits: Ideas, Values, Actions, Feelings, Aesthetics, Fantasy
Trait Description
Openness to Experience is associated with being broad-minded, unconventional, having a rich artistic
sensitivity and being curious and imaginative. OE has been a trait hard to identify and has been called
intellect, culture or openness to experience by various psychometricians. An open person is creative, willing
to challenge authority and entertain new ideas.
Common Job Correlates
• Creative Jobs
• Research-oriented Jobs
Sample Statements
• I decorate my house on festivals.
• I experiment with different kinds of food.
Sub Traits: Trust, Straightforwardness, Altruism, Compliance, Modesty, Tender-Mindedness
Trait Description
Agreeableness refers to social conformity, friendliness, compliance and altruism. Agreeable people are
sympathetic to others; help others and trust others to help them too in return. They are popular amongst
their colleagues and do not believe in manipulating people. Agreeable people are good for customer
relationship roles and are seen to work well in teams.
Common Job Correlates
• Customer Relationship Profiles
Sample Statements
• I avoid arguments with colleagues in public.
• We need to do more to help the needy and unfortunate.
d. English, Quantitative Aptitude (Non-Technical) and Logical Ability Syllabi
1. Vocabulary
• Synonyms
• Antonyms
2. Grammar
• Subject-verb agreement
• Tenses
• Prepositions, conjunctions and articles
• Voice and speech
• Miscellaneous - Pronouns, Modals, Question Tags
I. English Syllabus
Aspiring Minds’ National Employability Report-Graduates 201344
APPENDIX
3. Comprehension
• Reading Comprehension
• Comprehension Ordering
1. Basic Mathematics
• Divisibility
• HCF and LCM
• Power
• Decimal Fractions
• Numbers
2. Applied Mathematics
• Inverse
• Profit and Loss
• Simple and Compound Interest
• Speed, Time and Distance
• Ratios, Mixtures and Percentages
3. Advanced Mathematics
• Logarithms
• Probability
• Permutations and Combinations
1. Inductive Reasoning
• Coding Pattern Recognition
• Number Series Pattern Recognition
• Analogy Pattern Recognition
• Classification Pattern Recognition
2. Deductive Reasoning
• Coding Deductive Logic
• Directional Sense
• Blood Relations
• Objective Reasoning
• Selection Decision Table
• Puzzles
3. Abductive Reasoning
• Logical Word Sequence
• Data Sufficiency
II. Quantitative Aptitude (Non-Technical) Syllabus
III. Logical Ability Syllabus
Aspiring Minds’ National Employability Report-Graduates 2013 45

www.aspiringminds.in