Embed Size (px)
Citation preview
National 5 Unit 2:
Multicellular Organisms
Topic 2.1 Producing new cells
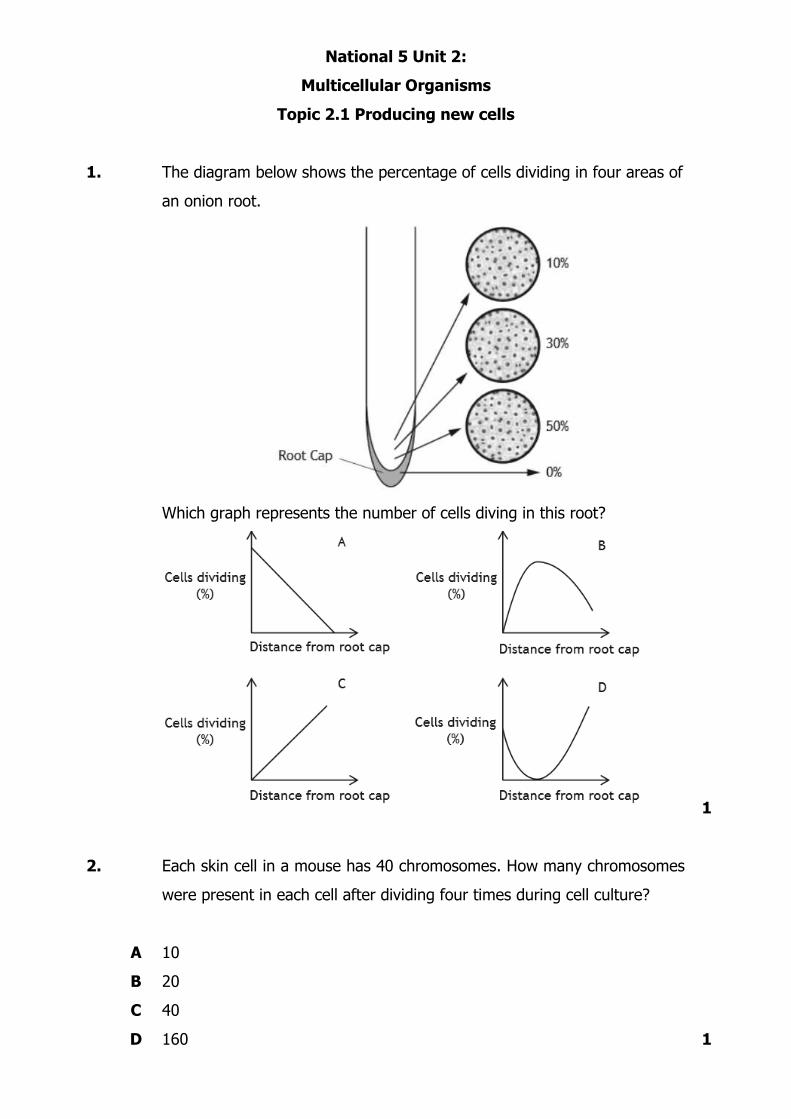
1.
The diagram below shows the percentage of cells dividing in four areas of
an onion root.
Which graph represents the number of cells diving in this root?
1
2.
A
B
C
D
Each skin cell in a mouse has 40 chromosomes. How many chromosomes
were present in each cell after dividing four times during cell culture?
10
20
40
160
1
3.
A
B
C
D
Specialisation of cells in animals leads to the formation of
tissues and organs
meristems and organs
stem cells and tissues
stem cells and meristems.
1
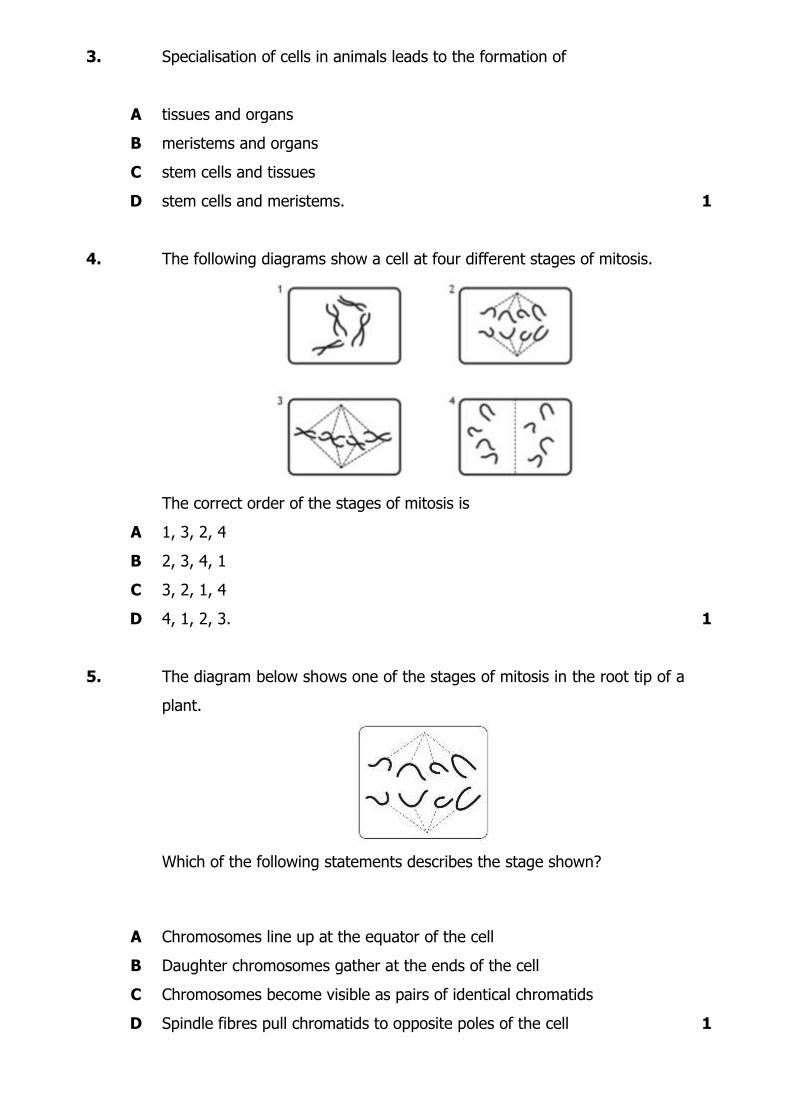
4.
The following diagrams show a cell at four different stages of mitosis.
The correct order of the stages of mitosis is
A
B
C
D
1, 3, 2, 4
2, 3, 4, 1
3, 2, 1, 4
4, 1, 2, 3.
1
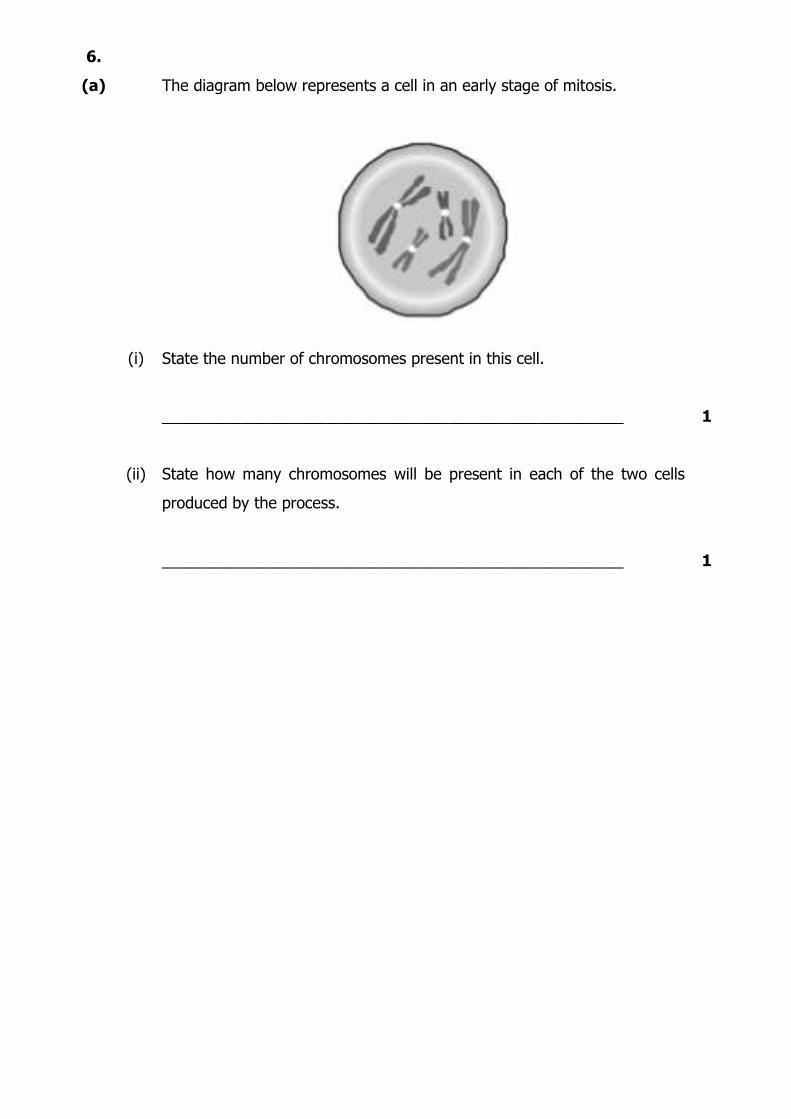
5.
The diagram below shows one of the stages of mitosis in the root tip of a
plant.
Which of the following statements describes the stage shown?
1
A
B
C
D
Chromosomes line up at the equator of the cell
Daughter chromosomes gather at the ends of the cell
Chromosomes become visible as pairs of identical chromatids
Spindle fibres pull chromatids to opposite poles of the cell
6.
(a)
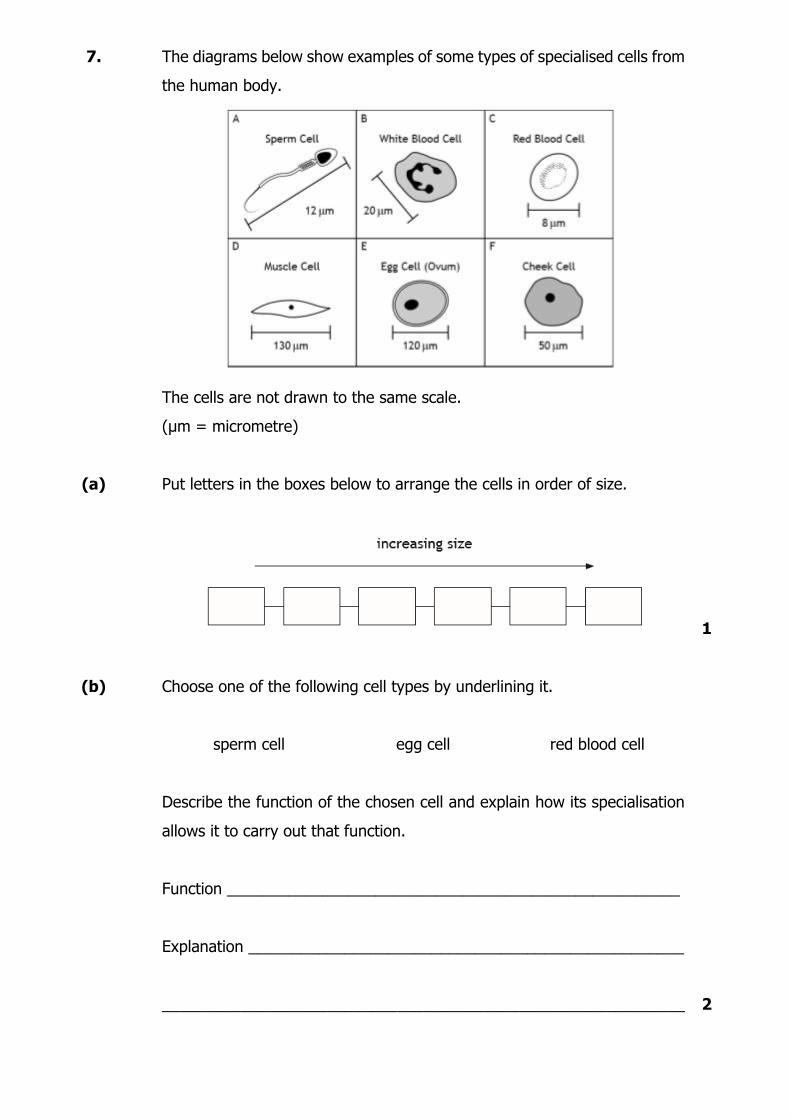
The diagram below represents a cell in an early stage of mitosis.
(i) State the number of chromosomes present in this cell.
_____________________________________________________
1
(ii) State how many chromosomes will be present in each of the two cells
produced by the process.
_____________________________________________________
1
7. The diagrams below show examples of some types of specialised cells from
the human body.
The cells are not drawn to the same scale.
(μm = micrometre)
(a) Put letters in the boxes below to arrange the cells in order of size.
1
(b) Choose one of the following cell types by underlining it.
sperm cell egg cell red blood cell
Describe the function of the chosen cell and explain how its specialisation
allows it to carry out that function.
Function ____________________________________________________
Explanation __________________________________________________
____________________________________________________________
2
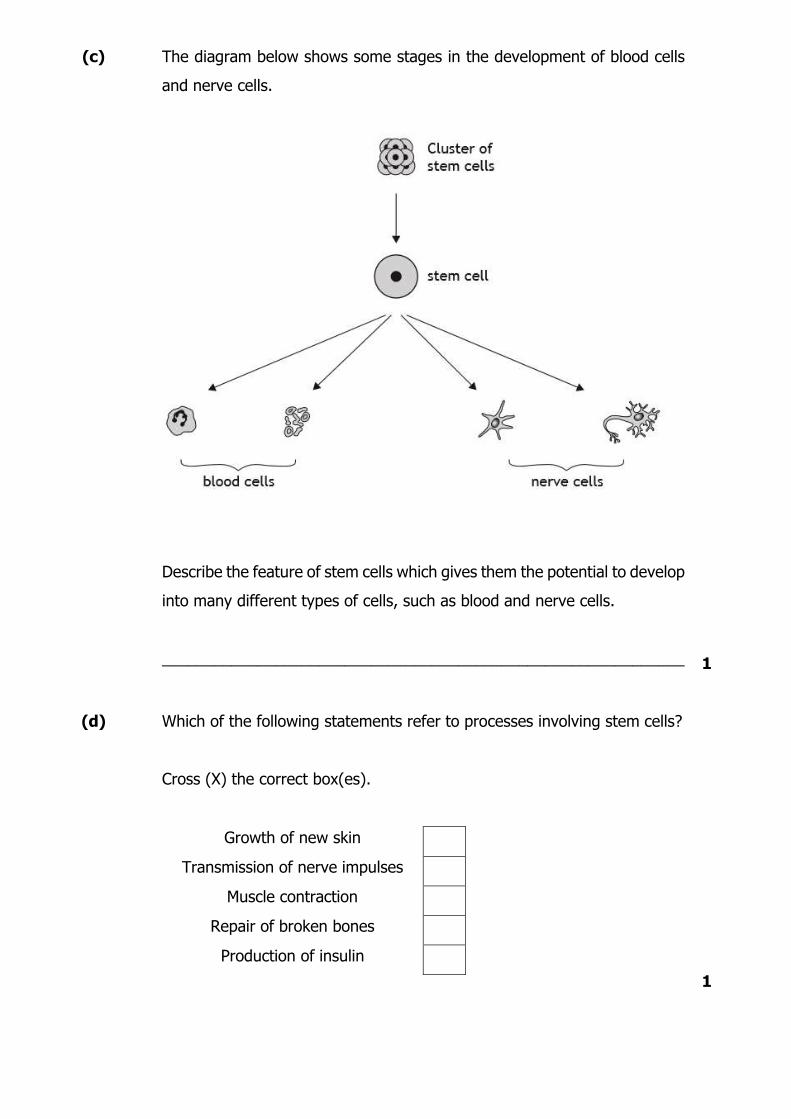
(c) The diagram below shows some stages in the development of blood cells
and nerve cells.
Describe the feature of stem cells which gives them the potential to develop
into many different types of cells, such as blood and nerve cells.
____________________________________________________________
1
(d)
Which of the following statements refer to processes involving stem cells?
Cross (X) the correct box(es).
Growth of new skin
Transmission of nerve impulses
Muscle contraction
Repair of broken bones
Production of insulin
1

8. Blood is an example of a tissue.
(a) Describe what is meant by the term ’’tissue’’.
____________________________________________________________
1
(b) Following bleeding, lost red blood cells are replaced by the activity of bone
marrow.
Identify the type of cell, present in bone marrow, which can divide and
differentiate to produce red blood cells.
____________________________________________________________
1
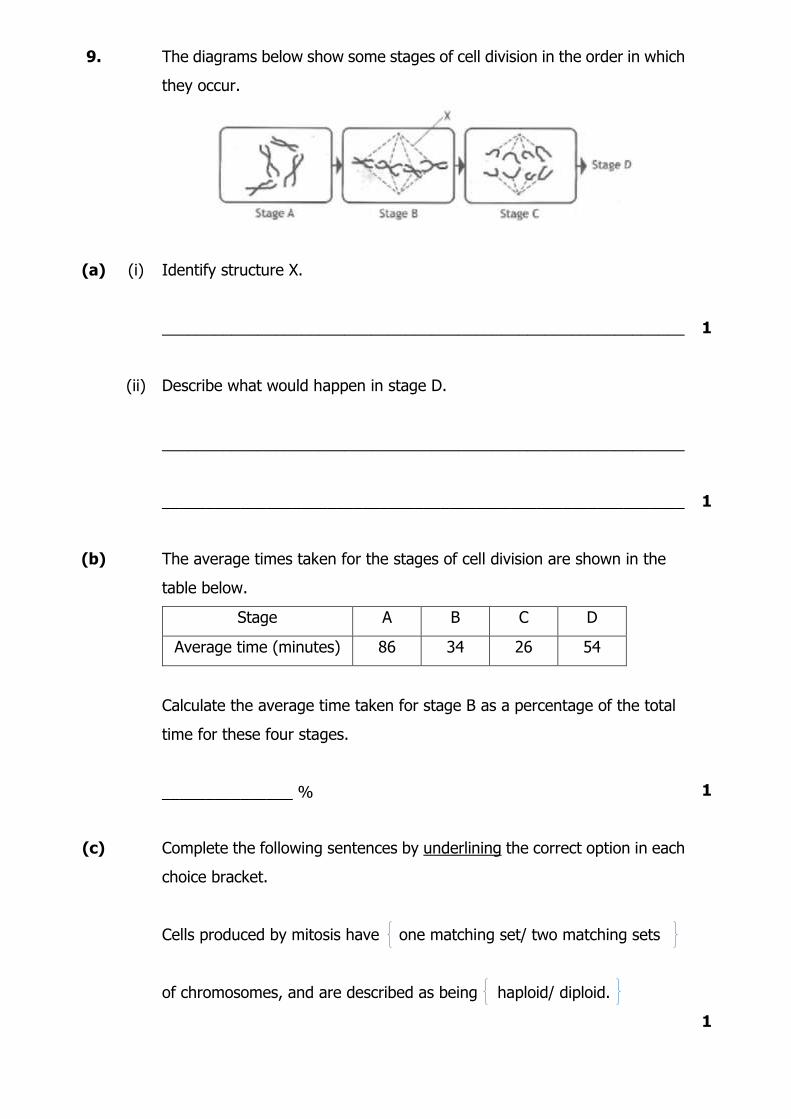
9.
The diagrams below show some stages of cell division in the order in which
they occur.
(a) (i) Identify structure X.
____________________________________________________________
1
(ii) Describe what would happen in stage D.
____________________________________________________________
____________________________________________________________
1
(b) The average times taken for the stages of cell division are shown in the
table below.
Stage A B C D
Average time (minutes) 86 34 26 54
Calculate the average time taken for stage B as a percentage of the total
time for these four stages.
_______________ %
1
(c) Complete the following sentences by underlining the correct option in each
choice bracket.
Cells produced by mitosis have one matching set/ two matching sets
of chromosomes, and are described as being haploid/ diploid.
1
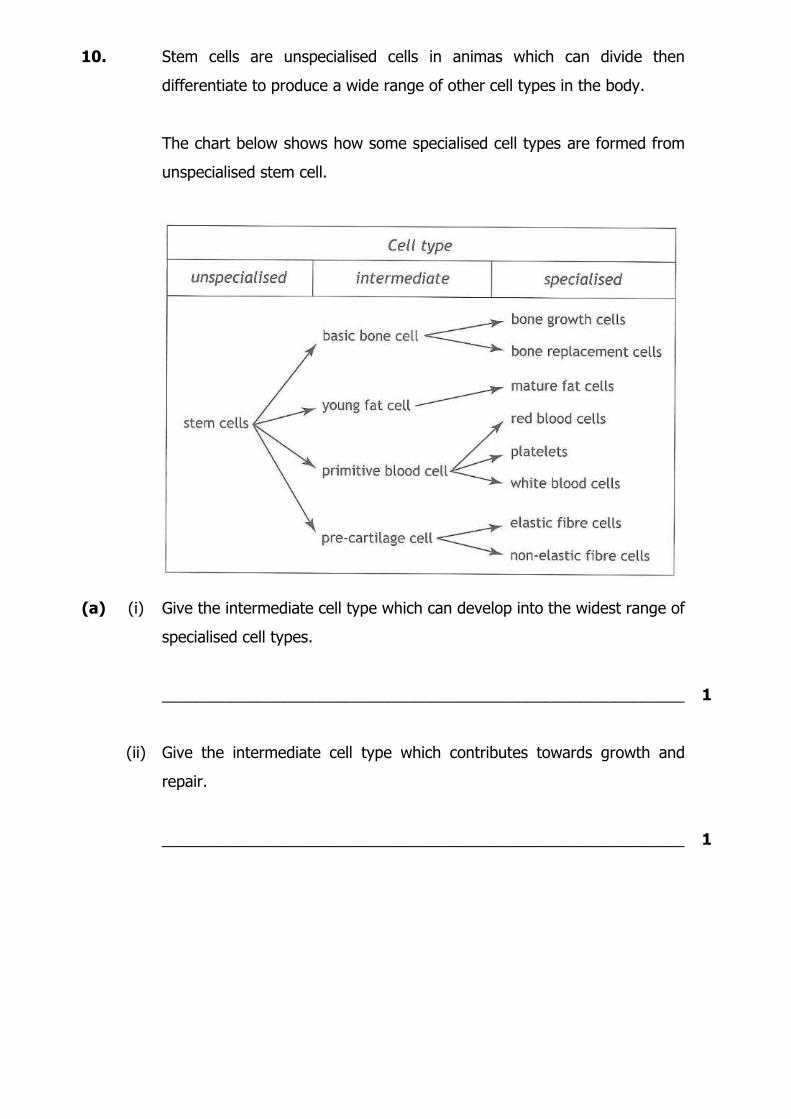
10. Stem cells are unspecialised cells in animas which can divide then
differentiate to produce a wide range of other cell types in the body.
The chart below shows how some specialised cell types are formed from
unspecialised stem cell.
(a) (i) Give the intermediate cell type which can develop into the widest range of
specialised cell types.
____________________________________________________________
1
(ii) Give the intermediate cell type which contributes towards growth and
repair.
____________________________________________________________
1
National 5 Unit 2:
Multicellular Organisms
Topic 2.2 Control and communication
(a) Nervous control
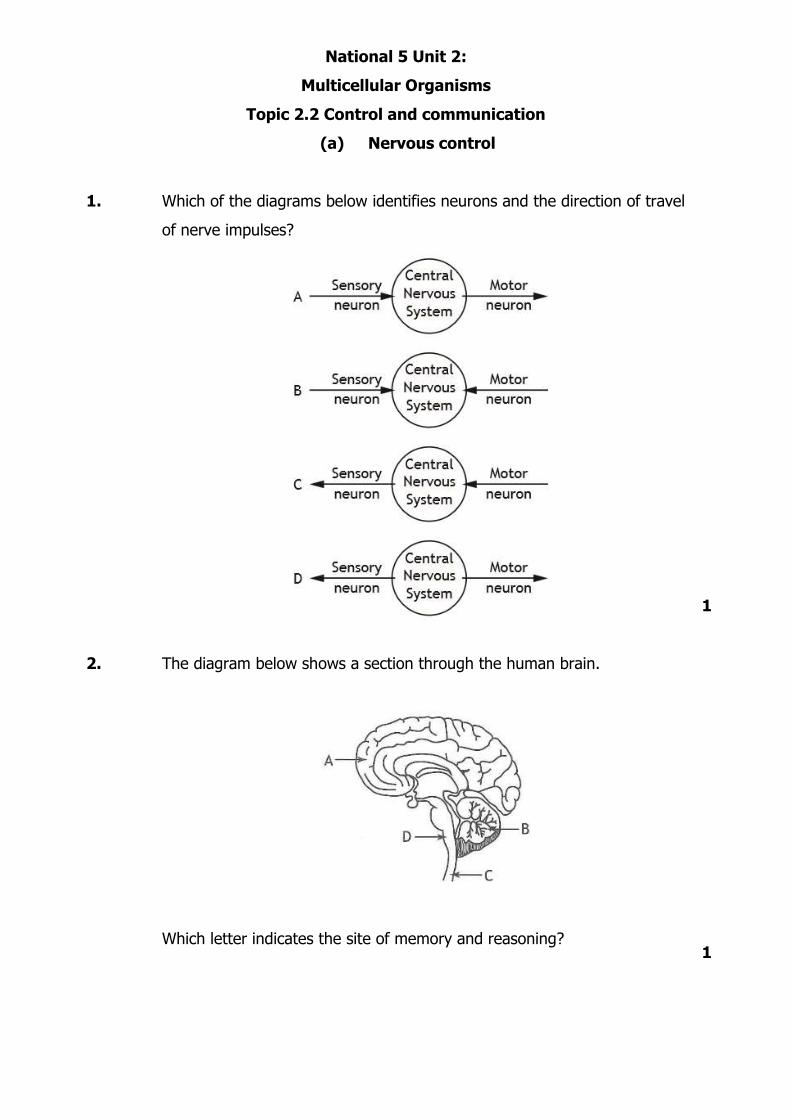
1. Which of the diagrams below identifies neurons and the direction of travel
of nerve impulses?
1
2. The diagram below shows a section through the human brain.
Which letter indicates the site of memory and reasoning?
1
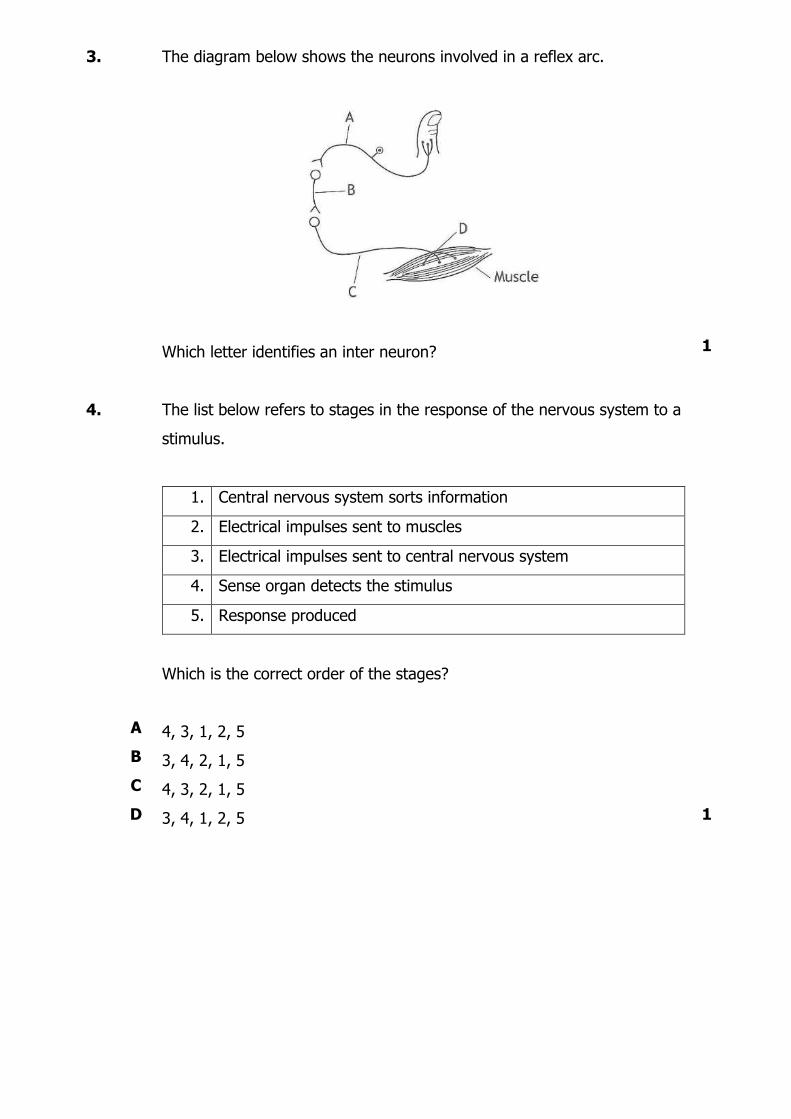
3. The diagram below shows the neurons involved in a reflex arc.
Which letter identifies an inter neuron?
1
4.
A
B
C
D
The list below refers to stages in the response of the nervous system to a
stimulus.
1. Central nervous system sorts information
2. Electrical impulses sent to muscles
3. Electrical impulses sent to central nervous system
4. Sense organ detects the stimulus
5. Response produced
Which is the correct order of the stages?
4, 3, 1, 2, 5
3, 4, 2, 1, 5
4, 3, 2, 1, 5
3, 4, 1, 2, 5
1
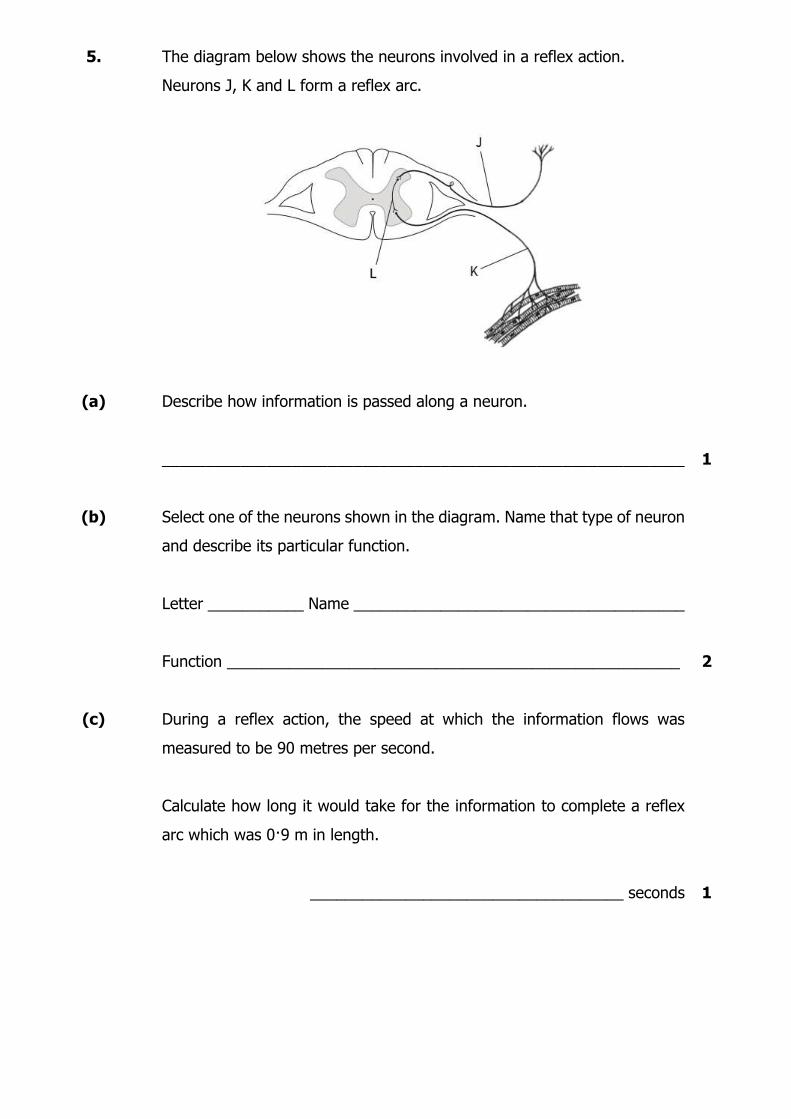
5. The diagram below shows the neurons involved in a reflex action.
Neurons J, K and L form a reflex arc.
(a) Describe how information is passed along a neuron.
____________________________________________________________
1
(b) Select one of the neurons shown in the diagram. Name that type of neuron
and describe its particular function.
Letter ___________ Name ______________________________________
Function ____________________________________________________
2
(c) During a reflex action, the speed at which the information flows was
measured to be 90 metres per second.
Calculate how long it would take for the information to complete a reflex
arc which was 0·9 m in length.
____________________________________ seconds
1
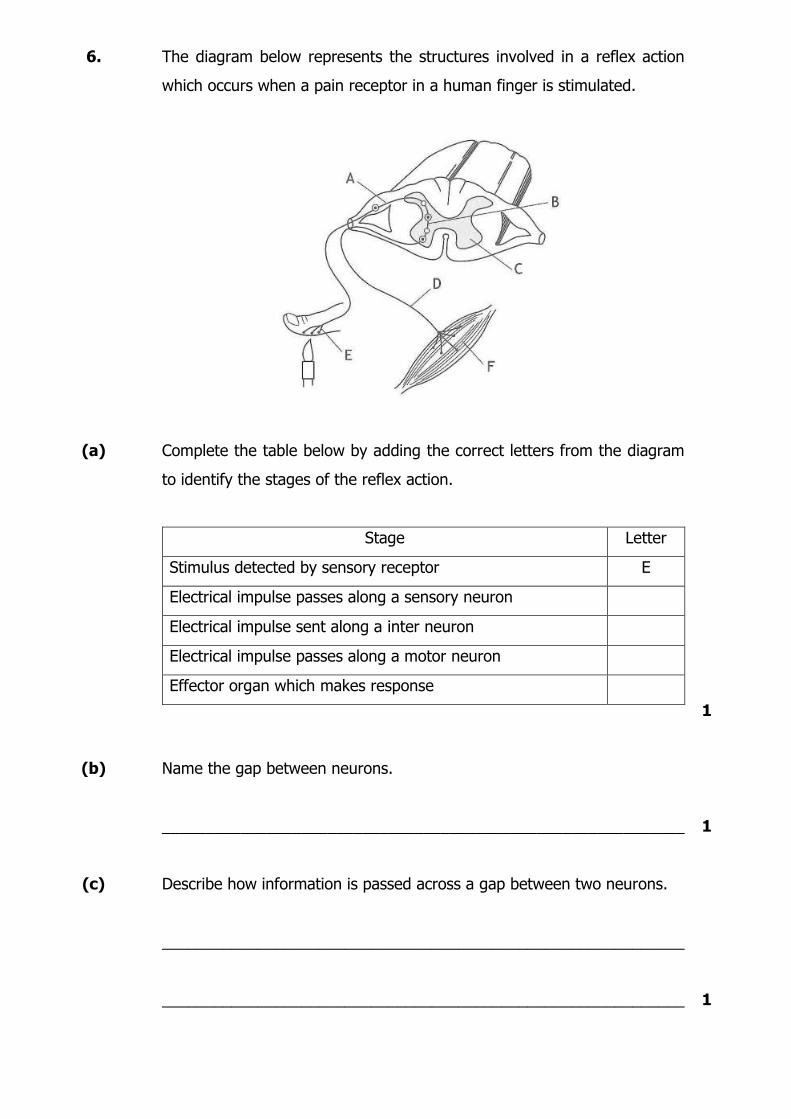
6. The diagram below represents the structures involved in a reflex action
which occurs when a pain receptor in a human finger is stimulated.
(a) Complete the table below by adding the correct letters from the diagram
to identify the stages of the reflex action.
Stage Letter
Stimulus detected by sensory receptor E
Electrical impulse passes along a sensory neuron
Electrical impulse sent along a inter neuron
Electrical impulse passes along a motor neuron
Effector organ which makes response
1
(b) Name the gap between neurons.
____________________________________________________________
1
(c) Describe how information is passed across a gap between two neurons.
____________________________________________________________
____________________________________________________________
1
7. Different parts of the brain have different functions.
(a) Draw a line from each of the following parts of the brain to its correct
function.
Part
Function
Cerebrum
Controls heart rate
Cerebellum
Controls balance
Medulla Memory and reasoning
2
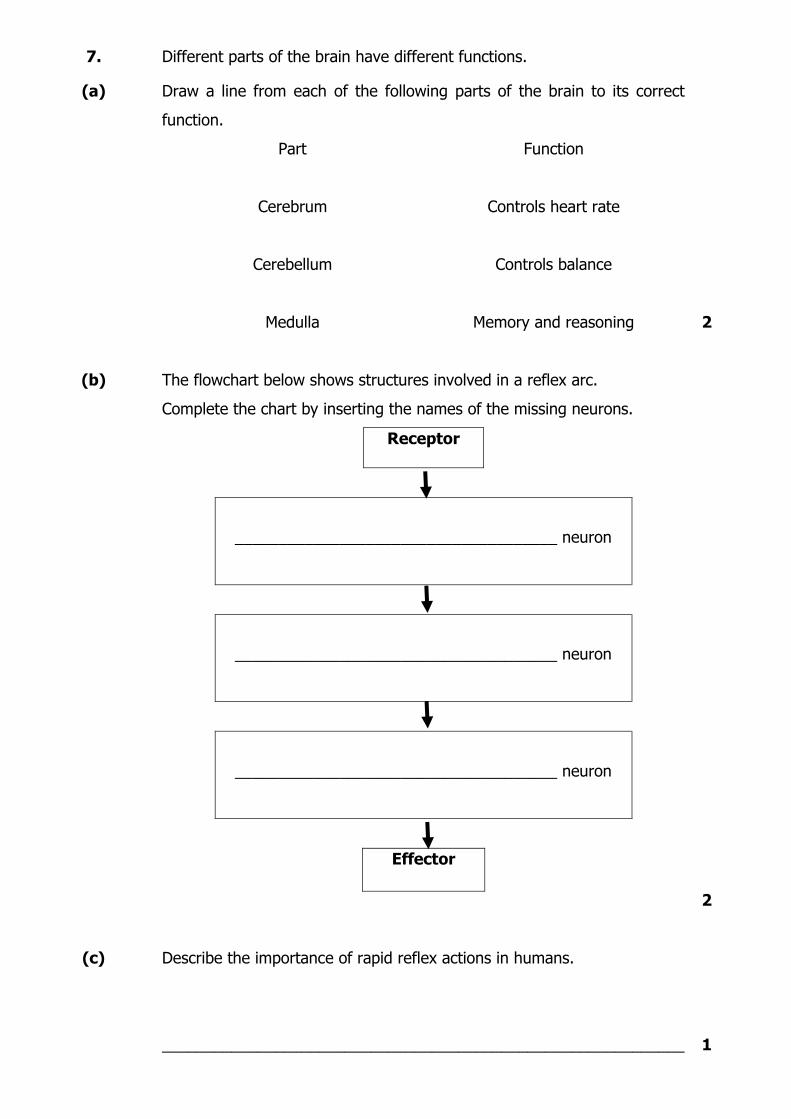
(b) The flowchart below shows structures involved in a reflex arc.
Complete the chart by inserting the names of the missing neurons.
Receptor
_____________________________________ neuron
_____________________________________ neuron
_____________________________________ neuron
Effector
2
(c) Describe the importance of rapid reflex actions in humans.
____________________________________________________________
1
National 5 Unit 2:
Multicellular Organisms
Topic 2.2 Control and communication
(b) Hormonal control
1.
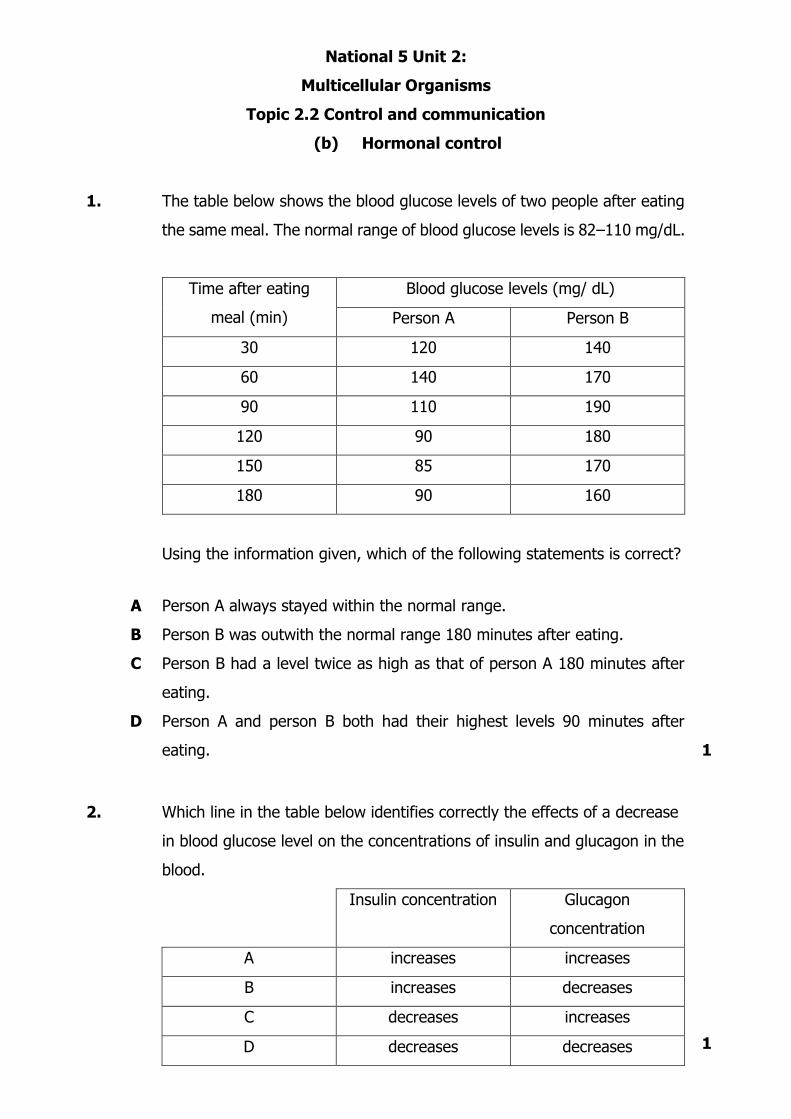
The table below shows the blood glucose levels of two people after eating
the same meal. The normal range of blood glucose levels is 82–110 mg/dL.
Time after eating
meal (min)
Blood glucose levels (mg/ dL)
Person A Person B
30 120 140
60 140 170
90 110 190
120 90 180
150 85 170
180 90 160
Using the information given, which of the following statements is correct?
A
B
C
D
Person A always stayed within the normal range.
Person B was outwith the normal range 180 minutes after eating.
Person B had a level twice as high as that of person A 180 minutes after
eating.
Person A and person B both had their highest levels 90 minutes after
eating.
1
2.
Which line in the table below identifies correctly the effects of a decrease
in blood glucose level on the concentrations of insulin and glucagon in the
blood.
Insulin concentration Glucagon
concentration
A increases increases
B increases decreases
C decreases increases
D decreases decreases
1
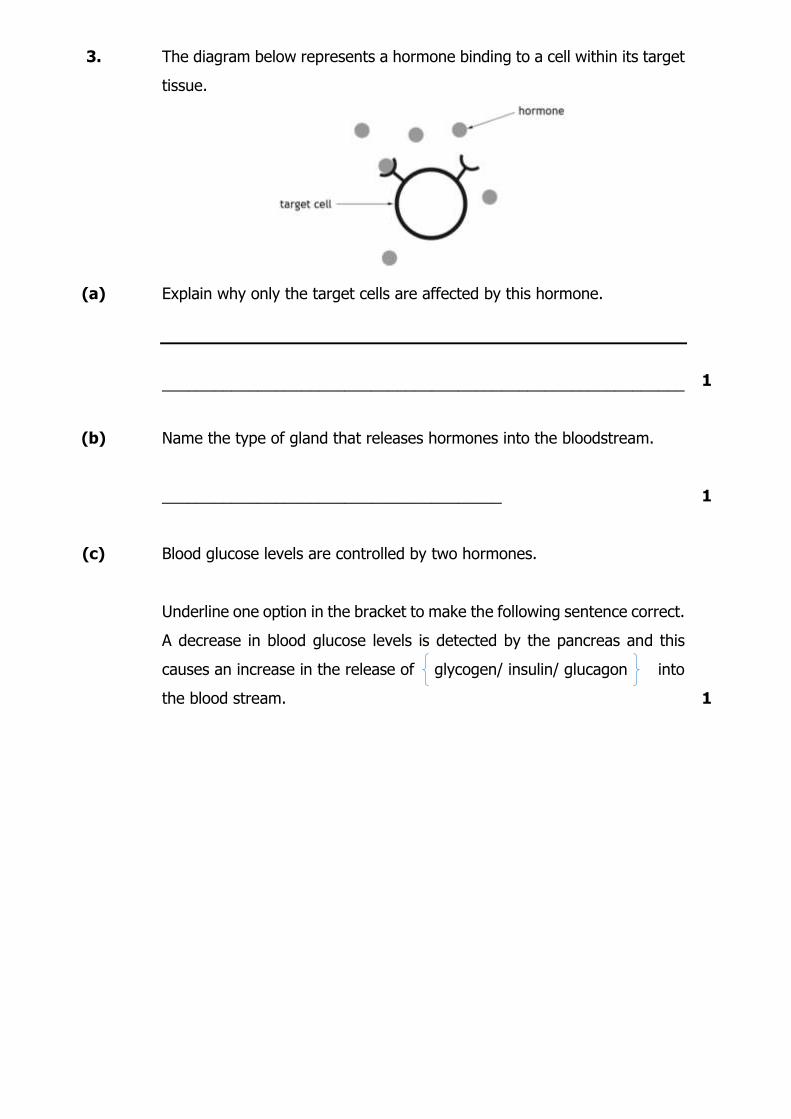
3.
The diagram below represents a hormone binding to a cell within its target
tissue.
(a)
Explain why only the target cells are affected by this hormone.
____________________________________________________________
1
(b) Name the type of gland that releases hormones into the bloodstream.
_______________________________________
1
(c) Blood glucose levels are controlled by two hormones.
Underline one option in the bracket to make the following sentence correct.
A decrease in blood glucose levels is detected by the pancreas and this
causes an increase in the release of glycogen/ insulin/ glucagon into
the blood stream.
1
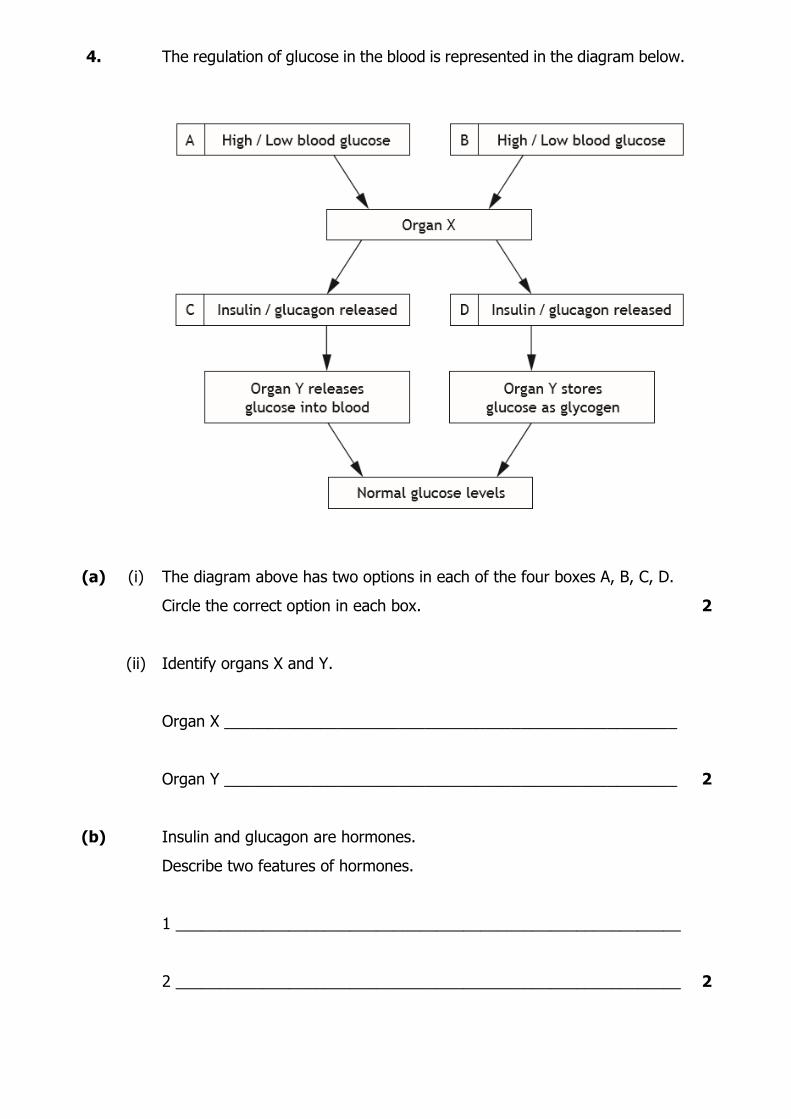
4. The regulation of glucose in the blood is represented in the diagram below.
(a) (i) The diagram above has two options in each of the four boxes A, B, C, D.
Circle the correct option in each box.
2
(ii) Identify organs X and Y.
Organ X ____________________________________________________
Organ Y ____________________________________________________
2
(b) Insulin and glucagon are hormones.
Describe two features of hormones.
1 __________________________________________________________
2 __________________________________________________________
2
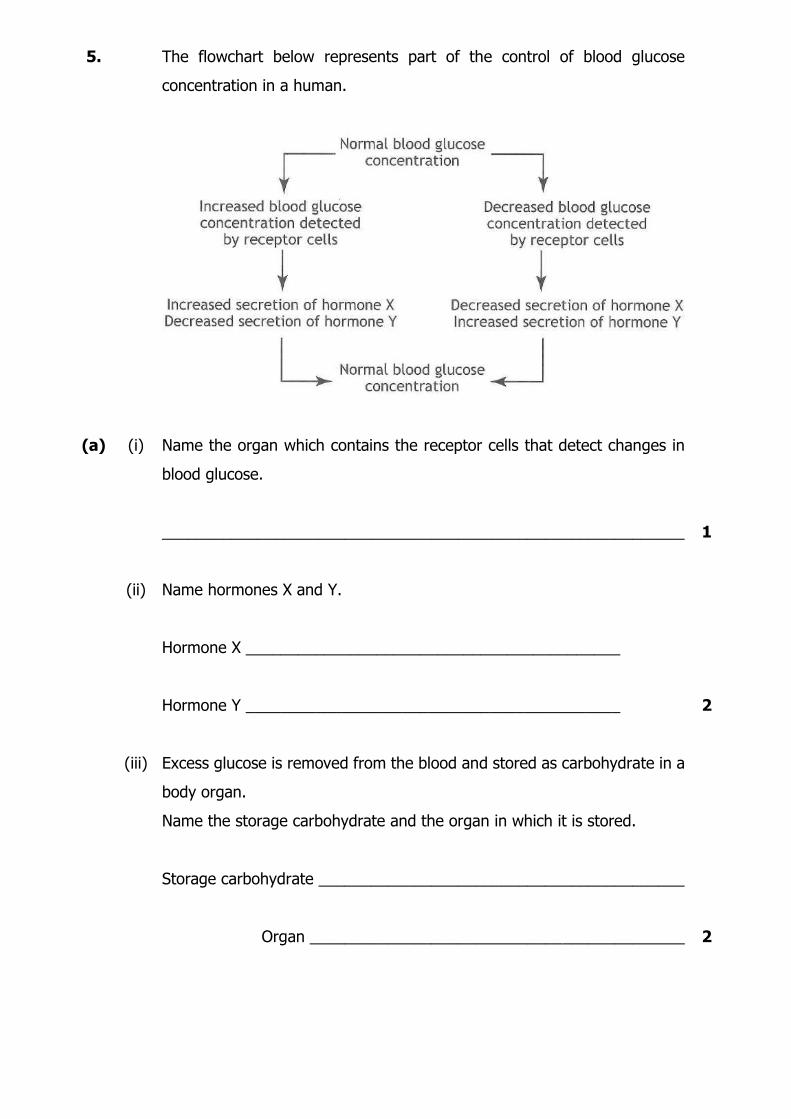
5. The flowchart below represents part of the control of blood glucose
concentration in a human.
(a) (i) Name the organ which contains the receptor cells that detect changes in
blood glucose.
____________________________________________________________
1
(ii) Name hormones X and Y.
Hormone X ___________________________________________
Hormone Y ___________________________________________
2
(iii) Excess glucose is removed from the blood and stored as carbohydrate in a
body organ.
Name the storage carbohydrate and the organ in which it is stored.
Storage carbohydrate __________________________________________
Organ ___________________________________________
2
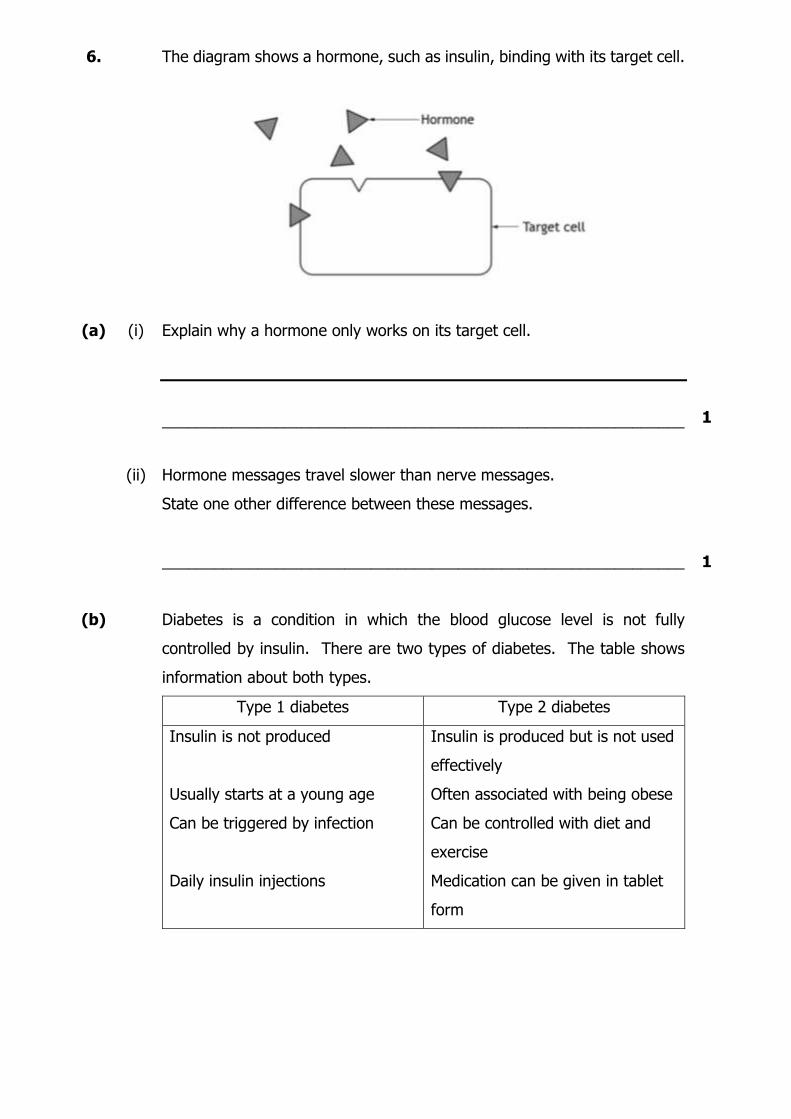
6. The diagram shows a hormone, such as insulin, binding with its target cell.
(a) (i) Explain why a hormone only works on its target cell.
____________________________________________________________
1
(ii) Hormone messages travel slower than nerve messages.
State one other difference between these messages.
____________________________________________________________
1
(b) Diabetes is a condition in which the blood glucose level is not fully
controlled by insulin. There are two types of diabetes. The table shows
information about both types.
Type 1 diabetes Type 2 diabetes
Insulin is not produced
Usually starts at a young age
Can be triggered by infection
Daily insulin injections
Insulin is produced but is not used
effectively
Often associated with being obese
Can be controlled with diet and
exercise
Medication can be given in tablet
form
A person with diabetes was treated with daily insulin injections.
(i) Using information from the table, state which type of diabetes this person
had and why this treatment was required.
____________________________________________________________
1
(ii) Describe what would happen to this person’s blood glucose level if they
had not been treated.
1
(iii) Name the organ which is not functioning properly, causing type 1 diabetes.
1
National 5 Unit 2:
Multicellular Organisms
Topic 2.3 Reproduction
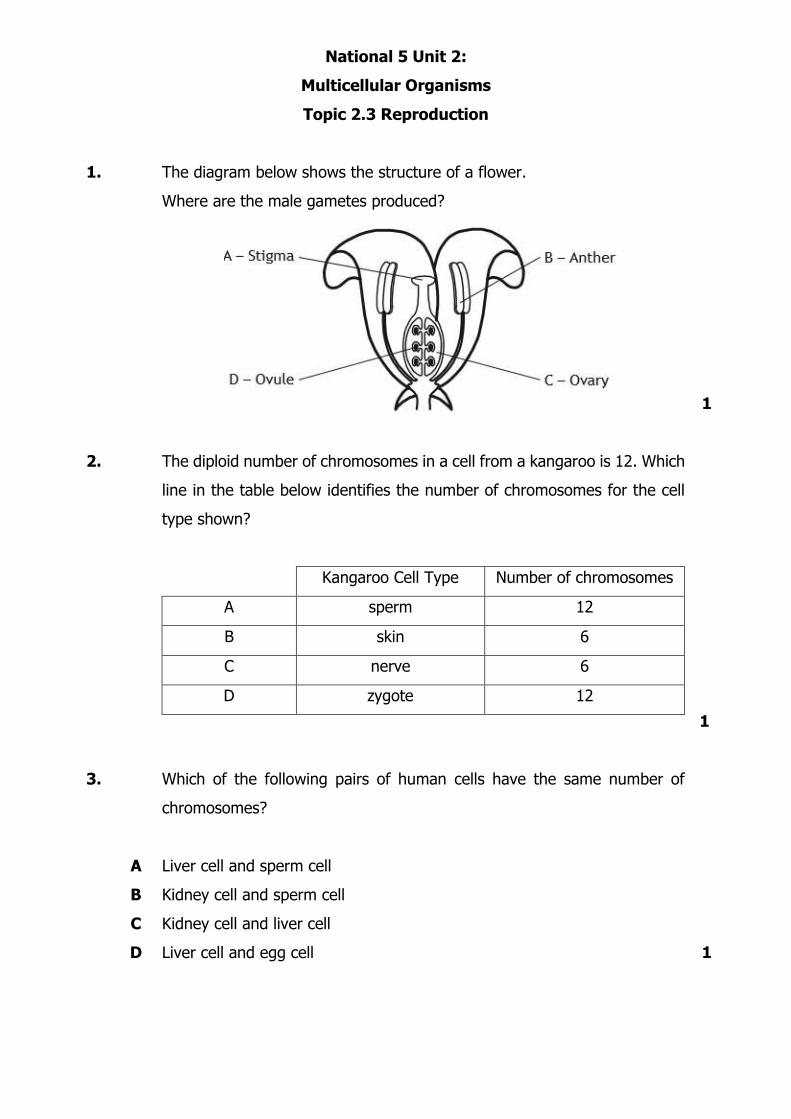
1. The diagram below shows the structure of a flower.
Where are the male gametes produced?
1
2. The diploid number of chromosomes in a cell from a kangaroo is 12. Which
line in the table below identifies the number of chromosomes for the cell
type shown?
Kangaroo Cell Type Number of chromosomes
A sperm 12
B skin 6
C nerve 6
D zygote 12
1
3.
A
B
C
D
Which of the following pairs of human cells have the same number of
chromosomes?
Liver cell and sperm cell
Kidney cell and sperm cell
Kidney cell and liver cell
Liver cell and egg cell
1
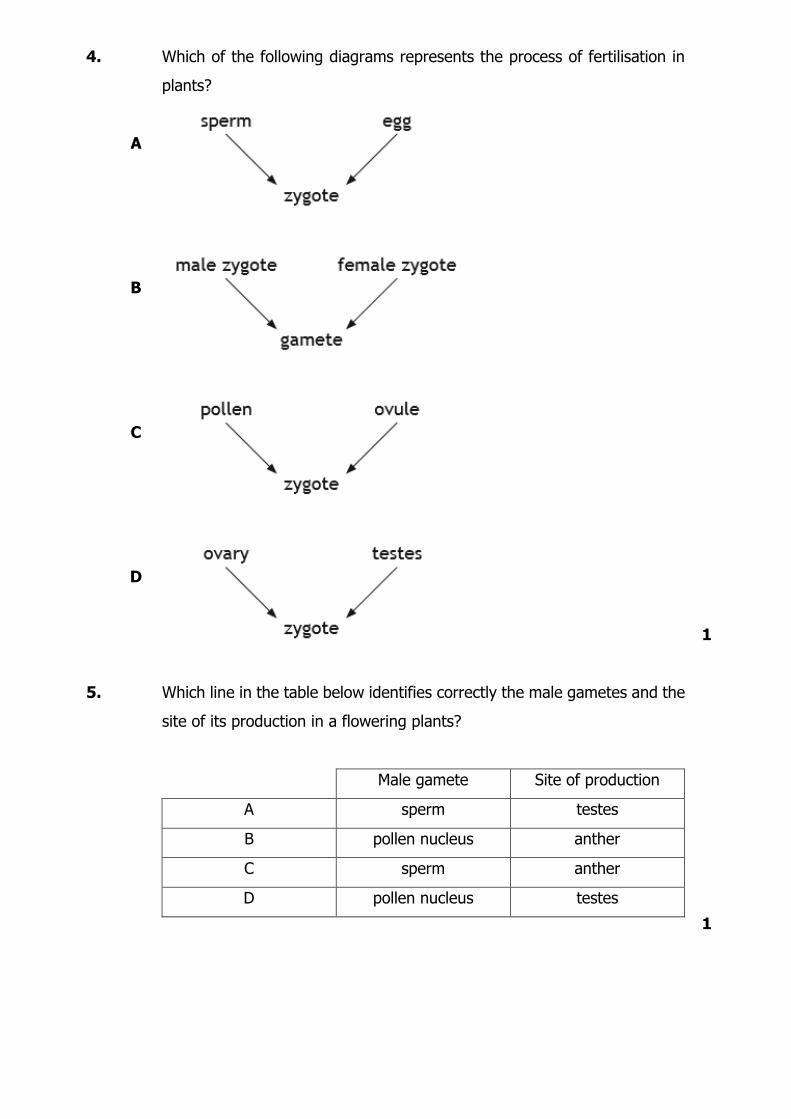
4.
A
B
C
D
Which of the following diagrams represents the process of fertilisation in
plants?
1
5. Which line in the table below identifies correctly the male gametes and the
site of its production in a flowering plants?
Male gamete Site of production
A sperm testes
B pollen nucleus anther
C sperm anther
D pollen nucleus testes
1
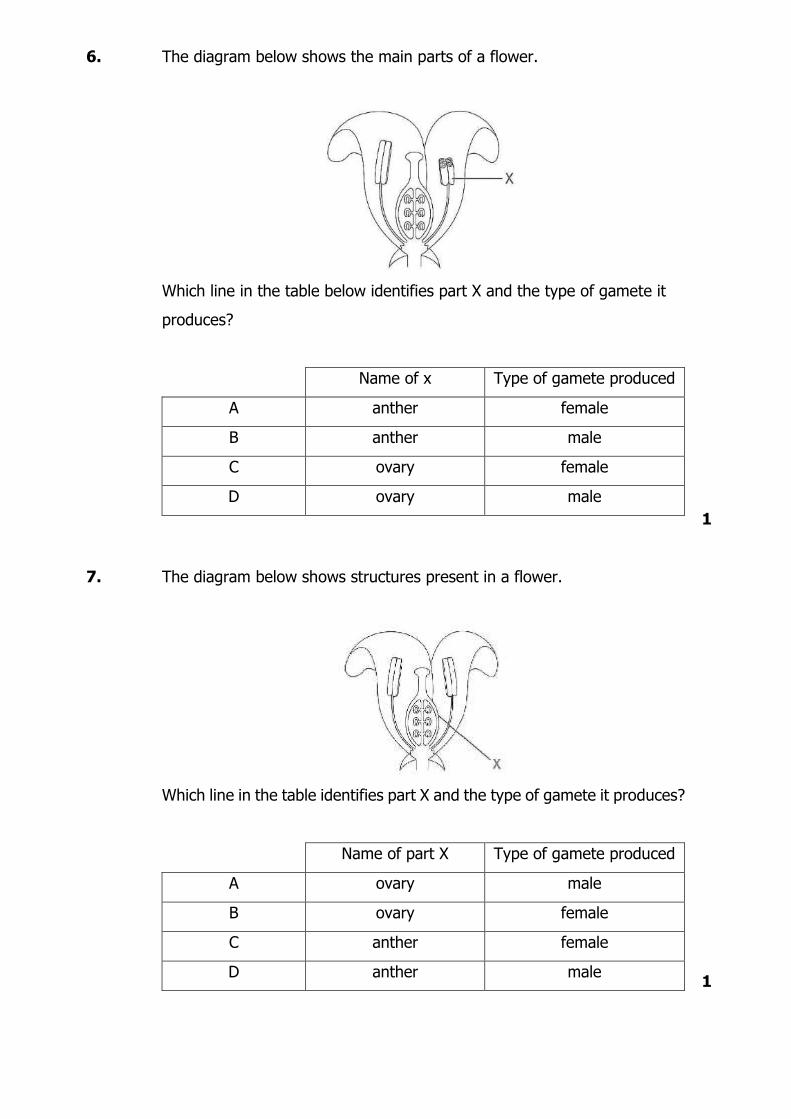
6. The diagram below shows the main parts of a flower.
Which line in the table below identifies part X and the type of gamete it
produces?
Name of x Type of gamete produced
A anther female
B anther male
C ovary female
D ovary male
1
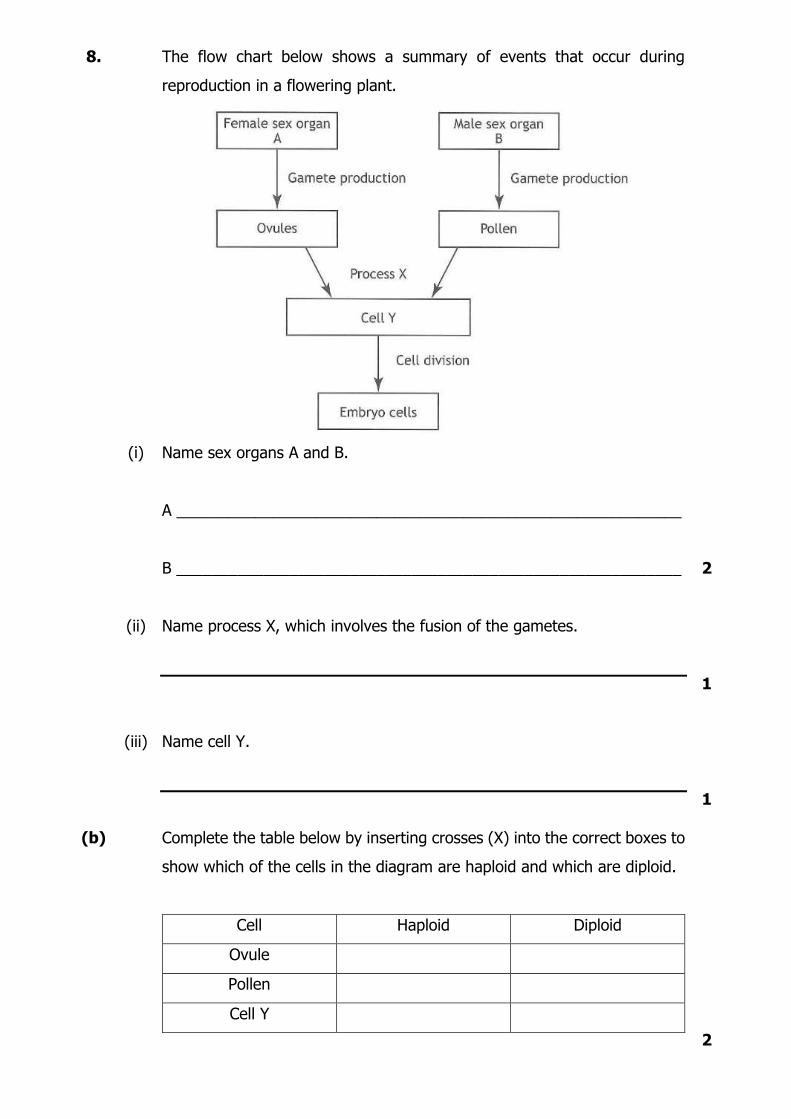
7. The diagram below shows structures present in a flower.
Which line in the table identifies part X and the type of gamete it produces?
Name of part X Type of gamete produced
A ovary male
B ovary female
C anther female
D anther male
1
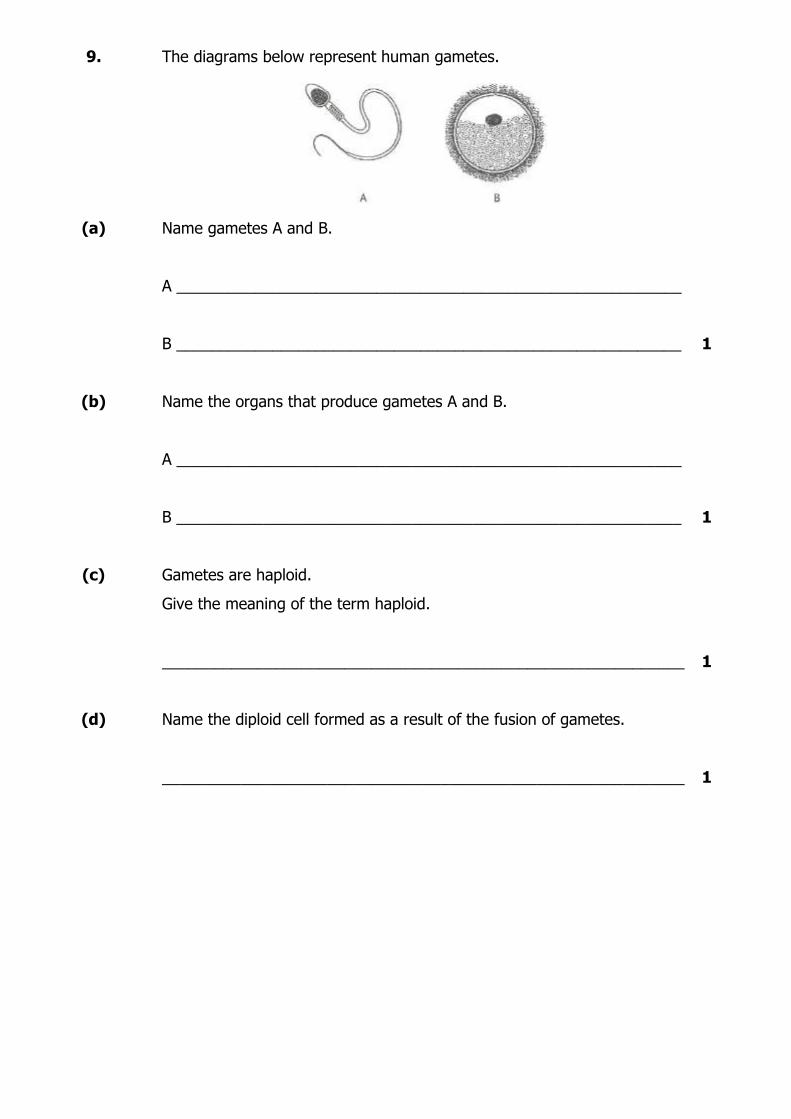
8. The flow chart below shows a summary of events that occur during
reproduction in a flowering plant.
(i) Name sex organs A and B.
A __________________________________________________________
B __________________________________________________________
2
(ii) Name process X, which involves the fusion of the gametes.
1
(iii) Name cell Y.
1
(b) Complete the table below by inserting crosses (X) into the correct boxes to
show which of the cells in the diagram are haploid and which are diploid.
Cell Haploid Diploid
Ovule
Pollen
Cell Y
2
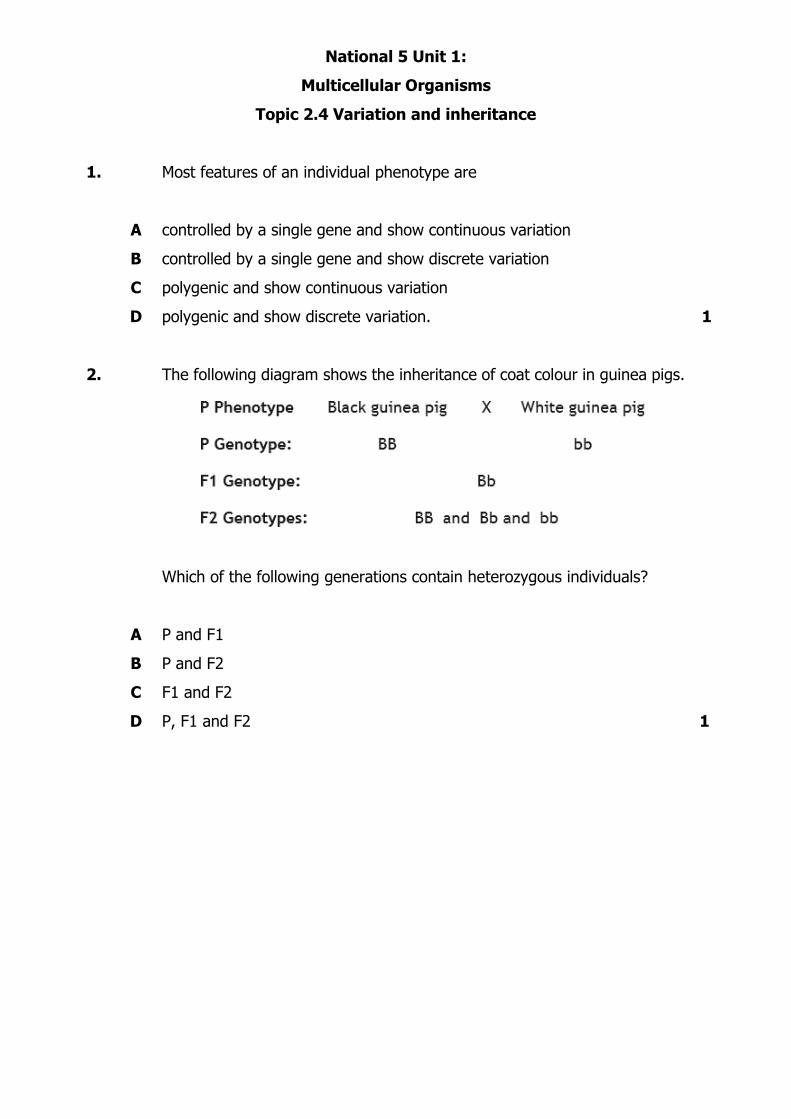
9. The diagrams below represent human gametes.
(a) Name gametes A and B.
A __________________________________________________________
B __________________________________________________________
1
(b)
Name the organs that produce gametes A and B.
A __________________________________________________________
B __________________________________________________________
1
(c) Gametes are haploid.
Give the meaning of the term haploid.
____________________________________________________________
1
(d) Name the diploid cell formed as a result of the fusion of gametes.
____________________________________________________________
1
National 5 Unit 1:
Multicellular Organisms
Topic 2.4 Variation and inheritance
1.
A
B
C
D
Most features of an individual phenotype are
controlled by a single gene and show continuous variation
controlled by a single gene and show discrete variation
polygenic and show continuous variation
polygenic and show discrete variation.
1
2.
The following diagram shows the inheritance of coat colour in guinea pigs.
A
B
C
D
Which of the following generations contain heterozygous individuals?
P and F1
P and F2
F1 and F2
P, F1 and F2
1
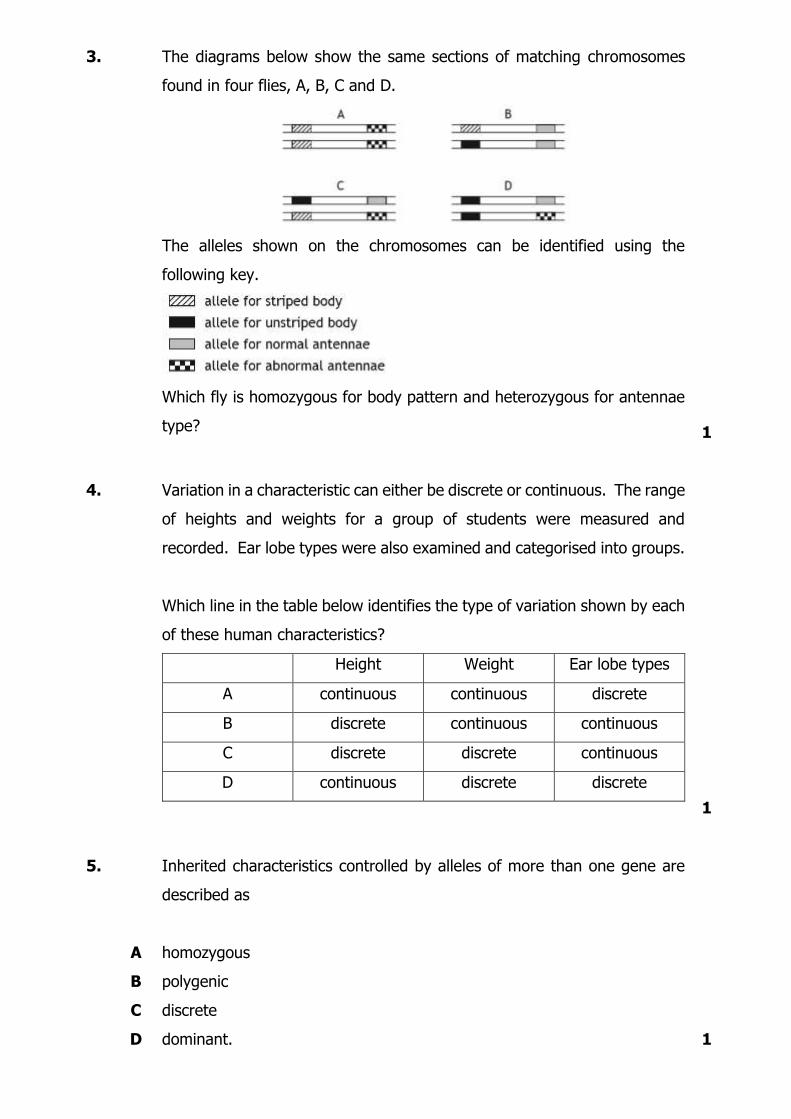
3. The diagrams below show the same sections of matching chromosomes
found in four flies, A, B, C and D.
The alleles shown on the chromosomes can be identified using the
following key.
Which fly is homozygous for body pattern and heterozygous for antennae
type?
1
4. Variation in a characteristic can either be discrete or continuous. The range
of heights and weights for a group of students were measured and
recorded. Ear lobe types were also examined and categorised into groups.
Which line in the table below identifies the type of variation shown by each
of these human characteristics?
Height Weight Ear lobe types
A continuous continuous discrete
B discrete continuous continuous
C discrete discrete continuous
D continuous discrete discrete
1
5.
A
B
C
D
Inherited characteristics controlled by alleles of more than one gene are
described as
homozygous
polygenic
discrete
dominant.
1
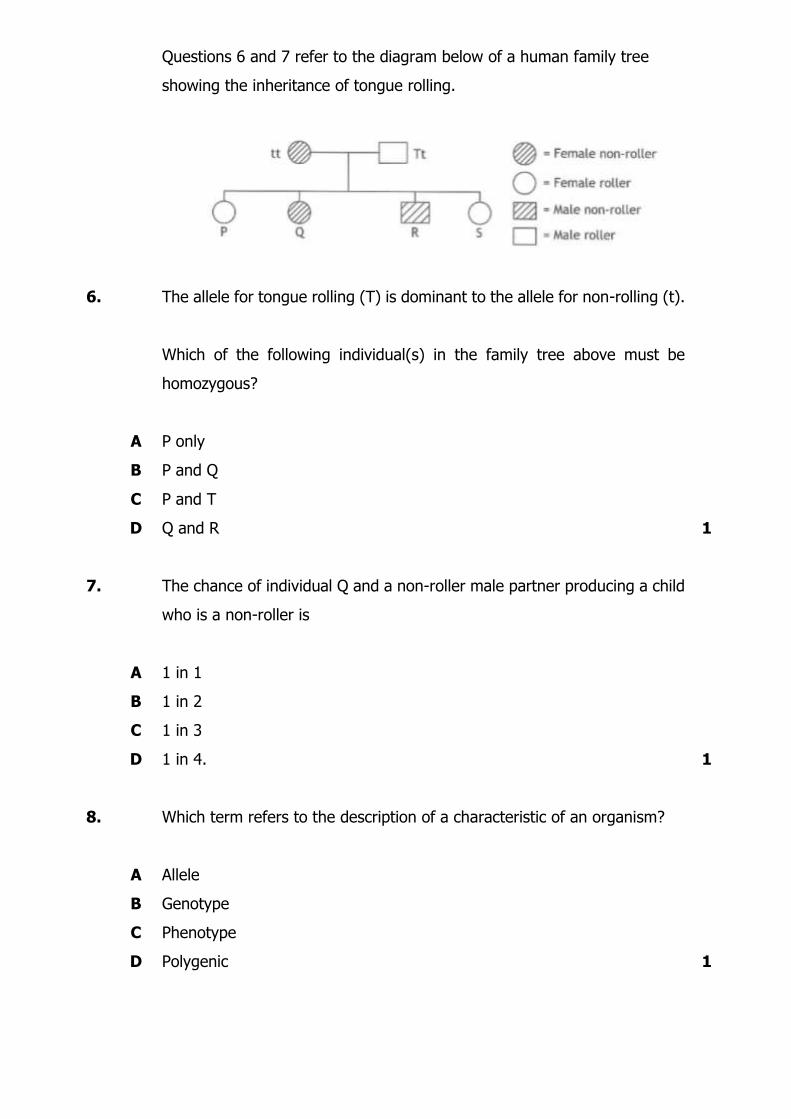
Questions 6 and 7 refer to the diagram below of a human family tree
showing the inheritance of tongue rolling.
6.
A
B
C
D
The allele for tongue rolling (T) is dominant to the allele for non-rolling (t).
Which of the following individual(s) in the family tree above must be
homozygous?
P only
P and Q
P and T
Q and R
1
7.
A
B
C
D
The chance of individual Q and a non-roller male partner producing a child
who is a non-roller is
1 in 1
1 in 2
1 in 3
1 in 4.
1
8.
A
B
C
D
Which term refers to the description of a characteristic of an organism?
Allele
Genotype
Phenotype
Polygenic
1
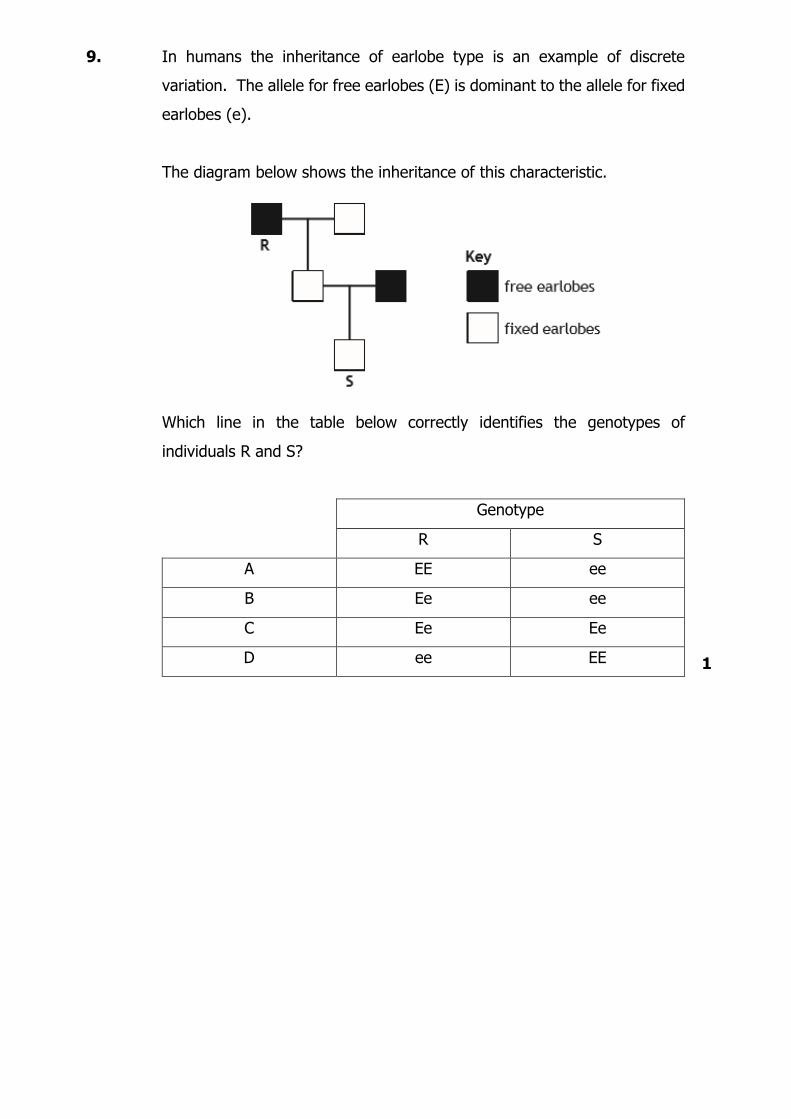
9. In humans the inheritance of earlobe type is an example of discrete
variation. The allele for free earlobes (E) is dominant to the allele for fixed
earlobes (e).
The diagram below shows the inheritance of this characteristic.
Which line in the table below correctly identifies the genotypes of
individuals R and S?
Genotype
R S
A EE ee
B Ee ee
C Ee Ee
D ee EE
1
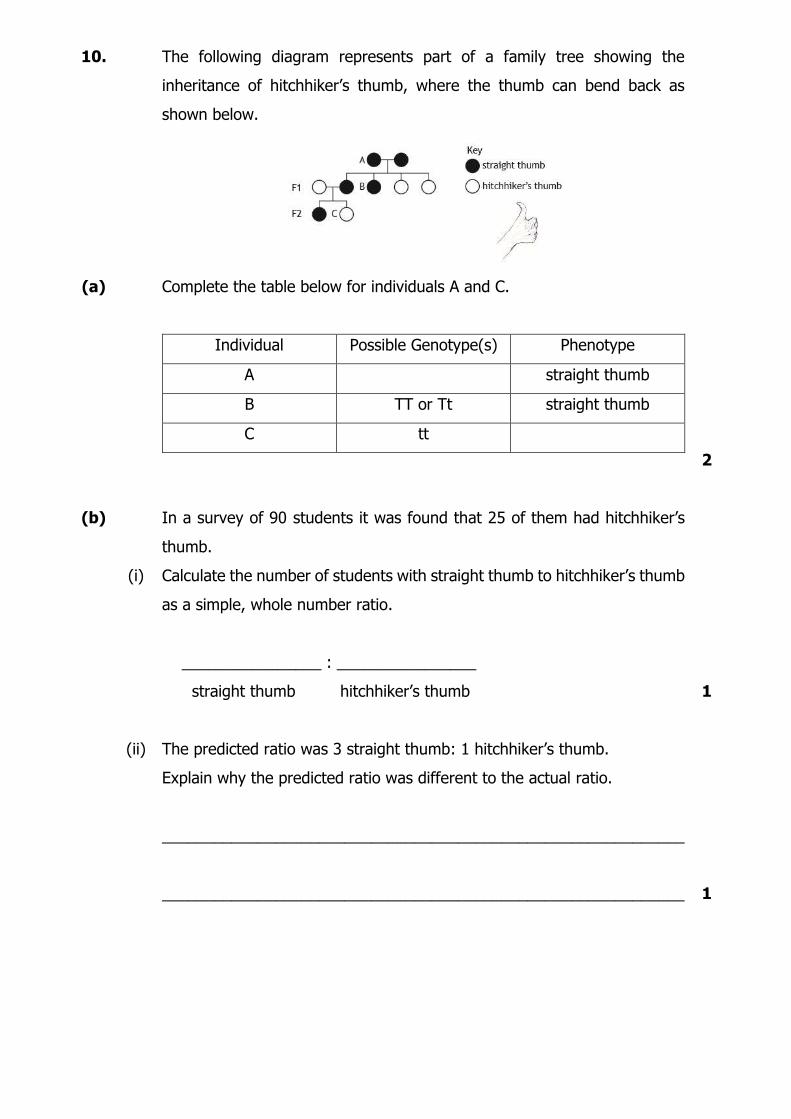
10. The following diagram represents part of a family tree showing the
inheritance of hitchhiker’s thumb, where the thumb can bend back as
shown below.
(a) Complete the table below for individuals A and C.
Individual Possible Genotype(s) Phenotype
A straight thumb
B TT or Tt straight thumb
C tt
2
(b) In a survey of 90 students it was found that 25 of them had hitchhiker’s
thumb.
(i) Calculate the number of students with straight thumb to hitchhiker’s thumb
as a simple, whole number ratio.
________________ : ________________
straight thumb hitchhiker’s thumb
1
(ii) The predicted ratio was 3 straight thumb: 1 hitchhiker’s thumb.
Explain why the predicted ratio was different to the actual ratio.
____________________________________________________________
____________________________________________________________
1
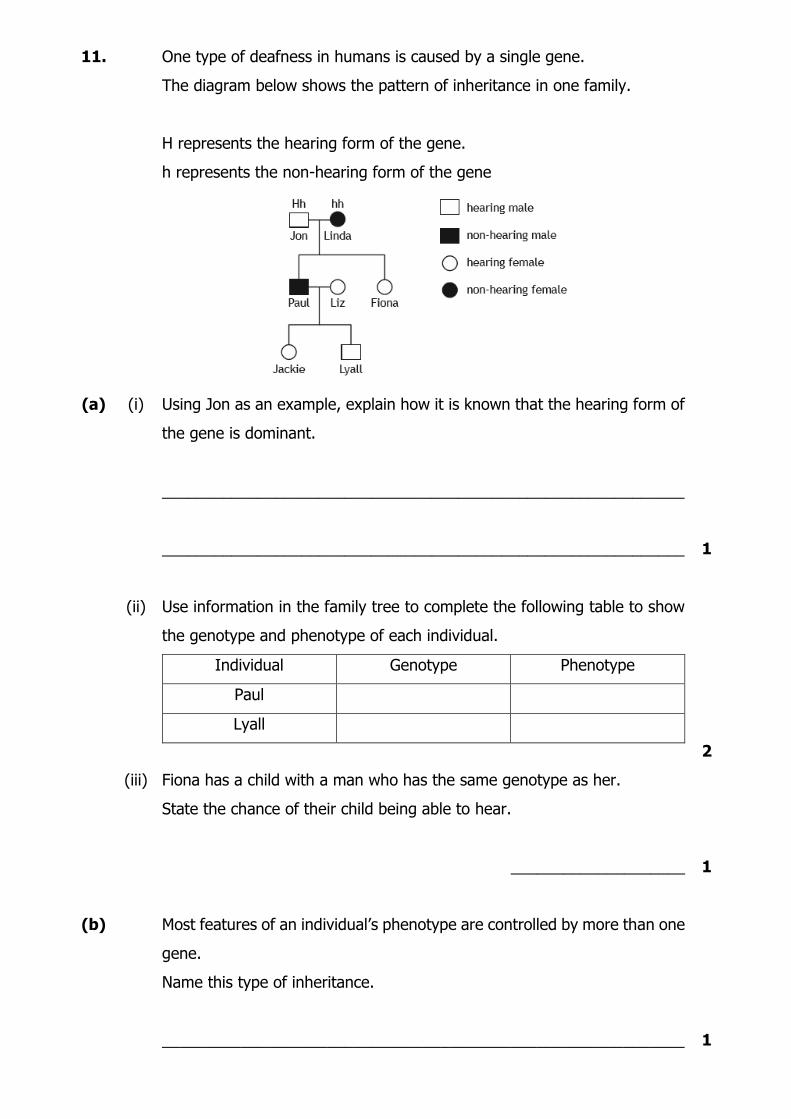
11. One type of deafness in humans is caused by a single gene.
The diagram below shows the pattern of inheritance in one family.
H represents the hearing form of the gene.
h represents the non-hearing form of the gene
(a) (i) Using Jon as an example, explain how it is known that the hearing form of
the gene is dominant.
____________________________________________________________
____________________________________________________________
1
(ii) Use information in the family tree to complete the following table to show
the genotype and phenotype of each individual.
Individual Genotype Phenotype
Paul
Lyall
2
(iii) Fiona has a child with a man who has the same genotype as her.
State the chance of their child being able to hear.
____________________
1
(b) Most features of an individual’s phenotype are controlled by more than one
gene.
Name this type of inheritance.
____________________________________________________________
1
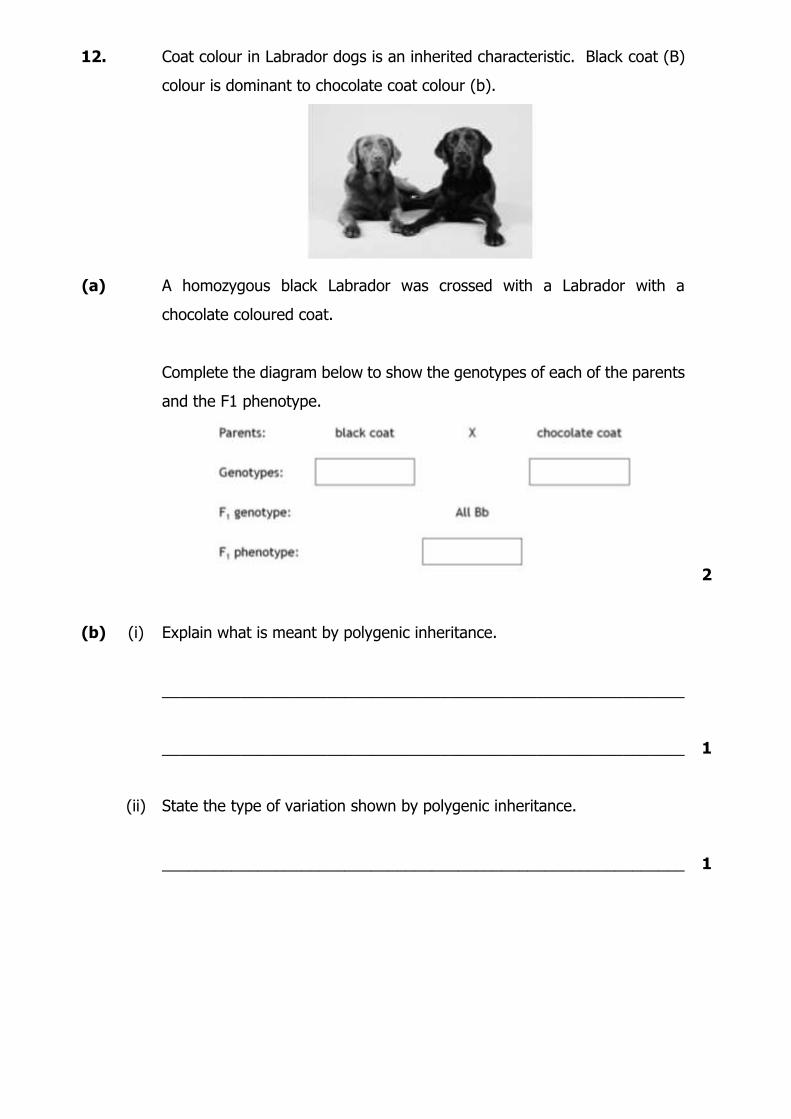
12. Coat colour in Labrador dogs is an inherited characteristic. Black coat (B)
colour is dominant to chocolate coat colour (b).
(a) A homozygous black Labrador was crossed with a Labrador with a
chocolate coloured coat.
Complete the diagram below to show the genotypes of each of the parents
and the F1 phenotype.
2
(b) (i) Explain what is meant by polygenic inheritance.
____________________________________________________________
____________________________________________________________
1
(ii) State the type of variation shown by polygenic inheritance.
____________________________________________________________
1
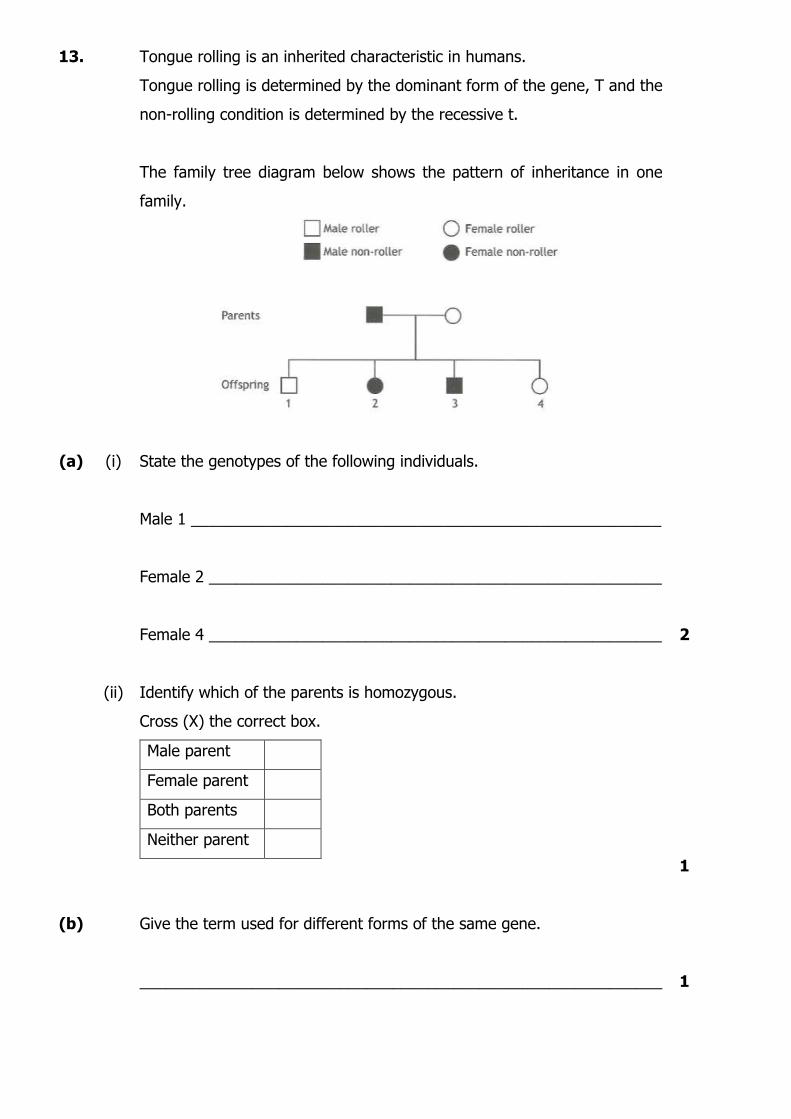
13. Tongue rolling is an inherited characteristic in humans.
Tongue rolling is determined by the dominant form of the gene, T and the
non-rolling condition is determined by the recessive t.
The family tree diagram below shows the pattern of inheritance in one
family.
(a) (i) State the genotypes of the following individuals.
Male 1 ______________________________________________________
Female 2 ____________________________________________________
Female 4 ____________________________________________________
2
(ii) Identify which of the parents is homozygous.
Cross (X) the correct box.
Male parent
Female parent
Both parents
Neither parent
1
(b) Give the term used for different forms of the same gene.
____________________________________________________________
1

(c) Tongue rolling is an example of a discrete variation.
Describe what is meant by the term ’’discrete variation’’.
____________________________________________________________
____________________________________________________________
1
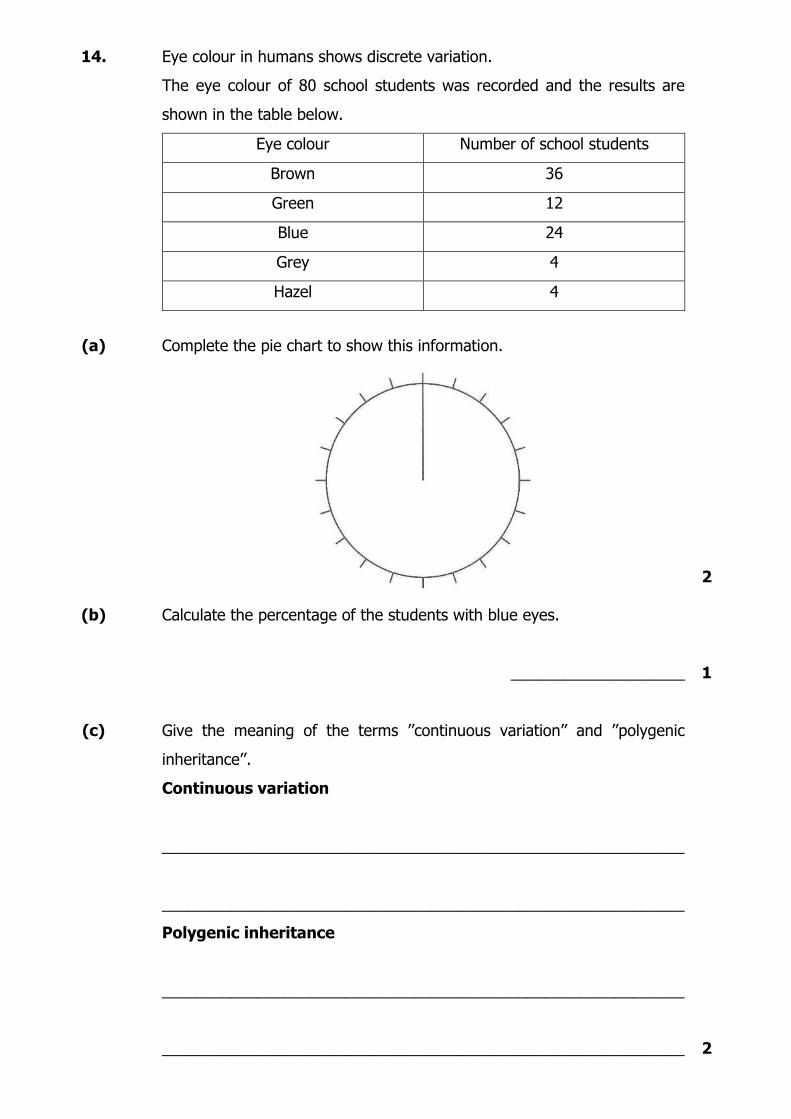
14. Eye colour in humans shows discrete variation.
The eye colour of 80 school students was recorded and the results are
shown in the table below.
Eye colour Number of school students
Brown 36
Green 12
Blue 24
Grey 4
Hazel 4
(a) Complete the pie chart to show this information.
2
(b) Calculate the percentage of the students with blue eyes.
____________________
1
(c) Give the meaning of the terms ’’continuous variation’’ and ’’polygenic
inheritance’’.
Continuous variation
____________________________________________________________
____________________________________________________________
Polygenic inheritance
____________________________________________________________
____________________________________________________________
2
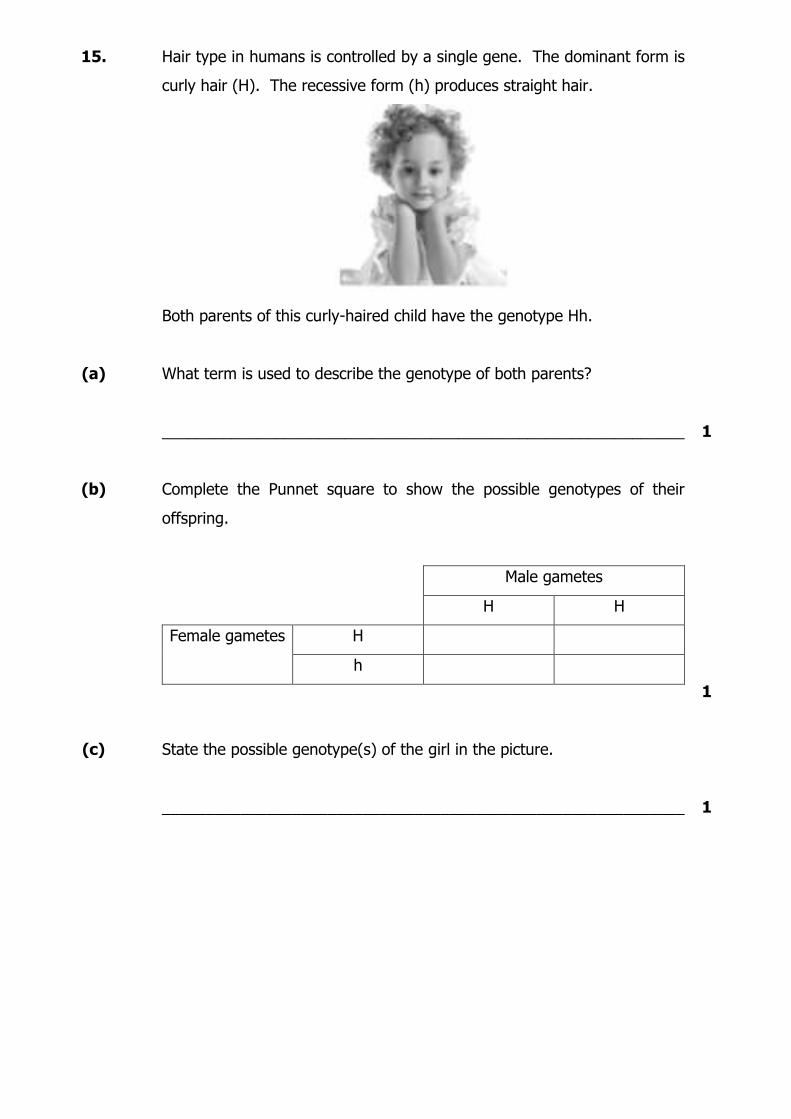
15. Hair type in humans is controlled by a single gene. The dominant form is
curly hair (H). The recessive form (h) produces straight hair.
Both parents of this curly-haired child have the genotype Hh.
(a) What term is used to describe the genotype of both parents?
____________________________________________________________
1
(b) Complete the Punnet square to show the possible genotypes of their
offspring.
Male gametes
H H
Female gametes H
h
1
(c) State the possible genotype(s) of the girl in the picture.
____________________________________________________________
1
National 5 Unit 2:
Multicellular Organisms
Topic 2.5 Transport systems – plants
1.
A
B
C
D
Transpiration is the
evaporation of water through stomata
uptake of water by root hair cells
transport of water through xylem
transport of sugars through phloem.
1
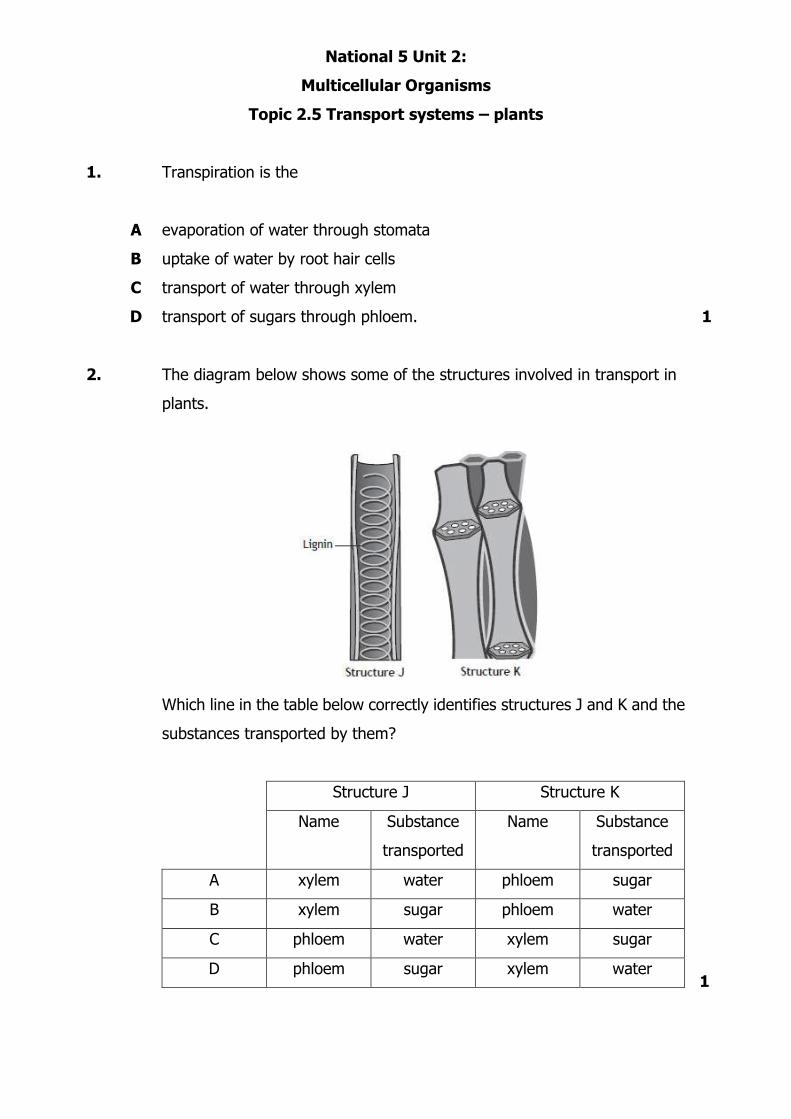
2. The diagram below shows some of the structures involved in transport in
plants.
Which line in the table below correctly identifies structures J and K and the
substances transported by them?
Structure J Structure K
Name Substance
transported
Name Substance
transported
A xylem water phloem sugar
B xylem sugar phloem water
C phloem water xylem sugar
D phloem sugar xylem water
1
3.
A
B
C
D
Transpiration occurs from the leaves of a plant.
Which environmental conditions would produce the greatest transpiration
rate?
warm and still air
cold and still air
warm and windy
cold and windy
1
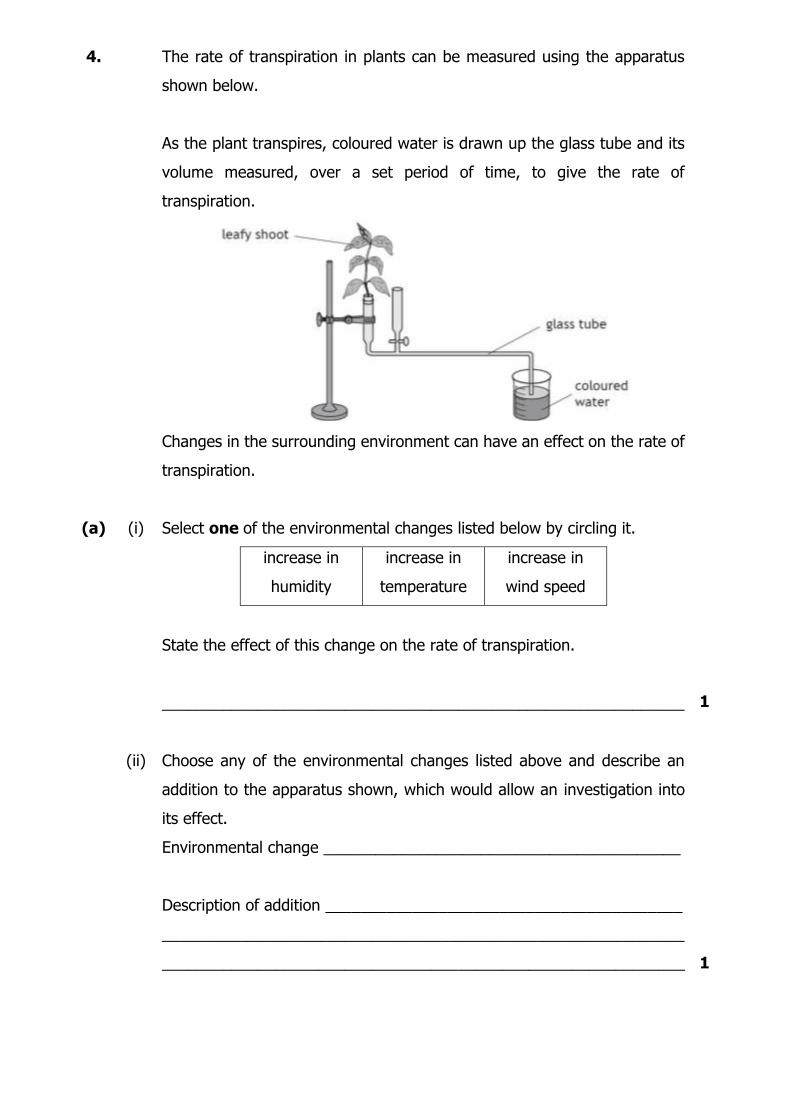
4. The rate of transpiration in plants can be measured using the apparatus
shown below.
As the plant transpires, coloured water is drawn up the glass tube and its
volume measured, over a set period of time, to give the rate of
transpiration.
Changes in the surrounding environment can have an effect on the rate of
transpiration.
(a) (i) Select one of the environmental changes listed below by circling it.
increase in
humidity
increase in
temperature
increase in
wind speed
State the effect of this change on the rate of transpiration.
____________________________________________________________
1
(ii) Choose any of the environmental changes listed above and describe an
addition to the apparatus shown, which would allow an investigation into
its effect.
Environmental change _________________________________________
Description of addition _________________________________________
____________________________________________________________
____________________________________________________________
1
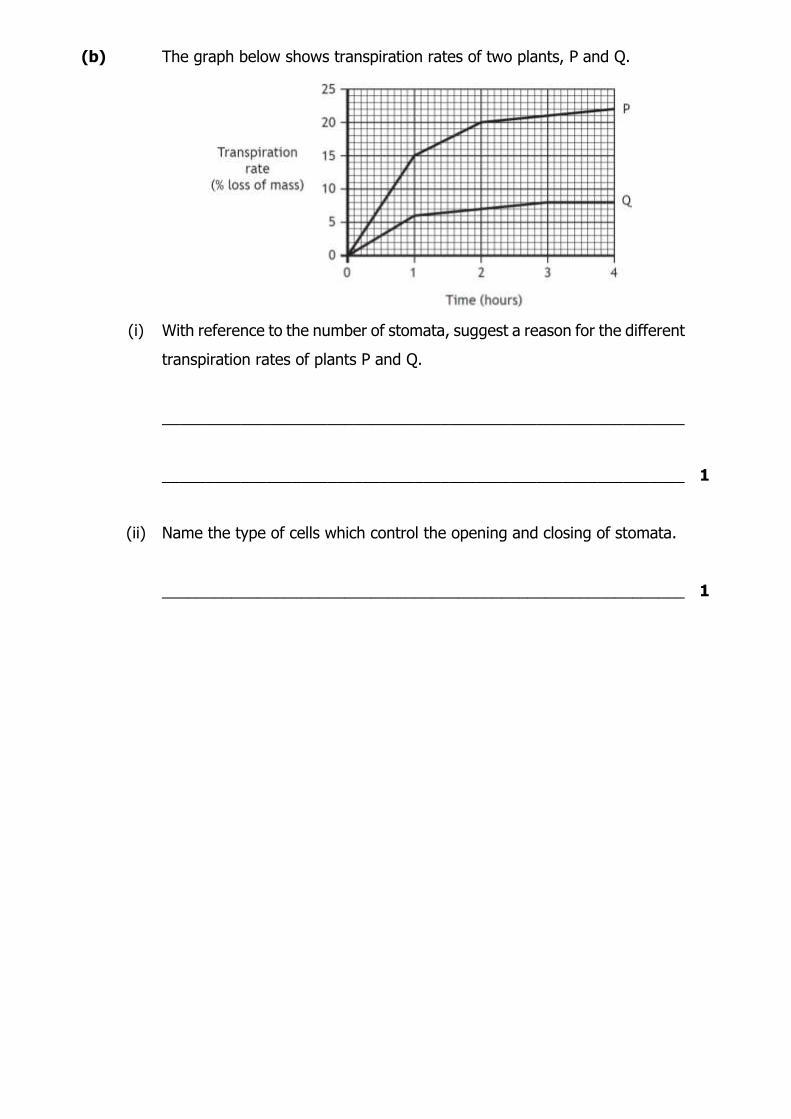
(b) The graph below shows transpiration rates of two plants, P and Q.
(i) With reference to the number of stomata, suggest a reason for the different
transpiration rates of plants P and Q.
____________________________________________________________
____________________________________________________________
1
(ii) Name the type of cells which control the opening and closing of stomata.
____________________________________________________________
1
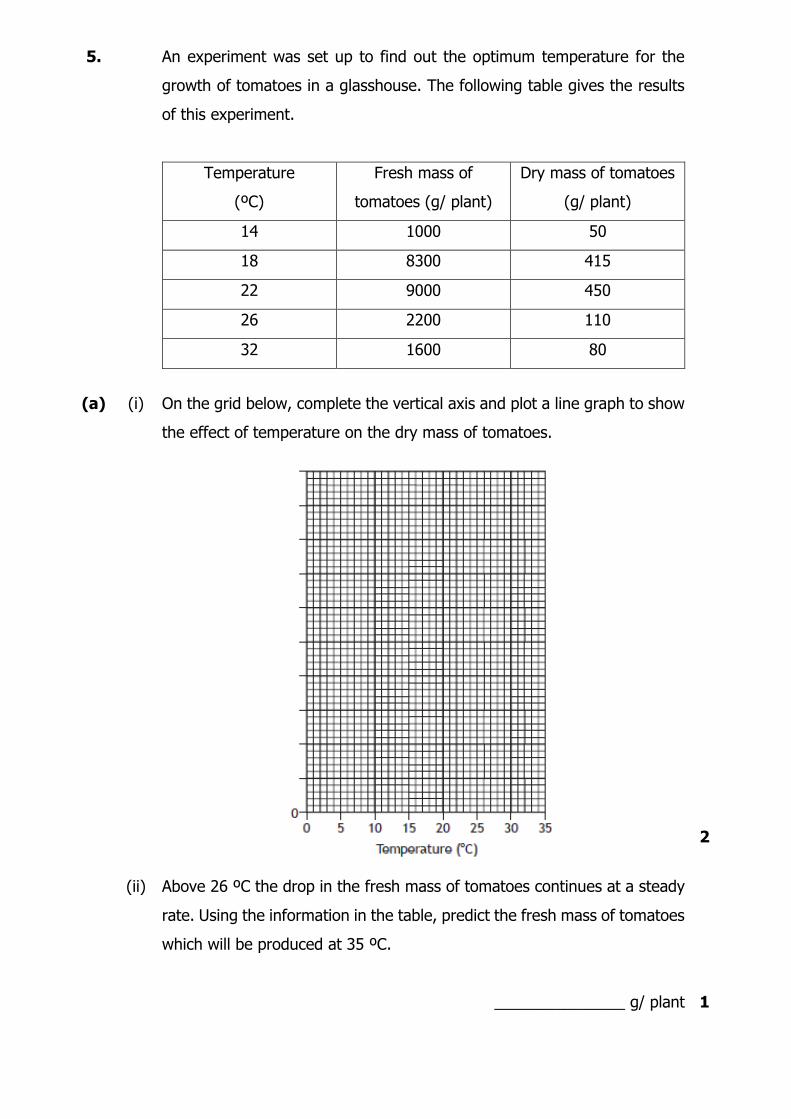
5. An experiment was set up to find out the optimum temperature for the
growth of tomatoes in a glasshouse. The following table gives the results
of this experiment.
Temperature
(ºC)
Fresh mass of
tomatoes (g/ plant)
Dry mass of tomatoes
(g/ plant)
14 1000 50
18 8300 415
22 9000 450
26 2200 110
32 1600 80
(a) (i) On the grid below, complete the vertical axis and plot a line graph to show
the effect of temperature on the dry mass of tomatoes.
2
(ii) Above 26 ºC the drop in the fresh mass of tomatoes continues at a steady
rate. Using the information in the table, predict the fresh mass of tomatoes
which will be produced at 35 ºC.
_______________ g/ plant
1
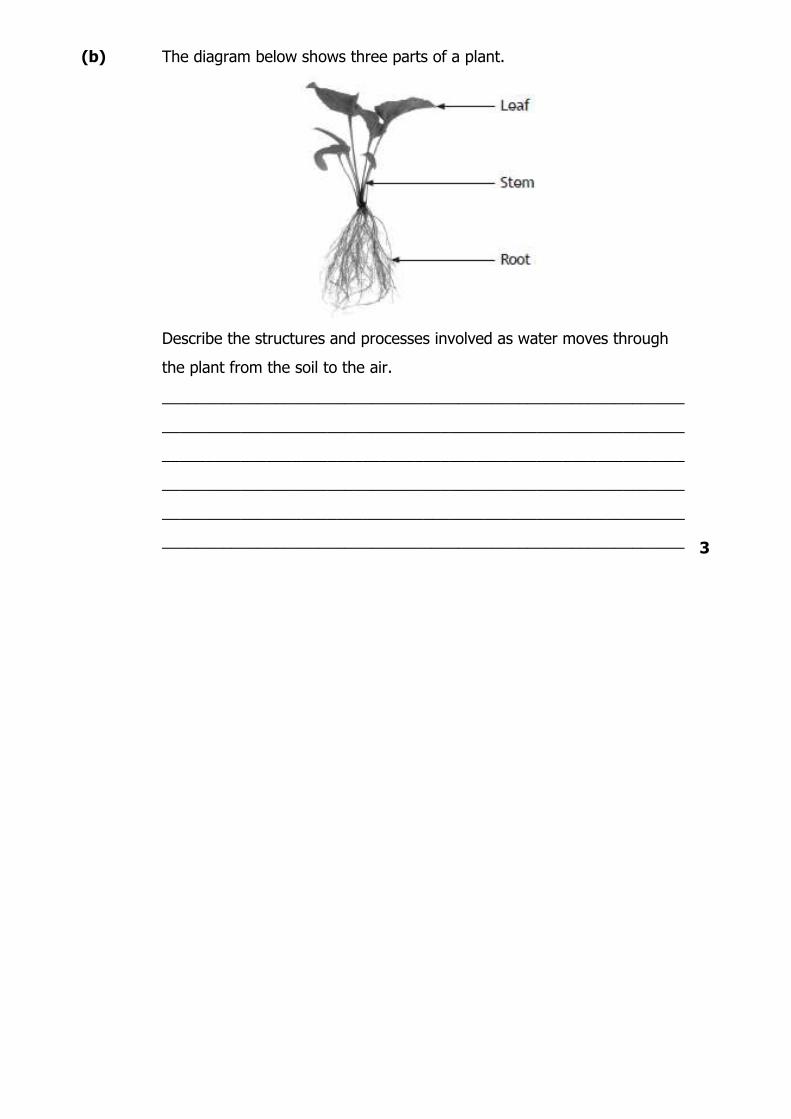
(b) The diagram below shows three parts of a plant.
Describe the structures and processes involved as water moves through
the plant from the soil to the air.
____________________________________________________________
____________________________________________________________
____________________________________________________________
____________________________________________________________
____________________________________________________________
____________________________________________________________
3
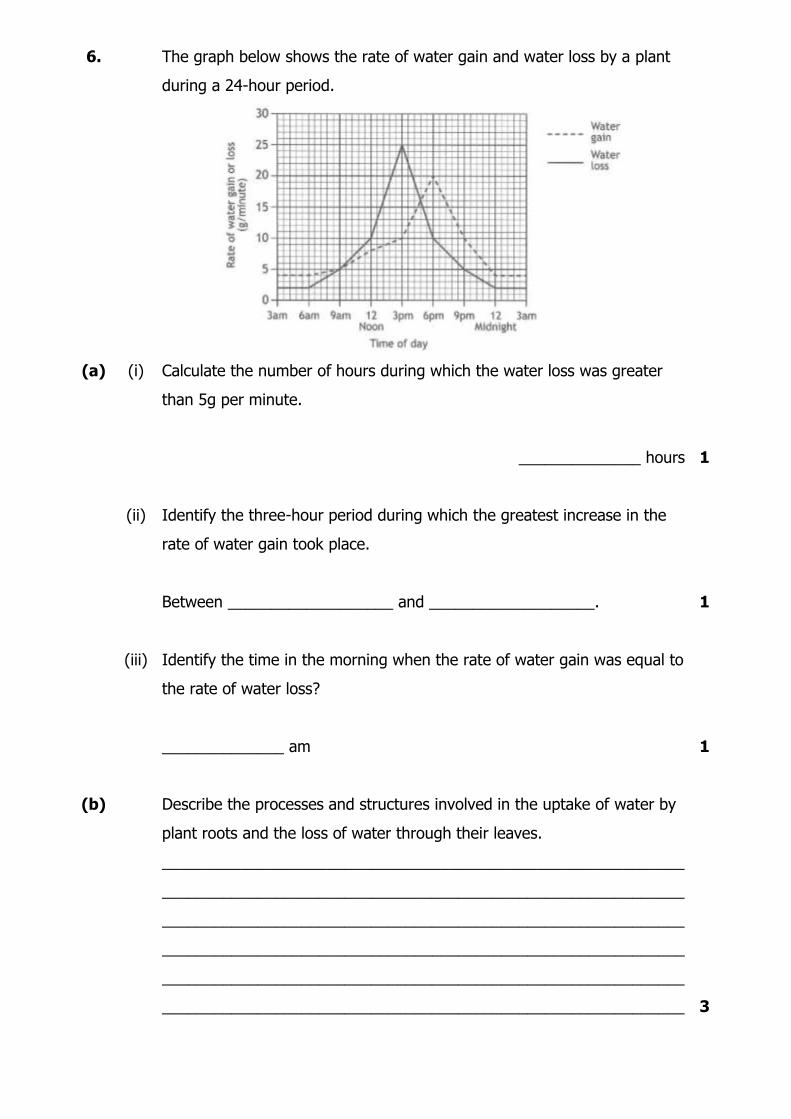
6. The graph below shows the rate of water gain and water loss by a plant
during a 24-hour period.
(a) (i) Calculate the number of hours during which the water loss was greater
than 5g per minute.
______________ hours
1
(ii) Identify the three-hour period during which the greatest increase in the
rate of water gain took place.
Between ___________________ and ___________________.
1
(iii) Identify the time in the morning when the rate of water gain was equal to
the rate of water loss?
______________ am
1
(b) Describe the processes and structures involved in the uptake of water by
plant roots and the loss of water through their leaves.
____________________________________________________________
____________________________________________________________
____________________________________________________________
____________________________________________________________
____________________________________________________________
____________________________________________________________
3
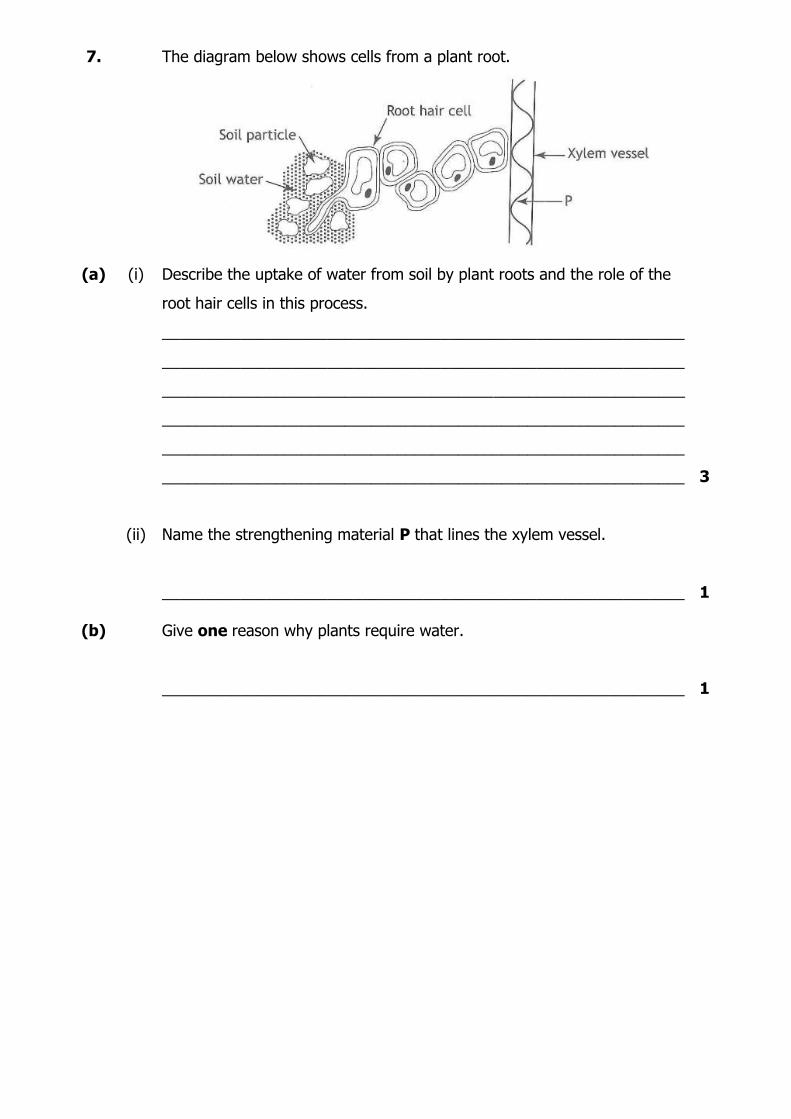
7. The diagram below shows cells from a plant root.
(a) (i) Describe the uptake of water from soil by plant roots and the role of the
root hair cells in this process.
____________________________________________________________
____________________________________________________________
____________________________________________________________
____________________________________________________________
____________________________________________________________
____________________________________________________________
3
(ii) Name the strengthening material P that lines the xylem vessel.
____________________________________________________________
1
(b) Give one reason why plants require water.
____________________________________________________________
1
National 5 Unit 2:
Multicellular Organisms
Topic 2.6 Transport systems - animals
1.
A
B
C
D
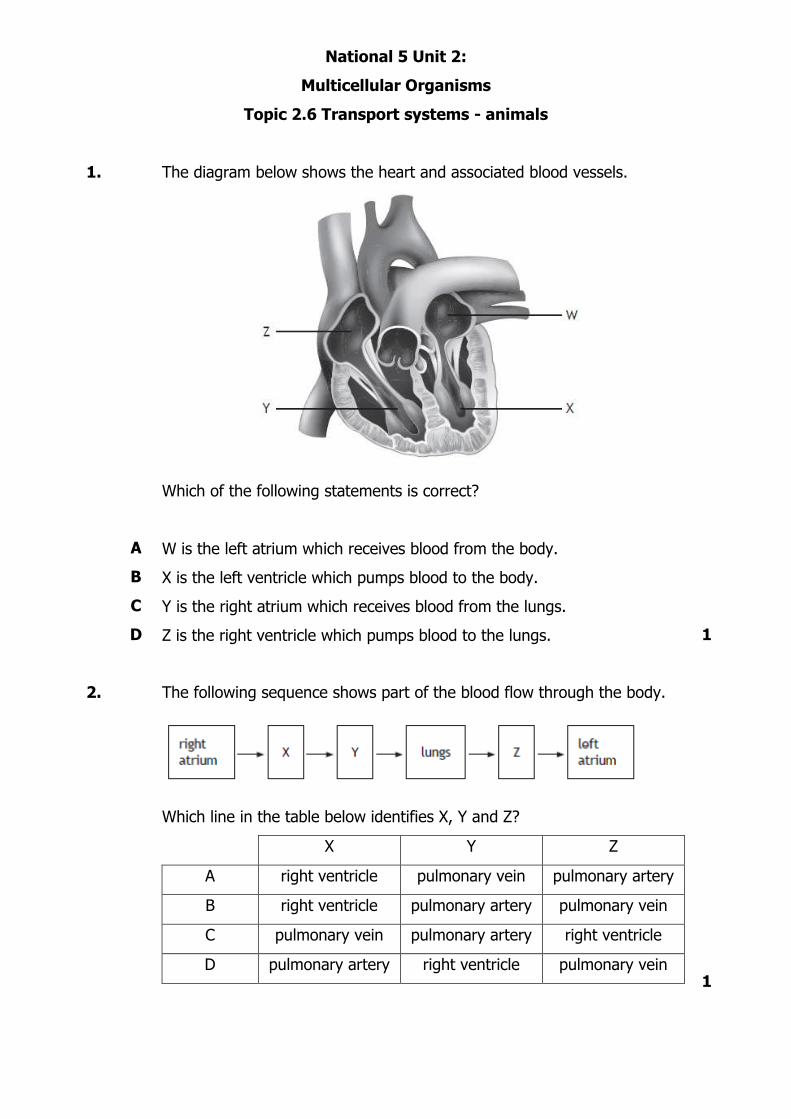
The diagram below shows the heart and associated blood vessels.
Which of the following statements is correct?
W is the left atrium which receives blood from the body.
X is the left ventricle which pumps blood to the body.
Y is the right atrium which receives blood from the lungs.
Z is the right ventricle which pumps blood to the lungs.
1
2. The following sequence shows part of the blood flow through the body.
Which line in the table below identifies X, Y and Z?
X Y Z
A right ventricle pulmonary vein pulmonary artery
B right ventricle pulmonary artery pulmonary vein
C pulmonary vein pulmonary artery right ventricle
D pulmonary artery right ventricle pulmonary vein
1
3.
A
B
C
D
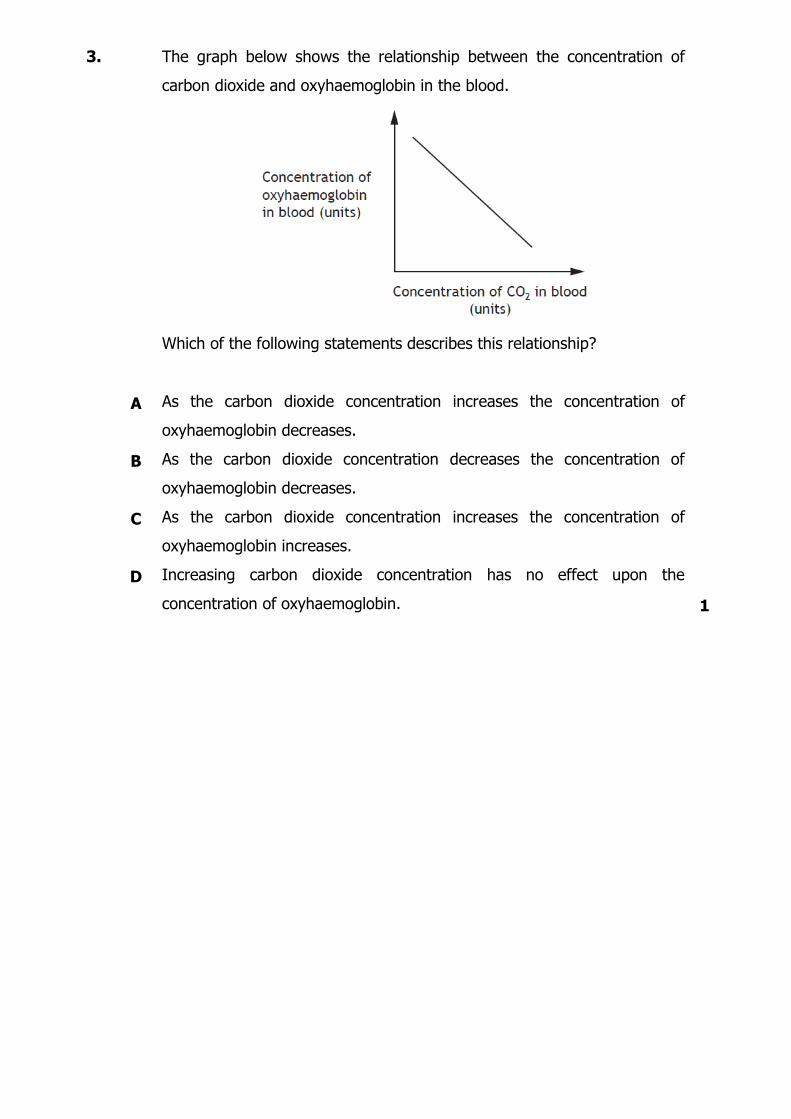
The graph below shows the relationship between the concentration of
carbon dioxide and oxyhaemoglobin in the blood.
Which of the following statements describes this relationship?
As the carbon dioxide concentration increases the concentration of
oxyhaemoglobin decreases.
As the carbon dioxide concentration decreases the concentration of
oxyhaemoglobin decreases.
As the carbon dioxide concentration increases the concentration of
oxyhaemoglobin increases.
Increasing carbon dioxide concentration has no effect upon the
concentration of oxyhaemoglobin.
1
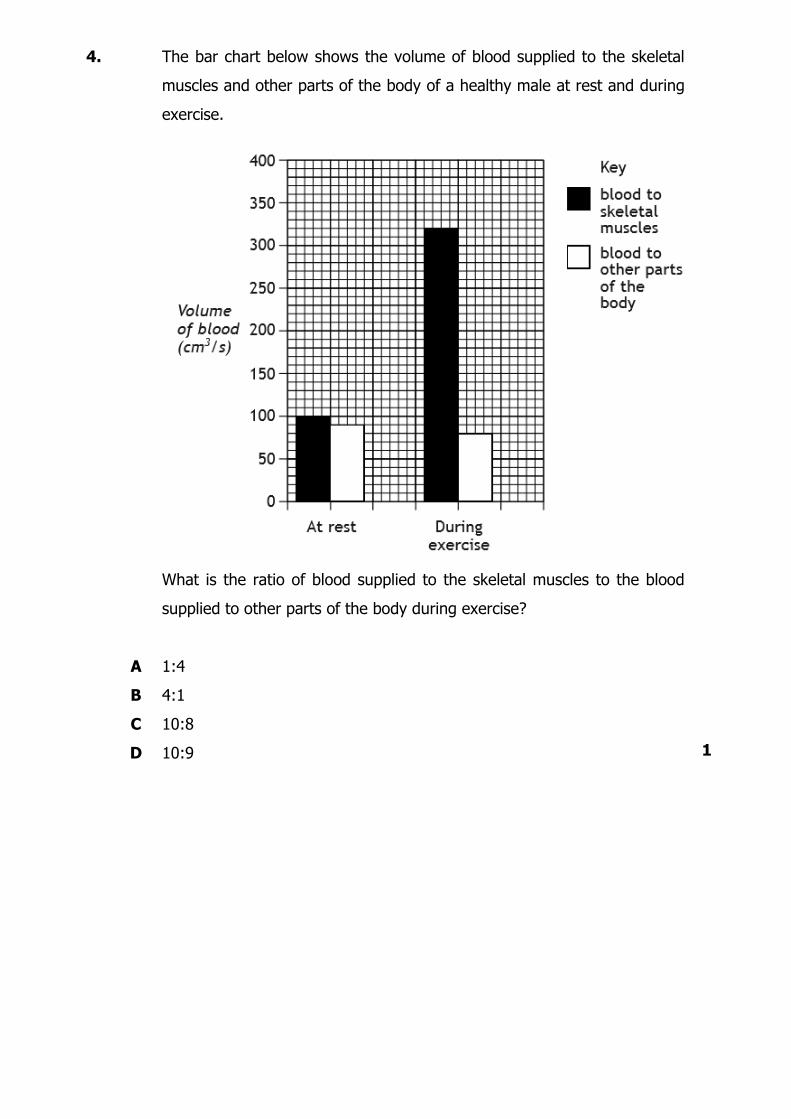
4.
The bar chart below shows the volume of blood supplied to the skeletal
muscles and other parts of the body of a healthy male at rest and during
exercise.
What is the ratio of blood supplied to the skeletal muscles to the blood
supplied to other parts of the body during exercise?
1
A
B
C
D
1:4
4:1
10:8
10:9
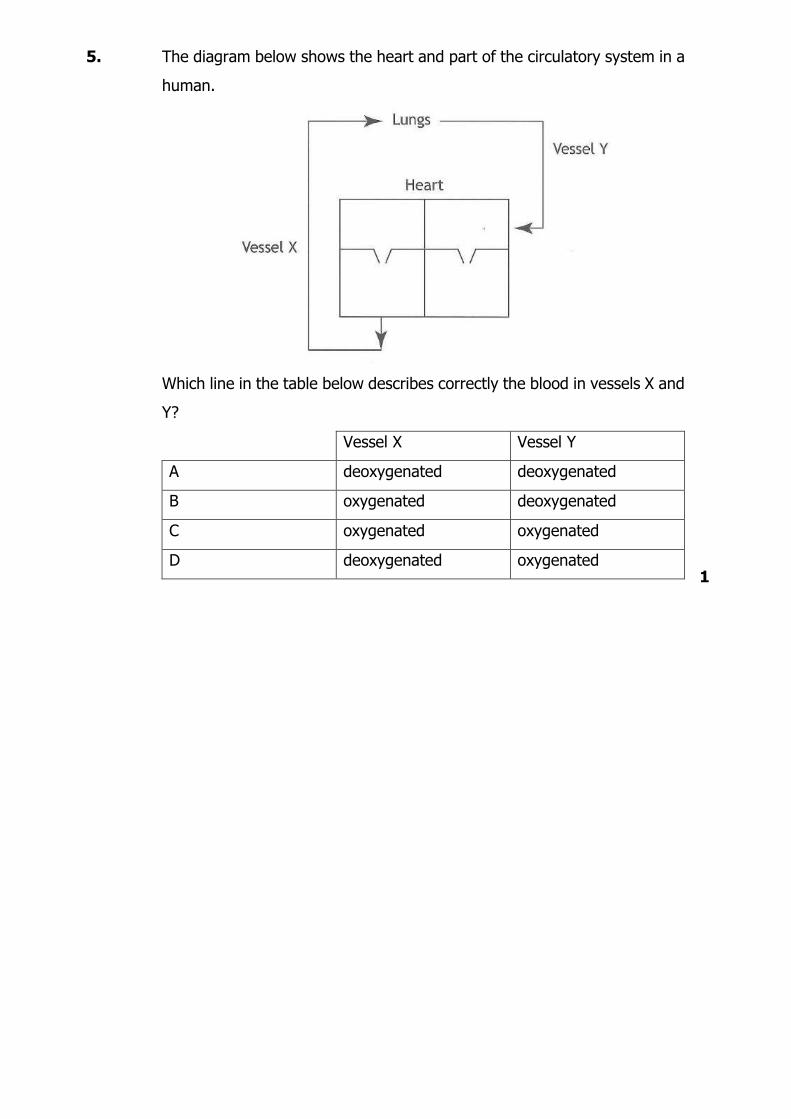
5. The diagram below shows the heart and part of the circulatory system in a
human.
Which line in the table below describes correctly the blood in vessels X and
Y?
Vessel X Vessel Y
A deoxygenated deoxygenated
B oxygenated deoxygenated
C oxygenated oxygenated
D deoxygenated oxygenated
1
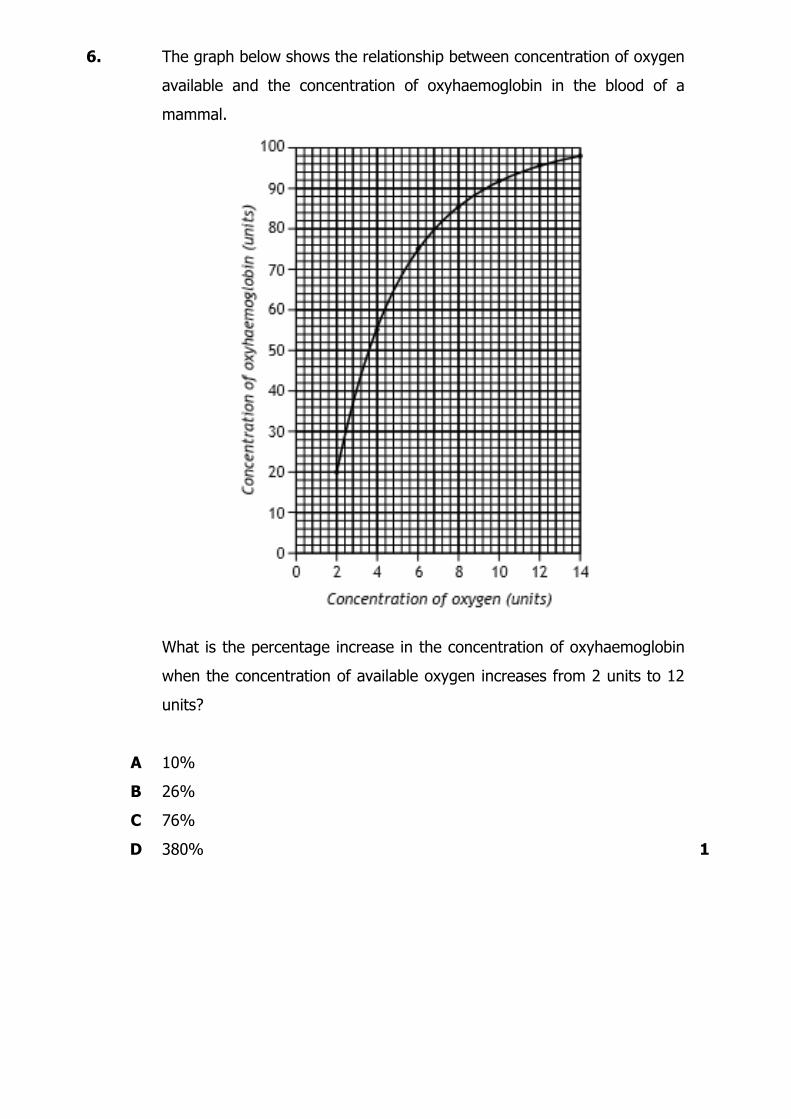
6.
The graph below shows the relationship between concentration of oxygen
available and the concentration of oxyhaemoglobin in the blood of a
mammal.
What is the percentage increase in the concentration of oxyhaemoglobin
when the concentration of available oxygen increases from 2 units to 12
units?
A
B
C
D
10%
26%
76%
380%
1
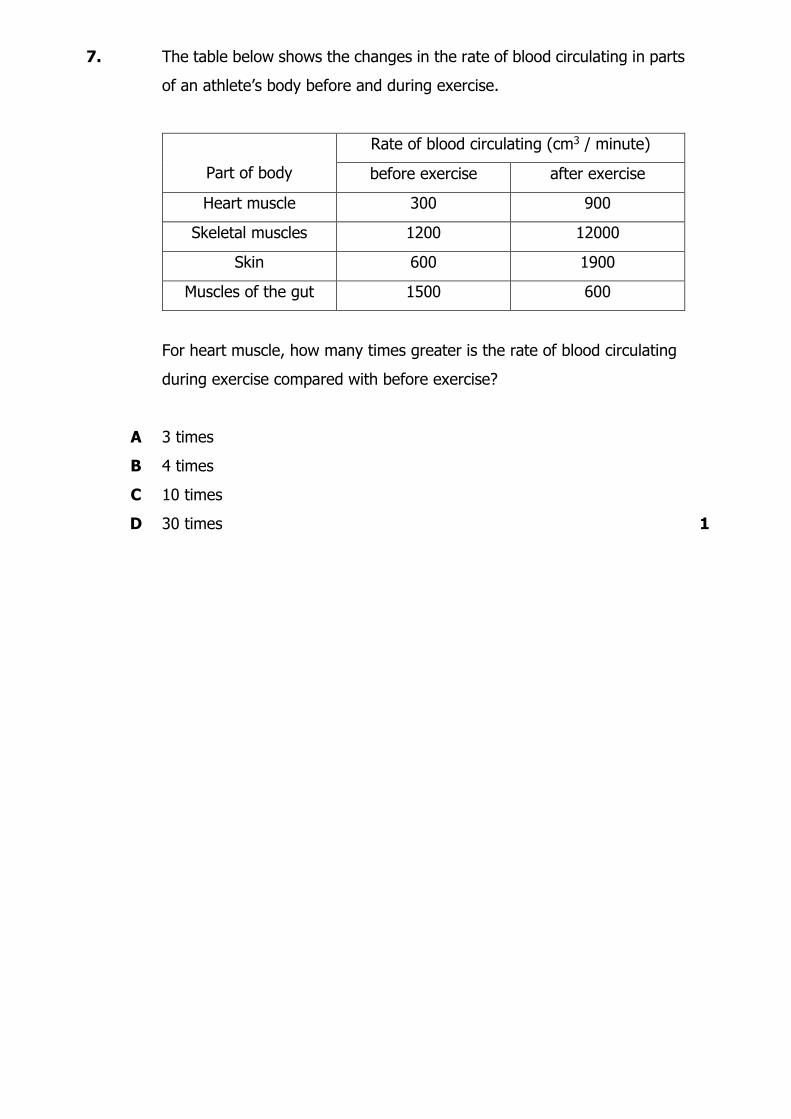
7.
The table below shows the changes in the rate of blood circulating in parts
of an athlete’s body before and during exercise.
Part of body
Rate of blood circulating (cm3 / minute)
before exercise after exercise
Heart muscle 300 900
Skeletal muscles 1200 12000
Skin 600 1900
Muscles of the gut 1500 600
For heart muscle, how many times greater is the rate of blood circulating
during exercise compared with before exercise?
A
B
C
D
3 times
4 times
10 times
30 times
1
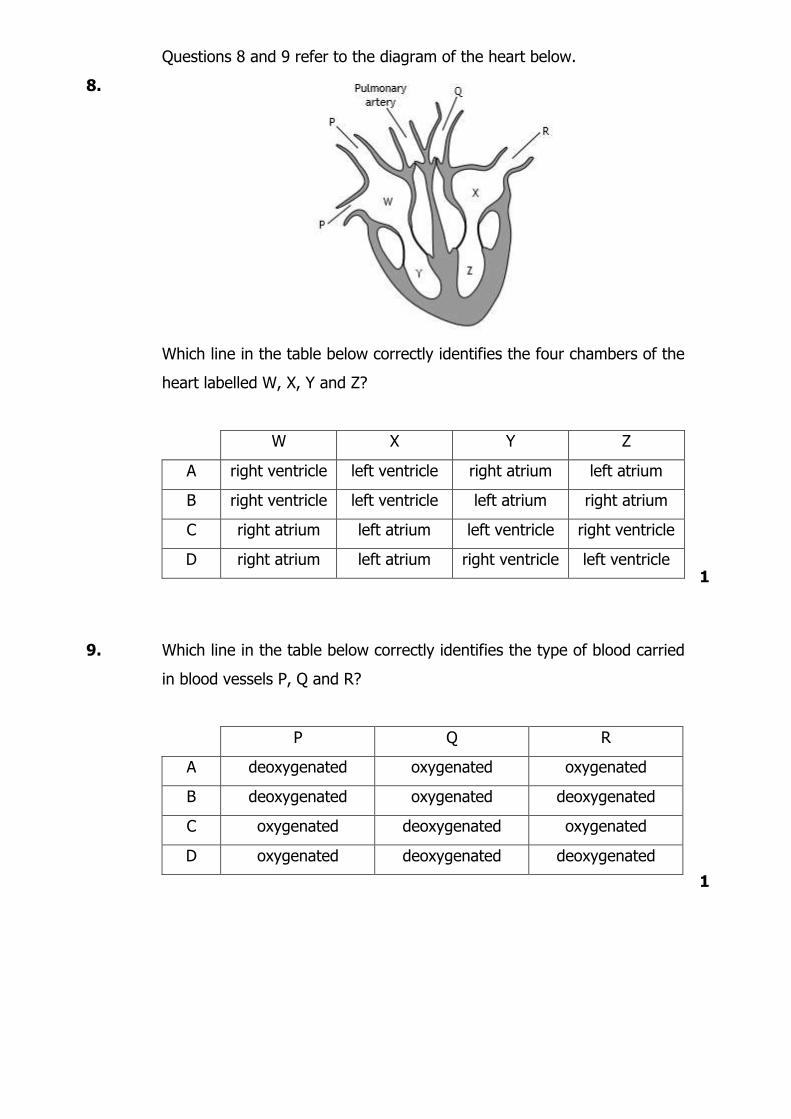
8.
Questions 8 and 9 refer to the diagram of the heart below.
Which line in the table below correctly identifies the four chambers of the
heart labelled W, X, Y and Z?
W X Y Z
A right ventricle left ventricle right atrium left atrium
B right ventricle left ventricle left atrium right atrium
C right atrium left atrium left ventricle right ventricle
D right atrium left atrium right ventricle left ventricle
1
9. Which line in the table below correctly identifies the type of blood carried
in blood vessels P, Q and R?
P Q R
A deoxygenated oxygenated oxygenated
B deoxygenated oxygenated deoxygenated
C oxygenated deoxygenated oxygenated
D oxygenated deoxygenated deoxygenated
1
10. The table below gives information about features of three different types
of blood vessel.
(a) (i) Complete the table by writing the name of the missing types of blood
vessels in the empty boxes.
Type of blood vessel Diameter of central
channel (mm)
Thickness of vessel
wall (mm)
30.0 1.5
Capillary 0.006 0.001
25.0 2.0
2
(ii) Of all the blood vessels, capillaries are best adapted for gas exchange.
Using the information in the table, give a reason for this.
____________________________________________________________
____________________________________________________________
1
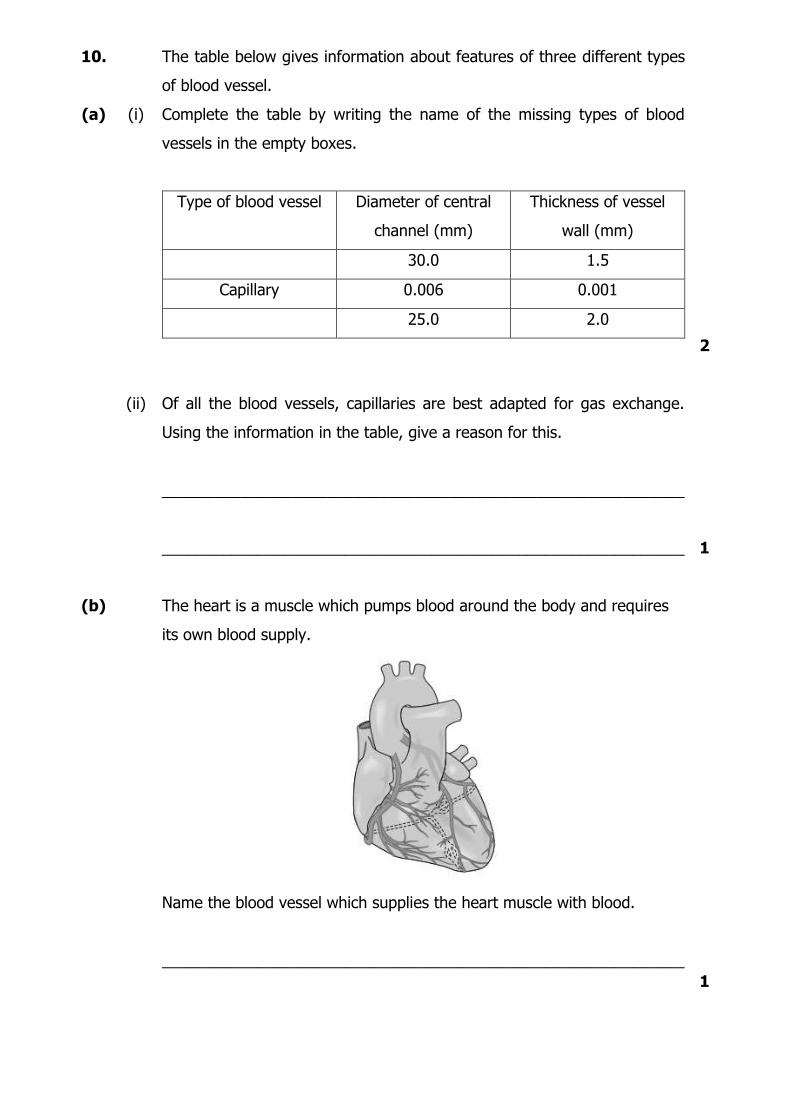
(b) The heart is a muscle which pumps blood around the body and requires
its own blood supply.
Name the blood vessel which supplies the heart muscle with blood.
____________________________________________________________
1
11. The following are types of mammalian blood vessels.
Artery Vein Capillary
(a) Choose one of these vessels and describe its structure and function.
Choice
____________________________________________________________
____________________________________________________________
____________________________________________________________
____________________________________________________________
____________________________________________________________
____________________________________________________________
3
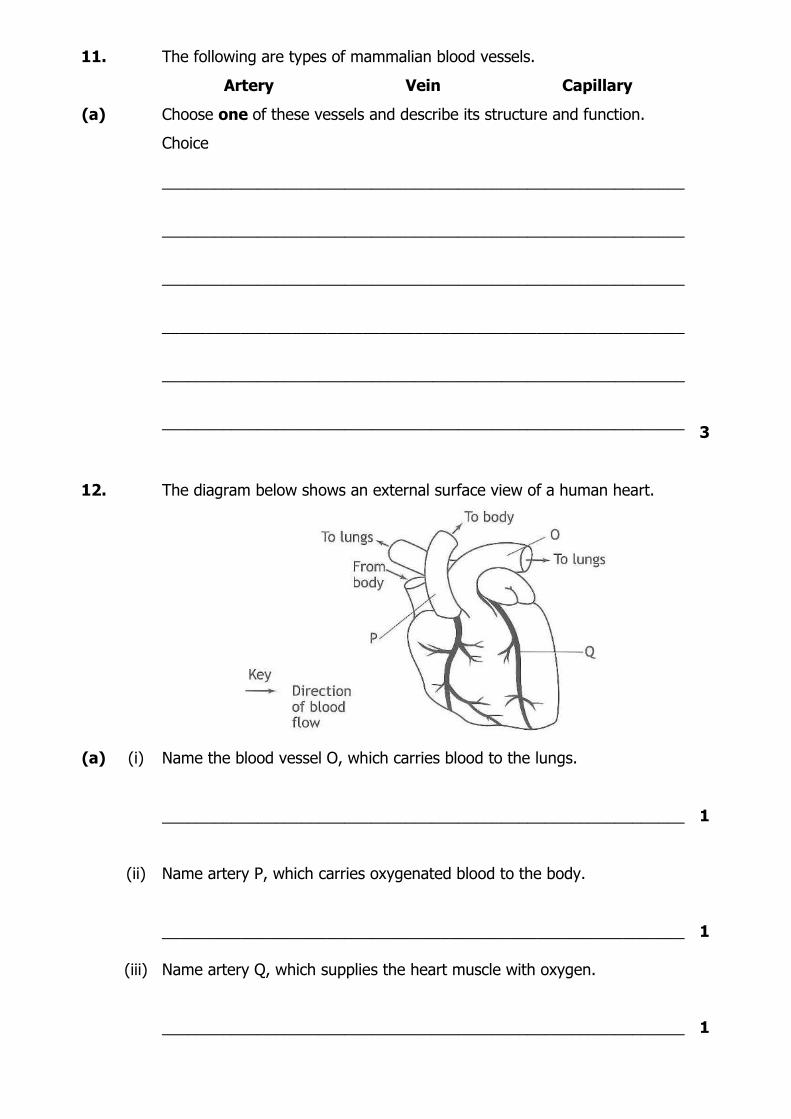
12. The diagram below shows an external surface view of a human heart.
(a) (i) Name the blood vessel O, which carries blood to the lungs.
____________________________________________________________
1
(ii) Name artery P, which carries oxygenated blood to the body.
____________________________________________________________
1
(iii) Name artery Q, which supplies the heart muscle with oxygen.
____________________________________________________________
1
13. Blood travels in three types of blood vessels.
(a) Compare the structure of two of these types of vessels.
____________________________________________________________
____________________________________________________________
____________________________________________________________
____________________________________________________________
____________________________________________________________
____________________________________________________________
3
(b) Haemoglobin is found in red blood cells. State its function.
____________________________________________________________
1
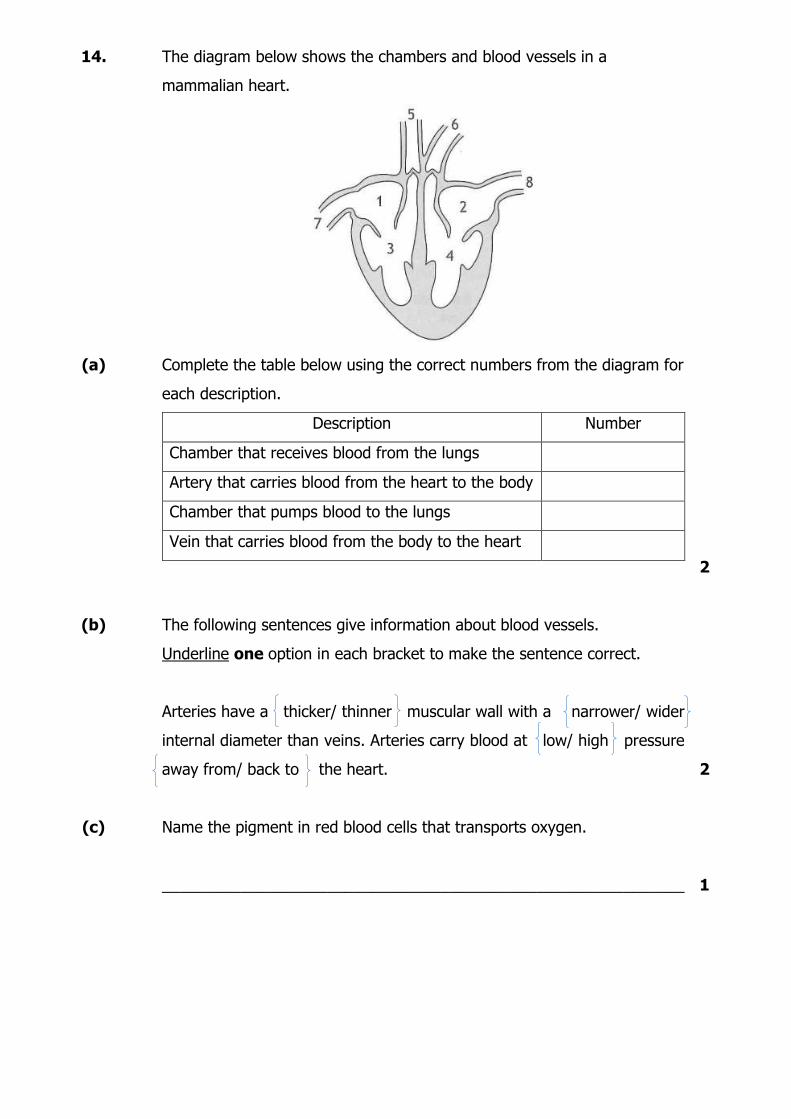
14. The diagram below shows the chambers and blood vessels in a
mammalian heart.
(a) Complete the table below using the correct numbers from the diagram for
each description.
Description Number
Chamber that receives blood from the lungs
Artery that carries blood from the heart to the body
Chamber that pumps blood to the lungs
Vein that carries blood from the body to the heart
2
(b) The following sentences give information about blood vessels.
Underline one option in each bracket to make the sentence correct.
Arteries have a thicker/ thinner muscular wall with a narrower/ wider
internal diameter than veins. Arteries carry blood at low/ high pressure
away from/ back to the heart.
2
(c) Name the pigment in red blood cells that transports oxygen.
____________________________________________________________
1
National 5 Unit 2:
Multicellular Organisms
Topic 2.7 Absorption of materials
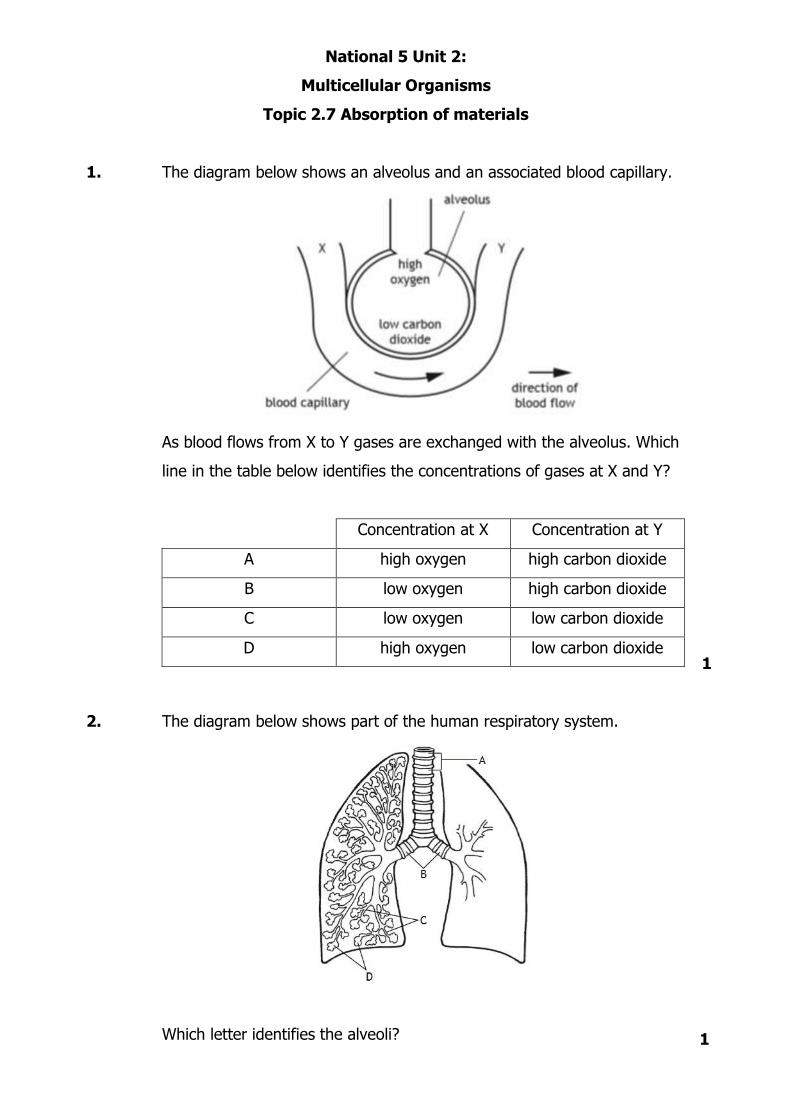
1. The diagram below shows an alveolus and an associated blood capillary.
As blood flows from X to Y gases are exchanged with the alveolus. Which
line in the table below identifies the concentrations of gases at X and Y?
Concentration at X Concentration at Y
A high oxygen high carbon dioxide
B low oxygen high carbon dioxide
C low oxygen low carbon dioxide
D high oxygen low carbon dioxide
1
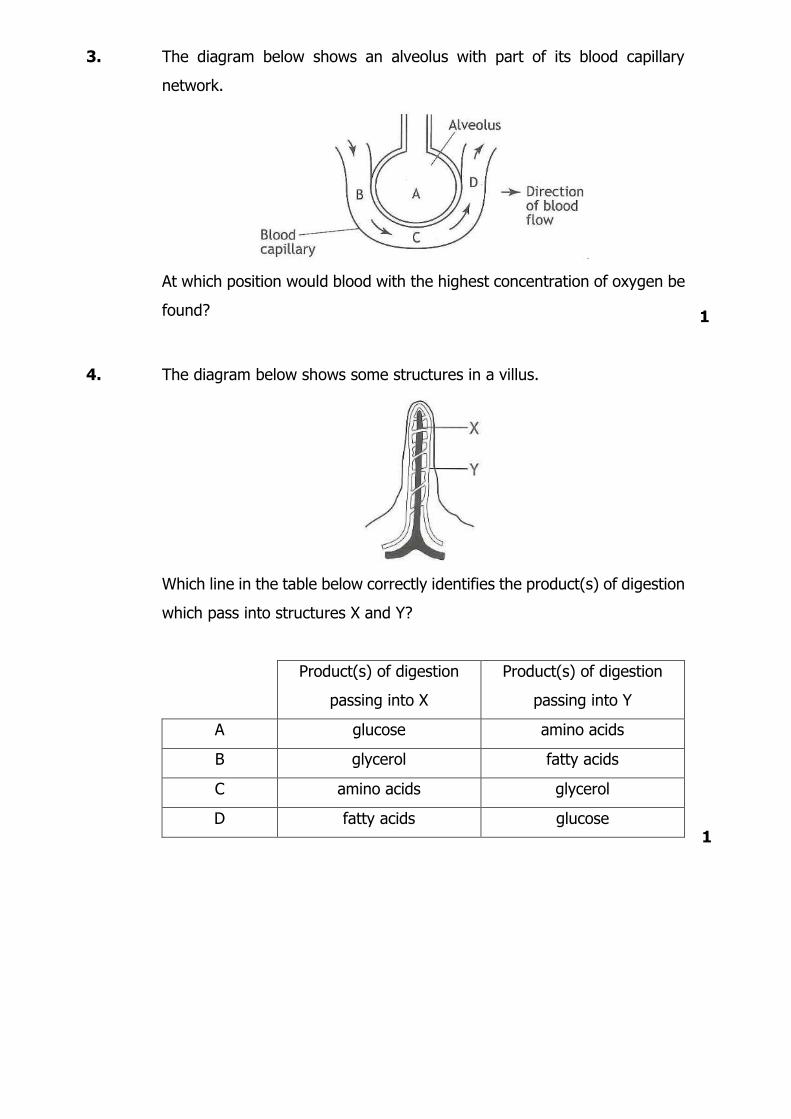
2. The diagram below shows part of the human respiratory system.
Which letter identifies the alveoli?
1
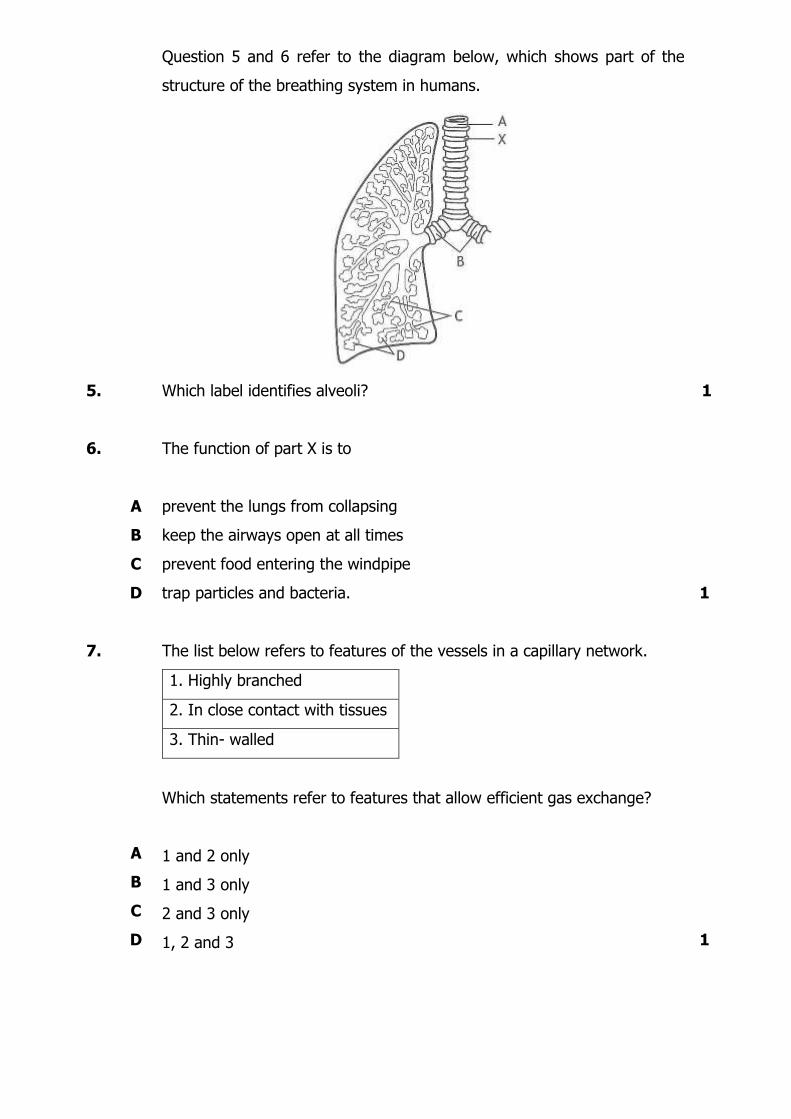
3. The diagram below shows an alveolus with part of its blood capillary
network.
At which position would blood with the highest concentration of oxygen be
found?
1
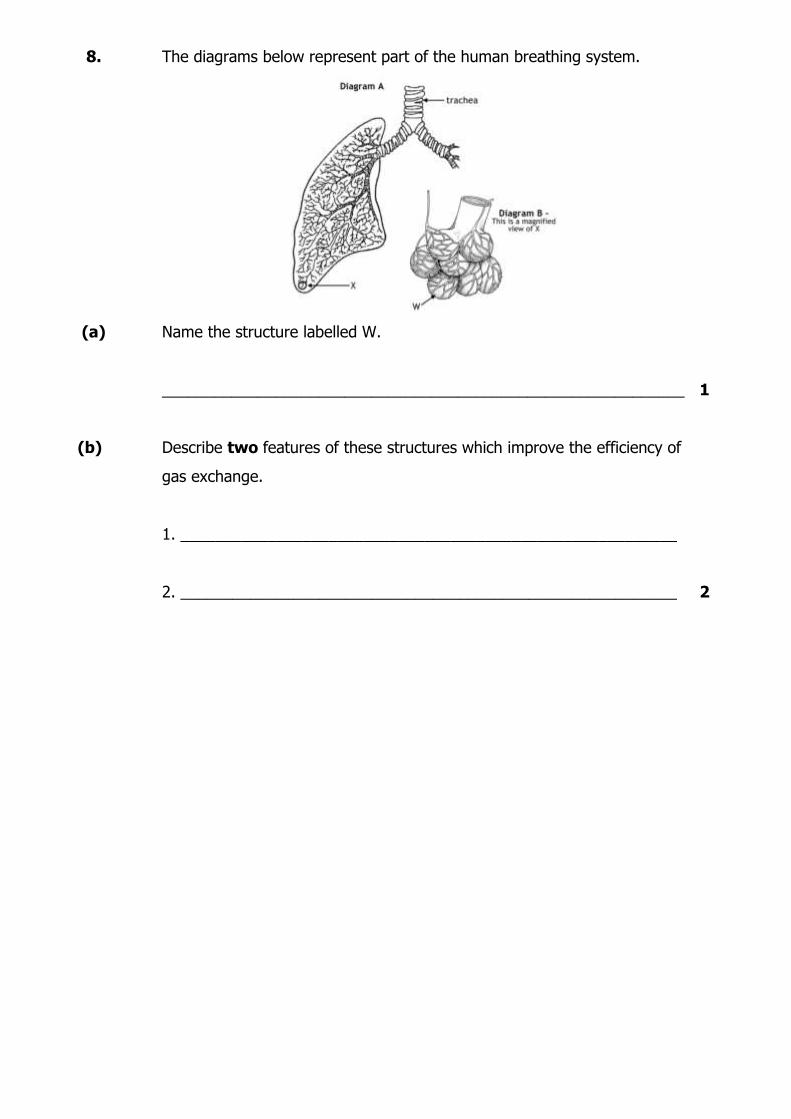
4. The diagram below shows some structures in a villus.
Which line in the table below correctly identifies the product(s) of digestion
which pass into structures X and Y?
Product(s) of digestion
passing into X
Product(s) of digestion
passing into Y
A glucose amino acids
B glycerol fatty acids
C amino acids glycerol
D fatty acids glucose
1
Question 5 and 6 refer to the diagram below, which shows part of the
structure of the breathing system in humans.
5. Which label identifies alveoli?
1
6.
A
B
C
D
The function of part X is to
prevent the lungs from collapsing
keep the airways open at all times
prevent food entering the windpipe
trap particles and bacteria.
1
7.
A
B
C
D
The list below refers to features of the vessels in a capillary network.
1. Highly branched
2. In close contact with tissues
3. Thin- walled
Which statements refer to features that allow efficient gas exchange?
1 and 2 only
1 and 3 only
2 and 3 only
1, 2 and 3
1
8. The diagrams below represent part of the human breathing system.
(a) Name the structure labelled W.
____________________________________________________________
1
(b)
Describe two features of these structures which improve the efficiency of
gas exchange.
1. _________________________________________________________
2. _________________________________________________________
2
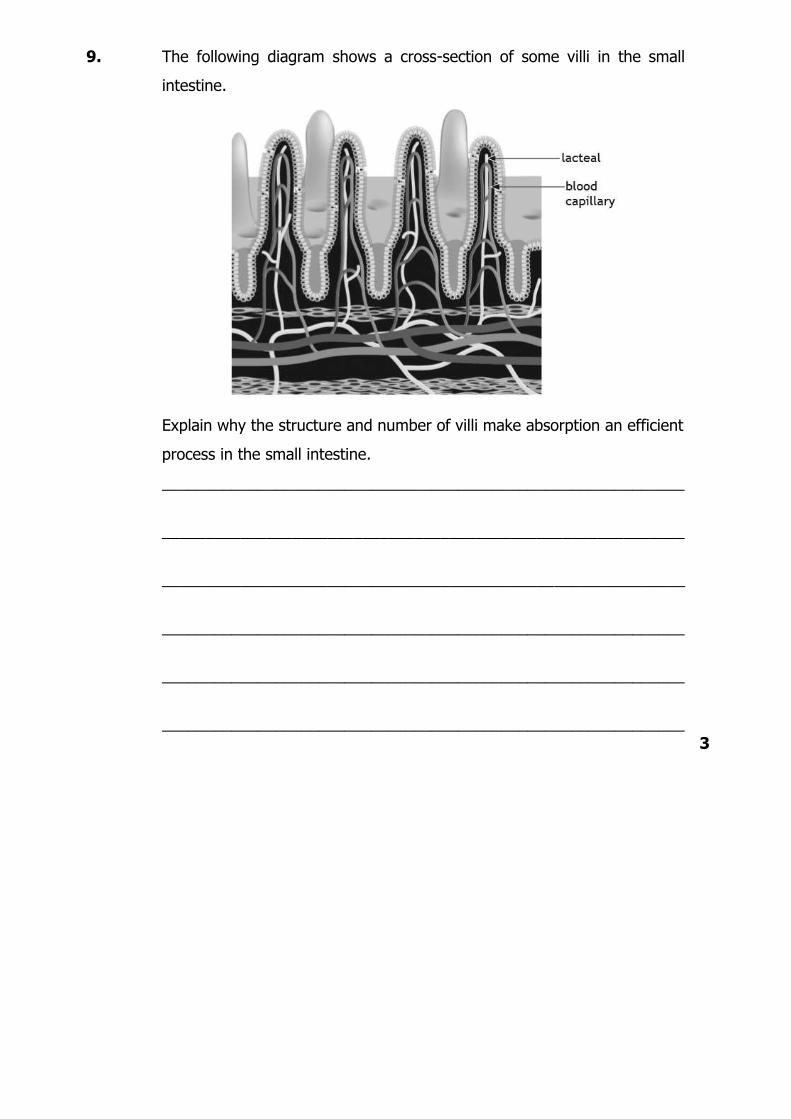
9. The following diagram shows a cross-section of some villi in the small
intestine.
Explain why the structure and number of villi make absorption an efficient
process in the small intestine.
____________________________________________________________
____________________________________________________________
____________________________________________________________
____________________________________________________________
____________________________________________________________
____________________________________________________________
3