Embed Size (px)
Citation preview

Clustering Methods
Nathaniel E. Helwig
Assistant Professor of Psychology and StatisticsUniversity of Minnesota (Twin Cities)
Updated 27-Mar-2017
Nathaniel E. Helwig (U of Minnesota) Clustering Methods Updated 27-Mar-2017 : Slide 1
Copyright
Copyright c© 2017 by Nathaniel E. Helwig
Nathaniel E. Helwig (U of Minnesota) Clustering Methods Updated 27-Mar-2017 : Slide 2
Outline of Notes
1) Similarity and DissimilarityDefining SimilarityDistance Measures
2) Hierarchical ClusteringOverviewLinkage MethodsStates Example
3) Non-Hierarchical ClusteringOverviewK Means ClusteringStates Example
Nathaniel E. Helwig (U of Minnesota) Clustering Methods Updated 27-Mar-2017 : Slide 3
Purpose of Clustering Methods
Clustering methods attempt to group (or cluster) objects based onsome rule defining the similarity (or dissimilarity) between the objects.
Distinction between clustering and classification/discrimination:Clustering: the group labels are not known a prioriClassification: the group labels are known (for a training sample)
The typical goal in clustering is to discover the “natural groupings”present in the data.
Nathaniel E. Helwig (U of Minnesota) Clustering Methods Updated 27-Mar-2017 : Slide 4
Similarity and Dissimilarity
Similarity and Dissimilarity
Nathaniel E. Helwig (U of Minnesota) Clustering Methods Updated 27-Mar-2017 : Slide 5
Similarity and Dissimilarity Defining Similarity (Between Objects)
What does it Mean for Objects to be “Similar”?
Let x = (x1, . . . , xp)′ and y = (y1, . . . , yp)
′ denote two arbitrary vectors.
Problem: We want some rule that measures the “closeness” or“similarity” between x and y.
How we define closeness (or similarity) will determine how we groupthe objects into clusters.
Rule 1: Pearson correlation between x and yRule 2: Euclidean distance between x and yRule 3: Number of matches, i.e.,
∑pj=1 1{xj=yj}
Nathaniel E. Helwig (U of Minnesota) Clustering Methods Updated 27-Mar-2017 : Slide 6
Similarity and Dissimilarity Defining Similarity (Between Objects)
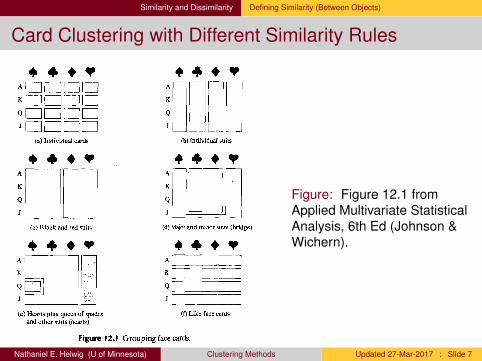
Card Clustering with Different Similarity Rules
Figure: Figure 12.1 fromApplied Multivariate StatisticalAnalysis, 6th Ed (Johnson &Wichern).
Nathaniel E. Helwig (U of Minnesota) Clustering Methods Updated 27-Mar-2017 : Slide 7
Similarity and Dissimilarity Distance Measures
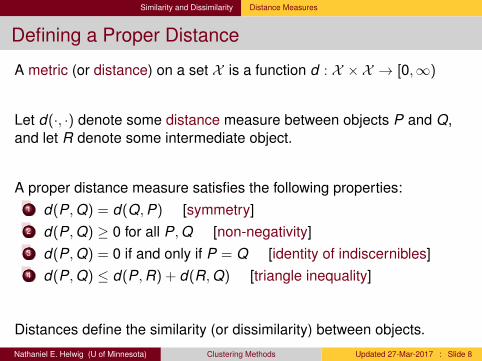
Defining a Proper Distance
A metric (or distance) on a set X is a function d : X × X → [0,∞)
Let d(·, ·) denote some distance measure between objects P and Q,and let R denote some intermediate object.
A proper distance measure satisfies the following properties:1 d(P,Q) = d(Q,P) [symmetry]2 d(P,Q) ≥ 0 for all P,Q [non-negativity]3 d(P,Q) = 0 if and only if P = Q [identity of indiscernibles]4 d(P,Q) ≤ d(P,R) + d(R,Q) [triangle inequality]
Distances define the similarity (or dissimilarity) between objects.
Nathaniel E. Helwig (U of Minnesota) Clustering Methods Updated 27-Mar-2017 : Slide 8
Similarity and Dissimilarity Distance Measures
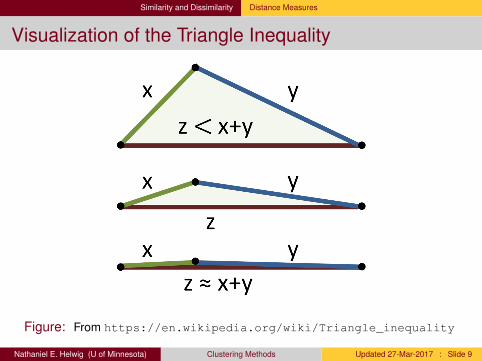
Visualization of the Triangle Inequality
Figure: From https://en.wikipedia.org/wiki/Triangle_inequality
Nathaniel E. Helwig (U of Minnesota) Clustering Methods Updated 27-Mar-2017 : Slide 9
Similarity and Dissimilarity Distance Measures
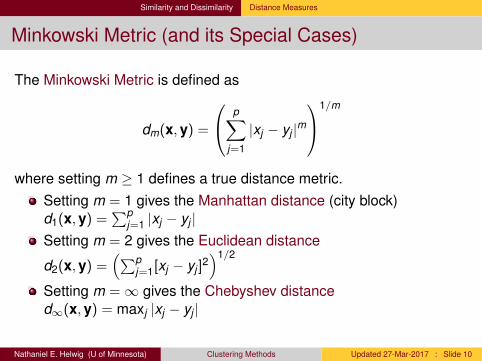
Minkowski Metric (and its Special Cases)
The Minkowski Metric is defined as
dm(x,y) =
p∑j=1
|xj − yj |m1/m
where setting m ≥ 1 defines a true distance metric.Setting m = 1 gives the Manhattan distance (city block)d1(x,y) =
∑pj=1 |xj − yj |
Setting m = 2 gives the Euclidean distance
d2(x,y) =(∑p
j=1[xj − yj ]2)1/2
Setting m =∞ gives the Chebyshev distanced∞(x,y) = maxj |xj − yj |
Nathaniel E. Helwig (U of Minnesota) Clustering Methods Updated 27-Mar-2017 : Slide 10
Hierarchical Clustering
Hierarchical Clustering
Nathaniel E. Helwig (U of Minnesota) Clustering Methods Updated 27-Mar-2017 : Slide 11
Hierarchical Clustering Overview
Two Approaches to Hierarchical Clustering
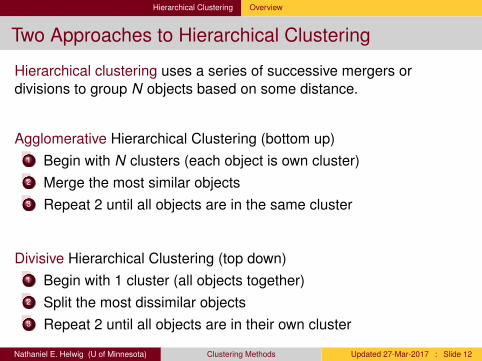
Hierarchical clustering uses a series of successive mergers ordivisions to group N objects based on some distance.
Agglomerative Hierarchical Clustering (bottom up)1 Begin with N clusters (each object is own cluster)2 Merge the most similar objects3 Repeat 2 until all objects are in the same cluster
Divisive Hierarchical Clustering (top down)1 Begin with 1 cluster (all objects together)2 Split the most dissimilar objects3 Repeat 2 until all objects are in their own cluster
Nathaniel E. Helwig (U of Minnesota) Clustering Methods Updated 27-Mar-2017 : Slide 12
Hierarchical Clustering Overview
Dissimilarity between Objects (and Clusters?)
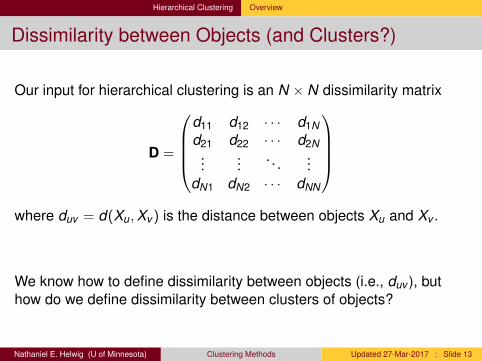
Our input for hierarchical clustering is an N × N dissimilarity matrix
D =
d11 d12 · · · d1Nd21 d22 · · · d2N
......
. . ....
dN1 dN2 · · · dNN
where duv = d(Xu,Xv ) is the distance between objects Xu and Xv .
We know how to define dissimilarity between objects (i.e., duv ), buthow do we define dissimilarity between clusters of objects?
Nathaniel E. Helwig (U of Minnesota) Clustering Methods Updated 27-Mar-2017 : Slide 13
Hierarchical Clustering Linkage Methods
Measuring Inter-Cluster Distance (Dissimilarity)
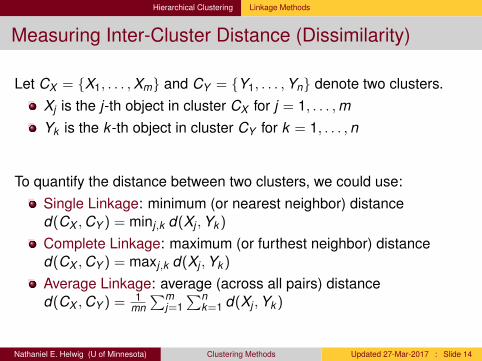
Let CX = {X1, . . . ,Xm} and CY = {Y1, . . . ,Yn} denote two clusters.Xj is the j-th object in cluster CX for j = 1, . . . ,mYk is the k -th object in cluster CY for k = 1, . . . ,n
To quantify the distance between two clusters, we could use:Single Linkage: minimum (or nearest neighbor) distanced(CX ,CY ) = minj,k d(Xj ,Yk )
Complete Linkage: maximum (or furthest neighbor) distanced(CX ,CY ) = maxj,k d(Xj ,Yk )
Average Linkage: average (across all pairs) distanced(CX ,CY ) =
1mn∑m
j=1∑n
k=1 d(Xj ,Yk )
Nathaniel E. Helwig (U of Minnesota) Clustering Methods Updated 27-Mar-2017 : Slide 14
Hierarchical Clustering Linkage Methods
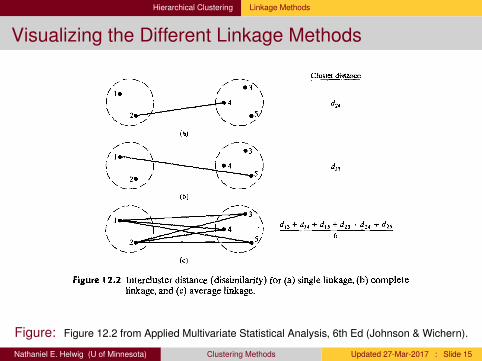
Visualizing the Different Linkage Methods
Figure: Figure 12.2 from Applied Multivariate Statistical Analysis, 6th Ed (Johnson & Wichern).
Nathaniel E. Helwig (U of Minnesota) Clustering Methods Updated 27-Mar-2017 : Slide 15
Hierarchical Clustering States Example
States Example: Dissimilarity Matrix
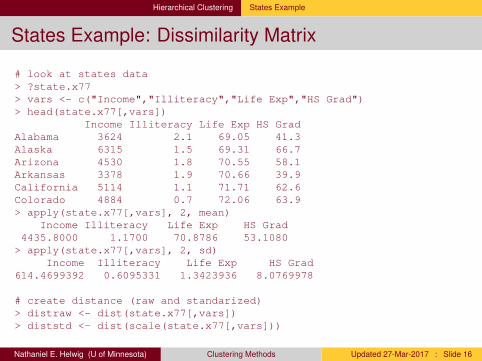
# look at states data> ?state.x77> vars <- c("Income","Illiteracy","Life Exp","HS Grad")> head(state.x77[,vars])
Income Illiteracy Life Exp HS GradAlabama 3624 2.1 69.05 41.3Alaska 6315 1.5 69.31 66.7Arizona 4530 1.8 70.55 58.1Arkansas 3378 1.9 70.66 39.9California 5114 1.1 71.71 62.6Colorado 4884 0.7 72.06 63.9> apply(state.x77[,vars], 2, mean)
Income Illiteracy Life Exp HS Grad4435.8000 1.1700 70.8786 53.1080> apply(state.x77[,vars], 2, sd)
Income Illiteracy Life Exp HS Grad614.4699392 0.6095331 1.3423936 8.0769978
# create distance (raw and standarized)> distraw <- dist(state.x77[,vars])> diststd <- dist(scale(state.x77[,vars]))
Nathaniel E. Helwig (U of Minnesota) Clustering Methods Updated 27-Mar-2017 : Slide 16
Hierarchical Clustering States Example
States Example: HCA via Three Linkage Methods
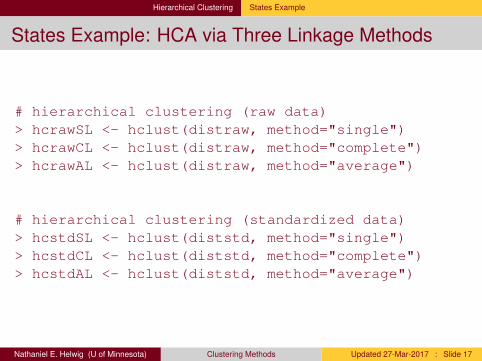
# hierarchical clustering (raw data)> hcrawSL <- hclust(distraw, method="single")> hcrawCL <- hclust(distraw, method="complete")> hcrawAL <- hclust(distraw, method="average")
# hierarchical clustering (standardized data)> hcstdSL <- hclust(diststd, method="single")> hcstdCL <- hclust(diststd, method="complete")> hcstdAL <- hclust(diststd, method="average")
Nathaniel E. Helwig (U of Minnesota) Clustering Methods Updated 27-Mar-2017 : Slide 17
Hierarchical Clustering States Example
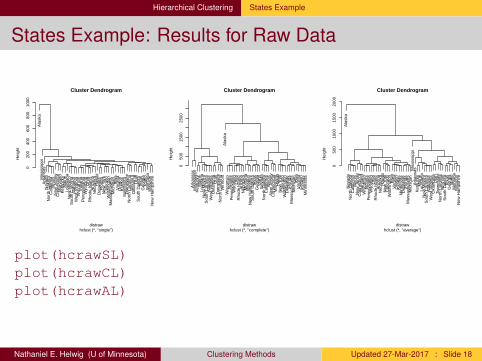
States Example: Results for Raw DataA
lask
aM
issi
ssip
piA
rkan
sas
Nev
ada
Nor
th D
akot
aC
alifo
rnia
Illin
ois
New
Jer
sey
Con
nect
icut
Mar
ylan
dK
entu
cky
Mai
neLo
uisi
ana
New
Mex
ico
Sou
th C
arol
ina
Ala
bam
aW
est V
irgin
iaW
isco
nsin
Indi
ana
Pen
nsyl
vani
aW
yom
ing
Ohi
oR
hode
Isla
ndA
rizon
aN
ebra
ska
Haw
aii
Del
awar
eF
lorid
aN
ew Y
ork
Col
orad
oW
ashi
ngto
nM
assa
chus
etts
Mic
higa
nIo
wa
Virg
inia
Ore
gon
Kan
sas
Min
neso
taTe
nnes
see
Nor
th C
arol
ina
Ver
mon
tO
klah
oma
Uta
hS
outh
Dak
ota
Texa
sG
eorg
iaId
aho
Mon
tana
Mis
sour
iN
ew H
amps
hire
020
040
060
080
010
00
Cluster Dendrogram
hclust (*, "single")distraw
Hei
ght
Ark
ansa
sM
issi
ssip
piK
entu
cky
Mai
neLo
uisi
ana
New
Mex
ico
Sou
th C
arol
ina
Ala
bam
aW
est V
irgin
iaO
klah
oma
Uta
hTe
nnes
see
Nor
th C
arol
ina
Ver
mon
tA
lask
aW
isco
nsin
Indi
ana
Pen
nsyl
vani
aW
yom
ing
Ohi
oR
hode
Isla
ndA
rizon
aN
ebra
ska
Mon
tana
Mis
sour
iN
ew H
amps
hire
Sou
th D
akot
aTe
xas
Geo
rgia
Idah
oN
evad
aN
orth
Dak
ota
Cal
iforn
iaIll
inoi
sN
ew J
erse
yC
onne
ctic
utM
aryl
and
Haw
aii
New
Yor
kC
olor
ado
Was
hing
ton
Del
awar
eF
lorid
aM
assa
chus
etts
Mic
higa
nIo
wa
Virg
inia
Ore
gon
Kan
sas
Min
neso
ta
050
015
0025
00
Cluster Dendrogram
hclust (*, "complete")distraw
Hei
ght
Ala
ska
Nev
ada
Nor
th D
akot
aC
alifo
rnia
Illin
ois
New
Jer
sey
Con
nect
icut
Mar
ylan
dW
isco
nsin
Indi
ana
Pen
nsyl
vani
aW
yom
ing
Ohi
oR
hode
Isla
ndA
rizon
aN
ebra
ska
Haw
aii
New
Yor
kC
olor
ado
Was
hing
ton
Iow
aV
irgin
iaO
rego
nK
ansa
sM
inne
sota
Del
awar
eF
lorid
aM
assa
chus
etts
Mic
higa
nM
issi
ssip
piA
rkan
sas
Ken
tuck
yM
aine
Loui
sian
aN
ew M
exic
oS
outh
Car
olin
aA
laba
ma
Wes
t Virg
inia
Okl
ahom
aU
tah
Tenn
esse
eN
orth
Car
olin
aV
erm
ont
Sou
th D
akot
aTe
xas
Geo
rgia
Idah
oM
onta
naM
isso
uri
New
Ham
pshi
re
050
010
0015
0020
00
Cluster Dendrogram
hclust (*, "average")distraw
Hei
ght
plot(hcrawSL)plot(hcrawCL)plot(hcrawAL)
Nathaniel E. Helwig (U of Minnesota) Clustering Methods Updated 27-Mar-2017 : Slide 18
Hierarchical Clustering States Example
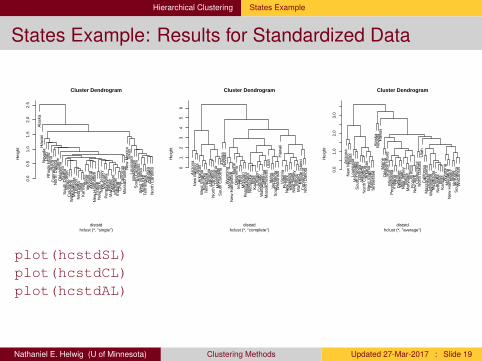
States Example: Results for Standardized DataA
lask
aH
awai
iN
evad
aU
tah
Rho
de Is
land
Ariz
ona
Con
nect
icut
Nor
th D
akot
aM
aine
Okl
ahom
aV
irgin
iaS
outh
Dak
ota
Wis
cons
inC
olor
ado
Was
hing
ton
Min
neso
taO
rego
nN
ebra
ska
Iow
aK
ansa
s Idah
oV
erm
ont
Wyo
min
gM
onta
naN
ew H
amps
hire
Flo
rida
New
Yor
kN
ew J
erse
yM
isso
uri
Pen
nsyl
vani
aIll
inoi
sM
aryl
and
Del
awar
eM
ichi
gan
Indi
ana
Ohi
o Cal
iforn
iaM
assa
chus
etts N
ew M
exic
oTe
xas
Loui
sian
aM
issi
ssip
piS
outh
Car
olin
aA
rkan
sas
Wes
t Virg
inia
Ken
tuck
yTe
nnes
see
Geo
rgia
Ala
bam
aN
orth
Car
olin
a
0.0
0.5
1.0
1.5
2.0
2.5
Cluster Dendrogram
hclust (*, "single")diststd
Hei
ght
Ariz
ona
New
Mex
ico
Texa
sA
rkan
sas
Wes
t Virg
inia
Ken
tuck
yTe
nnes
see
Geo
rgia
Ala
bam
aN
orth
Car
olin
aLo
uisi
ana
Mis
siss
ippi
Sou
th C
arol
ina
Ala
ska
Nev
ada
Wyo
min
gM
onta
naN
ew H
amps
hire M
aine
Okl
ahom
aIn
dian
aO
hio
Mis
sour
iP
enns
ylva
nia
Min
neso
taN
ebra
ska
Iow
aK
ansa
sO
rego
nC
olor
ado
Was
hing
ton
Cal
iforn
iaM
assa
chus
etts
Uta
hId
aho
Ver
mon
tS
outh
Dak
ota
Wis
cons
inH
awai
iV
irgin
iaF
lorid
aN
ew Y
ork
Del
awar
eM
ichi
gan
New
Jer
sey
Illin
ois
Mar
ylan
dR
hode
Isla
ndC
onne
ctic
utN
orth
Dak
ota0
12
34
56
Cluster Dendrogram
hclust (*, "complete")diststd
Hei
ght
Ariz
ona
New
Mex
ico
Texa
sLo
uisi
ana
Mis
siss
ippi
Sou
th C
arol
ina
Geo
rgia
Ala
bam
aN
orth
Car
olin
aA
rkan
sas
Wes
t Virg
inia
Ken
tuck
yTe
nnes
see
Ala
ska
Nev
ada
Haw
aii
Mai
neO
klah
oma
Rho
de Is
land
Mis
sour
iP
enns
ylva
nia
Indi
ana
Ohi
oD
elaw
are
Mic
higa
nN
ew J
erse
yIll
inoi
sM
aryl
and
Virg
inia
Flo
rida
New
Yor
kC
onne
ctic
utN
orth
Dak
ota
Uta
hC
alifo
rnia
Mas
sach
uset
tsC
olor
ado
Was
hing
ton
Min
neso
taO
rego
nN
ebra
ska
Iow
aK
ansa
sW
yom
ing
Mon
tana
New
Ham
pshi
reId
aho
Ver
mon
tS
outh
Dak
ota
Wis
cons
in0.0
1.0
2.0
3.0
Cluster Dendrogram
hclust (*, "average")diststd
Hei
ght
plot(hcstdSL)plot(hcstdCL)plot(hcstdAL)
Nathaniel E. Helwig (U of Minnesota) Clustering Methods Updated 27-Mar-2017 : Slide 19
Hierarchical Clustering States Example
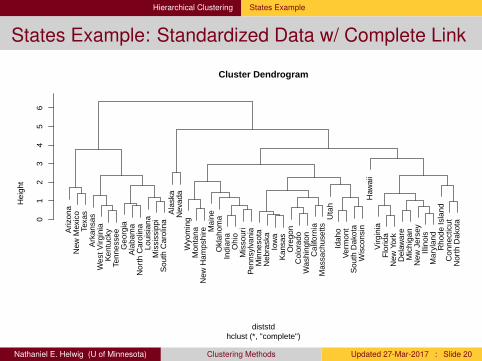
States Example: Standardized Data w/ Complete LinkA
rizon
aN
ew M
exic
oTe
xas
Ark
ansa
sW
est V
irgin
iaK
entu
cky
Tenn
esse
eG
eorg
iaA
laba
ma
Nor
th C
arol
ina
Loui
sian
aM
issi
ssip
piS
outh
Car
olin
aA
lask
aN
evad
aW
yom
ing
Mon
tana
New
Ham
pshi
re Mai
neO
klah
oma
Indi
ana
Ohi
oM
isso
uri
Pen
nsyl
vani
aM
inne
sota
Neb
rask
aIo
wa
Kan
sas
Ore
gon
Col
orad
oW
ashi
ngto
nC
alifo
rnia
Mas
sach
uset
tsU
tah
Idah
oV
erm
ont
Sou
th D
akot
aW
isco
nsin
Haw
aii
Virg
inia
Flo
rida
New
Yor
kD
elaw
are
Mic
higa
nN
ew J
erse
yIll
inoi
sM
aryl
and
Rho
de Is
land
Con
nect
icut
Nor
th D
akot
a01
23
45
6
Cluster Dendrogram
hclust (*, "complete")diststd
Hei
ght
Nathaniel E. Helwig (U of Minnesota) Clustering Methods Updated 27-Mar-2017 : Slide 20
Non-Hierarchical Clustering
Non-Hierarchical Clustering
Nathaniel E. Helwig (U of Minnesota) Clustering Methods Updated 27-Mar-2017 : Slide 21
Non-Hierarchical Clustering Overview
Non-Hierarchical Clustering: Definition
Non-hierarchical clustering partitions a set of N objects into K distinctgroups based on some distance (or dissimilarity).
The number of clusters K can be known a priori or can be estimatedas a part of the procedure.
Regardless, we need to start with some initial partition or “seed points”which define cluster centers.
Try many different randomly generated seed points
Nathaniel E. Helwig (U of Minnesota) Clustering Methods Updated 27-Mar-2017 : Slide 22
Non-Hierarchical Clustering K Means Clustering
K Means: Clustering via Distance to Centroids
K means clustering refers to the algorithm:1 Partition the N objects into K distinct clusters C1, . . . ,CK2 For each i = 1, . . . ,N:
2a Assign object Xi to cluster Ck that has closest centroid (mean)2b Update cluster centroids if Xi is reassigned to new cluster
3 Repeat 2 until all objects remain in the same cluster
Note: we could replace step 1 with “Define K seed points giving thecentroids of clusters C1, . . . ,CK ”.
It is good to use MANY random starts of the above algorithm.
Nathaniel E. Helwig (U of Minnesota) Clustering Methods Updated 27-Mar-2017 : Slide 23
Non-Hierarchical Clustering States Example
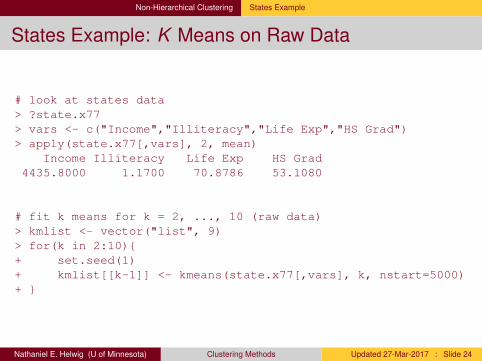
States Example: K Means on Raw Data
# look at states data> ?state.x77> vars <- c("Income","Illiteracy","Life Exp","HS Grad")> apply(state.x77[,vars], 2, mean)
Income Illiteracy Life Exp HS Grad4435.8000 1.1700 70.8786 53.1080
# fit k means for k = 2, ..., 10 (raw data)> kmlist <- vector("list", 9)> for(k in 2:10){+ set.seed(1)+ kmlist[[k-1]] <- kmeans(state.x77[,vars], k, nstart=5000)+ }
Nathaniel E. Helwig (U of Minnesota) Clustering Methods Updated 27-Mar-2017 : Slide 24
Non-Hierarchical Clustering States Example
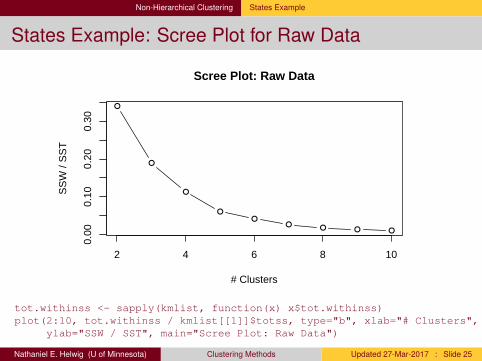
States Example: Scree Plot for Raw Data
●
●
●
●●
●● ● ●
2 4 6 8 10
0.00
0.10
0.20
0.30
Scree Plot: Raw Data
# Clusters
SS
W /
SS
T
tot.withinss <- sapply(kmlist, function(x) x$tot.withinss)plot(2:10, tot.withinss / kmlist[[1]]$totss, type="b", xlab="# Clusters",
ylab="SSW / SST", main="Scree Plot: Raw Data")
Nathaniel E. Helwig (U of Minnesota) Clustering Methods Updated 27-Mar-2017 : Slide 25
Non-Hierarchical Clustering States Example
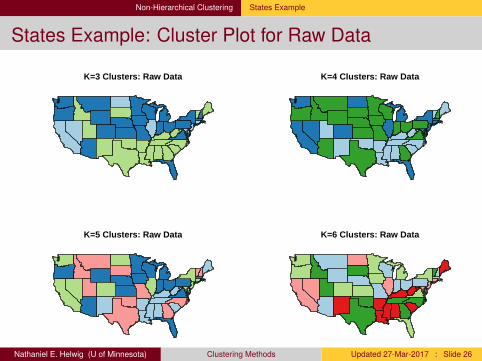
States Example: Cluster Plot for Raw Data
K=3 Clusters: Raw Data K=4 Clusters: Raw Data
K=5 Clusters: Raw Data K=6 Clusters: Raw Data
Nathaniel E. Helwig (U of Minnesota) Clustering Methods Updated 27-Mar-2017 : Slide 26
Non-Hierarchical Clustering States Example
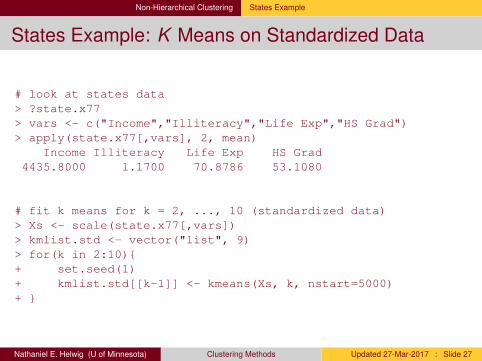
States Example: K Means on Standardized Data
# look at states data> ?state.x77> vars <- c("Income","Illiteracy","Life Exp","HS Grad")> apply(state.x77[,vars], 2, mean)
Income Illiteracy Life Exp HS Grad4435.8000 1.1700 70.8786 53.1080
# fit k means for k = 2, ..., 10 (standardized data)> Xs <- scale(state.x77[,vars])> kmlist.std <- vector("list", 9)> for(k in 2:10){+ set.seed(1)+ kmlist.std[[k-1]] <- kmeans(Xs, k, nstart=5000)+ }
Nathaniel E. Helwig (U of Minnesota) Clustering Methods Updated 27-Mar-2017 : Slide 27
Non-Hierarchical Clustering States Example
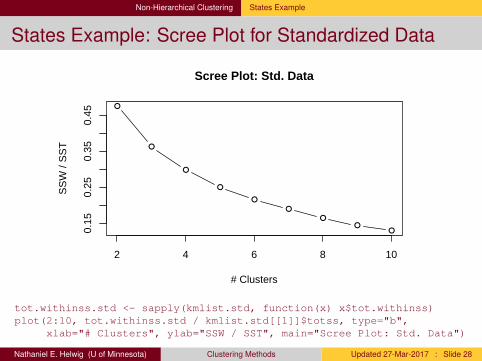
States Example: Scree Plot for Standardized Data
●
●
●
●
●
●
●●
●
2 4 6 8 10
0.15
0.25
0.35
0.45
Scree Plot: Std. Data
# Clusters
SS
W /
SS
T
tot.withinss.std <- sapply(kmlist.std, function(x) x$tot.withinss)plot(2:10, tot.withinss.std / kmlist.std[[1]]$totss, type="b",
xlab="# Clusters", ylab="SSW / SST", main="Scree Plot: Std. Data")
Nathaniel E. Helwig (U of Minnesota) Clustering Methods Updated 27-Mar-2017 : Slide 28
Non-Hierarchical Clustering States Example
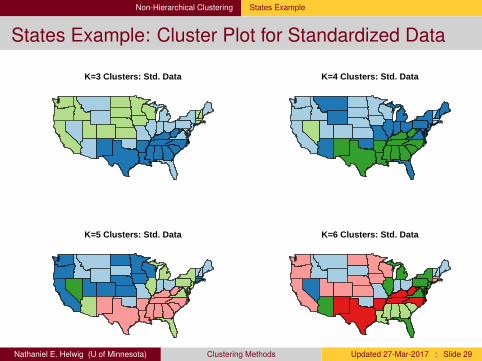
States Example: Cluster Plot for Standardized Data
K=3 Clusters: Std. Data K=4 Clusters: Std. Data
K=5 Clusters: Std. Data K=6 Clusters: Std. Data
Nathaniel E. Helwig (U of Minnesota) Clustering Methods Updated 27-Mar-2017 : Slide 29