Embed Size (px)
Citation preview
Nason Creek (Chelan County) Oxbow Reconnection Monitoring, 2010 June 2011 Publication No. 11-03-032

Publication and Contact Information This report is available on the Department of Ecology’s website at www.ecy.wa.gov/biblio/1103032.html Data for this project are available at Ecology’s Environmental Information Management (EIM) website www.ecy.wa.gov/eim/index.htm. Search User Study ID, ddug0001.
The Activity Tracker Code for this study is 10-103. For more information contact: Publications Coordinator Environmental Assessment Program P.O. Box 47600, Olympia, WA 98504-7600 Phone: (360) 407-6764
Washington State Department of Ecology - www.ecy.wa.gov/ o Headquarters, Olympia (360) 407-6000 o Northwest Regional Office, Bellevue (425) 649-7000 o Southwest Regional Office, Olympia (360) 407-6300 o Central Regional Office, Yakima (509) 575-2490 o Eastern Regional Office, Spokane (509) 329-3400 Cover photo: Department of Ecology staff conducting snorkel counts in the Chiwawa River off-channel reference site pool on June 17, 2010. Photo by Evan Newell.
Any use of product or firm names in this publication is for descriptive purposes only and does not imply endorsement by the author or the Department of Ecology.
If you need this document in a format for the visually impaired, call 360-407-6764.
Persons with hearing loss can call 711 for Washington Relay Service. Persons with a speech disability can call 877-833-6341.

Page 1
Nason Creek (Chelan County) Oxbow Reconnection
Monitoring, 2010
by
Dan Dugger
Central Regional Office Environmental Assessment Program
Washington State Department of Ecology 15 West Yakima Avenue, Suite 200
Yakima, WA 98902
Waterbody Numbers: WA-45-3000

Page 2
This page is purposely left blank

Page 3
Table of Contents
Page
List of Figures ......................................................................................................................5
List of Tables .......................................................................................................................6
Abstract ................................................................................................................................7
Acknowledgements ..............................................................................................................8
Introduction ..........................................................................................................................9 Study area and surroundings ..........................................................................................9 History of study area ......................................................................................................9
Nason Creek Oxbow Reconnection ...................................................................................11 Results of previous studies...........................................................................................12
Oxbow reconnection ............................................................................................12 Snorkel fish counts ..............................................................................................12 Summary of 2007-2008 fish counts ....................................................................12
Project Description.............................................................................................................13 Station description .......................................................................................................13
Reference sites .....................................................................................................15
Methods..............................................................................................................................19 Sampling Procedures ...................................................................................................20
Survey preparation ...............................................................................................20 Measurements ......................................................................................................20 Training ...............................................................................................................21 Day/night surveys ................................................................................................22 Ice ........................................................................................................................22 Data Management Procedures .............................................................................22
Results ................................................................................................................................23 Survey conditions.........................................................................................................23
Water temperature ...............................................................................................24 Flow .....................................................................................................................25 Salmonid species .................................................................................................25 Salmonid size .......................................................................................................28 Salmonid abundance ............................................................................................30
Discussion ..........................................................................................................................35 Changes in analysis from Murdoch and Collins (2009) ..............................................35 Survey completeness ....................................................................................................35 Fish abundance.............................................................................................................35
Pre-construction salmonid abundance .................................................................35 Post-construction changes ...................................................................................36 Other post-construction trends ............................................................................37 Factors contributing to increases in abundance ...................................................37

Page 4
Conclusions ........................................................................................................................38
Recommendations ..............................................................................................................38
References ..........................................................................................................................39
Appendices .........................................................................................................................43 Appendix A. Glossary, Acronyms, and Abbreviations ...............................................45 Appendix B. 2007 and 2008 Yakama Nation Fisheries Fish Counts .........................47 Appendix C. 2010 Washington State Department of Ecology Fish Counts ...............53

Page 5
List of Figures
Page
Figure 1. Outlet of oxbow before reconnection. Figure 2. Outlet of oxbow after reconnection. ..........................................................................................................11
Figure 3. Location of the reconnected oxbow on Nason Creek. ............................................14
Figure 4. Nason Creek oxbow south corner, July 7, 2009 .....................................................14
Figure 5. Location of the Nason Creek main-channel reference site. ....................................15
Figure 6. Nason Creek mainstem reference site during surveys, August 19, 2010. ..............16
Figure 7. Location of the Chiwawa River off-channel reference site. ...................................17
Figure 8. Chiwawa off-channel reference site outflow during surveys, June 17, 2010. ........17
Figure 9. Flow and water temperature at the Ecology Nason Creek gage compared to survey measurements, 2007-2010. .........................................................................23
Figure 10. Flow from the USGS Chiwawa River gage and water temperature from the Ecology Rock Creek (Chiwawa) gage compared to survey measurements, 2007-2010. ............................................................................................................24
Figure 11. Salmonid species distribution in the Nason Creek oxbow, 2007. ........................26
Figure 12. Salmonid species distribution in the Nason Creek oxbow, 2008. ........................26
Figure 13. Salmonid species distribution in the Nason Creek oxbow, 2010. ........................26
Figure 14. Salmonid species distribution in the Nason Creek mainstem reference site, 2007. ......................................................................................................................27
Figure 15. Salmonid species distribution in the Nason Creek mainstem reference site, 2008. ......................................................................................................................27
Figure 16. Salmonid species distribution in the Nason Creek mainstem reference site, 2010. ......................................................................................................................27
Figure 17. Salmonid species distribution in the Chiwawa River off-channel reference site, 2007 and 2008 .......................................................................................................28
Figure 18. Salmonid species distribution in the Chiwawa River off-channel reference site, 2010. ......................................................................................................................28
Figure 19. Abundance of salmonids in the Nason Creek oxbow versus time. ......................30
Figure 20. Abundance of salmonids in the Nason Creek mainstem reference site versus time. .......................................................................................................................30
Figure 21. Abundance of salmonids in the Chiwawa River off-channel reference site versus time. ...........................................................................................................31

Page 6
List of Tables
Page
Table 1. Number of surveys compared by season and site. ...................................................19
Table 2. Steelhead trout sizes for all sites, 2007-2010. .........................................................29
Table 3. Chinook salmon sizes for all sites, 2007-2010. .......................................................29
Table 4. Wilcoxon tests for salmonid abundance pre- versus post-oxbow reconnection for all sites .....................................................................................................................32
Table 5. Wilcoxon tests for salmonid abundance between 2008 and 2010 for all sites. .......33
Appendix B
Table B-1. 2007-2008 fish counts and sizes in the Nason Creek oxbow. .............................47
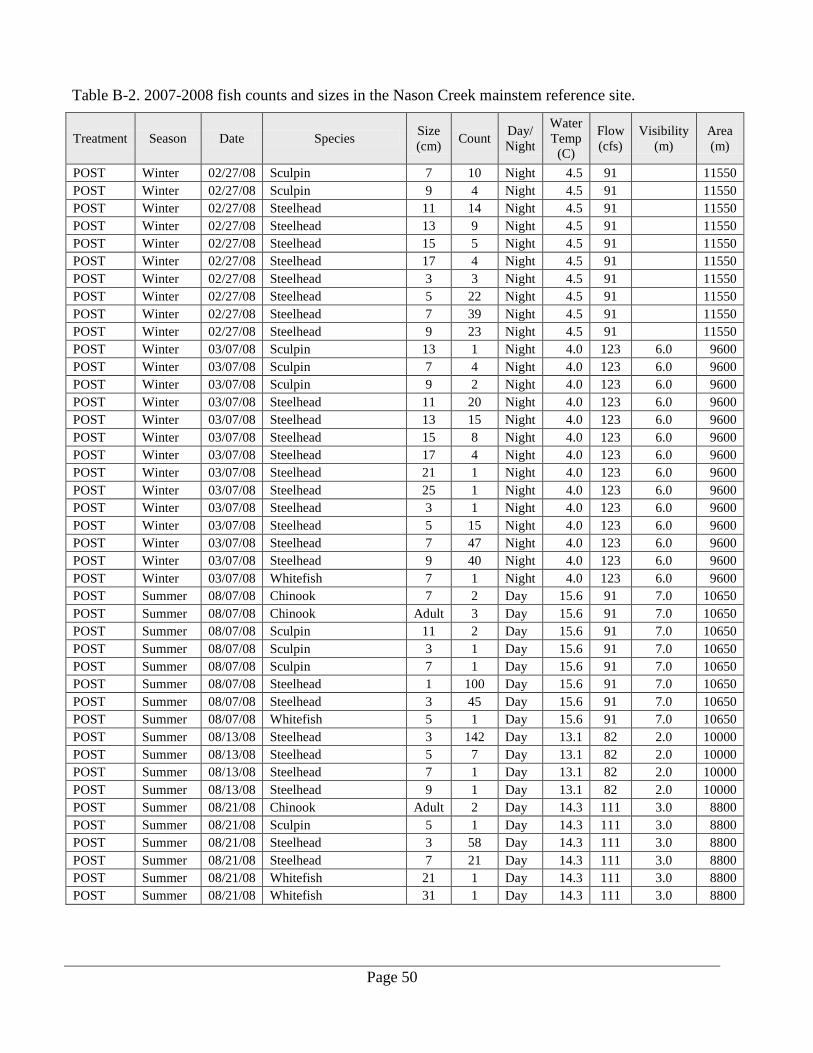
Table B-2. 2007-2008 fish counts and sizes in the Nason Creek mainstem reference site. ..49
Table B-3. 2007-2008 fish counts and sizes in the Chiwawa River off-channel reference site. .......................................................................................................................51
Appendix C
Table C-1. 2010 fish counts and sizes in the Nason Creek oxbow. .......................................53
Table C-2. 2010 fish counts and sizes in the Nason Creek mainstem reference site. ............58
Table C-3. 2010 fish counts and sizes in the Chiwawa River off-channel reference site. .....61

Page 7
Abstract In 2010, the Washington State Department of Ecology completed snorkel fish counts in a Nason Creek oxbow1 and two reference sites in the upper Wenatchee River watershed (WRIA2
45). The project continued monitoring started by Yakama Nation Fisheries on a contract with the Chelan County Natural Resources Department in 2007 and 2008.
The purpose of the project was to monitor changes in the abundance of salmonid species at the oxbow following the installation of two fish passable culverts in 2007. The culverts reconnected the oxbow to the mainstem of Nason Creek. The study supported these conclusions:
• Reconnection increased salmonid abundance in the Nason Creek oxbow over all survey seasons, 2007-08 and 2010.
• The increase was led by increases in chinook salmon and whitefish populations. Other salmonid populations also increased.
• Between 2008 and 2010, Nason Creek oxbow steelhead populations increased along with Nason Creek mainstem steelhead populations.
• Salmonid populations continued to climb in Nason Creek following the 2008 surveys. The 2010 summer survey showed the highest salmonid populations for all years, 2007-08 and 2010.
• Salmonid populations in the Nason Creek oxbow did not follow trends in the Chiwawa River off-channel reference site.
We recommend other habitat reconnection projects to improve salmonid access to rearing habitat. Reference sites should be selected within the same watershed and as close as possible to the treatment site.
1 Oxbow: A u-shaped low-flow habitat or lake formed when a meander of a stream is separated from the main flow by the cutting of a new stream channel. 2 Water Resource Inventory Area

Page 8
Acknowledgements The author of this report thanks the following people for their contribution to this study:
• Yakama Nation Fisheries staff for assistance in training, fish identification, sampling protocols, project logistics, history, and data sharing:
o Matt Collins, Fisheries Biologist.
o Keely Murdoch, Fisheries Biologist.
o Fisheries Technicians Matthew Clubb. Krista Ervin. Bryan Ishida. Nikole Offutt. Garrett Rains
• Lee Duncan with Chelan County Natural Resources Department for help with project logistics and history.
• Washington State Department of Ecology staff:
o Snorkel Field Crew
Mike Anderson, Environmental Assessment Program, Wenatchee, WA. Ryan Anderson, Water Quality Program, Yakima, WA. Jenna Durkee, Environmental Assessment Program, Yakima, WA. Sam Hunn, Toxics Cleanup Program, Yakima, WA. Evan Newell, Environmental Assessment Program, Yakima, WA. Eiko Urmos-Berry, Water Resources Program, Yakima, WA.
o Dave Holland, Shorelines and Environmental Assistance Program, Yakima, WA, for initiating the project and for project advice.
o Will Kendra, Environmental Assessment Program, for report review.

Page 9
Introduction In September 2007, the Chelan County Natural Resource Department (CCNRD) installed two fish-passable culverts to reconnect an oxbow to the mainstem of Nason Creek. The oxbow is a low-flow habitat formed when a meander of Nason Creek was cut off by the construction of Washington State Route 207 (WA-207). The purpose of the reconnection was to restore habitat for Endangered Species Act (ESA) listed Upper Columbia spring chinook (Oncorhynchus tshawytscha) and Upper Columbia steelhead (rainbow trout; Oncorhynchus mykiss). The project provided a chance to observe salmonid recolonization of historic habitat. Before and after reconnection, the Yakama Nation Fisheries Resource Management Program (Yakama Nation) conducted snorkel counts for CCNRD. Pre-construction surveys were completed in the summer of 2007. Post-construction surveys were held in the winter, spring, and summer of 2008. The sample sites included an oxbow on Nason Creek and two reference sites: one on the mainstem of Nason Creek and one on a Chiwawa River off-channel habitat. Yakama Nation reported survey results to the CCNRD. Initial trends pointed to increased counts of juvenile chinook in both the oxbow and reference reaches. However, after the 2008 post-construction surveys, further funding was unavailable. In their final report to the CCNRD, the Yakama Nation recommended further monitoring to determine whether the reconnection increased salmonid abundance in the oxbow. (Murdoch and Collins, 2009) To test whether the oxbow reconnection helped improve habitat for ESA listed salmonids, the Washington State Department of Ecology (Ecology) continued the monitoring program in 2010. Ecology followed the same survey protocols used by the Yakama Nation (Murdoch and Collins, 2009) to estimate salmonid abundance and evaluate fish abundance trends in the oxbow and two reference reaches.
Study area and surroundings Nason Creek drains about 69,000 acres from the Cascade Crest near Stevens Pass and joins the Wenatchee River just below Lake Wenatchee at river mile 53.6. Precipitation in the Wenatchee River basin ranges from 40 to 80 inches per year. About 96% of the Nason Creek subwatershed is forest, primarily fir and hemlock species. Land use includes timber harvest, rural residential, and recreation. The U.S. Forest Service manages about 78% of the watershed. (Ecology, 1995; WWPU, 2006; USBR, 2008)
History of study area The Wenatchee River basin is known for historically large salmon runs. Since the early 1900s, overfishing, the construction of dams on the Columbia River, hatchery mitigation programs,

Page 10
irrigation diversions, and habitat degradation from mining, grazing, and logging have all contributed to severely reduced salmon stocks. The Wenatchee basin is currently home to ESA listed spring chinook, summer steelhead, and bull trout. Indigenous coho were extirpated from the basin, but hatchery-introduced coho runs are beginning to establish. Sockeye spawn in Lake Wenatchee. Other salmonids in the basin include summer chinook, whitefish, and introduced brook trout (Andonaegui, 2001). Nason Creek is one of the more productive streams in the Wenatchee basin, providing habitat for all resident salmonids. However, between 1890 and 1943, construction of United States Highway 2 (US-2), WA-207, and the Great Northern railroad fragmented side-channel habitat and degraded water quality for the lower nine river miles (WWPU, 2006; USBR, 2008). Many factors pose risks for salmonid populations in the Nason Creek subwatershed (WWPU, 2006). • Road construction and channel straightening changed the flow structure. • Pool habitat was lost. • Instream flow velocity, channel erosion, and water temperature all increased. • Lack of adequate culverts contributed to the habitat loss and limited fish access to the
floodplain (USBR, 2008). • Nason Creek has failed to meet (exceeded) state and federal water quality standards for
temperature. To help restore salmonid populations, the Upper Columbia Spring Chinook Salmon and Steelhead Recovery Plan (UCSRB, 2007) recommended the reconnection of historic off-channel habitat. The expected benefits to salmon include:
• Increased habitat diversity. • Improved natural channel stability. • Restored riparian habitat. • Reduced instream sediment. • Lower water temperatures.

Page 11
Nason Creek Oxbow Reconnection CCNRD sponsored work on the initial surveys and construction for the Nason Creek oxbow reconnection project. Pre-construction monitoring for the project occurred between June and September 2007. Monitoring included surveys by snorkel fish counts conducted by the Yakama Nation (Murdoch and Collins, 2009). Between September 10 and 13, 2007, WA-207 was shut down to permit the installation of two fish passable culverts to reconnect an oxbow on Nason Creek located between mileposts 0.83 and 1.33. Prior to construction, the Yakama Nation removed all fish from the oxbow by seining and herding. Fish were transplanted to the Nason Creek mainstem across the road (Collins, personal communication, 2009). Two 12-foot diameter corrugated metal culverts were installed at the upstream and downstream ends of the oxbow. These culverts replaced a single 3-foot diameter downstream culvert. The lower portion of each culvert was buried in stream substrate to simulate a natural stream surface (Figures 1 and 2). The construction opened up 21.7 acres of off-channel refuge, rearing, and over-wintering habitat for juvenile salmonids (UCSRB, 2007).
Figure 1. Outlet of oxbow before reconnection. Figure 2. Outlet of oxbow after reconnection. (Photo credits: CCNRD.)
Post-construction surveys by snorkel fish count were conducted by Yakama Nation in the winter, spring, and summer of 2008. Results from the first year of pre- and post-construction sampling are available in Murdoch and Collins (2009).

Page 12
Results of previous studies Oxbow reconnection Oxbows are important for salmonids because oxbows may provide low-flow habitats in which adult spawners can rest and juveniles can rear and overwinter (Swales and Levings, 1989; Nickelson et al., 1992; Bonneau and Scarnecchia, 1998; Andonaegui, 2001). Oxbow reconnection shows promise in reestablishing salmonid habitat and was recommended for improving salmon populations in the Upper Columbia (UCSRB, 2007). Juvenile coho, chinook, and cutthroat seek refuge from fall and winter high stream flows in the off-channel habitats created by reconnection (Roni et al., 2002). Snorkel fish counts Yakama Nation used snorkel counts3
to estimate salmonid abundance in the sample sites. Snorkel counts are less disturbing to fish than other methods of estimating abundance (e.g., electrofishing, mark-and-recapture). Other recent studies found snorkel counts comparable to these methods (Thurow and Schill, 1996; Roni and Fayram, 2000; Thurow et al., 2006; Pink et al., 2007). Snorkel counts are used by Washington State, federal, and tribal agencies.
All 2007-2010 surveys, except for winter, occurred during the day. Winter surveys were held at night. Previous studies showed little difference between night and day snorkel counts in warm water (Thurow and Schill, 1996; Thurow et al., 2006). However, night surveys were more effective in icy (winter) water because of daytime concealment by salmonids at low water temperatures (Roni and Fayram, 2000; Bradford and Higgins, 2001; Thurow et al., 2006). Summary of 2007-2008 fish counts Results from the 2007-2008 Yakama Nation fish counts are reported in Murdoch and Collins (2009) and Tables B-1 to B-3 of Appendix B in this report. Pre-construction surveys in 2007 found chinook and steelhead in all sites including the oxbow. However, fish were found only in the vicinity of the single outlet culvert. Juvenile salmonids could enter the oxbow from the downstream outlet culvert during high streamflows, but were stranded in the oxbow during low-flow periods. Counts of juvenile salmonids in the oxbow declined between the spring high-flow and the summer low-flow surveys in 2007. The two reference sites were not sampled in the spring of 2007. Following reconnection of the oxbow in 2007, surveys were conducted in the winter, spring, and summer of 2008. Yakama crews documented juvenile chinook and steelhead occupying new habitat areas as well as rearing and spawning within the reconnected oxbow.
3 Underwater fish counts or underwater visual distance sampling.
Page 13
Project Description The goal for the 2010 Nason Creek monitoring was to determine if the restored connection to the Nason oxbow produced an increase in reach-level abundance of salmonids by season and species within the first three years following construction relative to two reference sites. The project objectives were to:
• Compare pre- and post-construction summer fish abundance in the oxbow relative to the reference sites.
• Compare seasonal post-construction fish abundance between 2008 and 2010 in the oxbow relative to the reference sites.
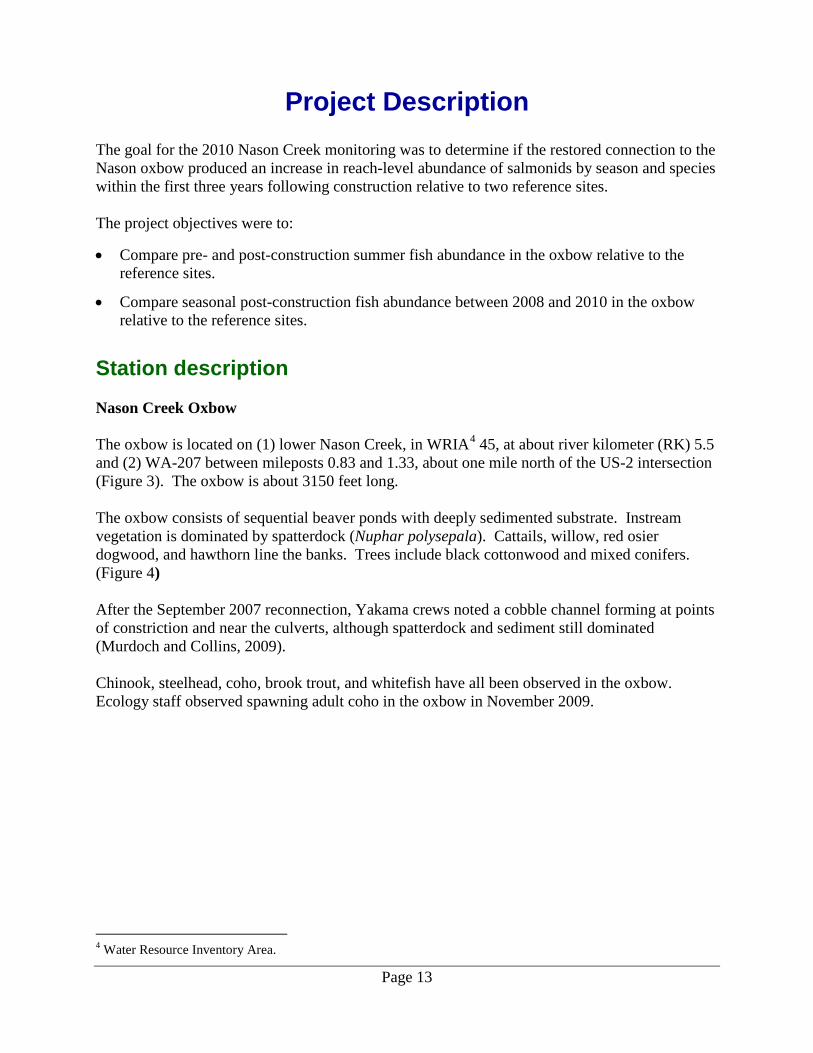
Station description Nason Creek Oxbow The oxbow is located on (1) lower Nason Creek, in WRIA4
45, at about river kilometer (RK) 5.5 and (2) WA-207 between mileposts 0.83 and 1.33, about one mile north of the US-2 intersection (Figure 3). The oxbow is about 3150 feet long.
The oxbow consists of sequential beaver ponds with deeply sedimented substrate. Instream vegetation is dominated by spatterdock (Nuphar polysepala). Cattails, willow, red osier dogwood, and hawthorn line the banks. Trees include black cottonwood and mixed conifers. (Figure 4) After the September 2007 reconnection, Yakama crews noted a cobble channel forming at points of constriction and near the culverts, although spatterdock and sediment still dominated (Murdoch and Collins, 2009). Chinook, steelhead, coho, brook trout, and whitefish have all been observed in the oxbow. Ecology staff observed spawning adult coho in the oxbow in November 2009.
4 Water Resource Inventory Area.
Page 14
Figure 3. Location of the reconnected oxbow on Nason Creek.
Figure 4. Nason Creek oxbow south corner, July 7, 2009 Matt Collins of Yakama Nation Fisheries pictured at right; photo by Dan Dugger.

Page 15
Reference sites Two reference reaches were selected for surveys. The reference reaches provided comparison fish counts to estimate the non-construction related changes in fish abundance in the mainstem Nason Creek and in a natural off-channel habitat (Chiwawa River). Mainstem of Nason Creek The first reference site is located on the mainstem of Nason Creek and is an Integrated Status and Effectiveness Monitoring Program (ISEMP) annual panel site. The Nason Creek reference site was chosen to reduce duplication of monitoring efforts and provide a source of data to compare changes over time. The mainstem site is located upstream of the oxbow at RK 12.2 and next to milepost 82.7 on US-2 (Figure 5). The Nason Creek mainstem reference reach is about 1600 feet long. The reach substrate consists of boulder, cobble, gravel, and sand. The banks are steep and cut for most of the sample reach. Discharge ranges from <50 cfs at low flow to >3000 cfs in the spring (Ecology, 2011c). Bank vegetation includes red osier dogwood, willow, hawthorn, and conifer trees. (Figure 6)
Figure 5. Location of the Nason Creek main-channel reference site.

Page 16
Figure 6. Nason Creek mainstem reference site during surveys, August 19, 2010. Photo by Mike Anderson.
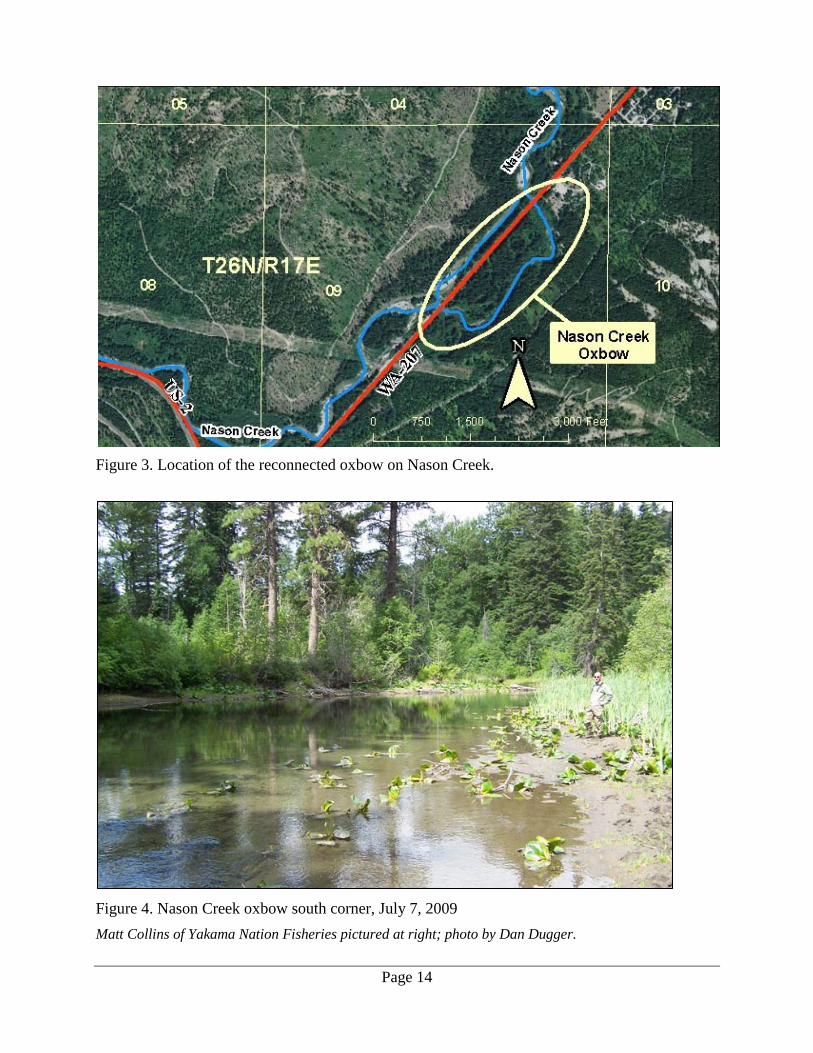
Off-channel habitat on the Chiwawa River The second reference reach was a natural off-channel habitat. Due to the lack of off-channel habitat on Nason Creek, a site on the Chiwawa River was chosen. In addition to meeting the off-channel habitat criteria, the site was chosen for accessibility during high-water events. The off-channel reference site is located at RK 38.3 on the Chiwawa River (Figure 7). The Chiwawa off-channel reference site receives flow through an upstream wetland on the edge of the Chiwawa River. The dry-season flow is low, < 2 cfs, and primarily from groundwater. During high flows (typically May-June) surface flow enters the site through the wetland. Deep (>1 meter) pools below the wetland have sedimented substrate. The shallow outflow substrate is a mix of gravels and sediment. The vegetation on site is a mix of conifers and black cottonwood, and an understory of willow, spirea, and other emergent shrubs. (Figure 8 and cover photo) Small fish are able to access the off-channel site year-round through the outflow. Also, the site is a rearing area for juvenile chinook (Murdoch and Collins, 2009). The length of surveyable reach on the Chiwawa site is about 500 feet during low flow.
Page 17
Figure 7. Location of the Chiwawa River off-channel reference site.
Figure 8. Chiwawa off-channel reference site outflow during surveys, June 17, 2010. Photo by Evan Newell.

Page 18
This page is purposely left blank
Page 19
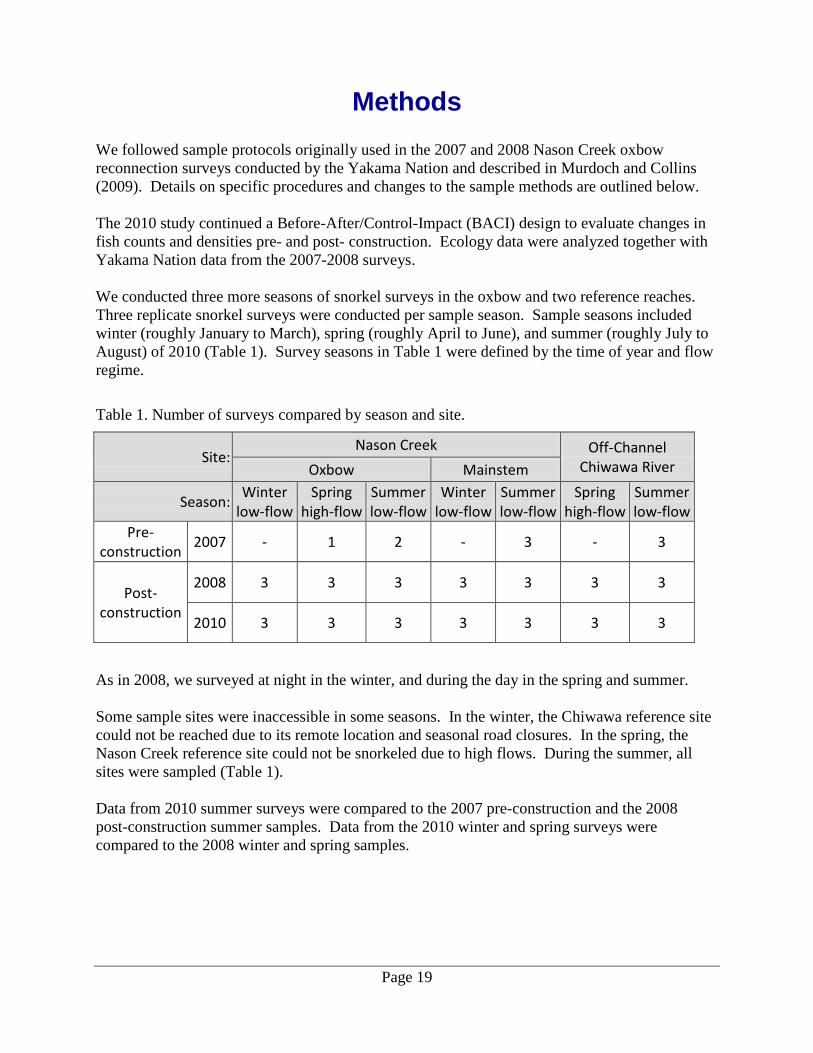
Methods We followed sample protocols originally used in the 2007 and 2008 Nason Creek oxbow reconnection surveys conducted by the Yakama Nation and described in Murdoch and Collins (2009). Details on specific procedures and changes to the sample methods are outlined below. The 2010 study continued a Before-After/Control-Impact (BACI) design to evaluate changes in fish counts and densities pre- and post- construction. Ecology data were analyzed together with Yakama Nation data from the 2007-2008 surveys. We conducted three more seasons of snorkel surveys in the oxbow and two reference reaches. Three replicate snorkel surveys were conducted per sample season. Sample seasons included winter (roughly January to March), spring (roughly April to June), and summer (roughly July to August) of 2010 (Table 1). Survey seasons in Table 1 were defined by the time of year and flow regime.
Table 1. Number of surveys compared by season and site.
Site: Nason Creek Off-Channel
Chiwawa River Oxbow Mainstem
Season: Winter
low-flow Spring
high-flow Summer low-flow
Winter low-flow
Summer low-flow
Spring high-flow
Summer low-flow
Pre- construction
2007 - 1 2 - 3 - 3
Post- construction
2008 3 3 3 3 3 3 3
2010 3 3 3 3 3 3 3
As in 2008, we surveyed at night in the winter, and during the day in the spring and summer. Some sample sites were inaccessible in some seasons. In the winter, the Chiwawa reference site could not be reached due to its remote location and seasonal road closures. In the spring, the Nason Creek reference site could not be snorkeled due to high flows. During the summer, all sites were sampled (Table 1). Data from 2010 summer surveys were compared to the 2007 pre-construction and the 2008 post-construction summer samples. Data from the 2010 winter and spring surveys were compared to the 2008 winter and spring samples.

Page 20
Sampling Procedures Sampling procedures are summarized below. The sampling protocol is described in further detail in the Quality Assurance Project Plan at www.ecy.wa.gov/biblio/1003104.html (Dugger and Durkee, 2010). We followed Ecology’s Environmental Assessment Program (EAP) Standard Operating Procedure (SOP) for minimizing the spread of invasive species (Ecology, 2011a). We preferred to use non-felt soled (e.g., vibram) wading boots that could be visually inspected and cleaned between sites. If felt wading soles were used, they were changed to an uncontaminated pair between sites. Details on the EAP SOP for minimizing the spread of invasive species can be found at: www.ecy.wa.gov/programs/eap/InvasiveSpecies/AIS-PublicVersion.html (Ecology, 2011a) Survey preparation Prior to scheduled surveys, we checked the streamflow at Nason Creek using the Ecology flow network, located at https://fortress.wa.gov/ecy/wrx/wrx/flows/station.asp?sta=45J070 (Ecology, 2011b). We also checked expected fish presence by consulting with the Yakama Nation who collect daily fish counts at a rotary screw trap on Nason Creek. Measurements We used snorkel protocols based on:
1. Murdoch and Collins (2009), and
2. The Yakama Nation and the Bonneville Power Administration (BPA) Integrated Status and Effectiveness Monitoring Program (ISEMP) (Murdoch and Nelle, 2008).
At the start and end of each site visit, we measured water temperature to the nearest degree (°C) using a hand-held thermometer. On three surveys (Chiwawa on 6/17/2010, Nason Creek mainstem on 8/12/2010, and Chiwawa on 8/13/2010), our thermometer was lost or missing. For these days we estimated water temperature based on the nearest Ecology flow gaging station. For the Nason Creek sites temperature and flow, we used the Nason Creek gage, https://fortress.wa.gov/ecy/wrx/wrx/flows/station.asp?sta=45J070 (Ecology, 2011c). For the Chiwawa off-channel site water temperature, we used the Rock Creek gage, https://fortress.wa.gov/ecy/wrx/wrx/flows/station.asp?sta=45N060 (Ecology, 2011b). For the Chiwawa off-channel site flow, we used the USGS gage Chiwawa River near Plain, WA, http://waterdata.usgs.gov/wa/nwis/uv?site_no=12456500 (USGS, 2011).

Page 21
We adjusted the estimated temperature based on the time-matched differences between the Ecology gage and the measured temperatures of the same season and year. We measured underwater visibility to the nearest meter using a patterned fishing lure with hooks removed. Three snorkelers measured the underwater visual distance at which lure patterns could be visually distinguished while snorkeling. We used the mean visual distance as the estimate. Site visits included four to five surveyors. In most surveys, at least one surveyor worked from the shore as bank tender. The bank tender helped direct the snorkeling effort, acted as safety coordinator for the group, and kept counts of fish that were not seen by snorkelers. When flows permitted, snorkeling proceeded from downstream to upstream. Surveyors entered the river about five meters downstream of the reach start and positioned themselves across the channel so that all fish could be seen. Surveyors counted fish that passed downstream and to their left while coordinating with adjacent snorkelers to ensure fish were counted only once. The snorkeler on the right side of the survey line counted fish passing to the left and right. In the Nason Creek mainstem, flows were too high to snorkel upstream for all winter surveys. And in the Nason Creek oxbow, flows were too high to snorkel upstream in the spring surveys. For all downstream surveys, we entered the water about five meters upstream of the survey reach. Fish were counted in the same manner as for upstream surveys. Fish were identified and counted by species and length increments of 2 cm in odd numbers (e.g., 3, 5, 7). Fish categorized as 1 cm were from 0.1 cm to 2 cm, the 3 cm size class was from 2.1 cm to 4 cm, and so on. Unidentified species were noted with estimated size. Information was written on a wrist cuff then transcribed to the field data sheets. (Murdoch and Nelle, 2008) We recorded a site sketch of each survey showing the area surveyed, flag points, and other features of interest. We flagged each sample site at regular intervals along the reach to measure the survey length. We estimated the average width of the surveyed area at the upstream and downstream ends. After the survey season was complete, the field crew removed all flagging from the site. Training Prior to sampling, field staff were trained in all sample techniques until proficient. We used taxonomic keys to identify fish to species and to observe live fish in hand. We practiced underwater size estimation with pre-measured dowels. We conducted practice sampling runs and visited Yakama Nation fish traps prior to surveys to verify field identification and size estimation. Our target species were chinook, coho, and steelhead (rainbow trout). Other species of interest included whitefish, bull trout, and brook trout (salmonids), suckers (catostomids), redside shiners, chubs, minnows, and dace (cyprinids).

Page 22
To improve our salmonid identification, we used taxonomic guides, instream training with Yakama Nation Fisheries crews, and observation of fish at the Nason Creek fish trap operated by Yakama Nation Fisheries. We used an underwater camera to check the accuracy of fish identification during training and sample events. Training on fish size estimation took place in the water with the use of a metric length scale on the PVC cuff or by comparison with a previously measured object. Surveyors memorized their body metrics as a backup estimate. Body metrics included:
• Thumb to pinky finger tip span (Y-measure). • Thumb to index finger tip span (L-measure). • Thumb tip to thumb-hand joint length (T-measure). For streams narrower than the maximum visibility, we used the average wetted width (measured at the start and end of the reach) as the maximum visibility for that site (Murdoch and Nelle, 2008). Day/night surveys Dive lights were used in both night and day surveys to help view fish. The dive light was attached to the snorkeler’s arm with a lanyard. The bank tender carried a flashlight, batteries, and spare dive lights for snorkelers on night surveys. Ice During some winter surveys, ice covered portions of the Nason Creek oxbow and prevented access. For these surveys we estimated the percentage of the oxbow we were able to effectively survey. In some cases we surveyed through areas with thin ice cover. We never entered any part of the oxbow with greater than ½ inch thick surface ice. Data Management Procedures Each snorkeler carried a PVC wrist-cuff marked with metric units for recording fish counts and estimating fish length. Wrist-cuff counts were transcribed to data sheets following the survey. Data sheets included a site sketch, site measurements, and fish counts per species. We entered data into an Excel spreadsheet (Microsoft, 2007). The spreadsheet was backed up on Ecology’s shared hard drive. Fish count data by species were also entered into Ecology’s Environmental Information Management (EIM) database, User Study ID ddug0001. All data were reviewed by project staff who did not perform the data entry and then compared to the field sheets. If substantive errors were identified, an independent review of the data was conducted. Fish count and water temperature data are included in Appendices B and C.
Page 23
Results 2010 fish counts per site are listed in Tables C-1 to C-3 of Appendix C. 2007 and 2008 fish counts from Murdoch and Collins (2009) are listed in Tables B-1 to B-3 of Appendix B. All statistical tests were evaluated for significance at α ≤ 0.05.
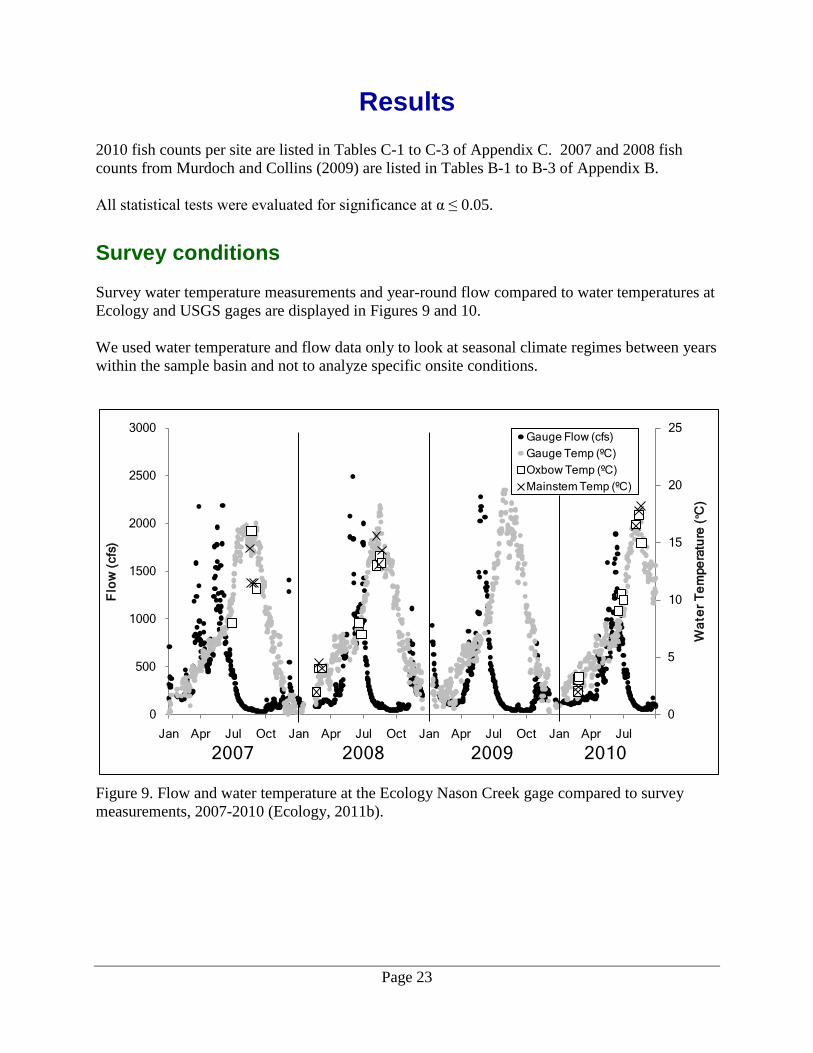
Survey conditions Survey water temperature measurements and year-round flow compared to water temperatures at Ecology and USGS gages are displayed in Figures 9 and 10. We used water temperature and flow data only to look at seasonal climate regimes between years within the sample basin and not to analyze specific onsite conditions.
Figure 9. Flow and water temperature at the Ecology Nason Creek gage compared to survey measurements, 2007-2010 (Ecology, 2011b).
0
5
10
15
20
25
0
500
1000
1500
2000
2500
3000
Jan Apr Jul Oct Jan Apr Jul Oct Jan Apr Jul Oct Jan Apr Jul
Wa
ter
Te
mpe
ratu
re (
ºC)
Flo
w (
cfs)
Gauge Flow (cfs)
Gauge Temp (ºC)
Oxbow Temp (ºC)
Mainstem Temp (ºC)
2008 2009 20102007
Page 24
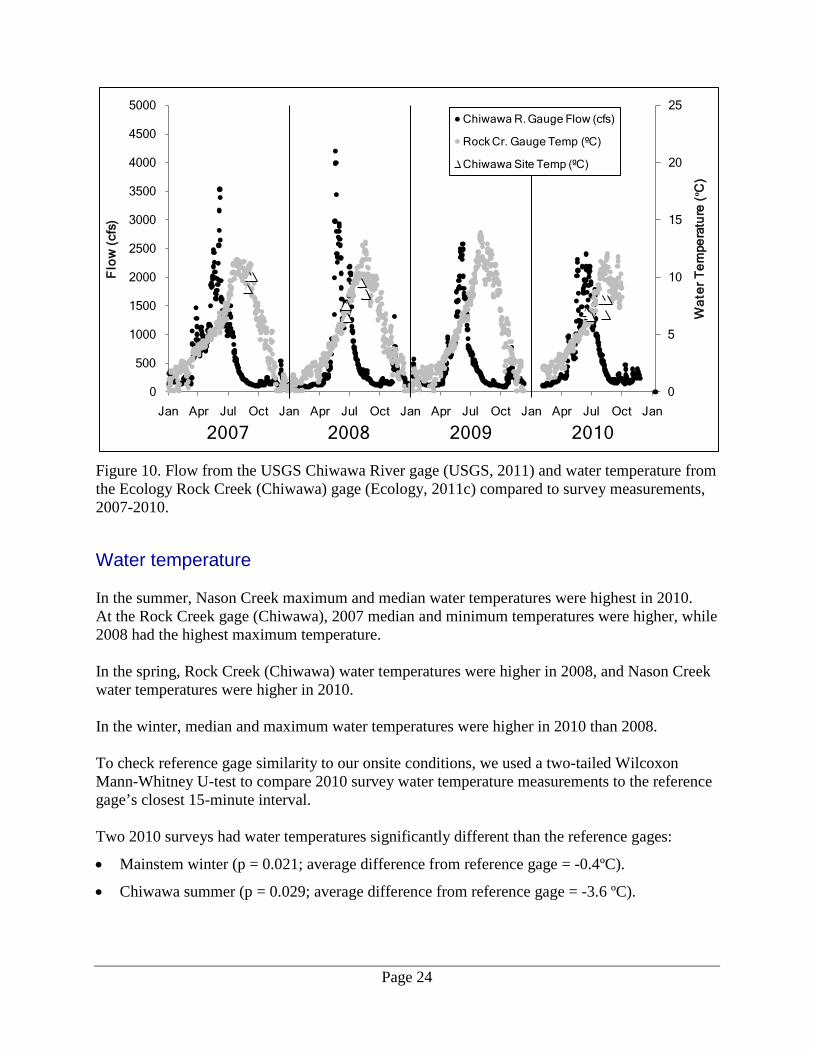
Figure 10. Flow from the USGS Chiwawa River gage (USGS, 2011) and water temperature from the Ecology Rock Creek (Chiwawa) gage (Ecology, 2011c) compared to survey measurements, 2007-2010.
Water temperature In the summer, Nason Creek maximum and median water temperatures were highest in 2010. At the Rock Creek gage (Chiwawa), 2007 median and minimum temperatures were higher, while 2008 had the highest maximum temperature. In the spring, Rock Creek (Chiwawa) water temperatures were higher in 2008, and Nason Creek water temperatures were higher in 2010. In the winter, median and maximum water temperatures were higher in 2010 than 2008. To check reference gage similarity to our onsite conditions, we used a two-tailed Wilcoxon Mann-Whitney U-test to compare 2010 survey water temperature measurements to the reference gage’s closest 15-minute interval. Two 2010 surveys had water temperatures significantly different than the reference gages:
• Mainstem winter (p = 0.021; average difference from reference gage = -0.4ºC).
• Chiwawa summer (p = 0.029; average difference from reference gage = -3.6 ºC).
0
5
10
15
20
25
0
500
1000
1500
2000
2500
3000
3500
4000
4500
5000
Jan Apr Jul Oct Jan Apr Jul Oct Jan Apr Jul Oct Jan Apr Jul Oct Jan
Wa
ter
Te
mpe
ratu
re (
ºC)
Flo
w (
cfs)
Chiwawa R. Gauge Flow (cfs)
Rock Cr. Gauge Temp (ºC)
Chiwawa Site Temp (ºC)
2008 2009 20102007

Page 25
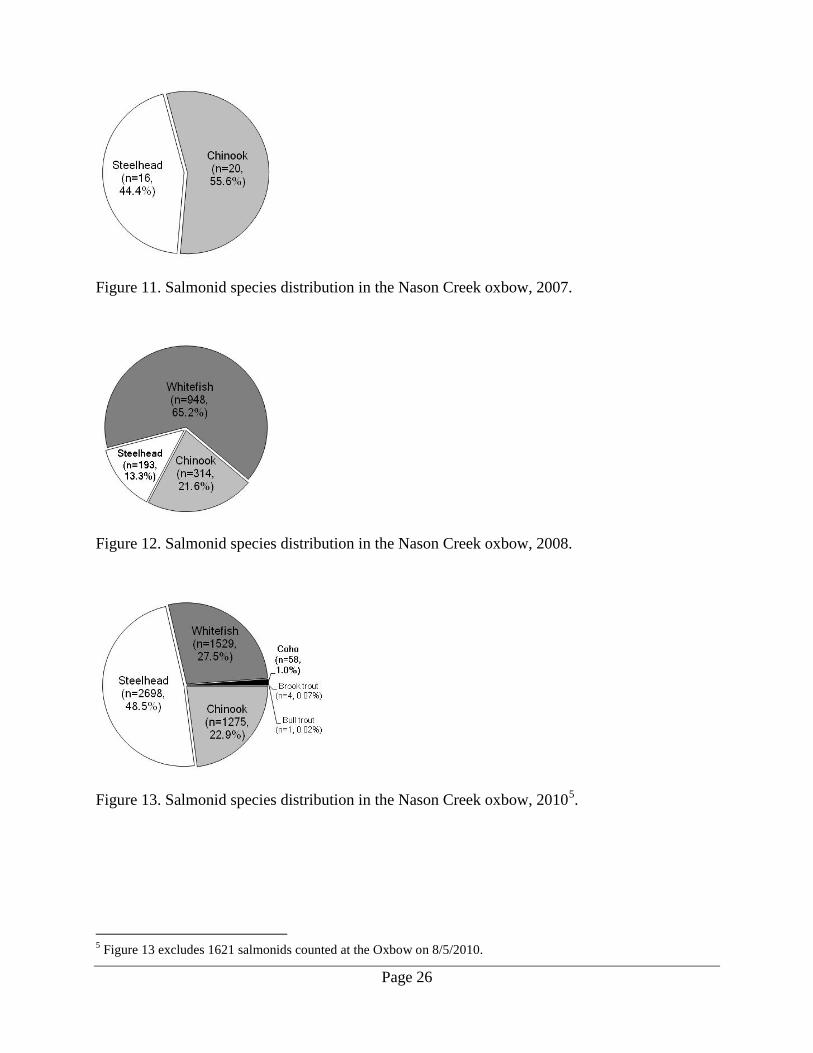
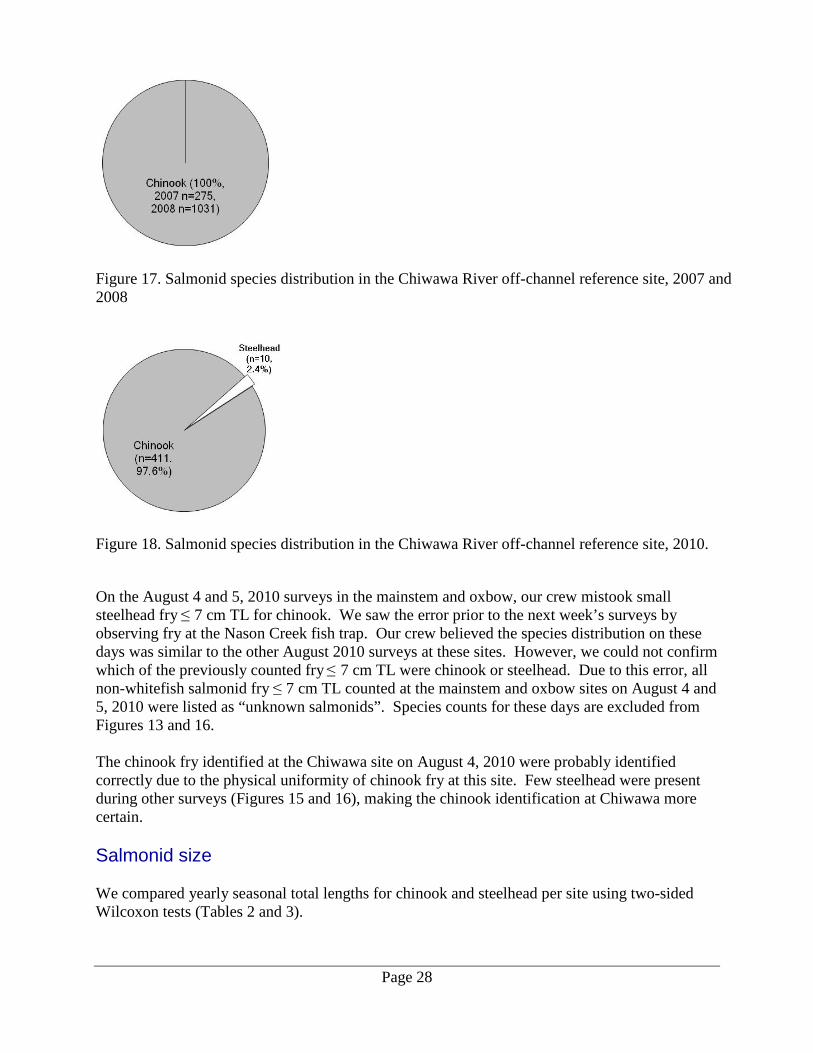
Local weather, aspect, vegetative cover, and instrument bias were among the factors that caused differences between reference-gage temperature and onsite-measured temperature. The difference between the mainstem winter survey and reference gage is significant. But it is not a concern because the average difference is less than 1 ºC. The Chiwawa site was 2-5 ºC cooler than the Rock Creek (Chiwawa) gage during summer surveys. The difference was probably due to greater vegetative cover at the Chiwawa sample site. Flow Spring and summer streamflows were highest in 2008 at Nason Creek and highest in 2010 at the Chiwawa River. Spring and summer flow was lowest in 2007 for both gages. (Figures 9 and 10) Winter flows were higher in 2010 than 2008 at Nason Creek (Figure 9). Salmonid species Yearly fish species distributions per site are in Figures 11 to 18. It was not possible for the snorkel crew to distinguish the difference between steelhead trout fry (Oncorhynchus mykiss) and cutthroat trout fry (Oncorhynchus clarki) due to the extreme overlap in the juvenile species’ physical features. Our field guides for these fry did not distinguish between the species (Page and Burr, 1991; Pollard et al., 1997; Wydoski and Whitney, 2003). We classified all trout juveniles that resembled steelhead or cutthroat as steelhead. No adult cutthroat were observed in the streams during surveys, however cutthroat are known to be present in both Nason Creek and the Chiwawa River. Identifying salmon and trout species less than 7 cm total length (TL) was difficult due to their small size, variation, and overlap in their physical features. Poor underwater visibility and the rapid movement of fish sometimes made identification impossible. In wide pool habitats, such as the Oxbow, fish formed large schools of mixed species. Surveyors attempted to count the different species and size classes of fish within each school. When thorough counts were impossible, the surveyor would estimate the counts, sizes, and species of observed schools. When species could not be identified, they were assigned to the categories “unknown salmonids” and “unknown fish”. Fish in these categories are not included in Figures 11 to 18.
Page 26
Figure 11. Salmonid species distribution in the Nason Creek oxbow, 2007.
Figure 12. Salmonid species distribution in the Nason Creek oxbow, 2008.
Figure 13. Salmonid species distribution in the Nason Creek oxbow, 20105
5 Figure 13 excludes 1621 salmonids counted at the Oxbow on 8/5/2010.
.

Page 27
Figure 14. Salmonid species distribution in the Nason Creek mainstem reference site, 2007.
Figure 15. Salmonid species distribution in the Nason Creek mainstem reference site, 2008.
Figure 16. Salmonid species distribution in the Nason Creek mainstem reference site, 20106
.
6 Figure 16 excludes 1590 salmonids counted at the mainstem on 8/4/2010.
Page 28
Figure 17. Salmonid species distribution in the Chiwawa River off-channel reference site, 2007 and 2008
Figure 18. Salmonid species distribution in the Chiwawa River off-channel reference site, 2010.
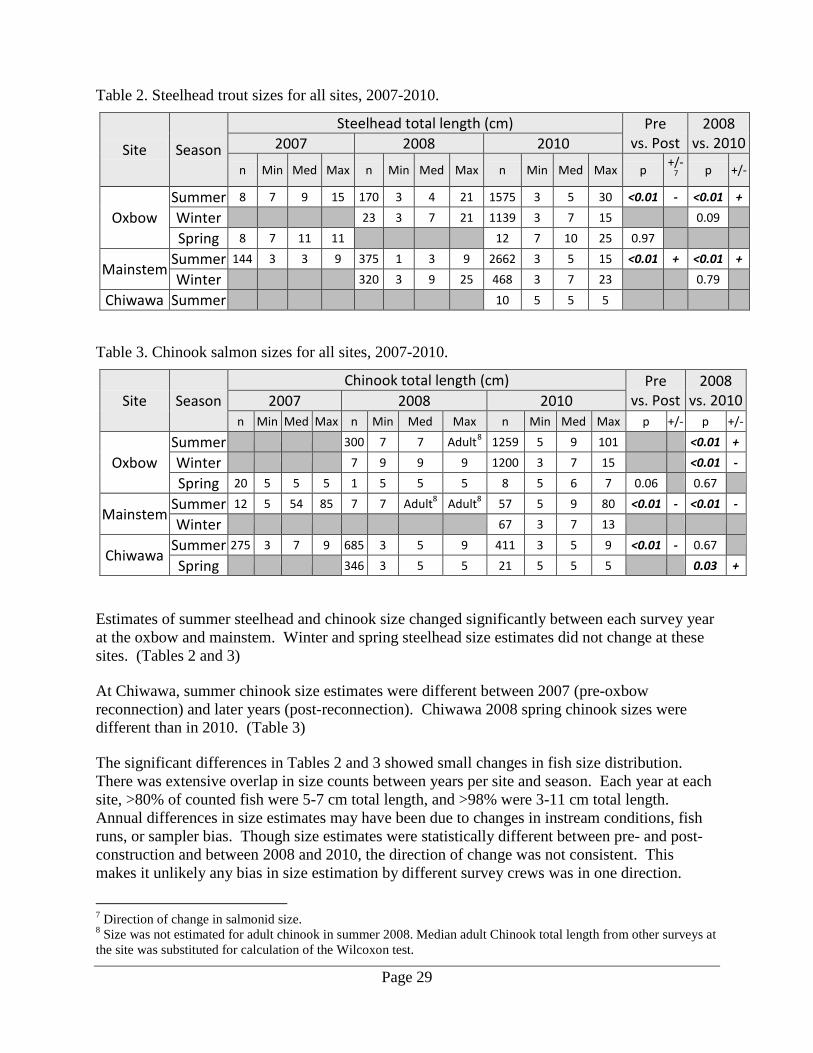
On the August 4 and 5, 2010 surveys in the mainstem and oxbow, our crew mistook small steelhead fry ≤ 7 cm TL for chinook. We saw the error prior to the next week’s surveys by observing fry at the Nason Creek fish trap. Our crew believed the species distribution on these days was similar to the other August 2010 surveys at these sites. However, we could not confirm which of the previously counted fry ≤ 7 cm TL were chinook or steelhead. Due to this error, all non-whitefish salmonid fry ≤ 7 cm TL counted at the mainstem and oxbow sites on August 4 and 5, 2010 were listed as “unknown salmonids”. Species counts for these days are excluded from Figures 13 and 16. The chinook fry identified at the Chiwawa site on August 4, 2010 were probably identified correctly due to the physical uniformity of chinook fry at this site. Few steelhead were present during other surveys (Figures 15 and 16), making the chinook identification at Chiwawa more certain. Salmonid size We compared yearly seasonal total lengths for chinook and steelhead per site using two-sided Wilcoxon tests (Tables 2 and 3).
Page 29
Table 2. Steelhead trout sizes for all sites, 2007-2010.
Site Season
Steelhead total length (cm) Pre vs. Post
2008 vs. 2010 2007 2008 2010
n Min Med Max n Min Med Max n Min Med Max p +/-
7 p
+/-
Oxbow Summer 8 7 9 15 170 3 4 21 1575 3 5 30 <0.01 - <0.01 +
Winter 23 3 7 21 1139 3 7 15
0.09
Spring 8 7 11 11
12 7 10 25 0.97
Mainstem Summer 144 3 3 9 375 1 3 9 2662 3 5 15 <0.01 + <0.01 +
Winter 320 3 9 25 468 3 7 23
0.79
Chiwawa Summer
10 5 5 5
Table 3. Chinook salmon sizes for all sites, 2007-2010.
Site Season Chinook total length (cm) Pre
vs. Post 2008
vs. 2010 2007 2008 2010 n Min Med Max n Min Med Max n Min Med Max p +/- p +/-
Oxbow Summer
300 7 7 Adult8 1259 5 9 101
<0.01 +
Winter 7 9 9 9 1200 3 7 15
<0.01 -
Spring 20 5 5 5 1 5 5 5 8 5 6 7 0.06
0.67
Mainstem Summer 12 5 54 85 7 7 Adult8 Adult8 57 5 9 80 <0.01 - <0.01 -
Winter 67 3 7 13
Chiwawa Summer 275 3 7 9 685 3 5 9 411 3 5 9 <0.01 - 0.67
Spring
346 3 5 5 21 5 5 5
0.03 +
Estimates of summer steelhead and chinook size changed significantly between each survey year at the oxbow and mainstem. Winter and spring steelhead size estimates did not change at these sites. (Tables 2 and 3) At Chiwawa, summer chinook size estimates were different between 2007 (pre-oxbow reconnection) and later years (post-reconnection). Chiwawa 2008 spring chinook sizes were different than in 2010. (Table 3) The significant differences in Tables 2 and 3 showed small changes in fish size distribution. There was extensive overlap in size counts between years per site and season. Each year at each site, >80% of counted fish were 5-7 cm total length, and >98% were 3-11 cm total length. Annual differences in size estimates may have been due to changes in instream conditions, fish runs, or sampler bias. Though size estimates were statistically different between pre- and post- construction and between 2008 and 2010, the direction of change was not consistent. This makes it unlikely any bias in size estimation by different survey crews was in one direction.
7 Direction of change in salmonid size. 8 Size was not estimated for adult chinook in summer 2008. Median adult Chinook total length from other surveys at the site was substituted for calculation of the Wilcoxon test.
Page 30
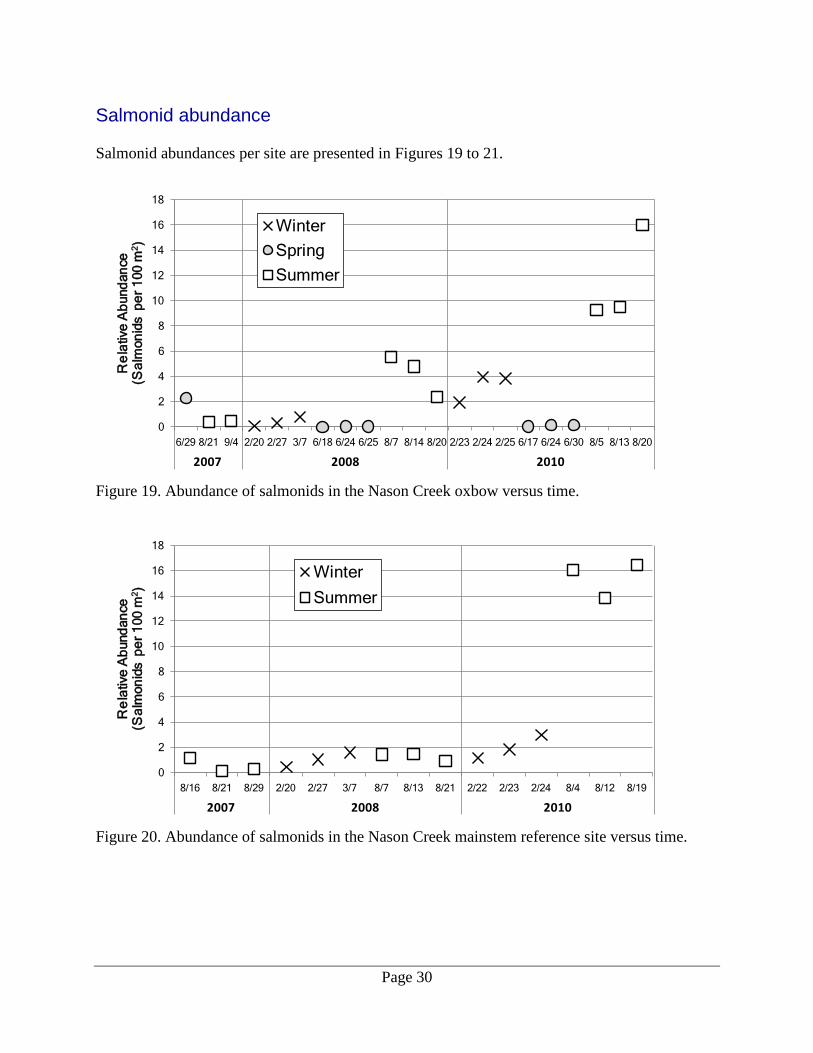
Salmonid abundance Salmonid abundances per site are presented in Figures 19 to 21.
Figure 19. Abundance of salmonids in the Nason Creek oxbow versus time.
Figure 20. Abundance of salmonids in the Nason Creek mainstem reference site versus time.
0
2
4
6
8
10
12
14
16
18
6/29 8/21 9/4 2/20 2/27 3/7 6/18 6/24 6/25 8/7 8/14 8/20 2/23 2/24 2/25 6/17 6/24 6/30 8/5 8/13 8/20
Re
lativ
e A
bun
dan
ce(S
alm
onid
s p
er
100
m2)
Winter
Spring
Summer
2007 2008 2010
0
2
4
6
8
10
12
14
16
18
8/16 8/21 8/29 2/20 2/27 3/7 8/7 8/13 8/21 2/22 2/23 2/24 8/4 8/12 8/19
Re
lativ
e A
bun
dan
ce(S
alm
onid
s p
er
100
m2)
Winter
Summer
2007 2008 2010
Page 31
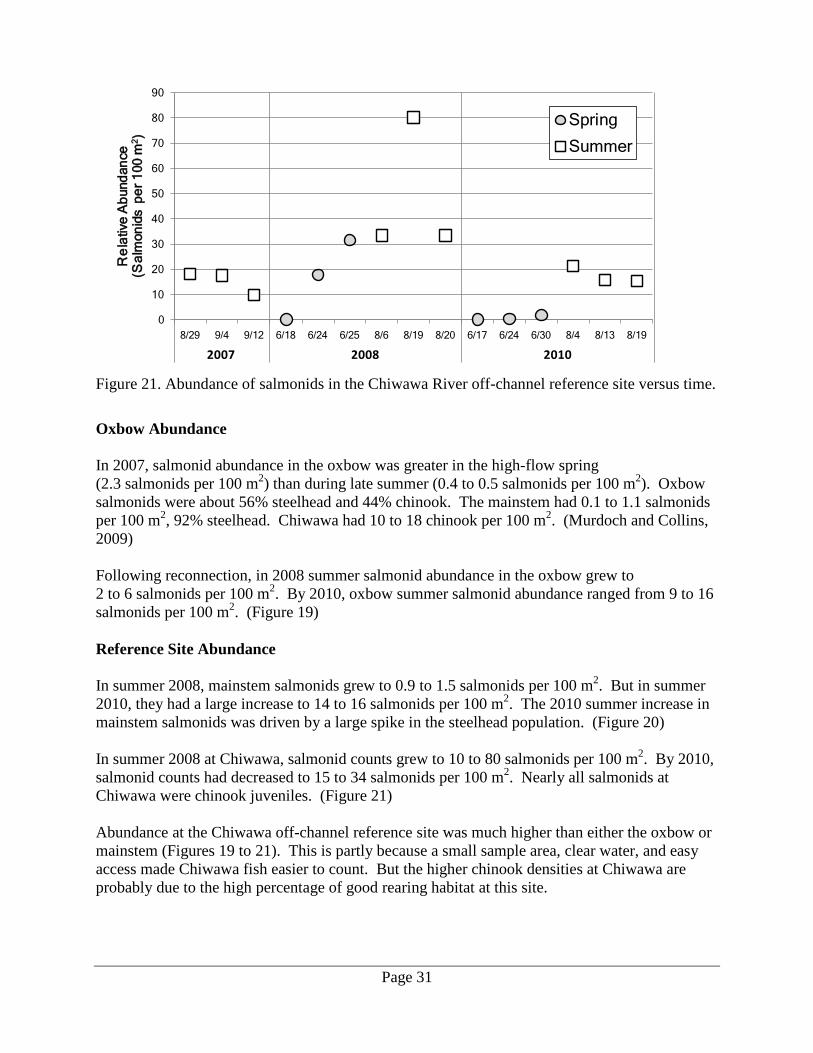
Figure 21. Abundance of salmonids in the Chiwawa River off-channel reference site versus time.
Oxbow Abundance In 2007, salmonid abundance in the oxbow was greater in the high-flow spring (2.3 salmonids per 100 m2) than during late summer (0.4 to 0.5 salmonids per 100 m2). Oxbow salmonids were about 56% steelhead and 44% chinook. The mainstem had 0.1 to 1.1 salmonids per 100 m2, 92% steelhead. Chiwawa had 10 to 18 chinook per 100 m2. (Murdoch and Collins, 2009) Following reconnection, in 2008 summer salmonid abundance in the oxbow grew to 2 to 6 salmonids per 100 m2. By 2010, oxbow summer salmonid abundance ranged from 9 to 16 salmonids per 100 m2. (Figure 19) Reference Site Abundance In summer 2008, mainstem salmonids grew to 0.9 to 1.5 salmonids per 100 m2. But in summer 2010, they had a large increase to 14 to 16 salmonids per 100 m2. The 2010 summer increase in mainstem salmonids was driven by a large spike in the steelhead population. (Figure 20) In summer 2008 at Chiwawa, salmonid counts grew to 10 to 80 salmonids per 100 m2. By 2010, salmonid counts had decreased to 15 to 34 salmonids per 100 m2. Nearly all salmonids at Chiwawa were chinook juveniles. (Figure 21) Abundance at the Chiwawa off-channel reference site was much higher than either the oxbow or mainstem (Figures 19 to 21). This is partly because a small sample area, clear water, and easy access made Chiwawa fish easier to count. But the higher chinook densities at Chiwawa are probably due to the high percentage of good rearing habitat at this site.
0
10
20
30
40
50
60
70
80
90
8/29 9/4 9/12 6/18 6/24 6/25 8/6 8/19 8/20 6/17 6/24 6/30 8/4 8/13 8/19
Re
lativ
e A
bun
dan
ce(S
alm
onid
s p
er
100
m2)
Spring
Summer
2007 2008 2010

Page 32
Abundance Distribution A Shapiro-Wilk test showed the salmonid abundance data were not normal (p<0.01). So we used non-parametric one-tailed Wilcoxon-Mann-Whitney U- tests (Wilcoxon tests) to analyze changes in abundance (Tables 4 and 5). Abundance Trends We analyzed abundance data separately by season and site. We compared:
• Summer salmonids pre-construction to post-construction for all sites (Table 4).
• Salmonids between 2008 and 2010 for all sites (Table 5). Table 4. Wilcoxon tests for salmonid abundance pre- versus post-oxbow reconnection for all sites.
Season Species Oxbow Chiwawa Mainstem
p-value test9 p-value test p-value test9
Summer
All Salmonids 0.036 + 0.131 + 0.024 +
Chinook 0.048
(0.036) 10
+
0.131 + 0.346
(0.274) 10 +
Steelhead 0.190 (0.143) 10
+ 0.405 + 0.038
(0.024) 10 +
Whitefish 0.036 + 0.190 +
Following reconnection, Wilcoxon tests (Table 4) show a significant increase in abundance in the summer for: • All salmonids, chinook, and whitefish in the oxbow. • All salmonids and steelhead in the mainstem. No salmonids at any site decreased in abundance from the 2007 late summer populations (Table 4).
9Direction of one-sided Mann-Whitney U-test: + for an increasing trend. − for a decreasing trend. 10 Values in parentheses include estimated chinook and steelhead results from the August 4 and 5, 2010 oxbow and mainstem surveys.
Page 33
Table 5. Wilcoxon tests for salmonid abundance between 2008 and 2010 for all sites.
Season Species Oxbow Chiwawa Mainstem
p-value11 test 12 p-value test p-value test12
Winter
All Salmonids 0.05 +
0.10 +
Chinook 0.20 + 0.05 +
Steelhead 0.05 + 0.35 +
Whitefish 0.10 + 0.50 +
Spring
All Salmonids 0.05 + 0.35 −
Chinook 0.05 + 0.35 −
Steelhead 0.05 +
Whitefish 0.35 −
Summer
All Salmonids 0.05 + 0.05 − 0.05 +
Chinook 0.10 (0.05) 13 +
0.05 −
0.10 (0.05) 13
+
Steelhead 0.10 (0.05) 13
+ 0.35 + 0.10
(0.05) 13 +
Whitefish 0.10 + 0.43 +
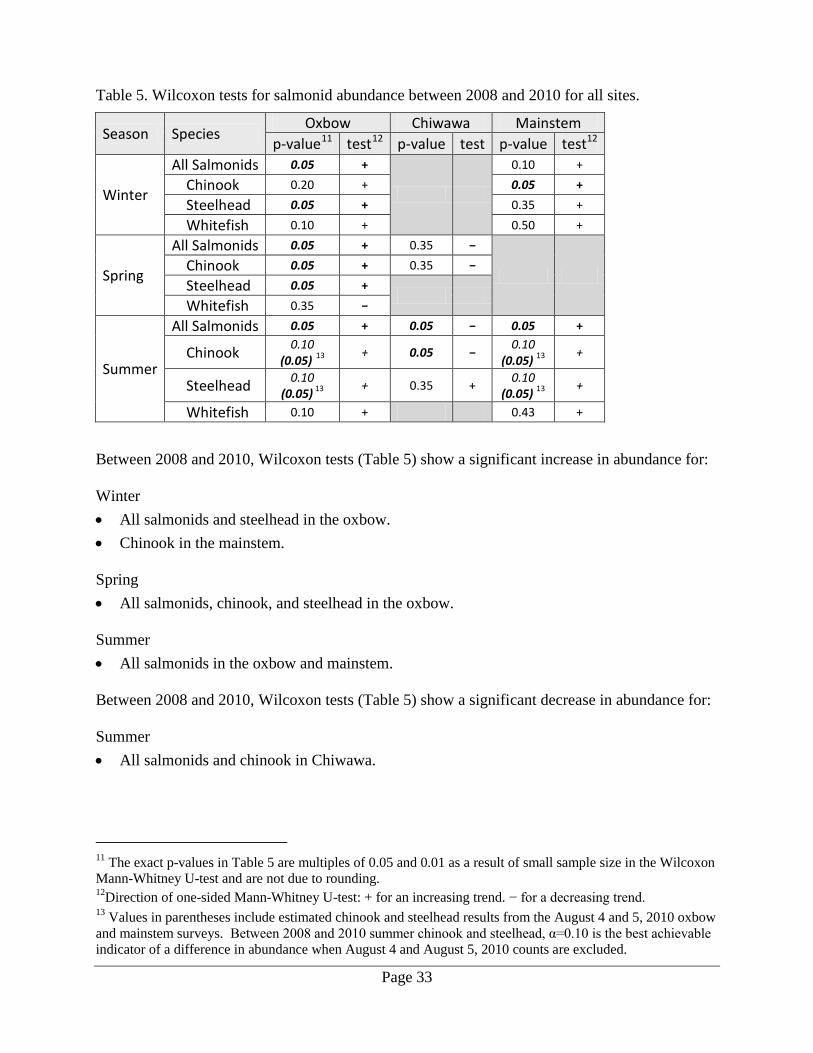
Between 2008 and 2010, Wilcoxon tests (Table 5) show a significant increase in abundance for: Winter • All salmonids and steelhead in the oxbow. • Chinook in the mainstem. Spring • All salmonids, chinook, and steelhead in the oxbow. Summer • All salmonids in the oxbow and mainstem. Between 2008 and 2010, Wilcoxon tests (Table 5) show a significant decrease in abundance for: Summer • All salmonids and chinook in Chiwawa.
11 The exact p-values in Table 5 are multiples of 0.05 and 0.01 as a result of small sample size in the Wilcoxon Mann-Whitney U-test and are not due to rounding. 12Direction of one-sided Mann-Whitney U-test: + for an increasing trend. − for a decreasing trend. 13 Values in parentheses include estimated chinook and steelhead results from the August 4 and 5, 2010 oxbow and mainstem surveys. Between 2008 and 2010 summer chinook and steelhead, α=0.10 is the best achievable indicator of a difference in abundance when August 4 and August 5, 2010 counts are excluded.

Page 34
This page is purposely left blank

Page 35
Discussion
Changes in analysis from Murdoch and Collins (2009) In this analysis we excluded data collected at the oxbow on June 29, 2007 by Yakama Nation (Murdoch and Collins, 2009). It was excluded because the Julian date, seasonal flow, and temperature for this survey did not match the conditions of the 2008 and 2010 low-flow summer data. Also, there was not enough pre-construction data for a statistical comparison with post-construction spring surveys.
Survey completeness Surveys that did not cover all of the site habitat may bias fish counts based on the selection of habitat within the site. The next three paragraphs describe onsite conditions that limited survey area and may have biased fish counts. • In 2007, prior to reconnection, the Nason Creek oxbow was surveyed only in the open water
areas near the upstream and downstream ends of the oxbow. The habitat in the center of the oxbow was not surveyed because it was inaccessible due to thick spatterdock, Nuphar polysephala (Murdoch and Collins, 2009). In the oxbow in 2010, more fish were observed near the upstream and downstream sections than in the area not surveyed in 2007. If the habitat near the culverts was preferred by fish in 2007 relative to the rest of the oxbow, then the 2007 oxbow fish abundance would be biased high compared to later counts.
• In the 2008 and 2010 winter surveys, some sections near the mid-point of the oxbow were
not surveyed due to thick ice. The iced sections were all in the oxbow beaver ponds, and tended to have lower densities of salmonids than the fast-flowing parts of the oxbow. This may have increased oxbow winter salmonid abundance.
• During the 2010 oxbow and Chiwawa surveys, our sight distance was impaired by disturbed
sediment as we moved through shallow water. When this happened, we estimated the fraction of the reach we were able to effectively survey and calculated abundance based on this area.
Fish abundance Pre-construction salmonid abundance Prior to reconnection, fish were unable to access the oxbow during low flow through the single high-placed culvert. The 3-foot diameter culvert also limited fish access during high flow. Limited survey access to the oxbow may have biased 2007 fish counts high. The 2007 spring salmonid count was higher than the oxbow counts for 2008 and 2010. However, 2007 fish counts during the late summer surveys tended to be lower in 2007 than in later years.

Page 36
This shows that oxbow fish populations were lower during the late summer when they could not access the oxbow from the mainstem of Nason Creek. This result contrasts with the higher fish counts following oxbow reconnection. Post-construction changes Late summer low-flow Oxbow late-summer salmonid populations grew following reconnection. It appears the rise was caused by increases in chinook and whitefish populations. Other salmonid populations also increased, and no populations decreased for the late summer. Following reconnection, hundreds of chinook were counted in the oxbow during summer low flow. In 2008, the increase in summer chinook numbers was not as high as the increase at Chiwawa, but was much greater than the increase in the mainstem. In 2010, the oxbow and mainstem summer chinook populations each had a large increase, while the Chiwawa summer chinook population decreased. Oxbow summer whitefish counts also increased by large margins, but were not common in the mainstem and were absent in Chiwawa. The oxbow appeared to be good habitat for whitefish, and reconnection probably helped boost their numbers there. Post-construction summer steelhead did not significantly increase at the oxbow. But steelhead abundance increased significantly between 2008 and 2010. This 2010 rise was accompanied by a very large increase in steelhead at the mainstem, and may indicate summer steelhead background populations were rising throughout Nason Creek. The rise in late-summer steelhead in Nason Creek may disguise any independent rise in steelhead that occurred at the oxbow due to reconnection. But it is likely the late summer oxbow steelhead populations rose with the mainstem populations because of increased access from the reconnection. Steelhead appear to slightly prefer the mainstem over the oxbow. However, the reconnected oxbow still carries a large steelhead population. The Chiwawa site had few or no steelhead detections in all three years. 2008 to 2010 Winter and Spring Changes Between 2008 and 2010, oxbow winter salmonid populations increased relative to mainstem salmonid populations. Oxbow winter steelhead populations increased at a greater rate than the mainstem. The mainstem had a significant increase in winter chinook population, while the oxbow population remained steady. Between 2008 and 2010, oxbow spring chinook and steelhead populations each increased significantly while the Chiwawa spring chinook abundance showed a non-significant decrease. The changes in oxbow chinook populations do not appear to follow the Chiwawa trend as closely as the oxbow steelhead populations follow the mainstem trend. This is most likely due to

Page 37
differences in instream conditions, local salmonid runs, and the distance of stream networks between the Nason Creek and Chiwawa River. Other post-construction trends The reconnected oxbow appears to provide good habitat for different species of salmonids. We counted several dozen coho and thousands of whitefish, along with a few bull trout and brook trout. Few coho or whitefish were seen in the mainstem, and none were found at Chiwawa. Much greater numbers of non-salmonids were counted in the reconnected oxbow than at either reference site (see Appendices B and C). Adult fish use of the oxbow also increased. No adults were observed in the oxbow prior to reconnection. Spawning chinook were observed in the oxbow in 2008 (Murdoch and Collins, 2009). In 2009 we observed spawning adult coho in the oxbow, and in 2010, we observed adult chinook in the oxbow. We observed spawning chinook with redds in the mainstem. The adult chinook in the oxbow may have used this low-flow pool habitat to rest while spawning. Chinook and steelhead size estimates changed significantly between each year. However, the direction of change was not consistent. It is likely the changes were due to changes in annual instream conditions and different salmonid runs. Although low precision in surveyor size estimation may have contributed to the difference. Factors contributing to increases in abundance High numbers of returning adult steelhead were counted at Rock Island Dam on the Columbia River in 2009 (FPC, 2011). Some of these adults spawned in the Wenatchee basin and may have contributed to an increase in steelhead fry counts throughout Nason Creek in 2010. The riffle-pool habitat at the mainstem site appears to be a preferred habitat for juvenile steelhead, while the stillwater habitat at Chiwawa was preferred by juvenile chinook salmon. The oxbow contains a mix of these habitats, which may explain why chinook and steelhead numbers are similar there. Other studies have shown juvenile trout are excluded from pools when coho or chinook juveniles are present (Swales and Levings, 1989; Rosenfeld et al., 2000). After reconnection, species diversity increased at the oxbow while remaining relatively constant at the reference sites. The change in species distribution at the oxbow may be due to both fish colonization and changes in the oxbow habitat as scour alters the channels.

Page 38
Conclusions Results of this 2010 study support the following conclusions: 1. Reconnection of the Nason Creek oxbow to the mainstem of Nason Creek caused an overall
increase within the oxbow in abundance for salmonids over all 2008 and 2010 surveys.
2. The increase in salmonids at the Nason Creek oxbow was led by increases in chinook salmon and whitefish populations, but was also affected by increases in other salmonid species.
3. Between 2008 and 2010, steelhead populations in the Nason Creek oxbow increased along with steelhead populations in the Nason Creek mainstem reference site.
4. Salmonid populations continued to climb in Nason Creek following the 2008 surveys. The 2010 summer survey showed the highest salmonid populations for all years (2007, 2008, 2010).
5. Salmonid population trends in the Nason Creek oxbow were not similar to trends in the Chiwawa River off-channel reference site. Differences in the local salmonid runs, differing habitat, and the distance between the sites probably contribute to the difference.
Recommendations
Results of this 2010 study support the following recommendations: 1. Further oxbow restoration projects at other locations are likely to help increase populations
of salmonids and other fish by providing additional rearing and spawning habitat.
2. For this type of survey, reference sites should be selected as close as possible to, and within the same basin as, the treatment site.

Page 39
References Andonaegui, C., 2001. Salmon, Steelhead, and Bull Trout Habitat Limiting Factors for the Wenatchee Subbasin (Water Resource Inventory Area 45) and Portions of WRIA 40 within Chelan County (Squilchuck, Stemilt and Colockum drainages) FINAL REPORT. Washington State Conservation Commission. P. O. Box 47721 Olympia, WA 98504-7721. www.scc.wa.gov/index.php/265-WRIA-45-40-partial-Wenatchee-Subbasin/View-category.html.
Bonneau, J.L. and D.L. Scarnecchia, 1998. Seasonal and diel changes in habitat use by juvenile bull trout (Salvelinus confluentus) and cutthroat trout (Oncorhynchus clarki) in a mountain stream. Canadian Journal of Zoology 76(5): 783–790.
Bradford, M.J. and P.S. Higgins, 2001. Habitat-, season-, and size-specific variation in diel activity patterns of juvenile chinook salmon (Oncorhynchus tshawytscha) and steelhead trout (Oncorhynchus mykiss). Canadian Journal of Fisheries and Aquatic Sciences 58(2): 365–374.
Collins, M.B., 2009. Personal communication from Matt Collins, Yakama Nation Fisheries, to Dan Dugger, Washington State Department of Ecology. July 6, 2009.
Dugger, D.J. and J.L. Durkee, 2010. Quality Assurance Project Plan: Nason Creek (Chelan County) Oxbow Reconnection Monitoring. Washington State Department of Ecology. Publication No. 10-03-104. www.ecy.wa.gov/biblio/1003104.html.
Ecology, 1995. Initial Watershed Assessment Water Resources Inventory Area 45 Wenatchee River Watershed Open file Report 95-12. Washington State Department of Ecology. www.ecy.wa.gov/pubs/95012.pdf.
Ecology 2011a. Aquatic Invasive Species: Minimizing the spread of invasive species through field work. www.ecy.wa.gov/programs/eap/InvasiveSpecies/AIS-PublicVersion.html.
Ecology, 2011b. River and Stream Flow Monitoring: Stream flow monitoring station, Rock Cr nr mouth. Washington State Department of Ecology. https://fortress.wa.gov/ecy/wrx/wrx/flows/station.asp?sta=45N060.
Ecology, 2011c. River and Stream Flow Monitoring: Stream flow monitoring station, Nason Cr. nr mouth. Washington State Department of Ecology. https://fortress.wa.gov/ecy/wrx/wrx/flows/station.asp?sta=45J070.
Fish Passage Center (FPC), 2011. 1827 NE 44th Ave., Suite 240 Portland, Oregon 97213. Northwest Power Planning Council (NPPC) Fish and Wildlife Program and Columbia basin fisheries and tribes. www.fpc.org/.
Hubbell, S.P. 2001. The unified neutral theory of biodiversity and biogeography. Princeton University Press, Princeton, N.J.
Microsoft, 2007. Microsoft Office XP Professional, Version 10.0. Microsoft Corporation.

Page 40
Murdoch, K. and M. Collins, 2009. Nason Creek Oxbow Reconnection: First-Year Post-Construction Changes in Salmonid Abundance, August 2007 to September 2008: Final Report. Yakama Nation Fisheries Resource Management, Toppenish, WA 98948. Prepared for: Chelan County Department of Natural Resources, 316 Washington Street, Suite 401, Wenatchee, WA 98801.
Murdoch, K. and R.D. Nelle, 2008. A Field Manual of Scientific Protocols for Underwater Observations within the Upper Columbia Monitoring Strategy, 2008 Working Version 1.0. Prepared for and funded by: Bonneville Power Administration’s Integrated Status and Effectiveness Monitoring Program. Published by: Terraqua, Inc. Wauconda, WA.
Nickelson, T.E., J.D. Rodgers, S.L. Johnson, and M.F. Solazzi, 1992. Seasonal Changes in Habitat Use by Juvenile Coho Salmon (Oncorhynchus kisutch) in Oregon Coastal Streams. Canadian Journal of Fisheries and Aquatic Sciences 49(4): 783–789.
Page, L.M. and B.M. Burr, 1991. A Field Guide to Freshwater Fishes, North America, North of Mexico. Houghton Mifflin Company, Boston, New York.
Pink, M., T.C. Pratt, and M.G. Fox, 2007. Use of underwater visual distance sampling for estimating habitat-specific population density. North American Journal of Fisheries Management 27: 246-255.
Pollard. W.R., G.F. Hartman, C. Groot, and P. Edgell, 1997. Field Identification of Coastal Juvenile Salmonids. Harbour Publishing, Madeira Park, BC, Canada.
Roni, P. and A. Fayram, 2000. Estimating winter salmonid abundance in small western Washington streams: a comparison of three techniques. North American Journal of Fisheries Management 20: 683-692.
Roni, P., T.J. Beechie, R.E. Bilby, F.E. Leonetti, M.M. Pollock, and G.R. Pess, 2002. A review of stream restoration techniques and a hierarchical strategy for prioritizing restoration in Pacific Northwest watersheds. North American Journal of Fisheries Management 22: 1–20.
Rosenfeld, J., M. Porter, and E. Parkinson, 2000. Habitat factors affecting the abundance and distribution of juvenile cutthroat trout (Oncorhynchus clarki) and coho salmon (Oncorhynchus kisutch). Canadian Journal of Fisheries and Aquatic Sciences 57(4): 766-774.
Swales, S. and C. D. Levings, 1989. Role of off-channel ponds in the life cycle of coho salmon (Oncorhynchus kisutch) and other juvenile salmonids in the Coldwater River, British Columbia. 1989. Canadian Journal of Fisheries and Aquatic Sciences 46:232–242.
Thurow, R. and D. Schill, 1996. Comparison of day snorkeling, night snorkeling, and electrofishing to estimate bull trout abundance and size structure in a second-order Idaho stream. North American Journal of Fisheries Management 16: 314-323.
Thurow, R., J. Peterson, and J. Guzevich, 2006. Utility and validation of day and night snorkel counts for estimating bull trout abundance in first- to third-order streams. North American Journal of Fisheries Management 26: 217-232.

Page 41
USBR (United States Bureau of Reclamation), 2008. Nason Creek Tributary Assessment Chelan County, Washington. Bureau of Reclamation Technical Service Center, Denver, CO, and Pacific Northwest Regional Office, Boise, ID.
Upper Columbia Salmon Recovery Board (UCSRB), 2007. Upper Columbia Spring Chinook Salmon And Steelhead Recovery Plan. www.ucsrb.com/plan.asp.
USGS (United States Geological Survey), 2011. River and Stream Flow Monitoring. USGS Station 12456500. Chiwawa River near Plain, WA. http://waterdata.usgs.gov/wa/nwis/inventory/?station=12456500.
Wenatchee Watershed Planning Unit (WWPU), 2006. Phase III. Wenatchee Watershed Management Plan. www.co.chelan.wa.us/nr/nr_watershed_plan.htm.
Wydoski, R.S. and R.R. Whitney, 2003. Inland Fishes of Washington, Second Edition, Revised and Expanded. American Fisheries Society, Bethesda, MD in association with University of Washington Press, Seattle, WA and London, UK.

Page 42
This page is purposely left blank

Page 43
Appendices

Page 44
This page is purposely left blank

Page 45
Appendix A. Glossary, Acronyms, and Abbreviations Glossary
Abundance: An ecological concept referring to the relative representation of a species in a particular ecosystem.
Aspect: Streamflow direction in decimal degrees from north.
Basin: Watershed. A drainage area in which all land and water areas drain or flow toward a central collector such as a stream, river, or lake at a lower elevation.
Char: Char (genus Salvelinus) are distinguished from trout and salmon by the absence of teeth in the roof of the mouth, presence of light colored spots on a dark background, absence of spots on the dorsal fin, small scales, and differences in the structure of their skeleton. (Trout and salmon have dark spots on a lighter background.)
Oxbow: A u-shaped low-flow habitat or lake formed when a meander of a stream is separated from the main flow by the cutting of a new stream channel.
Reach: A specific portion or segment of a stream.
Riparian: Relating to the banks along a natural course of water.
Salmonid: Any fish that belong to the family Salmonidae. Basically, any species of salmon, trout, or char. www.fws.gov/le/ImpExp/FactSheetSalmonids.htm
Snorkel fish counts: Underwater fish counts or underwater visual distance sampling.
Watershed: A drainage area or basin in which all land and water areas drain or flow toward a central collector such as a stream, river, or lake at a lower elevation.
Acronyms and Abbreviations BACI Before-After/Control-Impact design Chiwawa Chiwawa River off-channel reference reach CCNRD Chelan County Natural Resources Department EAP Environmental Assessment Program Ecology Washington State Department of Ecology EIM Environmental Information Management database Mainstem Nason Creek mainstem reference reach n number Oxbow Nason Creek oxbow SOP Standard operating procedures US-2 United States Highway 2 USGS U.S. Geological Survey

Page 46
WA-207 Washington State Route 207 WAC Washington Administrative Code WRIA Water Resources Inventory Area Yakama Nation Yakama Nation Fisheries Resource Management Program Units of Measurement °C degrees centigrade cfs cubic feet per second cm centimeter ft feet m meter RK river kilometer TL total length
Page 47
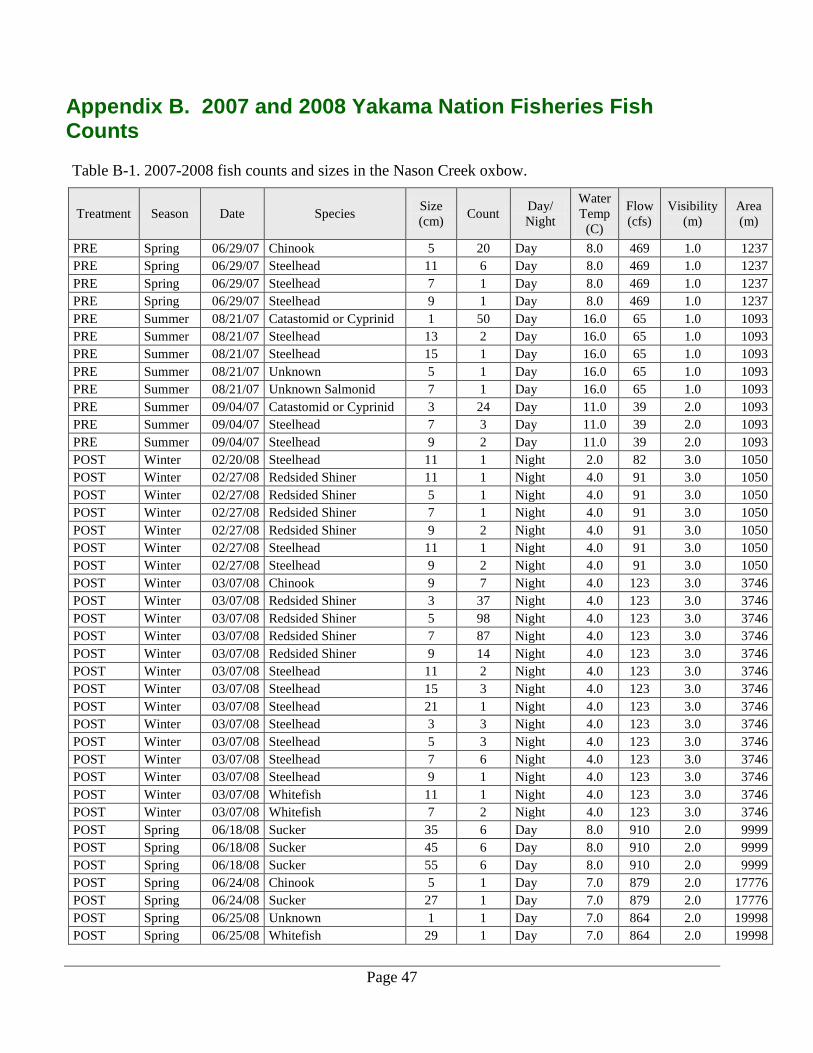
Appendix B. 2007 and 2008 Yakama Nation Fisheries Fish Counts Table B-1. 2007-2008 fish counts and sizes in the Nason Creek oxbow.
Treatment Season Date Species Size (cm) Count Day/
Night
Water Temp (C)
Flow (cfs)
Visibility (m)
Area (m)
PRE Spring 06/29/07 Chinook 5 20 Day 8.0 469 1.0 1237 PRE Spring 06/29/07 Steelhead 11 6 Day 8.0 469 1.0 1237 PRE Spring 06/29/07 Steelhead 7 1 Day 8.0 469 1.0 1237 PRE Spring 06/29/07 Steelhead 9 1 Day 8.0 469 1.0 1237 PRE Summer 08/21/07 Catastomid or Cyprinid 1 50 Day 16.0 65 1.0 1093 PRE Summer 08/21/07 Steelhead 13 2 Day 16.0 65 1.0 1093 PRE Summer 08/21/07 Steelhead 15 1 Day 16.0 65 1.0 1093 PRE Summer 08/21/07 Unknown 5 1 Day 16.0 65 1.0 1093 PRE Summer 08/21/07 Unknown Salmonid 7 1 Day 16.0 65 1.0 1093 PRE Summer 09/04/07 Catastomid or Cyprinid 3 24 Day 11.0 39 2.0 1093 PRE Summer 09/04/07 Steelhead 7 3 Day 11.0 39 2.0 1093 PRE Summer 09/04/07 Steelhead 9 2 Day 11.0 39 2.0 1093 POST Winter 02/20/08 Steelhead 11 1 Night 2.0 82 3.0 1050 POST Winter 02/27/08 Redsided Shiner 11 1 Night 4.0 91 3.0 1050 POST Winter 02/27/08 Redsided Shiner 5 1 Night 4.0 91 3.0 1050 POST Winter 02/27/08 Redsided Shiner 7 1 Night 4.0 91 3.0 1050 POST Winter 02/27/08 Redsided Shiner 9 2 Night 4.0 91 3.0 1050 POST Winter 02/27/08 Steelhead 11 1 Night 4.0 91 3.0 1050 POST Winter 02/27/08 Steelhead 9 2 Night 4.0 91 3.0 1050 POST Winter 03/07/08 Chinook 9 7 Night 4.0 123 3.0 3746 POST Winter 03/07/08 Redsided Shiner 3 37 Night 4.0 123 3.0 3746 POST Winter 03/07/08 Redsided Shiner 5 98 Night 4.0 123 3.0 3746 POST Winter 03/07/08 Redsided Shiner 7 87 Night 4.0 123 3.0 3746 POST Winter 03/07/08 Redsided Shiner 9 14 Night 4.0 123 3.0 3746 POST Winter 03/07/08 Steelhead 11 2 Night 4.0 123 3.0 3746 POST Winter 03/07/08 Steelhead 15 3 Night 4.0 123 3.0 3746 POST Winter 03/07/08 Steelhead 21 1 Night 4.0 123 3.0 3746 POST Winter 03/07/08 Steelhead 3 3 Night 4.0 123 3.0 3746 POST Winter 03/07/08 Steelhead 5 3 Night 4.0 123 3.0 3746 POST Winter 03/07/08 Steelhead 7 6 Night 4.0 123 3.0 3746 POST Winter 03/07/08 Steelhead 9 1 Night 4.0 123 3.0 3746 POST Winter 03/07/08 Whitefish 11 1 Night 4.0 123 3.0 3746 POST Winter 03/07/08 Whitefish 7 2 Night 4.0 123 3.0 3746 POST Spring 06/18/08 Sucker 35 6 Day 8.0 910 2.0 9999 POST Spring 06/18/08 Sucker 45 6 Day 8.0 910 2.0 9999 POST Spring 06/18/08 Sucker 55 6 Day 8.0 910 2.0 9999 POST Spring 06/24/08 Chinook 5 1 Day 7.0 879 2.0 17776 POST Spring 06/24/08 Sucker 27 1 Day 7.0 879 2.0 17776 POST Spring 06/25/08 Unknown 1 1 Day 7.0 864 2.0 19998 POST Spring 06/25/08 Whitefish 29 1 Day 7.0 864 2.0 19998
Page 48
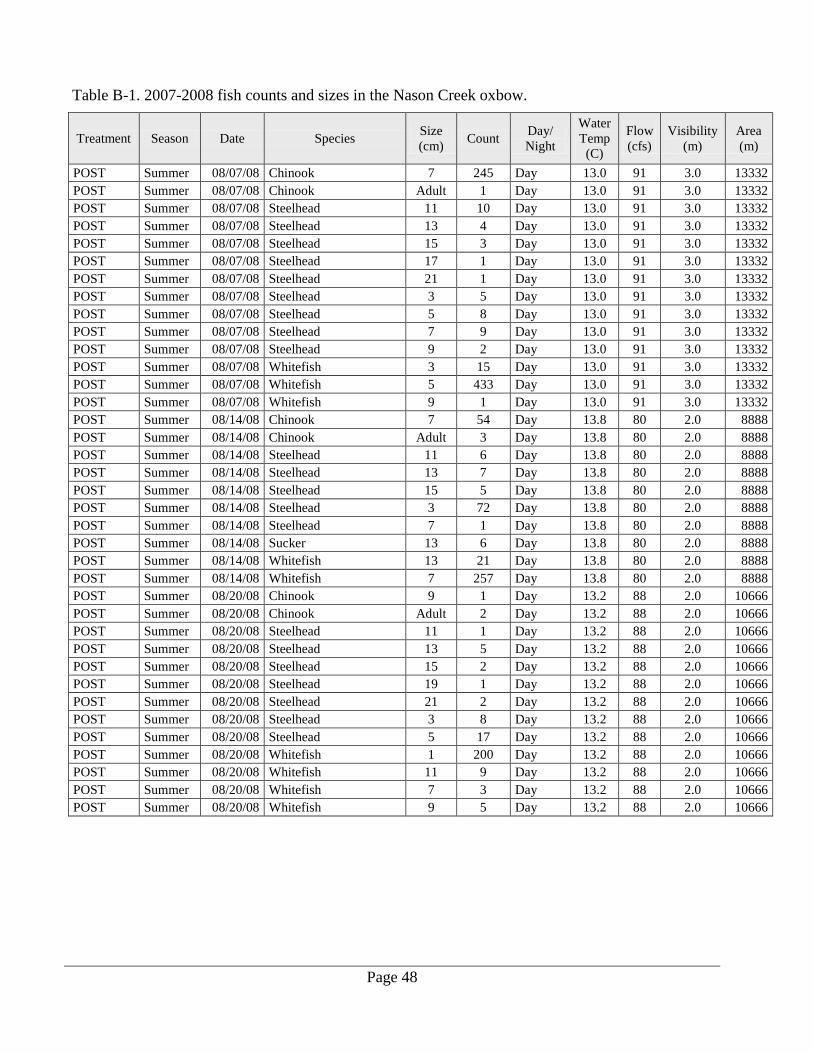
Table B-1. 2007-2008 fish counts and sizes in the Nason Creek oxbow.
Treatment Season Date Species Size (cm) Count Day/
Night
Water Temp (C)
Flow (cfs)
Visibility (m)
Area (m)
POST Summer 08/07/08 Chinook 7 245 Day 13.0 91 3.0 13332 POST Summer 08/07/08 Chinook Adult 1 Day 13.0 91 3.0 13332 POST Summer 08/07/08 Steelhead 11 10 Day 13.0 91 3.0 13332 POST Summer 08/07/08 Steelhead 13 4 Day 13.0 91 3.0 13332 POST Summer 08/07/08 Steelhead 15 3 Day 13.0 91 3.0 13332 POST Summer 08/07/08 Steelhead 17 1 Day 13.0 91 3.0 13332 POST Summer 08/07/08 Steelhead 21 1 Day 13.0 91 3.0 13332 POST Summer 08/07/08 Steelhead 3 5 Day 13.0 91 3.0 13332 POST Summer 08/07/08 Steelhead 5 8 Day 13.0 91 3.0 13332 POST Summer 08/07/08 Steelhead 7 9 Day 13.0 91 3.0 13332 POST Summer 08/07/08 Steelhead 9 2 Day 13.0 91 3.0 13332 POST Summer 08/07/08 Whitefish 3 15 Day 13.0 91 3.0 13332 POST Summer 08/07/08 Whitefish 5 433 Day 13.0 91 3.0 13332 POST Summer 08/07/08 Whitefish 9 1 Day 13.0 91 3.0 13332 POST Summer 08/14/08 Chinook 7 54 Day 13.8 80 2.0 8888 POST Summer 08/14/08 Chinook Adult 3 Day 13.8 80 2.0 8888 POST Summer 08/14/08 Steelhead 11 6 Day 13.8 80 2.0 8888 POST Summer 08/14/08 Steelhead 13 7 Day 13.8 80 2.0 8888 POST Summer 08/14/08 Steelhead 15 5 Day 13.8 80 2.0 8888 POST Summer 08/14/08 Steelhead 3 72 Day 13.8 80 2.0 8888 POST Summer 08/14/08 Steelhead 7 1 Day 13.8 80 2.0 8888 POST Summer 08/14/08 Sucker 13 6 Day 13.8 80 2.0 8888 POST Summer 08/14/08 Whitefish 13 21 Day 13.8 80 2.0 8888 POST Summer 08/14/08 Whitefish 7 257 Day 13.8 80 2.0 8888 POST Summer 08/20/08 Chinook 9 1 Day 13.2 88 2.0 10666 POST Summer 08/20/08 Chinook Adult 2 Day 13.2 88 2.0 10666 POST Summer 08/20/08 Steelhead 11 1 Day 13.2 88 2.0 10666 POST Summer 08/20/08 Steelhead 13 5 Day 13.2 88 2.0 10666 POST Summer 08/20/08 Steelhead 15 2 Day 13.2 88 2.0 10666 POST Summer 08/20/08 Steelhead 19 1 Day 13.2 88 2.0 10666 POST Summer 08/20/08 Steelhead 21 2 Day 13.2 88 2.0 10666 POST Summer 08/20/08 Steelhead 3 8 Day 13.2 88 2.0 10666 POST Summer 08/20/08 Steelhead 5 17 Day 13.2 88 2.0 10666 POST Summer 08/20/08 Whitefish 1 200 Day 13.2 88 2.0 10666 POST Summer 08/20/08 Whitefish 11 9 Day 13.2 88 2.0 10666 POST Summer 08/20/08 Whitefish 7 3 Day 13.2 88 2.0 10666 POST Summer 08/20/08 Whitefish 9 5 Day 13.2 88 2.0 10666
Page 49
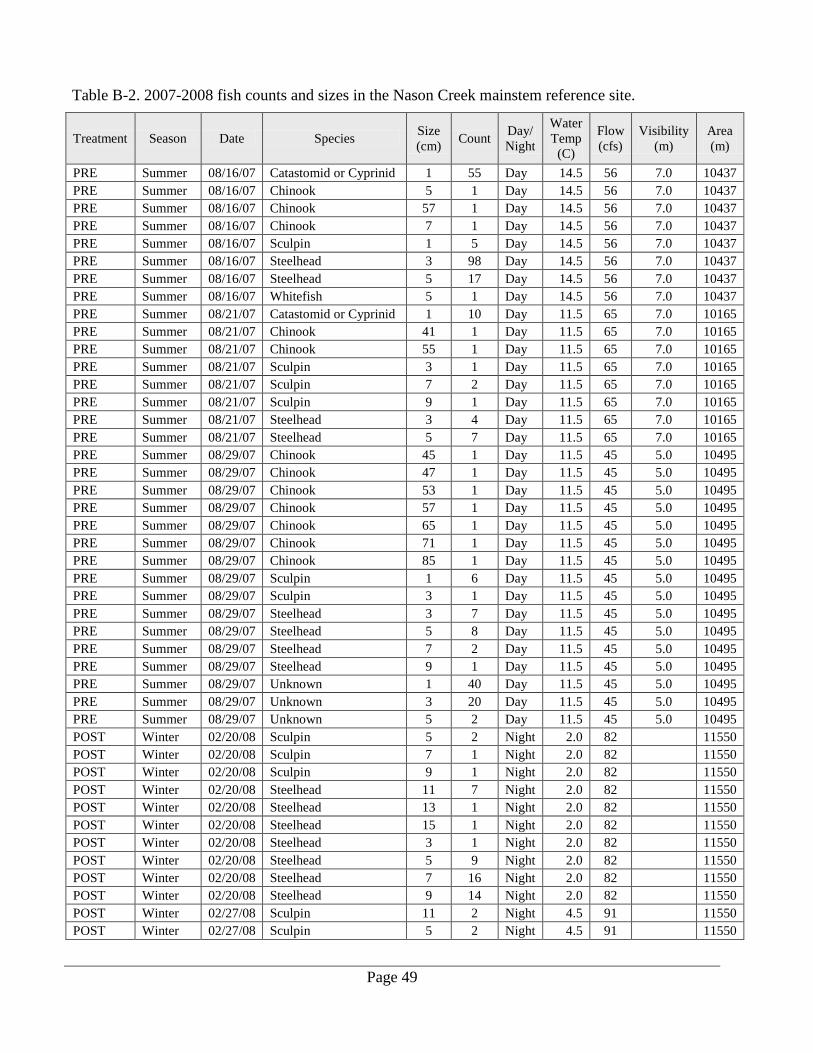
Table B-2. 2007-2008 fish counts and sizes in the Nason Creek mainstem reference site.
Treatment Season Date Species Size (cm) Count Day/
Night
Water Temp
(C)
Flow (cfs)
Visibility (m)
Area (m)
PRE Summer 08/16/07 Catastomid or Cyprinid 1 55 Day 14.5 56 7.0 10437 PRE Summer 08/16/07 Chinook 5 1 Day 14.5 56 7.0 10437 PRE Summer 08/16/07 Chinook 57 1 Day 14.5 56 7.0 10437 PRE Summer 08/16/07 Chinook 7 1 Day 14.5 56 7.0 10437 PRE Summer 08/16/07 Sculpin 1 5 Day 14.5 56 7.0 10437 PRE Summer 08/16/07 Steelhead 3 98 Day 14.5 56 7.0 10437 PRE Summer 08/16/07 Steelhead 5 17 Day 14.5 56 7.0 10437 PRE Summer 08/16/07 Whitefish 5 1 Day 14.5 56 7.0 10437 PRE Summer 08/21/07 Catastomid or Cyprinid 1 10 Day 11.5 65 7.0 10165 PRE Summer 08/21/07 Chinook 41 1 Day 11.5 65 7.0 10165 PRE Summer 08/21/07 Chinook 55 1 Day 11.5 65 7.0 10165 PRE Summer 08/21/07 Sculpin 3 1 Day 11.5 65 7.0 10165 PRE Summer 08/21/07 Sculpin 7 2 Day 11.5 65 7.0 10165 PRE Summer 08/21/07 Sculpin 9 1 Day 11.5 65 7.0 10165 PRE Summer 08/21/07 Steelhead 3 4 Day 11.5 65 7.0 10165 PRE Summer 08/21/07 Steelhead 5 7 Day 11.5 65 7.0 10165 PRE Summer 08/29/07 Chinook 45 1 Day 11.5 45 5.0 10495 PRE Summer 08/29/07 Chinook 47 1 Day 11.5 45 5.0 10495 PRE Summer 08/29/07 Chinook 53 1 Day 11.5 45 5.0 10495 PRE Summer 08/29/07 Chinook 57 1 Day 11.5 45 5.0 10495 PRE Summer 08/29/07 Chinook 65 1 Day 11.5 45 5.0 10495 PRE Summer 08/29/07 Chinook 71 1 Day 11.5 45 5.0 10495 PRE Summer 08/29/07 Chinook 85 1 Day 11.5 45 5.0 10495 PRE Summer 08/29/07 Sculpin 1 6 Day 11.5 45 5.0 10495 PRE Summer 08/29/07 Sculpin 3 1 Day 11.5 45 5.0 10495 PRE Summer 08/29/07 Steelhead 3 7 Day 11.5 45 5.0 10495 PRE Summer 08/29/07 Steelhead 5 8 Day 11.5 45 5.0 10495 PRE Summer 08/29/07 Steelhead 7 2 Day 11.5 45 5.0 10495 PRE Summer 08/29/07 Steelhead 9 1 Day 11.5 45 5.0 10495 PRE Summer 08/29/07 Unknown 1 40 Day 11.5 45 5.0 10495 PRE Summer 08/29/07 Unknown 3 20 Day 11.5 45 5.0 10495 PRE Summer 08/29/07 Unknown 5 2 Day 11.5 45 5.0 10495 POST Winter 02/20/08 Sculpin 5 2 Night 2.0 82 11550 POST Winter 02/20/08 Sculpin 7 1 Night 2.0 82 11550 POST Winter 02/20/08 Sculpin 9 1 Night 2.0 82 11550 POST Winter 02/20/08 Steelhead 11 7 Night 2.0 82 11550 POST Winter 02/20/08 Steelhead 13 1 Night 2.0 82 11550 POST Winter 02/20/08 Steelhead 15 1 Night 2.0 82 11550 POST Winter 02/20/08 Steelhead 3 1 Night 2.0 82 11550 POST Winter 02/20/08 Steelhead 5 9 Night 2.0 82 11550 POST Winter 02/20/08 Steelhead 7 16 Night 2.0 82 11550 POST Winter 02/20/08 Steelhead 9 14 Night 2.0 82 11550 POST Winter 02/27/08 Sculpin 11 2 Night 4.5 91 11550 POST Winter 02/27/08 Sculpin 5 2 Night 4.5 91 11550
Page 50
Table B-2. 2007-2008 fish counts and sizes in the Nason Creek mainstem reference site.
Treatment Season Date Species Size (cm) Count Day/
Night
Water Temp
(C)
Flow (cfs)
Visibility (m)
Area (m)
POST Winter 02/27/08 Sculpin 7 10 Night 4.5 91 11550 POST Winter 02/27/08 Sculpin 9 4 Night 4.5 91 11550 POST Winter 02/27/08 Steelhead 11 14 Night 4.5 91 11550 POST Winter 02/27/08 Steelhead 13 9 Night 4.5 91 11550 POST Winter 02/27/08 Steelhead 15 5 Night 4.5 91 11550 POST Winter 02/27/08 Steelhead 17 4 Night 4.5 91 11550 POST Winter 02/27/08 Steelhead 3 3 Night 4.5 91 11550 POST Winter 02/27/08 Steelhead 5 22 Night 4.5 91 11550 POST Winter 02/27/08 Steelhead 7 39 Night 4.5 91 11550 POST Winter 02/27/08 Steelhead 9 23 Night 4.5 91 11550 POST Winter 03/07/08 Sculpin 13 1 Night 4.0 123 6.0 9600 POST Winter 03/07/08 Sculpin 7 4 Night 4.0 123 6.0 9600 POST Winter 03/07/08 Sculpin 9 2 Night 4.0 123 6.0 9600 POST Winter 03/07/08 Steelhead 11 20 Night 4.0 123 6.0 9600 POST Winter 03/07/08 Steelhead 13 15 Night 4.0 123 6.0 9600 POST Winter 03/07/08 Steelhead 15 8 Night 4.0 123 6.0 9600 POST Winter 03/07/08 Steelhead 17 4 Night 4.0 123 6.0 9600 POST Winter 03/07/08 Steelhead 21 1 Night 4.0 123 6.0 9600 POST Winter 03/07/08 Steelhead 25 1 Night 4.0 123 6.0 9600 POST Winter 03/07/08 Steelhead 3 1 Night 4.0 123 6.0 9600 POST Winter 03/07/08 Steelhead 5 15 Night 4.0 123 6.0 9600 POST Winter 03/07/08 Steelhead 7 47 Night 4.0 123 6.0 9600 POST Winter 03/07/08 Steelhead 9 40 Night 4.0 123 6.0 9600 POST Winter 03/07/08 Whitefish 7 1 Night 4.0 123 6.0 9600 POST Summer 08/07/08 Chinook 7 2 Day 15.6 91 7.0 10650 POST Summer 08/07/08 Chinook Adult 3 Day 15.6 91 7.0 10650 POST Summer 08/07/08 Sculpin 11 2 Day 15.6 91 7.0 10650 POST Summer 08/07/08 Sculpin 3 1 Day 15.6 91 7.0 10650 POST Summer 08/07/08 Sculpin 7 1 Day 15.6 91 7.0 10650 POST Summer 08/07/08 Steelhead 1 100 Day 15.6 91 7.0 10650 POST Summer 08/07/08 Steelhead 3 45 Day 15.6 91 7.0 10650 POST Summer 08/07/08 Whitefish 5 1 Day 15.6 91 7.0 10650 POST Summer 08/13/08 Steelhead 3 142 Day 13.1 82 2.0 10000 POST Summer 08/13/08 Steelhead 5 7 Day 13.1 82 2.0 10000 POST Summer 08/13/08 Steelhead 7 1 Day 13.1 82 2.0 10000 POST Summer 08/13/08 Steelhead 9 1 Day 13.1 82 2.0 10000 POST Summer 08/21/08 Chinook Adult 2 Day 14.3 111 3.0 8800 POST Summer 08/21/08 Sculpin 5 1 Day 14.3 111 3.0 8800 POST Summer 08/21/08 Steelhead 3 58 Day 14.3 111 3.0 8800 POST Summer 08/21/08 Steelhead 7 21 Day 14.3 111 3.0 8800 POST Summer 08/21/08 Whitefish 21 1 Day 14.3 111 3.0 8800 POST Summer 08/21/08 Whitefish 31 1 Day 14.3 111 3.0 8800
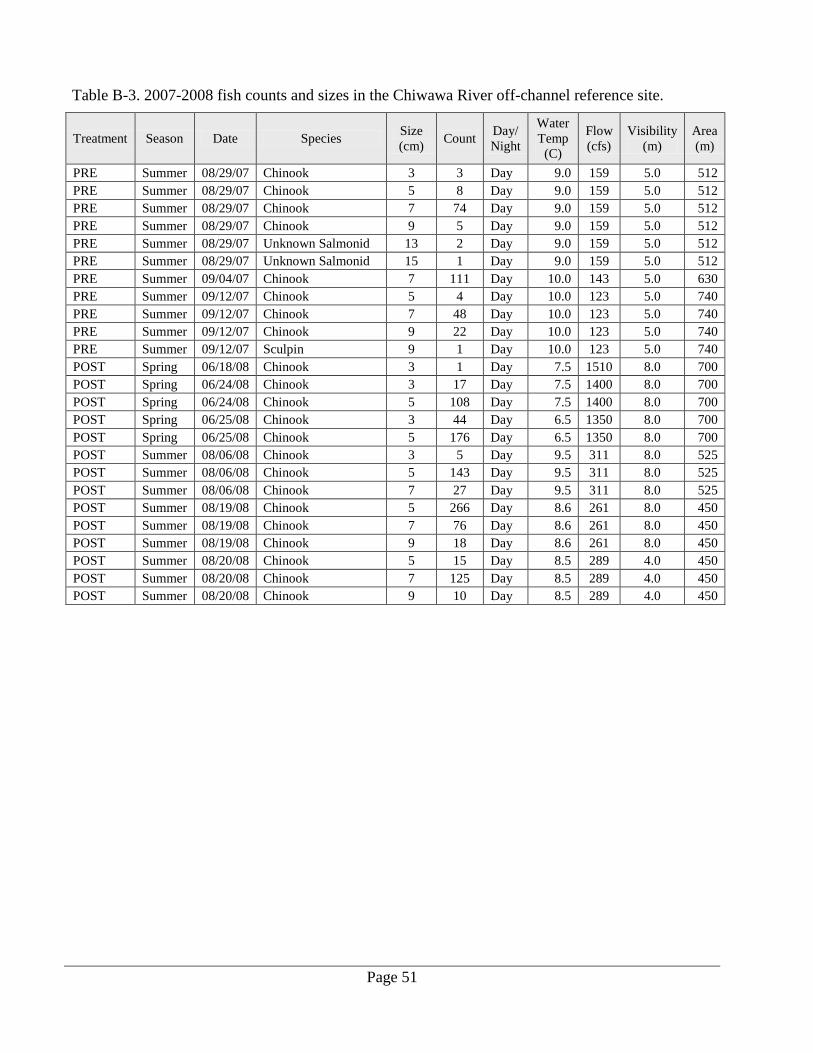
Page 51
Table B-3. 2007-2008 fish counts and sizes in the Chiwawa River off-channel reference site.
Treatment Season Date Species Size (cm) Count Day/
Night
Water Temp
(C)
Flow (cfs)
Visibility (m)
Area (m)
PRE Summer 08/29/07 Chinook 3 3 Day 9.0 159 5.0 512 PRE Summer 08/29/07 Chinook 5 8 Day 9.0 159 5.0 512 PRE Summer 08/29/07 Chinook 7 74 Day 9.0 159 5.0 512 PRE Summer 08/29/07 Chinook 9 5 Day 9.0 159 5.0 512 PRE Summer 08/29/07 Unknown Salmonid 13 2 Day 9.0 159 5.0 512 PRE Summer 08/29/07 Unknown Salmonid 15 1 Day 9.0 159 5.0 512 PRE Summer 09/04/07 Chinook 7 111 Day 10.0 143 5.0 630 PRE Summer 09/12/07 Chinook 5 4 Day 10.0 123 5.0 740 PRE Summer 09/12/07 Chinook 7 48 Day 10.0 123 5.0 740 PRE Summer 09/12/07 Chinook 9 22 Day 10.0 123 5.0 740 PRE Summer 09/12/07 Sculpin 9 1 Day 10.0 123 5.0 740 POST Spring 06/18/08 Chinook 3 1 Day 7.5 1510 8.0 700 POST Spring 06/24/08 Chinook 3 17 Day 7.5 1400 8.0 700 POST Spring 06/24/08 Chinook 5 108 Day 7.5 1400 8.0 700 POST Spring 06/25/08 Chinook 3 44 Day 6.5 1350 8.0 700 POST Spring 06/25/08 Chinook 5 176 Day 6.5 1350 8.0 700 POST Summer 08/06/08 Chinook 3 5 Day 9.5 311 8.0 525 POST Summer 08/06/08 Chinook 5 143 Day 9.5 311 8.0 525 POST Summer 08/06/08 Chinook 7 27 Day 9.5 311 8.0 525 POST Summer 08/19/08 Chinook 5 266 Day 8.6 261 8.0 450 POST Summer 08/19/08 Chinook 7 76 Day 8.6 261 8.0 450 POST Summer 08/19/08 Chinook 9 18 Day 8.6 261 8.0 450 POST Summer 08/20/08 Chinook 5 15 Day 8.5 289 4.0 450 POST Summer 08/20/08 Chinook 7 125 Day 8.5 289 4.0 450 POST Summer 08/20/08 Chinook 9 10 Day 8.5 289 4.0 450

Page 52
This page is purposely left blank

Page 53
Appendix C. 2010 Washington State Department of Ecology Fish Counts Table C-1. 2010 fish counts and sizes in the Nason Creek oxbow.
Treatment Season Date Species Size (cm) Count Day/
Night
Water Temp (C)
Flow (cfs)
Visibility (m)
Area (m)
POST Winter 02/23/10 Brook Trout 21 1 Night 2.1 125 2.4 14508 POST Winter 02/23/10 Chinook 5 4 Night 2.1 125 2.4 14508 POST Winter 02/23/10 Chinook 7 5 Night 2.1 125 2.4 14508 POST Winter 02/23/10 Chinook 9 1 Night 2.1 125 2.4 14508 POST Winter 02/23/10 Other 11 10 Night 2.1 125 2.4 14508 POST Winter 02/23/10 Other 3 10 Night 2.1 125 2.4 14508 POST Winter 02/23/10 Other 5 19 Night 2.1 125 2.4 14508 POST Winter 02/23/10 Other 7 28 Night 2.1 125 2.4 14508 POST Winter 02/23/10 Other 9 6 Night 2.1 125 2.4 14508 POST Winter 02/23/10 Redsided Shiner - 10 Night 2.1 125 2.4 14508 POST Winter 02/23/10 Sculpin - 3 Night 2.1 125 2.4 14508 POST Winter 02/23/10 Steelhead 11 10 Night 2.1 125 2.4 14508 POST Winter 02/23/10 Steelhead 13 3 Night 2.1 125 2.4 14508 POST Winter 02/23/10 Steelhead 3 2 Night 2.1 125 2.4 14508 POST Winter 02/23/10 Steelhead 5 64 Night 2.1 125 2.4 14508 POST Winter 02/23/10 Steelhead 7 144 Night 2.1 125 2.4 14508 POST Winter 02/23/10 Steelhead 9 37 Night 2.1 125 2.4 14508 POST Winter 02/23/10 Sucker - 1 Night 2.1 125 2.4 14508 POST Winter 02/23/10 Whitefish 5 1 Night 2.1 125 2.4 14508 POST Winter 02/23/10 Whitefish 7 5 Night 2.1 125 2.4 14508 POST Winter 02/24/10 Brook Trout 17 2 Night 3.1 126 2.2 14130 POST Winter 02/24/10 Chinook 5 6 Night 3.1 126 2.2 14130 POST Winter 02/24/10 Chinook 7 7 Night 3.1 126 2.2 14130 POST Winter 02/24/10 Chinook 9 13 Night 3.1 126 2.2 14130 POST Winter 02/24/10 Other - 73 Night 3.1 126 2.2 14130 POST Winter 02/24/10 Steelhead 11 13 Night 3.1 126 2.2 14130 POST Winter 02/24/10 Steelhead 13 2 Night 3.1 126 2.2 14130 POST Winter 02/24/10 Steelhead 15 1 Night 3.1 126 2.2 14130 POST Winter 02/24/10 Steelhead 3 5 Night 3.1 126 2.2 14130 POST Winter 02/24/10 Steelhead 5 173 Night 3.1 126 2.2 14130 POST Winter 02/24/10 Steelhead 7 238 Night 3.1 126 2.2 14130 POST Winter 02/24/10 Steelhead 9 46 Night 3.1 126 2.2 14130 POST Winter 02/24/10 Unknown Salmonid 21 1 Night 3.1 126 2.2 14130 POST Winter 02/24/10 Whitefish 11 4 Night 3.1 126 2.2 14130 POST Winter 02/24/10 Whitefish 7 11 Night 3.1 126 2.2 14130 POST Winter 02/24/10 Whitefish 9 35 Night 3.1 126 2.2 14130 POST Winter 02/25/10 Brook Trout 17 1 Night 3.3 127 1.9 12203 POST Winter 02/25/10 Chinook 11 3 Night 3.3 127 1.9 12203 POST Winter 02/25/10 Chinook 5 3 Night 3.3 127 1.9 12203 POST Winter 02/25/10 Chinook 7 13 Night 3.3 127 1.9 12203 POST Winter 02/25/10 Chinook 9 6 Night 3.3 127 1.9 12203
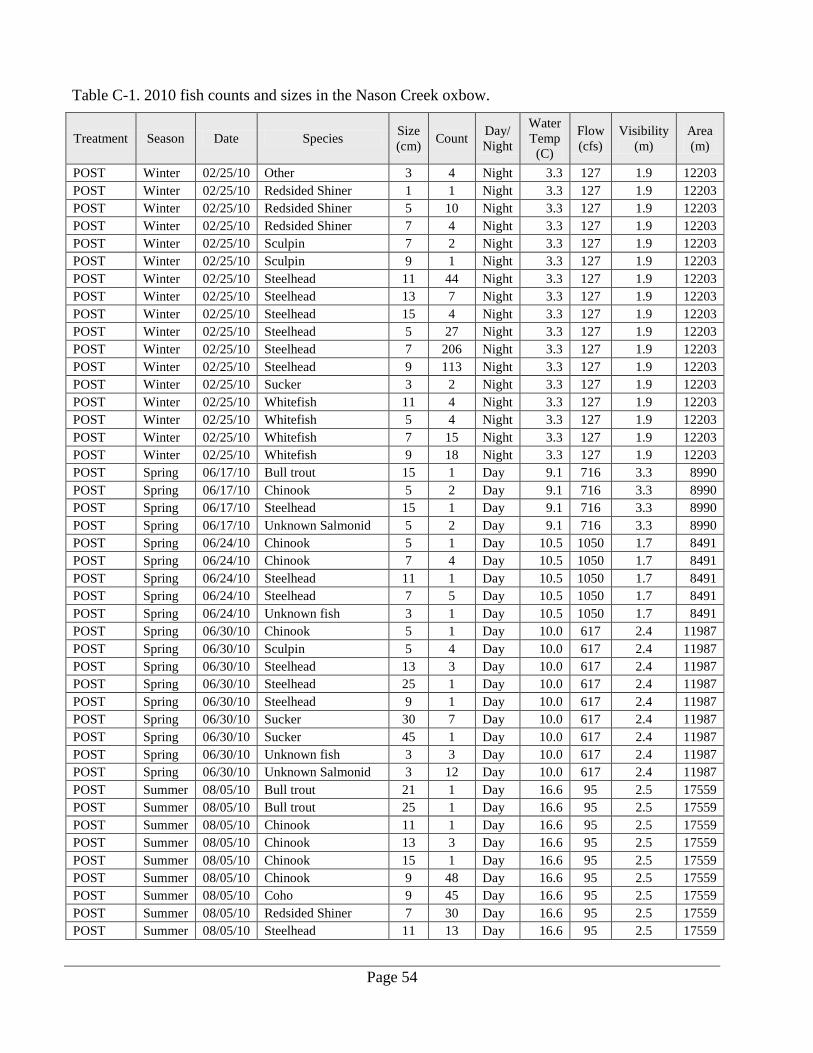
Page 54
Table C-1. 2010 fish counts and sizes in the Nason Creek oxbow.
Treatment Season Date Species Size (cm) Count Day/
Night
Water Temp (C)
Flow (cfs)
Visibility (m)
Area (m)
POST Winter 02/25/10 Other 3 4 Night 3.3 127 1.9 12203 POST Winter 02/25/10 Redsided Shiner 1 1 Night 3.3 127 1.9 12203 POST Winter 02/25/10 Redsided Shiner 5 10 Night 3.3 127 1.9 12203 POST Winter 02/25/10 Redsided Shiner 7 4 Night 3.3 127 1.9 12203 POST Winter 02/25/10 Sculpin 7 2 Night 3.3 127 1.9 12203 POST Winter 02/25/10 Sculpin 9 1 Night 3.3 127 1.9 12203 POST Winter 02/25/10 Steelhead 11 44 Night 3.3 127 1.9 12203 POST Winter 02/25/10 Steelhead 13 7 Night 3.3 127 1.9 12203 POST Winter 02/25/10 Steelhead 15 4 Night 3.3 127 1.9 12203 POST Winter 02/25/10 Steelhead 5 27 Night 3.3 127 1.9 12203 POST Winter 02/25/10 Steelhead 7 206 Night 3.3 127 1.9 12203 POST Winter 02/25/10 Steelhead 9 113 Night 3.3 127 1.9 12203 POST Winter 02/25/10 Sucker 3 2 Night 3.3 127 1.9 12203 POST Winter 02/25/10 Whitefish 11 4 Night 3.3 127 1.9 12203 POST Winter 02/25/10 Whitefish 5 4 Night 3.3 127 1.9 12203 POST Winter 02/25/10 Whitefish 7 15 Night 3.3 127 1.9 12203 POST Winter 02/25/10 Whitefish 9 18 Night 3.3 127 1.9 12203 POST Spring 06/17/10 Bull trout 15 1 Day 9.1 716 3.3 8990 POST Spring 06/17/10 Chinook 5 2 Day 9.1 716 3.3 8990 POST Spring 06/17/10 Steelhead 15 1 Day 9.1 716 3.3 8990 POST Spring 06/17/10 Unknown Salmonid 5 2 Day 9.1 716 3.3 8990 POST Spring 06/24/10 Chinook 5 1 Day 10.5 1050 1.7 8491 POST Spring 06/24/10 Chinook 7 4 Day 10.5 1050 1.7 8491 POST Spring 06/24/10 Steelhead 11 1 Day 10.5 1050 1.7 8491 POST Spring 06/24/10 Steelhead 7 5 Day 10.5 1050 1.7 8491 POST Spring 06/24/10 Unknown fish 3 1 Day 10.5 1050 1.7 8491 POST Spring 06/30/10 Chinook 5 1 Day 10.0 617 2.4 11987 POST Spring 06/30/10 Sculpin 5 4 Day 10.0 617 2.4 11987 POST Spring 06/30/10 Steelhead 13 3 Day 10.0 617 2.4 11987 POST Spring 06/30/10 Steelhead 25 1 Day 10.0 617 2.4 11987 POST Spring 06/30/10 Steelhead 9 1 Day 10.0 617 2.4 11987 POST Spring 06/30/10 Sucker 30 7 Day 10.0 617 2.4 11987 POST Spring 06/30/10 Sucker 45 1 Day 10.0 617 2.4 11987 POST Spring 06/30/10 Unknown fish 3 3 Day 10.0 617 2.4 11987 POST Spring 06/30/10 Unknown Salmonid 3 12 Day 10.0 617 2.4 11987 POST Summer 08/05/10 Bull trout 21 1 Day 16.6 95 2.5 17559 POST Summer 08/05/10 Bull trout 25 1 Day 16.6 95 2.5 17559 POST Summer 08/05/10 Chinook 11 1 Day 16.6 95 2.5 17559 POST Summer 08/05/10 Chinook 13 3 Day 16.6 95 2.5 17559 POST Summer 08/05/10 Chinook 15 1 Day 16.6 95 2.5 17559 POST Summer 08/05/10 Chinook 9 48 Day 16.6 95 2.5 17559 POST Summer 08/05/10 Coho 9 45 Day 16.6 95 2.5 17559 POST Summer 08/05/10 Redsided Shiner 7 30 Day 16.6 95 2.5 17559 POST Summer 08/05/10 Steelhead 11 13 Day 16.6 95 2.5 17559
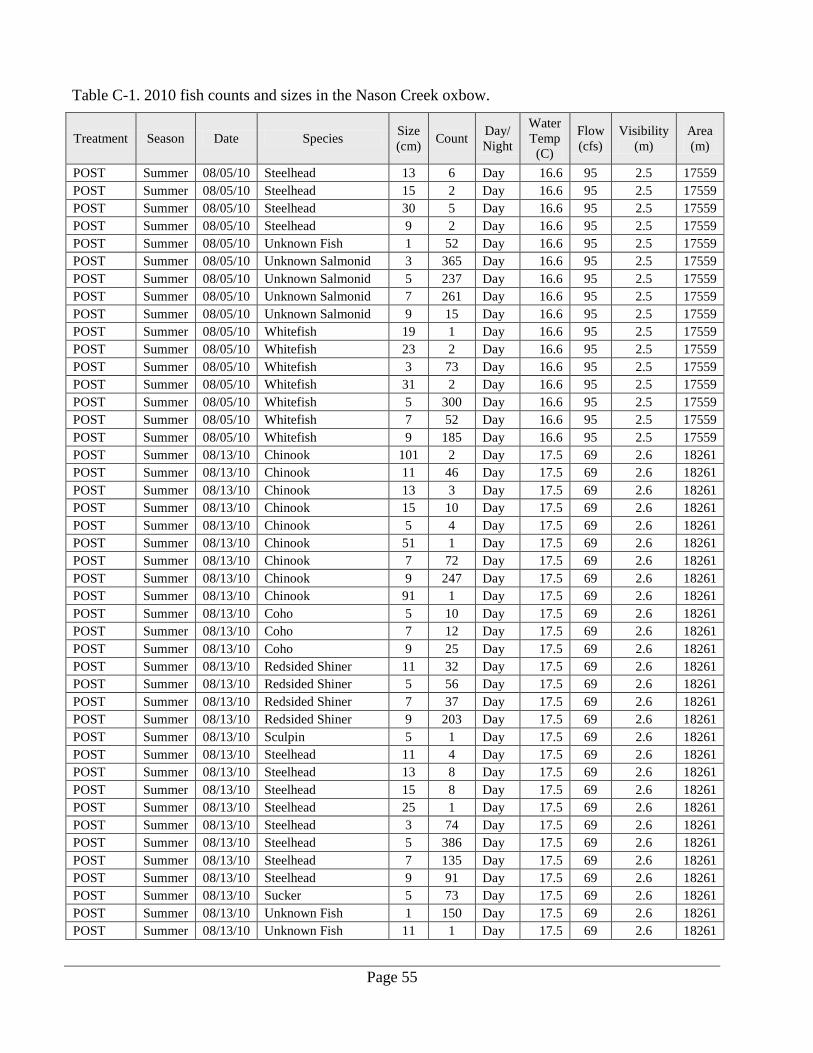
Page 55
Table C-1. 2010 fish counts and sizes in the Nason Creek oxbow.
Treatment Season Date Species Size (cm) Count Day/
Night
Water Temp (C)
Flow (cfs)
Visibility (m)
Area (m)
POST Summer 08/05/10 Steelhead 13 6 Day 16.6 95 2.5 17559 POST Summer 08/05/10 Steelhead 15 2 Day 16.6 95 2.5 17559 POST Summer 08/05/10 Steelhead 30 5 Day 16.6 95 2.5 17559 POST Summer 08/05/10 Steelhead 9 2 Day 16.6 95 2.5 17559 POST Summer 08/05/10 Unknown Fish 1 52 Day 16.6 95 2.5 17559 POST Summer 08/05/10 Unknown Salmonid 3 365 Day 16.6 95 2.5 17559 POST Summer 08/05/10 Unknown Salmonid 5 237 Day 16.6 95 2.5 17559 POST Summer 08/05/10 Unknown Salmonid 7 261 Day 16.6 95 2.5 17559 POST Summer 08/05/10 Unknown Salmonid 9 15 Day 16.6 95 2.5 17559 POST Summer 08/05/10 Whitefish 19 1 Day 16.6 95 2.5 17559 POST Summer 08/05/10 Whitefish 23 2 Day 16.6 95 2.5 17559 POST Summer 08/05/10 Whitefish 3 73 Day 16.6 95 2.5 17559 POST Summer 08/05/10 Whitefish 31 2 Day 16.6 95 2.5 17559 POST Summer 08/05/10 Whitefish 5 300 Day 16.6 95 2.5 17559 POST Summer 08/05/10 Whitefish 7 52 Day 16.6 95 2.5 17559 POST Summer 08/05/10 Whitefish 9 185 Day 16.6 95 2.5 17559 POST Summer 08/13/10 Chinook 101 2 Day 17.5 69 2.6 18261 POST Summer 08/13/10 Chinook 11 46 Day 17.5 69 2.6 18261 POST Summer 08/13/10 Chinook 13 3 Day 17.5 69 2.6 18261 POST Summer 08/13/10 Chinook 15 10 Day 17.5 69 2.6 18261 POST Summer 08/13/10 Chinook 5 4 Day 17.5 69 2.6 18261 POST Summer 08/13/10 Chinook 51 1 Day 17.5 69 2.6 18261 POST Summer 08/13/10 Chinook 7 72 Day 17.5 69 2.6 18261 POST Summer 08/13/10 Chinook 9 247 Day 17.5 69 2.6 18261 POST Summer 08/13/10 Chinook 91 1 Day 17.5 69 2.6 18261 POST Summer 08/13/10 Coho 5 10 Day 17.5 69 2.6 18261 POST Summer 08/13/10 Coho 7 12 Day 17.5 69 2.6 18261 POST Summer 08/13/10 Coho 9 25 Day 17.5 69 2.6 18261 POST Summer 08/13/10 Redsided Shiner 11 32 Day 17.5 69 2.6 18261 POST Summer 08/13/10 Redsided Shiner 5 56 Day 17.5 69 2.6 18261 POST Summer 08/13/10 Redsided Shiner 7 37 Day 17.5 69 2.6 18261 POST Summer 08/13/10 Redsided Shiner 9 203 Day 17.5 69 2.6 18261 POST Summer 08/13/10 Sculpin 5 1 Day 17.5 69 2.6 18261 POST Summer 08/13/10 Steelhead 11 4 Day 17.5 69 2.6 18261 POST Summer 08/13/10 Steelhead 13 8 Day 17.5 69 2.6 18261 POST Summer 08/13/10 Steelhead 15 8 Day 17.5 69 2.6 18261 POST Summer 08/13/10 Steelhead 25 1 Day 17.5 69 2.6 18261 POST Summer 08/13/10 Steelhead 3 74 Day 17.5 69 2.6 18261 POST Summer 08/13/10 Steelhead 5 386 Day 17.5 69 2.6 18261 POST Summer 08/13/10 Steelhead 7 135 Day 17.5 69 2.6 18261 POST Summer 08/13/10 Steelhead 9 91 Day 17.5 69 2.6 18261 POST Summer 08/13/10 Sucker 5 73 Day 17.5 69 2.6 18261 POST Summer 08/13/10 Unknown Fish 1 150 Day 17.5 69 2.6 18261 POST Summer 08/13/10 Unknown Fish 11 1 Day 17.5 69 2.6 18261
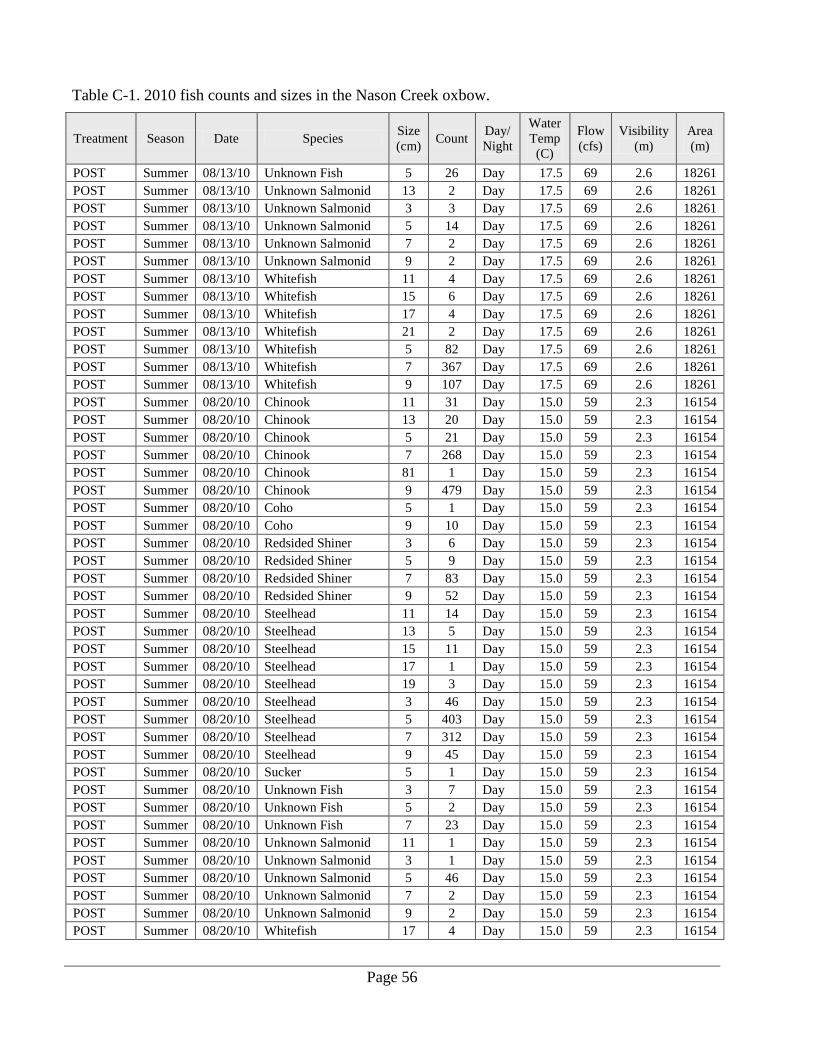
Page 56
Table C-1. 2010 fish counts and sizes in the Nason Creek oxbow.
Treatment Season Date Species Size (cm) Count Day/
Night
Water Temp (C)
Flow (cfs)
Visibility (m)
Area (m)
POST Summer 08/13/10 Unknown Fish 5 26 Day 17.5 69 2.6 18261 POST Summer 08/13/10 Unknown Salmonid 13 2 Day 17.5 69 2.6 18261 POST Summer 08/13/10 Unknown Salmonid 3 3 Day 17.5 69 2.6 18261 POST Summer 08/13/10 Unknown Salmonid 5 14 Day 17.5 69 2.6 18261 POST Summer 08/13/10 Unknown Salmonid 7 2 Day 17.5 69 2.6 18261 POST Summer 08/13/10 Unknown Salmonid 9 2 Day 17.5 69 2.6 18261 POST Summer 08/13/10 Whitefish 11 4 Day 17.5 69 2.6 18261 POST Summer 08/13/10 Whitefish 15 6 Day 17.5 69 2.6 18261 POST Summer 08/13/10 Whitefish 17 4 Day 17.5 69 2.6 18261 POST Summer 08/13/10 Whitefish 21 2 Day 17.5 69 2.6 18261 POST Summer 08/13/10 Whitefish 5 82 Day 17.5 69 2.6 18261 POST Summer 08/13/10 Whitefish 7 367 Day 17.5 69 2.6 18261 POST Summer 08/13/10 Whitefish 9 107 Day 17.5 69 2.6 18261 POST Summer 08/20/10 Chinook 11 31 Day 15.0 59 2.3 16154 POST Summer 08/20/10 Chinook 13 20 Day 15.0 59 2.3 16154 POST Summer 08/20/10 Chinook 5 21 Day 15.0 59 2.3 16154 POST Summer 08/20/10 Chinook 7 268 Day 15.0 59 2.3 16154 POST Summer 08/20/10 Chinook 81 1 Day 15.0 59 2.3 16154 POST Summer 08/20/10 Chinook 9 479 Day 15.0 59 2.3 16154 POST Summer 08/20/10 Coho 5 1 Day 15.0 59 2.3 16154 POST Summer 08/20/10 Coho 9 10 Day 15.0 59 2.3 16154 POST Summer 08/20/10 Redsided Shiner 3 6 Day 15.0 59 2.3 16154 POST Summer 08/20/10 Redsided Shiner 5 9 Day 15.0 59 2.3 16154 POST Summer 08/20/10 Redsided Shiner 7 83 Day 15.0 59 2.3 16154 POST Summer 08/20/10 Redsided Shiner 9 52 Day 15.0 59 2.3 16154 POST Summer 08/20/10 Steelhead 11 14 Day 15.0 59 2.3 16154 POST Summer 08/20/10 Steelhead 13 5 Day 15.0 59 2.3 16154 POST Summer 08/20/10 Steelhead 15 11 Day 15.0 59 2.3 16154 POST Summer 08/20/10 Steelhead 17 1 Day 15.0 59 2.3 16154 POST Summer 08/20/10 Steelhead 19 3 Day 15.0 59 2.3 16154 POST Summer 08/20/10 Steelhead 3 46 Day 15.0 59 2.3 16154 POST Summer 08/20/10 Steelhead 5 403 Day 15.0 59 2.3 16154 POST Summer 08/20/10 Steelhead 7 312 Day 15.0 59 2.3 16154 POST Summer 08/20/10 Steelhead 9 45 Day 15.0 59 2.3 16154 POST Summer 08/20/10 Sucker 5 1 Day 15.0 59 2.3 16154 POST Summer 08/20/10 Unknown Fish 3 7 Day 15.0 59 2.3 16154 POST Summer 08/20/10 Unknown Fish 5 2 Day 15.0 59 2.3 16154 POST Summer 08/20/10 Unknown Fish 7 23 Day 15.0 59 2.3 16154 POST Summer 08/20/10 Unknown Salmonid 11 1 Day 15.0 59 2.3 16154 POST Summer 08/20/10 Unknown Salmonid 3 1 Day 15.0 59 2.3 16154 POST Summer 08/20/10 Unknown Salmonid 5 46 Day 15.0 59 2.3 16154 POST Summer 08/20/10 Unknown Salmonid 7 2 Day 15.0 59 2.3 16154 POST Summer 08/20/10 Unknown Salmonid 9 2 Day 15.0 59 2.3 16154 POST Summer 08/20/10 Whitefish 17 4 Day 15.0 59 2.3 16154

Page 57
Table C-1. 2010 fish counts and sizes in the Nason Creek oxbow.
Treatment Season Date Species Size (cm) Count Day/
Night
Water Temp (C)
Flow (cfs)
Visibility (m)
Area (m)
POST Summer 08/20/10 Whitefish 19 1 Day 15.0 59 2.3 16154 POST Summer 08/20/10 Whitefish 21 1 Day 15.0 59 2.3 16154 POST Summer 08/20/10 Whitefish 5 171 Day 15.0 59 2.3 16154 POST Summer 08/20/10 Whitefish 7 618 Day 15.0 59 2.3 16154 POST Summer 08/20/10 Whitefish 9 65 Day 15.0 59 2.3 16154
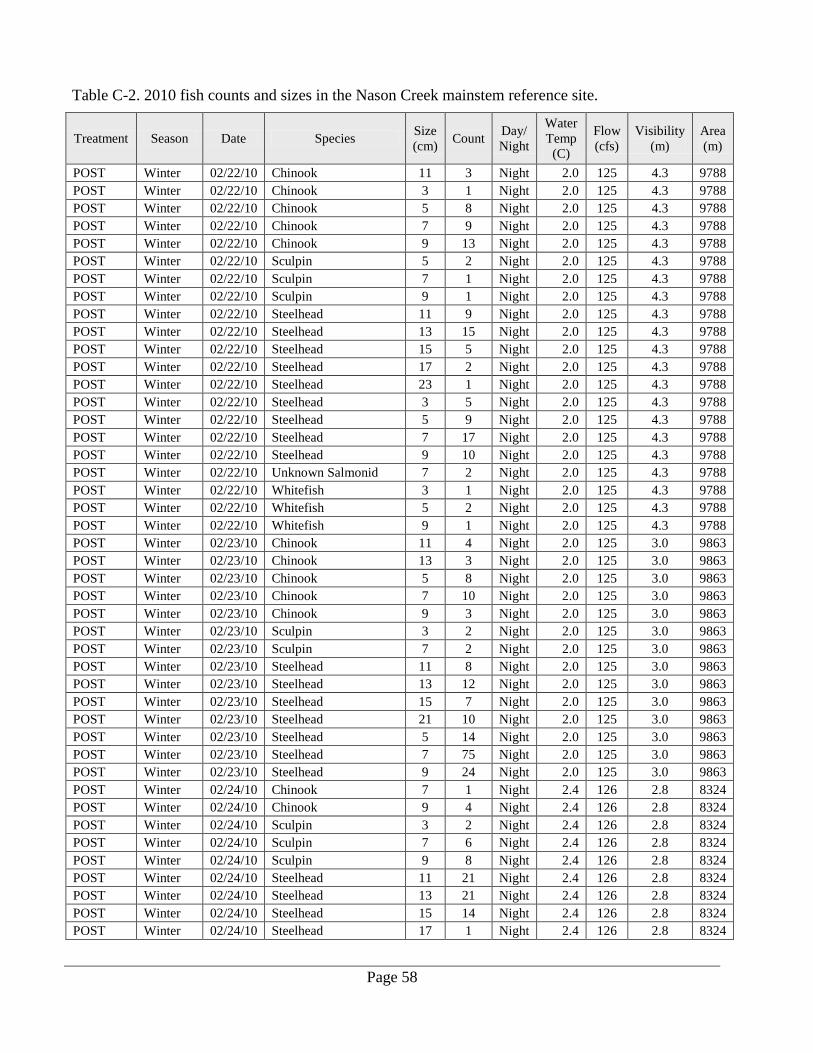
Page 58
Table C-2. 2010 fish counts and sizes in the Nason Creek mainstem reference site.
Treatment Season Date Species Size (cm) Count Day/
Night
Water Temp
(C)
Flow (cfs)
Visibility (m)
Area (m)
POST Winter 02/22/10 Chinook 11 3 Night 2.0 125 4.3 9788 POST Winter 02/22/10 Chinook 3 1 Night 2.0 125 4.3 9788 POST Winter 02/22/10 Chinook 5 8 Night 2.0 125 4.3 9788 POST Winter 02/22/10 Chinook 7 9 Night 2.0 125 4.3 9788 POST Winter 02/22/10 Chinook 9 13 Night 2.0 125 4.3 9788 POST Winter 02/22/10 Sculpin 5 2 Night 2.0 125 4.3 9788 POST Winter 02/22/10 Sculpin 7 1 Night 2.0 125 4.3 9788 POST Winter 02/22/10 Sculpin 9 1 Night 2.0 125 4.3 9788 POST Winter 02/22/10 Steelhead 11 9 Night 2.0 125 4.3 9788 POST Winter 02/22/10 Steelhead 13 15 Night 2.0 125 4.3 9788 POST Winter 02/22/10 Steelhead 15 5 Night 2.0 125 4.3 9788 POST Winter 02/22/10 Steelhead 17 2 Night 2.0 125 4.3 9788 POST Winter 02/22/10 Steelhead 23 1 Night 2.0 125 4.3 9788 POST Winter 02/22/10 Steelhead 3 5 Night 2.0 125 4.3 9788 POST Winter 02/22/10 Steelhead 5 9 Night 2.0 125 4.3 9788 POST Winter 02/22/10 Steelhead 7 17 Night 2.0 125 4.3 9788 POST Winter 02/22/10 Steelhead 9 10 Night 2.0 125 4.3 9788 POST Winter 02/22/10 Unknown Salmonid 7 2 Night 2.0 125 4.3 9788 POST Winter 02/22/10 Whitefish 3 1 Night 2.0 125 4.3 9788 POST Winter 02/22/10 Whitefish 5 2 Night 2.0 125 4.3 9788 POST Winter 02/22/10 Whitefish 9 1 Night 2.0 125 4.3 9788 POST Winter 02/23/10 Chinook 11 4 Night 2.0 125 3.0 9863 POST Winter 02/23/10 Chinook 13 3 Night 2.0 125 3.0 9863 POST Winter 02/23/10 Chinook 5 8 Night 2.0 125 3.0 9863 POST Winter 02/23/10 Chinook 7 10 Night 2.0 125 3.0 9863 POST Winter 02/23/10 Chinook 9 3 Night 2.0 125 3.0 9863 POST Winter 02/23/10 Sculpin 3 2 Night 2.0 125 3.0 9863 POST Winter 02/23/10 Sculpin 7 2 Night 2.0 125 3.0 9863 POST Winter 02/23/10 Steelhead 11 8 Night 2.0 125 3.0 9863 POST Winter 02/23/10 Steelhead 13 12 Night 2.0 125 3.0 9863 POST Winter 02/23/10 Steelhead 15 7 Night 2.0 125 3.0 9863 POST Winter 02/23/10 Steelhead 21 10 Night 2.0 125 3.0 9863 POST Winter 02/23/10 Steelhead 5 14 Night 2.0 125 3.0 9863 POST Winter 02/23/10 Steelhead 7 75 Night 2.0 125 3.0 9863 POST Winter 02/23/10 Steelhead 9 24 Night 2.0 125 3.0 9863 POST Winter 02/24/10 Chinook 7 1 Night 2.4 126 2.8 8324 POST Winter 02/24/10 Chinook 9 4 Night 2.4 126 2.8 8324 POST Winter 02/24/10 Sculpin 3 2 Night 2.4 126 2.8 8324 POST Winter 02/24/10 Sculpin 7 6 Night 2.4 126 2.8 8324 POST Winter 02/24/10 Sculpin 9 8 Night 2.4 126 2.8 8324 POST Winter 02/24/10 Steelhead 11 21 Night 2.4 126 2.8 8324 POST Winter 02/24/10 Steelhead 13 21 Night 2.4 126 2.8 8324 POST Winter 02/24/10 Steelhead 15 14 Night 2.4 126 2.8 8324 POST Winter 02/24/10 Steelhead 17 1 Night 2.4 126 2.8 8324
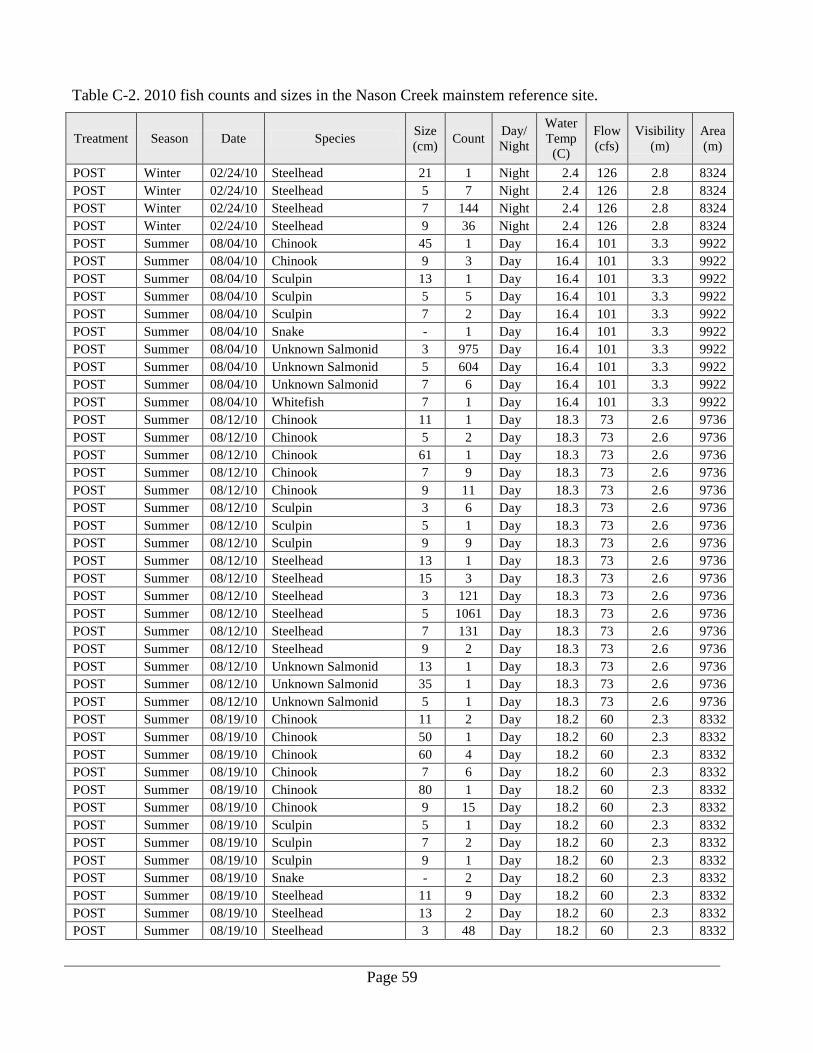
Page 59
Table C-2. 2010 fish counts and sizes in the Nason Creek mainstem reference site.
Treatment Season Date Species Size (cm) Count Day/
Night
Water Temp
(C)
Flow (cfs)
Visibility (m)
Area (m)
POST Winter 02/24/10 Steelhead 21 1 Night 2.4 126 2.8 8324 POST Winter 02/24/10 Steelhead 5 7 Night 2.4 126 2.8 8324 POST Winter 02/24/10 Steelhead 7 144 Night 2.4 126 2.8 8324 POST Winter 02/24/10 Steelhead 9 36 Night 2.4 126 2.8 8324 POST Summer 08/04/10 Chinook 45 1 Day 16.4 101 3.3 9922 POST Summer 08/04/10 Chinook 9 3 Day 16.4 101 3.3 9922 POST Summer 08/04/10 Sculpin 13 1 Day 16.4 101 3.3 9922 POST Summer 08/04/10 Sculpin 5 5 Day 16.4 101 3.3 9922 POST Summer 08/04/10 Sculpin 7 2 Day 16.4 101 3.3 9922 POST Summer 08/04/10 Snake - 1 Day 16.4 101 3.3 9922 POST Summer 08/04/10 Unknown Salmonid 3 975 Day 16.4 101 3.3 9922 POST Summer 08/04/10 Unknown Salmonid 5 604 Day 16.4 101 3.3 9922 POST Summer 08/04/10 Unknown Salmonid 7 6 Day 16.4 101 3.3 9922 POST Summer 08/04/10 Whitefish 7 1 Day 16.4 101 3.3 9922 POST Summer 08/12/10 Chinook 11 1 Day 18.3 73 2.6 9736 POST Summer 08/12/10 Chinook 5 2 Day 18.3 73 2.6 9736 POST Summer 08/12/10 Chinook 61 1 Day 18.3 73 2.6 9736 POST Summer 08/12/10 Chinook 7 9 Day 18.3 73 2.6 9736 POST Summer 08/12/10 Chinook 9 11 Day 18.3 73 2.6 9736 POST Summer 08/12/10 Sculpin 3 6 Day 18.3 73 2.6 9736 POST Summer 08/12/10 Sculpin 5 1 Day 18.3 73 2.6 9736 POST Summer 08/12/10 Sculpin 9 9 Day 18.3 73 2.6 9736 POST Summer 08/12/10 Steelhead 13 1 Day 18.3 73 2.6 9736 POST Summer 08/12/10 Steelhead 15 3 Day 18.3 73 2.6 9736 POST Summer 08/12/10 Steelhead 3 121 Day 18.3 73 2.6 9736 POST Summer 08/12/10 Steelhead 5 1061 Day 18.3 73 2.6 9736 POST Summer 08/12/10 Steelhead 7 131 Day 18.3 73 2.6 9736 POST Summer 08/12/10 Steelhead 9 2 Day 18.3 73 2.6 9736 POST Summer 08/12/10 Unknown Salmonid 13 1 Day 18.3 73 2.6 9736 POST Summer 08/12/10 Unknown Salmonid 35 1 Day 18.3 73 2.6 9736 POST Summer 08/12/10 Unknown Salmonid 5 1 Day 18.3 73 2.6 9736 POST Summer 08/19/10 Chinook 11 2 Day 18.2 60 2.3 8332 POST Summer 08/19/10 Chinook 50 1 Day 18.2 60 2.3 8332 POST Summer 08/19/10 Chinook 60 4 Day 18.2 60 2.3 8332 POST Summer 08/19/10 Chinook 7 6 Day 18.2 60 2.3 8332 POST Summer 08/19/10 Chinook 80 1 Day 18.2 60 2.3 8332 POST Summer 08/19/10 Chinook 9 15 Day 18.2 60 2.3 8332 POST Summer 08/19/10 Sculpin 5 1 Day 18.2 60 2.3 8332 POST Summer 08/19/10 Sculpin 7 2 Day 18.2 60 2.3 8332 POST Summer 08/19/10 Sculpin 9 1 Day 18.2 60 2.3 8332 POST Summer 08/19/10 Snake - 2 Day 18.2 60 2.3 8332 POST Summer 08/19/10 Steelhead 11 9 Day 18.2 60 2.3 8332 POST Summer 08/19/10 Steelhead 13 2 Day 18.2 60 2.3 8332 POST Summer 08/19/10 Steelhead 3 48 Day 18.2 60 2.3 8332

Page 60
Table C-2. 2010 fish counts and sizes in the Nason Creek mainstem reference site.
Treatment Season Date Species Size (cm) Count Day/
Night
Water Temp
(C)
Flow (cfs)
Visibility (m)
Area (m)
POST Summer 08/19/10 Steelhead 5 957 Day 18.2 60 2.3 8332 POST Summer 08/19/10 Steelhead 7 310 Day 18.2 60 2.3 8332 POST Summer 08/19/10 Steelhead 9 17 Day 18.2 60 2.3 8332 POST Summer 08/19/10 Whitefish 30 1 Day 18.2 60 2.3 8332 POST Summer 08/19/10 Whitefish 45 1 Day 18.2 60 2.3 8332

Page 61
Table C-3. 2010 fish counts and sizes in the Chiwawa River off-channel reference site.
Treatment Season Date Species Size (cm) Count Day/
Night
Water Temp
(C)
Flow (cfs)
Visibility (m)
Area (m)
POST Spring 06/17/10 Chinook 5 2 Day 7.0 1490 4.1 730 POST Spring 06/17/10 Redsided Shiner 3 1 Day 7.0 1490 4.1 730 POST Spring 06/17/10 Unknown fish 3 1 Day 7.0 1490 4.1 730 POST Spring 06/24/10 Chinook 5 2 Day 6.7 2200 1.9 1144 POST Spring 06/24/10 Unknown Salmonid 5 4 Day 6.7 2200 1.9 1144 POST Spring 06/30/10 Chinook 5 17 Day 6.6 1680 1.6 877 POST Summer 08/04/10 Chinook 5 185 Day 8.0 544 2.8 859 POST Summer 08/13/10 Chinook 5 44 Day 6.8 341 1.6 813 POST Summer 08/13/10 Chinook 7 58 Day 6.8 341 1.6 813 POST Summer 08/13/10 Chinook 9 1 Day 6.8 341 1.6 813 POST Summer 08/13/10 Steelhead 5 10 Day 6.8 341 1.6 813 POST Summer 08/13/10 Unknown Salmonid 5 16 Day 6.8 341 1.6 813 POST Summer 08/19/10 Chinook 3 1 Day 8.0 273 2.2 790 POST Summer 08/19/10 Chinook 5 15 Day 8.0 273 2.2 790 POST Summer 08/19/10 Chinook 7 86 Day 8.0 273 2.2 790 POST Summer 08/19/10 Unknown Salmonid 5 14 Day 8.0 273 2.2 790 POST Summer 08/19/10 Unknown Salmonid 7 5 Day 8.0 273 2.2 790