Embed Size (px)
Citation preview

NASA’s GRACE Mission -Opportunities in Fire Severity Risk Mapping
TFRSAC Fall Meeting October 23, 2014JT Reager Jet Propulsion LaboratoryChristine Rains NASA DEVELOP National Program

The DEVELOP National Program
Measurements
and Predictions
Communities
NASA DEVELOP
Discovering Innovative & Practical Applications of NASA Earth Science
Agri
culture
Clim
ate
Dis
aste
rs
Eco
logic
al
Fo
reca
stin
gEner
gy
Hea
lth &
Air
Qual
ity
Oce
ans
Wat
er
Res
ourc
esW
eath
er
Applied Sciences Program Website: www.nasa.gov/applied-sciences
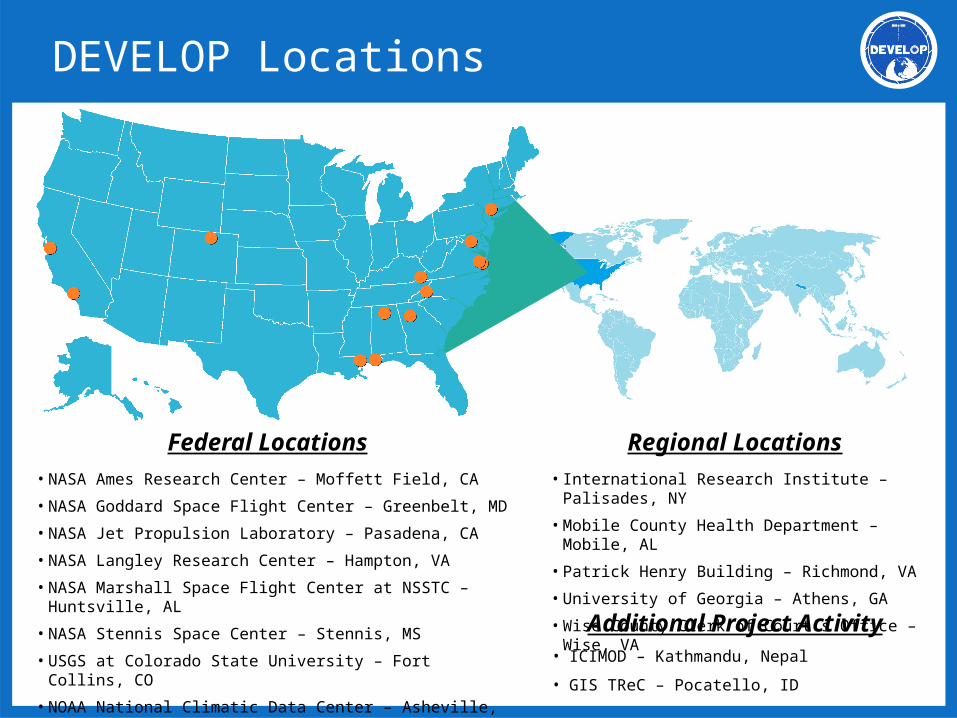
DEVELOP Locations
Federal Locations• NASA Ames Research Center – Moffett Field, CA
• NASA Goddard Space Flight Center – Greenbelt, MD
• NASA Jet Propulsion Laboratory – Pasadena, CA
• NASA Langley Research Center – Hampton, VA
• NASA Marshall Space Flight Center at NSSTC – Huntsville, AL
• NASA Stennis Space Center – Stennis, MS
• USGS at Colorado State University – Fort Collins, CO
• NOAA National Climatic Data Center – Asheville, NC
Regional Locations• International Research Institute – Palisades,
NY
• Mobile County Health Department – Mobile, AL
• Patrick Henry Building – Richmond, VA
• University of Georgia – Athens, GA
• Wise County Clerk of Court’s Office – Wise, VAAdditional Project Activity• ICIMOD – Kathmandu, Nepal
• GIS TReC – Pocatello, ID
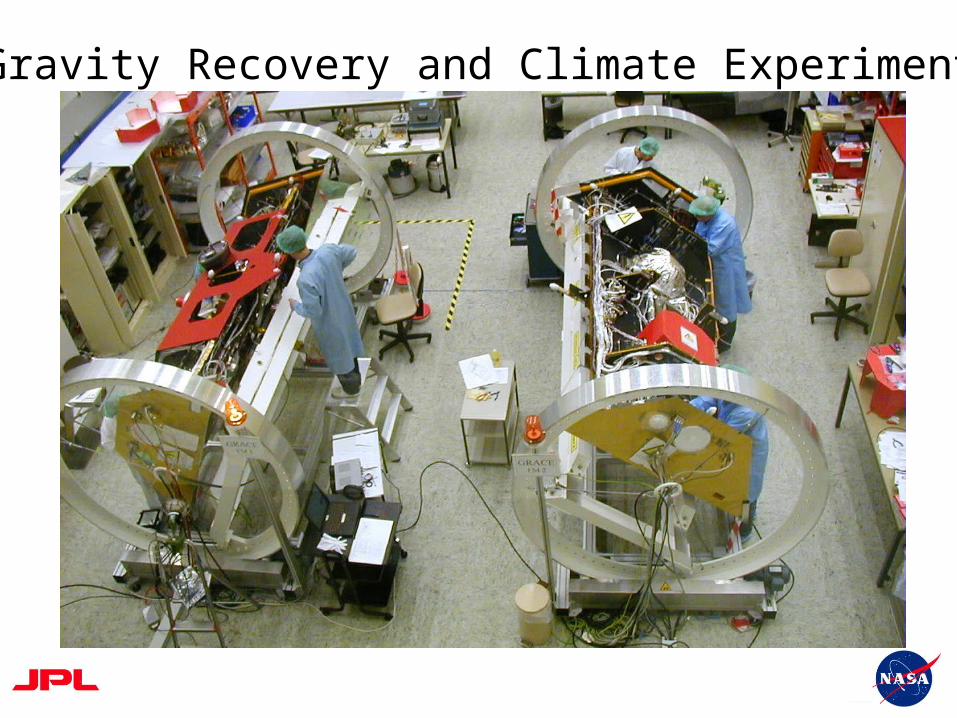
Gravity Recovery and Climate Experiment

How GRACE works
Concentrations (or deficits) of mass
affect the spacing
between the satellites

What GRACE “sees”
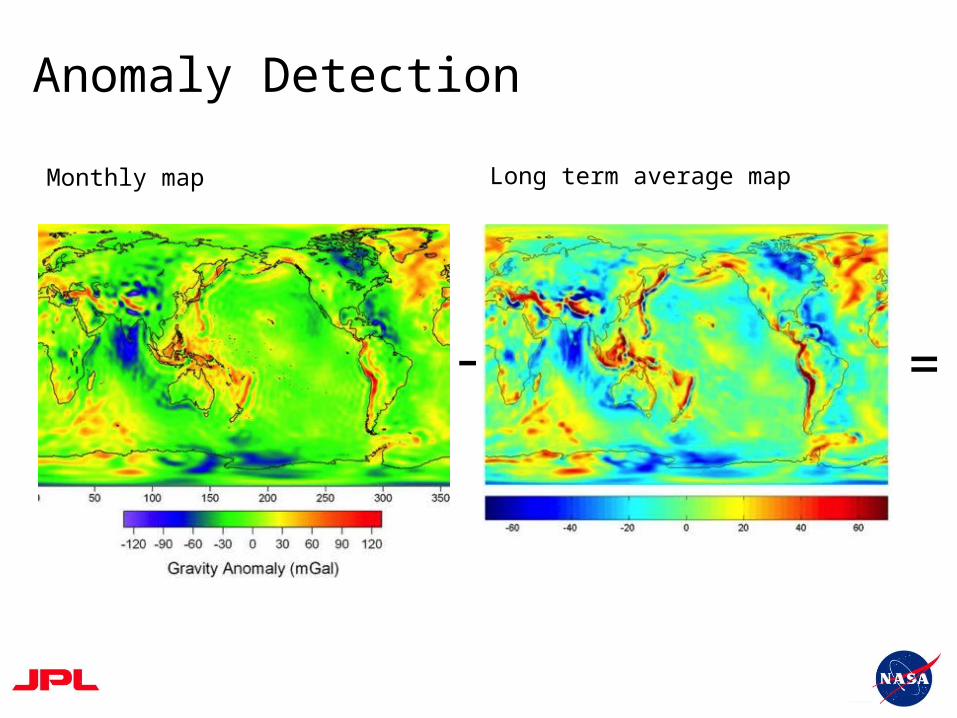
Monthly map Long term average map
- =
Anomaly Detection

• Monthly changes in gravity are caused by monthly changes in mass
• At certain time and space scales, assume change in gravity caused by changes in water storage
• Vertical extent on the order of centimeters
• CSR- 3 source : Time resolution of monthly, resolution ~200,000 km2
Terrestrial Water Storage Anomaly

GRACE Water storage deficits
Thomas, Reager, Famiglietti, GRL 2014


GRACE Data Assimilated Products

Strategy• Evidence that it is not just the dry years that are
correlated with fire• Fuel accumulation occurs in wet years, so both wet
and dry years are needed in sequence
Chen, Y., I. Velicogna, J. S. Famiglietti, and J. T. Randerson (2013). Satellite observations of terrestrial water storage provide early warning information about drought and fire season severity in the Amazon, JGRB
Anomaly PlotData Plot

Strategy
• Evidence that it is not just the dry years that are correlated with fire
• Fuel accumulation occurs in wet years, so both wet and dry years are needed in sequence
• Use GRACE-assimilated data combined with NDVI/EVI to identify areas of high fire risk at 0.25 deg resolution for CONUS, 2003 to Present
• Validate with GFED historical data to assess predictive capability of the methodology
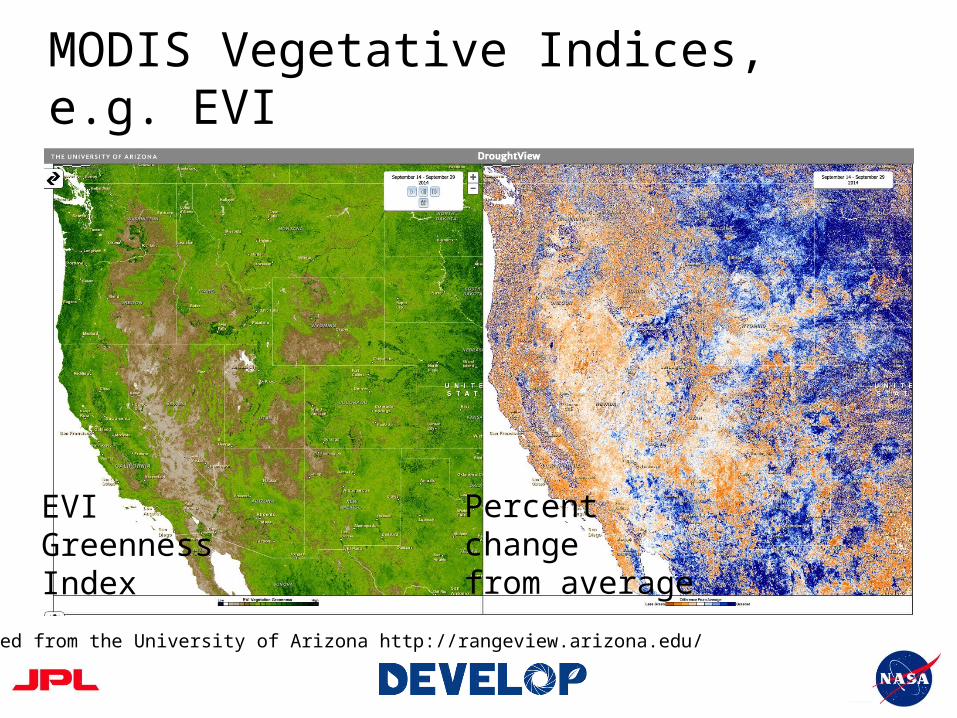
MODIS Vegetative Indices, e.g. EVI
Obtained from the University of Arizona http://rangeview.arizona.edu/
EVI Greenness Index
Percent change from average

Global Fire Emissions Database (GFED)
Burned area (fraction of grid cell)
Fuel consumption (g C m-2 burned)
Combines data from multiple datasets
• MODIS burned area maps
• VIIRS active fire data
• ATSR world fire atlas
Final products have 0.25 degree resolution
Some other DEVELOP fire projects…
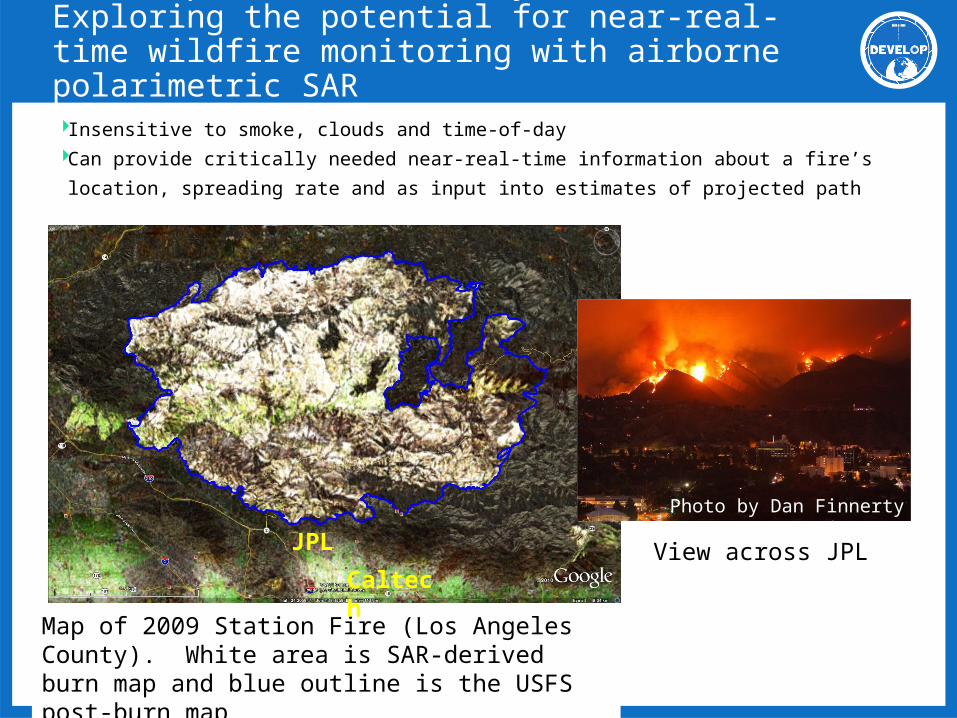
Jet Propulsion Laboratory: Exploring the potential for near-real-time wildfire monitoring with airborne polarimetric SAR Insensitive to smoke, clouds and time-of-day Can provide critically needed near-real-time information about a fire’s
location, spreading rate and as input into estimates of projected path
Map of 2009 Station Fire (Los Angeles County). White area is SAR-derived burn map and blue outline is the USFS post-burn map
JPL
Caltech
Photo by Dan Finnerty
View across JPL

Community Concerns Increasing temperatures Reduced spring snowpack More severe wildfires
Partners USDA Forest Service, RO5 Esri Plotly
Features Web Mapping
Application Climate, hydrology, and
vegetation datasets in a Mapping Viewer
Statistically & graphically analyzed datasets
Download portal for data
Ames Research Center: Sierra Nevada Decision Support System

Contact the DEVELOP National Program Office [email protected](757) 864-3761
Contact DEVELOP Center RepresentativesChristine Rains – DEVELOP JPL Center Lead
Andrew Nguyen – DEVELOP ARC Center Lead [email protected]
Amber Brooks – DEVELOP ARC Geoinformatics Young Professional
For More Information