Embed Size (px)
Citation preview
National Aeronautics and Space Administration
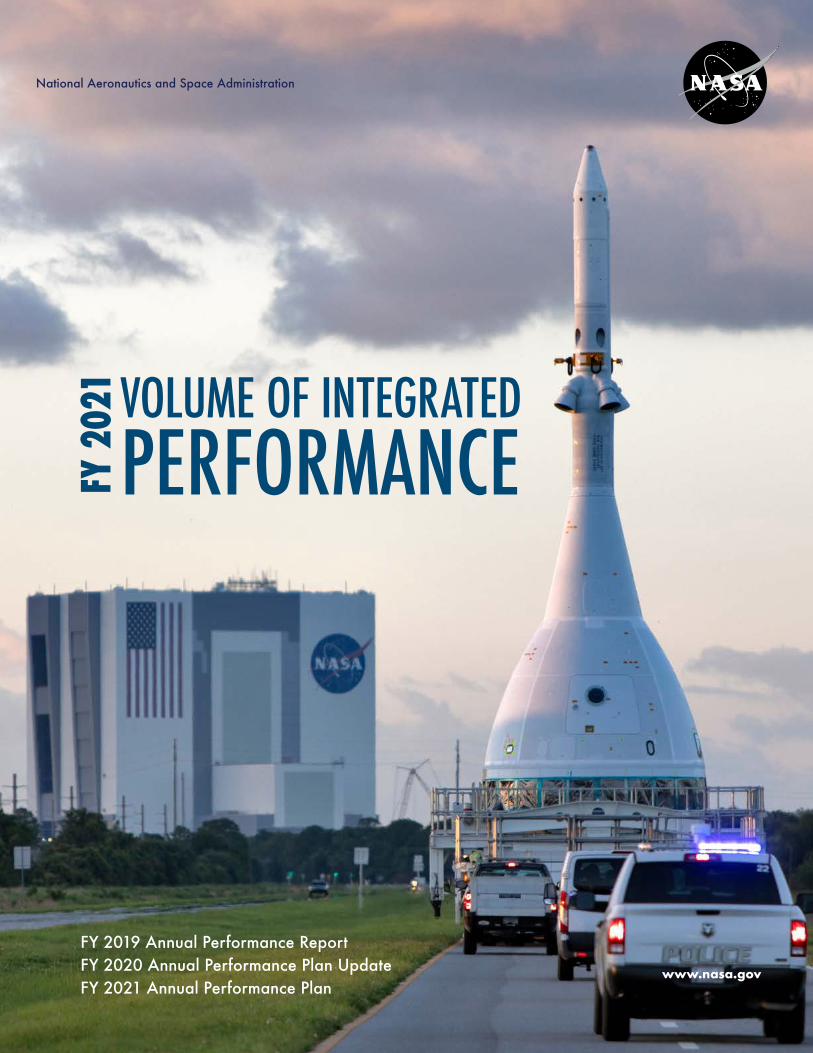
FY 2019 Annual Performance ReportFY 2020 Annual Performance Plan UpdateFY 2021 Annual Performance Plan
VOLUME OF INTEGRATEDPERFORMANCEFY
202
1
www.nasa.gov
NASA’s FY 2021 Volume of Integrated Performance i
Letter from the Chief Financial Officer
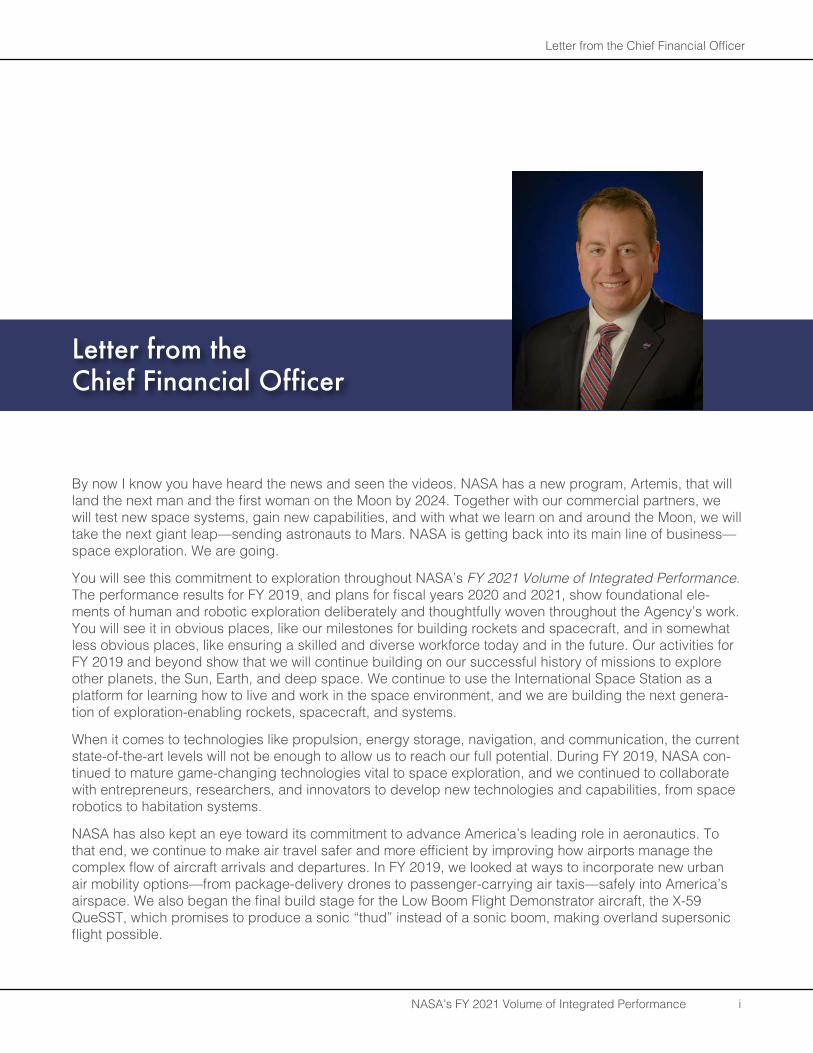
Letter from the Chief Financial Officer
By now I know you have heard the news and seen the videos. NASA has a new program, Artemis, that will land the next man and the first woman on the Moon by 2024. Together with our commercial partners, we will test new space systems, gain new capabilities, and with what we learn on and around the Moon, we will take the next giant leap—sending astronauts to Mars. NASA is getting back into its main line of business—space exploration. We are going.
You will see this commitment to exploration throughout NASA’s FY 2021 Volume of Integrated Performance. The performance results for FY 2019, and plans for fiscal years 2020 and 2021, show foundational ele-ments of human and robotic exploration deliberately and thoughtfully woven throughout the Agency’s work. You will see it in obvious places, like our milestones for building rockets and spacecraft, and in somewhat less obvious places, like ensuring a skilled and diverse workforce today and in the future. Our activities for FY 2019 and beyond show that we will continue building on our successful history of missions to explore other planets, the Sun, Earth, and deep space. We continue to use the International Space Station as a platform for learning how to live and work in the space environment, and we are building the next genera-tion of exploration-enabling rockets, spacecraft, and systems.
When it comes to technologies like propulsion, energy storage, navigation, and communication, the current state-of-the-art levels will not be enough to allow us to reach our full potential. During FY 2019, NASA con-tinued to mature game-changing technologies vital to space exploration, and we continued to collaborate with entrepreneurs, researchers, and innovators to develop new technologies and capabilities, from space robotics to habitation systems.
NASA has also kept an eye toward its commitment to advance America’s leading role in aeronautics. To that end, we continue to make air travel safer and more efficient by improving how airports manage the complex flow of aircraft arrivals and departures. In FY 2019, we looked at ways to incorporate new urban air mobility options—from package-delivery drones to passenger-carrying air taxis—safely into America’s airspace. We also began the final build stage for the Low Boom Flight Demonstrator aircraft, the X-59 QueSST, which promises to produce a sonic “thud” instead of a sonic boom, making overland supersonic flight possible.
NASA’s FY 2021 Volume of Integrated Performance ii
Letter from the Chief Financial Officer
One thing we are going to need for sure: a continuous stream of young minds, with the training, skills, and passion to make U.S. space exploration a reality. We will need engineers and scientists, statisticians and accountants, human resources and procurement professionals, IT developers, and support specialists. Our needs are and will be great and varied. So NASA is sowing the seeds of interest and nurturing ability that we will need in our future workforce. We are engaging people and igniting interest in our missions through social media, hands-on activities and challenges, citizen science, and in our educational opportunities.
In this report, you will see highlights of what NASA accomplished in FY 2019. You will also see that our performance ratings are not perfect, but if they were, maybe we aren’t pushing ourselves hard enough. To take the next giant leap or make the next great discovery, we have to be ambitious and set challenging goals. We continually have to evaluate how we manage our projects, operations, and people. Starting this year, we are stepping up our efforts to assess performance and evaluate our strategies and outcomes. We are increasing our capability and capacity to build and use evidence to better inform future decisions. We are always striving to improve our performance, so we have been pursuing the implementation of correc-tive actions that will lead to improved program performance and increased transparency for our external stakeholders. This is an important element in our exploration commitment to the Nation—to do our best to make each dollar count, to make the best effort, and to ensure that successes are meaningful.
This revitalized emphasis on Artemis and exploration promises exciting times for NASA and the Nation. We invite you to become a part of it, and I present to you a plan of what we will do and how we will do it. We promise to do it thoughtfully, creatively, inclusively, and transparently. With that, I will begin to make good on those promises through this report, NASA’s FY 2021 Volume of Integrated Performance.
Jeff DeWit Chief Financial Officer
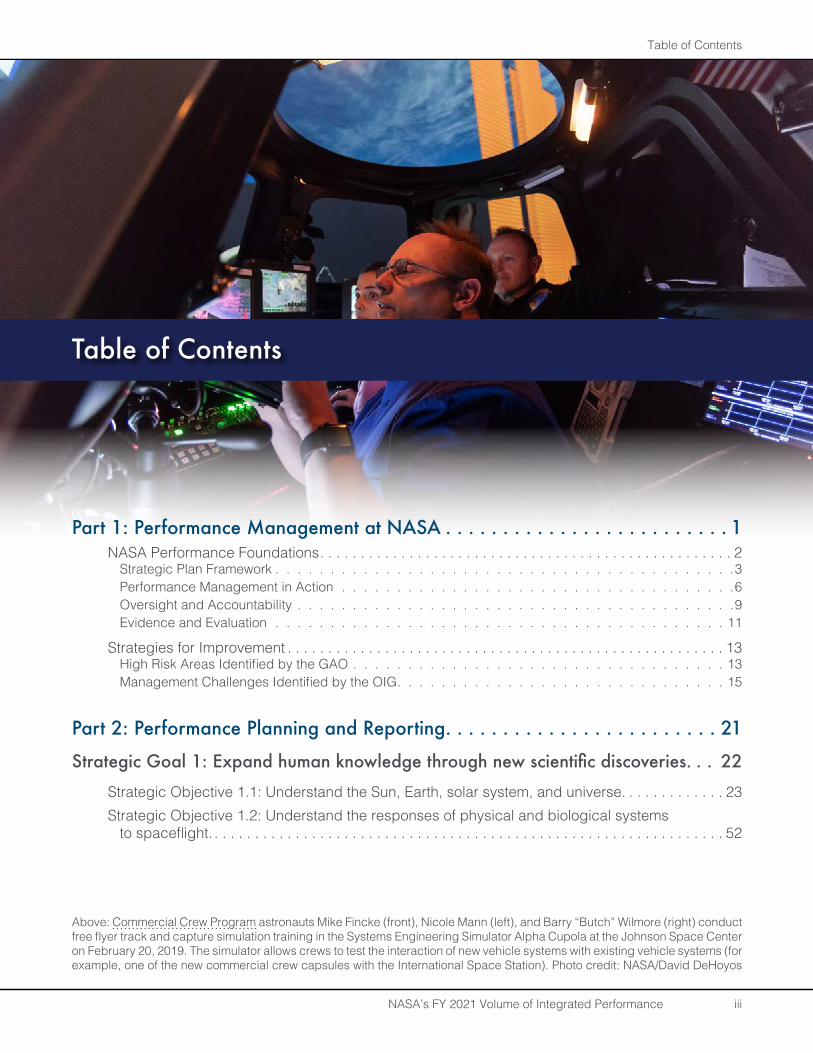
Table of Contents
NASA’s FY 2021 Volume of Integrated Performance iii
Table of Contents
Part 1: Performance Management at NASA . . . . . . . . . . . . . . . . . . . . . . . . . 1NASA Performance Foundations. . . . . . . . . . . . . . . . . . . . . . . . . . . . . . . . . . . . . . . . . . . . . . . . . . . 2
Strategic Plan Framework . . . . . . . . . . . . . . . . . . . . . . . . . . . . . . . . . . . . . . . . . .3Performance Management in Action . . . . . . . . . . . . . . . . . . . . . . . . . . . . . . . . . . . .6Oversight and Accountability . . . . . . . . . . . . . . . . . . . . . . . . . . . . . . . . . . . . . . . .9Evidence and Evaluation . . . . . . . . . . . . . . . . . . . . . . . . . . . . . . . . . . . . . . . . . 11
Strategies for Improvement . . . . . . . . . . . . . . . . . . . . . . . . . . . . . . . . . . . . . . . . . . . . . . . . . . . . . . 13High Risk Areas Identified by the GAO . . . . . . . . . . . . . . . . . . . . . . . . . . . . . . . . . . 13Management Challenges Identified by the OIG. . . . . . . . . . . . . . . . . . . . . . . . . . . . . . 15
Part 2: Performance Planning and Reporting . . . . . . . . . . . . . . . . . . . . . . . . 21
Strategic Goal 1: Expand human knowledge through new scientific discoveries. . . 22
Strategic Objective 1.1: Understand the Sun, Earth, solar system, and universe. . . . . . . . . . . . . 23Strategic Objective 1.2: Understand the responses of physical and biological systems
to spaceflight. . . . . . . . . . . . . . . . . . . . . . . . . . . . . . . . . . . . . . . . . . . . . . . . . . . . . . . . . . . . . . . . 52
Above: Commercial Crew Program astronauts Mike Fincke (front), Nicole Mann (left), and Barry “Butch” Wilmore (right) conduct free flyer track and capture simulation training in the Systems Engineering Simulator Alpha Cupola at the Johnson Space Center on February 20, 2019. The simulator allows crews to test the interaction of new vehicle systems with existing vehicle systems (for example, one of the new commercial crew capsules with the International Space Station). Photo credit: NASA/David DeHoyos
Table of Contents
NASA’s FY 2021 Volume of Integrated Performance iv
Strategic Goal 2: Extend human presence deeper into space and to the Moon for sustainable long-term exploration and utilization . . . . . . . . . . . . . 56
Strategic Objective 2.1: Lay the foundation for America to maintain a constant human presence in low Earth orbit enabled by a commercial market. . . . . . . . . . . . . . . . . . . . 57
Strategic Objective 2.2: Conduct human exploration in deep space, including to the surface of the Moon.. . . . . . . . . . . . . . . . . . . . . . . . . . . . . . . . . . . . . . . . . . . . . . . . . . . . . 63
Strategic Goal 3: Address national challenges and catalyze economic growth . . . 69
Strategic Objective 3.1: Develop and transfer revolutionary technologies to enable exploration capabilities for NASA and the Nation. . . . . . . . . . . . . . . . . . . . . . . . . . . . . . . . . . . . 70
Strategic Objective 3.2: Transform aviation through revolutionary technology research, development, and transfer. . . . . . . . . . . . . . . . . . . . . . . . . . . . . . . . . . . . . . . . . . . . . 76
Strategic Objective 3.3: Inspire and engage the public in aeronautics, space, and science. . . . 87
Strategic Goal 4: Optimize capabilities and operations . . . . . . . . . . . . . . . . . . . . 96
Strategic Objective 4.1: Engage in partnership strategies. . . . . . . . . . . . . . . . . . . . . . . . . . . . . . 97Strategic Objective 4.2: Enable space access and services.. . . . . . . . . . . . . . . . . . . . . . . . . . . 102Strategic Objective 4.3: Assure safety and mission success. . . . . . . . . . . . . . . . . . . . . . . . . . . 113Strategic Objective 4.4: Manage human capital. . . . . . . . . . . . . . . . . . . . . . . . . . . . . . . . . . . . . 118Strategic Objective 4.5: Ensure enterprise protection. . . . . . . . . . . . . . . . . . . . . . . . . . . . . . . . . 122Strategic Objective 4.6: Sustain infrastructure capabilities and operations. . . . . . . . . . . . . . . . 126
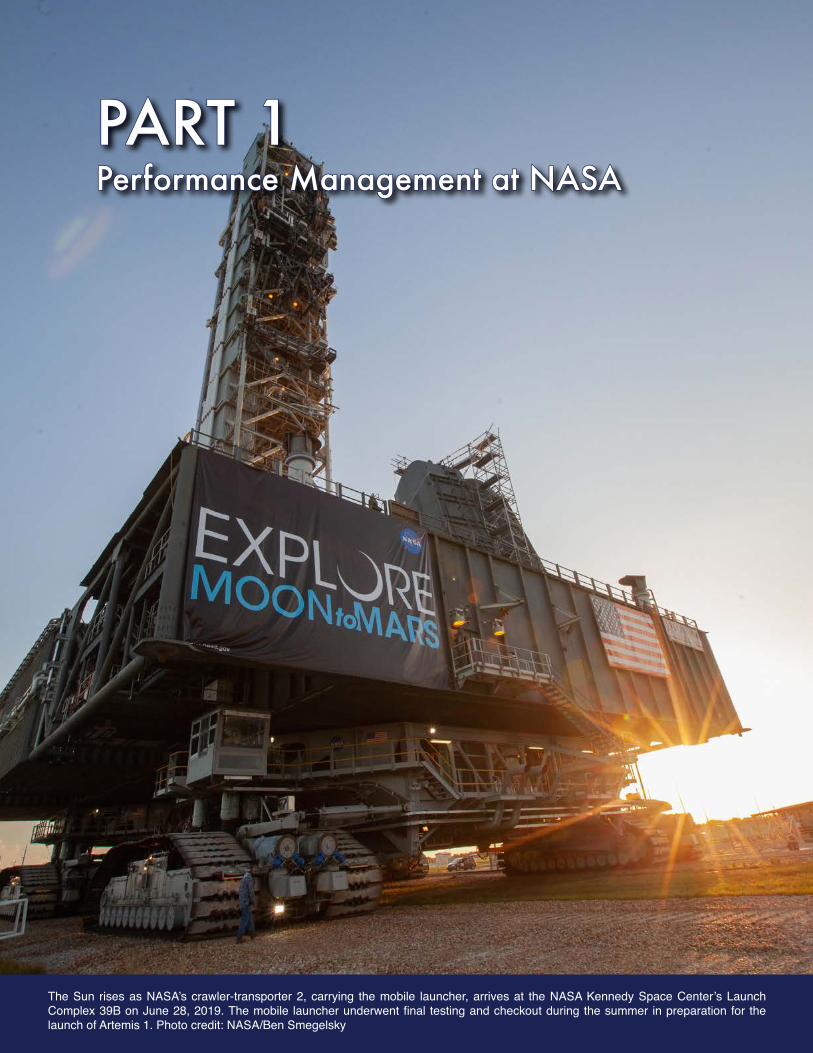
The Sun rises as NASA’s crawler-transporter 2, carrying the mobile launcher, arrives at the NASA Kennedy Space Center’s Launch Complex 39B on June 28, 2019. The mobile launcher underwent final testing and checkout during the summer in preparation for the launch of Artemis 1. Photo credit: NASA/Ben Smegelsky
PART 1PART 1Performance Management at NASAPerformance Management at NASA
NASA Performance Foundations
NASA’s FY 2021 Volume of Integrated Performance 2
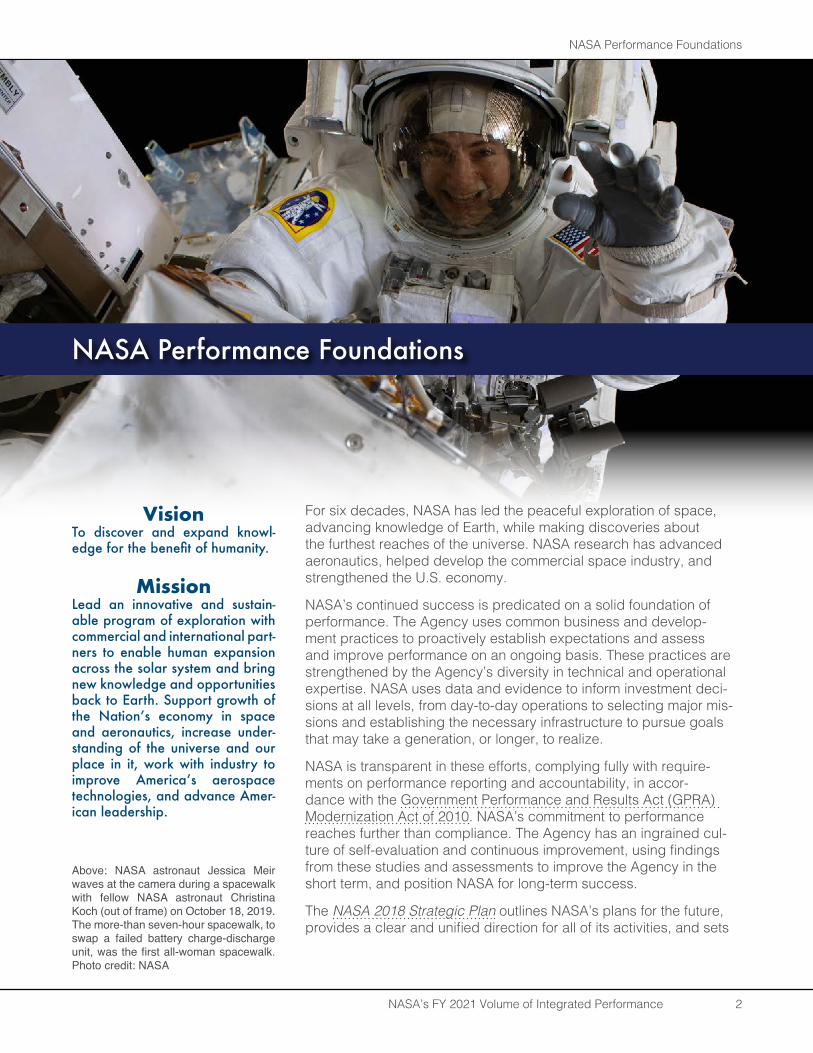
Above: NASA astronaut Jessica Meir waves at the camera during a spacewalk with fellow NASA astronaut Christina Koch (out of frame) on October 18, 2019. The more-than seven-hour spacewalk, to swap a failed battery charge-discharge unit, was the first all-woman spacewalk. Photo credit: NASA
For six decades, NASA has led the peaceful exploration of space, advancing knowledge of Earth, while making discoveries about the furthest reaches of the universe. NASA research has advanced aeronautics, helped develop the commercial space industry, and strengthened the U.S. economy.
NASA’s continued success is predicated on a solid foundation of performance. The Agency uses common business and develop-ment practices to proactively establish expectations and assess and improve performance on an ongoing basis. These practices are strengthened by the Agency’s diversity in technical and operational expertise. NASA uses data and evidence to inform investment deci-sions at all levels, from day-to-day operations to selecting major mis-sions and establishing the necessary infrastructure to pursue goals that may take a generation, or longer, to realize.
NASA is transparent in these efforts, complying fully with require-ments on performance reporting and accountability, in accor-dance with the Government Performance and Results Act (GPRA) Modernization Act of 2010. NASA’s commitment to performance reaches further than compliance. The Agency has an ingrained cul-ture of self-evaluation and continuous improvement, using findings from these studies and assessments to improve the Agency in the short term, and position NASA for long-term success.
The NASA 2018 Strategic Plan outlines NASA’s plans for the future, provides a clear and unified direction for all of its activities, and sets
VisionTo discover and expand knowl-edge for the benefit of humanity.
MissionLead an innovative and sustain-able program of exploration with commercial and international part-ners to enable human expansion across the solar system and bring new knowledge and opportunities back to Earth . Support growth of the Nation’s economy in space and aeronautics, increase under-standing of the universe and our place in it, work with industry to improve America’s aerospace technologies, and advance Amer-ican leadership .
NASA Performance Foundations
NASA Performance Foundations
NASA’s FY 2021 Volume of Integrated Performance 3
the foundation on which the Agency can build and measure the success of its programs and proj-ects. This direction is captured in NASA’s Vision and Mission statements—why NASA exists, what it aspires to achieve, and how it expects to make a difference that benefits all Americans.
The information reported in this document is aligned with the NASA 2018 Strategic Plan and the FY 2021 Budget Estimates, in accordance with the requirements of the GPRA Modernization Act.
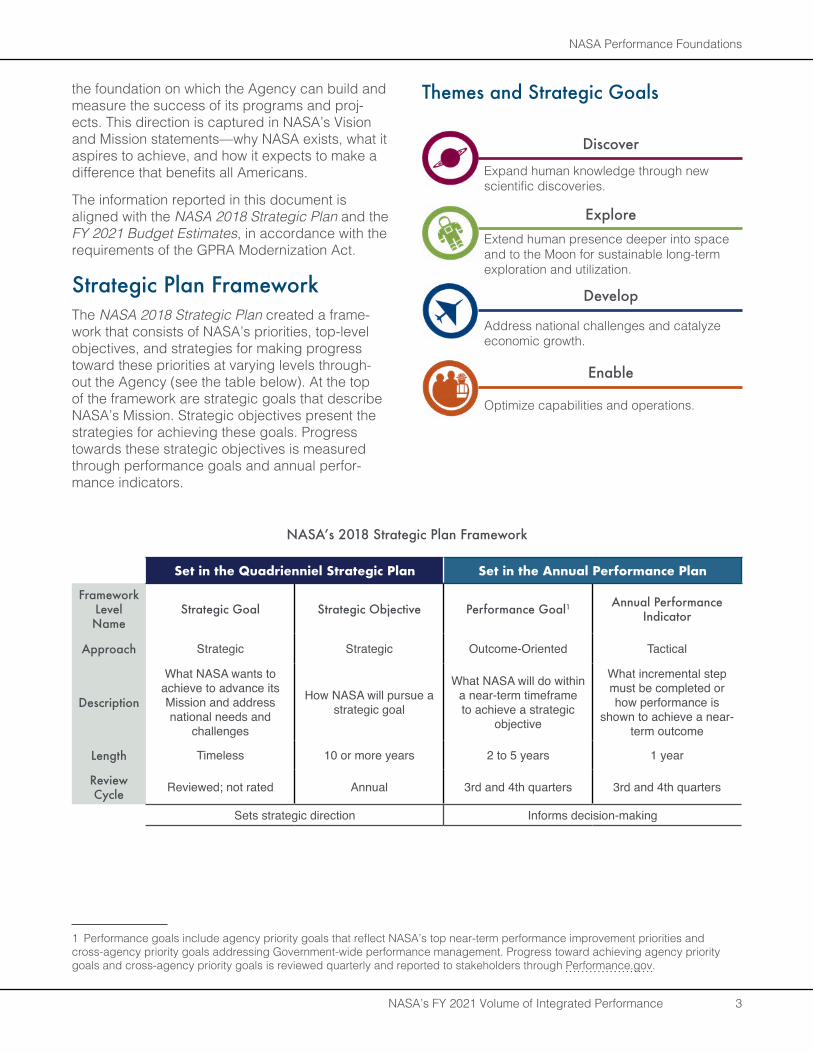
Strategic Plan FrameworkThe NASA 2018 Strategic Plan created a frame-work that consists of NASA’s priorities, top-level objectives, and strategies for making progress toward these priorities at varying levels through-out the Agency (see the table below). At the top of the framework are strategic goals that describe NASA’s Mission. Strategic objectives present the strategies for achieving these goals. Progress towards these strategic objectives is measured through performance goals and annual perfor-mance indicators.
Themes and Strategic Goals
Discover
Expand human knowledge through new scientific discoveries.
ExploreExtend human presence deeper into space and to the Moon for sustainable long-term exploration and utilization.
Develop
Address national challenges and catalyze economic growth.
Enable
Optimize capabilities and operations.
NASA’s 2018 Strategic Plan Framework
Set in the Quadrienniel Strategic Plan Set in the Annual Performance Plan
Framework Level Name
Strategic Goal Strategic Objective Performance Goal1 Annual Performance Indicator
Approach Strategic Strategic Outcome-Oriented Tactical
Description
What NASA wants to achieve to advance its Mission and address national needs and
challenges
How NASA will pursue a strategic goal
What NASA will do within a near-term timeframe to achieve a strategic
objective
What incremental step must be completed or how performance is
shown to achieve a near-term outcome
Length Timeless 10 or more years 2 to 5 years 1 year
Review Cycle Reviewed; not rated Annual 3rd and 4th quarters 3rd and 4th quarters
Sets strategic direction Informs decision-making
1 Performance goals include agency priority goals that reflect NASA’s top near-term performance improvement priorities and cross-agency priority goals addressing Government-wide performance management. Progress toward achieving agency priority goals and cross-agency priority goals is reviewed quarterly and reported to stakeholders through Performance.gov.
NASA Performance Foundations
NASA’s FY 2021 Volume of Integrated Performance 4
Annual Performance PlanThe Annual Performance Plan consists of perfor-mance goals and measurable targets that align to NASA’s budget and communicate desired out-comes. The plan is released to the public concur-rently with the full budget request document. Part 2 of this Volume of Integrated Performance includes the FY 2021 Annual Performance Plan.
Annual Performance Plan UpdateIn addition to performance planning for the bud-get year, NASA also reevaluates and updates the performance goals and targets released the pre-vious year. The Annual Performance Plan Update ensures that the plan still accurately reflects the budget, priorities, and programmatic plans. This is an opportunity for NASA to revise performance measure descriptions, add new measures, or delete unneeded measures due to strategic, budgetary, or programmatic changes that have occurred since the plan was originally submitted the year before.
NASA revised the reporting structure for perfor-mance goals starting with the FY 2020 Annual Performance Plan. Previously, NASA reported performance goals and the annual performance indicators as separate measured units. The new reporting structure incorporates the annual perfor-mance indicator into the performance goal. Each multiyear performance goal will have a measure-ment statement and annual targets. This change
to the reporting increases data transparency and clarity of the outcomes the Agency is planning to achieve. NASA has updated all of the performance goals for FY 2020 to reflect this new reporting structure; these are in Part 2.
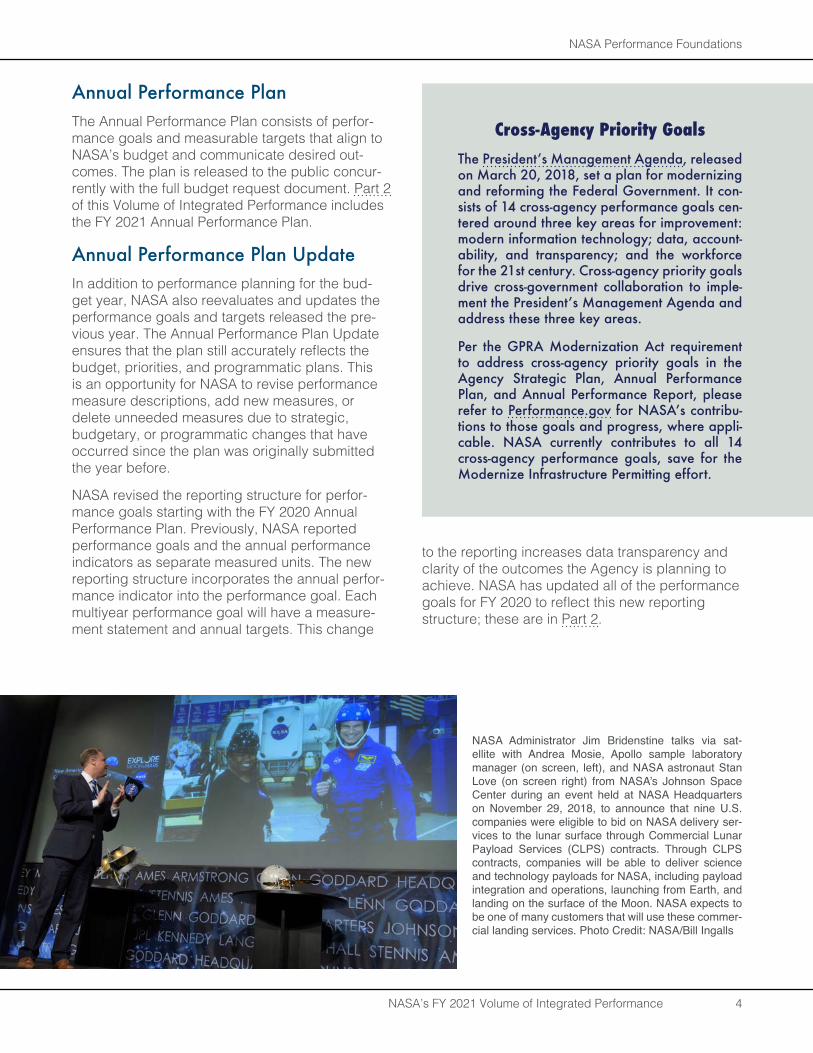
NASA Administrator Jim Bridenstine talks via sat-ellite with Andrea Mosie, Apollo sample laboratory manager (on screen, left), and NASA astronaut Stan Love (on screen right) from NASA’s Johnson Space Center during an event held at NASA Headquarters on November 29, 2018, to announce that nine U.S. companies were eligible to bid on NASA delivery ser-vices to the lunar surface through Commercial Lunar Payload Services (CLPS) contracts. Through CLPS contracts, companies will be able to deliver science and technology payloads for NASA, including payload integration and operations, launching from Earth, and landing on the surface of the Moon. NASA expects to be one of many customers that will use these commer-cial landing services. Photo Credit: NASA/Bill Ingalls
Cross-Agency Priority GoalsThe President’s Management Agenda, released on March 20, 2018, set a plan for modernizing and reforming the Federal Government. It con-sists of 14 cross-agency performance goals cen-tered around three key areas for improvement: modern information technology; data, account-ability, and transparency; and the workforce for the 21st century . Cross-agency priority goals drive cross-government collaboration to imple-ment the President’s Management Agenda and address these three key areas .
Per the GPRA Modernization Act requirement to address cross-agency priority goals in the Agency Strategic Plan, Annual Performance Plan, and Annual Performance Report, please refer to Performance.gov for NASA’s contribu-tions to those goals and progress, where appli-cable . NASA currently contributes to all 14 cross-agency performance goals, save for the Modernize Infrastructure Permitting effort .
NASA Performance Foundations
NASA’s FY 2021 Volume of Integrated Performance 5
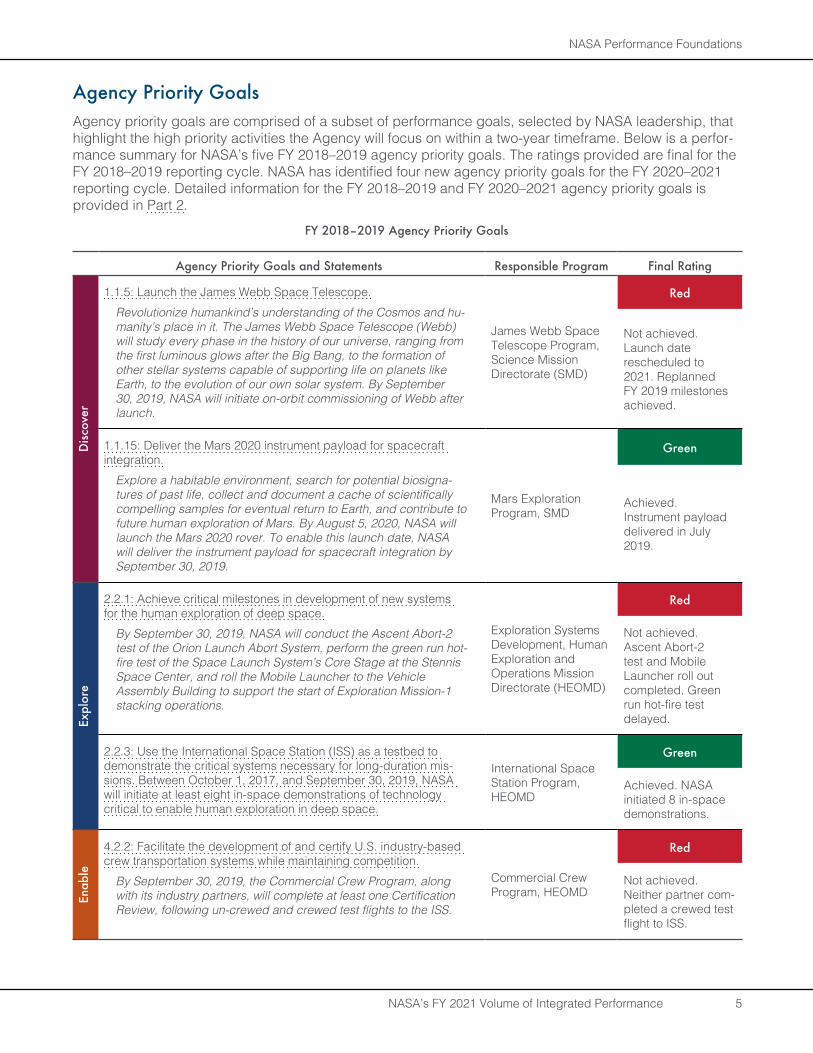
Agency Priority GoalsAgency priority goals are comprised of a subset of performance goals, selected by NASA leadership, that highlight the high priority activities the Agency will focus on within a two-year timeframe. Below is a perfor-mance summary for NASA’s five FY 2018–2019 agency priority goals. The ratings provided are final for the FY 2018–2019 reporting cycle. NASA has identified four new agency priority goals for the FY 2020–2021 reporting cycle. Detailed information for the FY 2018–2019 and FY 2020–2021 agency priority goals is provided in Part 2.
FY 2018–2019 Agency Priority Goals
Agency Priority Goals and Statements Responsible Program Final Rating
Disc
over
1.1.5: Launch the James Webb Space Telescope.Revolutionize humankind’s understanding of the Cosmos and hu-manity’s place in it. The James Webb Space Telescope (Webb) will study every phase in the history of our universe, ranging from the first luminous glows after the Big Bang, to the formation of other stellar systems capable of supporting life on planets like Earth, to the evolution of our own solar system. By September 30, 2019, NASA will initiate on-orbit commissioning of Webb after launch.
James Webb Space Telescope Program, Science Mission Directorate (SMD)
Red
Not achieved. Launch date rescheduled to 2021. Replanned FY 2019 milestones achieved.
1.1.15: Deliver the Mars 2020 instrument payload for spacecraft integration.
Explore a habitable environment, search for potential biosigna-tures of past life, collect and document a cache of scientifically compelling samples for eventual return to Earth, and contribute to future human exploration of Mars. By August 5, 2020, NASA will launch the Mars 2020 rover. To enable this launch date, NASA will deliver the instrument payload for spacecraft integration by September 30, 2019.
Mars Exploration Program, SMD
Green
Achieved. Instrument payload delivered in July 2019.
Expl
ore
2.2.1: Achieve critical milestones in development of new systems for the human exploration of deep space.
By September 30, 2019, NASA will conduct the Ascent Abort-2 test of the Orion Launch Abort System, perform the green run hot-fire test of the Space Launch System’s Core Stage at the Stennis Space Center, and roll the Mobile Launcher to the Vehicle Assembly Building to support the start of Exploration Mission-1 stacking operations.
Exploration Systems Development, Human Exploration and Operations Mission Directorate (HEOMD)
Red
Not achieved. Ascent Abort-2 test and Mobile Launcher roll out completed. Green run hot-fire test delayed.
2.2.3: Use the International Space Station (ISS) as a testbed to demonstrate the critical systems necessary for long-duration mis-sions. Between October 1, 2017, and September 30, 2019, NASA will initiate at least eight in-space demonstrations of technology critical to enable human exploration in deep space.
International Space Station Program, HEOMD
Green
Achieved. NASA initiated 8 in-space demonstrations.
Enab
le
4.2.2: Facilitate the development of and certify U.S. industry-based crew transportation systems while maintaining competition.
By September 30, 2019, the Commercial Crew Program, along with its industry partners, will complete at least one Certification Review, following un-crewed and crewed test flights to the ISS.
Commercial Crew Program, HEOMD
Red
Not achieved. Neither partner com-pleted a crewed test flight to ISS.
NASA Performance Foundations
NASA’s FY 2021 Volume of Integrated Performance 6
FY 2020–2021 Agency Priority Goals
Agency Priority Goals and Statements Responsible Program
Disc
over
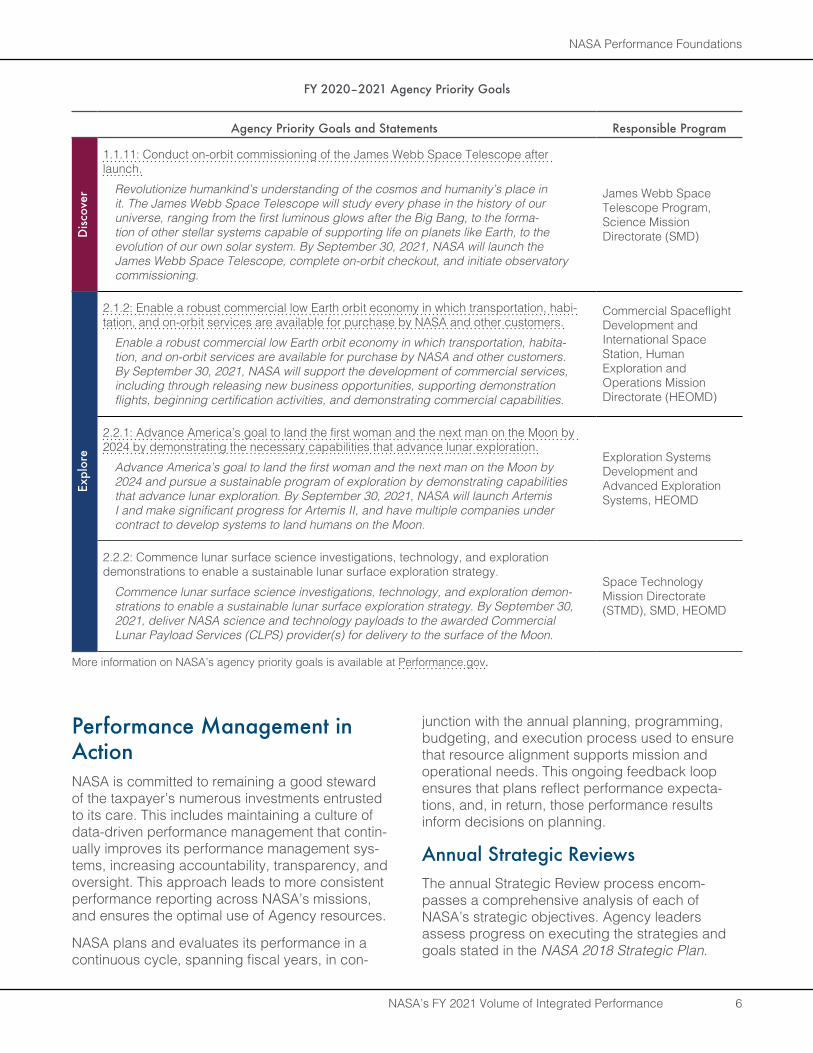
1.1.11: Conduct on-orbit commissioning of the James Webb Space Telescope after launch.
Revolutionize humankind’s understanding of the cosmos and humanity’s place in it. The James Webb Space Telescope will study every phase in the history of our universe, ranging from the first luminous glows after the Big Bang, to the forma-tion of other stellar systems capable of supporting life on planets like Earth, to the evolution of our own solar system. By September 30, 2021, NASA will launch the James Webb Space Telescope, complete on-orbit checkout, and initiate observatory commissioning.
James Webb Space Telescope Program, Science Mission Directorate (SMD)
Expl
ore
2.1.2: Enable a robust commercial low Earth orbit economy in which transportation, habi-tation, and on-orbit services are available for purchase by NASA and other customers.
Enable a robust commercial low Earth orbit economy in which transportation, habita-tion, and on-orbit services are available for purchase by NASA and other customers. By September 30, 2021, NASA will support the development of commercial services, including through releasing new business opportunities, supporting demonstration flights, beginning certification activities, and demonstrating commercial capabilities.
Commercial Spaceflight Development and International Space Station, Human Exploration and Operations Mission Directorate (HEOMD)
2.2.1: Advance America’s goal to land the first woman and the next man on the Moon by 2024 by demonstrating the necessary capabilities that advance lunar exploration.
Advance America’s goal to land the first woman and the next man on the Moon by 2024 and pursue a sustainable program of exploration by demonstrating capabilities that advance lunar exploration. By September 30, 2021, NASA will launch Artemis I and make significant progress for Artemis II, and have multiple companies under contract to develop systems to land humans on the Moon.
Exploration Systems Development and Advanced Exploration Systems, HEOMD
2.2.2: Commence lunar surface science investigations, technology, and exploration demonstrations to enable a sustainable lunar surface exploration strategy.
Commence lunar surface science investigations, technology, and exploration demon-strations to enable a sustainable lunar surface exploration strategy. By September 30, 2021, deliver NASA science and technology payloads to the awarded Commercial Lunar Payload Services (CLPS) provider(s) for delivery to the surface of the Moon.
Space Technology Mission Directorate (STMD), SMD, HEOMD
More information on NASA’s agency priority goals is available at Performance.gov.
Performance Management in ActionNASA is committed to remaining a good steward of the taxpayer’s numerous investments entrusted to its care. This includes maintaining a culture of data-driven performance management that contin-ually improves its performance management sys-tems, increasing accountability, transparency, and oversight. This approach leads to more consistent performance reporting across NASA’s missions, and ensures the optimal use of Agency resources.
NASA plans and evaluates its performance in a continuous cycle, spanning fiscal years, in con-
junction with the annual planning, programming, budgeting, and execution process used to ensure that resource alignment supports mission and operational needs. This ongoing feedback loop ensures that plans reflect performance expecta-tions, and, in return, those performance results inform decisions on planning.
Annual Strategic ReviewsThe annual Strategic Review process encom-passes a comprehensive analysis of each of NASA’s strategic objectives. Agency leaders assess progress on executing the strategies and goals stated in the NASA 2018 Strategic Plan.
NASA Performance Foundations
NASA’s FY 2021 Volume of Integrated Performance 7
The assessment considers different indicators the Agency tracks for each strategic objective, as well as challenges, risks, external factors, and other events that may have affected the outcomes. The review also looks at what current or future evalua-tions or evidence-building activities are needed to make better assessments of the Agency’s prog-ress.
Based on this self-assessment, NASA determines that each strategic objective demonstrates note-worthy progress, satisfactory performance, or is a focus area for improvement. NASA’s Chief Operating Officer reviews the summary of the self-assessments and the crosscutting assess-ment, then decides on final ratings for the strategic objectives and next steps for the Agency. NASA uses Strategic Review inputs, findings, and results throughout the Agency’s budget process and as an input to the annual performance planning process. A summary of progress and assessment results for each strategic objective is included in Part 2.
Annual Performance AssessmentsDuring the third and fourth quarters of each fiscal year, program officials assess progress towards
achieving the performance goals listed in the Annual Performance Plan. They determine whether targets or milestones were met as anticipated, assign the appropriate color rating, and provide an explanation to support the rating. NASA’s Chief Operating Officer and the Performance Improvement Officer review the performance assessment results and provide feedback, deter-mine final ratings when needed, and recommend course corrections.
NASA publishes a summary of preliminary fiscal year performance ratings in the annual Agency Financial Report in accordance with Circular A-136 guidance, released every November, using available fourth quarter data. NASA publishes the final fiscal year performance ratings in the Annual Performance Report, which becomes part of the Volume of Integrated Performance.
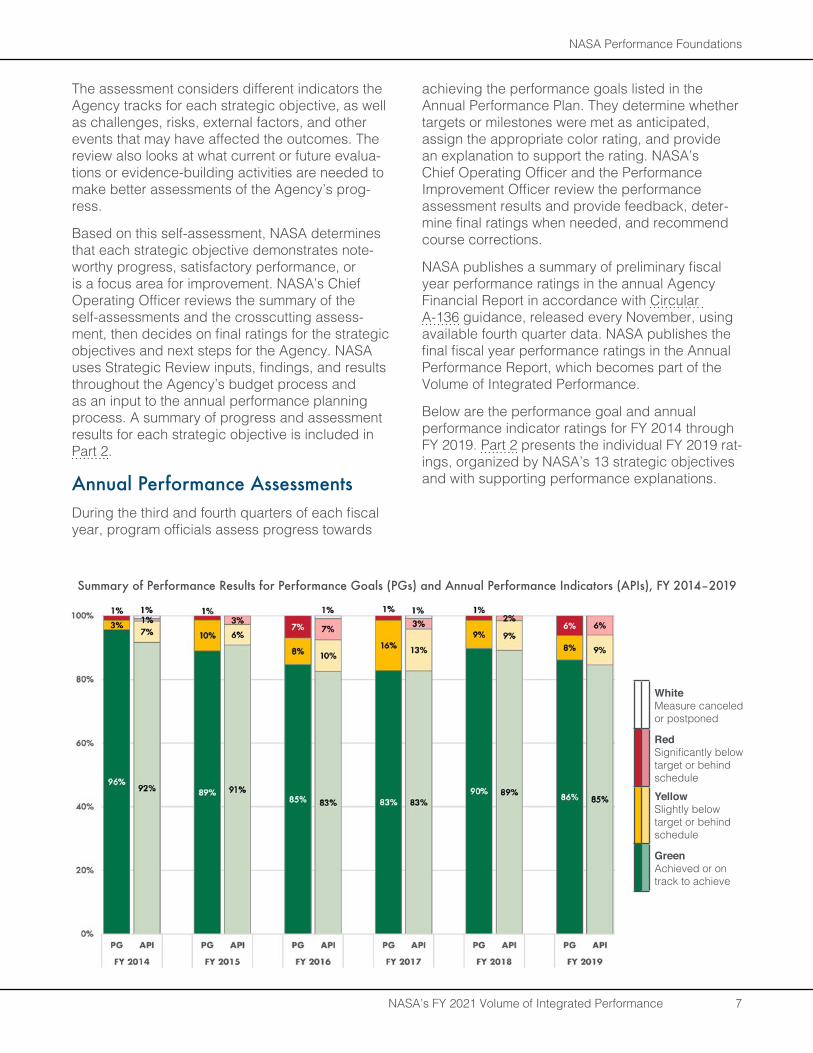
Below are the performance goal and annual performance indicator ratings for FY 2014 through FY 2019. Part 2 presents the individual FY 2019 rat-ings, organized by NASA’s 13 strategic objectives and with supporting performance explanations.
Summary of Performance Results for Performance Goals (PGs) and Annual Performance Indicators (APIs), FY 2014–2019
WhiteMeasure canceled or postponed
RedSignificantly below target or behind scheduleYellowSlightly below target or behind schedule
GreenAchieved or on track to achieve
NASA Performance Foundations
NASA’s FY 2021 Volume of Integrated Performance 8
FY 2021 Budget RequestThe 13 strategic objectives are mapped to NASA’s FY 2021 President’s Budget Request. The table below provides the FY 2021 budget request for each strategic objective. Detailed budget tables, provided in Part 2, include the FY 2019 actual, FY 2020 enacted, and outyear budget numbers through FY 2025. The budget numbers for FY 2019 and FY 2020 represent actual budget authority and the budget numbers for FY 2021 through FY 2025 are based on the requested budget. The funding lines combine multiple programs and projects that support the strategic objective. The budget num-bers are rounded and will not add up to NASA’s total budget request. Funds for the Office of Inspector General are not included in any strategic objective funding line.
FY 2021 Budget Request by Strategic Objective ($M)
Strategic Objective Requested1.1 $6,306.51.2 $350.92.1 $1,139.72.1 $8,761.73.1 $1,578.33.2 $819.03.3 $197.34.1 $121.04.2 $2,696.74.3 $184.04.4 $176.14.5 $549.54.6 $2,321.1
Enterprise Risk ManagementThe enterprise risk management2 process provides insights on how to effectively prioritize and man-age risks to mission delivery while also providing an enterprise-wide, strategically aligned portfo-lio view of organizational risks, challenges, and opportunities. NASA’s governing councils serve as the Agency’s risk management platform and the Chief Operating Officer serves as the senior official accountable for risk management. While NASA cannot mitigate all risks related to achieving
2 NASA implements enterprise risk management in accordance with the updates to the Office of Management and Budget’s Circu-lar A-123, released in Memoranda M-16-17 and M-18-16, and Circular A-11, Part 6.
its strategic goals and objectives, the Agency is using these risk-management strategies to identify, measure, and assess challenges related to mission delivery to the greatest extent possible. Enterprise risk management is integrated with the Strategic Review process to provide an analysis of the risks and opportunities NASA faces in achieving its stra-tegic objectives.
Using Evidence for Decision-MakingNASA uses evidence to inform investment deci-sions at all levels, from day-to-day operations to selecting major missions and establishing the necessary infrastructure to pursue goals that may take a generation, or longer, to realize. This evi-dence takes several forms. Evaluations, conducted by internal, external, and independent parties, help inform research strategies and priorities. In assessing outcomes, these independent experts help NASA to determine if the Agency has accom-plished what it set out to do.
The Foundations for Evidence-Based Policymaking Act of 2018 (Evidence Act) formalized require-ments for agencies to utilize evidence, evaluation, and data as a planning tool for policy and deci-sion making. As part of the phase I roll out of the Evidence Act, conducted during FY 2019, NASA named an Evaluation Officer, Chief Statistical Official, and Chief Data Officer and has since established a working group to support the requirements and implementation plans for the Evidence Act.
Program and Project Management for Executive AgenciesThe Program Management Improvement Accountability Act of 2016 (PMIAA) formalized requirements to strengthen program and proj-ect management within Federal agencies. As a research and development agency, NASA uses the core concept of cost, schedule, and program and project management to assess performance during the development phase. NASA established a Program Management Improvement Officer and a permanent program management working group to address PMIAA requirements and develop implementation plans. NASA is currently carrying
NASA Performance Foundations
NASA’s FY 2021 Volume of Integrated Performance 9
out a five-year PMIAA strategic implementation plan, that includes performing periodic portfolio assessments to examine and determine focused improvements to the Agency’s program manage-ment practices, guidance, and trainings that strive to improve performance overall.
Oversight and AccountabilityIn setting goals and establishing plans to achieve mission success, NASA leaders rely on informa-tion from multiple sources. Rigorous indepen-dent assessments, both internal and external to the Agency, are an essential tool in ensuring the integrity of data necessary to make well-informed investment decisions. Independent verification and validation in planning and executing work provides greater confidence in performance during devel-opment and execution, and improves expected outcomes. In many cases, these assessments include a routine measure of progress against a predetermined set of indicators or other targets that effectively establish an “early warning system” so that deviations can be more quickly and easily addressed.
Governance CouncilsNASA has four Agency-level councils that estab-lish strategic direction and provide oversight of Agency activities. The Executive Council focuses on major Agency-wide decisions by providing stra-tegic guidance and top-level planning. The Mission Support Council is a functional council focused on mission-enabling decisions, threshold opera-tional decisions, internal controls, and liability. The Program Management Council is an integral part of NASA’s program and mission decisions, ensur-ing programs and projects maintain acceptable performance as they progress through the phases of their life cycle. The Acquisition Strategy Council supports obtaining, or advancing the development of, the systems, research, services, construction, and supplies to fulfill the Agency’s mission. The Senior Management Council, a fifth council com-prised of NASA senior leaders, provides advice and counsel to the Executive Council on Agency issues and input on the formulation of Agency strategy.
Technical AuthoritiesThe technical authority process is part of NASA’s system of checks among key organizations to ensure that decisions have the benefit of dif-ferent points of view and are not made in isola-tion. Selected senior officials, called technical authorities, have direct lines of reporting to the Administrator, ensuring work on critical perfor-mance areas adheres to Agency policy and performance standards. NASA’s technical author-ities are responsible for safety and mission assur-ance, engineering, and health and medical issues. Approval from NASA’s technical authorities is required at each phase of major mission develop-ment or project implementation.
Baseline Performance ReviewsThe Chief Operating Officer conducts a monthly internal assessment and reporting forum where NASA’s leadership tracks and assesses perfor-mance of the Agency’s work against established plans. The baseline performance review is a bottom-up review of how well the Agency has performed against its strategic goals and other performance metrics, such as cost and schedule estimates, contract commitments, and technical objectives. Periodically, each mission directorate
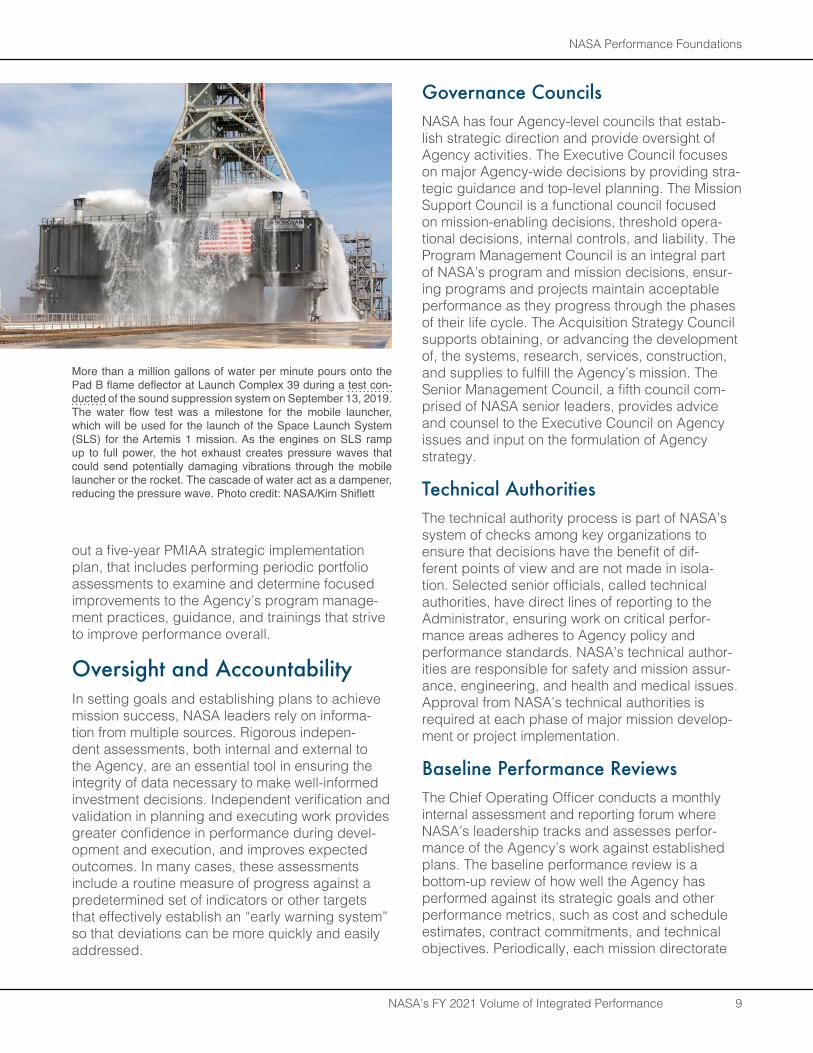
More than a million gallons of water per minute pours onto the Pad B flame deflector at Launch Complex 39 during a test con-ducted of the sound suppression system on September 13, 2019. The water flow test was a milestone for the mobile launcher, which will be used for the launch of the Space Launch System (SLS) for the Artemis 1 mission. As the engines on SLS ramp up to full power, the hot exhaust creates pressure waves that could send potentially damaging vibrations through the mobile launcher or the rocket. The cascade of water act as a dampener, reducing the pressure wave. Photo credit: NASA/Kim Shiflett
NASA Performance Foundations
NASA’s FY 2021 Volume of Integrated Performance 10
provides a performance assessment of the activ-ity it oversees. Analysts outside of the performing organization provide independent assessments. NASA’s technical authorities provide oversight and an additional level of control.
Technology Readiness Reviews and Investment ReviewsExperts in technology development use tech-nology readiness levels—a set of progressively sophisticated criteria and milestones—to assess the maturation of a technology or capability, from early concept, through testing, to integration and use. NASA conducts routine progress reviews to measure the advancement of the work, but also to ensure that the technology or capability remains relevant and beneficial to its missions. NASA conducts an annual assessment of its technology development portfolio to ensure that investments continue to align to future Agency needs and that a balance of desirable technologies remain in the pipeline.
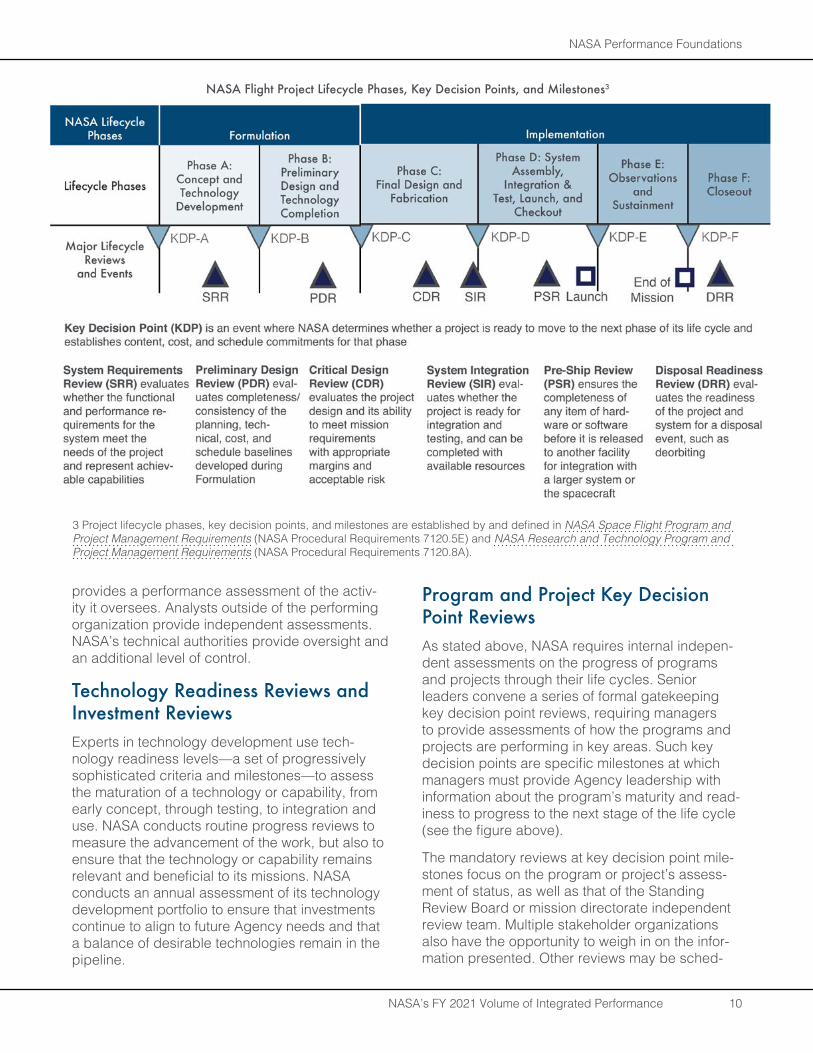
Program and Project Key Decision Point ReviewsAs stated above, NASA requires internal indepen-dent assessments on the progress of programs and projects through their life cycles. Senior leaders convene a series of formal gatekeeping key decision point reviews, requiring managers to provide assessments of how the programs and projects are performing in key areas. Such key decision points are specific milestones at which managers must provide Agency leadership with information about the program’s maturity and read-iness to progress to the next stage of the life cycle (see the figure above).
The mandatory reviews at key decision point mile-stones focus on the program or project’s assess-ment of status, as well as that of the Standing Review Board or mission directorate independent review team. Multiple stakeholder organizations also have the opportunity to weigh in on the infor-mation presented. Other reviews may be sched-
NASA Flight Project Lifecycle Phases, Key Decision Points, and Milestones3
3 Project lifecycle phases, key decision points, and milestones are established by and defined in NASA Space Flight Program and Project Management Requirements (NASA Procedural Requirements 7120.5E) and NASA Research and Technology Program and Project Management Requirements (NASA Procedural Requirements 7120.8A).
NASA Performance Foundations
NASA’s FY 2021 Volume of Integrated Performance 11
uled, in accordance with the lifecycle schedule of that project and depending on the formulation, development implementation, or construction plan. Additionally, NASA senior leaders monitor overall performance monthly through the Baseline Performance Review. NASA provides Congress, the Office of Management and Budget, and the Government Accountability Office with cost and schedule updates for major projects with an esti-mated lifecycle cost of $250 million or greater.
NASA Office of Inspector General and the Government Accountability OfficeTwo independent organizations, the NASA Office of Inspector General and the Government Accountability Office, conduct both broadly- and narrowly-focused evaluations of how well the Agency is achieving outcomes and performing to expectations. Evaluations cross all types of NASA work, from planning new initiatives, managing major programs, implementing necessary infra-structure modernization, to the potential impact of legislation and policy. The Office of Inspector General and contracted independent auditors are also employed to review the Agency’s financial record keeping systems, compliance with require-ments, and financial controls. NASA reviews the resulting reports and provides feedback on how
the Agency will improve on identified management challenges.
Evidence and EvaluationNASA leaders rely on data from numerous sources as they establish plans and make decisions. NASA actively promotes a strong culture of achieving results through reliance on data, analysis, evi-dence-building, and evaluations from both internal and external sources.
Internal but Independent Cost and Schedule EstimatingNASA’s independent analysts help mission man-agers craft and manage to realistic cost and schedule estimates. They also provide an inde-pendent perspective in establishing project cost and schedule baselines and meeting stakeholder expectations. Other NASA analysts use earned value management expertise to help mission plan-ners establish meaningful performance milestones for acquired products and technology.
External Independent Verification and Validation of Flight SoftwareIndependent verification and validation are part of an Agency-wide strategy to provide the highest
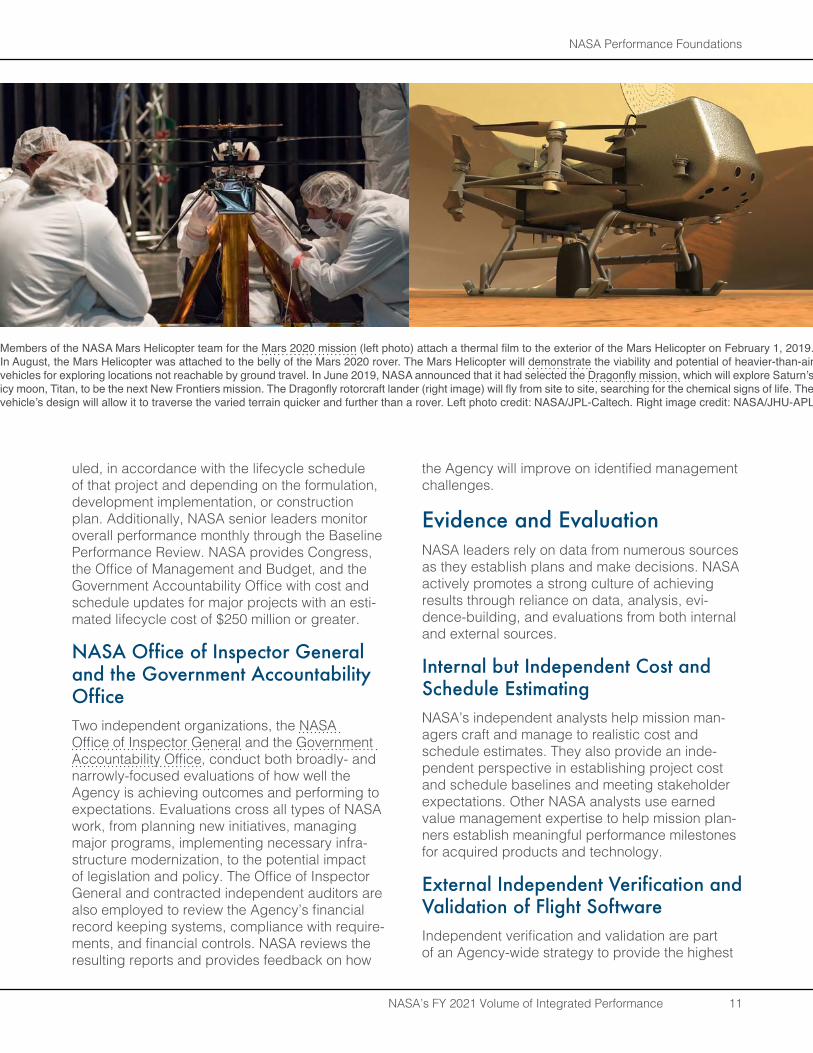
Members of the NASA Mars Helicopter team for the Mars 2020 mission (left photo) attach a thermal film to the exterior of the Mars Helicopter on February 1, 2019. In August, the Mars Helicopter was attached to the belly of the Mars 2020 rover. The Mars Helicopter will demonstrate the viability and potential of heavier-than-air vehicles for exploring locations not reachable by ground travel. In June 2019, NASA announced that it had selected the Dragonfly mission, which will explore Saturn’s icy moon, Titan, to be the next New Frontiers mission. The Dragonfly rotorcraft lander (right image) will fly from site to site, searching for the chemical signs of life. The vehicle’s design will allow it to traverse the varied terrain quicker and further than a rover. Left photo credit: NASA/JPL-Caltech. Right image credit: NASA/JHU-APL
NASA Performance Foundations
NASA’s FY 2021 Volume of Integrated Performance 12
achievable levels of safety and cost-effectiveness for mission critical software. Overseen by NASA’s Office of Safety and Mission Assurance, the Independent Verification and Validation Program applies system and software engineering best practices to evaluate the quality of critical and complex software systems throughout the soft-ware’s system life cycle.
Peer and Subject Matter Expert Community ReviewNASA relies on evaluations by external commu-nities with expertise in areas of major scientific and academic disciplines. The Agency uses external peer review panels to objectively assess and evaluate proposals for new work in science, technology, and education. The Science Mission Directorate also draws from external senior scien-tist reviews when determining either operational extension or closeout for a science mission that has completed its objectives. Papers from NASA-supported research undergo independent peer review for publication in professional journals. NASA often leverages internal and external evalu-ators to assess specific initiatives for benefit, cost, and overall impact.
External AdvisorsThe NASA Advisory Council provides the NASA Administrator with recommendations on major issues related to programs, policies, plans, finan-cial controls, proposed associate administra-tors, and other matters pertinent to the Agency’s responsibilities.
NASA’s goals reflect broad scientific, exploration, and technology objectives. To measure progress toward achieving these goals, NASA’s mission directorates use the NASA Advisory Council’s discipline committees, managed under the Federal Advisory Committee Act of 1972, to evaluate prog-ress in achieving these goals. The committees are comprised of subject matter experts in each disci-pline. Among other duties, the committees assess mission results, published peer-reviewed science, and progress on mission development to recom-mend performance ratings to NASA management.
The Aerospace Safety Advisory Panel evaluates NASA’s safety performance and advises the Agency on ways to improve performance. The
panel bases its advice on direct observation of NASA operations and decision-making.
NASA receives independent expert advice from the National Academies of Sciences, Engineering, and Medicine, which guides planning and helps ensure that the Agency’s research and develop-ment priorities align with the needs of the explo-ration and science communities. The National Academies lead a series of decadal surveys and other analyses that help inform Agency deci-sions on the balance and direction of the Science Mission Directorate’s investment portfolio. The National Academies also provides independent expert advice to NASA through ad hoc studies on areas such as aerospace technologies and capa-bilities, space biology and physics, and aeronau-tics. Resulting decisions are reflected in the Annual Performance Plan.
NASA’s Aeronautics Research Mission Directorate enlists experts in the aeronautics community to assess progress along six major research thrusts, ensuring that NASA is developing and maturing the technologies and capabilities according to the Agency’s aviation research agenda. See the NASA Aeronautics Strategic Implementation Plan 2017 Update for more information.
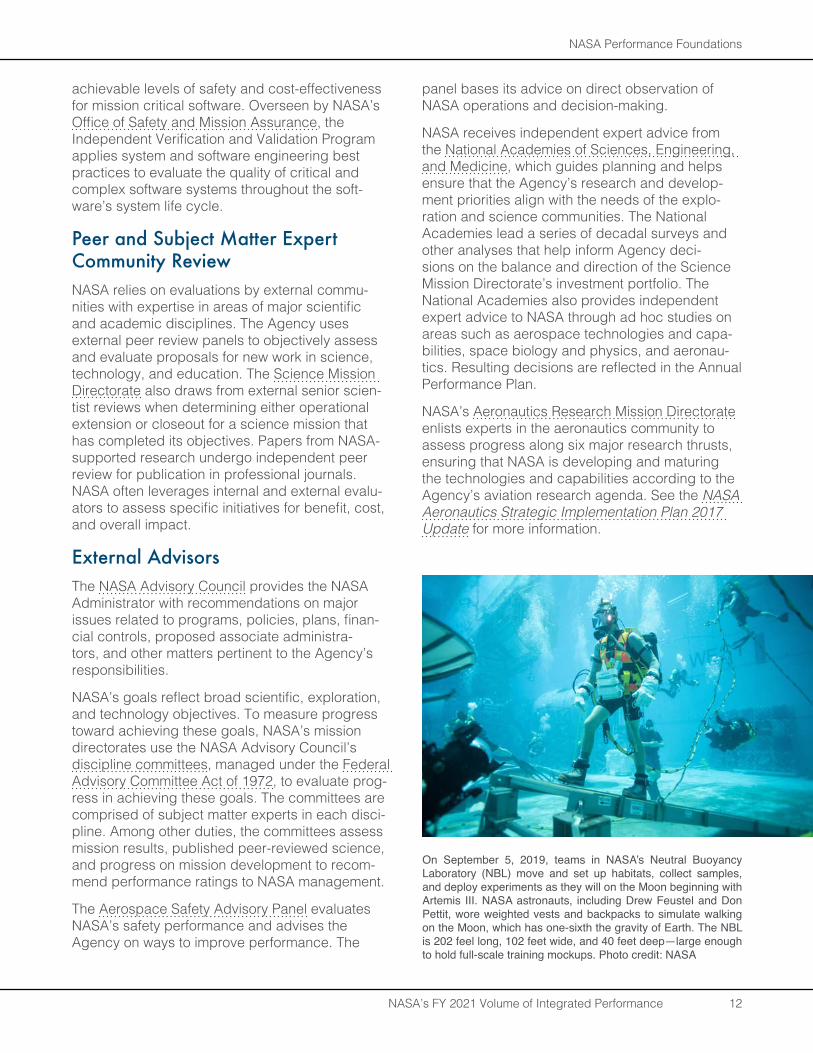
On September 5, 2019, teams in NASA’s Neutral Buoyancy Laboratory (NBL) move and set up habitats, collect samples, and deploy experiments as they will on the Moon beginning with Artemis III. NASA astronauts, including Drew Feustel and Don Pettit, wore weighted vests and backpacks to simulate walking on the Moon, which has one-sixth the gravity of Earth. The NBL is 202 feel long, 102 feet wide, and 40 feet deep—large enough to hold full-scale training mockups. Photo credit: NASA
Strategies for Improvement
NASA’s FY 2020 Volume of Integrated Performance 13
Strategies for Improvement
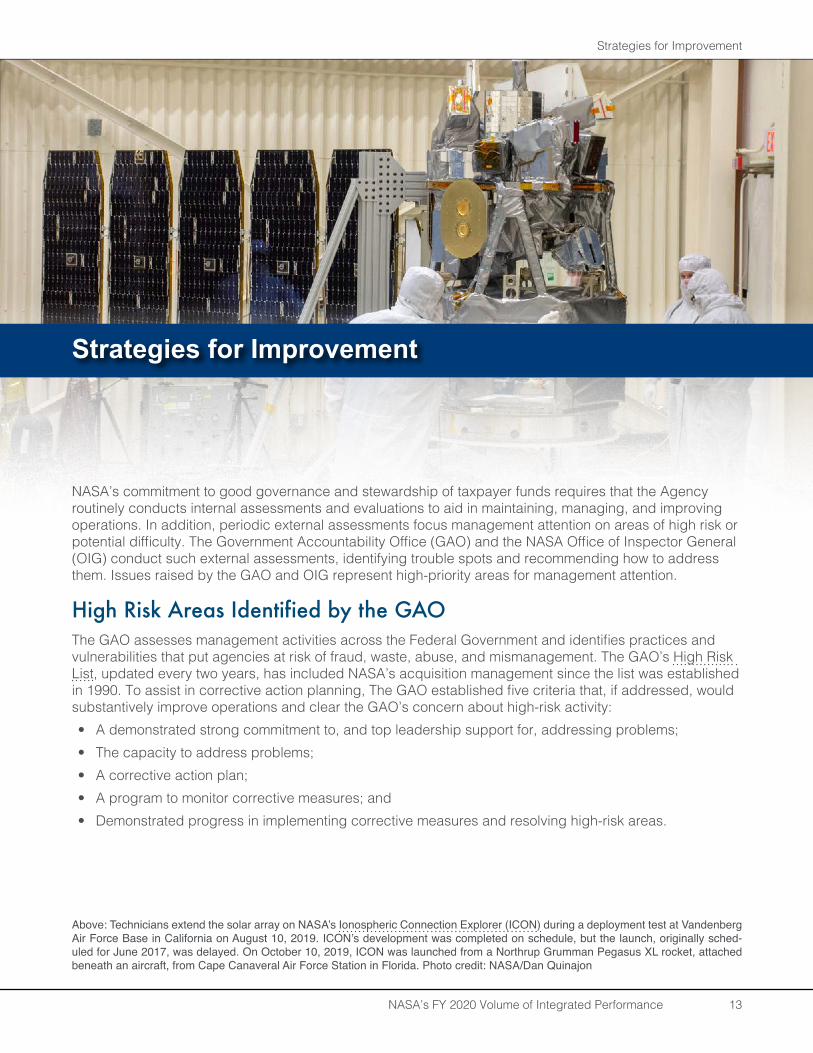
Above: Technicians extend the solar array on NASA’s Ionospheric Connection Explorer (ICON) during a deployment test at Vandenberg Air Force Base in California on August 10, 2019. ICON’s development was completed on schedule, but the launch, originally sched-uled for June 2017, was delayed. On October 10, 2019, ICON was launched from a Northrup Grumman Pegasus XL rocket, attached beneath an aircraft, from Cape Canaveral Air Force Station in Florida. Photo credit: NASA/Dan Quinajon
NASA’s commitment to good governance and stewardship of taxpayer funds requires that the Agency routinely conducts internal assessments and evaluations to aid in maintaining, managing, and improving operations. In addition, periodic external assessments focus management attention on areas of high risk or potential difficulty. The Government Accountability Office (GAO) and the NASA Office of Inspector General (OIG) conduct such external assessments, identifying trouble spots and recommending how to address them. Issues raised by the GAO and OIG represent high-priority areas for management attention.
High Risk Areas Identified by the GAOThe GAO assesses management activities across the Federal Government and identifies practices and vulnerabilities that put agencies at risk of fraud, waste, abuse, and mismanagement. The GAO’s High Risk List, updated every two years, has included NASA’s acquisition management since the list was established in 1990. To assist in corrective action planning, The GAO established five criteria that, if addressed, would substantively improve operations and clear the GAO’s concern about high-risk activity:• A demonstrated strong commitment to, and top leadership support for, addressing problems;• The capacity to address problems;• A corrective action plan;• A program to monitor corrective measures; and• Demonstrated progress in implementing corrective measures and resolving high-risk areas.
Strategies for Improvement
NASA’s FY 2020 Volume of Integrated Performance 14
As part of the 2019 update, High-Risk Series: Substantial Efforts Needed to Achieve Greater Progress on High-Risk Areas (GAO-19-157SP), the GAO included a scorecard detailing which of these criteria for improving acquisition management have been met, partially met, or have not been met. NASA has fully met the criterion for a correc-tive action plan and has partially met the criteria for leadership, monitoring, capacity, and demon-strated progress.
NASA’s responses to these challenges have yielded more credible cost and schedule base-lines, and both the GAO and OIG have observed that NASA’s management of its small- and medi-um-class major flight projects has improved. The effectiveness of these tools is particularly evident for the smaller (under $1 billion lifecycle cost) proj-ects. However, NASA needs to improve manage of its larger, more complex projects, which typically involve the development of a significant number of new technologies, greater risk, and early cost and schedule estimation challenges. The GAO observed that risks remain for NASA’s largest and flagship-type projects, such as the James Webb Space Telescope (Webb) (see Agency Priority Goal 1.1.5), the Space Launch System (SLS), and Orion (see Agency Priority Goal 2.2.1).
A Corrective Action Plan for Program Management
In 2018, NASA established a new high-risk cor-rective action plan to accomplish two principal objectives: 1) strengthen the Agency’s cut-ting-edge program and project management efforts across the board and improve transparency to stakeholders; and 2) improve the Agency’s surveillance of contractors through appropriate insight and oversight. In December 2018, the Agency Program Management Council approved the proposed plan, Corrective Action Plan: In Response to Recent Programmatic Performance and NASA’s Designation on GAO’s High Risk List. Recommendations and strategies informing the plan included previous GAO high-risk reports, the GAO’s 2018 priority recommendations let-ter, reports issued by the GAO during its annual programmatic reviews of NASA’s major projects, and numerous internal analyses conducted by the Agency. Direction from senior leadership, the advice of subject matter experts drawn from
across NASA, and feedback from GAO were also considered.
The NASA Associate Administrator assumes ownership of the corrective action plan. The Office of the Chief Financial Officer is responsible for maintaining documentation, tracking, and report-ing progress against the plan on an annual basis. Mission directorates and mission support offices are responsible for executing the plan and report-ing progress.
Several initiatives are anticipated to strengthen Agency acquisition management. The initiatives are categorized by the following actions.• Implement: Initiatives that NASA has deter-
mined should proceed and become part of regular Agency business cadence. Any actions taken to support execution of the described initiatives will follow all established Agency control and oversight boards, as applicable, to ensure no unintended consequences are experienced.
• Pilot: Initiatives that NASA has determined show promise to provide value related to Agency program management, but will initially be executed to a limited degree in scope and time until the Agency assesses and reaffirms continued execution.
• Research: Initiatives that are less concep-tually mature but warrant dedicated effort to explore and develop with respect to generating value for Agency program management.
Each initiative in the corrective action plan includes a history and current state (as of plan publication); near-term (two-year) anticipated next steps; output and outcome measurements by which progress can be assessed; and recognition of challenges, interdependencies, and required resources that must be actively managed by NASA leadership. The lead organization(s) identified for each initia-tive will pursue the objectives outlined in the plan. Assessments will occur on an annual or biennial basis; results of these assessments may result in goal or initiative addition, revision, or resolution. Lead organizations are accountable to the NASA Associate Administrator, and NASA will share results and progress with GAO annually at a min-imum, and more often when possible. NASA will keep this corrective action plan current and up to date until the GAO removes the High Risk designa-tion for the Agency.
Strategies for Improvement
NASA’s FY 2020 Volume of Integrated Performance 15
Management Challenges Identified by the OIGEach fiscal year, NASA’s OIG issues a letter sum-marizing what the Inspector General considers to be NASA’s most serious management and perfor-mance challenges, as well as a brief assessment regarding the Agency’s progress in addressing those challenges. NASA leverages the results of OIG audits to improve the overall efficiency and effectiveness of the Agency’s programs, projects, and functional activities. NASA is also committed to ensuring timely and responsive final management decisions, along with timely and complete final management action on all audit recommendations issued by the NASA OIG.
To this end, NASA has implemented a comprehen-sive program of audit follow-up, intended to ensure that audit recommendations issued by the OIG are resolved and implemented in a timely, respon-sive, and effective manner. NASA’s audit follow-up program is a key element in improving the overall efficiency and effectiveness of NASA’s programs, projects, and operations. The requirements for managing OIG’s recommendations are detailed in NASA’s FY 2019 Agency Financial Report.
The OIG’s 2019 Report on NASA’s Top Management and Performance Challenges retains the six 2018 findings and includes a new chal-lenge, “Landing Humans on the Moon by 2024.”
Landing Humans on the Moon by 2024
The OIG expresses concerns that achieving the goal of landing humans on the Moon by 2024 will require strong, consistent, and sustained leader-ship by the President, Congress, and NASA. The OIG notes that NASA’s development of a deep-space human exploration capability to reach the Moon and then Mars is the Agency’s most ambi-tious and costliest ongoing activity and currently includes three flagship programs (SLS, Orion, and Exploration Ground Systems) with more in the future. NASA has experienced a series of setbacks caused by technical challenges, cost increases, and schedule delays in each of the programs. Returning humans to the Moon by 2024 clearly will be NASA’s top management challenge for at least the next five years.
The OIG recognizes some forward movement in that NASA has begun to develop or purchase the additional capabilities needed for a crewed lunar landing. The Agency awarded a contract to develop power, propulsion, and communications capabilities for the Gateway, and is pursuing a contract to develop and deliver the Gateway’s hab-itation module. In August 2019, NASA announced plans for Marshall Space Flight Center to lead the development of the Human Landing System (HLS) program with Johnson Space Center responsible for developing the lunar ascent vehicle.
See Strategic Objective 2.2: Conduct human exploration in deep space, including to the surface of the Moon, to find out more about NASA’s efforts to land humans on the Moon by 2024.
Improving Management of Major Projects
The OIG states that it has identified several fac-tors that affect NASA’s ability to complete major projects within planned cost and schedule, but focuses on three: a culture of optimism; underes-timating technical complexity; and funding insta-bility. A culture of optimism prevents managers from making critical assessments of requirements, budgets, and schedules and determining what can be realistically accomplished within established constraints. The OIG notes that a “too big to fail” mentality may exist as few projects have been cancelled due to poor cost and schedule perfor-mance. NASA has a history of underestimating technical complexity and the level of effort needed to develop, mature, and integrate one-of-a-kind, first-of-their-kind technologies, instruments, and spacecraft, as well as account for the extensive pre-launch testing required to reduce risk.
Funding instability, whether budget authority is less than requested or out of phase with requirements, means the Agency must defer critical tasks, or de-scope or discontinue lower priority tasks, to keep project costs within a revised budget profile. The OIG reiterates prior year concerns that cost increases and schedule slippage with major ongo-ing projects can have a cascading effect across other NASA projects. The OIG notes the Agency’s progress in recognizing and moving to improved cost and schedule performance. The OIG also looks favorably on the corrective action plan to strengthen the Agency’s project management
Strategies for Improvement
NASA’s FY 2020 Volume of Integrated Performance 16
effort, improve transparency, and monitor con-tractors. Finally, the OIG is complimentary of the independent review board that investigated Webb cost and schedule problems.
See Strategic Objective 1.1: Understand the Sun, Earth, solar system, and universe and Strategic Objective 2.2: Conduct human exploration in deep space, including to the surface of the Moon, to find out more about NASA’s efforts to improve manage-ment of major projects.
Attracting and Retaining a Highly Skilled Workforce
The OIG cites recent OIG and GAO project reports that found challenges in not having enough staff or staff with the right skills. Experts have identified a nationwide shortage of workers for jobs requir-ing science, technology, engineering, arts, and mathematics that is impacting the entire aerospace community. As such, the Agency must compete with other government agencies, private industry, and academia for skilled workers. This increases the risk that a tight supply of aerospace workers combined with sharp increases in demand will result in more pronounced staffing shortages in NASA’s critical skill areas. The OIG identifies an additional risk in NASA’s aging workforce and potential retirement wave. The OIG believes the challenges to workforce capacity will only increase as the Agency pursues the Artemis program.
The OIG recognizes positive steps that NASA has taken to improve workforce planning across the Agency. Agency-wide reviews of the operating model have helped to assess, invest in, consoli-date, or eliminate duplicative workforce capabilities based on current and future mission requirements. NASA is in the first year of formulating a new five-year workforce master plan, but GAO believes ideal workforce master plans look 10, even 20 years into the future.
See Strategic Objective 4.4: Manage human capi-tal, to find out more about NASA’s efforts to attract and retain a highly skilled workforce.
Sustaining a Human Presence in Low Earth Orbit
OIG begins by referencing long-held con-cerns about the high cost of maintaining the
International Space Station (ISS), using nearly half of the Agency’s human spaceflight budget. OIG describes NASA’s plan to reduce costs by sup-porting a U.S. commercial space in which NASA is one of many customers for industry-owned and operated platforms in low Earth orbit. The OIG continues to question the ability of the Agency to conduct necessary research and technology demonstration aboard the ISS, given delays in the development of a robust commercial space transportation industry. Forecasts cited from NASA show that at least 8 of 20 human health risks and 4 of 37 technology gaps will not be completed by 2024, the current ISS retirement date. The OIG asserts that commercial entities have not developed profit-generating business cases, thus commercial activity will not sustain ISS operations past the proposed 2025 Federal funding cutoff. OIG also recommends NASA develop metrics that will help the Agency assess its success in fostering the new space industry. Success of the Center for the Advancement of Science in Space (CASIS) in developing new commercial ISS research has been limited. OIG states that stronger NASA over-sight is necessary; NASA has since initiated an independent review of CASIS activities.
The report acknowledges ISS successes over the past twenty years, and that many advances have been made, specifically in addressing risk to human health, but also in varied technical disci-plines. To further commercialization, NASA has announced a pricing policy for ISS research and an announcement of opportunity for commercial technology development. Commercial partners are currently transporting cargo to the ISS, but OIG believes that a crewed commercial capability by 2020 is unrealistic.
See Strategic Objective 2.1: Lay the foundation for America to maintain a constant human presence in low Earth orbit enabled by a commercial market, to find out more about NASA’s efforts to sustain a human presence in low Earth orbit.
Improving Oversight of Contracts, Grants, and Cooperative Agreements
The OIG has consistently reported on NASA’s acquisition management challenges for the past 13 years, and GAO has kept NASA acquisition management on its high-risk activity list since 1990. In 2018, NASA spent about $19.2 billion of

Strategies for Improvement
NASA’s FY 2020 Volume of Integrated Performance 17
its approximately $23.4 billion on external pro-curements (contracts, cooperative agreements, grants), yet the Agency must improve its efforts to ensure it receives good value for its investments and that recipients spend NASA funds appropri-ately to accomplish agreed-upon goals. Previous OIG reports have provided recommendations on contract oversight and controls that would improve security, streamline activity, improve transparency, and reduce costs. NASA continues to fail in these areas, with several missed opportunities cited, with instances ranging from consulting services to work on the Agency’s major projects.
The OIG asserts that improper oversight also applies to grants and cooperative agreements. The report provides instances in which NASA failed to administer and manage grants, leading to improper application of grant funding for unap-proved purposes. The OIG reiterates prior year concerns about oversight needed on small busi-ness awards, an area particularly vulnerable to fraud and compromise of NASA’s mission.
See Strategic Objective 4.1: Engage in partnership strategies, to find out more about NASA’s efforts to improve oversight of contracts, grants, and coop-erative agreements.
Addressing Long-standing IT Governance and Security Concerns
The OIG continues to express concern about the governance and security of NASA’s IT investments and data, despite spending over $2 billion across the Agency in FY 2018. The OIG states that the Agency Chief Information Officer and IT security officials have limited oversight and influence over IT purchases and security decisions, and NASA’s culture of autonomy further hinders IT governance.
The OIG both recognizes and challenges the Agency’s efforts to improve governance and oversight. NASA has established boards and better-defined roles and responsibilities, but the authority of the Chief Information Officer has been unstable and was weakened (and subsequently reversed) during recent enterprise realignments. The OIG recommends NASA increase collabora-tion between all Agency stakeholder organizations, including increased efforts in strategic workforce planning to better identify and close skill gaps. NASA must achieve full compliance with Federal
laws and regulations related to managing its IT resources and portfolio.
See Strategic Objective 4.5: Ensure enterprise protection, to find out more about NASA’s efforts to address long-standing IT security concerns.
Sustaining Infrastructure and Facilities
The OIG notes some positive management actions in the management of the Agency’s infrastructure, but the work ahead is significant. NASA controls $39 billion in real property assets, including 5,000 buildings. However, about 75 percent of facilities are 50 years or older and beyond their useful life. The OIG estimates NASA’s 2019 deferred main-tenance backlog to be “huge” at $2.65 billion, and resulting costs of unscheduled maintenance and repairs are a significant drain on resources. The OIG states that this must be addressed. The Agency also has significant liability in its aban-doned facilities and environmental cleanup, which must also be addressed.
The OIG observes that the Agency is focusing its efforts on modernizing the Agency’s infrastructure into fewer, more sustainable facilities and repairing failing infrastructure to reduce overall maintenance costs. Several older facilities are being refur-bished to accommodate Artemis and other mission requirements. Overall, the OIG urges NASA to improve its assessment and decision making on infrastructure investment, divestment, and consoli-dation, though it acknowledges that the Agency is subject to political pressure to retain unnecessary capabilities and facilities in certain locations.
See Strategic Objective 4.2: Enable space access and services. (Performance Goal 4.2.6: Maximize the availability of the Space Environment Testing Management Office (SETMO) portfolio of assets to meet NASA’s current and future test facility needs) and Strategic Objective 4.6: Sustain infrastructure capabilities and operations (Performance Goal 4.6.3: Demonstrate increased facility reliability) to find out more about NASA’s efforts for sustaining infrastructure and facilities.
Organized for Success and Sustainability
NASA’s FY 2021 Volume of Integrated Performance 18
Organized for Success and Sustainability
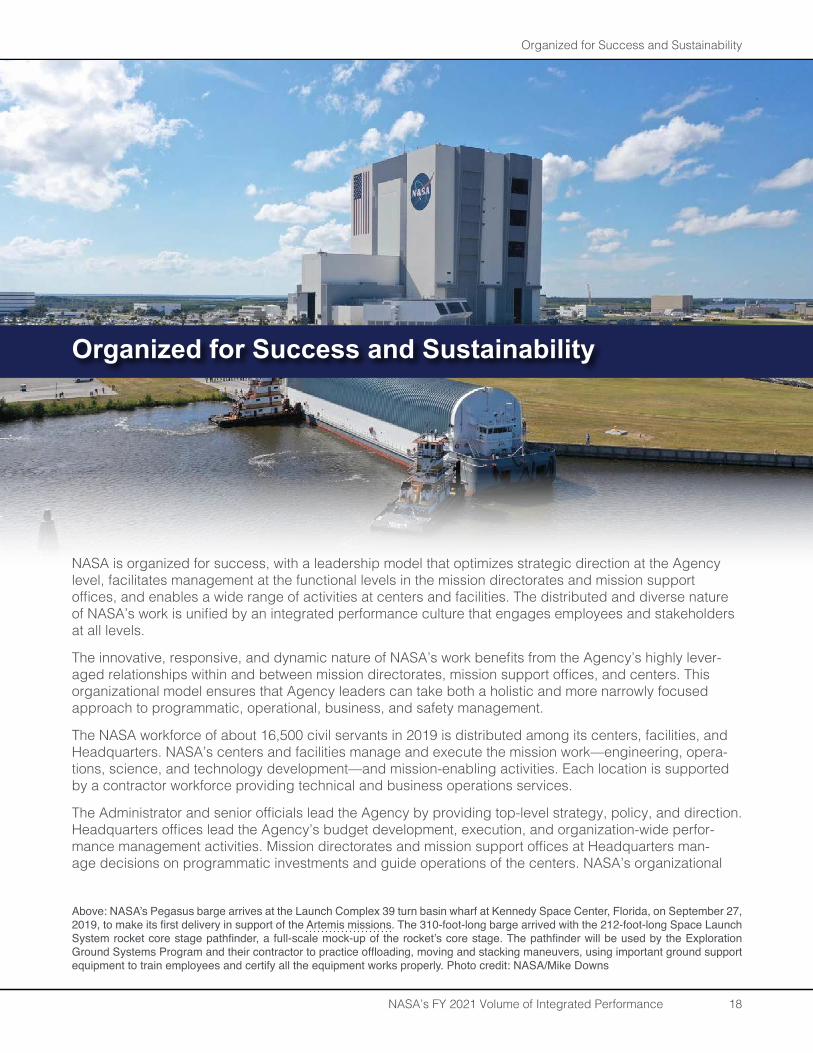
Above: NASA’s Pegasus barge arrives at the Launch Complex 39 turn basin wharf at Kennedy Space Center, Florida, on September 27, 2019, to make its first delivery in support of the Artemis missions. The 310-foot-long barge arrived with the 212-foot-long Space Launch System rocket core stage pathfinder, a full-scale mock-up of the rocket’s core stage. The pathfinder will be used by the Exploration Ground Systems Program and their contractor to practice offloading, moving and stacking maneuvers, using important ground support equipment to train employees and certify all the equipment works properly. Photo credit: NASA/Mike Downs
NASA is organized for success, with a leadership model that optimizes strategic direction at the Agency level, facilitates management at the functional levels in the mission directorates and mission support offices, and enables a wide range of activities at centers and facilities. The distributed and diverse nature of NASA’s work is unified by an integrated performance culture that engages employees and stakeholders at all levels.
The innovative, responsive, and dynamic nature of NASA’s work benefits from the Agency’s highly lever-aged relationships within and between mission directorates, mission support offices, and centers. This organizational model ensures that Agency leaders can take both a holistic and more narrowly focused approach to programmatic, operational, business, and safety management.
The NASA workforce of about 16,500 civil servants in 2019 is distributed among its centers, facilities, and Headquarters. NASA’s centers and facilities manage and execute the mission work—engineering, opera-tions, science, and technology development—and mission-enabling activities. Each location is supported by a contractor workforce providing technical and business operations services.
The Administrator and senior officials lead the Agency by providing top-level strategy, policy, and direction. Headquarters offices lead the Agency’s budget development, execution, and organization-wide perfor-mance management activities. Mission directorates and mission support offices at Headquarters man-age decisions on programmatic investments and guide operations of the centers. NASA’s organizational
Organized for Success and Sustainability
NASA’s FY 2021 Volume of Integrated Performance 19
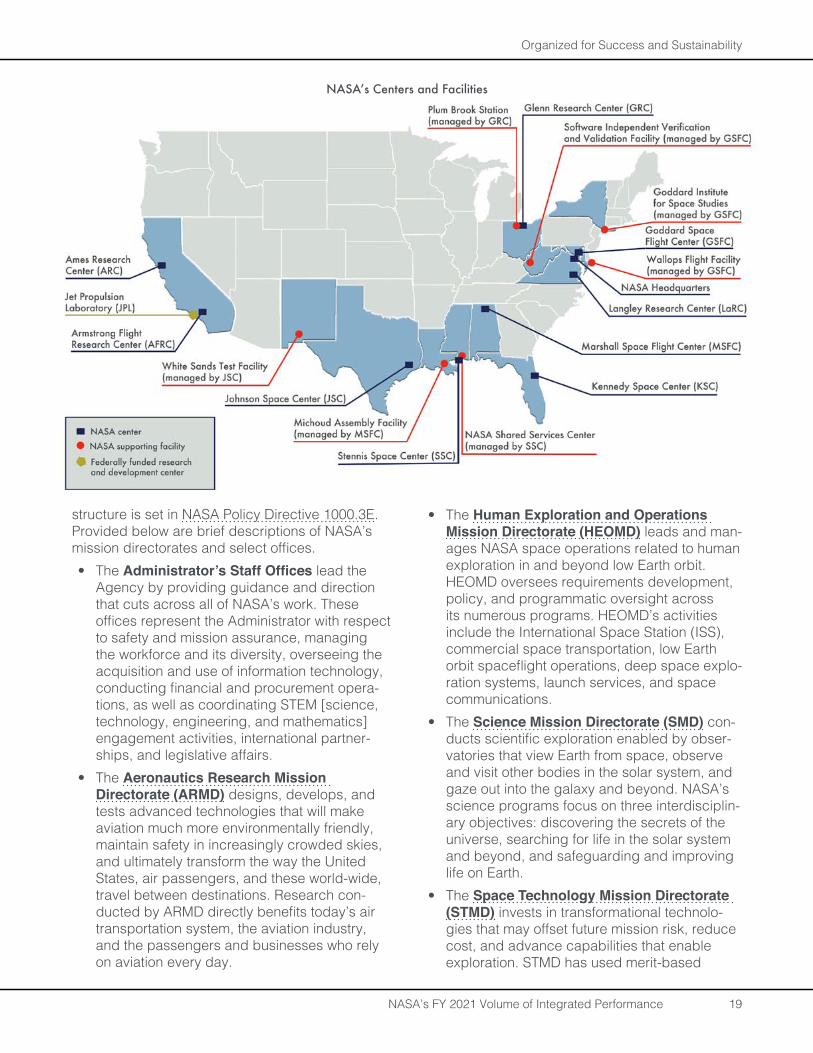
structure is set in NASA Policy Directive 1000.3E. Provided below are brief descriptions of NASA’s mission directorates and select offices.• The Administrator’s Staff Offices lead the
Agency by providing guidance and direction that cuts across all of NASA’s work. These offices represent the Administrator with respect to safety and mission assurance, managing the workforce and its diversity, overseeing the acquisition and use of information technology, conducting financial and procurement opera-tions, as well as coordinating STEM [science, technology, engineering, and mathematics] engagement activities, international partner-ships, and legislative affairs.
• The Aeronautics Research Mission Directorate (ARMD) designs, develops, and tests advanced technologies that will make aviation much more environmentally friendly, maintain safety in increasingly crowded skies, and ultimately transform the way the United States, air passengers, and these world-wide, travel between destinations. Research con-ducted by ARMD directly benefits today’s air transportation system, the aviation industry, and the passengers and businesses who rely on aviation every day.
• The Human Exploration and Operations Mission Directorate (HEOMD) leads and man-ages NASA space operations related to human exploration in and beyond low Earth orbit. HEOMD oversees requirements development, policy, and programmatic oversight across its numerous programs. HEOMD’s activities include the International Space Station (ISS), commercial space transportation, low Earth orbit spaceflight operations, deep space explo-ration systems, launch services, and space communications.
• The Science Mission Directorate (SMD) con-ducts scientific exploration enabled by obser-vatories that view Earth from space, observe and visit other bodies in the solar system, and gaze out into the galaxy and beyond. NASA’s science programs focus on three interdisciplin-ary objectives: discovering the secrets of the universe, searching for life in the solar system and beyond, and safeguarding and improving life on Earth.
• The Space Technology Mission Directorate (STMD) invests in transformational technolo-gies that may offset future mission risk, reduce cost, and advance capabilities that enable exploration. STMD has used merit-based
NASA’s Centers and Facilities
Organized for Success and Sustainability
NASA’s FY 2021 Volume of Integrated Performance 20
competition to identify and promote research and technology development, demonstrate applicability, and infuse these technologies into NASA’s exploration missions.
• The Mission Support Directorate (MSD) enables the Agency’s missions by managing institutional services and capabilities. MSD is actively reducing institutional risk to NASA’s current and future missions by improving pro-cesses, stimulating efficiency, and providing consistency and uniformity across institutional standards and practices.
• NASA’s Office of Inspector General (OIG) promotes economy, effectiveness, and effi-ciency within the Agency by conducting inde-pendent and objective audits, investigations,
and evaluations of Agency programs and oper-ations. The OIG safeguards taxpayer dollars and the integrity of the Agency by detecting and preventing fraud, waste, and abuse.
NASA’s best asset for achieving mission success is a diverse, multidisciplinary, and skilled work-force across all centers and facilities. NASA’s approach to performance management is based on that each team member brings unique experi-ence and important expertise to projects. NASA is committed to nurturing an organizational culture in which individuals make full use of their time, talent, and opportunities to pursue the highest standards in engineering, research, operations, and manage-ment.
Chief Financial Officer
Chief Information OfficerInspector General
Advisory Groups— NAC & ASAP
Diversity & Equal Opportunity
STEM Engagement
International & Interagency
Relations
Legislative & Intergovernmental
Affairs
Communications
Small Business Programs
General Counsel
Mission Support Directorate
Aeronatics Research Mission Directorate
Science Mission Directorate
Human Exploration & Operations Mission
Directorate
Space Technology Mission Directorate
Chief Scientist
Chief Technologist
Chief Engineer Chief, Safety & Mission Assurance
Chief, Health & Medical Officer
Ames Research Center
Armstrong Flight Research Center
Glenn Research Center
Goddard Flight Research Center
Johnson Space Center
Kennedy Space Center
Langley Research Center
Marshall Space Flight Center
Stennis Space Center
Office of Strategic Engagement & Assessments
Office of Agency Council Staff
Administrator Deputy Administrator
Associate Administrator
Deputy Associate AdministratorChief of Staff
Associate Administrator for Strategic Engagement & Assessments
Chief Human Capital Officer
Strategic Infrastructure
Procurement
Protective Services
NASA Shared Services Center
Headquarters Operations
Jet Propulsion Laboratory**
NASA Management Office*
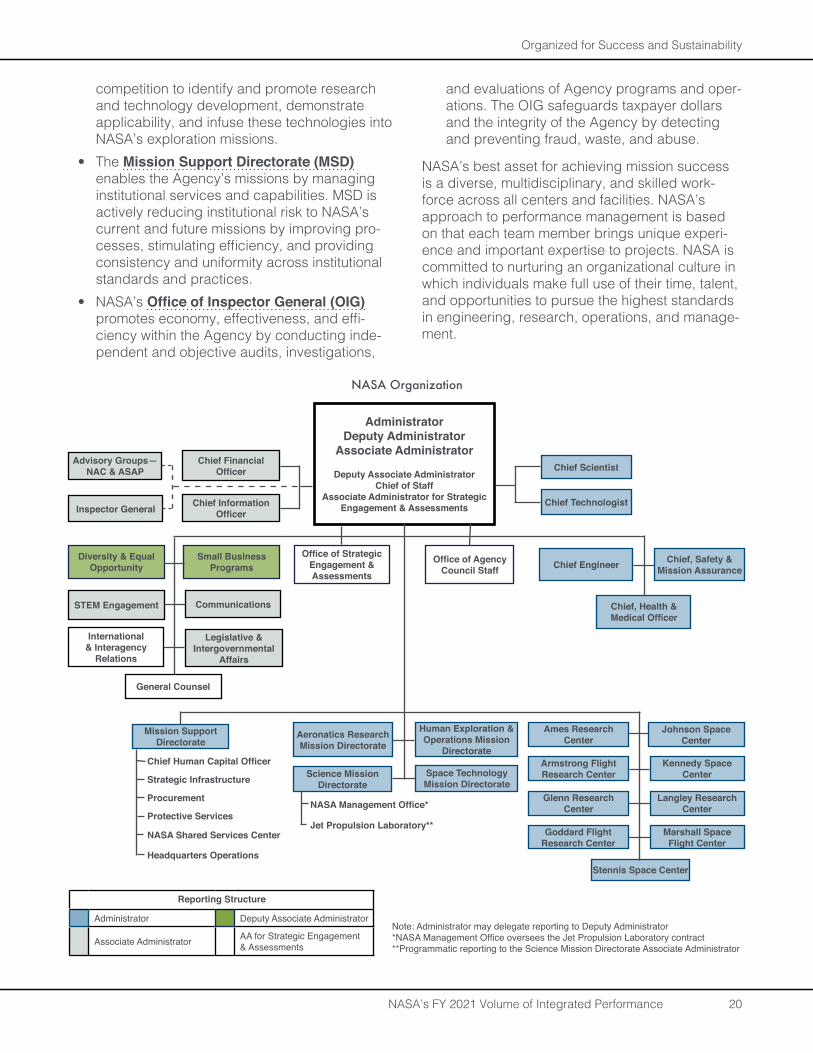
NASA Organization
Reporting Structure
Administrator Deputy Associate Administrator
Associate Administrator AA for Strategic Engagement & Assessments
Note: Administrator may delegate reporting to Deputy Administrator*NASA Management Office oversees the Jet Propulsion Laboratory contract**Programmatic reporting to the Science Mission Directorate Associate Administrator
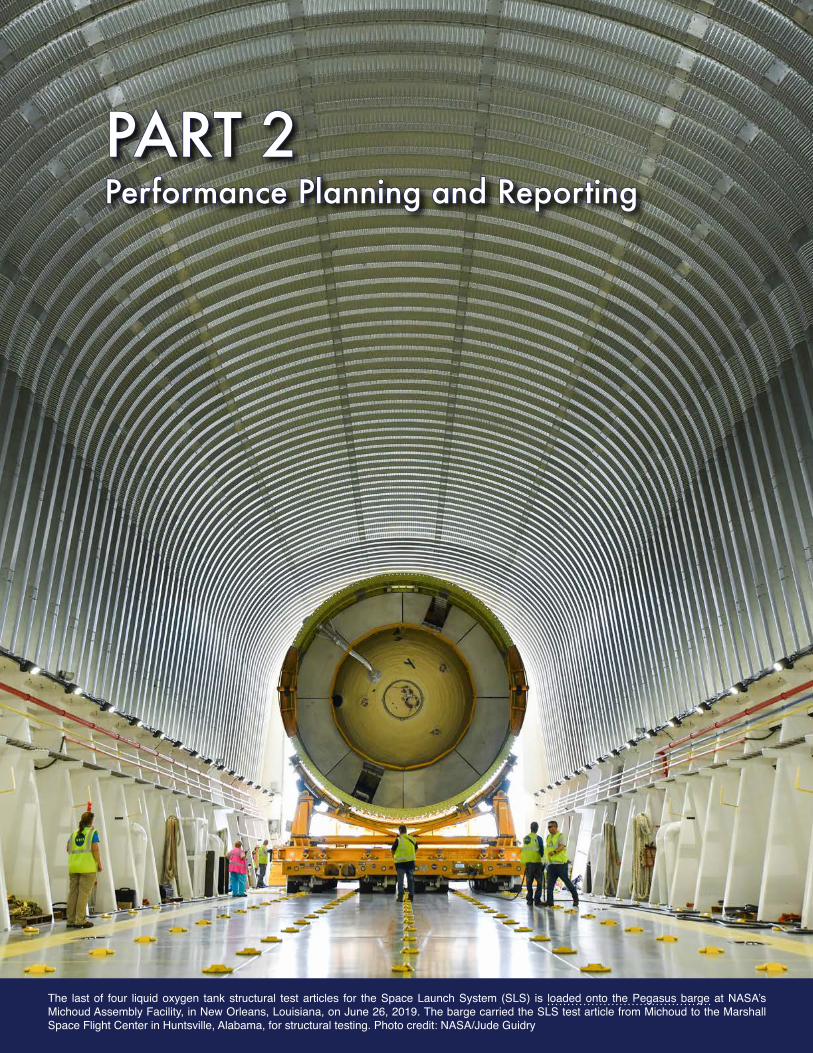
PART 2PART 2Performance Planning and ReportingPerformance Planning and Reporting
The last of four liquid oxygen tank structural test articles for the Space Launch System (SLS) is loaded onto the Pegasus barge at NASA’s Michoud Assembly Facility, in New Orleans, Louisiana, on June 26, 2019. The barge carried the SLS test article from Michoud to the Marshall Space Flight Center in Huntsville, Alabama, for structural testing. Photo credit: NASA/Jude Guidry
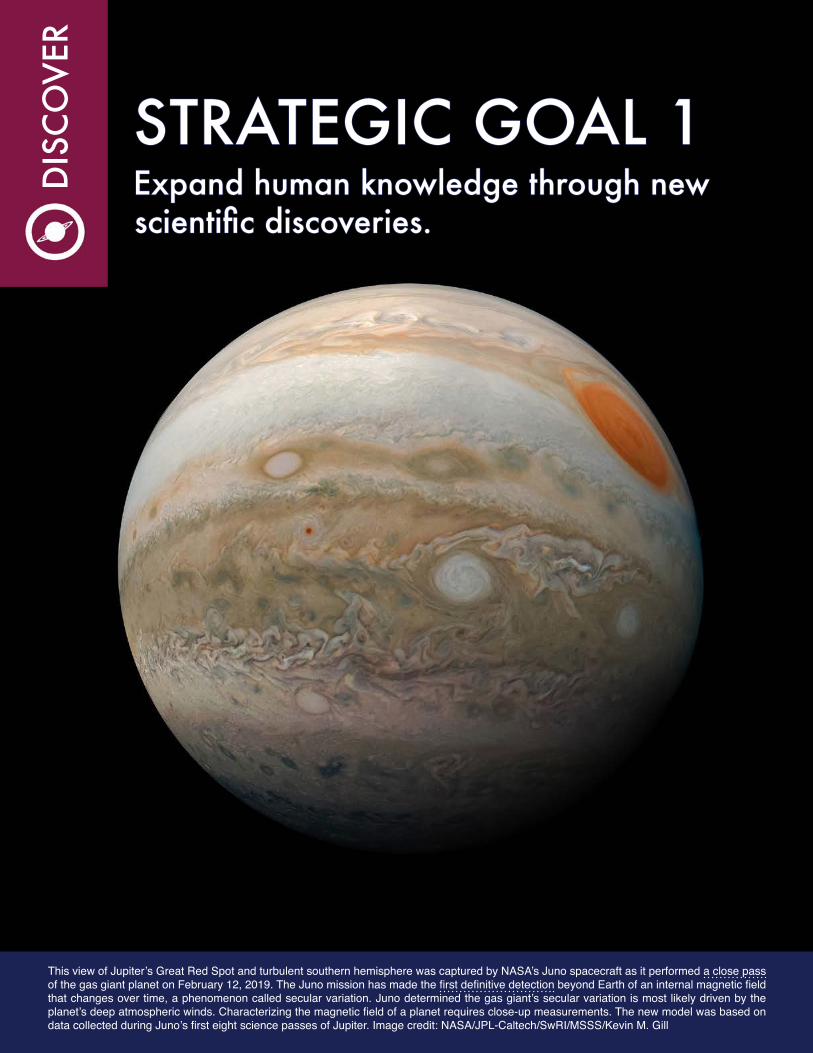
STRATEGIC GOAL 1STRATEGIC GOAL 1Expand human knowledge through new Expand human knowledge through new scientific discoveries.scientific discoveries.
DIS
CO
VER
This view of Jupiter’s Great Red Spot and turbulent southern hemisphere was captured by NASA’s Juno spacecraft as it performed a close pass of the gas giant planet on February 12, 2019. The Juno mission has made the first definitive detection beyond Earth of an internal magnetic field that changes over time, a phenomenon called secular variation. Juno determined the gas giant’s secular variation is most likely driven by the planet’s deep atmospheric winds. Characterizing the magnetic field of a planet requires close-up measurements. The new model was based on data collected during Juno’s first eight science passes of Jupiter. Image credit: NASA/JPL-Caltech/SwRI/MSSS/Kevin M. Gill
Part 2—Strategic Goal 1
NASA’s FY 2021 Volume of Integrated Performance 23
Discover
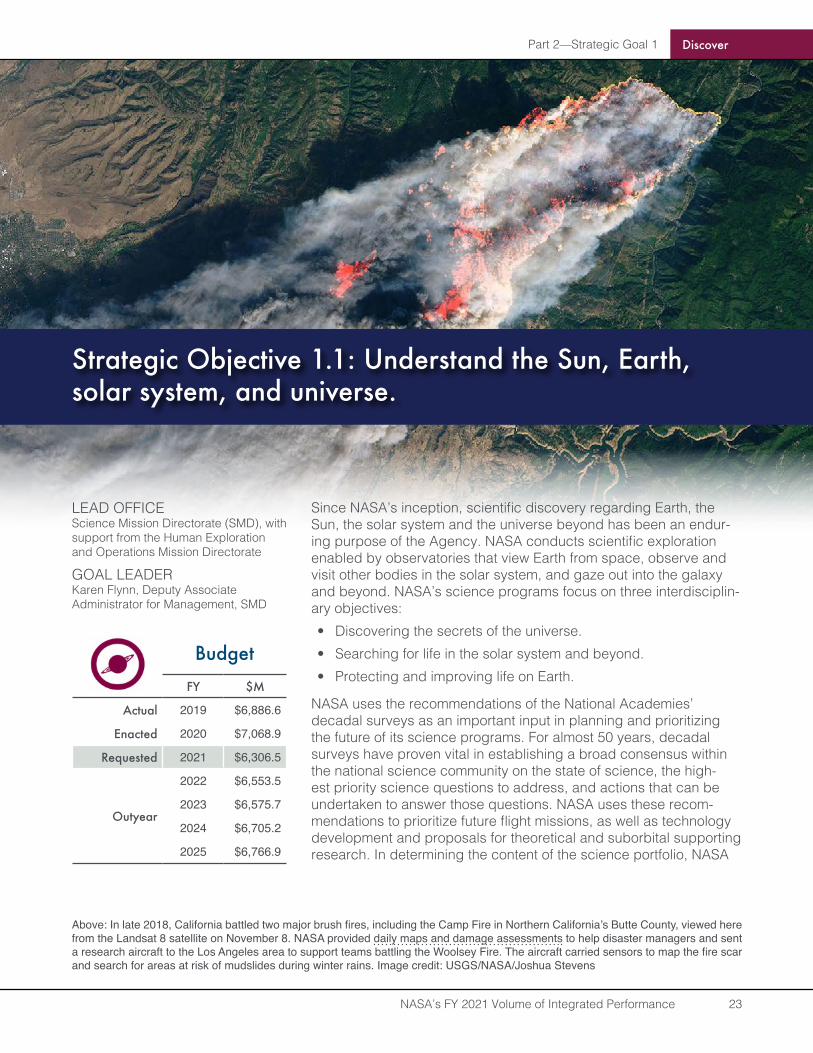
LEAD OFFICEScience Mission Directorate (SMD), with support from the Human Exploration and Operations Mission Directorate
GOAL LEADERKaren Flynn, Deputy Associate Administrator for Management, SMD
BudgetFY $M
Actual 2019 $6,886.6
Enacted 2020 $7,068.9
Requested 2021 $6,306.5
Outyear
2022 $6,553.5
2023 $6,575.7
2024 $6,705.2
2025 $6,766.9
Since NASA’s inception, scientific discovery regarding Earth, the Sun, the solar system and the universe beyond has been an endur-ing purpose of the Agency. NASA conducts scientific exploration enabled by observatories that view Earth from space, observe and visit other bodies in the solar system, and gaze out into the galaxy and beyond. NASA’s science programs focus on three interdisciplin-ary objectives: • Discovering the secrets of the universe. • Searching for life in the solar system and beyond.• Protecting and improving life on Earth.
NASA uses the recommendations of the National Academies’ decadal surveys as an important input in planning and prioritizing the future of its science programs. For almost 50 years, decadal surveys have proven vital in establishing a broad consensus within the national science community on the state of science, the high-est priority science questions to address, and actions that can be undertaken to answer those questions. NASA uses these recom-mendations to prioritize future flight missions, as well as technology development and proposals for theoretical and suborbital supporting research. In determining the content of the science portfolio, NASA
Strategic Objective 1.1: Understand the Sun, Earth, solar system, and universe.
Above: In late 2018, California battled two major brush fires, including the Camp Fire in Northern California’s Butte County, viewed here from the Landsat 8 satellite on November 8. NASA provided daily maps and damage assessments to help disaster managers and sent a research aircraft to the Los Angeles area to support teams battling the Woolsey Fire. The aircraft carried sensors to map the fire scar and search for areas at risk of mudslides during winter rains. Image credit: USGS/NASA/Joshua Stevens

Part 2—Strategic Goal 1 Discover
NASA’s FY 2021 Volume of Integrated Performance 24
also considers national priorities and policies, actual budgets, existing technological capabilities, partnership opportunities, and other programmatic factors.
In spring 2019, NASA found that it continued to make satisfactory progress toward Strategic Objective 1.1, with clear strategies for achieve-ment. The flight program was prolific, with three launches during the calendar year (Parker Solar Probe, Ice, Cloud, and Land Elevation Satellite (ICESat)-2, and the Transiting Exoplanet Survey Satellite (TESS)), the landing of the Interior Exploration using Seismic Investigations, Geodesy and Heat Transport (InSIGHT) spacecraft on Mars,
and more achievements described in the following performance goal explanations.
However, NASA faced continued technical, sched-ule, and cost challenges for the James Webb Space Telescope (Webb). NASA replanned the Webb project to address technical issues and schedule delays, with launch now planned for 2021. The Mars 2020 rover project also addressed technical issues, and while it remains on track for the 2020 launch, it has led to increased cost.
FY 2019 Performance Summary for Strategic Objective 1.1
Performance Goals (PGs) Annual Performance Indicators (APIs)
Summary of Performance for PGs and APIs Contributing to Strategic Objective 1.1, FY 2014–2019
Note: FY 2018 and FY 2019 contribute to Strategic Objective 1.1, as established by the NASA 2018 Strategic Plan. For FY 2014 through FY 2017, individual PGs and APIs were assigned to a strategic objective based on contributing work.

Part 2—Strategic Goal 1 Discover
NASA’s FY 2021 Volume of Integrated Performance 25
Performance Goal 1 .1 .1: Demonstrate progress in exploring the physical pro-cesses in the space environment from the Sun to Earth and throughout the solar system .
2014 2015 2016 2017 2018 2019
Green Green Green Green Green Green
FY 2019 Annual Performance Indicator
HE-19-1: As determined by the Heliophysics Advisory Committee (HPAC), demonstrate planned progress in exploring the physical pro-cesses in the space environment from the Sun to Earth and throughout the solar system.
Green
FY 2020–2021 Performance Plan
No performance goal after FY 2019. New perfor-mance goals for Strategic Objective 1.1 are on page 49.
FY 2019 Performance Progress
The Heliophysics Advisory Committee determined in October 2019 that NASA remained on track in its annual performance towards achieving this perfor-mance goal. Below are examples of the scientific progress reported in FY 2019.
The outermost region of the Sun’s atmosphere, the corona, is over 200 times hotter than the rest of the Sun’s surface. Scientists have been trying to figure out why the corona becomes superheated and how solar flares, large explosions on the surface of the Sun, develop in the solar atmosphere. NASA’s Interface Region Imaging Spectrograph (IRIS) revealed how plasma turbulence plays a vital role in converting magnetic energy to heat, challenging the current model stating that particles are simply transported along the Sun’s magnetic field.
The Time History of Events and Macroscale Interactions during Substorms (THEMIS) space-craft provided the first direct evidence that Earth’s dayside magnetosphere vibrates like a drum when the outer part of the magnetosphere, known as the magnetopause, is struck by plasma jets from the Sun. The THEMIS satellites were ideally located to observe as a plasma jet struck Earth’s magneto-sphere, sending oscillations to the magnetic poles and back again and creating a standing wave
pattern. These observations confirm the existence of long-hypothesized, but never demonstrated, magnetopause surface waves.
Closer to Earth, the Solar Occultation for Ice Experiment (SOFIE) on the Aeronomy of Ice in the Mesosphere (AIM) Explorer observed nitric oxide oscillations in the upper atmosphere. Although nitric oxide makes up a tiny part of the atmosphere, it radiates heat away and helps to cool Earth’s upper atmosphere after solar storms. AIM’s new observations show that the nitric oxide layer oscil-lates in the upper atmosphere driven by heating in the lower atmosphere. They also show that current models of the upper atmosphere overestimate nitric oxide abundances. Refining current models based on these observations will increase scientific knowledge about the processes that shape Earth’s upper atmosphere and also enable better predic-tions of ionospheric structures that are important to navigation and communication technologies.
An image from the IRIS spacecraft shows a tadpole-shaped jet containing a pseudo-shock streaking out from the Sun. Image credit: Abhishek Srivastava IIT (BHU)/Joy Ng, NASA
The Heliophysics Division, part of the Science Mission Directorate, studies the nature of the Sun and how it influences the nature of space and, in turn, the atmospheres of planets and the technologies that exist there .
Part 2—Strategic Goal 1 Discover
NASA’s FY 2021 Volume of Integrated Performance 26
Performance Goal 1.1.2: Demonstrate progress in advancing understanding of the connections that link the Sun, Earth, and planetary space environments, and the outer reaches of the solar system .
2014 2015 2016 2017 2018 2019
Green Green Green Green Green Green
FY 2019 Annual Performance Indicators
HE-19-2: As determined by the Heliophysics Advisory Committee (HPAC), demonstrate planned progress in advancing understanding of the connections that link the Sun, Earth, and planetary space environments, and the outer reaches of the solar system.
Green
HE-19-8: Based on NASA Research Announcement selections, establish Heliophysics Science Centers (HSCs) to tackle the key science problems of solar and space physics that require multidisciplinary teams of theorists, observers, modelers, and computer scientists.
Yellow
FY 2020–2021 Performance Plan
No performance goal after FY 2019. New perfor-mance goals for Strategic Objective 1.1 are on page 49.
FY 2019 Performance Progress
The Heliophysics Advisory Committee determined in October 2019 that NASA remained on track in its annual performance towards achieving this perfor-mance goal. Below are examples of the scientific progress reported in FY 2019.
Measurements from NASA’s two Van Allen Probes and the Japanese Arase, or ERG, mission showed that spatially localized waves, generated by a weak geomagnetic storm, on Earth’s magnetic field significantly reduced the number of charged par-ticles in the electron radiation belts on time scales as short as 10 minutes.
Ground and space-based observations from NASA’s Time History of Events and Macroscale Interactions during Substorms (THEMIS) space-craft found the likely source of the phenomenon known as STEVE, or Strong Thermal Emission Velocity Enhancement, a narrow feature of auro-ral lights that was recently discovered by citizen scientists. Most auroras are the result of substorms
pushing charged particles into the ionosphere from above. The observations showed that STEVE is due to enhanced motion of charged particles in the ionosphere.
Another example of progress is from NASA’s Interstellar Boundary Explorer (IBEX), which observed the response of the outer boundary of the solar system (the heliosphere) to a large increase in the strength of the solar wind that began in 2014. IBEX observes high energy neutral atoms (ENAs) formed when a high energy charged particle from interstellar space captures an elec-tron from a cold neutral particle at the solar system boundary. The signatures are consistent with the heliosphere being shaped by a balance between the outflowing solar wind and the flow and mag-netic fields of the interstellar medium.
The Heliophysics Division, part of the Science Mission Directorate, studies the nature of the Sun and how it influences the nature of space and, in turn, the atmospheres of planets and the technologies that exist there .

Part 2—Strategic Goal 1 Discover
NASA’s FY 2021 Volume of Integrated Performance 27
Performance Goal 1.1.3: Demonstrate progress in developing the knowledge and capability to detect and predict extreme conditions in space to protect life and society and to safeguard human and robotic explorers beyond Earth .
2014 2015 2016 2017 2018 2019
Green Green Green Green Green Green
FY 2019 Annual Performance Indicator
HE-19-3: As determined by the Heliophysics Advisory Committee (HPAC), demonstrate planned progress in developing the knowledge and capability to detect and predict extreme conditions in space to protect life and society and to safeguard human and robotic explorers beyond Earth.
Green
FY 2020–2021 Performance Plan
No performance goal after FY 2019. New perfor-mance goals for Strategic Objective 1.1 are on page 49.
FY 2019 Performance Progress
The Heliophysics Advisory Committee determined in October 2019 that NASA remained on track in its annual performance towards achieving this perfor-mance goal. NASA missions from all Heliophysics disciplines were used to advance understanding of extreme space weather phenomena, as well as conditions capable of adversely impacting tech-nology systems and human and robotic explorers. Below are examples of the scientific progress reported in FY 2019.
Observations from the Global-Scale Observations of the Limb and Disk (GOLD) mission showed that severe ionospheric plasma depletions, called “bubbles,” near the equator can occur 10 times more often than previously measured during solar minimum, when the Sun has the least solar flare activity. Communication and navigation signals can be disrupted when they encounter a bubble. More reliable functioning of these critical commu-nication and navigation systems will be possible, and will have wide societal impacts, when better forecasts of space weather are available. The GOLD mission’s observations enable advances in the modeling and understanding that is necessary for such forecasting.
On September 10, 2017, the Sun emitted a significant solar flare and a fast, wide coro-nal mass ejection. The space weather was observed from multiple locations, including at Earth by the National Oceanic and Atmospheric Administration’s Geostationary Operational Environmental Satellites (GOES), Mars by NASA’s Mars Atmosphere and Volatile Evolution (MAVEN) spacecraft, and the Sun by NASA’s Solar Terrestrial Relations Observatory (STEREO)-A spacecraft. This event provided an excellent example of the power of a distributed heliospheric observatory for diagnosing space weather events at remote locations in the solar system, including Mars, where humans will one day travel.
The Heliophysics Division, part of the Science Mission Directorate, studies the nature of the Sun and how it influences the nature of space and, in turn, the atmospheres of planets and the technologies that exist there .
The intense solar activity in September 2017 sparked global aurora on Mars more than 25 times brighter than any previ-ously observed by NASA’s MAVEN spacecraft. The purple-white colors show the intensity of ultraviolet light on Mars’ night side before (left) and during (right) the event. See how other space-craft observed the event. Image credit: NASA/GSFC/Univ. of Colorado/LASP/Joy Ng
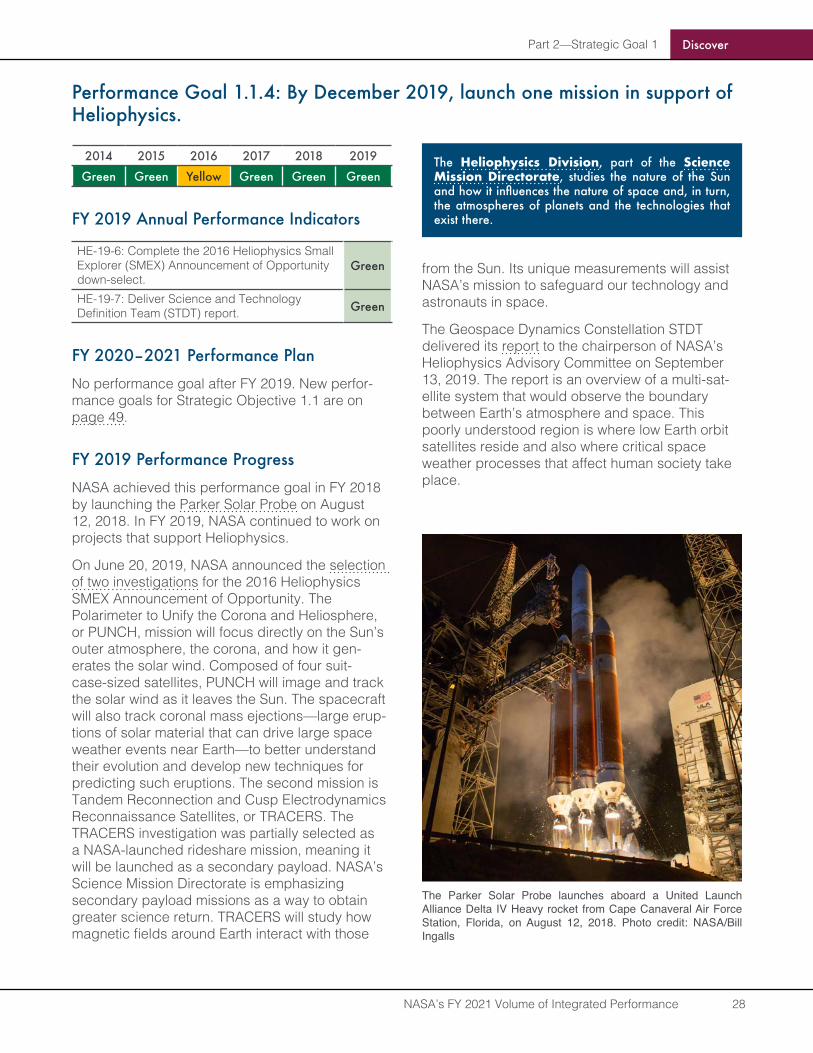
Part 2—Strategic Goal 1 Discover
NASA’s FY 2021 Volume of Integrated Performance 28
Performance Goal 1 .1 .4: By December 2019, launch one mission in support of Heliophysics .
2014 2015 2016 2017 2018 2019
Green Green Yellow Green Green Green
FY 2019 Annual Performance Indicators
HE-19-6: Complete the 2016 Heliophysics Small Explorer (SMEX) Announcement of Opportunity down-select.
Green
HE-19-7: Deliver Science and Technology Definition Team (STDT) report. Green
FY 2020–2021 Performance Plan
No performance goal after FY 2019. New perfor-mance goals for Strategic Objective 1.1 are on page 49.
FY 2019 Performance Progress
NASA achieved this performance goal in FY 2018 by launching the Parker Solar Probe on August 12, 2018. In FY 2019, NASA continued to work on projects that support Heliophysics.
On June 20, 2019, NASA announced the selection of two investigations for the 2016 Heliophysics SMEX Announcement of Opportunity. The Polarimeter to Unify the Corona and Heliosphere, or PUNCH, mission will focus directly on the Sun’s outer atmosphere, the corona, and how it gen-erates the solar wind. Composed of four suit-case-sized satellites, PUNCH will image and track the solar wind as it leaves the Sun. The spacecraft will also track coronal mass ejections—large erup-tions of solar material that can drive large space weather events near Earth—to better understand their evolution and develop new techniques for predicting such eruptions. The second mission is Tandem Reconnection and Cusp Electrodynamics Reconnaissance Satellites, or TRACERS. The TRACERS investigation was partially selected as a NASA-launched rideshare mission, meaning it will be launched as a secondary payload. NASA’s Science Mission Directorate is emphasizing secondary payload missions as a way to obtain greater science return. TRACERS will study how magnetic fields around Earth interact with those
from the Sun. Its unique measurements will assist NASA’s mission to safeguard our technology and astronauts in space.
The Geospace Dynamics Constellation STDT delivered its report to the chairperson of NASA’s Heliophysics Advisory Committee on September 13, 2019. The report is an overview of a multi-sat-ellite system that would observe the boundary between Earth’s atmosphere and space. This poorly understood region is where low Earth orbit satellites reside and also where critical space weather processes that affect human society take place.
The Heliophysics Division, part of the Science Mission Directorate, studies the nature of the Sun and how it influences the nature of space and, in turn, the atmospheres of planets and the technologies that exist there .
The Parker Solar Probe launches aboard a United Launch Alliance Delta IV Heavy rocket from Cape Canaveral Air Force Station, Florida, on August 12, 2018. Photo credit: NASA/Bill Ingalls
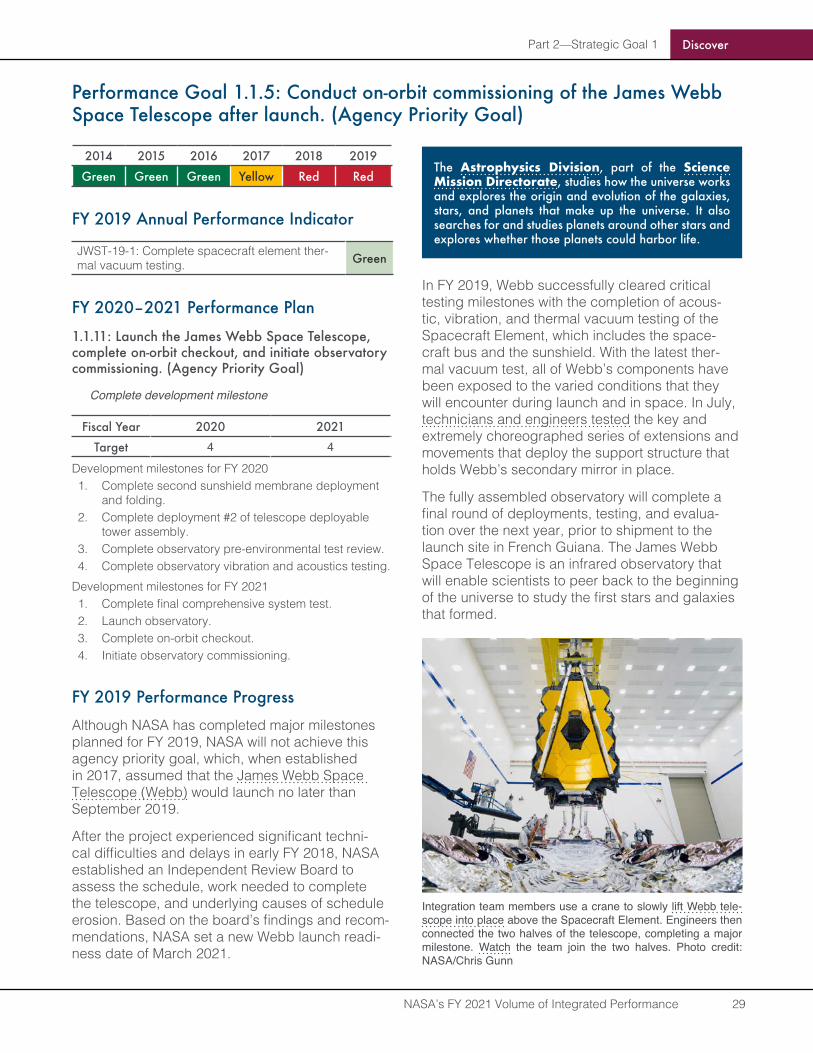
Part 2—Strategic Goal 1 Discover
NASA’s FY 2021 Volume of Integrated Performance 29
Performance Goal 1 .1 .5: Conduct on-orbit commissioning of the James Webb Space Telescope after launch . (Agency Priority Goal)
2014 2015 2016 2017 2018 2019
Green Green Green Yellow Red Red
FY 2019 Annual Performance Indicator
JWST-19-1: Complete spacecraft element ther-mal vacuum testing. Green
FY 2020–2021 Performance Plan
1 .1 .11: Launch the James Webb Space Telescope, complete on-orbit checkout, and initiate observatory commissioning . (Agency Priority Goal)
Complete development milestone
Fiscal Year 2020 2021
Target 4 4
Development milestones for FY 20201. Complete second sunshield membrane deployment
and folding.2. Complete deployment #2 of telescope deployable
tower assembly.3. Complete observatory pre-environmental test review.4. Complete observatory vibration and acoustics testing.
Development milestones for FY 20211. Complete final comprehensive system test.2. Launch observatory.3. Complete on-orbit checkout.4. Initiate observatory commissioning.
FY 2019 Performance Progress
Although NASA has completed major milestones planned for FY 2019, NASA will not achieve this agency priority goal, which, when established in 2017, assumed that the James Webb Space Telescope (Webb) would launch no later than September 2019.
After the project experienced significant techni-cal difficulties and delays in early FY 2018, NASA established an Independent Review Board to assess the schedule, work needed to complete the telescope, and underlying causes of schedule erosion. Based on the board’s findings and recom-mendations, NASA set a new Webb launch readi-ness date of March 2021.
In FY 2019, Webb successfully cleared critical testing milestones with the completion of acous-tic, vibration, and thermal vacuum testing of the Spacecraft Element, which includes the space-craft bus and the sunshield. With the latest ther-mal vacuum test, all of Webb’s components have been exposed to the varied conditions that they will encounter during launch and in space. In July, technicians and engineers tested the key and extremely choreographed series of extensions and movements that deploy the support structure that holds Webb’s secondary mirror in place.
The fully assembled observatory will complete a final round of deployments, testing, and evalua-tion over the next year, prior to shipment to the launch site in French Guiana. The James Webb Space Telescope is an infrared observatory that will enable scientists to peer back to the beginning of the universe to study the first stars and galaxies that formed.
The Astrophysics Division, part of the Science Mission Directorate, studies how the universe works and explores the origin and evolution of the galaxies, stars, and planets that make up the universe. It also searches for and studies planets around other stars and explores whether those planets could harbor life .
Integration team members use a crane to slowly lift Webb tele-scope into place above the Spacecraft Element. Engineers then connected the two halves of the telescope, completing a major milestone. Watch the team join the two halves. Photo credit: NASA/Chris Gunn
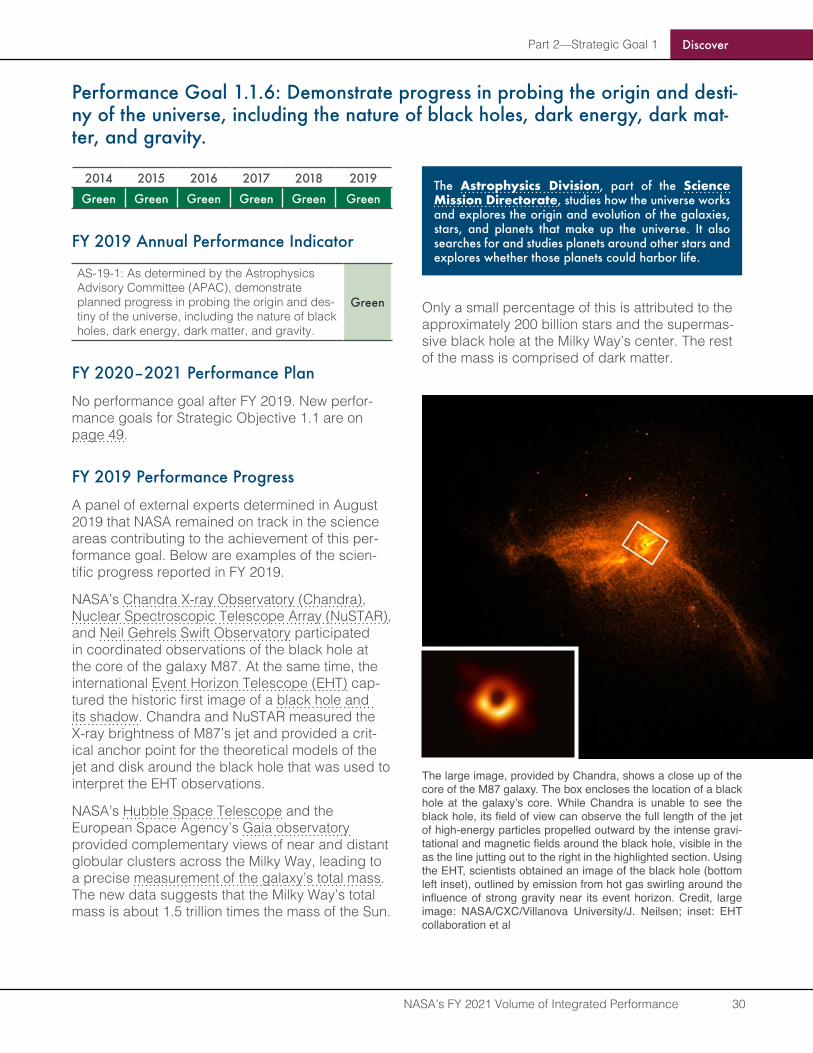
Part 2—Strategic Goal 1 Discover
NASA’s FY 2021 Volume of Integrated Performance 30
Performance Goal 1 .1 .6: Demonstrate progress in probing the origin and desti-ny of the universe, including the nature of black holes, dark energy, dark mat-ter, and gravity.
2014 2015 2016 2017 2018 2019
Green Green Green Green Green Green
FY 2019 Annual Performance Indicator
AS-19-1: As determined by the Astrophysics Advisory Committee (APAC), demonstrate planned progress in probing the origin and des-tiny of the universe, including the nature of black holes, dark energy, dark matter, and gravity.
Green
FY 2020–2021 Performance Plan
No performance goal after FY 2019. New perfor-mance goals for Strategic Objective 1.1 are on page 49.
FY 2019 Performance Progress
A panel of external experts determined in August 2019 that NASA remained on track in the science areas contributing to the achievement of this per-formance goal. Below are examples of the scien-tific progress reported in FY 2019.
NASA’s Chandra X-ray Observatory (Chandra), Nuclear Spectroscopic Telescope Array (NuSTAR), and Neil Gehrels Swift Observatory participated in coordinated observations of the black hole at the core of the galaxy M87. At the same time, the international Event Horizon Telescope (EHT) cap-tured the historic first image of a black hole and its shadow. Chandra and NuSTAR measured the X-ray brightness of M87’s jet and provided a crit-ical anchor point for the theoretical models of the jet and disk around the black hole that was used to interpret the EHT observations.
NASA’s Hubble Space Telescope and the European Space Agency’s Gaia observatory provided complementary views of near and distant globular clusters across the Milky Way, leading to a precise measurement of the galaxy’s total mass. The new data suggests that the Milky Way’s total mass is about 1.5 trillion times the mass of the Sun.
Only a small percentage of this is attributed to the approximately 200 billion stars and the supermas-sive black hole at the Milky Way’s center. The rest of the mass is comprised of dark matter.
The Astrophysics Division, part of the Science Mission Directorate, studies how the universe works and explores the origin and evolution of the galaxies, stars, and planets that make up the universe. It also searches for and studies planets around other stars and explores whether those planets could harbor life .
The large image, provided by Chandra, shows a close up of the core of the M87 galaxy. The box encloses the location of a black hole at the galaxy’s core. While Chandra is unable to see the black hole, its field of view can observe the full length of the jet of high-energy particles propelled outward by the intense gravi-tational and magnetic fields around the black hole, visible in the as the line jutting out to the right in the highlighted section. Using the EHT, scientists obtained an image of the black hole (bottom left inset), outlined by emission from hot gas swirling around the influence of strong gravity near its event horizon. Credit, large image: NASA/CXC/Villanova University/J. Neilsen; inset: EHT collaboration et al
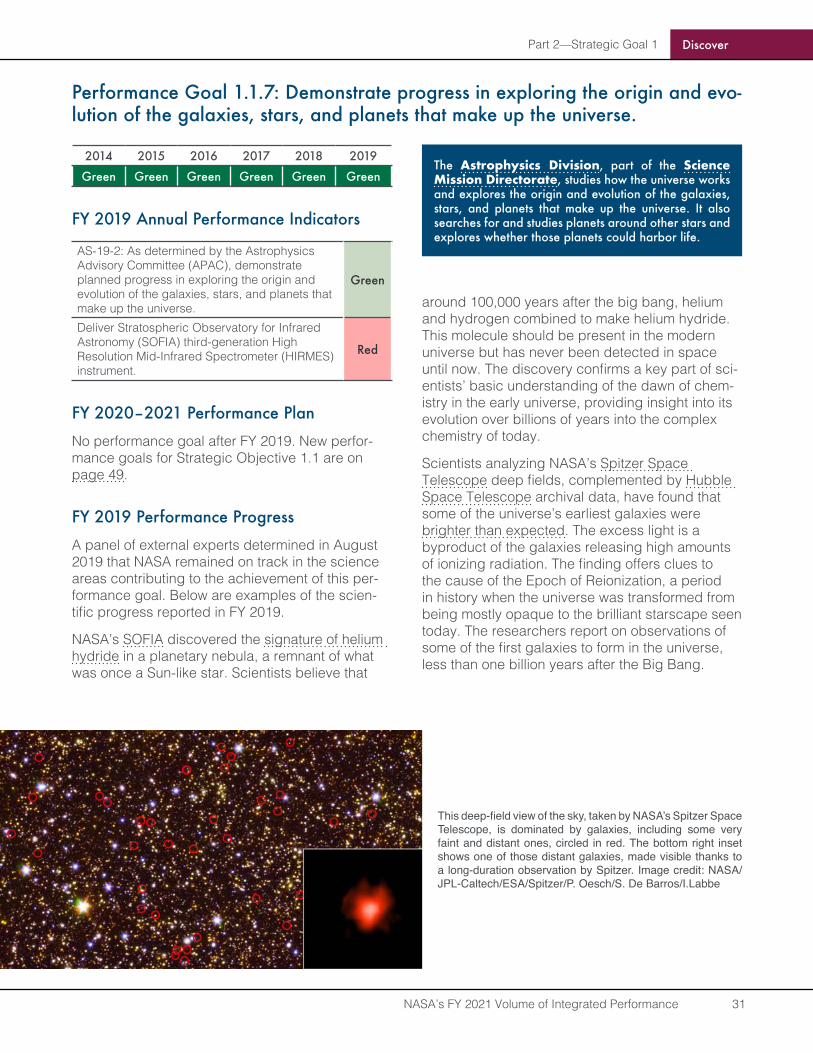
Part 2—Strategic Goal 1 Discover
NASA’s FY 2021 Volume of Integrated Performance 31
Performance Goal 1.1.7: Demonstrate progress in exploring the origin and evo-lution of the galaxies, stars, and planets that make up the universe.
2014 2015 2016 2017 2018 2019
Green Green Green Green Green Green
FY 2019 Annual Performance Indicators
AS-19-2: As determined by the Astrophysics Advisory Committee (APAC), demonstrate planned progress in exploring the origin and evolution of the galaxies, stars, and planets that make up the universe.
Green
Deliver Stratospheric Observatory for Infrared Astronomy (SOFIA) third-generation High Resolution Mid-Infrared Spectrometer (HIRMES) instrument.
Red
FY 2020–2021 Performance Plan
No performance goal after FY 2019. New perfor-mance goals for Strategic Objective 1.1 are on page 49.
FY 2019 Performance Progress
A panel of external experts determined in August 2019 that NASA remained on track in the science areas contributing to the achievement of this per-formance goal. Below are examples of the scien-tific progress reported in FY 2019.
NASA’s SOFIA discovered the signature of helium hydride in a planetary nebula, a remnant of what was once a Sun-like star. Scientists believe that
around 100,000 years after the big bang, helium and hydrogen combined to make helium hydride. This molecule should be present in the modern universe but has never been detected in space until now. The discovery confirms a key part of sci-entists’ basic understanding of the dawn of chem-istry in the early universe, providing insight into its evolution over billions of years into the complex chemistry of today.
Scientists analyzing NASA’s Spitzer Space Telescope deep fields, complemented by Hubble Space Telescope archival data, have found that some of the universe’s earliest galaxies were brighter than expected. The excess light is a byproduct of the galaxies releasing high amounts of ionizing radiation. The finding offers clues to the cause of the Epoch of Reionization, a period in history when the universe was transformed from being mostly opaque to the brilliant starscape seen today. The researchers report on observations of some of the first galaxies to form in the universe, less than one billion years after the Big Bang.
The Astrophysics Division, part of the Science Mission Directorate, studies how the universe works and explores the origin and evolution of the galaxies, stars, and planets that make up the universe. It also searches for and studies planets around other stars and explores whether those planets could harbor life .
This deep-field view of the sky, taken by NASA’s Spitzer Space Telescope, is dominated by galaxies, including some very faint and distant ones, circled in red. The bottom right inset shows one of those distant galaxies, made visible thanks to a long-duration observation by Spitzer. Image credit: NASA/JPL-Caltech/ESA/Spitzer/P. Oesch/S. De Barros/I.Labbe
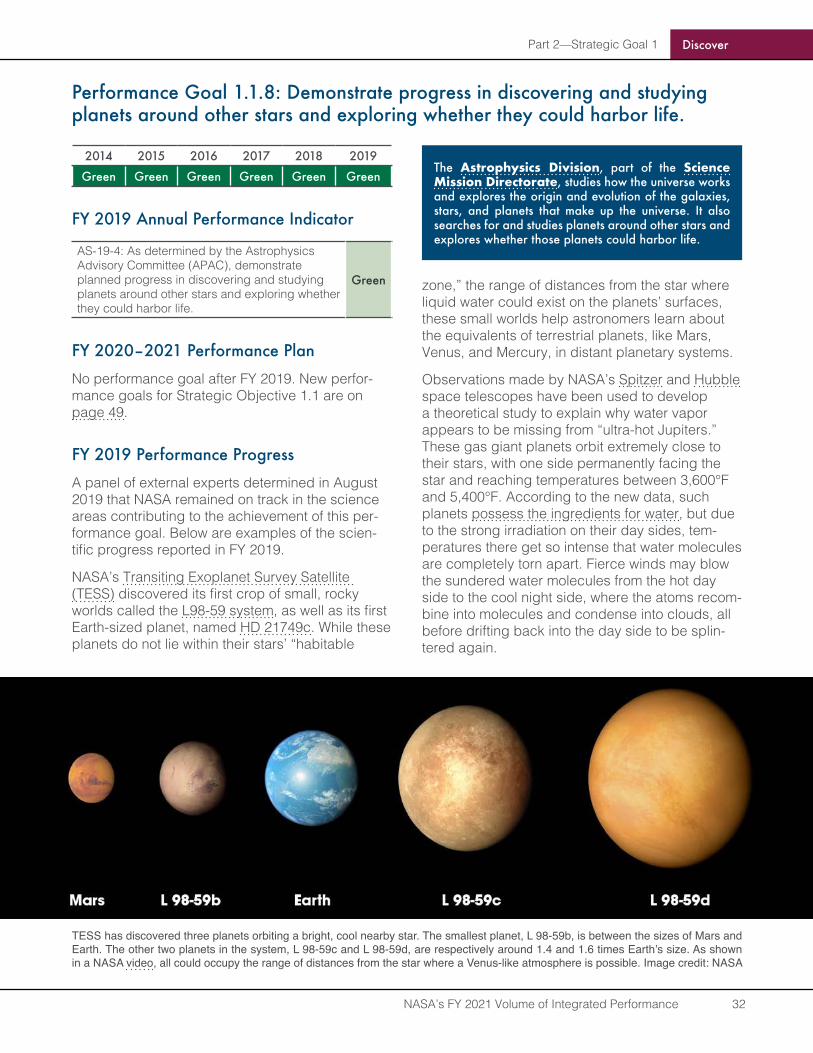
Part 2—Strategic Goal 1 Discover
NASA’s FY 2021 Volume of Integrated Performance 32
Performance Goal 1.1.8: Demonstrate progress in discovering and studying planets around other stars and exploring whether they could harbor life .
2014 2015 2016 2017 2018 2019
Green Green Green Green Green Green
FY 2019 Annual Performance Indicator
AS-19-4: As determined by the Astrophysics Advisory Committee (APAC), demonstrate planned progress in discovering and studying planets around other stars and exploring whether they could harbor life.
Green
FY 2020–2021 Performance Plan
No performance goal after FY 2019. New perfor-mance goals for Strategic Objective 1.1 are on page 49.
FY 2019 Performance Progress
A panel of external experts determined in August 2019 that NASA remained on track in the science areas contributing to the achievement of this per-formance goal. Below are examples of the scien-tific progress reported in FY 2019.
NASA’s Transiting Exoplanet Survey Satellite (TESS) discovered its first crop of small, rocky worlds called the L98-59 system, as well as its first Earth-sized planet, named HD 21749c. While these planets do not lie within their stars’ “habitable
zone,” the range of distances from the star where liquid water could exist on the planets’ surfaces, these small worlds help astronomers learn about the equivalents of terrestrial planets, like Mars, Venus, and Mercury, in distant planetary systems.
Observations made by NASA’s Spitzer and Hubble space telescopes have been used to develop a theoretical study to explain why water vapor appears to be missing from “ultra-hot Jupiters.” These gas giant planets orbit extremely close to their stars, with one side permanently facing the star and reaching temperatures between 3,600°F and 5,400°F. According to the new data, such planets possess the ingredients for water, but due to the strong irradiation on their day sides, tem-peratures there get so intense that water molecules are completely torn apart. Fierce winds may blow the sundered water molecules from the hot day side to the cool night side, where the atoms recom-bine into molecules and condense into clouds, all before drifting back into the day side to be splin-tered again.
The Astrophysics Division, part of the Science Mission Directorate, studies how the universe works and explores the origin and evolution of the galaxies, stars, and planets that make up the universe. It also searches for and studies planets around other stars and explores whether those planets could harbor life .
TESS has discovered three planets orbiting a bright, cool nearby star. The smallest planet, L 98-59b, is between the sizes of Mars and Earth. The other two planets in the system, L 98-59c and L 98-59d, are respectively around 1.4 and 1.6 times Earth’s size. As shown in a NASA video, all could occupy the range of distances from the star where a Venus-like atmosphere is possible. Image credit: NASA
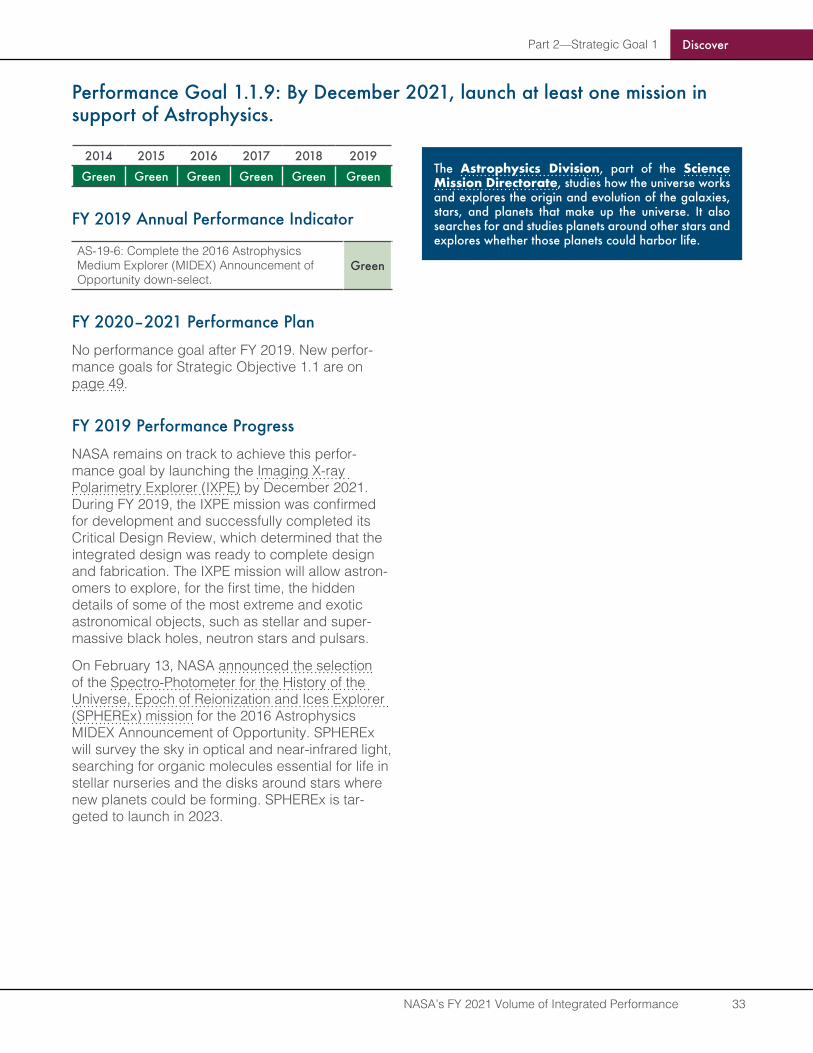
Part 2—Strategic Goal 1 Discover
NASA’s FY 2021 Volume of Integrated Performance 33
Performance Goal 1 .1 .9: By December 2021, launch at least one mission in support of Astrophysics .
2014 2015 2016 2017 2018 2019
Green Green Green Green Green Green
FY 2019 Annual Performance Indicator
AS-19-6: Complete the 2016 Astrophysics Medium Explorer (MIDEX) Announcement of Opportunity down-select.
Green
FY 2020–2021 Performance Plan
No performance goal after FY 2019. New perfor-mance goals for Strategic Objective 1.1 are on page 49.
FY 2019 Performance Progress
NASA remains on track to achieve this perfor-mance goal by launching the Imaging X-ray Polarimetry Explorer (IXPE) by December 2021. During FY 2019, the IXPE mission was confirmed for development and successfully completed its Critical Design Review, which determined that the integrated design was ready to complete design and fabrication. The IXPE mission will allow astron-omers to explore, for the first time, the hidden details of some of the most extreme and exotic astronomical objects, such as stellar and super-massive black holes, neutron stars and pulsars.
On February 13, NASA announced the selection of the Spectro-Photometer for the History of the Universe, Epoch of Reionization and Ices Explorer (SPHEREx) mission for the 2016 Astrophysics MIDEX Announcement of Opportunity. SPHEREx will survey the sky in optical and near-infrared light, searching for organic molecules essential for life in stellar nurseries and the disks around stars where new planets could be forming. SPHEREx is tar-geted to launch in 2023.
The Astrophysics Division, part of the Science Mission Directorate, studies how the universe works and explores the origin and evolution of the galaxies, stars, and planets that make up the universe. It also searches for and studies planets around other stars and explores whether those planets could harbor life .
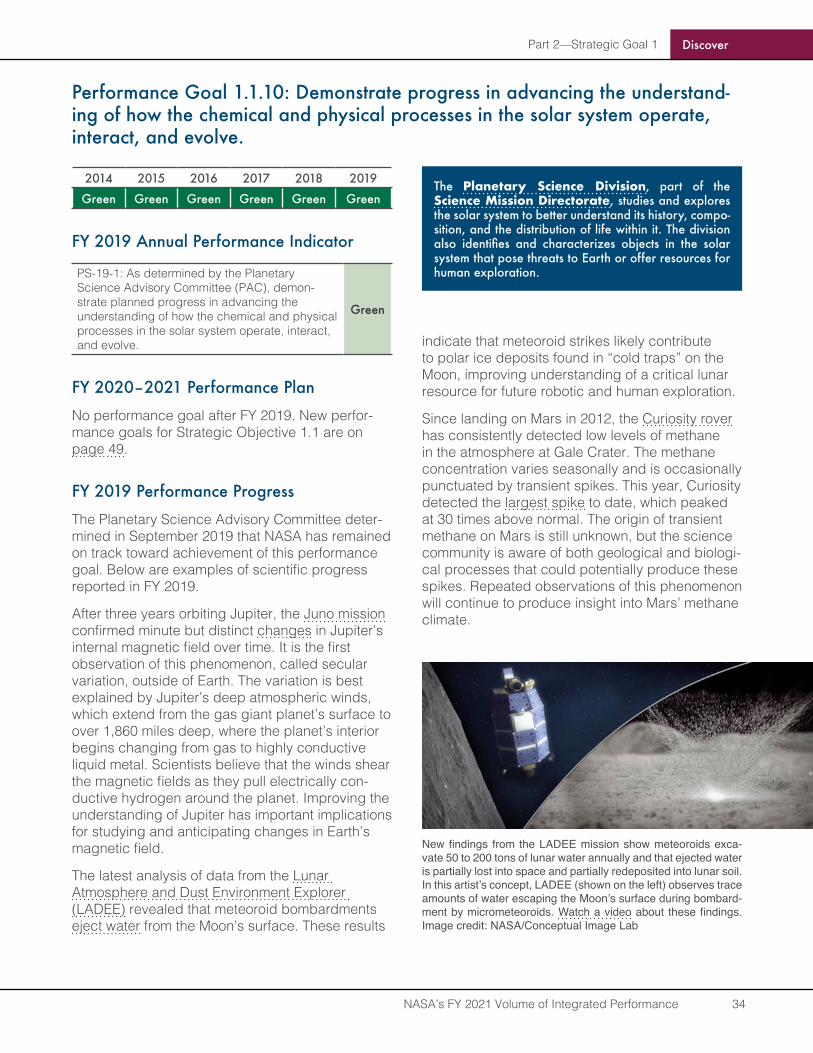
Part 2—Strategic Goal 1 Discover
NASA’s FY 2021 Volume of Integrated Performance 34
Performance Goal 1.1.10: Demonstrate progress in advancing the understand-ing of how the chemical and physical processes in the solar system operate, interact, and evolve.
2014 2015 2016 2017 2018 2019
Green Green Green Green Green Green
FY 2019 Annual Performance Indicator
PS-19-1: As determined by the Planetary Science Advisory Committee (PAC), demon-strate planned progress in advancing the understanding of how the chemical and physical processes in the solar system operate, interact, and evolve.
Green
FY 2020–2021 Performance Plan
No performance goal after FY 2019. New perfor-mance goals for Strategic Objective 1.1 are on page 49.
FY 2019 Performance Progress
The Planetary Science Advisory Committee deter-mined in September 2019 that NASA has remained on track toward achievement of this performance goal. Below are examples of scientific progress reported in FY 2019.
After three years orbiting Jupiter, the Juno mission confirmed minute but distinct changes in Jupiter’s internal magnetic field over time. It is the first observation of this phenomenon, called secular variation, outside of Earth. The variation is best explained by Jupiter’s deep atmospheric winds, which extend from the gas giant planet’s surface to over 1,860 miles deep, where the planet’s interior begins changing from gas to highly conductive liquid metal. Scientists believe that the winds shear the magnetic fields as they pull electrically con-ductive hydrogen around the planet. Improving the understanding of Jupiter has important implications for studying and anticipating changes in Earth’s magnetic field.
The latest analysis of data from the Lunar Atmosphere and Dust Environment Explorer (LADEE) revealed that meteoroid bombardments eject water from the Moon’s surface. These results
indicate that meteoroid strikes likely contribute to polar ice deposits found in “cold traps” on the Moon, improving understanding of a critical lunar resource for future robotic and human exploration.
Since landing on Mars in 2012, the Curiosity rover has consistently detected low levels of methane in the atmosphere at Gale Crater. The methane concentration varies seasonally and is occasionally punctuated by transient spikes. This year, Curiosity detected the largest spike to date, which peaked at 30 times above normal. The origin of transient methane on Mars is still unknown, but the science community is aware of both geological and biologi-cal processes that could potentially produce these spikes. Repeated observations of this phenomenon will continue to produce insight into Mars’ methane climate.
The Planetary Science Division, part of the Science Mission Directorate, studies and explores the solar system to better understand its history, compo-sition, and the distribution of life within it. The division also identifies and characterizes objects in the solar system that pose threats to Earth or offer resources for human exploration .
New findings from the LADEE mission show meteoroids exca-vate 50 to 200 tons of lunar water annually and that ejected water is partially lost into space and partially redeposited into lunar soil. In this artist’s concept, LADEE (shown on the left) observes trace amounts of water escaping the Moon’s surface during bombard-ment by micrometeoroids. Watch a video about these findings. Image credit: NASA/Conceptual Image Lab
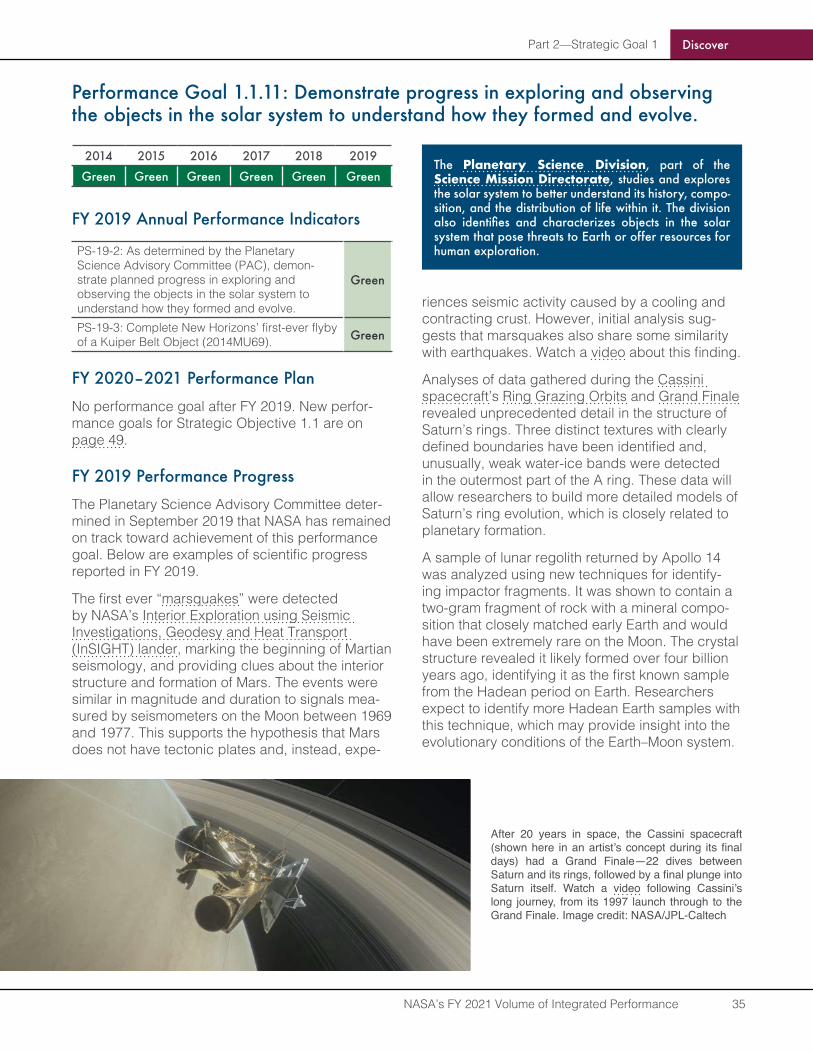
Part 2—Strategic Goal 1 Discover
NASA’s FY 2021 Volume of Integrated Performance 35
Performance Goal 1.1.11: Demonstrate progress in exploring and observing the objects in the solar system to understand how they formed and evolve.
2014 2015 2016 2017 2018 2019
Green Green Green Green Green Green
FY 2019 Annual Performance Indicators
PS-19-2: As determined by the Planetary Science Advisory Committee (PAC), demon-strate planned progress in exploring and observing the objects in the solar system to understand how they formed and evolve.
Green
PS-19-3: Complete New Horizons’ first-ever flyby of a Kuiper Belt Object (2014MU69). Green
FY 2020–2021 Performance Plan
No performance goal after FY 2019. New perfor-mance goals for Strategic Objective 1.1 are on page 49.
FY 2019 Performance Progress
The Planetary Science Advisory Committee deter-mined in September 2019 that NASA has remained on track toward achievement of this performance goal. Below are examples of scientific progress reported in FY 2019.
The first ever “marsquakes” were detected by NASA’s Interior Exploration using Seismic Investigations, Geodesy and Heat Transport (InSIGHT) lander, marking the beginning of Martian seismology, and providing clues about the interior structure and formation of Mars. The events were similar in magnitude and duration to signals mea-sured by seismometers on the Moon between 1969 and 1977. This supports the hypothesis that Mars does not have tectonic plates and, instead, expe-
riences seismic activity caused by a cooling and contracting crust. However, initial analysis sug-gests that marsquakes also share some similarity with earthquakes. Watch a video about this finding.
Analyses of data gathered during the Cassini spacecraft’s Ring Grazing Orbits and Grand Finale revealed unprecedented detail in the structure of Saturn’s rings. Three distinct textures with clearly defined boundaries have been identified and, unusually, weak water-ice bands were detected in the outermost part of the A ring. These data will allow researchers to build more detailed models of Saturn’s ring evolution, which is closely related to planetary formation.
A sample of lunar regolith returned by Apollo 14 was analyzed using new techniques for identify-ing impactor fragments. It was shown to contain a two-gram fragment of rock with a mineral compo-sition that closely matched early Earth and would have been extremely rare on the Moon. The crystal structure revealed it likely formed over four billion years ago, identifying it as the first known sample from the Hadean period on Earth. Researchers expect to identify more Hadean Earth samples with this technique, which may provide insight into the evolutionary conditions of the Earth–Moon system.
The Planetary Science Division, part of the Science Mission Directorate, studies and explores the solar system to better understand its history, compo-sition, and the distribution of life within it. The division also identifies and characterizes objects in the solar system that pose threats to Earth or offer resources for human exploration .
After 20 years in space, the Cassini spacecraft (shown here in an artist’s concept during its final days) had a Grand Finale—22 dives between Saturn and its rings, followed by a final plunge into Saturn itself. Watch a video following Cassini’s long journey, from its 1997 launch through to the Grand Finale. Image credit: NASA/JPL-Caltech
Part 2—Strategic Goal 1 Discover
NASA’s FY 2021 Volume of Integrated Performance 36
Performance Goal 1 .1 .12: Demonstrate progress in exploring and finding loca-tions where life could have existed or could exist today.
2014 2015 2016 2017 2018 2019
Green Green Green Green Green Green
FY 2019 Annual Performance Indicator
PS-19-4: As determined by the Planetary Science Advisory Committee (PAC), demon-strate planned progress in exploring and finding locations where life could have existed or could exist today.
Green
FY 2020–2021 Performance Plan
No performance goal after FY 2019. New perfor-mance goals for Strategic Objective 1.1 are on page 49.
FY 2019 Performance Progress
The Planetary Science Advisory Committee deter-mined in September 2019 that NASA has remained on track toward achievement of this performance goal. Below are examples of the scientific progress reported in FY 2019.
A recent comparison of Martian mudstone geo-chemistry to basaltic terrestrial sediments from southwest Iceland and northwest Idaho, United States, provide new constraints for the temperature and aridity of ancient Gale Crater and thus new insight into the habitability of ancient Mars. Using data collected by the Curiosity rover at the Murray and Yellowknife Bay regions on Mars as compared to terrestrial samples, results indicate that during the formation of Yellowknife Bay, paleoclimate con-ditions could have been as cold as modern-day Antarctica, and as wet as Svalbard. The measure-ments of the Murray Formation samples suggest that during their formation, a warmer and wetter, Icelandic-like environment prevailed. It is possible that future observations by Curiosity will provide evidence for even more warm and wet climates in ancient Gale crater, and thus aid the search for signs of past and present life on Mars.
The simultaneous presence of oxygen and meth-ane in an exoplanet’s atmosphere is an especially strong biosignature. New computer simulations show that the atmosphere of a planet orbiting a
lower mass K-type star, also known as an orange dwarf star, can support an order of magnitude more methane in the presence of oxygen com-pared to a planet orbiting a G-type star (like the Sun), and that exoplanets orbiting K-type stars may offer a “biosignature advantage” in the search for life elsewhere in the universe. The identification of K-type stars as good targets for future biosig-nature searches is an important step in narrowing down the billions of potential targets for exoplanet observation.
The Planetary Science Division, part of the Science Mission Directorate, studies and explores the solar system to better understand its history, compo-sition, and the distribution of life within it. The division also identifies and characterizes objects in the solar system that pose threats to Earth or offer resources for human exploration .
Part 2—Strategic Goal 1 Discover
NASA’s FY 2021 Volume of Integrated Performance 37
Performance Goal 1.1.13: Demonstrate progress in improving understanding of the origin and evolution of life on Earth to guide the search for life elsewhere.
2014 2015 2016 2017 2018 2019
Green Green Green Green Green Green
FY 2019 Annual Performance Indicator
PS-19-5: As determined by the Planetary Science Advisory Committee (PAC), demon-strate planned progress in improving under-standing of the origin and evolution of life on Earth to guide the search for life elsewhere.
Green
FY 2020–2021 Performance Plan
No performance goal after FY 2019. New perfor-mance goals for Strategic Objective 1.1 are on page 49.
FY 2019 Performance Progress
The Planetary Science Advisory Committee deter-mined in September 2019 that NASA has remained on track toward achieving this performance goal. Below are examples of the scientific progress reported in FY 2019.
Drawing from lessons learned from previous extra-terrestrial life detection efforts, as well as from our current understanding of the evolution of life on Earth, researchers developed the “Ladder of Life Detection” to guide future identification of indige-nous life. The “rungs” of the Ladder represent the features of known life, sorted by their likelihood of indicating extant or historic life. This work is a starting point to provide a high-level, guiding framework for future research on the characteris-tics of life, what constitutes a biosignature, and the means to measure them.
A recent study proposes that prior to the devel-opment of photosynthesis, early life-forms on Earth may have been able to generate metabolic energy from sunlight using a purple-pigmented molecule called retinal. A number of pigments that absorb light contain the retinal molecule, including one called bacteriorhodopsin, which has been observed in early haloarchaeal life forms. The strong absorption peak of retinal is different from but complementary to that of the green chloro-phyll pigment and may create unique spectral
signatures on exoplanets that could be remotely detected by telescopes. Expanding the categories of surface signatures to include light-harvesting life that use pigments other than chlorophyll is an important step in life-detection efforts.
The Planetary Science Division, part of the Science Mission Directorate, studies and explores the solar system to better understand its history, compo-sition, and the distribution of life within it. The division also identifies and characterizes objects in the solar system that pose threats to Earth or offer resources for human exploration .
Part 2—Strategic Goal 1 Discover
NASA’s FY 2021 Volume of Integrated Performance 38
Performance Goal 1 .1 .14: Demonstrate progress in identifying and characteriz-ing objects in the solar system that pose threats to Earth or offer resources for human exploration .
2014 2015 2016 2017 2018 2019
Green Green Green Green Green Green
FY 2019 Annual Performance Indicators
PS-19-6: As determined by the Planetary Science Advisory Committee (PAC), demon-strate planned progress in identifying and char-acterizing objects in the solar system that pose threats to Earth or offer resources for human exploration.
Green
PS-19-12: Conduct research, involving both U.S. interagency and international cooperation and partnerships, into mitigation techniques and technologies to address the anticipated threat of small body impacts to life on Earth.
Green
PS-19-13: Identify and catalog a cumulative 8,900 of the estimated 25,000 near-Earth aster-oids (NEAs) 140 meters or larger.
Yellow
FY 2020–2021 Performance Plan
No performance goal after FY 2019. New perfor-mance goals for Strategic Objective 1.1 are on page 49.
FY 2019 Performance Progress
The Planetary Science Advisory Committee deter-mined in September 2019 that NASA has remained on track toward achieving this performance goal. Below are examples of the scientific progress reported in FY 2019.
Since October 1, 2018, asteroid search teams funded by NASA’s Near-Earth Object Observations Program found another six asteroids larger than one kilometer in size and 2,179 asteroids less than one kilometer in size. This brings the total known population of near-Earth asteroids to 20,944 as of September 30, 2019.
The 2018-2019 Antarctic Search for Meteorites (ANSMET) field season recovered 865 meteorites, which are being classified by the Smithsonian Institution. More than a dozen of those found were achondrites, meteorites that have undergone melting and recrystallization to varying degrees
within their parent bodies. This helps scientists to understand the thermal and collisional history of the asteroid belt, as well as the timing of formation of major planets in the solar system. A total of 471 newly classified meteorites from Antarctica were announced in the spring and summer of 2019, and they have been made available to request for study.
The distinction between cometary and asteroid impact craters on Mars has been historically dif-ficult to determine, but computational simulations and laboratory experiments by researchers have produced additional insight into this problem. The research showed that impacts from comets produce radial, thermal wind streaks due to their higher speed and volatile content and concluded that approximately one percent of the craters on Mars formed in the last two billion years are due to Long-Period cometary impacts. This finding was then extrapolated to the Earth–Moon system, and after including the Jupiter-family and Haley-type comets, the model predicted that a higher per-centage than previously thought of all terrestrial impacts could be cometary. While more research is still needed, this study has important impli-cations for understanding both the past impact environment of Mars and future impact hazards for Earth.
The Planetary Science Division, part of the Science Mission Directorate, studies and explores the solar system to better understand its history, compo-sition, and the distribution of life within it. The division also identifies and characterizes objects in the solar system that pose threats to Earth or offer resources for human exploration .

Part 2—Strategic Goal 1 Discover
NASA’s FY 2021 Volume of Integrated Performance 39
Performance Goal 1.1.15: Deliver the Mars 2020 instrument payload for spacecraft integration . (Agency Priority Goal)
2014 2015 2016 2017 2018 2019None before FY 2018 Green Green
FY 2019 Annual Performance Indicator
PS-19-7: Deliver Mars 2020 instrument payload to Assembly, Test, and Launch Operations (ATLO).
Green
FY 2020–2021 Performance Plan
No performance goal after FY 2019. New perfor-mance goals for Strategic Objective 1.1 are on page 49.
FY 2019 Performance Progress
NASA achieved both the FY 2019 milestone and the FY 2018–2019 agency priority goal for the Mars 2020 mission. The mission is on schedule to launch in summer 2020, sending a rover to Mars to search for habitable conditions and signs of past microbial life.
On July 1, 2019, the instrument payload flight models were delivered to the Jet Propulsion Laboratory in Pasadena, California. By the end of the fiscal year, all of the instruments had been
integrated into the Mars 2020 rover and test-ing was completed. Instruments included the SuperCam camera, laser, and spectrometers; the Scanning Habitable Environments with Raman and Luminescence for Organics and Chemicals (SHERLOC) science instrument; the Planetary Instrument for X-ray Lithochemistry (PIXL); and a percussive drill and coring mechanism.
During the fiscal year, Mars 2020 also received other critical components. In June, engineers attached the remote sensing mast. The mast will provide a high perch for the several instruments, including SuperCam. The rover’s suspension and wheels (watch a video), as well as a seven-foot robotic arm (watch a video), also were added in June. In late August, the twin-rotor, solar-powered Mars Helicopter was attached to the belly of the rover.
The Planetary Science Division, part of the Science Mission Directorate, studies and explores the solar system to better understand its history, compo-sition, and the distribution of life within it. The division also identifies and characterizes objects in the solar system that pose threats to Earth or offer resources for human exploration .
Engineers at the Jet Propulsion Laboratory attach the bit carousel, which lies at the heart of the Mars 2020’s Sample Caching System, to the front end of the rover on August 5, 2019. The carousel contains the tools that the coring drill will use to sample the Martian surface and is the gateway through which the samples will enter the rover for assessment and processing. Photo credit: NASA/JPL-Caltech
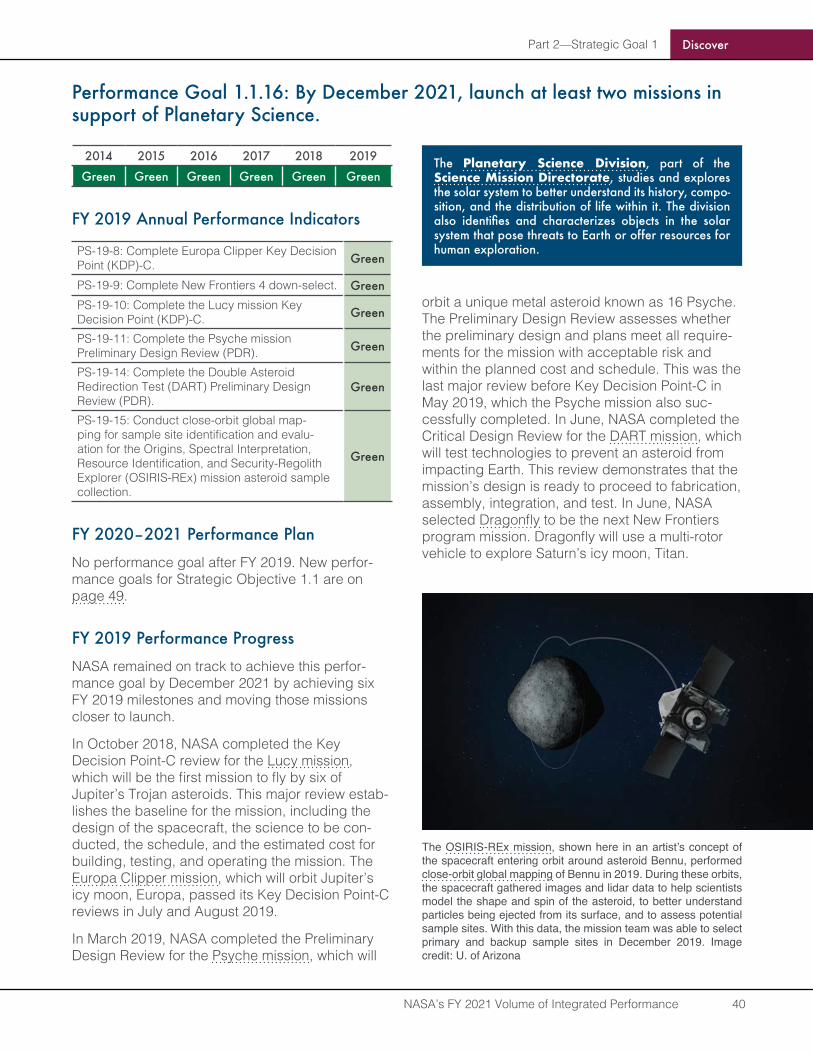
Part 2—Strategic Goal 1 Discover
NASA’s FY 2021 Volume of Integrated Performance 40
Performance Goal 1 .1 .16: By December 2021, launch at least two missions in support of Planetary Science .
2014 2015 2016 2017 2018 2019
Green Green Green Green Green Green
FY 2019 Annual Performance Indicators
PS-19-8: Complete Europa Clipper Key Decision Point (KDP)-C. Green
PS-19-9: Complete New Frontiers 4 down-select. GreenPS-19-10: Complete the Lucy mission Key Decision Point (KDP)-C. Green
PS-19-11: Complete the Psyche mission Preliminary Design Review (PDR). Green
PS-19-14: Complete the Double Asteroid Redirection Test (DART) Preliminary Design Review (PDR).
Green
PS-19-15: Conduct close-orbit global map-ping for sample site identification and evalu-ation for the Origins, Spectral Interpretation, Resource Identification, and Security-Regolith Explorer (OSIRIS-REx) mission asteroid sample collection.
Green
FY 2020–2021 Performance Plan
No performance goal after FY 2019. New perfor-mance goals for Strategic Objective 1.1 are on page 49.
FY 2019 Performance Progress
NASA remained on track to achieve this perfor-mance goal by December 2021 by achieving six FY 2019 milestones and moving those missions closer to launch.
In October 2018, NASA completed the Key Decision Point-C review for the Lucy mission, which will be the first mission to fly by six of Jupiter’s Trojan asteroids. This major review estab-lishes the baseline for the mission, including the design of the spacecraft, the science to be con-ducted, the schedule, and the estimated cost for building, testing, and operating the mission. The Europa Clipper mission, which will orbit Jupiter’s icy moon, Europa, passed its Key Decision Point-C reviews in July and August 2019.
In March 2019, NASA completed the Preliminary Design Review for the Psyche mission, which will
orbit a unique metal asteroid known as 16 Psyche. The Preliminary Design Review assesses whether the preliminary design and plans meet all require-ments for the mission with acceptable risk and within the planned cost and schedule. This was the last major review before Key Decision Point-C in May 2019, which the Psyche mission also suc-cessfully completed. In June, NASA completed the Critical Design Review for the DART mission, which will test technologies to prevent an asteroid from impacting Earth. This review demonstrates that the mission’s design is ready to proceed to fabrication, assembly, integration, and test. In June, NASA selected Dragonfly to be the next New Frontiers program mission. Dragonfly will use a multi-rotor vehicle to explore Saturn’s icy moon, Titan.
The Planetary Science Division, part of the Science Mission Directorate, studies and explores the solar system to better understand its history, compo-sition, and the distribution of life within it. The division also identifies and characterizes objects in the solar system that pose threats to Earth or offer resources for human exploration .
The OSIRIS-REx mission, shown here in an artist’s concept of the spacecraft entering orbit around asteroid Bennu, performed close-orbit global mapping of Bennu in 2019. During these orbits, the spacecraft gathered images and lidar data to help scientists model the shape and spin of the asteroid, to better understand particles being ejected from its surface, and to assess potential sample sites. With this data, the mission team was able to select primary and backup sample sites in December 2019. Image credit: U. of Arizona
Part 2—Strategic Goal 1 Discover
NASA’s FY 2021 Volume of Integrated Performance 41
Performance Goal 1.1.17: Demonstrate progress in advancing the understand-ing of changes in Earth’s radiation balance, air quality, and the ozone layer that result from changes in atmospheric composition .
2014 2015 2016 2017 2018 2019
Green Green Green Green Green Green
FY 2019 Annual Performance Indicators
ES-19-1: As determined by the Earth Science Advisory Committee (ESAC), demonstrate planned progress in advancing the understand-ing of changes in Earth’s radiation balance, air quality, and the ozone layer that result from changes in atmospheric composition.
Green
FY 2020–2021 Performance Plan
No performance goal after FY 2019. New perfor-mance goals for Strategic Objective 1.1 are on page 49.
FY 2019 Performance Progress
The Earth Science Advisory Committee determined in November 2019 that NASA remained on track to achieve this performance goal. Below are exam-ples of the progress reported in FY 2019.
A comprehensive analysis of carbon dioxide emissions in Boston and surrounding regions established the template for monitoring and mea-suring fossil fuel emission from large urbanized areas by combining extensive data from sensors on the ground, in aircraft, and from satellites with inverse modeling. It introduced new “big-data” approaches to determine actual emissions in an urban area, including spatial and temporal distribu-tions. The analysis lays the groundwork for Orbiting Carbon Observatory (OCO)-3 measurements of urban emissions.
A recent report estimated the number of asthma emergency room visits and new onset asthma cases globally attributable to fine particulate mat-ter, ozone, and nitrogen dioxide concentrations. Estimates of global 2015 surface nitrogen diox-ide were derived from Aura satellite observations and the Goddard Space Flight Center’s chemi-
cal transport model. The authors estimated that between 9 and 23 million asthma emergency room visits globally in 2015 were attributable to ozone and between 5 and 10 million were attributable to particulate matter.
A study combined satellite-based emissions of sulfur dioxide for large sources with a bottom-up inventory derived from reported fossil fuel com-bustion for smaller sources to construct a new “merged” inventory. This new merged emission database can be used on its own to capture the spatial and temporal variations in sulfur dioxide emissions and to support climate and air quality modeling.
The Earth Science Division, part of NASA’s Science Mission Directorate, delivers the technology, exper-tise, and global observations that help researchers map the connections between Earth’s vital processes and the effects of ongoing natural and human-caused changes .
Part 2—Strategic Goal 1 Discover
NASA’s FY 2021 Volume of Integrated Performance 42
Performance Goal 1.1.18: Demonstrate progress in improving the capability to predict weather and extreme weather events.
2014 2015 2016 2017 2018 2019
Green Green Green Green Green Green
FY 2019 Annual Performance Indicators
ES-19-2: As determined by the Earth Science Advisory Committee (ESAC), demonstrate planned progress in improving the capability to predict weather and extreme weather events.
Green
FY 2020–2021 Performance Plan
No performance goal after FY 2019. New perfor-mance goals for Strategic Objective 1.1 are on page 49.
FY 2019 Performance Progress
The Earth Science Advisory Committee determined in November 2019 that NASA remained on track to achieve this performance goal. Below are exam-ples of the progress reported in FY 2019.
The international Global Precipitation Measurement (GPM) satellite mission, which completed five years on orbit in February 2019, has become the main source of precipitation data since the end of NASA’s Tropical Rainfall Measuring Mission (TRMM) in 2015. Researchers evaluated the performance of six commonly used precipitation products, including the Integrated Multi-satellite Retrievals for GPM (IMERG) and TRMM products, in several heavy-rain-producing atmospheric river events in California in January and February 2017. They found that IMERG correlated best with rain gauge observations for both the detection and quantification of precipitation.
A recent study assessed the impact of assimilating GPM Microwave Imager (GMI) clear-sky radiance on the track and intensity forecasts of two Atlantic hurricanes during the 2015 and 2016 hurricane seasons using the Hurricane Weather Research and Forecasting (HWRF) model. Resulting data show that assimilating GMI clear-sky radiance, when it does not overlap with overpasses of other microwave sounders, can improve forecasts of both temperature, humidity, geopotential height, and wind field, which in turn lead to a more realistic
hurricane inner-core structure and better forecasts of the hurricane path.
NASA’s Short-term Prediction Research and Transition (SPoRT) Center, which seeks to improve short-term regional weather forecasts by transition-ing observations and capabilities to the operational weather community, has incorporated retrieved soil moisture observations from NASA’s Soil Moisture Active/Passive (SMAP) mission into an offline version of the NASA Land Information System (LIS). They continue to tune the model to improve impacts. The SPoRT team also began developing an Alaska-based scheme to understand soil mois-ture variability during the wildfire season to aid the Alaska Fire Service and their partners.
The Earth Science Division, part of NASA’s Science Mission Directorate, delivers the technology, exper-tise, and global observations that help researchers map the connections between Earth’s vital processes and the effects of ongoing natural and human-caused changes .
Part 2—Strategic Goal 1 Discover
NASA’s FY 2021 Volume of Integrated Performance 43
Performance Goal 1 .1 .19: Demonstrate progress in detecting and predicting changes in Earth’s ecosystems and biogeochemical cycles, including land cov-er, biodiversity, and the global carbon cycle.
2014 2015 2016 2017 2018 2019
Green Green Green Green Green Green
FY 2019 Annual Performance Indicators
ES-19-3: As determined by the Earth Science Advisory Committee (ESAC), demonstrate planned progress in detecting and predicting changes in Earth’s ecosystems and biogeo-chemical cycles, including land cover, biodiver-sity, and the global carbon cycle.
Green
FY 2020–2021 Performance Plan
No performance goal after FY 2019. New perfor-mance goals for Strategic Objective 1.1 are on page 49.
FY 2019 Performance Progress
The Earth Science Advisory Committee determined in November 2019 that NASA remained on track to achieve this performance goal. Below are exam-ples of the progress reported in FY 2019.
Researchers used airborne lidar data to map forest aboveground biomass at high spatial resolution over Maryland, Pennsylvania, and Delaware (with a total area of 157,865 square kilometers) by linking airborne lidar and field data with machine learning algorithms. The lidar-derived biomass maps provided an estimate of total aboveground biomass (approximately 680 teragrams of carbon) over this region. These data were integrated into an ecological modeling framework to estimate the carbon sequestration potential (the ability to remove carbon from the atmosphere and store it) across the state of Maryland. They estimated the forest above-ground carbon sequestration poten-tial of Maryland to be 204.1 teragrams of carbon, nearly double the current stock in the state. The time needed to reach this potential was estimated to be 228 years, with 50 percent of the gap being realized in 80 years. These results imply a large statewide potential for future carbon sequestration from afforestation and reforestation activities in Maryland.
Researchers used tree cover information from Landsat and the Moderate Resolution Imaging Spectroradiometer (MODIS), as well as topogra-phy from the Shuttle Radar Topography Mission (SRTM), to model the distribution and vulnerabil-ity of more than 19,000 species of amphibians, mammals, and birds across the globe. These relationships enabled prediction of future extinction risk using a range of land-use change scenarios derived from the Shared Socioeconomic Pathways and Representative Concentration Pathways scenarios to the year 2070. Substantial declines in suitable habitat were identified for species world-wide, with approximately 1,700 species expected to become imperiled due to land-use change alone.
The Earth Science Division, part of NASA’s Science Mission Directorate, delivers the technology, exper-tise, and global observations that help researchers map the connections between Earth’s vital processes and the effects of ongoing natural and human-caused changes .
Part 2—Strategic Goal 1 Discover
NASA’s FY 2021 Volume of Integrated Performance 44
Performance Goal 1 .1 .20: Demonstrate progress in enabling better assessment and management of water quality and quantity to accurately predict how the global water cycle evolves in response to climate change.
2014 2015 2016 2017 2018 2019
Green Green Green Green Green Green
FY 2019 Annual Performance Indicators
ES-19-4: As determined by the Earth Science Advisory Committee (ESAC), demonstrate planned progress in enabling better assessment and management of water quality and quantity to accurately predict how the global water cycle evolves in response to climate change.
Green
FY 2020–2021 Performance Plan
No performance goal after FY 2019. New perfor-mance goals for Strategic Objective 1.1 are on page 49.
FY 2019 Performance Progress
The Earth Science Advisory Committee determined in November 2019 that NASA remained on track to achieve this performance goal. Below are exam-ples of the progress reported in FY 2019.
Data from the Gravity Recovery and Climate Experiment (GRACE) mission has been unveiling Earth’s changing freshwater landscape, which has implications for food security. Global estimates of GRACE trends suggest increasing water storage in high and low latitudes, with decreased storage in mid-latitudes. Of the world’s 37 largest aquifer systems, 13 were found to be suffering critical depletion during the GRACE observational period, with many linked to anthropogenic activities. Additionally, the integration of GRACE total water storage data within a land-data assimilation sys-tem has enabled improvement in the accuracy of drought tools, such as the U.S. Drought Monitor.
Convective clouds produce a significant pro-portion of the global precipitation and play an important role in the energy and water cycles. Using observational evidence from CloudSat and Cloud-Aerosol Lidar and Infrared Pathfinder Satellite Observation (CALIPSO) mission, research-ers showed that aerosols can inhibit or invigorate convection, depending on aerosol type and con-
centration. On average, elevated smoke aerosol tends to suppress convection and results in lower cloud altitudes than clean clouds. In a light smoke environment, aerosols suppress deep convec-tion, producing lower cloud altitudes. If there is a lot of smoke, shallow convection can be totally shut down, but subsequent deep convection can become even stronger due to the unconsumed convective available potential energy, or CAPE. The reverse is true for aerosols from human-made pollution, in which lightly polluted air invigorates convection and promotes higher cloud altitudes. Dust aerosol effects differ from place to place in South America, Central Africa, and Southeast Asia.
The Earth Science Division, part of NASA’s Science Mission Directorate, delivers the technology, exper-tise, and global observations that help researchers map the connections between Earth’s vital processes and the effects of ongoing natural and human-caused changes .
Part 2—Strategic Goal 1 Discover
NASA’s FY 2021 Volume of Integrated Performance 45
Performance Goal 1.1.21: Demonstrate progress in improving the ability to pre-dict climate changes by better understanding the roles and interactions of the ocean, atmosphere, land, and ice in the climate system .
2014 2015 2016 2017 2018 2019
Green Green Green Green Green Green
FY 2019 Annual Performance Indicators
ES-19-5: As determined by the Earth Science Advisory Committee (ESAC), demonstrate planned progress in improving the ability to pre-dict climate changes by better understanding the roles and interactions of the ocean, atmo-sphere, land, and ice in the climate system.
Green
FY 2020–2021 Performance Plan
No performance goal after FY 2019. New perfor-mance goals for Strategic Objective 1.1 are on page 49.
FY 2019 Performance Progress
The Earth Science Advisory Committee determined in November 2019 that NASA remained on track to achieve this performance goal. Below are exam-ples of the progress reported in FY 2019.
Scientists analyzed a “marine heatwave” between 2013 and 2015 over the northeast Pacific Ocean, characterized by the highest surface temperatures ever recorded in a swath from near the Gulf of Alaska to off the coast of Baja California. Satellite data show that the heatwave was associated with a record decrease in the typically high cloudiness over an area of the Pacific off Baja California that is roughly half the size of the contiguous United States. Such a deficit in cloud cover coincided with a large increase in the amount of sunlight absorbed by the ocean surface, resulting in extremely warm temperatures.
Researchers extended the Arctic sea ice thick-ness, volume, and multiyear ice records by comparing the pre-satellite submarine data from 1958–1976 to the recent Cryosat-2 measurements from 2011–2018. The results show that sea ice thickness at the end of the melt season decreased by 66 percent over the six-decade period. Between 1999 and 2017, multiyear ice cover has decreased by 50 percent and now covers less
than one third of the Arctic Ocean. Another study highlighted the dramatic reversal in Antarctic sea ice extent trends seen from 2014 to 2017. Previous to 2014, Antarctic sea ice extent had substantial interannual variability and overall small positive trend. From 2014 to 2017, Antarctic sea ice extent decreased to record low values and a minimum was reached in 2017. The rate of change during the four-year period exceeds the rate of change in any other four-year period from 1978 to 2018 in either the Arctic or the Southern Ocean.
The Earth Science Division, part of NASA’s Science Mission Directorate, delivers the technology, exper-tise, and global observations that help researchers map the connections between Earth’s vital processes and the effects of ongoing natural and human-caused changes .
Part 2—Strategic Goal 1 Discover
NASA’s FY 2021 Volume of Integrated Performance 46
Performance Goal 1 .1 .22: Demonstrate progress in characterizing the dynam-ics of Earth’s surface and interior, improving the capability to assess and respond to natural hazards and extreme events.
2014 2015 2016 2017 2018 2019
Green Green Green Green Green Green
FY 2019 Annual Performance Indicators
ES-19-6: As determined by the Earth Science Advisory Committee (ESAC), demonstrate planned progress in characterizing the dynam-ics of Earth’s surface and interior, improving the capability to assess and respond to natural hazards and extreme events.
Green
FY 2020–2021 Performance Plan
No performance goal after FY 2019. New perfor-mance goals for Strategic Objective 1.1 are on page 49.
FY 2019 Performance Progress
The Earth Science Advisory Committee determined in November 2019 that NASA remained on track to achieve this performance goal. Below are exam-ples of the progress reported in FY 2019.
A study integrated satellite-detections of ground deformation, sulfur dioxide emissions, and ther-mal features, of which each contributed unique detections, validating a multi-sensor approach. The study found that most volcanic eruptions in the past few decades were measurable from satellites, and those not detected were associated with low volcano explosivity index eruptions and occurred in the earlier decades of remote sensing (pre-2000) when detection thresholds were high.
Researchers used interferometric synthetic aper-ture radar, or InSAR (a radar technique used to map ground deformation) and a simple hydrolog-ical model to characterize eight years of stable sliding of the Mud Creek landslide in California prior to its rapid acceleration and catastrophic failure on May 20, 2017. Their results suggest a large increase in pore-fluid pressure (the pressure created by groundwater held in the tiny pores in rock or between particles of soil) occurred during a shift from historic drought to record rainfall that triggered a large increase in velocity and drove
slip localization, overcoming the stabilizing mecha-nisms that had previously prevented landslides.
Following the magnitude 8.1 Samoa–Tonga earthquake in September 2009, investigators used Gravity Recovery and Climate Experiment (GRACE) mission and Global Positioning System (GPS) data to detect large‐scale gravity increases and ongoing subsidence (8–16 millimeters a year). The greatest post-seismic subsidence was observed for American Samoa, resulting in a relative sea level rise rate about five times faster than the global average sea level rise, which was 3.4 millimeters per year.
The Earth Science Division, part of NASA’s Science Mission Directorate, delivers the technology, exper-tise, and global observations that help researchers map the connections between Earth’s vital processes and the effects of ongoing natural and human-caused changes .
Part 2—Strategic Goal 1 Discover
NASA’s FY 2021 Volume of Integrated Performance 47
Performance Goal 1 .1 .23: Further the use of Earth system science research to inform decisions and provide benefits to society.
2014 2015 2016 2017 2018 2019
Green Green Green Green Green Green
FY 2019 Annual Performance Indicators
ES-19-7: Advance at least 40 percent of Earth science applications projects one Applications Readiness Level.
Green
ES-19-8: Maintain a high level of customer sat-isfaction, as measured by exceeding the most recently available Federal Government average rating of the American Customer Satisfaction Index.
Green
FY 2020–2021 Performance Plan
No performance goal after FY 2019. New perfor-mance goals for Strategic Objective 1.1 are on page 49.
FY 2019 Performance Progress
NASA remained on track to achieve this perfor-mance goal. Advanced uses of NASA data made possible by Earth Science applications projects improved decisions, economic growth, and qual-ity of life. Below are examples of the progress reported in FY 2019.• RTI International and partners have assim-
ilated Global Precipitation Measurement (GPM) mission and other satellite data to deploy and operationalize a forecast system, which provides improved water supply forecasts for the Colorado River basin for better decision-making.
• Through NASA support of U.S. humani-tarian interests, Kenya’s Crop Insurance Program used Landsat-based crop masks to expand their coverage, enhancing economic resilience of affected farm-ers and reducing costs 70 percent.
• The Sargassum Watch System uses data from Landsat and Moderate Resolution Imaging Spectroradiometer, or MODIS, to forecast Sargassum seaweed blooms, which can grow to form harmful mats hundreds of miles long, for the Caribbean. The investment
industry is using Sargassum Watch System to forecast demand in hotels and flights.
• The State of Missouri used flood products derived from MODIS, Landsat, and other satellites to survey the extent and crop dam-age caused by the 2019 Midwest floods.
• The Federal Emergency Management Agency, the U.S. National Guard, South Carolina, and others used NASA data for situational awareness during Hurricane Dorian, and satellite-based damage and flood-proxy maps supported the deployment of rapid damage assessment teams in the Bahamas.
• South Dakota’s Department of Health oper-ationalized a previously-piloted, satel-lite-enhanced West Nile Virus model, which provides weekly forecasts at the county level and seasonal risk forecasts by assimilating data from MODIS and the North American Land Data Assimilation System. Watch a video on South Dakota’s use of NASA sat-ellites to forecast the risk of West Nile.
NASA conducted 66 trainings on uses of its Earth observations, with over 17,000 instances of par-ticipation from over 150 countries and all 50 U.S. states.
The Applied Science Program, part of NASA’s Science Mission Directorate, enables uses of NASA Earth science data in organizations’ policy, busi-ness, and management decisions .
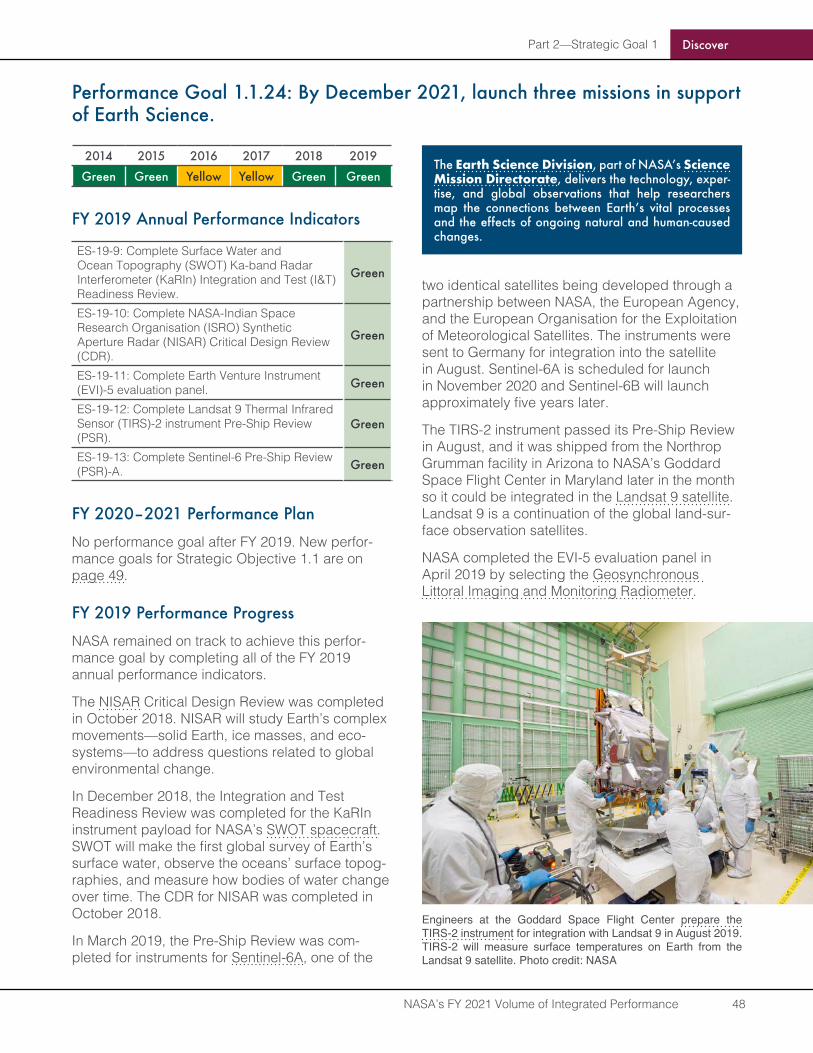
Part 2—Strategic Goal 1 Discover
NASA’s FY 2021 Volume of Integrated Performance 48
Performance Goal 1 .1 .24: By December 2021, launch three missions in support of Earth Science .
2014 2015 2016 2017 2018 2019
Green Green Yellow Yellow Green Green
FY 2019 Annual Performance Indicators
ES-19-9: Complete Surface Water and Ocean Topography (SWOT) Ka-band Radar Interferometer (KaRIn) Integration and Test (I&T) Readiness Review.
Green
ES-19-10: Complete NASA-Indian Space Research Organisation (ISRO) Synthetic Aperture Radar (NISAR) Critical Design Review (CDR).
Green
ES-19-11: Complete Earth Venture Instrument (EVI)-5 evaluation panel. Green
ES-19-12: Complete Landsat 9 Thermal Infrared Sensor (TIRS)-2 instrument Pre-Ship Review (PSR).
Green
ES-19-13: Complete Sentinel-6 Pre-Ship Review (PSR)-A. Green
FY 2020–2021 Performance Plan
No performance goal after FY 2019. New perfor-mance goals for Strategic Objective 1.1 are on page 49.
FY 2019 Performance Progress
NASA remained on track to achieve this perfor-mance goal by completing all of the FY 2019 annual performance indicators.
The NISAR Critical Design Review was completed in October 2018. NISAR will study Earth’s complex movements—solid Earth, ice masses, and eco-systems—to address questions related to global environmental change.
In December 2018, the Integration and Test Readiness Review was completed for the KaRIn instrument payload for NASA’s SWOT spacecraft. SWOT will make the first global survey of Earth’s surface water, observe the oceans’ surface topog-raphies, and measure how bodies of water change over time. The CDR for NISAR was completed in October 2018.
In March 2019, the Pre-Ship Review was com-pleted for instruments for Sentinel-6A, one of the
two identical satellites being developed through a partnership between NASA, the European Agency, and the European Organisation for the Exploitation of Meteorological Satellites. The instruments were sent to Germany for integration into the satellite in August. Sentinel-6A is scheduled for launch in November 2020 and Sentinel-6B will launch approximately five years later.
The TIRS-2 instrument passed its Pre-Ship Review in August, and it was shipped from the Northrop Grumman facility in Arizona to NASA’s Goddard Space Flight Center in Maryland later in the month so it could be integrated in the Landsat 9 satellite. Landsat 9 is a continuation of the global land-sur-face observation satellites.
NASA completed the EVI-5 evaluation panel in April 2019 by selecting the Geosynchronous Littoral Imaging and Monitoring Radiometer.
The Earth Science Division, part of NASA’s Science Mission Directorate, delivers the technology, exper-tise, and global observations that help researchers map the connections between Earth’s vital processes and the effects of ongoing natural and human-caused changes .
Engineers at the Goddard Space Flight Center prepare the TIRS-2 instrument for integration with Landsat 9 in August 2019. TIRS-2 will measure surface temperatures on Earth from the Landsat 9 satellite. Photo credit: NASA
Part 2—Strategic Goal 1 Discover
NASA’s FY 2021 Volume of Integrated Performance 49
FY 2020–2021 Performance Plan: New Performance Goals
1 .1 .1: Demonstrate progress in exploring and advancing understanding of the physical processes and connections of the Sun, space, and planetary environments throughout the solar system.
NASA portfolio assessment guided by an annual external expert review determination of contributing programs, missions, and research
Fiscal Year 2020 2021
Target Significant progress demonstrated
Significant progress demonstrated
1 .1 .2: Demonstrate progress in exploring and probing the origin, evolution, and destiny of the galaxies, stars, and planets that make up the universe.
NASA portfolio assessment guided by an annual external expert review determination of contributing programs, missions, and research
Fiscal Year 2020 2021
Target Significant progress demonstrated
Significant progress demonstrated
1.1.3: Demonstrate progress in exploring, observing, and understanding objects in the solar system in order to understand how they formed, operate, interact, and evolve.
NASA portfolio assessment guided by an annual external expert review determination of contributing programs, missions, and research
Fiscal Year 2020 2021
Target Significant progress demonstrated
Significant progress demonstrated
1.1.4: Demonstrate progress in discovering and studying planets around other stars .
NASA portfolio assessment guided by an annual external expert review determination of contributing programs, missions, and research
Fiscal Year 2020 2021
Target Significant progress demonstrated
Significant progress demonstrated
Areas for external review panel determination in FY 20201. Annual external expert review determination of
programs, missions, and published, peer-reviewed research contributing to Performance Goal 1.1.4.
Areas for external review panel determination in FY 20211. Annual external expert review determination of
programs, missions, and published, peer-reviewed research contributing to Performance Goal 1.1.4.
2. Complete Transiting Exoplanet Survey Satellite (TESS) mission success criteria.
1.1.5: Demonstrate progress in improving understanding of the origin and evolution of life on Earth to guide the search for life elsewhere, exploring and finding locations where life could have existed or could exist today, and exploring whether planets around other stars could harbor life .
NASA portfolio assessment guided by an annual external expert review determination of contributing programs, missions, and research
Fiscal Year 2020 2021
Target Significant progress demonstrated
Significant progress demonstrated
1.1.6: Demonstrate progress in developing the capability to detect and knowledge to predict extreme conditions in space to protect life and society and to safeguard human and robotic explorers beyond Earth .
NASA portfolio assessment guided by an annual external expert review determination of contributing programs, missions, and research
Fiscal Year 2020 2021
Target Significant progress demonstrated
Significant progress demonstrated
Areas for external review panel determination in FY 20201 Annual external expert review determination of
programs, missions, and published, peer-reviewed research contributing to Performance Goal 1.1.6.
2 External expert review panel determination indicating whether expectations for research program have been fully met or exceeded in advancing scientific understanding of background solar wind, solar wind structures, and coronal mass ejections, which can be integrated into key models used to predict the arrival time and impact of space storms at Earth.
Areas for external review panel determination in FY 20211. Annual external expert review determination of
programs, missions, and published, peer-reviewed research contributing to Performance Goal 1.1.6.
Part 2—Strategic Goal 1 Discover
NASA’s FY 2021 Volume of Integrated Performance 50
2. External expert review panel determination indicating whether expectations for research program have been fully met or exceeded in advancing scientific understanding of background solar wind, solar wind structures, and coronal mass ejections, which can be integrated into key models used to predict the arrival time and impact of space storms at Earth.
1 .1 .7: Demonstrate progress in identifying, characterizing, and predicting objects in the solar system that pose threats to Earth or offer resources for human exploration .
NASA portfolio assessment guided by an annual external expert review determination of contributing programs, missions, and research
Fiscal Year 2020 2021
Target Significant progress demonstrated
Significant progress demonstrated
Areas contributing to performance goal in FY 20201. Annual external expert review of programs, missions,
and published, peer-reviewed research contributing to Performance Goal 1.1.7.
2. Identify and catalogue 9500 near-Earth asteroids that are 140 meters in diameter or larger.
Areas contributing to performance goal in FY 20211. Annual external expert review of programs, missions,
and published, peer-reviewed research contributing to Performance Goal 1.1.7.
2. Identify and catalogue near-Earth asteroids that are 140 meters in diameter or larger.
1.1.8: Demonstrate progress in characterizing the behavior of the Earth system, including its various components and the naturally-occurring and human-induced forcings that act upon it .
NASA portfolio assessment guided by an annual external expert review determination of contributing programs, missions, and research
Fiscal Year 2020 2021
Target Significant progress demonstrated
Significant progress demonstrated
Areas contributing to performance goal in FY 20201. Annual external expert review of programs, missions,
and published, peer-reviewed research contributing to Performance Goal 1.1.8.
2. Complete the mission success criteria for Ice, Cloud and land Elevation Satellite (ICESat)-2.
Areas contributing to performance goal in FY 20211. Annual external expert review of programs, missions,
and published, peer-reviewed research contributing to Performance Goal 1.1.8.
2. Complete Gravity Recovery and Climate Experiment Follow-On (GRACE-FO) mission success criteria.
1 .1 .9: Demonstrate progress in enhancing understanding of the interacting processes that control the behavior of Earth system, and in utilizing the enhanced knowledge to improve predictive capability .
NASA portfolio assessment guided by an annual external expert review determination of contributing programs, missions, and research
Fiscal Year 2020 2021
Target Significant progress demonstrated
Significant progress demonstrated
Areas for external review panel determination in FY 20201. Annual external expert review of programs, missions,
and published, peer-reviewed research contributing to Performance Goal 1.1.9.
2. 40% of Earth science applications projects advance one Applications Readiness Level (ARL) with 3 proj-ects advance to ARL 8 or 9.
3. Customer satisfaction rating for the Earth Observing System Data and Information System (EOSDIS) exceeds the most recently available Federal Government average rating of the American Customer Satisfaction Index.
Areas for external review panel determination in FY 20211. Annual external expert review of programs, missions,
and published, peer-reviewed research contributing to Performance Goal 1.1.9.
2. 40% of Earth science applications projects advance one Applications Readiness Level (ARL) with 3 proj-ects advance to ARL 8 or 9.
3. Customer satisfaction rating for the Earth Observing System Data and Information System (EOSDIS) exceeds the most recently available Federal Government average rating of the American Customer Satisfaction Index.
1.1.10: Achieve critical milestones of Science Mission Directorate major projects .
Number of critical milestones completed
Fiscal Year 2020 2021
Target 12 12
List of major projects critical milestones FY 20201. Complete Interstellar Mapping and Acceleration
Probe (IMAP) Key Decision Point (KDP)-B review.2. Complete the 2016 Medium Explorer (SPHEREx)
Announcement of Opportunity Key Decision Point (KDP)-C review.
3. Complete the Europa Clipper mission Critical Design Review (CDR).
Part 2—Strategic Goal 1 Discover
NASA’s FY 2021 Volume of Integrated Performance 51
4. Complete the Lucy mission Critical Design Review (CDR).
5. Launch the Mars 2020 mission.6. Complete the Psyche mission Critical Design Review
(CDR).7. Complete the Double Asteroid Redirection Test
(DART) mission Key Decision Point (KDP)-D review.8. Award the second Commercial Lunar Payload
Services (CLPS) mission task order.9. Complete the Landsat 9 Key Decision Point (KDP)-D
review.10. Complete the Sentinel-6A satellite Flight Acceptance
Review.11. Complete the Surface Water and Ocean Topography
(SWOT) System Integration Review (SIR).12. Complete the NASA-Indian Space Research
Organization (ISRO) Synthetic Aperture Radar (NISAR) System Integration Review (SIR).
List of major projects critical milestones FY 20211. Launch Sentinel-6A.2. Launch Landsat 9.3. Initiate Surface Water and Ocean Topography
(SWOT) mission Observatory Integration and Testing (I&T).
4. Land the Mars 2020 rover in the Jezero Crater, com-plete checkout, and begin surface operations.
5. Complete the Mars Sample Return mission Key Decision Point (KDP)-A.
6. Complete the Double Asteroid Redirection Test (DART) mission Pre-Ship Review (PSR).
7. Complete the Europa Clipper mission System Integration Review (SIR).
8. Complete the Psyche mission System Integration Review (SIR).
9. Complete the Lucy mission Pre-Environmental Review (PER).
10. Complete one Dragonfly mission instrument Preliminary Design Review (PDR).
11. Complete the Interstellar Mapping and Acceleration Probe (IMAP) Preliminary Design Review (PDR).
12. Complete the Spectro-Photometer for the History of the Universe, Epoch of Reionization and Ices Explorer (SPHEREx) Critical Design Review (CDR).
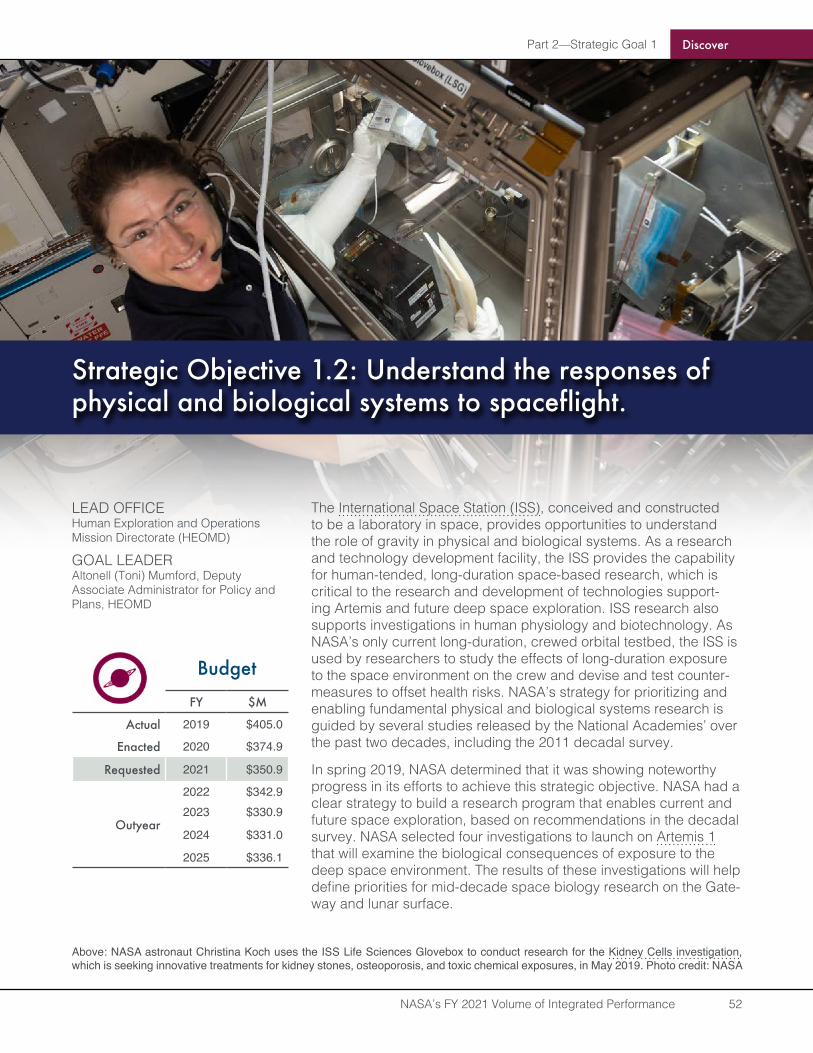
Part 2—Strategic Goal 1
NASA’s FY 2021 Volume of Integrated Performance 52
Discover
The International Space Station (ISS), conceived and constructed to be a laboratory in space, provides opportunities to understand the role of gravity in physical and biological systems. As a research and technology development facility, the ISS provides the capability for human-tended, long-duration space-based research, which is critical to the research and development of technologies support-ing Artemis and future deep space exploration. ISS research also supports investigations in human physiology and biotechnology. As NASA’s only current long-duration, crewed orbital testbed, the ISS is used by researchers to study the effects of long-duration exposure to the space environment on the crew and devise and test counter-measures to offset health risks. NASA’s strategy for prioritizing and enabling fundamental physical and biological systems research is guided by several studies released by the National Academies’ over the past two decades, including the 2011 decadal survey.
In spring 2019, NASA determined that it was showing noteworthy progress in its efforts to achieve this strategic objective. NASA had a clear strategy to build a research program that enables current and future space exploration, based on recommendations in the decadal survey. NASA selected four investigations to launch on Artemis 1 that will examine the biological consequences of exposure to the deep space environment. The results of these investigations will help define priorities for mid-decade space biology research on the Gate-way and lunar surface.
LEAD OFFICEHuman Exploration and Operations Mission Directorate (HEOMD)
GOAL LEADERAltonell (Toni) Mumford, Deputy Associate Administrator for Policy and Plans, HEOMD
Budget
FY $M
Actual 2019 $405.0
Enacted 2020 $374.9
Requested 2021 $350.9
Outyear
2022 $342.92023 $330.9
2024 $331.0
2025 $336.1
Above: NASA astronaut Christina Koch uses the ISS Life Sciences Glovebox to conduct research for the Kidney Cells investigation, which is seeking innovative treatments for kidney stones, osteoporosis, and toxic chemical exposures, in May 2019. Photo credit: NASA
Strategic Objective 1.2: Understand the responses of physical and biological systems to spaceflight .
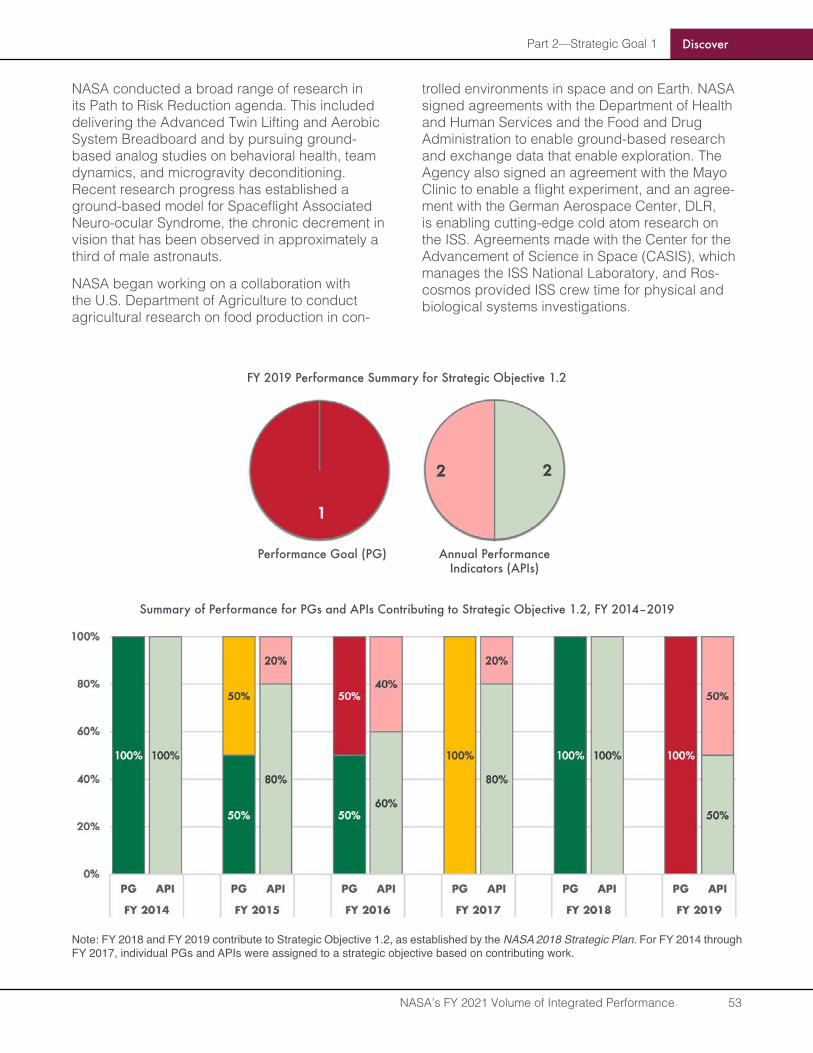
Part 2—Strategic Goal 1 Discover
NASA’s FY 2021 Volume of Integrated Performance 53
NASA conducted a broad range of research in its Path to Risk Reduction agenda. This included delivering the Advanced Twin Lifting and Aerobic System Breadboard and by pursuing ground-based analog studies on behavioral health, team dynamics, and microgravity deconditioning. Recent research progress has established a ground-based model for Spaceflight Associated Neuro-ocular Syndrome, the chronic decrement in vision that has been observed in approximately a third of male astronauts.
NASA began working on a collaboration with the U.S. Department of Agriculture to conduct agricultural research on food production in con-
trolled environments in space and on Earth. NASA signed agreements with the Department of Health and Human Services and the Food and Drug Administration to enable ground-based research and exchange data that enable exploration. The Agency also signed an agreement with the Mayo Clinic to enable a flight experiment, and an agree-ment with the German Aerospace Center, DLR, is enabling cutting-edge cold atom research on the ISS. Agreements made with the Center for the Advancement of Science in Space (CASIS), which manages the ISS National Laboratory, and Ros-cosmos provided ISS crew time for physical and biological systems investigations.
FY 2019 Performance Summary for Strategic Objective 1.2
Performance Goal (PG) Annual Performance Indicators (APIs)
Summary of Performance for PGs and APIs Contributing to Strategic Objective 1.2, FY 2014–2019
Note: FY 2018 and FY 2019 contribute to Strategic Objective 1.2, as established by the NASA 2018 Strategic Plan. For FY 2014 through FY 2017, individual PGs and APIs were assigned to a strategic objective based on contributing work.
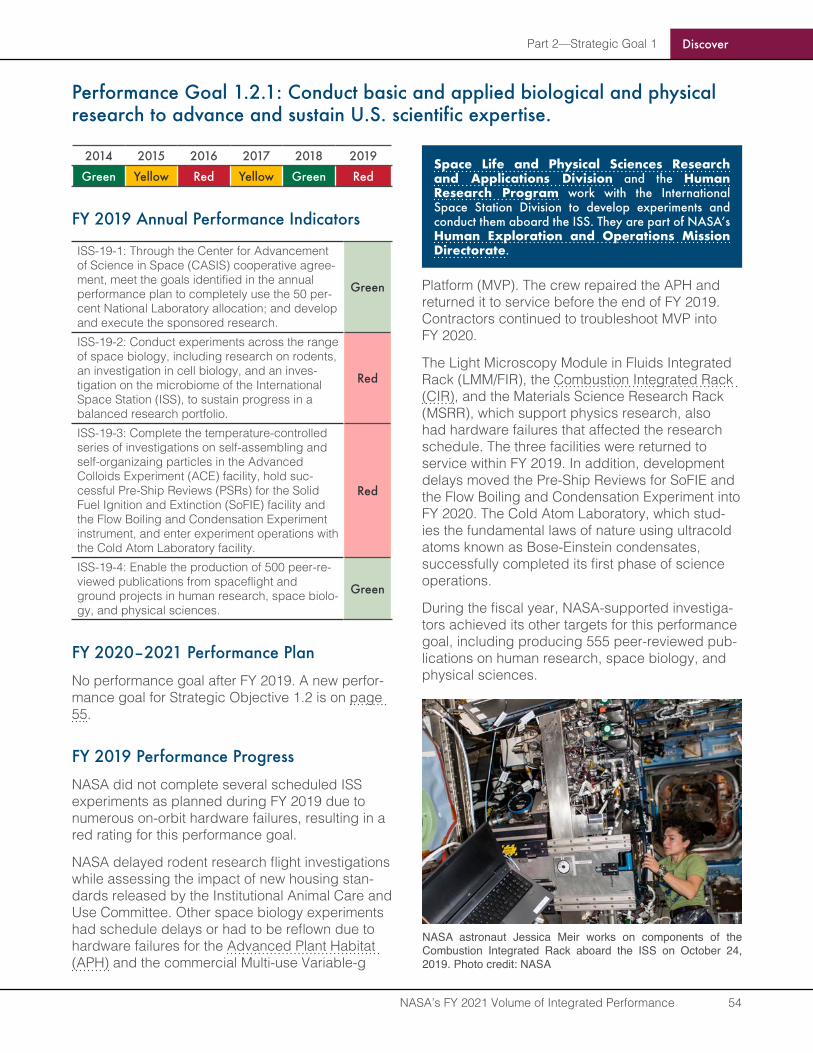
Part 2—Strategic Goal 1 Discover
NASA’s FY 2021 Volume of Integrated Performance 54
Performance Goal 1 .2 .1: Conduct basic and applied biological and physical research to advance and sustain U.S. scientific expertise.
2014 2015 2016 2017 2018 2019
Green Yellow Red Yellow Green Red
FY 2019 Annual Performance Indicators
ISS-19-1: Through the Center for Advancement of Science in Space (CASIS) cooperative agree-ment, meet the goals identified in the annual performance plan to completely use the 50 per-cent National Laboratory allocation; and develop and execute the sponsored research.
Green
ISS-19-2: Conduct experiments across the range of space biology, including research on rodents, an investigation in cell biology, and an inves-tigation on the microbiome of the International Space Station (ISS), to sustain progress in a balanced research portfolio.
Red
ISS-19-3: Complete the temperature-controlled series of investigations on self-assembling and self-organizaing particles in the Advanced Colloids Experiment (ACE) facility, hold suc-cessful Pre-Ship Reviews (PSRs) for the Solid Fuel Ignition and Extinction (SoFIE) facility and the Flow Boiling and Condensation Experiment instrument, and enter experiment operations with the Cold Atom Laboratory facility.
Red
ISS-19-4: Enable the production of 500 peer-re-viewed publications from spaceflight and ground projects in human research, space biolo-gy, and physical sciences.
Green
FY 2020–2021 Performance Plan
No performance goal after FY 2019. A new perfor-mance goal for Strategic Objective 1.2 is on page 55.
FY 2019 Performance Progress
NASA did not complete several scheduled ISS experiments as planned during FY 2019 due to numerous on-orbit hardware failures, resulting in a red rating for this performance goal.
NASA delayed rodent research flight investigations while assessing the impact of new housing stan-dards released by the Institutional Animal Care and Use Committee. Other space biology experiments had schedule delays or had to be reflown due to hardware failures for the Advanced Plant Habitat (APH) and the commercial Multi-use Variable-g
Platform (MVP). The crew repaired the APH and returned it to service before the end of FY 2019. Contractors continued to troubleshoot MVP into FY 2020.
The Light Microscopy Module in Fluids Integrated Rack (LMM/FIR), the Combustion Integrated Rack (CIR), and the Materials Science Research Rack (MSRR), which support physics research, also had hardware failures that affected the research schedule. The three facilities were returned to service within FY 2019. In addition, development delays moved the Pre-Ship Reviews for SoFIE and the Flow Boiling and Condensation Experiment into FY 2020. The Cold Atom Laboratory, which stud-ies the fundamental laws of nature using ultracold atoms known as Bose-Einstein condensates, successfully completed its first phase of science operations.
During the fiscal year, NASA-supported investiga-tors achieved its other targets for this performance goal, including producing 555 peer-reviewed pub-lications on human research, space biology, and physical sciences.
NASA astronaut Jessica Meir works on components of the Combustion Integrated Rack aboard the ISS on October 24, 2019. Photo credit: NASA
Space Life and Physical Sciences Research and Applications Division and the Human Research Program work with the International Space Station Division to develop experiments and conduct them aboard the ISS. They are part of NASA’s Human Exploration and Operations Mission Directorate .
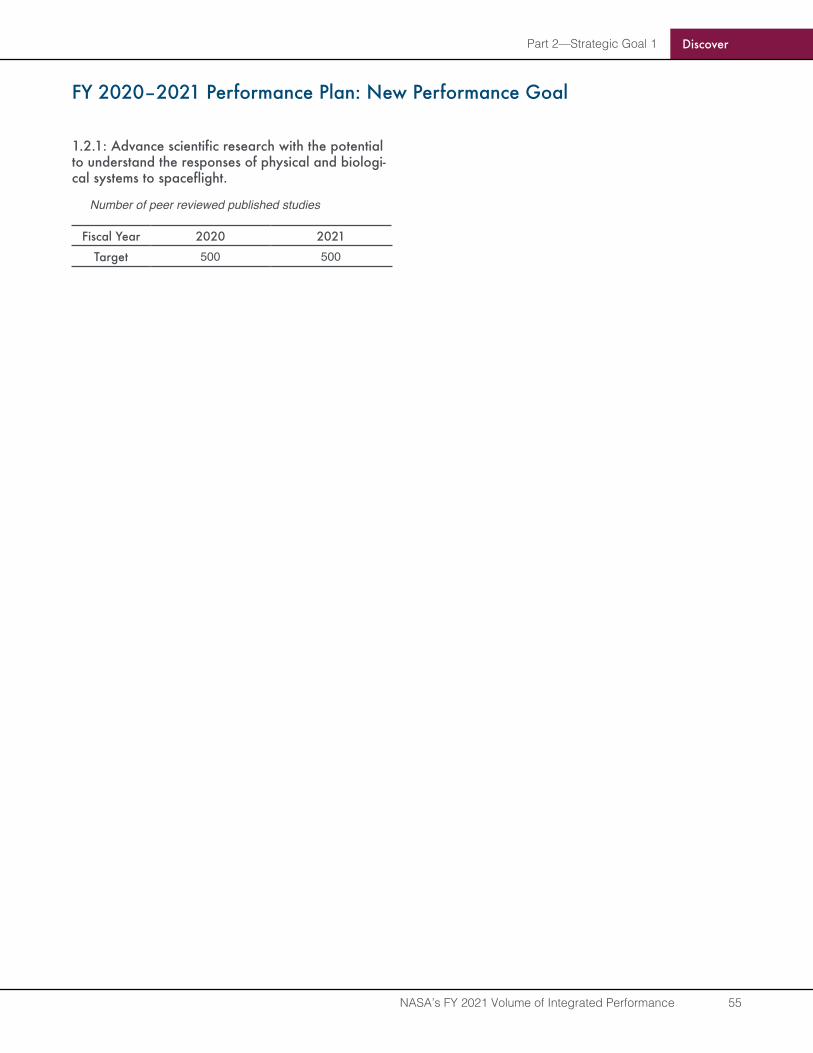
Part 2—Strategic Goal 1 Discover
NASA’s FY 2021 Volume of Integrated Performance 55
FY 2020–2021 Performance Plan: New Performance Goal
1.2.1: Advance scientific research with the potential to understand the responses of physical and biologi-cal systems to spaceflight .
Number of peer reviewed published studies
Fiscal Year 2020 2021
Target 500 500
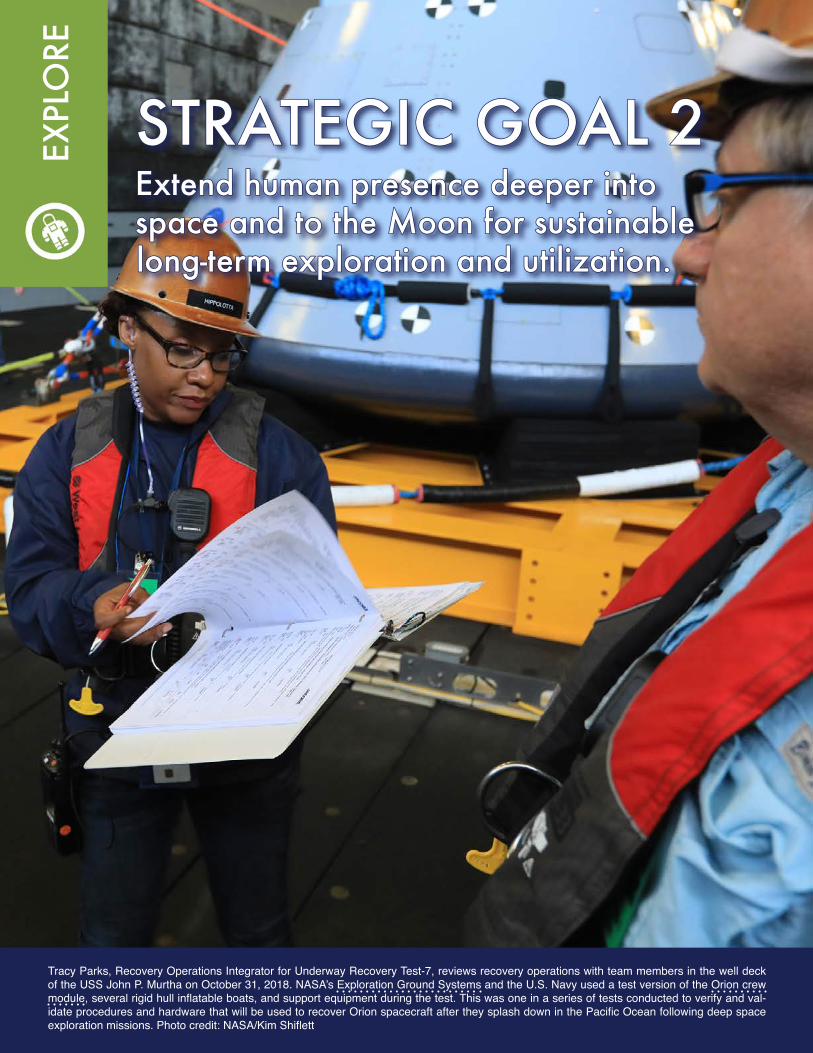
Tracy Parks, Recovery Operations Integrator for Underway Recovery Test-7, reviews recovery operations with team members in the well deck of the USS John P. Murtha on October 31, 2018. NASA’s Exploration Ground Systems and the U.S. Navy used a test version of the Orion crew module, several rigid hull inflatable boats, and support equipment during the test. This was one in a series of tests conducted to verify and val-idate procedures and hardware that will be used to recover Orion spacecraft after they splash down in the Pacific Ocean following deep space exploration missions. Photo credit: NASA/Kim Shiflett
EXPL
ORE
STRATEGIC GOAL 2STRATEGIC GOAL 2Extend human presence deeper into Extend human presence deeper into space and to the Moon for sustainable space and to the Moon for sustainable long-term exploration and utilization .long-term exploration and utilization .
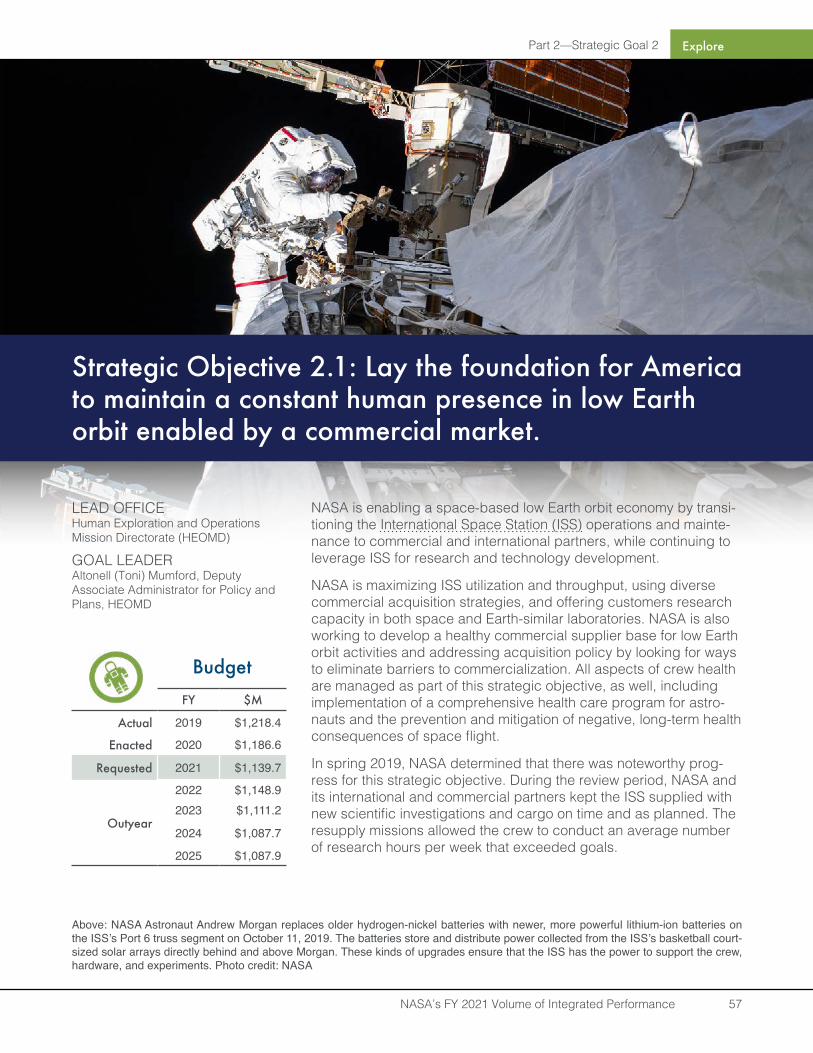
Part 2—Strategic Goal 2
NASA’s FY 2021 Volume of Integrated Performance 57
Explore
LEAD OFFICEHuman Exploration and Operations Mission Directorate (HEOMD)
GOAL LEADERAltonell (Toni) Mumford, Deputy Associate Administrator for Policy and Plans, HEOMD
BudgetFY $M
Actual 2019 $1,218.4
Enacted 2020 $1,186.6
Requested 2021 $1,139.7
Outyear
2022 $1,148.92023 $1,111.2
2024 $1,087.7
2025 $1,087.9
Above: NASA Astronaut Andrew Morgan replaces older hydrogen-nickel batteries with newer, more powerful lithium-ion batteries on the ISS’s Port 6 truss segment on October 11, 2019. The batteries store and distribute power collected from the ISS’s basketball court-sized solar arrays directly behind and above Morgan. These kinds of upgrades ensure that the ISS has the power to support the crew, hardware, and experiments. Photo credit: NASA
NASA is enabling a space-based low Earth orbit economy by transi-tioning the International Space Station (ISS) operations and mainte-nance to commercial and international partners, while continuing to leverage ISS for research and technology development.
NASA is maximizing ISS utilization and throughput, using diverse commercial acquisition strategies, and offering customers research capacity in both space and Earth-similar laboratories. NASA is also working to develop a healthy commercial supplier base for low Earth orbit activities and addressing acquisition policy by looking for ways to eliminate barriers to commercialization. All aspects of crew health are managed as part of this strategic objective, as well, including implementation of a comprehensive health care program for astro-nauts and the prevention and mitigation of negative, long-term health consequences of space flight.
In spring 2019, NASA determined that there was noteworthy prog-ress for this strategic objective. During the review period, NASA and its international and commercial partners kept the ISS supplied with new scientific investigations and cargo on time and as planned. The resupply missions allowed the crew to conduct an average number of research hours per week that exceeded goals.
Strategic Objective 2.1: Lay the foundation for America to maintain a constant human presence in low Earth orbit enabled by a commercial market .
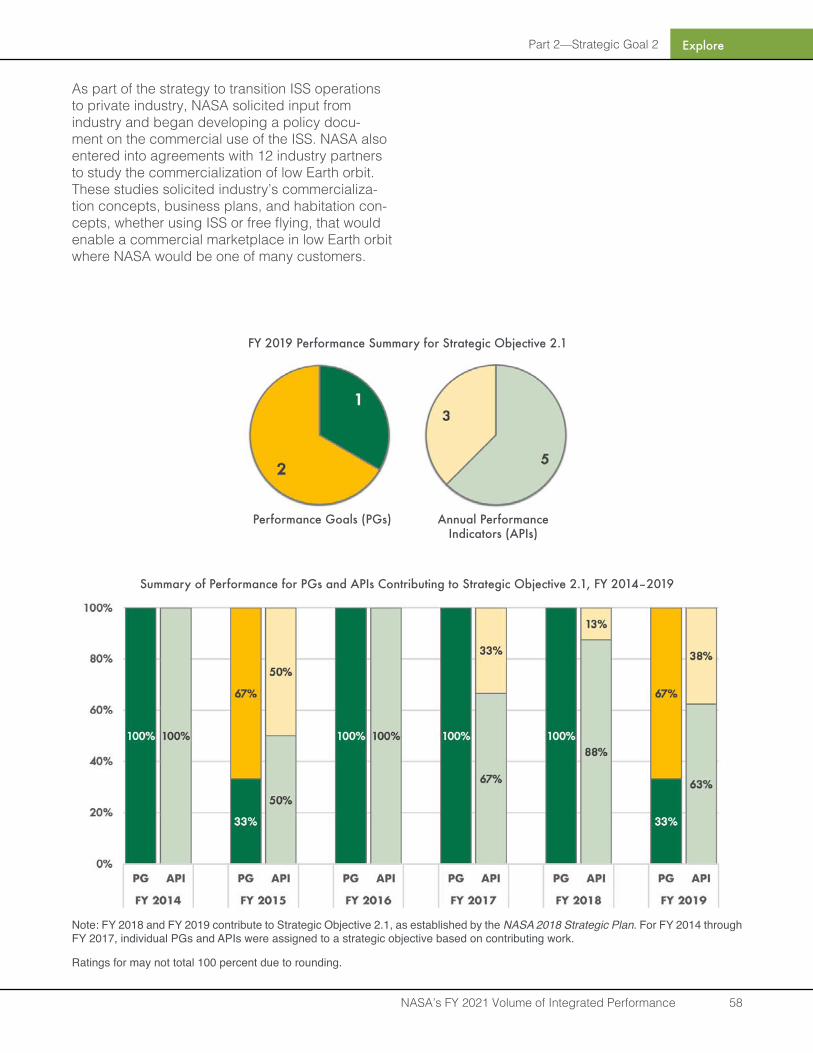
Part 2—Strategic Goal 2 Explore
NASA’s FY 2021 Volume of Integrated Performance 58
As part of the strategy to transition ISS operations to private industry, NASA solicited input from industry and began developing a policy docu-ment on the commercial use of the ISS. NASA also entered into agreements with 12 industry partners to study the commercialization of low Earth orbit. These studies solicited industry’s commercializa-tion concepts, business plans, and habitation con-cepts, whether using ISS or free flying, that would enable a commercial marketplace in low Earth orbit where NASA would be one of many customers.
FY 2019 Performance Summary for Strategic Objective 2.1
Performance Goals (PGs) Annual Performance Indicators (APIs)
Summary of Performance for PGs and APIs Contributing to Strategic Objective 2.1, FY 2014–2019
Note: FY 2018 and FY 2019 contribute to Strategic Objective 2.1, as established by the NASA 2018 Strategic Plan. For FY 2014 through FY 2017, individual PGs and APIs were assigned to a strategic objective based on contributing work.
Ratings for may not total 100 percent due to rounding.
Part 2—Strategic Goal 2 Explore
NASA’s FY 2021 Volume of Integrated Performance 59
Performance Goal 2.1.1: Increase the crew time for research and development beyond the three U .S . Orbital Segment crew baseline .
2014 2015 2016 2017 2018 2019
Green Green Green Green Green Yellow
FY 2019 Annual Performance Indicators
ISS-19-5: In concert with international partners, maintain a continuous five- or six-crew capabil-ity on the International Space Station (ISS) by coordinating and managing resources, logistics, and operational procedures.
Yellow
ISS-19-6: Maintain the capability to perform at least 40 hours of research per week by coordi-nating and managing resources, logistics, and research and development procedures.
Green
FY 2020–2021 Performance Plan
No performance goal after FY 2019. New perfor-mance goals for Strategic Objective 2.1 are on page 62.
FY 2019 Performance Progress
NASA was slightly below target for this goal due to a Russian Soyuz launch (mission 56S) failure on October 11, 2018. The capsule was transport-ing the new U.S. and Russian crew members to the ISS. When a malfunction was detected two minutes after liftoff, the capsule jettisoned from the rocket and returned the crew safely to Earth. The ISS was staffed with three crew members, instead of its usual five or six crew members, for approximately two months while the anomaly was investigated. During this time, the ISS crew did not exceed the baseline of spending 35 hours per week on research and development, resulting in a yellow rating for this performance goal. The Soyuz returned to service on December 3 (mission 58S) and restored ISS crew rotation.
Human Space Flight Operations, part of NASA’s Human Exploration and Operations Mission Directorate, is responsible for flight crew planning, management, direction, and training .
Part 2—Strategic Goal 2 Explore
NASA’s FY 2021 Volume of Integrated Performance 60
Performance Goal 2.1.2: Ensure vital assets are ready, available, and appro-priately sized to conduct NASA’s Mission.
2014 2015 2016 2017 2018 2019
Green Green Green Green Green Green
FY 2019 Annual Performance Indicator
SFS-19-1: Ensure the astronaut corps meets all mission-related training requirements and mission-related health standards.
Green
FY 2020–2021 Performance Plan
No performance goal after FY 2019. New perfor-mance goals for Strategic Objective 2.1 are on page 62.
FY 2019 Performance Progress
NASA’s Astronaut Corps ensured that its pool of active astronauts were prepared for missions by completing all planned mission-related training in FY 2019.
Human Space Flight Operations, part of NASA’s Human Exploration and Operations Mission Directorate, is responsible for flight crew planning, management, direction, and training .
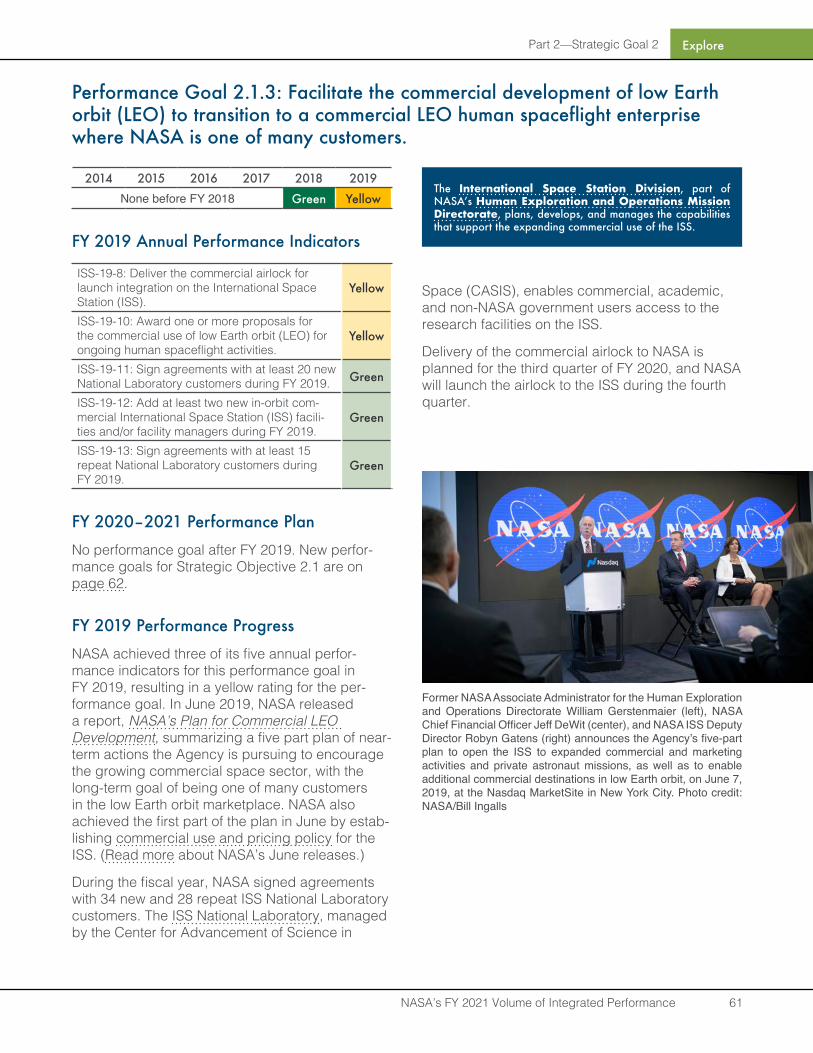
Part 2—Strategic Goal 2 Explore
NASA’s FY 2021 Volume of Integrated Performance 61
Performance Goal 2.1.3: Facilitate the commercial development of low Earth orbit (LEO) to transition to a commercial LEO human spaceflight enterprise where NASA is one of many customers .
2014 2015 2016 2017 2018 2019None before FY 2018 Green Yellow
FY 2019 Annual Performance Indicators
ISS-19-8: Deliver the commercial airlock for launch integration on the International Space Station (ISS).
Yellow
ISS-19-10: Award one or more proposals for the commercial use of low Earth orbit (LEO) for ongoing human spaceflight activities.
Yellow
ISS-19-11: Sign agreements with at least 20 new National Laboratory customers during FY 2019. Green
ISS-19-12: Add at least two new in-orbit com-mercial International Space Station (ISS) facili-ties and/or facility managers during FY 2019.
Green
ISS-19-13: Sign agreements with at least 15 repeat National Laboratory customers during FY 2019.
Green
FY 2020–2021 Performance Plan
No performance goal after FY 2019. New perfor-mance goals for Strategic Objective 2.1 are on page 62.
FY 2019 Performance Progress
NASA achieved three of its five annual perfor-mance indicators for this performance goal in FY 2019, resulting in a yellow rating for the per-formance goal. In June 2019, NASA released a report, NASA’s Plan for Commercial LEO Development, summarizing a five part plan of near-term actions the Agency is pursuing to encourage the growing commercial space sector, with the long-term goal of being one of many customers in the low Earth orbit marketplace. NASA also achieved the first part of the plan in June by estab-lishing commercial use and pricing policy for the ISS. (Read more about NASA’s June releases.)
During the fiscal year, NASA signed agreements with 34 new and 28 repeat ISS National Laboratory customers. The ISS National Laboratory, managed by the Center for Advancement of Science in
Space (CASIS), enables commercial, academic, and non-NASA government users access to the research facilities on the ISS.
Delivery of the commercial airlock to NASA is planned for the third quarter of FY 2020, and NASA will launch the airlock to the ISS during the fourth quarter.
The International Space Station Division, part of NASA’s Human Exploration and Operations Mission Directorate, plans, develops, and manages the capabilities that support the expanding commercial use of the ISS .
Former NASA Associate Administrator for the Human Exploration and Operations Directorate William Gerstenmaier (left), NASA Chief Financial Officer Jeff DeWit (center), and NASA ISS Deputy Director Robyn Gatens (right) announces the Agency’s five-part plan to open the ISS to expanded commercial and marketing activities and private astronaut missions, as well as to enable additional commercial destinations in low Earth orbit, on June 7, 2019, at the Nasdaq MarketSite in New York City. Photo credit: NASA/Bill Ingalls
Part 2—Strategic Goal 2 Explore
NASA’s FY 2021 Volume of Integrated Performance 62
FY 2020–2021 Performance Plan: New Performance Goals
2 .1 .1: Initiate technology demonstrations on the International Space Station to advance deep space exploration .
Number of research and technology demonstrations conducted
Fiscal Year 2020 2021
Target 5 5
2 .1 .2: Enable a robust commercial low Earth orbit economy in which transportation, habitation, and on-orbit services are available for purchase by NASA and other customers . (Agency Priority Goal)
Number of milestones met
Fiscal Year 2020 2021
Target 4 4
Development milestones for FY 20201. Make awards for the port solicitation –
NextStep 2 Broad Agency Announcement (Appendix I).
2. Make awards for the free-flyer solicitation – NextStep 2 Broad Agency Announcement (Appendix K).
3. Initiate astronaut training for initial private astro-naut mission under a reimbursable space act agreement.
4. Both commercial crew industry partners com-plete demonstration missions.
Development milestones for FY 20211. Execute an outreach and communication cam-
paign to expand pipeline of new entrants into the LEO economy.
2. Complete Preliminary Design Review for at least one port solicitation awardee.
3. Complete Preliminary Design Review for at least one free-flyer solicitation awardee.
4. Commence regular commercial crew operations.
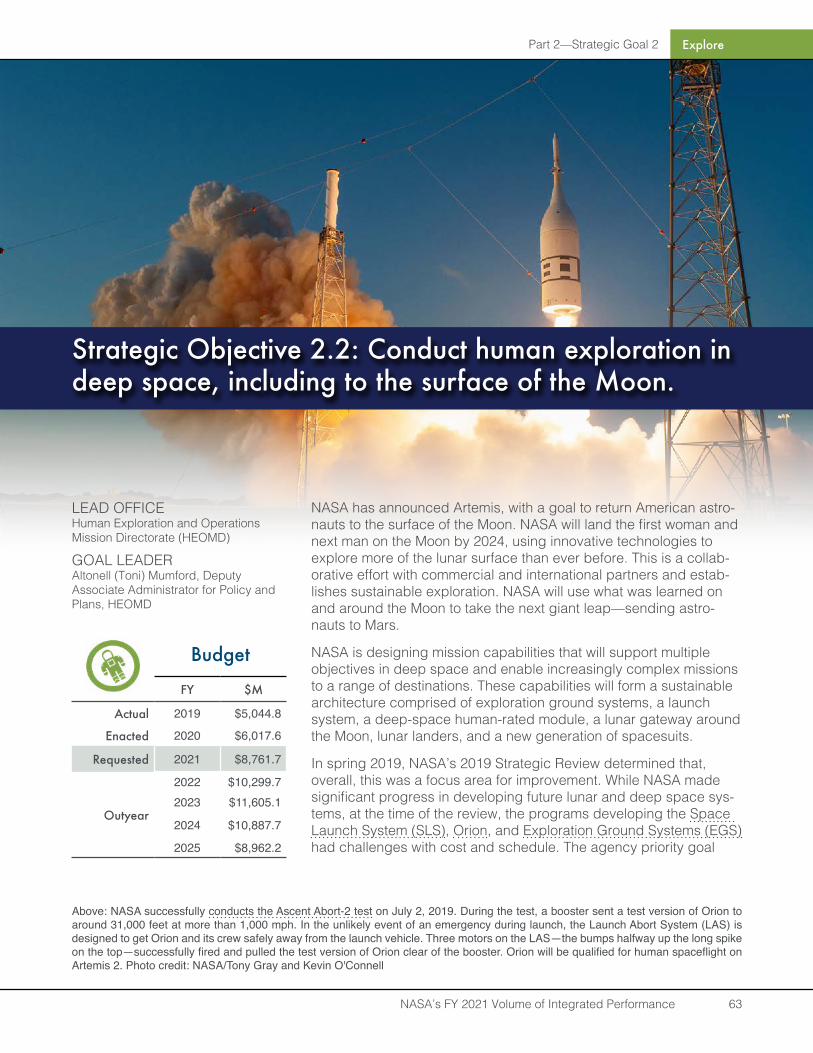
Part 2—Strategic Goal 2
NASA’s FY 2021 Volume of Integrated Performance 63
Explore
LEAD OFFICEHuman Exploration and Operations Mission Directorate (HEOMD)
GOAL LEADERAltonell (Toni) Mumford, Deputy Associate Administrator for Policy and Plans, HEOMD
Budget
FY $M
Actual 2019 $5,044.8
Enacted 2020 $6,017.6
Requested 2021 $8,761.7
Outyear
2022 $10,299.72023 $11,605.1
2024 $10,887.7
2025 $8,962.2
Strategic Objective 2.2: Conduct human exploration in deep space, including to the surface of the Moon .
Above: NASA successfully conducts the Ascent Abort-2 test on July 2, 2019. During the test, a booster sent a test version of Orion to around 31,000 feet at more than 1,000 mph. In the unlikely event of an emergency during launch, the Launch Abort System (LAS) is designed to get Orion and its crew safely away from the launch vehicle. Three motors on the LAS—the bumps halfway up the long spike on the top—successfully fired and pulled the test version of Orion clear of the booster. Orion will be qualified for human spaceflight on Artemis 2. Photo credit: NASA/Tony Gray and Kevin O'Connell
NASA has announced Artemis, with a goal to return American astro-nauts to the surface of the Moon. NASA will land the first woman and next man on the Moon by 2024, using innovative technologies to explore more of the lunar surface than ever before. This is a collab-orative effort with commercial and international partners and estab-lishes sustainable exploration. NASA will use what was learned on and around the Moon to take the next giant leap—sending astro-nauts to Mars.
NASA is designing mission capabilities that will support multiple objectives in deep space and enable increasingly complex missions to a range of destinations. These capabilities will form a sustainable architecture comprised of exploration ground systems, a launch system, a deep-space human-rated module, a lunar gateway around the Moon, lunar landers, and a new generation of spacesuits.
In spring 2019, NASA’s 2019 Strategic Review determined that, overall, this was a focus area for improvement. While NASA made significant progress in developing future lunar and deep space sys-tems, at the time of the review, the programs developing the Space Launch System (SLS), Orion, and Exploration Ground Systems (EGS) had challenges with cost and schedule. The agency priority goal
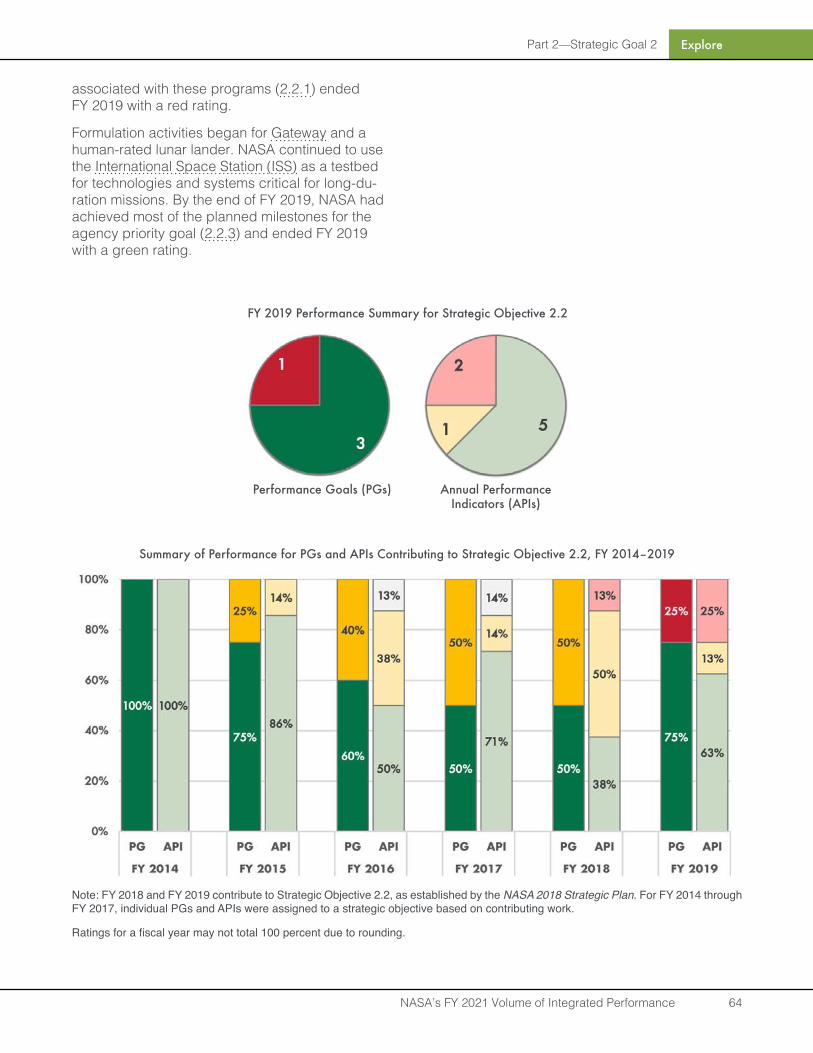
Part 2—Strategic Goal 2 Explore
NASA’s FY 2021 Volume of Integrated Performance 64
associated with these programs (2.2.1) ended FY 2019 with a red rating.
Formulation activities began for Gateway and a human-rated lunar lander. NASA continued to use the International Space Station (ISS) as a testbed for technologies and systems critical for long-du-ration missions. By the end of FY 2019, NASA had achieved most of the planned milestones for the agency priority goal (2.2.3) and ended FY 2019 with a green rating.
FY 2019 Performance Summary for Strategic Objective 2.2
Performance Goals (PGs) Annual Performance Indicators (APIs)
Summary of Performance for PGs and APIs Contributing to Strategic Objective 2.2, FY 2014–2019
Note: FY 2018 and FY 2019 contribute to Strategic Objective 2.2, as established by the NASA 2018 Strategic Plan. For FY 2014 through FY 2017, individual PGs and APIs were assigned to a strategic objective based on contributing work.
Ratings for a fiscal year may not total 100 percent due to rounding.
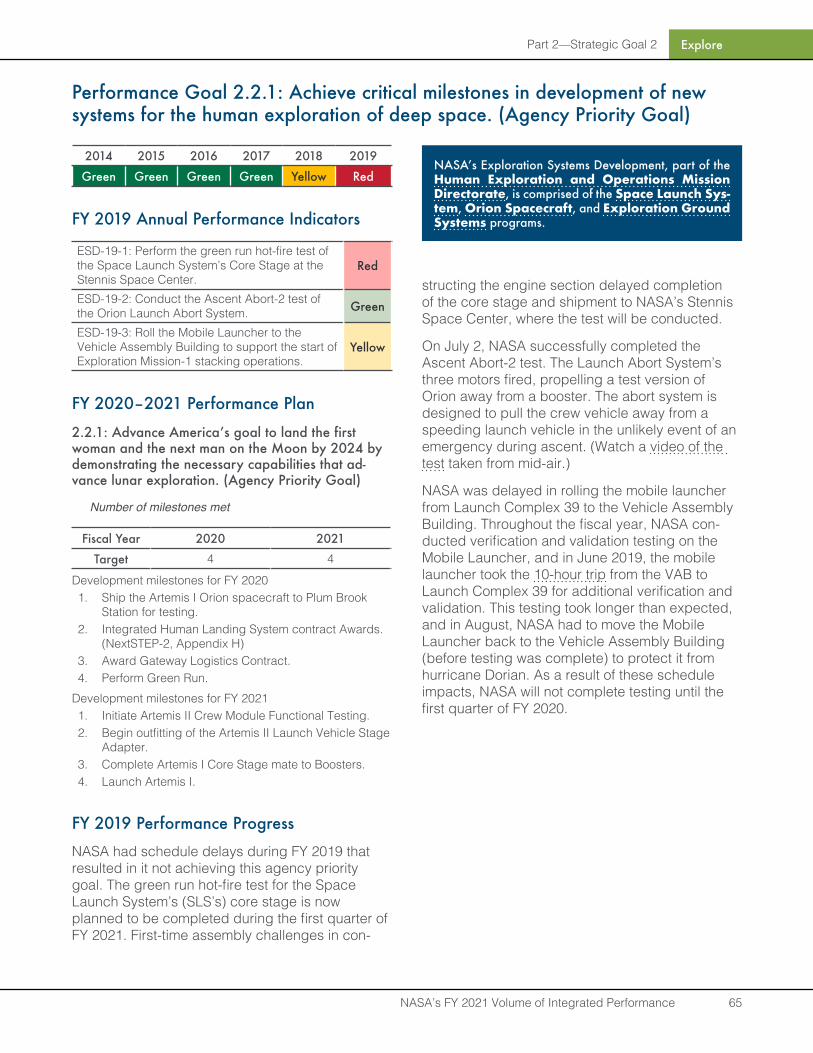
Part 2—Strategic Goal 2 Explore
NASA’s FY 2021 Volume of Integrated Performance 65
Performance Goal 2.2.1: Achieve critical milestones in development of new systems for the human exploration of deep space . (Agency Priority Goal)
2014 2015 2016 2017 2018 2019
Green Green Green Green Yellow Red
FY 2019 Annual Performance Indicators
ESD-19-1: Perform the green run hot-fire test of the Space Launch System’s Core Stage at the Stennis Space Center.
Red
ESD-19-2: Conduct the Ascent Abort-2 test of the Orion Launch Abort System. Green
ESD-19-3: Roll the Mobile Launcher to the Vehicle Assembly Building to support the start of Exploration Mission-1 stacking operations.
Yellow
FY 2020–2021 Performance Plan
2.2.1: Advance America’s goal to land the first woman and the next man on the Moon by 2024 by demonstrating the necessary capabilities that ad-vance lunar exploration. (Agency Priority Goal)
Number of milestones met
Fiscal Year 2020 2021
Target 4 4
Development milestones for FY 20201. Ship the Artemis I Orion spacecraft to Plum Brook
Station for testing.2. Integrated Human Landing System contract Awards.
(NextSTEP-2, Appendix H)3. Award Gateway Logistics Contract.4. Perform Green Run.
Development milestones for FY 20211. Initiate Artemis II Crew Module Functional Testing.2. Begin outfitting of the Artemis II Launch Vehicle Stage
Adapter.3. Complete Artemis I Core Stage mate to Boosters.4. Launch Artemis I.
FY 2019 Performance Progress
NASA had schedule delays during FY 2019 that resulted in it not achieving this agency priority goal. The green run hot-fire test for the Space Launch System’s (SLS’s) core stage is now planned to be completed during the first quarter of FY 2021. First-time assembly challenges in con-
structing the engine section delayed completion of the core stage and shipment to NASA’s Stennis Space Center, where the test will be conducted.
On July 2, NASA successfully completed the Ascent Abort-2 test. The Launch Abort System’s three motors fired, propelling a test version of Orion away from a booster. The abort system is designed to pull the crew vehicle away from a speeding launch vehicle in the unlikely event of an emergency during ascent. (Watch a video of the test taken from mid-air.)
NASA was delayed in rolling the mobile launcher from Launch Complex 39 to the Vehicle Assembly Building. Throughout the fiscal year, NASA con-ducted verification and validation testing on the Mobile Launcher, and in June 2019, the mobile launcher took the 10-hour trip from the VAB to Launch Complex 39 for additional verification and validation. This testing took longer than expected, and in August, NASA had to move the Mobile Launcher back to the Vehicle Assembly Building (before testing was complete) to protect it from hurricane Dorian. As a result of these schedule impacts, NASA will not complete testing until the first quarter of FY 2020.
NASA’s Exploration Systems Development, part of the Human Exploration and Operations Mission Directorate, is comprised of the Space Launch Sys-tem, Orion Spacecraft, and Exploration Ground Systems programs .
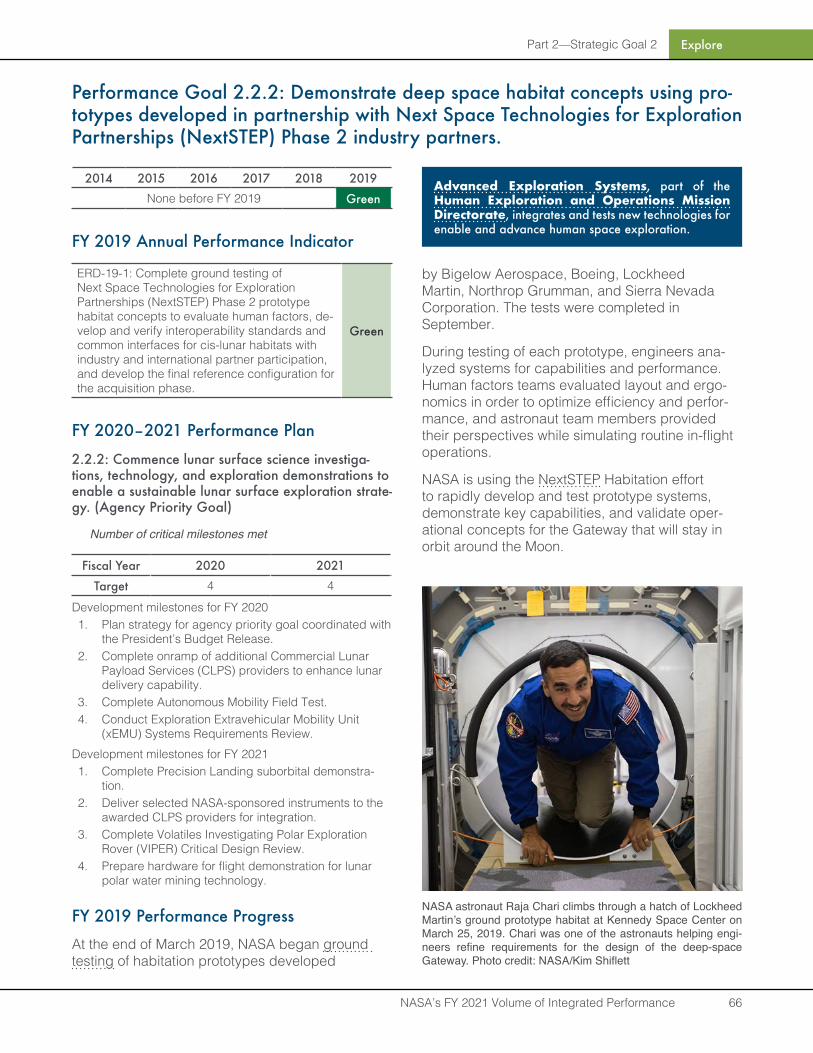
Part 2—Strategic Goal 2 Explore
NASA’s FY 2021 Volume of Integrated Performance 66
Performance Goal 2 .2 .2: Demonstrate deep space habitat concepts using pro-totypes developed in partnership with Next Space Technologies for Exploration Partnerships (NextSTEP) Phase 2 industry partners .
2014 2015 2016 2017 2018 2019None before FY 2019 Green
FY 2019 Annual Performance Indicator
ERD-19-1: Complete ground testing of Next Space Technologies for Exploration Partnerships (NextSTEP) Phase 2 prototype habitat concepts to evaluate human factors, de-velop and verify interoperability standards and common interfaces for cis-lunar habitats with industry and international partner participation, and develop the final reference configuration for the acquisition phase.
Green
FY 2020–2021 Performance Plan
2.2.2: Commence lunar surface science investiga-tions, technology, and exploration demonstrations to enable a sustainable lunar surface exploration strate-gy . (Agency Priority Goal)
Number of critical milestones met
Fiscal Year 2020 2021
Target 4 4
Development milestones for FY 20201. Plan strategy for agency priority goal coordinated with
the President’s Budget Release.2. Complete onramp of additional Commercial Lunar
Payload Services (CLPS) providers to enhance lunar delivery capability.
3. Complete Autonomous Mobility Field Test.4. Conduct Exploration Extravehicular Mobility Unit
(xEMU) Systems Requirements Review.Development milestones for FY 20211. Complete Precision Landing suborbital demonstra-
tion. 2. Deliver selected NASA-sponsored instruments to the
awarded CLPS providers for integration.3. Complete Volatiles Investigating Polar Exploration
Rover (VIPER) Critical Design Review.4. Prepare hardware for flight demonstration for lunar
polar water mining technology.
FY 2019 Performance Progress
At the end of March 2019, NASA began ground testing of habitation prototypes developed
by Bigelow Aerospace, Boeing, Lockheed Martin, Northrop Grumman, and Sierra Nevada Corporation. The tests were completed in September.
During testing of each prototype, engineers ana-lyzed systems for capabilities and performance. Human factors teams evaluated layout and ergo-nomics in order to optimize efficiency and perfor-mance, and astronaut team members provided their perspectives while simulating routine in-flight operations.
NASA is using the NextSTEP Habitation effort to rapidly develop and test prototype systems, demonstrate key capabilities, and validate oper-ational concepts for the Gateway that will stay in orbit around the Moon.
Advanced Exploration Systems, part of the Human Exploration and Operations Mission Directorate, integrates and tests new technologies for enable and advance human space exploration.
NASA astronaut Raja Chari climbs through a hatch of Lockheed Martin’s ground prototype habitat at Kennedy Space Center on March 25, 2019. Chari was one of the astronauts helping engi-neers refine requirements for the design of the deep-space Gateway. Photo credit: NASA/Kim Shiflett
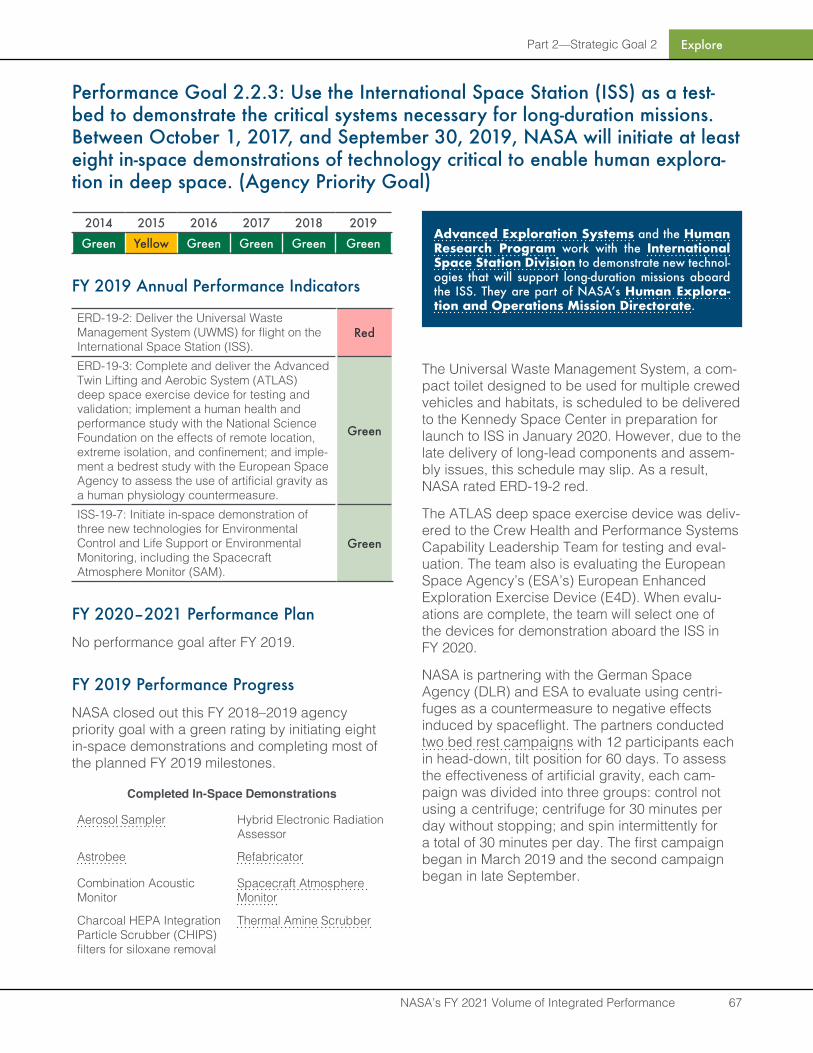
Part 2—Strategic Goal 2 Explore
NASA’s FY 2021 Volume of Integrated Performance 67
Performance Goal 2 .2 .3: Use the International Space Station (ISS) as a test-bed to demonstrate the critical systems necessary for long-duration missions . Between October 1, 2017, and September 30, 2019, NASA will initiate at least eight in-space demonstrations of technology critical to enable human explora-tion in deep space . (Agency Priority Goal)
2014 2015 2016 2017 2018 2019
Green Yellow Green Green Green Green
FY 2019 Annual Performance Indicators
ERD-19-2: Deliver the Universal Waste Management System (UWMS) for flight on the International Space Station (ISS).
Red
ERD-19-3: Complete and deliver the Advanced Twin Lifting and Aerobic System (ATLAS) deep space exercise device for testing and validation; implement a human health and performance study with the National Science Foundation on the effects of remote location, extreme isolation, and confinement; and imple-ment a bedrest study with the European Space Agency to assess the use of artificial gravity as a human physiology countermeasure.
Green
ISS-19-7: Initiate in-space demonstration of three new technologies for Environmental Control and Life Support or Environmental Monitoring, including the Spacecraft Atmosphere Monitor (SAM).
Green
FY 2020–2021 Performance Plan
No performance goal after FY 2019.
FY 2019 Performance Progress
NASA closed out this FY 2018–2019 agency priority goal with a green rating by initiating eight in-space demonstrations and completing most of the planned FY 2019 milestones.
Completed In-Space Demonstrations
Aerosol Sampler Hybrid Electronic Radiation Assessor
Astrobee Refabricator
Combination Acoustic Monitor
Spacecraft Atmosphere Monitor
Charcoal HEPA Integration Particle Scrubber (CHIPS) filters for siloxane removal
Thermal Amine Scrubber
The Universal Waste Management System, a com-pact toilet designed to be used for multiple crewed vehicles and habitats, is scheduled to be delivered to the Kennedy Space Center in preparation for launch to ISS in January 2020. However, due to the late delivery of long-lead components and assem-bly issues, this schedule may slip. As a result, NASA rated ERD-19-2 red.
The ATLAS deep space exercise device was deliv-ered to the Crew Health and Performance Systems Capability Leadership Team for testing and eval-uation. The team also is evaluating the European Space Agency’s (ESA’s) European Enhanced Exploration Exercise Device (E4D). When evalu-ations are complete, the team will select one of the devices for demonstration aboard the ISS in FY 2020.
NASA is partnering with the German Space Agency (DLR) and ESA to evaluate using centri-fuges as a countermeasure to negative effects induced by spaceflight. The partners conducted two bed rest campaigns with 12 participants each in head-down, tilt position for 60 days. To assess the effectiveness of artificial gravity, each cam-paign was divided into three groups: control not using a centrifuge; centrifuge for 30 minutes per day without stopping; and spin intermittently for a total of 30 minutes per day. The first campaign began in March 2019 and the second campaign began in late September.
Advanced Exploration Systems and the Human Research Program work with the International Space Station Division to demonstrate new technol-ogies that will support long-duration missions aboard the ISS. They are part of NASA’s Human Explora-tion and Operations Mission Directorate .
Part 2—Strategic Goal 2 Explore
NASA’s FY 2021 Volume of Integrated Performance 68
Performance Goal 2.2.5: Achieve milestones in the design and development of a Power and Propulsion Element in partnership with industry .
2014 2015 2016 2017 2018 2019None before FY 2018 Green Green
FY 2019 Annual Performance Indicator
ERD-19-4: In partnership with industry, conduct one or more Preliminary Design Reviews for the Power and Propulsion Element.
Green
FY 2020–2021 Performance Plan
No performance goal after FY 2019.
FY 2019 Performance Progress
On May 23, 2019, NASA achieved this perfor-mance goal, and took one of the first steps in the Agency’s Artemis lunar exploration plans, by announcing the selection of Maxar Technologies to develop and demonstrate power, propulsion, and communications for NASA’s Gateway. For this award, Maxar Technologies will design a solar electric propulsion spacecraft to maintain the Gateway’s position and to shift it between lunar orbits as needed. The first activity after the contract was signed was to conduct a Systems Requirements Review (SRR), which was held in September.
The Gateway program, part of the Human Explo-ration and Operations Mission Directorate, is managing development of a power and propulsion ele-ment through a partnership with U .S . industry .
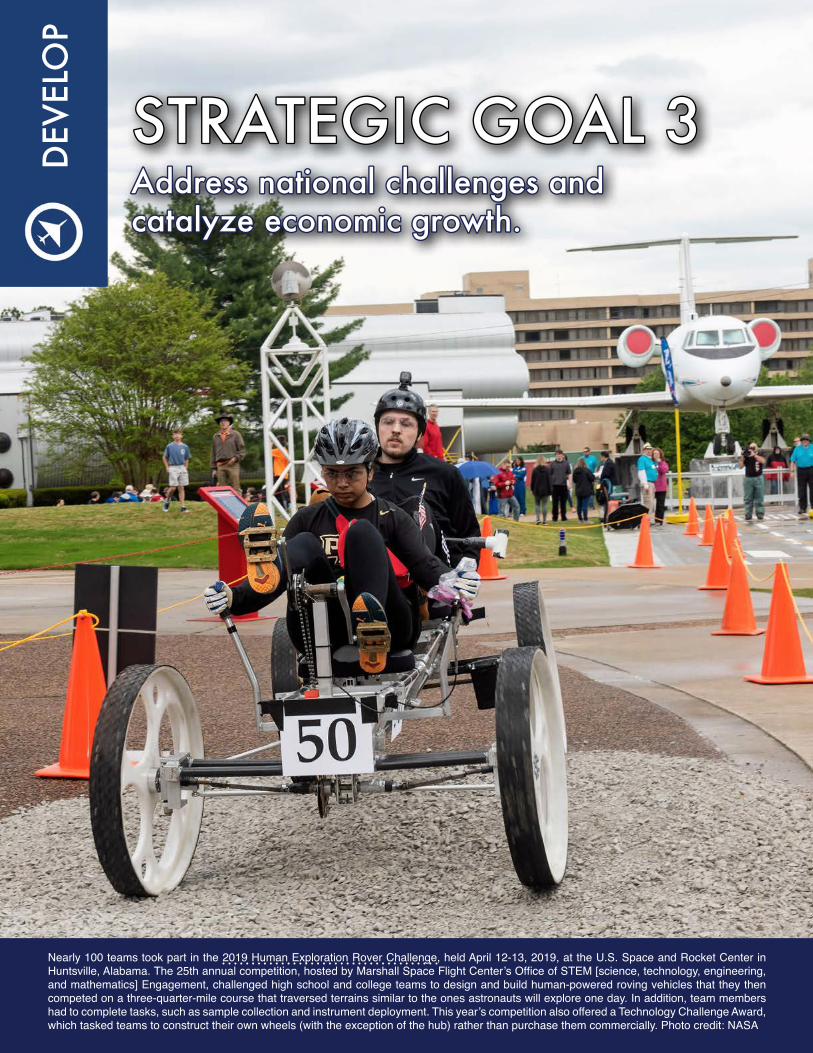
DEV
ELO
P
Nearly 100 teams took part in the 2019 Human Exploration Rover Challenge, held April 12-13, 2019, at the U.S. Space and Rocket Center in Huntsville, Alabama. The 25th annual competition, hosted by Marshall Space Flight Center’s Office of STEM [science, technology, engineering, and mathematics] Engagement, challenged high school and college teams to design and build human-powered roving vehicles that they then competed on a three-quarter-mile course that traversed terrains similar to the ones astronauts will explore one day. In addition, team members had to complete tasks, such as sample collection and instrument deployment. This year’s competition also offered a Technology Challenge Award, which tasked teams to construct their own wheels (with the exception of the hub) rather than purchase them commercially. Photo credit: NASA
STRATEGIC GOAL 3STRATEGIC GOAL 3Address national challenges and Address national challenges and catalyze economic growth .catalyze economic growth .
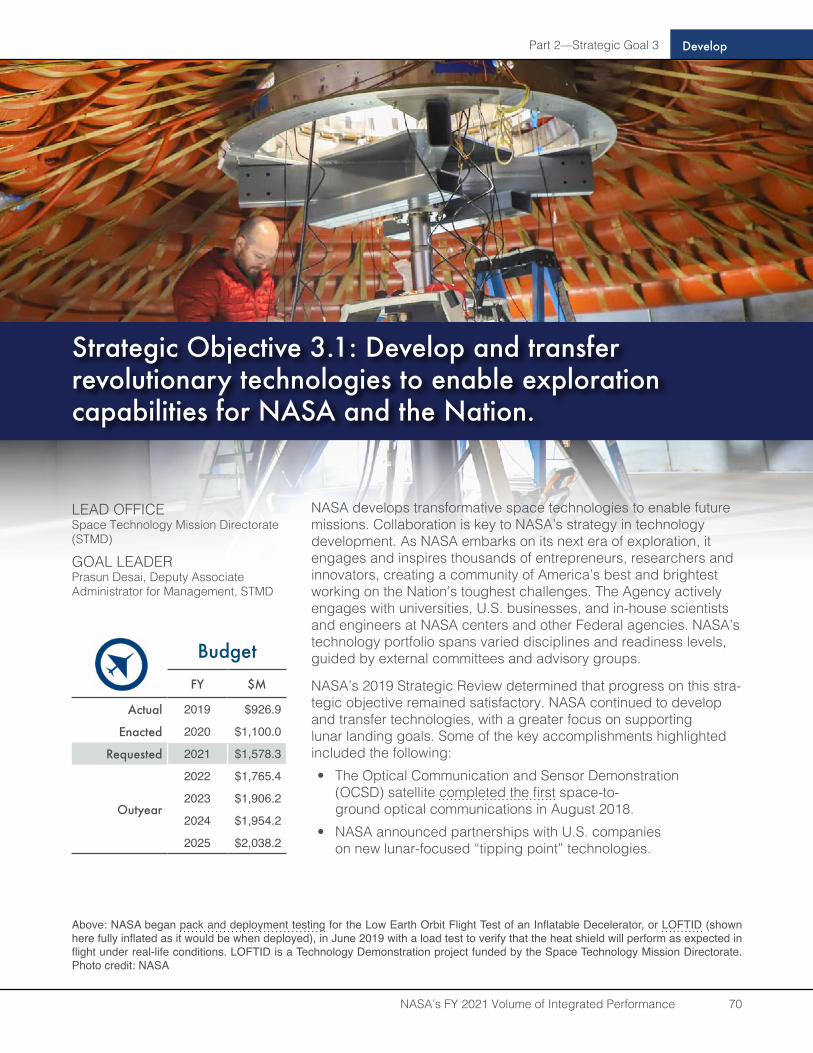
Part 2—Strategic Goal 3
NASA’s FY 2021 Volume of Integrated Performance 70
Develop
NASA develops transformative space technologies to enable future missions. Collaboration is key to NASA’s strategy in technology development. As NASA embarks on its next era of exploration, it engages and inspires thousands of entrepreneurs, researchers and innovators, creating a community of America’s best and brightest working on the Nation’s toughest challenges. The Agency actively engages with universities, U.S. businesses, and in-house scientists and engineers at NASA centers and other Federal agencies. NASA’s technology portfolio spans varied disciplines and readiness levels, guided by external committees and advisory groups.
NASA’s 2019 Strategic Review determined that progress on this stra-tegic objective remained satisfactory. NASA continued to develop and transfer technologies, with a greater focus on supporting lunar landing goals. Some of the key accomplishments highlighted included the following:• The Optical Communication and Sensor Demonstration
(OCSD) satellite completed the first space-to-ground optical communications in August 2018.
• NASA announced partnerships with U.S. companies on new lunar-focused “tipping point” technologies.
LEAD OFFICESpace Technology Mission Directorate (STMD)
GOAL LEADERPrasun Desai, Deputy Associate Administrator for Management, STMD
BudgetFY $M
Actual 2019 $926.9
Enacted 2020 $1,100.0
Requested 2021 $1,578.3
Outyear
2022 $1,765.4
2023 $1,906.2
2024 $1,954.2
2025 $2,038.2
Above: NASA began pack and deployment testing for the Low Earth Orbit Flight Test of an Inflatable Decelerator, or LOFTID (shown here fully inflated as it would be when deployed), in June 2019 with a load test to verify that the heat shield will perform as expected in flight under real-life conditions. LOFTID is a Technology Demonstration project funded by the Space Technology Mission Directorate. Photo credit: NASA
Strategic Objective 3.1: Develop and transfer revolutionary technologies to enable exploration capabilities for NASA and the Nation .
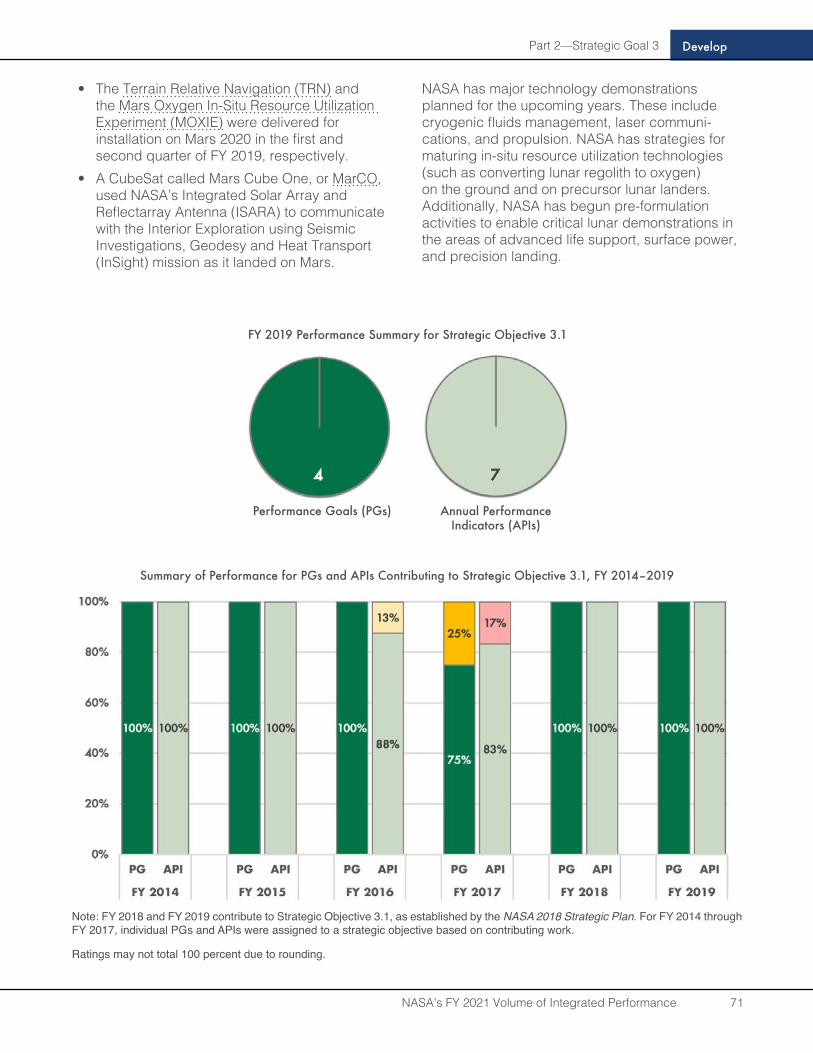
Part 2—Strategic Goal 3 Develop
NASA’s FY 2021 Volume of Integrated Performance 71
• The Terrain Relative Navigation (TRN) and the Mars Oxygen In-Situ Resource Utilization Experiment (MOXIE) were delivered for installation on Mars 2020 in the first and second quarter of FY 2019, respectively.
• A CubeSat called Mars Cube One, or MarCO, used NASA’s Integrated Solar Array and Reflectarray Antenna (ISARA) to communicate with the Interior Exploration using Seismic Investigations, Geodesy and Heat Transport (InSight) mission as it landed on Mars.
NASA has major technology demonstrations planned for the upcoming years. These include cryogenic fluids management, laser communi-cations, and propulsion. NASA has strategies for maturing in-situ resource utilization technologies (such as converting lunar regolith to oxygen) on the ground and on precursor lunar landers. Additionally, NASA has begun pre-formulation activities to enable critical lunar demonstrations in the areas of advanced life support, surface power, and precision landing.
FY 2019 Performance Summary for Strategic Objective 3.1
Performance Goals (PGs) Annual Performance Indicators (APIs)
Summary of Performance for PGs and APIs Contributing to Strategic Objective 3.1, FY 2014–2019
Note: FY 2018 and FY 2019 contribute to Strategic Objective 3.1, as established by the NASA 2018 Strategic Plan. For FY 2014 through FY 2017, individual PGs and APIs were assigned to a strategic objective based on contributing work.
Ratings may not total 100 percent due to rounding.
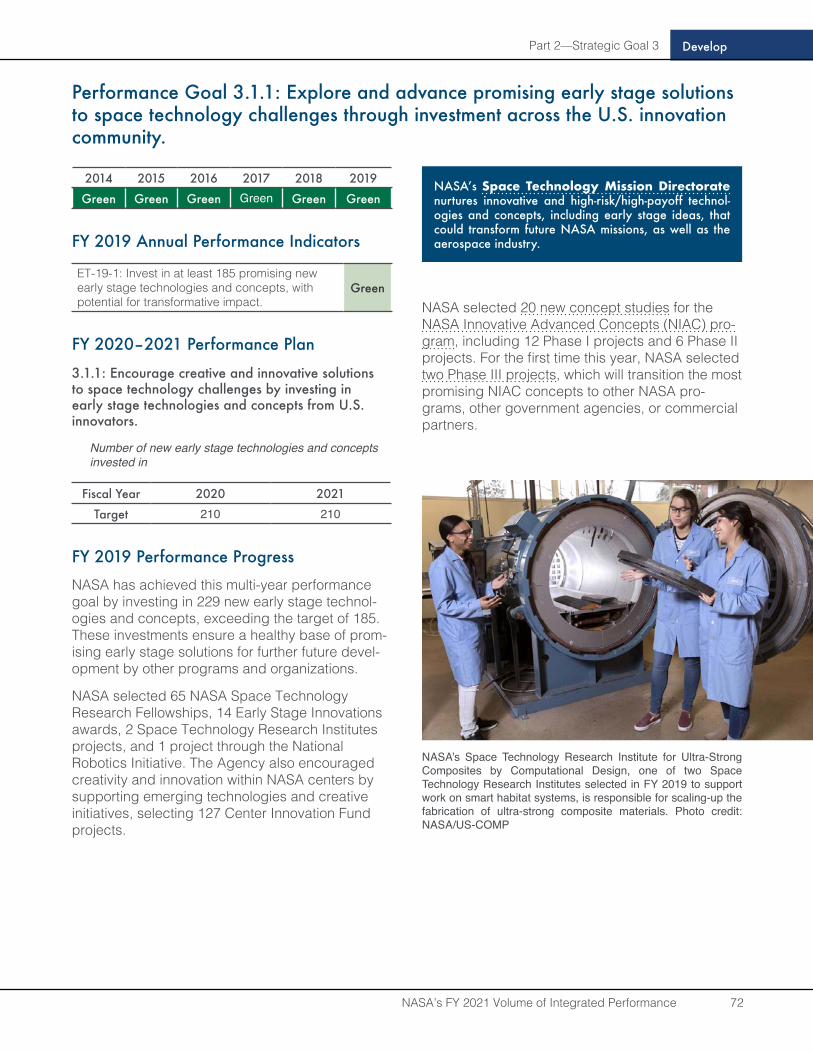
Part 2—Strategic Goal 3 Develop
NASA’s FY 2021 Volume of Integrated Performance 72
Performance Goal 3.1.1: Explore and advance promising early stage solutions to space technology challenges through investment across the U.S. innovation community .
2014 2015 2016 2017 2018 2019
Green Green Green Green Green Green
FY 2019 Annual Performance Indicators
ET-19-1: Invest in at least 185 promising new early stage technologies and concepts, with potential for transformative impact.
Green
FY 2020–2021 Performance Plan
3.1.1: Encourage creative and innovative solutions to space technology challenges by investing in early stage technologies and concepts from U .S . innovators.
Number of new early stage technologies and concepts invested in
Fiscal Year 2020 2021
Target 210 210
FY 2019 Performance Progress
NASA has achieved this multi-year performance goal by investing in 229 new early stage technol-ogies and concepts, exceeding the target of 185. These investments ensure a healthy base of prom-ising early stage solutions for further future devel-opment by other programs and organizations.
NASA selected 65 NASA Space Technology Research Fellowships, 14 Early Stage Innovations awards, 2 Space Technology Research Institutes projects, and 1 project through the National Robotics Initiative. The Agency also encouraged creativity and innovation within NASA centers by supporting emerging technologies and creative initiatives, selecting 127 Center Innovation Fund projects.
NASA selected 20 new concept studies for the NASA Innovative Advanced Concepts (NIAC) pro-gram, including 12 Phase I projects and 6 Phase II projects. For the first time this year, NASA selected two Phase III projects, which will transition the most promising NIAC concepts to other NASA pro-grams, other government agencies, or commercial partners.
NASA’s Space Technology Mission Directorate nurtures innovative and high-risk/high-payoff technol-ogies and concepts, including early stage ideas, that could transform future NASA missions, as well as the aerospace industry .
NASA’s Space Technology Research Institute for Ultra-Strong Composites by Computational Design, one of two Space Technology Research Institutes selected in FY 2019 to support work on smart habitat systems, is responsible for scaling-up the fabrication of ultra-strong composite materials. Photo credit: NASA/US-COMP
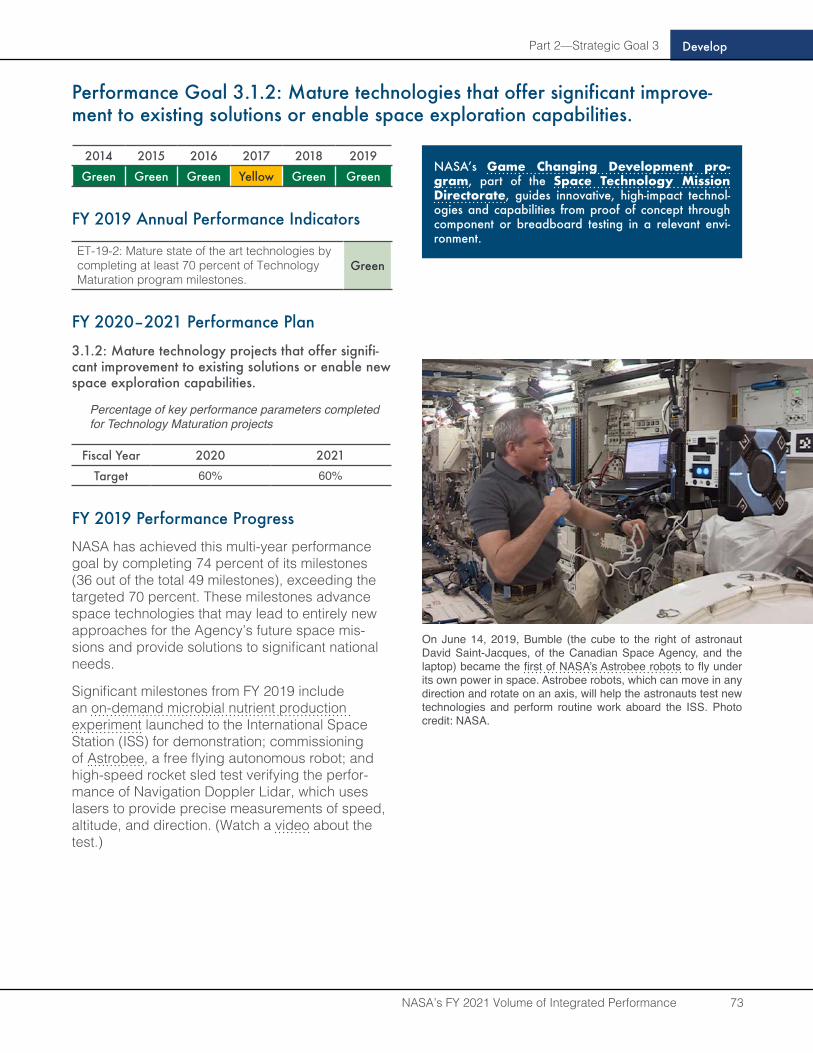
Part 2—Strategic Goal 3 Develop
NASA’s FY 2021 Volume of Integrated Performance 73
Performance Goal 3.1.2: Mature technologies that offer significant improve-ment to existing solutions or enable space exploration capabilities .
2014 2015 2016 2017 2018 2019
Green Green Green Yellow Green Green
FY 2019 Annual Performance Indicators
ET-19-2: Mature state of the art technologies by completing at least 70 percent of Technology Maturation program milestones.
Green
FY 2020–2021 Performance Plan
3 .1 .2: Mature technology projects that offer signifi-cant improvement to existing solutions or enable new space exploration capabilities .
Percentage of key performance parameters completed for Technology Maturation projects
Fiscal Year 2020 2021
Target 60% 60%
FY 2019 Performance Progress
NASA has achieved this multi-year performance goal by completing 74 percent of its milestones (36 out of the total 49 milestones), exceeding the targeted 70 percent. These milestones advance space technologies that may lead to entirely new approaches for the Agency’s future space mis-sions and provide solutions to significant national needs.
Significant milestones from FY 2019 include an on-demand microbial nutrient production experiment launched to the International Space Station (ISS) for demonstration; commissioning of Astrobee, a free flying autonomous robot; and high-speed rocket sled test verifying the perfor-mance of Navigation Doppler Lidar, which uses lasers to provide precise measurements of speed, altitude, and direction. (Watch a video about the test.)
NASA’s Game Changing Development pro-gram, part of the Space Technology Mission Directorate, guides innovative, high-impact technol-ogies and capabilities from proof of concept through component or breadboard testing in a relevant envi-ronment .
On June 14, 2019, Bumble (the cube to the right of astronaut David Saint-Jacques, of the Canadian Space Agency, and the laptop) became the first of NASA’s Astrobee robots to fly under its own power in space. Astrobee robots, which can move in any direction and rotate on an axis, will help the astronauts test new technologies and perform routine work aboard the ISS. Photo credit: NASA.
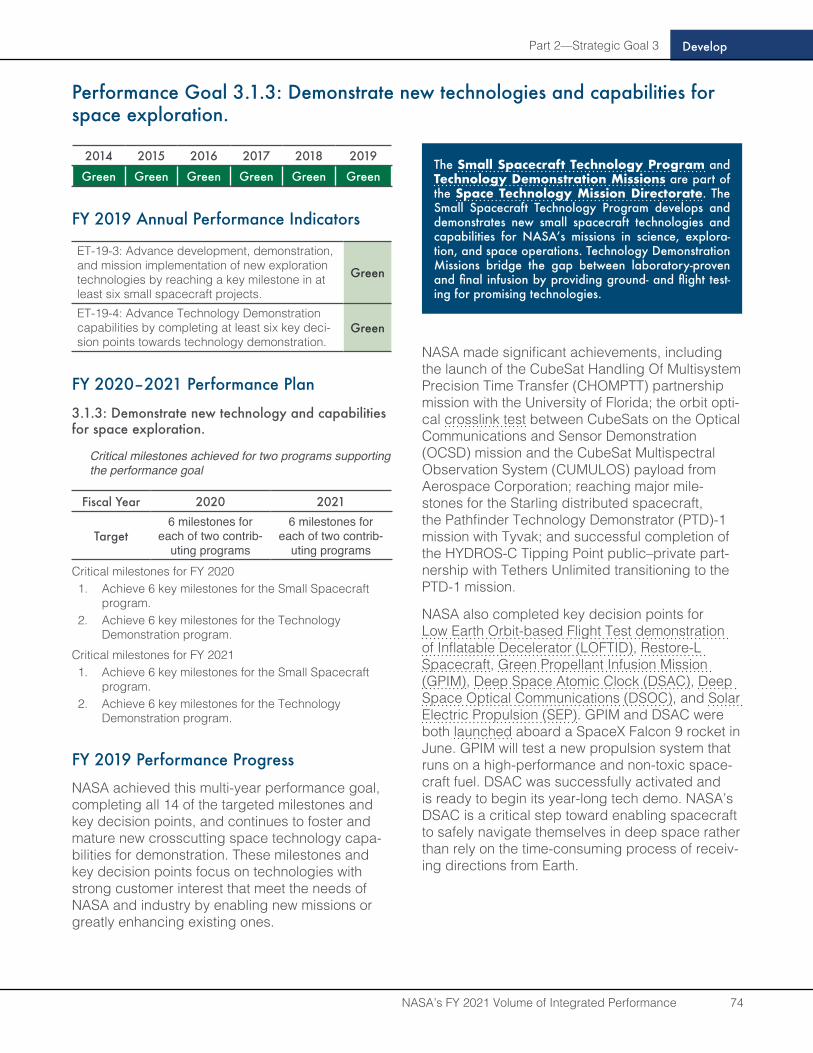
Part 2—Strategic Goal 3 Develop
NASA’s FY 2021 Volume of Integrated Performance 74
Performance Goal 3 .1 .3: Demonstrate new technologies and capabilities for space exploration .
2014 2015 2016 2017 2018 2019
Green Green Green Green Green Green
FY 2019 Annual Performance Indicators
ET-19-3: Advance development, demonstration, and mission implementation of new exploration technologies by reaching a key milestone in at least six small spacecraft projects.
Green
ET-19-4: Advance Technology Demonstration capabilities by completing at least six key deci-sion points towards technology demonstration.
Green
FY 2020–2021 Performance Plan
3 .1 .3: Demonstrate new technology and capabilities for space exploration .
Critical milestones achieved for two programs supporting the performance goal
Fiscal Year 2020 2021
Target6 milestones for
each of two contrib-uting programs
6 milestones for each of two contrib-
uting programsCritical milestones for FY 20201. Achieve 6 key milestones for the Small Spacecraft
program.2. Achieve 6 key milestones for the Technology
Demonstration program.Critical milestones for FY 20211. Achieve 6 key milestones for the Small Spacecraft
program.2. Achieve 6 key milestones for the Technology
Demonstration program.
FY 2019 Performance Progress
NASA achieved this multi-year performance goal, completing all 14 of the targeted milestones and key decision points, and continues to foster and mature new crosscutting space technology capa-bilities for demonstration. These milestones and key decision points focus on technologies with strong customer interest that meet the needs of NASA and industry by enabling new missions or greatly enhancing existing ones.
NASA made significant achievements, including the launch of the CubeSat Handling Of Multisystem Precision Time Transfer (CHOMPTT) partnership mission with the University of Florida; the orbit opti-cal crosslink test between CubeSats on the Optical Communications and Sensor Demonstration (OCSD) mission and the CubeSat Multispectral Observation System (CUMULOS) payload from Aerospace Corporation; reaching major mile-stones for the Starling distributed spacecraft, the Pathfinder Technology Demonstrator (PTD)-1 mission with Tyvak; and successful completion of the HYDROS-C Tipping Point public–private part-nership with Tethers Unlimited transitioning to the PTD-1 mission.
NASA also completed key decision points for Low Earth Orbit-based Flight Test demonstration of Inflatable Decelerator (LOFTID), Restore-L Spacecraft, Green Propellant Infusion Mission (GPIM), Deep Space Atomic Clock (DSAC), Deep Space Optical Communications (DSOC), and Solar Electric Propulsion (SEP). GPIM and DSAC were both launched aboard a SpaceX Falcon 9 rocket in June. GPIM will test a new propulsion system that runs on a high-performance and non-toxic space-craft fuel. DSAC was successfully activated and is ready to begin its year-long tech demo. NASA’s DSAC is a critical step toward enabling spacecraft to safely navigate themselves in deep space rather than rely on the time-consuming process of receiv-ing directions from Earth.
The Small Spacecraft Technology Program and Technology Demonstration Missions are part of the Space Technology Mission Directorate . The Small Spacecraft Technology Program develops and demonstrates new small spacecraft technologies and capabilities for NASA’s missions in science, explora-tion, and space operations . Technology Demonstration Missions bridge the gap between laboratory-proven and final infusion by providing ground- and flight test-ing for promising technologies .
Part 2—Strategic Goal 3 Develop
NASA’s FY 2021 Volume of Integrated Performance 75
Performance Goal 3 .1 .4: Engage the established commercial sector, emerging aerospace markets, and economic regions to leverage common interests and grow the national economy .
2014 2015 2016 2017 2018 2019
Green Green Green Green Green Green
FY 2019 Annual Performance Indicators
ET-19-5: Conduct at least four prize competi-tions to encourage innovation and address tech-nology challenges through engaging non-tradi-tional NASA partners.
Green
ET-19-6: Create 10 opportunities for advance-ment of SBIR/STTR technologies beyond Phase II, leveraging non-SBIR/STTR NASA investment or external investment.
Green
ET-19-7: Competitively select at least 14 pay-loads from NASA centers, other government agencies, industry, or academia for flight on commercial flight vehicles to achieve Agency priorities.
Green
FY 2020–2021 Performance Plan
3.1.4: Spur technology development through en-gagement with the commercial sector and the gener-al public .
Critical activities completed for three programs support-ing the performance goal
Fiscal Year 2020 2021
Target 3 3
Critical activities for FY 20201. Conduct 42 NASA challenges, prize competitions,
and crowdsourcing activities.2. Advance 45 Small Business Innovative Research/
Small Business Technology Transfer (SBIR/STTR) technologies beyond Phase II.
3. Manifest 16 payloads on commercial suborbital flights for testing.
Critical activities for FY 20211. Conduct 42 NASA challenges, prize competitions,
and crowdsourcing activities.2. Advance 45 Small Business Innovative Research/
Small Business Technology Transfer (SBIR/STTR) technologies beyond Phase II.
3. Manifest 16 payloads on commercial suborbital flights for testing.
FY 2019 Performance Progress
NASA achieved this multi-year performance goal by exceeding its target for conducting prize com-petitions, exceeding its target for engagements with small businesses and research institutions, and selecting the targeted number of flight oppor-tunity payloads.
NASA conducted several prize challenges in FY 2019, including the 3D-printed Hab Challenge Phase III, CO2 Conversion Challenge Phase I, Space Robotics Phase II (In Formulation), Vascular Tissue Challenge, CubeQuest Challenge, and the Earth and Space Air Prize. NASA also provided opportunities for small, highly innovative compa-nies and research institutions through the SBIR/STTR program. NASA created 55 post-Phase II opportunities, compared to the targeted 10 oppor-tunities, including 44 Phase II-E/X and 11 Civilian Commercialization Readiness Pilot Program opportunities. NASA also competitively selected 25 payloads, compared to the targeted 14 payloads, from industry and academia for flight on commer-cial flight vehicles to achieve agency priorities.
NASA’s Space Technology Mission Directorate (STMD) offers prizes for meeting key technology chal-lenges, while reaching out to non-traditional NASA partners. STMD also provides an opportunity for small businesses and research institutions to participate in government-sponsored research and development efforts in key technology areas .
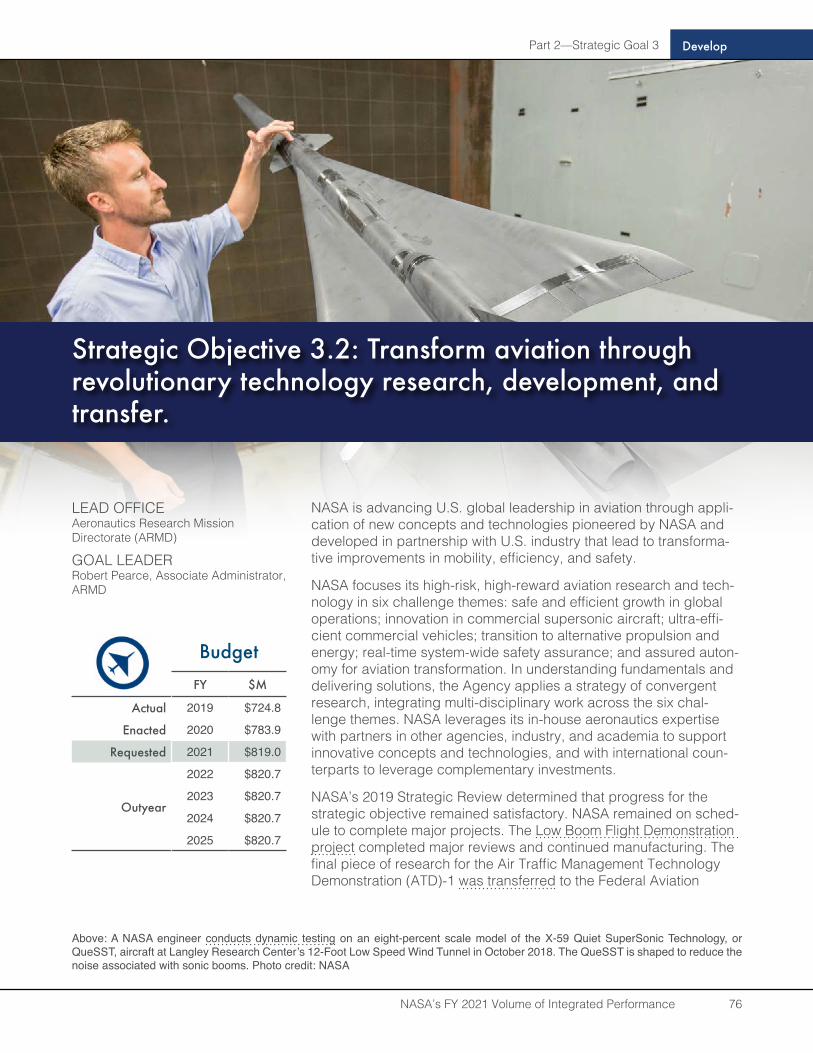
Part 2—Strategic Goal 3
NASA’s FY 2021 Volume of Integrated Performance 76
Develop
NASA is advancing U.S. global leadership in aviation through appli-cation of new concepts and technologies pioneered by NASA and developed in partnership with U.S. industry that lead to transforma-tive improvements in mobility, efficiency, and safety.
NASA focuses its high-risk, high-reward aviation research and tech-nology in six challenge themes: safe and efficient growth in global operations; innovation in commercial supersonic aircraft; ultra-effi-cient commercial vehicles; transition to alternative propulsion and energy; real-time system-wide safety assurance; and assured auton-omy for aviation transformation. In understanding fundamentals and delivering solutions, the Agency applies a strategy of convergent research, integrating multi-disciplinary work across the six chal-lenge themes. NASA leverages its in-house aeronautics expertise with partners in other agencies, industry, and academia to support innovative concepts and technologies, and with international coun-terparts to leverage complementary investments.
NASA’s 2019 Strategic Review determined that progress for the strategic objective remained satisfactory. NASA remained on sched-ule to complete major projects. The Low Boom Flight Demonstration project completed major reviews and continued manufacturing. The final piece of research for the Air Traffic Management Technology Demonstration (ATD)-1 was transferred to the Federal Aviation
LEAD OFFICEAeronautics Research Mission Directorate (ARMD)
GOAL LEADERRobert Pearce, Associate Administrator, ARMD
BudgetFY $M
Actual 2019 $724.8
Enacted 2020 $783.9
Requested 2021 $819.0
Outyear
2022 $820.7
2023 $820.7
2024 $820.7
2025 $820.7
Strategic Objective 3.2: Transform aviation through revolutionary technology research, development, and transfer .
Above: A NASA engineer conducts dynamic testing on an eight-percent scale model of the X-59 Quiet SuperSonic Technology, or QueSST, aircraft at Langley Research Center’s 12-Foot Low Speed Wind Tunnel in October 2018. The QueSST is shaped to reduce the noise associated with sonic booms. Photo credit: NASA

Part 2—Strategic Goal 3
NASA’s FY 2021 Volume of Integrated Performance 77
Develop
Administration and ATD-2 was on track for comple-tion and final delivery. NASA continues to success-fully pursue its work in support of urban air mobility and on-demand mobility vehicles.
The Agency is well positioned for continued pursuit of its long-term aeronautics goals, including those related to reducing noise on flight approaches and landings, providing tools and solutions for real-time decision making, improving flight safety, and enabling more environmentally-friendly flight systems.
FY 2019 Performance Summary for Strategic Objective 3.2
Performance Goals (PGs) Annual Performance Indicators (APIs)
Summary of Performance for PGs and APIs Contributing to Strategic Objective 3.2, FY 2014–2019
Note: FY 2018 and FY 2019 contribute to Strategic Objective 3.2, as established by the NASA 2018 Strategic Plan. For FY 2014 through FY 2017, individual PGs and APIs were assigned to a strategic objective based on contributing work.
Ratings may not total 100 percent due to rounding.
Part 2—Strategic Goal 3
NASA’s FY 2021 Volume of Integrated Performance 78
Develop
Performance Goal 3.2.1: Develop solutions that will advance decision-making ability for improving air traffic management to accommodate future growth in air travel, and for increasing aviation safety under hazardous conditions.
2014 2015 2016 2017 2018 2019
Green Green Green Green Green Green
FY 2019 Annual Performance Indicators
AR-19-1: Assess and document capacity of future air traffic services that increase Urban Air Mobility (UAM) capacity over current-day operations.
Green
AR-19-6: Conduct Shadow Mode assessment of Integrated Arrival/Departure/Surface (IADS) metroplex departure metering prototypes.
Green
FY 2020–2021 Performance Plan
3.2.1: Develop solutions that will advance deci-sion-making ability for improving air traffic manage-ment to accommodate future growth in air travel, and for increasing aviation safety under hazardous conditions .
Development milestone(s) completed
Fiscal Year 2020 2021
Target 2 1
Development milestones for FY 20201. Evaluate a service-oriented architecture, intended to
improve safety and efficiency, for traditional opera-tions in a relevant airspace.
2. Conduct an operational assessment of the Integrated Arrival/Departure/Surface (IADS) metroplex departure management prototype.
Development milestone for FY 20211. Develop an initial Urban Air Mobility airspace man-
agement system.
FY 2019 Performance Progress
NASA achieved this performance goal for FY 2019 by conducting evaluations for UAM airspace man-agement and for air traffic management capabili-ties.
NASA is studying what is needed to incorporate new UAM, from package delivery drones to pas-senger-carrying air taxis, safely into the national airspace. In FY 2019, NASA announced the UAM
Grand Challenge to conduct a full field demonstra-tion of UAM systems in a variety of weather and traffic conditions. NASA collaborated with Uber to complete a comprehensive test of the airspace management system to be used for the Grand Challenge. During the 40-minute engineering simulation, NASA and Uber tested the connectiv-ity between their UAM management systems by submitting operations for a set of modeled UAM flights operating in a common airspace. NASA also expects the tests to reduce risk and expedite the future integration of partners into this system as the Grand Challenge continues.
During the summer of 2019, NASA conducted the IADS Phase 3 initial concept evaluation in col-laboration with Southwest Airlines and American Airlines operations centers and four Federal Aviation Administration facilities in North Texas. Phase 3 extends the IADS concept and tech-nologies to the metroplex, or multiple airport, environment. The testing resulted in key find-ings and lessons learned that are being used to refine system requirements in preparation for the FY 2020 Phase 3 operational evaluation. Watch a video about NASA’s Airspace Technology Demonstration-2 IADS Traffic Management.
The Airspace Operations and Safety Program, part of the Aeronautics Research Mission Directorate, is working with partners to conceive and develop the Next Generation Air Transportation, or NextGen, technologies to further improve safety, capacity, and efficiency in the national airspace.
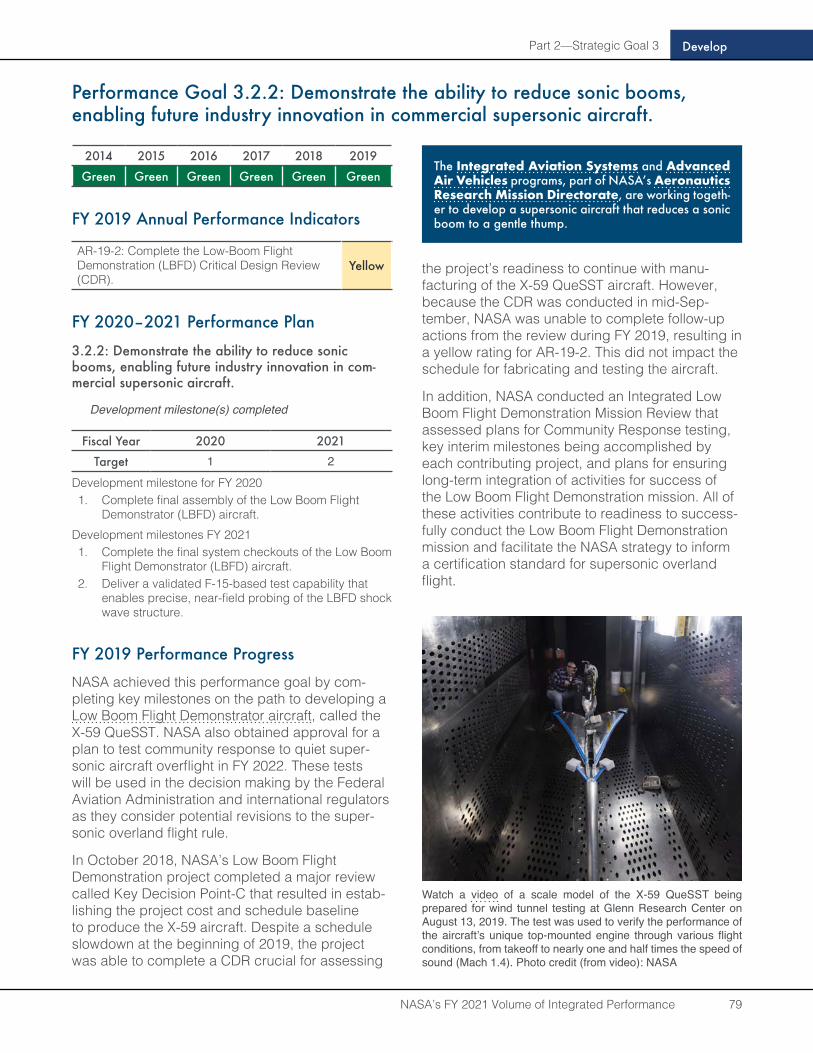
Part 2—Strategic Goal 3
NASA’s FY 2021 Volume of Integrated Performance 79
Develop
Performance Goal 3 .2 .2: Demonstrate the ability to reduce sonic booms, enabling future industry innovation in commercial supersonic aircraft.
2014 2015 2016 2017 2018 2019
Green Green Green Green Green Green
FY 2019 Annual Performance Indicators
AR-19-2: Complete the Low-Boom Flight Demonstration (LBFD) Critical Design Review (CDR).
Yellow
FY 2020–2021 Performance Plan
3 .2 .2: Demonstrate the ability to reduce sonic booms, enabling future industry innovation in com-mercial supersonic aircraft .
Development milestone(s) completed
Fiscal Year 2020 2021
Target 1 2
Development milestone for FY 20201. Complete final assembly of the Low Boom Flight
Demonstrator (LBFD) aircraft.Development milestones FY 20211. Complete the final system checkouts of the Low Boom
Flight Demonstrator (LBFD) aircraft.2. Deliver a validated F-15-based test capability that
enables precise, near-field probing of the LBFD shock wave structure.
FY 2019 Performance Progress
NASA achieved this performance goal by com-pleting key milestones on the path to developing a Low Boom Flight Demonstrator aircraft, called the X-59 QueSST. NASA also obtained approval for a plan to test community response to quiet super-sonic aircraft overflight in FY 2022. These tests will be used in the decision making by the Federal Aviation Administration and international regulators as they consider potential revisions to the super-sonic overland flight rule.
In October 2018, NASA’s Low Boom Flight Demonstration project completed a major review called Key Decision Point-C that resulted in estab-lishing the project cost and schedule baseline to produce the X-59 aircraft. Despite a schedule slowdown at the beginning of 2019, the project was able to complete a CDR crucial for assessing
the project’s readiness to continue with manu-facturing of the X-59 QueSST aircraft. However, because the CDR was conducted in mid-Sep-tember, NASA was unable to complete follow-up actions from the review during FY 2019, resulting in a yellow rating for AR-19-2. This did not impact the schedule for fabricating and testing the aircraft.
In addition, NASA conducted an Integrated Low Boom Flight Demonstration Mission Review that assessed plans for Community Response testing, key interim milestones being accomplished by each contributing project, and plans for ensuring long-term integration of activities for success of the Low Boom Flight Demonstration mission. All of these activities contribute to readiness to success-fully conduct the Low Boom Flight Demonstration mission and facilitate the NASA strategy to inform a certification standard for supersonic overland flight.
The Integrated Aviation Systems and Advanced Air Vehicles programs, part of NASA’s Aeronautics Research Mission Directorate, are working togeth-er to develop a supersonic aircraft that reduces a sonic boom to a gentle thump .
Watch a video of a scale model of the X-59 QueSST being prepared for wind tunnel testing at Glenn Research Center on August 13, 2019. The test was used to verify the performance of the aircraft’s unique top-mounted engine through various flight conditions, from takeoff to nearly one and half times the speed of sound (Mach 1.4). Photo credit (from video): NASA
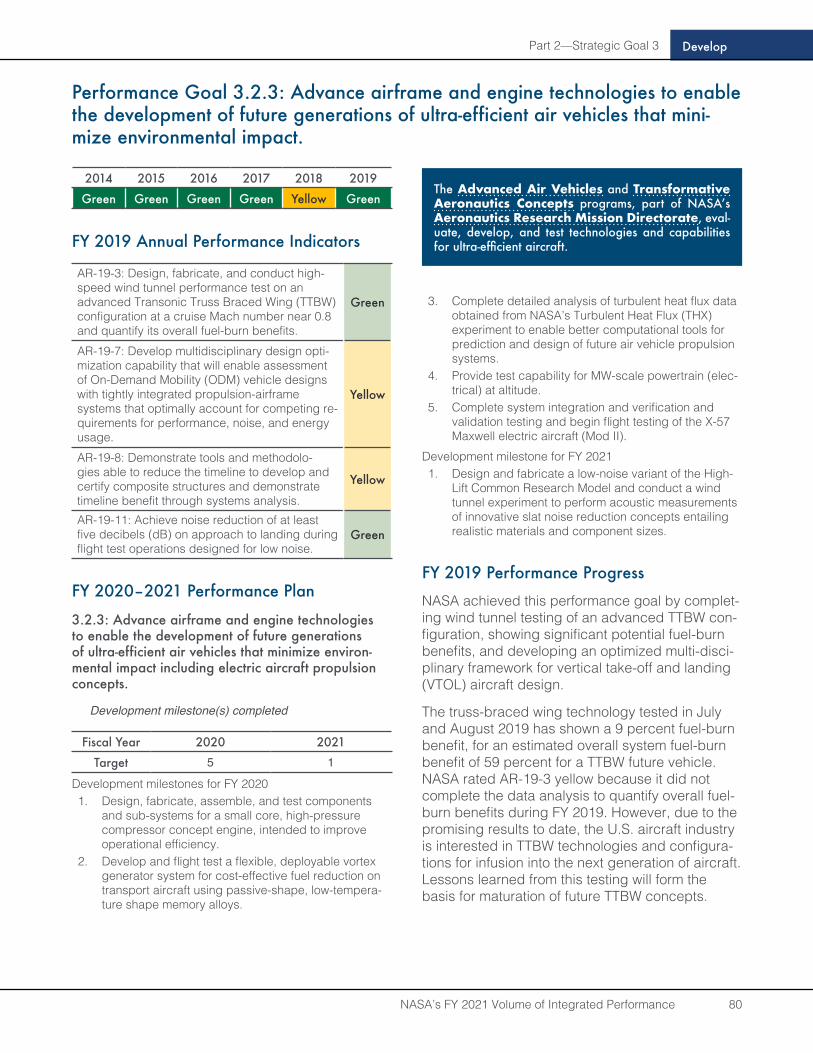
Part 2—Strategic Goal 3
NASA’s FY 2021 Volume of Integrated Performance 80
Develop
Performance Goal 3.2.3: Advance airframe and engine technologies to enable the development of future generations of ultra-efficient air vehicles that mini-mize environmental impact.
2014 2015 2016 2017 2018 2019
Green Green Green Green Yellow Green
FY 2019 Annual Performance Indicators
AR-19-3: Design, fabricate, and conduct high-speed wind tunnel performance test on an advanced Transonic Truss Braced Wing (TTBW) configuration at a cruise Mach number near 0.8 and quantify its overall fuel-burn benefits.
Green
AR-19-7: Develop multidisciplinary design opti-mization capability that will enable assessment of On-Demand Mobility (ODM) vehicle designs with tightly integrated propulsion-airframe systems that optimally account for competing re-quirements for performance, noise, and energy usage.
Yellow
AR-19-8: Demonstrate tools and methodolo-gies able to reduce the timeline to develop and certify composite structures and demonstrate timeline benefit through systems analysis.
Yellow
AR-19-11: Achieve noise reduction of at least five decibels (dB) on approach to landing during flight test operations designed for low noise.
Green
FY 2020–2021 Performance Plan
3.2.3: Advance airframe and engine technologies to enable the development of future generations of ultra-efficient air vehicles that minimize environ-mental impact including electric aircraft propulsion concepts .
Development milestone(s) completed
Fiscal Year 2020 2021
Target 5 1
Development milestones for FY 20201. Design, fabricate, assemble, and test components
and sub-systems for a small core, high-pressure compressor concept engine, intended to improve operational efficiency.
2. Develop and flight test a flexible, deployable vortex generator system for cost-effective fuel reduction on transport aircraft using passive-shape, low-tempera-ture shape memory alloys.
3. Complete detailed analysis of turbulent heat flux data obtained from NASA’s Turbulent Heat Flux (THX) experiment to enable better computational tools for prediction and design of future air vehicle propulsion systems.
4. Provide test capability for MW-scale powertrain (elec-trical) at altitude.
5. Complete system integration and verification and validation testing and begin flight testing of the X-57 Maxwell electric aircraft (Mod II).
Development milestone for FY 20211. Design and fabricate a low-noise variant of the High-
Lift Common Research Model and conduct a wind tunnel experiment to perform acoustic measurements of innovative slat noise reduction concepts entailing realistic materials and component sizes.
FY 2019 Performance Progress
NASA achieved this performance goal by complet-ing wind tunnel testing of an advanced TTBW con-figuration, showing significant potential fuel-burn benefits, and developing an optimized multi-disci-plinary framework for vertical take-off and landing (VTOL) aircraft design.
The truss-braced wing technology tested in July and August 2019 has shown a 9 percent fuel-burn benefit, for an estimated overall system fuel-burn benefit of 59 percent for a TTBW future vehicle. NASA rated AR-19-3 yellow because it did not complete the data analysis to quantify overall fuel-burn benefits during FY 2019. However, due to the promising results to date, the U.S. aircraft industry is interested in TTBW technologies and configura-tions for infusion into the next generation of aircraft. Lessons learned from this testing will form the basis for maturation of future TTBW concepts.
The Advanced Air Vehicles and Transformative Aeronautics Concepts programs, part of NASA’s Aeronautics Research Mission Directorate, eval-uate, develop, and test technologies and capabilities for ultra-efficient aircraft.
Part 2—Strategic Goal 3
NASA’s FY 2021 Volume of Integrated Performance 81
Develop
NASA also completed the development of an optimized multi-disciplinary framework for VTOL aircraft design and used the framework to design four NASA concept vehicles that represent a new type of electric vertical flight aircraft. The NASA concept vehicles are being used by NASA and external organizations as a way to talk about the new mission and requirements without discussing any proprietary information. NASA’s design soft-ware for vertical lift vehicles has been released to over 160 requestors, and NASA is now providing annual training on the use of the design software.
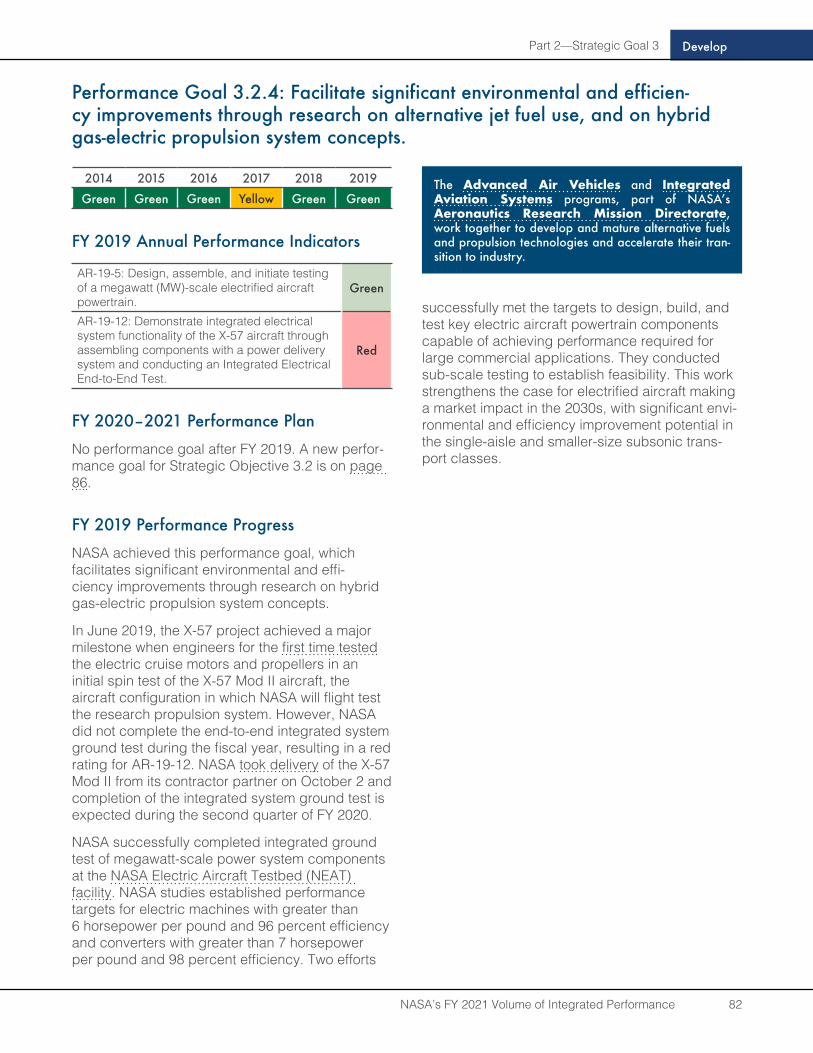
Part 2—Strategic Goal 3
NASA’s FY 2021 Volume of Integrated Performance 82
Develop
Performance Goal 3.2.4: Facilitate significant environmental and efficien-cy improvements through research on alternative jet fuel use, and on hybrid gas-electric propulsion system concepts .
2014 2015 2016 2017 2018 2019
Green Green Green Yellow Green Green
FY 2019 Annual Performance Indicators
AR-19-5: Design, assemble, and initiate testing of a megawatt (MW)-scale electrified aircraft powertrain.
Green
AR-19-12: Demonstrate integrated electrical system functionality of the X-57 aircraft through assembling components with a power delivery system and conducting an Integrated Electrical End-to-End Test.
Red
FY 2020–2021 Performance Plan
No performance goal after FY 2019. A new perfor-mance goal for Strategic Objective 3.2 is on page 86.
FY 2019 Performance Progress
NASA achieved this performance goal, which facilitates significant environmental and effi-ciency improvements through research on hybrid gas-electric propulsion system concepts.
In June 2019, the X-57 project achieved a major milestone when engineers for the first time tested the electric cruise motors and propellers in an initial spin test of the X-57 Mod II aircraft, the aircraft configuration in which NASA will flight test the research propulsion system. However, NASA did not complete the end-to-end integrated system ground test during the fiscal year, resulting in a red rating for AR-19-12. NASA took delivery of the X-57 Mod II from its contractor partner on October 2 and completion of the integrated system ground test is expected during the second quarter of FY 2020.
NASA successfully completed integrated ground test of megawatt-scale power system components at the NASA Electric Aircraft Testbed (NEAT) facility. NASA studies established performance targets for electric machines with greater than 6 horsepower per pound and 96 percent efficiency and converters with greater than 7 horsepower per pound and 98 percent efficiency. Two efforts
successfully met the targets to design, build, and test key electric aircraft powertrain components capable of achieving performance required for large commercial applications. They conducted sub-scale testing to establish feasibility. This work strengthens the case for electrified aircraft making a market impact in the 2030s, with significant envi-ronmental and efficiency improvement potential in the single-aisle and smaller-size subsonic trans-port classes.
The Advanced Air Vehicles and Integrated Aviation Systems programs, part of NASA’s Aeronautics Research Mission Directorate, work together to develop and mature alternative fuels and propulsion technologies and accelerate their tran-sition to industry .
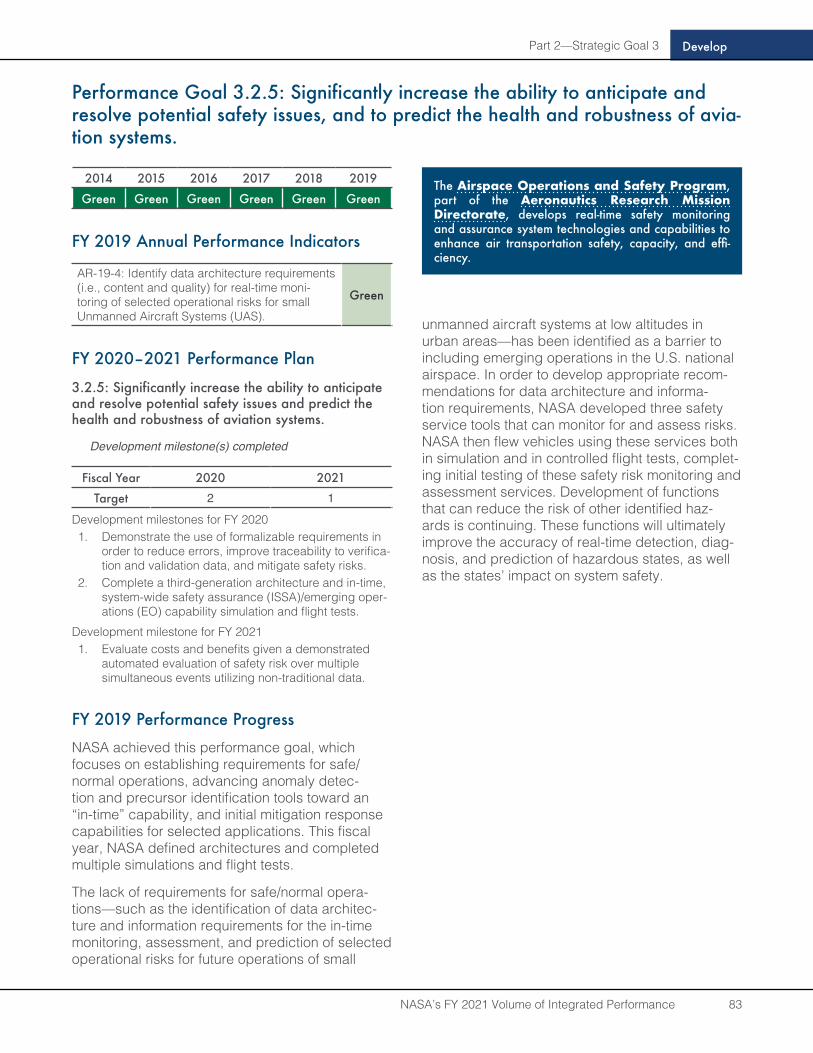
Part 2—Strategic Goal 3
NASA’s FY 2021 Volume of Integrated Performance 83
Develop
Performance Goal 3 .2 .5: Significantly increase the ability to anticipate and resolve potential safety issues, and to predict the health and robustness of avia-tion systems .
2014 2015 2016 2017 2018 2019
Green Green Green Green Green Green
FY 2019 Annual Performance Indicators
AR-19-4: Identify data architecture requirements (i.e., content and quality) for real-time moni-toring of selected operational risks for small Unmanned Aircraft Systems (UAS).
Green
FY 2020–2021 Performance Plan
3 .2 .5: Significantly increase the ability to anticipate and resolve potential safety issues and predict the health and robustness of aviation systems.
Development milestone(s) completed
Fiscal Year 2020 2021
Target 2 1
Development milestones for FY 20201. Demonstrate the use of formalizable requirements in
order to reduce errors, improve traceability to verifica-tion and validation data, and mitigate safety risks.
2. Complete a third-generation architecture and in-time, system-wide safety assurance (ISSA)/emerging oper-ations (EO) capability simulation and flight tests.
Development milestone for FY 20211. Evaluate costs and benefits given a demonstrated
automated evaluation of safety risk over multiple simultaneous events utilizing non-traditional data.
FY 2019 Performance Progress
NASA achieved this performance goal, which focuses on establishing requirements for safe/normal operations, advancing anomaly detec-tion and precursor identification tools toward an “in-time” capability, and initial mitigation response capabilities for selected applications. This fiscal year, NASA defined architectures and completed multiple simulations and flight tests.
The lack of requirements for safe/normal opera-tions—such as the identification of data architec-ture and information requirements for the in-time monitoring, assessment, and prediction of selected operational risks for future operations of small
unmanned aircraft systems at low altitudes in urban areas—has been identified as a barrier to including emerging operations in the U.S. national airspace. In order to develop appropriate recom-mendations for data architecture and informa-tion requirements, NASA developed three safety service tools that can monitor for and assess risks. NASA then flew vehicles using these services both in simulation and in controlled flight tests, complet-ing initial testing of these safety risk monitoring and assessment services. Development of functions that can reduce the risk of other identified haz-ards is continuing. These functions will ultimately improve the accuracy of real-time detection, diag-nosis, and prediction of hazardous states, as well as the states’ impact on system safety.
The Airspace Operations and Safety Program, part of the Aeronautics Research Mission Directorate, develops real-time safety monitoring and assurance system technologies and capabilities to enhance air transportation safety, capacity, and effi-ciency .
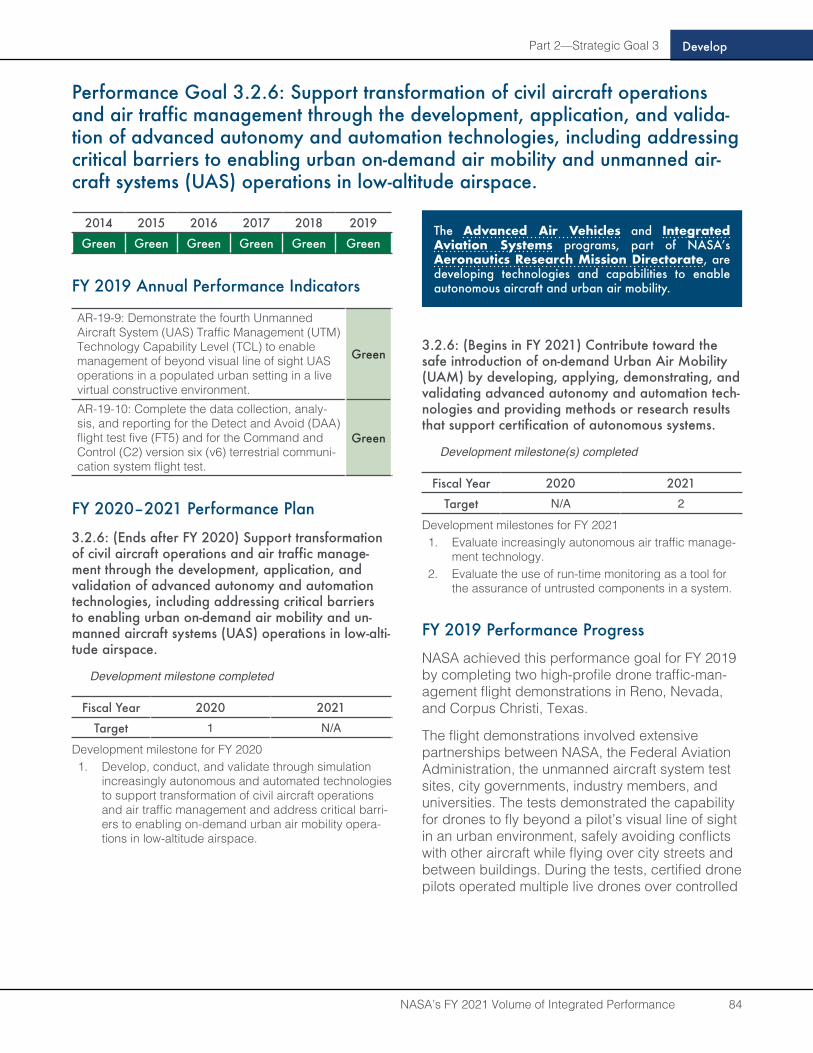
Part 2—Strategic Goal 3
NASA’s FY 2021 Volume of Integrated Performance 84
Develop
Performance Goal 3.2.6: Support transformation of civil aircraft operations and air traffic management through the development, application, and valida-tion of advanced autonomy and automation technologies, including addressing critical barriers to enabling urban on-demand air mobility and unmanned air-craft systems (UAS) operations in low-altitude airspace .
2014 2015 2016 2017 2018 2019
Green Green Green Green Green Green
FY 2019 Annual Performance Indicators
AR-19-9: Demonstrate the fourth Unmanned Aircraft System (UAS) Traffic Management (UTM) Technology Capability Level (TCL) to enable management of beyond visual line of sight UAS operations in a populated urban setting in a live virtual constructive environment.
Green
AR-19-10: Complete the data collection, analy-sis, and reporting for the Detect and Avoid (DAA) flight test five (FT5) and for the Command and Control (C2) version six (v6) terrestrial communi-cation system flight test.
Green
FY 2020–2021 Performance Plan
3 .2 .6: (Ends after FY 2020) Support transformation of civil aircraft operations and air traffic manage-ment through the development, application, and validation of advanced autonomy and automation technologies, including addressing critical barriers to enabling urban on-demand air mobility and un-manned aircraft systems (UAS) operations in low-alti-tude airspace .
Development milestone completed
Fiscal Year 2020 2021
Target 1 N/A
Development milestone for FY 20201. Develop, conduct, and validate through simulation
increasingly autonomous and automated technologies to support transformation of civil aircraft operations and air traffic management and address critical barri-ers to enabling on-demand urban air mobility opera-tions in low-altitude airspace.
3 .2 .6: (Begins in FY 2021) Contribute toward the safe introduction of on-demand Urban Air Mobility (UAM) by developing, applying, demonstrating, and validating advanced autonomy and automation tech-nologies and providing methods or research results that support certification of autonomous systems .
Development milestone(s) completed
Fiscal Year 2020 2021
Target N/A 2
Development milestones for FY 20211. Evaluate increasingly autonomous air traffic manage-
ment technology.2. Evaluate the use of run-time monitoring as a tool for
the assurance of untrusted components in a system.
FY 2019 Performance Progress
NASA achieved this performance goal for FY 2019 by completing two high-profile drone traffic-man-agement flight demonstrations in Reno, Nevada, and Corpus Christi, Texas.
The flight demonstrations involved extensive partnerships between NASA, the Federal Aviation Administration, the unmanned aircraft system test sites, city governments, industry members, and universities. The tests demonstrated the capability for drones to fly beyond a pilot’s visual line of sight in an urban environment, safely avoiding conflicts with other aircraft while flying over city streets and between buildings. During the tests, certified drone pilots operated multiple live drones over controlled
The Advanced Air Vehicles and Integrated Aviation Systems programs, part of NASA’s Aeronautics Research Mission Directorate, are developing technologies and capabilities to enable autonomous aircraft and urban air mobility .
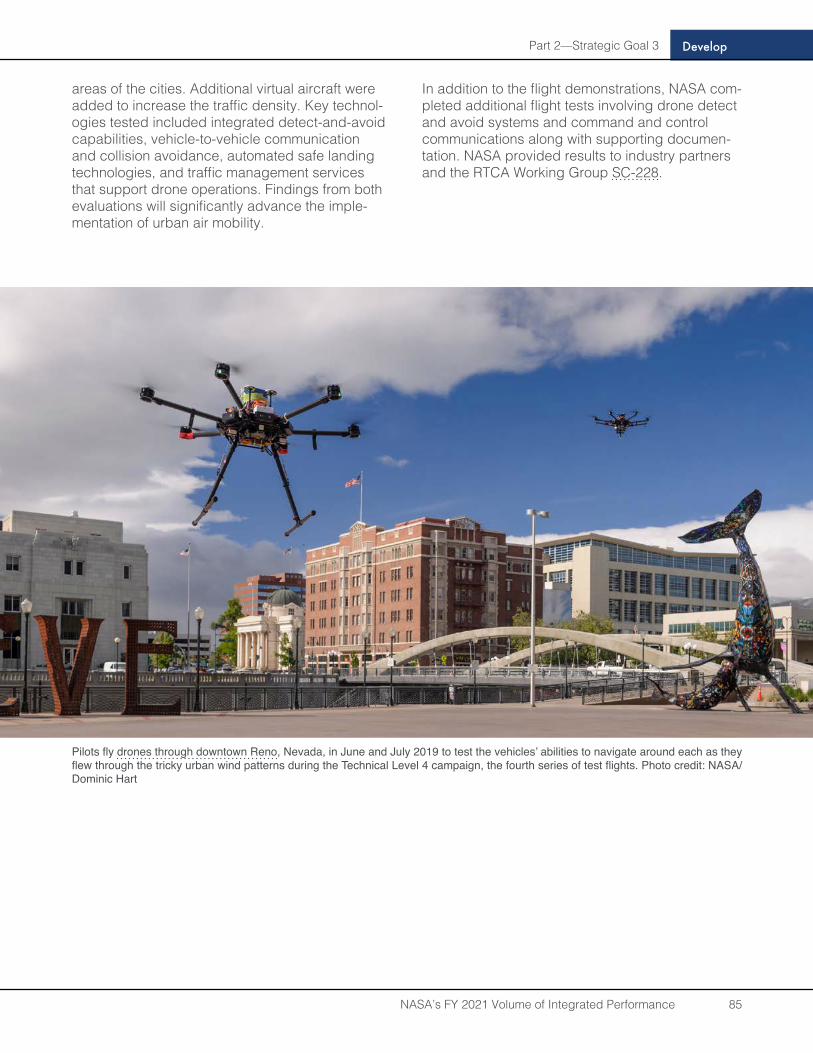
Part 2—Strategic Goal 3
NASA’s FY 2021 Volume of Integrated Performance 85
Develop
areas of the cities. Additional virtual aircraft were added to increase the traffic density. Key technol-ogies tested included integrated detect-and-avoid capabilities, vehicle-to-vehicle communication and collision avoidance, automated safe landing technologies, and traffic management services that support drone operations. Findings from both evaluations will significantly advance the imple-mentation of urban air mobility.
In addition to the flight demonstrations, NASA com-pleted additional flight tests involving drone detect and avoid systems and command and control communications along with supporting documen-tation. NASA provided results to industry partners and the RTCA Working Group SC-228.
Pilots fly drones through downtown Reno, Nevada, in June and July 2019 to test the vehicles’ abilities to navigate around each as they flew through the tricky urban wind patterns during the Technical Level 4 campaign, the fourth series of test flights. Photo credit: NASA/Dominic Hart
Part 2—Strategic Goal 3
NASA’s FY 2021 Volume of Integrated Performance 86
Develop
FY 2020–2021 Performance Plan: New Performance Goal
Performance Goal 3.2.4: Advance airframe and propulsion technologies to enable the development of vertical take-off and landing (VTOL) vehicles that minimize noise and maximize safety .
Development milestone completed
Fiscal Year 2020 2021
Target 1 1
Development milestone for FY 20201. Develop the theory for, and implement and assess the
functionality of, Broadband Acoustic Rotor Codes for application to VTOL Urban Air Mobility (UAM) vehi-cles.
Development milestone for FY 20211. Complete conceptual design and sizing trade studies
for VTOL Urban Air Mobility (UAM) configurations.
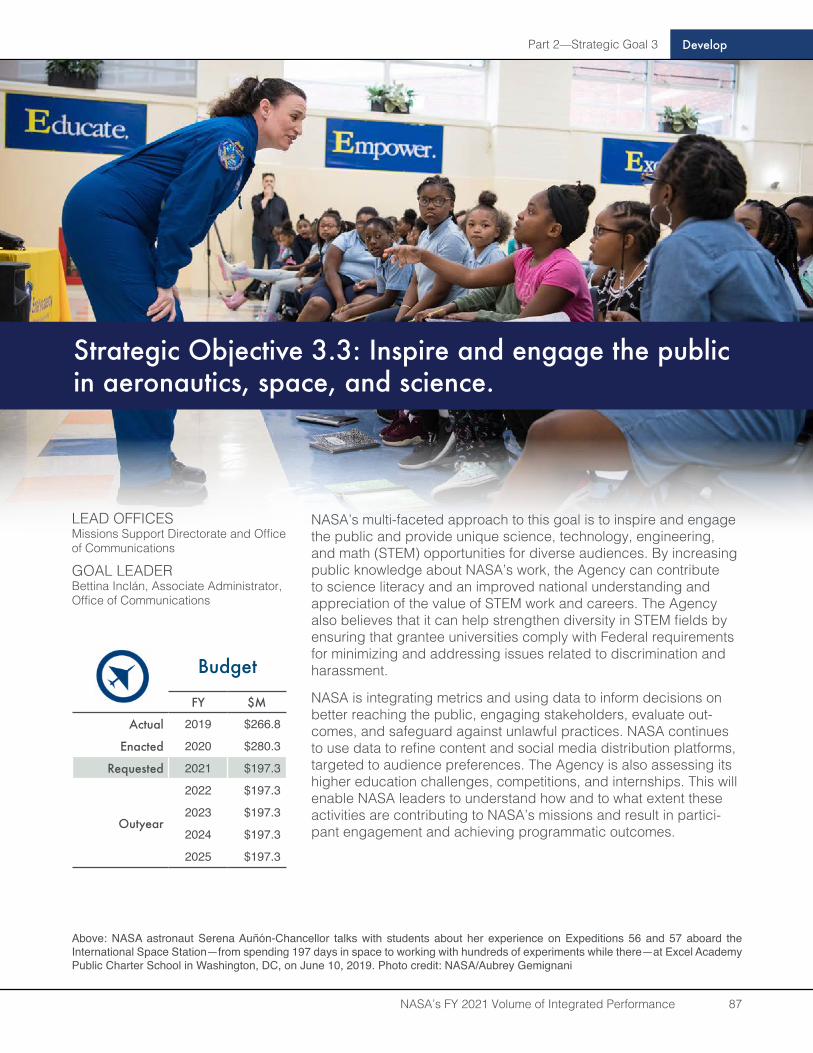
Part 2—Strategic Goal 3
NASA’s FY 2021 Volume of Integrated Performance 87
Develop
LEAD OFFICESMissions Support Directorate and Office of Communications
GOAL LEADERBettina Inclán, Associate Administrator, Office of Communications
Budget
FY $M
Actual 2019 $266.8
Enacted 2020 $280.3
Requested 2021 $197.3
Outyear
2022 $197.3
2023 $197.3
2024 $197.3
2025 $197.3
Strategic Objective 3.3: Inspire and engage the public in aeronautics, space, and science .
NASA’s multi-faceted approach to this goal is to inspire and engage the public and provide unique science, technology, engineering, and math (STEM) opportunities for diverse audiences. By increasing public knowledge about NASA’s work, the Agency can contribute to science literacy and an improved national understanding and appreciation of the value of STEM work and careers. The Agency also believes that it can help strengthen diversity in STEM fields by ensuring that grantee universities comply with Federal requirements for minimizing and addressing issues related to discrimination and harassment.
NASA is integrating metrics and using data to inform decisions on better reaching the public, engaging stakeholders, evaluate out-comes, and safeguard against unlawful practices. NASA continues to use data to refine content and social media distribution platforms, targeted to audience preferences. The Agency is also assessing its higher education challenges, competitions, and internships. This will enable NASA leaders to understand how and to what extent these activities are contributing to NASA’s missions and result in partici-pant engagement and achieving programmatic outcomes.
Above: NASA astronaut Serena Auñón-Chancellor talks with students about her experience on Expeditions 56 and 57 aboard the International Space Station—from spending 197 days in space to working with hundreds of experiments while there—at Excel Academy Public Charter School in Washington, DC, on June 10, 2019. Photo credit: NASA/Aubrey Gemignani
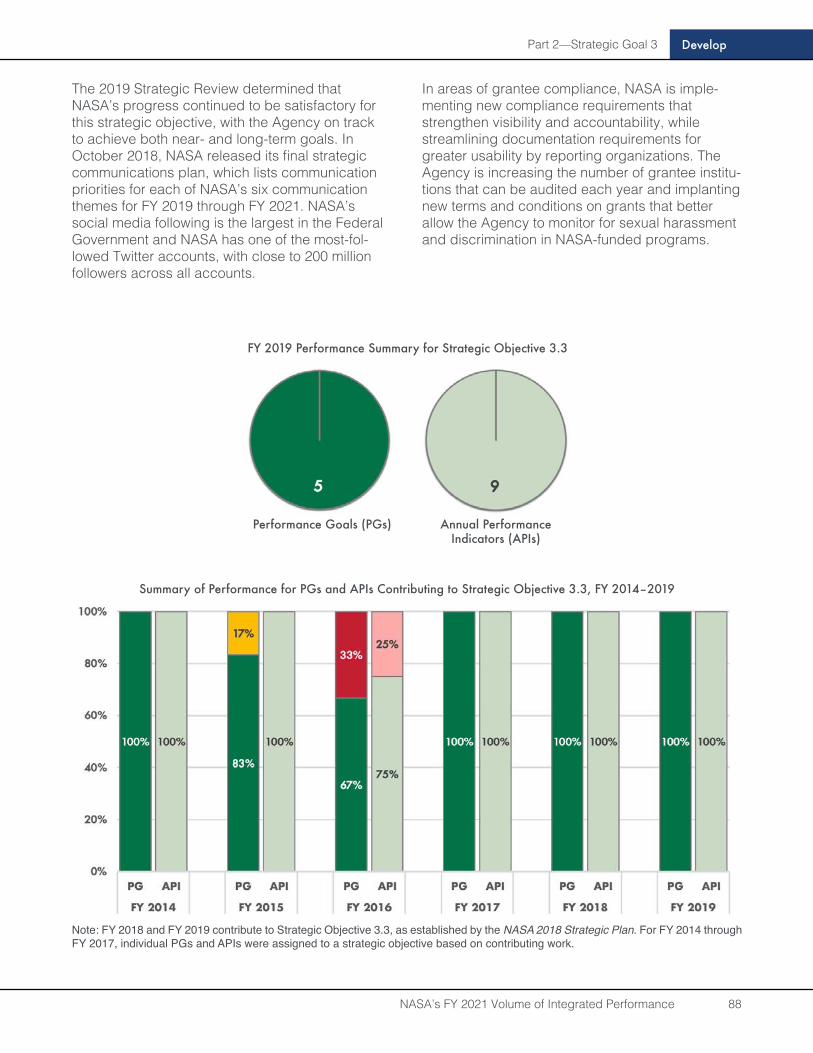
Part 2—Strategic Goal 3
NASA’s FY 2021 Volume of Integrated Performance 88
Develop
The 2019 Strategic Review determined that NASA’s progress continued to be satisfactory for this strategic objective, with the Agency on track to achieve both near- and long-term goals. In October 2018, NASA released its final strategic communications plan, which lists communication priorities for each of NASA’s six communication themes for FY 2019 through FY 2021. NASA’s social media following is the largest in the Federal Government and NASA has one of the most-fol-lowed Twitter accounts, with close to 200 million followers across all accounts.
In areas of grantee compliance, NASA is imple-menting new compliance requirements that strengthen visibility and accountability, while streamlining documentation requirements for greater usability by reporting organizations. The Agency is increasing the number of grantee institu-tions that can be audited each year and implanting new terms and conditions on grants that better allow the Agency to monitor for sexual harassment and discrimination in NASA-funded programs.
FY 2019 Performance Summary for Strategic Objective 3.3
Performance Goals (PGs) Annual Performance Indicators (APIs)
Summary of Performance for PGs and APIs Contributing to Strategic Objective 3.3, FY 2014–2019
Note: FY 2018 and FY 2019 contribute to Strategic Objective 3.3, as established by the NASA 2018 Strategic Plan. For FY 2014 through FY 2017, individual PGs and APIs were assigned to a strategic objective based on contributing work.

Part 2—Strategic Goal 3
NASA’s FY 2021 Volume of Integrated Performance 89
Develop
Performance Goal 3.3.1: Enhance reach and effectiveness of programs and projects that engage the public .
2014 2015 2016 2017 2018 2019
Green Yellow Green Green Green Green
FY 2019 Annual Performance Indicators
AMO-19-1: Add at least one new communi-cations technology, platform, tool, or method to make more effective operations and use of resources in alignment with the communications priorities.
Green
AMO-19-2: Add at least one new communica-tions technology, platform, tool or method to achieve more systematic measurement and eval-uation of reach, outcomes, and value of agency communications investments.
Green
AMO-19-3: Add at least one new communica-tions technology, platform, tool or method to help prepare NASA employees to engage in telling the NASA story.
Green
SMD-19-1: Expand Science Mission Directorate unique assets to support learners in all 50 states. Green
FY 2020–2021 Performance Plan
3.3.1: Increase NASA’s public engagement through social media .
Percentage of annual social media audience growth across all flagship platforms
Fiscal Year 2020 2021
Target 10% 10%
FY 2019 Performance Progress
NASA achieved this performance goal in FY 2019 by achieving all three performance indicators, which were to improve operations, metrics analysis and employee engagement through the addition of one or more communications technologies, plat-forms, tools or methods.
NASA added three content distribution platforms and two special-purpose communications toolkit pages, which include downloadable fact sheets, photos, graphics, and more. NASA also refined its media measurement methodology and applied new strategic approaches to public engagement.
These improvements have resulted in better stew-ardship of communications resources, a better-in-formed workforce, and better awareness of NASA’s work among stakeholders and the public.
To increase public engagement, NASA TV became available on Samsung Worldwide and Hulu, and a new NASA newsletter (subscribe here) was launched with a subscriber base that has already grown to one million. NASA is now tracking clicks on search queries related to Artemis as a proxy for increasing public interest in the program. Clicks are exceeding the target of five percent growth each week.
Better management of digital presence also has decreased information redundancy and enhanced audience engagement, as shown when the History.nasa.gov domain was overhauled in July 2019. This project made the site mobile-friendly and dramatically improved searchability. NASA has also initiated a project to right-size its digital footprint by eliminating or consolidating low value, low traffic websites and social media accounts, with a goal of a 30 percent reduction among 3,000 websites and 710 social media accounts. This effort will give even more visibility to NASA’s flagship social media accounts, which have more than 110 million followers (see the figure on the following page), and will strengthen cybersecurity.
NASA’s Office of Communications develops and implements outreach strategies to communicate NASA’s activities, priorities, and achievements to a wide audience .
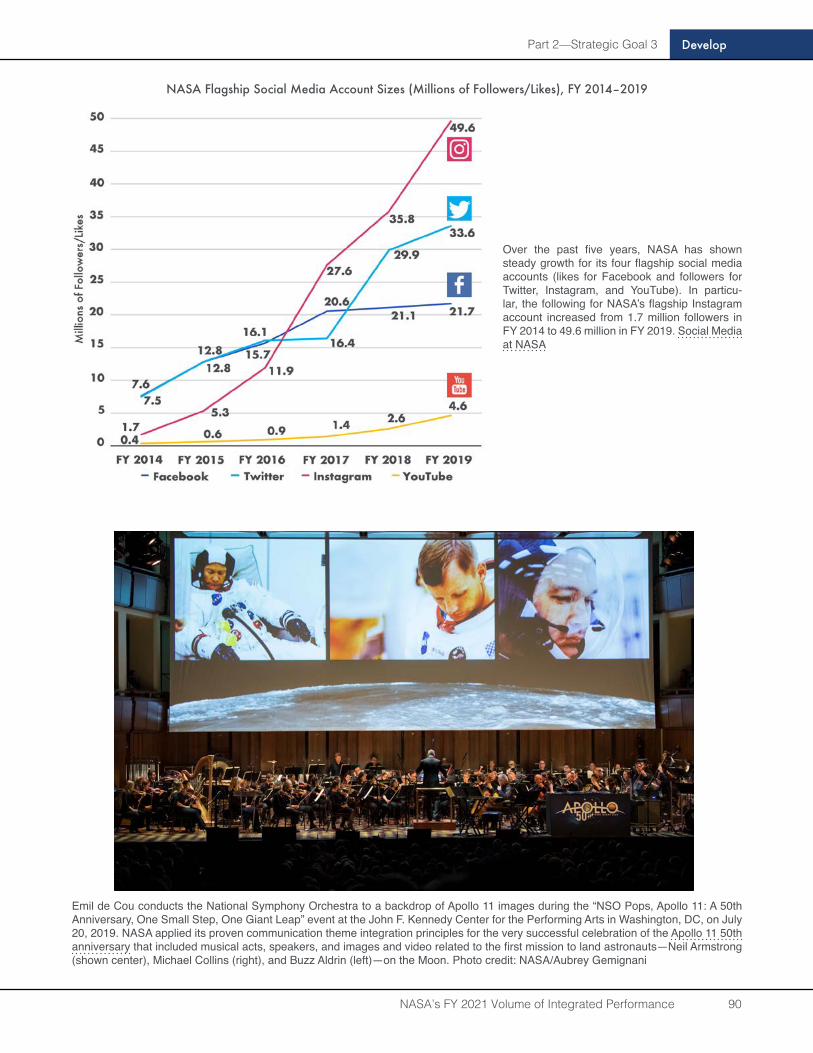
Part 2—Strategic Goal 3
NASA’s FY 2021 Volume of Integrated Performance 90
Develop
Over the past five years, NASA has shown steady growth for its four flagship social media accounts (likes for Facebook and followers for Twitter, Instagram, and YouTube). In particu-lar, the following for NASA’s flagship Instagram account increased from 1.7 million followers in FY 2014 to 49.6 million in FY 2019. Social Media at NASA
Emil de Cou conducts the National Symphony Orchestra to a backdrop of Apollo 11 images during the “NSO Pops, Apollo 11: A 50th Anniversary, One Small Step, One Giant Leap” event at the John F. Kennedy Center for the Performing Arts in Washington, DC, on July 20, 2019. NASA applied its proven communication theme integration principles for the very successful celebration of the Apollo 11 50th anniversary that included musical acts, speakers, and images and video related to the first mission to land astronauts—Neil Armstrong (shown center), Michael Collins (right), and Buzz Aldrin (left)—on the Moon. Photo credit: NASA/Aubrey Gemignani
NASA Flagship Social Media Account Sizes (Millions of Followers/Likes), FY 2014–2019
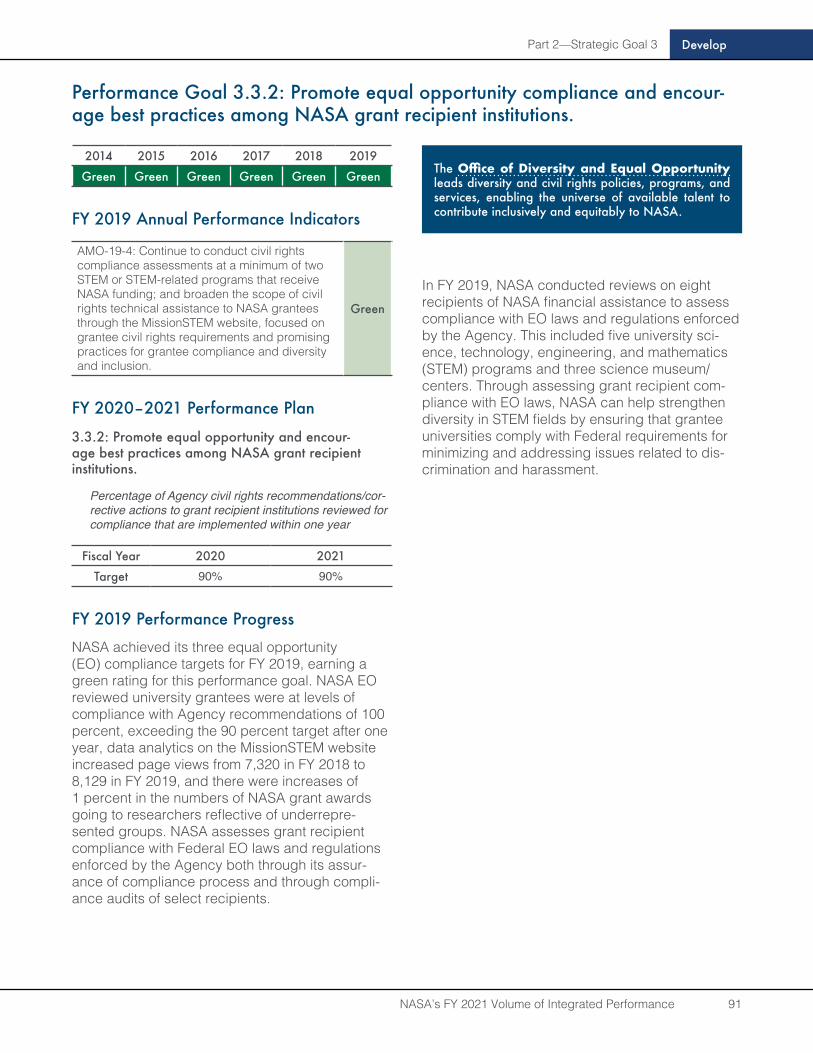
Part 2—Strategic Goal 3
NASA’s FY 2021 Volume of Integrated Performance 91
Develop
Performance Goal 3 .3 .2: Promote equal opportunity compliance and encour-age best practices among NASA grant recipient institutions .
2014 2015 2016 2017 2018 2019
Green Green Green Green Green Green
FY 2019 Annual Performance Indicators
AMO-19-4: Continue to conduct civil rights compliance assessments at a minimum of two STEM or STEM-related programs that receive NASA funding; and broaden the scope of civil rights technical assistance to NASA grantees through the MissionSTEM website, focused on grantee civil rights requirements and promising practices for grantee compliance and diversity and inclusion.
Green
FY 2020–2021 Performance Plan
3 .3 .2: Promote equal opportunity and encour-age best practices among NASA grant recipient institutions .
Percentage of Agency civil rights recommendations/cor-rective actions to grant recipient institutions reviewed for compliance that are implemented within one year
Fiscal Year 2020 2021
Target 90% 90%
FY 2019 Performance Progress
NASA achieved its three equal opportunity (EO) compliance targets for FY 2019, earning a green rating for this performance goal. NASA EO reviewed university grantees were at levels of compliance with Agency recommendations of 100 percent, exceeding the 90 percent target after one year, data analytics on the MissionSTEM website increased page views from 7,320 in FY 2018 to 8,129 in FY 2019, and there were increases of 1 percent in the numbers of NASA grant awards going to researchers reflective of underrepre-sented groups. NASA assesses grant recipient compliance with Federal EO laws and regulations enforced by the Agency both through its assur-ance of compliance process and through compli-ance audits of select recipients.
In FY 2019, NASA conducted reviews on eight recipients of NASA financial assistance to assess compliance with EO laws and regulations enforced by the Agency. This included five university sci-ence, technology, engineering, and mathematics (STEM) programs and three science museum/centers. Through assessing grant recipient com-pliance with EO laws, NASA can help strengthen diversity in STEM fields by ensuring that grantee universities comply with Federal requirements for minimizing and addressing issues related to dis-crimination and harassment.
The Office of Diversity and Equal Opportunity leads diversity and civil rights policies, programs, and services, enabling the universe of available talent to contribute inclusively and equitably to NASA.
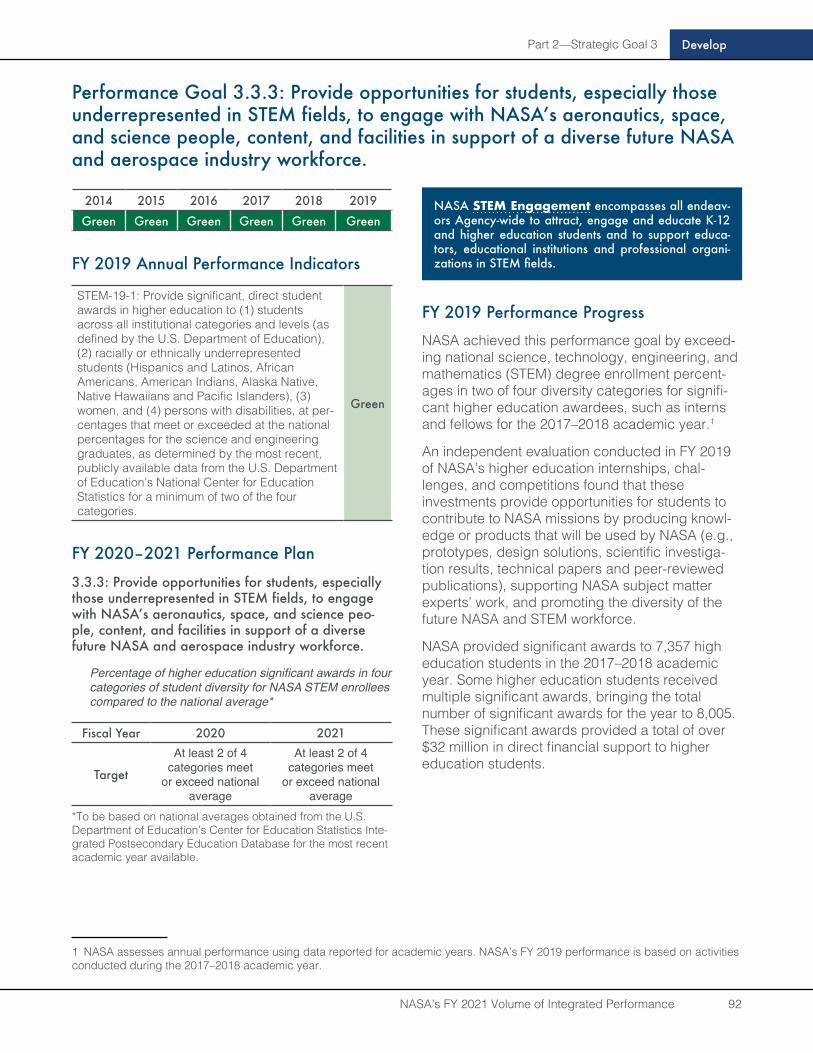
Part 2—Strategic Goal 3
NASA’s FY 2021 Volume of Integrated Performance 92
Develop
Performance Goal 3.3.3: Provide opportunities for students, especially those underrepresented in STEM fields, to engage with NASA’s aeronautics, space, and science people, content, and facilities in support of a diverse future NASA and aerospace industry workforce .
1 NASA assesses annual performance using data reported for academic years. NASA’s FY 2019 performance is based on activities conducted during the 2017–2018 academic year.
2014 2015 2016 2017 2018 2019
Green Green Green Green Green Green
FY 2019 Annual Performance Indicators
STEM-19-1: Provide significant, direct student awards in higher education to (1) students across all institutional categories and levels (as defined by the U.S. Department of Education), (2) racially or ethnically underrepresented students (Hispanics and Latinos, African Americans, American Indians, Alaska Native, Native Hawaiians and Pacific Islanders), (3) women, and (4) persons with disabilities, at per-centages that meet or exceeded at the national percentages for the science and engineering graduates, as determined by the most recent, publicly available data from the U.S. Department of Education’s National Center for Education Statistics for a minimum of two of the four categories.
Green
FY 2020–2021 Performance Plan
3.3.3: Provide opportunities for students, especially those underrepresented in STEM fields, to engage with NASA’s aeronautics, space, and science peo-ple, content, and facilities in support of a diverse future NASA and aerospace industry workforce .
Percentage of higher education significant awards in four categories of student diversity for NASA STEM enrollees compared to the national average*
Fiscal Year 2020 2021
Target
At least 2 of 4 categories meet
or exceed national average
At least 2 of 4 categories meet
or exceed national average
*To be based on national averages obtained from the U.S. Department of Education’s Center for Education Statistics Inte-grated Postsecondary Education Database for the most recent academic year available.
FY 2019 Performance Progress
NASA achieved this performance goal by exceed-ing national science, technology, engineering, and mathematics (STEM) degree enrollment percent-ages in two of four diversity categories for signifi-cant higher education awardees, such as interns and fellows for the 2017–2018 academic year.1
An independent evaluation conducted in FY 2019 of NASA’s higher education internships, chal-lenges, and competitions found that these investments provide opportunities for students to contribute to NASA missions by producing knowl-edge or products that will be used by NASA (e.g., prototypes, design solutions, scientific investiga-tion results, technical papers and peer-reviewed publications), supporting NASA subject matter experts’ work, and promoting the diversity of the future NASA and STEM workforce.
NASA provided significant awards to 7,357 high education students in the 2017–2018 academic year. Some higher education students received multiple significant awards, bringing the total number of significant awards for the year to 8,005. These significant awards provided a total of over $32 million in direct financial support to higher education students.
NASA STEM Engagement encompasses all endeav-ors Agency-wide to attract, engage and educate K-12 and higher education students and to support educa-tors, educational institutions and professional organi-zations in STEM fields.
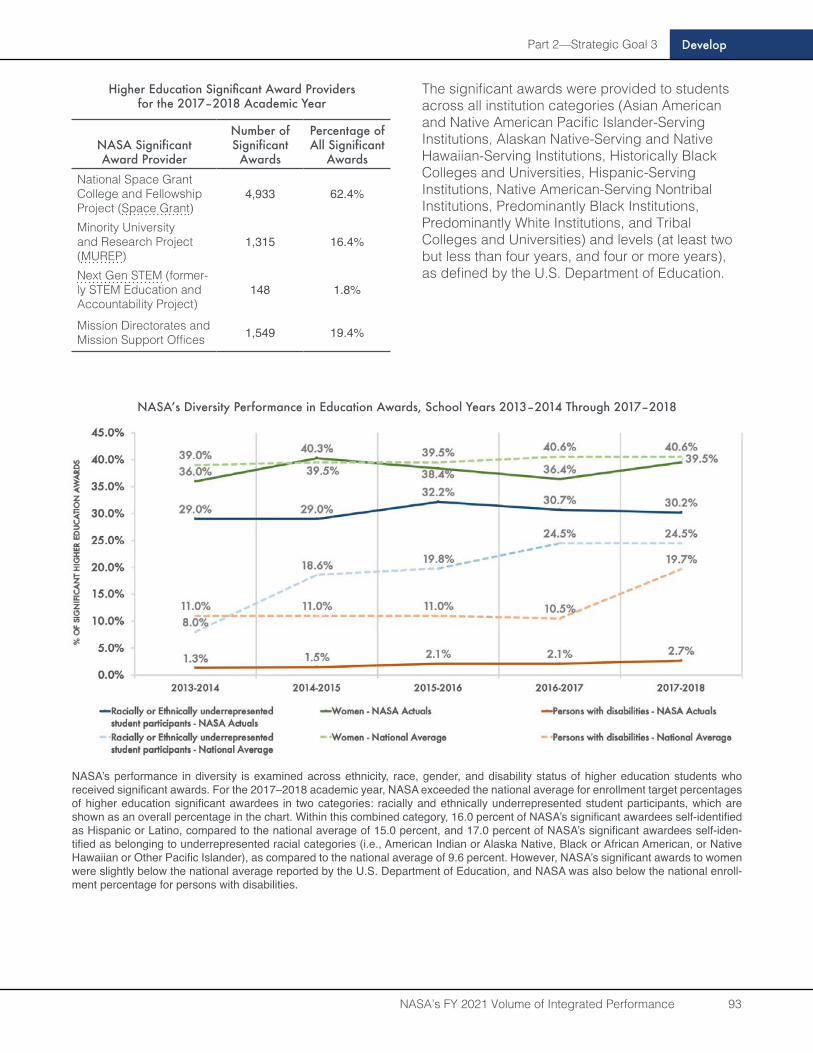
Part 2—Strategic Goal 3
NASA’s FY 2021 Volume of Integrated Performance 93
Develop
Higher Education Significant Award Providers for the 2017–2018 Academic Year
NASA Significant Award Provider
Number of Significant
Awards
Percentage of All Significant
AwardsNational Space Grant College and Fellowship Project (Space Grant)
4,933 62.4%
Minority University and Research Project (MUREP)
1,315 16.4%
Next Gen STEM (former-ly STEM Education and Accountability Project)
148 1.8%
Mission Directorates and Mission Support Offices 1,549 19.4%
The significant awards were provided to students across all institution categories (Asian American and Native American Pacific Islander-Serving Institutions, Alaskan Native-Serving and Native Hawaiian-Serving Institutions, Historically Black Colleges and Universities, Hispanic-Serving Institutions, Native American-Serving Nontribal Institutions, Predominantly Black Institutions, Predominantly White Institutions, and Tribal Colleges and Universities) and levels (at least two but less than four years, and four or more years), as defined by the U.S. Department of Education.
NASA’s performance in diversity is examined across ethnicity, race, gender, and disability status of higher education students who received significant awards. For the 2017–2018 academic year, NASA exceeded the national average for enrollment target percentages of higher education significant awardees in two categories: racially and ethnically underrepresented student participants, which are shown as an overall percentage in the chart. Within this combined category, 16.0 percent of NASA’s significant awardees self-identified as Hispanic or Latino, compared to the national average of 15.0 percent, and 17.0 percent of NASA’s significant awardees self-iden-tified as belonging to underrepresented racial categories (i.e., American Indian or Alaska Native, Black or African American, or Native Hawaiian or Other Pacific Islander), as compared to the national average of 9.6 percent. However, NASA’s significant awards to women were slightly below the national average reported by the U.S. Department of Education, and NASA was also below the national enroll-ment percentage for persons with disabilities.
NASA’s Diversity Performance in Education Awards, School Years 2013–2014 Through 2017–2018
Part 2—Strategic Goal 3
NASA’s FY 2021 Volume of Integrated Performance 94
Develop
Performance Goal 3.3.4: Enhance the effectiveness of education investments using performance assessment and evaluation-driven processes.
2014 2015 2016 2017 2018 2019None before FY 2018 Green Green
FY 2019 Annual Performance Indicators
STEM-19-2: Design a comprehensive data management system aligned to performance assessment and evaluation strategy to collect, analyze, and report data for STEM engagement investments.
Green
FY 2020–2021 Performance Plan
3.3.4: Enhance the effectiveness of education invest-ments using performance assessment and evalua-tion-driven processes.
Milestone achieved in the implementation of perfor-mance assessment and evaluation of STEM engage-ment investments
Fiscal Year 2020 2021
Target 1 met or exceeded 1 met or exceeded
Milestone for FY 20201. Award a competitive agreement to conduct a multi-
year, third-party, project-level evaluation of the National Space Grant College and Fellowship Project.
Milestone for FY 20211. Conduct a study focused on NASA STEM engage-
ment elementary and secondary formal and informal education investments to build knowledge about how these activities 1) align to NASA’s missions, 2) serve national and regional STEM ecosystems, and 3) engage participants from groups historically under-represented and/or underserved in STEM fields.
FY 2019 Performance Progress
In FY 2019, NASA achieved this performance goal by making significant progress to enhance the effectiveness of science, technology, engineering, and mathematics (STEM) engagement invest-ments using performance assessment and evalua-tion-driven processes.
NASA developed and executed a Learning Agenda which provides a systematic approach for building and using new knowledge about project and operational performance. The founda-tion of the Learning Agenda is an iterative evi-
dence-based decision-making process, which is a rigorous approach to planning and implementing activities through five steps that culminate with an evaluation of the learning process.
In alignment with the Learning Agenda and evi-dence-based decision-making process, a STEM engagement evaluation contract was issued for an independent multiple case study focused on NASA higher education challenges, competitions, and internships. The study characterized student con-tributions to NASA’s missions and work, provided recommendations for evidence-based design of future challenges, competitions, and internships, and classified demographics of higher education student participants.
The findings and recommendations resulting from the NASA Higher Education Challenges, Competitions, and Internships Multiple Case Study were shared with NASA internal stake-holders (activity managers) and external stake-holders (NASA STEM Engagement grantees and awardees) who are currently using the information to enhance existing activities and inform the design of future activities.
Additionally, in FY 2019, NASA designed a content management platform aligned to the performance assessment and evaluation strategy that integrates multiple legacy systems, and where possible, allows for the automation of manual data collection processes used across the Agency. Building upon requirements gathered from stakeholders and subject matter experts, the design team will create data modeling for implementation and migration of existing systems in FY 2020.
NASA STEM Engagement encompasses all endeav-ors Agency-wide to attract, engage and educate K-12 and higher education students and to support educa-tors, educational institutions and professional organi-zations in STEM fields.
Part 2—Strategic Goal 3
NASA’s FY 2021 Volume of Integrated Performance 95
Develop
Performance Goal 3.3.5: Provide opportunities for students to contribute to NASA’s aeronautics, space, and science missions and work in exploration and discovery.
2014 2015 2016 2017 2018 2019None before FY 2018 Green Green
FY 2019 Annual Performance Indicators
STEM-19-3: Conduct a multiple case study fo-cused on NASA STEM engagement higher edu-cation challenges, competitions, and internships to build knowledge about how these activities: a) contribute to NASA’s aeronautics, space, and science missions; b) align to evidence-based effective practices for STEM learning; and c) recruit and retain participants from groups his-torically underrepresented and/or underserved in STEM fields.
Green
STEM-19-4: Contribute to American technical capability by supporting the release of at least 1,300 paper presentations and peer-reviewed research publications through STEM engage-ment investments.
Green
FY 2020–2021 Performance Plan
3.3.5: Provide opportunities for students to con-tribute to NASA’s aeronautics, space, and science missions and to work in exploration and discovery.
Number of paper presentations, peer-reviewed research publications, and (beginning in FY 2021 to include student-proposed solutions and products) resulting from STEM engagement investments
Fiscal Year 2020 2021
Target 1,300 TBD-Baseline from FY 2020
FY 2019 Performance Progress
NASA achieved the targets for both annual perfor-mance indicators, earning a green rating for this performance goal for FY 2019.
The Establish Program to Stimulate Competitive Research (EPSCoR), National Space Grant College and Fellowship Project (Space Grant), and Minority University Research and Education Project (MUREP) grantee and awardee institu-tions reported 1,374 peer-reviewed publications, technical papers, and presentations during the
2017–2018 academic year. Forty-eight percent of these peer-reviewed publications were authored or coauthored by students. This assesses the contri-butions to NASA’s missions and work through its investments in higher education.
During FY 2019, a STEM [science, technology, engineering, and mathematics] Engagement evaluation contract conducted a study to assess and characterize how the Agency’s higher educa-tion activities define and enable contributions to NASA’s work. This study included higher education challenges, where higher education students were challenged to develop design solutions to authen-tic NASA real-world STEM questions, provided by the Office of STEM Engagement and the Human Exploration and Operations Mission Directorate. Findings showed that work-based learning and research experiences provided a means for higher education students to contribute to NASA missions through research, technology, and product devel-opment, as well as communication of these find-ings through technical papers and presentations.
NASA STEM Engagement encompasses all endeav-ors Agency-wide to attract, engage and educate K-12 and higher education students and to support educa-tors, educational institutions and professional organi-zations in STEM fields.
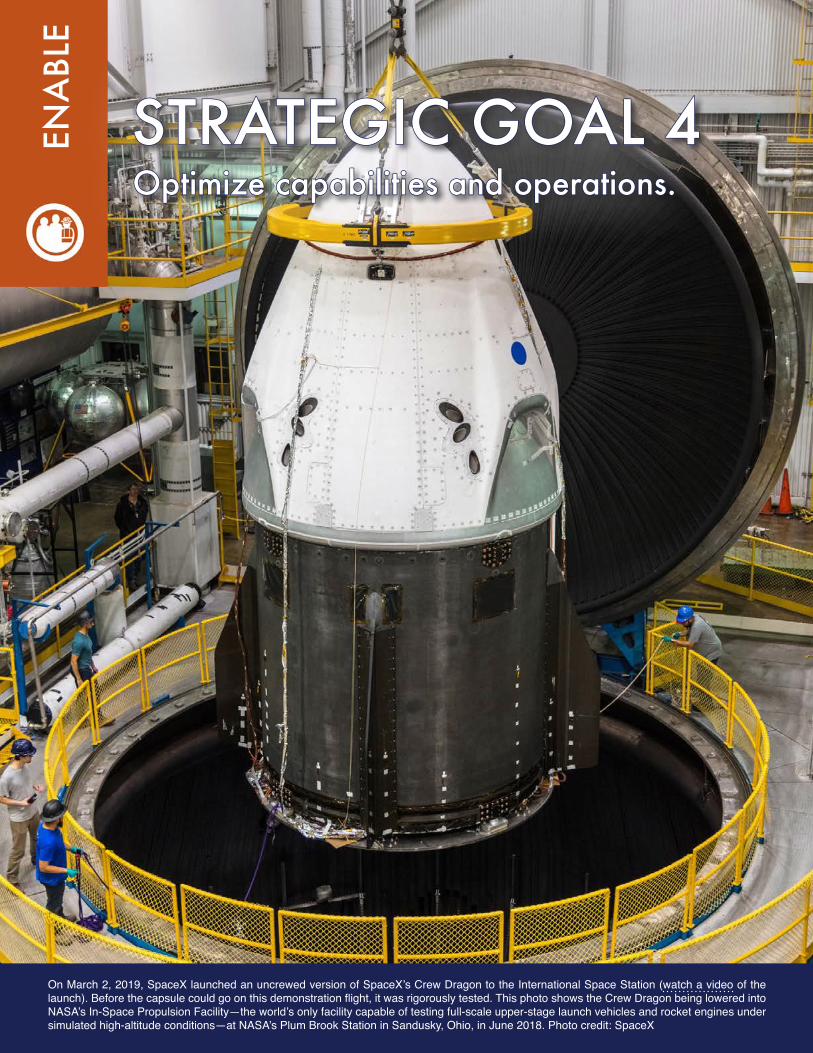
ENA
BLE
On March 2, 2019, SpaceX launched an uncrewed version of SpaceX’s Crew Dragon to the International Space Station (watch a video of the launch). Before the capsule could go on this demonstration flight, it was rigorously tested. This photo shows the Crew Dragon being lowered into NASA’s In-Space Propulsion Facility—the world’s only facility capable of testing full-scale upper-stage launch vehicles and rocket engines under simulated high-altitude conditions—at NASA’s Plum Brook Station in Sandusky, Ohio, in June 2018. Photo credit: SpaceX
STRATEGIC GOAL 4STRATEGIC GOAL 4Optimize capabilities and operations .Optimize capabilities and operations .
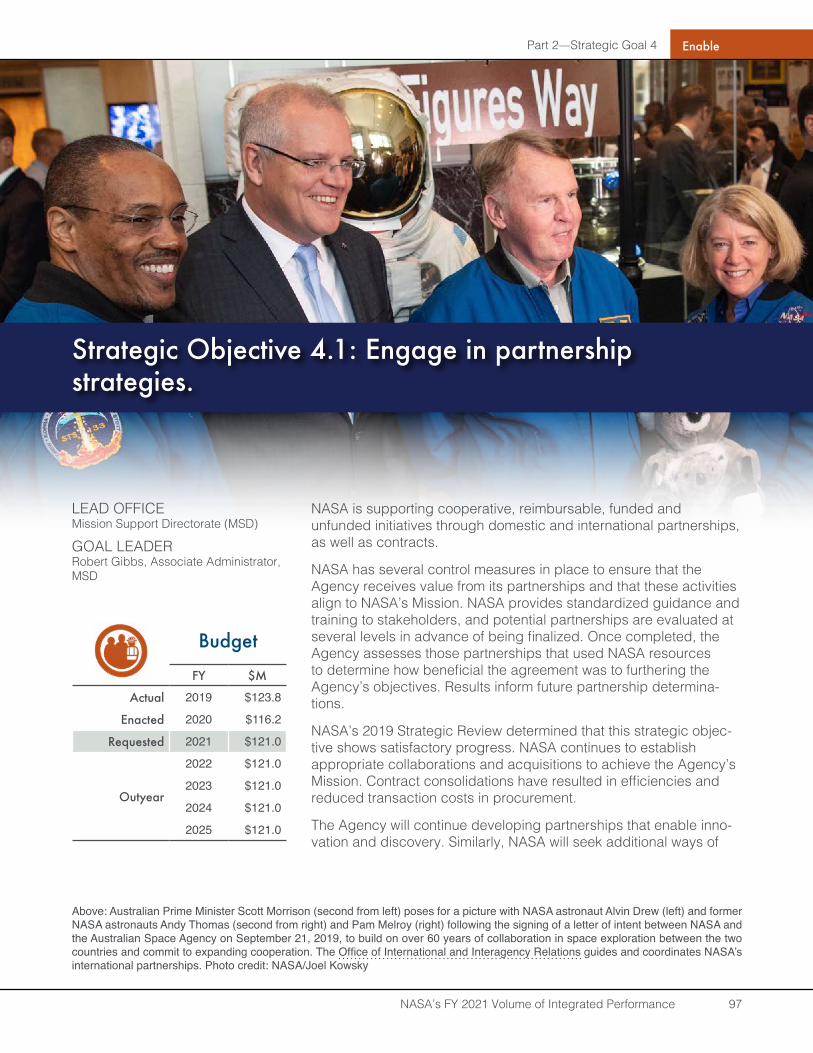
Part 2—Strategic Goal 4
NASA’s FY 2021 Volume of Integrated Performance 97
Enable
LEAD OFFICEMission Support Directorate (MSD)
GOAL LEADERRobert Gibbs, Associate Administrator, MSD
Budget
FY $M
Actual 2019 $123.8
Enacted 2020 $116.2
Requested 2021 $121.0
Outyear
2022 $121.0
2023 $121.0
2024 $121.0
2025 $121.0
Strategic Objective 4.1: Engage in partnership strategies .
NASA is supporting cooperative, reimbursable, funded and unfunded initiatives through domestic and international partnerships, as well as contracts.
NASA has several control measures in place to ensure that the Agency receives value from its partnerships and that these activities align to NASA’s Mission. NASA provides standardized guidance and training to stakeholders, and potential partnerships are evaluated at several levels in advance of being finalized. Once completed, the Agency assesses those partnerships that used NASA resources to determine how beneficial the agreement was to furthering the Agency’s objectives. Results inform future partnership determina-tions.
NASA’s 2019 Strategic Review determined that this strategic objec-tive shows satisfactory progress. NASA continues to establish appropriate collaborations and acquisitions to achieve the Agency’s Mission. Contract consolidations have resulted in efficiencies and reduced transaction costs in procurement.
The Agency will continue developing partnerships that enable inno-vation and discovery. Similarly, NASA will seek additional ways of
Above: Australian Prime Minister Scott Morrison (second from left) poses for a picture with NASA astronaut Alvin Drew (left) and former NASA astronauts Andy Thomas (second from right) and Pam Melroy (right) following the signing of a letter of intent between NASA and the Australian Space Agency on September 21, 2019, to build on over 60 years of collaboration in space exploration between the two countries and commit to expanding cooperation. The Office of International and Interagency Relations guides and coordinates NASA’s international partnerships. Photo credit: NASA/Joel Kowsky
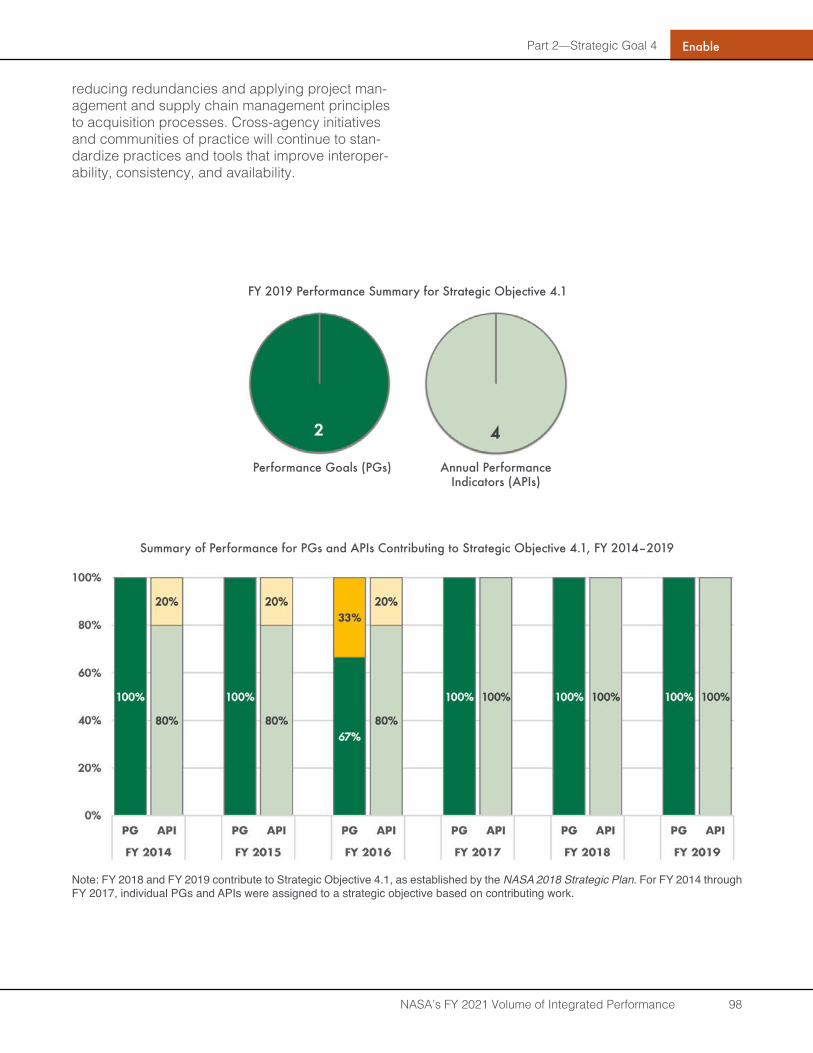
Part 2—Strategic Goal 4
NASA’s FY 2021 Volume of Integrated Performance 98
Enable
reducing redundancies and applying project man-agement and supply chain management principles to acquisition processes. Cross-agency initiatives and communities of practice will continue to stan-dardize practices and tools that improve interoper-ability, consistency, and availability.
FY 2019 Performance Summary for Strategic Objective 4.1
Performance Goals (PGs) Annual Performance Indicators (APIs)
Summary of Performance for PGs and APIs Contributing to Strategic Objective 4.1, FY 2014–2019
Note: FY 2018 and FY 2019 contribute to Strategic Objective 4.1, as established by the NASA 2018 Strategic Plan. For FY 2014 through FY 2017, individual PGs and APIs were assigned to a strategic objective based on contributing work.
Part 2—Strategic Goal 4
NASA’s FY 2021 Volume of Integrated Performance 99
Enable
Performance Goal 4.1.2: Achieve savings for the Agency through acquisition reforms .
2014 2015 2016 2017 2018 2019
Green Green Green Green Green Green
FY 2019 Annual Performance Indicators
AMO-19-9: Achieve savings in at least 70 per-cent of identified procurement initiatives through increased contract efficiencies and reduced transaction costs in NASA procurements.
Green
AMO-19-10: Achieve savings in at least 70 per-cent of identified procurement initiatives through effective use of both Federal-level and Agency-level strategic sourcing approaches.
Green
FY 2020–2021 Performance Plan
No performance goal after FY 2019. A new perfor-mance goal for Strategic Objective 4.1 is on page page 101.
FY 2019 Performance Progress
NASA achieved this performance goal for FY 2019 by achieving the majority of its planned acquisition initiatives, with a focus on achieving savings for the Agency through acquisition reforms. For the “Category Management” cross-agency priority goal, which focuses on increasing efficiencies and eliminating redundancies in Federal acquisitions, NASA has achieved overall savings at both the Agency and Federal levels. This initiative and the cost savings/avoidance have generated efficien-cies and savings across the Agency and are expected to continue and, in some cases, increase in coming years.
NASA established an initiative to increasingly procure more of its common goods and services using an enterprise acquisition approach that enables NASA to eliminate redundancies, increase efficiency, and deliver more value and savings for its acquisition programs. As of the end of FY 2019, 20 percent of enterprise procurement strategies have been approved. Approved enterprise pro-curement strategies currently exist for the Aircraft Operations, Human Capital, Propellants, Project
Planning and Control, and Subscriptions product service lines, with more due to be strategically pro-cured in FY 2020. NASA has achieved cost sav-ings/avoidance by reducing the cost of getting the work done (i.e., Agency administrative or transac-tion costs) and will continue to achieve efficiencies and savings across the Agency.
The Office of Procurement provides innovative, effective, and efficient acquisition solutions, optimiz-ing Agency capabilities and operations and enabling NASA’s missions.
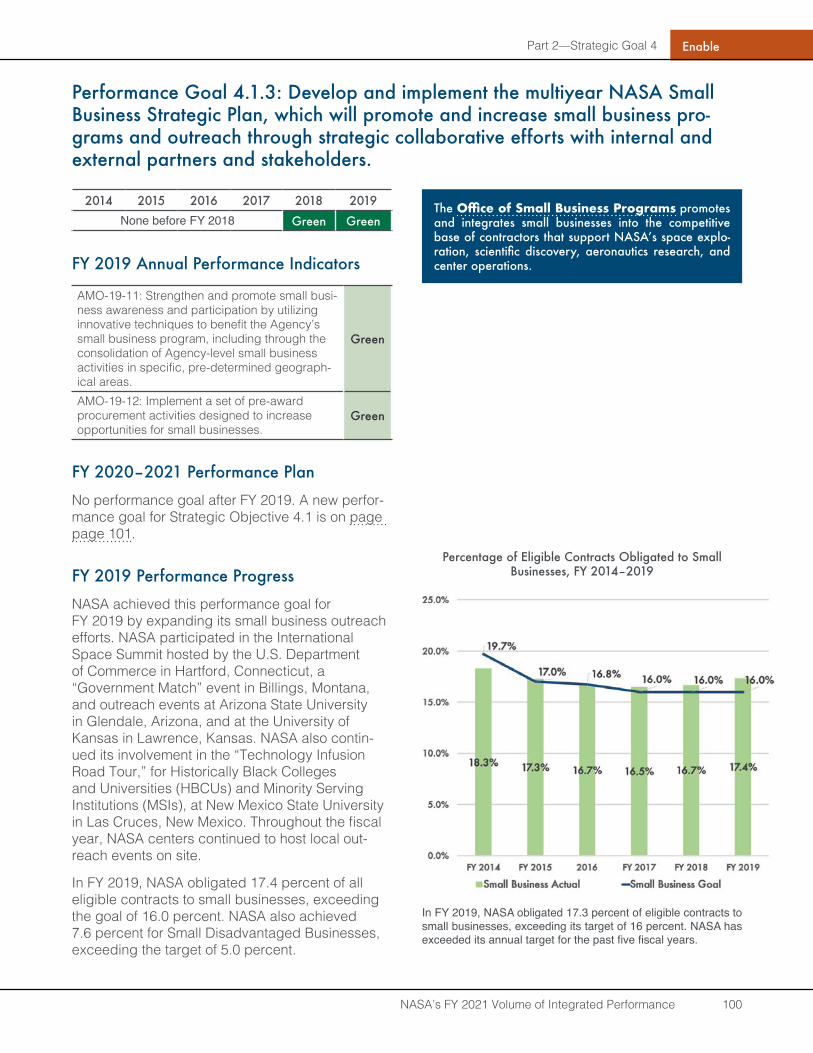
Part 2—Strategic Goal 4
NASA’s FY 2021 Volume of Integrated Performance 100
Enable
Performance Goal 4.1.3: Develop and implement the multiyear NASA Small Business Strategic Plan, which will promote and increase small business pro-grams and outreach through strategic collaborative efforts with internal and external partners and stakeholders .
2014 2015 2016 2017 2018 2019None before FY 2018 Green Green
FY 2019 Annual Performance Indicators
AMO-19-11: Strengthen and promote small busi-ness awareness and participation by utilizing innovative techniques to benefit the Agency’s small business program, including through the consolidation of Agency-level small business activities in specific, pre-determined geograph-ical areas.
Green
AMO-19-12: Implement a set of pre-award procurement activities designed to increase opportunities for small businesses.
Green
FY 2020–2021 Performance Plan
No performance goal after FY 2019. A new perfor-mance goal for Strategic Objective 4.1 is on page page 101.
FY 2019 Performance Progress
NASA achieved this performance goal for FY 2019 by expanding its small business outreach efforts. NASA participated in the International Space Summit hosted by the U.S. Department of Commerce in Hartford, Connecticut, a “Government Match” event in Billings, Montana, and outreach events at Arizona State University in Glendale, Arizona, and at the University of Kansas in Lawrence, Kansas. NASA also contin-ued its involvement in the “Technology Infusion Road Tour,” for Historically Black Colleges and Universities (HBCUs) and Minority Serving Institutions (MSIs), at New Mexico State University in Las Cruces, New Mexico. Throughout the fiscal year, NASA centers continued to host local out-reach events on site.
In FY 2019, NASA obligated 17.4 percent of all eligible contracts to small businesses, exceeding the goal of 16.0 percent. NASA also achieved 7.6 percent for Small Disadvantaged Businesses, exceeding the target of 5.0 percent.
The Office of Small Business Programs promotes and integrates small businesses into the competitive base of contractors that support NASA’s space explo-ration, scientific discovery, aeronautics research, and center operations .
Percentage of Eligible Contracts Obligated to Small Businesses, FY 2014–2019
In FY 2019, NASA obligated 17.3 percent of eligible contracts to small businesses, exceeding its target of 16 percent. NASA has exceeded its annual target for the past five fiscal years.

Part 2—Strategic Goal 4
NASA’s FY 2021 Volume of Integrated Performance 101
Enable
FY 2020–2021 Performance Plan: New Performance Goal
Performance Goal 4 .1 .1: Maintain the number of active partnership agreements with domestic, inter-agency, and international partners that support and enable NASA’s Mission.
Number of active partnership agreements with domestic, interagency, and international partners
Fiscal Year 2020 2021
Target 2,671 2,671
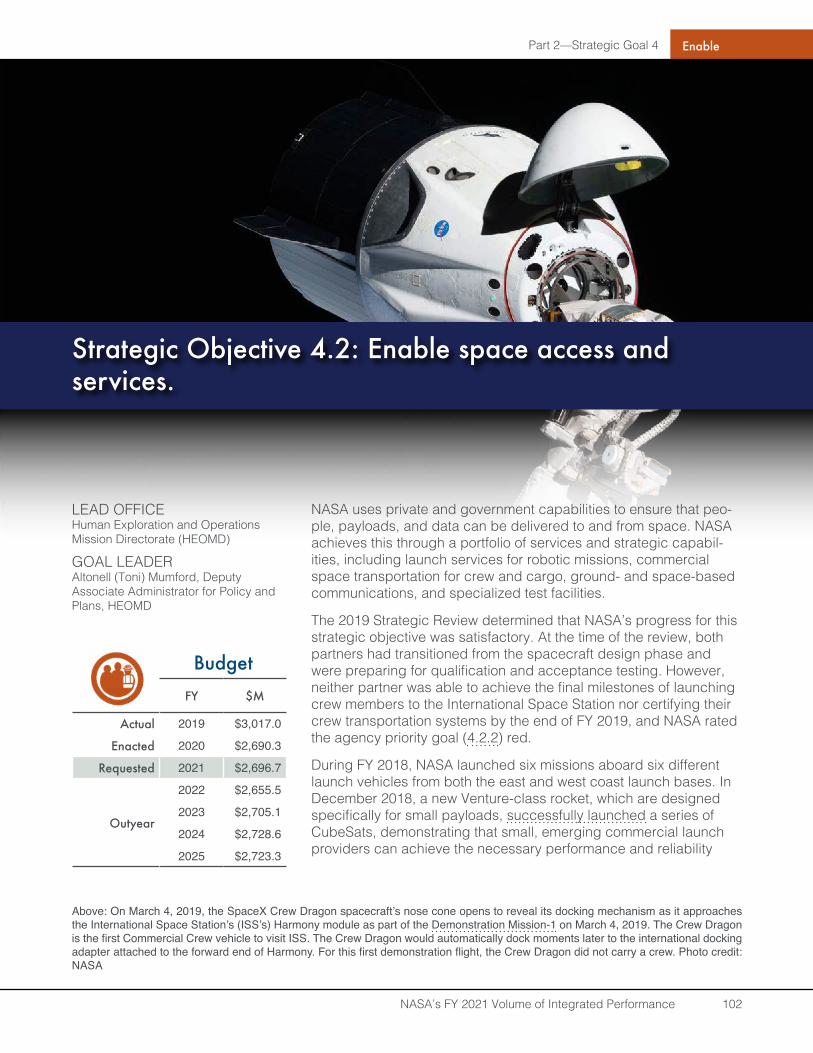
Part 2—Strategic Goal 4
NASA’s FY 2021 Volume of Integrated Performance 102
Enable
LEAD OFFICEHuman Exploration and Operations Mission Directorate (HEOMD)
GOAL LEADERAltonell (Toni) Mumford, Deputy Associate Administrator for Policy and Plans, HEOMD
BudgetFY $M
Actual 2019 $3,017.0
Enacted 2020 $2,690.3
Requested 2021 $2,696.7
Outyear
2022 $2,655.5
2023 $2,705.1
2024 $2,728.6
2025 $2,723.3
Strategic Objective 4.2: Enable space access and services.
NASA uses private and government capabilities to ensure that peo-ple, payloads, and data can be delivered to and from space. NASA achieves this through a portfolio of services and strategic capabil-ities, including launch services for robotic missions, commercial space transportation for crew and cargo, ground- and space-based communications, and specialized test facilities.
The 2019 Strategic Review determined that NASA’s progress for this strategic objective was satisfactory. At the time of the review, both partners had transitioned from the spacecraft design phase and were preparing for qualification and acceptance testing. However, neither partner was able to achieve the final milestones of launching crew members to the International Space Station nor certifying their crew transportation systems by the end of FY 2019, and NASA rated the agency priority goal (4.2.2) red.
During FY 2018, NASA launched six missions aboard six different launch vehicles from both the east and west coast launch bases. In December 2018, a new Venture-class rocket, which are designed specifically for small payloads, successfully launched a series of CubeSats, demonstrating that small, emerging commercial launch providers can achieve the necessary performance and reliability
Above: On March 4, 2019, the SpaceX Crew Dragon spacecraft’s nose cone opens to reveal its docking mechanism as it approaches the International Space Station’s (ISS’s) Harmony module as part of the Demonstration Mission-1 on March 4, 2019. The Crew Dragon is the first Commercial Crew vehicle to visit ISS. The Crew Dragon would automatically dock moments later to the international docking adapter attached to the forward end of Harmony. For this first demonstration flight, the Crew Dragon did not carry a crew. Photo credit: NASA
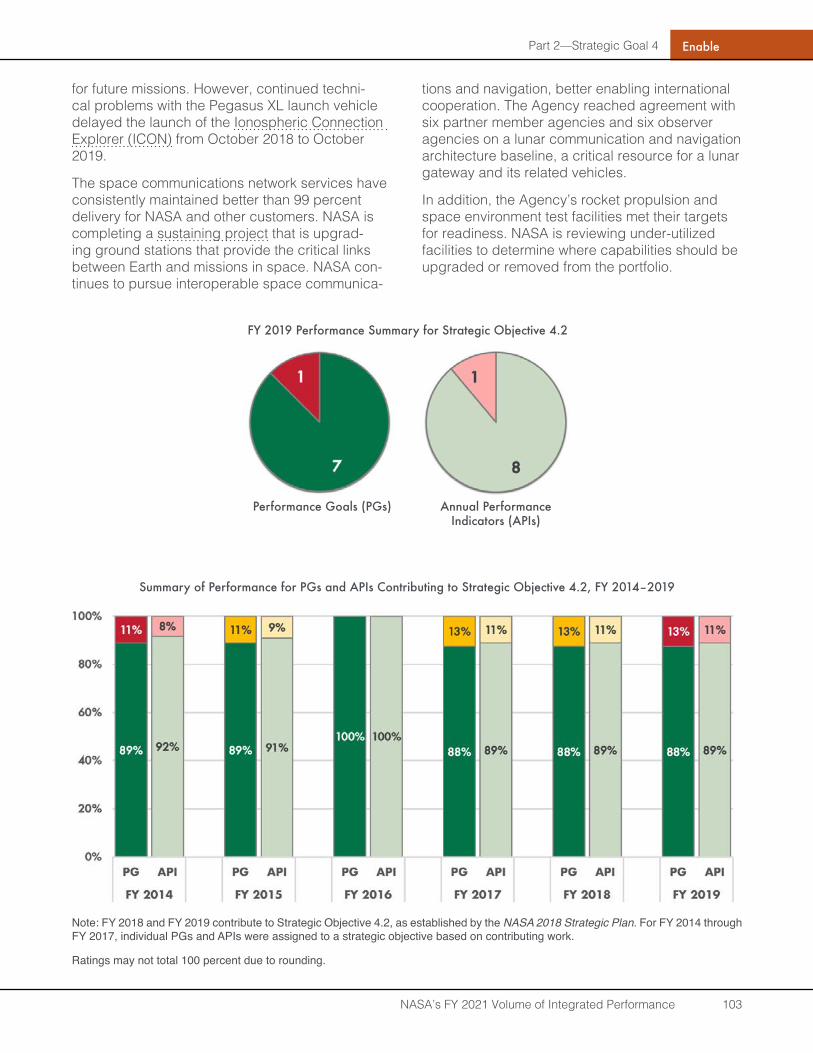
Part 2—Strategic Goal 4
NASA’s FY 2021 Volume of Integrated Performance 103
Enable
for future missions. However, continued techni-cal problems with the Pegasus XL launch vehicle delayed the launch of the Ionospheric Connection Explorer (ICON) from October 2018 to October 2019.
The space communications network services have consistently maintained better than 99 percent delivery for NASA and other customers. NASA is completing a sustaining project that is upgrad-ing ground stations that provide the critical links between Earth and missions in space. NASA con-tinues to pursue interoperable space communica-
tions and navigation, better enabling international cooperation. The Agency reached agreement with six partner member agencies and six observer agencies on a lunar communication and navigation architecture baseline, a critical resource for a lunar gateway and its related vehicles.
In addition, the Agency’s rocket propulsion and space environment test facilities met their targets for readiness. NASA is reviewing under-utilized facilities to determine where capabilities should be upgraded or removed from the portfolio.
FY 2019 Performance Summary for Strategic Objective 4.2
Performance Goals (PGs) Annual Performance Indicators (APIs)
Summary of Performance for PGs and APIs Contributing to Strategic Objective 4.2, FY 2014–2019
Note: FY 2018 and FY 2019 contribute to Strategic Objective 4.2, as established by the NASA 2018 Strategic Plan. For FY 2014 through FY 2017, individual PGs and APIs were assigned to a strategic objective based on contributing work.
Ratings may not total 100 percent due to rounding.
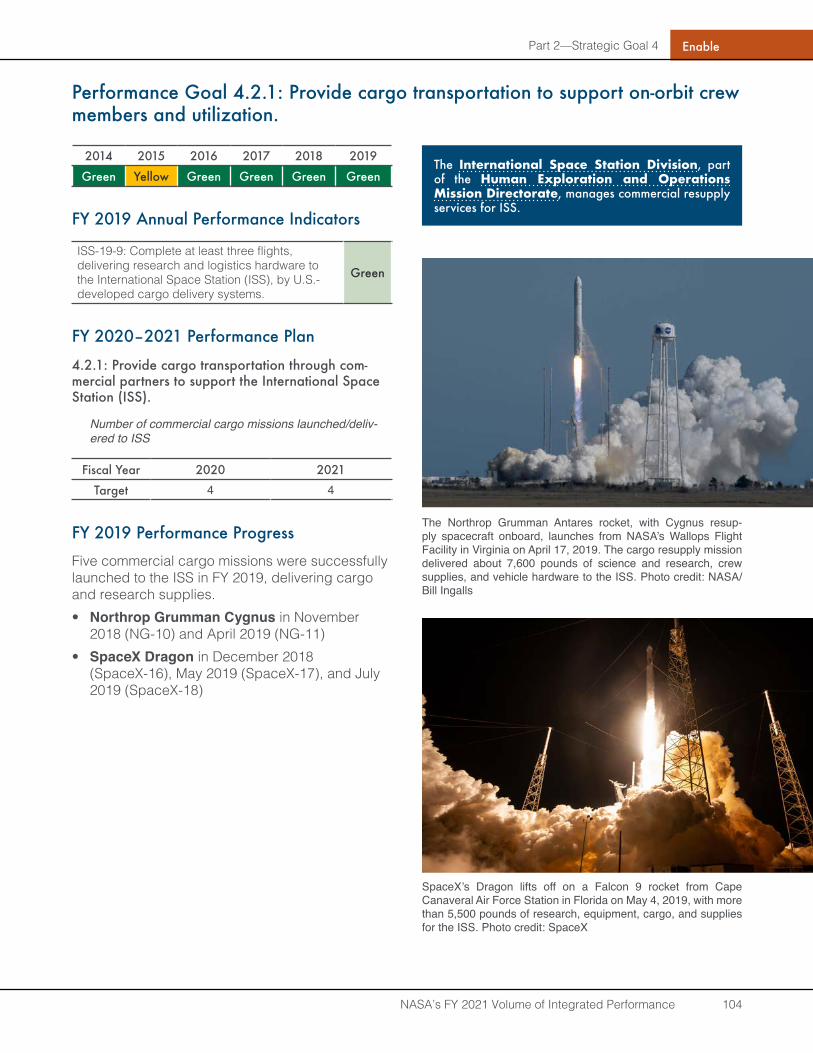
Part 2—Strategic Goal 4
NASA’s FY 2021 Volume of Integrated Performance 104
Enable
Performance Goal 4.2.1: Provide cargo transportation to support on-orbit crew members and utilization .
2014 2015 2016 2017 2018 2019
Green Yellow Green Green Green Green
FY 2019 Annual Performance Indicators
ISS-19-9: Complete at least three flights, delivering research and logistics hardware to the International Space Station (ISS), by U.S.-developed cargo delivery systems.
Green
FY 2020–2021 Performance Plan
4.2.1: Provide cargo transportation through com-mercial partners to support the International Space Station (ISS) .
Number of commercial cargo missions launched/deliv-ered to ISS
Fiscal Year 2020 2021
Target 4 4
FY 2019 Performance Progress
Five commercial cargo missions were successfully launched to the ISS in FY 2019, delivering cargo and research supplies.• Northrop Grumman Cygnus in November
2018 (NG-10) and April 2019 (NG-11)• SpaceX Dragon in December 2018
(SpaceX-16), May 2019 (SpaceX-17), and July 2019 (SpaceX-18)
The International Space Station Division, part of the Human Exploration and Operations Mission Directorate, manages commercial resupply services for ISS.
The Northrop Grumman Antares rocket, with Cygnus resup-ply spacecraft onboard, launches from NASA’s Wallops Flight Facility in Virginia on April 17, 2019. The cargo resupply mission delivered about 7,600 pounds of science and research, crew supplies, and vehicle hardware to the ISS. Photo credit: NASA/Bill Ingalls
SpaceX’s Dragon lifts off on a Falcon 9 rocket from Cape Canaveral Air Force Station in Florida on May 4, 2019, with more than 5,500 pounds of research, equipment, cargo, and supplies for the ISS. Photo credit: SpaceX
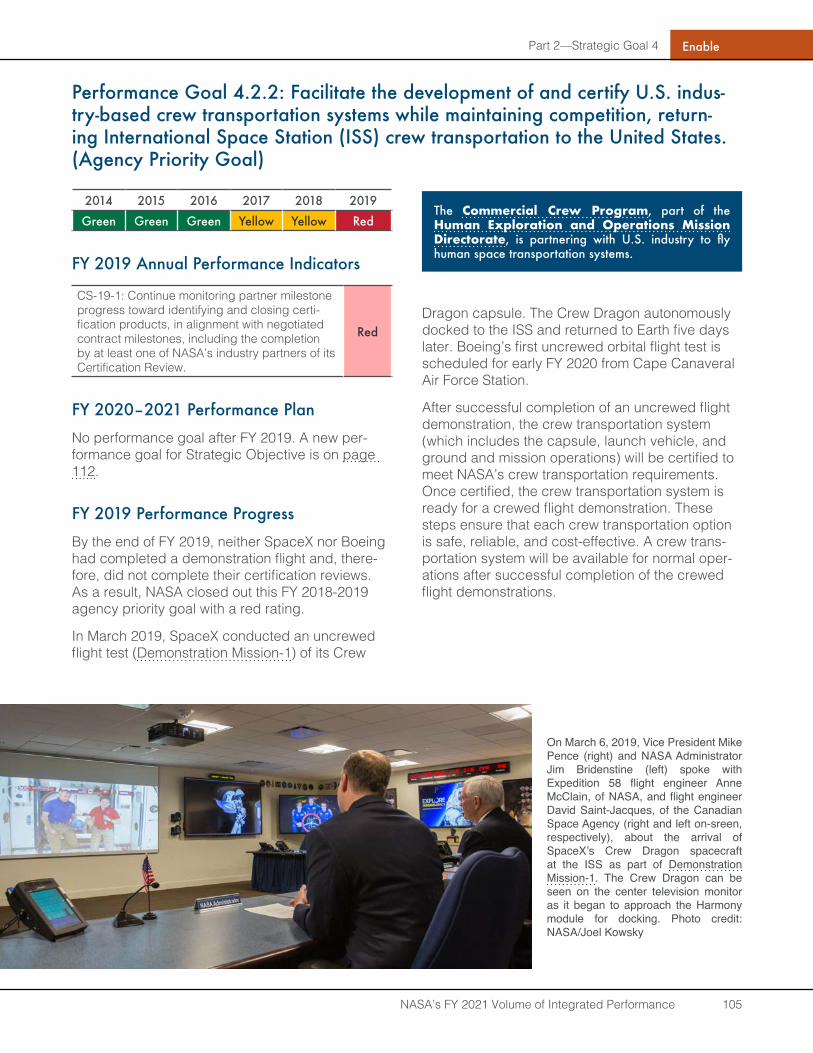
Part 2—Strategic Goal 4
NASA’s FY 2021 Volume of Integrated Performance 105
Enable
Performance Goal 4.2.2: Facilitate the development of and certify U.S. indus-try-based crew transportation systems while maintaining competition, return-ing International Space Station (ISS) crew transportation to the United States . (Agency Priority Goal)
2014 2015 2016 2017 2018 2019
Green Green Green Yellow Yellow Red
FY 2019 Annual Performance Indicators
CS-19-1: Continue monitoring partner milestone progress toward identifying and closing certi-fication products, in alignment with negotiated contract milestones, including the completion by at least one of NASA’s industry partners of its Certification Review.
Red
FY 2020–2021 Performance Plan
No performance goal after FY 2019. A new per-formance goal for Strategic Objective is on page 112.
FY 2019 Performance Progress
By the end of FY 2019, neither SpaceX nor Boeing had completed a demonstration flight and, there-fore, did not complete their certification reviews. As a result, NASA closed out this FY 2018-2019 agency priority goal with a red rating.
In March 2019, SpaceX conducted an uncrewed flight test (Demonstration Mission-1) of its Crew
Dragon capsule. The Crew Dragon autonomously docked to the ISS and returned to Earth five days later. Boeing’s first uncrewed orbital flight test is scheduled for early FY 2020 from Cape Canaveral Air Force Station.
After successful completion of an uncrewed flight demonstration, the crew transportation system (which includes the capsule, launch vehicle, and ground and mission operations) will be certified to meet NASA’s crew transportation requirements. Once certified, the crew transportation system is ready for a crewed flight demonstration. These steps ensure that each crew transportation option is safe, reliable, and cost-effective. A crew trans-portation system will be available for normal oper-ations after successful completion of the crewed flight demonstrations.
The Commercial Crew Program, part of the Human Exploration and Operations Mission Directorate, is partnering with U.S. industry to fly human space transportation systems .
On March 6, 2019, Vice President Mike Pence (right) and NASA Administrator Jim Bridenstine (left) spoke with Expedition 58 flight engineer Anne McClain, of NASA, and flight engineer David Saint-Jacques, of the Canadian Space Agency (right and left on-sreen, respectively), about the arrival of SpaceX’s Crew Dragon spacecraft at the ISS as part of Demonstration Mission-1. The Crew Dragon can be seen on the center television monitor as it began to approach the Harmony module for docking. Photo credit: NASA/Joel Kowsky
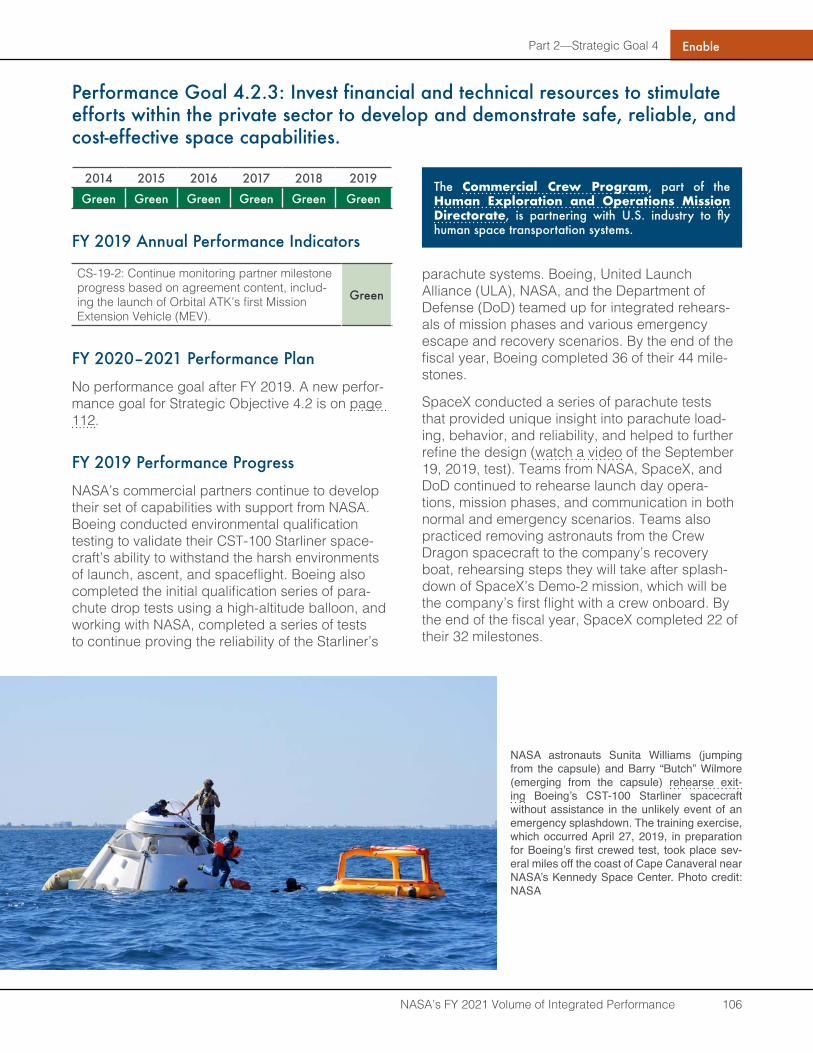
Part 2—Strategic Goal 4
NASA’s FY 2021 Volume of Integrated Performance 106
Enable
Performance Goal 4.2.3: Invest financial and technical resources to stimulate efforts within the private sector to develop and demonstrate safe, reliable, and cost-effective space capabilities.
2014 2015 2016 2017 2018 2019
Green Green Green Green Green Green
FY 2019 Annual Performance Indicators
CS-19-2: Continue monitoring partner milestone progress based on agreement content, includ-ing the launch of Orbital ATK’s first Mission Extension Vehicle (MEV).
Green
FY 2020–2021 Performance Plan
No performance goal after FY 2019. A new perfor-mance goal for Strategic Objective 4.2 is on page 112.
FY 2019 Performance Progress
NASA’s commercial partners continue to develop their set of capabilities with support from NASA. Boeing conducted environmental qualification testing to validate their CST-100 Starliner space-craft’s ability to withstand the harsh environments of launch, ascent, and spaceflight. Boeing also completed the initial qualification series of para-chute drop tests using a high-altitude balloon, and working with NASA, completed a series of tests to continue proving the reliability of the Starliner’s
parachute systems. Boeing, United Launch Alliance (ULA), NASA, and the Department of Defense (DoD) teamed up for integrated rehears-als of mission phases and various emergency escape and recovery scenarios. By the end of the fiscal year, Boeing completed 36 of their 44 mile-stones.
SpaceX conducted a series of parachute tests that provided unique insight into parachute load-ing, behavior, and reliability, and helped to further refine the design (watch a video of the September 19, 2019, test). Teams from NASA, SpaceX, and DoD continued to rehearse launch day opera-tions, mission phases, and communication in both normal and emergency scenarios. Teams also practiced removing astronauts from the Crew Dragon spacecraft to the company’s recovery boat, rehearsing steps they will take after splash-down of SpaceX’s Demo-2 mission, which will be the company’s first flight with a crew onboard. By the end of the fiscal year, SpaceX completed 22 of their 32 milestones.
The Commercial Crew Program, part of the Human Exploration and Operations Mission Directorate, is partnering with U.S. industry to fly human space transportation systems .
NASA astronauts Sunita Williams (jumping from the capsule) and Barry “Butch” Wilmore (emerging from the capsule) rehearse exit-ing Boeing’s CST-100 Starliner spacecraft without assistance in the unlikely event of an emergency splashdown. The training exercise, which occurred April 27, 2019, in preparation for Boeing’s first crewed test, took place sev-eral miles off the coast of Cape Canaveral near NASA’s Kennedy Space Center. Photo credit: NASA
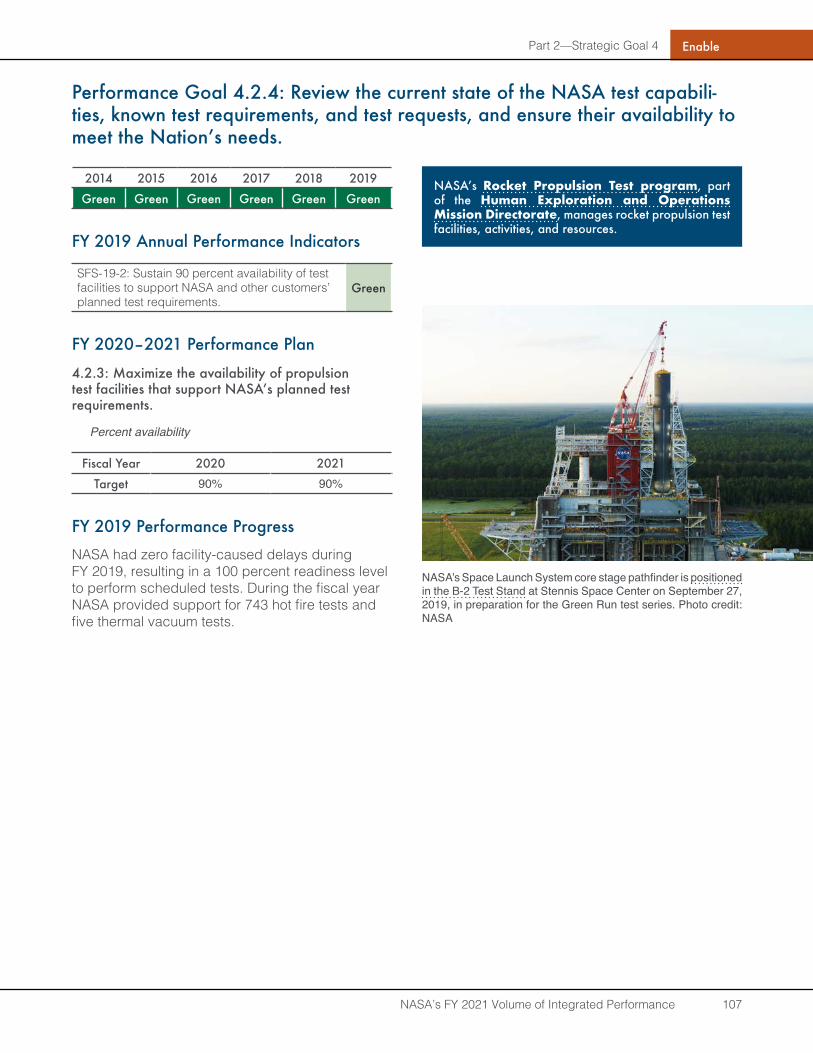
Part 2—Strategic Goal 4
NASA’s FY 2021 Volume of Integrated Performance 107
Enable
Performance Goal 4.2.4: Review the current state of the NASA test capabili-ties, known test requirements, and test requests, and ensure their availability to meet the Nation’s needs.
2014 2015 2016 2017 2018 2019
Green Green Green Green Green Green
FY 2019 Annual Performance Indicators
SFS-19-2: Sustain 90 percent availability of test facilities to support NASA and other customers’ planned test requirements.
Green
FY 2020–2021 Performance Plan
4.2.3: Maximize the availability of propulsion test facilities that support NASA’s planned test requirements .
Percent availability
Fiscal Year 2020 2021
Target 90% 90%
FY 2019 Performance Progress
NASA had zero facility-caused delays during FY 2019, resulting in a 100 percent readiness level to perform scheduled tests. During the fiscal year NASA provided support for 743 hot fire tests and five thermal vacuum tests.
NASA’s Rocket Propulsion Test program, part of the Human Exploration and Operations Mission Directorate, manages rocket propulsion test facilities, activities, and resources.
NASA’s Space Launch System core stage pathfinder is positioned in the B-2 Test Stand at Stennis Space Center on September 27, 2019, in preparation for the Green Run test series. Photo credit: NASA
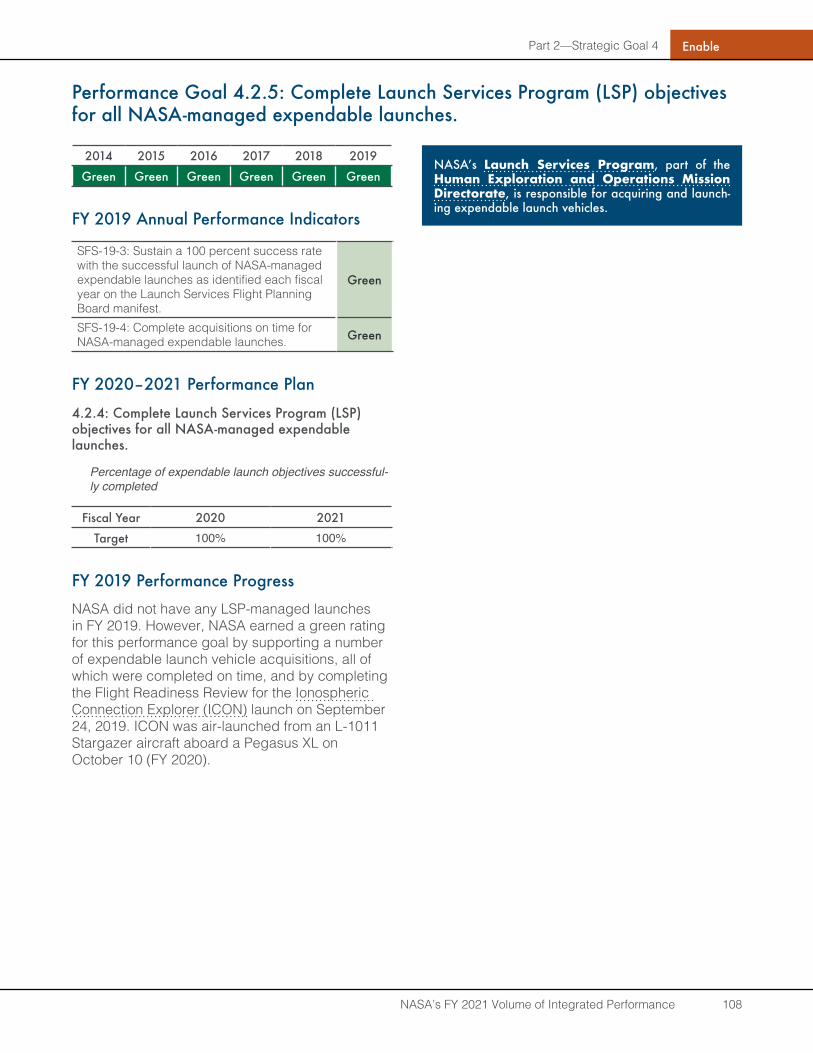
Part 2—Strategic Goal 4
NASA’s FY 2021 Volume of Integrated Performance 108
Enable
Performance Goal 4.2.5: Complete Launch Services Program (LSP) objectives for all NASA-managed expendable launches .
2014 2015 2016 2017 2018 2019
Green Green Green Green Green Green
FY 2019 Annual Performance Indicators
SFS-19-3: Sustain a 100 percent success rate with the successful launch of NASA-managed expendable launches as identified each fiscal year on the Launch Services Flight Planning Board manifest.
Green
SFS-19-4: Complete acquisitions on time for NASA-managed expendable launches. Green
FY 2020–2021 Performance Plan
4.2.4: Complete Launch Services Program (LSP) objectives for all NASA-managed expendable launches .
Percentage of expendable launch objectives successful-ly completed
Fiscal Year 2020 2021
Target 100% 100%
FY 2019 Performance Progress
NASA did not have any LSP-managed launches in FY 2019. However, NASA earned a green rating for this performance goal by supporting a number of expendable launch vehicle acquisitions, all of which were completed on time, and by completing the Flight Readiness Review for the Ionospheric Connection Explorer (ICON) launch on September 24, 2019. ICON was air-launched from an L-1011 Stargazer aircraft aboard a Pegasus XL on October 10 (FY 2020).
NASA’s Launch Services Program, part of the Human Exploration and Operations Mission Directorate, is responsible for acquiring and launch-ing expendable launch vehicles.
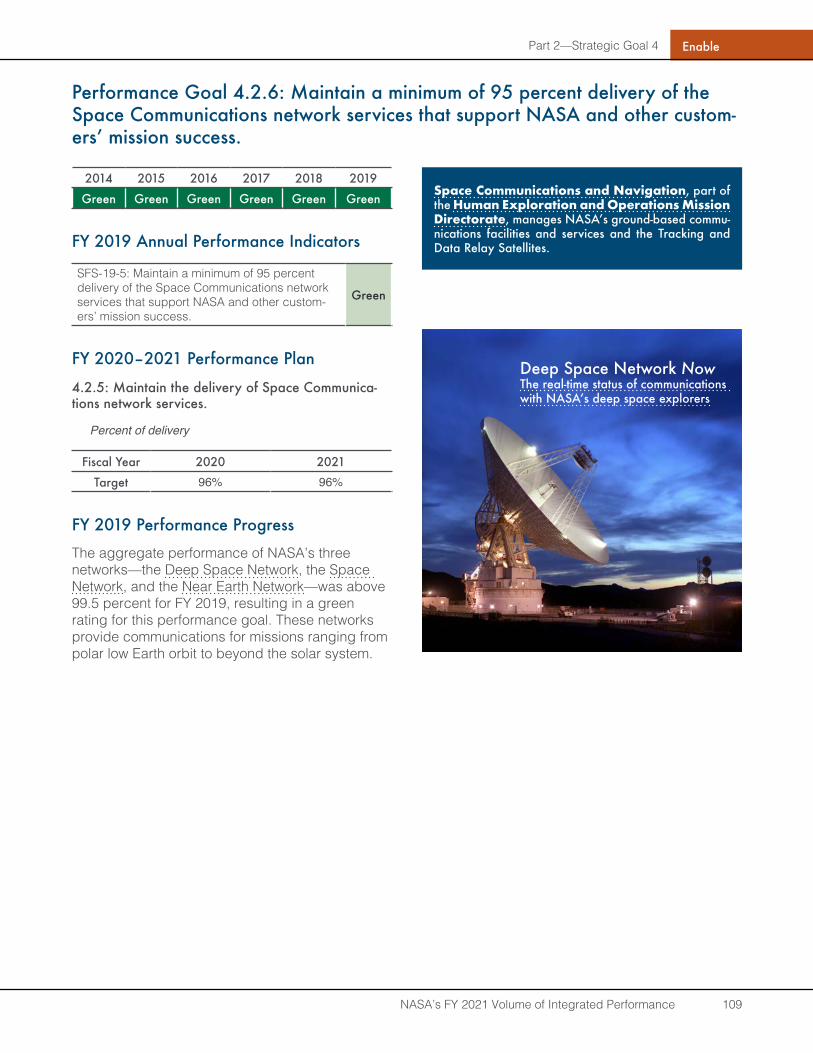
Part 2—Strategic Goal 4
NASA’s FY 2021 Volume of Integrated Performance 109
Enable
Performance Goal 4.2.6: Maintain a minimum of 95 percent delivery of the Space Communications network services that support NASA and other custom-ers’ mission success.
2014 2015 2016 2017 2018 2019
Green Green Green Green Green Green
FY 2019 Annual Performance Indicators
SFS-19-5: Maintain a minimum of 95 percent delivery of the Space Communications network services that support NASA and other custom-ers’ mission success.
Green
FY 2020–2021 Performance Plan
4.2.5: Maintain the delivery of Space Communica-tions network services.
Percent of delivery
Fiscal Year 2020 2021
Target 96% 96%
FY 2019 Performance Progress
The aggregate performance of NASA’s three networks—the Deep Space Network, the Space Network, and the Near Earth Network—was above 99.5 percent for FY 2019, resulting in a green rating for this performance goal. These networks provide communications for missions ranging from polar low Earth orbit to beyond the solar system.
Space Communications and Navigation, part of the Human Exploration and Operations Mission Directorate, manages NASA’s ground-based commu-nications facilities and services and the Tracking and Data Relay Satellites .
Deep Space Network NowThe real-time status of communications with NASA’s deep space explorers
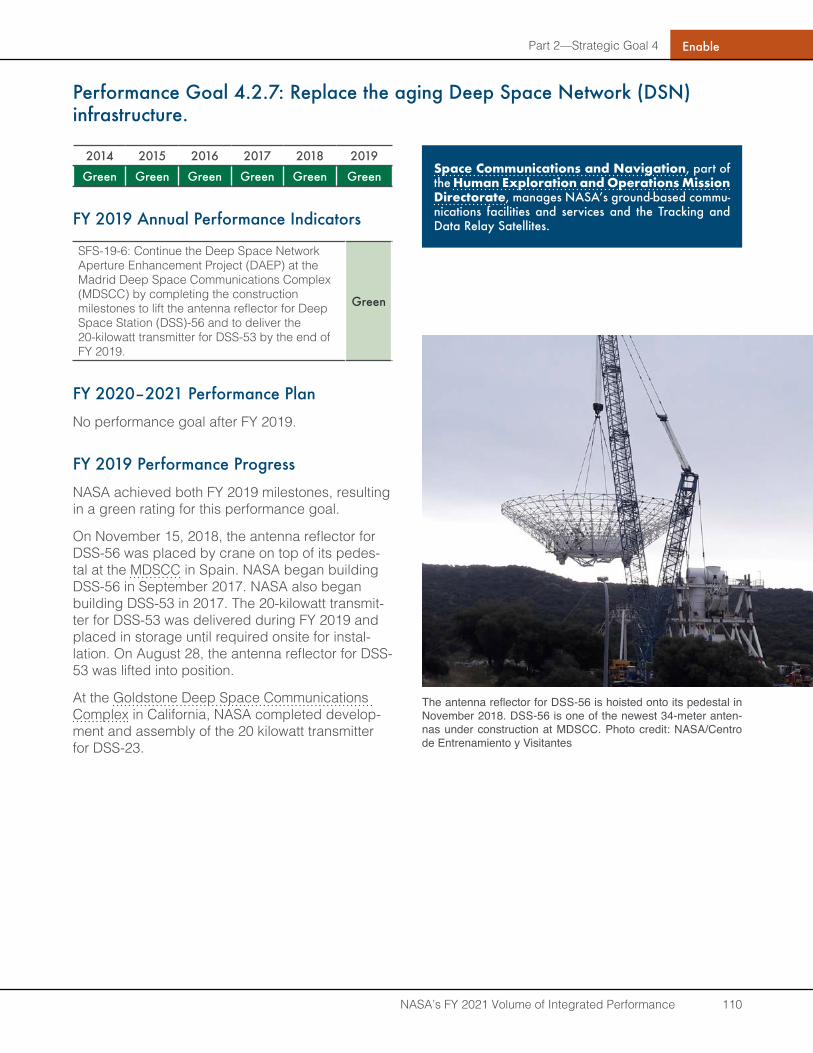
Part 2—Strategic Goal 4
NASA’s FY 2021 Volume of Integrated Performance 110
Enable
Performance Goal 4 .2 .7: Replace the aging Deep Space Network (DSN) infrastructure .
2014 2015 2016 2017 2018 2019
Green Green Green Green Green Green
FY 2019 Annual Performance Indicators
SFS-19-6: Continue the Deep Space Network Aperture Enhancement Project (DAEP) at the Madrid Deep Space Communications Complex (MDSCC) by completing the construction milestones to lift the antenna reflector for Deep Space Station (DSS)-56 and to deliver the 20-kilowatt transmitter for DSS-53 by the end of FY 2019.
Green
FY 2020–2021 Performance Plan
No performance goal after FY 2019.
FY 2019 Performance Progress
NASA achieved both FY 2019 milestones, resulting in a green rating for this performance goal.
On November 15, 2018, the antenna reflector for DSS-56 was placed by crane on top of its pedes-tal at the MDSCC in Spain. NASA began building DSS-56 in September 2017. NASA also began building DSS-53 in 2017. The 20-kilowatt transmit-ter for DSS-53 was delivered during FY 2019 and placed in storage until required onsite for instal-lation. On August 28, the antenna reflector for DSS-53 was lifted into position.
At the Goldstone Deep Space Communications Complex in California, NASA completed develop-ment and assembly of the 20 kilowatt transmitter for DSS-23.
Space Communications and Navigation, part of the Human Exploration and Operations Mission Directorate, manages NASA’s ground-based commu-nications facilities and services and the Tracking and Data Relay Satellites .
The antenna reflector for DSS-56 is hoisted onto its pedestal in November 2018. DSS-56 is one of the newest 34-meter anten-nas under construction at MDSCC. Photo credit: NASA/Centro de Entrenamiento y Visitantes
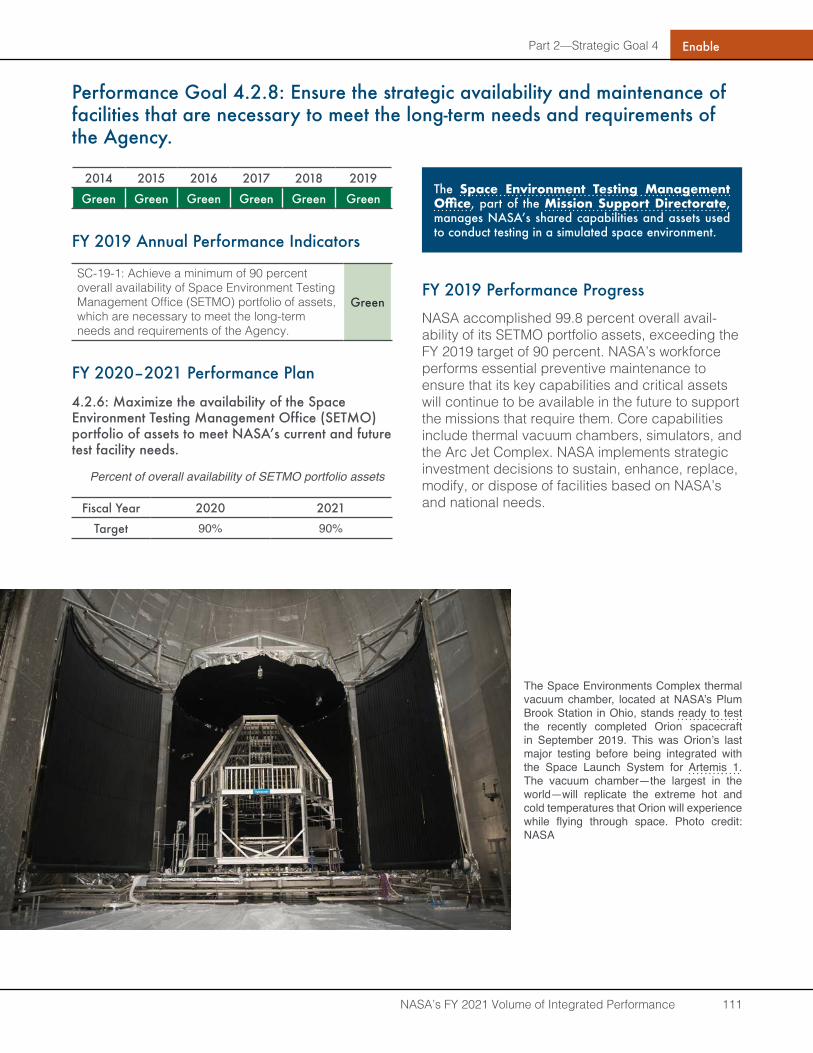
Part 2—Strategic Goal 4
NASA’s FY 2021 Volume of Integrated Performance 111
Enable
Performance Goal 4.2.8: Ensure the strategic availability and maintenance of facilities that are necessary to meet the long-term needs and requirements of the Agency .
2014 2015 2016 2017 2018 2019
Green Green Green Green Green Green
FY 2019 Annual Performance Indicators
SC-19-1: Achieve a minimum of 90 percent overall availability of Space Environment Testing Management Office (SETMO) portfolio of assets, which are necessary to meet the long-term needs and requirements of the Agency.
Green
FY 2020–2021 Performance Plan
4.2.6: Maximize the availability of the Space Environment Testing Management Office (SETMO) portfolio of assets to meet NASA’s current and future test facility needs .
Percent of overall availability of SETMO portfolio assets
Fiscal Year 2020 2021
Target 90% 90%
FY 2019 Performance Progress
NASA accomplished 99.8 percent overall avail-ability of its SETMO portfolio assets, exceeding the FY 2019 target of 90 percent. NASA’s workforce performs essential preventive maintenance to ensure that its key capabilities and critical assets will continue to be available in the future to support the missions that require them. Core capabilities include thermal vacuum chambers, simulators, and the Arc Jet Complex. NASA implements strategic investment decisions to sustain, enhance, replace, modify, or dispose of facilities based on NASA’s and national needs.
The Space Environment Testing Management Office, part of the Mission Support Directorate, manages NASA’s shared capabilities and assets used to conduct testing in a simulated space environment.
The Space Environments Complex thermal vacuum chamber, located at NASA’s Plum Brook Station in Ohio, stands ready to test the recently completed Orion spacecraft in September 2019. This was Orion’s last major testing before being integrated with the Space Launch System for Artemis 1. The vacuum chamber—the largest in the world—will replicate the extreme hot and cold temperatures that Orion will experience while flying through space. Photo credit: NASA
Part 2—Strategic Goal 4
NASA’s FY 2021 Volume of Integrated Performance 112
Enable
FY 2020–2021 Performance Plan: New Performance Goal
Performance Goal 4.2.2: Provide NASA crew transportation through commercial partners to low Earth orbit .
Number of commercial crew missions launched
Fiscal Year 2020 2021
Target 2 2
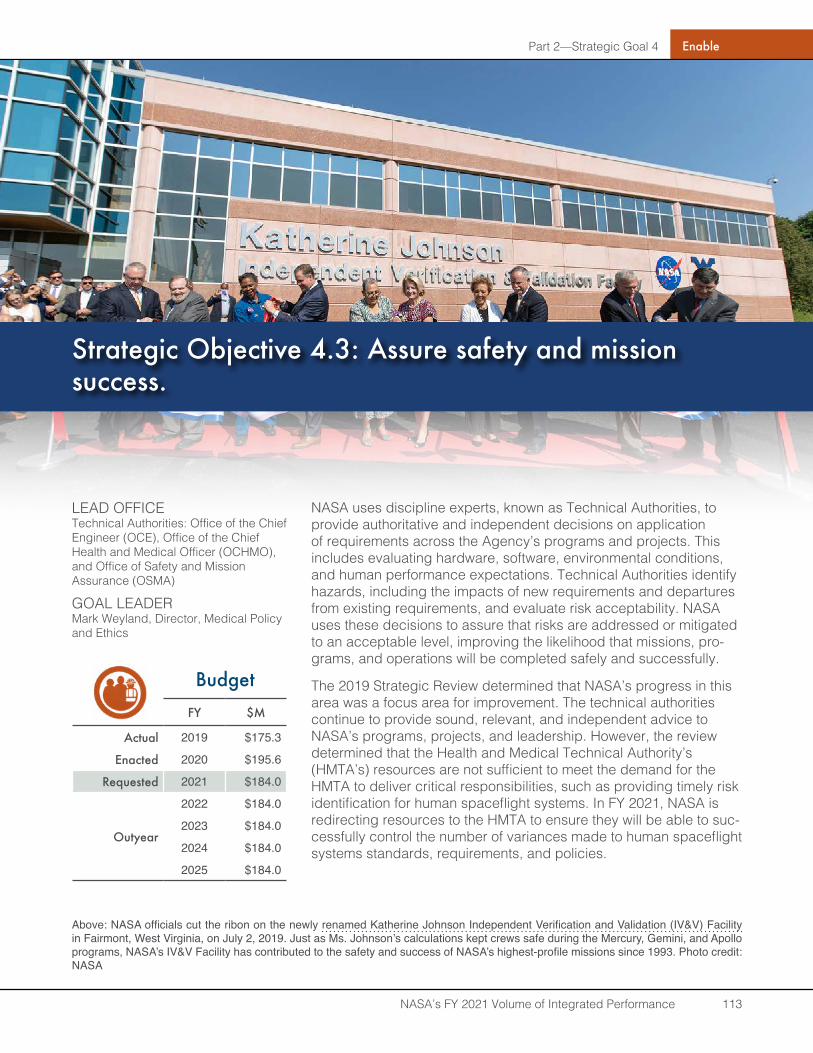
Part 2—Strategic Goal 4
NASA’s FY 2021 Volume of Integrated Performance 113
Enable
LEAD OFFICETechnical Authorities: Office of the Chief Engineer (OCE), Office of the Chief Health and Medical Officer (OCHMO), and Office of Safety and Mission Assurance (OSMA)
GOAL LEADERMark Weyland, Director, Medical Policy and Ethics
BudgetFY $M
Actual 2019 $175.3
Enacted 2020 $195.6
Requested 2021 $184.0
Outyear
2022 $184.0
2023 $184.0
2024 $184.0
2025 $184.0
Strategic Objective 4.3: Assure safety and mission success .
NASA uses discipline experts, known as Technical Authorities, to provide authoritative and independent decisions on application of requirements across the Agency’s programs and projects. This includes evaluating hardware, software, environmental conditions, and human performance expectations. Technical Authorities identify hazards, including the impacts of new requirements and departures from existing requirements, and evaluate risk acceptability. NASA uses these decisions to assure that risks are addressed or mitigated to an acceptable level, improving the likelihood that missions, pro-grams, and operations will be completed safely and successfully.
The 2019 Strategic Review determined that NASA’s progress in this area was a focus area for improvement. The technical authorities continue to provide sound, relevant, and independent advice to NASA’s programs, projects, and leadership. However, the review determined that the Health and Medical Technical Authority’s (HMTA’s) resources are not sufficient to meet the demand for the HMTA to deliver critical responsibilities, such as providing timely risk identification for human spaceflight systems. In FY 2021, NASA is redirecting resources to the HMTA to ensure they will be able to suc-cessfully control the number of variances made to human spaceflight systems standards, requirements, and policies.
Above: NASA officials cut the ribon on the newly renamed Katherine Johnson Independent Verification and Validation (IV&V) Facility in Fairmont, West Virginia, on July 2, 2019. Just as Ms. Johnson’s calculations kept crews safe during the Mercury, Gemini, and Apollo programs, NASA’s IV&V Facility has contributed to the safety and success of NASA’s highest-profile missions since 1993. Photo credit: NASA
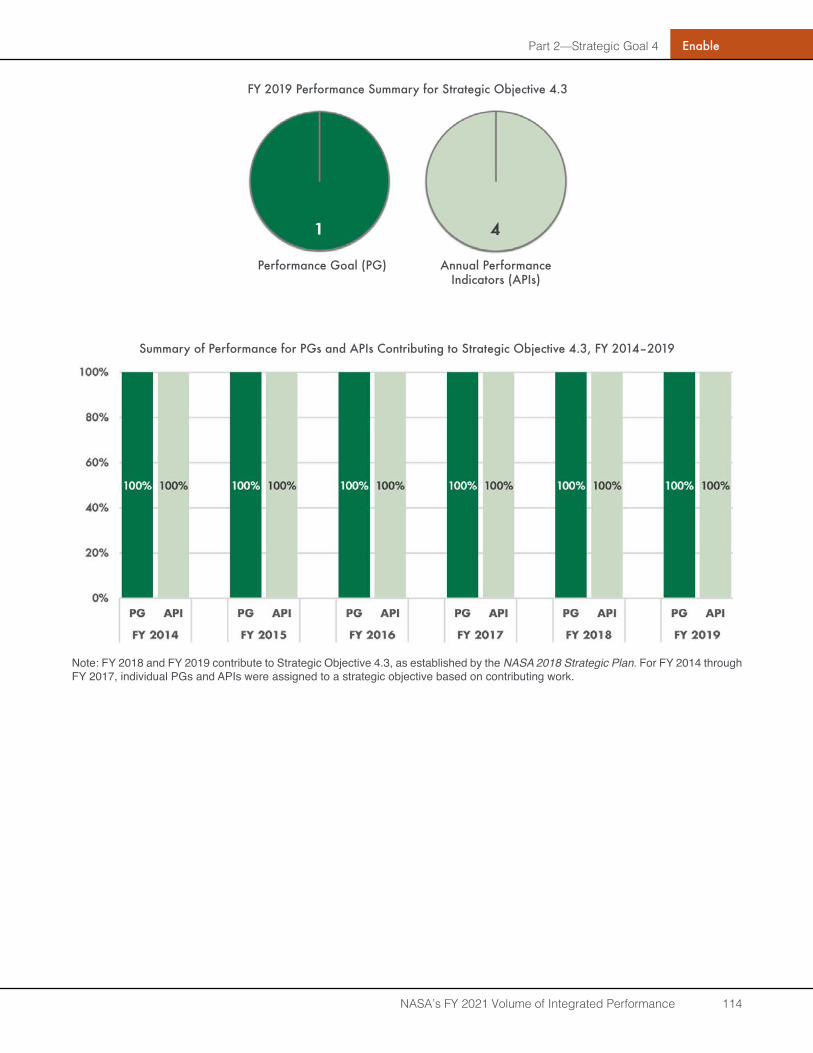
Part 2—Strategic Goal 4
NASA’s FY 2021 Volume of Integrated Performance 114
Enable
FY 2019 Performance Summary for Strategic Objective 4.3
Performance Goal (PG) Annual Performance Indicators (APIs)
Summary of Performance for PGs and APIs Contributing to Strategic Objective 4.3, FY 2014–2019
Note: FY 2018 and FY 2019 contribute to Strategic Objective 4.3, as established by the NASA 2018 Strategic Plan. For FY 2014 through FY 2017, individual PGs and APIs were assigned to a strategic objective based on contributing work.
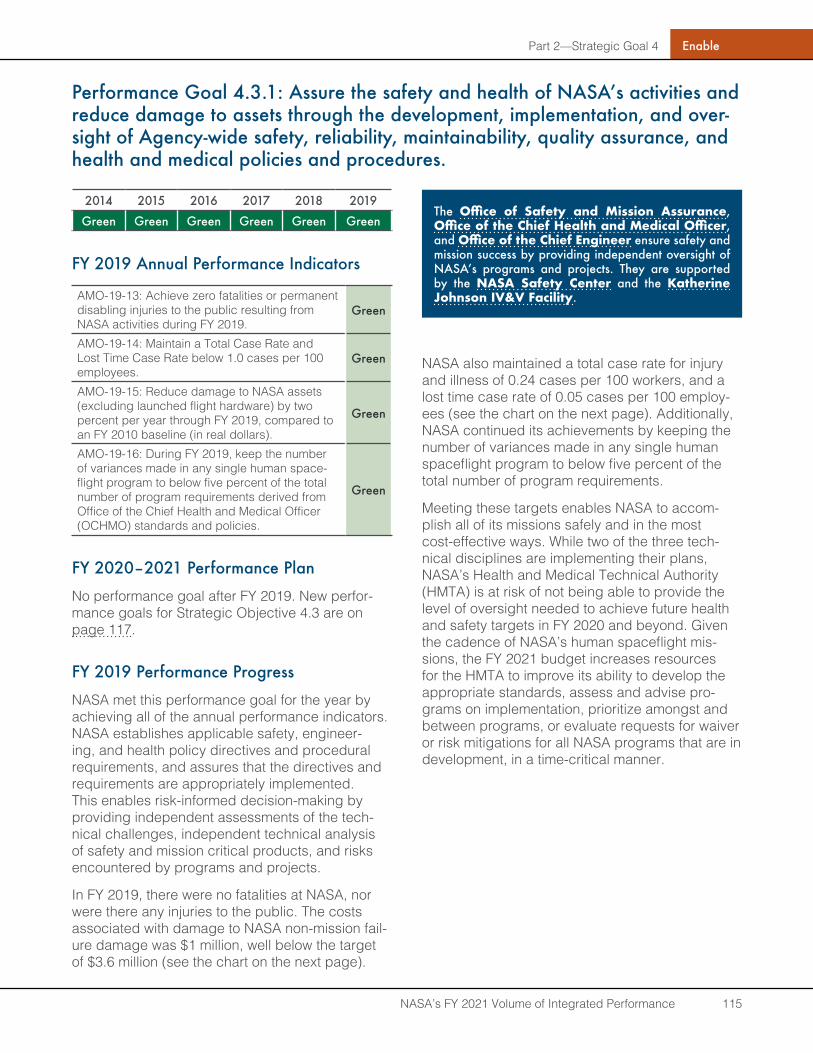
Part 2—Strategic Goal 4
NASA’s FY 2021 Volume of Integrated Performance 115
Enable
Performance Goal 4.3.1: Assure the safety and health of NASA’s activities and reduce damage to assets through the development, implementation, and over-sight of Agency-wide safety, reliability, maintainability, quality assurance, and health and medical policies and procedures .
2014 2015 2016 2017 2018 2019
Green Green Green Green Green Green
FY 2019 Annual Performance Indicators
AMO-19-13: Achieve zero fatalities or permanent disabling injuries to the public resulting from NASA activities during FY 2019.
Green
AMO-19-14: Maintain a Total Case Rate and Lost Time Case Rate below 1.0 cases per 100 employees.
Green
AMO-19-15: Reduce damage to NASA assets (excluding launched flight hardware) by two percent per year through FY 2019, compared to an FY 2010 baseline (in real dollars).
Green
AMO-19-16: During FY 2019, keep the number of variances made in any single human space-flight program to below five percent of the total number of program requirements derived from Office of the Chief Health and Medical Officer (OCHMO) standards and policies.
Green
FY 2020–2021 Performance Plan
No performance goal after FY 2019. New perfor-mance goals for Strategic Objective 4.3 are on page 117.
FY 2019 Performance Progress
NASA met this performance goal for the year by achieving all of the annual performance indicators. NASA establishes applicable safety, engineer-ing, and health policy directives and procedural requirements, and assures that the directives and requirements are appropriately implemented. This enables risk-informed decision-making by providing independent assessments of the tech-nical challenges, independent technical analysis of safety and mission critical products, and risks encountered by programs and projects.
In FY 2019, there were no fatalities at NASA, nor were there any injuries to the public. The costs associated with damage to NASA non-mission fail-ure damage was $1 million, well below the target of $3.6 million (see the chart on the next page).
NASA also maintained a total case rate for injury and illness of 0.24 cases per 100 workers, and a lost time case rate of 0.05 cases per 100 employ-ees (see the chart on the next page). Additionally, NASA continued its achievements by keeping the number of variances made in any single human spaceflight program to below five percent of the total number of program requirements.
Meeting these targets enables NASA to accom-plish all of its missions safely and in the most cost-effective ways. While two of the three tech-nical disciplines are implementing their plans, NASA’s Health and Medical Technical Authority (HMTA) is at risk of not being able to provide the level of oversight needed to achieve future health and safety targets in FY 2020 and beyond. Given the cadence of NASA’s human spaceflight mis-sions, the FY 2021 budget increases resources for the HMTA to improve its ability to develop the appropriate standards, assess and advise pro-grams on implementation, prioritize amongst and between programs, or evaluate requests for waiver or risk mitigations for all NASA programs that are in development, in a time-critical manner.
The Office of Safety and Mission Assurance, Office of the Chief Health and Medical Officer, and Office of the Chief Engineer ensure safety and mission success by providing independent oversight of NASA’s programs and projects. They are supported by the NASA Safety Center and the Katherine Johnson IV&V Facility .
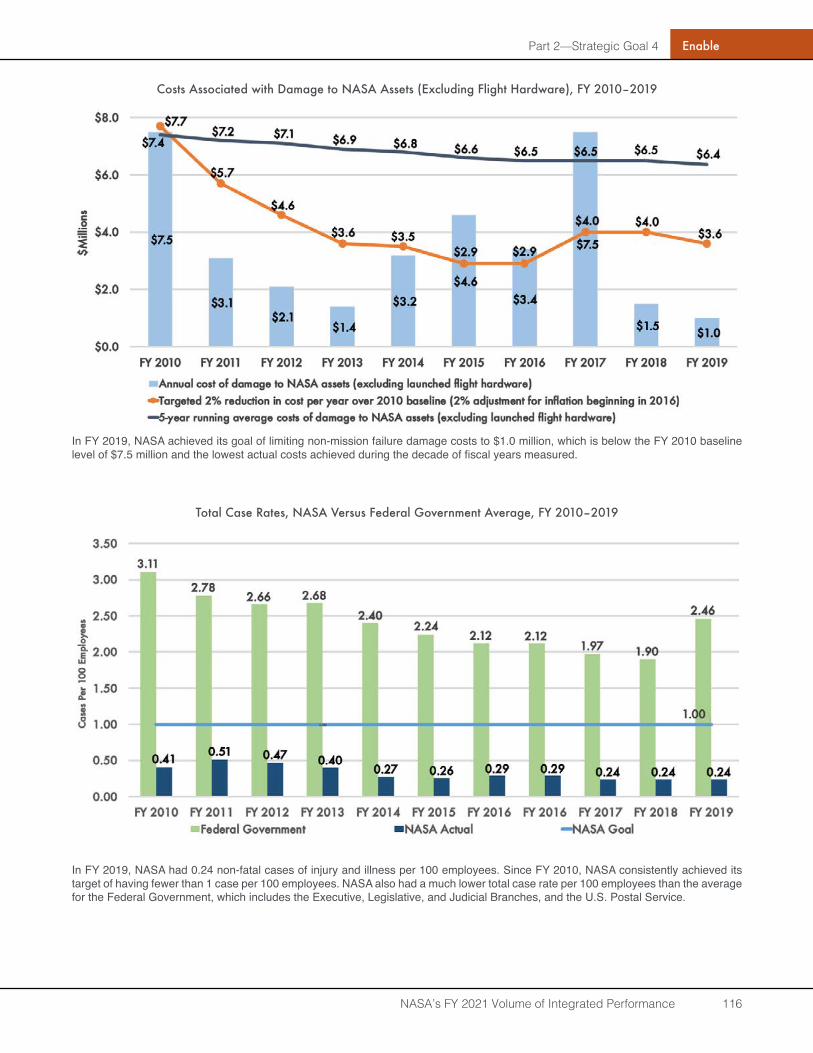
Part 2—Strategic Goal 4
NASA’s FY 2021 Volume of Integrated Performance 116
Enable
Costs Associated with Damage to NASA Assets (Excluding Flight Hardware), FY 2010–2019
In FY 2019, NASA achieved its goal of limiting non-mission failure damage costs to $1.0 million, which is below the FY 2010 baseline level of $7.5 million and the lowest actual costs achieved during the decade of fiscal years measured.
Total Case Rates, NASA Versus Federal Government Average, FY 2010–2019
In FY 2019, NASA had 0.24 non-fatal cases of injury and illness per 100 employees. Since FY 2010, NASA consistently achieved its target of having fewer than 1 case per 100 employees. NASA also had a much lower total case rate per 100 employees than the average for the Federal Government, which includes the Executive, Legislative, and Judicial Branches, and the U.S. Postal Service.
Part 2—Strategic Goal 4
NASA’s FY 2021 Volume of Integrated Performance 117
Enable
FY 2020–2021 Performance Plan: New Performance Goals
4.3.1: Achieve zero fatalities or permanent disabling injuries to the public resulting from NASA activities.
Number of fatalities or permanent disabling injuries
Fiscal Year 2020 2021
Target 0 0
4 .3 .2: Reduce damage to NASA assets (excluding launched flight hardware) .
Previous year’s costs (due to damage to NASA assets) reduced by two percent
Fiscal Year 2020 2021
Target 2% below FY 2019 actual
2% below FY 2020 actual
4 .3 .3: Ensure the health, safety and performance of NASA astronauts and pilots .
Number of non-concurrence determinations and percent-age of program variances.
Fiscal Year 2020 2021
Target
Zero non-concur-rence determi-
nations and five percent or fewer
program variances
Zero non-concur-rence determi-
nations and five percent or fewer
program variances
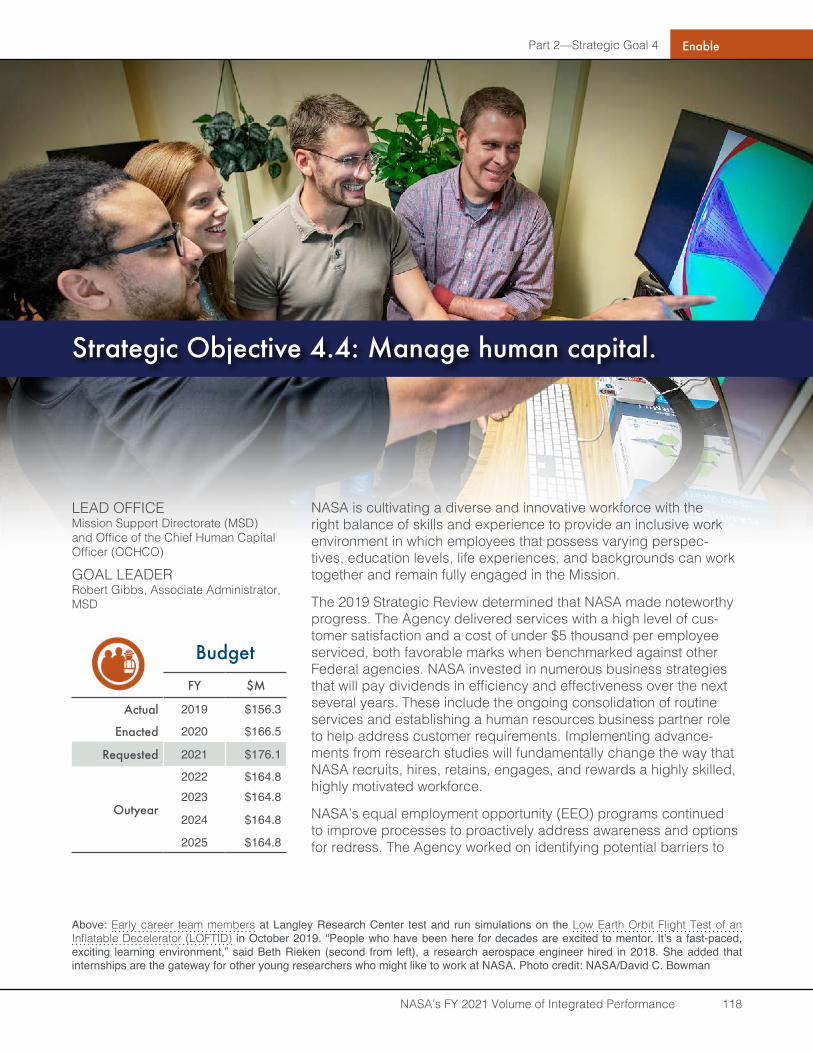
Part 2—Strategic Goal 4
NASA’s FY 2021 Volume of Integrated Performance 118
Enable
LEAD OFFICEMission Support Directorate (MSD) and Office of the Chief Human Capital Officer (OCHCO)
GOAL LEADERRobert Gibbs, Associate Administrator, MSD
BudgetFY $M
Actual 2019 $156.3
Enacted 2020 $166.5
Requested 2021 $176.1
Outyear
2022 $164.82023 $164.8
2024 $164.8
2025 $164.8
Strategic Objective 4.4: Manage human capital.
NASA is cultivating a diverse and innovative workforce with the right balance of skills and experience to provide an inclusive work environment in which employees that possess varying perspec-tives, education levels, life experiences, and backgrounds can work together and remain fully engaged in the Mission.
The 2019 Strategic Review determined that NASA made noteworthy progress. The Agency delivered services with a high level of cus-tomer satisfaction and a cost of under $5 thousand per employee serviced, both favorable marks when benchmarked against other Federal agencies. NASA invested in numerous business strategies that will pay dividends in efficiency and effectiveness over the next several years. These include the ongoing consolidation of routine services and establishing a human resources business partner role to help address customer requirements. Implementing advance-ments from research studies will fundamentally change the way that NASA recruits, hires, retains, engages, and rewards a highly skilled, highly motivated workforce.
NASA’s equal employment opportunity (EEO) programs continued to improve processes to proactively address awareness and options for redress. The Agency worked on identifying potential barriers to
Above: Early career team members at Langley Research Center test and run simulations on the Low Earth Orbit Flight Test of an Inflatable Decelerator (LOFTID) in October 2019. “People who have been here for decades are excited to mentor. It’s a fast-paced, exciting learning environment,” said Beth Rieken (second from left), a research aerospace engineer hired in 2018. She added that internships are the gateway for other young researchers who might like to work at NASA. Photo credit: NASA/David C. Bowman
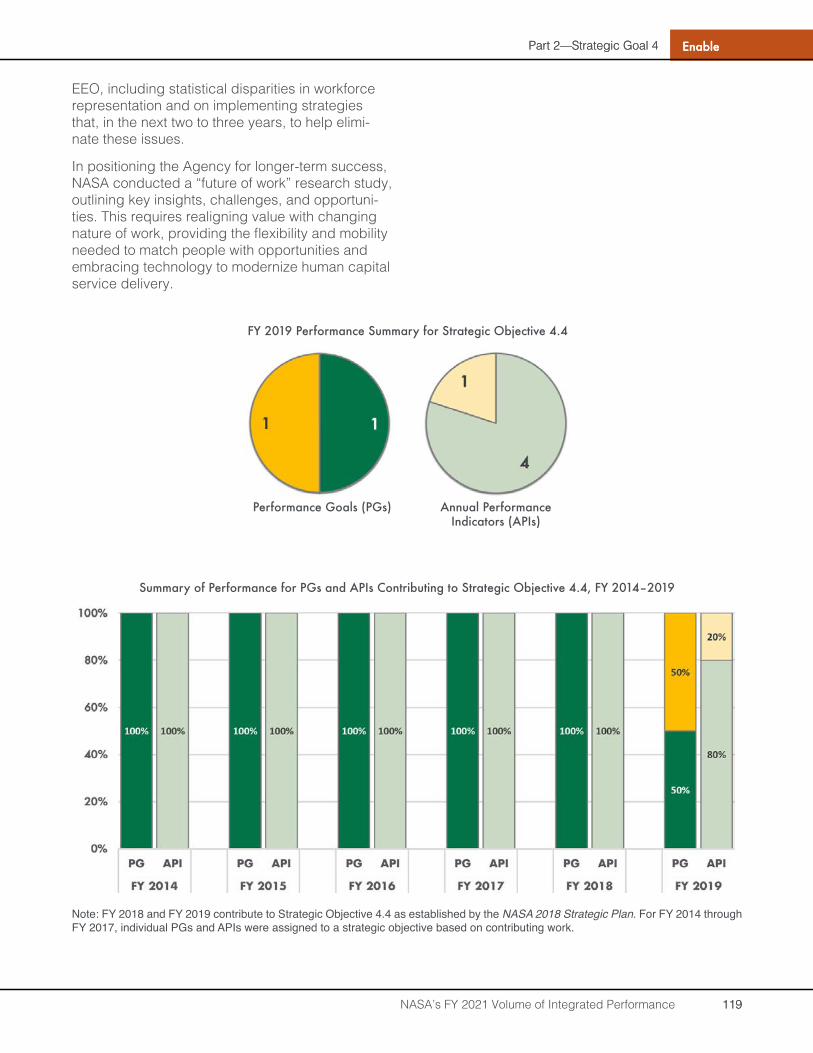
NASA’s FY 2021 Volume of Integrated Performance
Part 2—Strategic Goal 4Part 2—Strategic Goal 4
119119
EnableEnable
EEO, including statistical disparities in workforce representation and on implementing strategies that, in the next two to three years, to help elimi-nate these issues.
In positioning the Agency for longer-term success, NASA conducted a “future of work” research study, outlining key insights, challenges, and opportuni-ties. This requires realigning value with changing nature of work, providing the flexibility and mobility needed to match people with opportunities and embracing technology to modernize human capital service delivery.
FY 2019 Performance Summary for Strategic Objective 4.4
Performance Goals (PGs) Annual Performance Indicators (APIs)
Summary of Performance for PGs and APIs Contributing to Strategic Objective 4.4, FY 2014–2019
Note: FY 2018 and FY 2019 contribute to Strategic Objective 4.4 as established by the NASA 2018 Strategic Plan. For FY 2014 through FY 2017, individual PGs and APIs were assigned to a strategic objective based on contributing work.

NASA’s FY 2021 Volume of Integrated Performance
Part 2—Strategic Goal 4Part 2—Strategic Goal 4
120120
EnableEnable
Performance Goal 4.4.1: Define and build diverse workforce skills and compe-tencies needed for the Agency’s Mission.
2014 2015 2016 2017 2018 2019
Green Green Green Green Green Yellow
FY 2019 Annual Performance Indicators
AMO-19-20: Sustain NASA’s Innovation Score, as measured by the Innovation-related ques-tions of the Federal Employee Viewpoint Survey (FEVS), by taking actions such as refining and updating human capital policies, programs, and systems to support and encourage innovation to meet NASA’s missions.
Green
AMO-19-34: Ensure that NASA’s workforce has an appropriately-balanced skill and grade mix to meet current and future workforce needs by achieving an Agency hiring goal of 50 percent hires or intern conversions to be at entry and mid-level positions on the General Schedule (GS) pay scale (i.e., the GS-11 level or below or GS-12 level with a Ph.D.).
Yellow
FY 2020–2021 Performance Plan
4.4.1: Sustain NASA employees’ perceptions of innovation climate, as measured by the Innovation-related questions on the Federal Employee Viewpoint Survey (FEVS), through Human Capital programs and tools that support NASA employees .
Agency FEVS Innovation score
Fiscal Year 2020 2021
Target 84% 84%
FY 2019 Performance Progress
NASA rated this performance goal yellow for FY 2019 because the Agency was slightly below the target to meet early career hiring of 50 per-cent and only achieved 42 percent, as measured by hires or intern conversions to be at entry and mid-level positions on the GS pay scale. These positions are defined by NASA as GS-11 level or below or GS-12 level with a Ph.D. These positions are necessary for NASA to continue to grow and remain an industry leader.
Even though NASA did not achieve a green rating, the Agency still met the target of improving NASA’s Innovation Score, from 83 percent to 84 percent,
as measured by the innovation-related questions of the FEVS, which measures employees’ percep-tions of their workplace experiences, leadership, and culture (see the table below). NASA continues to improve this score by refining and updating human capital policies, programs, and systems to support and encourage innovation to meet NASA’s missions.
NASA’s Innovation Score, 2016–2019
2016 2017 2018 201981.0% 82.7% 83.0% 84.0%
The Innovation score is based on NASA civil servant re-sponses to the following three questions: • I feel encouraged to come up with new and better
ways of doing things.• I am constantly looking for ways to do my job better.• Creativity and innovation are rewarded.
NASA has redesigned the way human capital services are delivered through the use of Human Resources Business Partners (HRBPs). HRBPs are more engrained in the organizations they are servicing, enabling the Agency to more strate-gically hire, develop, and manage its workforce. NASA also gained more flexible hiring authorities and refined hiring processes to improve efficiency. This will allow the Agency to hire skilled employees faster and more competitively, helping NASA meet the challenge of landing the first woman and the next man on the Moon by 2024 while also fulfilling other parts of its Mission. NASA increased its focus on strategic workforce planning by developing a new process, which allows the Agency to increase its agility and alignment to future mission needs. NASA also launched a new People Analytics branch. This future-focused capability is concen-trated on better understanding the implications of decisions for NASA’s people, and factoring that insight into decision making, strategic planning, and even the day-to-day experience of working at NASA.
The Office of the Chief Human Capital Officer, part of the Mission Support Directorate, helps NASA maintain an adaptable and skilled workforce through strategic workforce planning, management services, and staff training and development.
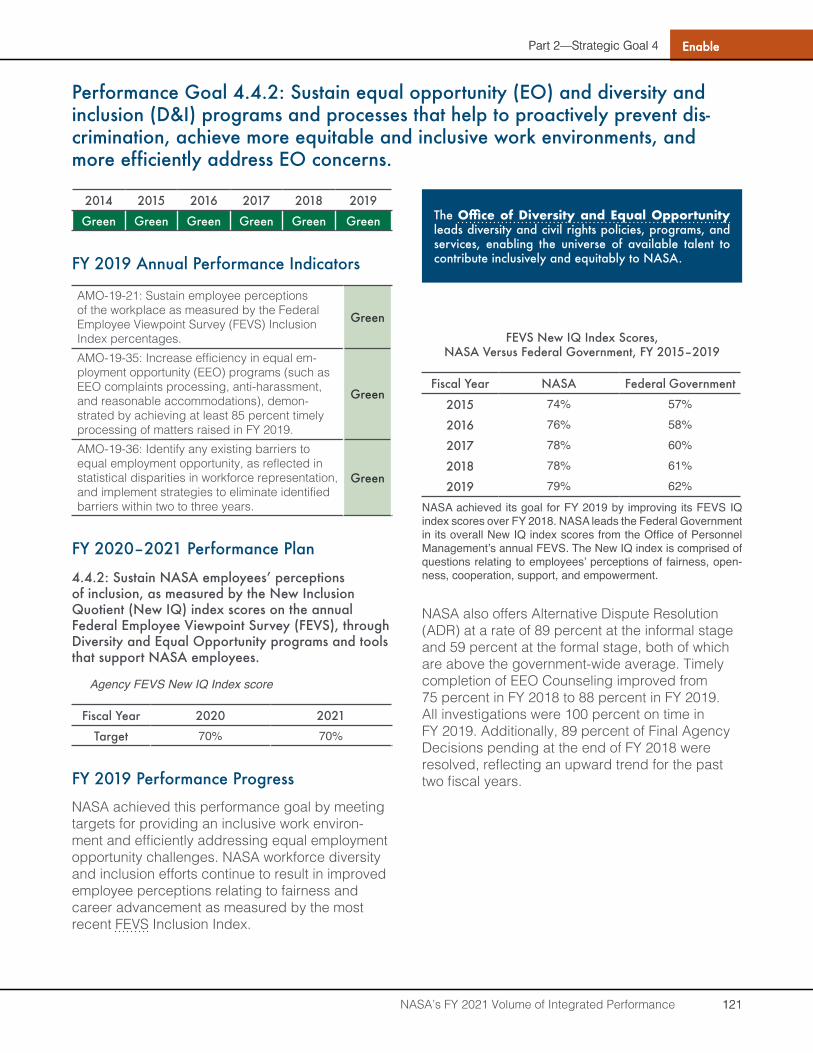
NASA’s FY 2021 Volume of Integrated Performance
Part 2—Strategic Goal 4Part 2—Strategic Goal 4
121121
EnableEnable
Performance Goal 4.4.2: Sustain equal opportunity (EO) and diversity and inclusion (D&I) programs and processes that help to proactively prevent dis-crimination, achieve more equitable and inclusive work environments, and more efficiently address EO concerns .
2014 2015 2016 2017 2018 2019
Green Green Green Green Green Green
FY 2019 Annual Performance Indicators
AMO-19-21: Sustain employee perceptions of the workplace as measured by the Federal Employee Viewpoint Survey (FEVS) Inclusion Index percentages.
Green
AMO-19-35: Increase efficiency in equal em-ployment opportunity (EEO) programs (such as EEO complaints processing, anti-harassment, and reasonable accommodations), demon-strated by achieving at least 85 percent timely processing of matters raised in FY 2019.
Green
AMO-19-36: Identify any existing barriers to equal employment opportunity, as reflected in statistical disparities in workforce representation, and implement strategies to eliminate identified barriers within two to three years.
Green
FY 2020–2021 Performance Plan
4.4.2: Sustain NASA employees’ perceptions of inclusion, as measured by the New Inclusion Quotient (New IQ) index scores on the annual Federal Employee Viewpoint Survey (FEVS), through Diversity and Equal Opportunity programs and tools that support NASA employees .
Agency FEVS New IQ Index score
Fiscal Year 2020 2021
Target 70% 70%
FY 2019 Performance Progress
NASA achieved this performance goal by meeting targets for providing an inclusive work environ-ment and efficiently addressing equal employment opportunity challenges. NASA workforce diversity and inclusion efforts continue to result in improved employee perceptions relating to fairness and career advancement as measured by the most recent FEVS Inclusion Index.
FEVS New IQ Index Scores, NASA Versus Federal Government, FY 2015–2019
Fiscal Year NASA Federal Government
2015 74% 57%2016 76% 58%2017 78% 60%2018 78% 61%2019 79% 62%
NASA achieved its goal for FY 2019 by improving its FEVS IQ index scores over FY 2018. NASA leads the Federal Government in its overall New IQ index scores from the Office of Personnel Management’s annual FEVS. The New IQ index is comprised of questions relating to employees’ perceptions of fairness, open-ness, cooperation, support, and empowerment.
NASA also offers Alternative Dispute Resolution (ADR) at a rate of 89 percent at the informal stage and 59 percent at the formal stage, both of which are above the government-wide average. Timely completion of EEO Counseling improved from 75 percent in FY 2018 to 88 percent in FY 2019. All investigations were 100 percent on time in FY 2019. Additionally, 89 percent of Final Agency Decisions pending at the end of FY 2018 were resolved, reflecting an upward trend for the past two fiscal years.
The Office of Diversity and Equal Opportunity leads diversity and civil rights policies, programs, and services, enabling the universe of available talent to contribute inclusively and equitably to NASA.
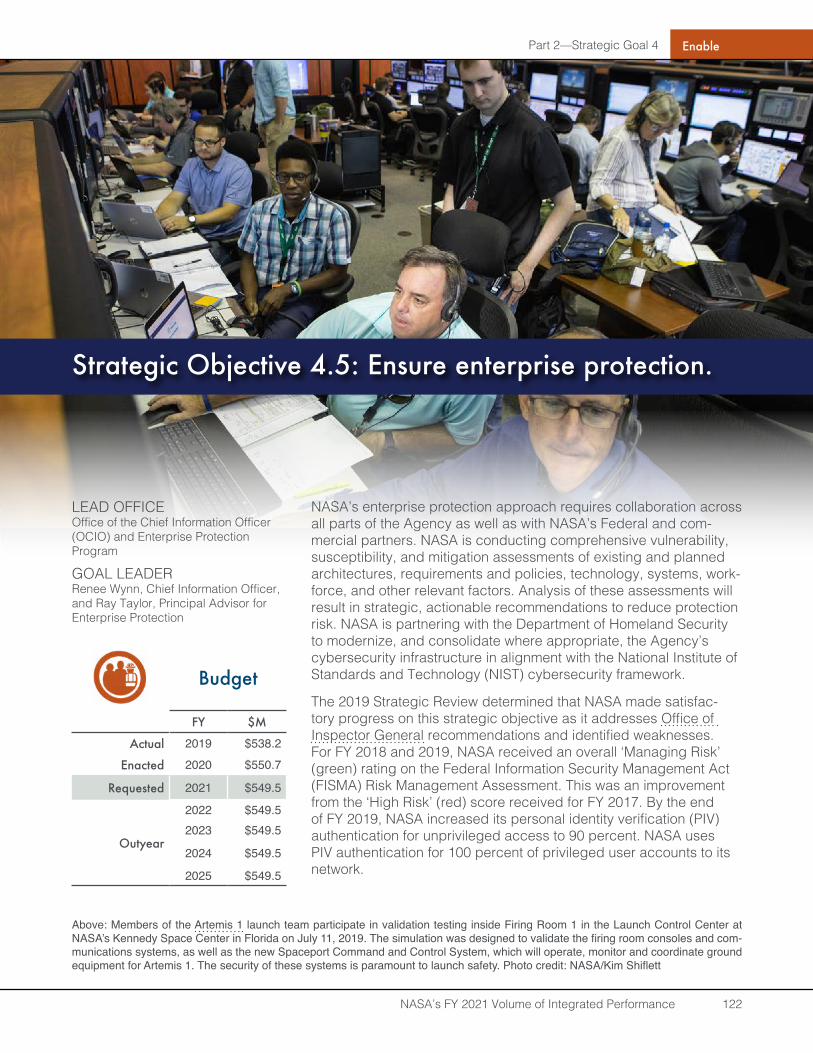
Part 2—Strategic Goal 4
NASA’s FY 2021 Volume of Integrated Performance 122
Enable
LEAD OFFICEOffice of the Chief Information Officer (OCIO) and Enterprise Protection Program
GOAL LEADERRenee Wynn, Chief Information Officer, and Ray Taylor, Principal Advisor for Enterprise Protection
Budget
FY $M
Actual 2019 $538.2
Enacted 2020 $550.7
Requested 2021 $549.5
Outyear
2022 $549.52023 $549.5
2024 $549.5
2025 $549.5
Strategic Objective 4.5: Ensure enterprise protection.
NASA’s enterprise protection approach requires collaboration across all parts of the Agency as well as with NASA’s Federal and com-mercial partners. NASA is conducting comprehensive vulnerability, susceptibility, and mitigation assessments of existing and planned architectures, requirements and policies, technology, systems, work-force, and other relevant factors. Analysis of these assessments will result in strategic, actionable recommendations to reduce protection risk. NASA is partnering with the Department of Homeland Security to modernize, and consolidate where appropriate, the Agency’s cybersecurity infrastructure in alignment with the National Institute of Standards and Technology (NIST) cybersecurity framework.
The 2019 Strategic Review determined that NASA made satisfac-tory progress on this strategic objective as it addresses Office of Inspector General recommendations and identified weaknesses. For FY 2018 and 2019, NASA received an overall ‘Managing Risk’ (green) rating on the Federal Information Security Management Act (FISMA) Risk Management Assessment. This was an improvement from the ‘High Risk’ (red) score received for FY 2017. By the end of FY 2019, NASA increased its personal identity verification (PIV) authentication for unprivileged access to 90 percent. NASA uses PIV authentication for 100 percent of privileged user accounts to its network.
Above: Members of the Artemis 1 launch team participate in validation testing inside Firing Room 1 in the Launch Control Center at NASA’s Kennedy Space Center in Florida on July 11, 2019. The simulation was designed to validate the firing room consoles and com-munications systems, as well as the new Spaceport Command and Control System, which will operate, monitor and coordinate ground equipment for Artemis 1. The security of these systems is paramount to launch safety. Photo credit: NASA/Kim Shiflett
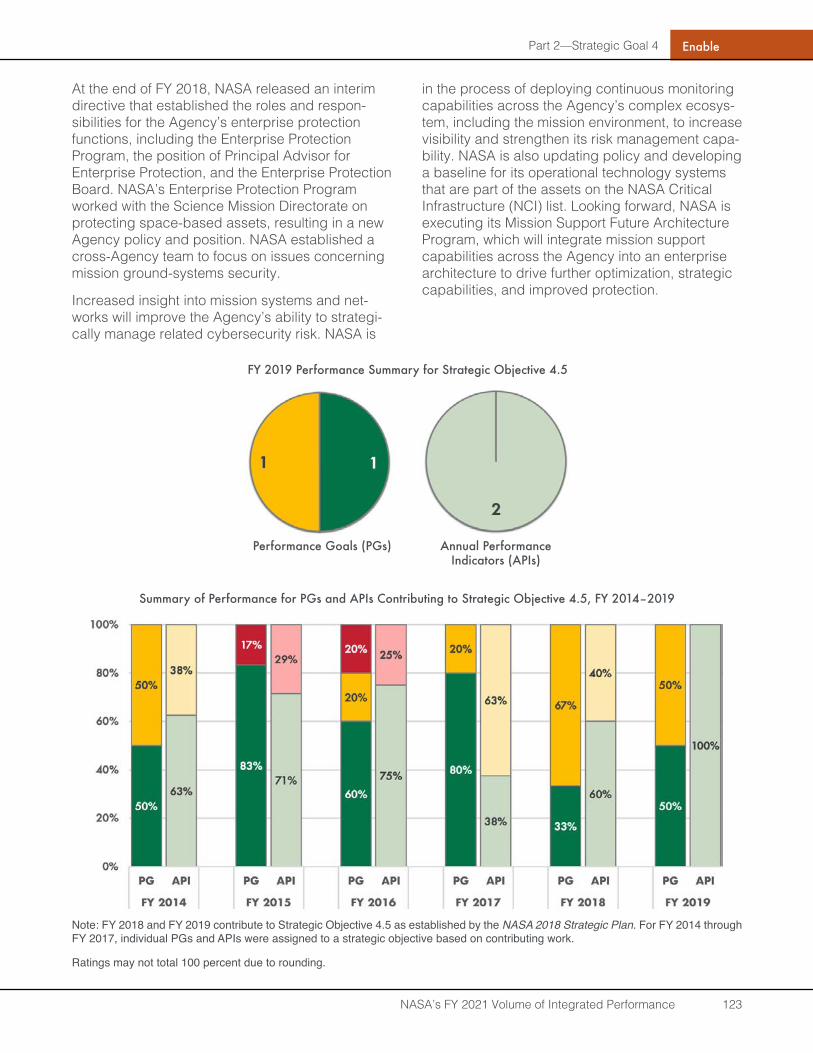
Part 2—Strategic Goal 4
NASA’s FY 2021 Volume of Integrated Performance 123
Enable
At the end of FY 2018, NASA released an interim directive that established the roles and respon-sibilities for the Agency’s enterprise protection functions, including the Enterprise Protection Program, the position of Principal Advisor for Enterprise Protection, and the Enterprise Protection Board. NASA’s Enterprise Protection Program worked with the Science Mission Directorate on protecting space-based assets, resulting in a new Agency policy and position. NASA established a cross-Agency team to focus on issues concerning mission ground-systems security.
Increased insight into mission systems and net-works will improve the Agency’s ability to strategi-cally manage related cybersecurity risk. NASA is
in the process of deploying continuous monitoring capabilities across the Agency’s complex ecosys-tem, including the mission environment, to increase visibility and strengthen its risk management capa-bility. NASA is also updating policy and developing a baseline for its operational technology systems that are part of the assets on the NASA Critical Infrastructure (NCI) list. Looking forward, NASA is executing its Mission Support Future Architecture Program, which will integrate mission support capabilities across the Agency into an enterprise architecture to drive further optimization, strategic capabilities, and improved protection.
FY 2019 Performance Summary for Strategic Objective 4.5
Performance Goals (PGs) Annual Performance Indicators (APIs)
Summary of Performance for PGs and APIs Contributing to Strategic Objective 4.5, FY 2014–2019
Note: FY 2018 and FY 2019 contribute to Strategic Objective 4.5 as established by the NASA 2018 Strategic Plan. For FY 2014 through FY 2017, individual PGs and APIs were assigned to a strategic objective based on contributing work.
Ratings may not total 100 percent due to rounding.
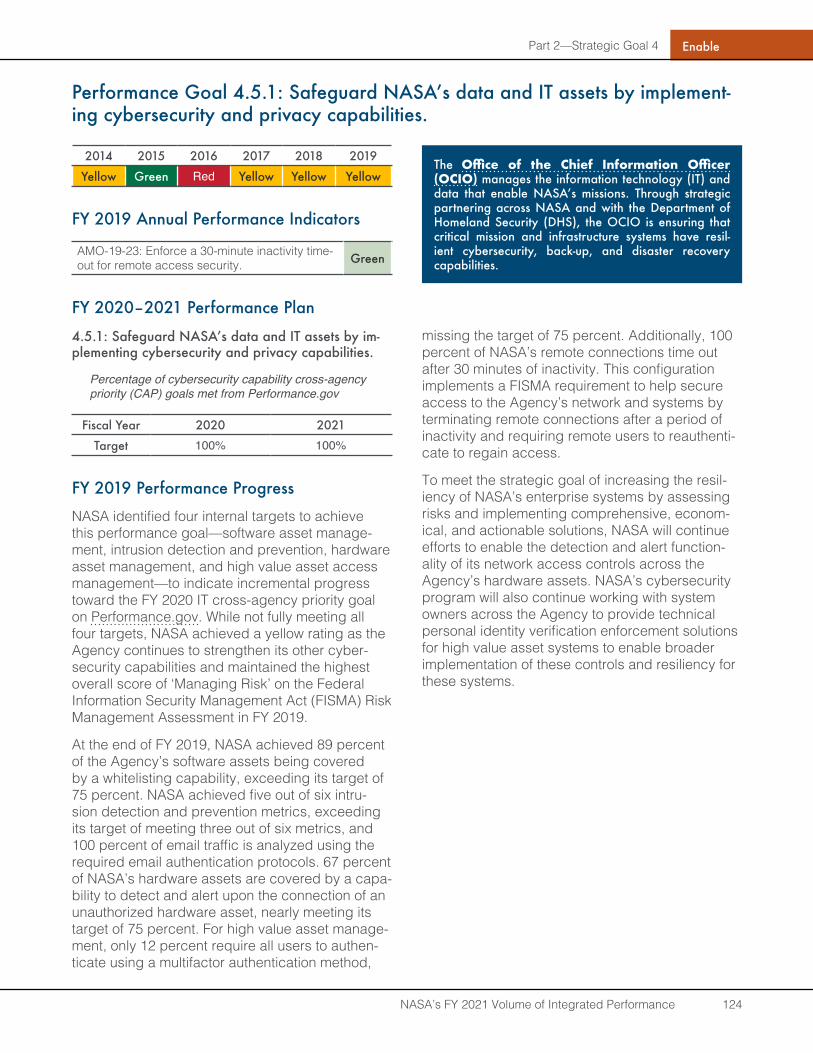
Part 2—Strategic Goal 4
NASA’s FY 2021 Volume of Integrated Performance 124
Enable
Performance Goal 4.5.1: Safeguard NASA’s data and IT assets by implement-ing cybersecurity and privacy capabilities.
2014 2015 2016 2017 2018 2019
Yellow Green Red Yellow Yellow Yellow
FY 2019 Annual Performance Indicators
AMO-19-23: Enforce a 30-minute inactivity time-out for remote access security. Green
FY 2020–2021 Performance Plan
4.5.1: Safeguard NASA’s data and IT assets by im-plementing cybersecurity and privacy capabilities.
Percentage of cybersecurity capability cross-agency priority (CAP) goals met from Performance.gov
Fiscal Year 2020 2021
Target 100% 100%
FY 2019 Performance Progress
NASA identified four internal targets to achieve this performance goal—software asset manage-ment, intrusion detection and prevention, hardware asset management, and high value asset access management—to indicate incremental progress toward the FY 2020 IT cross-agency priority goal on Performance.gov. While not fully meeting all four targets, NASA achieved a yellow rating as the Agency continues to strengthen its other cyber-security capabilities and maintained the highest overall score of ‘Managing Risk’ on the Federal Information Security Management Act (FISMA) Risk Management Assessment in FY 2019.
At the end of FY 2019, NASA achieved 89 percent of the Agency’s software assets being covered by a whitelisting capability, exceeding its target of 75 percent. NASA achieved five out of six intru-sion detection and prevention metrics, exceeding its target of meeting three out of six metrics, and 100 percent of email traffic is analyzed using the required email authentication protocols. 67 percent of NASA’s hardware assets are covered by a capa-bility to detect and alert upon the connection of an unauthorized hardware asset, nearly meeting its target of 75 percent. For high value asset manage-ment, only 12 percent require all users to authen-ticate using a multifactor authentication method,
missing the target of 75 percent. Additionally, 100 percent of NASA’s remote connections time out after 30 minutes of inactivity. This configuration implements a FISMA requirement to help secure access to the Agency’s network and systems by terminating remote connections after a period of inactivity and requiring remote users to reauthenti-cate to regain access.
To meet the strategic goal of increasing the resil-iency of NASA’s enterprise systems by assessing risks and implementing comprehensive, econom-ical, and actionable solutions, NASA will continue efforts to enable the detection and alert function-ality of its network access controls across the Agency’s hardware assets. NASA’s cybersecurity program will also continue working with system owners across the Agency to provide technical personal identity verification enforcement solutions for high value asset systems to enable broader implementation of these controls and resiliency for these systems.
The Office of the Chief Information Officer (OCIO) manages the information technology (IT) and data that enable NASA’s missions. Through strategic partnering across NASA and with the Department of Homeland Security (DHS), the OCIO is ensuring that critical mission and infrastructure systems have resil-ient cybersecurity, back-up, and disaster recovery capabilities .
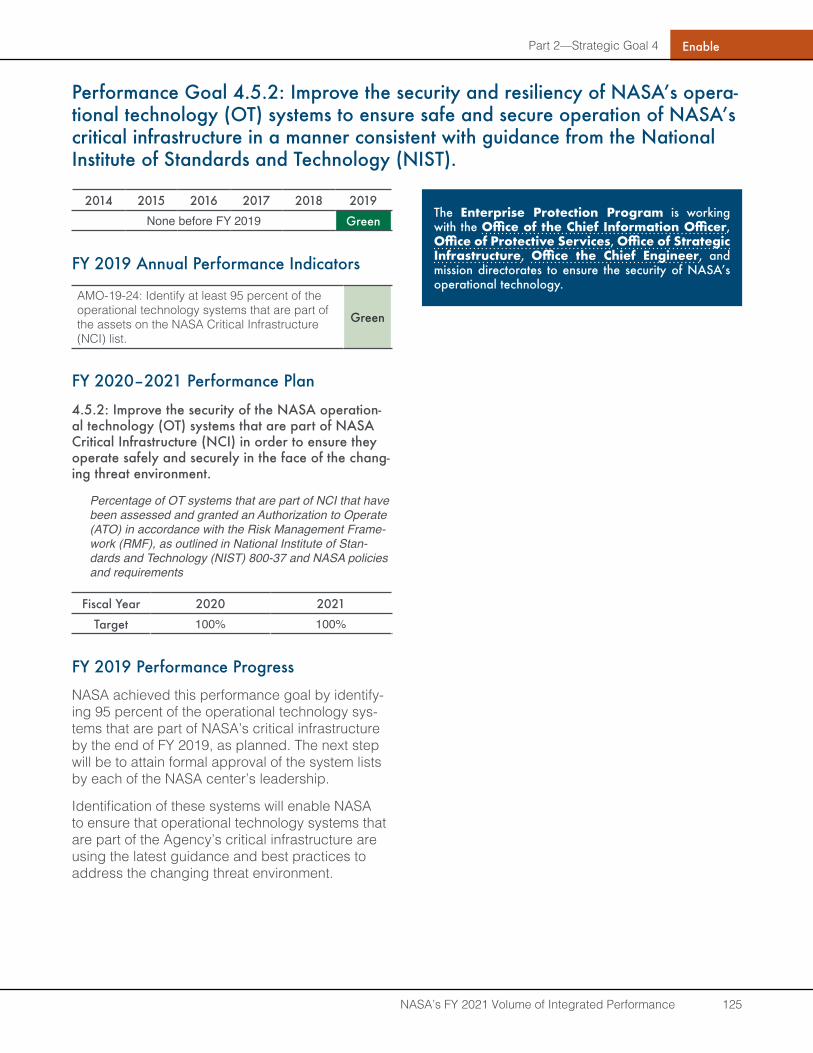
Part 2—Strategic Goal 4
NASA’s FY 2021 Volume of Integrated Performance 125
Enable
Performance Goal 4.5.2: Improve the security and resiliency of NASA’s opera-tional technology (OT) systems to ensure safe and secure operation of NASA’s critical infrastructure in a manner consistent with guidance from the National Institute of Standards and Technology (NIST) .
2014 2015 2016 2017 2018 2019None before FY 2019 Green
FY 2019 Annual Performance Indicators
AMO-19-24: Identify at least 95 percent of the operational technology systems that are part of the assets on the NASA Critical Infrastructure (NCI) list.
Green
FY 2020–2021 Performance Plan
4.5.2: Improve the security of the NASA operation-al technology (OT) systems that are part of NASA Critical Infrastructure (NCI) in order to ensure they operate safely and securely in the face of the chang-ing threat environment.
Percentage of OT systems that are part of NCI that have been assessed and granted an Authorization to Operate (ATO) in accordance with the Risk Management Frame-work (RMF), as outlined in National Institute of Stan-dards and Technology (NIST) 800-37 and NASA policies and requirements
Fiscal Year 2020 2021
Target 100% 100%
FY 2019 Performance Progress
NASA achieved this performance goal by identify-ing 95 percent of the operational technology sys-tems that are part of NASA’s critical infrastructure by the end of FY 2019, as planned. The next step will be to attain formal approval of the system lists by each of the NASA center’s leadership.
Identification of these systems will enable NASA to ensure that operational technology systems that are part of the Agency’s critical infrastructure are using the latest guidance and best practices to address the changing threat environment.
The Enterprise Protection Program is working with the Office of the Chief Information Officer, Office of Protective Services, Office of Strategic Infrastructure, Office the Chief Engineer, and mission directorates to ensure the security of NASA’s operational technology .

Part 2—Strategic Goal 4
NASA’s FY 2021 Volume of Integrated Performance 126
Enable
LEAD OFFICEMission Support Directorate (MSD)
GOAL LEADERRobert Gibbs, Associate Administrator, MSD
BudgetFY $M
Actual 2019 $1,976.8
Enacted 2020 $2,055.8
Requested 2021 $2,321.1
Outyear
2022 $2,321.22023 $2,321.2
2024 $2,321.2
2025 $2,321.2
Strategic Objective 4.6: Sustain infrastructure capabilities and operations .
Above: Marshall Space Flight Center officially opened its newest environmentally friendly building on Earth Day, April 22, 2019, with a rib-bon cutting ceremony that included (from left) David Burns, Manager of Marshall’s Science and Technology Office; Roy Malone, Director of Marshall’s Office of Center Operations; Calvin Williams, NASA Assistant Administrator for the Office of Strategic Infrastructure; Col. Sebastien Joly, Commander of the U.S. Army Corps of Engineers’ Mobile District; Marshall Director Jody Singer; U.S. Senator Doug Jones of Alabama; Bobby Watkins, Manager of Marshall’s Human Exploration Development and Operations Office; and Marshall Deputy Director Paul McConnaughey. Building 4221 is designed to rigorous Federal guidelines on energy and water efficiency and is Marshall Space Flight Center’s ninth Leadership in Energy and Environmental Design (LEED)-certified facility. Photo credit: NASA/Emmett Given
NASA is providing the facilities, tools, and services required to effi-ciently manage, operate, and sustain the infrastructure necessary to meet mission objectives. NASA has adopted a facilities maintenance and operation philosophy that proactively pursues and adopts the safest, most cost-effective blend of reliability-centered maintenance techniques, sustainability practices, and safety procedures. An Agency facilities master plan establishes priorities (over a 20-year projection) for construction, demolition, and maintenance. NASA uses a centralized approach in providing standardized, timely, and accurate business support for services.
In spring 2019, NASA’s Strategic Review assessed this to be a focus area for improvement, an area also identified as a challenge in the 2019 Report on NASA’s Top Management and Performance Challenges. NASA continues to address issues and challenges related to its aging infrastructure. While the Construction of Facilities program has focused on modernizing and repairing infrastructure, NASA has seen increased facility failures and, as a result, has only reduced spending on unscheduled maintenance by only one
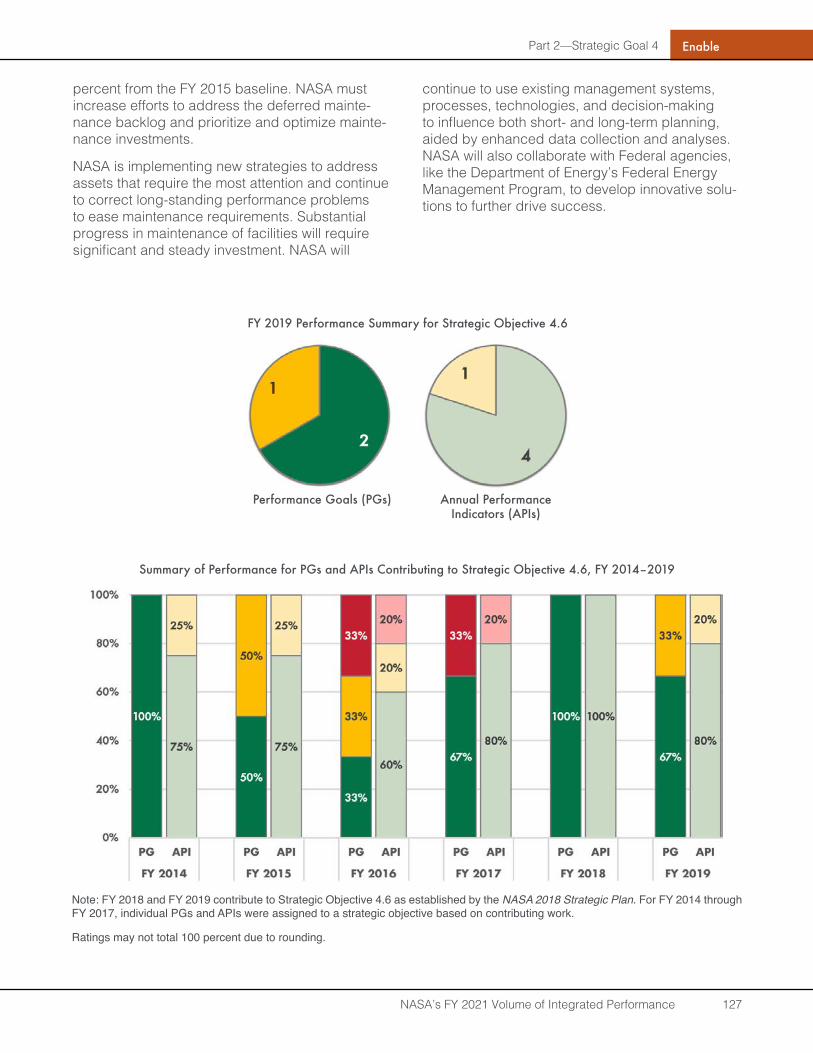
Part 2—Strategic Goal 4
NASA’s FY 2021 Volume of Integrated Performance 127
Enable
percent from the FY 2015 baseline. NASA must increase efforts to address the deferred mainte-nance backlog and prioritize and optimize mainte-nance investments.
NASA is implementing new strategies to address assets that require the most attention and continue to correct long-standing performance problems to ease maintenance requirements. Substantial progress in maintenance of facilities will require significant and steady investment. NASA will
continue to use existing management systems, processes, technologies, and decision-making to influence both short- and long-term planning, aided by enhanced data collection and analyses. NASA will also collaborate with Federal agencies, like the Department of Energy’s Federal Energy Management Program, to develop innovative solu-tions to further drive success.
Note: FY 2018 and FY 2019 contribute to Strategic Objective 4.6 as established by the NASA 2018 Strategic Plan. For FY 2014 through FY 2017, individual PGs and APIs were assigned to a strategic objective based on contributing work.
Ratings may not total 100 percent due to rounding.
FY 2019 Performance Summary for Strategic Objective 4.6
Performance Goals (PGs) Annual Performance Indicators (APIs)
Summary of Performance for PGs and APIs Contributing to Strategic Objective 4.6, FY 2014–2019
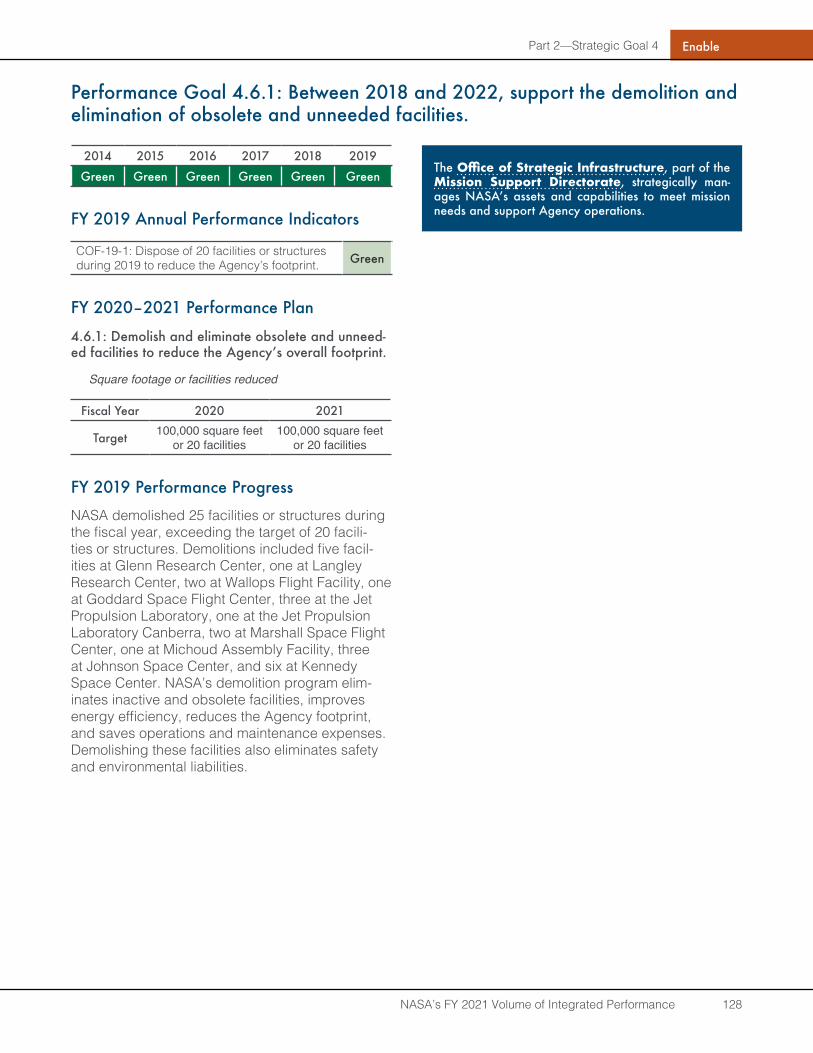
Part 2—Strategic Goal 4
NASA’s FY 2021 Volume of Integrated Performance 128
Enable
Performance Goal 4.6.1: Between 2018 and 2022, support the demolition and elimination of obsolete and unneeded facilities .
2014 2015 2016 2017 2018 2019
Green Green Green Green Green Green
FY 2019 Annual Performance Indicators
COF-19-1: Dispose of 20 facilities or structures during 2019 to reduce the Agency’s footprint. Green
FY 2020–2021 Performance Plan
4 .6 .1: Demolish and eliminate obsolete and unneed-ed facilities to reduce the Agency’s overall footprint.
Square footage or facilities reduced
Fiscal Year 2020 2021
Target 100,000 square feet or 20 facilities
100,000 square feet or 20 facilities
FY 2019 Performance Progress
NASA demolished 25 facilities or structures during the fiscal year, exceeding the target of 20 facili-ties or structures. Demolitions included five facil-ities at Glenn Research Center, one at Langley Research Center, two at Wallops Flight Facility, one at Goddard Space Flight Center, three at the Jet Propulsion Laboratory, one at the Jet Propulsion Laboratory Canberra, two at Marshall Space Flight Center, one at Michoud Assembly Facility, three at Johnson Space Center, and six at Kennedy Space Center. NASA’s demolition program elim-inates inactive and obsolete facilities, improves energy efficiency, reduces the Agency footprint, and saves operations and maintenance expenses. Demolishing these facilities also eliminates safety and environmental liabilities.
The Office of Strategic Infrastructure, part of the Mission Support Directorate, strategically man-ages NASA’s assets and capabilities to meet mission needs and support Agency operations .
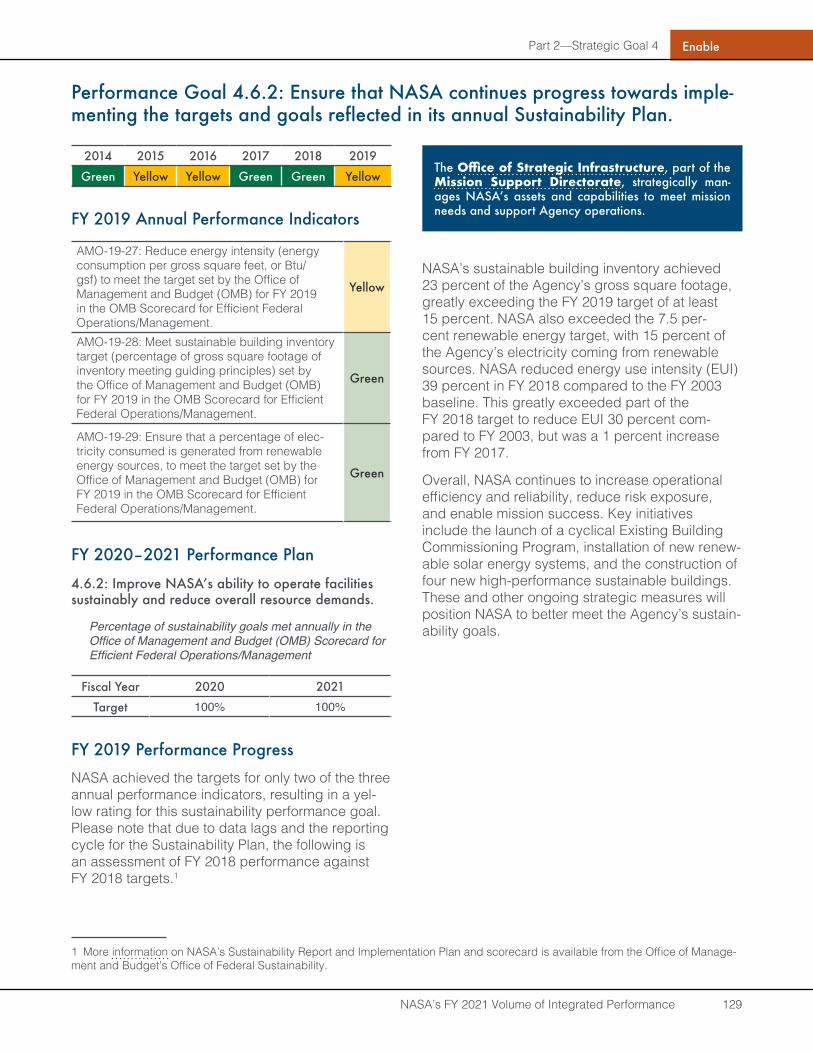
Part 2—Strategic Goal 4
NASA’s FY 2021 Volume of Integrated Performance 129
Enable
Performance Goal 4 .6 .2: Ensure that NASA continues progress towards imple-menting the targets and goals reflected in its annual Sustainability Plan .
1 More information on NASA’s Sustainability Report and Implementation Plan and scorecard is available from the Office of Manage-ment and Budget’s Office of Federal Sustainability.
2014 2015 2016 2017 2018 2019
Green Yellow Yellow Green Green Yellow
FY 2019 Annual Performance Indicators
AMO-19-27: Reduce energy intensity (energy consumption per gross square feet, or Btu/gsf) to meet the target set by the Office of Management and Budget (OMB) for FY 2019 in the OMB Scorecard for Efficient Federal Operations/Management.
Yellow
AMO-19-28: Meet sustainable building inventory target (percentage of gross square footage of inventory meeting guiding principles) set by the Office of Management and Budget (OMB) for FY 2019 in the OMB Scorecard for Efficient Federal Operations/Management.
Green
AMO-19-29: Ensure that a percentage of elec-tricity consumed is generated from renewable energy sources, to meet the target set by the Office of Management and Budget (OMB) for FY 2019 in the OMB Scorecard for Efficient Federal Operations/Management.
Green
FY 2020–2021 Performance Plan
4.6.2: Improve NASA’s ability to operate facilities sustainably and reduce overall resource demands.
Percentage of sustainability goals met annually in the Office of Management and Budget (OMB) Scorecard for Efficient Federal Operations/Management
Fiscal Year 2020 2021
Target 100% 100%
FY 2019 Performance Progress
NASA achieved the targets for only two of the three annual performance indicators, resulting in a yel-low rating for this sustainability performance goal. Please note that due to data lags and the reporting cycle for the Sustainability Plan, the following is an assessment of FY 2018 performance against FY 2018 targets.1
NASA’s sustainable building inventory achieved 23 percent of the Agency’s gross square footage, greatly exceeding the FY 2019 target of at least 15 percent. NASA also exceeded the 7.5 per-cent renewable energy target, with 15 percent of the Agency’s electricity coming from renewable sources. NASA reduced energy use intensity (EUI) 39 percent in FY 2018 compared to the FY 2003 baseline. This greatly exceeded part of the FY 2018 target to reduce EUI 30 percent com-pared to FY 2003, but was a 1 percent increase from FY 2017.
Overall, NASA continues to increase operational efficiency and reliability, reduce risk exposure, and enable mission success. Key initiatives include the launch of a cyclical Existing Building Commissioning Program, installation of new renew-able solar energy systems, and the construction of four new high-performance sustainable buildings. These and other ongoing strategic measures will position NASA to better meet the Agency’s sustain-ability goals.
The Office of Strategic Infrastructure, part of the Mission Support Directorate, strategically man-ages NASA’s assets and capabilities to meet mission needs and support Agency operations .
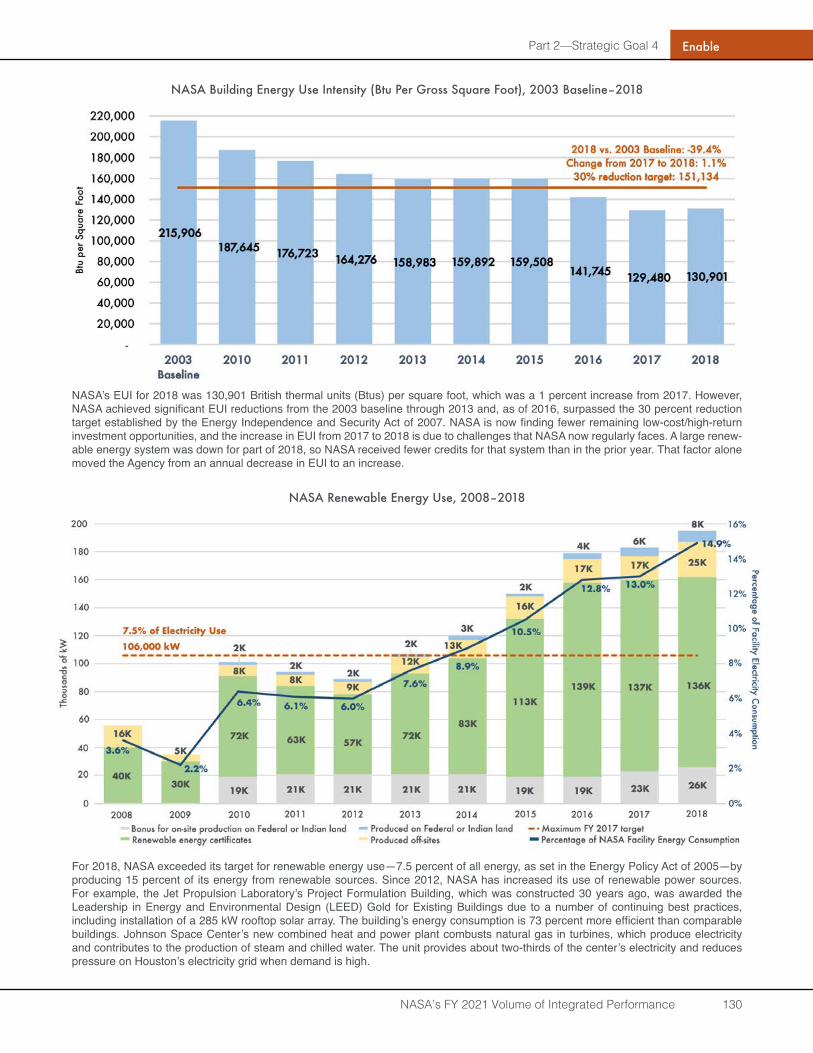
Part 2—Strategic Goal 4
NASA’s FY 2021 Volume of Integrated Performance 130
Enable
NASA Building Energy Use Intensity (Btu Per Gross Square Foot), 2003 Baseline–2018
NASA’s EUI for 2018 was 130,901 British thermal units (Btus) per square foot, which was a 1 percent increase from 2017. However, NASA achieved significant EUI reductions from the 2003 baseline through 2013 and, as of 2016, surpassed the 30 percent reduction target established by the Energy Independence and Security Act of 2007. NASA is now finding fewer remaining low-cost/high-return investment opportunities, and the increase in EUI from 2017 to 2018 is due to challenges that NASA now regularly faces. A large renew-able energy system was down for part of 2018, so NASA received fewer credits for that system than in the prior year. That factor alone moved the Agency from an annual decrease in EUI to an increase.
NASA Renewable Energy Use, 2008–2018
For 2018, NASA exceeded its target for renewable energy use—7.5 percent of all energy, as set in the Energy Policy Act of 2005—by producing 15 percent of its energy from renewable sources. Since 2012, NASA has increased its use of renewable power sources. For example, the Jet Propulsion Laboratory’s Project Formulation Building, which was constructed 30 years ago, was awarded the Leadership in Energy and Environmental Design (LEED) Gold for Existing Buildings due to a number of continuing best practices, including installation of a 285 kW rooftop solar array. The building’s energy consumption is 73 percent more efficient than comparable buildings. Johnson Space Center’s new combined heat and power plant combusts natural gas in turbines, which produce electricity and contributes to the production of steam and chilled water. The unit provides about two-thirds of the center’s electricity and reduces pressure on Houston’s electricity grid when demand is high.
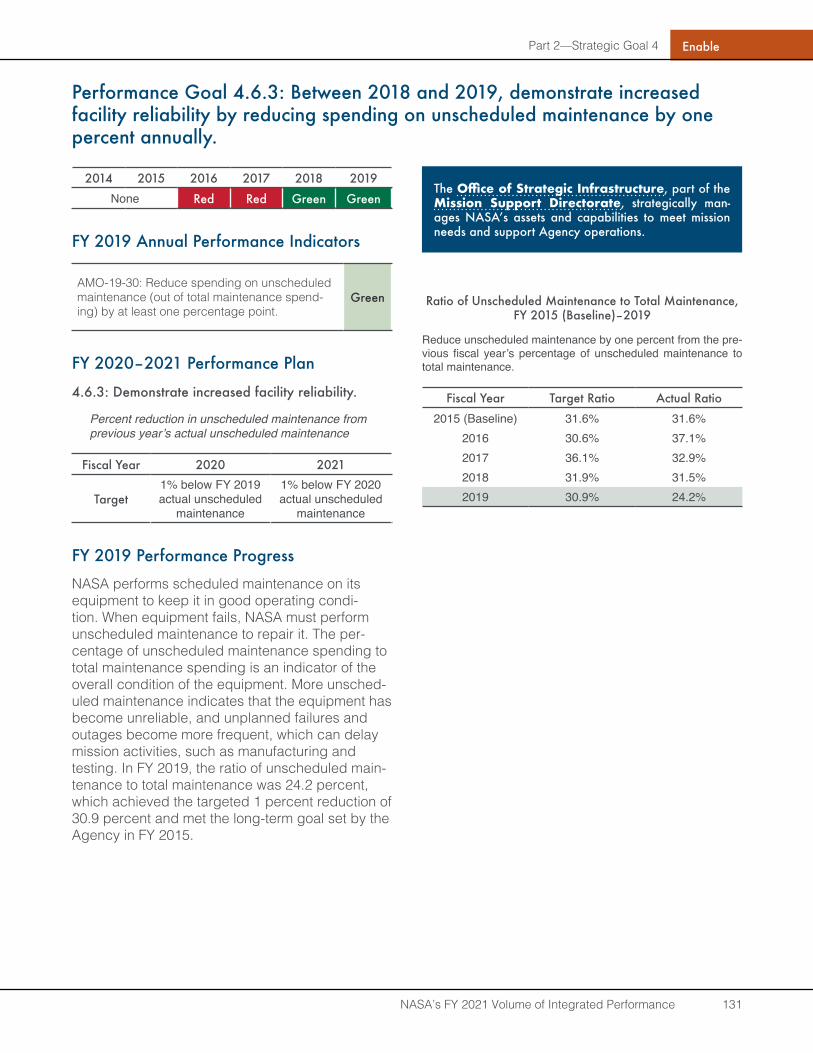
Part 2—Strategic Goal 4
NASA’s FY 2021 Volume of Integrated Performance 131
Enable
Performance Goal 4.6.3: Between 2018 and 2019, demonstrate increased facility reliability by reducing spending on unscheduled maintenance by one percent annually .
2014 2015 2016 2017 2018 2019None Red Red Green Green
FY 2019 Annual Performance Indicators
AMO-19-30: Reduce spending on unscheduled maintenance (out of total maintenance spend-ing) by at least one percentage point.
Green
FY 2020–2021 Performance Plan
4 .6 .3: Demonstrate increased facility reliability .
Percent reduction in unscheduled maintenance from previous year’s actual unscheduled maintenance
Fiscal Year 2020 2021
Target1% below FY 2019 actual unscheduled
maintenance
1% below FY 2020 actual unscheduled
maintenance
FY 2019 Performance Progress
NASA performs scheduled maintenance on its equipment to keep it in good operating condi-tion. When equipment fails, NASA must perform unscheduled maintenance to repair it. The per-centage of unscheduled maintenance spending to total maintenance spending is an indicator of the overall condition of the equipment. More unsched-uled maintenance indicates that the equipment has become unreliable, and unplanned failures and outages become more frequent, which can delay mission activities, such as manufacturing and testing. In FY 2019, the ratio of unscheduled main-tenance to total maintenance was 24.2 percent, which achieved the targeted 1 percent reduction of 30.9 percent and met the long-term goal set by the Agency in FY 2015.
Ratio of Unscheduled Maintenance to Total Maintenance, FY 2015 (Baseline)–2019
Reduce unscheduled maintenance by one percent from the pre-vious fiscal year’s percentage of unscheduled maintenance to total maintenance.
Fiscal Year Target Ratio Actual Ratio
2015 (Baseline) 31.6% 31.6%2016 30.6% 37.1%2017 36.1% 32.9%2018 31.9% 31.5%2019 30.9% 24.2%
The Office of Strategic Infrastructure, part of the Mission Support Directorate, strategically man-ages NASA’s assets and capabilities to meet mission needs and support Agency operations .