Embed Size (px)
Citation preview
FY 2009 Performance and Accountability Report
Detailed Performance
National Aeronautics and Space Administration
www.nasa.gov
DetaileD Performance DP-1
Measuring NASA’s Performance
NASA creates an annual performance plan for each fiscal year to work toward achieving NASA’s Strategic Goals. The performance plan includes multi-year Outcomes and Annual Performance Goals (APGs) under each Strategic Goal and Sub-goal included in NASA’s Strategic Plan. This section provides detailed information on NASA’s perfor-mance on the Agency’s FY 2009 performance plan and the cost associated with those efforts.
NASA managers use both internal and external assessments to determine ratings for multi-year Outcomes and APGs. Internally, NASA monitors and analyzes each program’s adherence to budgets, schedules, and key mile-stones. The managers provide these analyses during monthly/quarterly reviews at the Center, Mission Directorate, and Agency levels to communicate the health and performance of their programs and projects. Based on the rat-ings, the managers formulate appropriate follow-up actions.
External advisors, like the NASA Advisory Council, the National Research Council, and the Aerospace Safety Advisory Panel, assess program content and direction. Also, experts from the science community, coordinated by NASA’s Science Mission Directorate, review the Agency’s progress toward meeting performance measures under Sub-goals 3A through 3D.
Many of the programs and projects mentioned in NASA’s performance measures are either robotic or human spaceflight missions. For more information on the missions mentioned in the PAR, please see NASA’s Missions at a Glance, located in the Other Accompanying Information section of this document.
a reader’s Guide to naSa’s Detailed Performance DataNASA’s detailed performance data is organized by the Strategic Goals and Sub-goals, to help the reader under-
stand NASA’s FY 2009 performance and the Agency’s progress toward achieving each Strategic Goal and Sub-goal.
Summary of PerformanceEach Strategic Goal or Sub-goal section presents a summary of performance ratings for the multi-year Outcomes
and APGs that support the goal. It also provides the expenditures associated with those activities.
Benefits This portion explains the value of work toward the Strategic Goal or Sub-goal, from gains within the Agency to
benefits for academia, the public sector, and government.
RisksRisk assessments are a regular part of NASA’s review process. In this portion, NASA outlines and describes the
primary concerns facing management with respect to cost, schedule, technical, or programmatic issues as they may affect individual missions, programs, or the Agency as a whole.
FY 2010 Performance ForecastThis list provides the reader with upcoming performance expectations.
Performance Measure Descriptions and Rating TrendsEach Outcome is a multi-year performance target designed to support the overarching Strategic Goal or Sub-
goal. The description explains the activities completed in FY 2009 to meet the Outcome. NASA assigns ratings to

DP-2 naSa fY 2009 Performance anD accountabilitY rePort
these Outcomes on a yearly basis, and provides the current rating along with previous years’ ratings to show trends in performance. While NASA rates the Outcome on a yearly basis, the rating takes into account past performance and future work. Management uses the scale below to assign ratings to the Outcomes based on their internal and external assessment results.
Each APG is designed to support the multi-year Outcomes. Although the APG is annual, it may be repeated several years in a row. NASA assigns ratings to these APGs on a yearly basis, and provides the current rating along with previous years’ ratings to show trends in performance. In some cases, an APG may support more than one Goal or Sub-goal, and will be shown multiple times. Management uses the scale below to assign ratings to APGs based on their internal and external assessment results.
What do the color ratings mean?
Color Multi-year Outcome Rating Annual Performance Goal Rating
GreenNASA achieved most APGs under this Outcome and is on-track to achieve or exceed this Outcome.
NASA achieved this APG.
YellowNASA made significant progress toward this Outcome, however, the Agency may not achieve this Outcome as stated.
NASA failed to achieve this APG, but made significant progress and anticipates achieving it during the next fiscal year.
RedNASA failed to achieve most of the APGs under this Outcome and does not expect to achieve this Outcome as stated.
NASA failed to achieve this APG and does not anticipate completing it within the next fiscal year.
White
This Outcome was canceled by management directive or is no longer applicable based on management changes to the APGs.
This APG was canceled by management directive and NASA is no longer pursuing activities relevant to this APG, or the program did not have activities relevant to the APG during the fiscal year.
Other Trending InformationIf an APG is new in FY 2009, there will be no previous ratings available. The table below explains other trending
information.
NoneAlthough NASA may have conducted work in this area, management did not include a performance measure for this work in the fiscal year’s performance plan.
6ESS11Green In prior years where data is available, NASA notes the applicable Outcome or APG reference number and rating to
provide performance trends. In some cases, an APG may track to more than one performance measure in past performance years.6ESS12
Green
For any unmet performance measure in FY 2009, NASA managers are responsible for providing a reason for not achieving the measure and plans for reaching the measure in the future. The FY 2010 PAR will include an update to this year’s Performance Improvement Plans, explaining activities and decisions that satisfy the plan set forth in FY 2009.
Additional Information
Uniform and Efficiency MeasuresNASA uses Uniform and Efficiency Measures to track the performance of management areas such as cost,
schedule, and project completion. A table provides these measures, with current and previous ratings for trending, organized by budget Theme.
FY 2008 Performance Plan UpdateThe FY 2008 Performance Improvement Plan Update reports activities and progress achieved during FY 2009 to
resolve unmet measures from FY 2008.
DP-3DetaileD Performance
The Space Shuttle has supported NASA’s Mission for nearly 30 years, carrying crews and cargo to low Earth orbit, performing repair, recovery, and maintenance missions on orbiting satellites, providing a platform for conducting science experiments, and supporting construction of the International Space Station (ISS). NASA plans to retire the Space Shuttle fleet when assembly of the ISS is complete. Until then, the Agency will demonstrate NASA’s most critical value—safety—by promoting engineering excellence, maintaining realistic flight schedules, and fostering internal forums where mission risks and benefits can be discussed and analyzed freely. 5
BenefitsThe Space Shuttle is recognized around the world as a symbol
of America’s space program and the Nation’s commitment to space exploration. NASA’s Space Shuttle Program has inspired whole generations to pursue dreams and careers in science, tech-nology, engineering, and mathematics. The program provides direct benefits to the Nation by advancing national security and economic interests in space, and by spurring technology develop-ment in critical areas such as navigation, computing, materials, and communications. Furthermore, due to its heavy-lift capacity, the
Space Shuttle is the only vehicle capable of completing assembly of the ISS in a manner consistent with NASA’s International Partner commitments and exploration research needs. The remaining Space Shuttle flights will be dedicated to ISS construction.
NASA will use the knowledge and assets developed over nearly three decades of Space Shuttle operations to build a new gen-eration of vehicles designed for missions beyond low Earth orbit. As the Space Shuttle fleet approaches its retirement, the Agency gradually is directing available Space Shuttle personnel, assets,
and knowledge toward the development and support of new hardware and technologies that will support the devel-opment of new vehicles for exploration. For the American public, this means continuity in the access to space and sustained U.S. leadership in technology development and civilian space exploration.
Risks to Achieving Strategic Goal 1The Space Shuttle Program faces two main challenges. First, NASA must maintain the skilled workforce and
critical assets needed to safely complete the Space Shuttle manifest. Second, NASA must manage the process of retiring the Shuttle and transitioning or disposing of Space Shuttle assets and capabilities when they are no longer needed for safe mission execution of the Shuttle or Constellation programs.
The Space Shuttle transition and retirement effort is one of the largest that the Agency has undertaken in its history. As of the end of FY 2009, the Space Shuttle Program employed over 1,200 civil servants, with more than 11,000 work-year equivalents employed by prime contractors. The program’s assets are significant; the program occupies over 640 facilities, and uses over 990,000 line items of hardware and equipment. The total equipment acquisition value is over $12 billion, spread across hundreds of locations. The total facilities replacement cost is approximately $5.7 billion, which accounts for approximately one-fourth of the value of the Agency’s total facility inventory. The program has nearly 1,200 active suppliers located throughout the country.
Because of the size, complexity, and geographic dispersion of the program’s assets, transition and retirement will require careful planning so as to not interfere with safe mission execution and not greatly impact other Agency activi-ties. In addition to the sheer size of asset disposition activities, the Agency must cost-effectively manage and protect
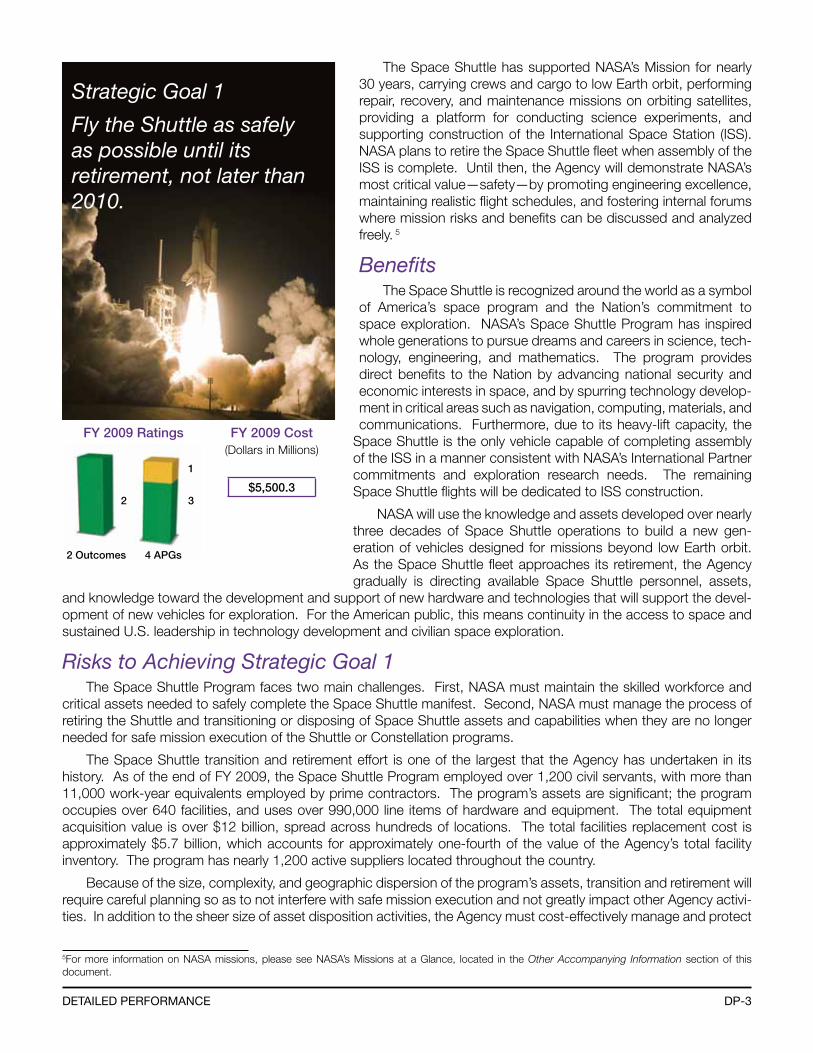
Strategic Goal 1
Fly the Shuttle as safely as possible until its retirement, not later than 2010.
2 Outcomes 4 APGs
2 3
1
FY 2009 Ratings FY 2009 Cost(Dollars in Millions)
$5,500.3
5For more information on NASA missions, please see NASA’s Missions at a Glance, located in the Other Accompanying Information section of this document.
DP-4 naSa fY 2009 Performance anD accountabilitY rePort
the Space Shuttle capabilities needed to satisfy the Agency’s Strategic Goal of flying out the manifest and completing assembly of the ISS. As ISS assem-bly is completed and the Space Shuttle Program’s mission comes to a close, exploration development activities will continue to increase. Use of certain legacy capabilities can reduce the time and resources needed to achieve ini-tial operational capability of the new designs. The program plays a key role in coordinating the smooth transition from current Space Shuttle operations to the next generation, thereby enabling new U.S. human spaceflight capabili-ties that will extend exploration and permanent human presence beyond low Earth orbit to the Moon, Mars, and beyond.
FY 2010 Performance Forecast• NASA will safely complete assembly of the ISS with the last six flights
planned for the Space Shuttle Program. Those missions will deliver the last of the U.S. pressurized elements to the ISS: Tranquility Node 3 and the Cupola (a seven-windowed module to be used as a control room for robot-ics). The missions will also deliver environmental control and life support equipment, hardware, and logistics needed to safely support and fully utilize the ISS once the Space Shuttle is retired.
• The Space Shuttle will deliver and install the Alpha Magnetic Spectrometer payload on the ISS during STS-134.
• Transition and retirement plans are in place or nearing completion for all Space Shuttle Program hardware elements, primary supporting Centers, and all organizations with a substantial role in ensuring a safe and effi-cient phase-out of Space Shuttle Program capabilities. The Space Shuttle Program and the Constellation Program already share some workforce, facilities, and operational experience. The number of shared capabilities will accelerate as they are no longer needed to support safe Space Shuttle Program completion.
• Finally, after 28 years, 134 missions, over 650 days of working in orbit, and over 500 million miles travelled in space, NASA will retire the Space Shuttle.
outcome 1.1: assure the safety and integrity of the Space Shuttle workforce, systems and processes, while flying the manifest.
The Space Shuttle safely and successfully completed every mission objective, including four crew rotations, for all five flights in FY 2009. Flight STS-126, launched in November 2008, delivered a Multi-Purpose Logistics Module loaded with hardware and supplies to support expansion of the ISS crew size from three to six. STS-126 also repaired the ISS’s port Solar Alpha Rotary Joint (SARJ). The 10-foot-wide, wagon-wheel-shaped SARJ allows the electricity-generating solar arrays to track the sun and generate power for the Station. STS-119 launched in March 2009 and focused on the installation of the S-6 starboard truss, the last truss and solar array assembly for the ISS. STS-125 launched in May 2009 to perform the final servicing mission to the Hubble Space Telescope. In this mission, the crew successfully repaired two of Hubble’s primary scientific instruments, replaced two other instruments with more advanced capabilities, attached a soft capture mechanism to facilitate eventual de-orbiting of the telescope, and refurbished the telescope’s batteries, gyroscopes, guidance sensors, and thermal blankets. STS-127 launched in July 2009 to deliver and install the final pieces of the Japan Aerospace Exploration Agency’s (JAXA) Kibo laboratory, including an external facility. The external facility will provide a way to expose science experiments to the extreme environment of space, an exposed experiment logistics module for storage, and some initial experiments. STS-128 launched in August 2009 to deliver hardware and logistics for future ISS assembly and research support.
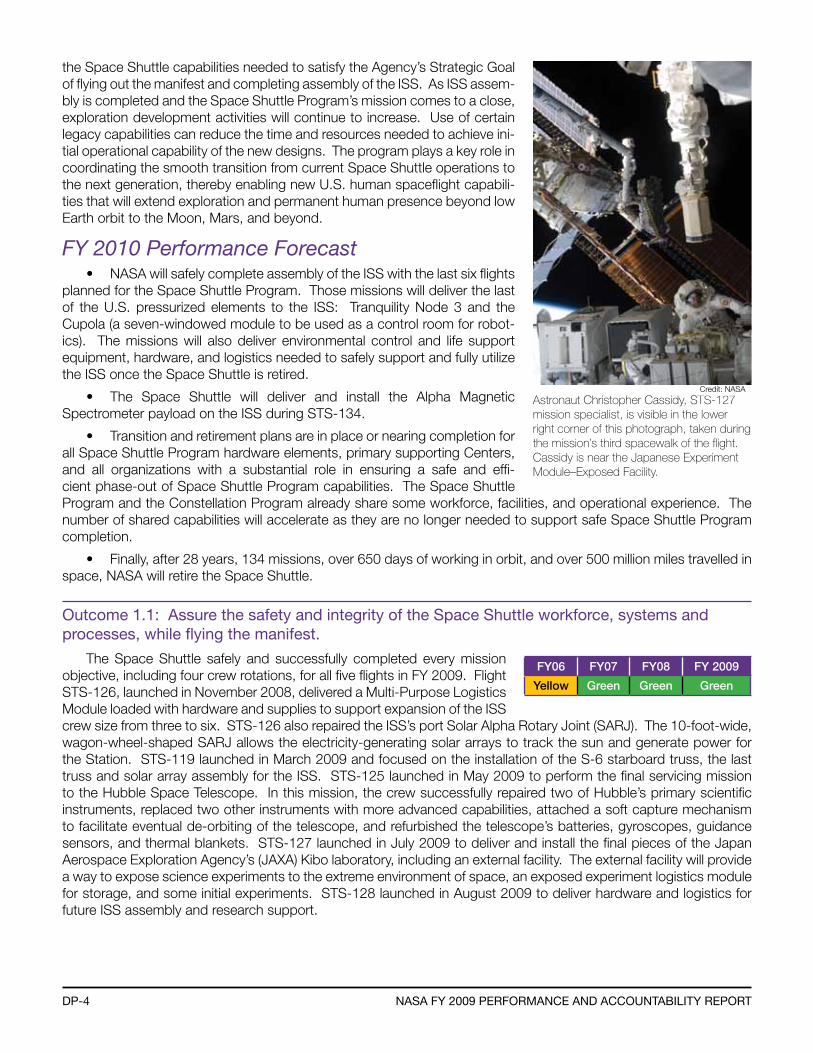
Astronaut Christopher Cassidy, STS-127 mission specialist, is visible in the lower right corner of this photograph, taken during the mission’s third spacewalk of the flight. Cassidy is near the Japanese Experiment Module–Exposed Facility.
FY06 FY07 FY08 FY 2009
Yellow Green Green Green
Credit: NASA
DP-5DetaileD Performance
FY 2009 Annual Performance Goals FY06 FY07 FY08 FY 2009
Achieve zero Type-A (damage to property at least $1 million or death) or Type-B (damage to property at least $250 thousand or permanent disability or hospitalization of three or more persons) mishaps in FY 2009.
6SSP1Red
7SSP1Green
8SSP01Green
9SSP1Green
Complete 100 percent of all mission objectives for all Space Shuttle missions in FY 2009 as specified in the Flight Requirements Document for each mission.
None7SSP2Green
8SSP02Green
9SSP2Green
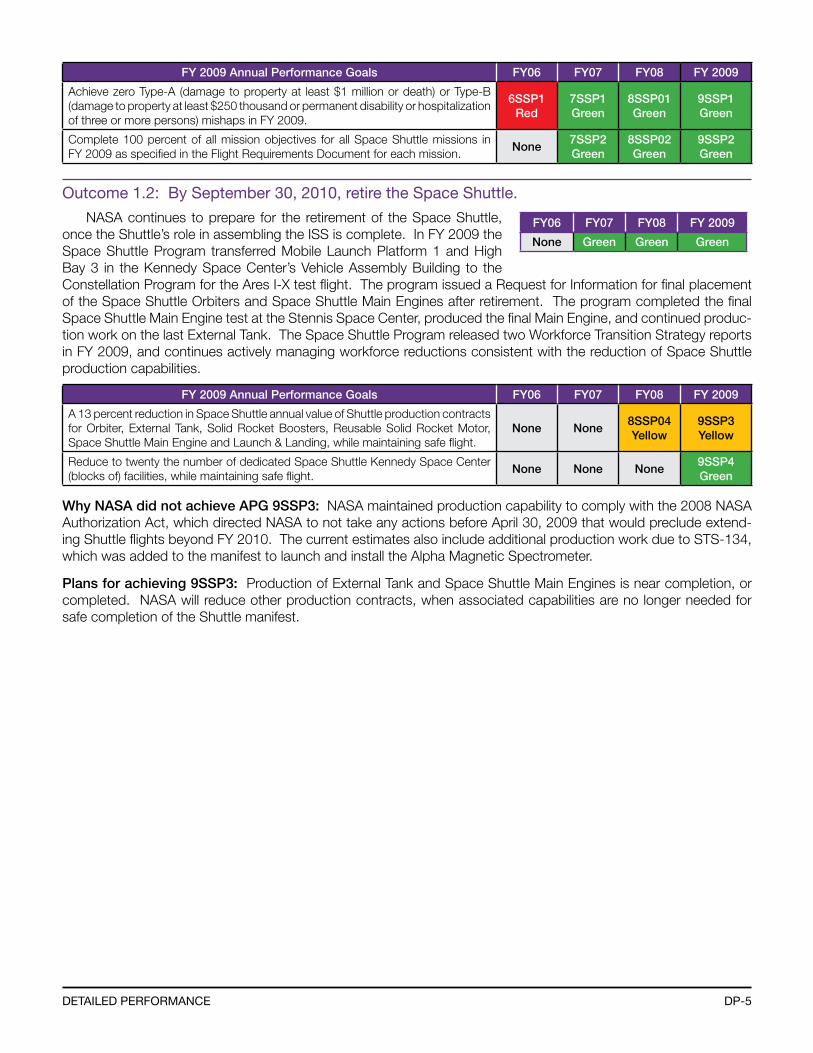
outcome 1.2: by September 30, 2010, retire the Space Shuttle.
NASA continues to prepare for the retirement of the Space Shuttle, once the Shuttle’s role in assembling the ISS is complete. In FY 2009 the Space Shuttle Program transferred Mobile Launch Platform 1 and High Bay 3 in the Kennedy Space Center’s Vehicle Assembly Building to the Constellation Program for the Ares I-X test flight. The program issued a Request for Information for final placement of the Space Shuttle Orbiters and Space Shuttle Main Engines after retirement. The program completed the final Space Shuttle Main Engine test at the Stennis Space Center, produced the final Main Engine, and continued produc-tion work on the last External Tank. The Space Shuttle Program released two Workforce Transition Strategy reports in FY 2009, and continues actively managing workforce reductions consistent with the reduction of Space Shuttle production capabilities.
FY 2009 Annual Performance Goals FY06 FY07 FY08 FY 2009
A 13 percent reduction in Space Shuttle annual value of Shuttle production contracts for Orbiter, External Tank, Solid Rocket Boosters, Reusable Solid Rocket Motor, Space Shuttle Main Engine and Launch & Landing, while maintaining safe flight.
None None8SSP04Yellow
9SSP3Yellow
Reduce to twenty the number of dedicated Space Shuttle Kennedy Space Center (blocks of) facilities, while maintaining safe flight.
None None None9SSP4Green
Why NASA did not achieve APG 9SSP3: NASA maintained production capability to comply with the 2008 NASA Authorization Act, which directed NASA to not take any actions before April 30, 2009 that would preclude extend-ing Shuttle flights beyond FY 2010. The current estimates also include additional production work due to STS-134, which was added to the manifest to launch and install the Alpha Magnetic Spectrometer.
Plans for achieving 9SSP3: Production of External Tank and Space Shuttle Main Engines is near completion, or completed. NASA will reduce other production contracts, when associated capabilities are no longer needed for safe completion of the Shuttle manifest.
FY06 FY07 FY08 FY 2009
None Green Green Green
DP-6 naSa fY 2009 Performance anD accountabilitY rePort
3 Outcomes 9 APGs
3 8
1
FY 2009 Ratings FY 2009 Cost(Dollars in Millions)
$3,866.9
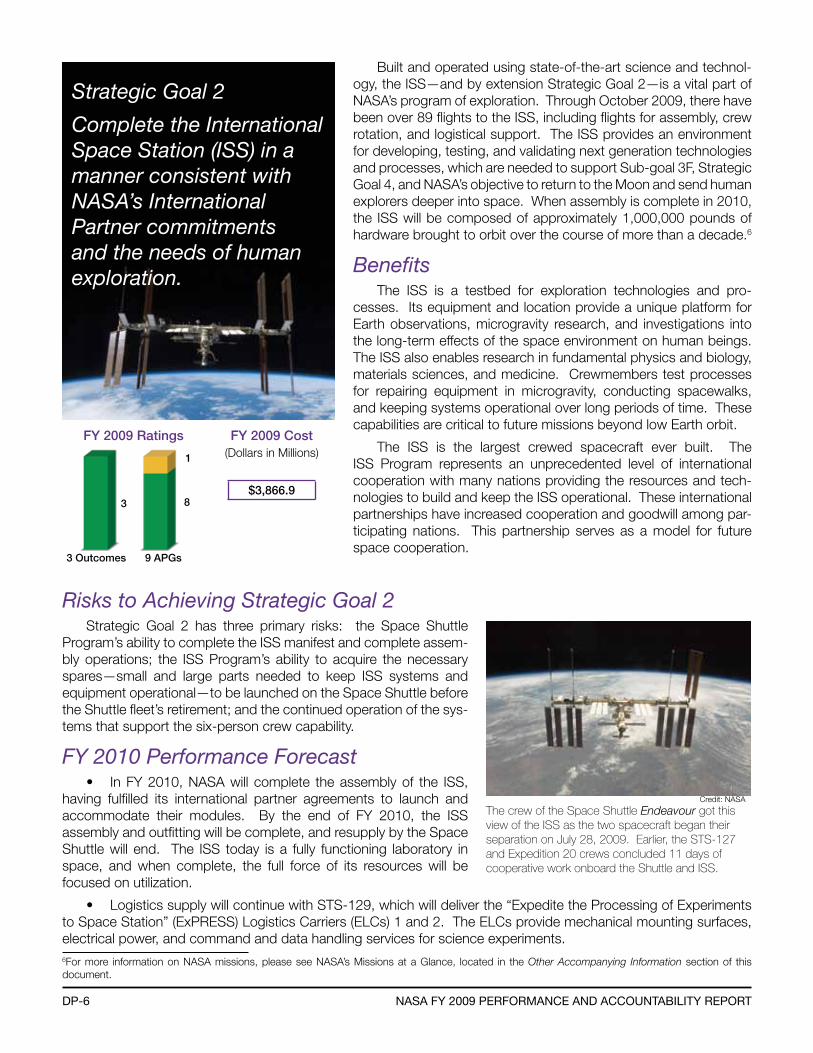
Strategic Goal 2
Complete the International Space Station (ISS) in a manner consistent with NASA’s International Partner commitments and the needs of human exploration.
Built and operated using state-of-the-art science and technol-ogy, the ISS—and by extension Strategic Goal 2—is a vital part of NASA’s program of exploration. Through October 2009, there have been over 89 flights to the ISS, including flights for assembly, crew rotation, and logistical support. The ISS provides an environment for developing, testing, and validating next generation technologies and processes, which are needed to support Sub-goal 3F, Strategic Goal 4, and NASA’s objective to return to the Moon and send human explorers deeper into space. When assembly is complete in 2010, the ISS will be composed of approximately 1,000,000 pounds of hardware brought to orbit over the course of more than a decade.6
BenefitsThe ISS is a testbed for exploration technologies and pro-
cesses. Its equipment and location provide a unique platform for Earth observations, microgravity research, and investigations into the long-term effects of the space environment on human beings. The ISS also enables research in fundamental physics and biology, materials sciences, and medicine. Crewmembers test processes for repairing equipment in microgravity, conducting spacewalks, and keeping systems operational over long periods of time. These capabilities are critical to future missions beyond low Earth orbit.
The ISS is the largest crewed spacecraft ever built. The ISS Program represents an unprecedented level of international cooperation with many nations providing the resources and tech-nologies to build and keep the ISS operational. These international partnerships have increased cooperation and goodwill among par-ticipating nations. This partnership serves as a model for future space cooperation.
Risks to Achieving Strategic Goal 2Strategic Goal 2 has three primary risks: the Space Shuttle
Program’s ability to complete the ISS manifest and complete assem-bly operations; the ISS Program’s ability to acquire the necessary spares—small and large parts needed to keep ISS systems and equipment operational—to be launched on the Space Shuttle before the Shuttle fleet’s retirement; and the continued operation of the sys-tems that support the six-person crew capability.
FY 2010 Performance Forecast• In FY 2010, NASA will complete the assembly of the ISS,
having fulfilled its international partner agreements to launch and accommodate their modules. By the end of FY 2010, the ISS assembly and outfitting will be complete, and resupply by the Space Shuttle will end. The ISS today is a fully functioning laboratory in space, and when complete, the full force of its resources will be focused on utilization.
• Logistics supply will continue with STS-129, which will deliver the “Expedite the Processing of Experiments to Space Station” (ExPRESS) Logistics Carriers (ELCs) 1 and 2. The ELCs provide mechanical mounting surfaces, electrical power, and command and data handling services for science experiments. 6For more information on NASA missions, please see NASA’s Missions at a Glance, located in the Other Accompanying Information section of this document.
The crew of the Space Shuttle Endeavour got this view of the ISS as the two spacecraft began their separation on July 28, 2009. Earlier, the STS-127 and Expedition 20 crews concluded 11 days of cooperative work onboard the Shuttle and ISS.
Credit: NASA

DP-7DetaileD Performance
• NASA will launch the Cupola and Node 3 on STS-130. The Cupola is a European Space Agency-built observatory module that will provide a view of robotic operations, docked spacecraft, and Earth. Node 3, named Tranquility, will connect with the Cupola and will hold a new, advanced life support system.
• Logistics and resupply continues with STS-131, which will deliver the Multi-Purpose Logistics Module and the Lightweight Multi-Purpose Experiment Support Structure Carrier to the ISS.
• STS-132 will deliver the Russian Mini Research Module-1, a small research laboratory that will be attached to the Russian Zarya module.
• Flight STS-134 will deliver the Alpha Magnetic Spectrometer, a particle physics experiment that will be attached to the outside of the ISS and will search for evidence of dark matter and antimatter.
outcome 2.1: by 2010, complete assembly of the u.S. on-orbit Segment; launch international Partner elements and sparing items required to be launched by the Shuttle; and provide on-orbit resources for research to support u.S. human space exploration.
NASA is on schedule to complete ISS assembly by 2010. NASA com-pleted the truss and solar array assembly with the delivery of the S6 Solar Array on STS-119. NASA delivered two Japanese Exploration Agency (JAXA) elements that will complement each other to enhance research capabilities of the ISS: the Exposed Facility is a platform outside (i.e., exposed to the space environment) of the Japanese Kibo experiment module that will hold up to ten experiments at a time; the Experiment Logistics Module–Exposed Section is attached to the Exposed Facility, providing payload storage space and a logistic capability that will allow it to detach from the Exposed Facility and return to ground via the Space Shuttle.
FY 2009 Annual Performance Goals FY06 FY07 FY08 FY 2009
Based on the actual Space Shuttle flight rate, number of remaining Shuttle flights, and the discussions with the International Partners, update the agreed-to ISS assembly sequence and transportation plan as necessary.
None7ISS1Green
8ISS01Green
9ISS1Green
Accomplish a minimum of 90 percent of the on-orbit research objectives as established one month prior to a given increment.
6ISS3Yellow
7ISS2Green
8ISS02Green
9ISS2Green
Per the final configuration agreed to by the International Partners, fly the ISS elements and logistics baselined for FY 2009.
6ISS1Green
7ISS3Green
8ISS03Green
9ISS3Green
Provide increased ISS capability by assembling the remaining two Japanese Exploration Agency (JAXA) elements, the Exposed Facility (EF) and the Experiment Logistics Module-Exposed Section (ELM-ES), and the NASA EXPRESS Logistics Carriers (ELC) as baselined in FY 2009.
None None8ISS04Green
9ISS4Yellow
Why NASA did not achieve APG 9ISS4: NASA launched and assembled the elements of the Exposed Facility and the Experiment Logistics Module, except for the ELCs.
Plans for achieving 9ISS4: NASA plans to launch and install the ELCs in early FY 2010.
outcome 2.2: by 2009, provide the on-orbit capability to support an iSS crew of six crewmembers.
In November 2008, the Space Shuttle delivered new hardware to the ISS to support expanding the ISS crew capacity from three to six:
• The ISS crew previously depended on water delivered by the Space Shuttle or a cargo rocket. Since the delivery of the Water Recovery System Racks 1 and 2 in November, the ISS is able to produce about 6,000 pounds of potable water each year. The system works by using a filter that is designed to process the astronauts’ urine and sweat into clean drinking water.
• A new Total Organic Carbon Analyzer will monitor key water quality parameters to ensure that the reclaimed water is safe for crew use.
FY06 FY07 FY08 FY 2009
Green Green Green Green
FY06 FY07 FY08 FY 2009
None Green Green Green
DP-8 naSa fY 2009 Performance anD accountabilitY rePort
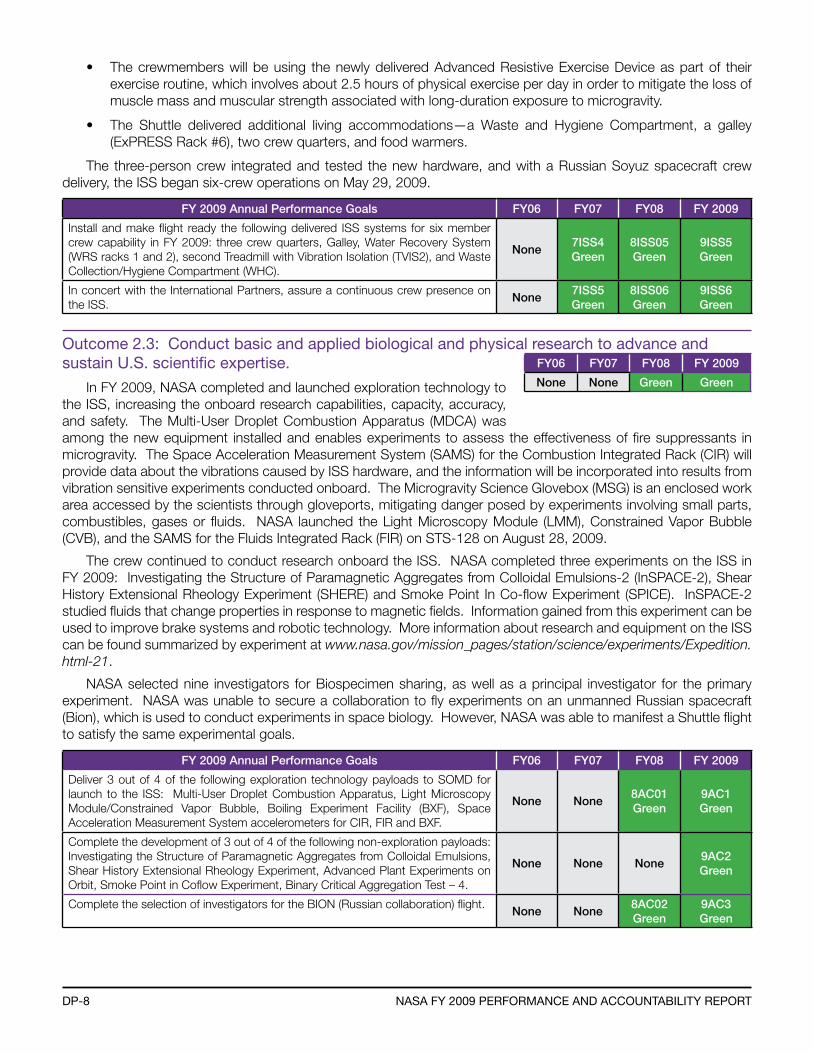
• The crewmembers will be using the newly delivered Advanced Resistive Exercise Device as part of their exercise routine, which involves about 2.5 hours of physical exercise per day in order to mitigate the loss of muscle mass and muscular strength associated with long-duration exposure to microgravity.
• The Shuttle delivered additional living accommodations—a Waste and Hygiene Compartment, a galley (ExPRESS Rack #6), two crew quarters, and food warmers.
The three-person crew integrated and tested the new hardware, and with a Russian Soyuz spacecraft crew delivery, the ISS began six-crew operations on May 29, 2009.
FY 2009 Annual Performance Goals FY06 FY07 FY08 FY 2009
Install and make flight ready the following delivered ISS systems for six member crew capability in FY 2009: three crew quarters, Galley, Water Recovery System (WRS racks 1 and 2), second Treadmill with Vibration Isolation (TVIS2), and Waste Collection/Hygiene Compartment (WHC).
None7ISS4Green
8ISS05Green
9ISS5Green
In concert with the International Partners, assure a continuous crew presence on the ISS.
None7ISS5Green
8ISS06Green
9ISS6Green
outcome 2.3: conduct basic and applied biological and physical research to advance and sustain u.S. scientific expertise.
In FY 2009, NASA completed and launched exploration technology to the ISS, increasing the onboard research capabilities, capacity, accuracy, and safety. The Multi-User Droplet Combustion Apparatus (MDCA) was among the new equipment installed and enables experiments to assess the effectiveness of fire suppressants in microgravity. The Space Acceleration Measurement System (SAMS) for the Combustion Integrated Rack (CIR) will provide data about the vibrations caused by ISS hardware, and the information will be incorporated into results from vibration sensitive experiments conducted onboard. The Microgravity Science Glovebox (MSG) is an enclosed work area accessed by the scientists through gloveports, mitigating danger posed by experiments involving small parts, combustibles, gases or fluids. NASA launched the Light Microscopy Module (LMM), Constrained Vapor Bubble (CVB), and the SAMS for the Fluids Integrated Rack (FIR) on STS-128 on August 28, 2009.
The crew continued to conduct research onboard the ISS. NASA completed three experiments on the ISS in FY 2009: Investigating the Structure of Paramagnetic Aggregates from Colloidal Emulsions-2 (InSPACE-2), Shear History Extensional Rheology Experiment (SHERE) and Smoke Point In Co-flow Experiment (SPICE). InSPACE-2 studied fluids that change properties in response to magnetic fields. Information gained from this experiment can be used to improve brake systems and robotic technology. More information about research and equipment on the ISS can be found summarized by experiment at www.nasa.gov/mission_pages/station/science/experiments/Expedition.html-21.
NASA selected nine investigators for Biospecimen sharing, as well as a principal investigator for the primary experiment. NASA was unable to secure a collaboration to fly experiments on an unmanned Russian spacecraft (Bion), which is used to conduct experiments in space biology. However, NASA was able to manifest a Shuttle flight to satisfy the same experimental goals.
FY 2009 Annual Performance Goals FY06 FY07 FY08 FY 2009
Deliver 3 out of 4 of the following exploration technology payloads to SOMD for launch to the ISS: Multi-User Droplet Combustion Apparatus, Light Microscopy Module/Constrained Vapor Bubble, Boiling Experiment Facility (BXF), Space Acceleration Measurement System accelerometers for CIR, FIR and BXF.
None None8AC01Green
9AC1Green
Complete the development of 3 out of 4 of the following non-exploration payloads: Investigating the Structure of Paramagnetic Aggregates from Colloidal Emulsions, Shear History Extensional Rheology Experiment, Advanced Plant Experiments on Orbit, Smoke Point in Coflow Experiment, Binary Critical Aggregation Test – 4.
None None None9AC2Green
Complete the selection of investigators for the BION (Russian collaboration) flight.None None
8AC02Green
9AC3Green
FY06 FY07 FY08 FY 2009
None None Green Green
DP-9DetaileD Performance
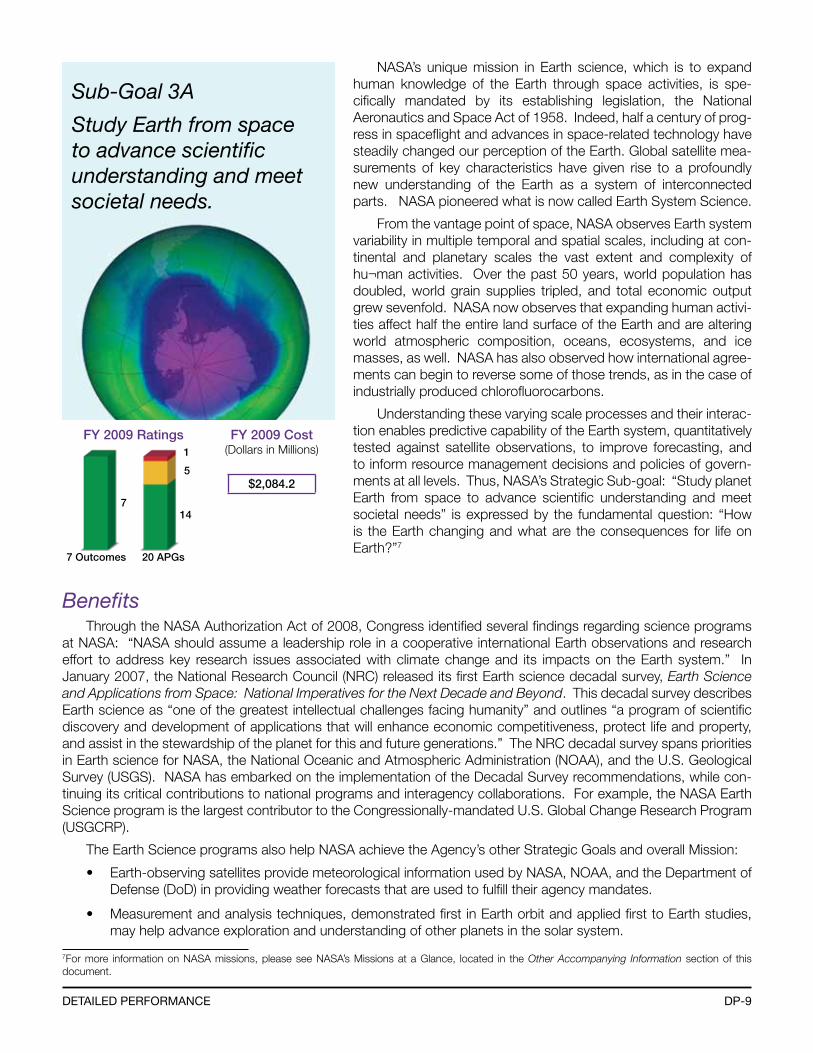
Sub-Goal 3A
Study Earth from space to advance scientific understanding and meet societal needs.
7 Outcomes 20 APGs
714
5
FY 2009 Ratings FY 2009 Cost(Dollars in Millions)
$2,084.2
1
NASA’s unique mission in Earth science, which is to expand human knowledge of the Earth through space activities, is spe-cifically mandated by its establishing legislation, the National Aeronautics and Space Act of 1958. Indeed, half a century of prog-ress in spaceflight and advances in space-related technology have steadily changed our perception of the Earth. Global satellite mea-surements of key characteristics have given rise to a profoundly new understanding of the Earth as a system of interconnected parts. NASA pioneered what is now called Earth System Science.
From the vantage point of space, NASA observes Earth system variability in multiple temporal and spatial scales, including at con-tinental and planetary scales the vast extent and complexity of hu¬man activities. Over the past 50 years, world population has doubled, world grain supplies tripled, and total economic output grew sevenfold. NASA now observes that expanding human activi-ties affect half the entire land surface of the Earth and are altering world atmospheric composition, oceans, ecosystems, and ice masses, as well. NASA has also observed how international agree-ments can begin to reverse some of those trends, as in the case of industrially produced chlorofluorocarbons.
Understanding these varying scale processes and their interac-tion enables predictive capability of the Earth system, quantitatively tested against satellite observations, to improve forecasting, and to inform resource management decisions and policies of govern-ments at all levels. Thus, NASA’s Strategic Sub-goal: “Study planet Earth from space to advance scientific understanding and meet societal needs” is expressed by the fundamental question: “How is the Earth changing and what are the consequences for life on Earth?”7
BenefitsThrough the NASA Authorization Act of 2008, Congress identified several findings regarding science programs
at NASA: “NASA should assume a leadership role in a cooperative international Earth observations and research effort to address key research issues associated with climate change and its impacts on the Earth system.” In January 2007, the National Research Council (NRC) released its first Earth science decadal survey, Earth Science and Applications from Space: National Imperatives for the Next Decade and Beyond. This decadal survey describes Earth science as “one of the greatest intellectual challenges facing humanity” and outlines “a program of scientific discovery and development of applications that will enhance economic competitiveness, protect life and property, and assist in the stewardship of the planet for this and future generations.” The NRC decadal survey spans priorities in Earth science for NASA, the National Oceanic and Atmospheric Administration (NOAA), and the U.S. Geological Survey (USGS). NASA has embarked on the implementation of the Decadal Survey recommendations, while con-tinuing its critical contributions to national programs and interagency collaborations. For example, the NASA Earth Science program is the largest contributor to the Congressionally-mandated U.S. Global Change Research Program (USGCRP).
The Earth Science programs also help NASA achieve the Agency’s other Strategic Goals and overall Mission:
• Earth-observing satellites provide meteorological information used by NASA, NOAA, and the Department of Defense (DoD) in providing weather forecasts that are used to fulfill their agency mandates.
• Measurement and analysis techniques, demonstrated first in Earth orbit and applied first to Earth studies, may help advance exploration and understanding of other planets in the solar system.
7For more information on NASA missions, please see NASA’s Missions at a Glance, located in the Other Accompanying Information section of this document.
DP-10 naSa fY 2009 Performance anD accountabilitY rePort
NASA and its partners—other government agencies, academia, non-profit organizations, industry, and international organizations—con-duct vital research that helps the Nation manage environmental and agricultural resources and pre-pare for natural disasters. They create computer models that help predict climate change, storm paths, and earthquakes. In the course of con-ducting this research, NASA applies the resulting data and knowledge with the Agency’s opera-tional partners to improve their decision-making in societal need areas such as public health, avia-tion, water management, air quality, and energy.
In FY 2009, Earth Science received $325 million in American Recovery and Reinvestment Act funds to help the Agency complete critical projects or bolster underfunded programs.
Risks to Achieving Sub-goal 3A
Absence of a National Strategy for Earth Observation. Acquisition of accurate, decadal-length, global time series of many different quantities is a necessary (although not sufficient) condition for achievement of sub-goal 3A. As noted in numer-ous National Research Council reports (including the Decadal Survey), these measurements must be obtained from a combination of NASA research missions and operational satellite systems operated by NOAA, DoD, and USGS. Inability by the operational agencies to transition NASA-demonstrated, research-quality measurements to the national operational satellite systems places at risk the required continuity of key time series. The National Polar-orbiting Operational Environmental Satellites System (NPOESS) co-funded by NOAA and DoD has recently been deemed by an independent review team to have a “low probability of success” as currently structured, and the NOAA Geostationary Environmental Operational Satellite (GOES)-R series has been de-scoped in response to budgetary pressure. Both the independent NPOESS review team and ongoing Office of Science and Technology Policy (OSTP)-led analyses aimed at revamping the NPOESS management and implementation approaches have concluded that the NASA NPOESS Preparatory Program research mission must be used to ensure the availability of basic meteorological measurements (historically provided by the civil and military operational environmental sat-ellite systems) because of NPOESS delays and capability shortfalls, resulting in negative implications to the NASA research program. No stable funding and management paradigm is in place for the Landsat program within USGS. While NASA and NOAA have made progress in piloting the transition of ocean altimetry measurement, no simi-lar progress has been made for the continued measurement of ocean vector winds by scatterometry, which has become a particular concern given the impending end of the mission based on instrument degradation taking place eight years after the end of QuikSCAT’s design life.
Unfunded Expansion of Program Scope. Actual and potential directed—but unfunded—expansion of the scope of the Earth Science Program is a risk to our ability to accomplish the established goals of the program and the ambitious guidance from the Decadal Survey. NASA technology development, research, and satellite missions have demonstrated the Agency’s ability to acquire high-quality spaceborne measurements and to advance science and applications through data analyses. The societal importance of many of our Earth observing capabilities is widely appreciated beyond the research communities. When urgent national needs for Earth observations arise unexpect-edly or owing to launch vehicle failures or other-agency funding shortfalls, NASA Earth Science continues to be called upon to use funding from its baseline program to help fill those needs. Examples that could arise in the coming year include potential direction to implement a recovery copy for the OCO mission to support national carbon policy development and treaty/regulation monitoring, and development for future flight of the DSCOVR mission, which was not recommended as a Decadal Survey priority.
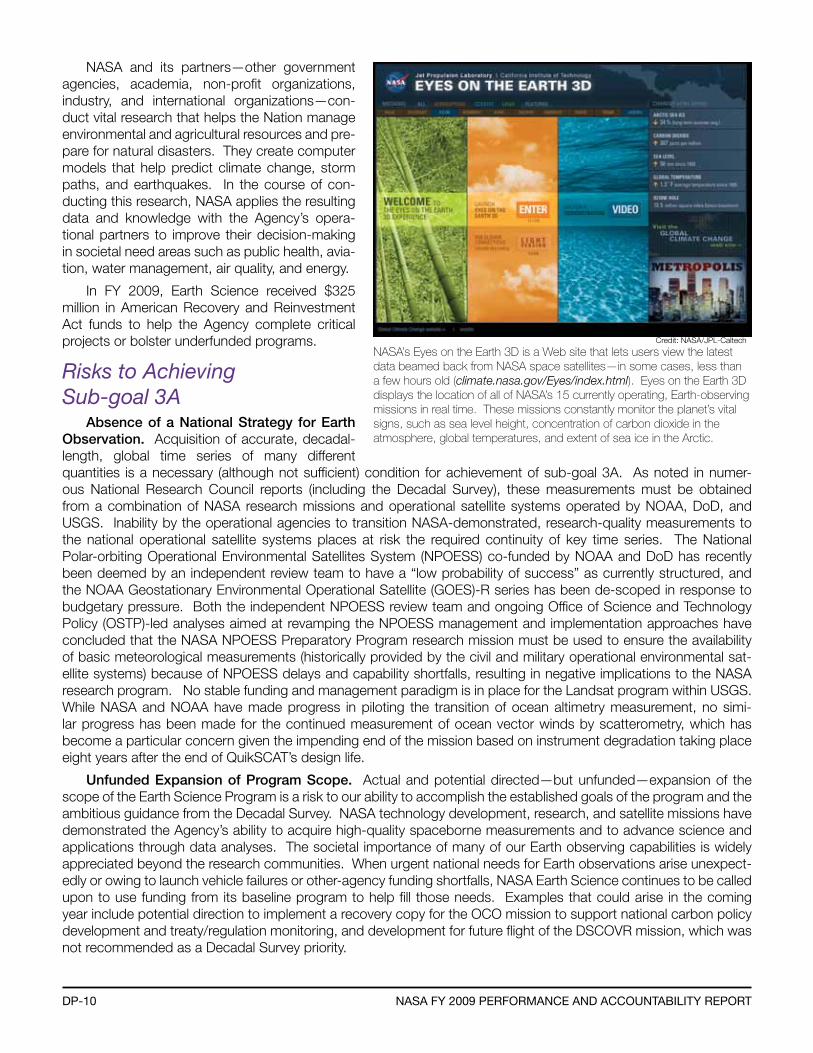
NASA’s Eyes on the Earth 3D is a Web site that lets users view the latest data beamed back from NASA space satellites—in some cases, less than a few hours old (climate.nasa.gov/Eyes/index.html). Eyes on the Earth 3D displays the location of all of NASA’s 15 currently operating, Earth-observing missions in real time. These missions constantly monitor the planet’s vital signs, such as sea level height, concentration of carbon dioxide in the atmosphere, global temperatures, and extent of sea ice in the Arctic.
Credit: NASA/JPL-Caltech
DP-11DetaileD Performance
Return to Flight of the Taurus XL Launch Vehicle for Glory. The Glory research mission to make first-ever measurements of climatically important aerosol distributions and scattering properties is scheduled to launch in 2010 on a Taurus XL launch vehicle. The Taurus XL experienced a failure during the launch of the OCO spacecraft on February 24, 2009. The need to complete a successful return-to-flight process for the Taurus XL prior to the Glory launch introduces a schedule risk for Glory, and is likely to push the launch into the second quarter of FY 2011.
FY 2010 Performance Forecast• Advance the use of uninhabited aerial systems (UASs) for Earth system science research, by utilizing them in
multi-instrument and multi-platform field campaigns to study atmospheric composition and hurricanes.
• Aquarius—a mission to investigate the links between the global water cycle, ocean circulation, and climate—will progress toward launch readiness. The NASA-provided Aquarius instrument suite has been delivered to Argentina for observatory integration. The launch date will be subject to the progress of the International Partners in completion of instrument deliveries and observatory integration and test.
• Glory—which will study atmospheric conditions that influence climate and improve understanding of natural and man-made factors of climate change—will progress toward launch readiness. The launch date will be subject to completion of the return-to-flight process for the Taurus XL launch vehicle.
• GPM—which will focus on climate variability and change, water and energy cycles, and weather—will enter development with completion of its Confirmation Review.
• LDCM—which will continue the observations of the Landsat series of spacecraft—will enter development with completion of its Confirmation Review. The LDCM payload will include the TIRS instrument, which was added to this mission in response to 2009 Congressional direction to continue making thermal infrared mea-surements for observations of ground water.
• SMAP, the first Decadal Survey mission to begin formulation, will enter the Preliminary Design Phase. ICESat-II will enter into Formulation with the completion of its Key Decision Point (KDP)-A formulation review. The two other Tier 1 Decadal Survey missions, CLARREO and DESDynI, will conduct Mission Concept Reviews.
• Using funding provided by the American Recovery and Reinvestment Act of 2009, NASA has begun a new Airborne Science campaign, called Operation ICE Bridge, to bridge the gap between ICESat-I, which will end operations in 2009, and ICESat-II, which is not due to launch until about 2015. The campaign will use NASA’s in-house and out-of-house aircraft and a variety of instruments to focus on changes in Greenland and arctic ice.
• Informed by a 2008 comparison study of seven Federal programs that incorporate Earth science data into decision-making activities for policy and management, the Applied Sciences Program will continue to lever-age NASA Earth Science research and observations for practical use, such as resource management and planning, decision-making, and improved prediction and planning.
outcome 3a.1: Progress in understanding and improving predictive capability for changes in the ozone layer, climate forcing, and air quality associated with changes in atmospheric composition.
New research released this year elaborated on the effects of differ-ent aerosol types, such as smoke particles, on clouds and precipitation. The research allows scientists to better quantify how much aerosols con-tribute to global climate changes. The burning of trees and plants in the savannas of southern Africa creates massive aerosol plumes that drift high above the ground. The aerosols—tiny suspended particles created by the fires—can reflect incoming solar radiation and create cooling or trap heat and warm the atmosphere. Researchers used data from the CALIPSO mission to show that the warming effect of aero-sols increases with the amount of cloud cover below the aerosols. In fact, the researchers found the relationship between aerosol warming/cooling and the strength of cloud cover to be nearly linear, making it possible for them to define the critical amount of cloud cover at which aerosols switch from producing a cooling to a warming effect.
FY06 FY07 FY08 FY 2009
Green Green Green Green
DP-12 naSa fY 2009 Performance anD accountabilitY rePort
This newfound knowledge could improve long-term projections of global climate models that pull together many processes about the changing planet. More about this research is available at www.nasa.gov/topics/earth/features/calipso-aerosol.html.
NASA is working on two major foundational missions, Aquarius and Glory, which help the Agency achieve this Outcome and Outcome 3A.5. In June 2009, NASA delivered the Aquarius instrument suite to our partner, the Space Agency of Argentina (CONAE), for integration with their SAC-D spacecraft. NASA will also launch Aquarius. NASA engineers for the Glory project helped the contractor trouble-shoot and resolve technical challenges with the Aerosol Polarimetry Sensor (APS) instrument, and APS was delivered to Orbital Sciences Corporation on March 9 for integra-tion with the Glory spacecraft. It is important to note that the Glory mission will be launched on a Taurus XL. This will be the first Taurus XL launch following the failure of the Orbiting Carbon Observatory (OCO) Taurus XL. The Glory launch is planned for late 2010, but this schedule will depend on the successful completion of the testing and design changes required to safely proceed with the next launch of the Taurus XL.
On February 24, 2009, the Taurus-XL launch vehicle failed to deliver the OCO spacecraft to orbit. OCO was a competitively selected, PI-led, experimental Earth System Science Pathfinder mission. The mission was intended to demonstrate for the first time the ability to make global space-based measurements of total-column atmospheric carbon dioxide concentrations with sufficient accuracy and quality to quantify distributed natural ocean-atmosphere and land-atmosphere carbon exchange processes and their roles in climate change. Had the experimental OCO technique proven successful as expected, the unique, accurate, near-surface carbon dioxide (CO2) measurements obtained by the mission would have complemented and extended upper-atmosphere space-based CO2 data sets being obtained from instruments on the NASA Aqua and Aura spacecraft and lower-quality, not-yet-validated mea-surements being acquired by the newly-launched Japanese GOSAT mission. The upper-atmosphere CO2 data sets from Aqua and Aura, combined with NASA-funded analyses and modeling advances, continue to drive significant progress in NASA’s study of Earth’s environment and climate processes (specifically related to Outcomes 3A.1, 3A.3, and 3A.5); it had been hoped that addition of the high-quality OCO data stream would have enabled even greater, and more rapid, progress. Subsequent to NASA’s 2002 selection of OCO for flight on the basis of its potential con-tributions to NASA Earth system science, the value of the OCO mission gained wider Administration, Congressional, and public appreciation owing to its potential contributions in the area of policy development, carbon monitoring, and treaty verification and enforcement (as documented in an unsolicited letter report from the National Academy of Sciences to Administrator Bolden on July 28, 2009, following the launch vehicle failure and subsequent loss of the OCO mission). As a result, there is great interest in the possibility of implementing a recovery copy of the mission. The OCO project team has been supporting NASA activities aimed at enabling the earliest possible implementation of an OCO-recovery mission, but NASA has not yet received direction from the Administration to initiate full develop-ment of such a recovery mission. Regarding the failure of the Taurus XL, NASA commissioned a Mishap Investigation Board which conducted a study of the vehicle failure, identified four potential causes, and made procedural recom-mendations to prevent future problems with the suspected launch vehicle hardware components. NASA’s Space Operations Mission Directorate is developing plans for the return to flight of the Taurus XL to support the launch of Glory.
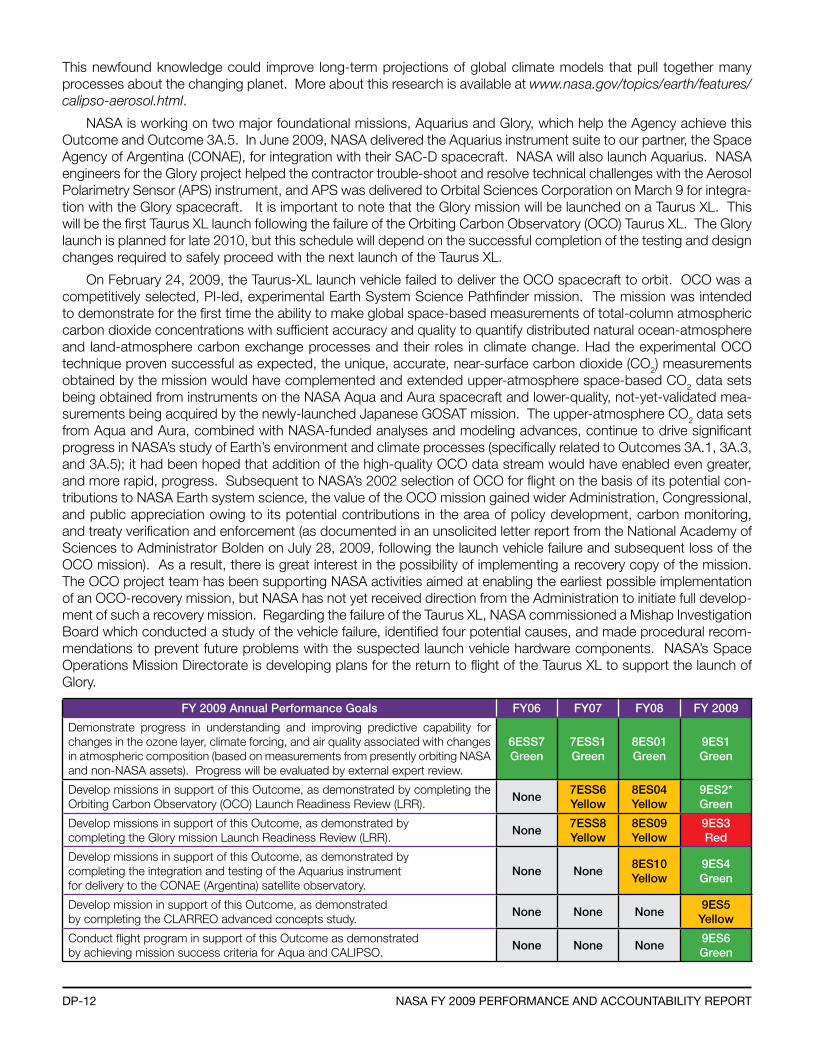
FY 2009 Annual Performance Goals FY06 FY07 FY08 FY 2009
Demonstrate progress in understanding and improving predictive capability for changes in the ozone layer, climate forcing, and air quality associated with changes in atmospheric composition (based on measurements from presently orbiting NASA and non-NASA assets). Progress will be evaluated by external expert review.
6ESS7Green
7ESS1Green
8ES01Green
9ES1Green
Develop missions in support of this Outcome, as demonstrated by completing the Orbiting Carbon Observatory (OCO) Launch Readiness Review (LRR).
None7ESS6Yellow
8ES04Yellow
9ES2*Green
Develop missions in support of this Outcome, as demonstrated by completing the Glory mission Launch Readiness Review (LRR).
None7ESS8Yellow
8ES09Yellow
9ES3Red
Develop missions in support of this Outcome, as demonstrated by completing the integration and testing of the Aquarius instrument for delivery to the CONAE (Argentina) satellite observatory.
None None8ES10Yellow
9ES4Green
Develop mission in support of this Outcome, as demonstrated by completing the CLARREO advanced concepts study.
None None None9ES5
Yellow
Conduct flight program in support of this Outcome as demonstrated by achieving mission success criteria for Aqua and CALIPSO.
None None None9ES6Green
DP-13DetaileD Performance
*The OCO project successfully completed the observatory assembly, integration, and testing (including the Launch Readiness Review) ahead of schedule, conducted additional risk mitigation activities while waiting for the Launch Services Program to complete certification of the launch vehicle, and delivered OCO to the launch site for successful pre-launch activities. However, the Taurus launch vehicle fairing—the clamshell-like protective casing at the nose of the rocket that holds the payload during launch—failed to separate and release the OCO spacecraft during ascent, resulting in loss of the mission.
The OCO project successfully managed risks within their control and, if not for launch vehicle-associated delays, likely would have entered the operations phase ahead of schedule and under budget. Factors beyond those necessary to meet APG 9ES2 (i.e., the Taurus XL launch vehicle failure) were the reason that NASA did not achieve the intent of APG 9ES2.
Why NASA did not achieve APG 9ES3: NASA did not complete Glory’s Launch Readiness Review due to the failure of the OCO Taurus XL, in addition to issues with the vendor’s production of acceptable boards for the Maxwell Single Board Computers. Unfortunately, the team determined that the 24-layer circuit boards originally chosen for the project could not be reliably manufactured, and they are pursuing an alternate design. As a result of both issues, the project has delayed the Launch Readiness Date by 17 months.
Plans for achieving 9ES3: The project has switched to an alternate design for the circuit boards and is now working toward a Launch Readiness Review in November 2010. As mentioned above, the Glory launch date will be subject to the completion of the activities required to approve launch of the Taurus XL.
Why NASA did not achieve APG 9ES5: The date for the CLARREO Mission Concept Review was shifted to be consistent with the mission’s FY 2010 through FY 2012 funding profile.
Plans for achieving 9ES5: The Mission Concept Review, successful completion of which represents completion of the CLARREO advanced concepts study, is scheduled for mid-FY 2010.
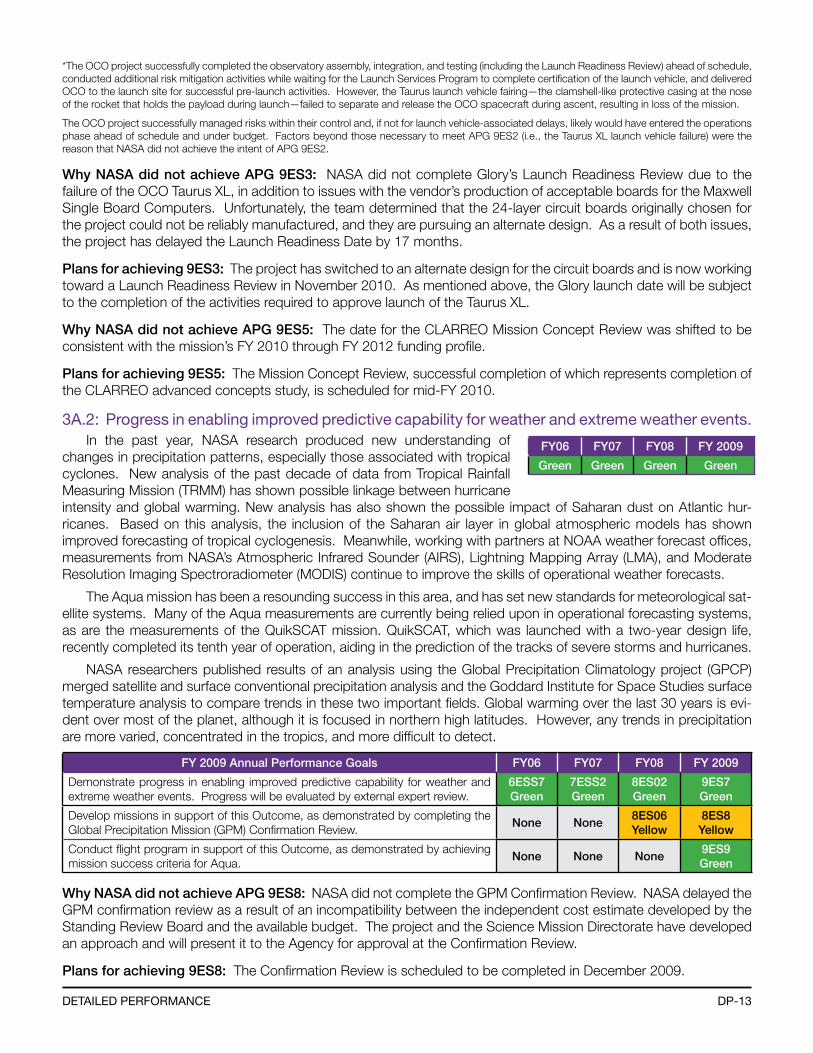
3a.2: Progress in enabling improved predictive capability for weather and extreme weather events.In the past year, NASA research produced new understanding of
changes in precipitation patterns, especially those associated with tropical cyclones. New analysis of the past decade of data from Tropical Rainfall Measuring Mission (TRMM) has shown possible linkage between hurricane intensity and global warming. New analysis has also shown the possible impact of Saharan dust on Atlantic hur-ricanes. Based on this analysis, the inclusion of the Saharan air layer in global atmospheric models has shown improved forecasting of tropical cyclogenesis. Meanwhile, working with partners at NOAA weather forecast offices, measurements from NASA’s Atmospheric Infrared Sounder (AIRS), Lightning Mapping Array (LMA), and Moderate Resolution Imaging Spectroradiometer (MODIS) continue to improve the skills of operational weather forecasts.
The Aqua mission has been a resounding success in this area, and has set new standards for meteorological sat-ellite systems. Many of the Aqua measurements are currently being relied upon in operational forecasting systems, as are the measurements of the QuikSCAT mission. QuikSCAT, which was launched with a two-year design life, recently completed its tenth year of operation, aiding in the prediction of the tracks of severe storms and hurricanes.
NASA researchers published results of an analysis using the Global Precipitation Climatology project (GPCP) merged satellite and surface conventional precipitation analysis and the Goddard Institute for Space Studies surface temperature analysis to compare trends in these two important fields. Global warming over the last 30 years is evi-dent over most of the planet, although it is focused in northern high latitudes. However, any trends in precipitation are more varied, concentrated in the tropics, and more difficult to detect.
FY 2009 Annual Performance Goals FY06 FY07 FY08 FY 2009
Demonstrate progress in enabling improved predictive capability for weather and extreme weather events. Progress will be evaluated by external expert review.
6ESS7Green
7ESS2Green
8ES02Green
9ES7Green
Develop missions in support of this Outcome, as demonstrated by completing the Global Precipitation Mission (GPM) Confirmation Review.
None None8ES06Yellow
8ES8Yellow
Conduct flight program in support of this Outcome, as demonstrated by achieving mission success criteria for Aqua.
None None None9ES9Green
Why NASA did not achieve APG 9ES8: NASA did not complete the GPM Confirmation Review. NASA delayed the GPM confirmation review as a result of an incompatibility between the independent cost estimate developed by the Standing Review Board and the available budget. The project and the Science Mission Directorate have developed an approach and will present it to the Agency for approval at the Confirmation Review.
Plans for achieving 9ES8: The Confirmation Review is scheduled to be completed in December 2009.
FY06 FY07 FY08 FY 2009
Green Green Green Green
DP-14 naSa fY 2009 Performance anD accountabilitY rePort
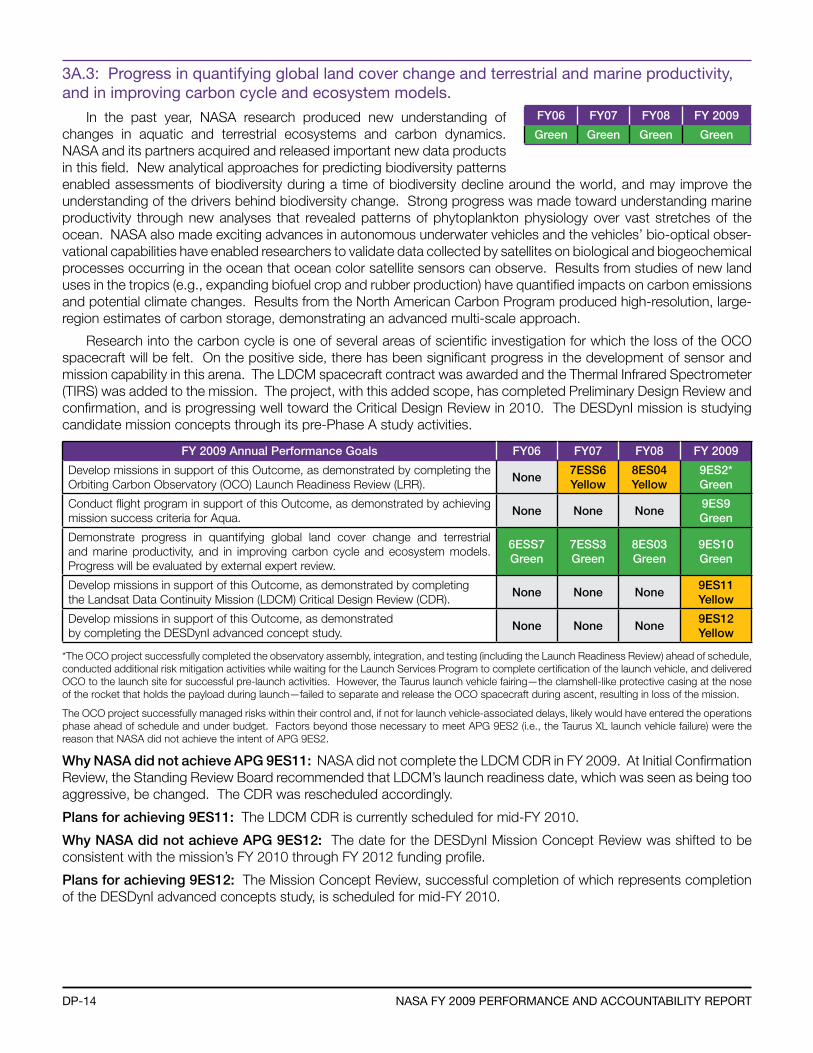
3a.3: Progress in quantifying global land cover change and terrestrial and marine productivity, and in improving carbon cycle and ecosystem models.
In the past year, NASA research produced new understanding of changes in aquatic and terrestrial ecosystems and carbon dynamics. NASA and its partners acquired and released important new data products in this field. New analytical approaches for predicting biodiversity patterns enabled assessments of biodiversity during a time of biodiversity decline around the world, and may improve the understanding of the drivers behind biodiversity change. Strong progress was made toward understanding marine productivity through new analyses that revealed patterns of phytoplankton physiology over vast stretches of the ocean. NASA also made exciting advances in autonomous underwater vehicles and the vehicles’ bio-optical obser-vational capabilities have enabled researchers to validate data collected by satellites on biological and biogeochemical processes occurring in the ocean that ocean color satellite sensors can observe. Results from studies of new land uses in the tropics (e.g., expanding biofuel crop and rubber production) have quantified impacts on carbon emissions and potential climate changes. Results from the North American Carbon Program produced high-resolution, large-region estimates of carbon storage, demonstrating an advanced multi-scale approach.
Research into the carbon cycle is one of several areas of scientific investigation for which the loss of the OCO spacecraft will be felt. On the positive side, there has been significant progress in the development of sensor and mission capability in this arena. The LDCM spacecraft contract was awarded and the Thermal Infrared Spectrometer (TIRS) was added to the mission. The project, with this added scope, has completed Preliminary Design Review and confirmation, and is progressing well toward the Critical Design Review in 2010. The DESDynI mission is studying candidate mission concepts through its pre-Phase A study activities.
FY 2009 Annual Performance Goals FY06 FY07 FY08 FY 2009
Develop missions in support of this Outcome, as demonstrated by completing the Orbiting Carbon Observatory (OCO) Launch Readiness Review (LRR).
None7ESS6Yellow
8ES04Yellow
9ES2*Green
Conduct flight program in support of this Outcome, as demonstrated by achieving mission success criteria for Aqua.
None None None9ES9Green
Demonstrate progress in quantifying global land cover change and terrestrial and marine productivity, and in improving carbon cycle and ecosystem models. Progress will be evaluated by external expert review.
6ESS7Green
7ESS3Green
8ES03Green
9ES10Green
Develop missions in support of this Outcome, as demonstrated by completing the Landsat Data Continuity Mission (LDCM) Critical Design Review (CDR).
None None None9ES11Yellow
Develop missions in support of this Outcome, as demonstrated by completing the DESDynI advanced concept study.
None None None9ES12Yellow
*The OCO project successfully completed the observatory assembly, integration, and testing (including the Launch Readiness Review) ahead of schedule, conducted additional risk mitigation activities while waiting for the Launch Services Program to complete certification of the launch vehicle, and delivered OCO to the launch site for successful pre-launch activities. However, the Taurus launch vehicle fairing—the clamshell-like protective casing at the nose of the rocket that holds the payload during launch—failed to separate and release the OCO spacecraft during ascent, resulting in loss of the mission.
The OCO project successfully managed risks within their control and, if not for launch vehicle-associated delays, likely would have entered the operations phase ahead of schedule and under budget. Factors beyond those necessary to meet APG 9ES2 (i.e., the Taurus XL launch vehicle failure) were the reason that NASA did not achieve the intent of APG 9ES2.
Why NASA did not achieve APG 9ES11: NASA did not complete the LDCM CDR in FY 2009. At Initial Confirmation Review, the Standing Review Board recommended that LDCM’s launch readiness date, which was seen as being too aggressive, be changed. The CDR was rescheduled accordingly.
Plans for achieving 9ES11: The LDCM CDR is currently scheduled for mid-FY 2010.
Why NASA did not achieve APG 9ES12: The date for the DESDynI Mission Concept Review was shifted to be consistent with the mission’s FY 2010 through FY 2012 funding profile.
Plans for achieving 9ES12: The Mission Concept Review, successful completion of which represents completion of the DESDynI advanced concepts study, is scheduled for mid-FY 2010.
FY06 FY07 FY08 FY 2009
Green Green Green Green
DP-15DetaileD Performance
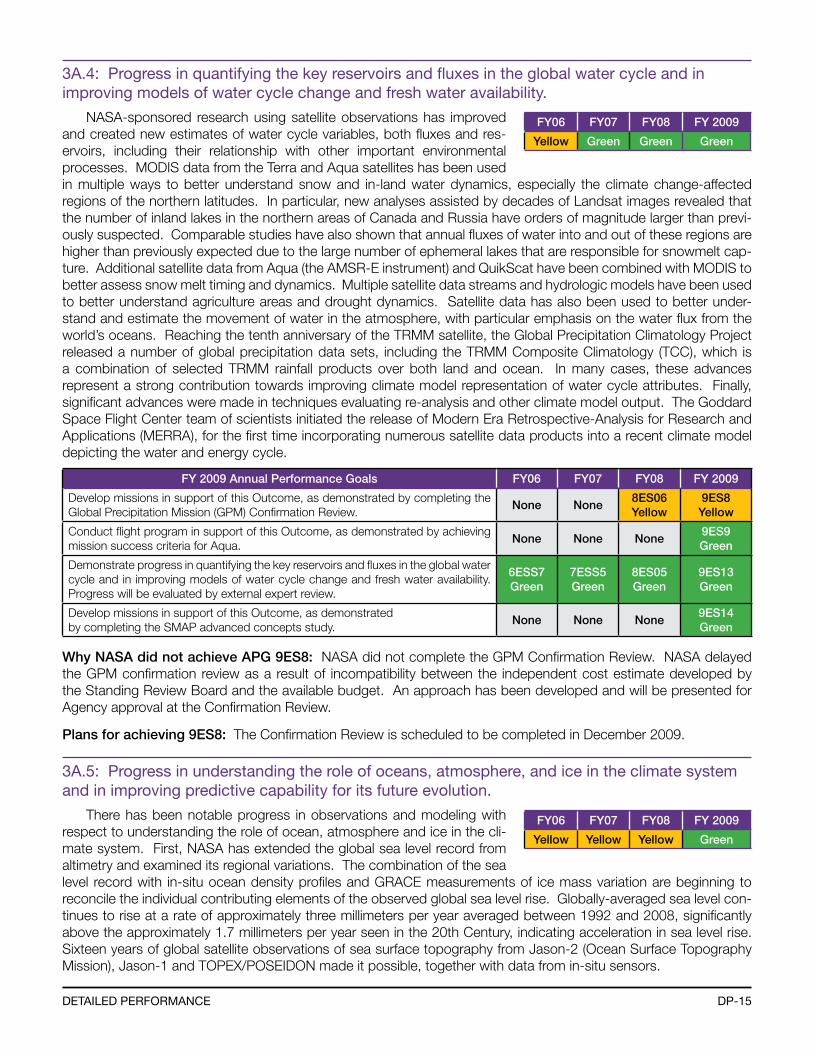
3a.4: Progress in quantifying the key reservoirs and fluxes in the global water cycle and in improving models of water cycle change and fresh water availability.
NASA-sponsored research using satellite observations has improved and created new estimates of water cycle variables, both fluxes and res-ervoirs, including their relationship with other important environmental processes. MODIS data from the Terra and Aqua satellites has been used in multiple ways to better understand snow and in-land water dynamics, especially the climate change-affected regions of the northern latitudes. In particular, new analyses assisted by decades of Landsat images revealed that the number of inland lakes in the northern areas of Canada and Russia have orders of magnitude larger than previ-ously suspected. Comparable studies have also shown that annual fluxes of water into and out of these regions are higher than previously expected due to the large number of ephemeral lakes that are responsible for snowmelt cap-ture. Additional satellite data from Aqua (the AMSR-E instrument) and QuikScat have been combined with MODIS to better assess snow melt timing and dynamics. Multiple satellite data streams and hydrologic models have been used to better understand agriculture areas and drought dynamics. Satellite data has also been used to better under-stand and estimate the movement of water in the atmosphere, with particular emphasis on the water flux from the world’s oceans. Reaching the tenth anniversary of the TRMM satellite, the Global Precipitation Climatology Project released a number of global precipitation data sets, including the TRMM Composite Climatology (TCC), which is a combination of selected TRMM rainfall products over both land and ocean. In many cases, these advances represent a strong contribution towards improving climate model representation of water cycle attributes. Finally, significant advances were made in techniques evaluating re-analysis and other climate model output. The Goddard Space Flight Center team of scientists initiated the release of Modern Era Retrospective-Analysis for Research and Applications (MERRA), for the first time incorporating numerous satellite data products into a recent climate model depicting the water and energy cycle.
FY 2009 Annual Performance Goals FY06 FY07 FY08 FY 2009
Develop missions in support of this Outcome, as demonstrated by completing the Global Precipitation Mission (GPM) Confirmation Review.
None None8ES06Yellow
9ES8Yellow
Conduct flight program in support of this Outcome, as demonstrated by achieving mission success criteria for Aqua.
None None None9ES9Green
Demonstrate progress in quantifying the key reservoirs and fluxes in the global water cycle and in improving models of water cycle change and fresh water availability. Progress will be evaluated by external expert review.
6ESS7Green
7ESS5Green
8ES05Green
9ES13Green
Develop missions in support of this Outcome, as demonstrated by completing the SMAP advanced concepts study.
None None None9ES14Green
Why NASA did not achieve APG 9ES8: NASA did not complete the GPM Confirmation Review. NASA delayed the GPM confirmation review as a result of incompatibility between the independent cost estimate developed by the Standing Review Board and the available budget. An approach has been developed and will be presented for Agency approval at the Confirmation Review.
Plans for achieving 9ES8: The Confirmation Review is scheduled to be completed in December 2009.
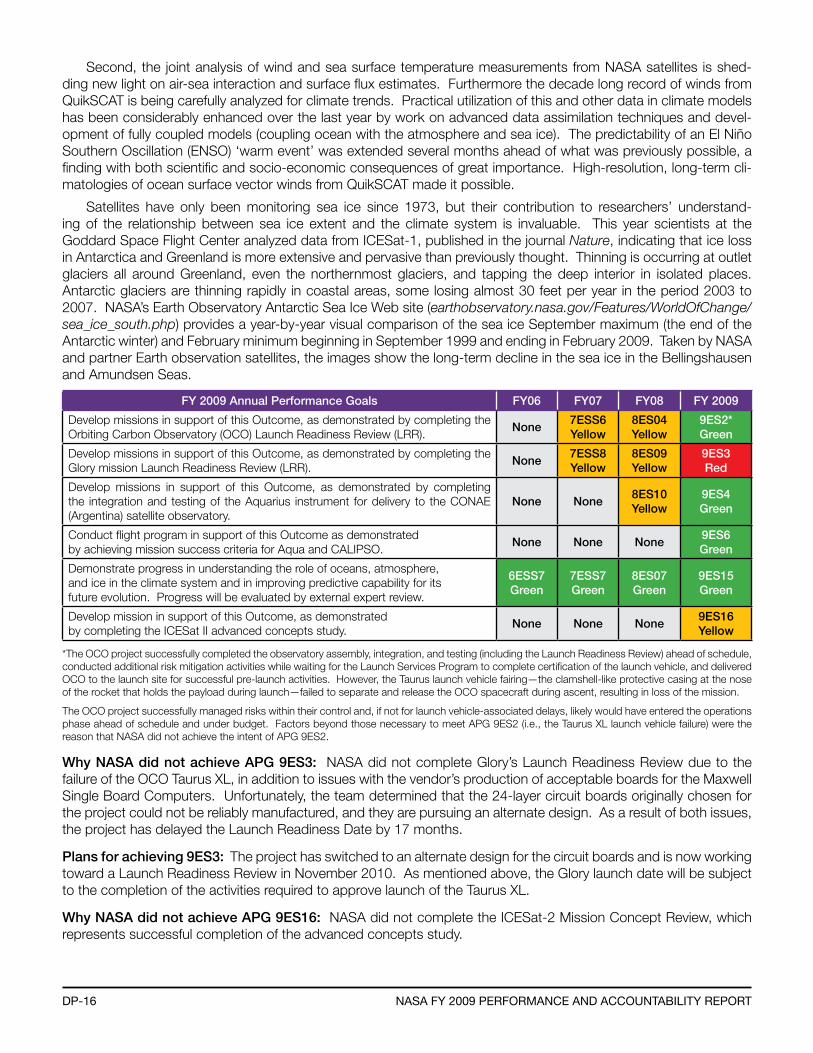
3a.5: Progress in understanding the role of oceans, atmosphere, and ice in the climate system and in improving predictive capability for its future evolution.
There has been notable progress in observations and modeling with respect to understanding the role of ocean, atmosphere and ice in the cli-mate system. First, NASA has extended the global sea level record from altimetry and examined its regional variations. The combination of the sea level record with in-situ ocean density profiles and GRACE measurements of ice mass variation are beginning to reconcile the individual contributing elements of the observed global sea level rise. Globally-averaged sea level con-tinues to rise at a rate of approximately three millimeters per year averaged between 1992 and 2008, significantly above the approximately 1.7 millimeters per year seen in the 20th Century, indicating acceleration in sea level rise. Sixteen years of global satellite observations of sea surface topography from Jason-2 (Ocean Surface Topography Mission), Jason-1 and TOPEX/POSEIDON made it possible, together with data from in-situ sensors.
FY06 FY07 FY08 FY 2009
Yellow Yellow Yellow Green
FY06 FY07 FY08 FY 2009
Yellow Green Green Green
DP-16 naSa fY 2009 Performance anD accountabilitY rePort
Second, the joint analysis of wind and sea surface temperature measurements from NASA satellites is shed-ding new light on air-sea interaction and surface flux estimates. Furthermore the decade long record of winds from QuikSCAT is being carefully analyzed for climate trends. Practical utilization of this and other data in climate models has been considerably enhanced over the last year by work on advanced data assimilation techniques and devel-opment of fully coupled models (coupling ocean with the atmosphere and sea ice). The predictability of an El Niño Southern Oscillation (ENSO) ‘warm event’ was extended several months ahead of what was previously possible, a finding with both scientific and socio-economic consequences of great importance. High-resolution, long-term cli-matologies of ocean surface vector winds from QuikSCAT made it possible.
Satellites have only been monitoring sea ice since 1973, but their contribution to researchers’ understand-ing of the relationship between sea ice extent and the climate system is invaluable. This year scientists at the Goddard Space Flight Center analyzed data from ICESat-1, published in the journal Nature, indicating that ice loss in Antarctica and Greenland is more extensive and pervasive than previously thought. Thinning is occurring at outlet glaciers all around Greenland, even the northernmost glaciers, and tapping the deep interior in isolated places. Antarctic glaciers are thinning rapidly in coastal areas, some losing almost 30 feet per year in the period 2003 to 2007. NASA’s Earth Observatory Antarctic Sea Ice Web site (earthobservatory.nasa.gov/Features/WorldOfChange/sea_ice_south.php) provides a year-by-year visual comparison of the sea ice September maximum (the end of the Antarctic winter) and February minimum beginning in September 1999 and ending in February 2009. Taken by NASA and partner Earth observation satellites, the images show the long-term decline in the sea ice in the Bellingshausen and Amundsen Seas.
FY 2009 Annual Performance Goals FY06 FY07 FY08 FY 2009
Develop missions in support of this Outcome, as demonstrated by completing the Orbiting Carbon Observatory (OCO) Launch Readiness Review (LRR).
None7ESS6Yellow
8ES04Yellow
9ES2*Green
Develop missions in support of this Outcome, as demonstrated by completing the Glory mission Launch Readiness Review (LRR).
None7ESS8Yellow
8ES09Yellow
9ES3Red
Develop missions in support of this Outcome, as demonstrated by completing the integration and testing of the Aquarius instrument for delivery to the CONAE (Argentina) satellite observatory.
None None8ES10Yellow
9ES4Green
Conduct flight program in support of this Outcome as demonstrated by achieving mission success criteria for Aqua and CALIPSO.
None None None9ES6Green
Demonstrate progress in understanding the role of oceans, atmosphere, and ice in the climate system and in improving predictive capability for its future evolution. Progress will be evaluated by external expert review.
6ESS7Green
7ESS7Green
8ES07Green
9ES15Green
Develop mission in support of this Outcome, as demonstrated by completing the ICESat II advanced concepts study.
None None None9ES16Yellow
*The OCO project successfully completed the observatory assembly, integration, and testing (including the Launch Readiness Review) ahead of schedule, conducted additional risk mitigation activities while waiting for the Launch Services Program to complete certification of the launch vehicle, and delivered OCO to the launch site for successful pre-launch activities. However, the Taurus launch vehicle fairing—the clamshell-like protective casing at the nose of the rocket that holds the payload during launch—failed to separate and release the OCO spacecraft during ascent, resulting in loss of the mission.
The OCO project successfully managed risks within their control and, if not for launch vehicle-associated delays, likely would have entered the operations phase ahead of schedule and under budget. Factors beyond those necessary to meet APG 9ES2 (i.e., the Taurus XL launch vehicle failure) were the reason that NASA did not achieve the intent of APG 9ES2.
Why NASA did not achieve APG 9ES3: NASA did not complete Glory’s Launch Readiness Review due to the failure of the OCO Taurus XL, in addition to issues with the vendor’s production of acceptable boards for the Maxwell Single Board Computers. Unfortunately, the team determined that the 24-layer circuit boards originally chosen for the project could not be reliably manufactured, and they are pursuing an alternate design. As a result of both issues, the project has delayed the Launch Readiness Date by 17 months.
Plans for achieving 9ES3: The project has switched to an alternate design for the circuit boards and is now working toward a Launch Readiness Review in November 2010. As mentioned above, the Glory launch date will be subject to the completion of the activities required to approve launch of the Taurus XL.
Why NASA did not achieve APG 9ES16: NASA did not complete the ICESat-2 Mission Concept Review, which represents successful completion of the advanced concepts study.
DP-17DetaileD Performance
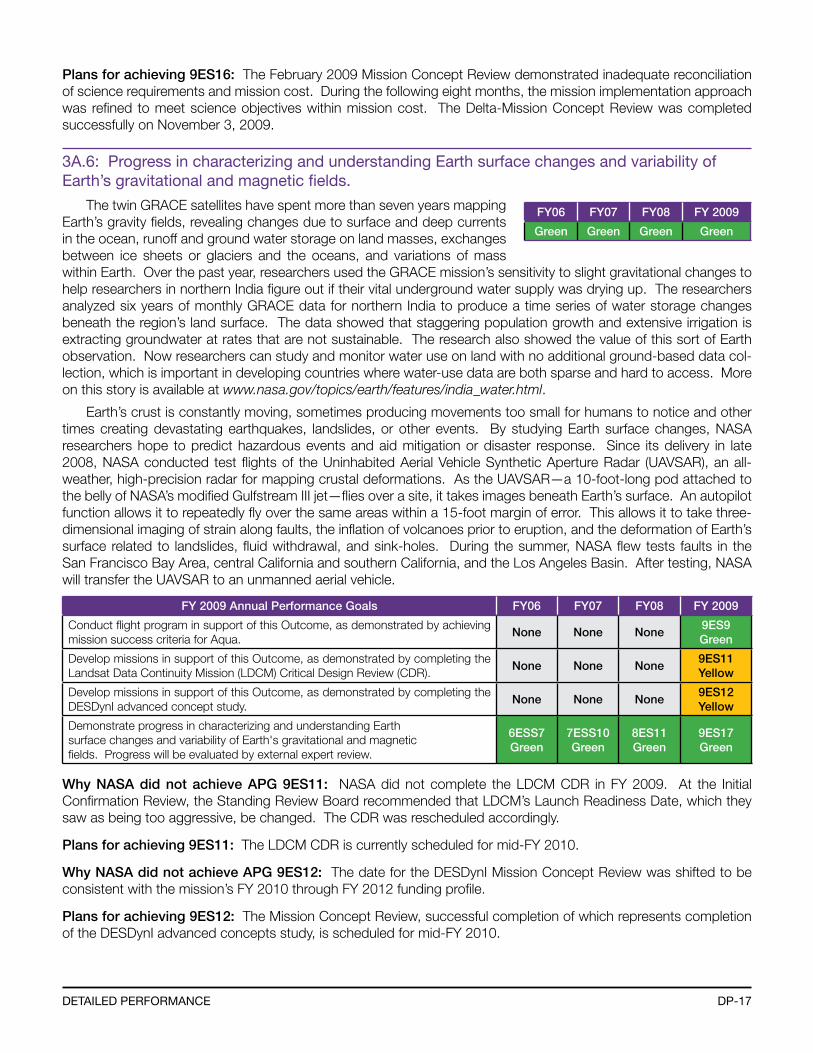
Plans for achieving 9ES16: The February 2009 Mission Concept Review demonstrated inadequate reconciliation of science requirements and mission cost. During the following eight months, the mission implementation approach was refined to meet science objectives within mission cost. The Delta-Mission Concept Review was completed successfully on November 3, 2009.
3a.6: Progress in characterizing and understanding earth surface changes and variability of earth’s gravitational and magnetic fields.
The twin GRACE satellites have spent more than seven years mapping Earth’s gravity fields, revealing changes due to surface and deep currents in the ocean, runoff and ground water storage on land masses, exchanges between ice sheets or glaciers and the oceans, and variations of mass within Earth. Over the past year, researchers used the GRACE mission’s sensitivity to slight gravitational changes to help researchers in northern India figure out if their vital underground water supply was drying up. The researchers analyzed six years of monthly GRACE data for northern India to produce a time series of water storage changes beneath the region’s land surface. The data showed that staggering population growth and extensive irrigation is extracting groundwater at rates that are not sustainable. The research also showed the value of this sort of Earth observation. Now researchers can study and monitor water use on land with no additional ground-based data col-lection, which is important in developing countries where water-use data are both sparse and hard to access. More on this story is available at www.nasa.gov/topics/earth/features/india_water.html.
Earth’s crust is constantly moving, sometimes producing movements too small for humans to notice and other times creating devastating earthquakes, landslides, or other events. By studying Earth surface changes, NASA researchers hope to predict hazardous events and aid mitigation or disaster response. Since its delivery in late 2008, NASA conducted test flights of the Uninhabited Aerial Vehicle Synthetic Aperture Radar (UAVSAR), an all-weather, high-precision radar for mapping crustal deformations. As the UAVSAR—a 10-foot-long pod attached to the belly of NASA’s modified Gulfstream III jet—flies over a site, it takes images beneath Earth’s surface. An autopilot function allows it to repeatedly fly over the same areas within a 15-foot margin of error. This allows it to take three-dimensional imaging of strain along faults, the inflation of volcanoes prior to eruption, and the deformation of Earth’s surface related to landslides, fluid withdrawal, and sink-holes. During the summer, NASA flew tests faults in the San Francisco Bay Area, central California and southern California, and the Los Angeles Basin. After testing, NASA will transfer the UAVSAR to an unmanned aerial vehicle.
FY 2009 Annual Performance Goals FY06 FY07 FY08 FY 2009
Conduct flight program in support of this Outcome, as demonstrated by achieving mission success criteria for Aqua.
None None None9ES9Green
Develop missions in support of this Outcome, as demonstrated by completing the Landsat Data Continuity Mission (LDCM) Critical Design Review (CDR).
None None None9ES11Yellow
Develop missions in support of this Outcome, as demonstrated by completing the DESDynI advanced concept study.
None None None9ES12Yellow
Demonstrate progress in characterizing and understanding Earth surface changes and variability of Earth's gravitational and magnetic fields. Progress will be evaluated by external expert review.
6ESS7Green
7ESS10Green
8ES11Green
9ES17Green
Why NASA did not achieve APG 9ES11: NASA did not complete the LDCM CDR in FY 2009. At the Initial Confirmation Review, the Standing Review Board recommended that LDCM’s Launch Readiness Date, which they saw as being too aggressive, be changed. The CDR was rescheduled accordingly.
Plans for achieving 9ES11: The LDCM CDR is currently scheduled for mid-FY 2010.
Why NASA did not achieve APG 9ES12: The date for the DESDynI Mission Concept Review was shifted to be consistent with the mission’s FY 2010 through FY 2012 funding profile.
Plans for achieving 9ES12: The Mission Concept Review, successful completion of which represents completion of the DESDynI advanced concepts study, is scheduled for mid-FY 2010.
FY06 FY07 FY08 FY 2009
Green Green Green Green
DP-18 naSa fY 2009 Performance anD accountabilitY rePort
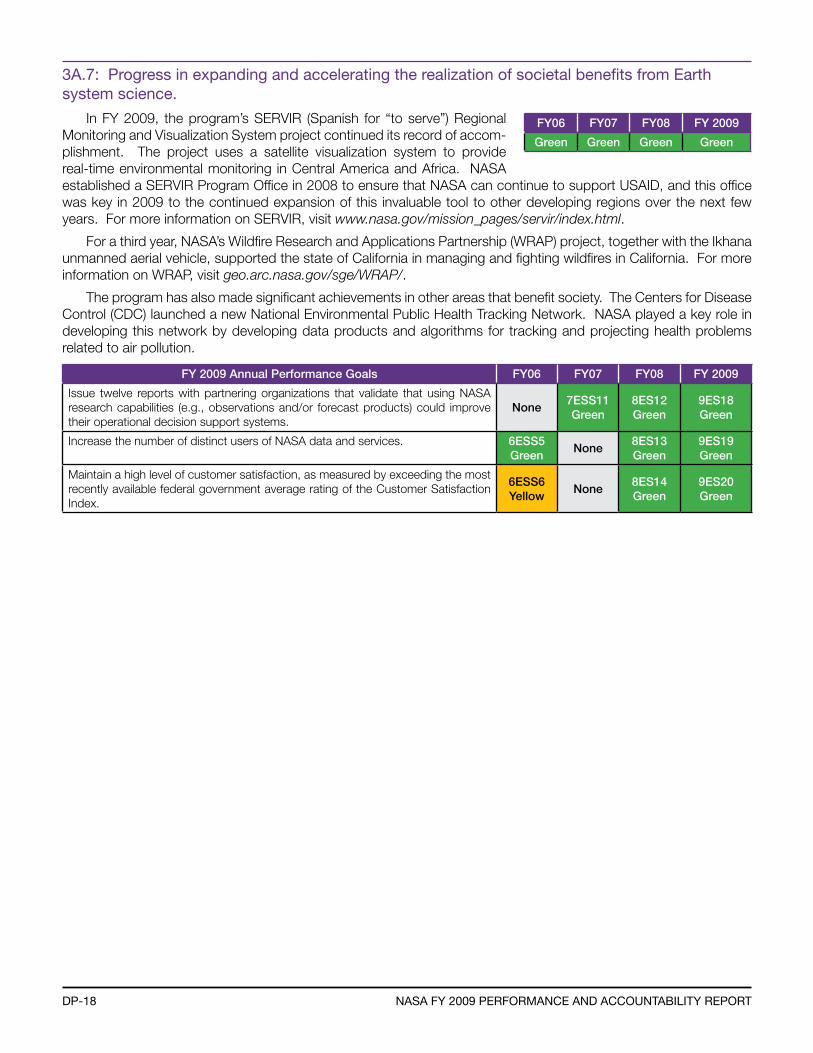
3a.7: Progress in expanding and accelerating the realization of societal benefits from earth system science.
In FY 2009, the program’s SERVIR (Spanish for “to serve”) Regional Monitoring and Visualization System project continued its record of accom-plishment. The project uses a satellite visualization system to provide real-time environmental monitoring in Central America and Africa. NASA established a SERVIR Program Office in 2008 to ensure that NASA can continue to support USAID, and this office was key in 2009 to the continued expansion of this invaluable tool to other developing regions over the next few years. For more information on SERVIR, visit www.nasa.gov/mission_pages/servir/index.html.
For a third year, NASA’s Wildfire Research and Applications Partnership (WRAP) project, together with the Ikhana unmanned aerial vehicle, supported the state of California in managing and fighting wildfires in California. For more information on WRAP, visit geo.arc.nasa.gov/sge/WRAP/.
The program has also made significant achievements in other areas that benefit society. The Centers for Disease Control (CDC) launched a new National Environmental Public Health Tracking Network. NASA played a key role in developing this network by developing data products and algorithms for tracking and projecting health problems related to air pollution.
FY 2009 Annual Performance Goals FY06 FY07 FY08 FY 2009
Issue twelve reports with partnering organizations that validate that using NASA research capabilities (e.g., observations and/or forecast products) could improve their operational decision support systems.
None7ESS11Green
8ES12Green
9ES18Green
Increase the number of distinct users of NASA data and services. 6ESS5Green
None8ES13Green
9ES19Green
Maintain a high level of customer satisfaction, as measured by exceeding the most recently available federal government average rating of the Customer Satisfaction Index.
6ESS6Yellow
None8ES14Green
9ES20Green
FY06 FY07 FY08 FY 2009
Green Green Green Green
DP-19DetaileD Performance
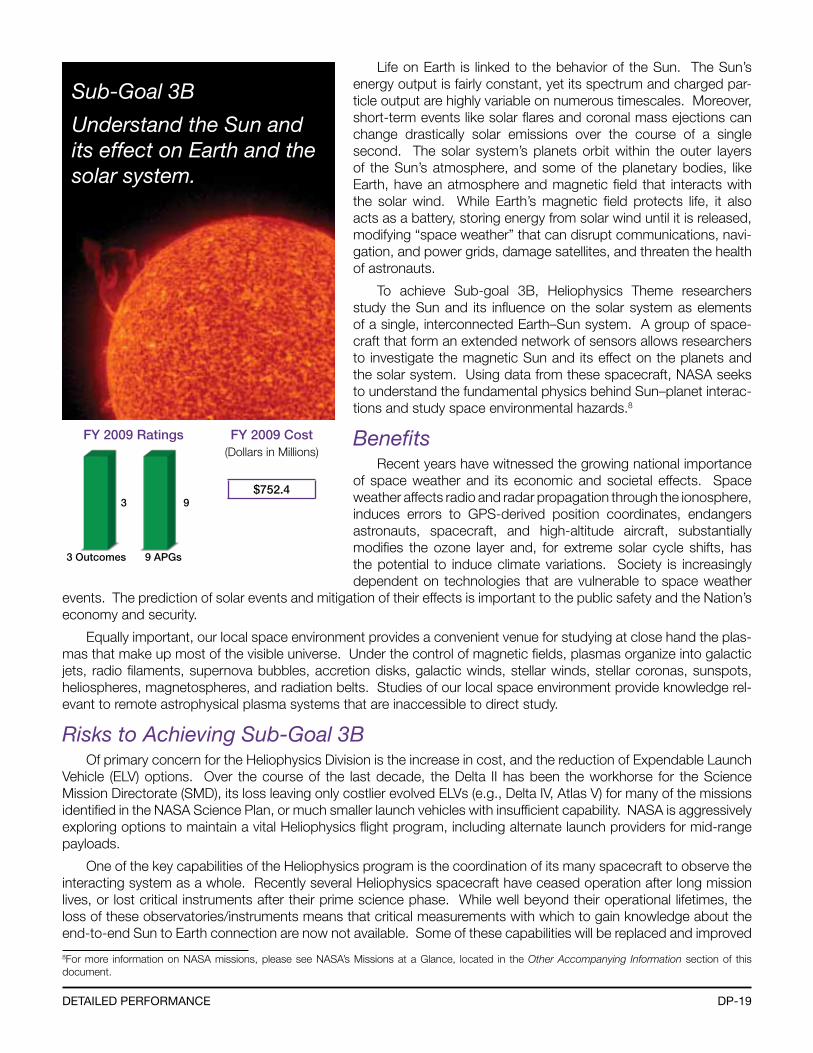
Sub-Goal 3B
Understand the Sun and its effect on Earth and the solar system.
3 Outcomes 9 APGs
3 9
FY 2009 Ratings FY 2009 Cost(Dollars in Millions)
$752.4
Life on Earth is linked to the behavior of the Sun. The Sun’s energy output is fairly constant, yet its spectrum and charged par-ticle output are highly variable on numerous timescales. Moreover, short-term events like solar flares and coronal mass ejections can change drastically solar emissions over the course of a single second. The solar system’s planets orbit within the outer layers of the Sun’s atmosphere, and some of the planetary bodies, like Earth, have an atmosphere and magnetic field that interacts with the solar wind. While Earth’s magnetic field protects life, it also acts as a battery, storing energy from solar wind until it is released, modifying “space weather” that can disrupt communications, navi-gation, and power grids, damage satellites, and threaten the health of astronauts.
To achieve Sub-goal 3B, Heliophysics Theme researchers study the Sun and its influence on the solar system as elements of a single, interconnected Earth–Sun system. A group of space-craft that form an extended network of sensors allows researchers to investigate the magnetic Sun and its effect on the planets and the solar system. Using data from these spacecraft, NASA seeks to understand the fundamental physics behind Sun–planet interac-tions and study space environmental hazards.8
BenefitsRecent years have witnessed the growing national importance
of space weather and its economic and societal effects. Space weather affects radio and radar propagation through the ionosphere, induces errors to GPS-derived position coordinates, endangers astronauts, spacecraft, and high-altitude aircraft, substantially modifies the ozone layer and, for extreme solar cycle shifts, has the potential to induce climate variations. Society is increasingly dependent on technologies that are vulnerable to space weather
events. The prediction of solar events and mitigation of their effects is important to the public safety and the Nation’s economy and security.
Equally important, our local space environment provides a convenient venue for studying at close hand the plas-mas that make up most of the visible universe. Under the control of magnetic fields, plasmas organize into galactic jets, radio filaments, supernova bubbles, accretion disks, galactic winds, stellar winds, stellar coronas, sunspots, heliospheres, magnetospheres, and radiation belts. Studies of our local space environment provide knowledge rel-evant to remote astrophysical plasma systems that are inaccessible to direct study.
Risks to Achieving Sub-Goal 3BOf primary concern for the Heliophysics Division is the increase in cost, and the reduction of Expendable Launch
Vehicle (ELV) options. Over the course of the last decade, the Delta II has been the workhorse for the Science Mission Directorate (SMD), its loss leaving only costlier evolved ELVs (e.g., Delta IV, Atlas V) for many of the missions identified in the NASA Science Plan, or much smaller launch vehicles with insufficient capability. NASA is aggressively exploring options to maintain a vital Heliophysics flight program, including alternate launch providers for mid-range payloads.
One of the key capabilities of the Heliophysics program is the coordination of its many spacecraft to observe the interacting system as a whole. Recently several Heliophysics spacecraft have ceased operation after long mission lives, or lost critical instruments after their prime science phase. While well beyond their operational lifetimes, the loss of these observatories/instruments means that critical measurements with which to gain knowledge about the end-to-end Sun to Earth connection are now not available. Some of these capabilities will be replaced and improved
8For more information on NASA missions, please see NASA’s Missions at a Glance, located in the Other Accompanying Information section of this document.
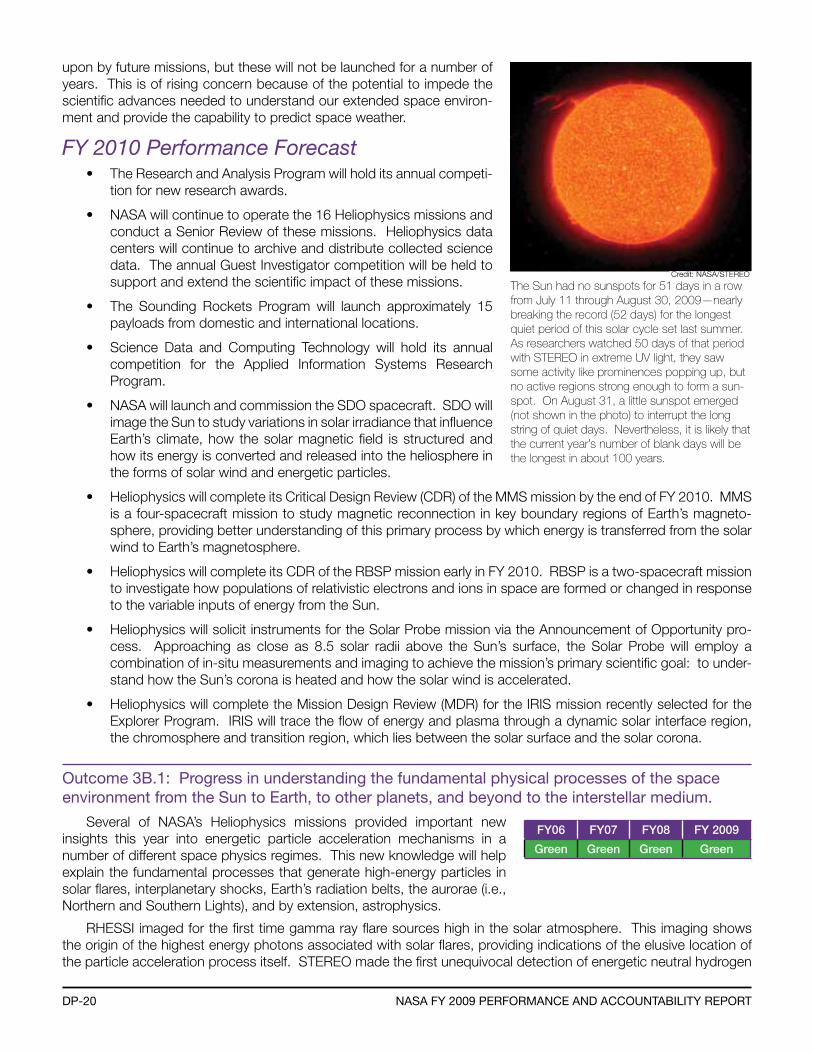
DP-20 naSa fY 2009 Performance anD accountabilitY rePort
upon by future missions, but these will not be launched for a number of years. This is of rising concern because of the potential to impede the scientific advances needed to understand our extended space environ-ment and provide the capability to predict space weather.
FY 2010 Performance Forecast• The Research and Analysis Program will hold its annual competi-
tion for new research awards.
• NASA will continue to operate the 16 Heliophysics missions and conduct a Senior Review of these missions. Heliophysics data centers will continue to archive and distribute collected science data. The annual Guest Investigator competition will be held to support and extend the scientific impact of these missions.
• The Sounding Rockets Program will launch approximately 15 payloads from domestic and international locations.
• Science Data and Computing Technology will hold its annual competition for the Applied Information Systems Research Program.
• NASA will launch and commission the SDO spacecraft. SDO will image the Sun to study variations in solar irradiance that influence Earth’s climate, how the solar magnetic field is structured and how its energy is converted and released into the heliosphere in the forms of solar wind and energetic particles.
• Heliophysics will complete its Critical Design Review (CDR) of the MMS mission by the end of FY 2010. MMS is a four-spacecraft mission to study magnetic reconnection in key boundary regions of Earth’s magneto-sphere, providing better understanding of this primary process by which energy is transferred from the solar wind to Earth’s magnetosphere.
• Heliophysics will complete its CDR of the RBSP mission early in FY 2010. RBSP is a two-spacecraft mission to investigate how populations of relativistic electrons and ions in space are formed or changed in response to the variable inputs of energy from the Sun.
• Heliophysics will solicit instruments for the Solar Probe mission via the Announcement of Opportunity pro-cess. Approaching as close as 8.5 solar radii above the Sun’s surface, the Solar Probe will employ a combination of in-situ measurements and imaging to achieve the mission’s primary scientific goal: to under-stand how the Sun’s corona is heated and how the solar wind is accelerated.
• Heliophysics will complete the Mission Design Review (MDR) for the IRIS mission recently selected for the Explorer Program. IRIS will trace the flow of energy and plasma through a dynamic solar interface region, the chromosphere and transition region, which lies between the solar surface and the solar corona.
outcome 3b.1: Progress in understanding the fundamental physical processes of the space environment from the Sun to earth, to other planets, and beyond to the interstellar medium.
Several of NASA’s Heliophysics missions provided important new insights this year into energetic particle acceleration mechanisms in a number of different space physics regimes. This new knowledge will help explain the fundamental processes that generate high-energy particles in solar flares, interplanetary shocks, Earth’s radiation belts, the aurorae (i.e., Northern and Southern Lights), and by extension, astrophysics.
RHESSI imaged for the first time gamma ray flare sources high in the solar atmosphere. This imaging shows the origin of the highest energy photons associated with solar flares, providing indications of the elusive location of the particle acceleration process itself. STEREO made the first unequivocal detection of energetic neutral hydrogen
The Sun had no sunspots for 51 days in a row from July 11 through August 30, 2009—nearly breaking the record (52 days) for the longest quiet period of this solar cycle set last summer. As researchers watched 50 days of that period with STEREO in extreme UV light, they saw some activity like prominences popping up, but no active regions strong enough to form a sun-spot. On August 31, a little sunspot emerged (not shown in the photo) to interrupt the long string of quiet days. Nevertheless, it is likely that the current year’s number of blank days will be the longest in about 100 years.
FY06 FY07 FY08 FY 2009
Green Green Green Green
Credit: NASA/STEREO
DP-21DetaileD Performance
from solar flares. These neutral atoms, thought to originate in solar flares, travel from the Sun quickly without being deflected by the Sun’s magnetic fields, yielding important information about the timing of particle acceleration in flares.
Several NASA missions provided new insight on the removal process of dust from the solar system through dust-plasma interactions. The STEREO spacecraft revealed that the smallest dust grains move away from the Sun at extreme speeds. These nanoparticles move at speeds approaching a million miles-per-hour. Nanoparticles are electrically charged by sunlight and are so lightweight that the solar wind magnetic field picks them up and rapidly transports the particles away from the Sun. Such dust constantly bombards Earth’s atmosphere, generating mete-oritic smoke. Observed by the AIM mission and by the Mesospheric Aerosol Sampling Spectrometer suborbital sounding rocket, it is believed that this meteoritic smoke plays a role in high-altitude ozone-hole chemistry and cloud formation.
Understanding how the outer atmospheres of the Sun and other stars are heated to multi-million degree temper-atures is one of the cornerstone problems of space science. Hinode X-Ray Telescope observations confirmed that magnetic reconnection is a driving force behind many classes of solar eruptive events (e.g., solar flares, coronal mass ejections, and X-ray jets). Impulsive energy release from magnetic reconnection is found to be important, not only in large-scale eruptions, but also in the acceleration of solar wind and the heating of the solar corona. The combination of Hinode’s magnetic field measurements, extreme ultraviolet spectroscopic and X-ray imaging data provided the first complete picture of the interaction of the Sun’s photospheric magnetic field with the overlying corona, providing the description of how energy is released and particles are energized. Hinode showed that coronal heating takes the form of small impulsive energy bursts called nanoflares, exactly as predicted by theoretical models.
Significant progress has also been made in understanding the timing and spatial structure of near-Earth releases of stored magnetic energy from the solar wind. These explosive energy releases, called magnetic storms and sub-storms, send currents and energetic particles into Earth’s upper atmosphere, causing communication and power system disruptions. They also inject energetic particle fluxes to geosynchronous orbit, where they endanger the health of orbiting spacecraft.
FY 2009 Annual Performance Goals FY06 FY07 FY08 FY 2009
Demonstrate progress in understanding the fundamental physical processes of the space environment from the Sun to Earth, to other planets, and beyond to the interstellar medium. Progress will be evaluated by external expert review.
6ESS11Green
7ESS13Green
8HE01Green
9HE1Green
6ESS12Green
6ESS14Green
6ESS15Green
Develop missions in support of this Outcome, as demonstrated by completing the Magnetospheric Multiscale (MMS) Spacecraft Preliminary Design Review (PDR).
None7ESS15
Red8HE02Green
9HE2Green
Develop missions in support of this Outcome, as demonstrated by completing the Geospace Radiation Belt Storm Probes Confirmation Review.
6ESS18Green
7ESS16Green
8HE04Green
9HE3Green
Develop missions in support of this Outcome, as demonstrated by completing the Explorer down-select.
None None None9HE4Green
Conduct flight program in support of this outcome, as demonstrated by achieving mission success criteria for STEREO, AIM, THEMIS and IBEX.
None None None9HE5Green
outcome 3b.2: Progress in understanding how human society, technological systems, and the habitability of planets are affected by solar variability and planetary magnetic fields.
The transition region between Earth’s upper atmosphere and the space environment is a critical boundary in the Sun–Earth system. NASA is making significant advances in understanding this boundary by studying the ways in which it couples to regions above and below it, as well as within itself. The AIM mission provided major advances in understanding polar mesospheric clouds (PMCs), the highest clouds in Earth’s atmosphere. PMCs have been becoming brighter and more frequent since their discovery in the late 1800s. It is important to understand these trends because of the possible relationship between these clouds
FY06 FY07 FY08 FY 2009
Green Green Green Green
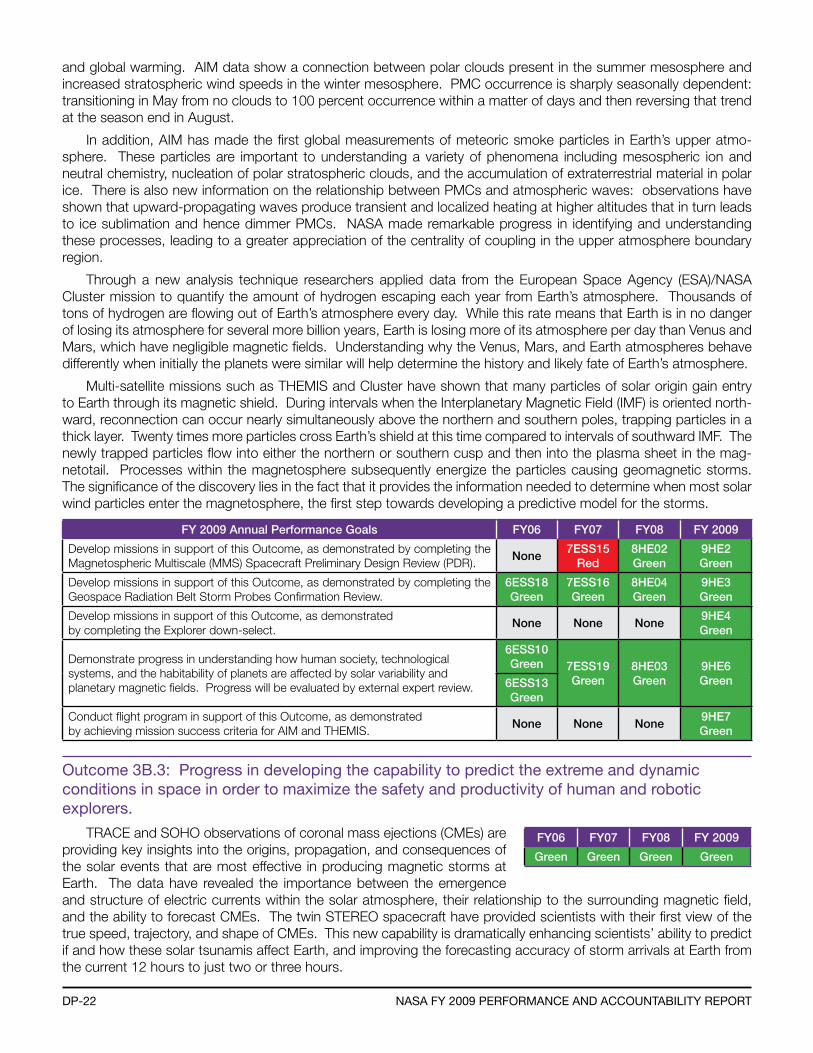
DP-22 naSa fY 2009 Performance anD accountabilitY rePort
and global warming. AIM data show a connection between polar clouds present in the summer mesosphere and increased stratospheric wind speeds in the winter mesosphere. PMC occurrence is sharply seasonally dependent: transitioning in May from no clouds to 100 percent occurrence within a matter of days and then reversing that trend at the season end in August.
In addition, AIM has made the first global measurements of meteoric smoke particles in Earth’s upper atmo-sphere. These particles are important to understanding a variety of phenomena including mesospheric ion and neutral chemistry, nucleation of polar stratospheric clouds, and the accumulation of extraterrestrial material in polar ice. There is also new information on the relationship between PMCs and atmospheric waves: observations have shown that upward-propagating waves produce transient and localized heating at higher altitudes that in turn leads to ice sublimation and hence dimmer PMCs. NASA made remarkable progress in identifying and understanding these processes, leading to a greater appreciation of the centrality of coupling in the upper atmosphere boundary region.
Through a new analysis technique researchers applied data from the European Space Agency (ESA)/NASA Cluster mission to quantify the amount of hydrogen escaping each year from Earth’s atmosphere. Thousands of tons of hydrogen are flowing out of Earth’s atmosphere every day. While this rate means that Earth is in no danger of losing its atmosphere for several more billion years, Earth is losing more of its atmosphere per day than Venus and Mars, which have negligible magnetic fields. Understanding why the Venus, Mars, and Earth atmospheres behave differently when initially the planets were similar will help determine the history and likely fate of Earth’s atmosphere.
Multi-satellite missions such as THEMIS and Cluster have shown that many particles of solar origin gain entry to Earth through its magnetic shield. During intervals when the Interplanetary Magnetic Field (IMF) is oriented north-ward, reconnection can occur nearly simultaneously above the northern and southern poles, trapping particles in a thick layer. Twenty times more particles cross Earth’s shield at this time compared to intervals of southward IMF. The newly trapped particles flow into either the northern or southern cusp and then into the plasma sheet in the mag-netotail. Processes within the magnetosphere subsequently energize the particles causing geomagnetic storms. The significance of the discovery lies in the fact that it provides the information needed to determine when most solar wind particles enter the magnetosphere, the first step towards developing a predictive model for the storms.
FY 2009 Annual Performance Goals FY06 FY07 FY08 FY 2009
Develop missions in support of this Outcome, as demonstrated by completing the Magnetospheric Multiscale (MMS) Spacecraft Preliminary Design Review (PDR).
None7ESS15
Red8HE02Green
9HE2Green
Develop missions in support of this Outcome, as demonstrated by completing the Geospace Radiation Belt Storm Probes Confirmation Review.
6ESS18Green
7ESS16Green
8HE04Green
9HE3Green
Develop missions in support of this Outcome, as demonstrated by completing the Explorer down-select.
None None None9HE4Green
Demonstrate progress in understanding how human society, technological systems, and the habitability of planets are affected by solar variability and planetary magnetic fields. Progress will be evaluated by external expert review.
6ESS10Green 7ESS19
Green8HE03Green
9HE6Green6ESS13
Green
Conduct flight program in support of this Outcome, as demonstrated by achieving mission success criteria for AIM and THEMIS.
None None None9HE7Green
outcome 3b.3: Progress in developing the capability to predict the extreme and dynamic conditions in space in order to maximize the safety and productivity of human and robotic explorers.
TRACE and SOHO observations of coronal mass ejections (CMEs) are providing key insights into the origins, propagation, and consequences of the solar events that are most effective in producing magnetic storms at Earth. The data have revealed the importance between the emergence and structure of electric currents within the solar atmosphere, their relationship to the surrounding magnetic field, and the ability to forecast CMEs. The twin STEREO spacecraft have provided scientists with their first view of the true speed, trajectory, and shape of CMEs. This new capability is dramatically enhancing scientists’ ability to predict if and how these solar tsunamis affect Earth, and improving the forecasting accuracy of storm arrivals at Earth from the current 12 hours to just two or three hours.
FY06 FY07 FY08 FY 2009
Green Green Green Green
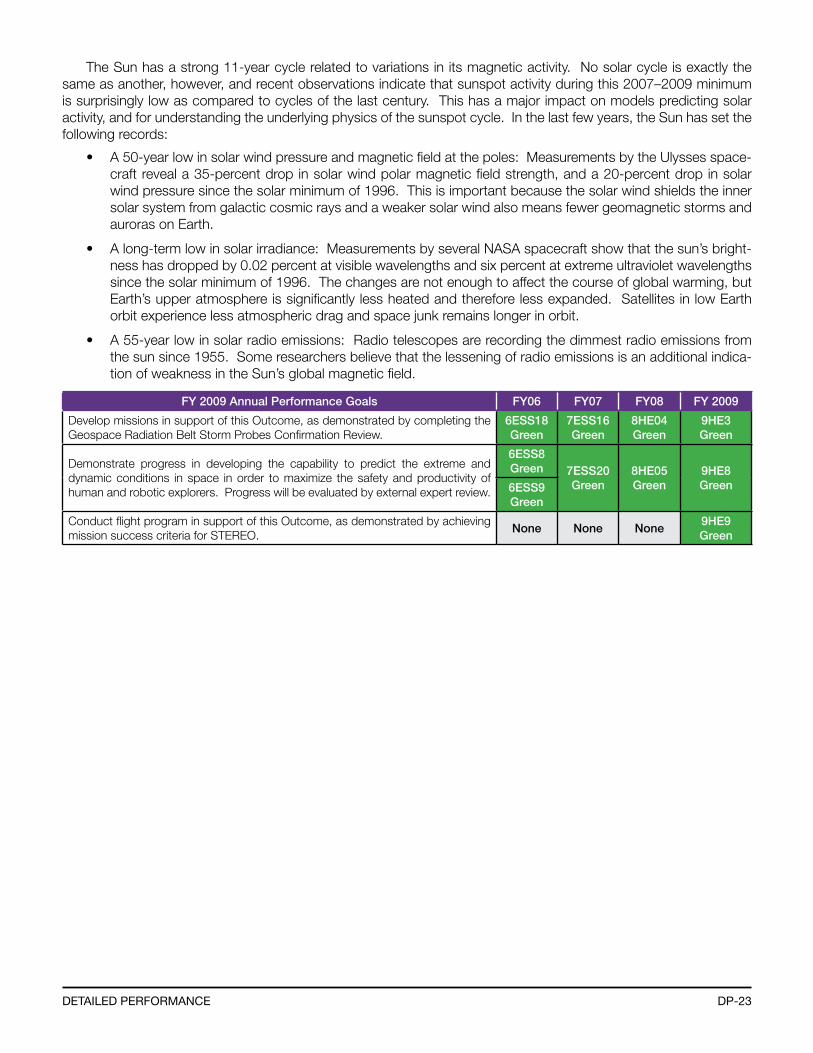
DP-23DetaileD Performance
The Sun has a strong 11-year cycle related to variations in its magnetic activity. No solar cycle is exactly the same as another, however, and recent observations indicate that sunspot activity during this 2007–2009 minimum is surprisingly low as compared to cycles of the last century. This has a major impact on models predicting solar activity, and for understanding the underlying physics of the sunspot cycle. In the last few years, the Sun has set the following records:
• A 50-year low in solar wind pressure and magnetic field at the poles: Measurements by the Ulysses space-craft reveal a 35-percent drop in solar wind polar magnetic field strength, and a 20-percent drop in solar wind pressure since the solar minimum of 1996. This is important because the solar wind shields the inner solar system from galactic cosmic rays and a weaker solar wind also means fewer geomagnetic storms and auroras on Earth.
• A long-term low in solar irradiance: Measurements by several NASA spacecraft show that the sun’s bright-ness has dropped by 0.02 percent at visible wavelengths and six percent at extreme ultraviolet wavelengths since the solar minimum of 1996. The changes are not enough to affect the course of global warming, but Earth’s upper atmosphere is significantly less heated and therefore less expanded. Satellites in low Earth orbit experience less atmospheric drag and space junk remains longer in orbit.
• A 55-year low in solar radio emissions: Radio telescopes are recording the dimmest radio emissions from the sun since 1955. Some researchers believe that the lessening of radio emissions is an additional indica-tion of weakness in the Sun’s global magnetic field.
FY 2009 Annual Performance Goals FY06 FY07 FY08 FY 2009
Develop missions in support of this Outcome, as demonstrated by completing the Geospace Radiation Belt Storm Probes Confirmation Review.
6ESS18Green
7ESS16Green
8HE04Green
9HE3Green
Demonstrate progress in developing the capability to predict the extreme and dynamic conditions in space in order to maximize the safety and productivity of human and robotic explorers. Progress will be evaluated by external expert review.
6ESS8Green 7ESS20
Green8HE05Green
9HE8Green6ESS9
Green
Conduct flight program in support of this Outcome, as demonstrated by achieving mission success criteria for STEREO.
None None None9HE9Green
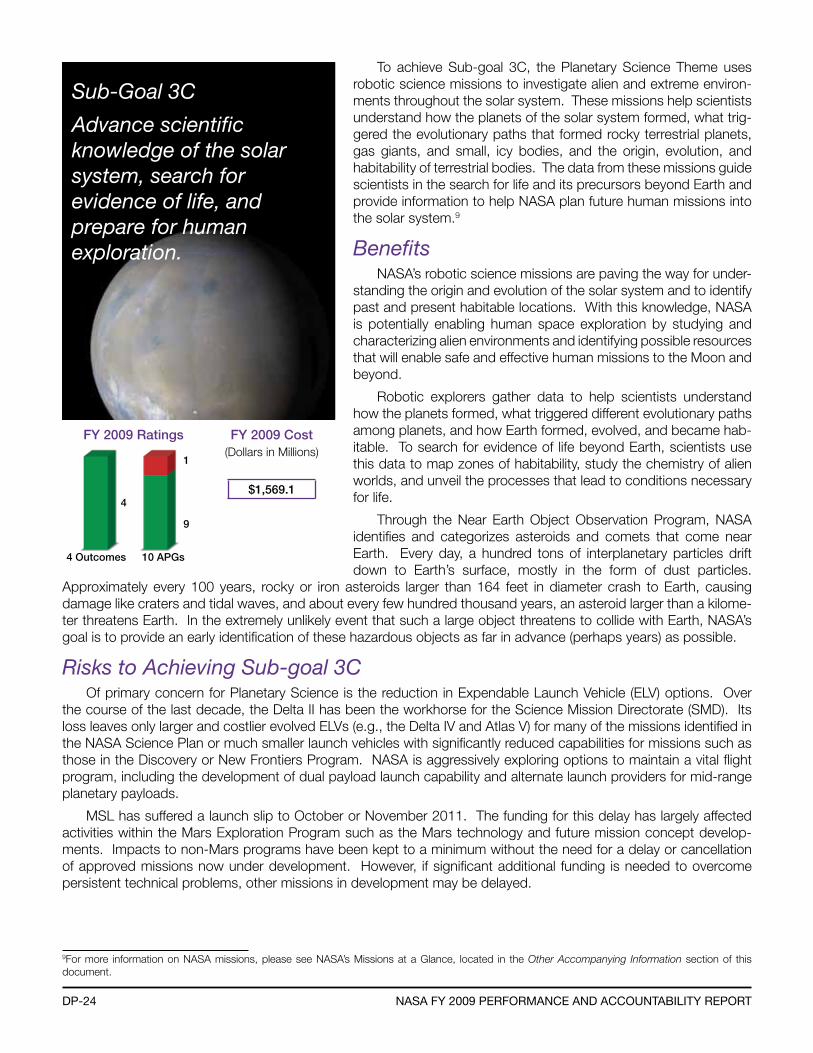
DP-24 naSa fY 2009 Performance anD accountabilitY rePort
Sub-Goal 3C
Advance scientific knowledge of the solar system, search for evidence of life, and prepare for human exploration.
4 Outcomes 10 APGs
4
9
FY 2009 Ratings FY 2009 Cost(Dollars in Millions)
$1,569.1
1
To achieve Sub-goal 3C, the Planetary Science Theme uses robotic science missions to investigate alien and extreme environ-ments throughout the solar system. These missions help scientists understand how the planets of the solar system formed, what trig-gered the evolutionary paths that formed rocky terrestrial planets, gas giants, and small, icy bodies, and the origin, evolution, and habitability of terrestrial bodies. The data from these missions guide scientists in the search for life and its precursors beyond Earth and provide information to help NASA plan future human missions into the solar system.9
BenefitsNASA’s robotic science missions are paving the way for under-
standing the origin and evolution of the solar system and to identify past and present habitable locations. With this knowledge, NASA is potentially enabling human space exploration by studying and characterizing alien environments and identifying possible resources that will enable safe and effective human missions to the Moon and beyond.
Robotic explorers gather data to help scientists understand how the planets formed, what triggered different evolutionary paths among planets, and how Earth formed, evolved, and became hab-itable. To search for evidence of life beyond Earth, scientists use this data to map zones of habitability, study the chemistry of alien worlds, and unveil the processes that lead to conditions necessary for life.
Through the Near Earth Object Observation Program, NASA identifies and categorizes asteroids and comets that come near Earth. Every day, a hundred tons of interplanetary particles drift down to Earth’s surface, mostly in the form of dust particles.
Approximately every 100 years, rocky or iron asteroids larger than 164 feet in diameter crash to Earth, causing damage like craters and tidal waves, and about every few hundred thousand years, an asteroid larger than a kilome-ter threatens Earth. In the extremely unlikely event that such a large object threatens to collide with Earth, NASA’s goal is to provide an early identification of these hazardous objects as far in advance (perhaps years) as possible.
Risks to Achieving Sub-goal 3COf primary concern for Planetary Science is the reduction in Expendable Launch Vehicle (ELV) options. Over
the course of the last decade, the Delta II has been the workhorse for the Science Mission Directorate (SMD). Its loss leaves only larger and costlier evolved ELVs (e.g., the Delta IV and Atlas V) for many of the missions identified in the NASA Science Plan or much smaller launch vehicles with significantly reduced capabilities for missions such as those in the Discovery or New Frontiers Program. NASA is aggressively exploring options to maintain a vital flight program, including the development of dual payload launch capability and alternate launch providers for mid-range planetary payloads.
MSL has suffered a launch slip to October or November 2011. The funding for this delay has largely affected activities within the Mars Exploration Program such as the Mars technology and future mission concept develop-ments. Impacts to non-Mars programs have been kept to a minimum without the need for a delay or cancellation of approved missions now under development. However, if significant additional funding is needed to overcome persistent technical problems, other missions in development may be delayed.
9For more information on NASA missions, please see NASA’s Missions at a Glance, located in the Other Accompanying Information section of this document.
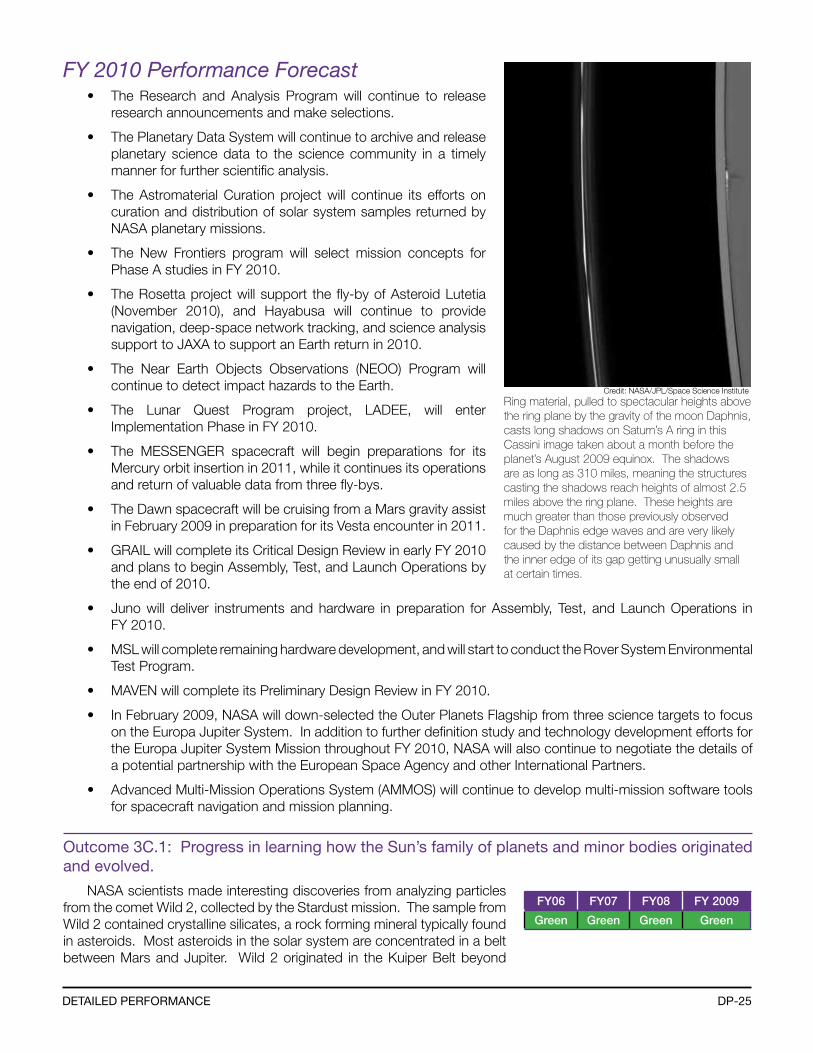
DP-25DetaileD Performance
FY 2010 Performance Forecast• The Research and Analysis Program will continue to release
research announcements and make selections.
• The Planetary Data System will continue to archive and release planetary science data to the science community in a timely manner for further scientific analysis.
• The Astromaterial Curation project will continue its efforts on curation and distribution of solar system samples returned by NASA planetary missions.
• The New Frontiers program will select mission concepts for Phase A studies in FY 2010.
• The Rosetta project will support the fly-by of Asteroid Lutetia (November 2010), and Hayabusa will continue to provide navigation, deep-space network tracking, and science analysis support to JAXA to support an Earth return in 2010.
• The Near Earth Objects Observations (NEOO) Program will continue to detect impact hazards to the Earth.
• The Lunar Quest Program project, LADEE, will enter Implementation Phase in FY 2010.
• The MESSENGER spacecraft will begin preparations for its Mercury orbit insertion in 2011, while it continues its operations and return of valuable data from three fly-bys.
• The Dawn spacecraft will be cruising from a Mars gravity assist in February 2009 in preparation for its Vesta encounter in 2011.
• GRAIL will complete its Critical Design Review in early FY 2010 and plans to begin Assembly, Test, and Launch Operations by the end of 2010.
• Juno will deliver instruments and hardware in preparation for Assembly, Test, and Launch Operations in FY 2010.
• MSL will complete remaining hardware development, and will start to conduct the Rover System Environmental Test Program.
• MAVEN will complete its Preliminary Design Review in FY 2010.
• In February 2009, NASA will down-selected the Outer Planets Flagship from three science targets to focus on the Europa Jupiter System. In addition to further definition study and technology development efforts for the Europa Jupiter System Mission throughout FY 2010, NASA will also continue to negotiate the details of a potential partnership with the European Space Agency and other International Partners.
• Advanced Multi-Mission Operations System (AMMOS) will continue to develop multi-mission software tools for spacecraft navigation and mission planning.
outcome 3c.1: Progress in learning how the Sun’s family of planets and minor bodies originated and evolved.
NASA scientists made interesting discoveries from analyzing particles from the comet Wild 2, collected by the Stardust mission. The sample from Wild 2 contained crystalline silicates, a rock forming mineral typically found in asteroids. Most asteroids in the solar system are concentrated in a belt between Mars and Jupiter. Wild 2 originated in the Kuiper Belt beyond
Ring material, pulled to spectacular heights above the ring plane by the gravity of the moon Daphnis, casts long shadows on Saturn’s A ring in this Cassini image taken about a month before the planet’s August 2009 equinox. The shadows are as long as 310 miles, meaning the structures casting the shadows reach heights of almost 2.5 miles above the ring plane. These heights are much greater than those previously observed for the Daphnis edge waves and are very likely caused by the distance between Daphnis and the inner edge of its gap getting unusually small at certain times.
FY06 FY07 FY08 FY 2009
Green Green Green Green
Credit: NASA/JPL/Space Science Institute
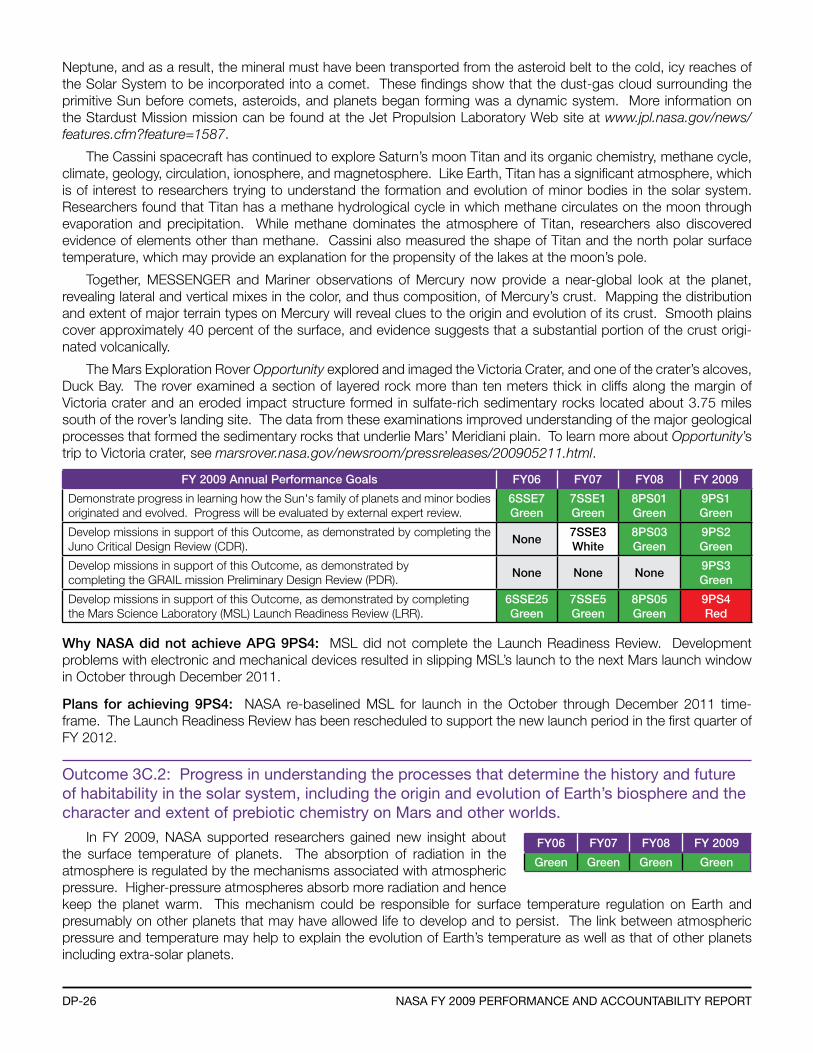
DP-26 naSa fY 2009 Performance anD accountabilitY rePort
Neptune, and as a result, the mineral must have been transported from the asteroid belt to the cold, icy reaches of the Solar System to be incorporated into a comet. These findings show that the dust-gas cloud surrounding the primitive Sun before comets, asteroids, and planets began forming was a dynamic system. More information on the Stardust Mission mission can be found at the Jet Propulsion Laboratory Web site at www.jpl.nasa.gov/news/features.cfm?feature=1587.
The Cassini spacecraft has continued to explore Saturn’s moon Titan and its organic chemistry, methane cycle, climate, geology, circulation, ionosphere, and magnetosphere. Like Earth, Titan has a significant atmosphere, which is of interest to researchers trying to understand the formation and evolution of minor bodies in the solar system. Researchers found that Titan has a methane hydrological cycle in which methane circulates on the moon through evaporation and precipitation. While methane dominates the atmosphere of Titan, researchers also discovered evidence of elements other than methane. Cassini also measured the shape of Titan and the north polar surface temperature, which may provide an explanation for the propensity of the lakes at the moon’s pole.
Together, MESSENGER and Mariner observations of Mercury now provide a near-global look at the planet, revealing lateral and vertical mixes in the color, and thus composition, of Mercury’s crust. Mapping the distribution and extent of major terrain types on Mercury will reveal clues to the origin and evolution of its crust. Smooth plains cover approximately 40 percent of the surface, and evidence suggests that a substantial portion of the crust origi-nated volcanically.
The Mars Exploration Rover Opportunity explored and imaged the Victoria Crater, and one of the crater’s alcoves, Duck Bay. The rover examined a section of layered rock more than ten meters thick in cliffs along the margin of Victoria crater and an eroded impact structure formed in sulfate-rich sedimentary rocks located about 3.75 miles south of the rover’s landing site. The data from these examinations improved understanding of the major geological processes that formed the sedimentary rocks that underlie Mars’ Meridiani plain. To learn more about Opportunity’s trip to Victoria crater, see marsrover.nasa.gov/newsroom/pressreleases/200905211.html.
FY 2009 Annual Performance Goals FY06 FY07 FY08 FY 2009
Demonstrate progress in learning how the Sun's family of planets and minor bodies originated and evolved. Progress will be evaluated by external expert review.
6SSE7Green
7SSE1Green
8PS01Green
9PS1Green
Develop missions in support of this Outcome, as demonstrated by completing the Juno Critical Design Review (CDR).
None7SSE3White
8PS03Green
9PS2Green
Develop missions in support of this Outcome, as demonstrated by completing the GRAIL mission Preliminary Design Review (PDR).
None None None9PS3Green
Develop missions in support of this Outcome, as demonstrated by completing the Mars Science Laboratory (MSL) Launch Readiness Review (LRR).
6SSE25Green
7SSE5Green
8PS05Green
9PS4Red
Why NASA did not achieve APG 9PS4: MSL did not complete the Launch Readiness Review. Development problems with electronic and mechanical devices resulted in slipping MSL’s launch to the next Mars launch window in October through December 2011.
Plans for achieving 9PS4: NASA re-baselined MSL for launch in the October through December 2011 time-frame. The Launch Readiness Review has been rescheduled to support the new launch period in the first quarter of FY 2012.
outcome 3c.2: Progress in understanding the processes that determine the history and future of habitability in the solar system, including the origin and evolution of earth’s biosphere and the character and extent of prebiotic chemistry on mars and other worlds.
In FY 2009, NASA supported researchers gained new insight about the surface temperature of planets. The absorption of radiation in the atmosphere is regulated by the mechanisms associated with atmospheric pressure. Higher-pressure atmospheres absorb more radiation and hence keep the planet warm. This mechanism could be responsible for surface temperature regulation on Earth and presumably on other planets that may have allowed life to develop and to persist. The link between atmospheric pressure and temperature may help to explain the evolution of Earth’s temperature as well as that of other planets including extra-solar planets.
FY06 FY07 FY08 FY 2009
Green Green Green Green
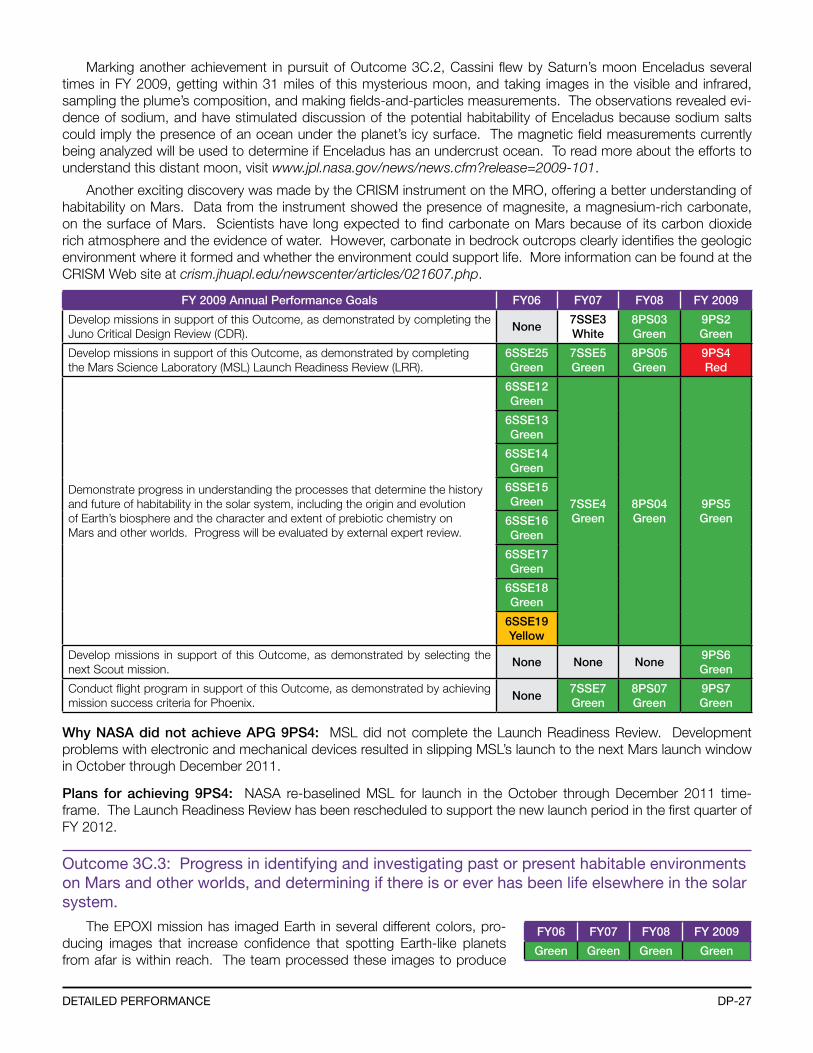
DP-27DetaileD Performance
Marking another achievement in pursuit of Outcome 3C.2, Cassini flew by Saturn’s moon Enceladus several times in FY 2009, getting within 31 miles of this mysterious moon, and taking images in the visible and infrared, sampling the plume’s composition, and making fields-and-particles measurements. The observations revealed evi-dence of sodium, and have stimulated discussion of the potential habitability of Enceladus because sodium salts could imply the presence of an ocean under the planet’s icy surface. The magnetic field measurements currently being analyzed will be used to determine if Enceladus has an undercrust ocean. To read more about the efforts to understand this distant moon, visit www.jpl.nasa.gov/news/news.cfm?release=2009-101.
Another exciting discovery was made by the CRISM instrument on the MRO, offering a better understanding of habitability on Mars. Data from the instrument showed the presence of magnesite, a magnesium-rich carbonate, on the surface of Mars. Scientists have long expected to find carbonate on Mars because of its carbon dioxide rich atmosphere and the evidence of water. However, carbonate in bedrock outcrops clearly identifies the geologic environment where it formed and whether the environment could support life. More information can be found at the CRISM Web site at crism.jhuapl.edu/newscenter/articles/021607.php.
FY 2009 Annual Performance Goals FY06 FY07 FY08 FY 2009
Develop missions in support of this Outcome, as demonstrated by completing the Juno Critical Design Review (CDR).
None7SSE3White
8PS03Green
9PS2Green
Develop missions in support of this Outcome, as demonstrated by completing the Mars Science Laboratory (MSL) Launch Readiness Review (LRR).
6SSE25Green
7SSE5Green
8PS05Green
9PS4Red
Demonstrate progress in understanding the processes that determine the history and future of habitability in the solar system, including the origin and evolution of Earth’s biosphere and the character and extent of prebiotic chemistry on Mars and other worlds. Progress will be evaluated by external expert review.
6SSE12Green
7SSE4Green
8PS04Green
9PS5Green
6SSE13Green
6SSE14Green
6SSE15Green
6SSE16Green
6SSE17Green
6SSE18Green
6SSE19Yellow
Develop missions in support of this Outcome, as demonstrated by selecting the next Scout mission.
None None None9PS6Green
Conduct flight program in support of this Outcome, as demonstrated by achieving mission success criteria for Phoenix.
None7SSE7Green
8PS07Green
9PS7Green
Why NASA did not achieve APG 9PS4: MSL did not complete the Launch Readiness Review. Development problems with electronic and mechanical devices resulted in slipping MSL’s launch to the next Mars launch window in October through December 2011.
Plans for achieving 9PS4: NASA re-baselined MSL for launch in the October through December 2011 time-frame. The Launch Readiness Review has been rescheduled to support the new launch period in the first quarter of FY 2012.
outcome 3c.3: Progress in identifying and investigating past or present habitable environments on mars and other worlds, and determining if there is or ever has been life elsewhere in the solar system.
The EPOXI mission has imaged Earth in several different colors, pro-ducing images that increase confidence that spotting Earth-like planets from afar is within reach. The team processed these images to produce
FY06 FY07 FY08 FY 2009
Green Green Green Green
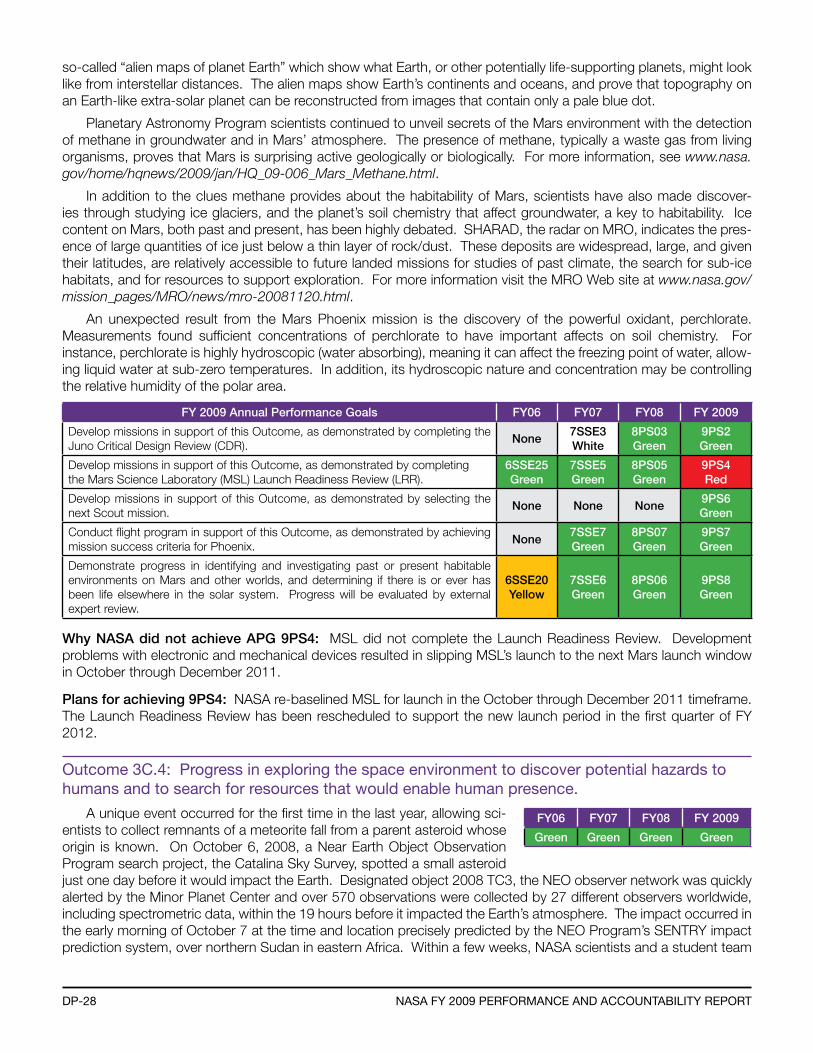
DP-28 naSa fY 2009 Performance anD accountabilitY rePort
so-called “alien maps of planet Earth” which show what Earth, or other potentially life-supporting planets, might look like from interstellar distances. The alien maps show Earth’s continents and oceans, and prove that topography on an Earth-like extra-solar planet can be reconstructed from images that contain only a pale blue dot.
Planetary Astronomy Program scientists continued to unveil secrets of the Mars environment with the detection of methane in groundwater and in Mars’ atmosphere. The presence of methane, typically a waste gas from living organisms, proves that Mars is surprising active geologically or biologically. For more information, see www.nasa.gov/home/hqnews/2009/jan/HQ_09-006_Mars_Methane.html.
In addition to the clues methane provides about the habitability of Mars, scientists have also made discover-ies through studying ice glaciers, and the planet’s soil chemistry that affect groundwater, a key to habitability. Ice content on Mars, both past and present, has been highly debated. SHARAD, the radar on MRO, indicates the pres-ence of large quantities of ice just below a thin layer of rock/dust. These deposits are widespread, large, and given their latitudes, are relatively accessible to future landed missions for studies of past climate, the search for sub-ice habitats, and for resources to support exploration. For more information visit the MRO Web site at www.nasa.gov/mission_pages/MRO/news/mro-20081120.html.
An unexpected result from the Mars Phoenix mission is the discovery of the powerful oxidant, perchlorate. Measurements found sufficient concentrations of perchlorate to have important affects on soil chemistry. For instance, perchlorate is highly hydroscopic (water absorbing), meaning it can affect the freezing point of water, allow-ing liquid water at sub-zero temperatures. In addition, its hydroscopic nature and concentration may be controlling the relative humidity of the polar area.
FY 2009 Annual Performance Goals FY06 FY07 FY08 FY 2009
Develop missions in support of this Outcome, as demonstrated by completing the Juno Critical Design Review (CDR).
None7SSE3White
8PS03Green
9PS2Green
Develop missions in support of this Outcome, as demonstrated by completing the Mars Science Laboratory (MSL) Launch Readiness Review (LRR).
6SSE25Green
7SSE5Green
8PS05Green
9PS4Red
Develop missions in support of this Outcome, as demonstrated by selecting the next Scout mission.
None None None9PS6Green
Conduct flight program in support of this Outcome, as demonstrated by achieving mission success criteria for Phoenix.
None7SSE7Green
8PS07Green
9PS7Green
Demonstrate progress in identifying and investigating past or present habitable environments on Mars and other worlds, and determining if there is or ever has been life elsewhere in the solar system. Progress will be evaluated by external expert review.
6SSE20Yellow
7SSE6Green
8PS06Green
9PS8Green
Why NASA did not achieve APG 9PS4: MSL did not complete the Launch Readiness Review. Development problems with electronic and mechanical devices resulted in slipping MSL’s launch to the next Mars launch window in October through December 2011.
Plans for achieving 9PS4: NASA re-baselined MSL for launch in the October through December 2011 timeframe. The Launch Readiness Review has been rescheduled to support the new launch period in the first quarter of FY 2012.
outcome 3c.4: Progress in exploring the space environment to discover potential hazards to humans and to search for resources that would enable human presence.
A unique event occurred for the first time in the last year, allowing sci-entists to collect remnants of a meteorite fall from a parent asteroid whose origin is known. On October 6, 2008, a Near Earth Object Observation Program search project, the Catalina Sky Survey, spotted a small asteroid just one day before it would impact the Earth. Designated object 2008 TC3, the NEO observer network was quickly alerted by the Minor Planet Center and over 570 observations were collected by 27 different observers worldwide, including spectrometric data, within the 19 hours before it impacted the Earth’s atmosphere. The impact occurred in the early morning of October 7 at the time and location precisely predicted by the NEO Program’s SENTRY impact prediction system, over northern Sudan in eastern Africa. Within a few weeks, NASA scientists and a student team
FY06 FY07 FY08 FY 2009
Green Green Green Green
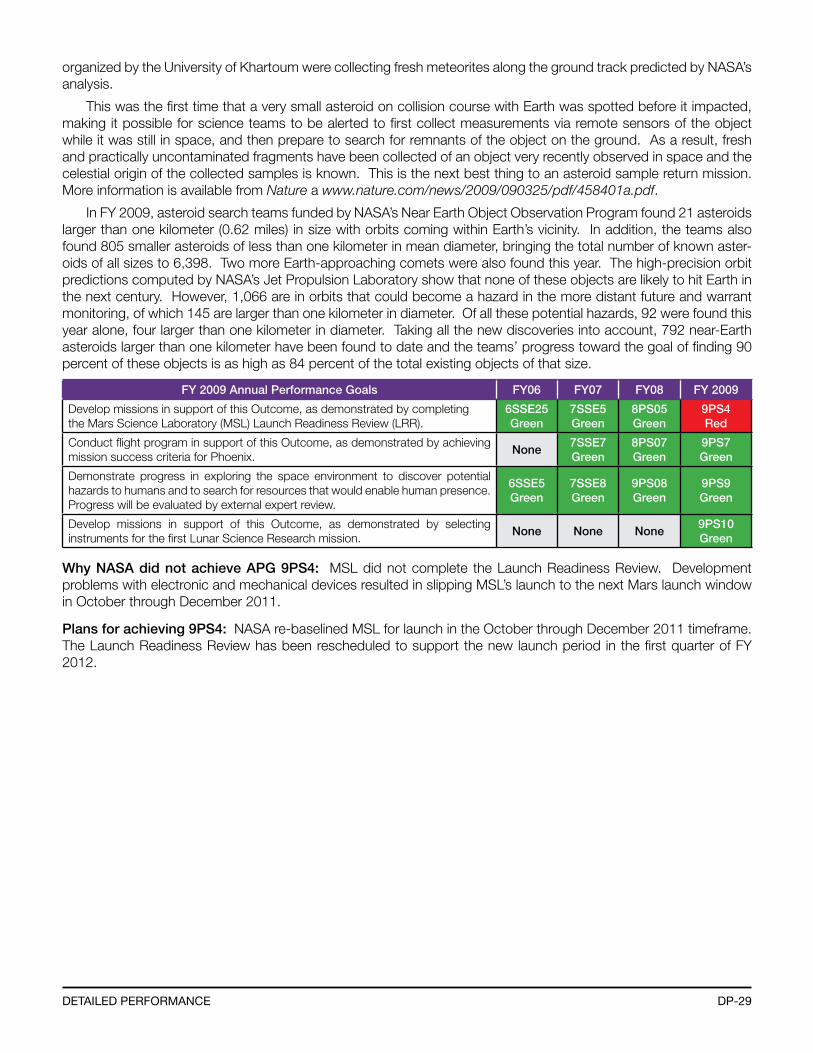
DP-29DetaileD Performance
organized by the University of Khartoum were collecting fresh meteorites along the ground track predicted by NASA’s analysis.
This was the first time that a very small asteroid on collision course with Earth was spotted before it impacted, making it possible for science teams to be alerted to first collect measurements via remote sensors of the object while it was still in space, and then prepare to search for remnants of the object on the ground. As a result, fresh and practically uncontaminated fragments have been collected of an object very recently observed in space and the celestial origin of the collected samples is known. This is the next best thing to an asteroid sample return mission. More information is available from Nature a www.nature.com/news/2009/090325/pdf/458401a.pdf.
In FY 2009, asteroid search teams funded by NASA’s Near Earth Object Observation Program found 21 asteroids larger than one kilometer (0.62 miles) in size with orbits coming within Earth’s vicinity. In addition, the teams also found 805 smaller asteroids of less than one kilometer in mean diameter, bringing the total number of known aster-oids of all sizes to 6,398. Two more Earth-approaching comets were also found this year. The high-precision orbit predictions computed by NASA’s Jet Propulsion Laboratory show that none of these objects are likely to hit Earth in the next century. However, 1,066 are in orbits that could become a hazard in the more distant future and warrant monitoring, of which 145 are larger than one kilometer in diameter. Of all these potential hazards, 92 were found this year alone, four larger than one kilometer in diameter. Taking all the new discoveries into account, 792 near-Earth asteroids larger than one kilometer have been found to date and the teams’ progress toward the goal of finding 90 percent of these objects is as high as 84 percent of the total existing objects of that size.
FY 2009 Annual Performance Goals FY06 FY07 FY08 FY 2009
Develop missions in support of this Outcome, as demonstrated by completing the Mars Science Laboratory (MSL) Launch Readiness Review (LRR).
6SSE25Green
7SSE5Green
8PS05Green
9PS4Red
Conduct flight program in support of this Outcome, as demonstrated by achieving mission success criteria for Phoenix.
None7SSE7Green
8PS07Green
9PS7Green
Demonstrate progress in exploring the space environment to discover potential hazards to humans and to search for resources that would enable human presence. Progress will be evaluated by external expert review.
6SSE5Green
7SSE8Green
9PS08Green
9PS9Green
Develop missions in support of this Outcome, as demonstrated by selecting instruments for the first Lunar Science Research mission.
None None None9PS10Green
Why NASA did not achieve APG 9PS4: MSL did not complete the Launch Readiness Review. Development problems with electronic and mechanical devices resulted in slipping MSL’s launch to the next Mars launch window in October through December 2011.
Plans for achieving 9PS4: NASA re-baselined MSL for launch in the October through December 2011 timeframe. The Launch Readiness Review has been rescheduled to support the new launch period in the first quarter of FY 2012.
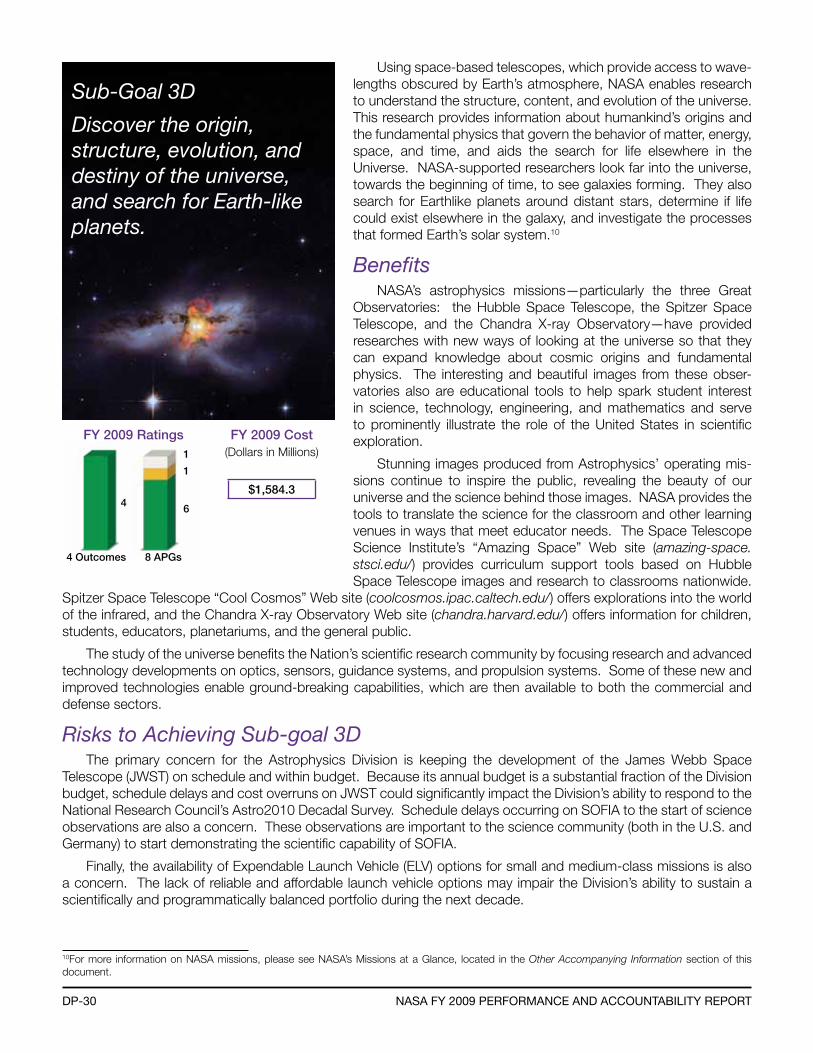
DP-30 naSa fY 2009 Performance anD accountabilitY rePort
Sub-Goal 3D
Discover the origin, structure, evolution, and destiny of the universe, and search for Earth-like planets.
4 Outcomes 8 APGs
4 6
FY 2009 Ratings FY 2009 Cost(Dollars in Millions)
$1,584.3
1
1
Using space-based telescopes, which provide access to wave-lengths obscured by Earth’s atmosphere, NASA enables research to understand the structure, content, and evolution of the universe. This research provides information about humankind’s origins and the fundamental physics that govern the behavior of matter, energy, space, and time, and aids the search for life elsewhere in the Universe. NASA-supported researchers look far into the universe, towards the beginning of time, to see galaxies forming. They also search for Earthlike planets around distant stars, determine if life could exist elsewhere in the galaxy, and investigate the processes that formed Earth’s solar system.10
BenefitsNASA’s astrophysics missions—particularly the three Great
Observatories: the Hubble Space Telescope, the Spitzer Space Telescope, and the Chandra X-ray Observatory—have provided researches with new ways of looking at the universe so that they can expand knowledge about cosmic origins and fundamental physics. The interesting and beautiful images from these obser-vatories also are educational tools to help spark student interest in science, technology, engineering, and mathematics and serve to prominently illustrate the role of the United States in scientific exploration.
Stunning images produced from Astrophysics’ operating mis-sions continue to inspire the public, revealing the beauty of our universe and the science behind those images. NASA provides the tools to translate the science for the classroom and other learning venues in ways that meet educator needs. The Space Telescope Science Institute’s “Amazing Space” Web site (amazing-space.stsci.edu/) provides curriculum support tools based on Hubble Space Telescope images and research to classrooms nationwide.
Spitzer Space Telescope “Cool Cosmos” Web site (coolcosmos.ipac.caltech.edu/) offers explorations into the world of the infrared, and the Chandra X-ray Observatory Web site (chandra.harvard.edu/) offers information for children, students, educators, planetariums, and the general public.
The study of the universe benefits the Nation’s scientific research community by focusing research and advanced technology developments on optics, sensors, guidance systems, and propulsion systems. Some of these new and improved technologies enable ground-breaking capabilities, which are then available to both the commercial and defense sectors.
Risks to Achieving Sub-goal 3DThe primary concern for the Astrophysics Division is keeping the development of the James Webb Space
Telescope (JWST) on schedule and within budget. Because its annual budget is a substantial fraction of the Division budget, schedule delays and cost overruns on JWST could significantly impact the Division’s ability to respond to the National Research Council’s Astro2010 Decadal Survey. Schedule delays occurring on SOFIA to the start of science observations are also a concern. These observations are important to the science community (both in the U.S. and Germany) to start demonstrating the scientific capability of SOFIA.
Finally, the availability of Expendable Launch Vehicle (ELV) options for small and medium-class missions is also a concern. The lack of reliable and affordable launch vehicle options may impair the Division’s ability to sustain a scientifically and programmatically balanced portfolio during the next decade.
10For more information on NASA missions, please see NASA’s Missions at a Glance, located in the Other Accompanying Information section of this document.
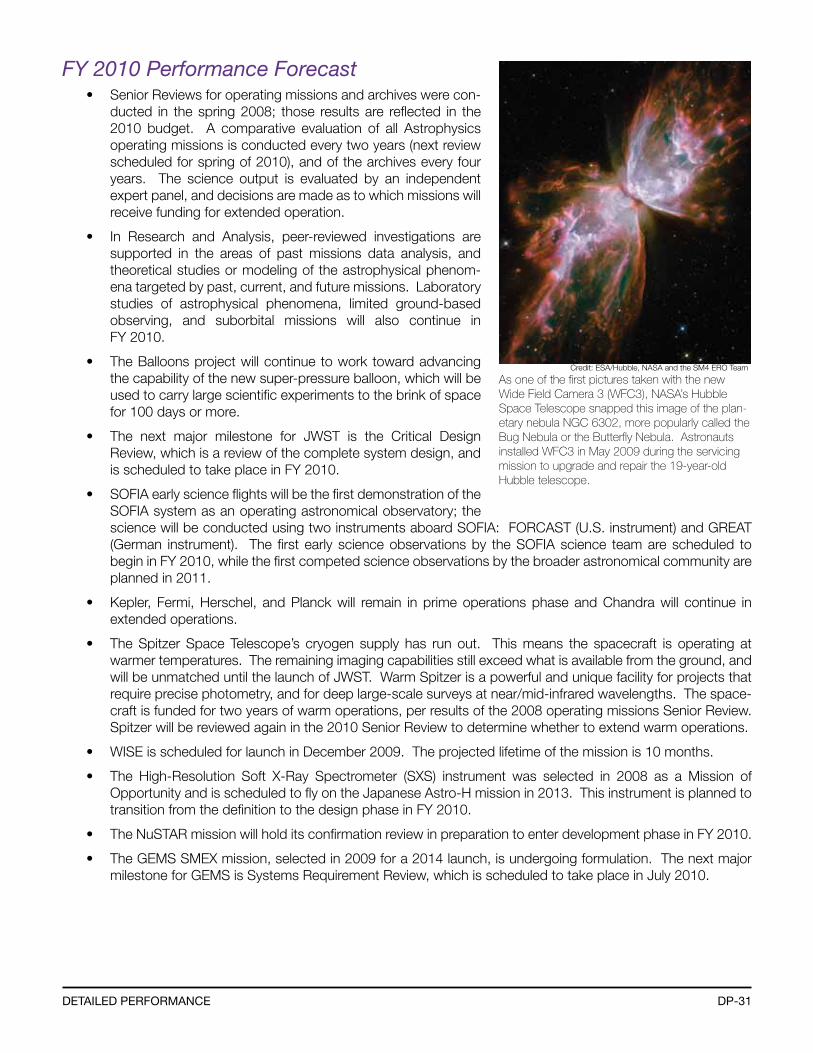
DP-31DetaileD Performance
FY 2010 Performance Forecast• Senior Reviews for operating missions and archives were con-
ducted in the spring 2008; those results are reflected in the 2010 budget. A comparative evaluation of all Astrophysics operating missions is conducted every two years (next review scheduled for spring of 2010), and of the archives every four years. The science output is evaluated by an independent expert panel, and decisions are made as to which missions will receive funding for extended operation.
• In Research and Analysis, peer-reviewed investigations are supported in the areas of past missions data analysis, and theoretical studies or modeling of the astrophysical phenom-ena targeted by past, current, and future missions. Laboratory studies of astrophysical phenomena, limited ground-based observing, and suborbital missions will also continue in FY 2010.
• The Balloons project will continue to work toward advancing the capability of the new super-pressure balloon, which will be used to carry large scientific experiments to the brink of space for 100 days or more.
• The next major milestone for JWST is the Critical Design Review, which is a review of the complete system design, and is scheduled to take place in FY 2010.
• SOFIA early science flights will be the first demonstration of the SOFIA system as an operating astronomical observatory; the science will be conducted using two instruments aboard SOFIA: FORCAST (U.S. instrument) and GREAT (German instrument). The first early science observations by the SOFIA science team are scheduled to begin in FY 2010, while the first competed science observations by the broader astronomical community are planned in 2011.
• Kepler, Fermi, Herschel, and Planck will remain in prime operations phase and Chandra will continue in extended operations.
• The Spitzer Space Telescope’s cryogen supply has run out. This means the spacecraft is operating at warmer temperatures. The remaining imaging capabilities still exceed what is available from the ground, and will be unmatched until the launch of JWST. Warm Spitzer is a powerful and unique facility for projects that require precise photometry, and for deep large-scale surveys at near/mid-infrared wavelengths. The space-craft is funded for two years of warm operations, per results of the 2008 operating missions Senior Review. Spitzer will be reviewed again in the 2010 Senior Review to determine whether to extend warm operations.
• WISE is scheduled for launch in December 2009. The projected lifetime of the mission is 10 months.
• The High-Resolution Soft X-Ray Spectrometer (SXS) instrument was selected in 2008 as a Mission of Opportunity and is scheduled to fly on the Japanese Astro-H mission in 2013. This instrument is planned to transition from the definition to the design phase in FY 2010.
• The NuSTAR mission will hold its confirmation review in preparation to enter development phase in FY 2010.
• The GEMS SMEX mission, selected in 2009 for a 2014 launch, is undergoing formulation. The next major milestone for GEMS is Systems Requirement Review, which is scheduled to take place in July 2010.
As one of the first pictures taken with the new Wide Field Camera 3 (WFC3), NASA’s Hubble Space Telescope snapped this image of the plan-etary nebula NGC 6302, more popularly called the Bug Nebula or the Butterfly Nebula. Astronauts installed WFC3 in May 2009 during the servicing mission to upgrade and repair the 19-year-old Hubble telescope.
Credit: ESA/Hubble, NASA and the SM4 ERO Team
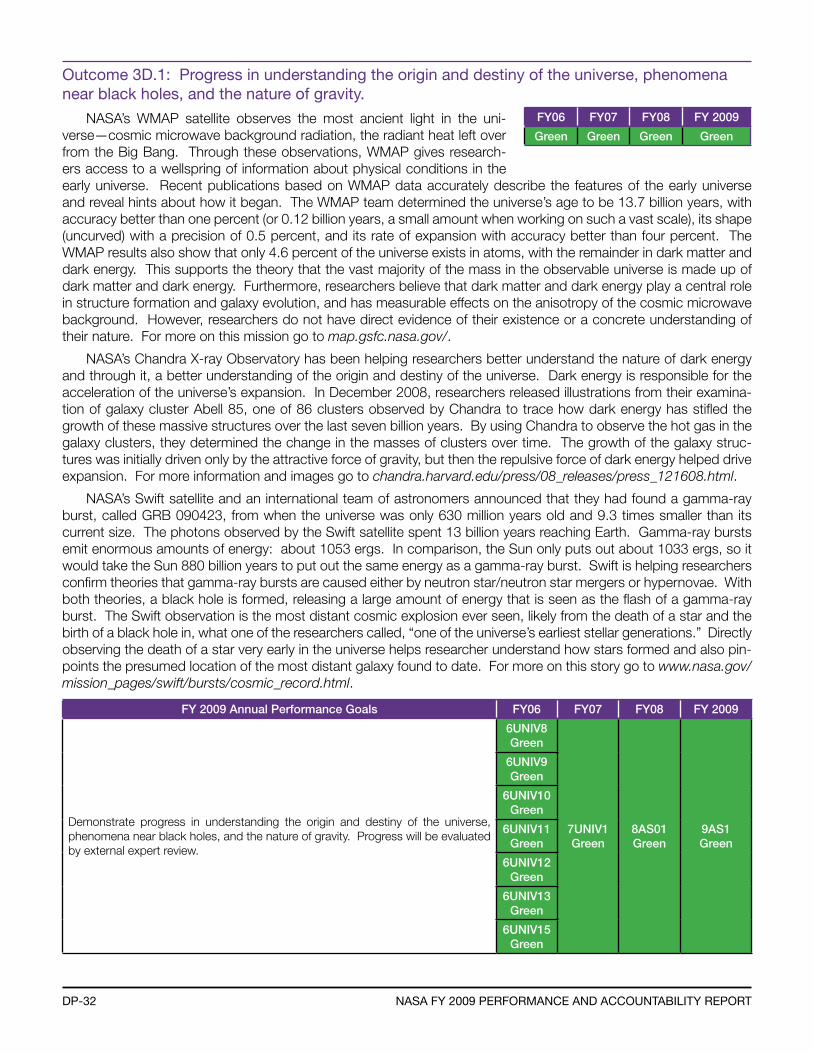
DP-32 naSa fY 2009 Performance anD accountabilitY rePort
outcome 3D.1: Progress in understanding the origin and destiny of the universe, phenomena near black holes, and the nature of gravity.
NASA’s WMAP satellite observes the most ancient light in the uni-verse—cosmic microwave background radiation, the radiant heat left over from the Big Bang. Through these observations, WMAP gives research-ers access to a wellspring of information about physical conditions in the early universe. Recent publications based on WMAP data accurately describe the features of the early universe and reveal hints about how it began. The WMAP team determined the universe’s age to be 13.7 billion years, with accuracy better than one percent (or 0.12 billion years, a small amount when working on such a vast scale), its shape (uncurved) with a precision of 0.5 percent, and its rate of expansion with accuracy better than four percent. The WMAP results also show that only 4.6 percent of the universe exists in atoms, with the remainder in dark matter and dark energy. This supports the theory that the vast majority of the mass in the observable universe is made up of dark matter and dark energy. Furthermore, researchers believe that dark matter and dark energy play a central role in structure formation and galaxy evolution, and has measurable effects on the anisotropy of the cosmic microwave background. However, researchers do not have direct evidence of their existence or a concrete understanding of their nature. For more on this mission go to map.gsfc.nasa.gov/.
NASA’s Chandra X-ray Observatory has been helping researchers better understand the nature of dark energy and through it, a better understanding of the origin and destiny of the universe. Dark energy is responsible for the acceleration of the universe’s expansion. In December 2008, researchers released illustrations from their examina-tion of galaxy cluster Abell 85, one of 86 clusters observed by Chandra to trace how dark energy has stifled the growth of these massive structures over the last seven billion years. By using Chandra to observe the hot gas in the galaxy clusters, they determined the change in the masses of clusters over time. The growth of the galaxy struc-tures was initially driven only by the attractive force of gravity, but then the repulsive force of dark energy helped drive expansion. For more information and images go to chandra.harvard.edu/press/08_releases/press_121608.html.
NASA’s Swift satellite and an international team of astronomers announced that they had found a gamma-ray burst, called GRB 090423, from when the universe was only 630 million years old and 9.3 times smaller than its current size. The photons observed by the Swift satellite spent 13 billion years reaching Earth. Gamma-ray bursts emit enormous amounts of energy: about 1053 ergs. In comparison, the Sun only puts out about 1033 ergs, so it would take the Sun 880 billion years to put out the same energy as a gamma-ray burst. Swift is helping researchers confirm theories that gamma-ray bursts are caused either by neutron star/neutron star mergers or hypernovae. With both theories, a black hole is formed, releasing a large amount of energy that is seen as the flash of a gamma-ray burst. The Swift observation is the most distant cosmic explosion ever seen, likely from the death of a star and the birth of a black hole in, what one of the researchers called, “one of the universe’s earliest stellar generations.” Directly observing the death of a star very early in the universe helps researcher understand how stars formed and also pin-points the presumed location of the most distant galaxy found to date. For more on this story go to www.nasa.gov/mission_pages/swift/bursts/cosmic_record.html.
FY 2009 Annual Performance Goals FY06 FY07 FY08 FY 2009
Demonstrate progress in understanding the origin and destiny of the universe, phenomena near black holes, and the nature of gravity. Progress will be evaluated by external expert review.
6UNIV8Green
7UNIV1Green
8AS01Green
9AS1Green
6UNIV9Green
6UNIV10Green
6UNIV11Green
6UNIV12Green
6UNIV13Green
6UNIV15Green
FY06 FY07 FY08 FY 2009
Green Green Green Green
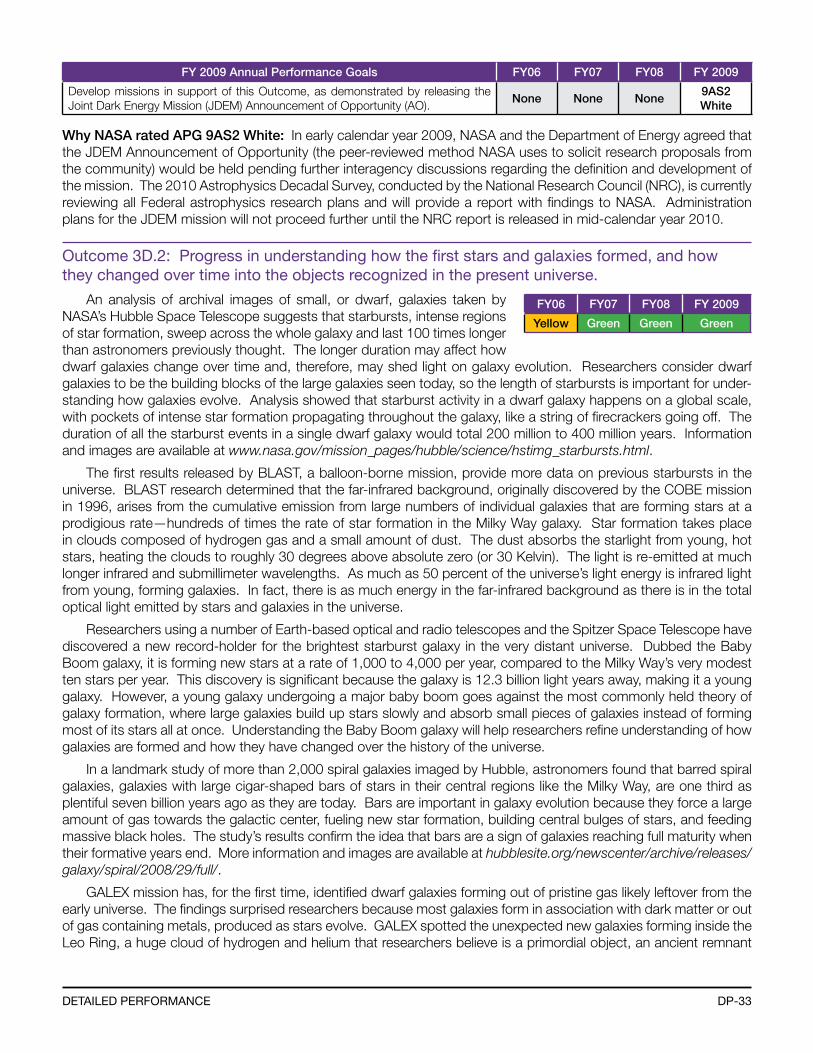
DP-33DetaileD Performance
FY 2009 Annual Performance Goals FY06 FY07 FY08 FY 2009
Develop missions in support of this Outcome, as demonstrated by releasing the Joint Dark Energy Mission (JDEM) Announcement of Opportunity (AO).
None None None9AS2White
Why NASA rated APG 9AS2 White: In early calendar year 2009, NASA and the Department of Energy agreed that the JDEM Announcement of Opportunity (the peer-reviewed method NASA uses to solicit research proposals from the community) would be held pending further interagency discussions regarding the definition and development of the mission. The 2010 Astrophysics Decadal Survey, conducted by the National Research Council (NRC), is currently reviewing all Federal astrophysics research plans and will provide a report with findings to NASA. Administration plans for the JDEM mission will not proceed further until the NRC report is released in mid-calendar year 2010.
outcome 3D.2: Progress in understanding how the first stars and galaxies formed, and how they changed over time into the objects recognized in the present universe.
An analysis of archival images of small, or dwarf, galaxies taken by NASA’s Hubble Space Telescope suggests that starbursts, intense regions of star formation, sweep across the whole galaxy and last 100 times longer than astronomers previously thought. The longer duration may affect how dwarf galaxies change over time and, therefore, may shed light on galaxy evolution. Researchers consider dwarf galaxies to be the building blocks of the large galaxies seen today, so the length of starbursts is important for under-standing how galaxies evolve. Analysis showed that starburst activity in a dwarf galaxy happens on a global scale, with pockets of intense star formation propagating throughout the galaxy, like a string of firecrackers going off. The duration of all the starburst events in a single dwarf galaxy would total 200 million to 400 million years. Information and images are available at www.nasa.gov/mission_pages/hubble/science/hstimg_starbursts.html.
The first results released by BLAST, a balloon-borne mission, provide more data on previous starbursts in the universe. BLAST research determined that the far-infrared background, originally discovered by the COBE mission in 1996, arises from the cumulative emission from large numbers of individual galaxies that are forming stars at a prodigious rate—hundreds of times the rate of star formation in the Milky Way galaxy. Star formation takes place in clouds composed of hydrogen gas and a small amount of dust. The dust absorbs the starlight from young, hot stars, heating the clouds to roughly 30 degrees above absolute zero (or 30 Kelvin). The light is re-emitted at much longer infrared and submillimeter wavelengths. As much as 50 percent of the universe’s light energy is infrared light from young, forming galaxies. In fact, there is as much energy in the far-infrared background as there is in the total optical light emitted by stars and galaxies in the universe.
Researchers using a number of Earth-based optical and radio telescopes and the Spitzer Space Telescope have discovered a new record-holder for the brightest starburst galaxy in the very distant universe. Dubbed the Baby Boom galaxy, it is forming new stars at a rate of 1,000 to 4,000 per year, compared to the Milky Way’s very modest ten stars per year. This discovery is significant because the galaxy is 12.3 billion light years away, making it a young galaxy. However, a young galaxy undergoing a major baby boom goes against the most commonly held theory of galaxy formation, where large galaxies build up stars slowly and absorb small pieces of galaxies instead of forming most of its stars all at once. Understanding the Baby Boom galaxy will help researchers refine understanding of how galaxies are formed and how they have changed over the history of the universe.
In a landmark study of more than 2,000 spiral galaxies imaged by Hubble, astronomers found that barred spiral galaxies, galaxies with large cigar-shaped bars of stars in their central regions like the Milky Way, are one third as plentiful seven billion years ago as they are today. Bars are important in galaxy evolution because they force a large amount of gas towards the galactic center, fueling new star formation, building central bulges of stars, and feeding massive black holes. The study’s results confirm the idea that bars are a sign of galaxies reaching full maturity when their formative years end. More information and images are available at hubblesite.org/newscenter/archive/releases/galaxy/spiral/2008/29/full/.
GALEX mission has, for the first time, identified dwarf galaxies forming out of pristine gas likely leftover from the early universe. The findings surprised researchers because most galaxies form in association with dark matter or out of gas containing metals, produced as stars evolve. GALEX spotted the unexpected new galaxies forming inside the Leo Ring, a huge cloud of hydrogen and helium that researchers believe is a primordial object, an ancient remnant
FY06 FY07 FY08 FY 2009
Yellow Green Green Green
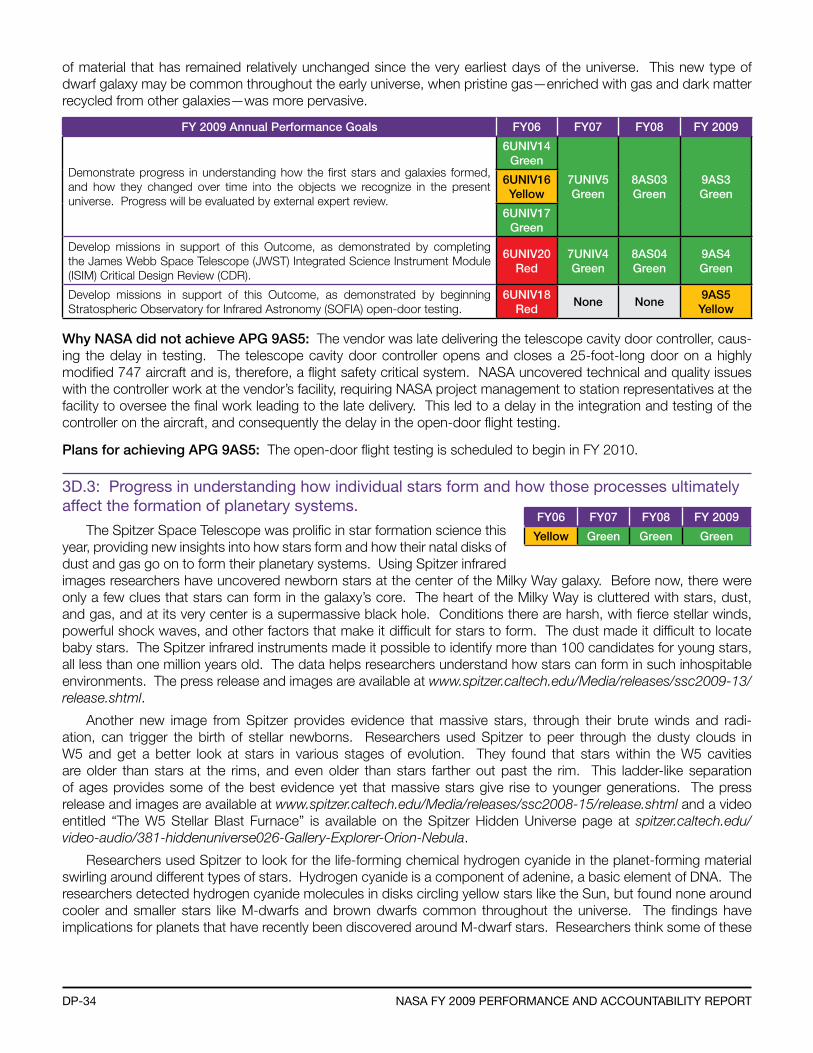
DP-34 naSa fY 2009 Performance anD accountabilitY rePort
of material that has remained relatively unchanged since the very earliest days of the universe. This new type of dwarf galaxy may be common throughout the early universe, when pristine gas—enriched with gas and dark matter recycled from other galaxies—was more pervasive.
FY 2009 Annual Performance Goals FY06 FY07 FY08 FY 2009
Demonstrate progress in understanding how the first stars and galaxies formed, and how they changed over time into the objects we recognize in the present universe. Progress will be evaluated by external expert review.
6UNIV14Green
7UNIV5Green
8AS03Green
9AS3Green
6UNIV16Yellow
6UNIV17Green
Develop missions in support of this Outcome, as demonstrated by completing the James Webb Space Telescope (JWST) Integrated Science Instrument Module (ISIM) Critical Design Review (CDR).
6UNIV20Red
7UNIV4Green
8AS04Green
9AS4Green
Develop missions in support of this Outcome, as demonstrated by beginning Stratospheric Observatory for Infrared Astronomy (SOFIA) open-door testing.
6UNIV18Red
None None9AS5Yellow
Why NASA did not achieve APG 9AS5: The vendor was late delivering the telescope cavity door controller, caus-ing the delay in testing. The telescope cavity door controller opens and closes a 25-foot-long door on a highly modified 747 aircraft and is, therefore, a flight safety critical system. NASA uncovered technical and quality issues with the controller work at the vendor’s facility, requiring NASA project management to station representatives at the facility to oversee the final work leading to the late delivery. This led to a delay in the integration and testing of the controller on the aircraft, and consequently the delay in the open-door flight testing.
Plans for achieving APG 9AS5: The open-door flight testing is scheduled to begin in FY 2010.
3D.3: Progress in understanding how individual stars form and how those processes ultimately affect the formation of planetary systems.
The Spitzer Space Telescope was prolific in star formation science this year, providing new insights into how stars form and how their natal disks of dust and gas go on to form their planetary systems. Using Spitzer infrared images researchers have uncovered newborn stars at the center of the Milky Way galaxy. Before now, there were only a few clues that stars can form in the galaxy’s core. The heart of the Milky Way is cluttered with stars, dust, and gas, and at its very center is a supermassive black hole. Conditions there are harsh, with fierce stellar winds, powerful shock waves, and other factors that make it difficult for stars to form. The dust made it difficult to locate baby stars. The Spitzer infrared instruments made it possible to identify more than 100 candidates for young stars, all less than one million years old. The data helps researchers understand how stars can form in such inhospitable environments. The press release and images are available at www.spitzer.caltech.edu/Media/releases/ssc2009-13/release.shtml.
Another new image from Spitzer provides evidence that massive stars, through their brute winds and radi-ation, can trigger the birth of stellar newborns. Researchers used Spitzer to peer through the dusty clouds in W5 and get a better look at stars in various stages of evolution. They found that stars within the W5 cavities are older than stars at the rims, and even older than stars farther out past the rim. This ladder-like separation of ages provides some of the best evidence yet that massive stars give rise to younger generations. The press release and images are available at www.spitzer.caltech.edu/Media/releases/ssc2008-15/release.shtml and a video entitled “The W5 Stellar Blast Furnace” is available on the Spitzer Hidden Universe page at spitzer.caltech.edu/video-audio/381-hiddenuniverse026-Gallery-Explorer-Orion-Nebula.
Researchers used Spitzer to look for the life-forming chemical hydrogen cyanide in the planet-forming material swirling around different types of stars. Hydrogen cyanide is a component of adenine, a basic element of DNA. The researchers detected hydrogen cyanide molecules in disks circling yellow stars like the Sun, but found none around cooler and smaller stars like M-dwarfs and brown dwarfs common throughout the universe. The findings have implications for planets that have recently been discovered around M-dwarf stars. Researchers think some of these
FY06 FY07 FY08 FY 2009
Yellow Green Green Green
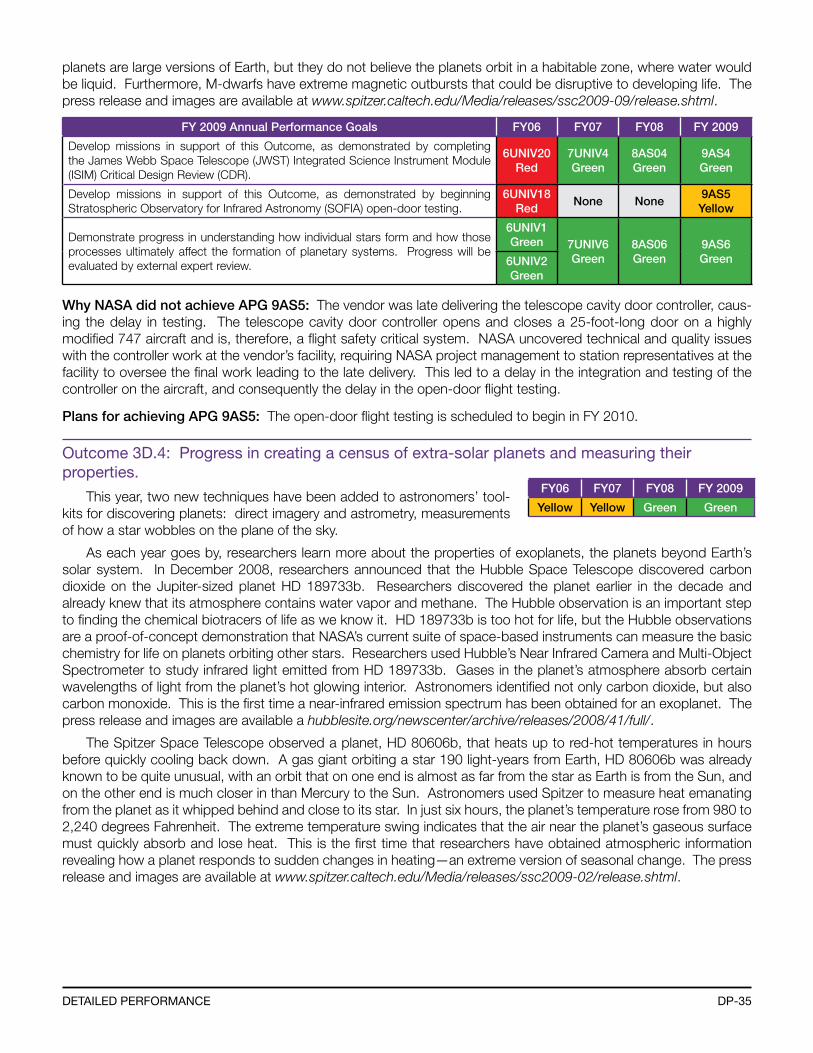
DP-35DetaileD Performance
planets are large versions of Earth, but they do not believe the planets orbit in a habitable zone, where water would be liquid. Furthermore, M-dwarfs have extreme magnetic outbursts that could be disruptive to developing life. The press release and images are available at www.spitzer.caltech.edu/Media/releases/ssc2009-09/release.shtml.
FY 2009 Annual Performance Goals FY06 FY07 FY08 FY 2009
Develop missions in support of this Outcome, as demonstrated by completing the James Webb Space Telescope (JWST) Integrated Science Instrument Module (ISIM) Critical Design Review (CDR).
6UNIV20Red
7UNIV4Green
8AS04Green
9AS4Green
Develop missions in support of this Outcome, as demonstrated by beginning Stratospheric Observatory for Infrared Astronomy (SOFIA) open-door testing.
6UNIV18Red
None None9AS5Yellow
Demonstrate progress in understanding how individual stars form and how those processes ultimately affect the formation of planetary systems. Progress will be evaluated by external expert review.
6UNIV1Green 7UNIV6
Green8AS06Green
9AS6Green6UNIV2
Green
Why NASA did not achieve APG 9AS5: The vendor was late delivering the telescope cavity door controller, caus-ing the delay in testing. The telescope cavity door controller opens and closes a 25-foot-long door on a highly modified 747 aircraft and is, therefore, a flight safety critical system. NASA uncovered technical and quality issues with the controller work at the vendor’s facility, requiring NASA project management to station representatives at the facility to oversee the final work leading to the late delivery. This led to a delay in the integration and testing of the controller on the aircraft, and consequently the delay in the open-door flight testing.
Plans for achieving APG 9AS5: The open-door flight testing is scheduled to begin in FY 2010.
outcome 3D.4: Progress in creating a census of extra-solar planets and measuring their properties.
This year, two new techniques have been added to astronomers’ tool-kits for discovering planets: direct imagery and astrometry, measurements of how a star wobbles on the plane of the sky.
As each year goes by, researchers learn more about the properties of exoplanets, the planets beyond Earth’s solar system. In December 2008, researchers announced that the Hubble Space Telescope discovered carbon dioxide on the Jupiter-sized planet HD 189733b. Researchers discovered the planet earlier in the decade and already knew that its atmosphere contains water vapor and methane. The Hubble observation is an important step to finding the chemical biotracers of life as we know it. HD 189733b is too hot for life, but the Hubble observations are a proof-of-concept demonstration that NASA’s current suite of space-based instruments can measure the basic chemistry for life on planets orbiting other stars. Researchers used Hubble’s Near Infrared Camera and Multi-Object Spectrometer to study infrared light emitted from HD 189733b. Gases in the planet’s atmosphere absorb certain wavelengths of light from the planet’s hot glowing interior. Astronomers identified not only carbon dioxide, but also carbon monoxide. This is the first time a near-infrared emission spectrum has been obtained for an exoplanet. The press release and images are available a hubblesite.org/newscenter/archive/releases/2008/41/full/.
The Spitzer Space Telescope observed a planet, HD 80606b, that heats up to red-hot temperatures in hours before quickly cooling back down. A gas giant orbiting a star 190 light-years from Earth, HD 80606b was already known to be quite unusual, with an orbit that on one end is almost as far from the star as Earth is from the Sun, and on the other end is much closer in than Mercury to the Sun. Astronomers used Spitzer to measure heat emanating from the planet as it whipped behind and close to its star. In just six hours, the planet’s temperature rose from 980 to 2,240 degrees Fahrenheit. The extreme temperature swing indicates that the air near the planet’s gaseous surface must quickly absorb and lose heat. This is the first time that researchers have obtained atmospheric information revealing how a planet responds to sudden changes in heating—an extreme version of seasonal change. The press release and images are available at www.spitzer.caltech.edu/Media/releases/ssc2009-02/release.shtml.
FY06 FY07 FY08 FY 2009
Yellow Yellow Green Green

DP-36 naSa fY 2009 Performance anD accountabilitY rePort
FY 2009 Annual Performance Goals FY06 FY07 FY08 FY 2009
Demonstrate progress in creating a census of extra-solar planets and measuring their properties. Progress will be evaluated by external expert review.
6UNIV3Green
7UNIV7Green
8AS07Green
9AS7Green
6UNIV4Green
6UNIV5Yellow
Develop missions in support of this Outcome, as demonstrated by completing Kepler Launch Readiness Review (LRR).
6UNIV21Yellow
7UNIV8Green
8AS08Green
9AS8Green
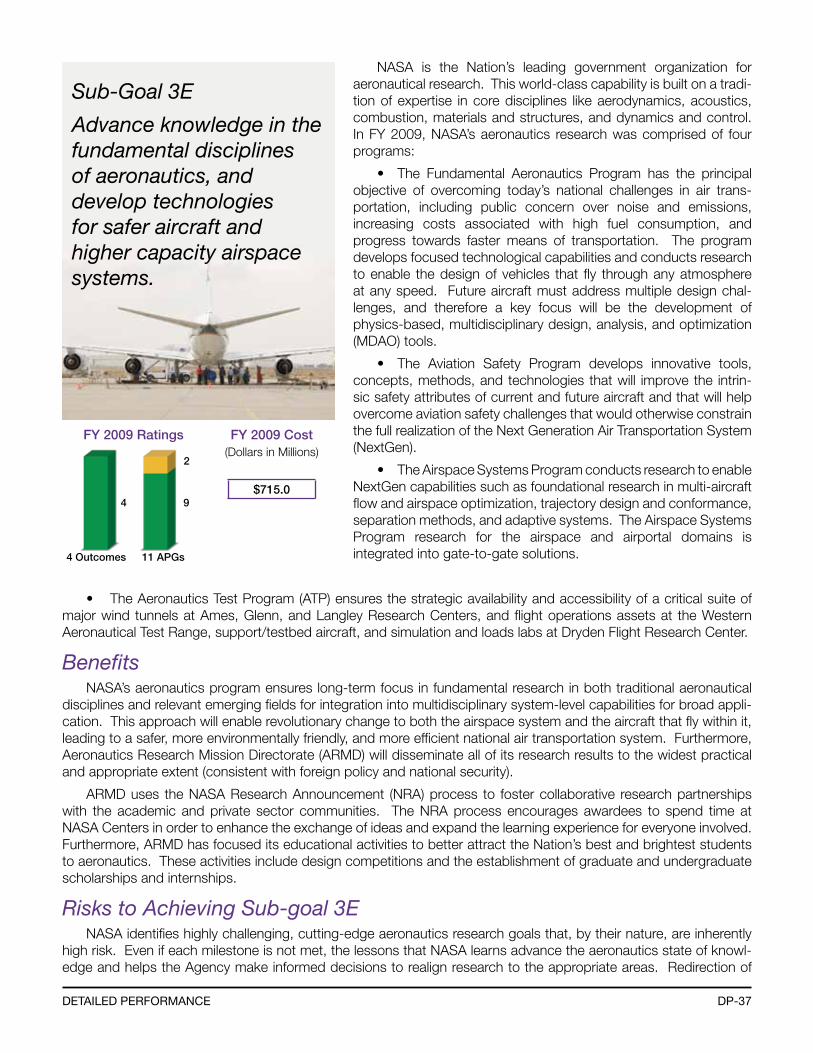
DP-37DetaileD Performance
Sub-Goal 3E
Advance knowledge in the fundamental disciplines of aeronautics, and develop technologies for safer aircraft and higher capacity airspace systems.
4 Outcomes 11 APGs
4 9
FY 2009 Ratings FY 2009 Cost(Dollars in Millions)
$715.0
2
NASA is the Nation’s leading government organization for aeronautical research. This world-class capability is built on a tradi-tion of expertise in core disciplines like aerodynamics, acoustics, combustion, materials and structures, and dynamics and control. In FY 2009, NASA’s aeronautics research was comprised of four programs:
• The Fundamental Aeronautics Program has the principal objective of overcoming today’s national challenges in air trans-portation, including public concern over noise and emissions, increasing costs associated with high fuel consumption, and progress towards faster means of transportation. The program develops focused technological capabilities and conducts research to enable the design of vehicles that fly through any atmosphere at any speed. Future aircraft must address multiple design chal-lenges, and therefore a key focus will be the development of physics-based, multidisciplinary design, analysis, and optimization (MDAO) tools.
• The Aviation Safety Program develops innovative tools, concepts, methods, and technologies that will improve the intrin-sic safety attributes of current and future aircraft and that will help overcome aviation safety challenges that would otherwise constrain the full realization of the Next Generation Air Transportation System (NextGen).
• The Airspace Systems Program conducts research to enable NextGen capabilities such as foundational research in multi-aircraft flow and airspace optimization, trajectory design and conformance, separation methods, and adaptive systems. The Airspace Systems Program research for the airspace and airportal domains is integrated into gate-to-gate solutions.
• The Aeronautics Test Program (ATP) ensures the strategic availability and accessibility of a critical suite of major wind tunnels at Ames, Glenn, and Langley Research Centers, and flight operations assets at the Western Aeronautical Test Range, support/testbed aircraft, and simulation and loads labs at Dryden Flight Research Center.
BenefitsNASA’s aeronautics program ensures long-term focus in fundamental research in both traditional aeronautical
disciplines and relevant emerging fields for integration into multidisciplinary system-level capabilities for broad appli-cation. This approach will enable revolutionary change to both the airspace system and the aircraft that fly within it, leading to a safer, more environmentally friendly, and more efficient national air transportation system. Furthermore, Aeronautics Research Mission Directorate (ARMD) will disseminate all of its research results to the widest practical and appropriate extent (consistent with foreign policy and national security).
ARMD uses the NASA Research Announcement (NRA) process to foster collaborative research partnerships with the academic and private sector communities. The NRA process encourages awardees to spend time at NASA Centers in order to enhance the exchange of ideas and expand the learning experience for everyone involved. Furthermore, ARMD has focused its educational activities to better attract the Nation’s best and brightest students to aeronautics. These activities include design competitions and the establishment of graduate and undergraduate scholarships and internships.
Risks to Achieving Sub-goal 3ENASA identifies highly challenging, cutting-edge aeronautics research goals that, by their nature, are inherently
high risk. Even if each milestone is not met, the lessons that NASA learns advance the aeronautics state of knowl-edge and helps the Agency make informed decisions to realign research to the appropriate areas. Redirection of
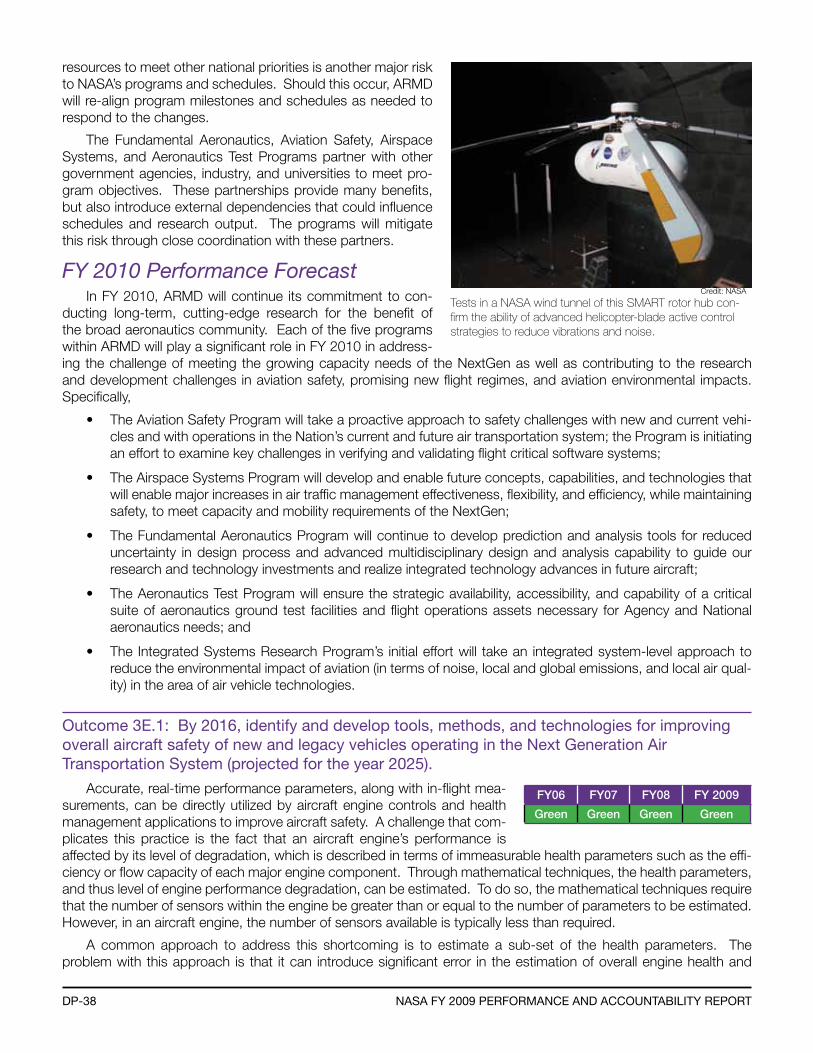
DP-38 naSa fY 2009 Performance anD accountabilitY rePort
resources to meet other national priorities is another major risk to NASA’s programs and schedules. Should this occur, ARMD will re-align program milestones and schedules as needed to respond to the changes.
The Fundamental Aeronautics, Aviation Safety, Airspace Systems, and Aeronautics Test Programs partner with other government agencies, industry, and universities to meet pro-gram objectives. These partnerships provide many benefits, but also introduce external dependencies that could influence schedules and research output. The programs will mitigate this risk through close coordination with these partners.
FY 2010 Performance ForecastIn FY 2010, ARMD will continue its commitment to con-
ducting long-term, cutting-edge research for the benefit of the broad aeronautics community. Each of the five programs within ARMD will play a significant role in FY 2010 in address-ing the challenge of meeting the growing capacity needs of the NextGen as well as contributing to the research and development challenges in aviation safety, promising new flight regimes, and aviation environmental impacts. Specifically,
• The Aviation Safety Program will take a proactive approach to safety challenges with new and current vehi-cles and with operations in the Nation’s current and future air transportation system; the Program is initiating an effort to examine key challenges in verifying and validating flight critical software systems;
• The Airspace Systems Program will develop and enable future concepts, capabilities, and technologies that will enable major increases in air traffic management effectiveness, flexibility, and efficiency, while maintaining safety, to meet capacity and mobility requirements of the NextGen;
• The Fundamental Aeronautics Program will continue to develop prediction and analysis tools for reduced uncertainty in design process and advanced multidisciplinary design and analysis capability to guide our research and technology investments and realize integrated technology advances in future aircraft;
• The Aeronautics Test Program will ensure the strategic availability, accessibility, and capability of a critical suite of aeronautics ground test facilities and flight operations assets necessary for Agency and National aeronautics needs; and
• The Integrated Systems Research Program’s initial effort will take an integrated system-level approach to reduce the environmental impact of aviation (in terms of noise, local and global emissions, and local air qual-ity) in the area of air vehicle technologies.
outcome 3e.1: by 2016, identify and develop tools, methods, and technologies for improving overall aircraft safety of new and legacy vehicles operating in the next Generation air transportation System (projected for the year 2025).
Accurate, real-time performance parameters, along with in-flight mea-surements, can be directly utilized by aircraft engine controls and health management applications to improve aircraft safety. A challenge that com-plicates this practice is the fact that an aircraft engine’s performance is affected by its level of degradation, which is described in terms of immeasurable health parameters such as the effi-ciency or flow capacity of each major engine component. Through mathematical techniques, the health parameters, and thus level of engine performance degradation, can be estimated. To do so, the mathematical techniques require that the number of sensors within the engine be greater than or equal to the number of parameters to be estimated. However, in an aircraft engine, the number of sensors available is typically less than required.
A common approach to address this shortcoming is to estimate a sub-set of the health parameters. The problem with this approach is that it can introduce significant error in the estimation of overall engine health and
Tests in a NASA wind tunnel of this SMART rotor hub con-firm the ability of advanced helicopter-blade active control strategies to reduce vibrations and noise.
FY06 FY07 FY08 FY 2009
Green Green Green Green
Credit: NASA
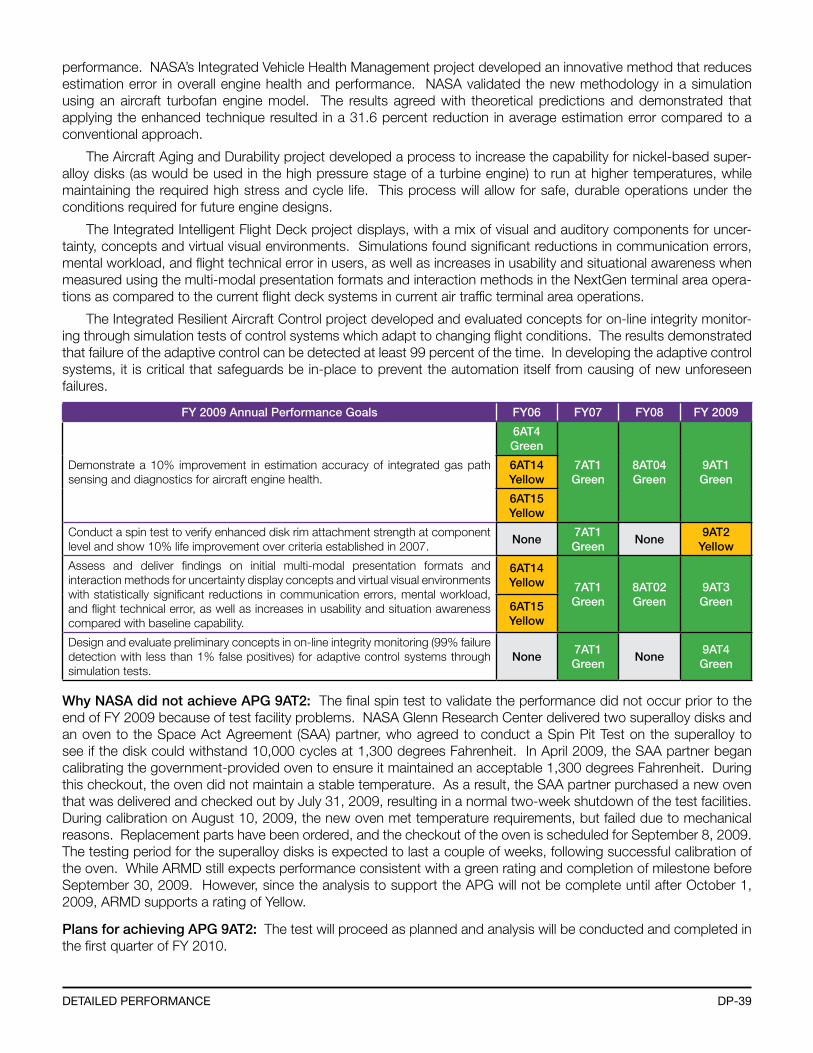
DP-39DetaileD Performance
performance. NASA’s Integrated Vehicle Health Management project developed an innovative method that reduces estimation error in overall engine health and performance. NASA validated the new methodology in a simulation using an aircraft turbofan engine model. The results agreed with theoretical predictions and demonstrated that applying the enhanced technique resulted in a 31.6 percent reduction in average estimation error compared to a conventional approach.
The Aircraft Aging and Durability project developed a process to increase the capability for nickel-based super-alloy disks (as would be used in the high pressure stage of a turbine engine) to run at higher temperatures, while maintaining the required high stress and cycle life. This process will allow for safe, durable operations under the conditions required for future engine designs.
The Integrated Intelligent Flight Deck project displays, with a mix of visual and auditory components for uncer-tainty, concepts and virtual visual environments. Simulations found significant reductions in communication errors, mental workload, and flight technical error in users, as well as increases in usability and situational awareness when measured using the multi-modal presentation formats and interaction methods in the NextGen terminal area opera-tions as compared to the current flight deck systems in current air traffic terminal area operations.
The Integrated Resilient Aircraft Control project developed and evaluated concepts for on-line integrity monitor-ing through simulation tests of control systems which adapt to changing flight conditions. The results demonstrated that failure of the adaptive control can be detected at least 99 percent of the time. In developing the adaptive control systems, it is critical that safeguards be in-place to prevent the automation itself from causing of new unforeseen failures.
FY 2009 Annual Performance Goals FY06 FY07 FY08 FY 2009
Demonstrate a 10% improvement in estimation accuracy of integrated gas path sensing and diagnostics for aircraft engine health.
6AT4Green
7AT1Green
8AT04Green
9AT1Green
6AT14Yellow
6AT15Yellow
Conduct a spin test to verify enhanced disk rim attachment strength at component level and show 10% life improvement over criteria established in 2007.
None7AT1Green
None9AT2
Yellow
Assess and deliver findings on initial multi-modal presentation formats and interaction methods for uncertainty display concepts and virtual visual environments with statistically significant reductions in communication errors, mental workload, and flight technical error, as well as increases in usability and situation awareness compared with baseline capability.
6AT14Yellow 7AT1
Green8AT02Green
9AT3Green6AT15
Yellow
Design and evaluate preliminary concepts in on-line integrity monitoring (99% failure detection with less than 1% false positives) for adaptive control systems through simulation tests.
None7AT1Green
None9AT4Green
Why NASA did not achieve APG 9AT2: The final spin test to validate the performance did not occur prior to the end of FY 2009 because of test facility problems. NASA Glenn Research Center delivered two superalloy disks and an oven to the Space Act Agreement (SAA) partner, who agreed to conduct a Spin Pit Test on the superalloy to see if the disk could withstand 10,000 cycles at 1,300 degrees Fahrenheit. In April 2009, the SAA partner began calibrating the government-provided oven to ensure it maintained an acceptable 1,300 degrees Fahrenheit. During this checkout, the oven did not maintain a stable temperature. As a result, the SAA partner purchased a new oven that was delivered and checked out by July 31, 2009, resulting in a normal two-week shutdown of the test facilities. During calibration on August 10, 2009, the new oven met temperature requirements, but failed due to mechanical reasons. Replacement parts have been ordered, and the checkout of the oven is scheduled for September 8, 2009. The testing period for the superalloy disks is expected to last a couple of weeks, following successful calibration of the oven. While ARMD still expects performance consistent with a green rating and completion of milestone before September 30, 2009. However, since the analysis to support the APG will not be complete until after October 1, 2009, ARMD supports a rating of Yellow.
Plans for achieving APG 9AT2: The test will proceed as planned and analysis will be conducted and completed in the first quarter of FY 2010.
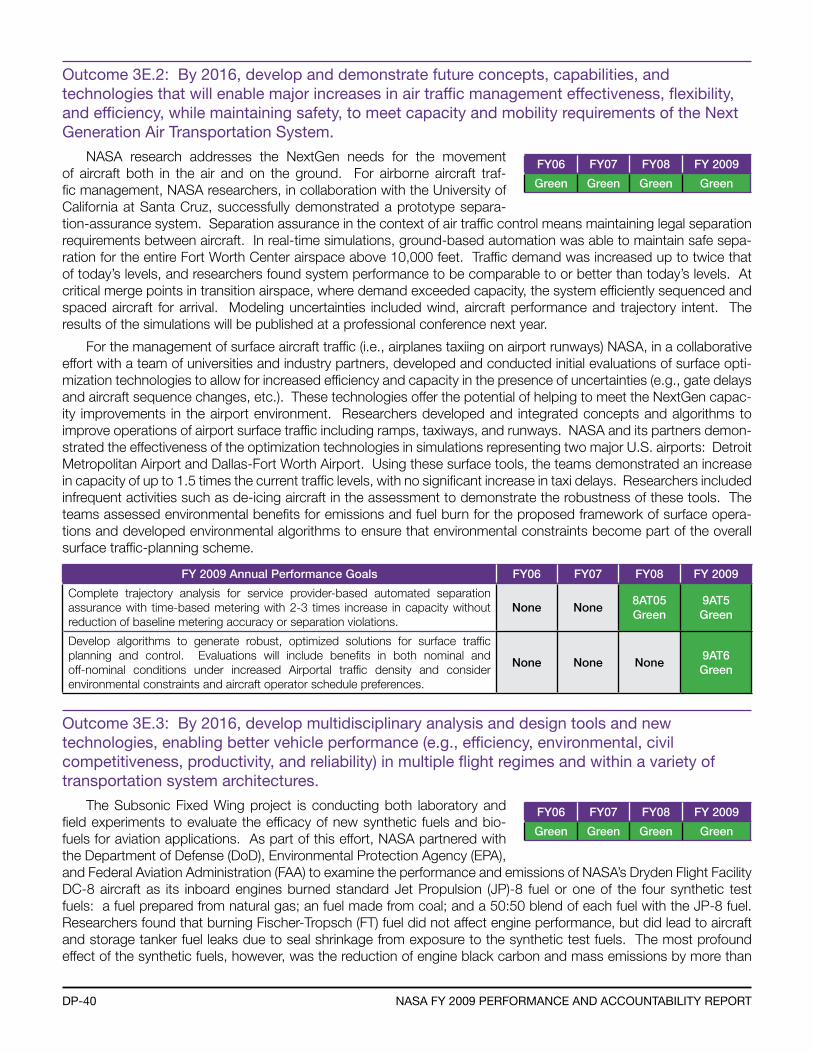
DP-40 naSa fY 2009 Performance anD accountabilitY rePort
outcome 3e.2: by 2016, develop and demonstrate future concepts, capabilities, and technologies that will enable major increases in air traffic management effectiveness, flexibility, and efficiency, while maintaining safety, to meet capacity and mobility requirements of the next Generation air transportation System.
NASA research addresses the NextGen needs for the movement of aircraft both in the air and on the ground. For airborne aircraft traf-fic management, NASA researchers, in collaboration with the University of California at Santa Cruz, successfully demonstrated a prototype separa-tion-assurance system. Separation assurance in the context of air traffic control means maintaining legal separation requirements between aircraft. In real-time simulations, ground-based automation was able to maintain safe sepa-ration for the entire Fort Worth Center airspace above 10,000 feet. Traffic demand was increased up to twice that of today’s levels, and researchers found system performance to be comparable to or better than today’s levels. At critical merge points in transition airspace, where demand exceeded capacity, the system efficiently sequenced and spaced aircraft for arrival. Modeling uncertainties included wind, aircraft performance and trajectory intent. The results of the simulations will be published at a professional conference next year.
For the management of surface aircraft traffic (i.e., airplanes taxiing on airport runways) NASA, in a collaborative effort with a team of universities and industry partners, developed and conducted initial evaluations of surface opti-mization technologies to allow for increased efficiency and capacity in the presence of uncertainties (e.g., gate delays and aircraft sequence changes, etc.). These technologies offer the potential of helping to meet the NextGen capac-ity improvements in the airport environment. Researchers developed and integrated concepts and algorithms to improve operations of airport surface traffic including ramps, taxiways, and runways. NASA and its partners demon-strated the effectiveness of the optimization technologies in simulations representing two major U.S. airports: Detroit Metropolitan Airport and Dallas-Fort Worth Airport. Using these surface tools, the teams demonstrated an increase in capacity of up to 1.5 times the current traffic levels, with no significant increase in taxi delays. Researchers included infrequent activities such as de-icing aircraft in the assessment to demonstrate the robustness of these tools. The teams assessed environmental benefits for emissions and fuel burn for the proposed framework of surface opera-tions and developed environmental algorithms to ensure that environmental constraints become part of the overall surface traffic-planning scheme.
FY 2009 Annual Performance Goals FY06 FY07 FY08 FY 2009
Complete trajectory analysis for service provider-based automated separation assurance with time-based metering with 2-3 times increase in capacity without reduction of baseline metering accuracy or separation violations.
None None8AT05Green
9AT5Green
Develop algorithms to generate robust, optimized solutions for surface traffic planning and control. Evaluations will include benefits in both nominal and off-nominal conditions under increased Airportal traffic density and consider environmental constraints and aircraft operator schedule preferences.
None None None9AT6Green
outcome 3e.3: by 2016, develop multidisciplinary analysis and design tools and new technologies, enabling better vehicle performance (e.g., efficiency, environmental, civil competitiveness, productivity, and reliability) in multiple flight regimes and within a variety of transportation system architectures.
The Subsonic Fixed Wing project is conducting both laboratory and field experiments to evaluate the efficacy of new synthetic fuels and bio-fuels for aviation applications. As part of this effort, NASA partnered with the Department of Defense (DoD), Environmental Protection Agency (EPA), and Federal Aviation Administration (FAA) to examine the performance and emissions of NASA’s Dryden Flight Facility DC-8 aircraft as its inboard engines burned standard Jet Propulsion (JP)-8 fuel or one of the four synthetic test fuels: a fuel prepared from natural gas; an fuel made from coal; and a 50:50 blend of each fuel with the JP-8 fuel. Researchers found that burning Fischer-Tropsch (FT) fuel did not affect engine performance, but did lead to aircraft and storage tanker fuel leaks due to seal shrinkage from exposure to the synthetic test fuels. The most profound effect of the synthetic fuels, however, was the reduction of engine black carbon and mass emissions by more than
FY06 FY07 FY08 FY 2009
Green Green Green Green
FY06 FY07 FY08 FY 2009
Green Green Green Green
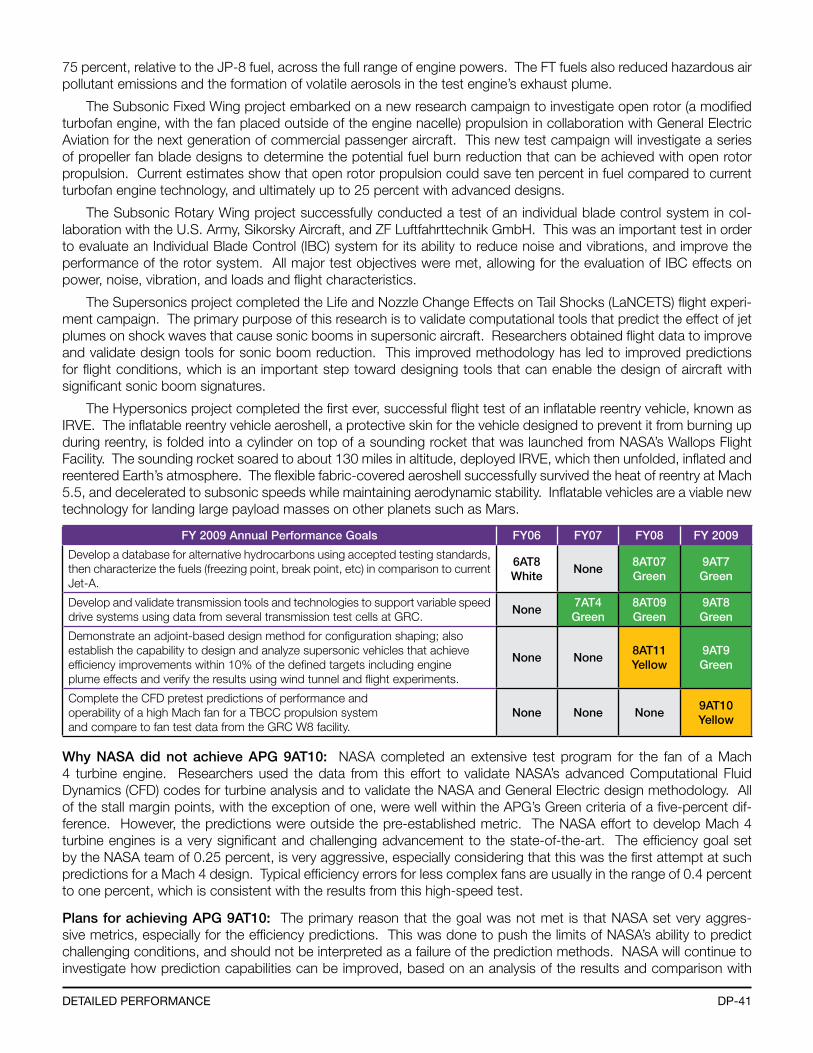
DP-41DetaileD Performance
75 percent, relative to the JP-8 fuel, across the full range of engine powers. The FT fuels also reduced hazardous air pollutant emissions and the formation of volatile aerosols in the test engine’s exhaust plume.
The Subsonic Fixed Wing project embarked on a new research campaign to investigate open rotor (a modified turbofan engine, with the fan placed outside of the engine nacelle) propulsion in collaboration with General Electric Aviation for the next generation of commercial passenger aircraft. This new test campaign will investigate a series of propeller fan blade designs to determine the potential fuel burn reduction that can be achieved with open rotor propulsion. Current estimates show that open rotor propulsion could save ten percent in fuel compared to current turbofan engine technology, and ultimately up to 25 percent with advanced designs.
The Subsonic Rotary Wing project successfully conducted a test of an individual blade control system in col-laboration with the U.S. Army, Sikorsky Aircraft, and ZF Luftfahrttechnik GmbH. This was an important test in order to evaluate an Individual Blade Control (IBC) system for its ability to reduce noise and vibrations, and improve the performance of the rotor system. All major test objectives were met, allowing for the evaluation of IBC effects on power, noise, vibration, and loads and flight characteristics.
The Supersonics project completed the Life and Nozzle Change Effects on Tail Shocks (LaNCETS) flight experi-ment campaign. The primary purpose of this research is to validate computational tools that predict the effect of jet plumes on shock waves that cause sonic booms in supersonic aircraft. Researchers obtained flight data to improve and validate design tools for sonic boom reduction. This improved methodology has led to improved predictions for flight conditions, which is an important step toward designing tools that can enable the design of aircraft with significant sonic boom signatures.
The Hypersonics project completed the first ever, successful flight test of an inflatable reentry vehicle, known as IRVE. The inflatable reentry vehicle aeroshell, a protective skin for the vehicle designed to prevent it from burning up during reentry, is folded into a cylinder on top of a sounding rocket that was launched from NASA’s Wallops Flight Facility. The sounding rocket soared to about 130 miles in altitude, deployed IRVE, which then unfolded, inflated and reentered Earth’s atmosphere. The flexible fabric-covered aeroshell successfully survived the heat of reentry at Mach 5.5, and decelerated to subsonic speeds while maintaining aerodynamic stability. Inflatable vehicles are a viable new technology for landing large payload masses on other planets such as Mars.
FY 2009 Annual Performance Goals FY06 FY07 FY08 FY 2009
Develop a database for alternative hydrocarbons using accepted testing standards, then characterize the fuels (freezing point, break point, etc) in comparison to current Jet-A.
6AT8White
None8AT07Green
9AT7Green
Develop and validate transmission tools and technologies to support variable speed drive systems using data from several transmission test cells at GRC.
None7AT4Green
8AT09Green
9AT8Green
Demonstrate an adjoint-based design method for configuration shaping; also establish the capability to design and analyze supersonic vehicles that achieve efficiency improvements within 10% of the defined targets including engine plume effects and verify the results using wind tunnel and flight experiments.
None None8AT11Yellow
9AT9Green
Complete the CFD pretest predictions of performance and operability of a high Mach fan for a TBCC propulsion system and compare to fan test data from the GRC W8 facility.
None None None9AT10Yellow
Why NASA did not achieve APG 9AT10: NASA completed an extensive test program for the fan of a Mach 4 turbine engine. Researchers used the data from this effort to validate NASA’s advanced Computational Fluid Dynamics (CFD) codes for turbine analysis and to validate the NASA and General Electric design methodology. All of the stall margin points, with the exception of one, were well within the APG’s Green criteria of a five-percent dif-ference. However, the predictions were outside the pre-established metric. The NASA effort to develop Mach 4 turbine engines is a very significant and challenging advancement to the state-of-the-art. The efficiency goal set by the NASA team of 0.25 percent, is very aggressive, especially considering that this was the first attempt at such predictions for a Mach 4 design. Typical efficiency errors for less complex fans are usually in the range of 0.4 percent to one percent, which is consistent with the results from this high-speed test.
Plans for achieving APG 9AT10: The primary reason that the goal was not met is that NASA set very aggres-sive metrics, especially for the efficiency predictions. This was done to push the limits of NASA’s ability to predict challenging conditions, and should not be interpreted as a failure of the prediction methods. NASA will continue to investigate how prediction capabilities can be improved, based on an analysis of the results and comparison with
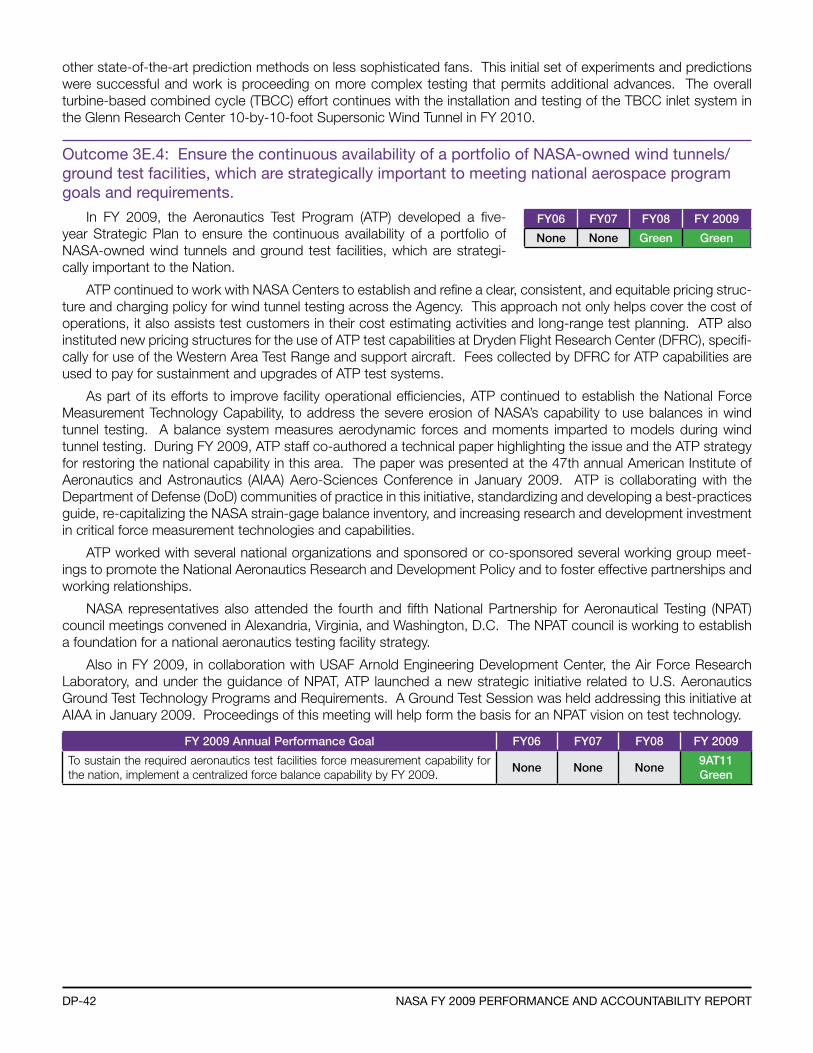
DP-42 naSa fY 2009 Performance anD accountabilitY rePort
other state-of-the-art prediction methods on less sophisticated fans. This initial set of experiments and predictions were successful and work is proceeding on more complex testing that permits additional advances. The overall turbine-based combined cycle (TBCC) effort continues with the installation and testing of the TBCC inlet system in the Glenn Research Center 10-by-10-foot Supersonic Wind Tunnel in FY 2010.
outcome 3e.4: ensure the continuous availability of a portfolio of naSa-owned wind tunnels/ground test facilities, which are strategically important to meeting national aerospace program goals and requirements.
In FY 2009, the Aeronautics Test Program (ATP) developed a five-year Strategic Plan to ensure the continuous availability of a portfolio of NASA-owned wind tunnels and ground test facilities, which are strategi-cally important to the Nation.
ATP continued to work with NASA Centers to establish and refine a clear, consistent, and equitable pricing struc-ture and charging policy for wind tunnel testing across the Agency. This approach not only helps cover the cost of operations, it also assists test customers in their cost estimating activities and long-range test planning. ATP also instituted new pricing structures for the use of ATP test capabilities at Dryden Flight Research Center (DFRC), specifi-cally for use of the Western Area Test Range and support aircraft. Fees collected by DFRC for ATP capabilities are used to pay for sustainment and upgrades of ATP test systems.
As part of its efforts to improve facility operational efficiencies, ATP continued to establish the National Force Measurement Technology Capability, to address the severe erosion of NASA’s capability to use balances in wind tunnel testing. A balance system measures aerodynamic forces and moments imparted to models during wind tunnel testing. During FY 2009, ATP staff co-authored a technical paper highlighting the issue and the ATP strategy for restoring the national capability in this area. The paper was presented at the 47th annual American Institute of Aeronautics and Astronautics (AIAA) Aero-Sciences Conference in January 2009. ATP is collaborating with the Department of Defense (DoD) communities of practice in this initiative, standardizing and developing a best-practices guide, re-capitalizing the NASA strain-gage balance inventory, and increasing research and development investment in critical force measurement technologies and capabilities.
ATP worked with several national organizations and sponsored or co-sponsored several working group meet-ings to promote the National Aeronautics Research and Development Policy and to foster effective partnerships and working relationships.
NASA representatives also attended the fourth and fifth National Partnership for Aeronautical Testing (NPAT) council meetings convened in Alexandria, Virginia, and Washington, D.C. The NPAT council is working to establish a foundation for a national aeronautics testing facility strategy.
Also in FY 2009, in collaboration with USAF Arnold Engineering Development Center, the Air Force Research Laboratory, and under the guidance of NPAT, ATP launched a new strategic initiative related to U.S. Aeronautics Ground Test Technology Programs and Requirements. A Ground Test Session was held addressing this initiative at AIAA in January 2009. Proceedings of this meeting will help form the basis for an NPAT vision on test technology.
FY 2009 Annual Performance Goal FY06 FY07 FY08 FY 2009
To sustain the required aeronautics test facilities force measurement capability for the nation, implement a centralized force balance capability by FY 2009.
None None None9AT11Green
FY06 FY07 FY08 FY 2009
None None Green Green
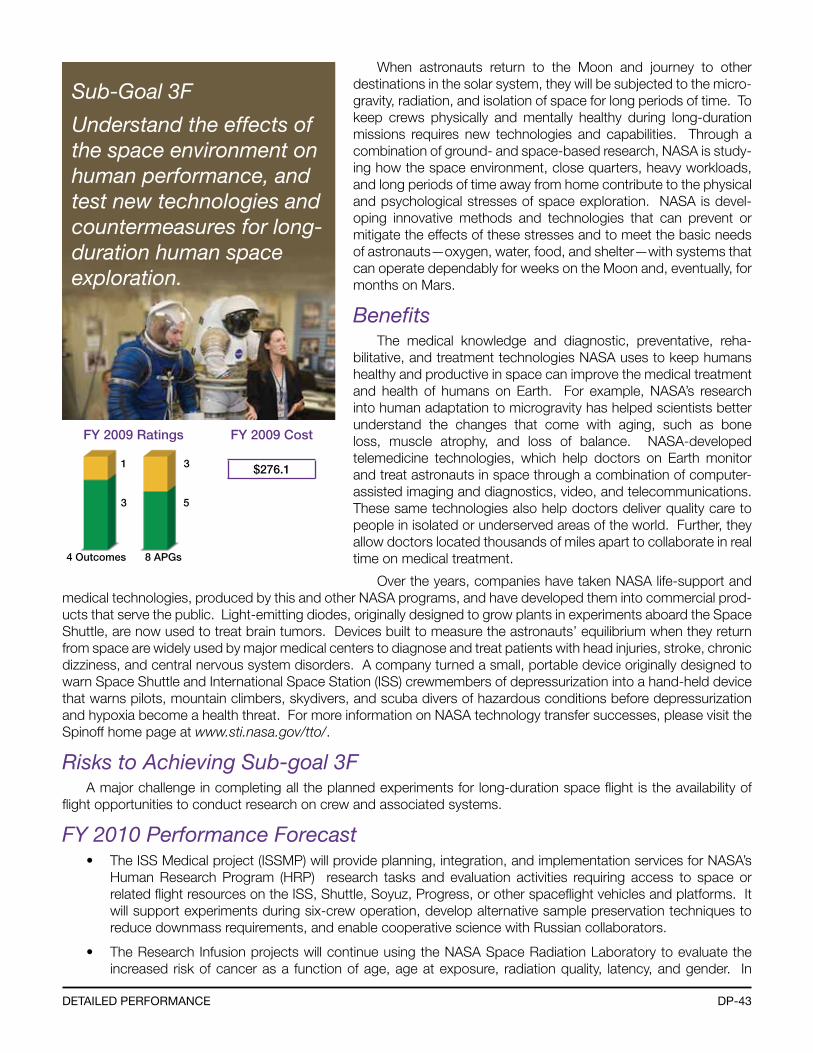
DP-43DetaileD Performance
Sub-Goal 3F
Understand the effects of the space environment on human performance, and test new technologies and countermeasures for long-duration human space exploration.
4 Outcomes 8 APGs
3 5
FY 2009 Ratings FY 2009 Cost
$276.131
When astronauts return to the Moon and journey to other destinations in the solar system, they will be subjected to the micro-gravity, radiation, and isolation of space for long periods of time. To keep crews physically and mentally healthy during long-duration missions requires new technologies and capabilities. Through a combination of ground- and space-based research, NASA is study-ing how the space environment, close quarters, heavy workloads, and long periods of time away from home contribute to the physical and psychological stresses of space exploration. NASA is devel-oping innovative methods and technologies that can prevent or mitigate the effects of these stresses and to meet the basic needs of astronauts—oxygen, water, food, and shelter—with systems that can operate dependably for weeks on the Moon and, eventually, for months on Mars.
BenefitsThe medical knowledge and diagnostic, preventative, reha-
bilitative, and treatment technologies NASA uses to keep humans healthy and productive in space can improve the medical treatment and health of humans on Earth. For example, NASA’s research into human adaptation to microgravity has helped scientists better understand the changes that come with aging, such as bone loss, muscle atrophy, and loss of balance. NASA-developed telemedicine technologies, which help doctors on Earth monitor and treat astronauts in space through a combination of computer-assisted imaging and diagnostics, video, and telecommunications. These same technologies also help doctors deliver quality care to people in isolated or underserved areas of the world. Further, they allow doctors located thousands of miles apart to collaborate in real time on medical treatment.
Over the years, companies have taken NASA life-support and medical technologies, produced by this and other NASA programs, and have developed them into commercial prod-ucts that serve the public. Light-emitting diodes, originally designed to grow plants in experiments aboard the Space Shuttle, are now used to treat brain tumors. Devices built to measure the astronauts’ equilibrium when they return from space are widely used by major medical centers to diagnose and treat patients with head injuries, stroke, chronic dizziness, and central nervous system disorders. A company turned a small, portable device originally designed to warn Space Shuttle and International Space Station (ISS) crewmembers of depressurization into a hand-held device that warns pilots, mountain climbers, skydivers, and scuba divers of hazardous conditions before depressurization and hypoxia become a health threat. For more information on NASA technology transfer successes, please visit the Spinoff home page at www.sti.nasa.gov/tto/.
Risks to Achieving Sub-goal 3FA major challenge in completing all the planned experiments for long-duration space flight is the availability of
flight opportunities to conduct research on crew and associated systems.
FY 2010 Performance Forecast• The ISS Medical project (ISSMP) will provide planning, integration, and implementation services for NASA’s
Human Research Program (HRP) research tasks and evaluation activities requiring access to space or related flight resources on the ISS, Shuttle, Soyuz, Progress, or other spaceflight vehicles and platforms. It will support experiments during six-crew operation, develop alternative sample preservation techniques to reduce downmass requirements, and enable cooperative science with Russian collaborators.
• The Research Infusion projects will continue using the NASA Space Radiation Laboratory to evaluate the increased risk of cancer as a function of age, age at exposure, radiation quality, latency, and gender. In
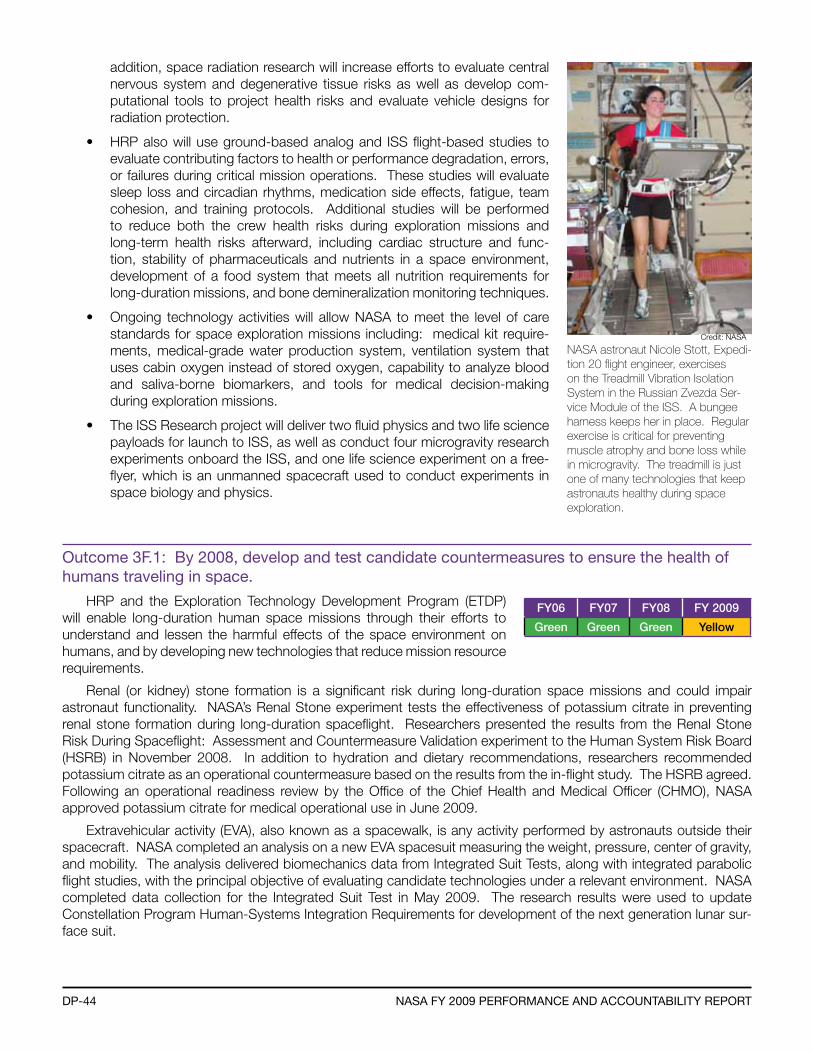
DP-44 naSa fY 2009 Performance anD accountabilitY rePort
addition, space radiation research will increase efforts to evaluate central nervous system and degenerative tissue risks as well as develop com-putational tools to project health risks and evaluate vehicle designs for radiation protection.
• HRP also will use ground-based analog and ISS flight-based studies to evaluate contributing factors to health or performance degradation, errors, or failures during critical mission operations. These studies will evaluate sleep loss and circadian rhythms, medication side effects, fatigue, team cohesion, and training protocols. Additional studies will be performed to reduce both the crew health risks during exploration missions and long-term health risks afterward, including cardiac structure and func-tion, stability of pharmaceuticals and nutrients in a space environment, development of a food system that meets all nutrition requirements for long-duration missions, and bone demineralization monitoring techniques.
• Ongoing technology activities will allow NASA to meet the level of care standards for space exploration missions including: medical kit require-ments, medical-grade water production system, ventilation system that uses cabin oxygen instead of stored oxygen, capability to analyze blood and saliva-borne biomarkers, and tools for medical decision-making during exploration missions.
• The ISS Research project will deliver two fluid physics and two life science payloads for launch to ISS, as well as conduct four microgravity research experiments onboard the ISS, and one life science experiment on a free-flyer, which is an unmanned spacecraft used to conduct experiments in space biology and physics.
outcome 3f.1: by 2008, develop and test candidate countermeasures to ensure the health of humans traveling in space.
HRP and the Exploration Technology Development Program (ETDP) will enable long-duration human space missions through their efforts to understand and lessen the harmful effects of the space environment on humans, and by developing new technologies that reduce mission resource requirements.
Renal (or kidney) stone formation is a significant risk during long-duration space missions and could impair astronaut functionality. NASA’s Renal Stone experiment tests the effectiveness of potassium citrate in preventing renal stone formation during long-duration spaceflight. Researchers presented the results from the Renal Stone Risk During Spaceflight: Assessment and Countermeasure Validation experiment to the Human System Risk Board (HSRB) in November 2008. In addition to hydration and dietary recommendations, researchers recommended potassium citrate as an operational countermeasure based on the results from the in-flight study. The HSRB agreed. Following an operational readiness review by the Office of the Chief Health and Medical Officer (CHMO), NASA approved potassium citrate for medical operational use in June 2009.
Extravehicular activity (EVA), also known as a spacewalk, is any activity performed by astronauts outside their spacecraft. NASA completed an analysis on a new EVA spacesuit measuring the weight, pressure, center of gravity, and mobility. The analysis delivered biomechanics data from Integrated Suit Tests, along with integrated parabolic flight studies, with the principal objective of evaluating candidate technologies under a relevant environment. NASA completed data collection for the Integrated Suit Test in May 2009. The research results were used to update Constellation Program Human-Systems Integration Requirements for development of the next generation lunar sur-face suit.
NASA astronaut Nicole Stott, Expedi-tion 20 flight engineer, exercises on the Treadmill Vibration Isolation System in the Russian Zvezda Ser-vice Module of the ISS. A bungee harness keeps her in place. Regular exercise is critical for preventing muscle atrophy and bone loss while in microgravity. The treadmill is just one of many technologies that keep astronauts healthy during space exploration.
FY06 FY07 FY08 FY 2009
Green Green Green Yellow
Credit: NASA
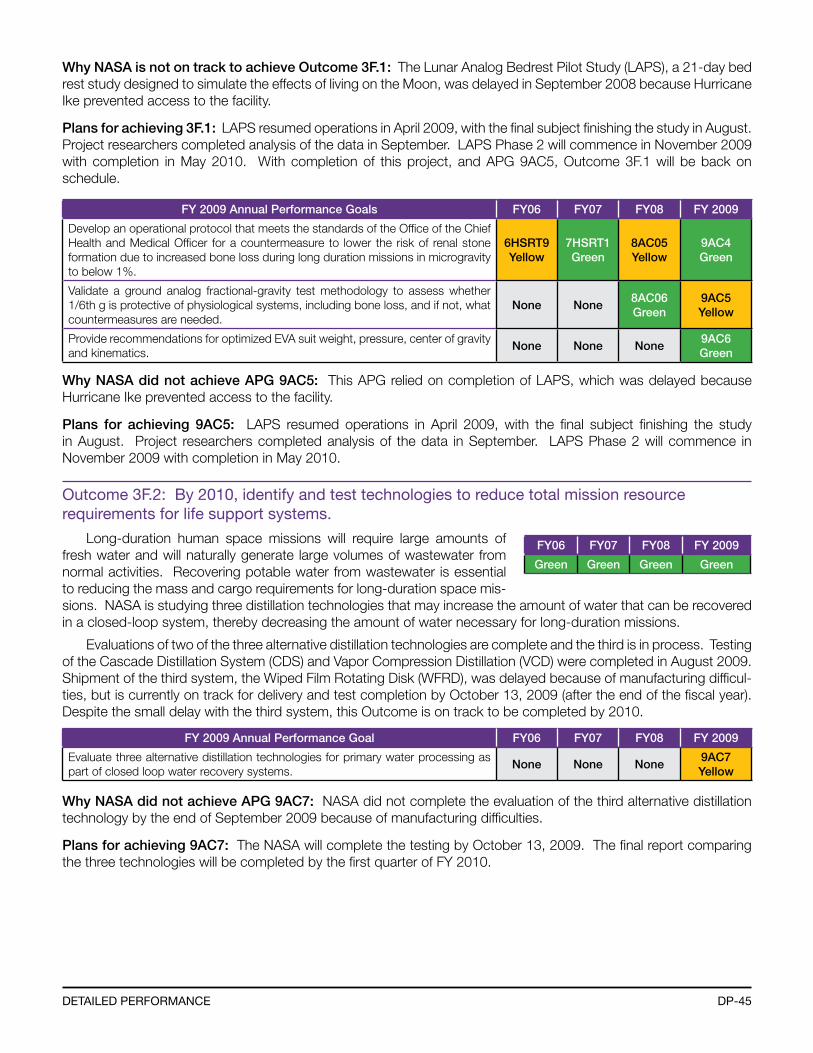
DP-45DetaileD Performance
Why NASA is not on track to achieve Outcome 3F.1: The Lunar Analog Bedrest Pilot Study (LAPS), a 21-day bed rest study designed to simulate the effects of living on the Moon, was delayed in September 2008 because Hurricane Ike prevented access to the facility.
Plans for achieving 3F.1: LAPS resumed operations in April 2009, with the final subject finishing the study in August. Project researchers completed analysis of the data in September. LAPS Phase 2 will commence in November 2009 with completion in May 2010. With completion of this project, and APG 9AC5, Outcome 3F.1 will be back on schedule.
FY 2009 Annual Performance Goals FY06 FY07 FY08 FY 2009
Develop an operational protocol that meets the standards of the Office of the Chief Health and Medical Officer for a countermeasure to lower the risk of renal stone formation due to increased bone loss during long duration missions in microgravity to below 1%.
6HSRT9Yellow
7HSRT1Green
8AC05Yellow
9AC4Green
Validate a ground analog fractional-gravity test methodology to assess whether 1/6th g is protective of physiological systems, including bone loss, and if not, what countermeasures are needed.
None None8AC06Green
9AC5Yellow
Provide recommendations for optimized EVA suit weight, pressure, center of gravity and kinematics.
None None None9AC6Green
Why NASA did not achieve APG 9AC5: This APG relied on completion of LAPS, which was delayed because Hurricane Ike prevented access to the facility.
Plans for achieving 9AC5: LAPS resumed operations in April 2009, with the final subject finishing the study in August. Project researchers completed analysis of the data in September. LAPS Phase 2 will commence in November 2009 with completion in May 2010.
outcome 3f.2: by 2010, identify and test technologies to reduce total mission resource requirements for life support systems.
Long-duration human space missions will require large amounts of fresh water and will naturally generate large volumes of wastewater from normal activities. Recovering potable water from wastewater is essential to reducing the mass and cargo requirements for long-duration space mis-sions. NASA is studying three distillation technologies that may increase the amount of water that can be recovered in a closed-loop system, thereby decreasing the amount of water necessary for long-duration missions.
Evaluations of two of the three alternative distillation technologies are complete and the third is in process. Testing of the Cascade Distillation System (CDS) and Vapor Compression Distillation (VCD) were completed in August 2009. Shipment of the third system, the Wiped Film Rotating Disk (WFRD), was delayed because of manufacturing difficul-ties, but is currently on track for delivery and test completion by October 13, 2009 (after the end of the fiscal year). Despite the small delay with the third system, this Outcome is on track to be completed by 2010.
FY 2009 Annual Performance Goal FY06 FY07 FY08 FY 2009
Evaluate three alternative distillation technologies for primary water processing as part of closed loop water recovery systems.
None None None9AC7Yellow
Why NASA did not achieve APG 9AC7: NASA did not complete the evaluation of the third alternative distillation technology by the end of September 2009 because of manufacturing difficulties.
Plans for achieving 9AC7: The NASA will complete the testing by October 13, 2009. The final report comparing the three technologies will be completed by the first quarter of FY 2010.
FY06 FY07 FY08 FY 2009
Green Green Green Green
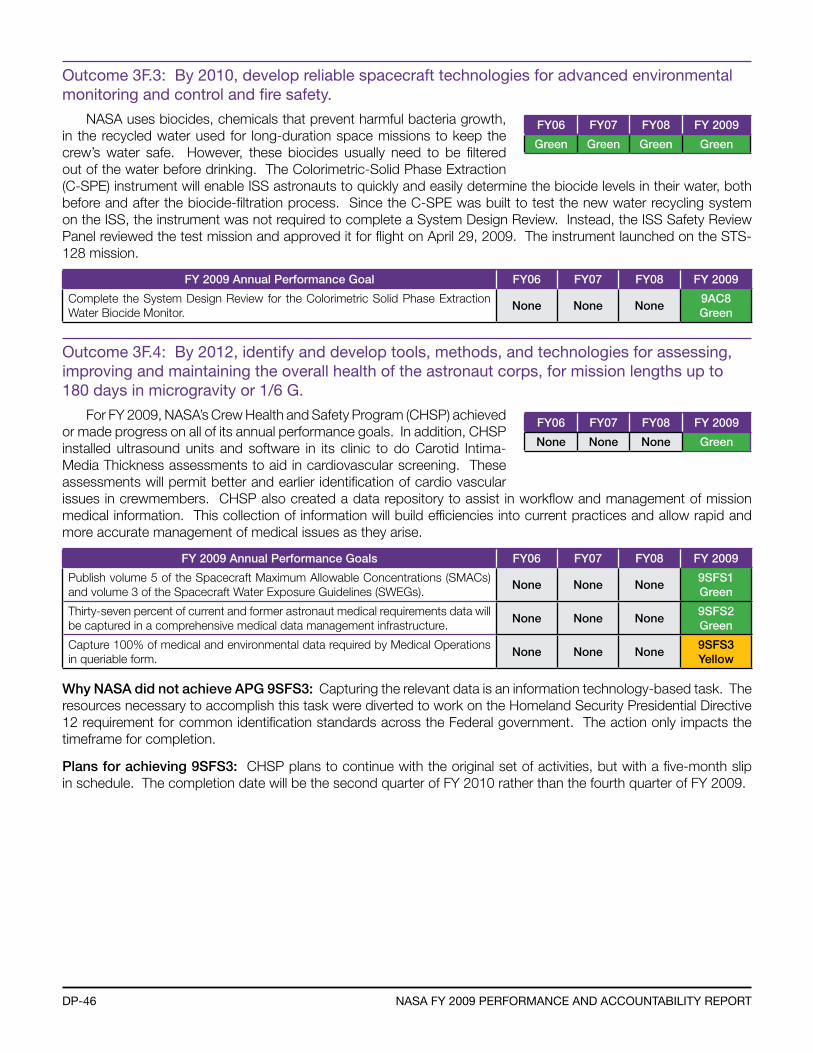
DP-46 naSa fY 2009 Performance anD accountabilitY rePort
outcome 3f.3: by 2010, develop reliable spacecraft technologies for advanced environmental monitoring and control and fire safety.
NASA uses biocides, chemicals that prevent harmful bacteria growth, in the recycled water used for long-duration space missions to keep the crew’s water safe. However, these biocides usually need to be filtered out of the water before drinking. The Colorimetric-Solid Phase Extraction (C-SPE) instrument will enable ISS astronauts to quickly and easily determine the biocide levels in their water, both before and after the biocide-filtration process. Since the C-SPE was built to test the new water recycling system on the ISS, the instrument was not required to complete a System Design Review. Instead, the ISS Safety Review Panel reviewed the test mission and approved it for flight on April 29, 2009. The instrument launched on the STS-128 mission.
FY 2009 Annual Performance Goal FY06 FY07 FY08 FY 2009
Complete the System Design Review for the Colorimetric Solid Phase Extraction Water Biocide Monitor.
None None None9AC8Green
outcome 3f.4: by 2012, identify and develop tools, methods, and technologies for assessing, improving and maintaining the overall health of the astronaut corps, for mission lengths up to 180 days in microgravity or 1/6 G.
For FY 2009, NASA’s Crew Health and Safety Program (CHSP) achieved or made progress on all of its annual performance goals. In addition, CHSP installed ultrasound units and software in its clinic to do Carotid Intima-Media Thickness assessments to aid in cardiovascular screening. These assessments will permit better and earlier identification of cardio vascular issues in crewmembers. CHSP also created a data repository to assist in workflow and management of mission medical information. This collection of information will build efficiencies into current practices and allow rapid and more accurate management of medical issues as they arise.
FY 2009 Annual Performance Goals FY06 FY07 FY08 FY 2009
Publish volume 5 of the Spacecraft Maximum Allowable Concentrations (SMACs) and volume 3 of the Spacecraft Water Exposure Guidelines (SWEGs).
None None None9SFS1Green
Thirty-seven percent of current and former astronaut medical requirements data will be captured in a comprehensive medical data management infrastructure.
None None None9SFS2Green
Capture 100% of medical and environmental data required by Medical Operations in queriable form.
None None None9SFS3Yellow
Why NASA did not achieve APG 9SFS3: Capturing the relevant data is an information technology-based task. The resources necessary to accomplish this task were diverted to work on the Homeland Security Presidential Directive 12 requirement for common identification standards across the Federal government. The action only impacts the timeframe for completion.
Plans for achieving 9SFS3: CHSP plans to continue with the original set of activities, but with a five-month slip in schedule. The completion date will be the second quarter of FY 2010 rather than the fourth quarter of FY 2009.
FY06 FY07 FY08 FY 2009
Green Green Green Green
FY06 FY07 FY08 FY 2009
None None None Green

DP-47DetaileD Performance
Strategic Goal 4
Bring a new Crew Exploration Vehicle into service as soon as possible after Shuttle retirement.
2 Outcomes 12 APGs
1
6
FY 2009 Ratings FY 2009 Cost(Dollars in Millions)
$4,368.2
21
3
1
Strategic Goal 4 is essential to achieving NASA’s Mission. The Nation’s current space transportation system, the Space Shuttle, is not designed for human exploration beyond low Earth orbit. To achieve the long-term objective of returning explorers to the Moon and eventually sending them to Mars, NASA initiated the Constellation Program. The program is responsible for the proj-ects that will design, build, and test the Orion Crew Exploration Vehicle, the expendable crew launch vehicle Ares I, the heavy-lift cargo launch vehicle Ares V, and spacesuits and tools required by the flight crews, and to create, or transition from the Space Shuttle Program, associated ground and mission operations infrastructure to support initial low Earth orbit missions.
Orion will be America’s new spacecraft for human space explo-ration. It will carry four crewmembers to the Moon and serve as the primary exploration vehicle for future missions. It also will be capa-ble of ferrying astronauts and cargo to and from the International Space Station (ISS), if commercial transport services are unavail-able. The Ares I will consist of a solid rocket booster and an upper stage that can carry Orion into low Earth orbit.11
BenefitsOrion will support the expansion of human exploration missions
and provide the means to take humans to the Moon where they can conduct scientific activities and make discoveries that cannot be achieved solely with robotic explorers.
As with past and current human exploration programs, NASA’s efforts to develop Orion and the Ares launchers will accelerate the development of technologies that are important for the economy and national security. The advanced systems and capabilities required for space travel include power generation and storage,
communications and navigation, networking, robotics, and improved materials, all of which could be used on Earth to meet commercial and other national needs. As Shuttle activities wind down, Shuttle personnel will find new, chal-lenging positions working on Constellation development efforts, keeping this highly skilled segment of America’s workforce productive and competitive. Constellation also will provide a training ground for the next generation of scientists and engineers who will realize the Nation’s space exploration dreams.
Furthermore, Orion will serve as a public symbol of the Nation’s continued commitment to space exploration, much as the Shuttle has for over 25 years. NASA anticipates that the exploration initiatives will spark the public’s imagination and inspire the Nation’s youth to pursue careers in science, technology, engineering, and mathematics as a result of their renewed interest in space.
Risks to Achieving Strategic Goal 4The Constellation Program is striving to meet challenges in the management and technical areas. The Constellation
Program must manage its development work to ensure it remains within a constrained budget while also meeting the externally committed milestones of exploration. In the technical arena, the Constellation Program has some engineering challenges very similar to many NASA encountered during the Apollo Program and development of the Space Shuttle. Every time NASA faces an engineering challenge, Agency engineers examine all the options for addressing the issue. NASA has an excellent track record of resolving technical challenges and the Agency expects to resolve any technical issues and meet the Exploration Systems milestones.
11For more information on NASA missions, please see NASA’s Missions at a Glance, located in the Other Accompanying Information section of this document.
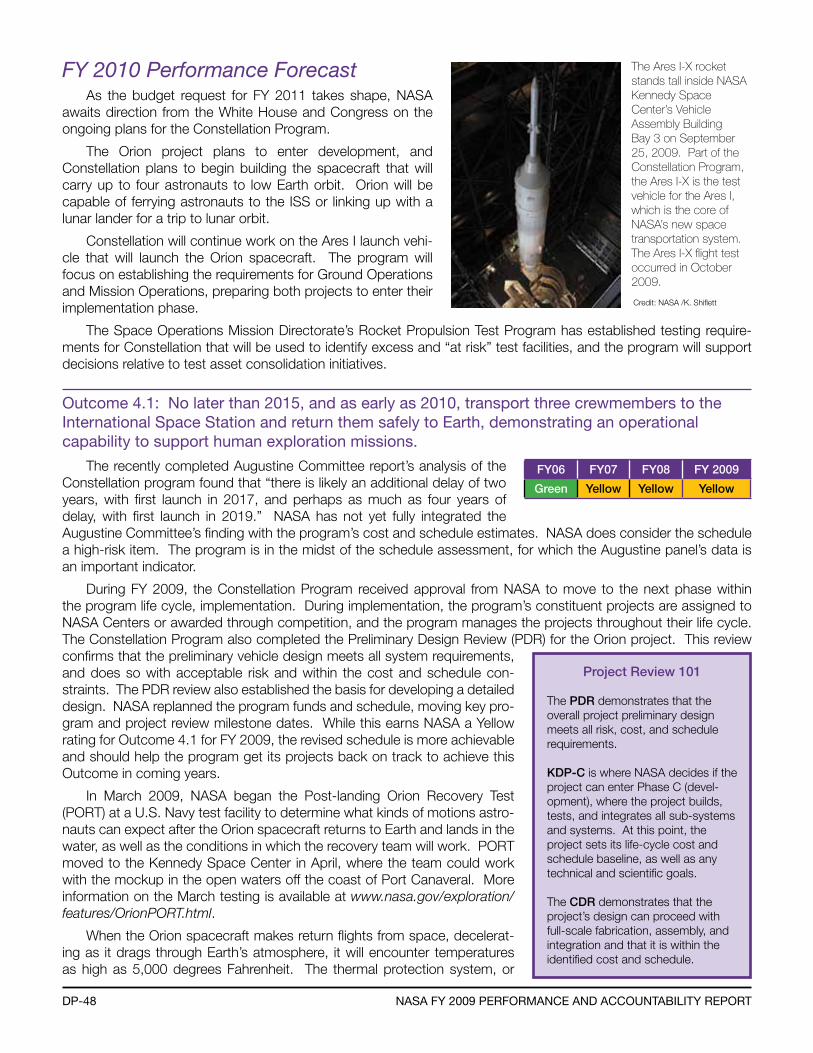
DP-48 naSa fY 2009 Performance anD accountabilitY rePort
FY 2010 Performance ForecastAs the budget request for FY 2011 takes shape, NASA
awaits direction from the White House and Congress on the ongoing plans for the Constellation Program.
The Orion project plans to enter development, and Constellation plans to begin building the spacecraft that will carry up to four astronauts to low Earth orbit. Orion will be capable of ferrying astronauts to the ISS or linking up with a lunar lander for a trip to lunar orbit.
Constellation will continue work on the Ares I launch vehi-cle that will launch the Orion spacecraft. The program will focus on establishing the requirements for Ground Operations and Mission Operations, preparing both projects to enter their implementation phase.
The Space Operations Mission Directorate’s Rocket Propulsion Test Program has established testing require-ments for Constellation that will be used to identify excess and “at risk” test facilities, and the program will support decisions relative to test asset consolidation initiatives.
outcome 4.1: no later than 2015, and as early as 2010, transport three crewmembers to the international Space Station and return them safely to earth, demonstrating an operational capability to support human exploration missions.
The recently completed Augustine Committee report’s analysis of the Constellation program found that “there is likely an additional delay of two years, with first launch in 2017, and perhaps as much as four years of delay, with first launch in 2019.” NASA has not yet fully integrated the Augustine Committee’s finding with the program’s cost and schedule estimates. NASA does consider the schedule a high-risk item. The program is in the midst of the schedule assessment, for which the Augustine panel’s data is an important indicator.
During FY 2009, the Constellation Program received approval from NASA to move to the next phase within the program life cycle, implementation. During implementation, the program’s constituent projects are assigned to NASA Centers or awarded through competition, and the program manages the projects throughout their life cycle. The Constellation Program also completed the Preliminary Design Review (PDR) for the Orion project. This review confirms that the preliminary vehicle design meets all system requirements, and does so with acceptable risk and within the cost and schedule con-straints. The PDR review also established the basis for developing a detailed design. NASA replanned the program funds and schedule, moving key pro-gram and project review milestone dates. While this earns NASA a Yellow rating for Outcome 4.1 for FY 2009, the revised schedule is more achievable and should help the program get its projects back on track to achieve this Outcome in coming years.
In March 2009, NASA began the Post-landing Orion Recovery Test (PORT) at a U.S. Navy test facility to determine what kinds of motions astro-nauts can expect after the Orion spacecraft returns to Earth and lands in the water, as well as the conditions in which the recovery team will work. PORT moved to the Kennedy Space Center in April, where the team could work with the mockup in the open waters off the coast of Port Canaveral. More information on the March testing is available at www.nasa.gov/exploration/features/OrionPORT.html.
When the Orion spacecraft makes return flights from space, decelerat-ing as it drags through Earth’s atmosphere, it will encounter temperatures as high as 5,000 degrees Fahrenheit. The thermal protection system, or
The Ares I-X rocket stands tall inside NASA Kennedy Space Center’s Vehicle Assembly Building Bay 3 on September 25, 2009. Part of the Constellation Program, the Ares I-X is the test vehicle for the Ares I, which is the core of NASA’s new space transportation system. The Ares I-X flight test occurred in October 2009.
FY06 FY07 FY08 FY 2009
Green Yellow Yellow Yellow
Project Review 101
The PDR demonstrates that the overall project preliminary design meets all risk, cost, and schedule requirements.
KDP-C is where NASA decides if the project can enter Phase C (devel-opment), where the project builds, tests, and integrates all sub-systems and systems. At this point, the project sets its life-cycle cost and schedule baseline, as well as any technical and scientific goals.
The CDR demonstrates that the project’s design can proceed with full-scale fabrication, assembly, and integration and that it is within the identified cost and schedule.
Credit: NASA /K. Shiflett
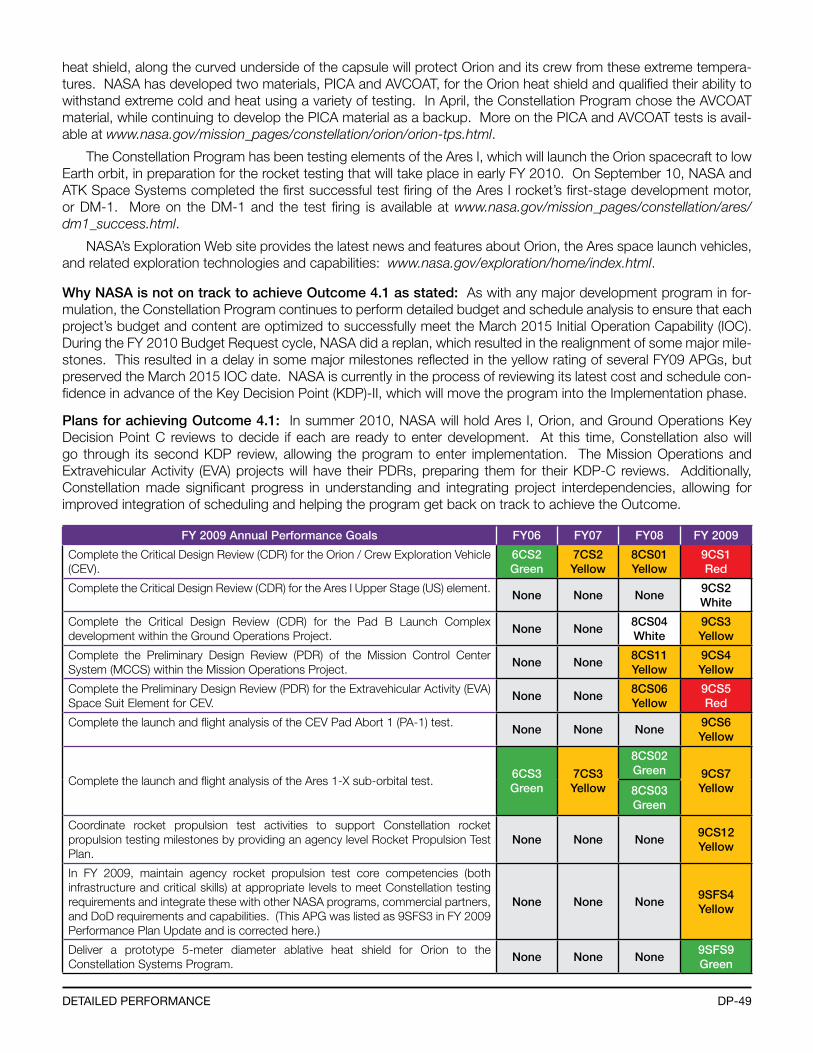
DP-49DetaileD Performance
heat shield, along the curved underside of the capsule will protect Orion and its crew from these extreme tempera-tures. NASA has developed two materials, PICA and AVCOAT, for the Orion heat shield and qualified their ability to withstand extreme cold and heat using a variety of testing. In April, the Constellation Program chose the AVCOAT material, while continuing to develop the PICA material as a backup. More on the PICA and AVCOAT tests is avail-able at www.nasa.gov/mission_pages/constellation/orion/orion-tps.html.
The Constellation Program has been testing elements of the Ares I, which will launch the Orion spacecraft to low Earth orbit, in preparation for the rocket testing that will take place in early FY 2010. On September 10, NASA and ATK Space Systems completed the first successful test firing of the Ares I rocket’s first-stage development motor, or DM-1. More on the DM-1 and the test firing is available at www.nasa.gov/mission_pages/constellation/ares/dm1_success.html.
NASA’s Exploration Web site provides the latest news and features about Orion, the Ares space launch vehicles, and related exploration technologies and capabilities: www.nasa.gov/exploration/home/index.html.
Why NASA is not on track to achieve Outcome 4.1 as stated: As with any major development program in for-mulation, the Constellation Program continues to perform detailed budget and schedule analysis to ensure that each project’s budget and content are optimized to successfully meet the March 2015 Initial Operation Capability (IOC). During the FY 2010 Budget Request cycle, NASA did a replan, which resulted in the realignment of some major mile-stones. This resulted in a delay in some major milestones reflected in the yellow rating of several FY09 APGs, but preserved the March 2015 IOC date. NASA is currently in the process of reviewing its latest cost and schedule con-fidence in advance of the Key Decision Point (KDP)-II, which will move the program into the Implementation phase.
Plans for achieving Outcome 4.1: In summer 2010, NASA will hold Ares I, Orion, and Ground Operations Key Decision Point C reviews to decide if each are ready to enter development. At this time, Constellation also will go through its second KDP review, allowing the program to enter implementation. The Mission Operations and Extravehicular Activity (EVA) projects will have their PDRs, preparing them for their KDP-C reviews. Additionally, Constellation made significant progress in understanding and integrating project interdependencies, allowing for improved integration of scheduling and helping the program get back on track to achieve the Outcome.
FY 2009 Annual Performance Goals FY06 FY07 FY08 FY 2009
Complete the Critical Design Review (CDR) for the Orion / Crew Exploration Vehicle (CEV).
6CS2Green
7CS2Yellow
8CS01Yellow
9CS1Red
Complete the Critical Design Review (CDR) for the Ares I Upper Stage (US) element.None None None
9CS2White
Complete the Critical Design Review (CDR) for the Pad B Launch Complex development within the Ground Operations Project.
None None8CS04White
9CS3Yellow
Complete the Preliminary Design Review (PDR) of the Mission Control Center System (MCCS) within the Mission Operations Project.
None None8CS11Yellow
9CS4Yellow
Complete the Preliminary Design Review (PDR) for the Extravehicular Activity (EVA) Space Suit Element for CEV.
None None8CS06Yellow
9CS5Red
Complete the launch and flight analysis of the CEV Pad Abort 1 (PA-1) test.None None None
9CS6Yellow
Complete the launch and flight analysis of the Ares 1-X sub-orbital test.6CS3Green
7CS3Yellow
8CS02Green 9CS7
Yellow8CS03Green
Coordinate rocket propulsion test activities to support Constellation rocket propulsion testing milestones by providing an agency level Rocket Propulsion Test Plan.
None None None9CS12Yellow
In FY 2009, maintain agency rocket propulsion test core competencies (both infrastructure and critical skills) at appropriate levels to meet Constellation testing requirements and integrate these with other NASA programs, commercial partners, and DoD requirements and capabilities. (This APG was listed as 9SFS3 in FY 2009 Performance Plan Update and is corrected here.)
None None None9SFS4Yellow
Deliver a prototype 5-meter diameter ablative heat shield for Orion to the Constellation Systems Program.
None None None9SFS9Green
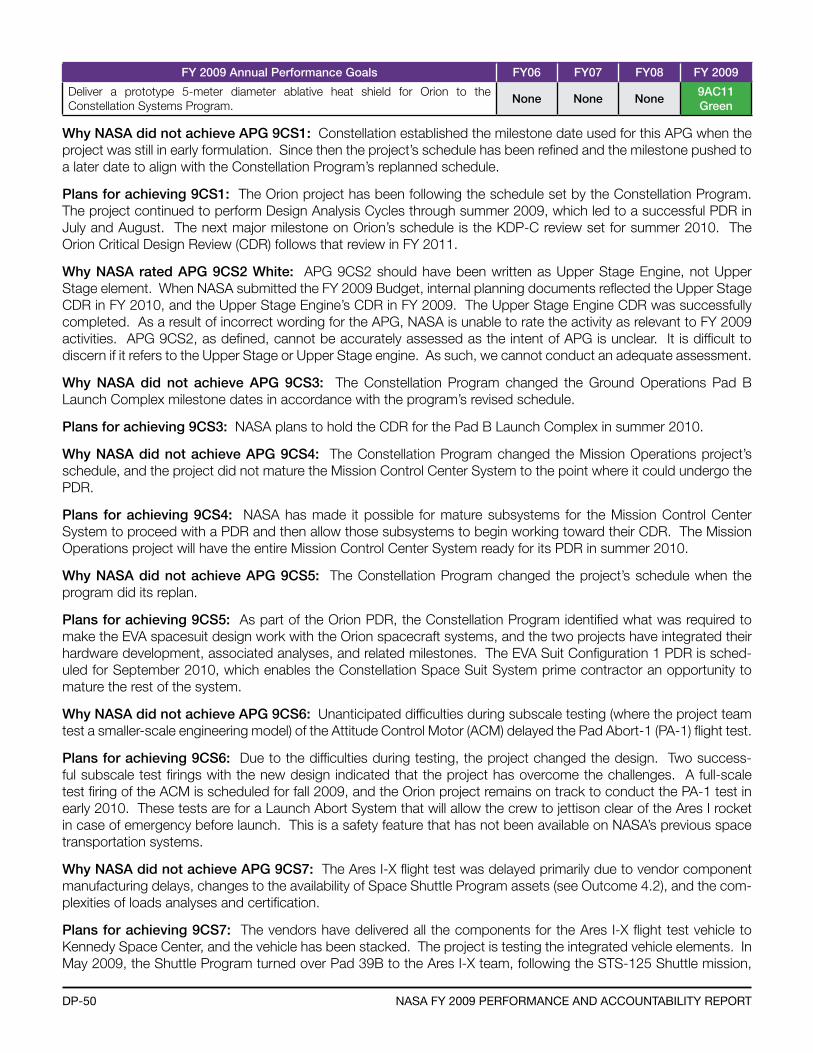
DP-50 naSa fY 2009 Performance anD accountabilitY rePort
FY 2009 Annual Performance Goals FY06 FY07 FY08 FY 2009
Deliver a prototype 5-meter diameter ablative heat shield for Orion to the Constellation Systems Program.
None None None9AC11Green
Why NASA did not achieve APG 9CS1: Constellation established the milestone date used for this APG when the project was still in early formulation. Since then the project’s schedule has been refined and the milestone pushed to a later date to align with the Constellation Program’s replanned schedule.
Plans for achieving 9CS1: The Orion project has been following the schedule set by the Constellation Program. The project continued to perform Design Analysis Cycles through summer 2009, which led to a successful PDR in July and August. The next major milestone on Orion’s schedule is the KDP-C review set for summer 2010. The Orion Critical Design Review (CDR) follows that review in FY 2011.
Why NASA rated APG 9CS2 White: APG 9CS2 should have been written as Upper Stage Engine, not Upper Stage element. When NASA submitted the FY 2009 Budget, internal planning documents reflected the Upper Stage CDR in FY 2010, and the Upper Stage Engine’s CDR in FY 2009. The Upper Stage Engine CDR was successfully completed. As a result of incorrect wording for the APG, NASA is unable to rate the activity as relevant to FY 2009 activities. APG 9CS2, as defined, cannot be accurately assessed as the intent of APG is unclear. It is difficult to discern if it refers to the Upper Stage or Upper Stage engine. As such, we cannot conduct an adequate assessment.
Why NASA did not achieve APG 9CS3: The Constellation Program changed the Ground Operations Pad B Launch Complex milestone dates in accordance with the program’s revised schedule.
Plans for achieving 9CS3: NASA plans to hold the CDR for the Pad B Launch Complex in summer 2010.
Why NASA did not achieve APG 9CS4: The Constellation Program changed the Mission Operations project’s schedule, and the project did not mature the Mission Control Center System to the point where it could undergo the PDR.
Plans for achieving 9CS4: NASA has made it possible for mature subsystems for the Mission Control Center System to proceed with a PDR and then allow those subsystems to begin working toward their CDR. The Mission Operations project will have the entire Mission Control Center System ready for its PDR in summer 2010.
Why NASA did not achieve APG 9CS5: The Constellation Program changed the project’s schedule when the program did its replan.
Plans for achieving 9CS5: As part of the Orion PDR, the Constellation Program identified what was required to make the EVA spacesuit design work with the Orion spacecraft systems, and the two projects have integrated their hardware development, associated analyses, and related milestones. The EVA Suit Configuration 1 PDR is sched-uled for September 2010, which enables the Constellation Space Suit System prime contractor an opportunity to mature the rest of the system.
Why NASA did not achieve APG 9CS6: Unanticipated difficulties during subscale testing (where the project team test a smaller-scale engineering model) of the Attitude Control Motor (ACM) delayed the Pad Abort-1 (PA-1) flight test.
Plans for achieving 9CS6: Due to the difficulties during testing, the project changed the design. Two success-ful subscale test firings with the new design indicated that the project has overcome the challenges. A full-scale test firing of the ACM is scheduled for fall 2009, and the Orion project remains on track to conduct the PA-1 test in early 2010. These tests are for a Launch Abort System that will allow the crew to jettison clear of the Ares I rocket in case of emergency before launch. This is a safety feature that has not been available on NASA’s previous space transportation systems.
Why NASA did not achieve APG 9CS7: The Ares I-X flight test was delayed primarily due to vendor component manufacturing delays, changes to the availability of Space Shuttle Program assets (see Outcome 4.2), and the com-plexities of loads analyses and certification.
Plans for achieving 9CS7: The vendors have delivered all the components for the Ares I-X flight test vehicle to Kennedy Space Center, and the vehicle has been stacked. The project is testing the integrated vehicle elements. In May 2009, the Shuttle Program turned over Pad 39B to the Ares I-X team, following the STS-125 Shuttle mission,
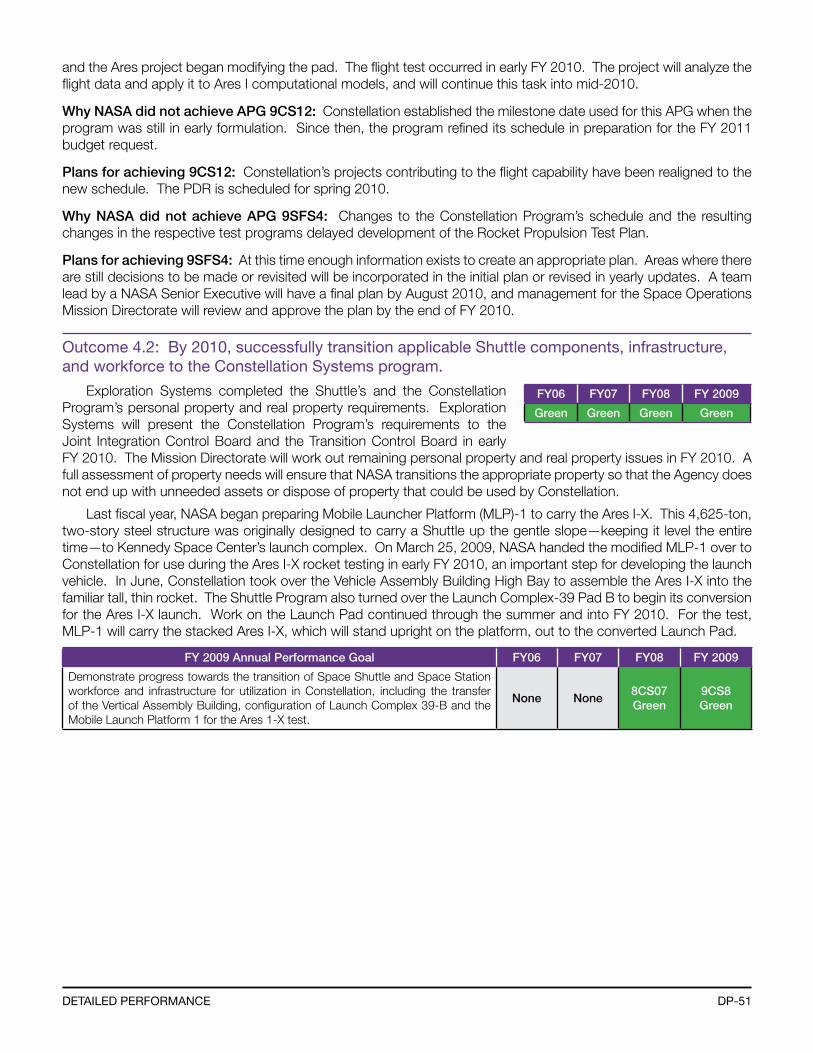
DP-51DetaileD Performance
and the Ares project began modifying the pad. The flight test occurred in early FY 2010. The project will analyze the flight data and apply it to Ares I computational models, and will continue this task into mid-2010.
Why NASA did not achieve APG 9CS12: Constellation established the milestone date used for this APG when the program was still in early formulation. Since then, the program refined its schedule in preparation for the FY 2011 budget request.
Plans for achieving 9CS12: Constellation’s projects contributing to the flight capability have been realigned to the new schedule. The PDR is scheduled for spring 2010.
Why NASA did not achieve APG 9SFS4: Changes to the Constellation Program’s schedule and the resulting changes in the respective test programs delayed development of the Rocket Propulsion Test Plan.
Plans for achieving 9SFS4: At this time enough information exists to create an appropriate plan. Areas where there are still decisions to be made or revisited will be incorporated in the initial plan or revised in yearly updates. A team lead by a NASA Senior Executive will have a final plan by August 2010, and management for the Space Operations Mission Directorate will review and approve the plan by the end of FY 2010.
outcome 4.2: by 2010, successfully transition applicable Shuttle components, infrastructure, and workforce to the constellation Systems program.
Exploration Systems completed the Shuttle’s and the Constellation Program’s personal property and real property requirements. Exploration Systems will present the Constellation Program’s requirements to the Joint Integration Control Board and the Transition Control Board in early FY 2010. The Mission Directorate will work out remaining personal property and real property issues in FY 2010. A full assessment of property needs will ensure that NASA transitions the appropriate property so that the Agency does not end up with unneeded assets or dispose of property that could be used by Constellation.
Last fiscal year, NASA began preparing Mobile Launcher Platform (MLP)-1 to carry the Ares I-X. This 4,625-ton, two-story steel structure was originally designed to carry a Shuttle up the gentle slope—keeping it level the entire time—to Kennedy Space Center’s launch complex. On March 25, 2009, NASA handed the modified MLP-1 over to Constellation for use during the Ares I-X rocket testing in early FY 2010, an important step for developing the launch vehicle. In June, Constellation took over the Vehicle Assembly Building High Bay to assemble the Ares I-X into the familiar tall, thin rocket. The Shuttle Program also turned over the Launch Complex-39 Pad B to begin its conversion for the Ares I-X launch. Work on the Launch Pad continued through the summer and into FY 2010. For the test, MLP-1 will carry the stacked Ares I-X, which will stand upright on the platform, out to the converted Launch Pad.
FY 2009 Annual Performance Goal FY06 FY07 FY08 FY 2009
Demonstrate progress towards the transition of Space Shuttle and Space Station workforce and infrastructure for utilization in Constellation, including the transfer of the Vertical Assembly Building, configuration of Launch Complex 39-B and the Mobile Launch Platform 1 for the Ares 1-X test.
None None8CS07Green
9CS8Green
FY06 FY07 FY08 FY 2009
Green Green Green Green
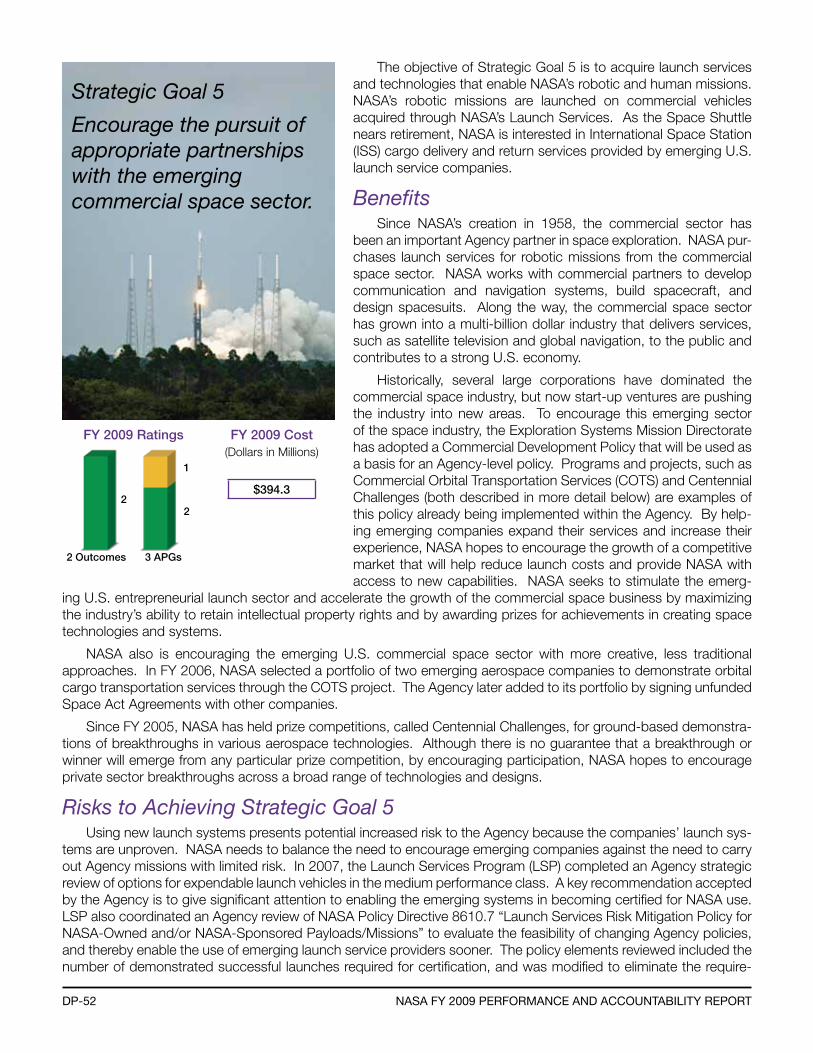
DP-52 naSa fY 2009 Performance anD accountabilitY rePort
Strategic Goal 5
Encourage the pursuit of appropriate partnerships with the emerging commercial space sector.
2 Outcomes 3 APGs
2
FY 2009 Ratings FY 2009 Cost(Dollars in Millions)
$394.3
1
2
The objective of Strategic Goal 5 is to acquire launch services and technologies that enable NASA’s robotic and human missions. NASA’s robotic missions are launched on commercial vehicles acquired through NASA’s Launch Services. As the Space Shuttle nears retirement, NASA is interested in International Space Station (ISS) cargo delivery and return services provided by emerging U.S. launch service companies.
BenefitsSince NASA’s creation in 1958, the commercial sector has
been an important Agency partner in space exploration. NASA pur-chases launch services for robotic missions from the commercial space sector. NASA works with commercial partners to develop communication and navigation systems, build spacecraft, and design spacesuits. Along the way, the commercial space sector has grown into a multi-billion dollar industry that delivers services, such as satellite television and global navigation, to the public and contributes to a strong U.S. economy.
Historically, several large corporations have dominated the commercial space industry, but now start-up ventures are pushing the industry into new areas. To encourage this emerging sector of the space industry, the Exploration Systems Mission Directorate has adopted a Commercial Development Policy that will be used as a basis for an Agency-level policy. Programs and projects, such as Commercial Orbital Transportation Services (COTS) and Centennial Challenges (both described in more detail below) are examples of this policy already being implemented within the Agency. By help-ing emerging companies expand their services and increase their experience, NASA hopes to encourage the growth of a competitive market that will help reduce launch costs and provide NASA with access to new capabilities. NASA seeks to stimulate the emerg-
ing U.S. entrepreneurial launch sector and accelerate the growth of the commercial space business by maximizing the industry’s ability to retain intellectual property rights and by awarding prizes for achievements in creating space technologies and systems.
NASA also is encouraging the emerging U.S. commercial space sector with more creative, less traditional approaches. In FY 2006, NASA selected a portfolio of two emerging aerospace companies to demonstrate orbital cargo transportation services through the COTS project. The Agency later added to its portfolio by signing unfunded Space Act Agreements with other companies.
Since FY 2005, NASA has held prize competitions, called Centennial Challenges, for ground-based demonstra-tions of breakthroughs in various aerospace technologies. Although there is no guarantee that a breakthrough or winner will emerge from any particular prize competition, by encouraging participation, NASA hopes to encourage private sector breakthroughs across a broad range of technologies and designs.
Risks to Achieving Strategic Goal 5Using new launch systems presents potential increased risk to the Agency because the companies’ launch sys-
tems are unproven. NASA needs to balance the need to encourage emerging companies against the need to carry out Agency missions with limited risk. In 2007, the Launch Services Program (LSP) completed an Agency strategic review of options for expendable launch vehicles in the medium performance class. A key recommendation accepted by the Agency is to give significant attention to enabling the emerging systems in becoming certified for NASA use. LSP also coordinated an Agency review of NASA Policy Directive 8610.7 “Launch Services Risk Mitigation Policy for NASA-Owned and/or NASA-Sponsored Payloads/Missions” to evaluate the feasibility of changing Agency policies, and thereby enable the use of emerging launch service providers sooner. The policy elements reviewed included the number of demonstrated successful launches required for certification, and was modified to eliminate the require-
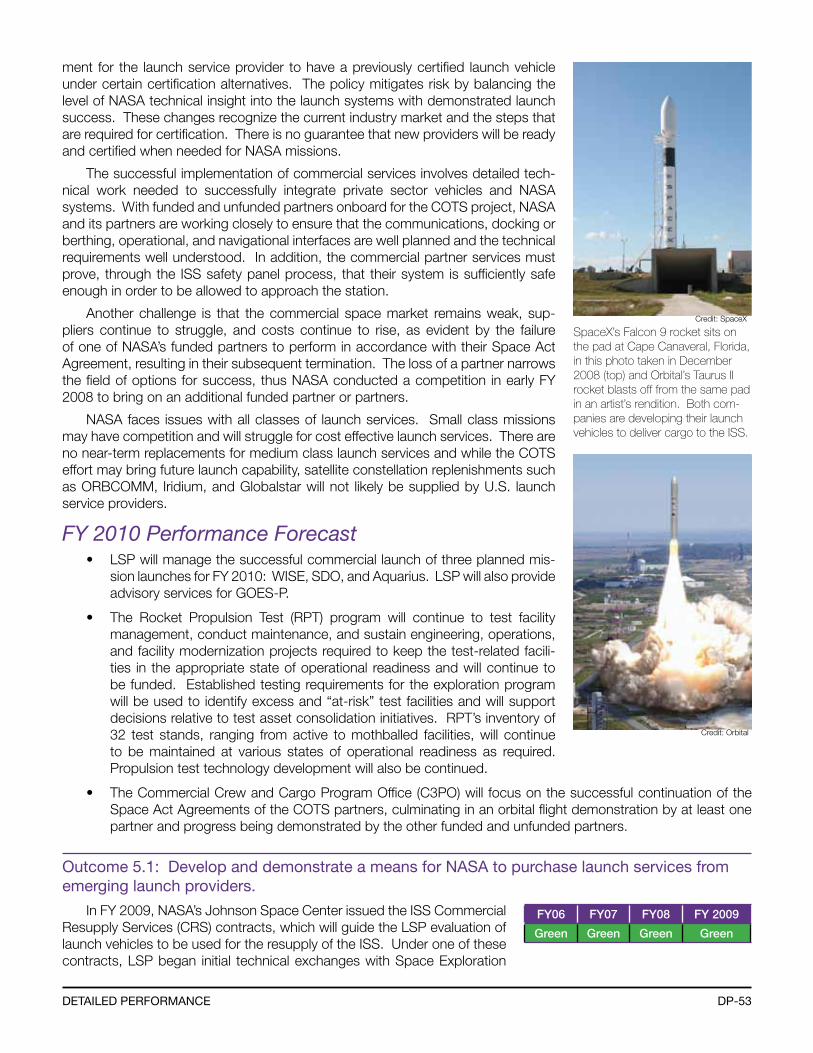
DP-53DetaileD Performance
ment for the launch service provider to have a previously certified launch vehicle under certain certification alternatives. The policy mitigates risk by balancing the level of NASA technical insight into the launch systems with demonstrated launch success. These changes recognize the current industry market and the steps that are required for certification. There is no guarantee that new providers will be ready and certified when needed for NASA missions.
The successful implementation of commercial services involves detailed tech-nical work needed to successfully integrate private sector vehicles and NASA systems. With funded and unfunded partners onboard for the COTS project, NASA and its partners are working closely to ensure that the communications, docking or berthing, operational, and navigational interfaces are well planned and the technical requirements well understood. In addition, the commercial partner services must prove, through the ISS safety panel process, that their system is sufficiently safe enough in order to be allowed to approach the station.
Another challenge is that the commercial space market remains weak, sup-pliers continue to struggle, and costs continue to rise, as evident by the failure of one of NASA’s funded partners to perform in accordance with their Space Act Agreement, resulting in their subsequent termination. The loss of a partner narrows the field of options for success, thus NASA conducted a competition in early FY 2008 to bring on an additional funded partner or partners.
NASA faces issues with all classes of launch services. Small class missions may have competition and will struggle for cost effective launch services. There are no near-term replacements for medium class launch services and while the COTS effort may bring future launch capability, satellite constellation replenishments such as ORBCOMM, Iridium, and Globalstar will not likely be supplied by U.S. launch service providers.
FY 2010 Performance Forecast• LSP will manage the successful commercial launch of three planned mis-
sion launches for FY 2010: WISE, SDO, and Aquarius. LSP will also provide advisory services for GOES-P.
• The Rocket Propulsion Test (RPT) program will continue to test facility management, conduct maintenance, and sustain engineering, operations, and facility modernization projects required to keep the test-related facili-ties in the appropriate state of operational readiness and will continue to be funded. Established testing requirements for the exploration program will be used to identify excess and “at-risk” test facilities and will support decisions relative to test asset consolidation initiatives. RPT’s inventory of 32 test stands, ranging from active to mothballed facilities, will continue to be maintained at various states of operational readiness as required. Propulsion test technology development will also be continued.
• The Commercial Crew and Cargo Program Office (C3PO) will focus on the successful continuation of the Space Act Agreements of the COTS partners, culminating in an orbital flight demonstration by at least one partner and progress being demonstrated by the other funded and unfunded partners.
outcome 5.1: Develop and demonstrate a means for naSa to purchase launch services from emerging launch providers.
In FY 2009, NASA’s Johnson Space Center issued the ISS Commercial Resupply Services (CRS) contracts, which will guide the LSP evaluation of launch vehicles to be used for the resupply of the ISS. Under one of these contracts, LSP began initial technical exchanges with Space Exploration
FY06 FY07 FY08 FY 2009
Green Green Green Green
SpaceX’s Falcon 9 rocket sits on the pad at Cape Canaveral, Florida, in this photo taken in December 2008 (top) and Orbital’s Taurus II rocket blasts off from the same pad in an artist’s rendition. Both com-panies are developing their launch vehicles to deliver cargo to the ISS.
Credit: SpaceX
Credit: Orbital
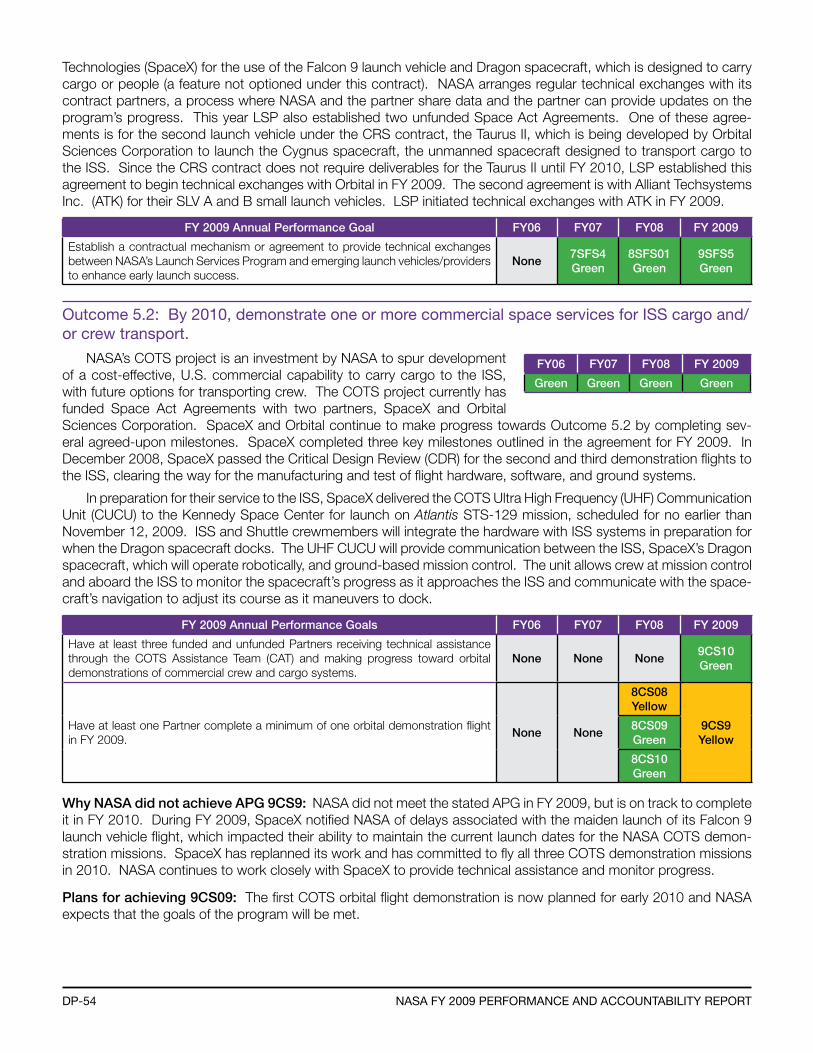
DP-54 naSa fY 2009 Performance anD accountabilitY rePort
Technologies (SpaceX) for the use of the Falcon 9 launch vehicle and Dragon spacecraft, which is designed to carry cargo or people (a feature not optioned under this contract). NASA arranges regular technical exchanges with its contract partners, a process where NASA and the partner share data and the partner can provide updates on the program’s progress. This year LSP also established two unfunded Space Act Agreements. One of these agree-ments is for the second launch vehicle under the CRS contract, the Taurus II, which is being developed by Orbital Sciences Corporation to launch the Cygnus spacecraft, the unmanned spacecraft designed to transport cargo to the ISS. Since the CRS contract does not require deliverables for the Taurus II until FY 2010, LSP established this agreement to begin technical exchanges with Orbital in FY 2009. The second agreement is with Alliant Techsystems Inc. (ATK) for their SLV A and B small launch vehicles. LSP initiated technical exchanges with ATK in FY 2009.
FY 2009 Annual Performance Goal FY06 FY07 FY08 FY 2009
Establish a contractual mechanism or agreement to provide technical exchanges between NASA’s Launch Services Program and emerging launch vehicles/providers to enhance early launch success.
None7SFS4Green
8SFS01Green
9SFS5Green
outcome 5.2: by 2010, demonstrate one or more commercial space services for iSS cargo and/or crew transport.
NASA’s COTS project is an investment by NASA to spur development of a cost-effective, U.S. commercial capability to carry cargo to the ISS, with future options for transporting crew. The COTS project currently has funded Space Act Agreements with two partners, SpaceX and Orbital Sciences Corporation. SpaceX and Orbital continue to make progress towards Outcome 5.2 by completing sev-eral agreed-upon milestones. SpaceX completed three key milestones outlined in the agreement for FY 2009. In December 2008, SpaceX passed the Critical Design Review (CDR) for the second and third demonstration flights to the ISS, clearing the way for the manufacturing and test of flight hardware, software, and ground systems.
In preparation for their service to the ISS, SpaceX delivered the COTS Ultra High Frequency (UHF) Communication Unit (CUCU) to the Kennedy Space Center for launch on Atlantis STS-129 mission, scheduled for no earlier than November 12, 2009. ISS and Shuttle crewmembers will integrate the hardware with ISS systems in preparation for when the Dragon spacecraft docks. The UHF CUCU will provide communication between the ISS, SpaceX’s Dragon spacecraft, which will operate robotically, and ground-based mission control. The unit allows crew at mission control and aboard the ISS to monitor the spacecraft’s progress as it approaches the ISS and communicate with the space-craft’s navigation to adjust its course as it maneuvers to dock.
FY 2009 Annual Performance Goals FY06 FY07 FY08 FY 2009
Have at least three funded and unfunded Partners receiving technical assistance through the COTS Assistance Team (CAT) and making progress toward orbital demonstrations of commercial crew and cargo systems.
None None None9CS10Green
Have at least one Partner complete a minimum of one orbital demonstration flight in FY 2009.
None None
8CS08Yellow
9CS9Yellow
8CS09Green
8CS10Green
Why NASA did not achieve APG 9CS9: NASA did not meet the stated APG in FY 2009, but is on track to complete it in FY 2010. During FY 2009, SpaceX notified NASA of delays associated with the maiden launch of its Falcon 9 launch vehicle flight, which impacted their ability to maintain the current launch dates for the NASA COTS demon-stration missions. SpaceX has replanned its work and has committed to fly all three COTS demonstration missions in 2010. NASA continues to work closely with SpaceX to provide technical assistance and monitor progress.
Plans for achieving 9CS09: The first COTS orbital flight demonstration is now planned for early 2010 and NASA expects that the goals of the program will be met.
FY06 FY07 FY08 FY 2009
Green Green Green Green

DP-55DetaileD Performance
Strategic Goal 6
Establish a lunar return program having the maximum possible utility for later missions to Mars and other destinations.
5 Outcomes 10 APGs
5
FY 2009 Ratings FY 2009 Cost(Dollars in Millions)
$1,356.0
1
8
1
Missions to the Moon in the 21st century will be vastly different from the Apollo missions of the 1960s and 1970s. Future missions will carry more crewmembers, expand the range of lunar landing sites, and increase the length of time astronauts spend exploring the lunar surface. Future explorers will experiment with using lunar resources (e.g., possible water ice located deep within lunar cra-ters) to reduce the amount of supplies that must be brought from Earth and to support an extended human presence on the Moon.
To achieve Strategic Goal 6, NASA is leveraging partnerships with industry and the international space community to acquire next-generation technologies for life support, communications and navigation, radiation shielding, power generation and storage, pro-pulsion, and resource extraction and processing.
NASA is laying the foundation for the lunar return program by focusing Agency research on robotic reconnaissance explorers, surface nuclear power systems, and advanced communications systems. These technologies will support the lunar return program and will evolve and be adapted to support future Mars missions.12
BenefitsNASA and the Agency’s partners transfer advanced space
exploration systems and capabilities—power generation, commu-nications, computing, robotics, and improved materials from space exploration research and execution—to the commercial sector to serve public, national, and global needs. In the past, technologies developed for space exploration have yielded ground-based appli-cations, such as non-polluting solar energy systems, advanced batteries for laptop computers and cell phones, and fuel cells for electric vehicles.
The activities under Strategic Goal 6 lay the groundwork for NASA’s future human space exploration goals. With the successful completion of these activities, NASA will have the technologies and capabilities to support humans on the Moon by the time the Orion Crew Exploration Vehicle and the Ares launch vehicles are fully operational. Until then, these activities will benefit other efforts across NASA: new power generation and nuclear technologies will help future space exploration missions; autonomous systems and integrated systems health management can make air travel safer and more efficient; and improved space com-munications enable better data delivery to and from the Space Shuttle, the International Space Station (ISS), and robotic spacecraft.
Risks to Achieving Strategic Goal 6The Advanced Capabilities Theme develops new, advanced technologies for NASA’s robotic and human explo-
ration missions. Many of the projects conducted by the Advanced Capabilities Exploration Technology Development Program (ETDP) are either in formulation or early stages of development. As such, they are subject to challenges that affect any project in its early stages:
• Reductions in planned budget may prevent technologies from being matured in time to support preliminary design of flight systems;
• The evolving lunar program architecture may cause technology development priorities to change; and
• Technologies may be more difficult to develop to the required level of maturity than originally anticipated.
12For more information on NASA missions, please see NASA’s Missions at a Glance, located in the Other Accompanying Information section of this document.
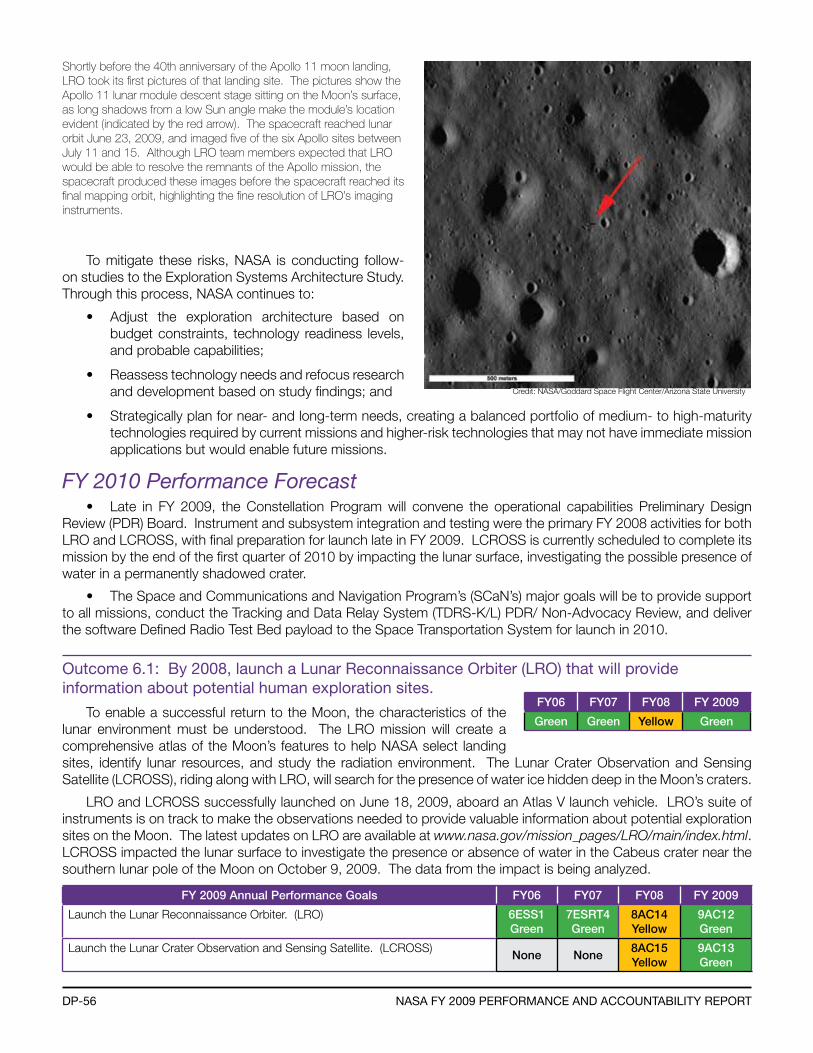
DP-56 naSa fY 2009 Performance anD accountabilitY rePort
To mitigate these risks, NASA is conducting follow-on studies to the Exploration Systems Architecture Study. Through this process, NASA continues to:
• Adjust the exploration architecture based on budget constraints, technology readiness levels, and probable capabilities;
• Reassess technology needs and refocus research and development based on study findings; and
• Strategically plan for near- and long-term needs, creating a balanced portfolio of medium- to high-maturity technologies required by current missions and higher-risk technologies that may not have immediate mission applications but would enable future missions.
FY 2010 Performance Forecast• Late in FY 2009, the Constellation Program will convene the operational capabilities Preliminary Design
Review (PDR) Board. Instrument and subsystem integration and testing were the primary FY 2008 activities for both LRO and LCROSS, with final preparation for launch late in FY 2009. LCROSS is currently scheduled to complete its mission by the end of the first quarter of 2010 by impacting the lunar surface, investigating the possible presence of water in a permanently shadowed crater.
• The Space and Communications and Navigation Program’s (SCaN’s) major goals will be to provide support to all missions, conduct the Tracking and Data Relay System (TDRS-K/L) PDR/ Non-Advocacy Review, and deliver the software Defined Radio Test Bed payload to the Space Transportation System for launch in 2010.
outcome 6.1: by 2008, launch a lunar reconnaissance orbiter (lro) that will provide information about potential human exploration sites.
To enable a successful return to the Moon, the characteristics of the lunar environment must be understood. The LRO mission will create a comprehensive atlas of the Moon’s features to help NASA select landing sites, identify lunar resources, and study the radiation environment. The Lunar Crater Observation and Sensing Satellite (LCROSS), riding along with LRO, will search for the presence of water ice hidden deep in the Moon’s craters.
LRO and LCROSS successfully launched on June 18, 2009, aboard an Atlas V launch vehicle. LRO’s suite of instruments is on track to make the observations needed to provide valuable information about potential exploration sites on the Moon. The latest updates on LRO are available at www.nasa.gov/mission_pages/LRO/main/index.html. LCROSS impacted the lunar surface to investigate the presence or absence of water in the Cabeus crater near the southern lunar pole of the Moon on October 9, 2009. The data from the impact is being analyzed.
FY 2009 Annual Performance Goals FY06 FY07 FY08 FY 2009
Launch the Lunar Reconnaissance Orbiter. (LRO) 6ESS1Green
7ESRT4Green
8AC14Yellow
9AC12Green
Launch the Lunar Crater Observation and Sensing Satellite. (LCROSS)None None
8AC15Yellow
9AC13Green
FY06 FY07 FY08 FY 2009
Green Green Yellow Green
Shortly before the 40th anniversary of the Apollo 11 moon landing, LRO took its first pictures of that landing site. The pictures show the Apollo 11 lunar module descent stage sitting on the Moon’s surface, as long shadows from a low Sun angle make the module’s location evident (indicated by the red arrow). The spacecraft reached lunar orbit June 23, 2009, and imaged five of the six Apollo sites between July 11 and 15. Although LRO team members expected that LRO would be able to resolve the remnants of the Apollo mission, the spacecraft produced these images before the spacecraft reached its final mapping orbit, highlighting the fine resolution of LRO’s imaging instruments.
Credit: NASA/Goddard Space Flight Center/Arizona State University
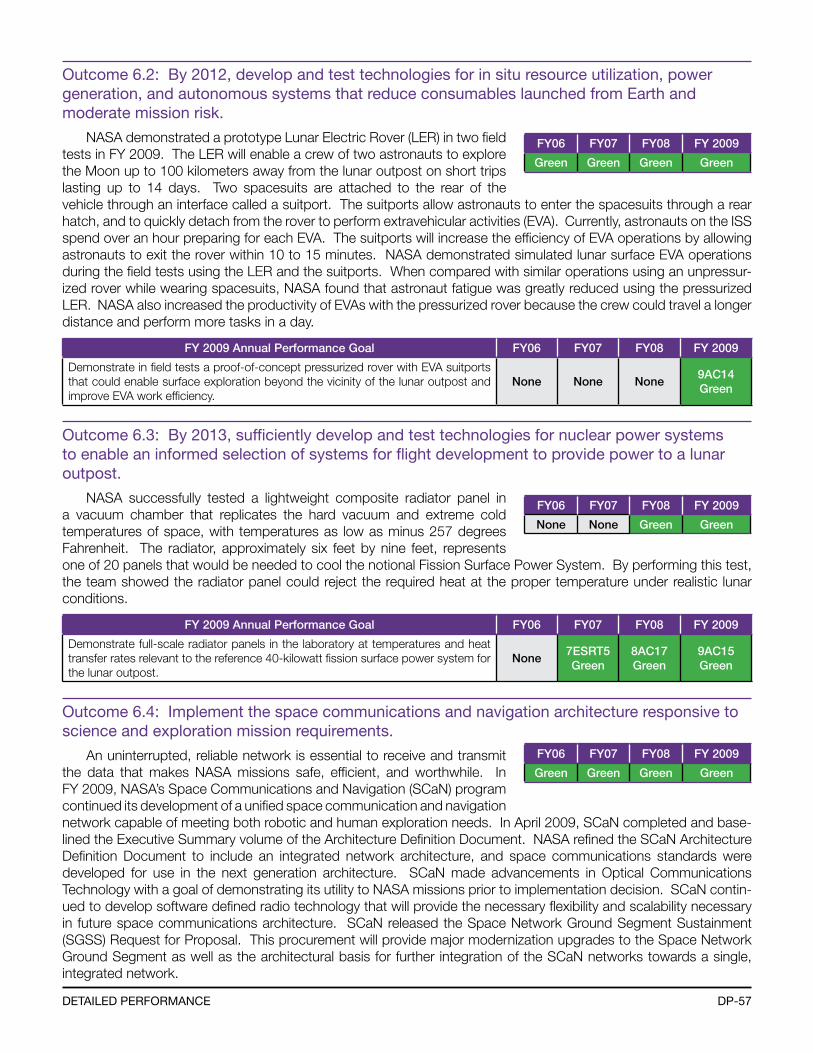
DP-57DetaileD Performance
outcome 6.2: by 2012, develop and test technologies for in situ resource utilization, power generation, and autonomous systems that reduce consumables launched from earth and moderate mission risk.
NASA demonstrated a prototype Lunar Electric Rover (LER) in two field tests in FY 2009. The LER will enable a crew of two astronauts to explore the Moon up to 100 kilometers away from the lunar outpost on short trips lasting up to 14 days. Two spacesuits are attached to the rear of the vehicle through an interface called a suitport. The suitports allow astronauts to enter the spacesuits through a rear hatch, and to quickly detach from the rover to perform extravehicular activities (EVA). Currently, astronauts on the ISS spend over an hour preparing for each EVA. The suitports will increase the efficiency of EVA operations by allowing astronauts to exit the rover within 10 to 15 minutes. NASA demonstrated simulated lunar surface EVA operations during the field tests using the LER and the suitports. When compared with similar operations using an unpressur-ized rover while wearing spacesuits, NASA found that astronaut fatigue was greatly reduced using the pressurized LER. NASA also increased the productivity of EVAs with the pressurized rover because the crew could travel a longer distance and perform more tasks in a day.
FY 2009 Annual Performance Goal FY06 FY07 FY08 FY 2009
Demonstrate in field tests a proof-of-concept pressurized rover with EVA suitports that could enable surface exploration beyond the vicinity of the lunar outpost and improve EVA work efficiency.
None None None9AC14Green
outcome 6.3: by 2013, sufficiently develop and test technologies for nuclear power systems to enable an informed selection of systems for flight development to provide power to a lunar outpost.
NASA successfully tested a lightweight composite radiator panel in a vacuum chamber that replicates the hard vacuum and extreme cold temperatures of space, with temperatures as low as minus 257 degrees Fahrenheit. The radiator, approximately six feet by nine feet, represents one of 20 panels that would be needed to cool the notional Fission Surface Power System. By performing this test, the team showed the radiator panel could reject the required heat at the proper temperature under realistic lunar conditions.
FY 2009 Annual Performance Goal FY06 FY07 FY08 FY 2009
Demonstrate full-scale radiator panels in the laboratory at temperatures and heat transfer rates relevant to the reference 40-kilowatt fission surface power system for the lunar outpost.
None7ESRT5Green
8AC17Green
9AC15Green
outcome 6.4: implement the space communications and navigation architecture responsive to science and exploration mission requirements.
An uninterrupted, reliable network is essential to receive and transmit the data that makes NASA missions safe, efficient, and worthwhile. In FY 2009, NASA’s Space Communications and Navigation (SCaN) program continued its development of a unified space communication and navigation network capable of meeting both robotic and human exploration needs. In April 2009, SCaN completed and base-lined the Executive Summary volume of the Architecture Definition Document. NASA refined the SCaN Architecture Definition Document to include an integrated network architecture, and space communications standards were developed for use in the next generation architecture. SCaN made advancements in Optical Communications Technology with a goal of demonstrating its utility to NASA missions prior to implementation decision. SCaN contin-ued to develop software defined radio technology that will provide the necessary flexibility and scalability necessary in future space communications architecture. SCaN released the Space Network Ground Segment Sustainment (SGSS) Request for Proposal. This procurement will provide major modernization upgrades to the Space Network Ground Segment as well as the architectural basis for further integration of the SCaN networks towards a single, integrated network.
FY06 FY07 FY08 FY 2009
Green Green Green Green
FY06 FY07 FY08 FY 2009
None None Green Green
FY06 FY07 FY08 FY 2009
Green Green Green Green
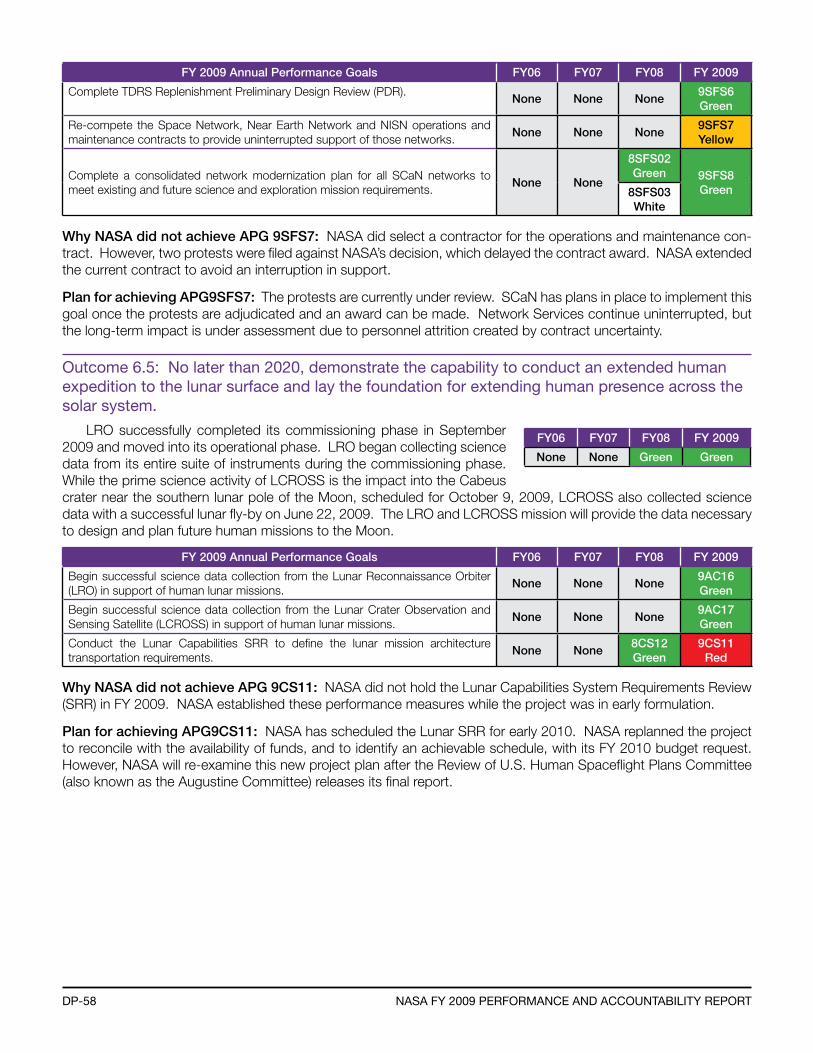
DP-58 naSa fY 2009 Performance anD accountabilitY rePort
FY 2009 Annual Performance Goals FY06 FY07 FY08 FY 2009
Complete TDRS Replenishment Preliminary Design Review (PDR).None None None
9SFS6Green
Re-compete the Space Network, Near Earth Network and NISN operations and maintenance contracts to provide uninterrupted support of those networks.
None None None9SFS7Yellow
Complete a consolidated network modernization plan for all SCaN networks to meet existing and future science and exploration mission requirements.
None None
8SFS02Green 9SFS8
Green8SFS03White
Why NASA did not achieve APG 9SFS7: NASA did select a contractor for the operations and maintenance con-tract. However, two protests were filed against NASA’s decision, which delayed the contract award. NASA extended the current contract to avoid an interruption in support.
Plan for achieving APG9SFS7: The protests are currently under review. SCaN has plans in place to implement this goal once the protests are adjudicated and an award can be made. Network Services continue uninterrupted, but the long-term impact is under assessment due to personnel attrition created by contract uncertainty.
outcome 6.5: no later than 2020, demonstrate the capability to conduct an extended human expedition to the lunar surface and lay the foundation for extending human presence across the solar system.
LRO successfully completed its commissioning phase in September 2009 and moved into its operational phase. LRO began collecting science data from its entire suite of instruments during the commissioning phase. While the prime science activity of LCROSS is the impact into the Cabeus crater near the southern lunar pole of the Moon, scheduled for October 9, 2009, LCROSS also collected science data with a successful lunar fly-by on June 22, 2009. The LRO and LCROSS mission will provide the data necessary to design and plan future human missions to the Moon.
FY 2009 Annual Performance Goals FY06 FY07 FY08 FY 2009
Begin successful science data collection from the Lunar Reconnaissance Orbiter (LRO) in support of human lunar missions.
None None None9AC16Green
Begin successful science data collection from the Lunar Crater Observation and Sensing Satellite (LCROSS) in support of human lunar missions.
None None None9AC17Green
Conduct the Lunar Capabilities SRR to define the lunar mission architecture transportation requirements.
None None8CS12Green
9CS11Red
Why NASA did not achieve APG 9CS11: NASA did not hold the Lunar Capabilities System Requirements Review (SRR) in FY 2009. NASA established these performance measures while the project was in early formulation.
Plan for achieving APG9CS11: NASA has scheduled the Lunar SRR for early 2010. NASA replanned the project to reconcile with the availability of funds, and to identify an achievable schedule, with its FY 2010 budget request. However, NASA will re-examine this new project plan after the Review of U.S. Human Spaceflight Plans Committee (also known as the Augustine Committee) releases its final report.
FY06 FY07 FY08 FY 2009
None None Green Green
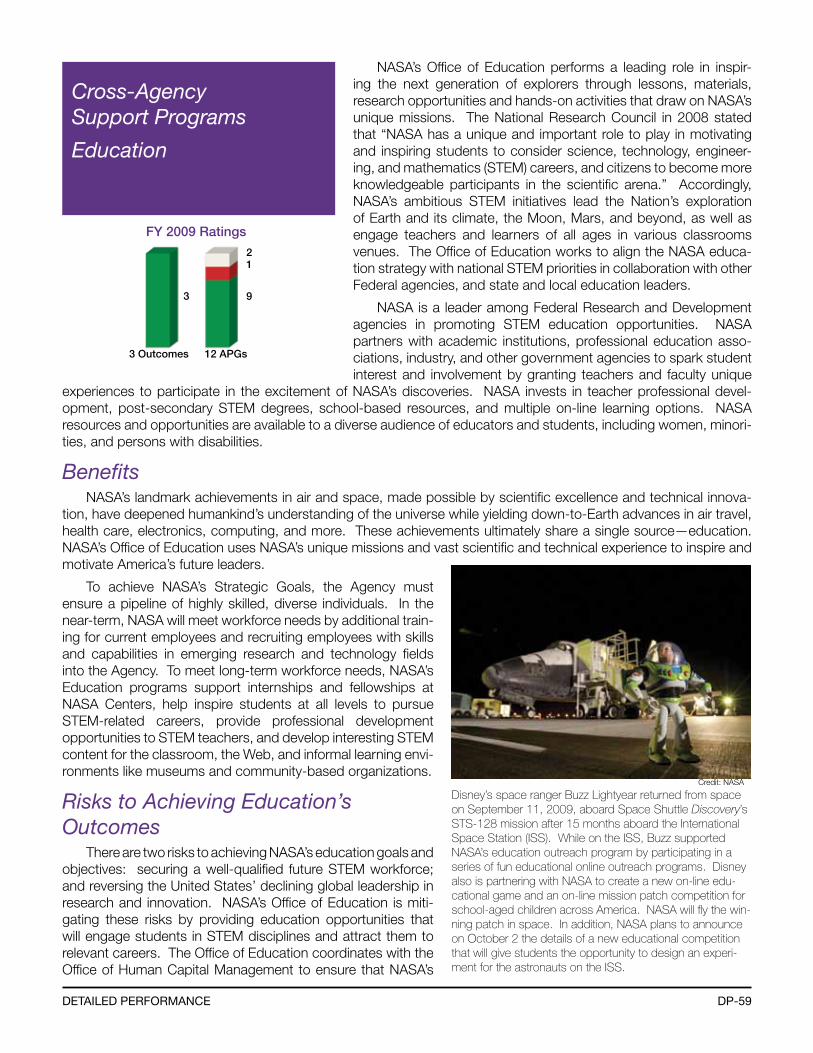
DP-59DetaileD Performance
Cross-Agency Support Programs
Education
3 Outcomes 12 APGs
3
FY 2009 Ratings
1
9
2
NASA’s Office of Education performs a leading role in inspir-ing the next generation of explorers through lessons, materials, research opportunities and hands-on activities that draw on NASA’s unique missions. The National Research Council in 2008 stated that “NASA has a unique and important role to play in motivating and inspiring students to consider science, technology, engineer-ing, and mathematics (STEM) careers, and citizens to become more knowledgeable participants in the scientific arena.” Accordingly, NASA’s ambitious STEM initiatives lead the Nation’s exploration of Earth and its climate, the Moon, Mars, and beyond, as well as engage teachers and learners of all ages in various classrooms venues. The Office of Education works to align the NASA educa-tion strategy with national STEM priorities in collaboration with other Federal agencies, and state and local education leaders.
NASA is a leader among Federal Research and Development agencies in promoting STEM education opportunities. NASA partners with academic institutions, professional education asso-ciations, industry, and other government agencies to spark student interest and involvement by granting teachers and faculty unique
experiences to participate in the excitement of NASA’s discoveries. NASA invests in teacher professional devel-opment, post-secondary STEM degrees, school-based resources, and multiple on-line learning options. NASA resources and opportunities are available to a diverse audience of educators and students, including women, minori-ties, and persons with disabilities.
Benefits NASA’s landmark achievements in air and space, made possible by scientific excellence and technical innova-
tion, have deepened humankind’s understanding of the universe while yielding down-to-Earth advances in air travel, health care, electronics, computing, and more. These achievements ultimately share a single source—education. NASA’s Office of Education uses NASA’s unique missions and vast scientific and technical experience to inspire and motivate America’s future leaders.
To achieve NASA’s Strategic Goals, the Agency must ensure a pipeline of highly skilled, diverse individuals. In the near-term, NASA will meet workforce needs by additional train-ing for current employees and recruiting employees with skills and capabilities in emerging research and technology fields into the Agency. To meet long-term workforce needs, NASA’s Education programs support internships and fellowships at NASA Centers, help inspire students at all levels to pursue STEM-related careers, provide professional development opportunities to STEM teachers, and develop interesting STEM content for the classroom, the Web, and informal learning envi-ronments like museums and community-based organizations.
Risks to Achieving Education’s Outcomes
There are two risks to achieving NASA’s education goals and objectives: securing a well-qualified future STEM workforce; and reversing the United States’ declining global leadership in research and innovation. NASA’s Office of Education is miti-gating these risks by providing education opportunities that will engage students in STEM disciplines and attract them to relevant careers. The Office of Education coordinates with the Office of Human Capital Management to ensure that NASA’s
Disney’s space ranger Buzz Lightyear returned from space on September 11, 2009, aboard Space Shuttle Discovery’s STS-128 mission after 15 months aboard the International Space Station (ISS). While on the ISS, Buzz supported NASA’s education outreach program by participating in a series of fun educational online outreach programs. Disney also is partnering with NASA to create a new on-line edu-cational game and an on-line mission patch competition for school-aged children across America. NASA will fly the win-ning patch in space. In addition, NASA plans to announce on October 2 the details of a new educational competition that will give students the opportunity to design an experi-ment for the astronauts on the ISS.
Credit: NASA
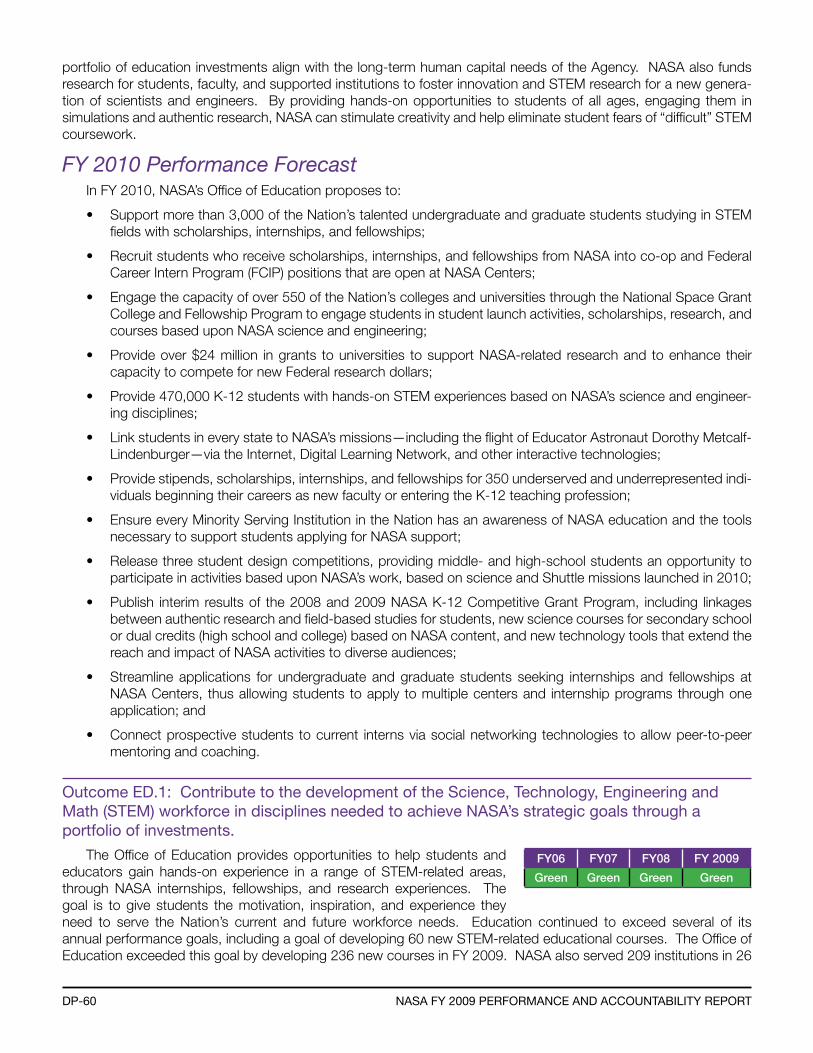
DP-60 naSa fY 2009 Performance anD accountabilitY rePort
portfolio of education investments align with the long-term human capital needs of the Agency. NASA also funds research for students, faculty, and supported institutions to foster innovation and STEM research for a new genera-tion of scientists and engineers. By providing hands-on opportunities to students of all ages, engaging them in simulations and authentic research, NASA can stimulate creativity and help eliminate student fears of “difficult” STEM coursework.
FY 2010 Performance ForecastIn FY 2010, NASA’s Office of Education proposes to:
• Support more than 3,000 of the Nation’s talented undergraduate and graduate students studying in STEM fields with scholarships, internships, and fellowships;
• Recruit students who receive scholarships, internships, and fellowships from NASA into co-op and Federal Career Intern Program (FCIP) positions that are open at NASA Centers;
• Engage the capacity of over 550 of the Nation’s colleges and universities through the National Space Grant College and Fellowship Program to engage students in student launch activities, scholarships, research, and courses based upon NASA science and engineering;
• Provide over $24 million in grants to universities to support NASA-related research and to enhance their capacity to compete for new Federal research dollars;
• Provide 470,000 K-12 students with hands-on STEM experiences based on NASA’s science and engineer-ing disciplines;
• Link students in every state to NASA’s missions—including the flight of Educator Astronaut Dorothy Metcalf-Lindenburger—via the Internet, Digital Learning Network, and other interactive technologies;
• Provide stipends, scholarships, internships, and fellowships for 350 underserved and underrepresented indi-viduals beginning their careers as new faculty or entering the K-12 teaching profession;
• Ensure every Minority Serving Institution in the Nation has an awareness of NASA education and the tools necessary to support students applying for NASA support;
• Release three student design competitions, providing middle- and high-school students an opportunity to participate in activities based upon NASA’s work, based on science and Shuttle missions launched in 2010;
• Publish interim results of the 2008 and 2009 NASA K-12 Competitive Grant Program, including linkages between authentic research and field-based studies for students, new science courses for secondary school or dual credits (high school and college) based on NASA content, and new technology tools that extend the reach and impact of NASA activities to diverse audiences;
• Streamline applications for undergraduate and graduate students seeking internships and fellowships at NASA Centers, thus allowing students to apply to multiple centers and internship programs through one application; and
• Connect prospective students to current interns via social networking technologies to allow peer-to-peer mentoring and coaching.
outcome eD.1: contribute to the development of the Science, technology, engineering and math (Stem) workforce in disciplines needed to achieve naSa’s strategic goals through a portfolio of investments.
The Office of Education provides opportunities to help students and educators gain hands-on experience in a range of STEM-related areas, through NASA internships, fellowships, and research experiences. The goal is to give students the motivation, inspiration, and experience they need to serve the Nation’s current and future workforce needs. Education continued to exceed several of its annual performance goals, including a goal of developing 60 new STEM-related educational courses. The Office of Education exceeded this goal by developing 236 new courses in FY 2009. NASA also served 209 institutions in 26
FY06 FY07 FY08 FY 2009
Green Green Green Green
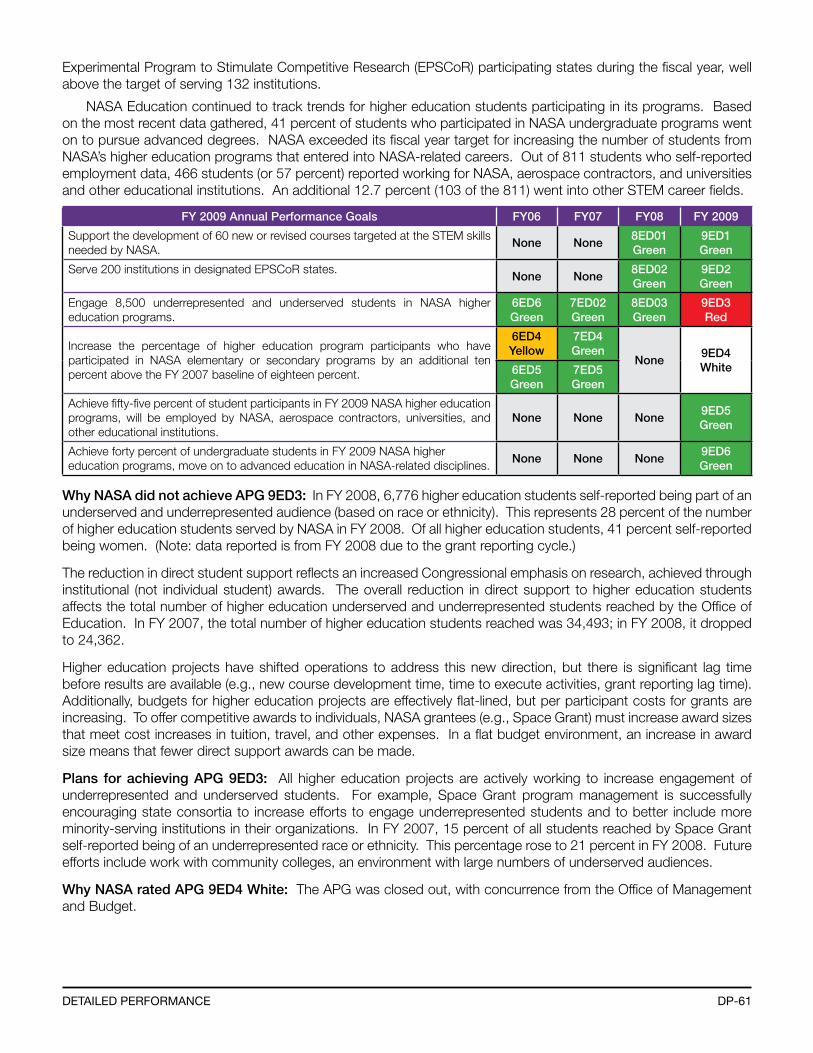
DP-61DetaileD Performance
Experimental Program to Stimulate Competitive Research (EPSCoR) participating states during the fiscal year, well above the target of serving 132 institutions.
NASA Education continued to track trends for higher education students participating in its programs. Based on the most recent data gathered, 41 percent of students who participated in NASA undergraduate programs went on to pursue advanced degrees. NASA exceeded its fiscal year target for increasing the number of students from NASA’s higher education programs that entered into NASA-related careers. Out of 811 students who self-reported employment data, 466 students (or 57 percent) reported working for NASA, aerospace contractors, and universities and other educational institutions. An additional 12.7 percent (103 of the 811) went into other STEM career fields.
FY 2009 Annual Performance Goals FY06 FY07 FY08 FY 2009
Support the development of 60 new or revised courses targeted at the STEM skills needed by NASA.
None None8ED01Green
9ED1Green
Serve 200 institutions in designated EPSCoR states.None None
8ED02Green
9ED2Green
Engage 8,500 underrepresented and underserved students in NASA higher education programs.
6ED6Green
7ED02Green
8ED03Green
9ED3Red
Increase the percentage of higher education program participants who have participated in NASA elementary or secondary programs by an additional ten percent above the FY 2007 baseline of eighteen percent.
6ED4Yellow
7ED4Green
None9ED4White6ED5
Green7ED5Green
Achieve fifty-five percent of student participants in FY 2009 NASA higher education programs, will be employed by NASA, aerospace contractors, universities, and other educational institutions.
None None None9ED5Green
Achieve forty percent of undergraduate students in FY 2009 NASA higher education programs, move on to advanced education in NASA-related disciplines.
None None None9ED6Green
Why NASA did not achieve APG 9ED3: In FY 2008, 6,776 higher education students self-reported being part of an underserved and underrepresented audience (based on race or ethnicity). This represents 28 percent of the number of higher education students served by NASA in FY 2008. Of all higher education students, 41 percent self-reported being women. (Note: data reported is from FY 2008 due to the grant reporting cycle.)
The reduction in direct student support reflects an increased Congressional emphasis on research, achieved through institutional (not individual student) awards. The overall reduction in direct support to higher education students affects the total number of higher education underserved and underrepresented students reached by the Office of Education. In FY 2007, the total number of higher education students reached was 34,493; in FY 2008, it dropped to 24,362.
Higher education projects have shifted operations to address this new direction, but there is significant lag time before results are available (e.g., new course development time, time to execute activities, grant reporting lag time). Additionally, budgets for higher education projects are effectively flat-lined, but per participant costs for grants are increasing. To offer competitive awards to individuals, NASA grantees (e.g., Space Grant) must increase award sizes that meet cost increases in tuition, travel, and other expenses. In a flat budget environment, an increase in award size means that fewer direct support awards can be made.
Plans for achieving APG 9ED3: All higher education projects are actively working to increase engagement of underrepresented and underserved students. For example, Space Grant program management is successfully encouraging state consortia to increase efforts to engage underrepresented students and to better include more minority-serving institutions in their organizations. In FY 2007, 15 percent of all students reached by Space Grant self-reported being of an underrepresented race or ethnicity. This percentage rose to 21 percent in FY 2008. Future efforts include work with community colleges, an environment with large numbers of underserved audiences.
Why NASA rated APG 9ED4 White: The APG was closed out, with concurrence from the Office of Management and Budget.
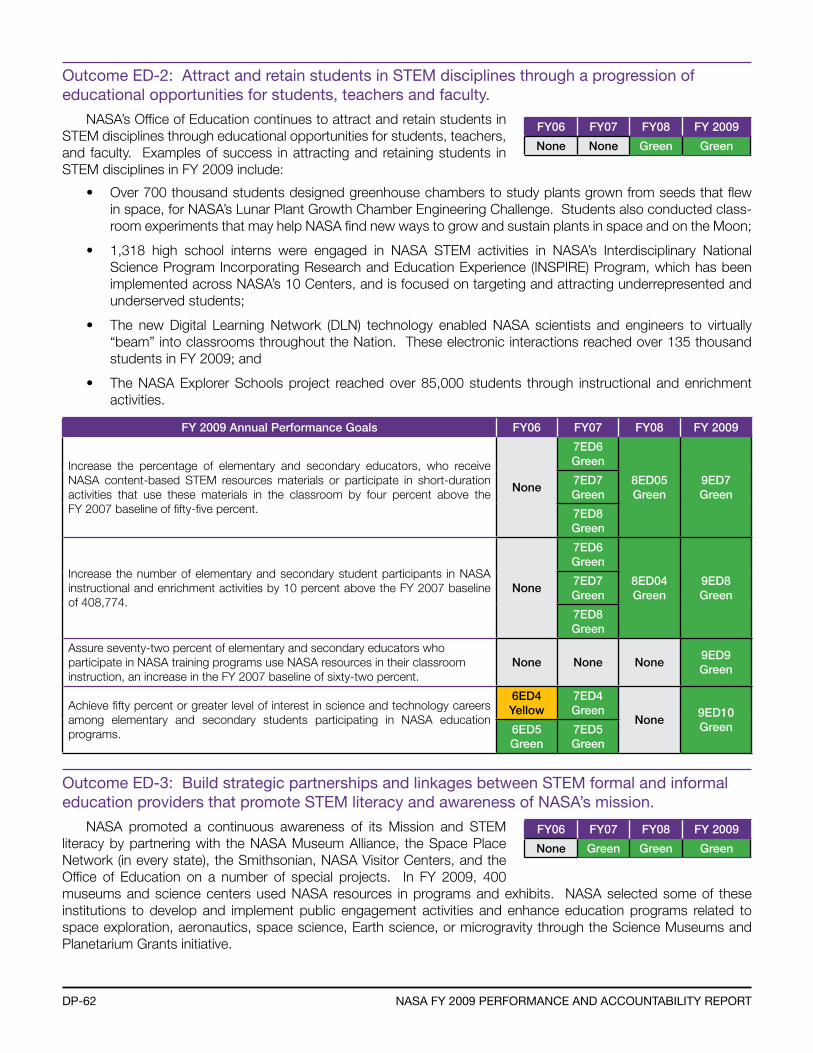
DP-62 naSa fY 2009 Performance anD accountabilitY rePort
outcome eD-2: attract and retain students in Stem disciplines through a progression of educational opportunities for students, teachers and faculty.
NASA’s Office of Education continues to attract and retain students in STEM disciplines through educational opportunities for students, teachers, and faculty. Examples of success in attracting and retaining students in STEM disciplines in FY 2009 include:
• Over 700 thousand students designed greenhouse chambers to study plants grown from seeds that flew in space, for NASA’s Lunar Plant Growth Chamber Engineering Challenge. Students also conducted class-room experiments that may help NASA find new ways to grow and sustain plants in space and on the Moon;
• 1,318 high school interns were engaged in NASA STEM activities in NASA’s Interdisciplinary National Science Program Incorporating Research and Education Experience (INSPIRE) Program, which has been implemented across NASA’s 10 Centers, and is focused on targeting and attracting underrepresented and underserved students;
• The new Digital Learning Network (DLN) technology enabled NASA scientists and engineers to virtually “beam” into classrooms throughout the Nation. These electronic interactions reached over 135 thousand students in FY 2009; and
• The NASA Explorer Schools project reached over 85,000 students through instructional and enrichment activities.
FY 2009 Annual Performance Goals FY06 FY07 FY08 FY 2009
Increase the percentage of elementary and secondary educators, who receive NASA content-based STEM resources materials or participate in short-duration activities that use these materials in the classroom by four percent above the FY 2007 baseline of fifty-five percent.
None
7ED6Green
8ED05Green
9ED7Green
7ED7Green
7ED8Green
Increase the number of elementary and secondary student participants in NASA instructional and enrichment activities by 10 percent above the FY 2007 baseline of 408,774.
None
7ED6Green
8ED04Green
9ED8Green
7ED7Green
7ED8Green
Assure seventy-two percent of elementary and secondary educators who participate in NASA training programs use NASA resources in their classroom instruction, an increase in the FY 2007 baseline of sixty-two percent.
None None None9ED9Green
Achieve fifty percent or greater level of interest in science and technology careers among elementary and secondary students participating in NASA education programs.
6ED4Yellow
7ED4Green
None9ED10Green6ED5
Green7ED5Green
outcome eD-3: build strategic partnerships and linkages between Stem formal and informal education providers that promote Stem literacy and awareness of naSa’s mission.
NASA promoted a continuous awareness of its Mission and STEM literacy by partnering with the NASA Museum Alliance, the Space Place Network (in every state), the Smithsonian, NASA Visitor Centers, and the Office of Education on a number of special projects. In FY 2009, 400 museums and science centers used NASA resources in programs and exhibits. NASA selected some of these institutions to develop and implement public engagement activities and enhance education programs related to space exploration, aeronautics, space science, Earth science, or microgravity through the Science Museums and Planetarium Grants initiative.
FY06 FY07 FY08 FY 2009
None None Green Green
FY06 FY07 FY08 FY 2009
None Green Green Green
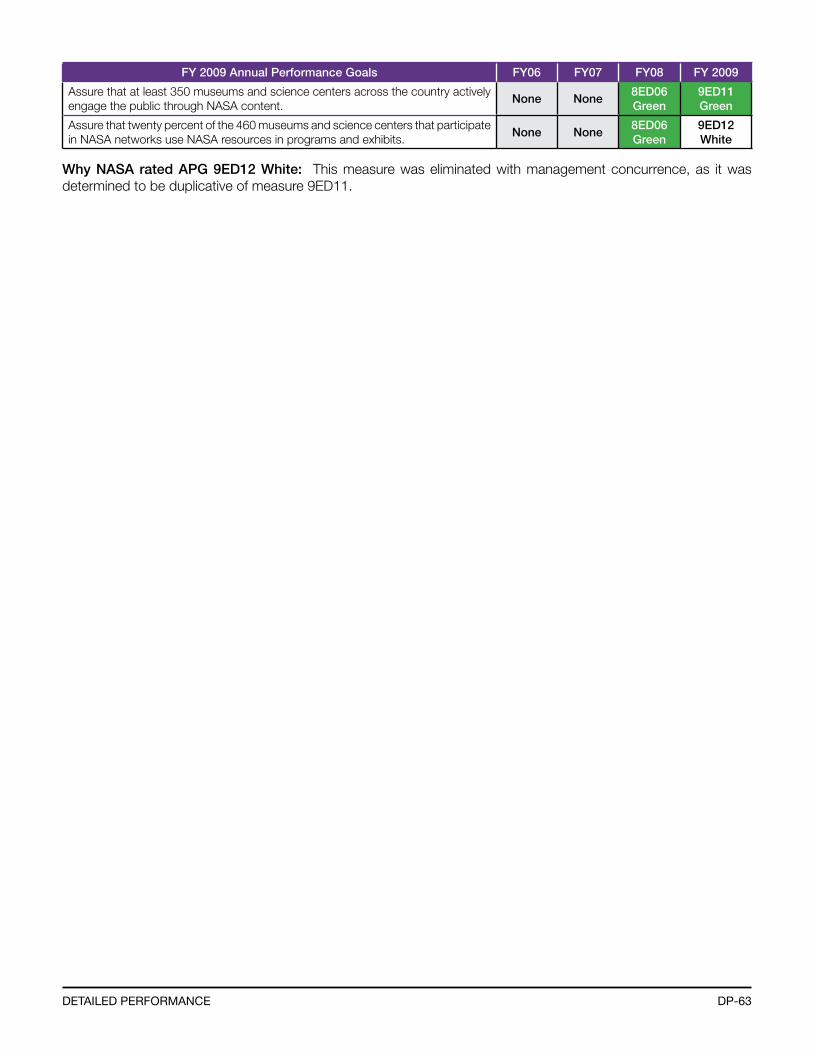
DP-63DetaileD Performance
FY 2009 Annual Performance Goals FY06 FY07 FY08 FY 2009
Assure that at least 350 museums and science centers across the country actively engage the public through NASA content.
None None8ED06Green
9ED11Green
Assure that twenty percent of the 460 museums and science centers that participate in NASA networks use NASA resources in programs and exhibits.
None None8ED06Green
9ED12White
Why NASA rated APG 9ED12 White: This measure was eliminated with management concurrence, as it was determined to be duplicative of measure 9ED11.
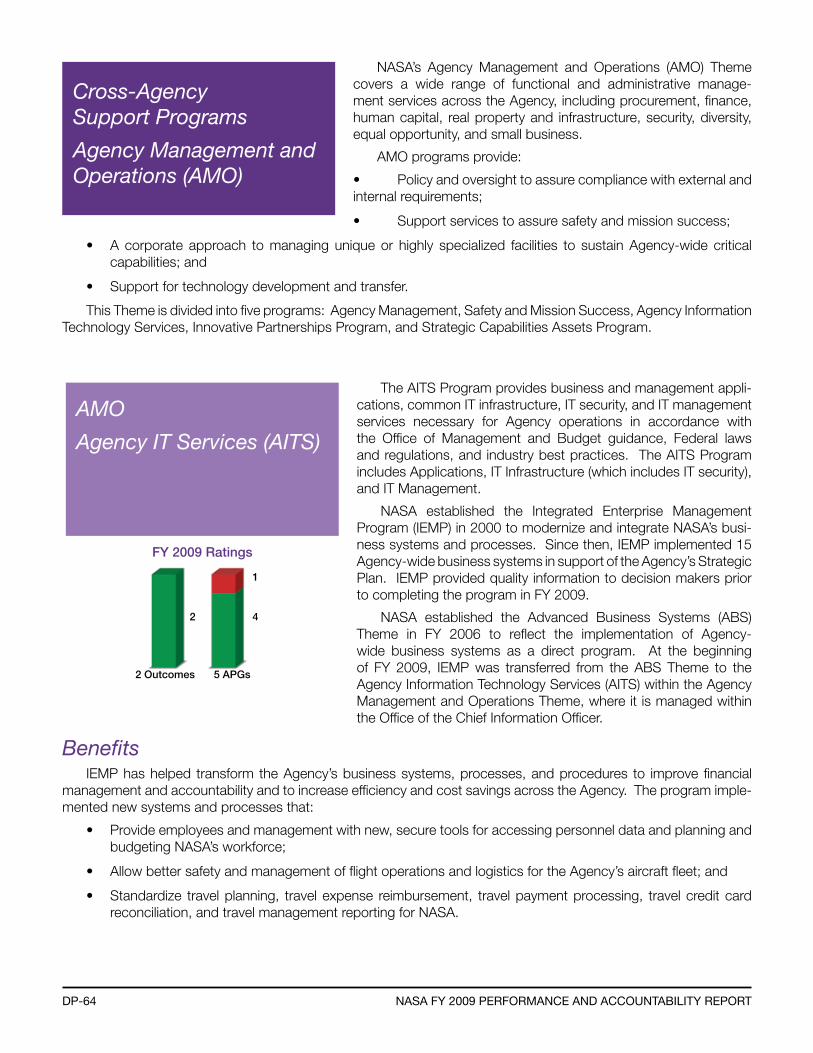
DP-64 naSa fY 2009 Performance anD accountabilitY rePort
Cross-Agency Support Programs
Agency Management and Operations (AMO)
NASA’s Agency Management and Operations (AMO) Theme covers a wide range of functional and administrative manage-ment services across the Agency, including procurement, finance, human capital, real property and infrastructure, security, diversity, equal opportunity, and small business.
AMO programs provide:
• Policy and oversight to assure compliance with external and internal requirements;
• Support services to assure safety and mission success;
• A corporate approach to managing unique or highly specialized facilities to sustain Agency-wide critical capabilities; and
• Support for technology development and transfer.
This Theme is divided into five programs: Agency Management, Safety and Mission Success, Agency Information Technology Services, Innovative Partnerships Program, and Strategic Capabilities Assets Program.
2 Outcomes 5 APGs
2
FY 2009 Ratings
4
1
AMO
Agency IT Services (AITS)
The AITS Program provides business and management appli-cations, common IT infrastructure, IT security, and IT management services necessary for Agency operations in accordance with the Office of Management and Budget guidance, Federal laws and regulations, and industry best practices. The AITS Program includes Applications, IT Infrastructure (which includes IT security), and IT Management.
NASA established the Integrated Enterprise Management Program (IEMP) in 2000 to modernize and integrate NASA’s busi-ness systems and processes. Since then, IEMP implemented 15 Agency-wide business systems in support of the Agency’s Strategic Plan. IEMP provided quality information to decision makers prior to completing the program in FY 2009.
NASA established the Advanced Business Systems (ABS) Theme in FY 2006 to reflect the implementation of Agency-wide business systems as a direct program. At the beginning of FY 2009, IEMP was transferred from the ABS Theme to the Agency Information Technology Services (AITS) within the Agency Management and Operations Theme, where it is managed within the Office of the Chief Information Officer.
BenefitsIEMP has helped transform the Agency’s business systems, processes, and procedures to improve financial
management and accountability and to increase efficiency and cost savings across the Agency. The program imple-mented new systems and processes that:
• Provide employees and management with new, secure tools for accessing personnel data and planning and budgeting NASA’s workforce;
• Allow better safety and management of flight operations and logistics for the Agency’s aircraft fleet; and
• Standardize travel planning, travel expense reimbursement, travel payment processing, travel credit card reconciliation, and travel management reporting for NASA.
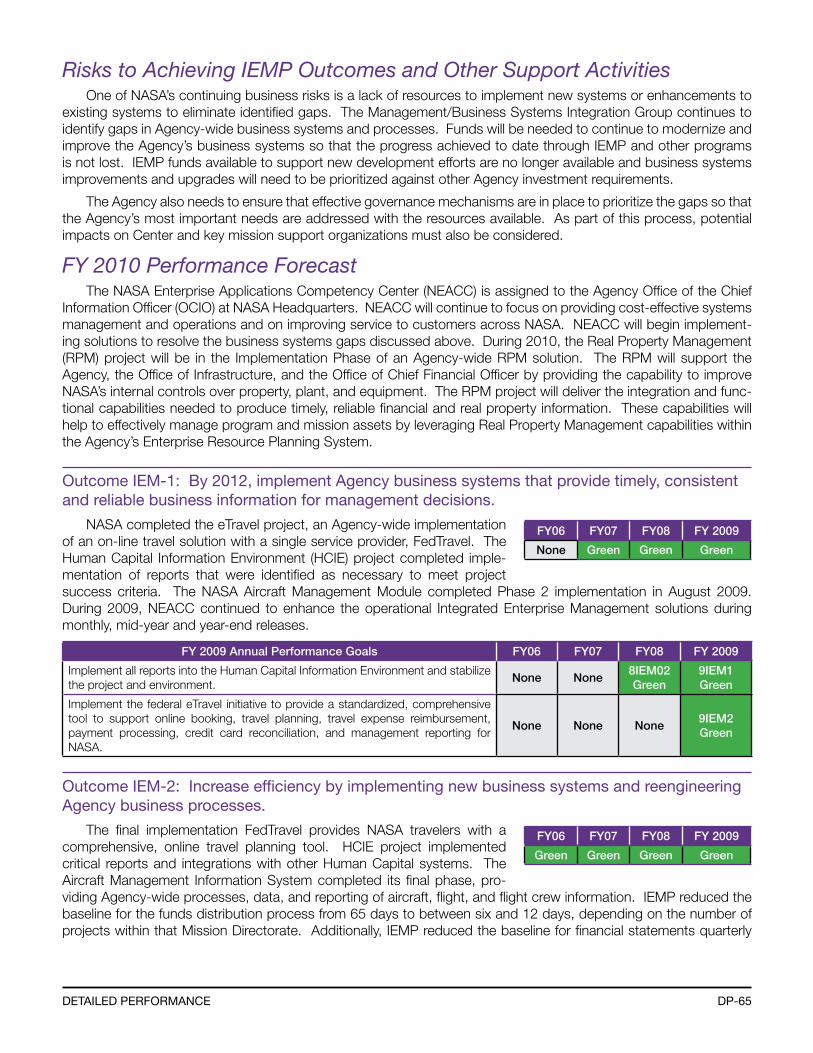
DP-65DetaileD Performance
Risks to Achieving IEMP Outcomes and Other Support ActivitiesOne of NASA’s continuing business risks is a lack of resources to implement new systems or enhancements to
existing systems to eliminate identified gaps. The Management/Business Systems Integration Group continues to identify gaps in Agency-wide business systems and processes. Funds will be needed to continue to modernize and improve the Agency’s business systems so that the progress achieved to date through IEMP and other programs is not lost. IEMP funds available to support new development efforts are no longer available and business systems improvements and upgrades will need to be prioritized against other Agency investment requirements.
The Agency also needs to ensure that effective governance mechanisms are in place to prioritize the gaps so that the Agency’s most important needs are addressed with the resources available. As part of this process, potential impacts on Center and key mission support organizations must also be considered.
FY 2010 Performance Forecast The NASA Enterprise Applications Competency Center (NEACC) is assigned to the Agency Office of the Chief
Information Officer (OCIO) at NASA Headquarters. NEACC will continue to focus on providing cost-effective systems management and operations and on improving service to customers across NASA. NEACC will begin implement-ing solutions to resolve the business systems gaps discussed above. During 2010, the Real Property Management (RPM) project will be in the Implementation Phase of an Agency-wide RPM solution. The RPM will support the Agency, the Office of Infrastructure, and the Office of Chief Financial Officer by providing the capability to improve NASA’s internal controls over property, plant, and equipment. The RPM project will deliver the integration and func-tional capabilities needed to produce timely, reliable financial and real property information. These capabilities will help to effectively manage program and mission assets by leveraging Real Property Management capabilities within the Agency’s Enterprise Resource Planning System.
outcome iem-1: by 2012, implement agency business systems that provide timely, consistent and reliable business information for management decisions.
NASA completed the eTravel project, an Agency-wide implementation of an on-line travel solution with a single service provider, FedTravel. The Human Capital Information Environment (HCIE) project completed imple-mentation of reports that were identified as necessary to meet project success criteria. The NASA Aircraft Management Module completed Phase 2 implementation in August 2009. During 2009, NEACC continued to enhance the operational Integrated Enterprise Management solutions during monthly, mid-year and year-end releases.
FY 2009 Annual Performance Goals FY06 FY07 FY08 FY 2009
Implement all reports into the Human Capital Information Environment and stabilize the project and environment.
None None8IEM02Green
9IEM1Green
Implement the federal eTravel initiative to provide a standardized, comprehensive tool to support online booking, travel planning, travel expense reimbursement, payment processing, credit card reconciliation, and management reporting for NASA.
None None None9IEM2Green
outcome iem-2: increase efficiency by implementing new business systems and reengineering agency business processes.
The final implementation FedTravel provides NASA travelers with a comprehensive, online travel planning tool. HCIE project implemented critical reports and integrations with other Human Capital systems. The Aircraft Management Information System completed its final phase, pro-viding Agency-wide processes, data, and reporting of aircraft, flight, and flight crew information. IEMP reduced the baseline for the funds distribution process from 65 days to between six and 12 days, depending on the number of projects within that Mission Directorate. Additionally, IEMP reduced the baseline for financial statements quarterly
FY06 FY07 FY08 FY 2009
None Green Green Green
FY06 FY07 FY08 FY 2009
Green Green Green Green
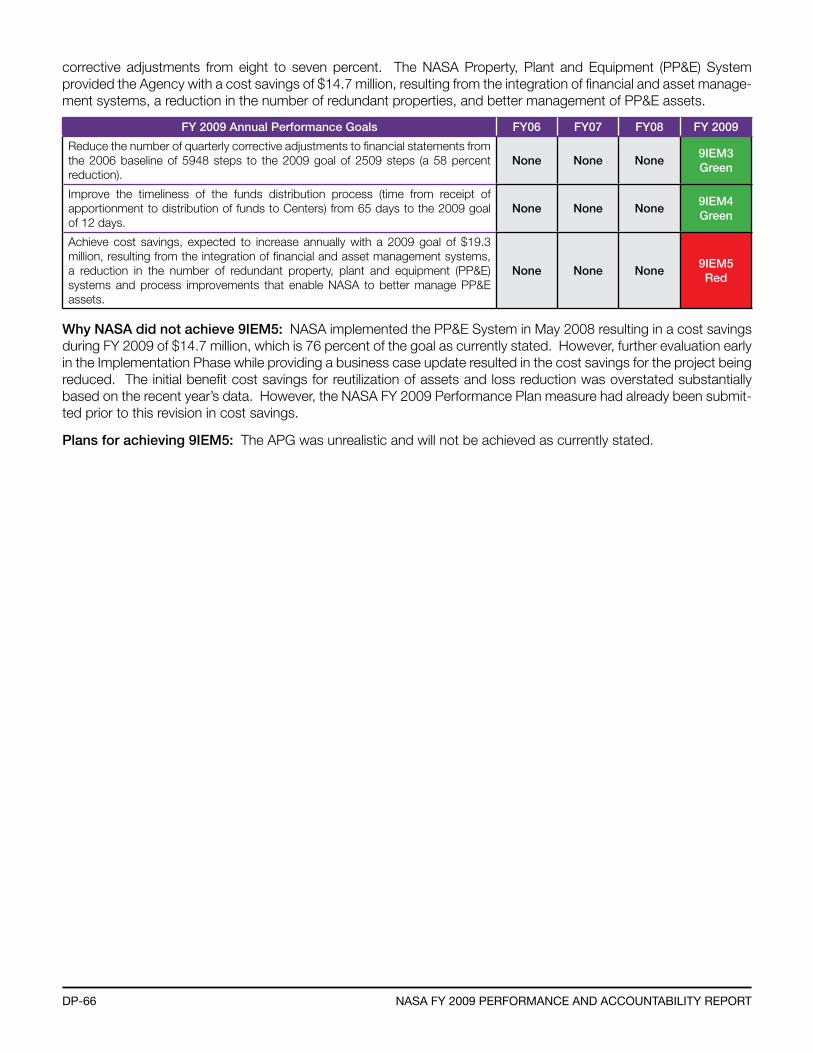
DP-66 naSa fY 2009 Performance anD accountabilitY rePort
corrective adjustments from eight to seven percent. The NASA Property, Plant and Equipment (PP&E) System provided the Agency with a cost savings of $14.7 million, resulting from the integration of financial and asset manage-ment systems, a reduction in the number of redundant properties, and better management of PP&E assets.
FY 2009 Annual Performance Goals FY06 FY07 FY08 FY 2009
Reduce the number of quarterly corrective adjustments to financial statements from the 2006 baseline of 5948 steps to the 2009 goal of 2509 steps (a 58 percent reduction).
None None None9IEM3Green
Improve the timeliness of the funds distribution process (time from receipt of apportionment to distribution of funds to Centers) from 65 days to the 2009 goal of 12 days.
None None None9IEM4Green
Achieve cost savings, expected to increase annually with a 2009 goal of $19.3 million, resulting from the integration of financial and asset management systems, a reduction in the number of redundant property, plant and equipment (PP&E) systems and process improvements that enable NASA to better manage PP&E assets.
None None None9IEM5Red
Why NASA did not achieve 9IEM5: NASA implemented the PP&E System in May 2008 resulting in a cost savings during FY 2009 of $14.7 million, which is 76 percent of the goal as currently stated. However, further evaluation early in the Implementation Phase while providing a business case update resulted in the cost savings for the project being reduced. The initial benefit cost savings for reutilization of assets and loss reduction was overstated substantially based on the recent year’s data. However, the NASA FY 2009 Performance Plan measure had already been submit-ted prior to this revision in cost savings.
Plans for achieving 9IEM5: The APG was unrealistic and will not be achieved as currently stated.
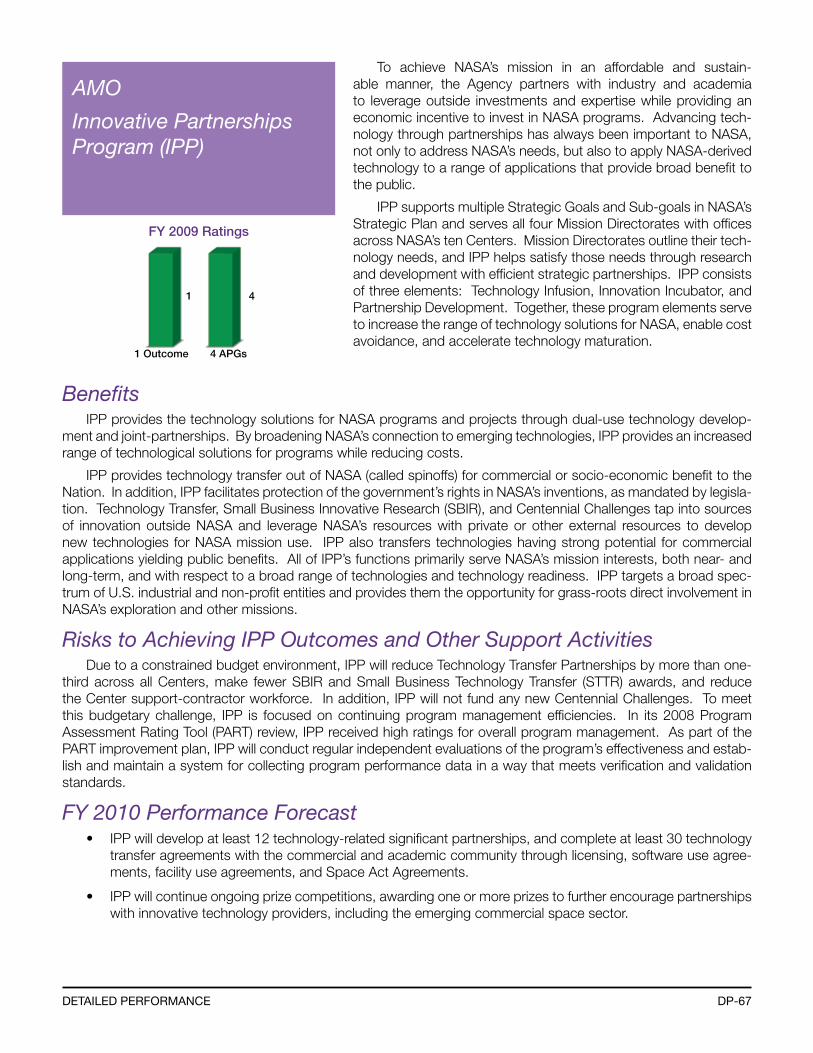
DP-67DetaileD Performance
1 Outcome 4 APGs
1
FY 2009 Ratings
4
AMO
Innovative Partnerships Program (IPP)
To achieve NASA’s mission in an affordable and sustain-able manner, the Agency partners with industry and academia to leverage outside investments and expertise while providing an economic incentive to invest in NASA programs. Advancing tech-nology through partnerships has always been important to NASA, not only to address NASA’s needs, but also to apply NASA-derived technology to a range of applications that provide broad benefit to the public.
IPP supports multiple Strategic Goals and Sub-goals in NASA’s Strategic Plan and serves all four Mission Directorates with offices across NASA’s ten Centers. Mission Directorates outline their tech-nology needs, and IPP helps satisfy those needs through research and development with efficient strategic partnerships. IPP consists of three elements: Technology Infusion, Innovation Incubator, and Partnership Development. Together, these program elements serve to increase the range of technology solutions for NASA, enable cost avoidance, and accelerate technology maturation.
BenefitsIPP provides the technology solutions for NASA programs and projects through dual-use technology develop-
ment and joint-partnerships. By broadening NASA’s connection to emerging technologies, IPP provides an increased range of technological solutions for programs while reducing costs.
IPP provides technology transfer out of NASA (called spinoffs) for commercial or socio-economic benefit to the Nation. In addition, IPP facilitates protection of the government’s rights in NASA’s inventions, as mandated by legisla-tion. Technology Transfer, Small Business Innovative Research (SBIR), and Centennial Challenges tap into sources of innovation outside NASA and leverage NASA’s resources with private or other external resources to develop new technologies for NASA mission use. IPP also transfers technologies having strong potential for commercial applications yielding public benefits. All of IPP’s functions primarily serve NASA’s mission interests, both near- and long-term, and with respect to a broad range of technologies and technology readiness. IPP targets a broad spec-trum of U.S. industrial and non-profit entities and provides them the opportunity for grass-roots direct involvement in NASA’s exploration and other missions.
Risks to Achieving IPP Outcomes and Other Support ActivitiesDue to a constrained budget environment, IPP will reduce Technology Transfer Partnerships by more than one-
third across all Centers, make fewer SBIR and Small Business Technology Transfer (STTR) awards, and reduce the Center support-contractor workforce. In addition, IPP will not fund any new Centennial Challenges. To meet this budgetary challenge, IPP is focused on continuing program management efficiencies. In its 2008 Program Assessment Rating Tool (PART) review, IPP received high ratings for overall program management. As part of the PART improvement plan, IPP will conduct regular independent evaluations of the program’s effectiveness and estab-lish and maintain a system for collecting program performance data in a way that meets verification and validation standards.
FY 2010 Performance Forecast • IPP will develop at least 12 technology-related significant partnerships, and complete at least 30 technology
transfer agreements with the commercial and academic community through licensing, software use agree-ments, facility use agreements, and Space Act Agreements.
• IPP will continue ongoing prize competitions, awarding one or more prizes to further encourage partnerships with innovative technology providers, including the emerging commercial space sector.
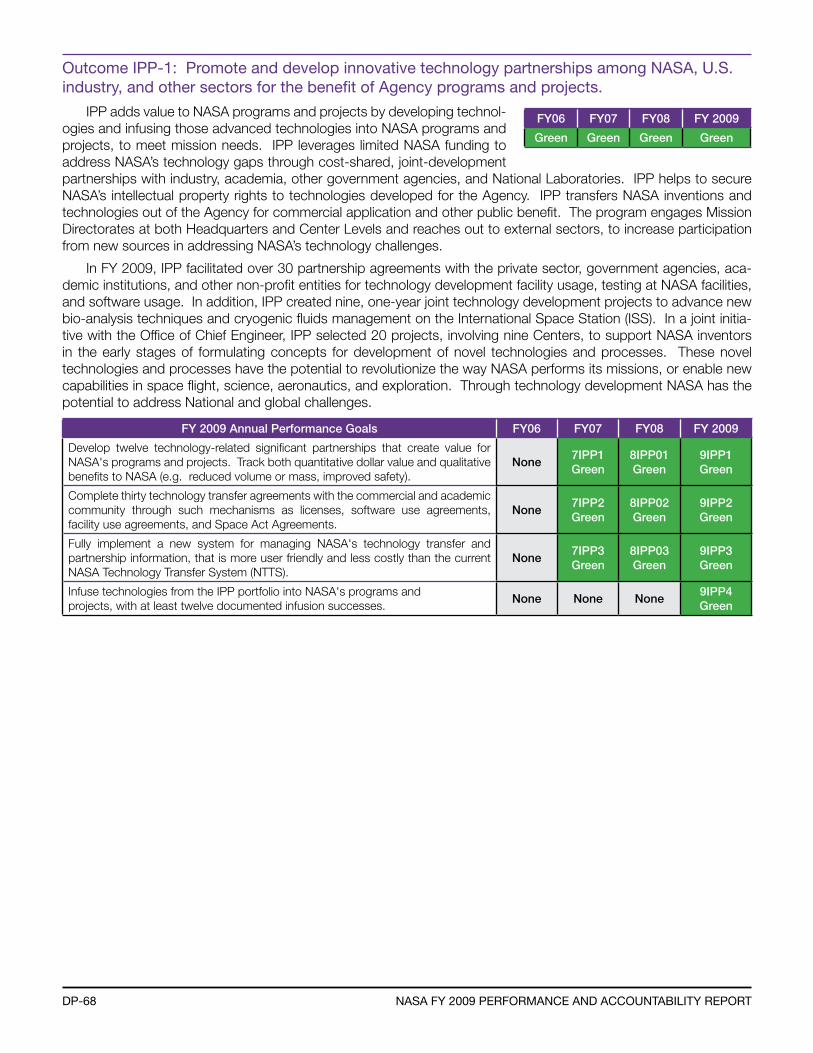
DP-68 naSa fY 2009 Performance anD accountabilitY rePort
outcome iPP-1: Promote and develop innovative technology partnerships among naSa, u.S. industry, and other sectors for the benefit of agency programs and projects.
IPP adds value to NASA programs and projects by developing technol-ogies and infusing those advanced technologies into NASA programs and projects, to meet mission needs. IPP leverages limited NASA funding to address NASA’s technology gaps through cost-shared, joint-development partnerships with industry, academia, other government agencies, and National Laboratories. IPP helps to secure NASA’s intellectual property rights to technologies developed for the Agency. IPP transfers NASA inventions and technologies out of the Agency for commercial application and other public benefit. The program engages Mission Directorates at both Headquarters and Center Levels and reaches out to external sectors, to increase participation from new sources in addressing NASA’s technology challenges.
In FY 2009, IPP facilitated over 30 partnership agreements with the private sector, government agencies, aca-demic institutions, and other non-profit entities for technology development facility usage, testing at NASA facilities, and software usage. In addition, IPP created nine, one-year joint technology development projects to advance new bio-analysis techniques and cryogenic fluids management on the International Space Station (ISS). In a joint initia-tive with the Office of Chief Engineer, IPP selected 20 projects, involving nine Centers, to support NASA inventors in the early stages of formulating concepts for development of novel technologies and processes. These novel technologies and processes have the potential to revolutionize the way NASA performs its missions, or enable new capabilities in space flight, science, aeronautics, and exploration. Through technology development NASA has the potential to address National and global challenges.
FY 2009 Annual Performance Goals FY06 FY07 FY08 FY 2009
Develop twelve technology-related significant partnerships that create value for NASA's programs and projects. Track both quantitative dollar value and qualitative benefits to NASA (e.g. reduced volume or mass, improved safety).
None7IPP1Green
8IPP01Green
9IPP1Green
Complete thirty technology transfer agreements with the commercial and academic community through such mechanisms as licenses, software use agreements, facility use agreements, and Space Act Agreements.
None7IPP2Green
8IPP02Green
9IPP2Green
Fully implement a new system for managing NASA's technology transfer and partnership information, that is more user friendly and less costly than the current NASA Technology Transfer System (NTTS).
None7IPP3Green
8IPP03Green
9IPP3Green
Infuse technologies from the IPP portfolio into NASA's programs and projects, with at least twelve documented infusion successes.
None None None9IPP4Green
FY06 FY07 FY08 FY 2009
Green Green Green Green

DP-69DetaileD Performance
1 Outcome 3 APGs
1
FY 2009 Ratings
3
AMO
Strategic Capabilities Assets Program (SCAP)
NASA established SCAP to ensure key capabilities and assets, such as wind tunnels and test facilities at Centers, are available for future missions and to help NASA prioritize and make strategic investment decisions to replace, modify, or disposition these capa-bilities/assets. SCAP is managed at the Agency level, with funding and day-to-day management responsibilities, generally residing in Centers and in the Office of Infrastructure and Administration. Mission Directorates share management responsibilities with SCAP on the Aeronautics Test Program and High-End Computing Columbia Program.
BenefitsSCAP serves each NASA Mission Directorate by providing the
facilities and capabilities to investigate, test, and establish new sci-entific and engineering theories, principles, and methods. SCAP establishes alliances between the NASA Centers with like assets, makes decisions on disposition of capabilities no longer required, identifies re-investments and re-capitalization opportunities within and among classes of assets, executes changes, and reviews
these capabilities each year to ensure the requirements are still valid. SCAP ensures that NASA has the assets and capabilities needed to achieve the Agency’s Mission by strategically managing capabilities, setting uniform use poli-cies, and reducing budget constraints, by eliminating redundant and unneeded assets.
Other government agencies, industry, and academia use the SCAP facilities to enhance their resources in meet-ing project requirements. The resulting advanced technologies often have dual-use capabilities that improve the Nation’s position in the global marketplace, and its defense capabilities.
Risks to Achieving SCAP’s Outcome and Other Support ActivitiesGiven that only selected, limited, investments are available for the recapitalization of test facilities managed by
SCAP, there is a possibility that test facilities will not meet requirements at the desired test date.
FY 2010 Performance Forecast• SCAP will concentrate on sustaining the infrastructure (i.e., the basic facilities, skilled workforce equipment,
services, and components required to sustain or enhance the facility itself) within asset classes and between Centers. SCAP also will institute consistency in reimbursable pricing policies, conduct quarterly program reviews for better management insight into the capabilities, and provide a forum for cooperation among all the Centers within asset classes.
• SCAP in FY 2009 will initiate outreach and in-reach activities to provide user awareness of the assets and the unique set of capabilities within the SCAP portfolio and to encourage greater use of these facilities.
• SCAP is committed to developing and implementing disposition plans for assets within its purview, when no longer required by the Agency.
outcome Sc-1: establish and maintain selected agency level shared capabilities, across multiple classes of assets (e.g., wind tunnels, vacuum chambers, etc.), to ensure that they will continue to be available to support the missions that require them.
SCAP continues to establish and maintain critical Agency-level shared capabilities to ensure their continued availability. In FY 2009, SCAP com-pleted critical maintenance and re-capitalization on the unique set of SCAP assets.
FY06 FY07 FY08 FY 2009
None Green Green Green
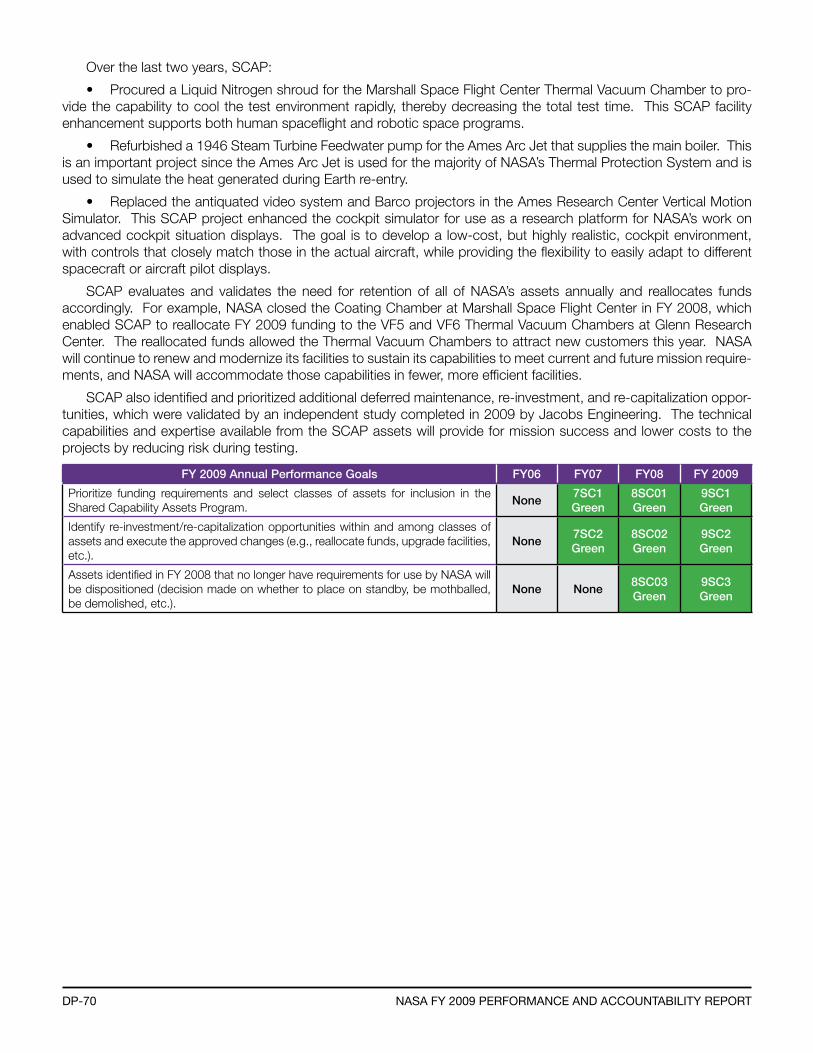
DP-70 naSa fY 2009 Performance anD accountabilitY rePort
Over the last two years, SCAP:
• Procured a Liquid Nitrogen shroud for the Marshall Space Flight Center Thermal Vacuum Chamber to pro-vide the capability to cool the test environment rapidly, thereby decreasing the total test time. This SCAP facility enhancement supports both human spaceflight and robotic space programs.
• Refurbished a 1946 Steam Turbine Feedwater pump for the Ames Arc Jet that supplies the main boiler. This is an important project since the Ames Arc Jet is used for the majority of NASA’s Thermal Protection System and is used to simulate the heat generated during Earth re-entry.
• Replaced the antiquated video system and Barco projectors in the Ames Research Center Vertical Motion Simulator. This SCAP project enhanced the cockpit simulator for use as a research platform for NASA’s work on advanced cockpit situation displays. The goal is to develop a low-cost, but highly realistic, cockpit environment, with controls that closely match those in the actual aircraft, while providing the flexibility to easily adapt to different spacecraft or aircraft pilot displays.
SCAP evaluates and validates the need for retention of all of NASA’s assets annually and reallocates funds accordingly. For example, NASA closed the Coating Chamber at Marshall Space Flight Center in FY 2008, which enabled SCAP to reallocate FY 2009 funding to the VF5 and VF6 Thermal Vacuum Chambers at Glenn Research Center. The reallocated funds allowed the Thermal Vacuum Chambers to attract new customers this year. NASA will continue to renew and modernize its facilities to sustain its capabilities to meet current and future mission require-ments, and NASA will accommodate those capabilities in fewer, more efficient facilities.
SCAP also identified and prioritized additional deferred maintenance, re-investment, and re-capitalization oppor-tunities, which were validated by an independent study completed in 2009 by Jacobs Engineering. The technical capabilities and expertise available from the SCAP assets will provide for mission success and lower costs to the projects by reducing risk during testing.
FY 2009 Annual Performance Goals FY06 FY07 FY08 FY 2009
Prioritize funding requirements and select classes of assets for inclusion in the Shared Capability Assets Program.
None7SC1Green
8SC01Green
9SC1Green
Identify re-investment/re-capitalization opportunities within and among classes of assets and execute the approved changes (e.g., reallocate funds, upgrade facilities, etc.).
None7SC2Green
8SC02Green
9SC2Green
Assets identified in FY 2008 that no longer have requirements for use by NASA will be dispositioned (decision made on whether to place on standby, be mothballed, be demolished, etc.).
None None8SC03Green
9SC3Green
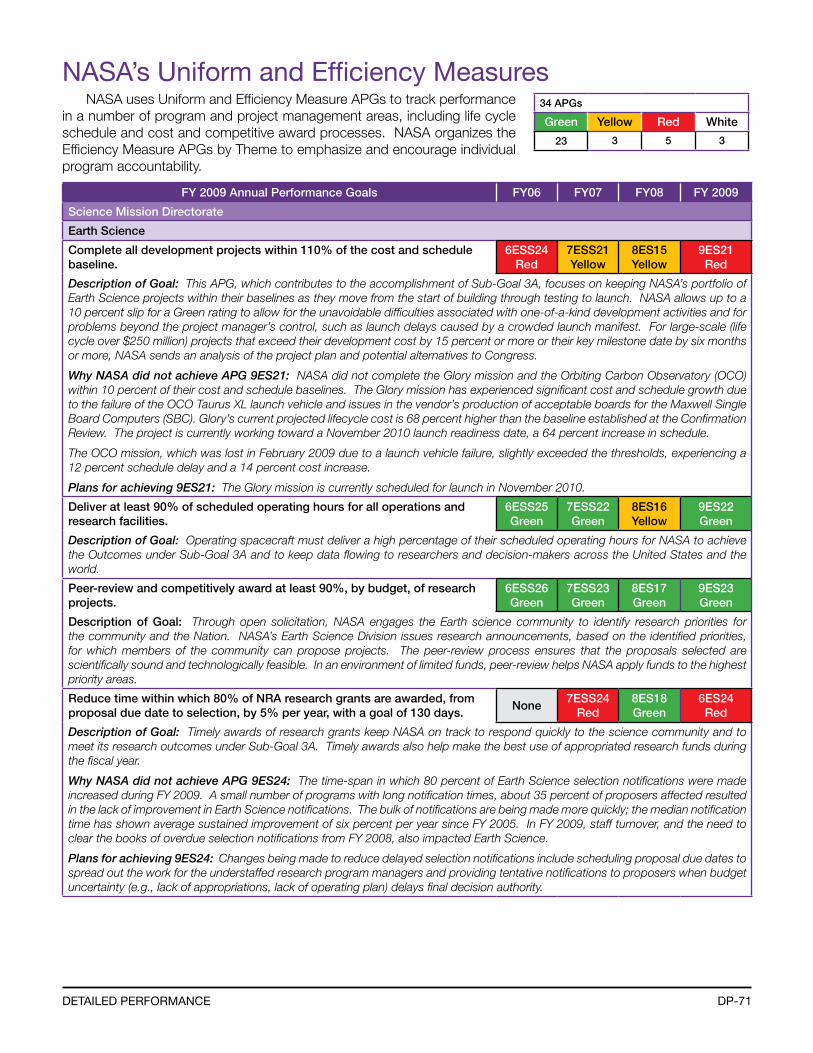
DP-71DetaileD Performance
naSa’s uniform and efficiency measuresNASA uses Uniform and Efficiency Measure APGs to track performance
in a number of program and project management areas, including life cycle schedule and cost and competitive award processes. NASA organizes the Efficiency Measure APGs by Theme to emphasize and encourage individual program accountability.
FY 2009 Annual Performance Goals FY06 FY07 FY08 FY 2009
Science Mission Directorate
Earth Science
Complete all development projects within 110% of the cost and schedule baseline.
6ESS24Red
7ESS21Yellow
8ES15Yellow
9ES21Red
Description of Goal: This APG, which contributes to the accomplishment of Sub-Goal 3A, focuses on keeping NASA’s portfolio of Earth Science projects within their baselines as they move from the start of building through testing to launch. NASA allows up to a 10 percent slip for a Green rating to allow for the unavoidable difficulties associated with one-of-a-kind development activities and for problems beyond the project manager’s control, such as launch delays caused by a crowded launch manifest. For large-scale (life cycle over $250 million) projects that exceed their development cost by 15 percent or more or their key milestone date by six months or more, NASA sends an analysis of the project plan and potential alternatives to Congress.
Why NASA did not achieve APG 9ES21: NASA did not complete the Glory mission and the Orbiting Carbon Observatory (OCO) within 10 percent of their cost and schedule baselines. The Glory mission has experienced significant cost and schedule growth due to the failure of the OCO Taurus XL launch vehicle and issues in the vendor’s production of acceptable boards for the Maxwell Single Board Computers (SBC). Glory’s current projected lifecycle cost is 68 percent higher than the baseline established at the Confirmation Review. The project is currently working toward a November 2010 launch readiness date, a 64 percent increase in schedule.
The OCO mission, which was lost in February 2009 due to a launch vehicle failure, slightly exceeded the thresholds, experiencing a 12 percent schedule delay and a 14 percent cost increase.
Plans for achieving 9ES21: The Glory mission is currently scheduled for launch in November 2010.
Deliver at least 90% of scheduled operating hours for all operations and research facilities.
6ESS25Green
7ESS22Green
8ES16Yellow
9ES22Green
Description of Goal: Operating spacecraft must deliver a high percentage of their scheduled operating hours for NASA to achieve the Outcomes under Sub-Goal 3A and to keep data flowing to researchers and decision-makers across the United States and the world.
Peer-review and competitively award at least 90%, by budget, of research projects.
6ESS26Green
7ESS23Green
8ES17Green
9ES23Green
Description of Goal: Through open solicitation, NASA engages the Earth science community to identify research priorities for the community and the Nation. NASA’s Earth Science Division issues research announcements, based on the identified priorities, for which members of the community can propose projects. The peer-review process ensures that the proposals selected are scientifically sound and technologically feasible. In an environment of limited funds, peer-review helps NASA apply funds to the highest priority areas.
Reduce time within which 80% of NRA research grants are awarded, from proposal due date to selection, by 5% per year, with a goal of 130 days.
None7ESS24
Red8ES18Green
6ES24Red
Description of Goal: Timely awards of research grants keep NASA on track to respond quickly to the science community and to meet its research outcomes under Sub-Goal 3A. Timely awards also help make the best use of appropriated research funds during the fiscal year.
Why NASA did not achieve APG 9ES24: The time-span in which 80 percent of Earth Science selection notifications were made increased during FY 2009. A small number of programs with long notification times, about 35 percent of proposers affected resulted in the lack of improvement in Earth Science notifications. The bulk of notifications are being made more quickly; the median notification time has shown average sustained improvement of six percent per year since FY 2005. In FY 2009, staff turnover, and the need to clear the books of overdue selection notifications from FY 2008, also impacted Earth Science.
Plans for achieving 9ES24: Changes being made to reduce delayed selection notifications include scheduling proposal due dates to spread out the work for the understaffed research program managers and providing tentative notifications to proposers when budget uncertainty (e.g., lack of appropriations, lack of operating plan) delays final decision authority.
34 APGs
Green Yellow Red White
23 3 5 3
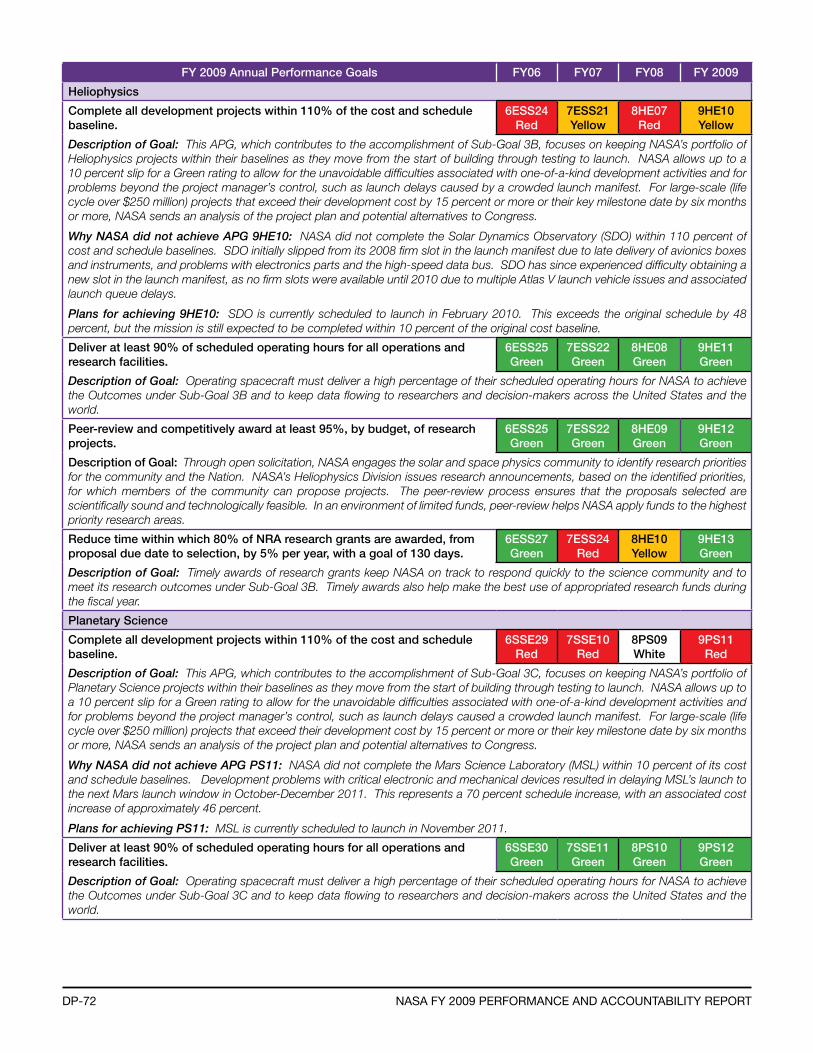
DP-72 naSa fY 2009 Performance anD accountabilitY rePort
FY 2009 Annual Performance Goals FY06 FY07 FY08 FY 2009
Heliophysics
Complete all development projects within 110% of the cost and schedule baseline.
6ESS24Red
7ESS21Yellow
8HE07Red
9HE10Yellow
Description of Goal: This APG, which contributes to the accomplishment of Sub-Goal 3B, focuses on keeping NASA’s portfolio of Heliophysics projects within their baselines as they move from the start of building through testing to launch. NASA allows up to a 10 percent slip for a Green rating to allow for the unavoidable difficulties associated with one-of-a-kind development activities and for problems beyond the project manager’s control, such as launch delays caused by a crowded launch manifest. For large-scale (life cycle over $250 million) projects that exceed their development cost by 15 percent or more or their key milestone date by six months or more, NASA sends an analysis of the project plan and potential alternatives to Congress.
Why NASA did not achieve APG 9HE10: NASA did not complete the Solar Dynamics Observatory (SDO) within 110 percent of cost and schedule baselines. SDO initially slipped from its 2008 firm slot in the launch manifest due to late delivery of avionics boxes and instruments, and problems with electronics parts and the high-speed data bus. SDO has since experienced difficulty obtaining a new slot in the launch manifest, as no firm slots were available until 2010 due to multiple Atlas V launch vehicle issues and associated launch queue delays.
Plans for achieving 9HE10: SDO is currently scheduled to launch in February 2010. This exceeds the original schedule by 48 percent, but the mission is still expected to be completed within 10 percent of the original cost baseline.
Deliver at least 90% of scheduled operating hours for all operations and research facilities.
6ESS25Green
7ESS22Green
8HE08Green
9HE11Green
Description of Goal: Operating spacecraft must deliver a high percentage of their scheduled operating hours for NASA to achieve the Outcomes under Sub-Goal 3B and to keep data flowing to researchers and decision-makers across the United States and the world.
Peer-review and competitively award at least 95%, by budget, of research projects.
6ESS25Green
7ESS22Green
8HE09Green
9HE12Green
Description of Goal: Through open solicitation, NASA engages the solar and space physics community to identify research priorities for the community and the Nation. NASA’s Heliophysics Division issues research announcements, based on the identified priorities, for which members of the community can propose projects. The peer-review process ensures that the proposals selected are scientifically sound and technologically feasible. In an environment of limited funds, peer-review helps NASA apply funds to the highest priority research areas.
Reduce time within which 80% of NRA research grants are awarded, from proposal due date to selection, by 5% per year, with a goal of 130 days.
6ESS27Green
7ESS24Red
8HE10Yellow
9HE13Green
Description of Goal: Timely awards of research grants keep NASA on track to respond quickly to the science community and to meet its research outcomes under Sub-Goal 3B. Timely awards also help make the best use of appropriated research funds during the fiscal year.
Planetary Science
Complete all development projects within 110% of the cost and schedule baseline.
6SSE29Red
7SSE10Red
8PS09White
9PS11Red
Description of Goal: This APG, which contributes to the accomplishment of Sub-Goal 3C, focuses on keeping NASA’s portfolio of Planetary Science projects within their baselines as they move from the start of building through testing to launch. NASA allows up to a 10 percent slip for a Green rating to allow for the unavoidable difficulties associated with one-of-a-kind development activities and for problems beyond the project manager’s control, such as launch delays caused a crowded launch manifest. For large-scale (life cycle over $250 million) projects that exceed their development cost by 15 percent or more or their key milestone date by six months or more, NASA sends an analysis of the project plan and potential alternatives to Congress.
Why NASA did not achieve APG PS11: NASA did not complete the Mars Science Laboratory (MSL) within 10 percent of its cost and schedule baselines. Development problems with critical electronic and mechanical devices resulted in delaying MSL’s launch to the next Mars launch window in October-December 2011. This represents a 70 percent schedule increase, with an associated cost increase of approximately 46 percent.
Plans for achieving PS11: MSL is currently scheduled to launch in November 2011.
Deliver at least 90% of scheduled operating hours for all operations and research facilities.
6SSE30Green
7SSE11Green
8PS10Green
9PS12Green
Description of Goal: Operating spacecraft must deliver a high percentage of their scheduled operating hours for NASA to achieve the Outcomes under Sub-Goal 3C and to keep data flowing to researchers and decision-makers across the United States and the world.
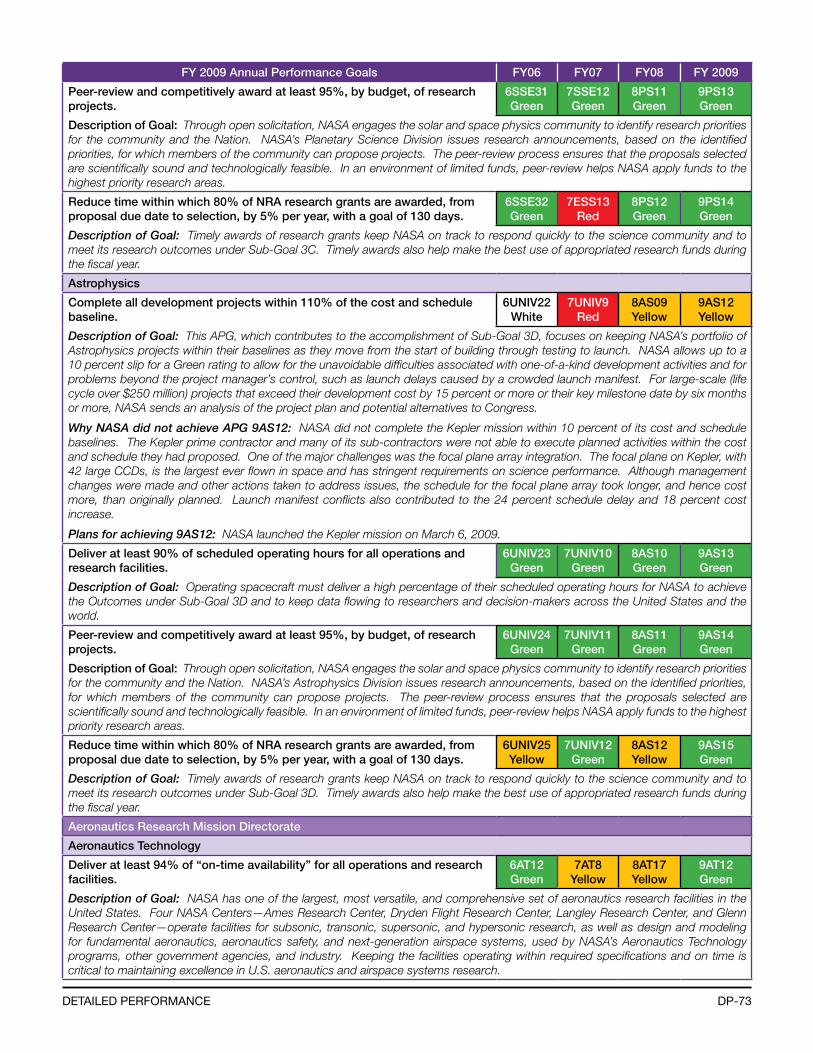
DP-73DetaileD Performance
FY 2009 Annual Performance Goals FY06 FY07 FY08 FY 2009
Peer-review and competitively award at least 95%, by budget, of research projects.
6SSE31Green
7SSE12Green
8PS11Green
9PS13Green
Description of Goal: Through open solicitation, NASA engages the solar and space physics community to identify research priorities for the community and the Nation. NASA’s Planetary Science Division issues research announcements, based on the identified priorities, for which members of the community can propose projects. The peer-review process ensures that the proposals selected are scientifically sound and technologically feasible. In an environment of limited funds, peer-review helps NASA apply funds to the highest priority research areas.
Reduce time within which 80% of NRA research grants are awarded, from proposal due date to selection, by 5% per year, with a goal of 130 days.
6SSE32Green
7ESS13Red
8PS12Green
9PS14Green
Description of Goal: Timely awards of research grants keep NASA on track to respond quickly to the science community and to meet its research outcomes under Sub-Goal 3C. Timely awards also help make the best use of appropriated research funds during the fiscal year.
Astrophysics
Complete all development projects within 110% of the cost and schedule baseline.
6UNIV22White
7UNIV9Red
8AS09Yellow
9AS12Yellow
Description of Goal: This APG, which contributes to the accomplishment of Sub-Goal 3D, focuses on keeping NASA’s portfolio of Astrophysics projects within their baselines as they move from the start of building through testing to launch. NASA allows up to a 10 percent slip for a Green rating to allow for the unavoidable difficulties associated with one-of-a-kind development activities and for problems beyond the project manager’s control, such as launch delays caused by a crowded launch manifest. For large-scale (life cycle over $250 million) projects that exceed their development cost by 15 percent or more or their key milestone date by six months or more, NASA sends an analysis of the project plan and potential alternatives to Congress.
Why NASA did not achieve APG 9AS12: NASA did not complete the Kepler mission within 10 percent of its cost and schedule baselines. The Kepler prime contractor and many of its sub-contractors were not able to execute planned activities within the cost and schedule they had proposed. One of the major challenges was the focal plane array integration. The focal plane on Kepler, with 42 large CCDs, is the largest ever flown in space and has stringent requirements on science performance. Although management changes were made and other actions taken to address issues, the schedule for the focal plane array took longer, and hence cost more, than originally planned. Launch manifest conflicts also contributed to the 24 percent schedule delay and 18 percent cost increase.
Plans for achieving 9AS12: NASA launched the Kepler mission on March 6, 2009.
Deliver at least 90% of scheduled operating hours for all operations and research facilities.
6UNIV23Green
7UNIV10Green
8AS10Green
9AS13Green
Description of Goal: Operating spacecraft must deliver a high percentage of their scheduled operating hours for NASA to achieve the Outcomes under Sub-Goal 3D and to keep data flowing to researchers and decision-makers across the United States and the world.
Peer-review and competitively award at least 95%, by budget, of research projects.
6UNIV24Green
7UNIV11Green
8AS11Green
9AS14Green
Description of Goal: Through open solicitation, NASA engages the solar and space physics community to identify research priorities for the community and the Nation. NASA’s Astrophysics Division issues research announcements, based on the identified priorities, for which members of the community can propose projects. The peer-review process ensures that the proposals selected are scientifically sound and technologically feasible. In an environment of limited funds, peer-review helps NASA apply funds to the highest priority research areas.
Reduce time within which 80% of NRA research grants are awarded, from proposal due date to selection, by 5% per year, with a goal of 130 days.
6UNIV25Yellow
7UNIV12Green
8AS12Yellow
9AS15Green
Description of Goal: Timely awards of research grants keep NASA on track to respond quickly to the science community and to meet its research outcomes under Sub-Goal 3D. Timely awards also help make the best use of appropriated research funds during the fiscal year.
Aeronautics Research Mission Directorate
Aeronautics Technology
Deliver at least 94% of “on-time availability” for all operations and research facilities.
6AT12Green
7AT8Yellow
8AT17Yellow
9AT12Green
Description of Goal: NASA has one of the largest, most versatile, and comprehensive set of aeronautics research facilities in the United States. Four NASA Centers—Ames Research Center, Dryden Flight Research Center, Langley Research Center, and Glenn Research Center—operate facilities for subsonic, transonic, supersonic, and hypersonic research, as well as design and modeling for fundamental aeronautics, aeronautics safety, and next-generation airspace systems, used by NASA’s Aeronautics Technology programs, other government agencies, and industry. Keeping the facilities operating within required specifications and on time is critical to maintaining excellence in U.S. aeronautics and airspace systems research.

DP-74 naSa fY 2009 Performance anD accountabilitY rePort
FY 2009 Annual Performance Goals FY06 FY07 FY08 FY 2009
Exploration Systems Mission Directorate
Constellation
Complete all development projects within 110% of the cost and schedule baseline.
6CS5Green
7CS9White
8CS14White
9CS14White
Description of Goal: This APG, which contributes to the accomplishment of Strategic Goal 4, focuses on keeping individual projects contributing to NASA’s new space transportation systems within their baselines as they move from the start of building through testing to full operational capability. In FY 2007 and FY 2008, none of the projects had entered development, earning a White rating. For large-scale (life cycle over $250 million) projects that exceed their development cost by 15 percent or more or their key milestone date by six months or more, NASA sends an analysis of the project plan and potential alternatives to Congress.
The other APGs that Constellation Systems reviewed to determine the rating for this Uniform Measure are 9CS1, 9CS2, 9CS3, 9CS4, 9CS5, 9CS6, 9CS7, 9CS11, and 9CS12. (APG 9CS14 was published in the FY09 Performance Plan as 9CS12.)
Why NASA rated APG 9CS14 White: This APG is not valid until a the project enters the development phase (after KDP-C). A triple KDP-C event is scheduled for Orion, Ares I, and Ground Operations in summer 2010.
Reduction in ground operations cost (through 2012) of the Constellation Systems based on comparison with the Space Shuttle Program.
None None8CS15Green
9CS13White
Description of Goal: NASA is transitioning facilities and equipment, including ground operations, from the out-going Space Shuttle Program to the new Constellation Systems Program. As part of this, NASA is working to make the ground operations that will serve Constellation Systems more efficient and cost effective, helping to make Constellation Systems a better value to the Nation than the Space Shuttle Program.
Why NASA rated APG 9CS13 White: Constellation, in consultation with their OMB analyst, determined that this APG was not measureable and canceled it for FY 2009. They have rewritten the measure for FY 2010. The first measure point will be the program Critical Design Review scheduled for fall 2012.
Advanced Capabilities
Complete all development projects within 110% of the cost and schedule baseline.
6ESRT13White
7ESRT6White
8AC18Yellow
9AC18Yellow
Description of Goal: This APG, which contributes to the accomplishment of Strategic Goal 6, focuses on keeping individual projects contributing to NASA’s lunar return program within their baselines as they move from the start of building through testing to operations. For large-scale (life cycle over $250 million) projects that exceed their development cost by 15 percent or more or their key milestone date by six months or more, NASA sends an analysis of the project plan and potential alternatives to Congress.
The other APGs that Advanced Capabilities reviewed to determine the rating for this Uniform Measure are 9AC12, 9AC13, 9AC14, and 9AC15.
Why NASA did not achieve APG 9AC18: While the LRO, LCROSS and the VCAM projects were within their cost baselines, they did not comply with the 110 percent schedule baseline. For LRO and LCROSS, there were technical problems with the launch vehicle systems which contributed to the launch delays. For VCAM, there were technical problems encountered in the development of the instrument which resulted in the schedule delay.
Plans for achieving 9AC18: LRO and LCROSS were launched on June 18, 2009, and the VCAM successfully completed its pre-ship review on August 26, 2009.
Increase the amount of research beam time for space radiation experiments at NSRL, hence science data collection, by reducing the non-science over-head to 25% from 33% for set up, tuning, and maintenance.
None None None9AC19Green
Description of Goal: Radiation exposure is the biggest risk to humans exploring space. The NASA Space Radiation Laboratory beam line simulates the cosmic rays found in space so that researchers can study the effects of radiation on human health, and to find effective ways to mitigate or prevent the damaging effects of space radiation. NASA seeks to increase the amount of time researchers have to conduct their experiments by reducing the time needed to keep the beam operational.

DP-75DetaileD Performance
FY 2009 Annual Performance Goals FY06 FY07 FY08 FY 2009
Given an annual constant dollar technology funding, demonstrate improve-ments in the EVA Work Efficiency Index for humans and robots working co-operatively to deploy the power system infrastructure for the lunar outpost. Work Efficiency Index = (Time to complete a task using humans and robots) / (Time to complete a task using humans only).
None None None9AC20Green
Description of Goal: Work conducted during EVA is often complicated and exhausting, and astronauts spend many hours training for each EVA task. As part of the lunar return program, NASA is creating robotic assistants to reduce the number of EVA work hours placed on crew while still achieving mission goals. As robotic assistants become more efficient and capable, they will work alongside astronauts or autonomously to deploy infrastructure for a lunar outpost.
Space Operations Mission Directorate
International Space Station
Achieve an Annual Cost Performance Index (CPI), the ratio of the value of the work accomplished versus the actual cost of the work accomplished, of greater than or equal to one.
None None8ISS08Green
9ISS7White
Description of Goal: CPI is the ratio of the value of the work accomplished versus the actual cost of the work accomplished. A ratio of 1 indicates the cumulative value of work accomplished within the fiscal year matches the cost accrued in the performance of the work during the same period. The current ISS plan assumes a reduction in the operational costs of ISS through its life after assembly is complete. Since the value of the work accomplished is tied to these planning assumptions, a CPI close to 1 is desirable because it shows efficiency in performance versus planning, yielding more value for taxpayer investment.
Why NASA rated APG 9ISS7 White: This goal was discontinued because the ISS has transitioned from the development stage to the operations stage. During the development stage, CPI was a valid A because hardware was being delivered and contractors were being paid per delivery. During the operations stage, contractors are being paid to perform a function that is not tied to deliveries.
Deliver at least 90% of scheduled operating hours for all operations and research facilities.
6ISS7Green
7ISS7Green
8ISS07Green
9ISS8Green
Description of Goal: Leading up to and beyond ISS assembly completion in 2010, the facilities provided throughout the life of ISS will be key to conducting research. This measure addresses those capabilities and resources needed to expand and validate future space flight applications and conduct research onboard the ISS: 20 research rack sites in the U.S. segment; the power to run the research racks; life-support systems capable of supporting a six-person crew; and the crew themselves to maintain and operate the facilities. These targets require comprehensive coordination with the International Partners, the Space Shuttle Program, U.S. national laboratory users, and commercial transportation providers.
Space and Flight Support
Achieve at least 99% Space Network proficiency for delivery of Space Com-munications services.
None None8SFS04Green
9SFS10Green
Description of Goal: This measure tracks the percentage of minutes provided by the Space Network against the total number of minutes of communications uplink and downlink required by the International Space Station, the Space Shuttle, and low Earth-orbiting missions. These services are critical to the safety of crews aboard the ISS and Shuttle, the efficient navigation and operation of crewed and robotic spacecraft, and data return.
Complete all development projects within 110% of the cost and schedule baseline.
6SFS7White
7SFS5White
8SFS06White
9SFS11Green
Description of Goal: NASA, in partnership with the Department of Defense, will be flying two new Tracking and Data Relay Satellites, TDRS-K and –L, to provide reliable space communications. This Uniform Measure was rated White in FY 2006, FY 2007, and FY 2008 while this project was in formulation. NASA’s portion of the project is being conducted via a firm, fixed-price contract that will keep the project within its cost baseline. It is important for the project to remain within its schedule baseline to support future exploration plans.
The other APG that Space and Flight Support reviewed to determine the rating for this Uniform Measure is 9SFS6.
Ratio of Launch Services program cost per mission to average spacecraft cost, reduced to 6.3 percent.
None None None9SFS12Green
Description of Goal: The cost of launching vehicles into space is very high, negatively impacting the cost of all flight missions. NASA is seeking to reduce the cost of launch for NASA and other government agency customers by reducing the cost of the Launch Services Program, which acquires launch vehicles, coordinates the launch manifest for NASA’s launch pads, oversees launch operations, and manages the countdown. This metric will demonstrate cost effectiveness in achieving the program goal of launch success for NASA missions by calculating the approximate cost of program services and capabilities per mission.
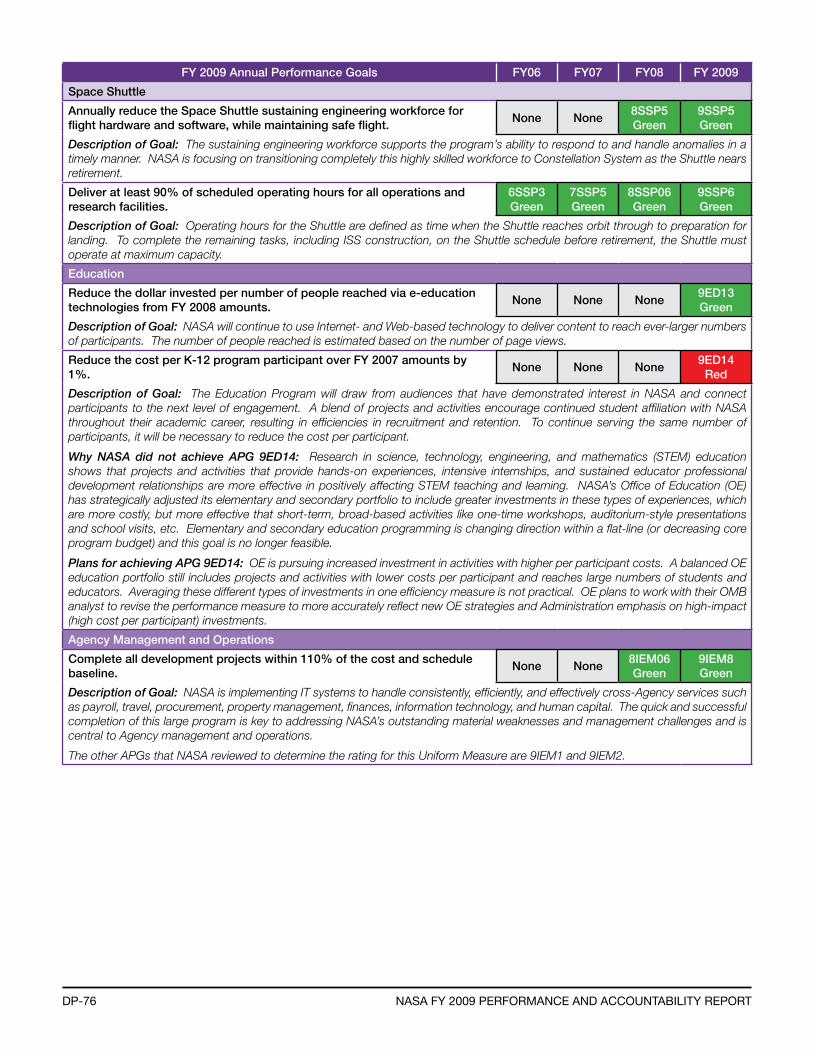
DP-76 naSa fY 2009 Performance anD accountabilitY rePort
FY 2009 Annual Performance Goals FY06 FY07 FY08 FY 2009
Space Shuttle
Annually reduce the Space Shuttle sustaining engineering workforce for flight hardware and software, while maintaining safe flight.
None None8SSP5Green
9SSP5Green
Description of Goal: The sustaining engineering workforce supports the program’s ability to respond to and handle anomalies in a timely manner. NASA is focusing on transitioning completely this highly skilled workforce to Constellation System as the Shuttle nears retirement.
Deliver at least 90% of scheduled operating hours for all operations and research facilities.
6SSP3Green
7SSP5Green
8SSP06Green
9SSP6Green
Description of Goal: Operating hours for the Shuttle are defined as time when the Shuttle reaches orbit through to preparation for landing. To complete the remaining tasks, including ISS construction, on the Shuttle schedule before retirement, the Shuttle must operate at maximum capacity.
Education
Reduce the dollar invested per number of people reached via e-education technologies from FY 2008 amounts.
None None None9ED13Green
Description of Goal: NASA will continue to use Internet- and Web-based technology to deliver content to reach ever-larger numbers of participants. The number of people reached is estimated based on the number of page views.
Reduce the cost per K-12 program participant over FY 2007 amounts by 1%.
None None None9ED14
Red
Description of Goal: The Education Program will draw from audiences that have demonstrated interest in NASA and connect participants to the next level of engagement. A blend of projects and activities encourage continued student affiliation with NASA throughout their academic career, resulting in efficiencies in recruitment and retention. To continue serving the same number of participants, it will be necessary to reduce the cost per participant.
Why NASA did not achieve APG 9ED14: Research in science, technology, engineering, and mathematics (STEM) education shows that projects and activities that provide hands-on experiences, intensive internships, and sustained educator professional development relationships are more effective in positively affecting STEM teaching and learning. NASA’s Office of Education (OE) has strategically adjusted its elementary and secondary portfolio to include greater investments in these types of experiences, which are more costly, but more effective that short-term, broad-based activities like one-time workshops, auditorium-style presentations and school visits, etc. Elementary and secondary education programming is changing direction within a flat-line (or decreasing core program budget) and this goal is no longer feasible.
Plans for achieving APG 9ED14: OE is pursuing increased investment in activities with higher per participant costs. A balanced OE education portfolio still includes projects and activities with lower costs per participant and reaches large numbers of students and educators. Averaging these different types of investments in one efficiency measure is not practical. OE plans to work with their OMB analyst to revise the performance measure to more accurately reflect new OE strategies and Administration emphasis on high-impact (high cost per participant) investments.
Agency Management and Operations
Complete all development projects within 110% of the cost and schedule baseline.
None None8IEM06Green
9IEM8Green
Description of Goal: NASA is implementing IT systems to handle consistently, efficiently, and effectively cross-Agency services such as payroll, travel, procurement, property management, finances, information technology, and human capital. The quick and successful completion of this large program is key to addressing NASA’s outstanding material weaknesses and management challenges and is central to Agency management and operations.
The other APGs that NASA reviewed to determine the rating for this Uniform Measure are 9IEM1 and 9IEM2.
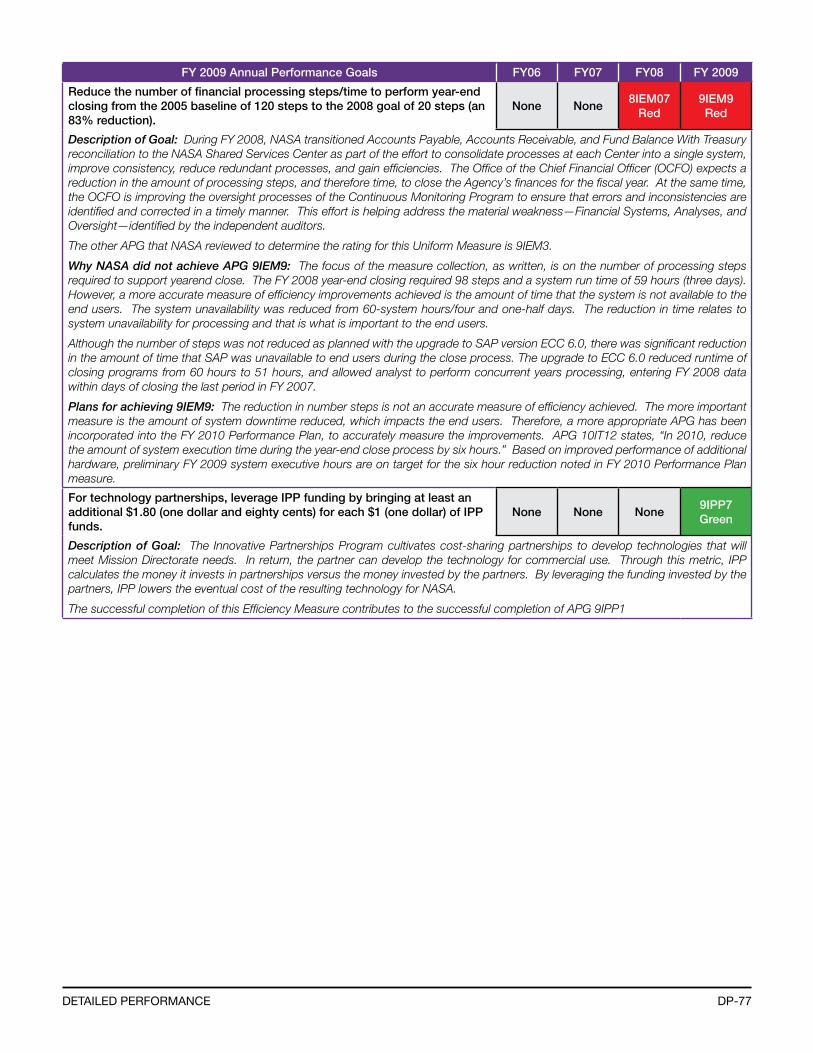
DP-77DetaileD Performance
FY 2009 Annual Performance Goals FY06 FY07 FY08 FY 2009
Reduce the number of financial processing steps/time to perform year-end closing from the 2005 baseline of 120 steps to the 2008 goal of 20 steps (an 83% reduction).
None None8IEM07
Red9IEM9Red
Description of Goal: During FY 2008, NASA transitioned Accounts Payable, Accounts Receivable, and Fund Balance With Treasury reconciliation to the NASA Shared Services Center as part of the effort to consolidate processes at each Center into a single system, improve consistency, reduce redundant processes, and gain efficiencies. The Office of the Chief Financial Officer (OCFO) expects a reduction in the amount of processing steps, and therefore time, to close the Agency’s finances for the fiscal year. At the same time, the OCFO is improving the oversight processes of the Continuous Monitoring Program to ensure that errors and inconsistencies are identified and corrected in a timely manner. This effort is helping address the material weakness—Financial Systems, Analyses, and Oversight—identified by the independent auditors.
The other APG that NASA reviewed to determine the rating for this Uniform Measure is 9IEM3.
Why NASA did not achieve APG 9IEM9: The focus of the measure collection, as written, is on the number of processing steps required to support yearend close. The FY 2008 year-end closing required 98 steps and a system run time of 59 hours (three days). However, a more accurate measure of efficiency improvements achieved is the amount of time that the system is not available to the end users. The system unavailability was reduced from 60-system hours/four and one-half days. The reduction in time relates to system unavailability for processing and that is what is important to the end users.
Although the number of steps was not reduced as planned with the upgrade to SAP version ECC 6.0, there was significant reduction in the amount of time that SAP was unavailable to end users during the close process. The upgrade to ECC 6.0 reduced runtime of closing programs from 60 hours to 51 hours, and allowed analyst to perform concurrent years processing, entering FY 2008 data within days of closing the last period in FY 2007.
Plans for achieving 9IEM9: The reduction in number steps is not an accurate measure of efficiency achieved. The more important measure is the amount of system downtime reduced, which impacts the end users. Therefore, a more appropriate APG has been incorporated into the FY 2010 Performance Plan, to accurately measure the improvements. APG 10IT12 states, “In 2010, reduce the amount of system execution time during the year-end close process by six hours.” Based on improved performance of additional hardware, preliminary FY 2009 system executive hours are on target for the six hour reduction noted in FY 2010 Performance Plan measure.
For technology partnerships, leverage IPP funding by bringing at least an additional $1.80 (one dollar and eighty cents) for each $1 (one dollar) of IPP funds.
None None None9IPP7Green
Description of Goal: The Innovative Partnerships Program cultivates cost-sharing partnerships to develop technologies that will meet Mission Directorate needs. In return, the partner can develop the technology for commercial use. Through this metric, IPP calculates the money it invests in partnerships versus the money invested by the partners. By leveraging the funding invested by the partners, IPP lowers the eventual cost of the resulting technology for NASA.
The successful completion of this Efficiency Measure contributes to the successful completion of APG 9IPP1
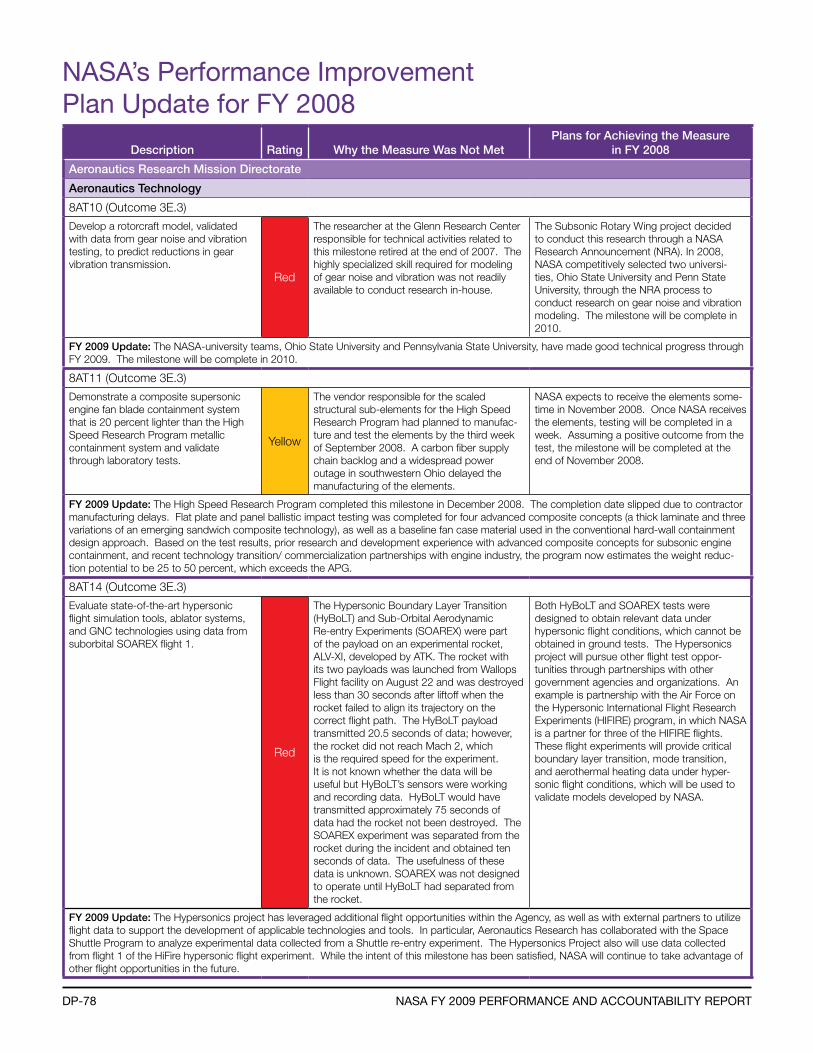
DP-78 naSa fY 2009 Performance anD accountabilitY rePort
naSa’s Performance improvement Plan update for fY 2008
Description Rating Why the Measure Was Not MetPlans for Achieving the Measure
in FY 2008
Aeronautics Research Mission Directorate
Aeronautics Technology
8AT10 (Outcome 3E.3)
Develop a rotorcraft model, validated with data from gear noise and vibration testing, to predict reductions in gear vibration transmission.
Red
The researcher at the Glenn Research Center responsible for technical activities related to this milestone retired at the end of 2007. The highly specialized skill required for modeling of gear noise and vibration was not readily available to conduct research in-house.
The Subsonic Rotary Wing project decided to conduct this research through a NASA Research Announcement (NRA). In 2008, NASA competitively selected two universi-ties, Ohio State University and Penn State University, through the NRA process to conduct research on gear noise and vibration modeling. The milestone will be complete in 2010.
FY 2009 Update: The NASA-university teams, Ohio State University and Pennsylvania State University, have made good technical progress through FY 2009. The milestone will be complete in 2010.
8AT11 (Outcome 3E.3)
Demonstrate a composite supersonic engine fan blade containment system that is 20 percent lighter than the High Speed Research Program metallic containment system and validate through laboratory tests.
Yellow
The vendor responsible for the scaled structural sub-elements for the High Speed Research Program had planned to manufac-ture and test the elements by the third week of September 2008. A carbon fiber supply chain backlog and a widespread power outage in southwestern Ohio delayed the manufacturing of the elements.
NASA expects to receive the elements some-time in November 2008. Once NASA receives the elements, testing will be completed in a week. Assuming a positive outcome from the test, the milestone will be completed at the end of November 2008.
FY 2009 Update: The High Speed Research Program completed this milestone in December 2008. The completion date slipped due to contractor manufacturing delays. Flat plate and panel ballistic impact testing was completed for four advanced composite concepts (a thick laminate and three variations of an emerging sandwich composite technology), as well as a baseline fan case material used in the conventional hard-wall containment design approach. Based on the test results, prior research and development experience with advanced composite concepts for subsonic engine containment, and recent technology transition/ commercialization partnerships with engine industry, the program now estimates the weight reduc-tion potential to be 25 to 50 percent, which exceeds the APG.
8AT14 (Outcome 3E.3)
Evaluate state-of-the-art hypersonic flight simulation tools, ablator systems, and GNC technologies using data from suborbital SOAREX flight 1.
Red
The Hypersonic Boundary Layer Transition (HyBoLT) and Sub-Orbital Aerodynamic Re-entry Experiments (SOAREX) were part of the payload on an experimental rocket, ALV-XI, developed by ATK. The rocket with its two payloads was launched from Wallops Flight facility on August 22 and was destroyed less than 30 seconds after liftoff when the rocket failed to align its trajectory on the correct flight path. The HyBoLT payload transmitted 20.5 seconds of data; however, the rocket did not reach Mach 2, which is the required speed for the experiment. It is not known whether the data will be useful but HyBoLT’s sensors were working and recording data. HyBoLT would have transmitted approximately 75 seconds of data had the rocket not been destroyed. The SOAREX experiment was separated from the rocket during the incident and obtained ten seconds of data. The usefulness of these data is unknown. SOAREX was not designed to operate until HyBoLT had separated from the rocket.
Both HyBoLT and SOAREX tests were designed to obtain relevant data under hypersonic flight conditions, which cannot be obtained in ground tests. The Hypersonics project will pursue other flight test oppor-tunities through partnerships with other government agencies and organizations. An example is partnership with the Air Force on the Hypersonic International Flight Research Experiments (HIFIRE) program, in which NASA is a partner for three of the HIFIRE flights. These flight experiments will provide critical boundary layer transition, mode transition, and aerothermal heating data under hyper-sonic flight conditions, which will be used to validate models developed by NASA.
FY 2009 Update: The Hypersonics project has leveraged additional flight opportunities within the Agency, as well as with external partners to utilize flight data to support the development of applicable technologies and tools. In particular, Aeronautics Research has collaborated with the Space Shuttle Program to analyze experimental data collected from a Shuttle re-entry experiment. The Hypersonics Project also will use data collected from flight 1 of the HiFire hypersonic flight experiment. While the intent of this milestone has been satisfied, NASA will continue to take advantage of other flight opportunities in the future.

DP-79DetaileD Performance
Description Rating Why the Measure Was Not MetPlans for Achieving the Measure
in FY 2008
8AT16 (Outcome 3E.4)
Develop a long-term, flight operations/test infrastructure vision and funded plan working with all the appropriate stakeholders, to assure that the plan reflects the priorities of the long-term needs of the Nation. Yellow
NASA did not achieve APG 8AT16 due to program management changes in the second quarter of FY 2008. The incoming program manager made several visits to the Dryden Flight Research Center during the second and third quarter FY 2008 to understand the issues and opportunities for NASA flight testing and this new understanding resulted in a management decision to engage the RAND corporation for support in developing a new strategic plan.
ATP awarded a contract to the RAND corporation in the fourth quarter FY 2008 for this effort and the scheduled completion is during the second quarter FY 2009.
FY 2009 Update: ATP completed the development of a Strategic Plan during the last quarter of FY 2009. The implementation of this Strategic Plan for flight operations and test infrastructure will happen in FY 2010. ATP’s funding profile has been developed to support this plan. Development of the plan took longer than expected due to the complexity and the coordination among relevant parties.
8AT17 (Efficiency Measure)
Deliver at least 90 percent of scheduled operating hours for all operations and research facilities.
Yellow
Several significant tests originally planned for ATP facilities in FY 2008 were either cancelled by the test customer or moved into another fiscal year. In addition, a number of unex-pected breakdowns and construction project delays occurred at several facilities at Langley Research Center, resulting in the delivery of 71 percent of scheduled operating hours for ground test assets.
ATP will continue to work with Centers and portfolio managers to accurately estimate, project, and secure test activities for its test capability assets. In addition, ATP will continue to invest in test facility maintenance and upgrade projects with the goal of improv-ing facility reliability, availability and overall attractiveness to test customers. However, due to the age and current condition of the facilities, system failures and the resulting unplanned downtime are constant risks. To mitigate this in FY 2009, ATP will develop a new program management strategy and will use this strategy to implement recom-mendations for its ground test facilities and related infrastructure from the comprehensive, independent facility condition assessment commissioned in FY 2008.
FY 2009 Update: ATP worked with the portfolio managers at the three aeronautics ground research Centers to more accurately and consistently estimate, project, and secure test activities for FY 2009. In addition, ATP continued to invest in test facility maintenance and upgrade projects with the goal of improving reliability, availability, and overall attractiveness to test customers. Due to the age and current condition of the facilities, however, system failures and the resulting unplanned downtime are constant risks, and, due to the evolution of program and project testing require-ments, slipped and cancelled tests will continue to happen. Facility age and condition and program and project evolution are risk areas inherent to the research test facility business. Although not an APG in FY 2009, the delivery of scheduled operating hours (preliminary but based on actuals through the end of the third quarter) is projected to increase to about 80 percent from approximately 70 percent in FY 2008. For FY 2009, NASA has changed the Efficiency Measure to measure on-time availability, which more accurately addresses performance of the program.
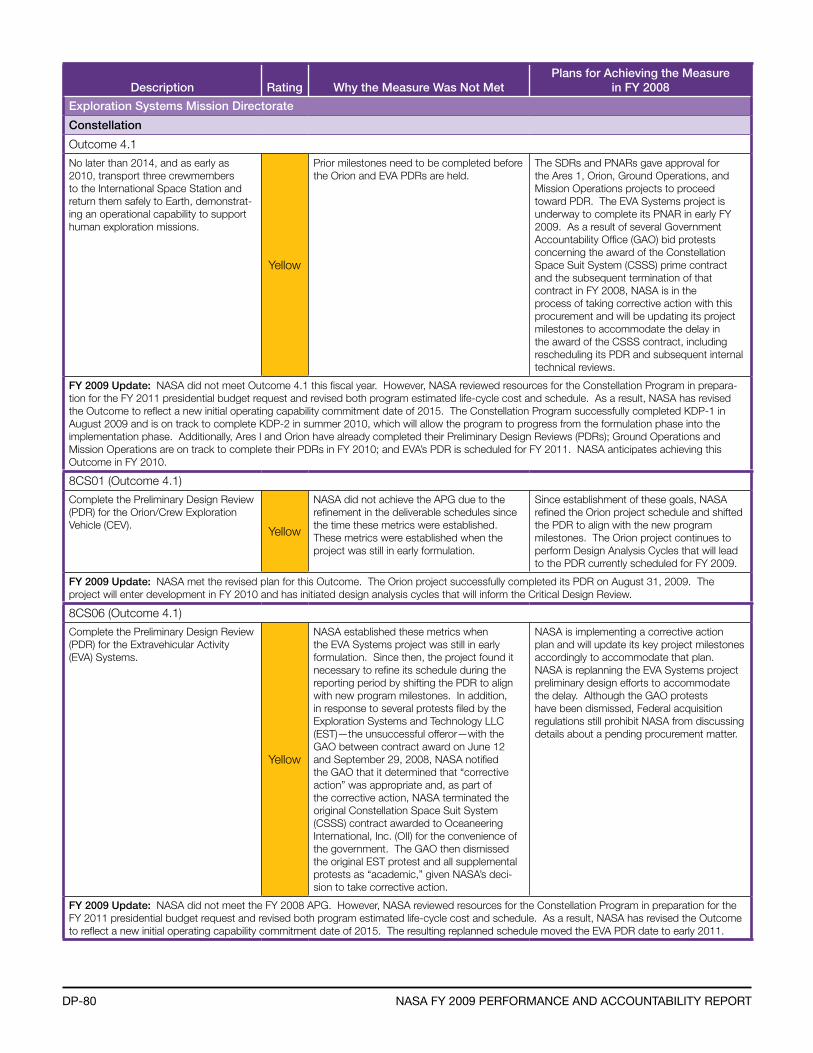
DP-80 naSa fY 2009 Performance anD accountabilitY rePort
Description Rating Why the Measure Was Not MetPlans for Achieving the Measure
in FY 2008
Exploration Systems Mission Directorate
Constellation
Outcome 4.1
No later than 2014, and as early as 2010, transport three crewmembers to the International Space Station and return them safely to Earth, demonstrat-ing an operational capability to support human exploration missions.
Yellow
Prior milestones need to be completed before the Orion and EVA PDRs are held.
The SDRs and PNARs gave approval for the Ares 1, Orion, Ground Operations, and Mission Operations projects to proceed toward PDR. The EVA Systems project is underway to complete its PNAR in early FY 2009. As a result of several Government Accountability Office (GAO) bid protests concerning the award of the Constellation Space Suit System (CSSS) prime contract and the subsequent termination of that contract in FY 2008, NASA is in the process of taking corrective action with this procurement and will be updating its project milestones to accommodate the delay in the award of the CSSS contract, including rescheduling its PDR and subsequent internal technical reviews.
FY 2009 Update: NASA did not meet Outcome 4.1 this fiscal year. However, NASA reviewed resources for the Constellation Program in prepara-tion for the FY 2011 presidential budget request and revised both program estimated life-cycle cost and schedule. As a result, NASA has revised the Outcome to reflect a new initial operating capability commitment date of 2015. The Constellation Program successfully completed KDP-1 in August 2009 and is on track to complete KDP-2 in summer 2010, which will allow the program to progress from the formulation phase into the implementation phase. Additionally, Ares I and Orion have already completed their Preliminary Design Reviews (PDRs); Ground Operations and Mission Operations are on track to complete their PDRs in FY 2010; and EVA’s PDR is scheduled for FY 2011. NASA anticipates achieving this Outcome in FY 2010.
8CS01 (Outcome 4.1)
Complete the Preliminary Design Review (PDR) for the Orion/Crew Exploration Vehicle (CEV). Yellow
NASA did not achieve the APG due to the refinement in the deliverable schedules since the time these metrics were established. These metrics were established when the project was still in early formulation.
Since establishment of these goals, NASA refined the Orion project schedule and shifted the PDR to align with the new program milestones. The Orion project continues to perform Design Analysis Cycles that will lead to the PDR currently scheduled for FY 2009.
FY 2009 Update: NASA met the revised plan for this Outcome. The Orion project successfully completed its PDR on August 31, 2009. The project will enter development in FY 2010 and has initiated design analysis cycles that will inform the Critical Design Review.
8CS06 (Outcome 4.1)
Complete the Preliminary Design Review (PDR) for the Extravehicular Activity (EVA) Systems.
Yellow
NASA established these metrics when the EVA Systems project was still in early formulation. Since then, the project found it necessary to refine its schedule during the reporting period by shifting the PDR to align with new program milestones. In addition, in response to several protests filed by the Exploration Systems and Technology LLC (EST)—the unsuccessful offeror—with the GAO between contract award on June 12 and September 29, 2008, NASA notified the GAO that it determined that “corrective action” was appropriate and, as part of the corrective action, NASA terminated the original Constellation Space Suit System (CSSS) contract awarded to Oceaneering International, Inc. (OII) for the convenience of the government. The GAO then dismissed the original EST protest and all supplemental protests as “academic,” given NASA’s deci-sion to take corrective action.
NASA is implementing a corrective action plan and will update its key project milestones accordingly to accommodate that plan. NASA is replanning the EVA Systems project preliminary design efforts to accommodate the delay. Although the GAO protests have been dismissed, Federal acquisition regulations still prohibit NASA from discussing details about a pending procurement matter.
FY 2009 Update: NASA did not meet the FY 2008 APG. However, NASA reviewed resources for the Constellation Program in preparation for the FY 2011 presidential budget request and revised both program estimated life-cycle cost and schedule. As a result, NASA has revised the Outcome to reflect a new initial operating capability commitment date of 2015. The resulting replanned schedule moved the EVA PDR date to early 2011.
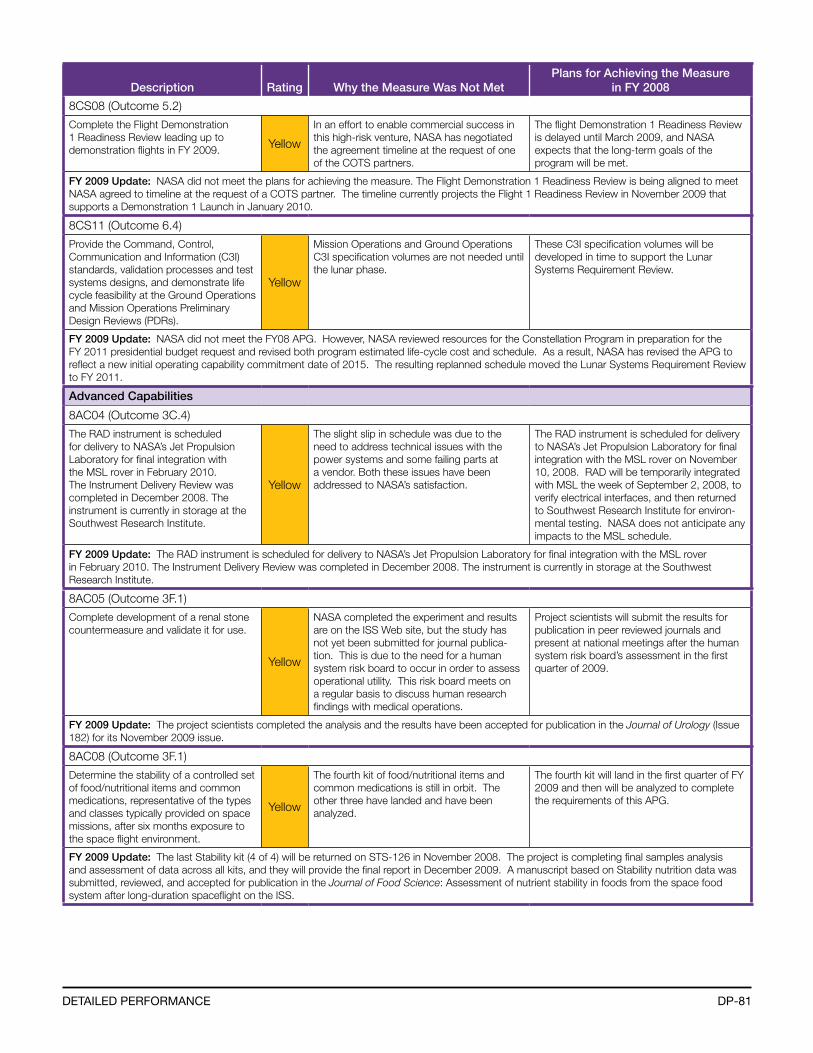
DP-81DetaileD Performance
Description Rating Why the Measure Was Not MetPlans for Achieving the Measure
in FY 2008
8CS08 (Outcome 5.2)
Complete the Flight Demonstration 1 Readiness Review leading up to demonstration flights in FY 2009. Yellow
In an effort to enable commercial success in this high-risk venture, NASA has negotiated the agreement timeline at the request of one of the COTS partners.
The flight Demonstration 1 Readiness Review is delayed until March 2009, and NASA expects that the long-term goals of the program will be met.
FY 2009 Update: NASA did not meet the plans for achieving the measure. The Flight Demonstration 1 Readiness Review is being aligned to meet NASA agreed to timeline at the request of a COTS partner. The timeline currently projects the Flight 1 Readiness Review in November 2009 that supports a Demonstration 1 Launch in January 2010.
8CS11 (Outcome 6.4)
Provide the Command, Control, Communication and Information (C3I) standards, validation processes and test systems designs, and demonstrate life cycle feasibility at the Ground Operations and Mission Operations Preliminary Design Reviews (PDRs).
Yellow
Mission Operations and Ground Operations C3I specification volumes are not needed until the lunar phase.
These C3I specification volumes will be developed in time to support the Lunar Systems Requirement Review.
FY 2009 Update: NASA did not meet the FY08 APG. However, NASA reviewed resources for the Constellation Program in preparation for the FY 2011 presidential budget request and revised both program estimated life-cycle cost and schedule. As a result, NASA has revised the APG to reflect a new initial operating capability commitment date of 2015. The resulting replanned schedule moved the Lunar Systems Requirement Review to FY 2011.
Advanced Capabilities
8AC04 (Outcome 3C.4)
The RAD instrument is scheduled for delivery to NASA’s Jet Propulsion Laboratory for final integration with the MSL rover in February 2010. The Instrument Delivery Review was completed in December 2008. The instrument is currently in storage at the Southwest Research Institute.
Yellow
The slight slip in schedule was due to the need to address technical issues with the power systems and some failing parts at a vendor. Both these issues have been addressed to NASA’s satisfaction.
The RAD instrument is scheduled for delivery to NASA’s Jet Propulsion Laboratory for final integration with the MSL rover on November 10, 2008. RAD will be temporarily integrated with MSL the week of September 2, 2008, to verify electrical interfaces, and then returned to Southwest Research Institute for environ-mental testing. NASA does not anticipate any impacts to the MSL schedule.
FY 2009 Update: The RAD instrument is scheduled for delivery to NASA’s Jet Propulsion Laboratory for final integration with the MSL rover in February 2010. The Instrument Delivery Review was completed in December 2008. The instrument is currently in storage at the Southwest Research Institute.
8AC05 (Outcome 3F.1)
Complete development of a renal stone countermeasure and validate it for use.
Yellow
NASA completed the experiment and results are on the ISS Web site, but the study has not yet been submitted for journal publica-tion. This is due to the need for a human system risk board to occur in order to assess operational utility. This risk board meets on a regular basis to discuss human research findings with medical operations.
Project scientists will submit the results for publication in peer reviewed journals and present at national meetings after the human system risk board’s assessment in the first quarter of 2009.
FY 2009 Update: The project scientists completed the analysis and the results have been accepted for publication in the Journal of Urology (Issue 182) for its November 2009 issue.
8AC08 (Outcome 3F.1)
Determine the stability of a controlled set of food/nutritional items and common medications, representative of the types and classes typically provided on space missions, after six months exposure to the space flight environment.
Yellow
The fourth kit of food/nutritional items and common medications is still in orbit. The other three have landed and have been analyzed.
The fourth kit will land in the first quarter of FY 2009 and then will be analyzed to complete the requirements of this APG.
FY 2009 Update: The last Stability kit (4 of 4) will be returned on STS-126 in November 2008. The project is completing final samples analysis and assessment of data across all kits, and they will provide the final report in December 2009. A manuscript based on Stability nutrition data was submitted, reviewed, and accepted for publication in the Journal of Food Science: Assessment of nutrient stability in foods from the space food system after long-duration spaceflight on the ISS.
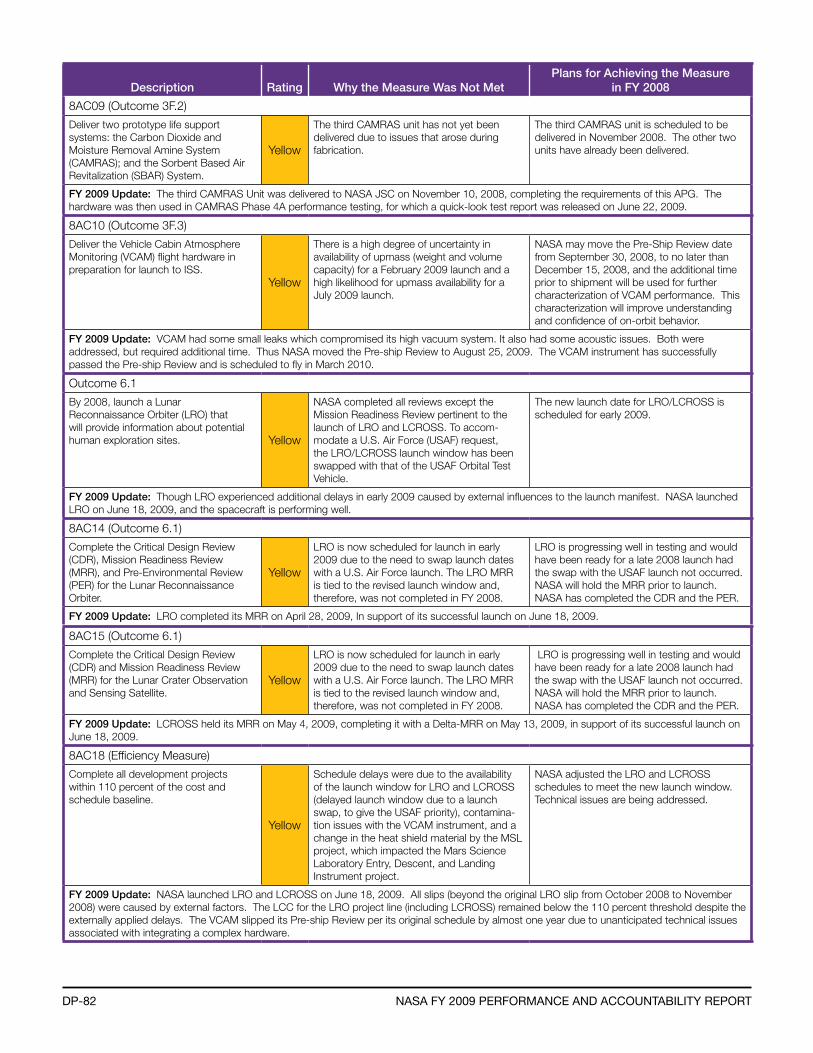
DP-82 naSa fY 2009 Performance anD accountabilitY rePort
Description Rating Why the Measure Was Not MetPlans for Achieving the Measure
in FY 2008
8AC09 (Outcome 3F.2)
Deliver two prototype life support systems: the Carbon Dioxide and Moisture Removal Amine System (CAMRAS); and the Sorbent Based Air Revitalization (SBAR) System.
Yellow
The third CAMRAS unit has not yet been delivered due to issues that arose during fabrication.
The third CAMRAS unit is scheduled to be delivered in November 2008. The other two units have already been delivered.
FY 2009 Update: The third CAMRAS Unit was delivered to NASA JSC on November 10, 2008, completing the requirements of this APG. The hardware was then used in CAMRAS Phase 4A performance testing, for which a quick-look test report was released on June 22, 2009.
8AC10 (Outcome 3F.3)
Deliver the Vehicle Cabin Atmosphere Monitoring (VCAM) flight hardware in preparation for launch to ISS.
Yellow
There is a high degree of uncertainty in availability of upmass (weight and volume capacity) for a February 2009 launch and a high likelihood for upmass availability for a July 2009 launch.
NASA may move the Pre-Ship Review date from September 30, 2008, to no later than December 15, 2008, and the additional time prior to shipment will be used for further characterization of VCAM performance. This characterization will improve understanding and confidence of on-orbit behavior.
FY 2009 Update: VCAM had some small leaks which compromised its high vacuum system. It also had some acoustic issues. Both were addressed, but required additional time. Thus NASA moved the Pre-ship Review to August 25, 2009. The VCAM instrument has successfully passed the Pre-ship Review and is scheduled to fly in March 2010.
Outcome 6.1
By 2008, launch a Lunar Reconnaissance Orbiter (LRO) that will provide information about potential human exploration sites. Yellow
NASA completed all reviews except the Mission Readiness Review pertinent to the launch of LRO and LCROSS. To accom-modate a U.S. Air Force (USAF) request, the LRO/LCROSS launch window has been swapped with that of the USAF Orbital Test Vehicle.
The new launch date for LRO/LCROSS is scheduled for early 2009.
FY 2009 Update: Though LRO experienced additional delays in early 2009 caused by external influences to the launch manifest. NASA launched LRO on June 18, 2009, and the spacecraft is performing well.
8AC14 (Outcome 6.1)
Complete the Critical Design Review (CDR), Mission Readiness Review (MRR), and Pre-Environmental Review (PER) for the Lunar Reconnaissance Orbiter.
Yellow
LRO is now scheduled for launch in early 2009 due to the need to swap launch dates with a U.S. Air Force launch. The LRO MRR is tied to the revised launch window and, therefore, was not completed in FY 2008.
LRO is progressing well in testing and would have been ready for a late 2008 launch had the swap with the USAF launch not occurred. NASA will hold the MRR prior to launch. NASA has completed the CDR and the PER.
FY 2009 Update: LRO completed its MRR on April 28, 2009, In support of its successful launch on June 18, 2009.
8AC15 (Outcome 6.1)
Complete the Critical Design Review (CDR) and Mission Readiness Review (MRR) for the Lunar Crater Observation and Sensing Satellite.
Yellow
LRO is now scheduled for launch in early 2009 due to the need to swap launch dates with a U.S. Air Force launch. The LRO MRR is tied to the revised launch window and, therefore, was not completed in FY 2008.
LRO is progressing well in testing and would have been ready for a late 2008 launch had the swap with the USAF launch not occurred. NASA will hold the MRR prior to launch. NASA has completed the CDR and the PER.
FY 2009 Update: LCROSS held its MRR on May 4, 2009, completing it with a Delta-MRR on May 13, 2009, in support of its successful launch on June 18, 2009.
8AC18 (Efficiency Measure)
Complete all development projects within 110 percent of the cost and schedule baseline.
Yellow
Schedule delays were due to the availability of the launch window for LRO and LCROSS (delayed launch window due to a launch swap, to give the USAF priority), contamina-tion issues with the VCAM instrument, and a change in the heat shield material by the MSL project, which impacted the Mars Science Laboratory Entry, Descent, and Landing Instrument project.
NASA adjusted the LRO and LCROSS schedules to meet the new launch window. Technical issues are being addressed.
FY 2009 Update: NASA launched LRO and LCROSS on June 18, 2009. All slips (beyond the original LRO slip from October 2008 to November 2008) were caused by external factors. The LCC for the LRO project line (including LCROSS) remained below the 110 percent threshold despite the externally applied delays. The VCAM slipped its Pre-ship Review per its original schedule by almost one year due to unanticipated technical issues associated with integrating a complex hardware.
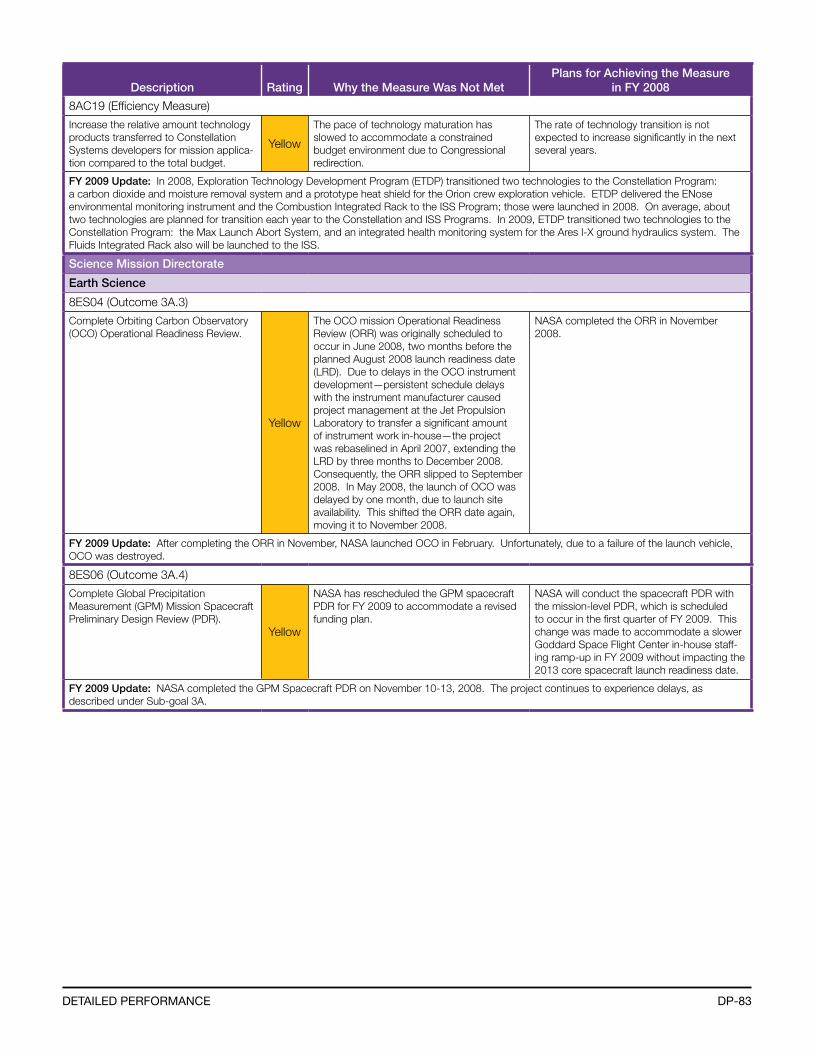
DP-83DetaileD Performance
Description Rating Why the Measure Was Not MetPlans for Achieving the Measure
in FY 2008
8AC19 (Efficiency Measure)
Increase the relative amount technology products transferred to Constellation Systems developers for mission applica-tion compared to the total budget.
Yellow
The pace of technology maturation has slowed to accommodate a constrained budget environment due to Congressional redirection.
The rate of technology transition is not expected to increase significantly in the next several years.
FY 2009 Update: In 2008, Exploration Technology Development Program (ETDP) transitioned two technologies to the Constellation Program: a carbon dioxide and moisture removal system and a prototype heat shield for the Orion crew exploration vehicle. ETDP delivered the ENose environmental monitoring instrument and the Combustion Integrated Rack to the ISS Program; those were launched in 2008. On average, about two technologies are planned for transition each year to the Constellation and ISS Programs. In 2009, ETDP transitioned two technologies to the Constellation Program: the Max Launch Abort System, and an integrated health monitoring system for the Ares I-X ground hydraulics system. The Fluids Integrated Rack also will be launched to the ISS.
Science Mission Directorate
Earth Science
8ES04 (Outcome 3A.3)
Complete Orbiting Carbon Observatory (OCO) Operational Readiness Review.
Yellow
The OCO mission Operational Readiness Review (ORR) was originally scheduled to occur in June 2008, two months before the planned August 2008 launch readiness date (LRD). Due to delays in the OCO instrument development—persistent schedule delays with the instrument manufacturer caused project management at the Jet Propulsion Laboratory to transfer a significant amount of instrument work in-house—the project was rebaselined in April 2007, extending the LRD by three months to December 2008. Consequently, the ORR slipped to September 2008. In May 2008, the launch of OCO was delayed by one month, due to launch site availability. This shifted the ORR date again, moving it to November 2008.
NASA completed the ORR in November 2008.
FY 2009 Update: After completing the ORR in November, NASA launched OCO in February. Unfortunately, due to a failure of the launch vehicle, OCO was destroyed.
8ES06 (Outcome 3A.4)
Complete Global Precipitation Measurement (GPM) Mission Spacecraft Preliminary Design Review (PDR).
Yellow
NASA has rescheduled the GPM spacecraft PDR for FY 2009 to accommodate a revised funding plan.
NASA will conduct the spacecraft PDR with the mission-level PDR, which is scheduled to occur in the first quarter of FY 2009. This change was made to accommodate a slower Goddard Space Flight Center in-house staff-ing ramp-up in FY 2009 without impacting the 2013 core spacecraft launch readiness date.
FY 2009 Update: NASA completed the GPM Spacecraft PDR on November 10-13, 2008. The project continues to experience delays, as described under Sub-goal 3A.
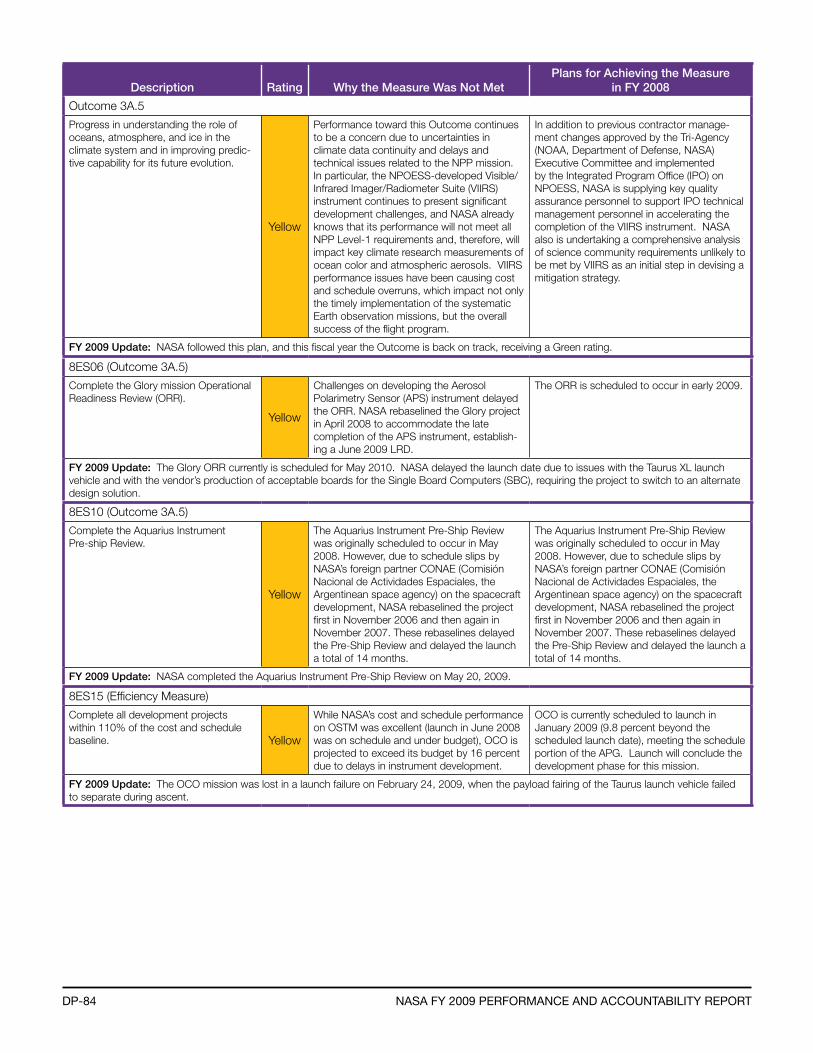
DP-84 naSa fY 2009 Performance anD accountabilitY rePort
Description Rating Why the Measure Was Not MetPlans for Achieving the Measure
in FY 2008
Outcome 3A.5
Progress in understanding the role of oceans, atmosphere, and ice in the climate system and in improving predic-tive capability for its future evolution.
Yellow
Performance toward this Outcome continues to be a concern due to uncertainties in climate data continuity and delays and technical issues related to the NPP mission. In particular, the NPOESS-developed Visible/Infrared Imager/Radiometer Suite (VIIRS) instrument continues to present significant development challenges, and NASA already knows that its performance will not meet all NPP Level-1 requirements and, therefore, will impact key climate research measurements of ocean color and atmospheric aerosols. VIIRS performance issues have been causing cost and schedule overruns, which impact not only the timely implementation of the systematic Earth observation missions, but the overall success of the flight program.
In addition to previous contractor manage-ment changes approved by the Tri-Agency (NOAA, Department of Defense, NASA) Executive Committee and implemented by the Integrated Program Office (IPO) on NPOESS, NASA is supplying key quality assurance personnel to support IPO technical management personnel in accelerating the completion of the VIIRS instrument. NASA also is undertaking a comprehensive analysis of science community requirements unlikely to be met by VIIRS as an initial step in devising a mitigation strategy.
FY 2009 Update: NASA followed this plan, and this fiscal year the Outcome is back on track, receiving a Green rating.
8ES06 (Outcome 3A.5)
Complete the Glory mission Operational Readiness Review (ORR).
Yellow
Challenges on developing the Aerosol Polarimetry Sensor (APS) instrument delayed the ORR. NASA rebaselined the Glory project in April 2008 to accommodate the late completion of the APS instrument, establish-ing a June 2009 LRD.
The ORR is scheduled to occur in early 2009.
FY 2009 Update: The Glory ORR currently is scheduled for May 2010. NASA delayed the launch date due to issues with the Taurus XL launch vehicle and with the vendor’s production of acceptable boards for the Single Board Computers (SBC), requiring the project to switch to an alternate design solution.
8ES10 (Outcome 3A.5)
Complete the Aquarius Instrument Pre-ship Review.
Yellow
The Aquarius Instrument Pre-Ship Review was originally scheduled to occur in May 2008. However, due to schedule slips by NASA’s foreign partner CONAE (Comisión Nacional de Actividades Espaciales, the Argentinean space agency) on the spacecraft development, NASA rebaselined the project first in November 2006 and then again in November 2007. These rebaselines delayed the Pre-Ship Review and delayed the launch a total of 14 months.
The Aquarius Instrument Pre-Ship Review was originally scheduled to occur in May 2008. However, due to schedule slips by NASA’s foreign partner CONAE (Comisión Nacional de Actividades Espaciales, the Argentinean space agency) on the spacecraft development, NASA rebaselined the project first in November 2006 and then again in November 2007. These rebaselines delayed the Pre-Ship Review and delayed the launch a total of 14 months.
FY 2009 Update: NASA completed the Aquarius Instrument Pre-Ship Review on May 20, 2009.
8ES15 (Efficiency Measure)
Complete all development projects within 110% of the cost and schedule baseline. Yellow
While NASA’s cost and schedule performance on OSTM was excellent (launch in June 2008 was on schedule and under budget), OCO is projected to exceed its budget by 16 percent due to delays in instrument development.
OCO is currently scheduled to launch in January 2009 (9.8 percent beyond the scheduled launch date), meeting the schedule portion of the APG. Launch will conclude the development phase for this mission.
FY 2009 Update: The OCO mission was lost in a launch failure on February 24, 2009, when the payload fairing of the Taurus launch vehicle failed to separate during ascent.
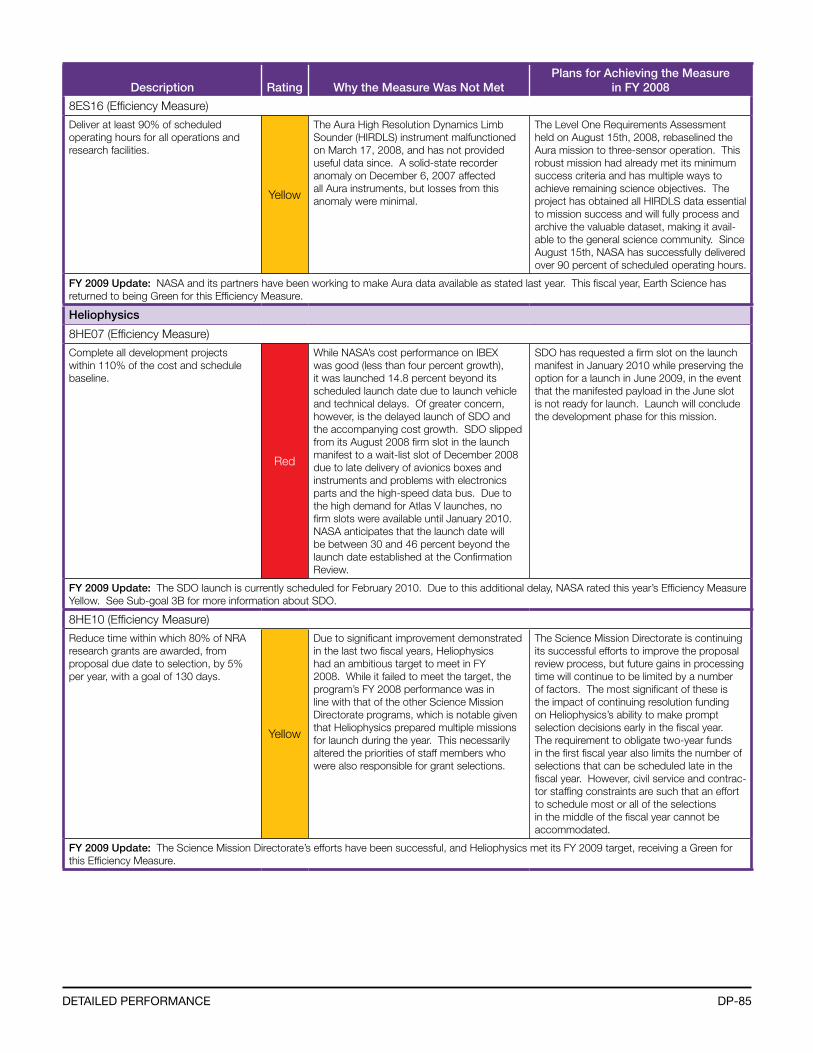
DP-85DetaileD Performance
Description Rating Why the Measure Was Not MetPlans for Achieving the Measure
in FY 2008
8ES16 (Efficiency Measure)
Deliver at least 90% of scheduled operating hours for all operations and research facilities.
Yellow
The Aura High Resolution Dynamics Limb Sounder (HIRDLS) instrument malfunctioned on March 17, 2008, and has not provided useful data since. A solid-state recorder anomaly on December 6, 2007 affected all Aura instruments, but losses from this anomaly were minimal.
The Level One Requirements Assessment held on August 15th, 2008, rebaselined the Aura mission to three-sensor operation. This robust mission had already met its minimum success criteria and has multiple ways to achieve remaining science objectives. The project has obtained all HIRDLS data essential to mission success and will fully process and archive the valuable dataset, making it avail-able to the general science community. Since August 15th, NASA has successfully delivered over 90 percent of scheduled operating hours.
FY 2009 Update: NASA and its partners have been working to make Aura data available as stated last year. This fiscal year, Earth Science has returned to being Green for this Efficiency Measure.
Heliophysics
8HE07 (Efficiency Measure)
Complete all development projects within 110% of the cost and schedule baseline.
Red
While NASA’s cost performance on IBEX was good (less than four percent growth), it was launched 14.8 percent beyond its scheduled launch date due to launch vehicle and technical delays. Of greater concern, however, is the delayed launch of SDO and the accompanying cost growth. SDO slipped from its August 2008 firm slot in the launch manifest to a wait-list slot of December 2008 due to late delivery of avionics boxes and instruments and problems with electronics parts and the high-speed data bus. Due to the high demand for Atlas V launches, no firm slots were available until January 2010. NASA anticipates that the launch date will be between 30 and 46 percent beyond the launch date established at the Confirmation Review.
SDO has requested a firm slot on the launch manifest in January 2010 while preserving the option for a launch in June 2009, in the event that the manifested payload in the June slot is not ready for launch. Launch will conclude the development phase for this mission.
FY 2009 Update: The SDO launch is currently scheduled for February 2010. Due to this additional delay, NASA rated this year’s Efficiency Measure Yellow. See Sub-goal 3B for more information about SDO.
8HE10 (Efficiency Measure)
Reduce time within which 80% of NRA research grants are awarded, from proposal due date to selection, by 5% per year, with a goal of 130 days.
Yellow
Due to significant improvement demonstrated in the last two fiscal years, Heliophysics had an ambitious target to meet in FY 2008. While it failed to meet the target, the program’s FY 2008 performance was in line with that of the other Science Mission Directorate programs, which is notable given that Heliophysics prepared multiple missions for launch during the year. This necessarily altered the priorities of staff members who were also responsible for grant selections.
The Science Mission Directorate is continuing its successful efforts to improve the proposal review process, but future gains in processing time will continue to be limited by a number of factors. The most significant of these is the impact of continuing resolution funding on Heliophysics’s ability to make prompt selection decisions early in the fiscal year. The requirement to obligate two-year funds in the first fiscal year also limits the number of selections that can be scheduled late in the fiscal year. However, civil service and contrac-tor staffing constraints are such that an effort to schedule most or all of the selections in the middle of the fiscal year cannot be accommodated.
FY 2009 Update: The Science Mission Directorate’s efforts have been successful, and Heliophysics met its FY 2009 target, receiving a Green for this Efficiency Measure.
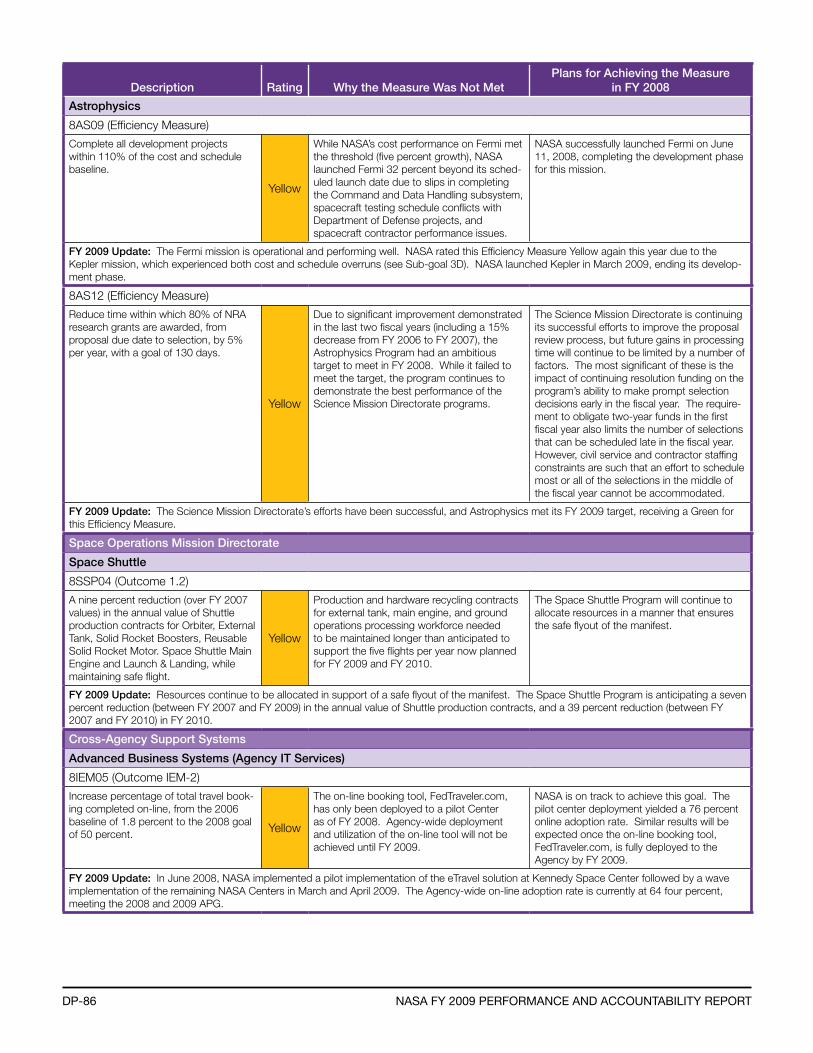
DP-86 naSa fY 2009 Performance anD accountabilitY rePort
Description Rating Why the Measure Was Not MetPlans for Achieving the Measure
in FY 2008
Astrophysics
8AS09 (Efficiency Measure)
Complete all development projects within 110% of the cost and schedule baseline.
Yellow
While NASA’s cost performance on Fermi met the threshold (five percent growth), NASA launched Fermi 32 percent beyond its sched-uled launch date due to slips in completing the Command and Data Handling subsystem, spacecraft testing schedule conflicts with Department of Defense projects, and spacecraft contractor performance issues.
NASA successfully launched Fermi on June 11, 2008, completing the development phase for this mission.
FY 2009 Update: The Fermi mission is operational and performing well. NASA rated this Efficiency Measure Yellow again this year due to the Kepler mission, which experienced both cost and schedule overruns (see Sub-goal 3D). NASA launched Kepler in March 2009, ending its develop-ment phase.
8AS12 (Efficiency Measure)
Reduce time within which 80% of NRA research grants are awarded, from proposal due date to selection, by 5% per year, with a goal of 130 days.
Yellow
Due to significant improvement demonstrated in the last two fiscal years (including a 15% decrease from FY 2006 to FY 2007), the Astrophysics Program had an ambitious target to meet in FY 2008. While it failed to meet the target, the program continues to demonstrate the best performance of the Science Mission Directorate programs.
The Science Mission Directorate is continuing its successful efforts to improve the proposal review process, but future gains in processing time will continue to be limited by a number of factors. The most significant of these is the impact of continuing resolution funding on the program’s ability to make prompt selection decisions early in the fiscal year. The require-ment to obligate two-year funds in the first fiscal year also limits the number of selections that can be scheduled late in the fiscal year. However, civil service and contractor staffing constraints are such that an effort to schedule most or all of the selections in the middle of the fiscal year cannot be accommodated.
FY 2009 Update: The Science Mission Directorate’s efforts have been successful, and Astrophysics met its FY 2009 target, receiving a Green for this Efficiency Measure.
Space Operations Mission Directorate
Space Shuttle
8SSP04 (Outcome 1.2)
A nine percent reduction (over FY 2007 values) in the annual value of Shuttle production contracts for Orbiter, External Tank, Solid Rocket Boosters, Reusable Solid Rocket Motor. Space Shuttle Main Engine and Launch & Landing, while maintaining safe flight.
Yellow
Production and hardware recycling contracts for external tank, main engine, and ground operations processing workforce needed to be maintained longer than anticipated to support the five flights per year now planned for FY 2009 and FY 2010.
The Space Shuttle Program will continue to allocate resources in a manner that ensures the safe flyout of the manifest.
FY 2009 Update: Resources continue to be allocated in support of a safe flyout of the manifest. The Space Shuttle Program is anticipating a seven percent reduction (between FY 2007 and FY 2009) in the annual value of Shuttle production contracts, and a 39 percent reduction (between FY 2007 and FY 2010) in FY 2010.
Cross-Agency Support Systems
Advanced Business Systems (Agency IT Services)
8IEM05 (Outcome IEM-2)
Increase percentage of total travel book-ing completed on-line, from the 2006 baseline of 1.8 percent to the 2008 goal of 50 percent. Yellow
The on-line booking tool, FedTraveler.com, has only been deployed to a pilot Center as of FY 2008. Agency-wide deployment and utilization of the on-line tool will not be achieved until FY 2009.
NASA is on track to achieve this goal. The pilot center deployment yielded a 76 percent online adoption rate. Similar results will be expected once the on-line booking tool, FedTraveler.com, is fully deployed to the Agency by FY 2009.
FY 2009 Update: In June 2008, NASA implemented a pilot implementation of the eTravel solution at Kennedy Space Center followed by a wave implementation of the remaining NASA Centers in March and April 2009. The Agency-wide on-line adoption rate is currently at 64 four percent, meeting the 2008 and 2009 APG.
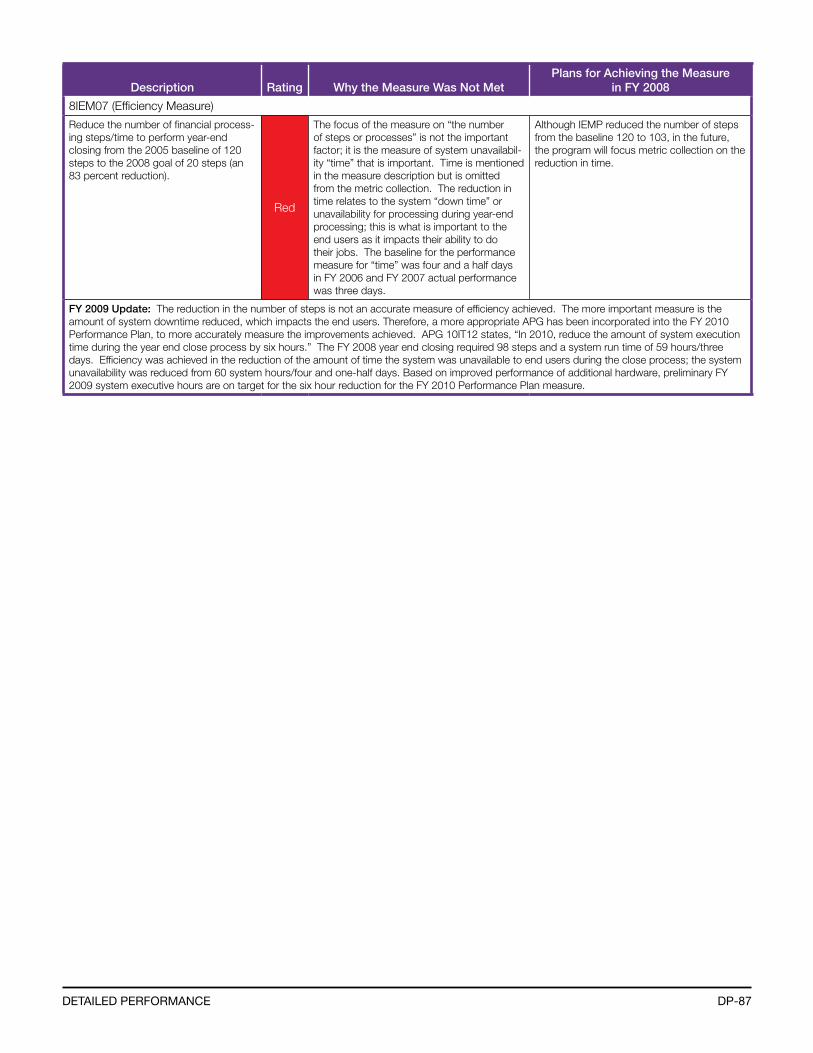
DP-87DetaileD Performance
Description Rating Why the Measure Was Not MetPlans for Achieving the Measure
in FY 2008
8IEM07 (Efficiency Measure)
Reduce the number of financial process-ing steps/time to perform year-end closing from the 2005 baseline of 120 steps to the 2008 goal of 20 steps (an 83 percent reduction).
Red
The focus of the measure on “the number of steps or processes” is not the important factor; it is the measure of system unavailabil-ity “time” that is important. Time is mentioned in the measure description but is omitted from the metric collection. The reduction in time relates to the system “down time” or unavailability for processing during year-end processing; this is what is important to the end users as it impacts their ability to do their jobs. The baseline for the performance measure for “time” was four and a half days in FY 2006 and FY 2007 actual performance was three days.
Although IEMP reduced the number of steps from the baseline 120 to 103, in the future, the program will focus metric collection on the reduction in time.
FY 2009 Update: The reduction in the number of steps is not an accurate measure of efficiency achieved. The more important measure is the amount of system downtime reduced, which impacts the end users. Therefore, a more appropriate APG has been incorporated into the FY 2010 Performance Plan, to more accurately measure the improvements achieved. APG 10IT12 states, “In 2010, reduce the amount of system execution time during the year end close process by six hours.” The FY 2008 year end closing required 98 steps and a system run time of 59 hours/three days. Efficiency was achieved in the reduction of the amount of time the system was unavailable to end users during the close process; the system unavailability was reduced from 60 system hours/four and one-half days. Based on improved performance of additional hardware, preliminary FY 2009 system executive hours are on target for the six hour reduction for the FY 2010 Performance Plan measure.